UNITED STATES
SECURITIES AND EXCHANGE COMMISSION
Washington, D.C. 20549
SECURITIES AND EXCHANGE COMMISSION
Washington, D.C. 20549
Form 20-F
| ☐ |
REGISTRATION STATEMENT PURSUANT TO SECTION 12(b) OR (g) OF THE SECURITIES EXCHANGE ACT OF 1934
|
OR
| ☒ |
ANNUAL REPORT PURSUANT TO SECTION 13 OR 15(d) OF THE SECURITIES EXCHANGE ACT OF 1934
|
For the fiscal year ended December 31, 2017
OR
| ☐ |
TRANSITION REPORT PURSUANT TO SECTION 13 OR 15(d) OF THE SECURITIES EXCHANGE ACT OF 1934
|
OR
| ☐ |
SHELL COMPANY REPORT PURSUANT TO SECTION 13 OR 15(d) OF THE SECURITIES EXCHANGE ACT OF 1934
|
Commission File Number: 001-36761
KENON HOLDINGS LTD.
(Exact name of registrant as specified in its charter)
(Company Registration No. 201406588W)
|
Singapore
|
4911
|
Not Applicable
|
|
(State or other jurisdiction of
incorporation or organization)
|
(Primary Standard Industrial
Classification Code Number)
|
(I.R.S. Employer
Identification No.) |
|
1 Temasek Avenue #36-01
Millenia Tower Singapore 039192 +65 6351 1780 |
||
|
(Address, including zip code, and telephone number, including area code, of registrant’s principal executive offices)
|
||
Copies to:
Scott V. Simpson
James A. McDonald
Skadden, Arps, Slate, Meagher and Flom (UK) LLP
40 Bank Street
London E14 5DS
Telephone: +44 20 7519 7000
Facsimile: +44 20 7519 7070
Scott V. Simpson
James A. McDonald
Skadden, Arps, Slate, Meagher and Flom (UK) LLP
40 Bank Street
London E14 5DS
Telephone: +44 20 7519 7000
Facsimile: +44 20 7519 7070
Securities registered or to be registered pursuant to Section 12(b) of the Act:
|
Title of Each Class
|
Name of Each Exchange on Which Registered
|
|
Ordinary Shares, no par value
|
The New York Stock Exchange
|
Securities registered or to be registered pursuant to Section 12(g) of the Act: None
Securities for which there is a reporting obligation pursuant to Section 15(d) of the Act: None
Indicate the number of outstanding shares of each of the issuer’s classes of capital or common stock as of the close of the period covered by the annual report:
53,807,578 shares
Indicate by check mark if the registrant is a well-known seasoned issuer, as defined in Rule 405 of the Securities Act.
Yes
☐
No
☒
If this report is an annual or transition report, indicate by check mark if the registrant is not required to file reports pursuant to Section 13 or 15(d) of the Securities Exchange Act of 1934.
Yes
☐
No
☒
Indicate by check mark whether the registrant (1) has filed all reports required to be filed by Section 13 or 15(d) of the Securities Exchange Act of 1934 during the preceding 12 months (or for such a shorter period that the registrant was required to file such reports), and (2) has been subject to such filing requirements for the past 90 days.
Yes
☒
No
☐
Indicate by check mark whether the registrant has submitted electronically or posted on its corporate Web site, if any, every Interactive Data File required to be submitted and posted pursuant to Rule 405 of Regulation S-T (§232.405 of this chapter) during the preceding 12 months (or for such shorter period that the registrant was required to submit and post such files).
Yes ☒ No
☐
Indicate by check mark whether the registrant is an accelerated filer, a large accelerated filer, a non-accelerated filer, or an emerging growth company. See definition of “large accelerated filer,” “accelerated filer,” and “emerging growth company” in Rule 12b-2 of the Exchange Act. (Check one):
|
Large accelerated filer
☒
|
Accelerated filer
☐
|
Non-accelerated filer
☐
|
Emerging growth company
☐
|
If an emerging growth company that prepares its financial statements in accordance with U.S. GAAP, indicate by check mark if the registrant has elected not to use the extended transition period for complying with any new or revised financial accounting standards † provided pursuant to Section 13(a) of the Exchange Act.
☐
† The term “new or revised financial accounting standard” refers to any update issued by the Financial Accounting Standards Board to its Accounting Standards Codification after April 5, 2012.
Indicate by check mark which basis of accounting the registrant has used to prepare the financial statements included in this filing:
|
U.S. GAAP
☐
|
International Financial Reporting Standards as issued by the International Accounting Standards Board
☒
|
Other
☐
|
If “Other” has been checked in response to the previous question, indicate by check mark which financial statement item the Registrant has elected to follow:
Item 17
☐
Item 18
☐
If this is an annual report, indicate by check mark whether the registrant is a shell company (as defined in Rule 12b-2 of the Exchange Act).
Yes
☐
No
☒
TABLE OF CONTENTS
|
11
|
||
|
11
|
||
|
A.
|
Directors and Senior Management
|
11
|
|
B.
|
Advisers
|
11
|
|
C.
|
Auditors
|
11
|
|
11
|
||
|
12
|
||
|
A.
|
Selected Financial Data
|
12
|
|
B.
|
Capitalization and Indebtedness
|
18
|
|
C.
|
Reasons for the Offer and Use of Proceeds
|
18
|
|
D.
|
Risk Factors
|
18
|
|
58
|
||
|
A.
|
History and Development of the Company
|
58
|
|
B.
|
Business Overview
|
58
|
|
C.
|
Organizational Structure
|
106
|
|
D.
|
Property, Plants and Equipment
|
106
|
|
106
|
||
|
106
|
||
|
A.
|
Operating Results
|
116
|
|
B.
|
Liquidity and Capital Resources
|
127
|
|
C.
|
Research and Development, Patents and Licenses, Etc.
|
139
|
|
D.
|
Trend Information
|
139
|
|
E.
|
Off-Balance Sheet Arrangements
|
140
|
|
F.
|
Tabular Disclosure of Contractual Obligations
|
140
|
|
G.
|
Safe Harbor
|
141
|
|
141
|
||
|
A.
|
Directors and Senior Management
|
141
|
|
B.
|
Compensation
|
144
|
|
C.
|
Board Practices
|
144
|
|
D.
|
Employees
|
147
|
|
E.
|
Share Ownership
|
147
|
|
148
|
||
|
A.
|
Major Shareholders
|
148
|
|
B.
|
Related Party Transactions
|
149
|
|
C.
|
Interests of Experts and Counsel
|
149
|
1
|
150
|
||
|
A.
|
Consolidated Statements and Other Financial Information
|
150
|
|
B.
|
Significant Changes
|
150
|
|
150
|
||
|
A.
|
Offer and Listing Details.
|
150
|
|
B.
|
Plan of Distribution
|
151
|
|
C.
|
Markets
|
151
|
|
D.
|
Selling Shareholders
|
151
|
|
E.
|
Dilution.
|
151
|
|
F.
|
Expenses of the Issue
|
151
|
|
151
|
||
|
A.
|
Share Capital
|
151
|
|
B.
|
Constitution
|
151
|
|
C.
|
Material Contracts
|
166
|
|
D.
|
Exchange Controls
|
167
|
|
E.
|
Taxation
|
167
|
|
F.
|
Dividends and Paying Agents
|
171
|
|
G.
|
Statement by Experts
|
171
|
|
H.
|
Documents on Display
|
171
|
|
I.
|
Subsidiary Information
|
172
|
|
172
|
||
|
172
|
||
|
A.
|
Debt Securities
|
172
|
|
B.
|
Warrants and Rights
|
173
|
|
C.
|
Other Securities
|
173
|
|
D.
|
American Depositary Shares
|
173
|
|
173
|
||
|
173
|
||
|
173
|
||
|
173
|
||
|
174
|
||
|
174
|
||
|
174
|
||
|
174
|
||
|
175
|
||
|
175
|
||
|
175
|
2
|
175
|
||
|
175
|
||
|
175
|
||
|
175
|
||
|
175
|
||
|
176
|
3
INTRODUCTION AND USE OF CERTAIN TERMS
We have prepared this annual report using a number of conventions, which you should consider when reading the information contained herein. In this annual report, the “Company,” “we,” “us” and “our” shall refer to Kenon Holdings Ltd., or Kenon, and each of our subsidiaries and associated companies, collectively, as the context may require, including:
| · |
I.C. Power Asia Development Ltd. (“ICP”), formerly I.C. Power Ltd., an Israeli holding company, in which Kenon has an indirect 100% interest. ICP holds a 76% direct interest in OPC;
|
| · |
IC Power Ltd. (“IC Power”), formerly IC Power Pte. Ltd, a Singaporean holding company, in which Kenon has a direct 100% interest. IC Power holds a direct 100% interest in ICP;
|
| · |
“Inkia” means Inkia Energy Limited, a Bermudian corporation and wholly-owned subsidiary of IC Power. In December 2017, Inkia sold all of its Latin American and Caribbean businesses;
|
| · |
OPC Energy Ltd. (“OPC”), an owner, developer and operator of power generation facilities in the Israeli power market, in which ICP has a 76% interest;
|
| · |
Qoros Automotive Co., Ltd. (“Qoros”), a Chinese automotive company based in China, in which Kenon, through its 100%-owned subsidiary Quantum (2007) LLC, has a 24% interest;
|
| · |
ZIM Integrated Shipping Services, Ltd. (“ZIM”), an Israeli global container shipping company, in which Kenon has a 32% interest; and
|
| · |
Primus Green Energy, Inc. (“Primus”), a New Jersey corporation which is a developer of an alternative fuel technology, in which Kenon, through IC Green, has a 91% interest.
|
Additionally, this annual report uses the following conventions:
| · |
“Ansonia” means Ansonia Holdings Singapore B.V., a company organized under the laws of Singapore, which owns approximately 58% of the outstanding shares of Kenon;
|
| · |
“CDA” means Cerro del Águila S.A., a Peruvian corporation;
|
| · |
“DEOCSA” means Distribuidora de Electricidad de Occidente, S.A., a Guatemalan corporation, which was owned by Inkia prior to the sale of the Inkia Business in December 2017;
|
| · |
“DEORSA” means Distribuidora de Electricidad de Oriente, S.A., a Guatemalan corporation, which was owned by Inkia prior to the sale of the Inkia Business in December 2017;
|
| · |
“Hadera Paper” means Hadera Paper Ltd., an Israeli corporation, which is owned by OPC;
|
| · |
“HelioFocus” means HelioFocus Ltd., an Israeli corporation, in which Kenon, through IC Green, held a 70% interest, and which was liquidated on July 6, 2017;
|
| · |
“IC” means Israel Corporation Ltd., an Israeli corporation traded on the Tel Aviv Stock Exchange, or the “TASE,” and Kenon’s former parent company;
|
| · |
“IC Green” means IC Green Energy Ltd., an Israeli corporation, which holds Kenon’s equity interests in Primus and previously held Kenon’s equity interest in HelioFocus;
|
| · |
IC Power Distribution Holdings Pte. Ltd. (“ICPDH”), a Singaporean corporation;
|
| · |
“IEC” means Israel Electric Corporation, a government-owned entity, which generates and supplies the majority of electricity in Israel, transmits and distributes all of the electricity in Israel, acts as the system operator of Israel’s electricity system, determines the dispatch order of generation units, grants interconnection surveys, and sets spot prices, among other roles;
|
4
| · |
“Inkia Business” means Inkia’s Latin American and Caribbean power generation and distribution businesses, which were sold in December 2017;
|
| · |
“Kallpa” means Kallpa Generación SA. In August 2017, Kallpa merged with CDA, with the surviving entity renamed Kallpa Generación SA;
|
| · | “New Qoros Investor” means the China-based investor related to the Baoneng group that completed a transaction to purchase 51% of Qoros from Kenon and Chery for RMB3.315 billion (approximately $526 million) 1 , which is part of an investment structure to invest a total of approximately RMB6.63 billion (approximately $1,052 million) by the New Qoros Investor of which RMB6.5 billion will ultimately be invested in Qoros’ equity as Kenon announced in January 2018; |
| · |
“OPC-Rotem” means O.P.C. Rotem Ltd., an Israeli corporation, which is owned by OPC;
|
| · |
“OPC-Hadera” is the trade name of Advanced Integrated Energy Ltd., an Israeli corporation, which is owned by OPC;
|
| · |
“Petrotec” means Petrotec AG, a German company listed on the Frankfurt Stock Exchange, which IC Green sold in December 2014;
|
| · |
“Quantum” means Quantum (2007) LLC, a Delaware limited liability company, which is the direct owner of our 24% interest in Qoros;
|
| · |
“our businesses” shall refer to each of our subsidiaries and associated companies, collectively, as the context may require;
|
| · |
“Samay I” means Samay I S.A., a Peruvian corporation;
|
| · |
“spin-off” shall refer to (i) IC’s January 7, 2015 contribution to Kenon of its interests in each of IC Power, Qoros, ZIM, Tower, Primus, HelioFocus and the Renewable Energy Group (“REG”), as well as other intermediate holding companies related to these entities, and (ii) IC’s January 9, 2015 distribution of Kenon’s issued and outstanding ordinary shares, via a dividend-in-kind, to IC’s existing shareholders; and
|
| · |
“Tower” means Tower Semiconductor Ltd., an Israeli specialty foundry semiconductor manufacturer, listed on the NASDAQ stock exchange, or “NASDAQ,” and the TASE, in which Kenon used to hold an interest.
|
Additionally, this annual report uses the following conventions for OPC:
| · |
“COD” means the commercial operation date of a development project;
|
| · |
“distribution” refers to the transfer of electricity from the transmission lines at grid supply points and its delivery to consumers at lower voltages through a distribution system;
|
| · |
“EPC” means engineering, procurement and construction;
|
| · |
“firm capacity” means the amount of energy available for production that, pursuant to applicable regulations, must be guaranteed to be available at a given time for injection to a certain power grid;
|
| · |
“greenfield projects” means projects constructed on unused land with no need to demolish or remodel existing structures;
|
| · |
“GWh” means gigawatt hours (one GWh is equal to 1,000 MWh);
|
| · |
“HFO” means heavy fuel oil;
|
1
Convenience translations of RMB amounts into US Dollars use a rate of 6.3: 1, unless otherwise indicated.
5
| · |
“OPC’s capacity” or “OPC’s installed capacity” means, with respect to each asset, 100% of the capacity of such asset, regardless of OPC’s ownership interest in the entity that owns such asset;
|
| · |
“installed capacity” means the intended full-load sustained output of energy that a generation unit is designed to produce (also referred to as name-plate capacity);
|
| · |
“IPP” means independent power producer, excluding co-generators and generators for self-consumption;
|
| · |
“kWh” means kilowatts per hour;
|
| · |
“MW” means megawatts (one MW is equal to 1,000 kilowatts or kW);
|
| · |
“MWh” means megawatt per hour;
|
| · |
“OEM” means original equipment manufacturer;
|
| · |
“PPA” means power purchase agreement;
|
| · |
“transmission” refers to the bulk transfer of electricity from generating facilities to the distribution system at load center station in which the electricity is stabilized by means of the transmission grid; and
|
| · |
“weighted average availability” refers to the number of hours that a generation facility is available to produce electricity divided by the total number of hours in a year.
|
SALE OF THE INKIA BUSINESS
On December 31, 2017, our subsidiary Inkia completed the sale of substantially all of its businesses, the Inkia Business, consisting of power generation and distribution businesses in Latin America and the Caribbean. The sale is described in more detail under “
Item 4.B. – Business – Discontinued Operations – Inkia Business – Sale of the Inkia Business.
” As a result of this sale, our remaining power generation business consists of our 76% interest in OPC. The results of the Inkia Business are presented as discontinued operations in our audited financial statements for the three years ended December 31, 2017, and prior periods presented herein have been reclassified for comparative purposes.
FINANCIAL INFORMATION
We produce financial statements in accordance with the International Financial Reporting Standards issued by the International Accounting Standards Board, or IFRS, and all financial information included in this annual report is derived from our IFRS financial statements, except as otherwise indicated. In particular, this annual report contains certain non-IFRS financial measures which are defined under “
Item 3.A Selected Financial Data” and “Item 4.B Business Overview—Our Businesses—OPC.
”
Our consolidated financial statements included in this annual report comprise the consolidated statements of profit and loss, other comprehensive income, changes in equity, and cash flows for the years ended December 31, 2017
,
2016
and 2015
and the consolidated statement of financial position as of December 31, 2017
and
2016. We present our consolidated financial statements in U.S. Dollars.
Our financial statements as of and for the year ended December 31, 2013 and 2014 included within selected financial data presented in Item 3.A., are presented as combined carve-out financial statements and have been derived from the consolidated financial statements of IC, our former parent. These combined financial statements reflect the assets, liabilities, revenues and expenses directly attributable to us, as well as allocations deemed reasonable by us, to present our combined financial position, profit and loss and other comprehensive income, changes in equity attributable to the owners of the company and cash flows. These combined carve-out financial statements are not necessarily indicative of our financial position, profit and loss and other comprehensive income, or cash flows had we operated as a separate entity throughout the periods presented. We present our combined carve-out financial statements in U.S. Dollars.
6
The results of the Inkia Business are presented as discontinued operations in our audited financial statements for the year ended December 31, 2017. Our consolidated financial statements as of and for the years ended December 31, 2016 and 2015 and in our combined carve-out selected data as of and for the two years ended December 31, 2014, have been reclassified for comparative purposes to reflect the Inkia Business as discontinued operations.
In July 2014, ZIM completed the restructuring of its outstanding indebtedness, which resulted in IC, and consequently, Kenon, owning 32% of the restructured ZIM as compared to IC’s previous interest in ZIM of approximately 99.7%. As a result of the restructuring, ZIM’s results of operations for 2013 and the six months ended June 30, 2014 are also presented as discontinued operations.
All references in this annual report to (i) “U.S. Dollars”, “$” or “USD” are to the legal currency of the United States of America; (ii) “RMB” are to Yuan, the legal currency of the People’s Republic of China, or China; (iii) “NIS” or “New Israeli Shekel” are to the legal currency of the State of Israel, or Israel; and (iv) “S$” are to Singapore Dollars, the legal currency of the Republic of Singapore, or Singapore. We have made rounding adjustments to reach some of the figures included in this annual report. Consequently, numerical figures shown as totals in some tables may not be arithmetic aggregations of the figures that precede them.
In this annual report, we also include the consolidated financial statements of profit or loss and other comprehensive income, changes in equity, and cash flows for the years ended December 31, 2017, 2016 and 2015, and consolidated statements of financial position as of December 31, 2017 and 2016 for Qoros, pursuant to Rule 3-09 of Regulation S-X.
NON-IFRS FINANCIAL INFORMATION
In this annual report, we disclose non-IFRS financial measures, namely EBITDA and net debt, each as defined under “
Item 3.A Selected Financial Data–Selected Reportable Segment Data” and “Item 3.A Selected Financial Data–Selected Reportable Segment Data–OPC” and “Item 4.B Business Overview—Our Businesses—OPC—OPC’s Description of Operations.
” Each of these measures are important measures used by us, and our businesses, to assess financial performance. We believe that the disclosure of EBITDA and net debt provides transparent and useful information to investors and financial analysts in their review of our, or our subsidiaries’ and associated companies’, operating performance and in the comparison of such operating performance to the operating performance of other companies in the same industry or in other industries that have different capital structures, debt levels and/or income tax rates.
EXCHANGE RATE INFORMATION
The following tables set forth the historical period-end, average, high and low noon buying rates in New York City for cable transfers in foreign currencies as certified by the Federal Reserve Bank of New York for the U.S. Dollar expressed in RMB per one U.S. Dollar for the periods indicated:
|
RMB/U.S. Dollar
|
||||||||||||||||
|
Year
|
Period end
1
|
Average rate
2
|
High
|
Low
|
||||||||||||
|
2013
|
6.0537
|
6.1412
|
6.2438
|
6.0537
|
||||||||||||
|
2014
|
6.2046
|
6.1701
|
6.2591
|
6.0402
|
||||||||||||
|
2015
|
6.4778
|
6.2869
|
6.4896
|
6.1870
|
||||||||||||
|
2016
|
6.9430
|
6.6549
|
6.9580
|
6.4480
|
||||||||||||
|
2017
|
6.5063
|
6.7350
|
6.9575
|
6.4773
|
||||||||||||
| (1) |
Represents the closing exchange rate on the last business day of the applicable period.
|
| (2) |
Represents the average of the closing exchange rates on the last business day of each month during the relevant one-year periods.
|
7
|
|
RMB/U.S. Dollar
|
|||||||
|
Month
|
High
|
Low
|
||||||
|
October 2017
|
6.6533
|
6.5712
|
||||||
|
November 2017
|
6.6385
|
6.5967
|
||||||
|
December 2017
|
6.6210
|
6.5063
|
||||||
|
January 2018
|
6.5263
|
6.2841
|
||||||
|
February 2018
|
6.3471
|
6.2649
|
||||||
|
March 2018
|
6.3565
|
6.2685
|
||||||
MARKET AND INDUSTRY DATA
Certain information relating to the industries in which each of our subsidiaries and associated companies operate and their position in such industries used or referenced in this annual report were obtained from internal analysis, surveys, market research, publicly available information and industry publications. Unless otherwise indicated, all sources for industry data and statistics are estimates or forecasts contained in or derived from internal or industry sources we believe to be reliable. Market data used throughout this annual report was obtained from independent industry publications and other publicly available information. Such data, as well as internal surveys, industry forecasts and market research, while believed to be reliable, have not been independently verified. In addition, in certain cases we have made statements in this annual report regarding the industries in which each of our subsidiaries and associated companies operate and their position in such industries based upon the experience of our businesses and their individual investigations of the market conditions affecting their respective operations. We cannot assure you that any of these statements are accurate or correctly reflect the position of subsidiaries and associated companies in such industries, and none of our internal surveys or information has been verified by independent sources.
Market data and statistics are inherently predictive and speculative and are not necessarily reflective of actual market conditions. Such statistics are based upon market research, which itself is based upon sampling and subjective judgments by both the researchers and the respondents. In addition, the value of comparisons of statistics for different markets is limited by many factors, including that (i) the markets are defined differently, (ii) the underlying information was gathered by different methods and (iii) different assumptions were applied in compiling the data. Accordingly, although we believe and operate as though all market and industry information presented in this annual report is accurate, the market statistics included in this annual report should be viewed with caution.
REPRESENTATION OF OPC CAPACITY AND PRODUCTION FIGURES
Unless otherwise indicated, statistics provided throughout this annual report with respect to power generation units are expressed in MW, in the case of the capacity of such power generation units, and in GWh, in the case of the electricity production of such power generation units. One GWh is equal to 1,000 megawatt hours, or MWh, and one MWh is equal to 1,000 kilowatt hours, or kWh. Statistics relating to aggregate annual electricity production are expressed in GWh and are based on a year of 8,760 hours. Unless otherwise indicated, OPC’s capacity figures provided in this annual report reflect 100% of the capacity of all of OPC’s assets, regardless of OPC’s ownership interest in the entity that owns each such asset. For information on OPC’s ownership interest in each of its operating companies and associated companies, see “
Item 4.B Business Overview—Our Businesses—OPC.”
DISTRIBUTION OF OUR INTEREST IN TOWER
On July 23, 2015, consistent with our strategy to realize value for our shareholders by, among other things, providing direct access to our businesses via distributions, we completed the pro rata distribution in specie of 18,030,041 ordinary shares of Tower, representing 23% of the then currently outstanding Tower shares and substantially all of our interest in Tower, to holders of our ordinary shares. In 2016, we sold our remaining interest in Tower.
8
SPECIAL NOTE REGARDING FORWARD-LOOKING STATEMENTS
This annual report contains forward-looking statements within the meaning of Section 21E of the Securities Exchange Act of 1934, or the Exchange Act, and reflects our current expectations and views of the quality of our assets, our anticipated financial performance, our future growth prospects, the future growth prospects of our businesses, the liquidity of our ordinary shares, and other future events. Forward-looking statements relate to expectations, beliefs, projections, future plans and strategies, anticipated events or trends and similar expressions concerning matters that are not historical facts, and are principally contained in the sections entitled “
Item 3. Key Information
,” “
Item 4. Information on the Company
” and “
Item 5. Operating and Financial Review and Prospects
.” These statements are made under the “safe harbor” provisions of the U.S. Private Securities Litigation Reform Act of 1995. Some of these forward-looking statements can be identified by terms and phrases such as “anticipate,” “should,” “likely,” “foresee,” “believe,” “estimate,” “expect,” “intend,” “continue,” “could,” “may,” “plan,” “project,” “predict,” “will,” and similar expressions.
These forward-looking statements relate to:
| · |
our goals and strategies;
|
| · |
our capital commitments and/or intentions with respect to each of our businesses;
|
| · |
our capital allocation principles, as set forth in “
Item 4.B Business Overview”
;
|
| · |
the funding requirements, strategies, and business plans of our businesses;
|
| · |
the potential listing, offering, distribution or monetization of our businesses;
|
| · |
expected trends in the industries and markets in which each of our businesses operate;
|
| · |
our expected tax status and treatment;
|
| · |
statements relating to litigation and/or regulatory proceedings;
|
| · |
statements relating to the sale of the Inkia Business, including estimated transaction costs, management compensation, advisor fees, other expenses and taxes, receipt of deferred consideration, expectations with respect to further tax liability, risks related to the pledge of OPC’s shares, the deferred payment agreement and Kenon’s guarantee, and statements with respect to claims relating to the Inkia Business
sale
retained by Kenon;
|
| · |
the expected effect of new accounting standards on Kenon;
|
| · |
with respect to OPC
:
|
| · |
the expected cost and timing of completion and commencement of construction and development projects, as well as the anticipated installed capacities of such projects, including OPC's project Tzomet Energy, including statements with respect to OPC continuing to seek relevant approvals to develop the Tzomet project and the expected payment of the remaining consideration, and the expected financing, total cost of construction, expected capacity and COD date of the OPC-Hadera power plant;
|
| · |
the OPC restructuring, including statements with respect to Kenon’s expectation in relation to future tax liability;
|
| · |
expected macroeconomic trends in Israel, including the expected growth in energy demand;
|
| · |
potential expansions;
|
| · |
its gas supply agreements;
|
| · |
its strategy;
|
9
| · |
expected trends in energy consumption;
|
| · |
regulatory trends;
|
| · |
its anticipated capital expenditures, including the expected sources of funding for capital expenditures;
|
| · |
the price and volume of gas available to OPC-Rotem and other IPPs in Israel; and
|
| · |
with respect to Qoros
:
|
| · |
Qoros’ expectation to renew or refinance its working capital facilities to support its continued operations and development;
|
| · |
Qoros’ strategy to increase its sales volumes;
|
| · |
Qoros’ expectation of growth in the Chinese passenger vehicle market, particularly within the C-segment, C-segment SUV and New Energy Vehicle, or NEV, markets;
|
| · |
Qoros’ expectation of pricing trends in the Chinese passenger vehicle market;
|
| · |
Qoros’ liquidity position;
|
| · |
Qoros’ strategy to develop its dealer network;
|
| · |
Qoros’ expectation of an increase in environmental regulations and the expected effect of such regulations on Qoros’ business;
|
| · |
Qoros’ ability to increase its production capacity;
|
| · |
the investment by the New Qoros Investor into Qoros, including the various elements of the investment and expected timing thereof, including, the commitment by the investor or an affiliate to introduce vehicle purchase orders to Qoros, the requirement that Chery make payments to Kenon in connection with guarantee release
s
, the repayment or equity conversion of the Qoros shareholder loans, the put option and investor's right to make further investments under the investment agreement, and the commitment in the investment agreement that the New Qoros Investor will assume its proportionate share of Kenon and Chery’s guarantee obligations;
|
| · |
Qoros’ expectation of the development of the NEV market in China, including expected trends regarding government subsidies for the purchase of NEVs and the growth of NEV infrastructure.
|
| · |
with respect to ZIM
:
|
| · |
the assumptions used in Kenon’s and ZIM’s impairment analysis with respect to Kenon’s investment in ZIM, and ZIM’s assets, respectively, including with respect to expected fuel price, freight rates, demand trends;
|
| · |
ZIM’s strategy with respect to its debt obligations;
|
| · |
ZIM’s expectation of modifications with respect to its and other shipping companies’ operating fleet and lines, including the utilization of larger vessels within certain trade zones and modifications made in light of environmental regulations; and
|
10
| · |
trends related to the global container shipping industry, including with respect to fluctuations in container supply, industry consolidation, demand, bunker prices and charter/freights rates;
|
| · |
with respect to Primus, its
:
|
| · |
strategy;
|
| · |
plans to raise capital;
|
| · |
plans and expectations in relation to Project Marcellus;
|
| · |
potential customers;
|
| · |
project pipeline; and
|
| · |
potential sources of revenue.
|
The preceding list is not intended to be an exhaustive list of each of our forward-looking statements. The forward-looking statements are based on our beliefs, assumptions and expectations of future performance, taking into account the information currently available to us and are only predictions based upon our current expectations and projections about future events. There are important factors that could cause our actual results, level of activity, performance or achievements to differ materially from the results, level of activity, performance or achievements expressed or implied by these forward-looking statements which are set forth in “
Item 3.D Risk Factors
.” Given these risks and uncertainties, you should not place undue reliance on forward-looking statements as a prediction of actual results.
Except as required by law, we undertake no obligation to publicly update or revise any forward-looking statements, whether as a result of new information, future events or otherwise. The foregoing factors that could cause our actual results to differ materially from those contemplated in any forward-looking statement included in this annual report should not be construed as exhaustive. You should read this annual report, and each of the documents filed as exhibits to the annual report, completely, with this cautionary note in mind, and with the understanding that our actual future results may be materially different from what we expect.
A.
Directors and Senior Management
Not applicable.
B.
Advisers
Not applicable.
C.
Auditors
Not applicable.
Not applicable.
11
A.
Selected Financial Data
The following tables set forth our selected combined carve-out financial and other data as of and for the years ended December 31, 2014 and 2013 and selected consolidated financial and other data as of and for the years ended December 31, 2017, 2016 and 2015. This selected financial data should be read in conjunction with our audited consolidated financial statements, and the related notes thereto, as of December 31, 2017 and 2016 and for the years ended December 31, 2017, 2016 and 2015, included elsewhere in this annual report, and the information contained in “Item 5. Operating and Financial Review and Prospects” and “Item 3.D Risk Factors.” The historical financial and other data included here and elsewhere in this annual report should not be assumed to be indicative of our future financial condition or results of operations.
Our consolidated financial statements as of and for the year ended December 31, 2017 reflect the Inkia Business as discontinued operations and our consolidated financial statements as of and for the years ended 2016 and 2015 and our selected combined carve-out financials set forth below have been reclassified for comparative purposes to account for the Inkia Business as discontinued operations.
ZIM’s results of operations for 2013 and the six months ended June 30, 2014 are also presented as discontinued operations for the relevant periods.
Our financial statements presented in this annual report have been prepared in accordance with IFRS.
12
The selected financial data below also includes certain non-IFRS measures used by us to evaluate our economic and financial performance. These measures are not identified as accounting measures under IFRS and therefore should not be considered as an alternative measure to evaluate our performance.
|
Year Ended December 31,
|
||||||||||||||||||||
|
2017
|
2016
1
|
2015
1
|
2014
1
|
2013
1,2
|
||||||||||||||||
|
(in millions of USD, except share data)
|
||||||||||||||||||||
|
Statements of Profit and Loss Data
3
|
||||||||||||||||||||
|
Revenue
|
$
|
366
|
$
|
324
|
$
|
326
|
$
|
413
|
$
|
187
|
||||||||||
|
Cost of sales and services (excluding depreciation)
|
(267
|
)
|
(251
|
)
|
(245
|
)
|
(297
|
)
|
(139
|
)
|
||||||||||
|
Depreciation
|
(31
|
)
|
(27
|
)
|
(25
|
)
|
(24
|
)
|
(11
|
)
|
||||||||||
|
Gross profit
|
$
|
68
|
$
|
46
|
$
|
56
|
$
|
92
|
$
|
37
|
||||||||||
|
Selling, general and administrative expenses
|
(56
|
)
|
(47
|
)
|
(50
|
)
|
(86
|
)
|
(40
|
)
|
||||||||||
|
Gain from distribution of dividend in kind
|
-
|
-
|
210
|
-
|
-
|
|||||||||||||||
|
Gain from disposal of investees
|
-
|
-
|
-
|
157
|
-
|
|||||||||||||||
|
Gain on bargain purchase
|
-
|
-
|
-
|
-
|
1
|
|||||||||||||||
|
Impairment of assets and investments
|
29
|
(72
|
)
|
(7
|
)
|
(48
|
)
|
-
|
||||||||||||
|
Dilution gains from reduction in equity interest held in associates
|
-
|
-
|
33
|
-
|
-
|
|||||||||||||||
|
Other expenses
|
-
|
-
|
(1
|
)
|
(6
|
)
|
(5
|
)
|
||||||||||||
|
Other income
|
1
|
1
|
4
|
(55
|
)
|
1
|
||||||||||||||
|
Operating profit / (loss) from continuing operations
|
$
|
42
|
$
|
(72
|
)
|
$
|
245
|
$
|
54
|
$
|
(6
|
)
|
||||||||
|
Financing expenses
|
(70
|
)
|
(47
|
)
|
(36
|
)
|
(49
|
)
|
(25
|
)
|
||||||||||
|
Financing income
|
3
|
7
|
11
|
14
|
-
|
|||||||||||||||
|
Financing expenses, net
|
$
|
(67
|
)
|
$
|
(40
|
)
|
$
|
(25
|
)
|
$
|
(35
|
)
|
$
|
(25
|
)
|
|||||
|
Provision of financial guarantee
|
-
|
(130
|
)
|
-
|
-
|
-
|
||||||||||||||
|
Share in losses of associated companies, net of tax
4
|
(111
|
)
|
(186
|
)
|
(187
|
)
|
(185
|
)
|
(160
|
)
|
||||||||||
|
(Loss) / profit from continuing operations before income taxes
|
$
|
(136
|
)
|
$
|
(428
|
)
|
$
|
33
|
$
|
(166
|
)
|
$
|
(191
|
)
|
||||||
|
Income taxes
|
(73
|
)
|
(2
|
)
|
(9
|
)
|
(68
|
)
|
(2
|
)
|
||||||||||
|
(Loss) / profit for the year from continuing operations
|
$
|
(209
|
)
|
$
|
(430
|
)
|
$
|
24
|
$
|
(234
|
)
|
$
|
(193
|
)
|
||||||
|
Profit and gain from sale of discontinued operations (after taxes)
5
|
478
|
36
|
72
|
711
|
(423
|
)
|
||||||||||||||
|
Profit / (loss) for the year
|
$
|
269
|
$
|
(394
|
)
|
$
|
96
|
$
|
477
|
$
|
(616
|
)
|
||||||||
|
Attributable to:
|
||||||||||||||||||||
|
Kenon’s shareholders
|
$
|
237
|
$
|
(412
|
)
|
$
|
73
|
$
|
459
|
$
|
(631
|
)
|
||||||||
|
Non-controlling interests
|
32
|
18
|
23
|
18
|
15
|
|||||||||||||||
|
Basic/diluted (loss)/profit per share attributable to Kenon’s shareholders (in Dollars):
|
||||||||||||||||||||
|
Basic/diluted profit/(loss) per share
|
4.40
|
(7.67
|
)
|
1.36
|
8.58
|
(11.82
|
)
|
|||||||||||||
|
Basic/diluted profit/(loss) per share from continuing operations
|
(4.00
|
)
|
(8.08
|
)
|
0.24
|
(4.44
|
)
|
(3.67
|
)
|
|||||||||||
|
Basic/diluted profit/(loss) per share from discontinued operations
|
8.40
|
0.41
|
1.12
|
13.02
|
(8.15
|
)
|
||||||||||||||
|
Statements of Financial Position Data
|
||||||||||||||||||||
|
Cash and cash equivalents
|
$
|
1,417
|
$
|
327
|
$
|
384
|
$
|
610
|
$
|
671
|
||||||||||
|
Short-term investments and deposits
|
7
|
90
|
309
|
227
|
30
|
|||||||||||||||
|
Trade receivables, net
|
44
|
284
|
123
|
181
|
358
|
|||||||||||||||
|
Other current assets, including derivatives
|
36
|
50
|
45
|
59
|
98
|
|||||||||||||||
|
Income tax receivable
|
-
|
11
|
4
|
3
|
7
|
|||||||||||||||
|
Inventories
|
-
|
92
|
51
|
56
|
150
|
|||||||||||||||
|
Total current assets
|
1,504
|
854
|
916
|
1,136
|
1,314
|
|||||||||||||||
|
Total non-current assets
6
|
1,022
|
4,284
|
3,567
|
3,184
|
4,671
|
|||||||||||||||
|
Total assets
|
$
|
2,526
|
$
|
5,138
|
$
|
4,483
|
$
|
4,320
|
$
|
5,985
|
||||||||||
|
Total current liabilities
|
806
|
1,045
|
653
|
497
|
2,925
|
|||||||||||||||
|
Total non-current liabilities
|
$
|
669
|
$
|
3,199
|
$
|
2,566
|
$
|
2,385
|
$
|
2,113
|
||||||||||
|
Equity attributable to the owners of the Company
|
983
|
681
|
1,061
|
1,230
|
710
|
|||||||||||||||
|
Share capital
|
$
|
1,267
|
$
|
1,267
|
$
|
1,267
|
$
|
-
|
$
|
-
|
||||||||||
|
Total equity
|
$
|
1,051
|
$
|
894
|
$
|
1,264
|
$
|
1,438
|
$
|
947
|
||||||||||
|
Total liabilities and equity
|
$
|
2,526
|
$
|
5,138
|
$
|
4,483
|
$
|
4,320
|
$
|
5,985
|
||||||||||
|
Basic/Diluted weighted average common shares outstanding used in calculating profit/(loss) per share (thousands)
|
53,761
|
53,720
|
53,649
|
53,383
|
7
|
53,383
|
7
|
|||||||||||||
|
Statements of Cash Flow Data
|
||||||||||||||||||||
|
Net cash provided by operating activities
|
$
|
392
|
$
|
162
|
$
|
290
|
$
|
410
|
$
|
257
|
||||||||||
|
Net cash used in investing activities
|
585
|
(400
|
)
|
(737
|
)
|
(883
|
)
|
(278
|
)
|
|||||||||||
|
Net cash provided by financing activities
|
97
|
175
|
233
|
430
|
281
|
|||||||||||||||
|
(Decrease) / increase in cash and cash equivalents
|
1,074
|
(63
|
)
|
(214
|
)
|
(43
|
)
|
260
|
||||||||||||
| (1) |
Results during these periods have been reclassified to reflect the Inkia Business as discontinued operations. For further information, see Note 2
9
to our financial statements included in this annual report.
|
| (2) |
Results during this period have been reclassified to reflect ZIM and Petrotec as discontinued operations.
|
| (3) |
Consists of the consolidated results of OPC and Primus and, from June 30, 2014, the consolidated results of HelioFocus; prior to this date, Kenon did not consolidate HelioFocus’ results of operations.
|
| (4) |
Includes Kenon’s share in ZIM’s loss for the six months ended December 31, 2014 and the years ended December 31, 2015, 2016 and 2017. As from July 1, 2014, Kenon accounted for ZIM’s results of operations pursuant to the equity method of accounting.
|
13
| (5) |
Consists of (i) ZIM’s results of operations for 2013 and the six months ended June 30, 2014, (ii) Petrotec’s results of operations for 2013 through 2014 and (iii) the results of operations of the Inkia Business for 2013 through 2017.
|
| (6) |
Includes Kenon’s associated companies: (i) Qoros, (ii) Tower (until June 30, 2015), (iii) ZIM (from June 30, 2014); and (iv) HelioFocus (prior to June 30, 2014).
|
| (7) |
Based on 53,383,015 shares which were issued as of January 7, 2015, the date of our spin-off from IC.
|
Selected Reportable Segment Data
Kenon is a holding company of (i) a 76% interest in OPC, (ii) a 24% interest in Qoros, (iii) a 32% interest in ZIM, and (iv) a 91% interest in Primus. Kenon used to also hold interests in (i) the Inkia Business, which was sold effective December 31, 2017, (ii) a 22.5% interest in Tower, which was distributed to Kenon shareholders on July 23, 2015 and (iii) HelioFocus, which was liquidated in July 2017.
The results of the following companies are included in Kenon’s statements of profit and loss as share in losses of associated companies, net of tax, for the years set forth below, except as otherwise indicated: (i) Qoros, (ii) ZIM from June 30, 2014 and (iii) Tower until June 30, 2015.
Kenon’s segments are OPC, Qoros and Other. Kenon’s Other segment includes the results of ZIM, Primus, and from June 30, 2014, the results of HelioFocus and Kenon (Company level).
The following table sets forth selected financial data for Kenon’s reportable segments for the periods presented:
|
|
Year Ended December 31, 2017
1
|
|||||||||||||||||||
|
OPC
|
Qoros
2
|
Other
3
|
Adjustments
4
|
Consolidated Results
|
||||||||||||||||
|
(in millions of USD, unless otherwise indicated)
|
||||||||||||||||||||
|
Sales
|
$
|
365
|
$
|
-
|
$
|
1
|
$
|
-
|
$
|
366
|
||||||||||
|
Depreciation and amortization
|
(30
|
)
|
-
|
(1
|
)
|
-
|
(31
|
)
|
||||||||||||
|
Impairment of assets and investments
|
-
|
-
|
29
|
-
|
29
|
|||||||||||||||
|
Financing income
|
1
|
-
|
13
|
(11
|
)
|
3
|
||||||||||||||
|
Financing expenses
|
(34
|
)
|
-
|
(47
|
)
|
11
|
(70
|
)
|
||||||||||||
|
Share in (losses) income of associated companies
|
-
|
(121
|
)
|
10
|
-
|
(111
|
)
|
|||||||||||||
|
Profit / (Loss) before taxes
|
$
|
23
|
$
|
(121
|
)
|
$
|
(38
|
)
|
$
|
-
|
$
|
(136
|
)
|
|||||||
|
Income taxes
|
(9
|
)
|
-
|
(64
|
)
|
-
|
(73
|
)
|
||||||||||||
|
Profit / (Loss) from continuing operations
|
$
|
14
|
$
|
(121
|
)
|
$
|
(102
|
)
|
$
|
-
|
$
|
(209
|
)
|
|||||||
|
Segment assets
5
|
$
|
936
|
$
|
-
|
$
|
1,468
|
6
|
$
|
-
|
$
|
2,404
|
|||||||||
|
Investments in associated companies
|
-
|
2
|
120
|
-
|
122
|
|||||||||||||||
|
Segment liabilities
|
743
|
-
|
732
|
7
|
-
|
1,475
|
||||||||||||||
|
Capital expenditure
8
|
109
|
-
|
121
|
-
|
230
|
|||||||||||||||
| (1) |
In December 2017, Inkia completed the sale of the Inkia Business. For further information, see Note 2
9
to our financial statements included in this annual report.
|
| (2) |
Associated company.
|
| (3) |
Includes the results of Primus and HelioFocus (which was liquidated in July 2017); the results of ZIM, as an associated company; as well as Kenon’s and IC Green’s holding company and general and administrative expenses.
|
14
| (4) |
“Adjustments” includes inter-segment financing income and expenses.
|
| (5) |
Excludes investments in associates.
|
| (6) |
Includes Kenon’s, IC Green’s and IC Power holding company assets.
|
| (7) |
Includes Kenon’s, IC Green’s and IC Power holding company liabilities.
|
| (8) |
Includes the additions of Property, Plant and Equipment, or PP&E, and intangibles based on an accrual basis.
|
|
|
Year Ended December 31, 2016
1
|
|||||||||||||||||||
|
OPC
|
Qoros
2
|
Other
3
|
Adjustments
4
|
Consolidated Results
|
||||||||||||||||
|
(in millions of USD, unless otherwise indicated)
|
||||||||||||||||||||
|
Sales
|
$
|
324
|
$
|
—
|
$
|
—
|
$
|
-
|
$
|
324
|
||||||||||
|
Depreciation and amortization
|
(27
|
)
|
—
|
-
|
-
|
(27
|
)
|
|||||||||||||
|
Impairment of assets and investments
|
-
|
—
|
(72
|
)
|
-
|
(72
|
)
|
|||||||||||||
|
Financing income
|
3
|
—
|
16
|
(12
|
)
|
7
|
||||||||||||||
|
Financing expenses
|
(23
|
)
|
—
|
(36
|
)
|
12
|
(47
|
)
|
||||||||||||
|
Share in losses of associated companies
|
-
|
(143
|
)
|
(43
|
)
|
-
|
(186
|
)
|
||||||||||||
|
Provision of financial guarantee
|
-
|
—
|
(130
|
)
|
-
|
(130
|
)
|
|||||||||||||
|
Profit/(Loss) before taxes
|
$
|
20
|
$
|
(143
|
)
|
$
|
(305
|
)
|
$
|
-
|
$
|
(428
|
)
|
|||||||
|
Income taxes
|
—
|
—
|
(2
|
)
|
-
|
(2
|
)
|
|||||||||||||
|
Profit/(Loss) from continuing operations
|
$
|
20
|
$
|
(143
|
)
|
$
|
(307
|
)
|
$
|
-
|
$
|
(430
|
)
|
|||||||
|
Segment assets
5
|
$
|
668
|
$
|
—
|
$
|
4,262
|
$
|
-
|
$
|
4,930
|
||||||||||
|
Investments in associated companies
|
-
|
118
|
90
|
-
|
208
|
|||||||||||||||
|
Segment liabilities
|
534
|
—
|
3,710
|
-
|
4,244
|
|||||||||||||||
|
Capital expenditure
8
|
73
|
—
|
245
|
-
|
318
|
|||||||||||||||
| (1) |
Results during this period have been reclassified to reflect the results of the Inkia Business as discontinued operations. For further information, see Note 29 to our financial statements included in this annual report.
|
| (2) |
Associated company.
|
| (3) |
Includes the results of Primus and HelioFocus (which was liquidated in July 2017); the results of ZIM, as an associated company; as well as Kenon’s and IC Green’s holding company and general and administrative expenses.
|
| (4) |
“Adjustments” includes inter-segment financing income and expenses.
|
| (5) |
Excludes investments in associates.
|
| (6) |
Includes Kenon’s, IC Green’s and IC Power holding company assets.
|
| (7) |
Includes Kenon’s, IC Green’s and IC Power holding company liabilities.
|
| (8) |
Includes the additions of PP&E and intangibles based on an accrual basis.
|
15
|
Year Ended December 31, 2015
1
|
||||||||||||||||||||
|
OPC
|
Qoros
2
|
Other
3
|
Adjustments
4
|
Consolidated Results
|
||||||||||||||||
|
(in millions of USD, unless otherwise indicated)
|
||||||||||||||||||||
|
Sales
|
$
|
326
|
$
|
—
|
$
|
—
|
$
|
-
|
$
|
326
|
||||||||||
|
Depreciation and amortization
|
(26
|
)
|
—
|
1
|
—
|
(25
|
)
|
|||||||||||||
|
Asset impairment
|
-
|
—
|
(7
|
)
|
—
|
(7
|
)
|
|||||||||||||
|
Financing income
|
3
|
—
|
8
|
—
|
11
|
|||||||||||||||
|
Financing expenses
|
(26
|
)
|
—
|
(10
|
)
|
—
|
(36
|
)
|
||||||||||||
|
Share in (losses) income of associated companies
|
-
|
(196
|
)
|
9
|
—
|
187
|
||||||||||||||
|
Gain from distribution of dividend in kind
|
-
|
—
|
210
|
—
|
210
|
|||||||||||||||
|
Profit/(Loss) before taxes
|
$
|
30
|
$
|
(196
|
)
|
$
|
199
|
$
|
—
|
$
|
33
|
|||||||||
|
Income taxes
|
(8
|
)
|
—
|
(1
|
)
|
—
|
(9
|
)
|
||||||||||||
|
Profit/(Loss) from continuing operations
|
$
|
22
|
$
|
(196
|
)
|
$
|
198
|
$
|
—
|
$
|
24
|
|||||||||
|
Segment assets
5
|
$
|
811
|
$
|
—
|
$
|
3,303
|
6
|
$
|
—
|
$
|
4,114
|
|||||||||
|
Investments in associated companies
|
-
|
159
|
210
|
—
|
369
|
|||||||||||||||
|
Segment liabilities
|
677
|
—
|
2,542
|
7
|
—
|
3,219
|
||||||||||||||
|
Capital expenditure
8
|
18
|
—
|
556
|
—
|
574
|
|||||||||||||||
| (1) |
Results during this period have been reclassified to reflect the results of the Inkia Business as discontinued operations. For further information, see Note 29 to our financial statements included in this annual report.
|
| (2) |
Associated company.
|
| (3) |
Includes the results of Primus and HelioFocus (which was liquidated in July 2017); the results of ZIM and Tower (up to June 30, 2015), as associated companies; as well as Kenon’s and IC Green’s holding company and general and administrative expenses.
|
| (4) |
“Adjustments” includes inter-segment sales.
|
| (5) |
Excludes investments in associates.
|
| (6) |
Includes Kenon’s, IC Green’s and IC Power holding company assets.
|
| (7) |
Includes Kenon’s, IC Green’s and IC Power holding company liabilities.
|
| (8) |
Includes the additions of PP&E and intangibles based on an accrual basis.
|
OPC
The following tables set forth other financial and key operating data for OPC for the periods presented:
|
2017
|
2016
|
2015
|
||||||||||
|
($ millions, except as otherwise indicated)
|
||||||||||||
|
Net income for the period
|
14
|
20
|
22
|
|||||||||
|
EBITDA
1
|
86
|
67
|
79
|
|||||||||
|
Net Debt
2
|
395
|
371
|
289
|
|||||||||
|
Net energy generated (GWh)
|
3,655
|
3,510
|
3,736
|
3
|
||||||||
|
Energy sales (GWh)
|
3,988
|
3.996
|
3,953
|
4
|
||||||||
| (1) |
OPC defines “EBITDA” for each period as net income (loss) for the period before depreciation and amortization, financing expenses, net and income tax expense.
|
EBITDA is not recognized under IFRS or any other generally accepted accounting principles as a measure of financial performance and should not be considered as a substitute for net income or loss, cash flow from operations or other measures of operating performance or liquidity determined in accordance with IFRS. EBITDA is not intended to represent funds available for dividends or other discretionary uses because those funds may be required for debt service, capital expenditures, working capital and other commitments and contingencies. EBITDA presents limitations that impair its use as a measure of OPC’s profitability since it does not take into consideration certain costs and expenses that result from its business that could have a significant effect on OPC’s net income, such as finance expenses, taxes and depreciation.
16
The following table sets forth a reconciliation of OPC’s net income to its EBITDA for the periods presented. Other companies may calculate EBITDA differently, and therefore this presentation of EBITDA may not be comparable to other similarly titled measures used by other companies:
|
Year Ended December 31,
|
||||||||||||
|
2017
|
2016
|
2015
|
||||||||||
|
(in millions of USD)
|
||||||||||||
|
Net income for the period
|
$
|
14
|
$
|
20
|
$
|
22
|
||||||
|
Depreciation and amortization
|
30
|
27
|
26
|
|||||||||
|
Finance expenses, net
|
33
|
20
|
23
|
|||||||||
|
Income tax expense
|
9
|
-
|
8
|
|||||||||
|
EBITDA
|
$
|
86
|
$
|
67
|
$
|
79
|
||||||
| (2) |
Net debt is calculated as total debt, minus cash
(which includes
short term deposits and restricted cash and long-term deposits and restricted cash
)
. Net debt is not a measure recognized under IFRS. The tables below sets forth a reconciliation of OPC’s total debt to net debt.
|
|
Year Ended December 31, 2017
|
||||||||||||||||
|
OPC-Rotem
|
OPC-Hadera
|
Energy & Others
|
Total OPC
|
|||||||||||||
|
(in millions of USD)
|
||||||||||||||||
|
Total debt
(i)
|
383
|
144
|
91
|
618
|
||||||||||||
|
Cash
(ii)
|
86
|
31
|
106
|
223
|
||||||||||||
|
Net Debt
|
$
|
297
|
$
|
113
|
$
|
(15
|
)
|
$
|
395
|
|||||||
| (i) |
Total debt comprises loans from banks and third parties and debentures, and includes long term and short term debt.
|
| (ii) |
Includes short-term deposits and restricted cash of $0 million; and includes long-term deposits and restricted cash of $76 million (including $22 million in cash that was deposited into an escrow account in connection with the Tamar gas dispute. For further information, see “
|
|
Year Ended December 31, 2016
|
||||||||||||||||
|
OPC-Rotem
|
OPC-Hadera
|
Energy & Others
|
Total OPC
|
|||||||||||||
|
(in millions of USD)
|
||||||||||||||||
|
Total debt
(i)
|
365
|
—
|
52
|
417
|
||||||||||||
|
Cash
(ii)
|
22
|
1
|
23
|
46
|
||||||||||||
|
Net Debt
|
$
|
343
|
$
|
(1
|
)
|
$
|
29
|
$
|
371
|
|||||||
| (i) |
Total debt comprises loans from banks and third parties and debentures, and includes long term and short term debt.
|
| (ii) |
Includes short-term deposits and restricted cash of $4 million and long-term deposits and restricted cash of $19 million.
|
|
Year Ended
December 31,
2015
|
||||
|
Total OPC
|
||||
|
(in millions of USD)
|
||||
|
Total debt
(i)
|
473
|
|||
|
Cash
(ii)
|
184
|
|||
|
Net Debt
|
$
|
289
|
||
| (i) |
Total debt comprises loans from banks and third parties and debentures, and includes long term and short term debt.
|
| (ii) |
Includes short-term deposits and restricted cash of $
50
million and long-term deposits and restricted cash of $
17
million.
|
| (3) |
Includes generation of OPC-Rotem only.
|
| (4) |
Includes sales of OPC-Rotem only.
|
Set forth below is a summary of certain OPC key historical financial and other operational information, for the periods set forth below.
|
Year Ended December 31,
|
||||||||||||
|
2017
|
2016
|
2015
|
||||||||||
|
($ millions, except as otherwise indicated)
|
||||||||||||
|
Sales
|
365
|
324
|
326
|
|||||||||
|
Cost of Sales
|
(266
|
)
|
(251
|
)
|
(245
|
)
|
||||||
|
Operating income (loss)
|
69
|
46
|
57
|
|||||||||
|
Operating margins
|
19
|
%
|
14
|
%
|
17
|
%
|
||||||
|
Financing expenses, net
|
33
|
20
|
23
|
|||||||||
|
Net income for the period
|
14
|
20
|
22
|
|||||||||
|
Net Energy sales (GWh)
|
3,988
|
3.996
|
3,953
|
1
|
||||||||
| (1) |
Includes sales of OPC-Rotem only.
|
17
B.
Capitalization and Indebtedness
Not applicable.
C.
Reasons for the Offer and Use of Proceeds
Not applicable.
D.
Risk Factors
Our business, financial condition, results of operations and liquidity can suffer materially as a result of any of the risks described below. While we have described all of the risks we consider material, these risks are not the only ones we face. We are also subject to the same risks that affect many other companies, such as technological obsolescence, labor relations, geopolitical events, climate change and risks related to the conducting of international operations. Additional risks not known to us or that we currently consider immaterial may also impair our business operations. Our businesses routinely encounter and address risks, some of which may cause our future results to be different—sometimes materially different—than we presently anticipate.
Risks Related to Our Strategy and Operations
Some of our businesses have significant capital requirements.
The business plans of our businesses contemplate additional debt or equity financing which is expected to be raised from third parties. However, our businesses may be unable to raise the necessary capital from third party financing sources, and in this case Kenon would be their only source of funding. For example, Qoros will require additional cash to further its development and, until it achieves significant sales levels, to meet its operating expenses, financing expenses, and capital expenditures.
In the event that one or more of our businesses require capital, either in accordance with their business plans or in response to new developments or to meet operating expenses, and such businesses are unable to raise such financing, Kenon may (i) issue equity in the form of shares or convertible instruments (through a pre-emptive offering or otherwise), (ii) provide financing to a business using funds received from the operations or sales of Kenon’s other businesses, (iii) sell part, or all, of its interest in any of its businesses, (iv) raise debt financing at the Kenon level or (v) provide guarantees or collateral in support of the debt of its businesses. To the extent debt financing is available to it, any debt financing that Kenon incurs may not be on favorable terms, may require Kenon to agree to restrictive covenants that limit how Kenon manages its investments in its businesses, and may also limit dividends or other distributions by Kenon. In addition, any equity financing, whether in the form of a sale of shares or convertible instruments, would dilute existing holders of our ordinary shares and any such equity financing could be at prices that are lower than the current trading prices.
In the future, third party financing sources may also require Kenon to guarantee an individual business’ indebtedness and/or provide additional collateral, including collateral via a cross-collateralization of assets across businesses. To the extent Kenon guarantees an individual business’ indebtedness, it may divert funds received from one business to another business. We may also sell some or all of our interests in any of our businesses to provide funding for another business. Additionally, if we cross-collateralize certain assets (i.e., pledging shares or assets of one of our businesses to secure debt of another of our businesses) in order to provide additional collateral to a lender, we may lose an asset associated with one business in the event that a separate business is unable to meet its debt obligations. Furthermore, if Kenon provides any of our businesses with additional capital, provides any third parties with indemnification rights or a guarantee, and/or provides additional collateral, including via cross-collateralization, this could reduce our liquidity. For further information on the capital resources and requirements of each of our businesses, see “
Item 5.B Liquidity and Capital Resources.
”
18
Disruptions in the financial markets could adversely affect Kenon or its businesses, which may not be able to obtain additional financing on acceptable terms or at all.
Kenon’s businesses may seek to access capital markets for various purposes, which may include raising funding for the repayment of indebtedness, acquisitions, capital expenditures and for general corporate purposes. The ability of Kenon’s businesses to access capital lending markets, and the cost of such capital, could be negatively impacted by disruptions in those markets. Capital markets have demonstrated significant volatility in recent years. These disruptions impacted other areas of the economy and led to a slowdown in general economic activity. Similar disruptions in the credit markets could make it more difficult or expensive for our businesses to access the capital or lending markets if the need arises and may make financing terms for borrowers less attractive or available. Furthermore, a decline in the value of any of our businesses, which are or may be used as collateral in financing agreements, could also impact their ability to access financing.
Kenon may seek to access the capital or lending markets to obtain financing in the future, including to support its businesses. The availability of such financing and the terms thereof will be impacted by many factors, including: (i) our financial performance, (ii) our credit ratings or absence of a credit rating, (iii) the liquidity of the overall capital markets, and (iv) the state of the economy. There can be no assurance that Kenon will be able to access the capital markets on acceptable terms or at all. If Kenon deems it necessary to access financing and is unable to do so on acceptable terms or at all, this could have a material adverse effect on our financial condition or liquidity.
We are dependent upon access to the capital markets to execute our strategy.
Our strategy may include sales or distributions of our interests in our businesses. For example, in August 2017, OPC completed an initial public offering, or IPO, in Israel, and a listing on the TASE. Our ability to complete an initial public offering, distribution or listing of one or more of our businesses is heavily dependent upon the public equity markets.
To the extent that the securities of our business are publicly traded, we are exposed to risks of downward movement in market prices. In addition, large holdings of securities can often be disposed only over a substantial length of time. Accordingly, under certain conditions, we may be forced to either sell our equity interest in a particular business at lower prices than expected to realize or defer such a sale, potentially for a long period of time. In addition, following OPC's initial public offering in August 2017, our shares in OPC are subject to a lock-up period, which restricts the amount of shares sold each month until 18 months after the IPO, pursuant to TASE regulation.
We have pledged a portion of our shares in OPC to secure obligations to the buyer of the Inkia Businesses under the indemnification obligations in the share purchase agreement for the sale. To the extent that we are required to make payments under the indemnity obligation in the share purchase agreement, we may be required to sell shares in OPC and we would be subject to market conditions at the time of such sale (and the TASE regulations in relation to such sale) which could mean that we are forced to sell our shares for a lower price than we would otherwise be able to do so, particularly if we need to sell a significant amount of shares. If we do not make required payments in the event we are required to make payments under the share purchase agreement, then, in certain circumstances, the pledge can be enforced to satisfy the indemnity obligations, which would result in a loss of some or all of the pledged OPC shares.
We are a holding company and are dependent upon cash flows from our businesses to meet our existing and future obligations.
We are a holding company of various operating companies, and as a result, do not conduct independent operations or possess significant assets other than investments in and advances to our businesses. As a result, we depend on funds from our businesses or external financing to meet our operating expenses and obligations, including our guarantee of the indemnification obligations under the share purchase agreement for the sale of the Inkia Business and our operating expenses and our guarantee obligations in respect of Qoros debt.
Kenon may also seek to raise financing at the Kenon level to meet its obligations. In the event that funds from its businesses or external financing are not available to meet such obligations on reasonable terms or at all, Kenon may need to sell assets to meet such obligations, and its ability to sell assets may be limited, particularly in light the various pledges over the shares and assets of some of Kenon's businesses. Any sales of assets may not be at attractive prices, particularly if such sales must be made quickly to meet Kenon’s obligations.
19
Kenon has provided loans and guarantees in the past to support our businesses, such as Qoros, and may provide additional loans to or make investments in or provide guarantees in support of its businesses. Kenon’s liquidity requirements will increase to the extent it makes further loans or grants additional guarantees to support its businesses.
In addition, as Kenon’s businesses are legally distinct from it and will generally be required to service their debt obligations before making distributions to Kenon, Kenon’s ability to access such cash flow from its businesses may be limited in some circumstances and it may not have the ability to cause its subsidiaries and associated companies to make distributions to Kenon, even if they are able to do so. Additionally, the terms of existing and future joint venture, financing, or cooperative operational agreements and/or the laws and jurisdictions under which each of Kenon’s businesses are organized may also limit the timing and amount of any dividends, other distributions, loans or loan repayments to Kenon.
Additionally, as dividends are generally taxed and governed by the relevant authority in the jurisdiction in which the company is incorporated, there may be numerous and significant tax or other legal restrictions on the ability of Kenon’s businesses to remit funds to us, or to remit such funds without incurring significant tax liabilities or incurring a ratings downgrade.
We do not have the right to manage, and in some cases do not control, some of our businesses, and therefore we may not be able to realize some or all of the benefits that we expect to realize from our businesses.
As we own minority interests in Qoros and ZIM, we are subject to the operating and financial risks of these businesses, the risk that these businesses may make business, operational, financial, legal or regulatory decisions that we do not agree with, and the risk that we may have objectives that differ from those of the applicable business itself or its other shareholders. Our ability to control the development and operation of these investments may be limited, and we may not be able to realize some or all of the benefits that we expect to realize from these investments. For example, we may not be able to cause these businesses to make distributions to us in the amount or at the time that we may need or want such distributions.
In January 2018, Kenon announced the
New Qoros Investor completed a transaction to purchase 51% of Qoros from Kenon and Chery for RMB3.315 billion (approximately $526 million), which is part of an investment structure to invest a total of approximately RMB6.63 billion (approximately $1,052 million) by the New Qoros Investor of which RMB6.5 billion will ultimately be invested in Qoros’ equity. As a result, Kenon and Chery now have 24% and 25% stakes in Qoros, respectively.
I
n addition, Kenon can now appoint two of nine Qoros directors (as opposed to half of the Qoros directors prior to the investment). Although we still actively participate in the management of Qoros through our 24% interest and board representatives, our right to control Qoros decreased with the new investment. For further information, see “
Item 4.B Business Overview—Our Businesses—Qoros —Qoros’ Investment Agreement
.”
In addition, we rely on the internal controls and financial reporting controls of our businesses and the failure of our businesses to maintain effective controls or to comply with applicable standards could make it difficult to comply with applicable reporting and audit standards. For example, the preparation of our consolidated financial statements requires the prompt receipt of financial statements from each of our subsidiaries and associated companies, some of whom rely on the prompt receipt of financial statements from each of their subsidiaries and associated companies. Additionally, in certain circumstances, we may be required to file with our annual report on Form 20-F, or a registration statement filed with the SEC, financial information of associated companies which has been audited in conformity with SEC rules and regulations and relevant audit standards. We may not, however, be able to procure such financial statements, or such audited financial statements, as applicable, from our subsidiaries and associated companies and this could render us unable to comply with applicable SEC reporting standards.
Our businesses are leveraged.
Some of our businesses are significantly leveraged and may incur additional debt financing in the future. As of December 31, 2017, OPC had $618 million of outstanding indebtedness, Qoros had outstanding indebtedness of RMB4.8 billion (excluding shareholder loans), and ZIM had outstanding indebtedness of approximately $1.5 billion.
20
Highly leveraged assets are inherently more sensitive to declines in earnings, increases in expenses and interest rates, and adverse market conditions. A leveraged company’s income and net assets also tend to increase or decrease at a greater rate than would otherwise be the case if money had not been borrowed. Consequently, the risk of loss associated with a leveraged company is generally greater than for companies with comparatively less debt. Additionally, some of our businesses’ assets have been pledged to secure indebtedness, and as a result, the amount of collateral that is available for future secured debt or credit support and a business’ flexibility in dealing with its secured assets may be limited. Our businesses use a substantial portion of their consolidated cash flows from operations to make debt service payments, thereby reducing its ability to use their cash flows to fund operations, capital expenditures, or future business opportunities. Additionally, notwithstanding the completion of its restructuring in July 2014, ZIM remains highly leveraged and will continue to face risks associated with those of a highly leveraged company.
Our businesses will generally have to service their debt obligations before making distributions to us or to any other shareholder. In addition, many of the financing agreements relating to the debt facilities of our operating companies contain covenants and limitations, including the following:
| · |
leverage ratio;
|
| · |
minimum equity;
|
| · |
debt service coverage ratio;
|
| · |
limits on the incurrence of liens or the pledging of certain assets;
|
| · |
limits on the incurrence of subsidiary debt;
|
| · |
limits on the ability to enter into transactions with affiliates, including us;
|
| · |
minimum liquidity and fixed charge cover ratios;
|
| · |
limits on the ability to pay dividends to shareholders, including us;
|
| · |
limits on our ability to sell assets; and
|
| · |
other non-financial covenants and limitations and various reporting obligations.
|
If any of our businesses are unable to repay or refinance their indebtedness as it becomes due, or if they are unable to comply with their covenants, we may decide to sell assets or to take other actions, including (i) reducing financing in the future for investments, acquisitions or general corporate purposes or (ii) dedicating an unsustainable level of our cash flow from operations to the payment of principal and interest on their indebtedness. As a result, the ability of our businesses to withstand competitive pressures and to react to changes in the various industries in which we operate could be impaired. A breach of any of our businesses’ debt instruments and/or covenants could result in a default under the relevant debt instrument(s), which could lead to an event of default. Upon the occurrence of such an event of default, the lenders could elect to declare all amounts outstanding thereunder to be immediately due and payable and, in the case of credit facility lenders, terminate all commitments to extend further credit. If the lenders accelerate the repayment of the relevant borrowings, the relevant business may not have sufficient assets to repay any outstanding indebtedness, which could result in a complete loss of that business for us. Furthermore, the acceleration of any obligation under certain debt instrument may permit the holders of other material debt to accelerate their obligations pursuant to “cross default” provisions, which could have a material adverse effect on our business, financial condition and liquidity.
Qoros will generally be required to seek bank approvals to make shareholder loan repayments.
Furthermore, changes to the investment structure of the transaction completed by the New Qoros Investor could require Qoros to receive bank consent. Failure to obtain such consent could have an adverse impact.
As a result, our businesses’ leverage could have a material adverse effect on our business, financial condition, results of operations or liquidity.
In addition, we have back-to-back guarantee obligations to Chery of RMB320 million
, with respect to debt in principal of RMB288 million
,
and have pledged a substantial portion of our interest in Qoros to support certain Qoros debt, as well as Chery's guarantees of Qoros debt.
We face risks in relation to the New Qoros Investor's investment in Qoros
In January 2018, Kenon announced the New Qoros Investor completed a transaction to purchase 51% of Qoros from Kenon and Chery for RMB3.315 billion (approximately $526 million), which is part of an investment structure to invest a total of approximately RMB6.63 billion (approximately $1,052 million) by the New Qoros Investor of which RMB6.5 billion will ultimately be invested in Qoros’ equity. As a result, Kenon and Chery now have 24% and 25% stakes in Qoros, respectively. The investment was made pursuant to an investment agreement among the New Qoros Investor, Quantum, Wuhu Chery and Qoros. Under the investment agreement,
during the three-year period beginning from the closing of the investment, Kenon has the right to cause the New Qoros Investor to purchase up to 50% of its remaining equity interest in Qoros, following the related capital increase, for up to RMB1.56 billion (approximately $248 million), being the price for 50% of Kenon's remaining 24% interest in Qoros, subject to adjustments for inflation. From the third anniversary of the closing until April 2023, Kenon has the right to cause the New Qoros Investor to purchase up to all of its remaining equity interests in Qoros for up to a total of RMB3.12 billion (approximately $495 million) (for Kenon's full 24% interest in Qoros), subject to adjustment for inflation.
If the New Qoros Investor (and the other company within the Baoeneng group has effectively guaranteed the New Qoros Investor's obligations under the put right by also serving as a grantor of the put) is unable to purchase Kenon’s equity interest in Qoros upon exercise of the put option, or if any exercise of the put option does not result in a purchase of Kenon's shares in accordance with the terms thereof for any other reason, this could have a material adverse effect on Kenon.The investment agreement also provides for the
repayment of existing shareholder loans owing from Qoros, and as a result Kenon is
subject to the risk of non-payment.
21
As part of the
investment agreement
,
the New Qoros Investor
will
assume its pro rata share (based on its 51% equity ownership) of the guarantees and pledges provided by Quantum and Wuhu Chery in respect of Qoros debt
, which will be subject to further adjustment following any future changes in the equity ownership in Qoros (including as a result of the exercise of the put option or investment right by a shareholder under the investment agreement)
.
The New Qoros Investor is still in the process of assuming its proportionate obligations with respect to the RMB1.2 billion loan facility after which Kenon will also be proportionately released from its pledge obligations thereunder, subject to the Qoros bank lender consent.
Failure to obtain bank consents could adversely impact Kenon.
Our success will be dependent upon the efforts of our directors and executive officers.
Our success will be dependent upon the decision-making of our directors and executive officers as well as the directors and executive officers of our businesses. The loss of any or all of our directors and executive officers could delay the implementation of our strategies or divert our directors and executive officers’ attention from our operations which could have a material adverse effect on our business, financial condition, results of operations or liquidity.
Foreign exchange rate fluctuations and controls could have a material adverse effect on our earnings and the strength of our balance sheet.
Through our businesses, we have facilities and generate costs and revenues in a number of geographic regions across the globe. As a result, a significant portion of our revenue and certain of our businesses’ operating expenses, assets and liabilities, are denominated in currencies other than the U.S. Dollar. The predominance of certain currencies varies from business to business, with many of our businesses generating revenues or incurring indebtedness in more than one currency. For example, most of ZIM’s revenues and a significant portion of its expenses are denominated in the U.S. Dollar. However, a material portion of ZIM’s expenses are denominated in local currencies.
We have outstanding back-to-back guarantees to Chery of up to RMB320 million, with respect to debt in principal of RMB288 million, plus certain interest and fees, in respect of certain of Qoros’ indebtedness. In addition, from time to time, we have held, and may hold, a portion of our available cash in RMB, which may expose us to RMB exchange rate fluctuations.
Furthermore, our businesses may pay distributions or make payments to us in currencies other than the U.S. Dollar, which we must convert to U.S. Dollars prior to making dividends or other distributions to our shareholders if we decide to make any distributions in the future. Foreign exchange controls in countries in which our businesses operate may further limit our ability to repatriate funds from unconsolidated foreign affiliates or otherwise convert local currencies into U.S. Dollars.
Consequently, as with any international business, our liquidity, earnings, expenses, asset book value, and/or amount of equity may be materially affected by short-term or long-term exchange rate movements or controls. Such movements may give rise to one or more of the following risks, any of which could have a material adverse effect on our business, financial condition, results of operations or liquidity:
| · |
Transaction Risk
—exists where sales or purchases are denominated in overseas currencies and the exchange rate changes after our entry into a purchase or sale commitment but
prior to
the completion of the underlying transaction itself;
|
| · |
Translation Risk
—exists where the currency in which the results of a business are reported differs from the underlying currency in which the business’ operations are transacted;
|
| · |
Economic Risk
—exists where the manufacturing cost base of a business is denominated in a currency different from the currency of the market into which the business’ products are sold; and
|
22
| · |
Reinvestment Risk
—exists where our ability to reinvest earnings from operations in one country to fund the capital needs of operations in other countries becomes limited.
|
If our businesses are unable to manage their interest rate risks effectively, our cash flows and operating results may suffer.
Certain of our businesses’ indebtedness bears interest at variable, floating rates. In particular, some of this indebtedness is in the form of Consumer Price Index (or CPI)-linked, NIS-denominated bonds. We, or our businesses, may incur further indebtedness in the future that also bears interest at a variable rate or at a rate that is linked to fluctuations in a currency in the form of other than the U.S. Dollar. Although our businesses attempt to manage their interest rate risk, there can be no assurance that they will hedge such exposure effectively or at all in the future. Accordingly, increases in interest rates or changes in the CPI that are greater than changes anticipated based upon historical trends could have a material adverse effect on our or any of our businesses’ business, financial condition, results of operations or liquidity.
Risks Related to the Industries in Which Our Businesses Operate
Conditions in the global economy, and in the industries in which our businesses operate in particular, could have a material adverse effect on us.
The business and operating results of each of our businesses are affected by worldwide economic conditions, particularly conditions in the energy generation, passenger vehicle, and shipping industries our businesses operate in. The operating results and profitability of our businesses may be adversely affected by slower global economic growth, credit market crises, lower levels of consumer and business confidence, downward pressure on prices, high unemployment levels, reduced levels of capital expenditures, fluctuating commodity prices (particularly prices for electricity, natural gas, bunker, gasoline, and crude oil), bankruptcies, government deficit reduction and austerity measures, heightened volatility, uncertainties with respect to the stability of the emerging markets, increased tariffs and other forms of trade protectionism and other challenges affecting the global economy. Volatility in global financial markets and in prices for oil and other commodities could result in a worsening of global economic conditions. As a result of global economic conditions, some of the customers of our businesses have experienced, and may experience, deterioration of their businesses, cash flow shortages, and/or difficulty in obtaining financing. As a result, existing or potential customers may delay or cancel plans to purchase the products and/or services of our businesses, or may not be able to fulfill their obligations to us in a timely fashion. Furthermore, the vendors, suppliers and/or partners of each of our businesses may experience similar conditions, which may impact their ability to fulfill their obligations.
Additionally, economic downturns may alter the priorities of governments to subsidize and/or incentivize participation in any of the markets in which our businesses operate. For example, economic downturns or political dynamics may impact the availability of financial incentives provided by the Chinese government for Chinese automobile purchases. Slower growth or deterioration in the global economy (as a result of recent volatility in global markets, trade protectionism and commodity prices, or otherwise) could have a material adverse effect on our business, financial condition, results of operations or liquidity.
Our businesses’ operations expose us to risks associated with conditions in those markets.
Through our businesses, we operate and service customers in geographic regions around the world which exposes us to risks, including:
| · |
heightened economic volatility;
|
| · |
difficulty in enforcing agreements, collecting receivables and protecting assets;
|
| · |
the possibility of encountering unfavorable circumstances from host country laws or regulations;
|
| · |
fluctuations in revenues, operating margins and/or other financial measures due to currency exchange rate fluctuations and restrictions on currency and earnings repatriation;
|
| · |
unfavorable changes in regulated electricity tariffs;
|
| · |
trade protection measures, import or export restrictions, licensing requirements and local fire and security codes and standards;
|
23
| · |
increased costs and risks of developing, staffing and simultaneously managing a number of foreign operations as a result of language and cultural differences;
|
| · |
issues related to occupational safety, work hazard, and adherence to local labor laws and regulations;
|
| · |
adverse tax developments;
|
| · |
changes in the general political, social and/or economic conditions in the countries where we operate; and
|
| · |
the presence of corruption in certain countries.
|
If any of our businesses are impacted by any of the aforementioned factors, such an impact could have a material adverse effect on our business, financial condition, results of operations or liquidity.
We require qualified personnel to manage and operate our various businesses.
As a result of our decentralized structure, we require qualified and competent management to independently direct the day-to-day business activities of each of our businesses, execute their respective business plans, and service their respective customers, suppliers and other stakeholders, in each case across numerous geographic locations. Many of the products and services offered by our businesses are highly technical in nature and may require specialized training or physically demanding work. Therefore, we must be able to retain employees and professionals with the skills necessary to understand the continuously developing needs of our customers and to maximize the value of each of our businesses. This includes developing talent and leadership capabilities in the emerging markets in which certain of our businesses operate, where the depth of skilled employees may be limited. Changes in demographics, training requirements and/or the unavailability of qualified personnel could negatively impact the ability of each of our businesses to meet these demands. Unpredictable increases in the demand for our goods and/or services, or the geographical diversity of our businesses, may exacerbate the risk of not having a sufficient number of trained personnel. If any of our businesses fail to train and retain qualified personnel, or if they experience excessive turnover, we may experience declining sales, production/manufacturing delays or other inefficiencies, increased recruiting, training or relocation costs and other difficulties, any of which could have a material adverse effect on our business, financial condition, results of operations or liquidity.
Significant raw material shortages, supplier capacity constraints, production disruptions, supplier quality and sourcing issues or price increases could increase our operating costs and adversely impact the competitive positions of the products and/or services of our businesses.
The reliance of certain of our businesses on certain third-party suppliers, contract manufacturers and service providers, or commodity markets to secure raw materials (e.g., natural gas for OPC and bunker and containers for ZIM), parts, components and sub-systems used in their products or services exposes us to volatility in the prices and availability of these materials, parts, components, systems and services. Some of these suppliers or their sub-suppliers are limited- or sole-source suppliers.
For more information on the risks relating to supplier concentration in relation to OPC, see “
—Risks Related to OPC— Supplier concentration may expose OPC to significant financial credit or performance risk, particularly with respect to those agreements which may expire during the life of its power plants.
”
A disruption in deliveries from these and other third-party suppliers, contract manufacturers or service providers, capacity constraints, production disruptions, price increases, or decreased availability of raw materials or commodities, including as a result of catastrophic events, could have an adverse effect on the ability of our businesses to meet their commitments to customers or could increase their operating costs. Our businesses could encounter supply problems and may be unable to replace a supplier that is not able to meet their demand in either the short- or the long-term; these risks are exacerbated in the case of raw materials or component parts that are sourced from a single-source supplier. Furthermore, quality and sourcing issues experienced by third-party providers can also adversely affect the quality and effectiveness of our businesses’ products and/or services and result in liability and reputational harm that could have a material adverse effect on our business, financial condition, results of operations or liquidity.
Some of our businesses must keep pace with technological changes and develop new products and services to remain competitive.
The markets in which some of our businesses operate experience rapid and significant changes as a result of the introduction of both innovative technologies and services. To meet customer needs in these areas, these businesses must continuously design new, and update existing, products and services, as well as invest in, and develop new technologies. Introducing new products and technologies requires a significant commitment to research and development that, in return, requires the expenditure of considerable financial resources that may not always result in success.
24
Our sales and profitability may suffer if our businesses invest in technologies that do not operate, or may not be integrated, as expected or that are not accepted into the marketplace as anticipated, or if their services, products or systems are not introduced to the market in a timely manner, in particular, compared to its competitors, or become obsolete. Furthermore, in some of these markets, the need to develop and introduce new products rapidly in order to capture available opportunities may lead to quality problems. Our operating results depend on our ability, and the ability of these businesses, to anticipate and adapt to changes in markets and to reduce the costs of producing high-quality, new and existing products and services. If we, or any of these businesses, are unsuccessful in our efforts, such a failure could have a material adverse effect on our business, financial condition, results of operations or liquidity.
Our businesses may be adversely affected by work stoppages, union negotiations, labor disputes and other matters associated with our labor force.
As of December 31, 2017, OPC employed 85 employees, Qoros employed approximately 1,640 employees and ZIM employed approximately 3,600 employees. Our businesses could experience strikes, industrial unrest, or work stoppages. Any disruptions in the operations of any of our businesses as a result of labor stoppages or strikes could materially and adversely affect our or the relevant businesses’ reputation and could adversely affect operations. Additionally, a work stoppage at any one of the suppliers of any of our businesses could materially and adversely affect our operations if an alternative source of supply were not readily available.
We, and each of our businesses, face cyber-security risks.
Our business operations, and the operations of our various operating companies, rely upon secure information technology systems for data processing, storage and reporting. As a result, we, and our businesses, maintain information security policies and procedures for managing such information technology systems. However, such security measures may be ineffective and our information technology systems, or those of our businesses, may be subject to cyber-attacks, including malicious software, network, system, application and data breaches and such cyber-security breaches may result in operational disruptions or information misappropriation.
A number of companies around the world have been the subject of cybersecurity attacks in recent years, including in Israel where we have a large part of our businesses. Should Kenon or any of its operating businesses experience a cyber-attack, this could have a material adverse effect on our, or any of our operating companies’, business, financial condition or results of operation.
Risks Related to Legal, Regulatory and Compliance Matters
We, and each of our businesses, are subject to legal proceedings and legal compliance risks.
We are subject to a variety of legal proceedings and legal compliance risks in every part of the world in which our businesses operate. We, our businesses, and the industries in which we operate, are periodically reviewed or investigated by regulators and other governmental authorities, which could lead to enforcement actions, fines and penalties or the assertion of private litigation claims and damages. Changes in laws or regulations could require us, or any of our businesses, to change manners of operation or to utilize resources to maintain compliance with such regulations, which could increase costs or otherwise disrupt operations. Protectionist trade policies and changes in the political and regulatory environment in the markets in which we operate, such as foreign exchange import and export controls, tariffs and other trade barriers and price or exchange controls, could affect our businesses in several national markets, impact our profitability and make the repatriation of profits difficult, and may expose us or any of our businesses to penalties, sanctions and reputational damage. In addition, the uncertainty of the legal environment in some regions could limit our ability to enforce our rights.
The global and diverse nature of our operations means that legal and compliance risks will continue to exist and additional legal proceedings and other contingencies, the outcome of which cannot be predicted with certainty, will arise from time to time. No assurances can be made that we will be found to be operating in compliance with, or be able to detect violations of, any existing or future laws or regulations. In addition, as we hold minority interests in ZIM and Qoros, we do control them and therefore cannot ensure that they will comply with all applicable laws and regulations. A failure to comply with or properly anticipate applicable laws or regulations could have a material adverse effect on our business, financial condition, results of operations or liquidity.
25
We may be subject to further government regulation, which may adversely affect our strategy.
The U.S. Investment Company Act of 1940 regulates "investment companies", which includes entities that are, or that hold themselves out as being, primarily engaged in the business of investing, reinvesting and trading in securities or that are engaged, or propose to engage, in the business of investing, reinvesting, owning, holding or trading in securities and own, or propose to acquire, investment securities having a value exceeding 40% of the value of the issuer’s total assets (exclusive of U.S. government securities and cash items) on an unconsolidated basis. Accordingly, we do not believe that we are subject to regulation under the U.S. Investment Company Act of 1940. We are organized as a holding company that conducts its businesses primarily through majority owned and primarily controlled subsidiaries. Maintaining such status may impose limits on our operations and on the assets that we and our subsidiaries may acquire or dispose of. If, at any time, we meet the definition of investment company, we could, among other things, be required either (a) to substantially change the manner in which we conduct our operations to avoid being required to register as an investment company or (b) to register as an investment company under the U.S. Investment Company Act of 1940, either of which could have an adverse effect on us and the market price of our securities. The U.S. Investment Company Act of 1940 generally only allows U.S. entities to register. If we were required to register as an investment company but failed to do so, we could be prohibited from engaging in our business in the United States or offering and selling securities in the United States or to U.S. persons, unable to comply with our reporting obligations in the United States as a foreign private issuer, subject to the delisting of the Kenon shares from the NYSE and subject to criminal and civil actions that could be brought against us, any of which would have a material adverse effect on the liquidity and value of the Kenon shares and on our business, financial condition, results of operations or liquidity.
We could be adversely affected by violations of the U.S. Foreign Corrupt Practices Act and similar anti-bribery laws outside of the United States.
The U.S. Foreign Corrupt Practices Act, or the FCPA, and similar anti-bribery laws in other jurisdictions generally prohibit companies and their intermediaries from making improper payments to government officials or other persons for the purpose of obtaining or retaining business. Recent years have seen a substantial increase in anti-bribery law enforcement activity, with more frequent and aggressive investigations and enforcement proceedings by both the U.S. Department of Justice and the SEC, increased enforcement activity by non-U.S. regulators, and increases in criminal and civil proceedings brought against companies and individuals. Our policies mandate compliance with the FCPA and other applicable anti-bribery laws. We operate, through our businesses, in some parts of the world that are recognized as having governmental and commercial corruption. Additionally, because many of our customers and end users are involved in infrastructure construction and energy production, they are often subject to increased scrutiny by regulators. Our internal control policies and procedures may not protect us from reckless or criminal acts committed by our employees, the employees of any of our businesses, or third party intermediaries. In the event that we believe or have reason to believe that our employees or agents have or may have violated applicable anti-corruption laws, including the FCPA, we would investigate or have outside counsel investigate the relevant facts and circumstances, which can be expensive and require significant time and attention from senior management. Violations of these laws may result in criminal or civil sanctions, inability to do business with existing or future business partners (either as a result of express prohibitions or to avoid the appearance of impropriety), injunctions against future conduct, profit disgorgements, disqualifications from directly or indirectly engaging in certain types of businesses, the loss of business permits, reputational harm or other restrictions which could disrupt our business and have a material adverse effect on our business, financial condition, results of operations or liquidity. We face risks with respect to compliance with the FCPA and similar anti-bribery laws through our acquisition of new companies and the due diligence we perform in connection with an acquisition may not be sufficient to enable us fully to assess an acquired company’s historic compliance with applicable regulations. Furthermore, our post-acquisition integration efforts may not be adequate to ensure our system of internal controls and procedures are fully adopted and adhered to by acquired entities, resulting in increased risks of non-compliance with applicable anti-bribery laws.
26
We could be adversely affected by international sanctions and trade restrictions
We have geographically diverse businesses, which may expose our business and financial affairs to political and economic risks, including operations in areas subject to international restrictions and sanctions. Legislation and rules governing sanctions and trade restrictions are complex and constantly evolving. Moreover, changes in these laws and regulations can be unpredictable and happen swiftly. Part of our global operations necessitate the importation and exportation of goods and technology across international borders on a regular basis. From time to time, we, or our businesses, obtain or receive information alleging improper activity in connection with such imports or exports. Our policies mandate strict compliance with applicable sanctions laws and trade restrictions. Nonetheless, our policies and procedures may not always protect us from actions that would violate U.S. and/or foreign laws. Such improper actions could subject us to civil or criminal penalties, including material monetary fines, denial of import or export privileges, or other adverse actions. The occurrence of any of the aforementioned factors could have a material adverse effect on our business, financial condition, results of operations or liquidity.
Risks Related to OPC
OPC faces risks in connection with the expansion of its business.
OPC is contemplating the construction and development of power generation facilities. Existing regulation, such as antitrust laws, regulation by virtue of the Israeli Concentration Law, or the EA rules with respect to holdings of control in generation licenses, may restrict the expansion of OPC’s activity in Israel.
For example, in April 2017, OPC entered into agreements (including an option agreement) for the acquisition of 95% of the shares of Tzomet Energy Ltd., which is developing a natural gas-fired power station in Israel with capacity of approximately 396 MW, for total consideration of $23 million, subject to adjustments. In August 2017, the EA received a letter from the
from the Israel Concentration Committee
stating that it believed that, for reasons of broad economy concentration (i.e. taking into account businesses owned by related entities of Kenon's controlling shareholder), OPC should not be granted a contingent license for the construction of the planned facility. In March 2018, OPC completed the acquisition of 95% of the shares of Tzomet Energy, although Tzomet Energy still requires (among other requirements) a license from the EA to proceed with construction of the planned facility.
The total consideration for the acquisition is estimated at approximately $23 million, subject to certain adjustments, of which $3.65 million was paid in March 2018, an additional $3.65 million is expected to be paid in the second quarter of 2018, and the remaining consideration will be paid at financial closing of the Tzomet project.
According to the Israeli Concentration Law, when allocating certain rights, including a power generation license, and when determining the terms for this right, the regulator must take into account the promotion of competition in the relevant industry and the Israeli economy generally. If the right is on the list of rights that may have a material impact on competition, the regulator must consult with the Israel Antitrust Commissioner. Kenon, OPC, OPC-Rotem and OPC-Hadera are considered concentration entities under the Israel Corporation Group, which may affect OPC’s or its subsidiaries’ ability to receive a generation license if it involves the construction and operation of power plants exceeding 175 MW. The list of concentration entities also includes Mr. Idan Ofer, who is the beneficiary of entities that indirectly hold a majority of the shares in Kenon, and includes a list of other entities which may be affiliated with Mr. Idan Ofer, including ZIM, in which Kenon holds a 32% interest.
In addition, OPC requires financing in connection with the development of the Hadera Power station. In the case of the Hadera project, OPC's financing for the project is subject to various conditions and restrictions, including OPC-Hadera's maintenance of Hadera Paper as a customer. If OPC is unable to obtain or utilize financing for the Hadera project, this may hinder OPC's ability to complete the Hadera Power station.
OPC’s facilities may be affected by disruptions, including technical failures and natural disasters.
OPC's ongoing activities may be affected by technical disruptions and faults to critical equipment. For instance, various natural disasters, such as earthquakes or fires, may harm OPC’s facilities and thereby affecting its operations and supply of electricity. Due to the nature of OPC's activities, which, for example, include the use and storage of flammable materials and working with high temperatures and pressures, OPC's facilities are exposed to the risk of fire hazards. Should natural or disasters damage OPC’s facilities, restoration may involve the investment of significant resources and time, which would likely lead to full or partial shutdown of the generation facilities that were damaged. Losses that are not fully covered by OPC’s insurance policies may have an adverse effect on OPC.
27
The political and security situation in Israel may affect OPC.
A deterioration of the political and security situation in Israel may adversely affect OPC’ s activities and harm its assets. Security and political events such as a war or acts of terrorism may harm the facilities serving OPC (including the power station facilities owned by the Company), the construction of the Hadera Power station and other future projects, computer systems, facilities for transmission of natural gas to the power stations and the electricity transmission grid. In addition, such acts may have an adverse effect on OPC's material suppliers, thereby limiting OPC's ability to supply electricity to its customers reliably. Likewise, a deterioration in the political and security situation in Israel may have a negative effect on OPC's ability to construct new projects, to raise capital for new projects and to initiate new projects in areas exposed to a security risk. Negative developments in the political and security situation in Israel and various security events may cause additional restrictions on OPC, including boycotts by various parties. In addition, in such cases, parties with whom OPC has contracted may claim to terminate their obligations pursuant to the agreements with the OPC due to the occurrence of force majeure events. In addition, some of OPC's employees may be called for reserve military duty and their absence may have an adverse effect on OPC's operations. Although the OPC-Rotem station is classified by the State of Israel as an "essential enterprise" and therefore its key employees are exempt from reserve duty during an emergency, these workers may be called up for reserve duty if the station were to lose its status as an "essential enterprise."
Changes in the EA’s electricity rates may reduce OPC’s profitability
Changes in the electricity rates published by the EA, including the rate of the electricity generation component, may have a substantial adverse effect on OPC’s profits. For example, if the
production component
tariffs published by the EA change as a result of, among other things, fluctuations in currency exchange rates or IEC fuel costs, OPC’s revenues from sales to private customers and cost of sales will be affected. This is the case as the price of electricity for OPC’s customers is directly affected by the electricity generation tariff, and this is the basis of linking the price of natural gas pursuant to gas purchase agreements.
Furthermore the gas price formula determined in the agreement with the Tamar Group is subject to a minimum price.
Therefore, when the price of gas is equal to or lower than the
minimum price
, reductions in the generation tariff will not lead to a reduction in the cost of natural gas consumed by OPC-Rotem, but rather to a reduction in profit margins.
For example, in connection with reductions in the EA generation tariff in 2015,
OPC-Rotem and OPC-Hadera began to pay the ultimate floor price in November 2015 and April 2016, respectively. Therefore, declines in the EA generation component tariff may not have a corresponding decline in OPC-Rotem’s natural gas expenses, due to the floor price mechanism. and may lead to a decline in OPC-Rotem’s margins, which may have a material adverse effect on OPC’s business, results of operations and financial condition.
For further information on the EA tariffs, see “
Item 4.B Business Overview—Our Businesses—OPC—Industry Overview—
Overview of Israeli Electricity Generation Industry.
” For further information on the effect of EA tariffs on OPC’s revenues and margins, see “
Item 5. Operating and Financial Review and Prospects—Material Factors Affecting Results of Operations—OPC— Sales—EA Tariffs.
”
Changes in the Consumer Price Index in Israel or the U.S. Dollar to NIS exchange rate could adversely affect OPC.
If Israel experiences inflation it may affect OPC. For instance, a significant portion of the liabilities of OPC and its subsidiaries is linked to the Consumer Price Index, or CPI, including a substantial part of the OPC-Rotem and OPC-Hadera loans. Therefore, adverse changes to CPI could impact OPC’s financing expenses and results of operations. In addition, to the extent that OPC is above the floor price in its gas supply agreement, the price it pays for gas is linked in part to the U.S. Dollar to NIS exchange rate, and accordingly variations in such rate can impact OPC's results.
OPC could face barriers to exit in connection with the disposals or transfers of its businesses or assets.
OPC may face exit barriers, including high exit costs or objections from various parties (whose approval OPC requires), in connection with dispositions of its operating companies or their assets. For example, pursuant to Israel’s Electricity Sector Law 5756-1996, or Electricity Sector Law, the transfer of control over an entity that holds a generation license in Israel must be approved by the Electricity Authority, or the EA. Additionally, there are restrictions on a transfer of control of OPC, OPC-Rotem and OPC-Hadera, pursuant to, among others, OPC-Rotem’s PPA with the Israel Electric Corporation, or IEC, the trust deed relating to OPC’s bonds, and OPC-Rotem’s and OPC-Hadera’s credit agreements. Such restrictions may prohibit or make it difficult for OPC to dispose of its interests in its businesses.
28
OPC, OPC-Rotem and OPC-Hadera are also defined as “significant real corporations.” As a result, OPC, OPC-Rotem and OPC-Hadera are subject to various restrictions, which mainly include restrictions in significant financial entities holding an interest (above a certain percentage) in such companies and restrictions on OPC, OPC-Rotem and OPC-Hadera’s holdings (above a certain percentage) of financial entities. Such restrictions may also limit Kenon's ability to transfer its interests in OPC.
OPC requires qualified personnel to manage and operate its various businesses and projects.
OPC requires professional and skilled personnel in order to manage its current activities and the performance of its projects, to service and respond to customers and suppliers. Therefore, OPC must be able to retain employees and professionals with the necessary skills. Furthermore, OPC employs foreign employees. Any unavailability of qualified personnel could negatively impact OPC’s activity and results of operations.
In addition, most of OPC-Rotem’s operations employees are employed through a collective agreement. In March 2018, a collective agreement was signed with the Energy Center, similar to the agreement that is currently in place at the OPC-Rotem plant. The agreement will apply to the Energy Center employees and to the employees that will be hired at the Hadera Power station. The implementation of the collective agreement may reduce managerial flexibility and impose additional costs on OPC. For further information on OPC
-
Rotem’s collective agreement, see “
Item 4.B Business Overview—Our Businesses—OPC—Employees.
”
The interruption or failure of OPC’s information technology, communication and processing systems or external attacks and invasions of these systems could have an adverse effect on OPC.
OPC uses information technology systems, telecommunications and data processing systems to operate its businesses. Damage to such systems may result in service delays or interruptions to OPC’s ability to provide electricity to its customers.
Furthermore, OPC, as an Israeli company, is at risk of cyber-attacks, as a number of Israeli corporations have been the subject of recent cybersecurity attacks. If a cyber-attack occurs, it could have a significant effect on OPC’s operations.
OPC is exposed to litigation and/or administrative proceedings.
OPC is involved in various litigation proceedings, and may be subject to future litigation proceedings, which could have adverse consequences on its business.
For example, in connection with the indexation of their natural gas price formula for OPC-Rotem’s gas supply agreement with the Tamar Group, OPC-Rotem and the Tamar Group disagreed as to which of Israel’s Public Utilities Authority (Electricity) July 2013 tariffs applied to OPC-Rotem’s supply agreement and have a similar disagreement with respect to the tariffs published in January 2015. In February 2017, OPC-Rotem received a letter from the Tamar Group with respect to the dispute. The Tamar Group requested payment by OPC-Rotem of approximately $25 million (including accrued interest) in connection with the dispute, or the deposit of such amount in escrow pursuant to the gas supply agreement. In May 2017, OPC-Rotem deposited $21.75 million in a trust account in respect of the dispute. In June 2017, the Tamar Group submitted a motion to initiate arbitration proceedings at the London Court of International Arbitration, demanding a payment of $33 million plus accrued interest. In its response in July 2017, OPC-Rotem disputed the Tamar Group’s claims. However, there is no certainty that OPC-Rotem’s claims will be accepted in whole or in part.
Litigation and/or regulatory proceedings are inherently unpredictable, and excessive verdicts may occur. Adverse outcomes in lawsuits and investigations could result in significant monetary damages, including indemnification payments, or injunctive relief that could adversely affect OPC’s ability to conduct its business and may have a material adverse effect on OPC’s financial condition and results of operations. In addition, such investigations, claims and lawsuits could involve significant expense and diversion of OPC’s management’s attention and resources from other matters, each of which could also have a material adverse effect on its business, financial condition, results of operations or liquidity.
29
OPC’s insurance policies may not fully cover damage, and OPC may not be able to obtain insurance against certain risks.
OPC and its subsidiaries maintain insurance policies intended to reduce various risks, as is customary in the industry. However, the existing insurance policies maintained by OPC and its subsidiaries may not cover certain types of damages or may not cover the entire scope of damage caused. In addition, OPC may not be able to obtain insurance on comparable terms in the future. OPC and its subsidiaries may be adversely affected if they incur losses that are not fully covered by their insurance policies. For further information on OPC’s insurance policies, see “
Item 4.B Business Overview—Our Businesses—OPC—Insurance.
”
OPC’s operations are significantly influenced by regulations
OPC is subject to significant government regulation. It is therefore exposed to changes in these regulations as well as changes to regulations applicable to sectors that are associated with the company’s activities. Regulatory changes may have an adverse effect on OPC’s activity and results or on its terms of engagement with third parties, such as its customers and the Tamar Group. In the coming years, OPC expects frequent regulatory changes in the industry, including in relation to the private electricity market in Israel, which is a new and developing market. Regulatory changes may impact the power stations owned by OPC or the power stations that it intends to develop, including the economic feasibility of establishing new power stations.
Furthermore, OPC is subject to environmental laws and regulations, including those that seek to regulate noise pollution and emission of contaminants to treat hazardous materials. If stricter regulatory requirements are imposed on private electricity producers or if OPC does not comply with such requirements, laws and regulations, this could have an adverse effect on OPC’s results and activity. Furthermore, stricter regulatory requirements could require material expenditures or investments by OPC.
Additionally, OPC requires certain licenses to produce and sell electricity in Israel, and may need further licenses in the future. For example, in November 2017, for propriety purposes, OPC-Rotem submitted an application to the EA to obtain a supply license which would permit OPC-Rotem to trade electricity with other electricity suppliers in Israel.
In February 2018, the EA responded that OPC-Rotem is required to receive a supply license to continue its sale of electricity to consumers, that the license will not change the terms of the agreement between OPC-Rotem and the IEC and will not derogate from OPC-Rotem’s rights according to it. If the EA refuses to grant OPC-Rotem a supply license as requested, this may harm OPC-Rotem's ability to trade surplus electricity with other power stations, including related companies.
Construction or development projects may not be completed or, if completed, may not be completed on time or perform as expected.
OPC faces risks in connection with its development projects, including future projects and the development of the Hadera Power station, in particular because it owns this project at a development stage. Developing a power station project entails certain risks, such as:
| · |
risks associated with the construction contractor,
|
| · |
supply of key equipment,
|
| · |
performance of works at the required specifications and within the required time,
|
| · |
receipt of services required from the IEC to establish the station and connect it to the grid (which may be affected by sanctions and IEC strikes),
|
| · |
applicable regulation, and
|
| · |
obtaining the required approvals and permits for the development and operation of the station, including obtaining permits required in connection with the environment, including emission permits, and compliance with their terms.
|
30
OPC-Hadera is party to on the Hadera Power station maintenance agreement with SerIDOM Servicios Integrados IDOM S.A.U., or IDOM. Breaches by IDOM or General Electric International, Inc. and its affiliates, or GE, including failure to meet certain fixed schedules and supply the primary equipment on time, or in the required quality, are likely to delay or hinder the establishment of the Hadera Power station, and may also hamper the performance of the Hadera Power station once it is built, and as a result cause material harm to OPC. IDOM has agreed to compensate OPC-Hadera in case of
a delay or non-compliance with the terms determined in the agreement in connection with the operation of the station. However, the agreed compensation for the underperformance of the Hadera Power station is limited. Additionally, the establishment of part of the infrastructure to connect the Hadera Power station and the Hadera Paper mill is under Hadera Paper’s responsibility. If Hadera Paper, which we do not control, does not meet its obligations to establish the infrastructure by the agreed date, this may lead to delays and obstructions in the development and operation of the Hadera Power station, thus adversely affecting OPC’s business and results of operation.
In addition, the gas turbines that have been purchased for the Hadera Power station are an upgrade of an existing model manufactured by GE. To the best of OPC’s knowledge, such turbines have been commercially operated only recently.
OPC may not be able to enter into, or renew existing, long-term contracts for the sale of energy and capacity, contracts which reduce volatility in its results of operations.
OPC-Rotem has a PPA with IEC, the government-owned electricity generation, transmission and distribution company in Israel, or the IEC PPA. The term of the IEC PPA lasts until 20 years after the power station’s COD. According to the agreement, OPC-Rotem is entitled to operate in one of the following two ways (or a combination of both with certain restrictions set in the agreement): (1) provide the entire net available capacity of its power station to IEC or (2) carve out energy and capacity for direct sales to private consumers, and OPC-Rotem has accordingly allocated the entire capacity of the plant to private consumers since COD. Under the IEC PPA, OPC-Rotem can also elect to revert back to supplying to IEC instead of private customers, subject to twelve months’ advance notice. OPC may be unable to enter into new long-term PPAs, renew the existing PPAs at the time they expire, or enter into PPA agreements with terms other than those that have ended due to various reasons, such as market conditions.
OPC is dependent on certain significant customers.
OPC has a small number of customers that purchase a significant portion of OPC’s output under PPAs that account for a substantial percentage of the anticipated revenue of its generation companies. OPC’s revenues from the generation of electricity are highly sensitive to the consumption by significant customers. Therefore, should there be no demand for electricity from OPC’s significant customers or should such customers not fulfill their obligations, including by failing to make payments to OPC, OPC’s revenues could be significantly affected.
Furthermore, OPC-Hadera is dependent on Hadera Paper’s consumption of steam. If such consumption ceases, it could have a material effect on OPC’s operations and OPC-Hadera's classification as a cogeneration electricity producer (which entails certain benefits). For further information on the regulations relating to cogeneration electricity producers, see "
Item 4.B Business Overview—OPC—Regulatory, Environmental and Compliance Matters—Regulatory Framework for Cogeneration IPPs.
"
OPC faces competition from other IPPs.
In recent years, the Israeli government’s policy has been to open the electricity market to competition and to encourage the entry of private electricity producers. This policy has increased the number of private electricity producers, increasing the level of competition in the private generation market, which may have an adverse effect on OPC’s business.
OPC relies on transmission facilities for the transmission of power and gas.
OPC’s businesses depend upon transmission facilities owned and operated by the IEC to deliver the wholesale power it sells from its power generation plants. If transmission is disrupted, or if the transmission capacity infrastructure is inadequate, OPC’s ability to sell and deliver wholesale power may be adversely impacted. OPC’s businesses may also be affected by IEC strikes and sanctions.
31
Furthermore, there is currently a single company supplying natural gas to OPC and one company providing it with transmission services Failure to comply with the requirements of these companies or limitations in the supply or transmission of gas by such companies could affect OPC’s ability to generate electricity through natural gas, which could have a material adverse effect on OPC’s business and results of operations. Finally, OPC’s plants require water for their operation. A continued disruption in the water supply could disrupt the operation of such plants.
Supplier concentration may expose OPC to significant financial credit or performance risk, particularly with respect to those agreements which may expire during the life of its power plants.
A continued disruption in the supply of gas, which OPC purchases from a single supplier, would require transition to the use of alternative fuel (diesel). In June 2017, the relevant regulation was amended (Covenant 125), permitting dual-fuel producers that use diesel (or liquid gas), which is more expensive than natural gas, to be compensated for the price difference. OPC believes that Covenant 125 applies to OPC-Rotem’s operations. If Covenant 125 is not applicable to OPC-Rotem in the future, gas shortages could have a material adverse effect on OPC’s profitability.
Furthermore, if there is a continued disruption in the supply of gas to the Energy Center, it may be required to purchase diesel. As Covenant 125 does not apply to the Energy Center, the Energy Center would not be compensated for the price difference between natural gas and diesel oil and, therefore, its profitability could be adversely affected. Moreover, once the Hadera Power station is operational, it could also be potentially adversely affected in a similar manner if faced with a shortage in the supply of gas. OPC is unable to currently estimate the scope of the damage to OPC’s profitability as a result thereof.
Finally, OPC-Rotem has a single maintenance agreement with Mitsubishi Heavy Industries Ltd., or Mitsubishi, for the maintenance of its power station. If Mitsubishi is unable to perform its obligations under its contract with OPC-Rotem, this could result in the technical malfunctioning of the power station. This could lead to delays in the supply of electricity, loss of revenues for OPC and a reduction in its profits. It could also have similar adverse effects on other projects once they are completed.
Risks Related to the Sale of the Inkia Business
We have indemnification obligations under the share purchase agreement for the sale of the Inkia Business
In December 2017, our wholly-owned subsidiary Inkia sold its Latin America and Caribbean businesses, or the Inkia Business, to an entity controlled by I Squared Capital, an infrastructure private equity firm. For further information on the sale and share purchase agreement see “
Item 4.B Business Overview—Discontinued Operations—Inkia Business — Sale of the Inkia Business— Share Purchase Agreement.
”
Under the share purchase agreement, our subsidiary Inkia has agreed to indemnify the buyer and its successors, permitted assigns, and affiliates against certain losses arising from a breach of Inkia’s representations and warranties and certain tax matters, subject to certain time and monetary limits depending on the particular indemnity obligation. These indemnification obligations are supported by (a) a three-year pledge of shares of OPC which represent 25% of OPC’s outstanding shares, (b) a deferral of $175 million of the purchase price in the form of a four-year $175 million Deferred Payment Agreement, accruing interest at 8% per year and payable in-kind, and (c) a three-year corporate guarantee from Kenon for all of the Inkia’s indemnification obligations. To the extent that Inkia is required to make indemnification payments under the share purchase agreement (and such payment obligations are agreed between buyer and seller or determined by a court in a non-appealable judgment), the buyer is entitled to seek recourse to the foregoing support arrangements in the following order: first, by exhausting rights under the OPC share pledge, second, by set off against amounts owing by the buyer under the Deferred Payment Agreement and third against the Kenon guarantee.
32
If Inkia is required to make indemnification payments under the share purchase agreement this could require us to sell OPC shares or result in enforcement of the OPC share pledge, set off against amounts owing to us under the Deferred Payment Agreement and enforcement of the Kenon guarantee, which could impact our liquidity and financial position. Furthermore, any enforcement of the OPC share pledge could result in the buyer acquiring a significant interest in OPC or could result in a sale of a significant amount of OPC shares which could adversely affect the market price of OPC’s shares.
If Kenon is required to make payments under the guarantee it may need to use funds from its businesses, or sell assets, including OPC shares. Furthermore, any sales of assets may not be at attractive prices, particularly if such sales must be made quickly to meet the sellers' obligations.
We are subject to risk in relations to the $175 million Deferred Payment Agreement
As part of the consideration for the sale of the Inkia Business, $175 million of the purchase price payable to us was deferred in the form of a four-year $175 million Deferred Payment Agreement, accruing interest at 8% per year and payable in-kind. The obligor under the Deferred Payment Agreement is Nautilus Energy TopCo LLC, which is the parent company of the buyer of the Inkia Business. The obligations of Nautilus Energy under this agreement are secured by a pledge over its shares by its direct parent company and a pledge over the shares of the direct subsidiary of Nautilus Energy. The obligations of Nautilus Energy are structurally subordinated to all of the debt and other obligations of the buyer of the Inkia Business and the Inkia Business itself. Accordingly, to the extent that the buyer of the Inkia Business or the Inkia Business itself are required to make payments to their creditors, there could be insufficient funds remaining for Nautilus Energy to meet its obligations under the Deferred Payment Agreement. In addition, debt or other agreements may limit amounts which can be distributed or otherwise transferred to Nautilus Energy to make payments on the Deferred Payment Agreement. Finally Nautilus Energy will depend on cash held or generated by the Inkia Business to be made available to it to meet its obligations under this agreement. ISQ Global Infrastructure Fund II, L.P., an indirect parent of Nautilus Energy, has provided a guarantee of Nautilus Energy's obligations under the deferred payment agreement. However, this guarantee falls away upon a cross-acceleration of Nautilus Energy's obligations under the deferred payment agreement. For further information see “
Item 4.B Business Overview—Discontinued Operations— Inkia Business—Nautilus Energy TopCo LLC Deferred Payment Agreement.
”
We are subject to credit risk relating to this loan, as Nautilus Energy may be unable to make principal and interest payments as they become due and there is no guarantee that any collateral securing such loan will be sufficient to protect us in the event of non-payment by Nautilus Energy.
In addition, we face risks under this loan relating to our indemnification obligations under the share purchase agreement for the sale of the Inkia Business, as to the extent that there are indemnification obligations owing to the buyer (and such payment obligations are agreed between buyer and seller or determined by a court in a non-appealable judgment) which are unpaid and after the buyer has exhausted its rights under the OPC share pledge, the buyer can offset amounts owing under this loan against unpaid indemnification obligations.
The transition services to be provided by the buyer may not be sufficient and be difficult for us to replace upon expiration of the agreement
In connection with the sale of the Inkia Business, we entered into a transition services agreement with the buyer. This agreement outlines the provision of transition services by the Inkia Business throughout a transition period. The transition services covered by this agreement include the preparation of financial statements, assistance with reporting requirements and consulting services with respect to the construction of OPC-Rotem. Any failure by the Inkia Business to perform such services during the transition period, or any failure by us to successfully transition such services away from the Inkia Business upon expiration of the transition services agreement and integrate the new services into our business, could have an adverse effect on our business.
33
Risks Related to Our Interest in Qoros
Qoros depends on funding to further its development and, until it achieves significant sales levels, to meet its operating expenses, financing expenses, and capital expenditures.
Qoros commenced commercial operations at the end of 2013. Qoros has incurred losses since inception and is continuing to experience losses and negative operating cash flow and expects that this will continue until it achieves significantly higher levels of sales. Qoros’ operating expenses, debt service requirements, capital expenditures and other liquidity requirements are significant. Until Qoros experiences a significant increase in sales, it will continue to require additional financing, including the renewal or refinancing of its working capital facilities, to meet these expenses and requirements, and there is no assurance that Qoros will experience an increase in sales in the near-term, if at all, or obtain additional financing.
Qoros has significant obligations. Qoros has historically relied upon capital contributions, loans, guarantees and pledges from its shareholders, and third party loans supported by its shareholders, to fund its development and operations. Qoros has long-term, short-term and working capital credit facilities, but amounts available under such facilities are limited. Qoros actively manages its trade payables, accrued expenses and other operating expenses in connection with the management of its liquidity requirements and resources.
In January 2018, Kenon announced the New Qoros Investor completed a transaction to purchase 51% of Qoros from Kenon and Chery for RMB3.315 billion (approximately $526 million), which is part of an investment structure to invest a total of approximately RMB6.63 billion (approximately $1,052 million) by the New Qoros Investor of which RMB6.5 billion will ultimately be invested in Qoros’ equity. As a result, Kenon and Chery now have 24% and 25% stakes in Qoros, respectively. This investment has improved Qoros' liquidity, but Qoros may need to continue to secure additional financing to meet its operating expenses, including accounts payable, and debt service requirements until it increases its sales levels.
Qoros’ success is dependent upon an increase in sales volumes.
Qoros commenced commercial sales in 2013 and has not yet achieved significant sales levels. Qoros's sales decreased to 15,000 cars in 2017 from 24,000 cars in 2016.
Qoros sold approximately 11,400 cars in the first quarter of 2018, a more than 200% increase as compared to approximately 3,700 cars sold in the first quarter of 2017, with a substantial number of such sales in Q1 2018 reflecting purchase orders introduced by the New Qoros Investor.
Qoros’ success will depend upon Qoros increasing its sales volumes, which will depend on, among others:
| · |
the continued development of the Qoros brand;
|
| · |
successful development and launch of new vehicle models;
|
| · |
expansion and enhanced sales capabilities of its dealer network;
|
| · |
build-up of its aftersales and services infrastructure;
|
| · |
managing its procurement, manufacturing and supply processes;
|
| · |
the volume of vehicles acquired by the affiliate to the New Qoros Investor;
|
| · |
establishing effective, and continuing to improve, customer service processes; and
|
| · |
securing additional financing to support its operating and capital expenses and further its growth and development.
|
Qoros’ ability to increase its sales volumes and generate profits will require the execution of effective planning and management processes, and such execution may be influenced by Qoros’ ability to sell its vehicle models within Qoros’ targeted price range, at prices that generate profits for Qoros, and at targeted volumes, as well as factors out of Qoros’ control, such as state of the Chinese economy.
34
Qoros will need to significantly increase its sales to meet its operating expenses and principal payments under its debt facilities. If Qoros is not able to increase its sales, this could have a significant impact on Qoros’ liquidity and future success, as well as on the value of Kenon’s investment in Qoros, which may result in Kenon being required to make payments under its guarantees of Qoros’ debt if Qoros is unable to meet its debt obligations.
Qoros is significantly leveraged.
As of December 31, 2017, Qoros had total loans and borrowings (excluding shareholder loans) of RMB4.8 billion. Qoros may require additional financing for its continued development.
Highly leveraged businesses are inherently more sensitive to declines in revenues, increases in expenses and interest rates, and adverse market conditions. This is particularly true for Qoros, as Qoros has yet to generate positive cash flows from its operations. Qoros uses a portion of its liquidity to make debt service payments, thereby reducing its ability to use its cash flows to fund its operations, capital expenditures, or future business opportunities. Qoros
is
required to make principal payments on its RMB3 billion, RMB1.2 billion and RMB700 million facilities in 2018.
In addition, Qoros’ RMB3 billion syndicated credit facility, RMB1.2 billion syndicated credit facility, and RMB700 million syndicated credit facility contain affirmative and negative covenants. Those facilities, as well as its other short-term credit facilities, also contain events of default and mandatory prepayments for breaches, including certain changes of control, and for material mergers and divestments, among other provisions. A significant percentage of Qoros’ assets secures its RMB3 billion syndicated credit facility and, as a result, the amount of collateral that Qoros has available for future secured debt or credit support and its flexibility in dealing with its secured assets is therefore relatively limited.
Currently, Qoros’ debt-to-asset ratio is higher, and its current ratio is lower, than the allowable ratios set forth in the terms of Qoros’ RMB3 billion syndicated credit facility. In 2016, the lenders under Qoros’ syndicated credit facility waived Qoros’ compliance with the financial covenants under this facility through the first half of 2020. Should Qoros’ debt-to-asset ratio continue to exceed, or its current ratio continue to be less than, the permitted ratios in any period after the waiver period, and Qoros’ syndicated lenders do not waive such non-compliance or revise such covenants, Qoros’ lenders could accelerate the repayment of borrowings due under Qoros’ RMB3 billion syndicated credit facility. If Qoros does not maintain a good relationship with its lenders this could impact requests for lender consents, including the consents being sought by New Qoros Investor, Chery and Kenon as pledgor
s
of Qoros shares under the RMB1.2 billion facility in connection with the investment by the New Qoros Investor.
If Qoros is unable meet its debt service obligations or otherwise comply with other covenants in its credit facilities, this would lead to an event of default. Each of Qoros’ significant debt facilities above contains a “cross-default” provision which provides for an event of default if any other debt of Qoros in excess of RMB50 million becomes payable prior to maturity, so a default under other debt facilities would result in a default under the facilities referenced above and a default that leads to acceleration under either facility above will result in an event of default under the other facility.
In the event that any of Qoros’ lenders accelerate the payment of Qoros’ borrowings, Qoros would not have sufficient liquidity to repay its debt under the syndicated credit facility, or to maintain payments on its remaining credit facilities. Additionally, as Qoros is significantly leveraged and certain of its assets, including its manufacturing facility and significant portion of its intellectual property, secures its syndicated credit facility and other indebtedness, if Qoros were unable to comply with the terms of its debt agreements, this could result in the foreclosure upon and loss of certain of Qoros’ assets.
Kenon has outstanding “back-to-back” guarantee obligations to Chery in respect of guarantees that Chery has given in respect of Qoros’ bank debt and has pledged a substantial portion of its interests in Qoros to secure Qoros’ bank debt, as well as Chery’s guarantees of Qoros’ debt. Accordingly, if Qoros’ debt facilities become payable due to a default under these facilities or otherwise, Kenon may be required to make payments under its guarantees and could lose the shares in Qoros it has pledged.
In addition, Kenon may be required to increase the amount of Qoros shares pledged (or Kenon may provide other credit support).
35
Our interest in Qoros is only 24%.
In January 2018, Kenon announced the New Qoros Investor completed a transaction to purchase 51% of Qoros from Kenon and Chery for RMB3.315 billion (approximately $526 million), which is part of an investment structure to invest a total of approximately RMB6.63 billion (approximately $1,052 million) by the New Qoros Investor of which RMB6.5 billion will ultimately be invested in Qoros’ equity. As a result, Kenon and Chery now have 24% and 25% stakes in Qoros, respectively.
Under the investment agreement, the New Qoros Investor also has the right to increase its stake in Qoros to up to 67%, subject to conditions. For further information on this option, see “
Item 4.B Business Overview—Our Businesses—Qoros —Qoros’ Investment Agreement—Kenon’s Put Option; the New Qoros Investor's Right to make Further Investments in Qoros
.” If this right is exercised, Kenon’s indirect interest in Qoros will be further diluted, resulting in less control over the Qoros business.
Prior to the New Qoros Investor’s investment, Kenon had a 50% interest in Qoros, and the right to appoint three of the six directors on the Qoros board, among various other management rights. As a result of this investment, Kenon's interest in Qoros has been diluted, and it is now entitled to only appoint two of the nine Qoros directors. Qoros' other joint venture partners may have goals, strategies, priorities, or resources that conflict with our goals, strategies, priorities or resources, which may adversely impact our ability to effectively own Qoros, undermine the commitment to Qoros’ long-term growth, or adversely impact Qoros’ business.
The Joint Venture Agreement contains provisions relating to the transfer and pledge of Qoros’ shares, the appointment of executive officers and directors, and the approval of certain matters which may prevent us from causing Qoros to take actions that we deem desirable. For further information on the terms of our Joint Venture Agreement with Chery, see “
Item 4.B Business Overview—Our Businesses—Qoros—Qoros’ Joint Venture Agreement.
”
Qoros has entered into certain arrangements and agreements with its shareholders.
Qoros sources its engines and certain spare parts from Chery in the ordinary course of Qoros’ business, and has entered into various commercial agreements with respect to the provision of such supplies from Chery. Qoros has amounts payable to Chery in the amount of RMB555 million as of December 31, 2017.
Qoros has also entered into a platform sharing agreement with Chery, pursuant to which Qoros provided Chery with the right to use Qoros’ platform in exchange for a fee. Qoros may enter into additional commercial arrangements and agreements with Chery, or parties related to it, in the future.
In addition, Qoros also sells vehicles to entities introduced by the New Qoros Investor
.
Accordingly, Qoros enters into transactions with its shareholders and their affiliates and Kenon’s ability to control the terms of such transactions may be limited. Such transactions could create potential conflicts of interest, which could impact the terms of such transactions.
Qoros actively manages its trade payables, accrued expenses and other operating expenses in connection with the management of its liquidity requirements and resources, and Qoros has accounts payable to Chery. Should Qoros be unable to make payments to Chery for its supply of engines, spare parts and other supplies from Chery, this may have a material adverse effect on Qoros’ relationship with Chery.
36
Qoros’ vehicle models and brand are still evolving, and Qoros is still trying to achieve broad base customer acceptance.
Qoros' success depends on its ability to target the appropriate market segment at the optimal price level. Qoros’ brand and business are relatively new, and Qoros has not achieved significant sales levels. Qoros’ future business and profitability outlook depends, in large part, upon Qoros’ ability to sell vehicle models that will be accepted by the targeted consumers, in its targeted price range.
Qoros depends upon a network of independent dealers to sell its automobiles.
As is customary in China, Qoros distributes and services its cars through a network of independent automobile dealers that are engaged on a non-exclusive basis. Dealers maintain the primary sales and service interface with the ultimate consumer of Qoros’ products and, as a result, the quality of Qoros’ dealerships and its relationship with its distributors are critical to Qoros’ success. Qoros also expects its dealers to generate a significant percentage of the revenues that Qoros expects to receive from the sale of spare parts and aftersales products. Consequently, Qoros’ success is dependent, in large part, upon a network of dealers, whose salespersons Qoros does not directly employ and therefore cannot control. As a result, Qoros’ dealer network may not achieve the required standards of quality of service producers within Qoros’ expected timeframe, if at all.
Qoros is still in the process of developing, establishing and expanding its dealer network, which will require Qoros’ dealers to construct their dealerships using their own capital resources, with sales rebates from Qoros (i.e., dealers are entitled to sales rebates from Qoros if they achieve certain purchase targets or meet certain other criteria). As part of its strategy to increase its sales, Qoros intends to create incentives for its high-performing dealers to open additional points of sales. In addition, Qoros directly owns two of its dealers, and may contemplate further direct ownership of its dealers. Qoros’ development of its dealer network will likely be affected by conditions in the Chinese passenger vehicle market and the Chinese economy, the financial resources available to existing and potential dealers, the decisions dealers make as a result of the current and future sales prospects of Qoros’ vehicle models, and the availability and cost of the capital necessary to acquire and hold inventories of Qoros’ vehicles for resale. Qoros’ ability to secure new dealers depends, in part, upon the sales performance of Qoros’ existing dealers. Therefore, Qoros may have difficulty in expanding its dealer network if existing dealers are not performing well in terms of sales, and if Qoros is unable to expand its dealer network, this could make it difficult for Qoros to significantly increase sales levels. Continued delays in, or other negative developments with respect to, the expansion of Qoros’ dealer network could have a material adverse effect on Qoros’ business, financial condition, results of operations or liquidity.
Qoros' cost-cutting measures in recent years may impact sales.
In recent years, Qoros has taken steps to reduce its costs and address its low sales and its liquidity situation, including workplace optimization and reduced promotional spending. Such cost-cutting measures may impact Qoros' sales. For instance, Qoros has reduced spending on promotions and other advertising, which could make it difficult for Qoros to maintain or significantly increase sales, as brand awareness is critical to increasing sales in the highly competitive Chinese car industry.
Furthermore, Qoros recently reduced spending on design and research and development costs for new models, as well as updating and adapting its vehicle platform and manufacturing facility. This reduced research and development spending has affected Qoros' ability to introduce newer vehicle models. A slower pace in introducing new models impacts sales and may make it difficult to attract customers.
Qoros’ business is subject to intense competition.
China has been one of the world’s fastest growing economies in terms of GDP in recent years, and has been the fastest growing among major passenger vehicle markets in the world. The passenger vehicle market in China is highly competitive. Many of the largest global manufacturers, through joint venture relationships with Chinese manufacturers, and numerous established domestic manufacturers compete within this market. Accordingly, Qoros competes with the established automobile manufacturers. Most of Qoros’ current and potential competitors have longer operating histories, broader customer relationships, greater name recognition, established customer bases, and greater financial, technical, manufacturing, marketing and other resources. As a result, many of these competitors may be able to devote greater resources to the design, development, manufacturing, distribution, promotion, pricing sale and support of their products, which could impair Qoros’ ability to operate within this market or adversely impact Qoros’ sales volumes or margins.
37
As the size of the Chinese passenger vehicle market continues to increase, Qoros anticipates that additional competitors, both international and domestic, will seek to enter the Chinese market and that existing market participants will try to maintain or increase their market share. The decline in growth rate that occurred in recent years has resulted in increased competition in China’s automotive market through price reductions, which has resulted in reduced margins. In response to market conditions, in 2016 and 2017, dealers and OEMs continued to reduce prices and offer further inducements (including non-cash incentives) to purchase vehicles. Qoros expects the downward pressure on vehicle prices to continue for the next few years.
In addition to reducing margins, increased competition may make it difficult for Qoros to increase sales. If Qoros is unable to increase its sales, or sell its vehicles at its expected margins, in light of increased competition in the passenger vehicle market, or if vehicle sales in China decrease or do not continue to increase as expected, this could have a material adverse effect on Qoros’ business, financial condition, results of operations or liquidity.
Qoros also faces intense competition in the C-segment SUV market, which it entered in March 2016 with its launch of the Qoros 5 SUV. Many of Qoros’ competitors in this market continued to upgrade their vehicles and introduced new models in 2017, and a continuation of this trend may affect Qoros' ability to sell its SUVs.
Qoros’ success depends, in part, upon its ability to protect, and maintain ownership of, its intellectual property.
Qoros has independently developed and patented, and owns numerous motor vehicle technologies, including technologies related to human machine interface, or HMI, motor vehicles, and motor vehicle platforms, parts, components and accessories for motor vehicles. Qoros believes that such technologies provide it with a competitive advantage and the platform with which to produce international-standard vehicles for its targeted Chinese consumers. Additionally, Qoros owns the brands, trade names, trademarks, or emblems developed in connection with, or with respect to, any of its vehicles. If Qoros fails to protect its intellectual property rights adequately, Qoros’ competitors might gain access to its technology, and its brand or business may be adversely affected. Qoros relies on copyright, trade secret and patent laws, confidentiality procedures and contractual provisions to protect its proprietary methods and technologies and trademark laws to protect the brands, trade names, trademarks, or emblems developed in connection with, or with respect to, any of Qoros’ vehicles. Patents may not be granted for Qoros’ pending patent applications, and the claims allowed on any issued patents may not be sufficiently broad to protect Qoros’ technologies. Any patents or trademarks currently held by Qoros, or that may be issued to Qoros in the future, may be challenged, invalidated or circumvented, and any rights granted under these patents or trademarks may not actually provide Qoros with adequate defensive protection or competitive advantages. Additionally, the process of applying for patent and trademark protection is expensive and time-consuming, and Qoros may not be able to complete all necessary or desirable patent and trademark applications at a reasonable cost or in a timely manner.
Furthermore, policing the unauthorized use of Qoros’ technology, or trademarks, may prove difficult as the laws of some foreign countries may not be sufficiently protective of intellectual property rights, and mechanisms for enforcement of Qoros’ proprietary rights in such countries may be inadequate. From time to time, Qoros may need to initiate legal action to enforce its intellectual property rights, to protect its trade secrets, to determine the validity and scope of the proprietary rights of others, or to defend itself against claims of infringement. Qoros has previously been a defendant in suits with respect to Qoros’ alleged infringement of the intellectual property of other vehicle manufacturers. Any such litigation could result in substantial costs and the diversion of limited resources and could negatively affect Qoros’ business, reputation or brand. If Qoros is unable to protect its proprietary rights (including aspects of its technology platform), Qoros may lose its expected competitive advantage which could have a material adverse effect on Qoros’ business, financial condition, results of operations or liquidity.
Finally, Qoros has pledged, and, in the future, may further pledge, certain of its intellectual property as collateral for its financing. A default on Qoros’ obligations secured by intellectual property under the terms of such facility could provide the secured parties with the right to foreclose on, and subsequently sell and/or license, all or a portion of Qoros’ pledged patent rights, which could materially impair Qoros’ ability to conduct its business.
38
The economic, political and social conditions in China affect Qoros’ business.
Substantially all of Qoros’ assets are located in China and Qoros expects that substantially all of its revenue will continue to be derived from its operations in China. Accordingly, Qoros’ results of operations and prospects are subject, to a significant extent, to the economic, political and legal developments in China. China’s economy differs from the economies of most developed countries in many respects, including government involvement, level of development, growth rate and allocation of resources. The Chinese economy has been transitioning from a planned economy to a more market-oriented economy. Although the Chinese government has implemented measures emphasizing the utilization of market forces for economic reform, the reduction of state ownership of productive assets and the establishment of sound corporate governance in business enterprises, a substantial portion of productive assets in China is still owned by the Chinese government. Additionally, the Chinese government continues to play a significant role in regulating industry by imposing industrial policies and continues to exercise significant control over China’s economic growth through allocating resources, controlling the payment of foreign currency-denominated obligations, setting monetary policy, and providing preferential treatment to particular industries or companies.
China’s economy has experienced rapid growth, much of it due to the issuance of debt over the last few years. This debt-fueled economic growth has led to an increase in the money supply and rising inflation. The Chinese government has implemented various measures from time to time to control China’s rate of economic growth, control inflation and otherwise regulate economic expansion. These measures include imposing controls on bank credit, limiting loans and enacting other restrictions on economic activities, such as measures to curb property, stock market speculation, and increasing inflation. These policies and procedures may, from time to time, be modified or reversed, which could lead to a tightening of credit, which measures, if taken, could further reduce the economic activity in China, reducing Qoros’ ability to obtain additional financing. Additionally, any economic, political or social crisis within China may also lead to a drastic decline in economic activity which could lead to a decline in the demand for Qoros’ vehicles or the availability of funding. Any economic slowdown in China could negatively affect consumption rates and the purchase of costly items, such as vehicles, throughout China.
Furthermore, China’s central government faces a number of issues arising from increased oil dependency. Among these issues are greenhouse gas emissions, heavy haze and urban gridlock due to fast-growing downtown vehicle fleets. As such, the Chinese government has implemented, and may continue to implement, policies to reduce, or slow down, the growth of the vehicle fleet, or promote green cars. Some local governments are being required to launch local promotion policies to speed up new energy vehicle development, which are expected to ease state energy security and local air pollution and traffic congestion problems. These policies may be costly or alter the demand for Qoros’ vehicles, or Qoros may be unable to adjust to changing regulations, which may have an adverse effect on Qoros’ business, results of operations and financial condition.
The New Qoros Investor may not satisfy its commitment to introduce vehicle purchase orders to Qoros.
In connection with its January 2018 investment in Qoros, the New Qoros Investor agreed to introduce approximately 100,000 vehicle purchase orders to Qoros each year between 2018 and 2020 following the entry into further agreements with respect to these purchases. Such further agreements, which will need to set out specific details relating to models to be purchased, purchase price and other details, have not yet been agreed in full, so there is no assurance as to the terms of such purchases.
In the event that the New Qoros Investor does not comply with its commitment to
introduce
the vehicle purchase orders, this could have an adverse effect on Qoros' results.
39
Qoros is subject to Chinese regulation and its business or profitability may be affected by changes in China’s regulatory environment.
Local and national Chinese authorities have exercised, and will continue to, exercise substantial control over the Chinese economy through regulation and state ownership, including rules and regulations that regulate or affect the Chinese automobile manufacturing process and concern vehicle safety and environmental matters such as emission levels, fuel economy, noise and pollution. Additionally, China has recently permitted provincial and local economic autonomy and private economic activities, and, as a result, Qoros is dependent upon its relationship with the local governments in the Jiangsu and Shanghai provinces, among others. As a result, certain of Qoros’ ongoing corporate activities are subject to the approval and regulation of the relevant authorities in China including, among other things, capital increases and investments in Qoros, changes in the structure of Qoros’ ownership, increases in the production capacity, construction of Qoros’ production facilities, ownership of trademarks, the formation of subsidiaries, and the inclusion of Qoros’ products in the national catalogue for purposes of selling them throughout China. Qoros’ operations are also sensitive to changes in the Chinese government’s policies relating to all aspects of the automobile industry. In addition, Qoros’ production facility and products are required to comply with Chinese environmental regulations.
Qoros has incurred, and expects to incur in the future, significant costs in complying with these, and other applicable, regulations and believes that its operations in China are in material compliance with all applicable legal and regulatory requirements. The central or local Chinese governments may continue to impose new, conflicting or stricter regulations or interpretations of existing regulations that would require additional expenditures and efforts by Qoros to ensure its compliance with such regulations or interpretations or maintain its competitiveness and margins. Qoros’ ability to operate profitably in China may be harmed by any such changes in the laws and regulations, including those relating to taxation, environmental regulations, land use rights, property, or the aforementioned corporate matters, of China, Jiangsu, Shanghai or any other jurisdiction in which Qoros may do business. Qoros’ failure to comply with such laws and regulations may also result in fines, penalties or lawsuits, which could have a material adverse effect on Qoros’ business, financial condition, results of operations or liquidity.
As Qoros’ strategy contemplates the development of an NEV, Qoros will be subject to the laws, licensing requirements, regulations and policies applicable to NEVs in China. For instance, Qoros will need to obtain regulatory approvals and licenses to develop and launch its NEV. In addition, in recent years, the Chinese government has offered large subsidies for purchases of electric vehicles. However, these subsidies are expected to be gradually phased out over the next few years, which may affect the demand for NEVs in China.
40
Furthermore, China has recently published a set of fuel consumption credit management rules to promote the growth of the NEV market and reduce reliance on internal combustion vehicles. Under the regulations, automakers must obtain a certain NEV score by 2019, which score is related to the number of NEVs the automaker produces (approximately 10% of the automaker's production in 2019). If the automaker is unable to obtain the score, it is required to purchase credits from other automakers whose NEV score is above the required amount or will be subject to penalties. If Qoros is unable to receive positive Corporate Average Fuel Consumption, or CAFC, credits commencing in 2018 and produce enough NEVs to satisfy the credit deficits, Qoros may be required to purchase NEV credits, which may be costly, or be subject to penalties, including the disqualification of new product registration.
Qoros requires qualified personnel to manage its operations.
Qoros’ senior executives and personnel are important to Qoros’ success, the establishment of Qoros’ strategic direction, and the design and implementation of Qoros’ business plan. Qoros also requires qualified and competent employees to independently direct its day-to-day business operations, execute its business plans, and service Qoros’ customers, dealers, suppliers and other stakeholders. Qoros’ products and services are highly technical in nature. Therefore, Qoros must be able to attract, recruit, hire, train and retain skilled employees, including employees with the capacity to operate Qoros’ production line as well as employees possessing core competencies in vehicle design and engineering. In recent years, Qoros has made a number of personnel changes at the executive management level and in the senior management structure, including after the investment in Qoros in 2018. Such management changes have affected and any future changes may affect, Qoros’ ability to execute its business plan.
In addition, Qoros must continue to develop talent and leadership capabilities in China, where the availability of skilled employees may be limited. The unavailability of qualified personnel in these competitive specialties, or the loss of key Qoros executives, could negatively impact Qoros’ ability to meet its growing operational and servicing demands. In addition, unpredictable increases in the demand for Qoros’ vehicle models may also exacerbate the risk of not having a sufficient number of trained personnel. In particular, Qoros intends to expand the size of its research and development team, but may be unable to hire a sufficient number of qualified personnel in line with its strategy.
In connection with cost-cutting measures implemented in recent years, Qoros decreased the size of its workforce. Furthermore, in light of the high demand for skilled employees in the Chinese automotive industry, certain Qoros employees have left, and may continue to leave, Qoros to join Qoros’ competitors. To the extent Qoros significantly increases its sales volumes, it may not hire or retain sufficient personnel necessary to meet the increased demand. If Qoros fails to hire, train and retain the required number of qualified personnel to operate its business, or if it experiences excessive turnover, Qoros may experience production/manufacturing delays or other inefficiencies, increased recruiting, training or relocation costs, or other difficulties, any of which could have a material adverse effect on Qoros’ business, financial condition, results of operations or liquidity.
Qoros is dependent upon its suppliers.
Qoros sources the component parts necessary for its vehicle models from over 100 suppliers. A number of Qoros’ component parts are currently obtained from a single source. Qoros utilizes such single-source suppliers to manage its expenses and maintain consistency in its component parts. Many of Qoros’ suppliers are European-based with manufacturing facilities in China. Additionally, Qoros sources its engines and certain spare parts from Chery.
Qoros maintains minimal inventories of the materials, systems, components and parts needed to conduct its manufacturing operations. Therefore, Qoros is dependent upon the continued ability of its suppliers to deliver such materials, systems, components and parts in sufficient quantities and at such times that will allow Qoros to meet its production schedules. As Qoros, consistent with industry practice, outsources a significant portion of its components and parts from suppliers, it may be affected by any fluctuations in the expertise and manufacturing capabilities of its suppliers. Additionally, as Qoros’ suppliers may also supply a significant portion of the components and parts of Qoros’ competitors, such concentration may expose Qoros and its competitors to increased pricing pressure. Qoros may also be unable to procure the component parts necessary for its vehicle models if the established manufacturers with which it competes have the capacity to influence Qoros’ suppliers. Although Qoros believes it may be able to establish alternate supply relationships and obtain or engineer replacement components in the event a supplier, including Chery or a single-source supplier, is unable to supply Qoros with a necessary component part at a favorable cost, Qoros may be unable to do so in the short-term, or at all, at prices or costs that it deems favorable. In addition, although Qoros believes that its component parts are available from many suppliers, qualifying alternate suppliers or developing replacements for certain highly customized components of its vehicles may be time consuming and costly or may force Qoros to make additional and unexpected modifications to its vehicle models’ designs or schedules. An unexpected shortage of materials, systems, components or parts, if even for a relatively short period of time, could prevent Qoros from manufacturing its vehicles, cause Qoros to alter its production designs, or prevent Qoros from timely supplying its dealers with the aftersales parts necessary for the servicing of Qoros’ vehicles. Such occurrences could adversely impact Qoros’ relationships with its dealers or customers and thereby affect Qoros’ business, financial condition, results of operations or liquidity.
41
Increases in the prices of raw materials that are included within the component parts Qoros purchases from its suppliers, may increase Qoros’ costs and could reduce Qoros’ profitability if Qoros cannot recoup the increased costs through increased vehicle prices. As Qoros continues to actively manage its trade payables, Qoros may not be able to maintain favorable arrangements and relationships with its suppliers and, in particular, may not be able to secure or maintain, as applicable, contractual conditions comparable with those of Qoros’ main competitors.
In addition, to the extent Qoros significantly increases its sales, it may be unable to procure the supplies necessary to meet such sales volumes. If Qoros is unable to pay its suppliers on a timely basis, it may be unable to procure on favorable terms the parts, components and services it requires to continue operating and Qoros has been, and may continue to be, subject to suits or other claims in respect of outstanding payables.
Qoros may experience delays and/or cost overruns with respect to the design, manufacture, launch and financing of new or enhanced models.
Qoros’ business plan contemplates the introduction of new vehicle models (including an NEV model), as well as enhanced versions of existing vehicle models, over the short- and long-term. In light of technological developments, Qoros will need to continually upgrade and adapt its vehicle models, vehicle platform and manufacturing facility in Changshu, as automobile customers generally expect new or enhanced vehicle models to be introduced frequently. Upgrading and adapting Qoros’ vehicle models and manufacturing facility and developing and launching an NEV will require significant investments, whereas in recent years, Qoros has undertaken cost-cutting measures. Further, there can be no assurance that Qoros will be able to secure the necessary financing to fund the continued introduction and manufacturing of new and enhanced vehicle models, design future vehicle models that will maintain the high quality standards required for Qoros’ branding image, meet the expectations of its customers, and become commercially viable. Should Qoros be unable to invest in developing and upgrading its vehicle models and manufacturing facility, Qoros may experience difficulties in introducing and developing new vehicles, including NEVs, with the latest automobile technology which meets consumer standards. In addition, automobile manufacturers often experience delays and cost overruns in the design, manufacture and commercial release of new and enhanced vehicle models and any delay in the financing, design, manufacture or launch of Qoros’ new or enhanced models could materially damage Qoros’ brand, the development of its business and its financial position.
Our independent registered public accounting firm currently relies on an independent registered public accounting firm located in the People’s Republic of China, who are not inspected by the PCAOB, for assistance in completing their audit work associated with our investment in Qoros, and as such, you are deprived of the benefits of such inspection.
Our independent registered public accounting firm currently relies on an independent registered public accounting firm located in the People’s Republic of China for assistance in completing the audit work associated with our investment in Qoros. Auditors of companies that are publicly traded in the United States and firms registered with the Public Company Accounting Oversight Board, or PCAOB, are required to undergo regular PCAOB inspections. However, because Qoros has substantial operations within China, a jurisdiction in which the PCAOB is currently unable to conduct inspections without the approval of the Chinese government authorities, the audit work conducted in China with respect to Qoros has not been inspected by the PCAOB.
Inspections of other auditors conducted by the PCAOB outside of China have, at times, identified deficiencies in those auditors’ audit procedures and quality control procedures, which may be addressed as part of the PCAOB’s inspection process to improve future audit quality. The lack of PCAOB inspections of audit work undertaken in China prevents the PCAOB from regularly evaluating audits and quality control procedures conducted in China. As a result, our shareholders may be deprived of the benefits of PCAOB inspections, and may lose confidence in Kenon’s or Qoros’ financial statements and the procedures and the quality underlying such financial statements.
42
If the China-based affiliates of the “Big Four” accounting firms, including the auditor of Qoros, were to violate the terms of a settlement agreement with the SEC arising out of proceedings instituted by the SEC against them in late 2012, such violation could result in the Chinese member firms of the “Big Four” accounting firms being suspended from practicing before the SEC which could, in turn, delay the timely filing of our, or Qoros’, financial statements with the SEC.
In late 2012, the SEC commenced administrative proceedings under Rule 102(e) of its Rules of Practice and also under the Sarbanes-Oxley Act of 2002 against the mainland Chinese affiliates of the “Big Four” accounting firms, including the auditor of Qoros. The Rule 102(e) proceedings initiated by the SEC related to the failure of these firms to produce documents, including audit work papers, in response to the request of the SEC pursuant to Section 106 of the Sarbanes-Oxley Act of 2002.
In January 2014, an SEC administrative law judge, issued an initial decision suspending the Chinese member firms of the “Big Four” accounting firms, including the auditor of Qoros, from, among other things, practicing before the SEC for six months. In February 2014, the initial decision was appealed. While under appeal and in February 2015, the Chinese member firms of “Big Four” accounting firms reached a settlement with the SEC. As part of the settlement, each of the Chinese member firms of “Big Four” accounting firms agreed to settlement terms that include a censure; undertakings to make a payment to the SEC; procedures and undertakings as to future requests for documents by the SEC; and possible additional proceedings and remedies should those undertakings not be adhered to.
Pursuant to Rule 3-09 of Regulation S-X, Kenon is required to attach Qoros’ separate audited financial statements to this annual report on Form 20-F, and may be required to attach Qoros’ separate audited financial statements to its future annual reports on Form 20-F. Additionally, our independent registered public accounting firm currently relies on a Chinese member firm of the “Big Four” network for assistance in completing the audit work associated with our investment in Qoros. If the settlement terms are not adhered to, the Chinese member firms of “Big Four” accounting firms may be suspended from practicing before the SEC which could in turn delay the timely filing of our, or Qoros’, financial statements with the SEC. In addition, it could be difficult for Qoros to timely identify and engage another qualified independent auditor.
Any such occurrences may ultimately affect the continued listing of our ordinary shares on the New York Stock Exchange, or the NYSE, or our registration with the SEC, or both. Moreover, any further negative news about the proceedings, any violations of the settlement agreement relating to the proceedings or any future proceedings against these audit firms may adversely affect investor confidence in companies with substantial mainland China based operations listed in, or affiliated with listings in, the U.S., such as Qoros, which could have a material adverse effect on the price of our ordinary shares and substantially reduce or effectively terminate the trading of our ordinary shares in the United States.
Risks Related to Our Other Businesses
Risks Related to Our Interest in ZIM
The container shipping industry is dynamic and volatile.
The container shipping industry is dynamic and volatile and has been marked in recent years by instability as a result of global economic conditions and the many conditions and factors that affect supply and demand in the shipping industry, which include:
| · |
global and regional economic and geopolitical trends, including armed conflicts, terrorist activities, embargoes and strikes;
|
| · |
the supply of and demand for commodities and industrial products globally and in certain key markets, such as China;
|
43
| · |
developments in international trade, including the imposition of tariffs and other trade protectionism;
|
| · |
currency exchange rates;
|
| · |
prices of energy resources;
|
| · |
environmental and other regulatory developments;
|
| · |
changes in seaborne and other transportation patterns;
|
| · |
changes in the shipping industry, including mergers and acquisitions, bankruptcies, restructurings and alliances;
|
| · |
changes in the infrastructure and capabilities of ports and terminals;
|
| · |
weather conditions; and
|
| · |
development of digital platforms to manage operations.
|
These factors also significantly affect ZIM’s freight rates. Furthermore, rates within the charter market, through which ZIM sources a substantial portion of its capacity, may also fluctuate significantly based upon changes in demand for shipping services. As global trends continue to change, it remains difficult to predict their impact on the container shipping industry and on ZIM’s business. If ZIM is unable to adequately respond to market changes, they could have a material adverse effect on its business, financial condition, results of operations and liquidity.
Excess supply of global container ship capacity may limit ZIM’s ability to operate vessels profitably, and lead to overload and/or overcapacity and congestion in certain ports.
Global container ship capacity has increased over the years and continues to exceed demand. As of December 31, 2017, global container ship capacity was approximately 21 million 20-foot equivalent units, or TEUs, spread across approximately 5,200 vessels. According to Alphaliner, excess capacity is projected to further increase, outpacing any expected increase in worldwide demand as a result of large global orders for new vessels. Many of these orders are for vessels with carrying capacities of 18,000 TEUs and above, which may increase capacity for each shipping voyage. Additionally, responses to changes in market conditions may be slow as a result of the time required to build new vessels and adapt to market needs. As shipping companies purchase vessels years in advance to address expected demand, vessels may be delivered during times of decreased demand or unavailable during times of increased demand, leading to a supply/demand mismatch. The container shipping industry may continue to face oversupply in the coming years and numerous other factors beyond ZIM’s control may also contribute to an increase in capacity, including deliveries of refurbished or converted vessels, port and canal congestion, decreased scrapping of older vessels, any decline in the practice of slow steaming, a reduction in the number of void voyages and a decrease in the number of vessels that are out of service (e.g., vessels that are laid-up, dry-docked, awaiting repairs or are otherwise not available for hire). Excess capacity depresses freight rates and can lead to lower utilization rates, which may adversely affect ZIM’s revenues, profitability and asset values. Until such capacity is fully absorbed by the container shipping market and, in particular, the shipping lines on which ZIM’s operations are focused, the industry will continue to experience downward pressure on freight rates and such prolonged pressure could have a material adverse effect on ZIM’s financial condition, results of operations and liquidity.
Furthermore, in recent years, container ship capacities have increased globally at a faster rate than the rate at which some container ports have increased their capacities, leading to considerable delays in processing container shipments in affected ports. As a result of longer load and unload times, increases in container ship capacities could increase port congestion, which could have a material adverse effect on affected shipping lines. In addition, as industry capacity continues to grow, ZIM may have difficulty securing sufficient terminal slots to expand its operations in accordance with its growth strategy due to the limited availability of port facilities.
44
ZIM does not benefit from the efficiencies of participating in strategic alliances and the ability to enter into such alliances and the participation in operational partnerships in the shipping industry may be limited, which may adversely affect ZIM’s business.
The container shipping industry has experienced a reduction in the number of major carriers, as well as a continuation of the trends of strategic alliances and partnerships among container carriers, which can result in more efficient and better coverage for shipping companies participating in such arrangements. For example, in recent years, COSCO and China Shipping Container Lines merged into COSCO Shipping, Hanjin Shipping filed for bankruptcy and APL Shipping was acquired by CMA CGM Shipping. In 2017, there were announcements of further consolidation in the shipping industry, including the merger of United Arab Shipping Company and Hapag-Lloyd, the acquisition of Hamburg Sud by Maersk and the merger of three large Japanese carriers.
The recent consolidation in the industry has affected the existing strategic alliances between shipping companies. For example, the Ocean Three alliance, which consisted of CMA CGM Shipping, United Arab Shipping Company and China Shipping Container Lines, was terminated and replaced by the Ocean Alliance, consisting of COSCO Shipping, CMA CGM Shipping, Evergreen Marine and Orient Overseas Container Line.
ZIM is not a member of any alliances. As a result, ZIM does not benefit from the economies of scale that many of its competitors are able to achieve through participation in such arrangements. However, ZIM is party to operational partnerships with other carriers in some of the trade zones in which ZIM operates, and may seek to enter into additional operational partnerships or similar arrangements with other shipping companies or local operators, partners or agents. If ZIM is not successful in expanding operational partnerships, this could adversely affect its business. In addition, ZIM’s status as an Israeli company has limited, and may continue to limit, its ability to call on certain ports and has therefore limited, and may continue to limit, ZIM’s ability to enter into alliances or operational partnerships with certain shipping companies.
Declines in freight rates or other market conditions and other factors, could negatively affect ZIM’s business, financial condition, or results of operations and could thereby result in ZIM or Kenon incurring impairment charges.
At each of its reporting periods, ZIM examines whether there have been any events or changes in circumstances, such as a decline in freight rates or other market conditions, which would indicate an impairment. Additionally, when there are indications of an impairment, an examination is made as to whether the carrying amount of the operating assets or cash generating units, or CGUs, exceeds the recoverable amount and, if necessary, an impairment loss is recognized in its financial statements. The projection of future cash flows related to ZIM’s CGU, which is one CGU, is complex and requires ZIM to make various estimates including future freight or charter rates, bunker prices, earnings from the vessels and discount rates, all of which have been volatile historically. Should freight rates decline significantly or ZIM or the shipping industry experience adverse conditions, this may have a material adverse effect on ZIM's business, results of operation and financial condition, which may result in ZIM or Kenon recording an impairment charge.
An increase in bunker prices may have an adverse effect on ZIM’s results of operations.
Bunker expenses represent a significant portion of ZIM’s operating expenses, accounting for 11% and 13% of the income from voyages and related services for the years ended December 31, 2016 and 2017, respectively. Bunker prices move in close interdependence with crude oil prices, which have historically exhibited significant volatility. Crude oil prices are influenced by a host of economic and geopolitical factors that are beyond ZIM’s control, particularly economic developments in emerging markets such as China and India, global terrorism, political instability and tensions in North Africa and the Middle East, environmental regulations, fracking, and the long-term increase in global demand for oil.
Increases in bunker prices could have a material adverse effect on ZIM’s business, financial condition, results of operations and liquidity. Historically, and in line with industry practice, from time to time ZIM has imposed surcharges over the base freight rate ZIM charges to its customers in part to minimize its exposure to certain market-related risks, including bunker price adjustments. However, there can be no assurance that ZIM will be successful in passing on future price increases to customers in a timely manner, either for the full amount or at all.
45
ZIM’s bunker consumption is affected by various factors, including the number of vessels being deployed, vessel capacity, pro forma speed, vessel efficiency, the weight of the cargo being transported, port efficiency and sea conditions. ZIM has implemented various optimization strategies designed to reduce bunker consumption, including operating vessels in “super slow steaming” mode, trim optimization, hull and propeller polishing and sailing rout optimization. Additionally, ZIM manages part of its exposure to bunker price fluctuations by entering into hedging arrangements. ZIM’s optimization strategies and hedging program may not be successful in mitigating higher bunker costs, and any price protection provided by hedging may be limited due to market conditions, such as choice of hedging instruments, and the fact that only a portion of ZIM’s exposure is hedged. There can be no assurance that ZIM’s hedging arrangements will be cost-effective, will provide sufficient protection, if any, against rises in bunker prices or that the counterparties will be able to perform under ZIM’s hedging arrangements.
In addition, in connection with IMO sulfur emissions regulations expected to come into effect in 2020, ZIM may be required to use fuel oil which is more costly than that which it currently uses to comply with the regulations.
ZIM is highly leveraged and may be unable to comply with its financial covenants or meet its debt service or other obligations.
As of December 31, 2017, ZIM had approximately $1.5 billion of outstanding loans and liabilities to be repaid between 2018 through 2030, of which $313 million of principal is scheduled to be repaid during 2018. Many of the financing agreements relating to ZIM’s debt facilities contain covenants and limitations, including:
| · |
Minimum liquidity, fixed charge coverage ratio and total leverage covenants; and
|
| · |
Other non-financial covenants and limitations such as restrictions on dividend distribution, asset sales, investments and incurrence of debt, as well as various reporting obligations.
|
In 2016, ZIM agreed with its creditors a rescheduling of principal payments of $116 million originally scheduled for payment in the 12 months from September 30, 2016, as well as to waive and revise certain covenants to which ZIM was subject. The covenants which had been waived for 2017 are applicable beginning in March 2018.
If ZIM is unable to meet its obligations or refinance its indebtedness as it becomes due, or if ZIM is unable to comply with its covenants, ZIM may have to take disadvantageous actions, such as (i) reducing financing in the future for investments, acquisitions or general corporate purposes or (ii) dedicating a high level of ZIM’s cash flow from operations to the payment of principal and interest on indebtedness. As a result, the ability of ZIM’s business to withstand competitive pressures and to react to changes in the container shipping industry could be impaired. If ZIM is unable to comply with its covenants or meet debt service obligations or does not pursue any of these alternatives and is unable to obtain waivers from the relevant creditors, a breach of any of its debt instruments and/or covenants could result in a default under the relevant debt instruments. Upon the occurrence of such an event of default, the lenders could elect to declare all amounts outstanding thereunder to be immediately due and payable and, in the case of credit facility lenders, terminate all commitments to extend further credit. If the lenders accelerate the repayment of the relevant borrowings, ZIM may not have sufficient assets to repay any outstanding indebtedness. Furthermore, a default or the acceleration of any obligation under a particular debt instrument may cause a default under other material debt or permit the holders of such debt to accelerate repayment of their obligations pursuant to “cross default” or “cross acceleration” provisions, which could have a material adverse effect on ZIM’s business, financial condition and liquidity. For additional information, see “
Item 5.B Liquidity and Capital Resources—ZIM’s Liquidity and Capital Resources.
”
Furthermore, ZIM may be unable to generate sufficient cash flows to satisfy its debt service and other obligations. ZIM’s ability to generate cash flow from operations to make interest and principal payments on ZIM’s debt obligations will depend on its future performance, which will be affected by a range of economic, competitive and business factors. ZIM cannot control many of these factors, including general economic conditions and the health of the shipping industry. If ZIM’s operations do not generate sufficient cash flow from operations to satisfy its debt service and other obligations, ZIM may need to sell assets, borrow additional funds or undertake alternative financing plans, such as refinancing or restructuring its debt, or reducing or delaying capital investments and other expenses. It may be difficult for ZIM to incur additional debt on commercially reasonable terms, even if ZIM is permitted to do so under its debt agreements, due to, among other things, its financial condition and results of operations and market conditions. If ZIM does not generate sufficient cash flows from operations or obtain additional funds or alternative financing on acceptable terms could have a material adverse effect on its business.
46
A decrease in the level of China’s import or export of goods could have a material adverse effect on ZIM’s business.
A significant portion of ZIM’s business originates from China, and ZIM therefore depends on the level of imports and exports to and from China. As China exports considerably more goods than it imports, any reduction in or hindrance to China-based exports, whether due to decreased demand from the rest of the world, an economic slowdown in China, increased tariffs or other factors, could have a material adverse effect on ZIM’s business. For instance, the Chinese government has recently implemented economic policies aimed at increasing domestic consumption of Chinese-made goods. This may have the effect of reducing the supply of goods available for export and may, in turn, result in decreased demand for cargo shipping. In recent years, China has experienced an increasing level of economic autonomy and a gradual shift toward a “market economy” and enterprise reform. However, many of the reforms implemented, particularly some limited price reforms, are unprecedented or experimental and may be subject to revision, change or abolition. The level of imports to and exports from China could be adversely affected by changes to these economic reforms by the Chinese government, as well as by changes in political, economic and social conditions or other relevant policies of the Chinese or other governments. In recent years, China has experienced slower GDP growth rates than in previous years, which affected levels of imports to and exports from China. In response to the recent slowdown in China’s economic growth, China may implement additional trade barriers to protect their domestic industries against foreign imports, which may depress the global demand for shipping services.
Furthermore, China’s import and export of goods may also be affected by trade protectionism and local production over foreign trade, which may affect the demand for maritime shipping, particularly between the United States and China. For instance, in March 2018, the U.S. President directed the U.S. trade representative to impose tariffs of approximately $50 billion of products originating in China, file a case against China with the World Trade Organization and also proposed to limit Chinese inbound investment into the United States. The Chinese government has announced that it intends to retaliate against the imposition of these sanctions through imposition of its own tariffs on certain imports from the United States. Such policies, if implemented, may affect the global demand for ZIM's services.
In addition, in 2017, China implemented an environmental plan applicable to scrap imports. This plan materially decreased U.S. exports of scrap paper, plastics and textiles during 2017. Should this environmental plan be broadened, this may have a material adverse effect on global shipping demand.
Changes in laws and regulations, including with regard to tax matters, and their implementation by local authorities could also affect ZIM’s vessels calling on Chinese ports and could have a material adverse effect on its business, financial condition and results of operations.
Israel holds a Special State Share in ZIM, which imposes certain restrictions on ZIM’s operations and our equity interest in ZIM.
The State of Israel holds a special share in ZIM, or Special State Share, which imposes certain limitations on the activities of ZIM that may negatively affect ZIM’s business and results of its operations. The Special State Share, and the permit which accompanies it, also imposes transferability restrictions on our equity interest in ZIM. Furthermore, although there are no contractual restrictions on any sales of our shares by our controlling shareholders, if Idan Ofer’s ownership interest in Kenon is less than 36%, or Idan Ofer ceases to be the controlling shareholder, or sole controlling shareholder of Kenon, then Kenon’s rights with respect to its shares in ZIM (e.g., Kenon’s right to vote and receive dividends in respect of its ZIM shares) will be limited to the rights applicable to an ownership of 24% of ZIM, until or unless the State of Israel provides its consent, or does not object to, this decrease in Idan Ofer’s ownership or “control” (as defined in the State of Israel consent received by IC in connection with the spin-off). The State of Israel may also revoke Kenon’s permit if there is a material change in the facts upon which the State of Israel’s consent was based, upon a breach of the provisions of the Special State Share by Kenon, Mr. Ofer, or ZIM, or if the cancellation of the provisions of the Special State Share with respect to a person holding shares in ZIM contrary to the Special State Share’s provisions apply (without limitation). For further information on the Special State Share, see “
Item 4.B Business Overview—Our Businesses—ZIM—ZIM’s Special State Share.
”
47
ZIM faces risks as a result of its status as an Israeli corporation.
ZIM is incorporated and its headquarters is located in Israel, and the majority of its key employees, officers and directors are residents of Israel. Accordingly, political, economic and military conditions in Israel may directly affect ZIM’s business and existing relationships with certain foreign corporations, as well as affect the willingness of potential partners to enter into business arrangements with ZIM. Numerous countries, corporations and organizations limit their business activities in Israel and their business ties with Israeli-based companies. ZIM’s status as an Israeli company has limited, and may continue to limit, its ability to call on certain ports and therefore has limited, and may continue to limit, its ability to enter into alliances or operational partnerships with certain shipping companies, which has historically adversely affected its operations and its ability to compete effectively within certain trades. In addition, ZIM’s status as an Israeli company has limited, and may continue to limit, its ability to enter into alliances that include certain carriers who are not willing to cooperate with Israeli companies.
Since the establishment of the State of Israel in 1948, a number of armed conflicts have taken place between Israel and its neighboring countries. In recent years, these have included hostilities between Israel and Hezbollah in Lebanon and Hamas in the Gaza Strip, both of which resulted in rockets being fired into Israel, causing casualties and disrupting economic activities. Recent political uprisings, social unrest and violence in the Middle East and North Africa, including Israel’s neighbors Egypt and Syria, are affecting the political stability of those countries. This instability has raised concerns regarding security in the region and the potential for armed conflict. Armed conflicts or hostilities in Israel or neighboring countries could cause disruptions in ZIM’s operations, including significant employee absences, failure of its information technology systems and cyber-attacks, which may lead to the shutdown of its headquarters in Israel. ZIM’s commercial insurance does not cover losses that may occur as a result of an event associated with the security situation in the Middle East. Although the Israeli government is currently committed to covering the reinstatement value of direct damages caused by terrorist attacks or acts of war, ZIM cannot assure that this government coverage will be maintained, or if maintained, will be sufficient to fully compensate us for damages incurred. Any losses or damages incurred by us could have a material adverse effect on its business. Any armed conflict involving Israel could adversely affect ZIM’s business and results and operations.
During the 2006 Lebanon War, a military conflict took place in Lebanon. As a result of rocket fire in the city of Haifa, ZIM closed its headquarters for several days. Although ZIM maintains an emergency plan, such events can have a material adverse effect on its operational activities. Any future deterioration in the security or geopolitical conditions in Israel or the Middle East could adversely impact ZIM’s business relationships and thereby have a material adverse effect on its business, financial condition, results of operations or liquidity. As an Israeli company, ZIM has relatively high exposure, compared to many of its competitors, to acts of terror, hostile activities including cyber-attacks, security limitations imposed upon Israeli organizations overseas, possible isolation by various organizations and institutions for political reasons and other limitations (such as restrictions against entering certain ports). If ZIM’s facilities, including its headquarters, become temporarily or permanently disabled by an act of terrorism or war, it may be necessary for us to develop alternative infrastructure and ZIM may not be able to avoid service interruptions. Additionally, ZIM’s owned and chartered vessels, including those vessels that do not sail under the Israeli flag, may be subject to control by the authorities of the State of Israel in order to protect the security of, or bring essential supplies and services to, the State of Israel. Israeli legislation also allows the State of Israel to use ZIM’s vessels in times of emergency. Any of the aforementioned factors may negatively affect ZIM and its results of operations. For further information on the risks related to entry into operational partnerships within the shipping industry, see “—
ZIM does not benefit from the efficiencies of participating in strategic alliances and the ability to enter into such alliances and the participation in operational partnerships in the shipping industry may be limited, which may adversely affect ZIM’s business.
”
ZIM charters a substantial portion of its fleet and the cost associated with chartering such vessels is unpredictable.
ZIM charters a substantial portion of its fleet. As of December 31, 2017, of the 81 vessels through which ZIM provides transport services globally, 74 are chartered, which represents a percentage of chartered vessels that is higher than the industry average. A rise in charter hire rates may adversely affect ZIM’s results of operations. ZIM is party to a number of long-term charter agreements. As of December 31, 2017, approximately 34% of ZIM’s chartered vessels (in terms of capacity) are chartered under operational leases for terms exceeding one year. As a result, ZIM may be unable to take full advantage of short-term reductions in charter hire rates. In addition, some of ZIM’s long-term charter agreements contain rate adjustment mechanisms pursuant to which charter hire rates will increase if the market rate increases, so ZIM may not benefit from such long-term charter agreements in the event of an increase in market charter hire rates. Furthermore, if ZIM is unable in the future to charter vessels of the type and size needed to serve its customers efficiently on terms that are favorable to ZIM, if at all, this may have a material adverse effect of on its business, financial condition, results of operations and liquidity.
48
The trend towards increasing vessel sizes may adversely affect ZIM.
Container shipping companies have been incorporating, and are expected to continue to incorporate, larger, more economical vessels into their operating fleets. The cost per TEU transported on large vessels is less than the cost per TEU for smaller vessels (assuming the vessels are operating at full capacity), as, among other reasons, larger vessels provide increased capacity and fuel efficiency. As a result, cargo shippers are encouraged to deploy large vessels, particularly within the more competitive trades. According to Alphaliner, vessels in excess of 18,000 TEUs represented approximately 47% of the current global order book based on TEU capacity as of December 2017. Furthermore, a significant introduction of large vessels, including very large vessels in excess of 18,000 TEUs, into any trade zone will enable the transfer of existing, large vessels to other shipping lines on which smaller vessels typically operate. Such transfers, which are referred to as “fleet cascading,” may in turn generate similar effects in the other, smaller trade zones in which ZIM operates. ZIM does not currently have agreements in place to procure or charter large container vessels, and the continued deployment of larger vessels by ZIM’s competitors will adversely impact ZIM’s competitiveness if ZIM is not able to acquire, charter or obtain financing for such vessels on attractive terms or at all. This risk is further exacerbated due to ZIM’s inability to participate in certain alliances and thereby access lager vessels for deployment. Even if ZIM is able to acquire or charter larger vessels, ZIM may be unable to achieve utilization rates necessary to operate such vessels profitably.
In June 2016, the Panama Canal expansion project was completed. As a result of the expansion, the canal can accommodate container vessels with capacities of 13,000-14,000 TEUs, which can then access via the Panama Canal the Pacific trade zone, which is one of ZIM’s strategic trade zones. The introduction of such vessels within this trade zone has required shipping liners seeking to remain competitive, including ZIM, to alter their fleet composition and incorporate larger vessels into their Panama Canal operations.
ZIM currently does not have any agreements in place to procure or charter-in large container vessels with capacities of 13,000-14,000 TEUs. As large container vessels continue to be delivered into the shipping industry, ZIM’s competitors are expected to further upgrade their fleet to capacities of 13,000-14,000 TEUs in the trans-Pacific trade. As a result, a significant portion of ZIM’s vessels may become increasingly less efficient to operate via the Panama Canal.
ZIM is subject to environmental regulation and failure to comply with such regulation could have a material adverse effect on ZIM’s business.
ZIM is subject to many legal provisions relating to the protection of the environment, including the emissions of hazardous substances, sulfur oxides, or SOx, and nitrogen oxides, or NOx, and the use of low-sulfur fuel or shore power voltage, all of which may be subject to ongoing developments and amendments. For example, ZIM is subject to the International Convention for the Prevention of Pollution from Ships (including designation of Emission Control Areas thereunder), the International Convention for the Control and Management of Ships Ballast Water & Sediments, the International Convention on Liability and Compensation for Damage in Connection with the Carriage of Hazardous and Noxious Substances by Sea of 1996, the Oil Pollution Act of 1990, the Comprehensive Environmental Response, Compensation and Liability Act, the Clean Water Act, and National Invasive Species Act, among others. Compliance with such laws, regulations and standards, where applicable, may require the installation of costly equipment or operational changes. ZIM may also incur additional compliance costs, and any such costs could have a material adverse effect on its business. If ZIM fails to comply with any of the environmental regulations applicable, ZIM could be exposed to significant environmental liability damages, criminal charges, and substantial harm to its operations and reputation. Additionally, environmental laws often impose strict liability for remediation of spills and releases of oil and hazardous substances, which could subject ZIM to liability without regard to whether ZIM is negligent or at fault.
In addition, ZIM may be required to incur significant costs in connection with modifications to environmental regulations applicable to shipping companies. For example, ZIM will be required to comply with IMO regulations relating to sulfur emissions which are expected to come into effect in 2020. In order to comply with these regulations, ZIM will be required to either use fuel oil which is more costly than that which it currently uses or modify its vessels by installing scrubbers, either of which may entail significant costs.
49
Environmental requirements may also require a reduction in cargo capacity, ship modifications or operational changes or restrictions, lead to decreased availability of or more costly insurance coverage for safety and environmental matters or result in ZIM’s denial of access to certain jurisdictional waters or ports, or its detention in certain ports. Under local, national and foreign laws, as well as international treaties and conventions, ZIM could incur material liabilities, including cleanup obligations, natural resource damages, personal injury and property damage claims in the event there is a release of petroleum or other hazardous materials from its vessels, or otherwise, in connection with its operations. Violations of, or liabilities under, safety and environmental requirements can result in substantial penalties, fines and other sanctions, including in certain instances, seizure or detention of its vessels and events of this nature could have a material adverse effect on ZIM’s business, reputation, financial condition and results of operations.
The shipping industry is subject to extensive government regulation and standards, international treaties and trade prohibitions and sanctions.
The shipping industry is subject to extensive regulation that changes from time to time and that applies in the jurisdictions in which shipping companies are incorporated, the jurisdictions in which vessels are registered (flag states), the jurisdictions governing the ports at which vessels call, as well as regulations by virtue of international treaties and membership in international associations. As a global container shipping company, ZIM is subject to a wide variety of international, national and local laws, regulations and agreements. As a result, ZIM is subject to extensive government regulation and standards, customs inspections and security checks, international treaties and trade prohibitions and sanctions, including laws and regulations in each of the jurisdictions in which we operate, including those of the State of Israel, the U.S. Federal Maritime Commission, the International Safety Management Code, or the ISM Code, and the European Union. Any violation of such laws, regulations, treaties and/or prohibitions could have a material adverse effect on ZIM’s business, financial condition, results of operations and liquidity and may also result in the revocation or non-renewal of its “time-limited” licenses.
Furthermore, the U.S. Department of the Treasury’s Office of Foreign Assets Control administers certain laws and regulations that impose restrictions upon U.S. companies and persons and, in some contexts, foreign entities and persons, with respect to activities or transactions with certain countries, governments, entities and individuals that are the subject of such sanctions laws and regulations. Similar sanctions are imposed by the European Union and the United Nations. Under economic and trading sanction laws, governments may seek to impose modifications to business practices, and modifications to compliance programs, which may increase compliance costs, and may subject us to fines, penalties and other sanctions.
Additionally, ZIM is subject to competition and antitrust regulations in each of the countries where ZIM operates. In most of the jurisdictions in which ZIM operates, operational partnerships among shipping companies are exempted from the application of antitrust laws, subject to the fulfillment of certain exemption requirements. Recently, however, there has been a trend within the international community to limit such exemptions and it is difficult to predict whether existing exemptions or their renewal will be affected in the future. ZIM is party to numerous operational partnerships and view these agreements as competitive advantages in response to the market concentration in the industry as a result of mergers and global alliances. An amendment to or a revocation of any of the exemptions for operational partnerships that ZIM rely on could negatively affect ZIM’s business and results of operations.
There are numerous risks related to the operation of any sailing vessel and ZIM’s inability to successfully respond to such risks could have a material adverse effect on ZIM.
There are numerous risks related to the operation of sailing vessels, including dangers associated with potential port closures, marine disasters, mechanical failures, collisions, lost or damaged cargo, contraband smugglers, poor weather conditions, the content of the load, exceptional load, meeting deadlines, risks of documentation, maintenance and the quality of fuels, piracy, shortages of containers, shortages of qualified sea and shoreside personnel and maritime arrests arising from unsatisfied debts, claims or damages. The occurrence of any of the aforementioned risks could have a material adverse effect on ZIM’s business, financial condition, results of operations or liquidity and ZIM may not be adequately insured against any of these risks.
50
Risks Related to Primus
Primus requires additional financing for its operations.
The implementation of Primus’ business plan requires additional capital to enable Primus to continue to develop its commercial operations. Primus expects such funding to be provided by us either through capital contributions or shareholder loans, or to the extent Primus pursues projects, through contributions from strategic partners or debt financing. There is no certainty that additional financing will be provided to Primus. Any lack of, or delay in securing, such financing may delay, or prevent completely, Primus’ ability to continue to develop its commercial operations, which may result in Primus’ ultimate sale, liquidation or dissolution.
Primus’ STG+ process may not become commercially viable.
Demand for and industry acceptance of Primus’ technologies is subject to a high level of uncertainty. If potential customers fail to accept Primus’ technologies, if acceptance develops slower than anticipated by Primus, or if Primus’ technologies prove uneconomical or unattractive, this could have a material adverse effect on Primus’ business, financial condition, results of operations or liquidity.
Primus is an early stage company with a limited operating history.
Primus is an early stage company. The risks and uncertainties associated with the operation of an early stage company include a potential inability to:
| · |
retain and recruit key personnel;
|
| · |
adequately protect its intellectual property;
|
| · |
secure necessary capital;
|
| · |
successfully negotiate with government agencies, vendors, customers, feedstock suppliers or other third parties;
|
| · |
successfully manage its existing, or enter into new, strategic relationships and partnerships;
|
| · |
commence projects on the current, or any revised, schedule in compliance with the budget;
|
| · |
effectively manage rapid growth in personnel or operations; and
|
| · |
develop technology, products or processes that complement existing business strategies or address changing market conditions.
|
If Primus is unable to adequately address any of these risks, this could have a material adverse effect on Primus’ business, financial condition, results of operations or liquidity.
Primus’ STG+ process may not generate methanol or fuel that satisfies required specifications.
The commercialization of Primus’ technology contemplates the production of liquids that satisfy certain specifications. If any of the liquids produced by Primus’ STG+ process are unable to satisfy required specifications, Primus may be unable to market and commercialize its proprietary liquids technology, the STG+ process. Any change in such specifications, could increase Primus’ expenses or delay the commercialization or viability of Primus’ gas monetization technology, which could have a material adverse effect on Primus’ business, financial condition, results of operations or liquidity.
51
Primus’ operations are highly dependent upon commodity prices, particularly natural gas, methanol and gasoline.
Primus’ operations depend substantially on the prices of various commodities, including natural gas, gasoline, crude oil, methanol and others. The prices of certain of these commodities are volatile, and this volatility may affect Primus’ ability to market its technology and processes.
The liquids that Primus produces using its STG+ process (gasoline, methanol and stream miscible with crude) will compete in markets with refined petroleum products. Because natural gas, or syngas derived from natural gas, will be primarily used as the feedstock in Primus’ STG+ process, an increase in natural gas prices relative to prices for refined petroleum products, or a decrease in prices for refined petroleum products, could adversely affect demand for Primus’ technology. The price and availability of natural gas and refined products may be affected by numerous factors, including the level of consumer product demand, weather conditions, the availability of water for fracking, domestic and foreign government regulation (including regulation of fracking), the actions of the Organization of Petroleum Exporting Countries, political conditions in oil and natural gas producing countries, the supply of domestic and foreign crude oil and natural gas, the location of any plants developed by Primus vis-á-vis natural gas reserves and pipelines, the capacities of such pipelines, fluctuations in seasonal demand, governmental regulations, the price and availability of alternative fuels and overall economic conditions. Primus cannot predict future demand and prices for natural gas or refined products, and a relative increase in the price of natural gas could have a material adverse effect on its business, financial condition, results of operations or liquidity.
Primus’ success depends, in part, upon its ability to protect its intellectual property.
Primus has independently developed, patented and owns numerous processes related to liquids synthesis, gasoline composition, and incremental improvements and customizations. If Primus fails to protect its intellectual property rights adequately, its competitors might gain access to its technology, and its competitive advantage, brand or business may be adversely affected.
Primus relies on trade secret and patent laws, confidentiality procedures and contractual provisions to protect its proprietary methods and processes. Primus currently holds several patents and has pending patent applications in the U.S. Valid patents may not be issued from Primus’ pending applications, and the claims allowed on any issued patents may not be sufficiently broad to protect Primus’ STG+ process. Any patents currently held by Primus or that may be issued to Primus in the future may be challenged, invalidated or circumvented, and any rights granted under these patents may not actually provide Primus with adequate defensive protection or competitive advantages. Additionally, the process of applying for patent protection is expensive and time-consuming, and Primus may not be able to complete all necessary or desirable patent applications at a reasonable cost or in a timely manner.
Policing unauthorized use of technology may prove difficult for Primus as the laws of some foreign countries may not be as protective of intellectual property rights as those of the United States, and mechanisms for the enforcement of Primus’ proprietary rights in such countries may be inadequate. From time to time, Primus may need to initiate legal action to enforce its intellectual property rights, to protect its trade secrets, to determine the validity and scope of the proprietary rights of others, or to defend itself against claims of infringement. Such litigation could result in substantial costs and the diversion of limited resources and could negatively affect Primus’ business, reputation or brand. If Primus is unable to protect its proprietary rights, it may lose its expected competitive advantage which could have a material adverse effect on its business, financial condition, results of operations or liquidity.
Risks Related to Our Spin-Off
The potential indemnification of liabilities to IC pursuant to the Separation and Distribution Agreement may require us to divert cash to IC to satisfy our indemnification obligations.
We entered into a Sales, Separation and Distribution Agreement with IC, or the Separation and Distribution Agreement, which provides for, among other things, indemnification obligations designed to make us financially responsible for liabilities incurred in connection with our businesses, and as otherwise allocated to us in the Separation and Distribution Agreement. If we are required to indemnify IC under the circumstances set forth in the Separation and Distribution Agreement, we may be subject to substantial liabilities, which could have a material adverse effect on our business, financial condition, results of operations or liquidity.
52
There can be no assurance that IC’s indemnification of certain of our liabilities will be sufficient to insure us against the full amount of those liabilities, or that IC’s ability to satisfy its indemnification obligation will not be impaired in the future.
Pursuant to the Separation and Distribution Agreement, IC has agreed to indemnify us for certain liabilities retained by it (which includes certain specified pending legal matters). However, third parties could seek to hold us responsible for any of the liabilities that IC has agreed to retain, and there can be no assurance that the indemnity from IC will be sufficient to protect us against the full amount, or any, of such liabilities, or that IC will be able to satisfy its indemnification obligations. Moreover, even if we ultimately succeed in recovering from IC any amounts for which we are held liable, we may be temporarily required to bear these losses ourselves. Additionally, IC’s insurers may deny coverage to us for liabilities associated with occurrences prior to the spin-off. Even if we ultimately succeed in recovering from such insurance providers, we may be required to temporarily bear such loss of coverage. If IC is unable to satisfy its indemnification obligations or if insurers deny coverage, the underlying liabilities could have a material adverse effect on our business, financial condition, results of operations or liquidity.
Risks Related to Our Ordinary Shares
Our ordinary shares are traded on more than one stock exchange and this may result in price variations between the markets.
Our ordinary shares are listed on each of the NYSE and the TASE. Trading in our ordinary shares therefore takes place in different currencies (U.S. Dollars on the NYSE and New Israeli Shekels on the TASE), and at different times (resulting from different time zones, different trading days and different public holidays in the United States and Israel). The trading prices of our ordinary shares on these two markets may differ as a result of these, or other, factors. Any decrease in the price of our ordinary shares on either of these markets could also cause a decrease in the trading prices of our ordinary shares on the other market.
If securities or industry analysts do not publish research or reports about our business, or publish negative reports about our business, our share price and trading volume could decline.
There is no analyst coverage of Kenon outside of Israel. The trading market for our ordinary shares depends, in part, upon the research and reports that securities or industry analysts publish about us or our businesses. If securities or industry analysts do not cover us, we could lose visibility in the financial markets, which could cause our share price or trading volume to decline.
A significant portion of our outstanding ordinary shares may be sold into the public market, which could cause the market price of our ordinary shares to drop significantly, even if our business is doing well.
A significant portion of our shares are held by Ansonia, which holds approximately 58% of our shares. If Ansonia sells, or indicates an intention to sell, substantial amounts of our ordinary shares in the public market, the trading price of our ordinary shares could decline. The perception that any such sales may occur, including the entry of any of Ansonia into programmed selling plans, could have a material adverse effect on the trading price of our ordinary shares and/or could impair the ability of any of our businesses to raise capital.
Control by principal shareholders could adversely affect our other shareholders.
Ansonia beneficially owns approximately 58% of our outstanding ordinary shares and voting power. Ansonia therefore has a continuing ability to control, or exert a significant influence over, our board of directors, and will continue to have significant influence over our affairs for the foreseeable future, including with respect to the election of directors, the consummation of significant corporate transactions, such as an amendment of our constitution, a merger or other sale of our company or our assets, and all matters requiring shareholder approval. In certain circumstances, Ansonia’s interests as a principal shareholder may conflict with the interests of our other shareholders and Ansonia’s ability to exercise control, or exert significant influence, over us may have the effect of causing, delaying, or preventing changes or transactions that our other shareholders may or may not deem to be in their best interests.
53
We may not have sufficient distributable profits to pay dividends or make other distributions.
Under Singapore law and our constitution, dividends, whether in cash or in specie, must be paid out of our profits available for distribution. The availability of distributable profits is assessed on the basis of Kenon’s standalone unconsolidated accounts (which are based upon the Singapore Financial Reporting Standards, or the SFRS). There is no assurance that, on such basis, we will not incur losses, that we will become profitable, or that we will have sufficient distributable income that might be distributed to our shareholders as a dividend or other distribution in the foreseeable future. Therefore, we may be unable to pay dividends to our shareholders unless and until we have generated sufficient distributable reserves. Accordingly, it may not be legally permissible for us to pay dividends to our shareholders. As a result, if we declare dividends with respect to our ordinary shares, a holder of our ordinary shares will only realize income from an investment in our ordinary shares if there is an increase in the market price of our ordinary shares. Such potential increase is uncertain and unpredictable.
Under Singapore law, it is possible to effect either a court-free or court-approved capital reduction exercise to return cash and/or assets to our shareholders. Further, the completion of a court-free capital reduction exercise will depend on whether our directors are comfortable executing a solvency statement attesting to our solvency, as well as whether there are any other creditor objections raised (in the event that we have creditors other than IC). We have completed capital reduction exercises in connection with the distribution of our Tower shares and the cash distribution in March 2018, but there is no assurance that we will be able to complete further capital reductions in the future.
Any dividend payments on our ordinary shares would be declared in U.S. Dollars, and any shareholder whose principal currency is not the U.S. Dollar would be subject to exchange rate fluctuations.
The ordinary shares are, and any cash dividends or other distributions to be declared in respect of them, if any, will be denominated in U.S. Dollars. For example, in March 2018, we distributed a cash dividend of $665 million, representing approximately $12.35 per share, to our shareholders. Although a significant percentage of our shareholders hold their shares through the TASE, the dividend was denominated in U.S. Dollars. Shareholders whose principal currency is not the U.S. Dollar will be exposed to foreign currency exchange rate risk. Any depreciation of the U.S. Dollar in relation to such foreign currency will reduce the value of such shareholders’ ordinary shares and any appreciation of the U.S. Dollar will increase the value in foreign currency terms. In addition, we will not offer our shareholders the option to elect to receive dividends, if any, in any other currency. Consequently, our shareholders may be required to arrange their own foreign currency exchange, either through a brokerage house or otherwise, which could incur additional commissions or expenses.
Furthermore, in December 2017, Kenon's shareholders authorized a capital reduction to enable a potential distribution of a portion of the proceeds received from the sale of the Inkia Business. The Singapore courts approved the capital reduction in February 2018 and Kenon distributed $665 million in March 2018.
We are a “foreign private issuer” under U.S. securities laws and, as a result, are subject to disclosure obligations that are different from those applicable to U.S. domestic registrants listed on the NYSE.
We are incorporated under the laws of Singapore and, as such, will be considered a “foreign private issuer” under U.S. securities laws. Although we will be subject to the reporting requirements of the Exchange Act, the periodic disclosure required of foreign private issuers under the Exchange Act is different from the periodic disclosure required of U.S. domestic registrants. Therefore, there may be less publicly available information about us than is regularly published by or about other public companies in the United States. We are also exempt from certain other sections of the Exchange Act that U.S. domestic registrants are otherwise subject to, including the requirement to provide our shareholders with information statements or proxy statements that comply with the Exchange Act. In addition, insiders and large shareholders of ours will be exempt from the reporting and short-swing profit recovery provisions contained in Section 16 of the Exchange Act and will not be obligated to file the reports required by Section 16 of the Exchange Act.
54
As a foreign private issuer, we have followed certain, and may follow, home country corporate governance practices instead of otherwise applicable SEC and NYSE corporate governance requirements, and this may result in less investor protection than that accorded to investors under rules applicable to domestic U.S. issuers.
As a foreign private issuer, we are permitted to follow certain home country corporate governance practices instead of those otherwise required under the NYSE’s rules for domestic U.S. issuers, provided that we disclose which requirements we are not following and describe the equivalent home country requirement. For example, foreign private issuers are permitted to follow home country practice with regard to director nomination procedures and the approval of compensation of officers.
In addition, we are not required to maintain a board comprised of a majority of independent directors and a fully independent nominating and corporate governance committee. We generally seek to apply the corporate governance rules of the NYSE that are applicable to U.S. domestic registrants that are not “controlled” companies. However, we do not fully comply such rules; for example, we do not have a fully independent nominating and corporate governance committee. We may, in the future, decide to rely on other foreign private issuer exemptions provided by the NYSE and follow home country corporate governance practices in lieu of complying with some or all of the NYSE’s requirements.
Following our home country governance practices, as opposed to complying with the requirements that are applicable to a U.S. domestic registrant, may provide less protection to you than is accorded to investors under the NYSE’s corporate governance rules. Therefore, any foreign private exemptions we avail ourselves of in the future may reduce the scope of information and protection to which you are otherwise entitled as an investor.
It may be difficult to enforce a judgment of U.S. courts for civil liabilities under U.S. federal securities laws against us, our directors or officers in Singapore.
We are incorporated under the laws of Singapore and certain of our officers and directors are or will be residents outside of the United States. Moreover, most of our assets are located outside of the United States. Although we are incorporated outside of the U.S., we have agreed to accept service of process in the United States through our agent designated for that specific purpose. Additionally, for so long as we are listed in the U.S. or in Israel, we have undertaken not to claim that we are not subject to any derivative/class action that may be filed against us in the U.S. or Israel, as applicable, solely on the basis that we are a Singapore company. However, since most of the assets owned by us are located outside of the United States, any judgment obtained in the United States against us may not be collectible within the United States.
Furthermore, there is no treaty between the United States and Singapore providing for the reciprocal recognition and enforcement of judgments in civil and commercial matters, such that a final judgment for the payment of money rendered by any federal or state court in the United States based on civil liability, whether or not predicated solely upon the federal securities laws, would, therefore, not be automatically enforceable in Singapore. Additionally, there is doubt whether a Singapore court may impose civil liability on us or our directors and officers who reside in Singapore in a suit brought in the Singapore courts against us or such persons with respect to a violation solely of the federal securities laws of the United States, unless the facts surrounding such a violation would constitute or give rise to a cause of action under Singapore law. We have undertaken not to oppose the enforcement in Singapore of judgments or decisions rendered in Israel or in the United States in a class action or derivative action to which Kenon is a party. Notwithstanding such undertakings, it may be difficult for investors to enforce against us, our directors or our officers in Singapore, judgments obtained in the United States which are predicated upon the civil liability provisions of the federal securities laws of the United States.
We are incorporated in Singapore and our shareholders may have greater difficulty in protecting their interests than they would as shareholders of a corporation incorporated in the United States.
Our corporate affairs are governed by our constitution and by the laws governing corporations incorporated in Singapore. The rights of our shareholders and the responsibilities of the members of our board of directors under Singapore law are different from those applicable to a corporation incorporated in the United States. Therefore, our public shareholders may have more difficulty in protecting their interest in connection with actions taken by our management or members of our board of directors than they would as shareholders of a corporation incorporated in the United States. For information on the differences between Singapore and Delaware corporation law, see “
Item 10.B Constitution.
”
55
Singapore corporate law may delay, deter or prevent a takeover of our company by a third-party, and as a result of a waiver from application of the Code, our shareholders may not have the benefit of the application of the Singapore Code on Take-Overs and Mergers, which could adversely affect the value of our ordinary shares.
The Singapore Code on Take-overs and Mergers and Sections 138, 139 and 140 of the Securities and Futures Act, Chapter 289 of Singapore contain certain provisions that may delay, deter or prevent a future takeover or change in control of our company for so long as we remain a public company with more than 50 shareholders and net tangible assets of $5 million or more. Any person acquiring an interest, whether by a series of transactions over a period of time or not, either on his own or together with parties acting in concert with such person, in 30% or more of our voting shares, or, if such person holds, either on his own or together with parties acting in concert with such person, between 30% and 50% (both inclusive) of our voting shares, and such person (or parties acting in concert with such person) acquires additional voting shares representing more than 1% of our voting shares in any six-month period, must, except with the consent of the Securities Industry Council of Singapore, extend a mandatory takeover offer for the remaining voting shares in accordance with the provisions of the Singapore Code on Take-overs and Mergers.
In October 2014, the Securities Industry Council of Singapore waived the application of the Singapore Code on Take-overs and Mergers to the Company, subject to certain conditions. Pursuant to the waiver, for as long as Kenon is not listed on a securities exchange in Singapore, and except in the case of a tender offer (within the meaning of U.S. securities laws) where the offeror relies on a Tier 1 exemption to avoid full compliance with U.S. tender offer regulations, the Singapore Code on Take-overs and Mergers shall not apply to Kenon.
Accordingly, Kenon’s shareholders will not have the protection or otherwise benefit from the provisions of the Singapore Code on Take-overs and Mergers and the Securities and Futures Act to the extent that this waiver is available.
Our directors have general authority to allot and issue new shares on terms and conditions and with any preferences, rights or restrictions as may be determined by our board of directors in its sole discretion, which may dilute our existing shareholders. We may also issue securities that have rights and privileges that are more favorable than the rights and privileges accorded to our existing shareholders.
Under Singapore law, we may only allot and issue new shares with the prior approval of our shareholders in a general meeting. Other than with respect to the issuance of shares pursuant to awards made under our Share Incentive Plan 2014 or Share Option Plan 2014, and subject to the general authority to allot and issue new shares provided by our shareholders annually, the provisions of the Singapore Companies Act and our constitution, our board of directors may allot and issue new shares on terms and conditions and with the rights (including preferential voting rights) and restrictions as they may think fit to impose. Any such offering may be on a pre-emptive or non-pre-emptive basis. Subject to the prior approval of our shareholders for (i) the creation of new classes of shares and the (ii) granting to our directors of the authority to issue new shares with different or similar rights, additional shares may be issued carrying such preferred rights to share in our profits, losses and dividends or other distributions, any rights to receive assets upon our dissolution or liquidation and any redemption, conversion and exchange rights. At the annual general meeting of shareholders held in 2017, or the 2017 AGM, our shareholders granted the board of directors authority (effective until the conclusion of the annual general meeting of shareholders to be held in 2018, or the 2018 AGM, or the expiration of the period by which the 2018 AGM is required to be held) to allot and issue ordinary shares and/or instruments that might or could require ordinary shares to be allotted and issued as authorized by our shareholders at the 2017 AGM and shareholders will be asked to renew this authority at the 2018 AGM. Ansonia, our significant shareholder, may use its ability to control to approve a grant of such authority to our board of directors, or exert influence over, our board of directors to cause us to issue additional ordinary shares, which would dilute existing holders of our ordinary shares, or to issue securities with rights and privileges that are more favorable than those of our ordinary shareholders. There are no statutory pre-emptive rights for new share issuances conferred upon our shareholders under the Companies Act, Chapter 50 of Singapore, or the Singapore Companies Act. Furthermore, any additional issuances of new shares by our directors could adversely impact the market price of our ordinary shares.
56
Risks Related to Taxation
We may be classified as a passive foreign investment company, which could result in adverse U.S. federal income tax consequences to U.S. holders of our ordinary shares.
Based upon, among other things, the valuation of our assets and the composition of our income and assets, we do not believe we were a passive foreign investment company, or PFIC, for U.S. federal income tax purposes for our previous taxable year ended December 31, 2017. However, the application of the PFIC rules is subject to uncertainty in several respects and a separate determination must be made after the close of each taxable year as to whether we were a PFIC for that year. Accordingly, we cannot assure you that we will not be a PFIC for our current, or any future, taxable year. A non-U.S. corporation will be a PFIC for any taxable year if either (i) 75% or more of its gross income for such year is passive income or (ii) 50% or more of the value of its assets (based on an average of the quarterly values of the assets) during such year is attributable to assets that produce passive income or are held for the production of passive income. For this purpose, we will be treated as owning our proportionate share of the businesses and earning our proportionate share of the income of any other business in which we own, directly or indirectly, 25% or more (by value) of the stock. Because the value of our assets for purposes of the PFIC test will generally be determined in part by reference to the market price of our ordinary shares, fluctuations in the market price of the ordinary shares may cause us to become a PFIC. In addition, changes in the composition of our income or assets may cause us to become a PFIC. As a result, dispositions of operating companies could increase the risk that we become a PFIC. For instance, the sale of the Inkia Business and the investment in Qoros by the New Qoros Investor (which reduced our equity interest in Qoros to 24%) each may increase the value of our assets that produce, or are held for the production of, passive income and/or our passive income and result in us becoming a PFIC for our current, and any future, taxable year. If we are a PFIC for any taxable year during which a U.S. Holder (as defined below) holds an ordinary share, certain adverse U.S. federal income tax consequences could apply to such U.S. Holder. For further information on such U.S. tax implications, see “
Item 10.E Taxation—U.S. Federal Income Tax Considerations—Passive Foreign Investment Company.
”
Tax regulations and examinations may have a material effect on us and we may be subject to challenges by tax authorities.
We operate in a number of countries and are therefore regularly examined by and remain subject to numerous tax regulations. Changes in our global mix of earnings could affect our effective tax rate. Furthermore, changes in tax laws could result in higher tax-related expenses and payments. Legislative changes in any of the countries in which our businesses operate could materially impact our tax receivables and liabilities as well as deferred tax assets and deferred tax liabilities. Additionally, the uncertain tax environment in some regions in which our businesses operate could limit our ability to enforce our rights. As a holding company with globally operating businesses, we have established businesses in countries subject to complex tax rules, which may be interpreted in a variety of ways and could affect our effective tax rate. Future interpretations or developments of tax regimes or a higher than anticipated effective tax rate could have a material adverse effect on our tax liability, return on investments and business operations.
In addition, we and our businesses operate in, are incorporated in and are tax residents of various jurisdictions. The tax authorities in the various jurisdictions in which we and our businesses operate, or are incorporated, may disagree with and challenge our assessments of our transactions (including any sales or distributions), tax position, deductions, exemptions, where we or our businesses are tax resident, or other matters. If we, or our businesses, are unsuccessful in responding to any such challenge from a tax authority, we, or our businesses, may be unable to proceed with certain transactions, be required to pay additional taxes, interest, fines or penalties, and we, or our businesses, may be subject to taxes for the same business in more than one jurisdiction or may also be subject to higher tax rates, withholding or other taxes. Even if we, or our businesses, are successful, responding to such challenges may be expensive, consume time and other resources, or divert management’s time and focus from our operations or businesses or from the operations of our businesses. Therefore, a challenge as to our, or our businesses’, tax position or status or transactions, even if unsuccessful, may have a material adverse effect on our business, financial condition, results of operations or liquidity or the business, financial condition, results of operations or liquidity of our businesses.
Our shareholders may be subject to non-U.S. taxes and return filing requirements as a result of owning our ordinary shares.
Based upon our expected method of operation and the ownership of our businesses following the spin-off, we do not expect any shareholder, solely as a result of owning our ordinary shares, to be subject to any additional taxes or additional tax return filing requirements in any jurisdiction in which we, or any of our businesses, conduct activities or own property. However, there can be no assurance that our shareholders, solely as a result of owning our ordinary shares, will not be subject to certain taxes, including non-U.S. taxes, imposed by the various jurisdictions in which we and our businesses do business or own property now or in the future, even if our shareholders do not reside in any of these jurisdictions. Consequently, our shareholders may also be required to file non-U.S. tax returns in some or all of these jurisdictions. Further, our shareholders may also be subject to penalties for failure to comply with these requirements. It is the responsibility of each shareholder to file each of the U.S. federal, state and local, as well as non-U.S., tax returns that may be required of such shareholder.
57
A.
History and Development of the Company
We were formed in 2014 to be the holding company of certain companies that were owned (in whole, or in part) by IC in connection with our spin-off from IC in January 2015. We currently own the following subsidiaries and associated companies:
| · |
a 76% interest in
OPC
,
an owner, developer and operator of power generation facilities in the Israeli power market;
|
| · |
a 24% interest in
Qoros
, a China-based automotive company;
|
| · |
a 32% interest in
ZIM
, a large provider of global container shipping services; and
|
| · |
a 91% interest in
Primus
, an innovative developer and owner of a proprietary natural gas-to-liquids technology process.
|
In connection with our spin-off from IC, we also held a 29% interest in Tower, a NASDAQ- and TASE–listed specialty foundry semiconductor manufacturer. In July 2015, we completed a pro-rata distribution in specie of substantially all of our interest in Tower. In 2016, we sold our remaining interest in Tower.
In December 2017, our wholly-owned subsidiary Inkia sold its power generation and distribution businesses in Latin America and the Caribbean, or the Inkia Business, to an entity controlled by I Squared Capital, an infrastructure private equity firm. For further information on the sale, see “
Item 4.B Business Overview—Discontinued Operations—Inkia Business — Sale of the Inkia Business.
” As a result of this sale, our remaining power generation business consists of its 76% interest in OPC.
We were incorporated in March 2014 under the Singapore Companies Act. Our registered office and principal place of business is located at 1 Temasek Avenue #36-01, Millenia Tower, Singapore 039192. Our telephone number at our registered office and principal place of business is + 65 6351 1780. We have appointed Gornitzky & Co., Advocates and Notaries, as our agent for service of process in connection with certain claims which may be made in Israel.
Our ordinary shares are listed on each of the NYSE and the TASE under the symbol “KEN.” We plan to examine the various considerations in respect of our dual listing and, in particular, the advisability of maintaining or terminating such dual listing. We may, as a result of such examination, delist our ordinary shares from trading on the TASE pursuant to the Securities Law of Israel, 5728—1968. In the event we do decide to delist our ordinary shares from trading on the TASE, we have undertaken to publish an Immediate Report with the TASE pursuant to Israeli Securities regulations no less than 9 months prior to the delisting.
B.
Business Overview
We are a holding company that operates dynamic, primarily growth-oriented, businesses. The companies we own, in whole or in part, are at various stages of development, ranging from established, cash generating businesses to early stage companies.
58
We were established in connection with a spin-off of our businesses from IC to promote the growth and development of our primary businesses, and we are primarily engaged in the operation of the following businesses: (i) OPC, an owner, developer and operator of power generation facilities in Israel, in which we have a 76% equity interest, and (ii) Qoros, a China-based automotive company in which we have a 24% equity interest following the completion of the New Qoros Investor investment.
Our strategy is to realize the value of our businesses for our shareholders. In connection with this strategy, we will support the development of our business and we may provide our shareholders with direct access to our businesses, which may include spin-offs, listings, offerings, distributions or monetization of our businesses. To the extent we monetize our businesses (i.e., through offerings or sales), we may distribute the proceeds derived from such transactions to our shareholders.
We have implemented a number of steps in furtherance of our strategy in 2017 and early 2018 for our primary businesses, including:
| · |
IC Power:
we completed an IPO and listing of our OPC business in Israel and sold our businesses in Latin America and the Caribbean:
|
| o |
OPC IPO:
In August 2017, OPC completed an initial public offering in Israel, and a listing on the TASE, resulting in net proceeds to OPC of approximately $100 million and Kenon retaining a 76% stake; and
|
| o |
Sale of IC Power’s Inkia Businesses:
In December 2017, we sold IC Power's power distribution and generation businesses in Latin America and the Caribbean for consideration of $1,332 million (subject to final closing adjustments), of which $175 million was deferred. The proceeds were used to repay debt and pay taxes and other expenses, and to fund a distribution to Kenon shareholders of $665 million.
|
| · |
Qoros:
In 2017, we reduced our guarantee exposure to Qoros and in early 2018 we announced the completion of
a transaction
to facilitate a new investment in Qoros:
|
| o | Reduction of Guarantees: In addition to the reduction in our proportionate guarantees resulting from the new investment in January 2018 described below, we also entered into a series of transactions in 2017 with our joint venture partner, Chery, which reduced the maximum amount of our guarantee obligations in respect of Qoros debt from RMB850 million as of December 31, 2017 to RMB320 million, with respect to debt in principal of RMB288 million; and |
| o |
New Investor in Qoros:
In January 2018, Kenon announced the New Qoros Investor completed a transaction to purchase 51% of Qoros from Kenon and Chery for RMB3.315 billion (approximately $526 million), which is part of an investment structure to invest a total of approximately RMB6.63 billion (approximately $1,052 million) by the New Qoros Investor of which RMB6.5 billion will ultimately be invested in Qoros’ equity. As a result, Kenon and Chery now have 24% and 25% stakes in Qoros, respectively; the transaction provides significant liquidity to Qoros and contemplates
the repayment of
existing shareholder loans owing from
Qoros to
Kenon. The agreement also gives Kenon a put option to sell some or all of its remaining interest in Qoros to the New Qoros Investor for consideration of up to $4
95
million (subject to adjustments).
|
We also hold interests in:
| · |
ZIM
, a large provider of global container shipping services, which, as of December 31, 2017 operated 81 (owned and chartered) vessels with a total container capacity of 385,974 TEUs, and in which we have a 32% equity interest; and
|
| · |
Primus
, an innovative developer and owner of a proprietary natural gas-to-liquid technology process, in which we have a 91% equity interest.
|
59
We continue to assess our options with respect to ZIM and Primus. We do not intend to make further investments in ZIM. Nevertheless, if a strategic opportunity arises that would require an investment to facilitate a transaction that will benefit Kenon shareholders, we may consider such a transaction.
As we execute our strategy, we intend to operate under disciplined capital allocation principles designed to ensure the prudent use of our capital. We intend to refrain from acquiring interests in new companies outside our existing businesses. We do not intend to materially “cross-allocate” proceeds received in connection with distributions or sales of our interests in any of our businesses, among our other businesses.
Our strategy set forth above is designed to promote the growth and development of our primary businesses, maximize value for our shareholders and ensure the prudent use of our capital. However, we will be required to make determinations over time that will be based on the facts and circumstances prevailing at such time, as well as continually evolving market conditions and outlook. As a result, we will be required to exercise significant judgment while seeking to adhere to these capital allocation principles in order to maximize value for our shareholders and further the development of our businesses.
Our Businesses (Continuing Operations)
Set forth below is a description of our businesses (continuing operations).
OPC
OPC, which accounted for 100% of our revenues in the year ended December 31, 2017, is an owner, developer and operator of power generation facilities located in Israel.
OPC-Rotem, in which OPC has an 80% equity interest, operates a conventional combined cycle power plant in Mishor Rotem, Israel, with an installed capacity of 466 MW (based on OPC-Rotem's generation license). The power plant utilizes natural gas, with diesel oil as backup.
OPC-Hadera, a wholly-owned subsidiary of OPC, operates steam boilers and turbines with an installed capacity of up to 18 MW in Hadera. In June 2016, OPC-Hadera commenced construction of the OPC-Hadera plant, a cogeneration power station in Israel, which is expected to have a capacity of up to 148 MW, and is expected to reach its COD by first half of 2019. OPC expects that the total cost of completing the OPC-Hadera plant (including the consideration for the original acquisition of OPC-Hadera) will be approximately NIS 1 billion (approximately $288 million). As of December 31, 2017, OPC-Hadera had
completed approximately 83% of the project and
invested approximately NIS 56
2
million (approximately
$162
million) in the project.
In April 2017, OPC entered into agreements (including an option agreement) for the acquisition of 95% of the shares of Tzomet Energy Ltd., which is developing a natural gas-fired power station in Israel with capacity of approximately 396 MW, for total consideration of $23 million, subject to adjustment. In August 2017, the EA received a letter from the
from the Israel Concentration Committee
stating that it believed that, for reasons of broad economy concentration (i.e. taking into account businesses owned by related entities of Kenon's controlling shareholder), OPC should not be granted a contingent license for the construction of the planned facility. In March 2018, OPC completed the acquisition of 95% of the shares of Tzomet Energy, although Tzomet still requires (among other requirements) a license from the EA to proceed with construction of the planned facility.
The total consideration for the acquisition is estimated at approximately $23 million, subject to certain adjustments, of which $3.65 million was paid in March 2018, an additional $3.65 million is expected to be paid in the second quarter of 2018, and the remaining consideration will be paid at financial closing of the Tzomet project.
For risks related to OPC's expansion, see "
Item 3.D Risk Factors—Risks Related to OPC—
OPC faces risks in connection with the expansion of its business.
"
60
In August 2017, OPC completed an initial public offering in Israel, and a listing on the TASE, resulting in net proceeds to OPC of approximately $100 million and Kenon retaining 76% stake. The OPC shares owned by Kenon are subject to an 18-month lock up from the IPO date in August 2017 in accordance with regulations of the Tel Aviv Stock Exchange. The lock up permits sales of up to 2.5% of the OPC shares held by Kenon for each month starting the fourth month after the IPO; starting the seventh month after the IPO
,
sales are permitted to a person who becomes subject to the lock-up restriction. Shares released from the lock-up restricted are deposited into the pledge account in respect of the sale of the Inkia Business until the full amount of shares is deposited into that account. For further information on Kenon's pledge of OPC shares, see “
Item 3.B Business Overview—Discontinued Operations—Inkia Business—Sale of the Inkia Business—Pledge Agreement with respect to OPC Shares.
”.
OPC has recently begun initiating projects in the field of power generation using photovoltaic technology, through OPC Solar, a wholly-owned subsidiary of OPC. These ventures are in a preliminary stage, and OPC does not currently have active projects for the generation of electricity with photovoltaic technology.
The following table sets forth summary operational information regarding each of OPC’s operating companies as of December 31, 2017:
|
Country
|
Entity
|
Ownership Percentage (Rounded)
|
Fuel
|
Installed Capacity (MW)
|
Type of
Asset |
||||||||
|
Israel
|
OPC-Rotem
|
80
|
%
|
Natural Gas and Diesel
|
466
|
Greenfield
|
|||||||
|
Israel
|
OPC-Hadera
|
100
|
%
|
Natural Gas and Diesel
|
18
|
Acquired
|
|||||||
|
Total Operating Capacity
|
484
|
||||||||||||
The weighted average remaining life of OPC’s PPAs based on firm capacity, as of December 31, 2017, is approximately seven years
.
For OPC-Rotem, this reflects the weighted average remaining life of its PPAs with end users based on OPC’s firm capacity. The IEC PPA (as defined below), which extends for a 20-year term, provides OPC-Rotem with the option to allocate and sell the generated electricity of the power station directly to end users. OPC-Rotem has exercised this option and sells all of its energy and capacity directly to 23 end users, as of the date of this report. For further information on the IEC PPA, see “
—Regulatory, Environmental and Compliance Matters.
”
Industry Overview
Overview of Israeli Electricity Generation Industry
According to the Israel Central Bureau of Statistics, Israel had a population of approximately 8.8 million as of December 31, 2017. Israeli GDP grew by 3%, 4% and 2.6% in 2017, 2016 and 2015, respectively.
Israel’s power generation units primarily utilize fossil fuels. Most of the activity of power generation in Israel is carried out by the state-owned IEC. However, in recent years the market share of private producers has been increasing in light of the Israeli government policy to allow competition in the electricity market.
61
The following tables feature data on the share of private electricity producers and the IEC in the electricity market in 2015 and 2016, as published by the EA
1
:
|
December 31, 2016
|
December 31, 2015
|
||||
|
Installed Capacity (MW)
|
% of Total Installed Capacity in the Market
|
Installed Capacity (MW)
|
% of Total Installed Capacity in the Market
|
||
|
IEC
|
13,617
|
77%
|
13,617
|
78%
|
|
|
Private electricity producers (without renewable energy)
|
3,077
|
17%
|
3,065
|
18%
|
|
|
Renewable energy (private electricity producers)
|
971
|
6%
|
679
|
4%
|
|
|
Private electricity producers (including renewable energy)
|
4,048
|
23%
|
3,743
|
22%
|
|
|
Total in the market
|
17,665
|
100%
|
17,360
|
100%
|
|
|
Energy generated (thousands of MWh)
|
% of total generated in the market
|
Energy generated (thousands of MWh)
|
% of total energy generated in the market
|
||
|
IEC
|
45,544
|
68%
|
50,641
|
77%
|
|
|
Private electricity producers (without renewable energy)
|
20,102
|
30%
|
13,496
|
21%
|
|
|
Renewable energy (private electricity producers)
|
1,745
|
2%
|
1,276
|
2%
|
|
|
Private electricity producers (including renewable energy)
|
21,847
|
32%
|
14,772
|
23%
|
|
|
Total in the market
|
67,391
|
100%
|
65,413
|
100%
|
|
1. Based on the Report on Electricity Market 2016 and the database for assessment, as published by the EA.
Sales of IPPs are generally made on the basis of PPAs for the sale of energy to customers, with prices predominantly linked to the tariff issued by the EA and denominated in NIS. The EA operates a “Time of Use” tariff, which provides different energy rates for different seasons (e.g., summer and winter) and different periods of time during the day. Within Israel, the price of energy varies by season and demand period, with tariffs varying based upon the season—summer (July, August), winter (January, February, December) and transition (March-June, September-November)—and demand (peak, shoulder and off-peak).
62
The following tables set forth the consumption blocks for each of the seasons set forth below, as of January 1, 2018:
|
Hours per Consumption Block
1
|
||||||||||||
|
Winter
|
Transition
|
Summer
|
||||||||||
|
(Hours)
|
||||||||||||
|
Peak
|
410
|
1,932
|
315
|
|||||||||
|
Shoulder
|
206
|
946
|
315
|
|||||||||
|
Off-Peak
|
1,544
|
2,234
|
858
|
|||||||||
| (1) |
The hours per consumption block may vary due to changes in the dates of weekdays, weekends and public holidays.
|
For information on the risks associated with the indexation of OPC’s revenues and cost of sales to the EA’s generation component tariff and its potential impact on OPC’s business, financial condition and results of operations, see “
Item 3.D Risk Factors—Risks Related to OPC—
Changes in the EA’s electricity rates may reduce OPC’s profitability
.
”
As of December 31, 2016, the installed capacity of the Israeli market (IEC and IPPs, excluding renewable technologies) was 16,694 MW, and 17,665 MW, including renewable technologies. According to Bank of Israel’s and IEC projections, the demand for electricity in Israel is expected to grow at an annual rate of 2.3%-2.8% in coming years.
IEC has been classified by the Electricity Sector Law as an “essential service provider” and, as such, is subject to basic obligations concerning the proper management of the Israeli power utility market. These obligations include the filing of development plans, management of Israel’s power system, management of Israel’s power transmission and distribution systems, provision of backup and infrastructure services to IPPs and consumers, and the purchase of power from IPPs. IEC also transmits all of the electricity in Israel.
For further information on Israel’s regulatory environment, see “—
OPC’s Description of Operations—Regulatory, Environmental and Compliance Matters
.” For information on the risks related to changes in Israel’s regulatory environment, see “
Item 3.D Risk Factors—Risks Related to OPC—
Changes in the EA’s electricity rates may reduce OPC’s profitability
.
”
OPC’s Description of Operations
OPC’s portfolio includes power generation plants that operate on natural gas and diesel. As of December 31, 2017, OPC’s installed capacity was up to 484 MW.
OPC’s first power plant, OPC-Rotem, a combined cycle power plant with an installed capacity of 466 MW (based on OPC-Rotem’s generation license), commenced commercial operations in Mishor Rotem, Israel in July 2013. The power plant utilizes natural gas, with diesel oil as backup. OPC has an 80% equity interest in OPC-Rotem.
OPC-Hadera, a wholly-owned subsidiary of OPC, operates steam boilers and turbine with an installed capacity of 18 MW
in Hadera. In June 2016, OPC-Hadera commenced construction of a cogeneration power station in Israel, which is expected to have a capacity of up to 148 MW, and is expected to reach its COD in the first half of 2019. OPC expects that the total cost of completing the OPC-Hadera plant (including the consideration for the original acquisition of OPC-Hadera) will be approximately NIS 1 billion (approximately $288 million) (including the consideration for the original acquisition of OPC-Hadera). As of December 31, 2017, OPC-Hadera had completed approximately 83% of the project and invested approximately NIS 562 million (approximately $162 million) in the project.
In April 2017, OPC entered into agreements (including an option agreement) for the acquisition of 95% of the shares of Tzomet Energy Ltd., which is developing a natural gas-fired power station in Israel with capacity of approximately 396 MW, for total consideration of $23 million, subject to adjustment. In August 2017, the EA received a letter from the from the Israel Concentration Committee stating that it believed that, for reasons of broad economy concentration (i.e. taking into account businesses owned by related entities of Kenon's controlling shareholder), OPC should not be granted a contingent license for the construction of the planned facility. In March 2018, OPC completed the acquisition of 95% of the shares of Tzomet Energy, although Tzomet still requires (among other requirements) a license from the EA to proceed with construction of the planned facility. The total consideration for the acquisition is estimated at approximately $23 million, subject to certain adjustments, of which $3.65 million was paid in March 2018, an additional $3.65 million is expected to be paid in the second quarter of 2018, and the remaining consideration will be paid at financial closing of the Tzomet project. For risks related to OPC's expansion, see "
Item 3.D Risk Factors—Risks Related to OPC—
OPC faces risks in connection with the expansion of its business.
"
63
OPC has recently begun initiating projects in the field of power generation using photovoltaic technology, through OPC Solar, a wholly-owned subsidiary of OPC. These ventures are in a preliminary stage, and OPC does not currently have active projects for the generation of electricity with photovoltaic technology.
The following table sets forth summary financial information for OPC for the year ended December 31, 2017:
|
Year Ended December 31, 2017
|
||||||||||||||||||||||
|
Sales
|
Cost of Sales
|
Net Income
|
EBITDA
1
|
Outstanding Debt
2
|
Net Debt
3
|
|||||||||||||||||
|
($ millions)
|
||||||||||||||||||||||
|
$
|
365
|
$
|
266
|
$
|
14
|
$
|
86
|
$
|
618
|
$
|
395
|
|||||||||||
| (1) |
“EBITDA” is a non-IFRS measure. For a reconciliation of OPC’s income (loss) to its EBITDA, see footnote 1 to the first table in “
Item 3.A Selected Financial Data—Selected Reportable Segment Data—OPC
” setting forth the selected financial data for the year ended December 31, 2017.
|
| (2) |
Includes short-term and long-term debt and excludes loans and notes owed to a parent company.
|
| (3) |
“Net debt” is not a measure recognized under IFRS. For a reconciliation of total debt to net debt for OPC and its businesses as of December 31, 2017 see footnote 2 to the first table in in “
|
The following table sets forth summary financial information for OPC for the year ended December 31, 2016:
|
Year Ended December 31, 2016
|
||||||||||||||||||||||
|
Sales
|
Cost of Sales
|
Net Income
|
EBITDA
1
|
Outstanding Debt
2
|
Net Debt
3
|
|||||||||||||||||
|
($ millions)
|
||||||||||||||||||||||
|
$
|
324
|
$
|
251
|
$
|
20
|
$
|
67
|
$
|
417
|
$
|
371
|
|||||||||||
| (1) |
“EBITDA” is a non-IFRS measure. For a reconciliation of OPC’s income (loss) to its EBITDA, see footnote 1 to the first table in “
Item 3.A Selected Financial Data—Selected Reportable Segment Data—OPC
” setting forth the selected financial data for the year ended December 31, 2017.
|
| (2) |
Includes short-term and long-term debt and excludes loans and notes owed to a parent company.
|
| (3) |
“Net debt” is not a measure recognized under IFRS. For a reconciliation of total debt to net debt for OPC and its businesses as of December 31, 2017 see footnote 2 to the first table in “
Item 3.A Selected Financial Data— Selected Reportable Segment Data—OPC
” setting forth the selected financial data for the year ended December 31, 2017.
|
The following table sets forth summary financial information for OPC for the year ended December 31, 2015:
|
Year Ended December 31, 2015
|
||||||||||||||||||||||
|
Sales
|
Cost of Sales
|
Net Income
|
EBITDA
1
|
Outstanding Debt
2
|
Net Debt
3
|
|||||||||||||||||
|
($ millions)
|
||||||||||||||||||||||
|
$
|
326
|
$
|
245
|
$
|
22
|
$
|
79
|
$
|
473
|
$
|
289
|
|||||||||||
| (1) |
“EBITDA” is a non-IFRS measure. For a reconciliation of OPC’s income (loss) to its EBITDA, see footnote 1 to the first table in “
Item 3.A Selected Financial Data—Selected Reportable Segment Data—OPC
” setting forth the selected financial data for the year ended December 31, 2017.
|
| (2) |
Includes short-term and long-term debt.
|
| (3) |
“Net debt” is not a measure recognized under IFRS. For a reconciliation of total debt to net debt for OPC and its businesses as of December 31, 2017 see footnote 2 to the first table in “
|
64
The following table sets forth summary operational information for OPC as of and for the year ended December 31, 2017:
|
Entity
|
Installed
Capacity (MW) 1 |
Net
energy generated (GWh) |
Availability
factor (%) |
|||||||||
|
OPC-Rotem
|
466
|
3,576
|
94
|
%
|
||||||||
|
OPC-Hadera
|
18
|
79
|
89
|
%
|
||||||||
|
OPC Total
|
484
|
3,655
|
||||||||||
The following table sets forth summary operational information for OPC as of and for the year ended December 31, 2016:
|
Entity
|
Installed
Capacity (MW) |
Net
energy generated (GWh) |
Availability
factor (%) |
|||||||||
|
OPC-Rotem
|
466
|
3,422
|
91
|
%
|
||||||||
|
OPC-Hadera
|
18
|
88
|
95
|
%
|
||||||||
|
OPC Total
|
484
|
3,510
|
||||||||||
The following summaries provide a description of OPC’s businesses.
OPC-Rotem
OPC has an 80% stake in OPC-Rotem. The remaining 20% is held by Veridis, which is owned by Oaktree Capital Management, an investment management firm. In March 2018, Delek Automotive Systems Ltd., or Delek Automotive, announced that it had entered into an agreement with Oaktree Capital Management and minority shareholders for the acquisition of the control of Veridis by Delek Automotive, together with several entities of the Harel Insurance Group, subject to the fulfillment of suspending conditions set out in the agreement. OPC-Rotem commenced operations in July 2013 in Mishor Rotem industrial zone in the south of Israel. The OPC-Rotem plant was constructed for an aggregate cost of approximately $508 million. OPC-Rotem’s plant has a capacity of 466 MW (based on OPC-Rotem’s generation license), representing, together with the Energy Center, approximately 2.7% of the total installed capacity and approximately 12% of the total installed capacity provided by IPPs in Israel as of December 31, 2016 (including renewables).
OPC-Rotem purchases natural gas from the Tamar Group, pursuant to a natural gas supply agreement that expires upon the earlier of June 2029 or the date on which OPC-Rotem consumes the entire contractual capacity. The EA’s generation component tariff is the base for the natural gas price linkage formula in the agreement between OPC-Rotem and the Tamar Group. According to the agreement with the Tamar Group, OPC-Rotem has the option to decrease the daily contractual gas amount to a specific amount set forth in the agreement, such that the minimum consumption from the Tamar Group constitutes 50% of the average gas consumption in the three years preceding the notice of the option exercise.
In December 2017, OPC-Rotem signed an agreement for the purchase of natural gas with Energean Israel Ltd., or Energean. Pursuant to this agreement, OPC-Rotem will purchase from Energean 5.3 billion m
3
of natural gas over a period of fifteen years (subject to adjustments based on their actual consumption of natural gas)
or until the date of consumption of the full contractual quantity
, commencing at the commercial operation date of the Energean natural gas reservoir. According to disclosure made by Energean, the supply of gas is currently expected to commence in 2021, but there is no guarantee that the gas supply will be available by such date. For further information on OPC-Rotem’s gas supply agreements, see “—
OPC’s Raw Materials and Suppliers.
”
OPC-Rotem has a PPA with IEC, the government-owned electricity generation, transmission and distribution company in Israel, or the IEC PPA. The term of the IEC PPA lasts until 20 years after the power station’s COD. According to the agreement, OPC-Rotem is entitled to operate in one of the following two ways (or a combination of both with certain restrictions set in the agreement): (1) provide the entire net available capacity of its power station to IEC or (2) carve out energy and capacity for direct sales to private consumers, and OPC-Rotem has accordingly allocated the entire capacity of the plant to private consumers since COD, and OPC-Rotem has accordingly allocated the entire capacity of the plant to private consumers since COD. As a result, as of the date of this report, OPC-Rotem supplies energy to 23 end users according to long-term PPAs. In addition, OPC-Rotem from time to time enters short-term PPAs that give OPC flexibility in the sale of electricity to these customers (i.e. OPC may suspend from time to time the sale of electricity under these agreements). Under the IEC PPA, OPC-Rotem can also elect to revert back to supplying to IEC instead of private customers, subject to twelve months’ advance notice
65
Mitsubishi provides the long-term servicing of the power station, for a term of 100,000 hours of operation,
or until the date on which 8 planned gas turbine treatments are completed (OPC estimates that this is a period of 12 years).
OPC has entered into a shareholders’ agreement which grants minority rights to OPC’s minority shareholder. For further information on OPC’s shareholders’ agreements, see “—
Shareholders’ Agreements.
”
OPC-Hadera
In August 2015, OPC acquired 100% of the shares of OPC-Hadera from Hadera Paper, a large paper and paper product manufacturer in Israel. The consideration for the transaction was NIS 60 million. OPC-Hadera, which currently operates an 18 MW plant, holds a conditional license for the construction of a cogeneration power station in Israel. OPC-Hadera commenced construction of the plant in June 2016. OPC expects that the total cost of completing the OPC-Hadera plant (including the consideration for the acquisition of OPC-Hadera) will be approximately NIS 1 billion (approximately $288 million), based upon a plant with up to 148 MW of capacity.
In January 2016, OPC-Hadera entered into an EPC contract in an amount equivalent to approximately $156 million with SerIDOM Servicios Integrados IDOM, S.A.U, or IDOM, for the design, engineering, procurement and construction of the cogeneration power plant (including amendments to the agreement that were subsequently signed). The consideration is payable upon achievement of certain milestones. The agreement contains a mechanism for the compensation of OPC-Hadera in the event that IDOM fails to meet its contractual obligations under the agreement. Furthermore, IDOM has provided bank guarantees and a corporate guarantee by its parent company to secure its obligations and OPC has provided IDOM a guarantee to secure part of OPC-Hadera’s liabilities.
The OPC-Hadera plant is expected to reach its COD in the first half of 2019. As of December 31, 2017, OPC-Hadera had
completed approximately 83% of the project and
invested approximately NIS 56
2
million (approximately $
162
million) in the project. In July 2016, OPC-Hadera entered into a NIS 1 billion loan agreement to finance the construction of the OPC-Hadera plant. Approximately 80% of the financing consists of long-term facility intended to cover the cost of construction and the remaining 20% consists of additional facilities. As of December 31, 2017, following financial closing, OPC made drawings under the loan agreement, in a total amount of NIS 494 million, of which two thirds of the amount is CPI-linked and one third is not CPI-linked. For further information on the OPC-Hadera financing, see “
Item 5.B Liquidity and Capital Resources—OPC’s Liquidity and Capital Resources—OPC’s Material Indebtedness—OPC-Hadera Financing.
”
OPC-Hadera’s power plant is expected to supply the electricity and steam needs of Hadera Paper’s facility as well as to provide electricity to private customers in Israel. The power plant will operate using natural gas as its energy source, and diesel oil as backup. As a cogeneration plant which supplies electricity and steam in a single production process, based on the construction contractor’s estimates OPC-Hadera’s power plant is expected to have a relatively high level of energy utilization. The efficiency of the Hadera station is expected to be approximately 74.5% when steam is supplied to Hadera Paper, and 54.5% when steam is not produced.
In June 2015, OPC-Hadera entered into an agreement with Hadera Paper for OPC-Hadera’s supply of electricity and steam from the OPC-Hadera power plant under construction to Hadera Paper’s facility for a period of 18 years from the date the power plant reaches its COD. Pursuant to this agreement, Hadera Paper will acquire all of its electricity and steam needs from OPC-Hadera. The agreement provides minimum quantity of steam to be purchased by Hadera Paper (ToP level), which will be subject to adjustment. Until OPC-Hadera reaches its COD, OPC-Hadera will supply steam and electricity to Hadera Paper using the energy center purchased from Hadera Paper and OPC-Rotem will supply the residual energy. In 2012, Hadera Paper entered into an agreement with the Tamar Group for the supply of natural gas, which has been assigned to OPC-Hadera. The gas supply agreement expires upon the earlier of April 2028 or the date on which OPC-Hadera consumes the entire contractual capacity. Both contracting parties have the option to extend the agreement, under certain conditions. The price of gas is linked to the weighted average of the generation component tariff published by the EA, and it is also subject to a price floor. According to the agreement, the gas shall be supplied on a firm basis, and includes a “take-or-pay” obligation, or TOP, by OPC-Hadera, In addition, according to the agreement, OPC-Hadera has the option to effectively reduce the purchased gas quantities by approximately 50%, subject to certain conditions
66
In September 2016, OPC-Hadera entered into another gas supply agreement with the Tamar Group. The gas supply agreement will expire at the earlier of fifteen years following the OPC-Hadera plant’s COD date or on the date on which OPC-Hadera consumes the entire contractual capacity. Both contracting parties have the option to extend the agreement, under certain conditions. The price of gas is linked to the weighted average of the generation component tariff published by the EA, and it is also subject to a price floor
According to the agreement, the gas will be supplied on an interruptible basis, and the Tamar Group shall not be responsible for failures in the requested gas supply levels. At the same time, the Tamar Group may decide to switch the supply to a firm basis. In the event of such a decision and from the date of the change in supply mechanism, Hadera will be subject to a TOP obligation. OPC-Hadera also has the option to sell gas surpluses to other customers, including related parties, subject to limitations. Furthermore, OPC-Hadera has the option to terminate the agreement at its sole discretion, within three years starting December 2016.
In December 2017, OPC-Hadera signed an agreement for the purchase of natural gas with Energean. Pursuant to this agreement, OPC-Hadera will purchase from Energean 3.7 billion m
3
of natural gas for a period of fifteen years (subject to adjustments based on their actual consumption of natural gas)
or until the date of consumption of the full contractual quantity
, commencing at the commercial operation date of the Energean natural gas reservoir. For further information on OPC-Hadera's gas supply agreements, see "—
OPC's Raw Materials and Suppliers.
"
In connection with the acquisition, Hadera Paper sold its energy center, consisting of certain equipment that it uses to produce steam, and up to 18 MW of additional capacity (and 7 MW that are not active), within its manufacturing plant to OPC-Hadera. OPC-Hadera will also lease from Hadera Paper the land on which the power generation plant is located for a period of 20 years from the OPC-Hadera plant’s COD. OPC-Hadera is also expected to sell its residual electricity to other end users.
Potential Expansions
In March 2014, OPC, through one of its subsidiaries, was awarded a tender published by the Israel Land Authority to lease a 5.5 hectare plot of land adjacent to the OPC-Rotem site. Entry into the lease agreement is subject to receipt of the required approvals, including the approval of the Israel Land Council, which has not yet been received. In April 2017, OPC was authorized by the Israeli Government to
promote
zoning for a gas fired power station with a capacity of up to 530MW
located on the land adjacent to OPC-Rotem
.
In April 2017,
OPC was also authorized by the Israeli Government to
promote
zoning for a gas-fired power station of up to 800 MW of installed capacity on land owned by Hadera Paper near the Hadera power station. OPC-Hadera has entered into an
option
agreement with Hadera Paper to
lease
the relevant land. However, there is no guarantee that OPC will pursue either of these expansion projects, or be able to proceed with either of these expansion projects.
OPC’s Raw Materials and Suppliers
OPC’s power facilities utilize natural gas as primary fuel, and diesel for backup.
OPC-Rotem
and OPC-Hadera have entered into gas supply agreements with the
e Tamar Group, composed of Noble Energy Mediterranean Ltd., Delek Drilling Limited Partnership, Isramco Negev 2 Limited Partnership, Dor Gas Exploration Limited Partnership, Everest Infrastructures Limited Partnership and Tamar Petroleum Limited Partnership, or collectively,
for the purchase of natural gas
.
For further information on these agreements see “
—OPC’s Description of Operations—OPC-Rotem
” and “
OPC’s Description of Operations—OPC Hadera
.”
The price that OPC-Rotem pays to the Tamar Group for the natural gas supplied is based upon a base price in NIS set on the date of the agreement, indexed to changes in the EA’s generation component tariff, , and partially indexed (30%) the U.S. Dollar representative exchange rate. The price that OPC-Hadera pays to the Tamar Group is based upon a base price in US$, indexed to changes in the EA’s generation component tariff. As a result, increases or decreases in the EA’s generation tariff have a related effect on OPC-Rotem’s and OPC-Hadera’s cost of sales and margins. In addition, the natural gas price formulas in OPC-Rotem’s and OPC-Hadera’s supply agreements are subject to a floor price mechanism, which is denominated in US$ for both OPC-Rotem and OPC-Hadera.
As a result of previous declines in the EA’s generation component tariff, OPC-Rotem and OPC-Hadera began to pay the ultimate floor price in November 2015 and April 2016, respectively. Therefore, declines in the EA generation component tariff may not have a corresponding decline in OPC-Rotem’s natural gas expenses, due to the floor price mechanism. and may lead to a decline in OPC-Rotem’s margins, which may have a material adverse effect on OPC’s business, results of operations and financial condition. For information on the risks associated with the impact of the EA’s generation tariff on OPC’s supply agreements with the Tamar Group, see “
Item 3.D Risk Factors—Risks Related to OPC—Changes in the EA’s electricity rates may reduce OPC’s profitability.
”
67
In January 2018, the EA published the electricity tariffs for 2018, which included an increase of the EA’s generation component tariff by 6.7%. As a result, OPC-Rotem and OPC-Hadera’s gas prices may rise above their ultimate floor prices.
In December 2017, OPC-Rotem and OPC-Hadera signed agreements for the purchase of natural gas with Energean. Pursuant to these agreements (which contain take-or-pay commitments), OPC-Rotem and OPC-Hadera will collectively purchase from Energean 9 billion m
3
of natural gas over a period of fifteen years (subject to adjustments based on their actual consumption of natural gas), or until the date of consumption of the full contractual quantity, commencing at the commercial operation date of the Energean natural gas reservoir.
According to a disclosure made by Energean, the supply of gas is currently expected to commence in 2021, but there is no guarantee that the gas supply will be available by such date.
OPC’s Competition
Within Israel, OPC’s major competitors are IEC and private power generators, such as Dorad Energy Ltd. and Dalia, who, as a result of recent government initiatives encouraging investments in the Israeli power generation market, have constructed, and are constructing, power stations with significant capacity. The key private producers competing with OPC are presented in the table below.
|
Name
|
Power Station Technology
|
Approximate Capacity (MW)
|
Commercial Operating Date
|
|
Dorad
|
Conventional
|
860
|
May 2014
|
|
Mashav
|
Conventional
|
120
|
April 2014
|
|
Dalia – Unit 1
1
|
Conventional
|
450
|
July 2015
|
|
Dalia – Unit 2
1
|
Conventional
|
450
|
September 2015
|
|
Ashdod Energy
|
Cogeneration
|
60
|
October 2015
|
|
Ramat Negev Energy
|
Cogeneration
|
120
|
January 2016
|
|
Sugat
|
Cogeneration
|
70
|
Under construction
|
|
Alon Tabor
|
Cogeneration
|
70
|
Under construction
|
|
Ramat Gabriel
|
Cogeneration
|
70
|
Under construction
|
|
Paz Ashdod
|
Cogeneration
|
100
|
July 2013
|
|
Delek Sorek
|
Conventional
|
140
|
July 2016
|
|
DSW
|
Cogeneration
|
230
|
Under construction
|
|
IPM Beer Tuvia
|
Conventional
|
450
|
Under construction
|
| (1) |
To OPC’s knowledge, approximately 70% of Dalia’s total installed output (Unit 1 and Unit 2) is assigned to the IEC, and only 30% is assigned to private customers.
|
68
OPC’s Seasonality
Revenues from the sale of electricity are seasonal and impacted by the “Time of Use” tariffs published by the Electricity Authority. The seasons are divided into three, as follows: (a) summer – July and August; (b) winter – December, January and February; (c) transitional seasons – March to June and September to November.
The following table provides a schedule of the weighted
EA’s Generation Component
rates for 2018 based on seasons and demand hours, published by the Electricity Authority.
|
Season
|
Demand Hours
|
Weighted
Generation Component tariff
(NIS AGOROT per
K
wh)
|
|
Winter
|
Off-peak
|
20.84
|
|
Shoulder
|
40.42
|
|
|
Peak
|
70.57
|
|
|
Transition
|
Off-peak
|
17.8
|
|
Shoulder
|
22.75
|
|
|
Peak
|
29.31
|
|
|
Summer
|
Off-peak
|
17.59
|
|
Shoulder
|
28.54
|
|
|
Peak
|
74.01
|
|
|
Weighted Average Rate
|
28.16
|
|
In general, tariffs in the summer and winter are higher than during transitional seasons. The cost of acquiring gas, which is the primary cost of OPC, is not influenced by the tariff seasonality. Therefore, the profitability of power producers, including
OPC-
Rotem and
OPC-
Hadera, is generally higher in the summer and winter months compared to the remainder of the year.
For further information on the seasonality of tariffs in Israel, see “
—Industry Overview—
Overview of Israeli Electricity Generation Industry.
”
The following table provides a summary of OPC’s revenues
from the sale of electricity
, by season (these figures have not been audited or reviewed) (in $ millions):
|
2016
|
2017
|
|
|
Summer (2 months)
|
62
|
70
|
|
Winter (3 months)
|
87
|
99
|
|
Transitional Seasons (7 months)
|
160
|
181
|
|
Total for the year
|
309
|
350
|
69
OPC’s Property, Plants and Equipment
The following table provides certain information regarding OPC’s power plants, as of December 31, 2017:
|
Company/Plant
|
Location
|
Installed Capacity
|
Fuel Type
|
||||
|
(MW)
|
|||||||
|
Operating Companies
|
|||||||
|
OPC-Rotem
|
Mishor Rotem, Israel
|
466
|
Natural gas and diesel (combined cycle)
|
||||
|
OPC-Hadera
1
|
Hadera, Israel
|
18
|
2
|
Natural gas and diesel
|
|||
| (1) |
OPC-Hadera also holds a conditional license for the construction of a cogeneration power station in Israel, based upon a plant with up to 148 MW of capacity. Construction commenced in June 2016 and COD is expected in the first half 2019.
|
| (2) |
OPC-Hadera's generation license refers to an installed capacity of 25 MW, representing an 18 MW and 7 MW unit. The 7 MW steam turbine reflected in OPC-Hadera's license is not active, and therefore OPC-Hadera's installed capacity is only 18 MW.
|
For further information regarding OPC’s plants, see “—
OPC’s Description of Operations.
”
OPC leases its principal executive offices in Israel. OPC owns all of its power generation facilities.
As of December 31, 2017, the consolidated net book value of OPC’s property, plant and equipment was $630 million.
Insurance
OPC and its subsidiaries hold various insurance policies in order to reduce the damage for various risks, including “all-risks” insurance. However the existing insurance policies maintained by OPC and its subsidiaries may not cover certain types of damages or may not cover the entire scope of damage caused. In addition, OPC may not be able to obtain insurance on comparable terms in the future. OPC and its subsidiaries may be adversely affected if they incur losses that are not fully covered by their insurance policies
Employees
As of December 31, 2017, OPC had a total of 88 employees, of which 51 employees are in the operations division, and 37 are at OPC’s headquarters. Substantially all of OPC’s employees are employed on a full-time basis.
70
The table below sets forth breakdown of employees by main category of activity as of the dates indicated:
|
As of December 31,
|
||||||||||||
|
2017
|
2016
|
2015
|
||||||||||
|
Number of employees by category of activity:
|
||||||||||||
|
Plant operation and maintenance
|
51
|
51
|
43
|
|||||||||
|
Corporate management, finance, commercial and other
|
37
|
28
|
23
|
|||||||||
|
OPC Total
|
88
|
79
|
66
|
|||||||||
Most of the OPC-Rotem power plant’s operations employees are employed under a collective employment agreement entered into in November 2015, which will remain in force through March 2019. The agreement establishes and regulates which employees are subject to the agreement, as well as the career path that the employees will follow within the organization, from their initial hiring through the end of their employment. The agreement establishes the process of hiring employees, trial periods, starting compensation and salary, rates for wage increases and annual bonuses, as well as entitlement to vacation, sick days and convalescence pay, welfare benefits, disciplinary regulations, and the process for ending employment and the mechanism for resolving disputes between management and the employees’ representation. In addition, the agreement stipulates that OPC’s employees that are subject to the agreement will receive salary increase and annual bonus for each calendar year in the agreement period.
In March 2018, a collective employment agreement was signed with Hadera power plant’s operations employees. This agreement was in line with the existing collective agreement of
OPC-
Rotem power plant’s operations employees, which will remain in force through March 2022.
Shareholders’ Agreements
OPC holds a 80% stake in OPC-Rotem. OPC has entered into a shareholders’ agreement with Veridis, the minority shareholder of OPC-Rotem. The shareholders’ agreement grants Veridis veto rights in connection with certain material decisions relating to OPC-Rotem, including: (a) a change in the incorporation documents; (b) winding up of OPC-Rotem; (c) change in rights attached to shares prejudicing a shareholder; (d) transactions with affiliated parties; (e) change in the OPC-Rotem’s activity; (f) reorganization, merger, sale of material assets and such like; (g) pursuit of new projects; (h) changes in share capital, issue of bonds or allotment of various securities, subject to the exceptions determined in the agreement; (i) change of accountants; and (j) appointment and dismissal of directors on behalf of Veridis.
The agreements grant the shareholders additional rights in the event of any of them selling OPC-Rotem shares, such as a right of first refusal and tag-along rights. The agreement also permits OPC to terminate the shareholder agreement in the event that Veridis sells its shares in OPC-Rotem.
Legal Proceedings
For a discussion of significant legal proceedings to which OPC’s businesses are party, see Notes 21 and 33 to our financial statements included in this annual report.
Regulatory, Environmental and Compliance Matters
IEC generates and supplies most of the electricity in Israel in accordance with licenses granted it by virtue of the Israeli Electrical Market Law, and distributes and supplies all of the electricity in Israel. In addition, IEC serves as the “System Administrator” for the Israeli electricity system by virtue of the general license granted it. The System Administrator is intended to maintain balance in levels of supply and demand in the electricity market, manage the transmission of energy from power stations to substations at the reliability and quality required (by passing through the power grids), timing and performing maintenance works in production units and in transmission systems, managing commerce in Israel under competitive, equal and optimal terms, including performing agreements to purchase available capacity and energy from private electricity producers and for planning and developing the transmission and distribution systems. Within this framework, IEC, as System Administrator, sets the dispatch order of operation for production units, prepares connection surveys and more. IEC’s activity as the System Administrator is subject to the Standards published by the Electricity Authority.
71
Pursuant to the Electricity Sector Law, IEC was defined as an “essential service provider” and as such is subject to the obligations pertaining to the proper management of the Israeli electrical services market. These obligations include, inter alia, submitting development plans, managing and operating the electrical system in Israel including the transmission and distribution systems, providing backup and infrastructure services to private power producers and to consumers as well as purchasing electricity from private power producers. In addition, IEC was declared a monopoly by the Israeli Antitrust Authority in the electricity sector, in the field of power supply – electricity production and sale, transmission and distribution of electricity and providing backup services to electricity consumers and producers.
On December 28, 2016 the licenses issued to IEC were extended by an order until November 15, 2017. On November 16, 2017, the Electricity Sector Law (Amendment no. 15), 5778-2017 was published, which extended IEC’s licenses until November 15, 2018, and within its framework, it was determined that an additional extension of IEC’s licenses would be subject to amendments to the main legislation.
Ministry of Energy
The Israeli Ministry of Energy is in charge of the energy and natural resources markets of the State of Israel: electricity, fuel, cooking gas, natural gas, energy conservation, water, sewerage, oil exploration, minerals, scientific research of the land and water, etc. The Ministry of Energy regulates public and private entities involved in these fields, and operates to ensure the markets’ adequate supply under changing energy and infrastructure needs, while regulating the markets, protecting consumers and preserving the environment.
According to publications of the Ministry of Energy, the Ministry of Energy's multi-year goals include diversified energy resources and ensuring reliability of supply during peacetime and emergency, developing effective and significant natural gas, and determining long-terms policies and appropriate regulations of the market's electricity.
The Ministry of Energy's main objectives in the electricity field are securing a reliable supply of electricity to the Israeli market, formulating development procedures to the electricity production sections, energy transmission and distribution, promoting policies to integrate renewable energies in electricity production in accordance with governmental decisions, formulating policies changing the market's electricity structure, performing control and supervision of the implementation of the IEC's and private producers’ development plans, performing control, supervision and enforcement of implementing safety regulations according to the Electricity Law, 5714-1954, and handling legislature in the electricity market fields, rules of performing electricity works and security in electricity. The main objectives of the Ministry of Energy in its workplan for 2018 in the electricity area include consolidating a reform in the electricity sector, and promoting a national outline plan for infrastructures for the energy sector.
EA
The Electricity Authority, or the EA, which is subordinated to the Ministry of Energy and operates in accordance with its policy, was established in January 2016, and replaced the Public Utility Authority, or PUAE, which operated until that time by virtue of the Electricity Sector Law. The EA has the authority to grant licenses in accordance with the Electricity Sector Law (licenses for facilities with a generation capacity higher than 100 MW also require the approval of the Minister of Energy), to supervise license holders, to set electricity tariffs and criteria for them, including the level and quality of services required from an “essential service provider” license holder, supply license holder, a transmission and distribution license holder, an electricity producer and a private electricity producer. Thus, the EA supervises both the IEC and private producers.
The Minister of Energy can dispute EA rulings and request a renewed discussion on specific rulings, except in the matter of the electricity tariffs, which the EA has full authority to set. In addition, the Minister of Energy has the authority to propose the appointment of some of the members of the EA board, as well as the authority to rule on electricity market policy on the subjects defined in the Electricity Sector Law.
According to the Electricity Authority Law, the EA may set the power rates in the market, based, among others, on IEC costs that the EA elects to recognize, and yield on capital. The EA sets different rates for different electricity sectors. According to the Electricity Sector Law, the IEC shall charge customers in accordance with rates set by the EA and shall pay another license holder or a customer in accordance with the relevant rates. In addition, the EA sets the tariffs paid by private electricity producers to the IEC for various services provided by the IEC, including measurement and meter services, system services, and infrastructure services.
72
The workplan of the EA for 2018 includes, among others, the publication of a master plan for the electricity sector and the production segment, the promotion of renewable energies and decentralized generation, the consolidation of a program for the development of a delivery and distribution system that will provide a response to the increase in demand, the incorporation of different production technologies and an update to the centralization guidelines in the electricity sector, regularization of licensing guidelines.
For further information on related EA tariffs, see “
—Industry Overview—
Overview of Israeli Electricity Generation Industry
.” For further information on the effect of EA tariffs on OPC’s revenues and margins, see “
Item 5. Operating and Financial Review and Prospects—Material Factors Affecting Results of Operations—OPC— Sales—EA Tariffs.
”
Independent Power Producers
In recent years, a substantial number of independent power producers have begun entering the Israeli electricity generation market, in view of, among others, increasing competition in the field of electricity generation and encouraging the construction and operation of private generation facilities. This entry has led to a significant decrease in the IEC’s market share in the sale of electricity to large electricity consumers (high and medium voltage consumers) such that in 2016, according to public IEC reports, its market share dropped to under 50% of electricity sales to large consumers.
Activity by independent power producers, including the construction of private power stations and the sale of electricity produced therein, is regulated by IPP Regulations and the Cogeneration Regulations, as well as the rules, decisions, and standards established by the EA. OPC-Rotem has a unique regulation by virtue of a tender, as detailed below.
According to the Electricity Sector Law, none of the actions set in the Electricity Sector Law shall be carried out by anyone other than a license holder. The Licenses Regulations include provisions and conditions in the matter of issuing licenses, rules for operating under such licenses and the obligations borne by license holders.
In order to obtain a production license, a private electricity producer must file a request in accordance with the relevant regulations, and meet the threshold conditions. Among others, the manufacturer bears the burden to prove that the corporation requesting the license has a link to the land relevant to the facility. According to EA rulings, subject to meeting the terms (and with the approval of the Minister of Energy for licenses exceeding 100 MW), the developer is granted a conditional license. The conditional license holder must meet certain milestones for constructing its facility as detailed in the conditional license, and must also prove financial closing. Only after meeting these milestones and the commercial operation of the facility, the developer is granted a generation license (or Permanent License) determined by the EA for the period determined in such license (for licenses exceeding 100 MW, the license must be approved by the Minister of Energy).
This model, which is based on receiving a conditional license followed by a permanent license (subject to meeting the regulatory and statutory milestones), is applicable to both the production of electricity using conventional technology and cogeneration technology, with the exception of facilities with an installed capacity under 5 MW, for which no license is required for their operation, and photovoltaic facilities with an installed capacity over 5 MW, which require only a fixed license.
According to the 2016 Electricity Market Report, as of 2016, IPPs (including OPC-Rotem and including renewable energy) are active in the market with an aggregate capacity of approx. 4,048 MW, constituting 23% of the Israeli electricity market’s total installed capacity. The Electricity Authority estimates that by the end of the decade, approximately 40% of the installed capacity in the Israeli electricity market will generated by IPPs (including renewable energy and self-generation).
73
The regulatory arrangements applicable to IPPs were determined while distinguishing between the different generation technologies they use and the various levels of voltage they will be connected to (according to installed capacity). The following are the key electricity production technologies used by private producers in Israel:
| · |
Conventional technology
– electricity generation using fossil fuel (natural gas or diesel oil). Exercise of the quota of IPPs using this technology amounts to 2,400 MW out of a total quota of 3,470 MW assigned to generation using this technology.
|
| · |
Cogeneration technology
–electricity generation using facilities that simultaneously generate both electrical energy and useful thermal energy (steam) from a single source of energy. Exercise of the quota of generators using this technology amounts to 760 MW out of a total quota of 1,000 MW assigned under the current regulation. Licenses issued beyond that shall be subject to different regulation.
|
| · |
Renewable energy
– generation of electric power the source of energy of which includes, inter alia, sun, wind, water or waste. The installed capacity of renewable energy generation facilities amounts to 971 MW as well as another 711 MW in various stages of construction, with 1,682 MW from quotas constituting 3,760 MW assigned to generation using renewable energy.
|
| · |
Pumped storage energy
– generation of electricity using an electrical pump connected to the power grid in order to pump water from a lower water reservoir to an upper water reservoir, while taking advantage of the height differences between them in order to power an electric turbine. The installed capacity of production facilities using this technology amounts to 644 MW out of a total quota of 800 MW assigned to production.
|
According to the Electricity Sector Law, the IEC, as an essential service provider, is committed to purchasing electricity from IPPs at the rates and under the conditions set in the Electricity Sector Law and the regulations and standards promulgated thereunder (and, in relation to OPC-Rotem, by virtue of the tender and OPC-Rotem’s PPA with IEC). In addition, the IEC is committed to connecting the IPPs facilities to the distribution and transmission grid and providing them with infrastructure services in order to allow IPPs to provide power to private customers. The IEC is also committed to providing IPPs with system administration services in return for a power system management services rate (the system cost rates).
Regulatory Framework for Conventional IPPs
The regulatory framework for current and under construction conventional IPPs was set by the PUAE in 2008. An IPP may choose to allocate its generation capacity, as “permanently available capacity,” or PAC, or as “variable available capacity,” or VAC. PAC refers to capacity that is allocated to IEC and is dispatched according to IEC’s instructions. PAC receives a capacity payment for the capacity allocated to IEC, as well as energy payment to cover the energy costs, in the event that the unit is dispatched. VAC refers to capacity that is allocated to private consumers, and sold according to an agreement between the IPP and a third party. Under VAC terms, IPP shall be entitled to receive availability payments for excess energy not sold to private customers. In addition, the IEC can purchase electricity allocated to it at variable availability, on a price quote basis. Within this regulatory framework, a private electricity producer can choose to allocate between 70% and 90% of their production capacity at high availability, and the rest at variable availability.
Upon the development of the electricity market and the utilization of Regulation 241 quotas in December 2014, the EA published a follow-up regulation for conventional producers, and implemented dispatch of IPPs according to the economic dispatch order. According to this regulation, the production units shall be dispatched in accordance with an economic dispatch principle and independent of PPAs between producers and customers, and shall apply to producers with an installed capacity higher than 16 MW and up to a total output of 1,224 MW. This regulation is referred to as Regulation 914.
In May 2017, the EA published a decision amending Regulation 914, in order to adapt it to the changing needs of the electricity sector and provide a response to the barriers that prevented electricity producers from reaching financial closure. According to the decision, a higher tariff was adopted for production facilities that comply with certain flexible requirements (in view of the high cost that characterize them), and the decision also determined that the facilities would receive a tariff based on normative characteristics. In addition, the decision offers open-cycle producers several alternatives, including receiving surplus gas from gas agreements of other producers. The total quota for new facilities under this arrangement was limited to 1,100 MW distributed into various stations (at least 450 MW and up to 700 MW for combined cycle facilities, at least 400 MW and up to 650 MW for flexible open cycle facilities). According to the decision, the EA prohibits entry into bilateral transactions by open-cycle facilities and demands that combined-cycle facilities sell at least 15% of their capacity to private consumers. In addition, as part of the decision and in order to grant IPPs sufficient time to reach financial closure, Regulation 914 was extended to apply to producers who will receive approvals no later than January 1, 2020.
74
In addition, in December 2017, a proposed resolution was published for a hearing to regulate the activity of gas-fired production facilities that are connected to the distribution network. The resolution encourages the construction of production facilities near the consumption site by providing a capacity-dependent incentive tariff of NIS 140-180/kW per year. According to the hearing, the capacity tariff will be paid to facilities that comply with certain conditions (mainly a load factor of no less than 35% per year) up to a quota of 300 MW.
OPC-Rotem’s Regulatory Framework
OPC-Rotem operates according to a tender issued by the state of Israel in 2001 and, in accordance therewith, OPC-Rotem and the IEC executed the IEC PPA in 2009, which stipulates OPC's regulatory framework. OPC-Rotem’s framework differs from the general regulatory framework for IPPs, as set by the PUAE and described above.
According to the IEC PPA, OPC-Rotem may sell electricity in one or more of the following ways:
| 1. |
Capacity and Energy to IEC
: according to the IEC PPA, OPC-Rotem is obligated to allocate its full capacity to IEC. In return, IEC shall pay OPC-Rotem a monthly payment for each available MW, net, that was available to IEC.
|
In addition, when IEC requests to dispatch OPC-Rotem, the IEC shall pay a variable payment based on the cost of fuel and the efficiency of the station. This payment will cover the variable cost deriving from the operation of the
OPC-
Rotem Power
s
tation and the generation of electricity.
| 2. |
Sale of energy to end users
: OPC-Rotem is allowed to inform IEC, subject to the provision of advanced notice, that it is releasing itself in whole or in part from the allocation of capacity to IEC, and extract (in whole or in part) the capacity allocated to IEC, in order to sell electricity to private customers pursuant to the Electricity Sector Law. OPC-Rotem may, subject to 12-months’ advanced notice, re-include the excluded capacity (in whole or in part) as capacity sold to IEC.
|
OPC-Rotem informed IEC, as required by the IEC PPA, of the exclusion of the entire capacity of its power plant, in order to sell such capacity to private customers. Since July 2013, the entire capacity of OPC-Rotem has been allocated to private customers.
The IEC PPA includes a transmission and backup appendix, which requires IEC to provide transmission and backup services to OPC-Rotem and its customers, for private transactions between OPC-Rotem and its customers, and the tariffs payable by OPC-Rotem to IEC for these services. Moreover, upon entering a PPA between OPC-Rotem and an individual consumer, OPC-Rotem becomes the sole electricity provider for this customer, and IEC is required to supply power to this customer when OPC-Rotem is unable to do so, in exchange for a payment by OPC-Rotem according to the tariffs set by the EA for this purpose. For further information on the risks associated with the indexation of the EA’s generation tariff and its potential impact on OPC-Rotem’s business, financial condition and results of operations, see “
Item 3.D Risk Factors—Risks Related to OPC—
Changes in the EA’s electricity rates may reduce OPC’s profitability
.
”
Regulatory Framework for Cogeneration IPPs
The regulatory framework for current and under construction cogeneration IPPs was established by the PUAE in its 2008 and 2016 decisions. A cogeneration IPP can sell electricity in the following ways:
| 1. |
At peak and shoulder times, one of the following shall apply:
|
a. each year, the IPP may sell up to 70% of the total electrical energy, calculated annually, produced in its facility to IEC—for up to 12 years from the date of the grant of the license; or
b. each year, the IPP may sell up to 50% of the total electrical energy, calculated annually, produced in its facility to IEC—for up to 18 years from the date of the grant of the license.
75
| 2. |
At low demand times, IPPs with units with an installed capacity of up to 175 MW, may sell electrical energy produced by it with a capacity of up to 35 MW, calculated annually or up to 20% of the produced power, inasmuch as the installed output of the unit is higher than 175 MW, all calculated on an annual basis.
|
According to the regulations, if a cogeneration facility no longer qualifies as a “Cogeneration Production Unit,” other rate arrangements are applied to it, which are inferior to the rate arrangements applicable to cogeneration producers.
OPC-Hadera’s Regulatory Framework
OPC-Hadera holds a conditional license, granted on October 19, 2012 (as amended on
August
29, 2016), for the construction of a cogeneration power station in Israel. On September 18, 2016, OPC-Hadera provided the EA a notice that it had reached “financial closing” with respect to financing for the project.
Moreover, as set forth above, OPC-Hadera must meet certain conditions before it will be subject to the regulatory framework for cogeneration IPPs and be considered a “Cogeneration Production Unit.” For example, OPC-Hadera will have to obtain a certain efficiency rate which will depend, in large part, upon the steam consumption of OPC-Hadera’s consumers. In circumstances where OPC-Hadera no longer satisfies such conditions and therefore no longer qualifies as a “Cogeneration Production Unit,” other rate arrangements, are applied to it, which are inferior to the rate arrangements applicable to cogeneration producers.
Qoros
Kenon holds a 24% interest in Qoros, a China-based automotive company which began commercial operations in 2013. Kenon used to hold a 50% stake in Qoros prior to the New Qoros Investor’s investment, and was one of the founding members of the company. Kenon continues to remain actively involved in the business with its current stake and right to appoint two of the nine directors on Qoros’ board.
Qoros’ vision is to design, manufacture, distribute, and service (through dealers) high quality cars. Qoros’ manufacturing facility in Changshu, China has a technical capacity of 150 thousand units per annum, which can be increased to approximately 220 thousand units per annum through the utilization of different shift models (and further increased through additional shift optimizations and improvements in workday efficiency). Qoros sold approximately 15,000 vehicles in 2017, as compared to approximately 24,000 vehicles in 2016. Qoros sold approximately 11,400 cars in the first quarter of 2018, a
more than
200% increase as compared to approximately 3,700 cars sold in the first quarter of 2017
,
with
a
substantial number of such sales
in Q1 2018
reflect
ing
purchase orders introduced by the New Qoros Investor.
Qoros is seeking to establish a position in the Chinese passenger vehicle market, one of the largest and fastest growing passenger vehicle market in terms of new units sold. Qoros is currently focused on the C-segment, which primarily includes the sedan, hatchback, and SUV body types and is the largest vehicle segment in China with 15 million C-segment vehicles, or 61% of China’s total passenger vehicle sales, sold in 2017 according to
Ways and China Passenger Car Association
, or CPCA.
In 2017, Qoros continued to receive numerous awards for its cars. Four Qoros EV concept models won 2017 Green Good Design awards. The Qoros 5 SUV and Qoros 5 SUV Q-LECTRIO won the German Design Award 2017 for outstanding design quality. In addition, Qoros received numerous awards from the Chinese media, including a 2017 Up and Rising SUV award for the Qoros 5 SUV from the China Business Journal.
Each Qoros vehicle is equipped with a Multi-Media Hub, or MMH, which includes an 8-inch touch screen and interactive human machine interface, or HMI, system. Through the MMH, most of Qoros’ vehicles are equipped with the “QorosQloud,” an innovative, cloud-based entertainment and services system that delivers a variety of free (e.g., cloud-enhanced navigation, car care, and social sharing) and premium (e.g., real-time traffic and parking information) connectivity features. Qoros intends to continue upgrading its MMH.
In January 2018, Kenon announced the New Qoros Investor completed a transaction to purchase 51% of Qoros from Kenon and Chery for RMB3.315 billion (approximately $526 million), which is part of an investment structure to invest a total of approximately RMB6.63 billion (approximately $1,052 million) by the New Qoros Investor of which RMB6.5 billion will ultimately be invested in Qoros’ equity. As a result, Kenon and Chery now have 24% and 25% stakes in Qoros, respectively. Qoros updated its business license to reflect the change in its ownership in December 2017. For further information, see “
Item 4.B Business Overview—Our Businesses—Qoros —Qoros’ Investment Agreement
."
76
Kenon has outstanding back-to-back guarantees to Chery in respect of Qoros' debt of up to RMB320 million, with respect to debt in principal of RMB288 million, and has pledged a substantial portion of its interest in Qoros to support certain Qoros debt, as well as Chery's guarantees of Qoros debt.
Overview of the Chinese Passenger Vehicle Market
Qoros is currently focused on the Chinese passenger vehicle market, which experienced rapid growth in recent years driven by significant expansion of the Chinese economy. China is the largest vehicle markets in the world in terms of units sold (although growth rates have been lower in recent years). The table below sets forth domestic sales volumes of passenger vehicle models in China between 2012 and 2017.
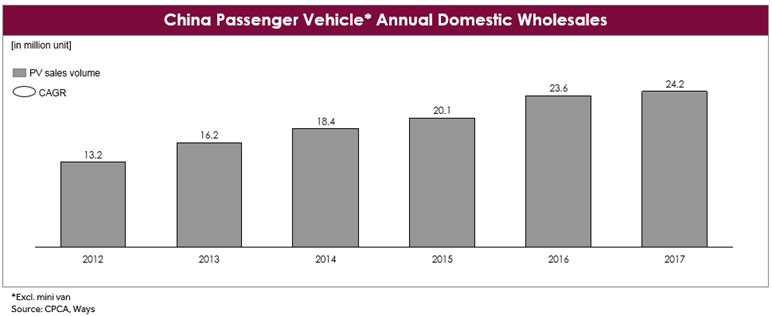
Factors Driving Growth in the Chinese Passenger Vehicle Industry
Qoros believes the following factors have contributed to the growth of the Chinese passenger vehicle industry:
Rapid Economic and Purchasing Power Growth
High GDP growth in China over the past decade has resulted in increased personal wealth and purchasing power. According to the National Bureau of Statistics of China, China’s nominal GDP increased from RMB13,582 billion in 2003 to RMB82,712 billion in 2017 (although GDP growth rates have been lower in recent years). If the Chinese economy continues to grow, corresponding personal wealth generation is expected to support greater demand for passenger vehicles.
Low Penetration Rate Implies Long-Term Growth Potential
Although China’s passenger vehicle market is the largest in the world by country (in terms of units sold), China’s penetration rate of vehicles as a proportion of its population is still relatively low, at approximately 10% at the end of 2015. According to the International Organization of Motor Vehicle Manufacturers, or OICA, the penetration rate of more mature economies, by comparison, typically ranges from approximately 55% (in the case of Japan and Korea) to approximately 80% (in the case of the United States), which indicates significant growth potential for the passenger vehicle market in China.
Market Segmentation of the Chinese Passenger Vehicle Industry
The Chinese passenger vehicle market, in line with international markets, can be separated into the following segments: large-size (F-segment) and mid- to large-size (E-segment), mid-size (D-segment), compact (C-segment), small-size (B-segment) and mini (A-segment) models based on the size of the vehicles and their typical engine displacement. The following table sets forth the major categories of passenger vehicles and key features.
77
With 24 million vehicles sold in 2017, China’s C-segment market, which Qoros is targeting, is one of the largest C-segment markets in the world and represents, by far, the largest segment within the Chinese automotive market. The C-segment has also been one of China’s fastest growing segment over the past decade (although it contracted in 2017). Qoros believes that the C-segment’s primary attractiveness in China results from its delivery of the combination of value for money with sufficient comfort and space for families.
The table below sets forth wholesale vehicle sales in China by segment from 2012 to 2017.
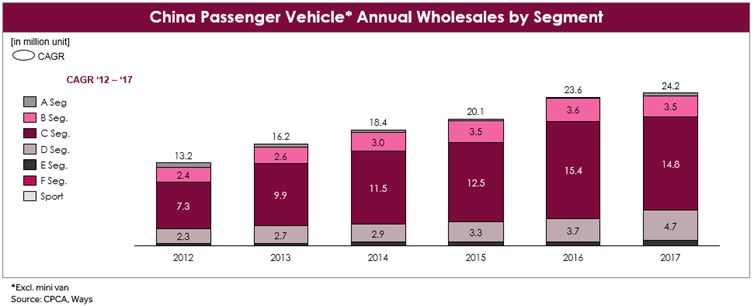
In recent years, the C-segment SUV market has experienced significant growth, representing approximately 38% of C-segment sales in China in 2017, as compared to approximately 19% in 2012. In response to consumer demand for SUVs, multiple C-segment SUV models, including vertical upgrade versions, were introduced in China over the last years.
The table below sets forth C-segment sales in China by body type from 2012 to 2017.
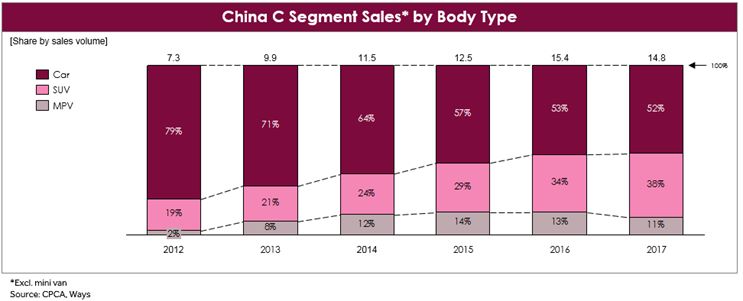
International brands generally participate in the larger and more expensive market segments of the Chinese passenger vehicle market, and a significant portion of the sales within these segments are generated from international joint venture brands. Domestic brands participate primarily in the economy price range, but in recent years, a number of domestic brands have competed in the higher market segments.
78
New Energy Vehicle Market in China
The Chinese central government has stated that the NEV market is critical for the development of the Chinese automobile industry and China’s economic growth, and has implemented a number of policies to promote the growth of the market. Sales of NEV cars (which includes plug-in and battery electric vehicles) increased from approximately 290,000 units in 2016 to approximately 552,000 units in 2017, representing a growth rate significantly higher than that of internal combustion engine cars.
Chinese national and regional governments have implemented various policies to promote the growth of the NEV market, including through purchase subsidies from central and local governments and tax cuts. However, a number of these subsidies are expected to be gradually phased out over the next few years, which may affect the demand for NEVs in China.
Chinese national and regional governments have also granted free license plates in cities which have quotas or extra costs for new car registration, exclusive license plates for NEVs, and preferential parking access to promote the growth of the NEV market in China. Additional policies to encourage the growth of NEVs are expected to be instituted, as many local governments are under pressure to reduce CO
2
emissions, urban gridlock and haze. In the near- to mid-term, NEVs may be given traffic privileges and exempted from driving day restrictions. The Chinese central government has also undertaken a series of steps to improve the infrastructure for NEVs, including by building charging points for NEV vehicles.
OEMs are also expected to invest in manufacturing NEVs to meet mandatory fuel economy regulations on corporate average fuel consumption. For example, China has introduced extensive emissions regulations which require automakers to sell a certain number of NEV vehicles each year. To the extent OEMs are unable to meet such standards, they may be required to acquire NEV credits or otherwise face a penalty. These regulations are expected to increase sales of NEVs in China.
Pricing Trends in the Chinese Passenger Vehicle Market
Following years of rapid growth, the Chinese passenger vehicle market experienced reduced growth rates in 2015 due largely to the economic slowdown in China and the volatility of the Chinese stock market. In response, China’s central government enacted a tax policy to incentivize the sale of domestic vehicle sales by lowering purchases taxes on certain vehicles, including Qoros’ vehicles. The purchase tax incentive was phased out on January 1, 2018.
In light of increased competition in the Chinese automotive market in recent years, dealers and OEMs have offered customers a variety of inducements to purchase vehicles, including price reductions. In line with many of its competitors, in 2016, Qoros announced price reductions on all its vehicle models. In 2017, dealers and OEMs continued to reduce prices and offer further inducements to purchase vehicles. Qoros expects the downward pressure on vehicle prices to continue for the next few years.
Qoros’ Description of Operations
Qoros designs, engineers and manufactures a new brand of automobiles manufactured in China, designed to deliver international standards of quality and safety, as well as innovative features. In 2017, Qoros sold approximately 15,000 cars, as compared to approximately 24,000 cars in 2016.
Qoros sold approximately 11,400 cars in the first quarter of 2018, a more than 200% increase as compared to approximately 3,700 cars sold in the first quarter of 2017, with a substantial number of such sales in Q1 2018 reflecting purchase orders introduced by the New Qoros Investor.
Models
Qoros currently sells C-segment models, including:
| · |
Qoros 3 Sedan
–launched in December 2013;
|
| · |
Qoros 3 Hatch –
launched in June 2014;
|
| · |
Qoros 3 City SUV –
launched in December 2014;
|
| · |
Qoros 5 SUV –
launched in March 2016; and
|
| · |
Qoros 3GT –
launched in November 2016.
|
79
Qoros’ platform has been designed to enable the efficient introduction of new models in the C- and D-segments. Qoros developed its vehicles in accordance with international standards of quality and safety, working in conjunction with global entities from both automotive and non-automotive industries.
The Qoros 5 SUV is the largest model in Qoros’s product line. Launched in 2016, the Qoros 5 SUV was designed by an international team from Munich and Shanghai.
The Qoros 3 Sedan’s vehicle performance is competitive in its segment, particularly with respect to fuel economy, acoustics, aerodynamics, climatic comfort, and braking performance. The Qoros 3 Sedan received a 5+ star safety rating in the China—New Car Assessment Program (C-NCAP)’s 2015 crash test, becoming the first car ever to achieve the 5+ rating against the demanding 2015 assessment protocol.
Qoros' strategy contemplates the development of an NEV model. Qoros intends to increase its research and development expenditures with respect to NEV development.
QorosQloud
All of Qoros’ vehicles are equipped with a MMH, including a user friendly 8-inch capacitive touch screen with swipe gestured control HMI. Most of Qoros vehicles are equipped with the “QorosQloud,” a cutting-edge telematics and cloud-based entertainment and services system that delivers a variety of free (e.g., cloud-enhanced navigation, car care, and social sharing) and premium (e.g., real-time traffic, parking information, cloud-enabled map update, and safe drive monitoring) connectivity features. Qoros believes the features and the services provided by the QorosQloud integrates Qoros’ vehicle into the driver’s lifestyle, by virtually connecting the vehicle, the driver and the driver’s digital world. QorosQloud creates a digital ecosystem that, among other features, seeks to provide the driver with a convenient, fun and integrated experience.
Qoros’ Manufacturing: Property, Plants and Equipment
Qoros conducts its vehicle manufacturing and assembly operations at its 150 thousand unit per annum, 790,000 square meter factory by land size in Changshu, China, for which it has a land use right until 2062. Qoros’ international-standard manufacturing facility incorporates comprehensive, flexible capabilities, including body assembly, paint shop, final vehicle assembly and end-of-line testing. Qoros’ paint shop utilizes advanced equipment and robotic technology, to contribute to the overall effectiveness and efficiency of Qoros’ painting operations.
Qoros can adjust the manufacturing capacity of its manufacturing facility in accordance with the demand for its vehicles. Currently, the base installed volume of vehicles that can be manufactured, or the “technical capacity,” of Qoros’ manufacturing facility is 150 thousand units per annum. Through alterations of operating parameters, such as the utilization of different shift models, the volume of vehicles manufactured can be increased to approximately 220 thousand units per annum (and further increased through additional shift optimizations, equipment modification and improvements in workday efficiency). This represents the manufacturing facility’s “shift capacity.” Subject to approval from the relevant Chinese government authorities and additional investments in the manufacturing facility, the production capacity of Qoros’ manufacturing facility can be further increased to up to approximately 440 thousand units per annum through a plant expansion.
Qoros’ Sourcing and Suppliers
Qoros sources the component parts necessary for its vehicle models from over 100 global suppliers. Qoros aims to establish long-term relationships with its suppliers as a means of building loyalty, achieving competitive pricing, and achieving component quality and prompt delivery. Qoros has implemented enterprise resource planning and management software to automate its procurement and inventory processes and to integrate them with its financial accounting system.
Qoros also collaborates and sub-contracts with several engineering firms for its product development activities.
80
For information on Qoros’ relationship with, and the risks related to, Qoros’ suppliers, see “
Item 3.D Risk Factors—Risks Related to Our Interest in Qoros—Qoros is dependent upon its suppliers.
” For information on claims brought by certain of Qoros’ suppliers, see “—
Qoros’ Legal Proceedings—
Claims by Suppliers and Service Providers.
”
Qoros’ Commercial Agreements with Shareholders
Qoros sources its engines and certain spare parts from Chery in the ordinary course of Qoros’ business, and has entered into various commercial agreements with respect to the provision of such supplies from Chery.
Additionally, Qoros entered into a platform sharing agreement with Chery, pursuant to which Qoros provides Chery with the right to use Qoros’ platform in exchange for a fee. Qoros may enter into additional commercial arrangements and agreements with Chery, or parties related to it, in the future. Qoros has amounts payable to Chery in the amount of RMB555 million as of December 31, 2017.
For further information on the risks related to Qoros’ commercial agreements with Chery, see “
Item 3.D Risk Factors—Risks Related to Our Interest in Qoros—Qoros has entered into certain arrangements and agreements with its shareholders.
”
Furthermore, the New Qoros Investor introduces vehicle purchase orders to Qoros. For further information on the agreement with the New Qoros Investor, see “
—Qoros’ Investment Agreement
.
”
Qoros’ Patents and Licenses
Qoros owns the intellectual property rights related to motor vehicles that it has independently developed (including HMI, electric powered motor vehicles and relevant motor vehicles platforms, parts, components and accessories for motor vehicles) and also owns any and all brands, trade names, trademarks, or emblems developed in connection with, or with respect to, any of its vehicles.
Qoros has filed trademark applications for Qoros major trademarks (e.g., QOROS, Qoros logos) and other trademark related to Qoros business in Asia (including Australia/New Zealand), Europe, Middle East, North America, South America, Africa, etc. “QOROS,” “Qoros Auto” and the Qoros logo have been registered throughout Europe and Asia.
Qoros has pledged, and, in the future, may further pledge, certain of its intellectual property as collateral for its financing. For information on the risks related to Qoros’ ownership of its intellectual property, including the risks relating to Qoros’ pledging of its rights in certain of its patents, see “
Item 3.D Risk Factors—Risks Related to Our Interest in Qoros—Qoros’ success depends, in part, upon its ability to protect, and maintain ownership of, its intellectual property.
”
Qoros’ Marketing Channels
Qoros has an integrated product, marketing and communication strategy. Qoros’ centralized, in-house marketing team aims to utilize its market research to generate demand for Qoros’ vehicles and drive leads to Qoros’ dealerships and sales teams.
Marketing Campaigns
In July 2017, Qoros launched its Crazy Qoros marketing campaign. The campaign was co-developed by Qoros, Tencent Video, and Energy Group, and entails a live-broadcasting show that leverages broadcasting technologies, social media, and the influence of celebrities to reach and resonate with today’s young consumers. This marketing approach reflects Qoros’ efforts to use new channels and technologies to raise brand awareness and generate sales.
Auto Show
Qoros continued to participate in major auto shows in 2017. Qoros unveiled its high-performance super EV, the Qoros Model K-EV, at the 2017 Shanghai Auto Show. Featuring forward-looking design and cutting-edge technologies, Model K-EV is created by an international design and engineering team to offer customers premium driving and riding experiences.
81
In August 2017, Qoros signed a strategic agreement in Chengdu with China Mobile for 5G-connected car services at the Chengdu Auto Show.
Qoros’ Sales Channels
Dealers
Qoros markets its vehicles in China primarily through a network of independent authorized retail dealers, with whom Qoros enters into non-exclusive relationships. As of December 31, 2017, Qoros had 73 full-service dealer stores, providing Qoros’ customers with dealers and authorized salesmen, showrooms, and service and parts, under one roof; the remaining portion of Qoros’ dealership network comprises only showrooms. As of December 31, 2017, Qoros’ dealerships included 113 points of sales, 5 additional points of sales under construction and Memorandums of Understanding. Qoros intends to create incentives for its high-performing dealers to open additional points of sales.
Qoros enters into a contract with each authorized dealer, agreeing to sell to the dealer all specified vehicle lines at wholesale prices and granting to the dealer the right to sell those vehicles to retail customers from an approved location. It is expected that Qoros’ dealers will offer the full vehicle model lineup offered by Qoros. Authorized Qoros dealers also offer parts, accessories, service and repairs for Qoros’ vehicles, using genuine Qoros parts and accessories obtained directly from Qoros. Qoros’ dealers are authorized to service Qoros’ vehicles under Qoros’ limited warranty program, and those repairs are required to be made only with Qoros’ parts. In addition, most of Qoros’ dealers also provide their customers access to retail financing, vehicle insurance and warranty packages. The dealership facilities are based on Qoros’ branded construction plans, to ensure consistency and quality, and are constructed by the dealer using its own capital resources. Dealers are entitled to sales rebates from Qoros if they achieve certain purchase targets or meet certain other criteria).
Because dealers maintain the primary sales and service interface with the end consumer of Qoros’ products, the quality of Qoros’ dealerships and its relationship with its distributors are critical to its success. Qoros conducts rigorous training for dealers with respect to its vehicle models and ancillary and aftersales products, most of which are required to be completed prior to the opening of a dealer’s operations. For information on the risks related to Qoros’ dealers, see “
Item 3.D Risk Factors—Risks Related to Our Interest in Qoros—Qoros depends upon a network of independent dealers to sell its automobiles.
As of December 31, 2017, Qoros operated two self-owned dealerships. Qoros may operate additional dealerships.
Qoros’ Customers
Qoros’ Customers
Qoros seeks to attract customers by offering a diversified range of vehicles and features with smart connectivity technologies and aspirational design.
Qoros is also targeting a diverse group of fleet-sale customers, including car rental and ride sharing companies, corporate entities, and other large groups.
Auto Financing Program
Customer financing is available through dealers and financing packages are also offered by Chery Huiyin Motor Finance Service, Co. Ltd., or Huiyin, a Wuhu Chery affiliate. Qoros does not provide direct financing to customers at this time.
Qoros has provided a guarantee to Huiyin for wholesale financing arrangements between Huiyin and selected Qoros dealers. In the case of defaults under such financing program between March 2016 and 2018, Qoros may need to compensate Huiyin for an amount up to the actual loss incurred. For further information, see Note 30 to Qoros’ consolidated financial statements, included in this annual report.
82
Warranty Program
Qoros provides a 36-month or 100,000 km limited warranty with its Qoros 3 models and a 72-month or 100,000 km limited warranty for the Qoros 5 SUV. Qoros’ limited warranty is subject to certain limitations, exclusions or separate warranties, including certain wear and tear items, such as tires, brake pads and general appearance, and battery performance, and accessories, and is intended to cover parts and labor to repair defects in material or workmanship.
Qoros’ Competition
The passenger vehicle market in China is highly competitive, with competition from many of the largest global manufacturers (acting through joint ventures), including European, U.S., Korean and Japanese automakers, and established domestic manufacturers. As the size of the Chinese automotive market continues to increase, Qoros anticipates that additional competitors, both international and domestic, may seek to enter the Chinese automotive market and that market participants will act to maintain or increase their market share. For information on the risks related to Qoros’ competition, see “
Item 3.D Risk Factors—Risks Related to Our Interest in Qoros—Qoros’ business is subject to intense competition.
”
Conditions in the passenger vehicle market have resulted in increased competition in China’s automotive market. In 2016 and 2017, a number of Chinese car manufacturers, including Qoros, announced price reductions and purchase inducements on their vehicles. Qoros expects the downward pressure on vehicle prices to continue for the next few years.
As part of its strategy, Qoros intends to develop an NEV vehicle. Qoros expects to experience significant competition in the NEV market, as OEMs are required to satisfy certain recently issued fuel consumption and NEV credit management standards.
Qoros’ Investment Agreement
In January 2018, Kenon announced the New Qoros Investor completed a transaction to purchase 51% of Qoros from Kenon and Chery for RMB3.315 billion (approximately $526 million), which is part of an investment structure to invest a total of approximately RMB6.63 billion (approximately $1,052 million) by the New Qoros Investor of which RMB6.5 billion will ultimately be invested in Qoros’ equity. As a result, Kenon and Chery now have 24% and 25% stakes in Qoros, respectively.
For purposes of this section, any references to Kenon will be deemed to include Quantum (Kenon's wholly-owned subsidiary which owns Kenon's interest in Qoros) and any references to Chery will be deemed to include Wuhu Chery (the direct owner of Chery's interest in Qoros). The investment was made pursuant to an investment agreement among the New Qoros Investor, Quantum, Wuhu Chery and Qoros. In connection with this investment, Kenon received total cash proceeds of RMB 1.69 billion ($268 million) and Chery received total cash proceeds of RMB 1.625 billion ($258 million). A description of the key terms of the investment agreement and the investment is set forth below. The investment also involved an amendment of the Qoros joint venture agreement which is described below.
The investment is based on an RMB6.5 billion pre-investment valuation of Qoros, excluding RMB1.9 billion principal amount of existing shareholder loans.
The investment agreement for the transaction provides that following the sale of equity interests, Qoros’ shareholders (including the New Qoros Investor) will invest a total of RMB6.5 billion in Qoros’ equity in proportion to their post-investment equity ownership. The New Qoros Investor has advanced their proportionate share totalling RMB3.315 billion directly to Qoros. As a result, all funds for the investment, totalling RMB6.63 billion, have now been advanced by the New Qoros Investor.
Kenon and Chery will use proceeds they received from the sale of their Qoros interests to fund their respective portions of the investment in Qoros, or to partially fund together with the conversion of existing shareholder loans. The transaction will not involve any new money invested from Kenon or Chery. In total,
the investment agreement provides for
Kenon to invest RMB1.56 billion and
,
as a result
, Kenon
retained RMB130 million, which funds were paid to Ansonia as further detailed below.
83
The investment agreement provides for repayment of existing shareholder loans owing from Qoros in the principal amount of RMB944 million (approximately $150 million) to each of Kenon and Chery, in two equal tranches,
following the purchase of Kenon's and Chery's equity interests as described above
. In addition, Kenon retained RMB130 million from the sale of its 1% holding in Qoros (which was not to be reinvested into Qoros), out of the total sale proceeds of RMB1.69 billion. $20 million in proceeds retained by Kenon was applied to the partial repayment of the Ansonia loans in January 2018, leaving a balance of approximately $55 million (linked to RMB proceeds received by Kenon) of loans owing to Ansonia. A portion of the loan repayments to Kenon (or any sale proceeds, if retained by Kenon) will likely be applied to the repayment of such loans, as discussed below.
Guarantee Obligations and Equity Pledges
Chery has guaranteed a portion of Qoros' obligations under its RMB3 billion and RMB700 million credit facilities, and Kenon has provided back-to-back guarantees to Chery in respect of a portion of Chery's obligations. Kenon's back-to-back guarantee obligations are approximately RMB320 million relating to Qoros loans in principal amount of RMB288 million. In addition, Kenon and Chery have also pledged a significant portion of their equity interests in Qoros to secure Qoros' obligations under its RMB1.2 billion credit facility.
In connection with previous reductions in Kenon's back-to-back guarantee obligations, Kenon provided cash collateral to Chery that was used to fund shareholder loans on behalf of Chery for a total amount of RMB244 million and pledged a portion of Kenon's equity interests in Qoros to Chery. The agreements for this guarantee and pledge provide that in the event that Chery’s obligations under its guarantees are reduced, including through guarantee releases, Kenon is entitled to the proportionate return from Chery of the RMB244 million funding provided on Chery’s behalf and/or a release of the equity pledged to Chery.
As part of the investment, the New Qoros Investor will assume its pro rata share of the guarantees and equity pledges based on post-investment equity ownership in Qoros, which will be subject to further adjustment following any future changes in the equity ownership in Qoros (including as a result of the exercise of the put option or investment right by a shareholder under the investment agreement). The New Qoros Investor has assumed its proportionate obligations with respect to the RMB3 billion and RMB700 million loan facilities, and as a result, in January 2018, Chery repaid Kenon RMB120 million (approximately $18 million
2
) out of the total RMB244 million (approximately $39 million) previously advanced, and a significant portion of the Qoros equity pledged by Kenon to Chery was released. These repayments and releases of equity pledges were required under the terms of the advances, which provided for repayment of the advances and release of pledges to Chery upon a reduction of guarantee obligations of Chery, and the investment by the New Qoros Investor resulted in guarantee reductions for Chery requiring such repayment and releases from the pledge. The New Qoros Investor is still in the process of assuming its proportionate obligations with respect to the RMB1.2 billion loan facility after which Kenon will also be proportionately released from its pledge obligations thereunder, subject to the Qoros bank lender consent. Substantially all of Kenon's equity in Qoros is currently pledged.
Repayment of Loans to Ansonia
Kenon is party to loan agreements with Kenon’s major shareholder Ansonia, which loan agreements were entered into in 2016 to provide loans to Kenon to fund Qoros. The total outstanding principal amount of the loans owing from Kenon to Ansonia was approximately $75 million (including interest) as of December 31, 2017.
Under the terms of these loan agreements, Kenon is required to use the proceeds from realizations of a certain investment in Qoros and repayments of shareholder loans from Qoros to Kenon to repay the loans with Ansonia. Accordingly, $20 million in proceeds retained by Kenon was applied to the partial repayment of the Ansonia loans in January 2018, leaving a balance of approximately $55 million (linked to RMB proceeds received by Kenon
, under certain circumstances
) of loans owing to Ansonia.
Repayments of shareholder loans by Qoros to Kenon as contemplated by the investment agreement (or any further proceeds, if retained by Kenon from the sale of its interest in Qoros)
would similarly
likely
be applied to the repayment of the Ansonia loans.
Kenon’s Put Option; the New Qoros Investor's Right to make Further Investments in Qoros
During the three-year period beginning from the closing of the investment, Kenon has the right to cause the New Qoros Investor to purchase up to 50% of its remaining equity interest in Qoros
, following the related capital increase
for up to RMB1.56 billion
(approximately $248 million)
, being the price for 50% of Kenon's remaining 24% interest in Qoros, subject to adjustments for inflation. From the third anniversary of the closing until April 2023, Kenon has the right to cause the New Qoros Investor to purchase up to all of its remaining equity interests in Qoros for up to a total of RMB3.12 billion
(approximately $495 million)
(for Kenon's full 24% interest in Qoros), subject to adjustment for inflation. Another company within the Baoneng group effectively guarantees this put option by also serving as a grantor of the option. The put option requires six months’ notice for exercise.
2
Convenience translation of this RMB amount into US Dollars uses a January 2018 rate of 6.5: 1.
84
During the two-year period from the closing of the investment, the New Qoros Investor has the right to increase its stake in Qoros to up to 67%, at the same price as the capital increase in the investment plus interest of 10% per annum from the closing of the Investment.
The investment agreement provides that any changes in the equity holdings of Qoros by Kenon, Chery or the New Qoros Investor, including as a result of the put option and investment right described above, will result in adjustments to the respective parties’ pro rata obligations of the Qoros bank guarantees and pledges described above according to their equity ownership in Qoros.
The
New Qoros Investor
’s Commitment to Introduce Vehicle Purchase Orders
Pursuant to the investment agreement, the New Qoros Investor has agreed to introduce approximately 100,000 vehicle purchase orders to Qoros each year between 2018 and 2020 following the entry into further agreements with respect to these purchase orders. Such further agreements, which will need to set out specific details relating to models to be purchased, purchase price and other details, have not yet been fully executed and are expected to be executed gradually over time. While we expect that the New Qoros Investor will introduce meaningful vehicle purchase orders in the 2018, the full amount of the vehicle purchase order commitment may not be met for 2018. For risks associated with this agreement, including the risk that the New Qoros Investor does not introduce some or all of the vehicle purchase orders it has agreed to introduce or the terms of such purchase orders, see “
Item 3.D Risk Factors—Risks Related to Our Interest in Qoros— The New Qoros Investor may not satisfy its commitment to introduce vehicle purchase orders to Qoros
.”
Governance of Qoros
Qoros' joint venture agreement and articles of association have been amended to reflect the New Qoros Investor’s 51% interest in Qoros. For further information on the terms of the joint venture agreement, see “
—Qoros’ Joint Venture Agreement
.”
Qoros’ Joint Venture Agreement
We are party to a joint venture agreement, or the Joint Venture Agreement, entered into on February 16, 2007, which was recently amended, to reflect
the New Qoros Investor’s
51% interest in Qoros as well as certain terms agreed pursuant to the investment agreement. The Joint Venture Agreement sets forth certain rights and obligations of each of Quantum, the wholly-owned subsidiary through which we own our equity interest in Qoros, Wuhu Chery and
the New Qoros Investor
with respect to Qoros
The Joint Venture Agreement is governed by Chinese law. Under the Joint Venture Agreement, certain matters require the unanimous approval of Qoros’ board of directors, while other matters require a two-thirds or a simple majority board approval. Matters requiring unanimous approval of the Qoros board include amendments to Qoros’ articles of association, changes to Qoros’ share capital, the merger, division, termination or dissolution of Qoros, the sale or otherwise disposal of all or a material part of Qoros’ fixed assets for an amount equal or greater than RMB200 million and the issuance of debentures or the creation of third party security interests over any of Qoros’ material fixed assets (other than those provided in connection with legitimate Qoros loans). Matters requiring approval by two-thirds of the board include the acquisition of majority equity interests in another entity for an amount exceeding 5% of Qoros’ net asset value, termination of any material partnership or joint venture contract, profit distribution plans, the sale or otherwise disposal of all or a material part of Qoros’ fixed assets for an amount equal or greater than RMB60 million but less than RMB200 million, and capital expenditures and investments which are equal to or greater than the higher of $4 million or 10% of the approved annual budget.
85
Pursuant to the terms of our Joint Venture Agreement, we have the right to appoint two of Qoros’ nine directors, Wuhu Chery has the right to appoint two of Qoros’ directors and
the New Qoros Investor
has the right to appoint the remaining five of Qoros’ directors. If
the New Qoros Investor
exercises its right to increase its stake in Qoros to up to 67% (see “—
Kenon’s Put Option; the New Qoros Investor's Right to make Further Investments in Qoros
”), the board of directors of Qoros will be further adjusted such that Qoros will have a six-member board of directors, of which
the New Qoros Investor
will have the right to appoint four directors, while Kenon and Wuhu Chery will each have the right to appoint one director. T
he New Qoros Investor
has the right to nominate Qoros’ Chief Executive Officer and Chief Financial Officer. The nomination of Qoros’ Chief Executive Officer and Chief Financial Officer are each subject to the approval of Qoros’ board of directors by a simple majority vote. Quantum and Wuhu Chery each have the right to nominate one of Qoros’ deputy Chief Financial Officers. Such nominations by Quantum and Wuhu Chery are subject to the approval of Qoros’ board of directors by a simple majority vote.
The Joint Venture Agreement restricts transfers of interests in Qoros by the shareholders (other than transfers to affiliates). Quantum has the right to transfer up to 50% of its interest in Qoros to a third-party at any time (subject to
the New Qoros Investor’s
right of first refusal described below). Quantum may not assign the remaining 50% of its interest in Qoros to a third-party during the three-year period following the change in shareholding in Qoros pursuant to the investment agreement with
the New Qoros Investor
without the consent of the other joint venture partners. After the three-year lock-up period, Quantum may transfer all of its interest in Qoros to any third-party, subject to the rights of first refusal discussed below. During the five-year period following the closing of the investment, Wuhu Chery and
the New Qoros Investor
may not transfer any or all their interests in Qoros to any third-party without consent of the other joint venture partners (except for assignments in relation to an initial public offering of Wuhu Chery’s interest in Qoros).
Subject to the lock-up restrictions set forth above, if any of the joint venture partners elects to sell any of its equity interest in Qoros to a third party (i.e., other than an affiliate), the other joint venture partners have the right to purchase all, but not less than all, of the equity interests to be transferred, subject to certain conditions relating to the minimum price for such sale. In the event that more than one joint venture partner elects to exercise its right of first refusal, the shareholders shall purchase the equity interest to be transferred in proportion to their respective interests in Qoros at such time.
The Joint Venture Agreement also reflects Kenon’s put option and
the New Qoros Investor’s
call option in relation to their interests in Qoros. For further information on the put and call option, see “
—Qoros’ Investment Agreement— Kenon’s Put Option; the New Qoros Investor's Right to make Further Investments in Qoros.
”
The Joint Venture Agreement expires in 2042. The Joint Venture Agreement terminates prior to this date only (i) if the joint venture partners unanimously agree to dissolve Qoros (ii) in the event of any other reasons for dissolution specified in the Joint Venture Agreement and Articles of Association of Qoros or (iii) upon occurrence of any other termination event, as specified in PRC laws and regulations. For further information on the risks related to the Joint Venture Agreement, see “
Item 3.D Risk Factors—Risks Related to Our Interest in Qoros—Our interest in Qoros is only 24%
.”
Changes to Qoros’ Management
In recent years, Qoros has made a number of changes at the executive management level. In 2018, the
New Qoros Investor
has appointed a new chief executive officer and chief financial officer for Qoros.
For further information on the risks related to Qoros’ management, see “
Item 3.D. Risk Factors—Risks Related to Our Interest in Qoros—Qoros requires qualified personnel to manage its operations.
”
86
Qoros’ Legal Proceedings
Claims by Suppliers and Service Providers
During 2017, Qoros was subject to various claims brought by certain of its suppliers and service providers claiming unpaid amounts. As of December 31, 2017, the total amounts claimed are approximately RMB142 million.
During 2017, Qoros settled various outstanding claims previously brought by its suppliers and service providers. As of December 31, 2017, Qoros has settled an amount of approximately RMB121 million, out of which approximately RMB39 million was paid by the end of 2017.
Qoros’ Regulatory, Environmental and Compliance Matters
Qoros is subject to regulation, including environmental regulations, in China and the Jiangsu Province. Such regulations are becoming increasingly stringent and focus upon the reduction of emissions, the mitigation of remediation expenses related to environmental liabilities, the improvement of fuel efficiency, and the monitoring and enhancement of the safety features of Chinese vehicles. For example, the Chinese government has introduced stringent fuel consumption regulations which will take effect in 2020 for vehicles sold by Chinese automotive manufacturers. In order to comply with these fuel consumption standards, Qoros may need to alter the composition of its fleet of vehicles, which may include developing an electric vehicle. Qoros’ facility, activities and operations are also subject to continued monitoring and inspection by the relevant Chinese authorities. Qoros believes that it is in compliance with applicable Chinese government regulations.
Additionally, certain of Qoros’ corporate activities are subject to the regulation and approval of the competent authorities in China. Such activities include capital increases by, loans to, or investments in Qoros, changes in the structure of Qoros’ ownership, increases in the production capacity, construction of Qoros’ production facilities, registration and ownership of trademarks, relocation of Qoros’ head office, the formation of subsidiaries, and the inclusion of Qoros’ products in the national catalogue for purposes of selling them throughout China.
As Qoros’ strategy contemplates the development of an NEV, Qoros will be subject to the laws, licensing requirements, regulations and policies applicable to NEVs in China. For instance, China has recently published a set of fuel consumption credit management rules to promote the growth of the NEV market and reduce reliance on internal combustion vehicles. Under the regulations, automakers must obtain a certain NEV score by 2019, which score is related to the number of NEVs the automaker produces (approximately 10% of the automaker's production in 2019). If the automaker is unable to obtain the score, it is required to purchase credits from other automakers whose NEV score is above the required amount or will be subject to penalties. If Qoros is unable to receive positive CAFC credits commencing in 2018 and produce enough NEVs to satisfy the credit deficits, Qoros may be required to purchase NEV credits, which may be costly, or be subject to penalties, including disqualification of new product registration.
ZIM
We have a 32% stake in ZIM, an international shipping company that operates in select markets. ZIM was founded in Israel in 1945, and has over 70 years of experience in the shipping industry providing customers with seaborne transportation and logistics services and solutions. As of December 31, 2017, ZIM operated 81 vessels (of which 7 were owned and 74 were chartered) with a total shipping capacity of 385,974 TEUs. As of December 31, 2017, ZIM chartered 92% of its capacity, and approximately 63% of its charter leases by capacity have durations of less than one year.
87
As of December 31, 2017, ZIM operated a global network of over 50 weekly lines, calling at approximately 267 port of calls in approximately 72 countries. ZIM’s network includes strategically located hubs and regional feeder lines to increase geographical coverage. ZIM has cooperation agreements with other leading container liner companies and alliances, allowing ZIM to increase its fleet utilization by sharing capacity, expand its service offering and benefit from cost savings. ZIM’s vessels have capacities ranging from less than 1,000 TEUs to approximately 11,000 TEUs. Within ZIM’s global network, ZIM offers a variety of services, including land transportation and logistical services, as well as specialized shipping solutions, such as the transportation of out-of-gauge cargo, refrigerated cargo and hazardous cargo.
Pursuant to ZIM’s articles of association, Kenon currently has the right to appoint up to 2 directors to ZIM’s board of directors (even if our interest in ZIM’s share capital otherwise entitles us to appoint more than 2 directors to ZIM’s board of directors). This right will expire if ZIM’s board of directors is comprised of more than nine directors, in which case Kenon will be entitled (alone or together with others) to appoint a number of directors that corresponds to its equity interest in ZIM.
ZIM’s Industry Update
In recent years, conditions in the shipping industry have been challenging due to a large supply-demand gap and an increase in vessel capacity. In 2016, freight rates were historically low, but began to increase moderately in the second half of 2016 and, on the aggregate, continued to increase in 2017, as a result of, among other factors, increased idle fleet levels and intensive scrapping activity, as well as the receivership of Hanjin, one of the leading companies in the shipping industry. In addition, in 2017, demand for containerized goods increased as a result of global GDP growth which resulted in increased private consumption. These factors resulted in improved profitability for the shipping industry in 2017.
The oversupply of vessel capacity which has negatively affected the shipping industry in recent years is expected to continue in the near future as the global fleet continues to increase. In response, carriers and vessel owners continued scrapping, as approximately 200 vessels representing approximately 664,717 TEUs and approximately 160 vessels (representing approximately 427,030 TEUs) were sold for demolition in 2016 and 2017, respectively, thereby offsetting in part the increase in capacity from new vessels.
The shipping industry has also been affected by volatility in bunker prices, which have declined from their levels in 2014. The decrease in bunker prices improved shipping companies' cost structures and supported household spending which increases private consumption, but also resulted in downward pressure in freight rates, as customers put pressure on shipping companies to reduce freight rates. Bunker prices have increased moderately since the end of 2016, but remain volatile due to, among others, uncertainty regarding levels of U.S. output. Further increases in bunker prices may affect ZIM’s margins.
In addition, the container shipping market has experienced significant consolidation as carriers look for operational savings that will improve efficiency and margins. In recent years, the shipping industry has experienced extensive industry consolidation and M&A activity, resulting in rising market concentration levels.
In line with the trend towards consolidation, a number of large strategic alliances and cooperations have been reorganized or formed, including the Ocean Alliance (consisting of COSCO Shipping, CMA CGM Shipping, Evergreen Marine and Orient Overseas Container Line) and the Alliance (consisting of Hapag Lloyd, Yang Ming MOL, NYK Line and K Line Shipping).
ZIM’s Description of Operations
ZIM operates in the liner shipping sector and provides container space/allocation in connection with its operation of regular routes between fixed destinations, within and between trade zones, according to set schedules and anchoring at ports in accordance with a predetermined schedule and according to either pre-determined or spot rates. ZIM operates globally, although its key operational activities are conducted in the Trans-Pacific trade zone, the Asia (including Indian Sub-Continent)-Black Sea/ East Mediterranean Sea trade zones and the Intra-Asia trade zone. In 2017, these trade zones accounted for approximately 70% of ZIM’s total carried volume (measured in TEUs).
88
ZIM competes with other liner shipping companies to provide transport services to customers worldwide. The market is significantly concentrated with the top five carriers accounting for approximately 64% of the global capacity, and the remaining top carriers each controlling less than 5% of the capacity as of December 2017. ZIM controls approximately 2% of the global container shipping capacity and is ranked twelfth among shipping carriers globally as of January 2018 (in terms of TEU capacity) (as compared to a ranking of sixteenth in January 2017, reflecting industry consolidation).
To compete in an oversupplied market and to minimize costs, the main containership operators have created, and are continuing to create and enter into alliances of cooperative operational arrangements. These alliances enable rationalization of the activities of the carriers, realization of economies of scale in the operation of vessels and utilization of port facilities, promotion of technical and economic progress and greater, more efficient utilization of container and vessel capacity. ZIM is not a member of an alliance. However, ZIM is party to a wide range of operational partnerships, including vessel sharing agreements, swap agreements, and slot purchase agreements with other carriers in most of the trade zones in which it operates. For further information on the risks related to competition within the shipping industry and ZIM’s participation in cooperative operational agreements, see “
Item 3.D Risk Factors—Risks Related to Our Other Businesses—Risks Related to Our Interests in ZIM—ZIM does not benefit from the efficiencies of participating in strategic alliances and the ability to enter into such alliances and the participation in operational partnerships in the shipping industry may be limited, which may adversely affect ZIM’s business.
” In light of such industry dynamics, ZIM continues to monitor its operational costs and has implemented additional cost reduction practices in order to position itself as a more efficient and profitable carrier.
The map below illustrates ZIM’s trade zones of operation, as of December 31, 2017, and the percentage of TEUs transported by zone:
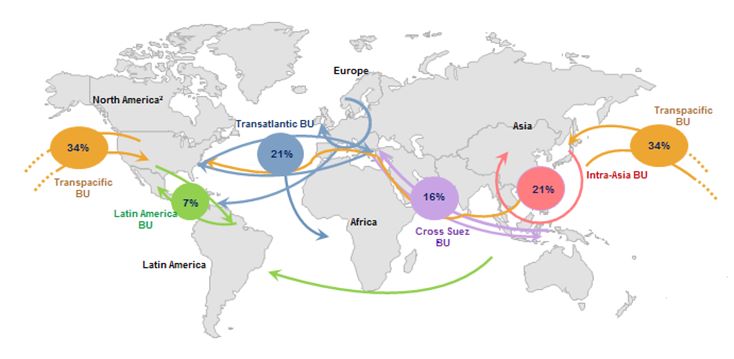
89
The following table sets forth, a description of the major trade zones or sub-trade zones in which ZIM operates, and the distribution of TEUs transported by ZIM within each zone, for each of 2017, 2016 and 2015:
|
2017
|
2016
|
2015
|
||||||||||||
|
Business Unit
|
Description of Business Unit
|
TEUTransported(%)
|
TEU Transported (%)
|
TEUTransported(%)
|
||||||||||
|
Pacific
|
The Pacific BU consists of the Trans-Pacific trade zone, which covers trade between Asia (mainly China) and the east coast and west coast of the U.S., Canada, Central America and the Caribbean
|
34.2
|
33.6
|
34.7
|
||||||||||
|
Cross Suez
|
The Cross Suez BU consists of the Asia-Europe trade zone, which covers trade between Asia and Europe through the Suez Canal, primarily through the Asia-Black Sea/Mediterranean Sea sub-trade zone
|
15.9
|
16.5
|
15.4
|
||||||||||
|
Intra-Asia
|
The Intra-Asia BU consists primarily of the Intra-Asia trade zone, which covers trade within regional ports in Asia, as well as trade between Asia and Africa
|
21.1
|
20.3
|
18.5
|
||||||||||
|
Atlantic
|
The Atlantic BU consists of the Trans-Atlantic trade zone, which covers the trade between the Mediterranean to U.S. east and west coasts and the Caribbean, as well as Intra trades which include the East Mediterranean, West Mediterranean and North Europe and the Mediterranean to West Africa trade
|
21.3
|
21.4
|
22.4
|
||||||||||
|
Latin America
|
The Latin America BU consists of the Intra-America trade zone, which covers trade within regional ports in the Americas as well as trade between South American east coast and Asia and the Mediterranean to South America east coast via the Atlantic Ocean
|
7.4
|
8.3
|
9.0
|
||||||||||
|
Total
|
|
100.0
|
100.0
|
100.0
|
||||||||||
ZIM’s Description of Fleet
ZIM operates in the liner shipping sector and generates revenue from fees paid to it in exchange for transportation services provided by it (through deployment of its fleet of vessels it owns or charters to ZIM’s customers). As of December 31, 2017, ZIM’s fleet included 81 vessels (as compared to 72 vessels as of December 31, 2016). ZIM's fleet as of December 31, 2017 consisted of 80 container vessels and 1 vehicle transport vessel, of which 7 vessels were indirectly owned by ZIM (through subsidiaries established for vessel-holding purposes only) and 74 vessels were chartered (5 of these are defined as financial leases). ZIM has re-delivery dates ranging from 2018 to 2026. As of December 31, 2017, the total capacity of ZIM’s fleet of vessels (both owned and chartered) was 385,974 TEUs (compared to 322,566 TEUs as of December 31, 2016).
90
The following table sets forth summary information relating to ZIM’s vessels as of December 31, 2017, differentiating between owned and chartered vessels, and the remaining period of the charter:
|
Container Vessels
|
||||||||||||||||
|
Number
|
Capacity
(TEU) |
Other Vessels
|
Total
|
|||||||||||||
|
Vessels owned by ZIM
|
7
|
32,023
|
-
|
7
|
||||||||||||
|
Vessels chartered from parties related to ZIM
|
||||||||||||||||
|
Periods up to 1 year (from December 31, 2017)
|
2
|
8,500
|
1
|
1
|
3
|
|||||||||||
|
Periods between 1 to 5 years (from December 31, 2017)
|
3
|
14,792
|
-
|
3
|
||||||||||||
|
Periods over 5 years (from December 31, 2017)
|
-
|
-
|
-
|
-
|
||||||||||||
|
Vessels chartered from third parties
|
||||||||||||||||
|
Periods up to 1 year (from December 31, 2017)
|
50
|
214,629
|
-
|
50
|
||||||||||||
|
Periods between 1 to 5 years (from December 31, 2017)
|
12
|
66,411
|
-
|
12
|
||||||||||||
|
Periods over 5 years (from December 31, 2017)
|
6
|
49,619
|
-
|
6
|
||||||||||||
|
Total
|
80
|
385,974
|
1
|
1
|
81
|
|||||||||||
1.
Vehicle transport vessels.
Industry analysts expect shipping companies’ deployments of larger vessels to increase and, in particular, to increase in certain of the key trade zones in which ZIM operates and intends to increase its operations. The recent Panama Canal expansion and increase in the size of vessels through the canal is illustrative of the industry trend towards larger vessels. To remain competitive within the Asia-USEC trade zone, ZIM has increased the size of certain of its vessels in this trade zone, but does not operate the maximum-sized vessels (e.g., 13,000-14,000 TEU vessels) in this zone. ZIM assesses the size of its vessels in other routes.
Chartered Vessels
ZIM charters vessels under charter agreements for varying periods. With the exception of those vessels whose rates were set in connection with ZIM’s 2014 debt restructuring, ZIM’s charter rates were fixed at the time of entry into the charter, and depend upon market conditions existing at that time. As of December 31, 2017, of the 74 vessels chartered by ZIM under lease arrangements:
| · |
68 vessels were chartered under a “time charter,” which consists of chartering the vessel capacity for a given period of time against a daily charter fee, with the crewing and technical operation of the vessel handled by its owner, including 6 vessels chartered under a time charter from parties related to ZIM;
|
| · |
1 vessel was chartered under a “bareboat charter,” which consists of the chartering of a vessel for a given period of time against a charter fee, with the operation of the vessel handled by the charterer; and
|
| · |
5 vessels were chartered under financial lease agreements.
|
Subject to any restrictions in the applicable lease arrangement, the charterer determines the type and quantity of cargo to be carried as well as the ports of loading and discharging. ZIM’s vessels operate worldwide within the trading limits imposed by its insurance terms. The technical operation and navigation of ZIM’s vessels remain, at all times, the responsibility of the vessel owner, who is generally responsible for the vessel’s operating expenses, including the cost of crewing, insuring, repairing and maintaining the vessel, costs of spares and consumable stores, tonnage taxes and other miscellaneous expenses.
Fleet Management
ZIM provides its own operational and technical management services for each of the vessels that it owns.
ZIM operates vessels in accordance with the ISM Code and the International Ship and Port Facilities Security Code, or ISPS Code, in addition to developing, implementing and maintaining a safety management system in accordance with the ISM Code. In addition, ZIM follows the regulations of the International Maritime Organization, or IMO, and intends to make its vessels compliant with the new IMO regulations expected to come into effect in 2020. These regulations will require shipping companies to either utilize fuels which emit less sulfur or install scrubbers on vessels to reduce the emission of sulfur.
91
Non-Fleet Equipment
In addition to the vessels that ZIM owns and charters, ZIM owns and charters a significant number of shipping containers. As of December 31, 2017, ZIM held approximately 360,000 container units with a total capacity of approximately 590,000 TEUs, of which approximately 78% were owned by ZIM (including under finance leases) and approximately 22% were chartered.
ZIM’s Customers
In 2017, ZIM had more than 29,300 customers. ZIM’s customers are divided into “direct customers”, including exporters and importers, and “forwarders,” these being non-vessel operating common carriers (i.e., entities engaged in assembling cargos from various customers and the forwarding thereof through a shipping company). In 2017, 32% of ZIM’s customers (in terms of transported volume) were “direct customers,” while the remainder were “forwarders.” ZIM does not depend upon any single customer.
ZIM’s Seasonality
Activity in the marine container shipping industry is affected by various seasonality factors. Generally, the first quarter of the calendar year is marked by a decrease in demand for shipping, and the third quarter is generally the strongest quarter with respect to shipping demand.
Recently, the seasonality factors have not been as apparent as they have been in the past. The marine shipping market is dynamic and volatile by its very nature and has been marked in recent years by relative instability. As global trends that affect the shipping market have been changing rapidly in recent years, it remains difficult to predict these trends and the shipping industry’s activities.
Changes to ZIM’s Executive Management
In 2017, Mr. Eli Glickman was named as President and Chief Executive Officer of the company. In addition, in 2017, Mr. Yohai Benita was named as the acting Chief Financial Officer of ZIM.
ZIM’s Legal Proceedings
Derivative Action Concerning ZIM Restructuring
During 2014 a petition for approval of a derivative action was submitted to the District Court in Tel Aviv by a shareholder of the Israeli Corporation Ltd., or IC, against, among others, IC and the ZIM. The petitioner argues that the transaction executed by IC in connection with its participation in ZIM’s restructuring deviates from the approval of IC's shareholders meeting and that the condition precedent to the execution of IC’s participation in the restructuring, as approved by such meeting, regarding the transferability of the shares in ZIM was not fulfilled. The petitioner moves to have the defendants (other than IC and ZIM) to convene IC's shareholders meeting to approve IC’s participation in the ZIM’s restructuring or have the defendants (other than IC) compensate IC in the amount of US$ 27.4 million which, as argued, reflects the damage caused to IC due to its participation in ZIM's restructuring, being the decreased value of ZIM’s shares held by IC in consideration therefore, due to the incompletion of the said condition precedent. During 2016, the derivative action was rejected by the court, followed by an appeal filed by the petitioner. No provision was recorded in relate to the said derivative action.
2016 Class Action—Local Charges
In January 2016, ZIM’s wholly-owned agency in Israel, along with other third party shipping agencies, was served with a filing of a class action. The applicant alleges, among other things, that the agency has, in breach of applicable port regulations, charged their customers higher rates for services rendered than are allowed and charged for services which are not included in the list of services detailed in the regulations. ZIM has not recorded a provision in relation to the class action.
Competition law issues
ZIM is involved in a number of legal matters, including industry-wide investigations regarding competition law issues and applications to approve the filing of class actions, some of which may involve significant monetary amounts. The developments and/or resolutions of such matters, which include either negotiations or litigation, are subject to a high level of uncertainty that cannot be reliably quantified.
During the reported period, ZIM has been served, together with another defendant, with an application to approve the filing of a class action in Israel, related to alleged breaches of competition rules in respect of carriage of vehicles from South Korea. The applicants estimate the total damages caused to the class at a total of NIS 403 million (approximately $ 115 million) based on an expert opinion attached to the application. However, from a preliminary review of the opinion, it should be noted that the estimate is based on data which is not necessarily correct and/or relevant to ZIM.
In addition, ZIM representatives received subpoenas in connection with an investigation by the United States Department of Justice Antitrust Division into the container liner shipping industry in the United States. ZIM is currently reviewing this case with its legal advisors, who are in contact with the Department of Justice regarding ZIM’s compliance with the subpoenas. As the investigation is still in its initial stages, it is too early to determine the outcome of this investigation and the possible exposure therefrom, if any.
Court’s Ruling against Shipping Agencies in certain jurisdictions
In one jurisdiction, courts ruled against the operation of shipping agencies in such jurisdiction, including a subsidiary of ZIM. The shipping agencies have appealed to the supreme court against this ruling.
92
ZIM’s Regulatory, Environmental and Compliance Matters
Government and international regulation significantly affects the ownership and operation of vessels. ZIM is subject to many legal provisions relating to the protection of the environment, including with respect to the emissions of hazardous substances, SOx and NOx gas exhaust emissions, the operation of vessels while at anchor by means of generators, and the use of low-sulfur fuel. ZIM could be exposed to high costs in respect of environmental damages (to the extent that the costs are not covered by its insurance policies), criminal charges, and substantive harm to its operations and goodwill, if and to the extent that environmental damages are caused by its operations. ZIM instructs the crews of its vessels on the environmental regulatory requirements and operates in accordance with procedures that ensure its in compliance with such regulatory requirements. ZIM also insures its activities, where effective for it to do so, in order to hedge its environmental risks. ZIM’s vessels are also subject to the standards imposed by the IMO, the United Nations specialized agency with responsibility for the safety and security of shipping and the prevention of marine pollution by ships.
In 2017, ZIM took measures to comply with the International Maritime Organization, or IMO, Ballast Water regulations. In addition, ZIM has taken measures to comply with the amendments of the IMO IMDF code, and the amendments to the International Convention for the Prevention of Pollution from Ships (MARPOL) .
ZIM has also taken steps to comply with the Chinese Ministry of Transportation regulations which stipulate a 0.5% sulfur content restriction on fuels used in all Chinese ports and the U.S National Oceanic and Atmosphere Administration's seasonal 10 knot speed limit on Mid-Atlantic coastal areas between November 1, 2017 and April 30, 2018. These regulations may increase ZIM’s operational costs.
In addition, ZIM may be required to incur significant costs in connection with modifications to environmental regulations applicable to shipping companies. For example, ZIM will be required to comply with IMO regulations relating to sulfur emissions which are expected to come into effect in 2020. In order to comply with these regulations, ZIM will be required to either use fuel oil which is more costly than that it currently uses or modify its vessels by installing scrubbers, either of which may entail significant costs.
ZIM is also subject to extensive regulation that changes from time to time and that applies in the jurisdictions in which shipping companies are incorporated, the jurisdictions in which vessels are registered (flag states), the jurisdictions governing the ports at which the vessels anchor, as well as regulations by virtue of international treaties and membership in international associations. Changes and/or amendments to the regulatory provisions applying to ZIM (e.g., the U.S.’s recent policy requiring the scanning of all cargo en route to the United States) could have a significant adverse effect on ZIM’s results of operations. Additionally, the non-compliance of a port with any of the regulations applicable to it may also adversely impact ZIM’s results of operations, by increasing ZIM’s operating expenses.
Additionally, ZIM is subject to competition regulations worldwide. For example, in the European Union, ZIM is subject to articles 101 and 102 of the Consolidated Version of the Treaty on the Functioning of the European Union. ZIM’s transport activities serving the U.S. ports are subject to the Shipping Act of 1984, as modified by the Ocean Shipping Reform Act of 1998. With respect to Israel, ZIM is subject to the general competition law established in the Israel Antitrust Law, 1988. In certain jurisdictions, exemptions from antitrust laws to certain agreements between ocean carriers that operate in the aforementioned jurisdictions, such as slot exchange agreements and other operational partnerships, are in effect. ZIM is party to certain operational and commercial partnerships with other carriers in the industry and each of those arrangements, as well as any future arrangements it becomes party to, must comply with the applicable antitrust regulations in order to remain protected and enforceable.
ZIM is also subject to Israeli regulation regarding, among other things, national security and the mandatory provision of ZIM’s fleet, environmental and sea pollution, and the Israeli Shipping Law (Seamen) of 1973, which regulates matters concerning seamen, and the terms of their eligibility and work procedures.
Finally, ZIM is subject, in the framework of its international activities, to laws, directives, decisions and orders in various countries around the world that prohibit or restrict trade with certain countries, individuals and entities.
For further information on ZIM’s regulatory risks, see “
Item 3.D Risk Factors—Risks Related to Our Other Businesses—Risks Related to Our Interest in ZIM—ZIM is subject to environmental regulation and failure to comply with such regulation could have a material adverse effect on ZIM’s business” and “Item 3.D Risk Factors—Risks Related to Our Other Businesses—Risks Related to Our Interest in ZIM—The shipping industry is subject to extensive government regulation and standards, international treaties and trade prohibitions and sanctions.
”
ZIM’s Special State Share
In connection with the 2004 sale of the holdings of the State of Israel in ZIM to IC, ZIM ceased to be a “mixed company” (as defined in the Government Companies Law of Israel) and issued a Special State Share to the State of Israel. The objectives underlying the Special State Share are to (i) safeguard ZIM’s existence as an Israeli company, (ii) ensure ZIM’s operating ability and transport capacity, so as to enable the State of Israel to effectively access a minimal fleet in an emergency crisis, or for security purposes and (iii) prevent elements hostile to the State of Israel or elements liable to harm the State of Israel’s vital interests or its foreign or security interest or Israel’s shipping relations with foreign countries from having influence on ZIM’s management. In connection with the completion of ZIM’s restructuring plan, certain transferability restrictions imposed by the terms of the Special State Share were revised. The key terms and conditions of the revised Special State Share include the following requirements:
|
·
|
ZIM must be, at all times, a company incorporated and registered in Israel, whose headquarters and registered main office are domiciled in Israel;
|
93
|
·
|
at least a majority of the members of ZIM’s board of directors, including the Chairman of the board, as well as the Chief Executive Officer or the person serving as its Chief Business Officer, whatever his/her title may be, must be Israeli citizens;
|
|
·
|
any transfer of vessels shall be invalid vis-à-vis ZIM, its shareholders and any third party if, as a result thereof, the minimum fleet target mandated by the State of Israel will not be maintained and the holder of the Special State Share has not given prior written consent thereto;
|
|
·
|
any holding and/or transfer of shares and/or allocation that confers possession of shares in ZIM at 35% or more of its issued share capital, or that vests the holder thereof with control over ZIM, including as a result of a voting agreement, shall be invalid vis-à-vis ZIM, its shareholders and any third party, if the holder of the Special State Share has not given prior written consent thereto; and
|
|
·
|
any transfer of shares granting the owner a holding exceeding 24% but not exceeding 35%, shall require prior notice to the State of Israel, including full information regarding the transferor and the transferee, the percentage of the shares held by the transferee after the transaction will be completed, and the relevant information about the transaction, including voting agreements and agreements for the appointment of directors (if applicable). In any case, if the State of Israel determines that a transfer of such shares shall constitute potential harm to the State of Israel’s security, or any of its vital interests, or that it has not received the relevant information in order to make a decision, the State of Israel shall be entitled to notify the parties within 30 days that it opposes the transaction, and will be obligated to justify its opposition. In such a situation, the requestor of the transaction shall be entitled to transfer this matter to the competent court, which shall hear and rule on the subject in question.
|
Any change, including an amendment or cancellation of the rights afforded to the State of Israel by the Special State Share shall be invalid with respect to ZIM, its shareholders and any third party, unless it is approved in advance and in writing by the State of Israel.
Kenon’s ownership of ZIM shares is subject to the terms and conditions of the Special State Share, which restricts Kenon’s ability to transfer its equity interest in ZIM to third parties. The terms of the State of Israel’s consent of Kenon’s and Idan Ofer’s status, individually and collectively, as a “Permitted Holder” of ZIM’s shares, stipulates, among other things, that Kenon’s transfer of the means of control of ZIM is limited if the recipient is required to obtain the State of Israel’s consent, or is required to notify the State of Israel of its holding of ZIM shares pursuant to the terms of the Special State Share, unless such consent was obtained by the recipient or the State of Israel did not object to the notice provided by the recipient. In addition, the terms of the consent provide that, if Idan Ofer’s ownership interest in Kenon is less than 36% or Idan Ofer ceases to be the controlling shareholder, or sole controlling shareholder of Kenon, then Kenon’s rights with respect to its shares in ZIM will be limited to the rights applicable to an ownership of 24% of ZIM, until or unless the State of Israel provides its consent, or does not object to, this decrease in Idan Ofer’s ownership or control. Therefore, if Mr. Ofer sells a portion of his interest in Kenon and owns less than 36% of Kenon, or ceases to be Kenon’s controlling shareholder, then Kenon’s right to vote and receive dividends in respect of its ZIM shares, for example, will be limited to those available to a holder of 24% of ZIM’s shares (even if Kenon holds a greater percentage of ZIM’s shares). “Control”, for the purposes of this consent, is as defined in the State of Israel’s consent, with respect to certain provisions. Additionally, the State of Israel may revoke Kenon’s permit if there is a material change in the facts upon which the State of Israel’s consent was based, or upon a breach of the provisions of the Special State Share by Kenon, Mr. Ofer, or ZIM. For information on the risks related to the State of Israel’s ownership of the Special State Share, including with respect to IC’s transfer of its interest in ZIM to us, see “
Item 3.D Risk Factors —Risks Related to Our Other Businesses—Risks Related to Our Interest in ZIM—Israel holds a Special State Share in ZIM, which imposes certain restrictions on ZIM’s operations and our equity interest in ZIM.
”
Tower
Tower is a pure-play independent specialty foundry dedicated to the manufacture of semiconductors. On July 23, 2015, consistent with our strategy to realize value for our shareholders by, among other things, distributing our interests in our non-primary businesses to our shareholders rationally and expeditiously, we completed the pro rata distribution in specie of 18,030,041 ordinary shares of Tower, representing 23% of the then currently outstanding Tower shares and substantially all of our interest in Tower, to holders of our ordinary shares. As a result of this distribution, we recognized a $210 million gain in the year ended December 21, 2015, which reflects the difference between the fair market value of the Tower ordinary shares held by us on the distribution date ($255 million based upon the closing price of the Tower shares on NASDAQ on the date of our distribution of such shares to our shareholders) and the carrying amount of Tower’s shares at the time of the distribution ($45 million). In 2016, we sold our remaining interest in Tower.
94
Tower’s results of operations are reflected in our share in income (losses) of associated companies, net of tax, for all periods prior to June 30, 2015. For further information on Tower, see “
Distribution of our interest in Tower”
and “
Item 5.A—
Operating Results— Year Ended December 31, 2016 Compared to Year Ended December 31, 2015--Share In Income (Losses) of Associated Companies, Net of Tax—Tower
.”
Remaining Businesses
We have a 91% equity interest in
Primus
, an innovative developer and owner of a proprietary natural gas-to-liquid technology process.
Additionally, until December 24, 2014, we owned a 69% equity interest in
Petrotec
, a European producer of biodiesel generated from used cooking oil. On December 24, 2014, Renewable Energy Group, Inc., or REG, a NASDAQ-listed advanced biofuels producer and developer of renewable chemicals, purchased Kenon’s holdings in Petrotec. As consideration for REG’s purchase of Petrotec’s shares, Kenon received approximately $20.9 million, which was paid in the form of newly-issued shares of REG. Kenon has sold its interest in REG.
Primus
Primus’ Description of Operations
Primus is an innovative developer of a proprietary liquids technology, the STG+ process, which is designed to produce liquid hydrocarbons from synthesis gas, or syngas, derived from natural gas (including synthetic natural gas) and other feedstocks (e.g., ethane). Primus’ STG+ process converts syngas into methanol, high-octane gasoline or stream miscible with crude. The availability of large shale gas reserves in the U.S. and the low cost of natural gas in relation to the cost of methanol enables Primus to utilize domestically produced natural gas in its STG+ process.
Primus’ business strategy is focused on three primary activities:
| · |
Gas Flaring Solutions.
Primus offers gas flaring solutions to convert natural gas that would otherwise be flared into gasoline or crude oil diluent. Primus intends to deploy its STG+ technology for operators seeking to remain in compliance with strict anti-flaring regulations and monetize natural gas that would otherwise be flared.
|
| · |
Gasoline Production.
Primus intends to provide its STG+ process to convert natural gas into reformulated blend-stock for oxygen blending (RBOB) gasoline as blend-stock at industrial and chemical plant locations that have spare syngas capacity and in emerging international markets where low value natural gas can be converted to high value (usually imported) gasoline.
|
| · |
Methanol Production.
Primus intends to own, operate and develop, or license the technology for the operation and development of, methanol production plants to service local users of methanol who are located far from larger-scale methanol plants.
|
Primus seeks to develop, build, own and operate a portfolio of facilities where the company can access low-cost natural gas feedstock and take advantage of lower product transportation costs resulting from locating producing assets closer to markets than competing sources. Primus seeks to generate revenues from the sale of methanol, gasoline and stream miscible with crude from its operating plants as well as from construction management services, engineering fees, technology licensing fees, production royalties, and other opportunities the company identifies. Primus intends to finance the first series of plants through non-recourse project financing and is seeking a strategic partner to participate alongside Primus in the equity component of the investment.
95
Primus’ STG+ process improves upon existing gas-to-liquid technologies by integrating all reactors into a single-loop process, thereby reducing capital and operating costs while increasing reliability and yield. Primus expects the STG+ process to operate on a smaller scale than the competing methanol-to-gasoline process utilized by other, non-traditional gasoline producers. Primus expects its customers to be able to distribute, store and pump its gasoline using existing fuel infrastructures and expects that the gasoline produced may be utilized in unmodified, conventional vehicles.
Between 2011 and 2013, Primus operated a pilot scale test facility at its headquarters in Hillsborough, New Jersey. Primus’ pilot plant consisted of two major units, the first being a wood pellet gasifier that produced syngas, and the second being the STG+ process. The STG+ process has been successfully validated at the pilot scale. Primus used the data obtained from such operations to optimize the design of its demonstration plant, which was completed in August 2013. Primus’ demonstration plant generates syngas from natural gas, and converts the syngas into methanol and high-octane gasoline. The demonstration plant has a nameplate production capacity for gasoline of 12.7 gallons per hour, or 100,000 gallons per year, and for methanol of 32.4 gallons per hour or 255,000 gallons per year, and was designed to replicate the key scale parameters of a larger plant, so as to minimize potential scale-up risks. Between 2013 and 2017, Primus successfully operated the demonstration plant for approximately 10,000 hours. The same reactor design and catalyst are in use in other sites in slightly different services around the world.
In the year ended December 31, 2017, Primus did not generate material revenues from its operations. As of December 31, 2017, we have invested approximately $96 million (which consists of $32 million invested by Kenon and $64 million invested by IC prior to the spin-off) into Primus. In January 2018, we provided Primus an additional $3.0 million via convertible notes.
In connection with Primus’ further development and our efforts to maximize its value, we may provide additional capital to Primus, in the form of debt or equity financing, if deemed appropriate to facilitate Primus’ operational and development capital requirements.
We own 91% of Primus and the remaining 9% is primarily held by Primus’ founders; on a fully diluted basis, giving effect to management share options, Kenon’s ownership interest in Primus is approximately 80%.
Primus’ Principal Markets; Customers
Primus intends to develop, build, own and operate methanol production plants in North America and develop, build, own and operate methanol, gasoline or stream miscible with crude production plants, or license the technology for the operation and development of methanol or gasoline production plants, outside of North America. The intended off-takers of Primus’ methanol are expected to primarily consist of local users of methanol who are located far from large-scale methanol production plants. In the United States, methanol is generally produced in the Gulf Coast and is transported to off-takers throughout the country. Due to transportation costs, methanol customers located outside the Gulf Coast region pay a substantially higher price than customers around the Gulf Coast. Primus intends to construct and own plants in such regions to capture the price spread resulting from the transportation costs and lower costs of natural gas.
Primus intends to provide its gas flaring solutions to customers throughout the world, particularly those in gas-prone regions with strict gas flaring regulations. The production of oil results in the “flaring” of natural gas—a cheap method disposing of, rather than utilizing, associated natural gas. Such flaring has become a concern in many countries as a result of the associated emissions in greenhouse gases and participation in the World Bank’s Zero Routine Flaring by 2030 Initiative. As Primus’ STG+ process converts syngas into gasoline blendstock, Primus can provide its potential customers with the technological tools to transform the natural gas associated with oil production and flaring into gasoline or a diluent to be blended into crude oil.
Potential customers of the gasoline, methanol and stream miscible with crude produced by Primus’ technology include existing refiners of crude oil, industrial and chemical users, purchasers of oil-based fuels, and blenders of transportation fuels and direct end-users, such as retailers.
Primus’ Project Pipeline
Primus is engaging in discussions with potential customers and joint venture partners with respect to potential projects, including for the construction of methanol plants, the conversion of syngas into gasoline and stream miscible with crude and the provision of gas flaring solutions. Should Primus secure these potential projects, which may be located throughout the world, Primus may be compensated through a mix of revenues from sales to off-takers, construction management and engineering fees, technology licensing fees and production royalties. These projects also give Primus the opportunity to own equity in the project. At this time, these projects have not been secured.
96
Primus’ Raw Materials and Suppliers
In connection with the operation of Primus’ demonstration plant in the year ended December 31, 2017, a single supplier provided Primus with its natural gas requirements, representing an immaterial amount of Primus’ operating expenses in the year ended December 31, 2017.
Primus’ Competition
Primus seeks to operate as a producer of alternative liquids. Its competitors are expected to include other gas-to-liquids companies and companies using other feedstocks to produce syngas, such as ExxonMobil MTG, Haldor Topsøe TIGAS or other newly-established ventures that provide a different technological approach to the production of syngas. Primus also competes with traditional producers of gasoline and methanol. As Primus’ STG+ process is further developed to produce gasoline and methanol, Primus also expects to compete with the traditional and alternative producers of these fuels. Primus believes that its (i) direct synthesis of the desired product, (ii) high yield and cost-effective results, and (iii) selective process allows it to remain competitive with its competitors in both areas.
Project Marcellus
Primus is working to complete the financing of its first project (Project Marcellus), a 158MT/day modular methanol plant that will be located in West Virginia. The total project cost estimate is $70 million. Primus is seeking to raise $35 million in non-recourse debt financing and has approached several banks and is in discussions with a potential equity investor to take a significant part of the equity commitment. In order to minimize its exposure to commodity risk, Primus is in discussions with a large oil and gas company, which would provide gas supply, guarantee some of the project debt and secure the methanol offtake.
The portion of equity
investment to be made by Primus in the project would likely require funding from Kenon.
Primus’ Patents, Licenses, Etc.
Primus’ intellectual property portfolio includes: three issued U.S. patents on its core technology, the “Single Loop Process”, to produce liquid fuels from syngas; two issued U.S. patents on its first commercial product, specifically the “Fuel Composition”; and several additional patent applications and trade secrets that are generally categorized into the following areas: liquid fuel synthesis, liquid fuel composition, incremental improvements and customization, and biomass gasification.
Primus has also filed corresponding patent applications under the Patent Cooperation Treaty and has filed national phase applications in multiple countries for its base process patent. Primus actively evaluates its intellectual property portfolio so as to optimize its intellectual property strategy and to protect the authenticity and commercial value of its STG+ process.
Primus’ Property, Plants and Equipment
Primus’ fully operational 300 gallon-per-day integrated industrial demonstration plant located in Hillsborough, New Jersey, was successfully constructed in August 2013. The demonstration plant converts natural gas feedstock into syngas which is, in turn, converted into high-octane gasoline or methanol. The demonstration plant has a nameplate production capacity for gasoline of 12.7 gallons per hour, or 100,000 gallons per year, and for methanol of 32.4 gallons per hour or 255,000 gallons per year. Primus expects this demonstration plant to provide the performance data necessary for the design and development of other plants.
Primus’ Regulatory, Environmental and Compliance Matters
Primus’ operations are affected by various local and foreign laws, rules, regulations and authorities. As a result, changes in various types of regulations could affect Primus’ business adversely. For example, the implementation of new safety, environmental or legal requirements could impact Primus’ ability to produce gasoline and methanol, or use the STG+ process. Furthermore, changes to the various regulations governing gas flaring could impact Primus’ ability to provide gas flaring solutions. The impact of these changes in regulation could adversely affect Primus’ business, financial condition and results of operations even where the specific regulations do not directly apply to Primus or to its technologies, products or services.
97
Discontinued Operations – Inkia Business
Sale of the Inkia Business
Share Purchase Agreement
On November 24, 2017, Kenon, through its subsidiaries Inkia and IC Power Distribution Holdings Pte. Ltd. ("ICPDH") entered into a share purchase agreement with Nautilus Inkia Holdings LLC which is an entity controlled by I Squared Capital, pursuant to which Inkia and ICPDH agreed to sell all of their interests in power generation and distribution companies in Latin America and the Caribbean (the “Inkia Businesses”) in consideration for $1,332 million, consisting of (i) $935 million cash proceeds paid by the buyer, (ii) retained cash at Inkia of $222 million, and (iii) $175 million, which was deferred in the form of a Deferred Payment Obligation bearing interest of 8% per annum, payable in kind. The buyer also assumed Inkia's obligations under Inkia's $600 million 5.875% Senior Unsecured Notes due 2027. The sale was completed in December 2017. The final purchase price is subject to certain adjustments, including adjustments for working capital, debt and cash at closing.
This sale is consistent with Kenon's strategy, which includes monetization of its business and distribution of proceeds to shareholders.
In December 2017, the sale was completed, resulting in cash proceeds of approximately $1,332 million, consisting of $1,110 million proceeds paid by the buyer plus retained unconsolidated cash at Inkia of $222 million, reflecting the base purchase price of $1,177 million after certain adjustments, including estimated working capital, debt and cash at closing.
The consideration that Inkia received in the transaction is before estimated transaction costs, management compensation, advisor fees, other expenses and taxes, which are estimated to be in the aggregate approximately $263 million, of which $27 million comprises taxes to be paid upon payment of the $175 million Deferred Payment Obligation. The estimated tax payment includes taxes payable in connection with a restructuring of some of the companies remaining in the Kenon group, which is intended to simplify Kenon’s holding structure. As a result of this restructuring, Kenon now holds its interest in OPC directly. Kenon does not expect any further tax liability in relation to any future sales of its interest in OPC.
Use of Proceeds of Transaction
In January 2018, Kenon used a portion of the proceeds of the transaction to repay debt of IC Power ($43 million of net debt outstanding), and to repay its loan facility with Israel Corporation ($240 million including accrued interest, and $3 million withholding tax).
In December 2017, Kenon's shareholders authorized a capital reduction to enable a potential distribution of a portion of the proceeds received from the sale of the Inkia Business. The Singapore courts approved the capital reduction in February 2018 and Kenon distributed $665 million
in cash to its shareholders
in March 2018
as a return of capital resulting from a capital reduction
.
Indemnification
In relation to the share purchase agreement for the sale, the sellers, Inkia and ICPDH, gave representations and warranties in respect of the Inkia Business and the transaction. Subject to a specified deductibles, caps and time limitations, the sellers have agreed to indemnify the buyer and its successors, permitted assigns, and affiliates, and its officers, employees, directors, managers, members, partners, stockholders, heirs and personal representatives from and against any and all losses arising out of:
| · |
prior to their expiration eighteen months from the date of the closing of the sale (or three years in the case of representations relating to environmental matters), a breach of any of the sellers' representations and warranties (other than fundamental representations) up to a maximum amount of $176.55 million;
|
98
| · |
prior to their expiration upon the expiration of the statute of limitations applicable to breach of contract claims in New York, a breach of any of the sellers' covenants or agreements set forth in the share purchase agreement;
|
| · |
prior to their expiration thirty days after the expiration of the applicable statute of limitations, certain tax liabilities for pre-closing periods and certain transfer taxes, breach of certain tax representations and the incurrence of certain capital gain taxes by the transferred companies in connection with the transaction; and
|
| · |
without limitation with respect to time, a breach of any of the sellers' fundamental representations (including representations relating to due authorization, ownership title, and capitalization).
|
The sellers' obligation to indemnify Nautilus Inkia Holdings LLC shall not exceed the base purchase price.
The sellers' indemnification obligations for any claims under the share purchase agreement that are agreed between the buyer and the Sellers, or that are subject to a final non-appealable judgment, will be supported by the following:
| · |
IC Power's three-year pledge of OPC shares representing 25% of OPC shares as of the closing date;
|
| · |
to the extent any indemnification obligations remain outstanding after the exercise of the above-described pledge (or payments of amounts equal to the value of the pledge), a deferral of $175 million of the purchase price in the form of a four-year $175 million deferred payment agreement, or the Deferred Payment Agreement, accruing interest at a rate of 8% per annum payable-in-kind, which the buyer may use to set-off any such indemnification obligations owed to it (see “
—Nautilus Energy TopCo LLC Deferred Payment Agreement
”); and
|
| · |
to the extent any obligations remain outstanding after
s
eeking recourse against of the Deferred Payment Agreement, a three-year corporate guarantee from Kenon.
|
Subject to certain terms and conditions, the terms of the pledge, the deferred payment agreement and the guarantee may each be extended if there are unresolved claims existing on the applicable expiration dates.
Pledge Agreement with respect to OPC Shares
In connection with the sale of the Inkia Business, ICP (which was the holder of Kenon's shares in OPC at the time of the sale) entered into a pledge agreement with the buyer of the Inkia Business (Nautilus Inkia Holdings LLC) to pledge OPC shares representing 25% of the outstanding shares of OPC as of the date of the pledge agreement in favor of the buyer to secure the sellers’ indemnification obligations under the share purchase agreement for the sale. Following the sale of the Inkia Business, ICP transferred all of its shares in OPC to Kenon. As a result, in February 2018, Kenon and the buyer entered into an amended pledge agreement, pursuant to which Kenon became the pledgor and assumed ICP’s obligations under the pledge agreement. The majority of Kenon’s OPC shares are subject to a lock-up period (imposed following OPC's initial public offering in August 2017), which restricts the amount of shares sold each month until 18 months after the IPO, pursuant to TASE regulation, and are held by the Lock-Up Trustee (as defined below).
Set forth below is a description some of the key provisions of the pledge agreement. The provisions described below are subject to certain conditions described in the agreement which is filed as an exhibit to this annual report.
Pledged Assets
Kenon has pledged 32,971,680 shares of OPC, representing 25% of the outstanding shares of OPC as of the date of the pledge agreement, plus related rights including distributions on those shares and proceeds of sales of such shares and including accounts in which such shares are currently held or may be held in the future and rights in respect of such shares against the trustee holding such shares, all as discussed below.
99
Secured Obligations
The pledged shares secure indemnification claims by the buyer that are "finally determined" (agreed by the parties or pursuant to a non-appealable judgment of a court with proper jurisdiction) under the share purchase agreement and obligations in connection with the pledge agreement and related preservation and foreclosure costs and expenses incurred by the buyer. The pledged shares and cash are held in an account in the name of a trust company, or the Lock-up Trustee, for the benefit of Kenon which account and rights of Kenon against the trust company in connection therewith have been pledged on a first priority basis in favor of the buyer. Additionally, Kenon pledged in favour of the buyer an account in the name of Kenon for the purpose of holding pledged shares that are released from the lock up. The secured obligations are reduced to the extent of indemnification payments to the buyer under the share purchase agreement and to the extent of the net proceeds from sales of shares upon enforcement of the pledge.
Certain Rights of Kenon with respect to the Pledged Shares
Kenon retains voting rights over the pledged shares unless an event of default under the pledge agreement has occurred and is continuing.
All dividends on the pledged shares are paid into the pledged account. Unless an event of default under the pledge agreement has occurred and is continuing,
| · |
Kenon can withdraw dividends paid into that account as follows (i) in the first 365 days from November 24, 2017, if the 30-trading day volume weighted average price, or VWAP prior to drawing such dividends exceeds NIS14.45 Kenon can draw an amount up to 50% of cumulative net income of OPC from January 1, 2017 (such amount is referred to as the "dividend cap"), (ii) during the following 365-day period, if the 30-trading day VWAP prior to drawing such dividends exceeds NIS14.82, Kenon can draw an amount up to the dividend cap and (iii) during the following 365-day period, if the 30-trading day VWAP prior to drawing such dividends exceeds NIS15.17, Kenon can draw an amount up to the dividend cap; and
|
| · |
in addition, on one occasion over the life of the pledge Kenon can draw from the pledged account its pro rata share of OPC dividends up to $25 million paid in respect of all of the pledged shares (by way of example
if the company makes a distribution of US$50 million following the original effective date of the pledge agreement, Kenon is entitled to draw from the pledged account $6.25 million).
OPC has not paid a dividend since the date the pledge was executed, and therefore Kenon has not made such draw.
|
Kenon can sell pledged shares on arms’ length terms in cash at market prices or at customary discounts to market prices for such sales (provided that the discounts do not exceed 5% of market price, based on customary VWAP from such a sale on the TASE), provided that cash equal to the number of pledged shares sold multiplied by NIS 14.105 is deposited into the pledged account.
Release of Pledged Shares
In the event
of any indemnity claims in accordance with the share purchase agreement, pledged shares and cash shall be released in an amount equal to the indemnity payment, with the amount of pledged shares released calculated in accordance with the fair market value of OPC’s ordinary shares based on the 30-trading day VWAP of OPC shares prior to the release, and pledged cash is released prior to pledged shares.
Kenon may also release cash from the pledge by depositing additional OPC shares into the pledged account, with released cash being replaced by a number of OPC shares equal to the amount of cash released divided by the lower of (i) the 30-trading day VWAP of OPC shares prior to the release and (ii) NIS 14.105.
All pledged shares and cash remaining in the pledged account will be released on December 31, 2020, provided that if there are unresolved claims by the buyer for indemnity under the Inkia share purchase agreement, the pledge will continue to apply for pledged assets sufficient (in the case of pledged shares, based on a the 30-trading day VWAP prior to December 31, 2020)
to cover an amount determined by Kenon and the buyer, each acting in good faith (or a third party evaluator or PricewaterhouseCoopers in case the parties cannot agree) equal to a reasonable estimate of the amount ultimately payable on an unresolved claim (including interest and penalties) to be paid under the Inkia share purchase agreement, plus a reasonable estimate of the amount of costs and expenses that are expected to be incurred to resolve the claim plus 10% of the foregoing (the total amount is referred to as the reserve amount). To the extent that such unresolved indemnity claims which results in an extension of the pledge results in a claim amount actually paid exceeding 110% of the reserve amount, Kenon must pay the buyer interest in cash at a rate of 4% per annum on the difference between the amount paid and 110% of the reserve amount from December 31, 2020 until such payment, and to the extent that such unresolved indemnity claims which in an extension of the pledge results in a claim amount actually paid less than 90% of the reserve amount, the buyer must pay Kenon interest in cash at a rate of 4% per annum on the difference between the amount paid and 90% of the reserve amount from December 31, 2020 until the remaining pledged assets are released from the pledge.
100
Events of Default; Enforcement of Pledge
The pledge agreement contains events of default for events such as breaches of representations and warranties or undertakings, certain insolvency or bankruptcy events and a failure by Kenon to pay indemnification claims under the Inkia share purchase agreement which claims have been finally determined and are unpaid for three business days. Upon an event of default for a failure to pay a finally determined indemnification claim or a breach of the repeating representation confirming no insolvency or similar events relating to Kenon, the buyer may take customary enforcement measures, including enforcement of the pledges and sale of pledged shares. Upon any other event of default, the buyer may take possession of the pledged assets and exercise voting rights, but is may not dispose of the pledged assets.
Nautilus Energy TopCo LLC Deferred Payment Agreement
In December 2017, Inkia loaned $175 million to Nautilus Energy TopCo LLC, or Nautilus Energy, as a deferral of a portion of the purchase price for the sale of the Inkia Business. The loan accrues interest at 8% per annum, with such interest capitalized and added to the aggregate principal amount on an annual basis. Under the deferred payment agreement, Nautilus Energy is subject to certain restrictions with respect to indebtedness, liens, disposals of all or substantially all of the assets of its group, and the general conduct of its group. Subject to the terms of the share purchase agreement, Nautilus Energy may offset its obligation to pay all or some of the aggregate principal amount outstanding under the deferred payment agreement in lieu of seeking a cash payment of a finally determined indemnity claim in an aggregate principal amount equal to the amount of any unpaid finally determined indemnification claim, provided that Nautilus Energy must first offset any indemnity claims first against IC Power's pledge of OPC shares for the benefit of the buyer, Nautilus Inkia Holdings LLC (as described above). The loan matures in December 2021, but may be extended in certain circumstances if there is an unresolved indemnification claim outstanding at the scheduled maturity date. Upon a sale of all or substantially all of the assets of certain of Nautilus Energy's subsidiaries domiciled in Peru, Nautilus Energy may either repay the loan in full, place the aggregate principal amount outstanding together with accrued and unpaid interest in escrow or cause ISQ Global Infrastructure Fund II, L.P. to guarantee Nautilus Energy's obligations (which guarantee shall not be subject to release upon a cross-acceleration event).
The obligations of Nautilus Energy are secured with a share mortgage over its shares by Nautilus Energy Partners LLC and a share mortgage over the shares of the direct subsidiary of Nautilus Energy, Nautilus Inkia Holdings LLC. ISQ Global Infrastructure Fund II, L.P., an indirect parent of Nautilus Energy, has provided a guarantee of Nautilus Energy's obligations under the deferred payment agreement until such time as there is a cross-acceleration of Nautilus Energy's obligations under the deferred payment agreement.
Inkia's rights and obligations under the deferred payment agreement were transferred to ICP as of December 28, 2017.
Kenon Guarantee
Pursuant to a guarantee agreement entered into in December 2017, Kenon has agreed to guarantee payment of Inkia's payment obligations under the share purchase agreement relating to the sale of the Inkia Business, including all of their indemnification obligations, subject to certain conditions. The guarantee is only enforceable to the extent that there remain payment obligations under the share purchase agreement after the buyer has exhausted in full its rights under the OPC share pledge and the deferred payment agreement as described above. The guarantee will expire in December 2020, provided that the term of the guarantee shall be extended to the extent that there remain indemnification obligations for which a claim has been made but not resolved at the scheduled expiration date.
101
Claims Relating
to the
Inkia Business
Set forth below is a description of the investment treaty claims that are being or may be pursued by Kenon subsidiaries and the other claims related to of the Inkia Business to which Kenon has rights.
The claims will require funding for legal expenses and Kenon is considering its options with respect to meeting these funding needs, including potentially third party funding for such claims in exchange for a portion of the awards or settlements. Kenon may also sell its rights under or the rights to proceeds resulting from claims.
Bilateral Investment Treaty Claim Relating to Peru
In June 2017, IC Power sent a Notice of Dispute to the Government of Peru under the Free Trade Agreement between Singapore and Peru, or the FTA, relating to two matters described below, based on events that occurred while IC Power owned and operated its former Peruvian subsidiary Kallpa, later sold as part of the Inkia sale. The claim is ready to be brought to arbitration pursuant to the FTA, subject to IC Power submitting a Notice of Intent one month in advance of the institution of arbitral proceedings. The FTA cooling off deadlines have been exhausted and the Notice of Intent is ripe to be provided as of this date. IC Power has not yet quantified the claim against the Government of Peru, but the claim is any event in excess of $150 million. Set forth below is a summary of the claims.
Secondary Frequency Regulation Claim
The Secondary Frequency Regulation, or SFR, is a complementary service required to adjust power generation in order to maintain the frequency of the system in certain situations. In March 2014, OSINERGMIN (the mining and energy regulator in Peru) approved Technical Procedure 22, or PR 22, establishing that the SFR would be provided through a firm and variable base provision. The firm base provision of the SFR would have priority on the daily electricity dispatch to keep turbines permanently on to respond to frequency changes in the system.
In February 2016, COES (a committee made up of public and private entities with powers delegated to it by the Peruvian government to manage the Peruvian energy transmission grid), invited generation companies to bid for the provision of SFR, and Kallpa submitted a bid offering to provide the SFR. In April 2016, Kallpa was awarded the SFR firm base provision for three years, until July 2019 on an exclusive basis, independently of its declared variable generation costs, and in exchange for a Reserve Assignment Price of zero, plus certain reimbursable costs.
In June 2016, OSINERGMIN issued a resolution that materially modified PR 22 (or the Resolution). Under the Resolution, SFR service can only be rendered when the generator is programmed for economic dispatch (i.e. daily dispatch according to variable cost). Due to this retroactive amendment to PR 22, the exclusivity in dispatch that Kallpa had received through the bid process was withdrawn. IC Power suffered losses, including, but not limited to, lost profits as a result of the Resolution.
Transmission Tolls Claim
Until July 2016, the responsibility for the payment for the use of the secondary and complementary transmission systems was distributed based on the use of each transmission line. OSINERGMIN identified the generators that made use of particular distribution lines and proceeded to determine payment based on actual use (or the “relevance of use” requirement).
However, in July 2016, OSINERGMIN issued a resolution, referred to as the Transmission Toll Resolution, eliminating the “relevance of use” requirement, replacing it with a methodology that required each generation company to pay for a number of transmission lines, irrespective of the transmission lines the company actually uses. The change in methodology benefited the state-owned electricity company, Electroperu, and caused significant detriment to IC Power’s subsidiaries and IC Power itself.
102
Entitlement to Payments in Respect of Certain Proceedings and Claims
As discussed below, IC Power’s former subsidiary, Inkia, is entitled to receive certain payments from the buyer of the Inkia Business in connection with certain insurance and other claims held by companies within the Inkia Business or as a result of the resolution of, and/or a change in regulations or cash payments received relating to the transmission tolls claim or the SFR claim. These payments are subject to conditions, and may be subject to deduction for taxes incurred as a result of the relevant payment.
Guatemala
The Guatemalan Tax Administrator, or SAT, issued in February 2015 certain binding tax opinions confirming the validity of certain deductions with respect to the referenced distributors. ICP subsequently acquired the distributors. The government of Guatemala changed in 2016 and there also were changes in the SAT management. Subsequently, and notwithstanding the binding tax opinions, the SAT filed a complaint in July 2016 against the distributors for alleged back taxes for the years 2011 and 2012, alleging that such companies improperly deducted interest and amortization of goodwill relating to the acquisition of the distributors in 2011 by their prior owner. In August 2016, the court hearing the SAT complaint ordered the distributors immediately to pay approximately $17 million in alleged back taxes for 2011 and 2012, plus interest and fines within 60 days following the court order. The distributors paid such amount.
In December 2016, the distributors paid an additional $26 million corresponding to the alleged fines and interest on the principal amount. In light of the actions by the SAT, and in order to avoid complaints by the SAT concerning fiscal years 2013, 2014, and 2015, and any resulting fines and interest, upon instructions of the SAT, the distributors revised their tax returns for such years and paid a further amount of approximately $31 million, corresponding to alleged back taxes and interest for those fiscal years. The total payments described above related to 2011 through 2015 amount to approximately $74 million in the aggregate. The distributors made such payments subject to a broad reservation of rights, including but not limited to seeking restitution of such payments. The foregoing circumstances form the basis for the investment treaty arbitration, which is pending.
ICP commenced an investment treaty arbitration against the Republic of Guatemala in February 2018 pursuant to the Agreement between the Government of the State of Israel and the Government of the Republic of Guatemala for the Reciprocal Promotion and Protection of Investments, or the Treaty. ICP is seeking damages on the basis that Guatemala breached its obligations under the Treaty including through the treatment of DEORSA and DEOCSA, two electricity distributors which were subsidiaries of ICP.
Energuate Representation & Warranty Insurance Claims
Prior to the sale of the Inkia Business, DEORSA and DEOCSA and their parent company ICPDH, made a claim under the representation & warranty insurance put in place during the acquisition of DEORSA and DEOCSA (the “Insurance Claim”). The Insurance Claim seeks coverage for taxes paid in connection with the SAT tax claim in 2016, as described above. The maximum coverage under the insurance policy is $30 million. The insurer has disputed coverage for the Insurance Claim and that dispute has been submitted to arbitration, which is ongoing.
Kenon’s subsidiary ICPDH, which was not sold as part of the sale of the Inkia Business, continues to pursue the Insurance Claim, and the claims by DEORSA and DEOCSA were transferred to ICPDH. If any proceeds under this claim are received by DEORSA or DEOCSA, such proceeds must be paid to ICPDH.
103
Samay I Insurance Claims
Samay I has made an insurance claim for losses suffered as a result of the damage to the turbines at the Samay I Facility in 2016. The amount of the claim is approximately $
25.3 million plus interest and costs
.
The buyer of the Inkia Business has agreed to use commercially reasonable efforts to pursue this claim, with Inkia required to pay the costs of pursuing the claim, and to pay to Inkia 75% of the insurance claim proceeds received by it.
Transmission Toll Regulation
In the event of certain changes in or revocation of regulation in Peru or a final court order relating to the Transmission Toll Resolution (described above under
"—Bilateral Investment Treaty Claims—Transmission Tolls Claim"
) which change, revocation or order has the effect of increasing operating profits of Kallpa or Samay I (which are part of the Inkia Business) then the buyer of the Inkia Business is required to pay or cause to be paid to Inkia in cash 75% of an amount equal to 70% of the increase in operating profits of Kallpa and Samay I attributable directly and solely to the changes in regulation through December 31, 2024.
In addition, in the event of any cash payments made to Kallpa or Samay I as a result certain changes in regulation in Peru relating to the Transmission Toll Resolution or as a result certain claims being pursued in Peru in connection with this resolution, the buyer is required to pay or cause to be paid in cash 75% of an amount equal to 70% of such cash proceeds.
Secondary Frequency Regulation Claim
In the event of certain changes to or revocation of PR 22 (as described under
"—Bilateral Investment Treaty Claims—Secondary Frequency Regulation Claim")
which result in a cash payment to Kallpa or Samay I, the buyer is required to pay or cause to be paid in cash 75% of an amount equal to 70% of such cash proceeds.
Samay I S.A. Force Majeure Proceedings
In connection with the damage to the Samay I turbines in 2016, Samay I made a claim to the Peruvian Ministry of Energy and Mines, or MINEM, demanding that the unavailability to the system of the Samay I turbines was a force majeure event and therefore measures taken by MINEM should be reversed. The buyer of the Inkia Business has agreed, promptly following regulatory approval of the sale of the Inkia Business in Peru, to commence arbitration proceedings against MINEM to recover negative revenue adjustments of approximately $3 million on the basis that the unavailability of the turbines was a force majeure event.
Samay I is required to pay to Inkia 50% of the proceeds received from such proceedings, and Inkia is required to reimburse 50% of the costs in proceeding with the claim.
Bolivian Land
Inkia is entitled to appoint a broker to procure buyers for a plot of land in Bolivia owned by COBBEE (part of the Inkia Business) and consummate a sale of the land, with the sale terms subject to Inkia's consent. All proceeds from the sale must be paid to Inkia, after deduction of reasonable costs and expenses, brokerage fees and taxes.
Description of Operations of the Inkia Business
The Inkia Business, which was sold in December 2017, consisted of generation and distribution facilities located in energy markets in Latin America and the Caribbean.
Generation Operations
The Inkia Business’ generation operations were focused in the Latin American and Caribbean markets—primarily Peru. The Inkia Business’ portfolio included power generation plants that operated on a range of energy sources, including natural gas, hydroelectric, HFO, diesel and wind. As of December 31, 2017, the Inkia Business’ installed capacity was 3,374 MW.
104
The following table sets forth summary operational information regarding each of the Inkia Business’ operating companies in its power generation business as of December 31, 2017:
|
Country
|
Entity
|
Ownership Percentage (Rounded)
|
Fuel
|
Installed Capacity (MW)
1
|
||||||||
|
Peru
|
Kallpa
|
75
|
%
|
Natural Gas, Hydroelectric
|
1,618
|
|||||||
|
Peru
|
Samay I
|
75
|
%
|
Diesel and Natural Gas
|
632
|
|||||||
|
Nicaragua
|
Corinto
|
65
|
%
|
HFO
|
71
|
|||||||
|
Nicaragua
|
Tipitapa Power
|
65
|
%
|
HFO
|
51
|
|||||||
|
Nicaragua
|
Amayo I
|
61
|
%
|
Wind
|
40
|
|||||||
|
Nicaragua
|
Amayo II
|
61
|
%
|
Wind
|
23
|
|||||||
|
Guatemala
|
Puerto Quetzal
|
100
|
%
|
HFO
|
55
|
|||||||
|
El Salvador
|
Nejapa
|
100
|
%
|
HFO
|
140
|
|||||||
|
Panama
|
Kanan
|
100
|
%
|
HFO
|
124
|
|||||||
|
Bolivia
|
COBEE
|
100
|
%
|
Hydroelectric, Natural Gas
|
228
|
|||||||
|
Chile
|
Central Cardones
|
87
|
%
|
Diesel
|
153
|
|||||||
|
Chile
|
Colmito
|
100
|
%
|
Natural Gas and Diesel
|
58
|
|||||||
|
Dominican Republic
|
CEPP
|
97
|
%
|
HFO
|
67
|
|||||||
|
Jamaica
|
JPPC
|
100
|
%
|
HFO
|
60
|
|||||||
|
Panama
|
Pedregal
|
21
|
%
|
HFO
|
54
|
|||||||
|
Total Capacity
|
3,374
|
|||||||||||
| (1) |
Reflects 100% of the capacity of each of the Inkia Business’ assets, regardless of ownership interest in the entity that owns each such asset
|
Distribution Operations
The Inkia Business’ electricity distribution operations consisted of Energuate (the trade name for the Inkia Business’ Guatemalan electricity distribution businesses), which was acquired in 2016 and consisted of:
| · |
DEORSA, in which Inkia held a 93% interest; and
|
| · |
DEOCSA, in which Inkia held a 91% interest.
|
As of December 31, 2017, Energuate provided services for approximately 1.7 million regulated customers in Guatemala and distributed energy to a service area of approximately 103,089 km
2
in Guatemala, covering primarily rural areas. Energuate operates approximately 78,395 km of distribution lines within Guatemala.
105
C.
Organizational Structure
The chart below represents a summary of our organizational structure, excluding intermediate holding companies, as of April 9, 2018. This chart should be read in conjunction with the explanation of our ownership and organizational structure above.
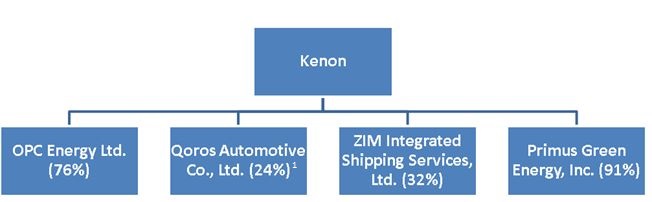
|
(1)
|
In January 2018, Kenon announced the New Qoros Investor completed a transaction to purchase 51% of Qoros from Kenon and Chery. As a result, Kenon now has a 24% stake in Qoros. Kenon used to hold a 50% stake in Qoros prior to the New Qoros Investor’s investment.
|
D.
Property, Plants and Equipment
For information on our property, plants and equipment, see “
Item 4.B Business Overview.
”
Not Applicable.
This section should be read in conjunction with our audited consolidated financial statements, and the related notes thereto, for the years ended December 31, 2017, 2016 and 2015, included elsewhere in this annual report. Our financial statements have been prepared in accordance with IFRS. Our consolidated financial statements as of and for the year ended December 31, 2017 reflect the Inkia Business as discontinued operations and our consolidated financial statements as of and for the years ended 2016 and 2015 have been reclassified for comparative purposes to account for the Inkia Business as discontinued operations (see “Item 4.B Business Overview—Discontinued Operations—Inkia Business”).
The financial information below also includes certain non-IFRS measures used by us to evaluate our economic and financial performance. These measures are not identified as accounting measures under IFRS and therefore should not be considered as an alternative measure to evaluate our performance. In addition, all financial information below relating to Tower has been derived from financial statements that were prepared in accordance with U.S. GAAP.
Certain information included in this discussion and analysis includes forward-looking statements that are subject to risks and uncertainties, and which may cause actual results to differ materially from those expressed or implied by such forward-looking statements. For further information on important factors that could cause our actual results to differ materially from the results described in the forward-looking statements contained in this discussion and analysis, see “Special Note Regarding Forward-Looking Statements” and “Item 3.D Risk Factors.”
Business Overview
For a discussion of our strategy, see “
Item 4.B Business Overview.
”
106
Overview of Financial Information Presented
As a holding company, Kenon’s results of operations are impacted by the financial results of each of its businesses. To effectively assess our results of operations, we supply detailed information on the financial results of our individual businesses and the impact such results have had on our consolidated results of operations. The analysis of each business’ impact on our results of continuing operations for the years ended December 31, 2017 and 2016 depends upon the method of accounting applicable to it as set forth in the following table:
|
Year Ended December 31, 2017
|
||||||||
|
Ownership Percentage
|
Method of Accounting
|
Treatment in Consolidated
Financial Statements
|
||||||
|
OPC
|
76
|
%
|
Consolidated
|
Consolidated
|
||||
|
Qoros
|
50
|
%
1
|
Equity
|
Share in losses of associated companies, net of tax
|
||||
|
ZIM
|
32
|
%
|
Equity
|
Share in losses of associated companies, net of tax
|
||||
|
Other
|
||||||||
|
Primus
|
91
|
%
|
Consolidated
|
Consolidated
|
||||
|
(1)
|
In January 2018, Kenon announced the New Qoros Investor completed a transaction to purchase 51% of Qoros from Kenon and Chery. As a result, Kenon now has a 24% stake in Qoros.
|
|
Years Ended December 31, 2016 and 2015
|
||||||||
|
Ownership Percentage
|
Method of Accounting
|
Treatment in Consolidated
Financial Statements
|
||||||
|
OPC
|
100
|
%
|
Consolidated
|
Consolidated
|
||||
|
Qoros
|
50
|
%
|
Equity
|
Share in losses of associated companies, net of tax
|
||||
|
ZIM
|
32
|
%
|
Equity
|
Share in losses of associated companies, net of tax
|
||||
|
Other
|
||||||||
|
Primus
|
91
|
%
|
Consolidated
|
Consolidated
|
||||
The results of the following companies are included in Kenon’s statements of profit and loss as share in losses of associated companies, net of tax, for the years set forth below, except as otherwise indicated: (i) Qoros, (ii) ZIM from June 30, 2014 and (iii) Tower until June 30, 2015.
The following tables set forth selected financial data for Kenon’s reportable segments for the periods presented:
|
|
Year Ended December 31, 2017
1
|
|||||||||||||||||||
|
OPC
|
Qoros
2
|
Other
3
|
Adjustments
4
|
Consolidated Results
|
||||||||||||||||
|
(in millions of USD, unless otherwise indicated)
|
||||||||||||||||||||
|
Sales
|
$
|
365
|
$
|
-
|
$
|
1
|
$
|
-
|
$
|
366
|
||||||||||
|
Depreciation and amortization
|
(30
|
)
|
-
|
(1
|
)
|
-
|
(31
|
)
|
||||||||||||
|
Impairment of assets and investments
|
-
|
-
|
29
|
-
|
29
|
|||||||||||||||
|
Financing income
|
1
|
-
|
13
|
(11
|
)
|
3
|
||||||||||||||
|
Financing expenses
|
(34
|
)
|
-
|
(47
|
)
|
11
|
(70
|
)
|
||||||||||||
|
Share in (losses) income of associated companies
|
-
|
(121
|
)
|
10
|
-
|
(111
|
)
|
|||||||||||||
|
Profit / (Loss) before taxes
|
$
|
23
|
$
|
(121
|
)
|
$
|
(38
|
)
|
$
|
-
|
$
|
(136
|
)
|
|||||||
|
Income taxes
|
(9
|
)
|
-
|
(64
|
)
|
-
|
(73
|
)
|
||||||||||||
|
Profit / (Loss) from continuing operations
|
$
|
14
|
$
|
(121
|
)
|
$
|
(102
|
)
|
$
|
-
|
$
|
(209
|
)
|
|||||||
|
Segment assets
5
|
$
|
936
|
$
|
-
|
$
|
1,468
|
6
|
$
|
-
|
$
|
2,404
|
|||||||||
|
Investments in associated companies
|
-
|
2
|
120
|
-
|
122
|
|||||||||||||||
|
Segment liabilities
|
743
|
-
|
732
|
7
|
-
|
1,475
|
||||||||||||||
|
Capital expenditure
8
|
109
|
-
|
121
|
-
|
230
|
|||||||||||||||
| (1) |
In December 2017, Inkia completed the sale of the Inkia Business. For further information, see Note 29 to our financial statements included in this annual report.
|
| (2) |
Associated company.
|
| (3) |
Includes the results of Primus and HelioFocus (which was liquidated in July 2017); the results of ZIM, as an associated company; as well as Kenon’s and IC Green’s holding company and general and administrative expenses.
|
| (4) |
“Adjustments” includes inter-segment financing income and expenses.
|
| (5) |
Excludes investments in associates.
|
| (6) |
Includes Kenon’s and IC Green’s assets.
|
| (7) |
Includes Kenon’s and IC Green’s liabilities.
|
| (8) |
Includes the additions of PP&E and intangibles based on an accrual basis.
|
107
|
|
Year Ended December 31, 2016
1
|
|||||||||||||||||||
|
OPC
|
Qoros
2
|
Other
3
|
Adjustments
4
|
Consolidated Results
|
||||||||||||||||
|
(in millions of USD, unless otherwise indicated)
|
||||||||||||||||||||
|
Sales
|
$
|
324
|
$
|
—
|
$
|
—
|
$
|
-
|
$
|
324
|
||||||||||
|
Depreciation and amortization
|
(27
|
)
|
—
|
-
|
-
|
(27
|
)
|
|||||||||||||
|
Impairment of assets and investments
|
-
|
—
|
72
|
|
-
|
(72
|
)
|
|||||||||||||
|
Financing income
|
3
|
—
|
16
|
(12
|
)
|
7
|
||||||||||||||
|
Financing expenses
|
(23
|
)
|
—
|
(36
|
)
|
12
|
(47
|
)
|
||||||||||||
|
Share in losses of associated companies
|
-
|
(143
|
)
|
(43
|
)
|
-
|
(186
|
)
|
||||||||||||
|
Provision of financial guarantee
|
-
|
—
|
(130
|
)
|
-
|
(130
|
)
|
|||||||||||||
|
Profit/(Loss) before taxes
|
$
|
20
|
$
|
(143
|
)
|
$
|
(305
|
)
|
$
|
-
|
$
|
(428
|
)
|
|||||||
|
Income taxes
|
—
|
—
|
(2
|
)
|
-
|
(2
|
)
|
|||||||||||||
|
Profit/(Loss) from continuing operations
|
$
|
20
|
$
|
(143
|
)
|
$
|
(307
|
)
|
$
|
-
|
$
|
(430
|
)
|
|||||||
|
Segment assets
5
|
$
|
668
|
$
|
—
|
$
|
4,262
|
6
|
$
|
-
|
$
|
4,930
|
|||||||||
|
Investments in associated companies
|
-
|
118
|
90
|
-
|
208
|
|||||||||||||||
|
Segment liabilities
|
534
|
—
|
3,710
|
7
|
-
|
4,244
|
||||||||||||||
|
Capital expenditure
8
|
73
|
—
|
245
|
-
|
318
|
|||||||||||||||
| (1) |
Results during this period have been reclassified to reflect the results of the Inkia Business as discontinued operations. For further information, see Note 29 to our financial statements included in this annual report.
|
| (2) |
Associated company.
|
| (3) |
Includes the results of Primus and HelioFocus (which was liquidated in July 2017); the results of ZIM, as an associated company; as well as Kenon’s and IC Green’s holding company and general and administrative expenses.
|
| (4) |
“Adjustments” includes inter-segment financing income and expenses.
|
| (5) |
Excludes investments in associates.
|
| (6) |
Includes Kenon’s, IC Green’s and IC Power holding company assets.
|
| (7) |
Includes Kenon’s, IC Green’s and IC Power holding company liabilities.
|
| (8) |
Includes the additions of PP&E and intangibles based on an accrual basis.
|
|
Year Ended December 31, 2015
1
|
||||||||||||||||||||
|
OPC
|
Qoros
2
|
Other
3
|
Adjustments
4
|
Consolidated Results
|
||||||||||||||||
|
(in millions of USD, unless otherwise indicated)
|
||||||||||||||||||||
|
Sales
|
$
|
326
|
$
|
—
|
$
|
—
|
$
|
-
|
$
|
326
|
||||||||||
|
Depreciation and amortization
|
(26
|
)
|
—
|
1
|
—
|
(25
|
)
|
|||||||||||||
|
Asset impairment
|
-
|
—
|
(7
|
)
|
—
|
(7
|
)
|
|||||||||||||
|
Financing income
|
3
|
—
|
8
|
—
|
11
|
|||||||||||||||
|
Financing expenses
|
(26
|
)
|
—
|
(10
|
)
|
—
|
(36
|
)
|
||||||||||||
|
Share in (losses) income of associated companies
|
-
|
(196
|
)
|
9
|
—
|
187
|
||||||||||||||
|
Gain from distribution of dividend in kind
|
-
|
—
|
210
|
—
|
210
|
|||||||||||||||
|
Profit / (Loss)before taxes
|
$
|
30
|
$
|
(196
|
)
|
$
|
199
|
$
|
—
|
$
|
33
|
|||||||||
|
Income taxes
|
(8
|
)
|
—
|
1
|
—
|
(9
|
)
|
|||||||||||||
|
Profit / (Loss)from continuing operations
|
$
|
22
|
$
|
(196
|
)
|
$
|
198
|
$
|
—
|
$
|
24
|
|||||||||
|
Segment assets
5
|
$
|
811
|
$
|
—
|
$
|
3,303
|
6
|
$
|
—
|
$
|
4,114
|
|||||||||
|
Investments in associated companies
|
-
|
159
|
210
|
—
|
369
|
|||||||||||||||
|
Segment liabilities
|
677
|
—
|
2,542
|
7
|
—
|
3,219
|
||||||||||||||
|
Capital expenditure
8
|
18
|
—
|
556
|
—
|
574
|
|||||||||||||||
| (1) |
Results during this period have been reclassified to reflect the results of the Inkia Business as discontinued operations. For further information, see Note 29 to our financial statements included in this annual report.
|
| (2) |
Associated company.
|
| (3) |
Includes the results of Primus and HelioFocus (which was liquidated in July 2017); the results of ZIM and Tower (up to June 30, 2015), as associated companies; as well as Kenon’s and IC Green’s holding company and general and administrative expenses.
|
| (4) |
“Adjustments” includes inter-segment sales.
|
| (5) |
Excludes investments in associates.
|
| (6) |
Includes Kenon’s and IC Green’s assets.
|
| (7) |
Includes Kenon’s and IC Green’s liabilities.
|
| (8) |
Includes the additions of PP&E and intangibles based on an accrual basis.
|
108
The following tables set forth summary information regarding each of our equity-method accounting businesses for the periods presented.
|
Year Ended December 31, 2017
|
||||||||||||||||
|
Qoros
|
ZIM
|
Other
|
Total
|
|||||||||||||
|
(in millions of USD)
|
||||||||||||||||
|
Income (loss) (100% of results)
|
$
|
(242
|
)
|
$
|
6
|
$
|
-
|
$
|
(236
|
)
|
||||||
|
Share of Income (loss) from Associates
|
(121
|
)
|
10
|
-
|
(111
|
)
|
||||||||||
|
Book Value
|
2
|
120
|
-
|
122
|
||||||||||||
|
Year Ended December 31, 2016
|
||||||||||||||||
|
Qoros
|
ZIM
|
Other
|
Total
|
|||||||||||||
|
(in millions of USD)
|
||||||||||||||||
|
Income (loss) (100% of results)
|
$
|
(285
|
)
|
$
|
(168
|
)
|
$
|
—
|
$
|
(4
5
3
|
)
|
|||||
|
Share of Income (loss) from Associates
|
(143
|
)
|
(43
|
)
|
—
|
(186
|
)
|
|||||||||
|
Book Value
|
118
|
82
|
8
|
208
|
||||||||||||
|
Year Ended December 31, 2015
|
||||||||||||||||||||
|
Qoros
|
ZIM
|
Tower
1
|
Other
|
Total
|
||||||||||||||||
|
(in millions of USD)
|
||||||||||||||||||||
|
Income (loss) (100% of results)
|
$
|
(392
|
)
|
$
|
2
|
$
|
(1
|
)
|
$
|
—
|
$
|
(391
|
)
|
|||||||
|
Share of Income (loss) from Associates
|
(196
|
)
|
10
|
(1
|
)
|
—
|
(187
|
)
|
||||||||||||
|
Book Value
|
159
|
201
|
—
|
9
|
369
|
|||||||||||||||
| (1) |
Reflects Tower’s results of operations up to June 30, 2015. As a result of our distribution in specie of substantially all of our interest in Tower, representing 23% of the then currently outstanding Tower shares on July 23, 2015, Tower’s results of operations for all periods subsequent to June 30, 2015 are not reflected in our consolidated financial statements.
|
Qoros
Following the completion of the New Qoros Investor investment, we have a 24% equity interest in Qoros. We account for Qoros pursuant to the equity method of accounting and discuss Qoros’ results of operations in our discussion of our share in losses of associated companies, net of tax.
109
ZIM
In July 2014, ZIM completed the restructuring of its outstanding indebtedness, which resulted in IC, and consequently, Kenon, owning 32% of the restructured ZIM as compared to IC’s previous interest in ZIM of approximately 99.7%. As a result of the restructuring, ZIM’s results of operations for all periods prior to June 30, 2014 are reflected as discontinued in Kenon’s results of operations and ZIM’s results of operations for the six months ended December 31, 2014 and the years ended December 31, 2015, 2016 and 2017 are reflected in Kenon’s share in losses of associated companies, net of tax.
Tower
For information on Tower’s results of operations, see “
Distribution of our interest in Tower”
and “
Item 5.A—
Operating Results— Year Ended December 31, 2016 Compared to Year Ended December 31, 2015--Share In Income (Losses) of Associated Companies, Net of Tax—Tower
.”
Material Factors Affecting Results of Operations
Discontinued Operations
In December 2017, Inkia, a wholly-owned subsidiary of IC Power completed the sale of the Inkia Business, which includes Inkia’s Latin American and Caribbean businesses, to I Squared Capital, an infrastructure private equity firm, for approximately $1,332 million. As a result, the results of operations of the Inkia Business are reflected as discontinued operations in Kenon’s financial statements presented in this annual report. Inkia still has certain obligations in relation to the sale of the Inkia Business, including certain indemnification obligations (see
“Item 4.B Business Overview— Discontinued Operations – Inkia Business—Sale of the Inkia Business—Share Purchase Agreement—Indemnification
), while Kenon holds the deferred payment agreement (see “
—Nautilus Energy TopCo LLC Deferred Payment Agreement
”), and has retained certain claims relating to the Inkia Business (see “—
Claims Relating to Inkia Business Retained by Kenon
”). For further information, see “
Item 4.B Business Overview—Discontinued Operations—Inkia Business
.” Furthermore, results during 2016 and 2015 have been reclassified to reflect the classification of the Inkia Business as discontinued operations.
OPC
Set forth below is a discussion of the material factors affecting the results of operations of OPC for the periods under review.
Sales—EA Tariffs
In Israel, sales by IPPs are generally made on the basis of PPAs for the sale of energy to customers, with prices predominantly linked to the tariff issued by the EA and denominated in NIS.
The EA operates a Time of Use tariff, which provides different energy rates for different seasons (e.g., summer and winter) and different periods of time during the day. Within Israel, the price of energy varies by season and demand period. For further information on Israel’s seasonality and the related EA tariffs, see “
Item 4.B Business Overview—Our Businesses—OPC—Industry Overview—
Overview of Israeli Electricity Generation Industry
.”
The EA’s rates have affected OPC’s revenues and income in the periods under review.
In September 2015, the PUAE published a decision, which became effective on September 13, 2015, which reduced the PUAE generation component tariff by approximately 12% from NIS 300.9 per MWh and NIS 301.5 per MWh to a single tariff of NIS 265.2 per MWh. In December 2016, the EA published its generation component tariff update, which became effective on January 1, 2017, and reduced the generation component tariff by approximately 0.5% from NIS 265.2 per MWh to NIS 264 per MWh. However, as part of the December 2016 EA decision, the time of use tariffs were also adjusted to reflect a decrease in certain payments made by IPPs to the IEC. In January 2018, the EA published its generation component tariff update for 2018, which increased the generation component tariff by approximately 6.7%, from NIS 264 per MWh to NIS 282 per MWh.
110
Cost of Sales
OPC’s principal costs of sales are natural gas, transmission, distribution and system services costs, personnel, third-party services and maintenance costs.
The prices at which OPC-Rotem and OPC-Hadera purchase their natural gas from their sole natural gas supplier, the Tamar Group, is predominantly indexed to changes in the EA’s generation component tariff, pursuant to the price formula set forth in OPC-Rotem’s and OPC-Hadera’s supply agreements with the Tamar Group. As a result, increases or decreases in this tariff have a related effect on OPC-Rotem’s and PC-Hadera’s cost of sales and margins. Additionally, the natural gas price formula in OPC-Rotem’s and OPC-Hadera’s supply agreement is subject to a floor price mechanism.
As a result of previous declines in the EA’s generation component tariff, OPC-Rotem and OPC-Hadera began to pay the ultimate floor price in November 2015 and April 2016, respectively. Therefore, declines in the EA generation component tariff may not have a corresponding decline in OPC-Rotem’s natural gas expenses, due to the floor price mechanism. and may lead to a decline in OPC-Rotem’s margins, which may have a material adverse effect on OPC’s business, results of operations and financial condition. For information on the risks associated with the impact of the EA’s generation tariff on OPC’s supply agreements with the Tamar Group, see “
Item 3.D Risk Factors—Risks Related to OPC—Changes in the EA’s electricity rates may reduce OPC’s profitability.
”
In January 2018, the EA published the electricity tariffs for 2018, which included an increase of the EA’s generation component tariff by 6.7%, As a results, OPC-Rotem and OPC-Hadera’s gas prices may rise above their ultimate floor prices.
For information on the risks associated with the impact of the EA’s generation tariff on OPC-Rotem’s supply agreement with the Tamar Group, see “
Item 3.D Risk Factors—Risks Related to OPC—
Changes in the EA’s electricity rates may reduce OPC’s profitability
.
” As of the date of this report, OPC-Hadera’s gas price is above the floor price.
OPC’s costs for transmission, distribution and systems services vary primarily according to the quantity of energy that OPC sells. These costs are passed on to its customers. OPC incurs personnel and third-party services costs in the operation of its plants. These costs are usually independent of the volumes of energy produced by OPC’s plants. OPC incurs maintenance costs in connection with the ongoing and periodic maintenance of its generation plants. These costs are usually correlated to the volumes of energy produced and the number of running hours of OPC’s plants.
Income Taxes
OPC is subject to income tax in Israel. The corporate tax rates applicable in Israel as of December 31, 2017, 2016 and 2015 were 24%, 25% and 26.5%, respectively. The corporate income tax decreased to 23% on January 1, 2018.
Changes in Exchange Rates
Fluctuations in the exchange rates between currencies in which certain of OPC's agreements are denominated (such as the U.S. Dollar and Euro) and the NIS, which is OPC’s functional and reporting currency, will generate either gains or losses on monetary assets and liabilities denominated in such currencies and can therefore affect OPC’s profitability. Furthermore, OPC is indirectly influenced by changes in the U.S. Dollar to NIS exchange rate as the IEC electricity tariff is partially linked to increases in fuel prices (mainly coal and gas) that are denominated in U.S. Dollars.
In addition, Kenon’s functional currency is the U.S. Dollar, so Kenon reports OPC’s NIS-denominated results of operation and balance sheet items in U.S. Dollars, translating OPC’s results into U.S. Dollars at the average exchange rate (for results of operation) or rate in effect on the balance sheet date (for balance sheet items). Accordingly, changes in the U.S. Dollar to NIS exchange rate impact Kenon’s reported results for OPC.
111
In 2017, the U.S. Dollar continued weakening and, therefore, the exchange rate of the U.S. Dollar to the NIS continued to decline.
Qoros
Set forth below is a discussion of the material factors affecting the results of operations of Qoros for the periods under review.
Qoros commenced commercial operations at the end of 2013. Qoros has incurred losses since its inception.
In the years ended December 31, 2017 and 2016, Qoros incurred net losses of RMB1.
6
billion and RMB1.9 billion, respectively. Qoros expects to continue experiencing losses and negative cash flows until it achieves significantly higher levels of sales.
For the year ended December 31, 2017, Qoros sold approximately 15,000 cars, as compared to approximately 24,000 cars in 2016.
Qoros sold approximately 11,400 cars in the first quarter of 2018, a more than 200% increase as compared to approximately 3,700 cars sold in the first quarter of 2017, with a substantial number of such sales in Q1 2018 reflecting purchase orders introduced by the New Qoros Investor.
Qoros’ ability to generate positive net income and cash flow from its operations will depend upon a variety of factors, particularly Qoros’ ability to sell its vehicles within its targeted price range and develop an effective dealer network.
In January 2018, Kenon announced the New Qoros Investor completed a transaction to purchase 51% of Qoros from Kenon and Chery for RMB3.315 billion (approximately $526 million), which is part of an investment structure to invest a total of approximately RMB6.63 billion (approximately $1,052 million) by the New Qoros Investor of which RMB6.5 billion will ultimately be invested in Qoros’ equity. As a result, Kenon and Chery now have 24% and 25% stakes in Qoros, respectively. This investment has improved Qoros' liquidity, but Qoros may need to continue to secure additional financing to meet its operating expenses, including accounts payable, and debt service requirements until it increases its sales levels. Kenon may be required to make payments under its back-to-back guarantees to Chery in respect of Qoros’ bank debt and pledges over Qoros shares by Quantum (Kenon’s subsidiary which owns Kenon’s interest in Qoros) may be enforced. In addition, if Qoros' other joint venture partners make additional equity investments in Qoros without Kenon also making its pro-rata investment, Kenon's interest in Qoros may be diluted. See “
Item 3.D Risk Factors—Risks Related to Our Strategy and Operations— Some of our businesses have significant capital requirements.
”
ZIM
In July 2014, ZIM completed its financial restructuring, which resulted in IC, and consequently, Kenon, owning 32% of the restructured ZIM as compared to IC’s previous interest in ZIM of approximately 99.7% and reduced ZIM’s outstanding indebtedness and liabilities (face value, including future off-balance sheet commitments in respect of operational leases and with respect to those parties participating in the restructuring) from approximately $3.4 billion to approximately $2 billion. As a result, Kenon received a 32% equity interest in ZIM upon the consummation of the spin-off.
ZIM’s results of operations for the years ended December 31, 2015, 2016 and 2017 are reflected in Kenon’s share in losses of associated companies, net of tax, pursuant to the equity method of accounting.
In addition, bunker prices and freight rates are material factors which affect ZIM’s results of operations. For a discussion of bunker prices and freight rates, see “
Item 4.B Business Overview—Our Businesses—ZIM—ZIM’s Industry Update
.”
Primus
In the year ended December 31, 2017, Primus did not generate material revenues from its operations.
Primus seeks to develop, build, own and operate facilities where the company can access low-cost natural gas feedstock and take advantage of lower product transportation costs resulting from locating producing assets closer to markets than competing sources. Primus seeks to generate revenues from the sale of methanol, gasoline and stream miscible with crude from its operating plants as well as from construction management services, engineering fees, technology licensing fees, production royalties, and other opportunities the company identifies. Primus intends to finance the first series of plants through non-recourse project financing and is seeking a strategic partner to participate alongside Primus in the equity component of the investment.
112
Critical Accounting Policies and Significant Estimates
In preparing our financial statements, we make judgments, estimates and assumptions about the carrying amounts of assets and liabilities that are not readily apparent from other sources. Our estimates and associated assumptions are reviewed on an ongoing basis and are based upon historical experience and various other assumptions that we believe to be reasonable under the circumstances. Actual results may differ from these estimates under different assumptions or conditions. We believe that the estimates, assumptions and judgments involved in the accounting policies described below have the greatest potential impact on our financial statements:
| · |
Impairment analysis;
|
| · |
Revenue recognition;
|
| · |
Provisions for legal claims; and
|
| · |
Useful life of property, plant and equipment.
|
Set forth below is a discussion of impairment analyses conducted by Kenon and its subsidiaries and associated companies. For further information on the estimates, assumptions and judgments involved in our accounting policies, see Note 2 to Kenon’s financial statements included in this annual report.
Impairment Analysis
For each reporting period, Kenon examines whether there have been any events or changes in circumstances which would indicate an impairment of one or more non-monetary assets or cash generating units, or CGUs. Additionally, when there are indications of an impairment, a review is made as to whether the carrying amount of the non-monetary assets or CGUs exceeds the recoverable amount and, if so, an impairment loss is recognized. An assessment of the impairment of the goodwill is performed once a year or when signs of an impairment exist.
Under IFRS, the recoverable amount of the asset or CGU is determined based upon the higher of (i) the fair value less costs of disposal and (ii) the present value of the future cash flows expected from the continued use of the asset or CGU in its present condition, including cash flows expected to be received upon the retirement of the asset from service and the eventual sale of the asset (value in use). The future cash flows are discounted to their present value using a discount rate that reflects current market assessments of the time-value of money and the risk specific to the asset or CGU.
The estimates regarding future cash flows are based upon past experience with respect to this asset or similar assets (or CGUs), and on Kenon’s businesses best possible assessments regarding the economic conditions that will exist during the remaining useful life of the asset or CGU. Such estimates rely on the particular business’ current development plans and forecasts. As the actual cash flows may differ, the recoverable amount determined could change in subsequent periods, such that an additional impairment loss may need to be recognized or a previously recognized impairment loss may need to be reversed.
Impairment Tests of ZIM
In connection with the completion of ZIM’s restructuring in July 2014, IC’s equity interest in ZIM (which was transferred to Kenon in connection with Kenon’s spin-off from IC) was reduced to 32%. As a result of conditions in the container shipping market, Kenon conducted an impairment test in relation to its 32% equity investment in ZIM as of June 30, 2016 in accordance with IAS 28 and IAS 36. Kenon concluded that the carrying amount of its investment in ZIM was higher than the recoverable amount, and therefore, Kenon recognized an impairment loss of $72 million with respect to its investment in ZIM in 2016. As a result of improved operating conditions at ZIM throughout 2017, Kenon conducted another impairment analysis as of December 31, 2017. The analysis concluded that Kenon should reverse $29 million of the impairment recognized in 2016.
113
ZIM conducted an impairment test of its operating assets as of December 31, 2017. For the purposes of IAS 36, ZIM, which operates integrated network liner activity, has one CGU, which consists of all of ZIM’s operating assets. ZIM estimated its recoverable amount based upon the fair value of its CGU less the costs of disposal, using the discounted cash flow method.
ZIM’s assumptions were made for the period up to December 31, 2021 and a representative year intended to reflect a long-term, steady state. The key assumptions are set forth below:
A detailed cash flow forecast for the above-mentioned period based upon ZIM’s business plan;
Bunker price
: according to the future price curve of fuel;
Freight rates
: a compound annual growth rate of 0.7% over the projection period;
Increase in aggregate TEU shipped
: a compound annual growth rate of 7.7% over the projection period, which is in line with the expected trends in the main trade zones in which ZIM intends to operate;
Charter hire rates
: contractual rates in effect as of December 31, 2017, and assuming anticipated market rates for renewals of charters expiring in the projection period;
Discount rate
of 9%;
Long-term nominal growth rate
of 1.5%, which is consistent with the expected industry average;
Capital expenditures
that are less than or equal to ZIM’s expected vessel depreciation; and
Payment
of tax at ZIM’s corporate tax rate of 23%; also assumes expected use of tax losses.
ZIM concluded that the recoverable amount of its CGU was significantly higher than the carrying amount of the CGU, and therefore, no impairment was recognized in ZIM’s financial statements in respect of its CGU.
Although ZIM believes the assumptions used to evaluate the potential impairment of its assets are reasonable and appropriate, such assumptions are highly subjective. There can be no assurance as to how long bunker prices and freight rates will remain consistent with their current levels or whether they will increase or decrease by any significant degree. Freight rates may remain at depressed levels for some time, which could adversely affect ZIM’s revenue and profitability. For further information on recent trends relating to bunker prices and freight rates, see “—
Trend Information—ZIM
.”
A change of 100 bps in the following assumptions will result in an increase (decrease) in the fair value of the recoverable amount
of the entire carrying value of the ZIM’s CGU
as follows:
|
Increase
|
Decrease
|
|||||||
|
By 100 bps
|
||||||||
|
($ millions)
|
||||||||
|
Discount rate
|
(170
|
)
|
218
|
|||||
|
Terminal growth rate
|
169
|
(130
|
)
|
|||||
Business Combinations
Kenon accounts for all business combinations using the acquisition method when control is transferred to Kenon and its subsidiaries and associated companies. The consideration transferred in the acquisition is measured at the fair value, as are the identifiable net assets acquired. Kenon controls an entity when it is exposed to, or has rights to, variable returns from its involvement with the acquired entity and it has the ability to affect those returns based on its power over those acquired entities.
114
Kenon recognizes goodwill on acquisitions according to the fair value of consideration transferred, less the net amount of the fair value of identifiable assets acquired, less the fair value of liabilities assumed. To the extent there is negative goodwill in connection with an acquisition, Kenon recognizes the resulting in gain in profit or loss on the acquisition date.
Costs incurred in connection with the acquisition of a business, including finder’s, advisory, legal valuation and other professional or consulting fees, are expensed in the period the services are received.
Adoption of New Accounting Standards in 2018 and 2019
For annual periods beginning on or after January 1, 2018, IFRS 15 “Revenues from Contracts with Customers” has replaced the current guidelines regarding recognition of revenue from contracts with customers. IFRS 15 provides two approaches for recognition of revenue, and includes five stages for analysis of transactions in order to determine the timing of recognition of the revenue and the amount thereof. As of the date of this annual report, we have not yet adopted IFRS 15.
Kenon has examined the expected effects of the implementation of IFRS 15 and does not expect the implementation to have a material effect on its financial statements.
IFRS 15 is expected to have certain qualitative effects on our business, particularly with respect to OPC. For example, IFRS 15 is expected to have a qualitative effect on the identification and modification of contracts, performance obligations, transaction prices and allocation of such prices, recognition of revenue and disclosures.
In addition, IFRS 16 “Leases” will replace IAS 17 – Leases and its related interpretation effective for annual periods commencing on or after January 1, 2019, with the possibility of early adoption. Kenon examined the expected effects of the implementation of IFRS 16, but is unable at this stage to reliably estimate the quantitative impact on its financial statements.
In addition, IFRS 9 (2014) “Financial Instruments” has replaced IAS 39
Financial Instruments: Recognition and Measurement
regarding, among others, the classification and measurement of financial instruments, a new expected credit loss model for calculating impairment on financial assets, and new general hedge accounting requirements. The standard will be applied for annual periods on or after January 1, 2018, with the possibility of early adoption. As of December 31, 2017, Kenon considers that the overall impact of the implementation of IFRS 9 will be immaterial.
For more information on the impact of the adoption of these standards, see Note 3 to our financial statements included in this annual report.
Recent Developments
Kenon
Sale of the Inkia Business
In December 2017, Kenon’s wholly-owned subsidiary Inkia sold its power generation and distribution businesses in Latin America and the Caribbean, the Inkia Business, to an entity controlled by I Squared Capital, an infrastructure private equity firm. For further information on the sale, see “
Item 4.B Business Overview—Discontinued Operations—Inkia Business — Sale of the Inkia Business.
” As a result of this sale, Kenon’s remaining power generation business consists of its 76% interest in OPC.
Repayment of IC Credit Facility
In January 2018, Kenon used part of the proceeds of the sale of the Inkia Business to fully repay the $200 million IC Credit Facility, plus $40 million in interest and fees
and $3 million withholding taxes
.
115
Repayment of IC Power's Overseas Investment Peru Facility
In January 2018, Kenon fully repaid IC Power's $100 million Overseas Investment Peru facility, representing $43 million of net debt, plus $1 million of accrued interest.
Cash Distribution to Kenon Shareholders
In March 2018, Kenon distributed an aggregate amount of $665 million to Kenon’s shareholders, representing $12.35 per share, as a return of capital.
OPC
Acquisition of Tzomet Energy
In April 2017, OPC entered into agreements (including an option agreement) for the acquisition of 95% of the shares of Tzomet Energy Ltd., which is developing a natural gas-fired power station in Israel with capacity of approximately 396 MW, for total consideration of $23 million, subject to adjustment. In August 2017, the EA received a letter from the
from the Israel Concentration Committee
stating that it believed that, for reasons of broad economy concentration (i.e. taking into account businesses owned by related entities of Kenon's controlling shareholder), OPC should not be granted a contingent license for the construction of the planned facility. In March 2018, OPC completed the acquisition of 95% of the shares of Tzomet Energy, although Tzomet still requires (among other requirements) a license from the EA to proceed with construction of the planned facility.
The total consideration for the acquisition is estimated at approximately $23 million, subject to certain adjustments, of which $3.65 million was paid in March 2018, an additional $3.65 million is expected to be paid in the second quarter of 2018, and the remaining consideration will be paid at financial closing of the Tzomet project.
Qoros
Investment in Qoros
In January 2018, Kenon announced the
New Qoros Investor completed a transaction to purchase 51% of Qoros from Kenon and Chery for RMB3.315 billion (approximately $526 million), which is part of an investment structure to invest a total of approximately RMB6.63 billion (approximately $1,052 million) by the New Qoros Investor of which RMB6.5 billion will ultimately be invested in Qoros’ equity. As a result, Kenon and Chery now have 24% and 25% stakes in Qoros, respectively.
For a more detailed discussion of the key terms of the investment, see “
Item 4.B Business Overview—Our Businesses—Qoros —Qoros’ Investment Agreement
.”
A.
Operating Results
Our consolidated/combined financial statements for the years ended December 31, 2017, 2016 and 2015 are comprised of OPC, Primus, HelioFocus (which was liquidated in July 2017), and the results of the associated companies (Qoros, ZIM and Tower).
As set forth above, as a result of the completion of ZIM’s restructuring in July 2014, IC’s equity investment in ZIM was reduced from 99.7% to 32% and ZIM was reflected as a discontinued operation for all periods prior to June 30, 2014. ZIM’s results of operations for the six month period ended December 31, 2014, and all periods subsequent thereto, are reflected in our share in losses of associated companies, net of tax for the relevant period. Additionally, Tower’s results of operations for all periods prior to June 30, 2015 were accounted for pursuant to the equity method of accounting and were reflected in our share in losses of associated companies, net of tax. As a result of our distribution in specie of substantially all of our interest in Tower on July 23, 2015, Tower’s results of operations for all periods subsequent to June 30, 2015 are not reflected in our consolidated/combined financial statements.
Our consolidated/combined results of operations for each of the periods presented are largely impacted by OPC, which generated net income of $14 million, $20 million and $22 million in the years ended December 31, 2017, 2016 and 2015, respectively.
In December 2017, Inkia completed the sale of the Inkia Business, which consists of its Latin American and Caribbean businesses. The results of the Inkia Business are presented as discontinued operations in our consolidated/combined financial statements for the year ended December 31, 2017. Our consolidated financial statements as of and for the years ended December 31, 2016 and 2015 have been reclassified for comparative purposes to reflect the Inkia Business as discontinued operations.
116
Year Ended December 31, 2017 Compared to Year Ended December 31, 2016
The following tables set forth summary information regarding our operating segment results for the years ended December 31, 2017 and 2016.
|
|
Year Ended December 31, 2017
1
|
|||||||||||||||||||
|
OPC
|
Qoros
2
|
Other
3
|
Adjustments
4
|
Consolidated Results
|
||||||||||||||||
|
(in millions of USD, unless otherwise indicated)
|
||||||||||||||||||||
|
Sales
|
$
|
365
|
$
|
-
|
$
|
1
|
$
|
-
|
$
|
366
|
||||||||||
|
Depreciation and amortization
|
(30
|
)
|
-
|
(1
|
)
|
-
|
(31
|
)
|
||||||||||||
|
Impairment of assets and investments
|
-
|
-
|
29
|
-
|
29
|
|||||||||||||||
|
Financing income
|
1
|
-
|
13
|
(11
|
)
|
3
|
||||||||||||||
|
Financing expenses
|
(34
|
)
|
-
|
(47
|
)
|
11
|
(70
|
)
|
||||||||||||
|
Share in (losses) income of associated companies
|
-
|
(121
|
)
|
10
|
-
|
(111
|
)
|
|||||||||||||
|
Profit / (Loss) before taxes
|
$
|
23
|
$
|
(121
|
)
|
$
|
(38
|
)
|
$
|
-
|
$
|
(136
|
)
|
|||||||
|
Income taxes
|
(9
|
)
|
-
|
(64
|
)
|
-
|
(73
|
)
|
||||||||||||
|
Profit / (Loss) from continuing operations
|
$
|
14
|
$
|
(121
|
)
|
$
|
(102
|
)
|
$
|
-
|
$
|
(209
|
)
|
|||||||
|
Segment assets
5
|
$
|
936
|
$
|
-
|
$
|
1,468
|
6
|
$
|
-
|
$
|
2,404
|
|||||||||
|
Investments in associated companies
|
-
|
2
|
120
|
-
|
122
|
|||||||||||||||
|
Segment liabilities
|
743
|
-
|
732
|
7
|
-
|
1,475
|
||||||||||||||
|
Capital expenditure
8
|
109
|
-
|
121
|
-
|
230
|
|||||||||||||||
| (1) |
In December 2017, Inkia completed the sale of the Inkia Business. For further information, see Note 29 to our financial statements included in this annual report.
|
| (2) |
Associated company.
|
| (3) |
Includes the results of Primus and HelioFocus (which was liquidated in July 2017); the results of ZIM, as an associated company; as well as Kenon’s and IC Green’s holding company and general and administrative expenses.
|
| (4) |
“Adjustments” includes inter-segment financing income and expenses.
|
| (5) |
Excludes investments in associates.
|
| (6) |
Includes Kenon’s, IC Green’s and IC Power holding company assets.
|
| (7) |
Includes Kenon’s, IC Green’s and IC Power holding company liabilities.
|
| (8) |
Includes the additions of PP&E and intangibles based on an accrual basis.
|
|
|
Year Ended December 31, 2016
1
|
|||||||||||||||||||
|
OPC
|
Qoros
2
|
Other
3
|
Adjustments
4
|
Consolidated Results
|
||||||||||||||||
|
(in millions of USD, unless otherwise indicated)
|
||||||||||||||||||||
|
Sales
|
$
|
324
|
$
|
—
|
$
|
—
|
$
|
-
|
$
|
324
|
||||||||||
|
Depreciation and amortization
|
(27
|
)
|
—
|
-
|
-
|
(27
|
)
|
|||||||||||||
|
Impairment of assets and investments
|
-
|
—
|
(72
|
)
|
-
|
(72
|
)
|
|||||||||||||
|
Financing income
|
3
|
—
|
16
|
(12
|
)
|
7
|
||||||||||||||
|
Financing expenses
|
(23
|
)
|
—
|
(36
|
)
|
12
|
(47
|
)
|
||||||||||||
|
Share in losses of associated companies
|
-
|
(143
|
)
|
(43
|
)
|
-
|
(186
|
)
|
||||||||||||
|
Provision of financial guarantee
|
-
|
—
|
(130
|
)
|
-
|
(130
|
)
|
|||||||||||||
|
Profit/(Loss) before taxes
|
$
|
20
|
$
|
(143
|
)
|
$
|
(305
|
)
|
$
|
-
|
$
|
(428
|
)
|
|||||||
|
Income taxes
|
—
|
—
|
(2
|
)
|
-
|
(2
|
)
|
|||||||||||||
|
Profit/(Loss)from continuing operations
|
$
|
20
|
$
|
(143
|
)
|
$
|
(307
|
)
|
$
|
-
|
$
|
(430
|
)
|
|||||||
|
Segment assets
5
|
$
|
668
|
$
|
—
|
$
|
4,262
|
6
|
$
|
-
|
$
|
4,930
|
|||||||||
|
Investments in associated companies
|
-
|
118
|
90
|
-
|
208
|
|||||||||||||||
|
Segment liabilities
|
534
|
—
|
3,710
|
7
|
-
|
4,244
|
||||||||||||||
|
Capital expenditure
8
|
73
|
—
|
245
|
-
|
318
|
|||||||||||||||
| (1) |
Results during this period have been reclassified to reflect the results of the Inkia Business as discontinued operations. For further information, see Note 29 to our financial statements included in this annual report.
|
| (2) |
Associated company.
|
| (3) |
Includes the results of Primus and HelioFocus (which was liquidated in July 2017); the results of ZIM, as an associated company; as well as Kenon’s and IC Green’s holding company and general and administrative expenses.
|
| (4) |
“Adjustments” includes inter-segment financing income and expenses.
|
| (5) |
Excludes investments in associates.
|
| (6) |
Includes Kenon’s, IC Green’s and IC Power holding company assets.
|
| (7) |
Includes Kenon’s, IC Green’s and IC Power holding company liabilities.
|
| (8) |
Includes the additions of PP&E and intangibles based on an accrual basis.
|
117
The following table sets forth summary information regarding the results of operations of our equity-method businesses for the periods presented:
|
Year Ended December 31,
|
Year Ended December 31,
|
|||||||||||||||
|
2017
|
2016
|
|||||||||||||||
|
ZIM
|
Qoros
|
ZIM
|
Qoros
|
|||||||||||||
|
(in millions of USD)
|
||||||||||||||||
|
Revenues
|
$
|
2,978
|
$
|
280
|
$
|
2,539
|
$
|
377
|
||||||||
|
Income/(Loss)
|
6
|
(242
|
)
|
(168
|
)
|
(285
|
)
|
|||||||||
|
Other comprehensive income/(loss)
|
(4
|
)
|
-
|
(13
|
)
|
—
|
||||||||||
|
Total comprehensive income/(loss)
|
$
|
2
|
$
|
(242
|
)
|
$
|
(181
|
)
|
$
|
(285
|
)
|
|||||
|
Share of Kenon in total comprehensive income/(loss)
|
$
|
2
|
$
|
(121
|
)
|
$
|
(57
|
)
|
$
|
(143
|
)
|
|||||
|
Adjustments
|
8
|
-
|
9
|
—
|
||||||||||||
|
Share of Kenon in total comprehensive income/(loss) presented in the books
|
$
|
10
|
$
|
(121
|
)
|
$
|
(48
|
)
|
$
|
(143
|
)
|
|||||
|
Total assets
|
$
|
1,802
|
$
|
1,495
|
$
|
1,704
|
$
|
1,534
|
||||||||
|
Total liabilities
|
1,896
|
1,674
|
1,804
|
1,469
|
||||||||||||
|
Book value of investment
|
120
|
2
|
82
|
118
|
||||||||||||
Revenues
Our revenues (representing OPC’s revenues) increased by $
41
million to $36
5
million for the year ended December 31, 2017 from $324 million for the year ended December 31, 2016.
As OPC’s revenues are denominated in NIS, translation of its revenues to U.S. Dollars had a positive impact of $21 million.
Excluding the impact of fluctuations in the U.S. Dollar to NIS exchange rate on the translation of OPC's results from NIS into U.S. Dollars, revenues increased by $20 million, primarily as a result of (i)
a
$17 million increase due to the higher
electricity tariffs in 2017 as compared to 2016 and
increased volume of
sales to private customers
and (ii) $3 million collected from customers for sales in prior periods, which payments had been delayed due to a delay in availability of relevant data
.
118
Cost of Sales and Services (excluding Depreciation and Amortization)
Our cost of sales (representing OPC’s cost of sales) increased by $16 million to $267 million for the year ended December 31, 2017, as compared to $251 million for the year ended December 31, 2016. Translation of OPC’s cost of sales to US Dollars increased its cost of sales by $16 million. Excluding the impact of exchange rate fluctuations on the translation of OPC's cost of sales from NIS into US Dollars, cost of sales decreased by $1 million, primarily as a result of (i) a $9 million decrease in energy purchases due to the increased availability of the OPC-Rotem station (in 2016 the OPC-Rotem power plant incurred a scheduled major maintenance) and (ii) a $4 million decrease in gas costs, as the gas price is indexed to the US Dollar (this impact was partially offset by higher quantities of gas purchased in 2017). These effects were partially offset by a $11 million increase in payments to IEC due to the increase in infrastructure and system cost rates and $1 million in payments made to IEC in connection with payments made for prior periods which had been delayed due to a delay in availability of relevant data.
Depreciation and Amortization
Our depreciation and amortization expenses (representing OPC’s depreciation and amortization expenses) increased by $4 million to $31 million for the year ended December 31, 2017 from $27 million for the year ended December 31, 2016. Excluding the impact of fluctuations in the U.S. Dollar to NIS exchange rate on the translation of OPC's results from NIS into U.S. Dollars, depreciation and amortization expenses increased by 6%, primarily as a result of maintenance work that was carried out earlier than scheduled, which increased the amounts of fixed assets and accordingly depreciation.
Selling, General and Administrative Expenses
Our selling, general and administrative expenses consist of payroll and related expenses, bad/doubtful debts, depreciation and amortization, and other expenses. Our selling, general and administrative expenses (excluding depreciation and amortization) increased to approximately $56 million for the year ended December 31, 2017, compared to $47 million for the year ended December 31, 2016. This increase was primarily driven by (i) OPC’s selling, general and administrative expenses (as discussed below) and (ii) approximately $6 million in additional payroll and professional fees incurred at the Kenon level in connection with the disposal of the Inkia business, the partial disposal of Qoros and related restructuring of remaining Kenon entities.
OPC’s selling, general and administrative expenses increased by $3 million, or 46%, to $11 million for the year ended December 31, 2017 from $8 million for the year ended December 31, 2016. Excluding the impact of fluctuations in the U.S. Dollar to NIS exchange rate on the translation of OPC's results from NIS into U.S. Dollars, OPC’s selling, general and administrative expenses increased by 37%, primarily as a result of (i) a $2 million increase in payroll and directors’ fees and a one-off grant and (ii) a $1 million increase in professional and legal service fees in 2017.
Impairment of Assets and Investments
In 2016, Kenon recognized an impairment loss of $72 million with respect to its investment in ZIM in 2016. Kenon conducted the impairment test as a result of conditions in the container shipping market during 2016.
In 2017, Kenon did not recognize any impairment of its investments. However, as a result of improved operating conditions at ZIM throughout 2017, Kenon conducted another impairment analysis as of December 31, 2017. The analysis concluded that Kenon should reverse $29 million of the impairment recognized in 2016.
For further information, see “—
Critical Accounting Policies and Significant Estimates—Impairment Analysis.
”
Financing Expenses, Net
Our financing expenses, net, increased by $27 million, or 68%, to $67 million for the year ended December 31, 2017, compared to $40 million for the year ended December 31, 2016. This increase was primarily driven by the increase in OPC’s financing expenses, net (as described below).
119
OPC’s financing expenses, net increased by approximately $1
3
million to $3
3
million in 2017 from $
20
million in 2016
, primarily as a result of (i) a $6 million early payment (make-whole) fee incurred as a result of the early repayment in full of OPC’s mezzanine loan in May 2017, (ii) a $3 million increase in financing expenses relating to OPC’s August 2017 bond issuance (iii) a $3 million increase due to impact of exchange rate fluctuations, and (iv) a $1 million increase in expenses as a result of fluctuations in the CPI.
Provision of Financial Guarantee
We recorded a provision of financial guarantee in the amount of $130 million in the year ended December 31, 2016. In light of Kenon’s strategy and Qoros’ limited liquidity as of June 30, 2016, Kenon increased its previously recorded liability of $30 million to $160 million in respect of Kenon’s back-to-back guarantee obligations to Chery. For further information on Kenon’s back-to-back guarantee obligations to Chery, including Kenon’s agreement to fund shareholder loans to Qoros in connection with the full release of Kenon’s obligations under its back-to-back guarantees to Chery, see “
Item 5.B Liquidity and Capital Resources— Kenon’s Liquidity and Capital Resources—Kenon’s Commitments and Obligations—Back-to-Back Guarantees Provided to Chery.
”
We did not record on our income statement any further provision of financial guarantee in the year ended December 31, 2017. In 2017, Kenon reduced its previously recorded liability in respect of Kenon’s back-to-back guarantee obligations to Chery to $44 million by providing additional shareholder loans to Qoros on behalf of Chery.
Share In Income (Losses) of Associated Companies, Net of Tax
Our share in losses of associated companies, net of tax decreased by 40% to approximately $111 million for the year ended December 31, 2017, compared to approximately $186 million for the year ended December 31, 2016. Set forth below is a discussion of income (losses) for our material associated companies and the share in income (losses) of associated companies, net of tax.
Qoros
Our share in Qoros’ comprehensive loss decreased to approximately $121 million for the year ended December 31, 2017, compared to losses of approximately $143 million for the year ended December 31, 2016. Although we now have a 24% equity interest in Qoros, we held a 50% stake in Qoros prior to the New Qoros Investor’s investment and therefore recognized 50% of the net loss of Qoros in 2017 (RMB1,612 million) and 2016 (RMB1,897 million). A discussion of Qoros’ results of operations (on a 100% basis; Kenon’s share is 24%) for 2017 and 2016 is set forth below.
Qoros’ revenues decreased by 25% to RMB1,886 million in 2017, as compared to RMB2,512 million in 2016. Qoros’ decreased revenues in 2017 reflect an approximately 38% decrease in car sales from approximately 24,000 cars in 2016 to approximately 15,000 cars in 2017.
Qoros’ cost of sales decreased by 25% to RMB2,262 million in 2017, as compared to RMB3,009 million in 2016. The decrease in cost of sales is primarily due to the decrease in the number of cars sold, as well as a decrease in depreciation and amortization to RMB615 million in 2017, as compared to RMB659 million in 2016.
Qoros’ research and development expenses increased by 58% to RMB322 million in 2017, as compared to RMB204 million in 2016, reflecting increased expenses incurred for the research and development activities of a Qoros car model.
120
Qoros’ selling, general and administrative expenses decreased by 21% to RMB605 million in 2017, as compared to RMB763 million in 2016. The decrease reflects a reduction in advertising, marketing and promoting and consulting fees.
Primarily as a result of the foregoing, Qoros’ loss decreased to RMB1.6 billion for the year ended December 31, 2017, as compared to RMB1.9 billion for the year ended December 31, 2016.
ZIM
Pursuant to the equity method of accounting, our share in ZIM’s results of operations was income of approximately $10 million and loss of $48 million for the year ended December 31, 2017 and 2016, respectively. Set forth below is a summary of ZIM’s consolidated results for the year ended December 31, 2017 and 2016:
|
Year Ended December 31,
|
||||||||
|
2017
|
2016
|
|||||||
|
(in millions of USD)
|
||||||||
|
Sales
|
$
|
2,978
|
$
|
2,539
|
||||
|
Cost of sales
|
2,697
|
2,480
|
||||||
|
Gross profit
|
281
|
59
|
||||||
|
Operating profit (loss)
|
135
|
(52
|
)
|
|||||
|
Profit (loss) before taxes on income
|
25
|
(145
|
)
|
|||||
|
Taxes on income
|
(14
|
)
|
(19
|
)
|
||||
|
Profit (loss) after taxes on income
|
11
|
(164
|
)
|
|||||
|
Profit (loss) for the period
|
$
|
11
|
$
|
(164
|
)
|
|||
ZIM carried approximately 2,629 thousand TEUs in 2017, representing an 8% increase as compared to 2016, in which ZIM carried approximately 2,429 thousand TEUs. ZIM’s revenues increased by 17% in 2017 to approximately $3.0 billion, as compared to approximately $2.5 billion in 2016, due to the increase in carried quantities, as well as the increase in industry container freight rates. ZIM’s operating expenses and cost of services increased by 9% to approximately $2.6 billion, as compared to approximately $2.4 billion in 2016, primarily as a result of an increase in cargo handling expenses, as well as an increase in bunker prices.
ZIM publishes its results on its website. For more information, see www.ZIM.com. This website, and any information referenced therein, is not incorporated by reference herein.
Tax Expenses
Our taxes on income increased by $
71
million to $7
3
million for the year ended December 31, 2017 from $2 million for the year ended December 31, 2016. This increase was primarily driven by approximately $6
3
million in tax expenses incurred in
connection with a planned restructuring of some of the companies remaining in the Kenon group, which will simplify the holding structure. There was also an increase in OPC’s tax expenses (as described below).
OPC’s tax expenses increased to $9 million for the year ended December 31, 2017, as compared to $66 thousand for the year ended December 31, 2016, primarily as a result of lower tax on income reported in 2016 due to the reduction in corporate tax rates in 2016, which reduced deferred tax liabilities.
121
Net Income For the Year From Discontinued Operations (After Taxes)
Our net income for the year from discontinued operations (after taxes) is comprised of the results of the Inkia Business and the gain on disposal of the Inkia Business.
Revenues for the year from discontinued operations increased to approximately $1,777 million for the year ended December 31, 2017, compared to approximately $1,517 million for the year ended December 31, 2016.
Operating income for the year from discontinued operations increased to approximately $152 million for the year ended December 31, 2017, compared to approximately $92 million for the year ended December 31, 2016.
Our net income for the year from discontinued operations (after taxes) increased to approximately $79 million for the year ended December 31, 2017, compared to approximately $35 million for the year ended December 31, 2016.
Our 2017 results attributable to discontinued operations includes a net gain (after tax) on the sale of discontinued operations of $
397
million.
For more information on discontinued operations, see Note 2
9
to our financial statements included in this annual report.
Profit (Loss) For the Year
As a result of the above, our profit for the year amounted to $26
9
million for the year ended December 31, 2017, compared to a loss of $394 million for the year ended December 31, 2016.
Year Ended December 31, 2016 Compared to Year Ended December 31, 2015
The following tables set forth summary information regarding our operating segment results for the years ended December 31, 2016 and 2015.
|
|
Year Ended December 31, 2016
1
|
|||||||||||||||||||
|
OPC
|
Qoros
2
|
Other
3
|
Adjustments
4
|
Consolidated Results
|
||||||||||||||||
|
(in millions of USD, unless otherwise indicated)
|
||||||||||||||||||||
|
Sales
|
$
|
324
|
$
|
—
|
$
|
—
|
$
|
-
|
$
|
324
|
||||||||||
|
Depreciation and amortization
|
(27
|
)
|
—
|
-
|
-
|
(27
|
)
|
|||||||||||||
|
Impairment of assets and investments
|
-
|
—
|
(72
|
)
|
-
|
(72
|
)
|
|||||||||||||
|
Financing income
|
3
|
—
|
16
|
(12
|
)
|
7
|
||||||||||||||
|
Financing expenses
|
(23
|
)
|
—
|
(36
|
)
|
12
|
(47
|
)
|
||||||||||||
|
Share in losses of associated companies
|
-
|
(143
|
)
|
(43
|
)
|
-
|
(186
|
)
|
||||||||||||
|
Provision of financial guarantee
|
-
|
—
|
(130
|
)
|
-
|
(130
|
)
|
|||||||||||||
|
Profit / (Loss) before taxes
|
$
|
20
|
$
|
(143
|
)
|
$
|
(305
|
)
|
$
|
-
|
$
|
(428
|
)
|
|||||||
|
Income taxes
|
—
|
—
|
(2
|
)
|
-
|
(2
|
)
|
|||||||||||||
|
Profit / (Loss) from continuing operations
|
$
|
20
|
$
|
(143
|
)
|
$
|
(307
|
)
|
$
|
-
|
$
|
(430
|
)
|
|||||||
|
Segment assets
5
|
$
|
668
|
$
|
—
|
$
|
4,262
|
6
|
$
|
-
|
$
|
4,930
|
|||||||||
|
Investments in associated companies
|
-
|
118
|
90
|
-
|
208
|
|||||||||||||||
|
Segment liabilities
|
534
|
—
|
3,710
|
7
|
-
|
4,244
|
||||||||||||||
|
Capital expenditure
8
|
73
|
—
|
245
|
-
|
318
|
|||||||||||||||
____________________________________
| (1) |
Results during this period have been reclassified to reflect the results of the Inkia Business as discontinued operations. For further information, see Note 29 to our financial statements included in this annual report.
|
| (2) |
Associated company.
|
| (3) |
Includes the results of Primus and HelioFocus (which was liquidated in July 2017); the results of ZIM, as an associated company; as well as Kenon’s and IC Green’s holding company and general and administrative expenses.
|
| (4) |
“Adjustments” includes inter-segment financing income and expenses.
|
| (5) |
Excludes investments in associates.
|
| (6) |
Includes Kenon’s, IC Green’s and IC Power holding company assets.
|
| (7) |
Includes Kenon’s, IC Green’s and IC Power holding company liabilities.
|
| (8) |
Includes the additions of PP&E and intangibles based on an accrual basis.
|
122
|
Year Ended December 31, 2015
1
|
||||||||||||||||||||
|
OPC
|
Qoros
2
|
Other
3
|
Adjustments
4
|
Consolidated Results
|
||||||||||||||||
|
(in millions of USD, unless otherwise indicated)
|
||||||||||||||||||||
|
Sales
|
$
|
326
|
$
|
—
|
$
|
—
|
$
|
-
|
$
|
326
|
||||||||||
|
Depreciation and amortization
|
(26
|
)
|
—
|
1
|
—
|
(25
|
)
|
|||||||||||||
|
Asset impairment
|
-
|
—
|
(7
|
)
|
—
|
(7
|
)
|
|||||||||||||
|
Financing income
|
3
|
—
|
8
|
—
|
11
|
|||||||||||||||
|
Financing expenses
|
(26
|
)
|
—
|
(10
|
)
|
—
|
(36
|
)
|
||||||||||||
|
Share in (losses) income of associated companies
|
-
|
(196
|
)
|
9
|
—
|
187
|
||||||||||||||
|
Gain from distribution of dividend in kind
|
-
|
—
|
210
|
—
|
210
|
|||||||||||||||
|
Profit / (Loss) before taxes
|
$
|
30
|
$
|
(196
|
)
|
$
|
199
|
$
|
—
|
$
|
33
|
|||||||||
|
Income taxes
|
(8
|
)
|
—
|
(1
|
)
|
—
|
(9
|
)
|
||||||||||||
|
Profit / (Loss) from continuing operations
|
$
|
22
|
$
|
(196
|
)
|
$
|
198
|
$
|
—
|
$
|
24
|
|||||||||
|
Segment assets
5
|
$
|
811
|
$
|
—
|
$
|
3,303
|
6
|
$
|
—
|
$
|
4,114
|
|||||||||
|
Investments in associated companies
|
-
|
159
|
210
|
—
|
369
|
|||||||||||||||
|
Segment liabilities
|
677
|
—
|
2,542
|
7
|
—
|
3,219
|
||||||||||||||
|
Capital expenditure
8
|
18
|
—
|
556
|
—
|
574
|
|||||||||||||||
| (1) |
Results during this period have been reclassified to reflect the results of the Inkia Business as discontinued operations. For further information, see Note 29 to our financial statements included in this annual report.
|
| (2) |
Associated company.
|
| (3) |
Includes the results of Primus and HelioFocus (which was liquidated in July 2017); the results of ZIM and Tower (up to June 30, 2015), as associated companies; as well as Kenon’s and IC Green’s holding company and general and administrative expenses.
|
| (4) |
“Adjustments” includes inter-segment sales.
|
| (5) |
Excludes investments in associates.
|
| (6) |
Includes Kenon’s, IC Green’s and IC Power holding company assets.
|
| (7) |
Includes Kenon’s, IC Green’s and IC Power holding company liabilities.
|
| (8) |
Includes the additions of PP&E and intangibles based on an accrual basis.
|
The following table sets forth summary information regarding the results of operations of our equity-method businesses for the periods presented:
|
Year Ended December 31,
|
Year Ended December 31,
|
|||||||||||||||||||
|
2016
|
2015
|
|||||||||||||||||||
|
ZIM
|
Qoros
|
ZIM
|
Qoros
|
Tower
1
|
||||||||||||||||
|
(in millions of USD)
|
||||||||||||||||||||
|
Revenues
|
$
|
2,539
|
$
|
377
|
$
|
2,991
|
$
|
232
|
$
|
462
|
||||||||||
|
Income/(Loss)
|
(168
|
)
|
(285
|
)
|
2
|
(392
|
)
|
(1
|
)
|
|||||||||||
|
Other comprehensive income/(loss)
|
(13
|
)
|
—
|
(2
|
)
|
—
|
—
|
|||||||||||||
|
Total comprehensive income/(loss)
|
$
|
(181
|
)
|
$
|
(285
|
)
|
$
|
—
|
$
|
(392
|
)
|
$
|
(1
|
)
|
||||||
|
Share of Kenon in total comprehensive income/(loss)
|
$
|
(57
|
)
|
$
|
(143
|
)
|
$
|
—
|
$
|
(196
|
)
|
$
|
—
|
|||||||
|
Adjustments
|
9
|
—
|
10
|
—
|
(1
|
)
|
||||||||||||||
|
Share of Kenon in total comprehensive income/(loss) presented in the books
|
$
|
(48
|
)
|
$
|
(143
|
)
|
$
|
10
|
$
|
(196
|
)
|
$
|
(1
|
)
|
||||||
|
Total assets
|
$
|
1,704
|
$
|
1,534
|
$
|
1,912
|
$
|
1,665
|
$
|
—
|
||||||||||
|
Total liabilities
|
1,804
|
1,469
|
1,834
|
1,635
|
—
|
|||||||||||||||
|
Book value of investment
|
82
|
118
|
201
|
159
|
—
|
|||||||||||||||
| (1) |
Reflects Tower’s results of operations up to June 30, 2015. As a result of our distribution in specie of substantially all of our interest in Tower, representing 23% of the then currently outstanding Tower shares on July 23, 2015, Tower’s results of operations for all periods subsequent to June 30, 2015 are not reflected in our consolidated financial statements.
|
123
Revenues
Our revenues (representing OPC’s revenues) decreased by $2 million, or 1%, to $324 million for the year ended December 31, 2016 from $326 million for the year ended December 31, 2015, primarily as a result of the decline in the EA generation component tariff in August 2015 (which tariff forms the basis for the prices in OPC-Rotem’s PPAs). The decrease was partially offset by a full year of steam sales to Hadera Paper, which started in August 2015.
Cost of Sales and Services (excluding Depreciation and Amortization)
Our cost of sales (excluding depreciation and amortization) (representing OPC’s cost of sales) increased by $6 million to $251 million for the year ended December 31, 2016 from $245 million for the year ended December 31, 2015, largely in line with the increase in revenue (ignoring exchange rate effects).
Depreciation and Amortization
Our depreciation and amortization expenses (representing OPC’s depreciation and amortization expenses) increased by $2 million to $27 million for the year ended December 31, 2016 from $25 million for the year ended December 31, 2015.
Selling, General and Administrative Expenses
Our selling, general and administrative expenses (excluding depreciation and amortization) decreased to approximately $47 million for the year ended December 31, 2016, compared to $50 million for the year ended December 31, 2015.
Gain from Distribution of Dividend in Kind
On July 23, 2015, we completed the pro rata distribution of substantially all of our interest in Tower. We recognized a $210 million gain in the year ended December 21, 2015, which reflects the difference between the fair market value of the Tower ordinary shares held by us on the distribution date ($255 million based upon the closing price of the Tower shares on NASDAQ on the date of our distribution of such shares to our shareholders by way of a capital reduction) and the carrying amount of Tower’s shares at the time of the distribution ($45 million).
We did not recognize any gain from distribution of dividend in kind in 2016.
Impairment of Assets and Investments
In 2016, Kenon recognized an impairment loss of $72 million with respect to its investment in ZIM in 2016. Kenon conducted the impairment test as a result of conditions in the container shipping market during 2016.
124
Our $7 million asset impairment in 2015 is due to IC Green writing-off its goodwill in Primus in the amount of $6 million.
For further information, see “—
Critical Accounting Policies and Significant Estimates—Impairment Analysis.
”
Financing Expenses, Net
Our financing expenses, net, increased by $
15
million, or
60
%, to $
40
million for the year ended December 31, 2016, compared to $
25
million for the year ended December 31, 2015. This increase was primarily driven by
(i) an $8 million interest expense relating to the $120 million ICPDH Credit Agreement entered into in connection with IC Power’s acquisition of its distribution business and (ii) a $7 million increase in finance expenses in Inkia related to the cessation of capitalization of finance expenses due the commencement of CDA’s commercial operations in 2016
.
Provision of Financial Guarantee
We recorded a provision of financial guarantee in the amount of $130 million in the year ended December 31, 2016. In light of Kenon’s strategy and Qoros’ limited liquidity as of June 30, 2016, Kenon increased its previously recorded liability of $30 million to $160 million in respect of Kenon’s back-to-back guarantee obligations to Chery. For further information on Kenon’s back-to-back guarantee obligations to Chery, including Kenon’s agreement to fund shareholder loans to Qoros in connection with the full release of Kenon’s obligations under its back-to-back guarantees to Chery, see “
tem 5.B Liquidity and Capital Resources— Kenon’s Liquidity and Capital Resources—Kenon’s Commitments and Obligations—Back-to-Back Guarantees Provided to Chery.
”
We did not record on our income statement a provision of financial guarantee for the year ended December 31, 2015.
Share In Income (Losses) of Associated Companies, Net of Tax
Our share in losses of associated companies, net of tax decreased by 1% to approximately $186 million for the year ended December 31, 2016, compared to approximately $187 million for the year ended December 31, 2015. Set forth below is a discussion of income (losses) for our material associated companies and the share in income (losses) of associated companies, net of tax.
Qoros
Our share in Qoros’ comprehensive loss decreased to approximately $143 million for the year ended December 31, 2016, compared to losses of approximately $196 million for the year ended December 31, 2015. As we had a 50% equity interest in Qoros in 2016 and 2015, we recognized 50% of the net loss of Qoros in 2016 (RMB1,897 million) and 2015 (RMB2,475 million). A discussion of Qoros’ results of operations (on a 100% basis; Kenon’s share was 50% in 2016 and 2015) for 2016 and 2015 is set forth below. Qoros’ results of operation for 2016 and 2015 reflect the fact that Qoros is an early stage automobile manufacturer. Accordingly, Qoros has incurred significant expenses, including expenses relating to the launch of new models, but has not achieved significant revenues.
Qoros’ revenues increased by 72% to RMB2,512 million in 2016, as compared to RMB1,459 million in 2015. Qoros’ increased revenues in 2016 reflect an approximately 70% increase in car sales from approximately 14,000 cars in 2015 to approximately 24,000 cars in 2016. The launch of the Qoros 5 SUV in March 2016 was a major contributor to the increase in Qoros’ car sales.
Qoros’ cost of sales increased by 76% to RMB3,009 million in 2016, as compared to RMB1,713 million in 2015. The increase in cost of sales is primarily due to the increase in the number of cars sold, as well as an increase in amortization of capitalized research and development costs and an increase in depreciation of property, plant and equipment.
125
Qoros’ cost of sales included depreciation and amortization of RMB659 million in 2016, as compared to RMB230 million in 2015.
Qoros’ gross loss increased by 96% to RMB497 million in 2016, as compared to RMB254 million in 2015.
Qoros’ selling, general and administrative expenses decreased by 51% to RMB763 million in 2016, as compared to RMB1,560 million in 2015. The decrease reflects cost-cutting measures implemented by Qoros in 2016, including a reduction in advertising, marketing and promoting, consulting fees and personnel expenses.
Qoros’ net finance costs increased by 16% to RMB403 million in 2016, as compared to RMB346 million in 2015, primarily due to increased interest expenses.
As a result of the foregoing, Qoros’ loss decreased to RMB1.9 billion for the year ended December 31, 2016, as compared to RMB2.5 billion for the year ended December 31, 2015.
ZIM
Pursuant to the equity method of accounting, our share in ZIM’s results of operations was a loss of approximately $44 million and income of $10 million for the years ended December 31, 2016 and 2015, respectively. Set forth below is a summary of ZIM’s consolidated results for the years ended December 31, 2016 and 2015:
|
Year Ended December 31,
|
||||||||
|
2016
|
2015
|
|||||||
|
(in millions of USD)
|
||||||||
|
Sales
|
$
|
2,539
|
$
|
2,991
|
||||
|
Cost of sales
|
2,480
|
2,775
|
||||||
|
Gross profit
|
59
|
216
|
||||||
|
Operating profit (loss)
|
(52
|
)
|
98
|
|||||
|
Profit (loss) before taxes on income
|
(145
|
)
|
5
|
|||||
|
Taxes on income
|
(19
|
)
|
2
|
|||||
|
Profit (loss) after taxes on income
|
(164
|
)
|
7
|
|||||
|
Profit (loss) for the period
|
$
|
(164
|
)
|
$
|
7
|
|||
ZIM carried approximately 2,429 thousand TEUs in 2016, representing a 5% increase as compared to 2015, in which ZIM carried approximately 2,308 thousand TEUs. Despite the increase in carried quantities in 2016, ZIM’s revenues decreased by 15% in 2016 to approximately $2.5 billion, as compared to approximately $3.0 billion in 2015, due to the decrease in industry container freight rates. ZIM’s operating expenses and cost of services decreased by 11% to approximately $2.4 billion in 2016, as compared to $2.7 billion in 2015, primarily as a result of a decrease in bunker prices, as well as a decrease in charter hire expenses and cargo handling expenses, as a result of steps implemented by ZIM to manage its costs.
Tower
We did not record any comprehensive income for the year ended December 31, 2016 from Tower, as we completed the pro rata distribution of substantially all of our interest in Tower in 2015.
Our share in Tower’s comprehensive loss for the period in 2015 prior to June 30, 2015, during which period Kenon accounted for Tower’s results of operations pursuant to the equity method of accounting, was approximately $1 million.
Tax Expenses
Our taxes on income decreased by $7 million, or 78%, to $2 million for the year ended December 31, 2016 from $9 million for the year ended December 31, 2015, primarily as a result of the change in OPC’s corporate tax rate in 2016.
126
Net Income For the Year From Discontinued Operations (After Taxes)
Our net income for the year from discontinued operations (after taxes) is comprised of the results of the Inkia Business.
Revenues for the year from discontinued operations increased to approximately $1,517 million for the year ended December 31, 2016, compared to approximately $963 million for the year ended December 31, 2015.
Operating income for the year from discontinued operations increased to approximately $92 million for the year ended December 31, 2016, compared to approximately $126 million for the year ended December 31, 2015.
Our net income for the year from discontinued operations (after taxes) decreased to approximately $35 million for the year ended December 31, 2016, compared to approximately $73 million for the year ended December 31, 2015.
For more information on discontinued operations, see Note 2
9
to our financial statements included in this annual report.
Profit (Loss) For the Year
As a result of the above, our loss for the year amounted to $394 million for the year ended December 31, 2016, compared to a profit of $96 million for the year ended December 31, 2015.
B.
Liquidity and Capital Resources
Kenon’s Liquidity and Capital Resources
As of December 31, 2017, Kenon had approximately $62 million in cash on an unconsolidated basis
and
gross
debt of $240 million.
The net proceeds from the sale of the Inkia Businesses, after repayment of certain debt, taxes and expenses, amounted to $635 million, consisting of (i) $935 million cash received from the sale and (ii) $222 million retained cash at Inkia, minus (iii) $243 million repayment of the full outstanding loan from IC ($240 million paid toIC, plus $3 million withholding tax), (iv) $43 million net debt full outstanding of IC Power, and (v) $236 million expenses related to the Inkia sale. An additional $27 million in taxes remains to be paid upon payment of the $175 million deferred payment obligation.
I
n March 2018, we distributed $665 million to our shareholders.
We believe that Kenon’s working capital (on a stand-alone basis) is sufficient for its present requirements. Our principal needs for liquidity are expenses related to our day-to-day operations. We may also incur expenditures related to investments in our businesses, our back-to-back guarantees to Chery with respect to Qoros’ indebtedness and expenses we may incur in connection with legal claims and other rights we retained in connection with the sale of the Inkia Business. Our businesses are at various stages of development, ranging from early stage companies to established, cash generating businesses, and some of these businesses will require significant financing, via equity contributions or debt facilities, to further their development, execute their current business plans, and become or remain fully-funded. We may, in furtherance of the development of our businesses, make further investments, via debt or equity financings, in our remaining businesses.
Kenon has outstanding guarantee obligations to Chery of RMB320 million, with respect to Qoros’ debt in principal of RMB288 million. During 2017, Kenon undertook various steps to reduce its back-to-back guarantee obligations, which were RMB850 million as of December 31, 2016. In 2016 and 2017, Kenon entered into agreements with Chery to provide financing to Qoros in connection with a release of Kenon’s back-to-back guarantee obligations to Chery. Pursuant to these agreements, during 2017 Kenon funded shareholder loans of RMB488 million (of which RMB244 million was advanced on behalf of Chery) to Qoros, reducing Kenon’s
back-to-back guarantee obligations to Chery from RMB850 million to RMB320 million,
with respect to debt in principal of RMB288 million
.
127
I
n January 2018, Kenon announced the New Qoros Investor completed a transaction to purchase 51% of Qoros from Kenon and Chery for RMB3.315 billion (approximately $526 million), which is part of an investment structure to invest a total of approximately RMB6.63 billion (approximately $1,052 million) by the New Qoros Investor of which RMB6.5 billion will ultimately be invested in Qoros’ equity. As a result, Kenon and Chery now have 24% and 25% stakes in Qoros, respectively. The total cash proceeds of RMB1.69 billion ($268 million) received by Kenon from the New Qoros Investor from the sale of its Qoros interests, will be used by Kenon to fund all or a portion of its required investment in Qoros and repayments to Ansonia.
As part of the investment, the New Qoros Investor will assume its pro rata share of the guarantees and equity pledges based on post-investment equity ownership in Qoros, which will be subject to further adjustment following any future changes in the equity ownership in Qoros (including as a result of the exercise of the put option or investment right by a shareholder under the investment agreement). The New Qoros Investor has assumed its proportionate obligations with respect to the RMB3 billion and RMB700 million loan facilities, and as a result, in January 2018, Chery repaid Kenon RMB120 million (approximately $18 million
4
) out of the total RMB244 million (approximately $39 million) previously advanced, and a significant portion of the Qoros equity pledged by Kenon to Chery was released. These repayments and releases of equity pledges were required under the terms of the advances, which provided for repayment of the advances and release of pledges to Chery upon a reduction of guarantee obligations of Chery, and the investment by the New Qoros Investor resulted in guarantee reductions for Chery requiring such repayment and releases from the pledge. The New Qoros Investor is still in the process of assuming its proportionate obligations with respect to the RMB1.2 billion loan facility after which Kenon will also be proportionately released from its pledge obligations thereunder, subject to the Qoros bank lender consent. Substantially all of Kenon's equity in Qoros is currently pledged.
The investment agreement provides for repayment of existing shareholder loans owing from Qoros in the principal amount of RMB944 million (approximately $150 million) to each of Kenon and Chery, in two equal tranches,
following the purchase of Kenon's and Chery's equity interests as described above
. In addition, Kenon retained RMB130 million from the sale of its 1% holding in Qoros (which was not to be reinvested into Qoros), out of the total sale proceeds of RMB1.69 billion. $20 million in proceeds retained by Kenon was applied to the partial repayment of the Ansonia loans in January 2018, leaving a balance of approximately $55 million (linked to RMB proceeds received by Kenon) of loans owing to Ansonia. A portion of these loan repayments to Kenon (or any sale proceeds, if retained by Kenon) will likely be applied to the repayment of such loans. As of December 31, 2017, the outstanding amount of these loans was approximately $75 million (including interest).
For further information on the investment in Qoros, see “
Item 4.B Business Overview—Our Businesses—Qoros —Qoros’ Investment Agreement
.”
In connection with Kenon's sale of its Inkia Businesses, Kenon has
given a three-year guarantee of Inkia’s indemnification obligations to the buyer of the Inkia Business. For further information, see “
Item 4.B Business Overview— Discontinued Operations – Inkia Business—Sale of the Inkia Business—Kenon Guarantee.
”
Kenon may not have sufficient liquidity to satisfy payment obligations under
the
guarantees
described above
. In the event that Kenon is required to make such payments, it would need to obtain such funds from its businesses, which may include OPC (via dividends, loans or advances, or the repayment of loans or advances to us, which may be funded by sales of assets or minority interests in our businesses), or obtain external financing, which may result in dilution of shareholders (in the event of equity financing) or additional debt obligations for the company (in the event of debt financing).
We intend to adhere to our capital allocation principles which seek to limit cross-allocation of funds and capital contributions to our businesses, via debt or equity financings or the provisions of guarantees. Nevertheless, the cash resources on Kenon’s balance sheet may not be sufficient to fund additional investments that we deem appropriate in our businesses or meet our guarantee obligations. As a result, Kenon may seek additional liquidity from its businesses. For a description of our capital allocation principles, see “
Item 4.B Business Overview
.” For further information on the risks related to the significant capital requirements of our businesses, see “
Item 3.D Risk Factors—Risks Related to Our Strategy and Operations—Some of our businesses have significant capital requirements.
” For a discussion of our outstanding commitments and obligations, see “—
Kenon’s Commitments and Obligations
.” For a discussion of the capital requirements of each of our businesses, see below.
4
Convenience translation of this RMB amount into US Dollars uses a January 2018 rate of 6.5: 1.
128
Consolidated Cash Flow Statement
Year Ended December 31, 2017 Compared to Year Ended December 31, 2016
Cash and cash equivalents increased to approximately $1,417 million for the year ended December 31, 2017, as compared to approximately $327 million for the year ended December 31, 2016
, primarily as a result of our receipt of the proceeds from the sale of the Inkia Business in December 2017.
The following table sets forth our summary cash flows from our operating, investing and financing activities for the years ended December 31, 2017 and 2016:
|
Year Ended December 31,
|
||||||||
|
2017
|
2016
1
|
|||||||
|
(in millions of USD)
|
||||||||
|
Continuing operations
|
||||||||
|
Net cash flows used in operating activities
|
||||||||
|
OPC
|
114
|
25
|
||||||
|
Adjustments and Other
|
(42
|
)
|
(39
|
)
|
||||
|
Total
|
72
|
(14
|
)
|
|||||
|
Net cash flows used in investing activities
|
(232
|
)
|
(99
|
)
|
||||
|
Net cash flows provided by financing activities
|
200
|
149
|
||||||
|
Net change in cash from continuing operations
|
40
|
36
|
||||||
|
Net change in cash from discontinued operations
|
1,033
|
(99
|
)
|
|||||
|
Cash—opening balance
|
327
|
384
|
||||||
|
Effect of exchange rate fluctuations on balances of cash and cash equivalents
|
17
|
6
|
||||||
|
Cash—closing balance
|
$
|
1,417
|
$
|
327
|
||||
| (1) |
Results during this period have been reclassified to reflect the results of the Inkia Business as discontinued operations. For further information, see Note 29 to our financial statements included in this annual report.
|
Cash Flows Provided by / (Used in) Operating Activities
Net cash flows provided by operating activities increased to $72 million for the year ended December 31, 2017 compared to $14 million net cash flows used in operating activities for the year ended December 31, 2016. The increase is primarily explained by the increase in OPC’s cash provided by operating activities as discussed below.
Cash flows provided by OPC’s operating activities increased to $114 million for the year ended December 31, 2017 from $25 million for the year ended December 31, 2016, primarily as a result of (i) a one-off payment of $43 million in system management costs that was made in 2016, (ii) an $18 million increase in working capital and (iii) the increase in the company’s revenues.
Cash Flows Used in Investing Activities
Net cash flows used in our investing activities increased to approximately $232 million for the year ended December 31, 2017, compared to approximately $99 million for the year ended December 31, 2016. This increase was primarily driven OPC’s investing activities as described below.
Cash flows used in OPC’s investing activities increased to $158 million for the year ended December 31, 2017 from $19 million for the year ended December 31, 2016, primarily as a result of (i) the increase in the amount of fixed assets purchased, primarily due to a $39 million additional investment in the Hadera project (ii) a $21 million deposit into a trust account in relation to the agreement with the Tamar Group, (iii) $21 million contributed in relation to corporate guarantees, (iv) a $7 million increase in restricted cash in respect of guarantees issued by OPC-Rotem and OPC-Hadera in 2017 and (v) a $50 million release of restricted cash in 2016 due to the partial prepayment of the mezzanine loan.
129
Cash Flows Provided by Financing Activities
Net cash flows provided by the financing activities of our consolidated businesses increased by 34% to approximately $200 million for the year ended December 31, 2017, compared to approximately $149 million for the year ended December 31, 2016. This increase was primarily driven by OPC’s financing activities as described below.
Cash flows provided by OPC’s financing activities increased by $59 million, or 57%, to $163 million for the year ended December 31, 2017, as compared to $104 million provided by OPC’s financing activities for the year ended December 31, 2016, primarily as a result of contributions of (i) $100 million in proceeds from OPC’s IPO, (ii) $88 million in proceeds from OPC’s bond issuance, (iii) $137 million from the drawdown of loans relating to the Hadera project and (iv) a $39 million decrease in the amount of dividends distributed in 2017 as compared to 2016. These effects were partially offset by OPC’s debt repayments in the total amount of $140 million in relation to its mezzanine loan, parent company loan, current portion of long-term debt and reconciliation of intercompany debt, as compared to $51 million debt repayments in 2016.
Net Change in Cash from Discontinued Operations
Net change in cash from discontinued operations in 2017 includes approximately $793 million net cash inflows resulting from the sale of the Inkia Business.
Year Ended December 31, 2016 Compared to Year Ended December 31, 2015
Cash and cash equivalents decreased 15% to approximately $327 million for the year ended December 31, 2016, compared to approximately $384 million for the year ended December 31, 2015. The following table sets forth our summary cash flows from our operating, investing and financing activities for the years ended December 31, 2016 and 2015:
|
Year Ended December 31,
|
||||||||
|
2016
1
|
2015
1
|
|||||||
|
(in millions of USD)
|
||||||||
|
Continuing Operations
|
||||||||
|
Net cash flows (used in) / provided by operating activities
|
||||||||
|
OPC
|
25
|
81
|
||||||
|
Adjustments and Other
|
(39
|
)
|
(21
|
)
|
||||
|
Total
|
(14
|
)
|
60
|
|||||
|
Net cash flows used in investing activities
|
(99
|
)
|
(99
|
)
|
||||
|
Net cash flows provided by financing activities
|
149
|
69
|
||||||
|
Net change in cash from continuing operations
|
36
|
30
|
||||||
|
Net change in cash from discontinued operations
|
(99
|
)
|
(244
|
)
|
||||
|
Cash—opening balance
|
384
|
610
|
||||||
|
Effect of exchange rate fluctuations on balances of cash and cash equivalents
|
6
|
(12
|
)
|
|||||
|
Cash—closing balance
|
$
|
327
|
$
|
384
|
||||
| (1) |
Results during this period have been reclassified to reflect the results of the Inkia Business as discontinued operations. For further information, see Note 29 to our financial statements included in this annual report.
|
Cash Flows (Used In) / Provided by Operating Activities
Net cash flows used in our operating activities decreased to approximately $14 million for the year ended December 31, 2016, compared to approximately $60 million net cash flows provided by operating activities for the year ended December 31, 2015. This decrease in cash used in operating activities was primarily driven by a decrease in cash provided by OPC’s operating activities.
Cash flows provided by OPC’s operating activities decreased by 69% to $25 million for the year ended December 31, 2016 from $81 million for the year ended December 31, 2015, primarily as a result of a $57 million decrease in OPC-Rotem’s net cash flows from operating activities as a result of a $40 million system costs provision paid by OPC-Rotem in February 2016 and lower operating results during the period.
130
Cash Flows Used in Investing Activities
Net cash flows used in our investing activities remained stable at $99 million for the year ended December 31, 2016 and the year ended December 31, 2015.
Cash Flows Provided by Financing Activities
Net cash flows provided by the financing activities of our consolidated businesses increased by 116% to approximately $149 million for the year ended December 31, 2016, compared to approximately $69 million for the year ended December 31, 2015. This increase was primarily driven by (1) the $35 million increase in cash flows provided by OPC’s financing activities (excluding OPC’s repayment of a $75 million note payable, plus $3 million of interest, to Kenon in 2016), and (2) a $34 million reduction in contributions from former parent IC provided in connection with the spin-off in January 2015.
Cash flows provided by OPC’s financing activities increased by 51% to $104 million for the year ended December 31, 2016 compared to $69 million for the year ended December 31, 2015, primarily as a result of (i) the full repayment of tranche A and partial repayment of tranche B of OPC’s mezzanine loan in the amount of $52 million and (ii) $53 million in connection with the dividend distribution. The increase was partially offset by (i) a $4 million decrease as a result of repayments made on the OPC-Rotem loan, (ii) a $4 million decrease in the repayment of capital notes and (iii) a $2 million decrease as a result of other loan repayments.
Kenon’s Commitments and Obligations
As of December 31, 2017, Kenon had consolidated liabilities of $1,475 million. In January 2018, the $200 million IC Credit Facility was repaid.
In 2016, Kenon’s major shareholder Ansonia made loans of $
69
million to our subsidiary Quantum (which were used by Quantum to make back-to-back loans to Qoros). In January 2018, $20 million of these loans were repaid.
In addition, as of the date of this annual report, Kenon has obligations under its back-to-back guarantees provided by it to Chery, which amounted to RMB320 million, with respect to debt in principal of RMB288 million, plus interest and certain fees. For further information on, and an overview of, the guarantees provided by Kenon in respect of Qoros’ debt, see “—
Back-to-Back Guarantees Provided to Chery
.”
As of the date of this annual report, other than the back-to-back guarantees we have provided to Chery in respect of certain of Qoros’ indebtedness, and loans from subsidiaries, we, at the Kenon level, have no outstanding indebtedness or financial obligations and are not party to any credit facilities or other committed sources of external financing. Kenon has given a three year guarantee of Inkia's indemnity obligations under the share purchase agreement for the sale of the Inkia Business.
Set forth below is a summary of these obligations.
131
Back-to-Back Guarantees Provided to Chery
Kenon provided back-to-back guarantees to Chery in respect of certain of Qoros’ RMB3 billion EXIM bank credit facility and its RMB700 million EXIM bank loan facilities. As of December 31, 2017, the outstanding amount of these back-to-back guarantees was RMB320 million (plus certain interest and fees)
, with respect to debt in principal of RMB288 million
.
In 2016 and 2017, Kenon entered into agreements with Chery to provide financing to Qoros in connection with a release of Kenon’s back-to-back guarantee obligations to Chery (which were RMB850 million as of December 31, 2016). Pursuant to these agreements, during 2017, Kenon funded shareholder loans of RMB488 million (of which RMB244 million was advanced on behalf of Chery) to Qoros, reducing Kenon’s
back-to-back guarantee obligations to Chery from RMB850 million to RMB320 million,
with respect to debt in principal of RMB288 million
.
In January 2018, Kenon announced the New Qoros Investor’s completion of a transaction to purchase 51% of Qoros from Wuhu Chery and Kenon which is part of an investment structure to invest a total of approximately RMB6.63 billion in Qoros. As a result, Kenon now has a 24% stake in Qoros, with the 51% controlling interest owned by the New Qoros Investor and the remaining 25% interest owned by Wuhu Chery.
As part of the investment, the New Qoros Investor will assume its pro rata share of the guarantees and equity pledges based on post-investment equity ownership in Qoros, which will be subject to further adjustment following any future changes in the equity ownership in Qoros (including as a result of the exercise of the put option or investment right by a shareholder under the investment agreement). As a result, in January 2018, Cherry paid Kenon RMB120 million (approximately $18 million) out of the total RMB244 million (approximately $38 million) previously advanced, and a significant portion of the Qoros equity pledged to Chery was released. Kenon will also be proportionately released from its obligations with respect to the RMB1.2 billion loan subject to the Qoros bank lender consent.
Kenon’s major shareholder Ansonia has also committed to fund RMB25 million of Kenon’s back-to-back guarantee obligations in certain circumstances.
Debt Owed to Kenon from Subsidiaries
Debt Owed to Kenon from Subsidiaries
Prior to the spin-off, some of our businesses borrowed funds from, or issued capital notes to, IC. IC transferred its interest in each of the outstanding loans and capital notes to Kenon in connection with the spin-off. These loans and capital notes, as well as loans and capital notes provided to Kenon subsequent to the spin-off, are described below.
Qoros Shareholder Loans
As of December 31, 2017, Qoros had outstanding shareholder loans in the principal amount of RMB944 million to each of Kenon and Chery.
In January 2018, Kenon announced the New Qoros Investor’s completion of
a transaction to purchase 51% of Qoros from Wuhu Chery and Kenon which is part of an investment structure to invest a total of approximately RMB6.63 billion in Qoros. The investment was implemented through a sale to
the New Qoros Investor
by Kenon and Chery, of 26% and 25% of their holdings in Qoros for RMB1.69 billion and RMB1.625 billion, respectively. Following completion of this sale, Qoros’ shareholders (including
the New Qoros Investor
) will invest a total of RMB6.5 billion in Qoros’ equity in proportion to their post-investment equity ownership, which will ultimately be made by way of capital increase.
The investment agreement provides for repayment of existing shareholder loans owing from Qoros in the principal amount of RMB944 million (approximately $150 million) to each of Kenon and Chery, in two equal tranches, following the purchase of Kenon's and Chery's equity interests as described above. In addition, Kenon retained RMB130 million from the sale of its 1% holding in Qoros (which was not to be reinvested into Qoros), out of the total sale proceeds of RMB1.69 billion. $20 million in proceeds retained by Kenon was applied to the partial repayment of the Ansonia loans in January 2018, leaving a balance of approximately $55 million (linked to RMB proceeds received by Kenon) of loans owing to Ansonia.
A portion of the loan repayments to Kenon (or any sale proceeds, if retained by Kenon) will likely be applied to the repayment of such loans.
132
The following discussion sets forth the liquidity and capital resources of each of our businesses.
OPC’s Liquidity and Capital Resources
As of December 31, 2017, OPC had cash and cash equivalents of $147 million. OPC’s total outstanding consolidated indebtedness was $618 million as of December 31, 2017.
OPC’s principal sources of liquidity have traditionally consisted of cash flows from operating activities, short- and long-term borrowings, OPC’s bond issuance and OPC's 2017 initial public offering.
In addition, OPC is limited in usage of certain deposits and cash, with such restricted deposits and cash constituting an aggregate amount of $76 million and $23 million as of December 31, 2017 and 2016, respectively.
OPC’s principal needs for liquidity generally consist of capital expenditures related to the development and construction of generation projects (including OPC-Hadera, Tzomet and other projects OPC may pursue), capital expenditure relating to maintenance (e.g., maintenance and diesel inventory), working capital requirements (e.g., maintenance costs that extend the useful life of OPC’s plants) and other operating expenses. OPC believes that its liquidity is sufficient to cover its working capital needs in the ordinary course of OPC’s business.
OPC’s Material Indebtedness
As of December 31, 2017, OPC had cash and cash equivalents of $147 million, deposits and restricted cash of $76 million, and total outstanding consolidated indebtedness of $618 million, consisting of $30 million of short-term indebtedness, including the current portion of long-term indebtedness, and $588 million of long-term indebtedness. All of OPC's debt is denominated in NIS.
The following table sets forth selected information regarding OPC’s principal outstanding short-term and long-term debt, as of December 31, 2017:
|
Outstanding Principal Amount as of December 31, 2017
|
Interest Rate
|
Final Maturity
|
Amortization
Schedule
|
||||
|
($ millions)
|
|||||||
|
OPC-Rotem:
|
|||||||
|
Financing agreement
1
|
383
|
4.7%-5.4%, CPI linked
|
June 2031
|
Quarterly principal payments to maturity
|
|||
|
OPC-Hadera:
|
|||||||
|
Financing agreement
2
|
144
|
3.4%-3.9%, CPI linked (2/3 of the loan)
4.8%-5.4% (1/3 of the loan)
|
18 years from commercial operations date of Hadera power plant
|
Quarterly principal payments to maturity, commenting 6 months following commercial operations of Hadera power plant
|
|||
|
OPC Energy:
|
|||||||
|
Bonds
3
|
91
|
4.45%
|
December 2030
|
Semi-annual principal payments to maturity
|
|||
|
Total
|
618
|
||||||
| (1) |
Represents NIS
1,329
million converted into U.S. Dollars at the exchange rate for NIS into U.S. Dollars of NIS
3.467
to $1.00. All debt has been issued in Israeli currency (NIS) linked to CPI.
|
| (2) |
Represents NIS 500 million converted into U.S. Dollars at the exchange rate for NIS into U.S. Dollars of NIS 3.467 to $1.00. All debt has been issued in Israeli currency (NIS), of which 2/3 is linked to CPI and 1/3 is not linked to CPI.
|
| (3) |
Represents NIS 316 million converted into U.S. Dollars at the exchange rate for NIS into U.S. Dollars of NIS 3.467 to $1.00. All debt has been issued in Israeli currency (NIS) and is not linked to CPI.
|
The debt instruments to which OPC and its operating companies are party to require compliance with financial covenants. Under each of these debt instruments, the creditor has the right to accelerate the debt or restrict the company from declaring and paying dividends if, at the end of any applicable period the applicable entity is not in compliance with the defined financial covenants ratios.
The instruments governing a substantial portion of the indebtedness of OPC operating companies contain clauses that would prohibit these companies from paying dividends or making other distributions in the event that the relevant entity was in default on its obligations under the relevant instrument.
For further information on OPC’s financing arrangements, see Note 15 to our financial statements included in this annual report.
OPC-Rotem Financing Agreement
In January 2011, OPC-Rotem entered into a financing agreement with a consortium of lenders led by Bank Leumi Le-Israel Ltd., or Bank Leumi, for the financing of its power plant project. As part of the financing agreement, the lenders committed to provide OPC-Rotem a long-term credit facility, including several types of lines of credit., in the overall amount of NIS 1,800 million. Currently, there are two available lines of credit in the total amount of NIS 15 million and a working capital line of credit. Furthermore, as part of the financing agreement, certain restrictions were provided with respect to distributions of dividends and repayments of OPC-Rotem’s shareholders’ loans, commencing from the third year after the completion of OPC-Rotem’s power plant. The lock-up period prohibiting distributions ended in June 2015. The loans are CPI-linked and are repayable on a quarterly basis beginning in the fourth quarter of 2013 until 2031.
Under the agreement, OPC and ICP and the non-controlling interests in OPC-Rotem (Veridis), issued corporate guarantees in favor of OPC-Rotem, in the amounts of NIS92 million (approximately $27 million) and NIS23 million (approximately $7 million), respectively.
In December 2017, an amended credit facility agreement was signed, according to which ICP was released from the corporate guarantee. In return, OPC-Rotem created a new reserve account (“guarantee reserve account”) in the amount of NIS57.5 million (approximately $17 million). OPC-Rotem deposited NIS 20 million (approximately $6 million) in the guarantee reserve account, and must deposit the remaining NIS 14 million (approximately $11 million) within 24 months from the creation of the guarantee reserve account, in semi-annual instalments. As of December 31, 2017, the guarantee reserve account balance is NIS20 million (approximately $6 million). OPC and Veridis issued corporate guarantees in favour of OPC-Rotem in the amount of NIS46 million (approximately $13 million) and NIS11.5 million (approximately $4 million), respectively. Upon deposit of the full guarantee reserve account amount, both OPC and Veridis shall be released from their corporate guarantees.
133
OPC-Hadera Financing
In July 2016, OPC-Hadera entered into a NIS 1 billion senior facility agreement with Israel Discount Bank Ltd. and Harel Company Ltd. to finance the construction of OPC-Hadera’s power plant in Hadera. Pursuant to the agreement, the lenders undertook to provide OPC-Hadera with financing in several facilities (including a term loan facility, a standby facility, a debt service reserve amount, or DSRA, facility to finance the DSRA deposit, a guarantee facility to facilitate the issuance of bank guarantees to be issued to third parties, a VAT facility (for the construction period only), a hedging facility (for the construction period only), and a working capital facility (for the operation period only).
In December 2017, Israel Discount Bank Ltd. assigned 43.5% of its share in the long-term credit facility (including the facility for variances in construction and related costs) to Clal Pension and Femel Ltd. and Atudot Pension Fund for Salaried and Self-employed Ltd.
Some of the loans under the facility agreement are CPI-linked, while others accrue interest at the rates specified in the relevant agreement. The loans will be repaid in quarterly installments according to repayment schedules specified in the agreement. The financing will mature 18 years after the commencement of repayments in accordance with the provisions of the agreement (which will commence approximately half a year following the commencement of commercial operation of the OPC-Hadera construction plant.
In connection with the senior facility agreement, liens were placed on some of OPC-Hadera’s existing and future assets and on certain OPC and OPC-Hadera rights, in favor of Israel Discount Bank Ltd., as collateral agent on behalf of the lenders, The senior facility agreement also contains certain restriction in respect of distributions and repayments of shareholder loans.
As of December 31, 2017, following the full investment of the project’s equity contribution, OPC-Hadera has made three drawings in the aggregate amount of NIS 494 million under the NIS 1 billion loan agreement relating to the project. In the first quarter of 2018, OPC fourth disbursement was made in the amount of NIS22 million.
OPC Bonds
In May 2017, OPC issued Bonds (Series A) to classified investors under a private placement, which were listed for trade on the Institutional Continuous Trading Platform. The bonds, with a par value of NIS 320 million ($92 million), bear annual interest at the rate of 4.95% and are redeemable, principal and interest, every six months, commencing on June 30, 2018 (on June 30th and December 30th of every calendar year) through December 30, 2030. Under the terms, the interest on the bonds will be reduced by 0.5% in the event of their listing for trade on the main list of the TASE. The bonds have received a rating of A3 from Midroog and A- from S&P Global Ratings Maalot Ltd.
In August 2017, OPC listed the bonds for trade in the stock exchange under an issuance and the listing of its shares for trade and accordingly, from that date, interest on the bonds (series A) was reduced by 0.5% and is 4.45% per year. According to the trust deed from May 2017, OPC has registered, in favor of the trustee on behalf of the bond holders, a first-ranking floating charge, unlimited in amount, on all of its assets. The floating charge will not preclude OPC from pledging specific assets and the performance of other asset dispositions by OPC.
Additionally, OPC has created a reserve for the servicing of the debt, out of the issuance consideration, in the amount of 12 months of interest up to the commencement of repayment of the principal of the bonds, and will pay 12 months of principal and interest payments subsequent to the commencement of the bonds' principal repayment. The trust account in which the reserve was deposited will be pledged in favor of the trustee on behalf of the bond holders. As of December 31, 2017, the deposit for the debt service fund amounts to NIS 18 million ($5 million).
The trust deed contains customary clauses for calling for the immediate redemption of the bonds, including events of breach, insolvency, liquidation proceedings, receivership, stay of proceedings and creditors' arrangements, certain types of restructuring, material downturn in the position of OPC. The bondholders' right to call for immediate redemption also arises upon: (1) the occurrence of certain events of loss of control by Kenon; (2) the call for immediate repayment of other debts (or guarantees) of OPC or of OPC-Hadera or OPC-Rotem in certain predefined minimum amounts; (3) a change in the area of operation of OPC such that OPC's main area of activity is not in the energy sector in Israel, including electricity generation in power plants and with renewable energy sources; (4) in the event that a rating is discontinued over a certain period of time, and the rating of the bond falls below the level of Baa3 (or BBB); and (5) in the event of suspending trading for a certain time period if the bonds are listed for trade on the main list of the stock exchange.
Furthermore, the trust deed includes an undertaking by OPC to comply with covenants on the basis of its stand-alone financial statements: debt coverage ratio of at least 1.05 (to be reviewed commencing in the financial statements as at June 30, 2018), minimum equity of NIS 80 million and an equity-to-balance sheet ratio of at least 12.5%. As at December 31, 2017, the equity attributed to OPC’s shareholders amounted to approximately NIS 600 thousand and the equity-to-balance sheet ratio was 65%.
134
The trust deed also includes an undertaking by OPC to monitor the rating by a rating agency and for mandatory early redemption in the event of the sale of means of control in OPC-Rotem and OPC-Hadera.
Additionally, restrictions imposed on distributions, provision of loans to related parties and repayment of loans to related parties, are included as set forth in the trust deed, including compliance with certain covenants.
The terms of the bonds also provide for the possible raising of the interest rate in certain cases of lowering the rating, in certain cases of breach of financial covenants, and in certain cases of use of the reserve for servicing the debt where the reserve is not sufficiently funded within the time frame that is set forth in the trust deed. The ability of OPC to expand the series of the bonds has been limited under certain circumstances, including maintaining the rating of the bonds at its level shortly prior to the expansion of the series and the lack of breach.
Additionally, should OPC raise additional bonds that are not secured (or that are secured with a pari passu ranking floating charge), these will not have preference over the bonds (Series A) upon liquidation.
Qoros’ Liquidity and Capital Resources
Qoros’ cash and cash equivalents was RMB77 million as of December 31, 2017, compared to approximately RMB465 million as of December 31, 2016. Following the completion of the New Qoros Investor investment, we have a 24% equity interest in Qoros and, and we do not exercise control over Qoros’ cash and cash equivalents.
Qoros’ principal sources of liquidity are cash inflows received from financing activities, including long-term loans, short-term facilities and capital contributions (in the form of equity contributions, or convertible or non-convertible shareholder loans), and cash flows from car sales. Qoros has fully utilized its RMB3 billion syndicated credit facility, RMB1.2 billion syndicated credit facility and its RMB700 million credit facility, and may require additional financing, including the renewal or refinancing of its working capital facilities, to fund its development and operations.
Qoros has historically relied upon capital contributions, loans, guarantees and pledges from its shareholders, and third party loans supported by its shareholders, to fund its development and operations.
In June 2017, Quantum, Wuhu Chery, and Qoros entered into an investment agreement pursuant to which
the New Qoros Investor
agreed to invest approximately RMB6.63 billion for a controlling interest in Qoros (of which RMB1 billion was advanced to Qoros in 2017).
In January 2018, the New Qoros Investor completed the transaction to purchase 51% of Qoros from Wuhu Chery and Kenon which is part of an investment structure to invest a total of approximately RMB6.63 billion in Qoros.
As a result, Kenon now has a 24% stake in Qoros, with the 51% controlling interest owned by
the New Qoros Investor
and the remaining 25% interest owned by Wuhu Chery. For more information see “
—Kenon’s Liquidity and Capital Resources.
”
As of December 31, 2017, Qoros had total loans and borrowings (excluding shareholder loans) of RMB4.8 billion and current liabilities (excluding shareholder loans) of RMB3.3 billion, including trade and other payables of RMB2.7 billion, and current assets of RMB1.5 billion, including cash and cash equivalents of RMB77 million. Qoros uses a portion of its liquidity to make debt service payments. Qoros
is
required to make principal payments on its RMB3 billion, RMB1.2 billion and RMB700 million facilities in 2018.
Although the January 2018 investment in Qoros has improved Qoros' liquidity position, Qoros will require additional liquidity and will continue to manage its trade payables, accrued expenses and other operating expenses in connection with the management of its liquidity requirements and resources. For further information on the risks related to the effect of Qoros’ liquidity situation on its relationship with its supplies, see “
Item 3.D. Risk Factors—Risk Factors Related to Our Interest in Qoros—Qoros is dependent upon its suppliers.
”
Until Qoros achieves significantly higher levels of sales, Qoros will need to secure additional financing to meet its operating expenses (including accounts payable) and debt service requirements. If Qoros is not able to raise additional financing as required, it may be unable to continue operations, and Kenon may be required to make payments under its back-to-back guarantees to Chery in respect of Qoros’ bank debt and pledges over Qoros shares by Quantum (Kenon’s subsidiary which owns Kenon’s interest in Qoros) may be enforced.
Alternatively, the Baoneng group (or its related entities), Chery or other investors, may choose to make additional investments in Qoros (without a corresponding Kenon investment) which may result in a dilution of Kenon’s interest. For information on the risks related to Qoros’ liquidity, see “
Item 3.D Risk Factors—Risks Related to Our Interest in Qoros—Qoros depends on funding to further its development and, until it achieves significant sales levels, to meet its operating expenses, financing expenses, and capital expenditures
.”
135
Material Indebtedness
As of December 31, 2017, Qoros had total loans and borrowings (excluding shareholder loans) of RMB4.8 billion, consisting of non-current loans and borrowings of RMB4.2 billion and current loans and borrowings of RMB600 million (excluding shareholder loans). Set forth below is a discussion of Qoros’ material indebtedness.
RMB3 Billion Syndicated Credit Facility
On July 23, 2012, Qoros entered into a consortium financing agreement with a syndicate of banks for the ability to draw down loans, in either RMB or USD, up to an aggregate maximum principal amount of RMB3 billion. The RMB loans bear interest at the 5-year interest rate quoted by the People’s Bank of China from time to time and the USD loans bear interest at LIBOR + 4.8% per annum. Outstanding loans are repayable within ten years from July 27, 2012, the first draw down date. The first and second scheduled repayment dates were in July 2015 and January 2016, respectively. Subsequent repayment dates occur every six months after the preceding repayment date. In July 2017, Qoros’ lenders approved the rescheduling of principal payments under Qoros’ RMB3 billion facility originally scheduled to be made in 2017 and 2018, with substantially all of the principal payments now scheduled to be made between 2019 and 2022 (with small payment
s
scheduled to be made in 2018).
Qoros’ RMB/USD dual currency fixed rate credit facility is secured by Qoros’ manufacturing facility, the land use right for the premises on which such manufacturing facility is located, and its equipment, and properties, and several guarantees, including a joint, but not several, guarantee from each of Chery and Changshu Port. Loans under this facility are severally guaranteed by (i) Changshu Port for up to 50% of amounts outstanding under this loan, or up to RMB1.5 billion, plus related interest and fees and (ii) Chery for up to 50% of amounts outstanding under this loan, or up to RMB1.5 billion, plus related interest and fees. Kenon has outstanding a back-to-back guarantees to Chery of RMB320 million, with respect to debt in principal of RMB288 million,
of which a portion is
in respect of Chery’s guarantee of this facility. For further information on Kenon’s back-to-back guarantee obligations to Chery see “—
Kenon’s Liquidity and Capital Resources—Kenon’s Commitments and Obligations—Back-to-Back Guarantees Provided to Chery.
”
Qoros’ syndicated credit facility contains financial, affirmative and negative covenants, events of default or mandatory prepayments for contractual breaches, including certain changes of control, and for material mergers and divestments, among other provisions. Although Qoros’ debt-to-asset ratio is currently higher, and its current ratio is lower, than the allowable ratios set forth in the terms of the syndicated credit facility, in 2016, the lenders under Qoros’ syndicated credit facility waived Qoros’ compliance with the financial covenants under this facility through the first half of 2020. Should Qoros’ debt-to-asset ratio continue to exceed, or its current ratio continue to be less than, the permitted ratios in any period after the waiver period, and Qoros’ syndicated lenders do not waive such non-compliance or revise such covenants so as to ensure Qoros’ compliance, Qoros’ lenders could accelerate the repayment of borrowings due under Qoros’ RMB3 billion syndicated credit facility.
As of December 31, 2017, the aggregate amount outstanding on this loan was approximately RMB2.5 billion.
RMB1.2 Billion Syndicated Credit Facility
In July 2014, Qoros entered into a consortium financing agreement with a syndicate of banks for the ability to draw loans, in either RMB or USD, up to an aggregate maximum principal amount of RMB1.2 billion for the research and development of C-platform derivative models. The RMB loans bear interest at the 5-year interest rate quoted by the People’s Bank of China from time to time
plus
10.0%
of such quoted rate
and the USD loans bear interest at LIBOR
plus
5.0%
of such rate
per annum. Outstanding loans are repayable within ten years from August 19, 2014, the first draw down date. The first scheduled repayment was made in August 2017 with subsequent repayment dates occurring every six months after the preceding repayment date.
136
Following the completion of the share transfer, up to 50% of the indebtedness incurred under this facility is secured by Quantum’s pledge of substantially all of its shares in Qoros, including dividends deriving therefrom. The pledge agreement under which Quantum has pledged its equity interest in Qoros includes provisions setting forth, among other things, (i) minimum ratios relating to the value of Quantum’s pledged securities, (ii) Quantum’s ability to replace the pledge of its equity interest in Qoros with a pledge of cash collateral or to pledge cash collateral instead of pledging additional shares, representing up to 100% of Quantum’s equity interest in Qoros, and (iii) the events (e.g., Qoros’ default under the syndicated facility) that entitle the Chinese bank to enforce its lien on Quantum’s equity interest. In the event that the value of Qoros’ equity decreases and Quantum’s shares of Qoros’ equity is not sufficient to cover its proportionate stake of the pledge, Quantum has the option to provide additional collateral to secure the RMB1.2 billion facility. However, in the event that Quantum does not provide such additional collateral, the lenders under the facility may be entitled to sell some or all of Quantum’s shares in Qoros.
In connection with Kenon’s 2016 and 2017 funding of shareholder loans to Qoros, pursuant to which Kenon’s back-to-back guarantee obligations to Chery were partially released, Quantum pledged equity in Qoros to Chery to secure the back-to-back guarantee reductions (i.e., if Chery is required to make payments on its guarantee of Qoros’ debt, then to the extent that Chery makes payments that would have been reimbursed by Kenon but for the back-to-back guarantee reduction, Chery will be entitled to enforce this pledge). Chery may also borrow from Quantum some of Qoros’ outstanding equity to meet its pledge obligations under the RMB1.2 billion credit facility. The number of Qoros shares pledged to Chery is subject to adjustment from time to time. In certain circumstances, Quantum must pledge additional shares (to the extent it has unencumbered shares) (e.g., if additional shares must be pledged under the credit facility), and in other circumstances the pledged shares may be released and the borrowed shares must be returned (e.g., in the event that Quantum is required to pledge additional shares to secure the RMB1.2 billion credit facility).
The syndicated loan agreement includes covenants (including financial covenants) and events of default and acceleration provisions.
As of December 31, 2017, the aggregate principal amount outstanding on this loan was approximately RMB1.1
7
billion.
RMB700 Million Syndicated Credit Facility
In May 2015, Qoros entered into a RMB700 million facility with a bank consortium for the purpose of research and development into a hybrid electric vehicle. Under the facility, Qoros can draw down loans in either RMB or USD, up to an aggregate principal amount of RMB700 million. The loan agreement covers a period of 102 months starting in May 2015, and is secured by a guarantee by Chery and a pledge over Qoros’ 90 vehicle patents. The RMB loan bears the 5-year interest rate quoted by the People’s Bank of China +10%, and the USD loan bears interest of LIBOR+3.5% per annum. Qoros is required to make principal repayments under this facility beginning in 2018. The facility includes covenants and event of default provisions.
The RMB700 million is guaranteed by Chery. We provided a back-to-back guarantee to Chery in respect of this facility
and also pledged shares to Chery
. For further information on Kenon’s back-to-back guarantee obligations to Chery, see “—
Kenon’s Liquidity and Capital Resources—Kenon’s Commitments and Obligations—Back-to-Back Guarantees Provided to Chery.
”
As of December 31, 2017, Qoros drew down a total of RMB700 million, and the aggregate principal amount outstanding on this loan is RMB700 million.
Working Capital Facilities
Qoros is party to various short-term and working capital facilities. As of December 31, 2017, the balance of these facilities was RMB345 million.
Qoros may require additional financing, including the renewal or refinancing of its working capital facilities. For further information on the risks related to Qoros’ liquidity, see “
Item 3.D Risk Factors—Risks Related to Our Interest in Qoros—Qoros depends on funding to further its development and, until it achieves significant sales levels, to meet its operating expenses, financing expenses, and capital expenditures.
”
137
Shareholder Loans
As of December 31, 2017, Qoros had outstanding shareholder loans in the principal amount of RMB944 million to each of Kenon and Chery.
The investment agreement provides for repayment of existing shareholder loans owing from Qoros in the principal amount of RMB944 million (approximately $150 million) to each of Kenon and Chery, in two equal tranches, following the purchase of Kenon's and Chery's equity interests (see “
Item 4.B Business Overview—Our Businesses—Qoros —Qoros’ Investment Agreement
.”) In addition, Kenon retained RMB130 million from the sale of its 1% holding in Qoros (which was not to be reinvested into Qoros), out of the total sale proceeds of RMB1.69 billion. $20 million in proceeds retained by Kenon was applied to the partial repayment of the Ansonia loans in January 2018, leaving a balance of approximately $55 million (linked to RMB proceeds received by Kenon) of loans owing to Ansonia.
A portion of the loan repayments to Kenon (or any sale proceeds, if retained by Kenon) will likely be applied to the repayment of such loans.
ZIM’s Liquidity and Capital Resources
As of December 31, 2017, ZIM had an aggregate amount of $158 million in cash and cash equivalents, similar to its cash and cash equivalents as of December 31, 2016.
During the year ended December 31, 2017, ZIM generated $231 million from operating activities, used $94 million in investing activities and used $140 million in financing activities.
ZIM has a significant amount of debt and other liabilities. As of December 31, 2017, ZIM had approximately $1.5 billion of outstanding loans and liabilities to be repaid between 2018 through 2030, of which $313 million of principal (including short term borrowings and current maturities of long-term debt) is scheduled to be repaid during 2018.
ZIM expects to finance its short-term debt obligations and other liabilities through expected cash flow generation from operating activities, in addition to cash on hand. ZIM may also obtain funds from additional sources including debt issuance and/or other financing transactions and/or sale of assets and/or fund raising activities, including initial public offering or listing and/or re-finance its debt obligations by engaging potential new lenders and existing lenders in order to exchange existing maturities to debt vehicles with longer maturities.
During 2016, in light of the continued unfavorable container shipping market conditions, ZIM took various steps to address its liquidity and financial position, including by obtaining waivers from its creditors from compliance from certain financial covenants and deferring certain payments. ZIM
is
required to comply with these covenants beginning on March 31, 2018, and repay the deferred amounts on a straight line basis, during a period of up to 36 months, ending on December 31, 2020.
ZIM is continuing to pursue strategies to improve ZIM’s commercial and operational processes, and aims to reduce ZIM’s operational expenses and improve ZIM’s profitability. However, there is no assurance as to the extent of the effectiveness such activities or when, if at all, the results of such activities will be reflected in ZIM’s liquidity and capital resources. For further information on the risks related to ZIM’s liquidity, see “
Item 3.D Risk Factors—Risks Related to Our Other Businesses—Risks Related to our Interest in ZIM—
ZIM is highly leveraged and may be unable to comply with its financial covenants or meet its debt service or other obligations.
”
138
Primus’ Liquidity and Capital Resources
As of December 31, 2017, Primus had cash and cash equivalents of approximately $0.3 million.
The implementation of Primus’ business plan requires additional capital to enable Primus to continue to develop its commercial operations. Primus expects such funding to be provided by us either through capital contributions or shareholder loans, or to the extent Primus pursues projects, through contributions from strategic partners or debt financing. There is no certainty that additional financing will be provided to Primus.
Primus’ principal liquidity requirements relate to its operating expenses and investments in various development projects. A lack, or delay, of financing could delay, or prevent completely, Primus’ research and commercial development or result in its immediate liquidation or dissolution.
In connection with Primus’ further development and our efforts to maximize its value, we may provide additional capital to Primus, in the form of debt or equity financing, if deemed appropriate to facilitate Primus’ operational and development capital requirements. Through our wholly-owned subsidiary IC Green, we have provided Primus a total of $35.4 million (including accrued interest) via a series of convertible notes through December 31, 2017. In January 2018, we provided Primus an additional $3.0 million via convertible notes.
Material Indebtedness
Primus does not have any material indebtedness, other than related party indebtedness.
C.
Research and Development, Patents and Licenses, Etc.
Kenon did not have significant research and development expenses during the years ended December 31, 2017, 2016 and 2015.
D.
Trend Information
The following key trends contain forward-looking statements and should be read in conjunction with “
Special Note Regarding Forward-Looking Statements
” and “
Item 3.D Risk Factors
.” For further information on the recent developments of Kenon and our businesses, see “
Item 5. Operating and Financial Review and Prospects—Recent Developments.
”
Trend Information
OPC
In January 2018, the EA published its generation component tariff update for 2018, which increased the generation component tariff by approximately 6.7%, from NIS 264 per MWh to NIS 282 per MWh. For further information, see “
Item 5. Operating and Financial Review and Prospects—Material Factors Affecting Results of Operations—OPC— Sales—EA Tariffs
.”
Qoros
The investment in Qoros in January 2018 by the New Qoros Investor resulted in the New Qoros Investor owning 51% of Qoros and contributed significant liquidity to Qoros. Following this investment, Qoros has made a number of management changes. As a result of the transaction, Kenon will recognise an estimated gain on dilution of approximately $286 million in its financial statements in the first half of 2018. Kenon will also value its put option and record that value in its financial statements in the first quarter of 2018. The valuation of the put option is in progress and no estimate can currently be given.
For the year ended December 31, 2017, Qoros sold approximately 15,000 vehicles, as compared to approximately 24,000 vehicles in 2016. Qoros sold approximately 11,400 cars in the first quarter of 2018, a
more than
200% increase as compared to approximately 3,700 cars sold in the first quarter of 2017
, with
a
substantial number of such sales
in Q1 2018
reflect
ing
purchase orders introduced by the New Qoros Investor. Qoros believes that its sales figures will continue to fluctuate in the near-term.
139
In light of increased competition in the Chinese automotive market in recent years, dealers and OEMs have offered customers a variety of inducements to purchase vehicles, including price reductions. In line with many of its competitors, Qoros announced price reductions on all its vehicle models. In 2017, dealers and OEMs continued to reduce prices and offer further inducements to purchase vehicles. Qoros expects the downward pressure on vehicle prices to continue for the next few years. The SUV segment in China continues to experience growth as compared to sedans.
Qoros continues to require additional funding to further its development and, until it achieves significant sales levels, to meet its operating expenses, financing expenses, and capital expenditures. For further information on Qoros’ liquidity requirements, see “—
Qoros’ Liquidity and Capital Resources
” and “
Item 3D. Risk Factors— Risks Related to Our Strategy and Operations— Some of our businesses have significant capital requirements.
”
ZIM
For further information on the conditions affecting the shipping industry, see “
Item 4.B Business Overview—Our Businesses—ZIM—ZIM’s Industry Update
.”
E.
Off-Balance Sheet Arrangements
Neither Kenon nor any of its subsidiaries are party to off-balance sheet arrangements.
F.
Tabular Disclosure of Contractual Obligations
Kenon
The following table sets forth Kenon’s contractual obligations (including future interest payments) and commercial commitments as of December 31, 2017:
|
Payments Due by Period
|
||||||||||||||||||||
|
Total
|
Less than One Year
|
One to Three Years
|
Three to Five Years
|
More than Five Years
|
||||||||||||||||
|
($ millions)
|
||||||||||||||||||||
|
Kenon’s stand-alone contractual obligations
1
|
$
|
240
|
2
|
$
|
240
|
2
|
$
|
-
|
$
|
-
|
$
|
-
|
||||||||
|
Overseas Investment Peru Facility
|
$
|
101
|
3
|
$
|
101
|
3
|
$
|
-
|
$
|
-
|
$
|
-
|
||||||||
|
OPC’s consolidated contractual obligations
4
|
$
|
926
|
$
|
120
|
$
|
125
|
$
|
133
|
$
|
548
|
||||||||||
|
Total contractual obligations and commitments
|
$
|
1,267
|
$
|
461
|
$
|
125
|
$
|
133
|
$
|
548
|
||||||||||
| (1) |
Excludes Kenon’s back-to-back guarantees to Chery and convertible loans between Ansonia and Quantum.
|
| (2) |
Represents $200 million, plus interest and fees of $40 million, outstanding under the IC Credit Facility as of December 31, 2017. In January 2018, this facility was repaid.
|
| (3) |
Represents $43 million of net debt, plus $1 million of accrued interest.
In January 2018, this facility was repaid.
|
| (4) |
For further information on OPC’s consolidated contractual obligations, see “—
Tabular Disclosure of Contractual Obligations—OPC
” below.
|
As of the date of this annual report, Kenon has outstanding back-to-back guarantee obligations to Chery of up to RMB320 million, with respect to debt in principal of RMB288 million, plus certain interest and fees, in respect of certain of Qoros’ indebtedness. For further information on, and the risks related to, the guarantees provided by Kenon in respect of Qoros’ debt, see “
Item 5.B Liquidity and Capital Resources—Kenon’s Liquidity and Capital Resources—Kenon’s Commitments and Obligations—Back-to-Back Guarantees Provided to Chery.”
140
OPC
The following table sets forth OPC’s contractual obligations (including future interest payments) and commercial commitments as of December 31, 2017, on a consolidated basis.
|
Payments Due by Period
|
||||||||||||||||||||
|
Total
|
Less than One Year
|
One to Three Years
|
Three to Five Years
|
More than Five Years
|
||||||||||||||||
|
($ millions)
|
||||||||||||||||||||
|
Trade Payables
|
$
|
58
|
$
|
58
|
$
|
-
|
$
|
-
|
$
|
-
|
||||||||||
|
Other payables
|
6
|
6
|
-
|
-
|
-
|
|||||||||||||||
|
Bonds
|
126
|
13
|
20
|
22
|
71
|
|||||||||||||||
|
Loans
|
736
|
43
|
105
|
111
|
477
|
|||||||||||||||
|
Total contractual obligations and commitments
|
$
|
926
|
120
|
125
|
133
|
548
|
||||||||||||||
G.
Safe Harbor
See “
Special Note Regarding Forward-Looking Statements.
”
A.
Directors and Senior Management
Board of Directors
The following table sets forth information regarding our board of directors:
|
Name
|
Age
|
Function
|
Original
Appointment Date
|
Current
Term Begins
|
Current Term Expires
|
|||||
|
Antoine Bonnier
|
35
|
Board Member
|
2017
|
2018
|
||||||
|
Laurence N. Charney
|
71
|
Chairman of the Audit Committee, Compensation Committee Member, Board Member
|
2016
|
2017
|
2018
|
|||||
|
Cyril Pierre-Jean Ducau
|
39
|
Chairman of the Board, Nominating and Corporate Governance Committee Chairman
|
2014
|
2017
|
2018
|
|||||
|
N. Scott Fine
|
61
|
Audit Committee Member, Compensation Committee Chairman, Board Member
|
2014
|
2017
|
2018
|
|||||
|
Bill Foo
|
61
|
Board Member, Nominating and Corporate Governance Committee Member
|
2017
|
2017
|
2018
|
|||||
|
Aviad Kaufman
|
47
|
Compensation Committee Member, Board Member, Nominating and Corporate Governance Committee Member
|
2014
|
2017
|
2018
|
|||||
|
Arunava Sen
|
57
|
Board Member, Audit Committee Member
|
2017
|
2017
|
2018
|
Our constitution provides that, unless otherwise determined by a general meeting, the minimum number of directors is five and the maximum number is 12.
141
Senior Management
|
Name
|
Age
|
Position
|
||
|
Barak Cohen
|
36
|
Co-Chief Executive Officer
|
||
|
Robert L. Rosen
|
45
|
Co-Chief Executive Officer
|
||
|
Mark Hasson
|
42
|
Chief Financial Officer
|
Biographies
Directors
Antoine Bonnier
. Mr. Bonnier is currently a Managing Director of Quantum Pacific (UK) LLP and serves as a member of the board of directors of Club Atletico de Madrid SAD, Pacific Drilling S.A. and of Primus Green Energy, Inc., each of which may be associated with the same ultimate beneficiary, Mr. Idan Ofer. Mr. Bonnier was previously a member of the investment team of Quantum Pacific Advisory Limited from 2011 to 2012. Prior to joining Quantum Pacific Advisory Limited in 2011, Mr. Bonnier was an Associate in the Investment Banking Division of Morgan Stanley & Co. During his tenure there, from 2005 to 2011, he held various positions in the Capital Markets and Mergers and Acquisitions teams in London, Paris and Dubai. Mr. Bonnier graduated from ESCP Europe Business School and holds a Master of Science in Management.
Laurence N. Charney
. Mr. Charney currently serves as the chairman of our audit committee. Mr. Charney retired from Ernst & Young LLP in June 2007, where, over the course of his more than 35-year career, he served as Senior Audit Partner, Practice Leader and Senior Advisor. Since his retirement from Ernst & Young, Mr. Charney has served as a business strategist and financial advisor to boards, senior management and investors of early stage ventures, private businesses and small to mid-cap public corporations across the consumer products, energy, high-tech/software, media/entertainment, and non-profit sectors. His most recent directorships include board tenure with Pacific Drilling S.A., along with Kenon, as well as Marvel Entertainment, Inc. (through December 2009) and TG Therapeutics, Inc. (from March 2012 through the current date). Mr. Charney is a graduate of Hofstra University with a Bachelor’s Degree in Business Administration (Accounting), and has also completed an Executive Master’s program at Columbia University. Mr. Charney maintains active membership with the American Institute of Certified Public Accountants and the New York State Society of Certified Public Accountants.
Cyril Pierre-Jean Ducau
. Mr. Ducau is the Chief Executive Officer of Ansonia Holdings Singapore B.V. and the Managing Director of Quantum Pacific Ventures Limited. He is also a member of the board of directors of Pacific Drilling S.A., Quantum Pacific Shipping Services Pte. Ltd. and Ansonia Holdings Singapore B.V., as well as other private companies, each of which may be associated with the same ultimate beneficiary, Mr. Idan Ofer. He was previously Head of Business Development of Quantum Pacific Advisory Limited in London from 2008 to 2012. Prior to joining Quantum Pacific Advisory Limited, Mr. Ducau was Vice President in the Investment Banking Division of Morgan Stanley & Co. International Ltd. in London and, during his tenure there from 2000 to 2008, he held various positions in the Capital Markets, Leveraged Finance and Mergers and Acquisitions teams. Prior to that, Mr. Ducau gained experience in consultancy working for Arthur D. Little in Munich and investment management with Credit Agricole UI Private Equity in Paris. Mr. Ducau graduated from ESCP Europe Business School (Paris, Oxford, Berlin) and holds a Master of Science in business administration and a Diplom Kaufmann.
N. Scott Fine.
Mr. Fine is the Chief Executive Officer and Chairman of CTD Holdings Inc., a biotechnology company focused on developing novel therapeutics based on cyclodextrin technologies. Mr. Fine is also a director of Pacific Drilling S.A. Mr. Fine has been involved in investment banking for over 35 years, working on a multitude of debt and equity financings, buy and sell side mergers and acquisitions, strategic advisory work and corporate restructurings. Much of his time has been focused on transactions in the healthcare and consumer products area, including time with The Tempo Group of Jakarta, Indonesia. Mr. Fine was the lead investment banker on the IPO of Keurig Green Mountain Coffee Roasters and Central European Distribution Corporation, or CEDC, a multi-billion-Dollar alcohol company. He was also involved in an Equity Strategic Alliance between Research Medical and the Tempo Group. Mr. Fine continued his involvement with CEDC, serving as a director from 1996 until 2014, during which time he led the CEDC Board’s successful efforts in 2013 to restructure the company through a pre-packaged Chapter 11 process whereby CEDC was acquired by the Russian Standard alcohol group. He also served as Sole Director of Better Place Inc. from 2013 until 2015. In that role, Mr. Fine successfully managed the global wind down of the company in a timely and efficient manner which was approved by both the Delaware and Israeli courts. Mr. Fine devotes time to several non-profit organizations, including through his service on the Board of Trustees for the IWM American Air Museum in Britain. Mr. Fine has been a guest lecturer at Ohio State University’s Moritz School of Law.
142
Bill Foo.
Dr. Bill Foo is a director and corporate advisor of several private, listed and non-profit entities, including Mewah International Inc., CDL Hospitality Trusts, Tung Lok Restaurants (2000) Ltd., M&C REIT Management Ltd and chairing the Salvation Army and Heartware Network Youth Charity organizations. In May 2017, Dr. Foo was appointed to the board of directors of Kenon, having served as a director of IC Power between November 2015 and January 2018. Prior to his retirement, Dr. Foo worked in financial services for over 30 years, including serving as CEO of ANZ Singapore and South East Asia Head of Investment Banking for Schroders. Dr. Foo has also worked in various positions at Citibank and Bank of America and has been a director of several listed and government-related entities, including International Enterprise Singapore (Trade Agency), where he chaired the Audit Committee for several years. Dr. Foo has a Master’s Degree in Business Administration from McGill University and a Bachelor of Business Administration from Concordia University and an honorary Doctor of Commerce from James Cook University Australia.
Aviad Kaufman
. Mr. Kaufman is the Chief Financial Officer of Quantum Pacific (UK) LLP, the chairman of IC, a board member of Israel Chemicals Ltd., and other private companies, each of which may be associated with the same ultimate beneficiary, Mr. Idan Ofer. From 2008 until 2012, Mr. Kaufman served as Chief Financial Officer of Quantum Pacific Advisory Limited. From 2002 until 2007, Mr. Kaufman served as Director of International Taxation and fulfilled different senior corporate finance roles at Amdocs Ltd. Previously, Mr. Kaufman held various consultancy positions with KPMG. Mr. Kaufman is a certified public accountant and holds a Bachelor’s Degree in Accounting and Economics from the Hebrew University in Jerusalem (with distinction), and a Master’s of Business Administration in Finance from Tel Aviv University.
Arunava Sen.
Mr. Sen is CEO and Managing Director of Coromandel Advisors Pte Ltd, a Singapore-based company that provides strategic and transactional advice to global investors in the infrastructure and clean energy sectors. In May 2017, Mr. Sen was appointed to the board of directors of Kenon, having served as a director of IC Power between November 2015 and January 2018. Between August 2010 and February 2015, Mr. Sen was CEO and Managing Director of Lanco Power International Pte Ltd, a Singapore-registered company focused on the development of power projects globally. Previously, Mr. Sen held several senior roles at Globeleq Ltd, a Houston-based power investment company, including COO, CEO—Latin America and CEO—Asia. In 1999, Mr. Sen cofounded and was COO of Hart Energy International, a Houston-based company that developed and invested in power businesses in Latin America and the Caribbean. Mr. Sen currently serves as a member of the investment committee of Armstrong Asset Management Pte Ltd. A qualified Chartered Accountant, Mr. Sen holds a B.Com. degree from the University of Calcutta and an M.S. degree in Finance from The American University in Washington, DC.
Senior Management
Barak Cohen
. Mr. Cohen has served as Co-CEO of Kenon since September 2017. Prior to becoming Co-CEO, Mr. Cohen served as Vice President of Business Development and Investor Relations of Kenon since 2015. Prior to joining Kenon in 2015, Mr. Cohen worked in various capacities at Israel Corporation since 2008, most recently as Israel Corporation’s Senior Director of Business Development and Investor Relations. In this capacity, Mr. Cohen supported and monitored the development of key growth companies throughout various stages of their lifecycles, contributed to the development of Israel Corporation’s corporate investment strategy, evaluated new investment opportunities, assisted in transaction execution. Additionally, Mr. Cohen headed Israel Corporation’s global investor relations activity. Prior to joining Israel Corporation, Mr. Cohen held positions at Lehman Brothers (UK) and Ernst & Young (Israel). Mr. Cohen is also currently a director of Qoros and OPC. Mr. Cohen holds bachelor’s degrees in Economics, summa cum laude, and Accounting & Management, magna cum laude, both from Tel Aviv University.
Robert Rosen
. Mr. Rosen has served as Co-CEO of Kenon since September 2017. Prior to becoming Co-CEO, Mr. Rosen served as General Counsel of Kenon since 2014. Prior to joining Kenon in 2014, Mr. Rosen spent 15 years in private practice with top tier law firms, including Linklaters LLP and Milbank, Tweed, Hadley and McCloy LLP. During his time in private practice, Mr. Rosen was primarily involved in cross-border public and private capital markets offerings and other securities transactions, as well as with the purchase and sale of U.S. and international distressed assets, private equity investments, structured finance transactions and SEC filings and related advice. Mr. Rosen is admitted to the Bar in the state of New York, holds a Bachelor’s degree with honors from Boston University and a JD and MBA, both from the University of Pittsburgh, where he graduated with high honors.
143
Mark Hasson
. Mr. Hasson has served as Chief Financial Officer at Kenon Holdings Ltd. since October 2017. Prior to this role, Mr. Hasson served as Vice President of Finance at Kenon. Prior to joining Kenon in 2017, Mr. Hasson served in various senior finance positions in Singapore and Australia. He holds a Bachelor’s degree in Finance and Accounting from the University of Cape Town in South Africa and is a Chartered Accountant (Institute of Chartered Accountants in England and Wales).
B.
Compensation
We pay our directors compensation for serving as directors, including per meeting fees.
For the year ended December 31, 2017, the aggregate compensation accrued (comprising remuneration and the aggregate fair market value of equity awards granted) for our directors and executive officers was approximately $
6
million.
For further information on Kenon’s Share Incentive Plan 2014 and Share Option Plan 2014, see “
Item 6.E Share Ownership.
”
C.
Board Practices
As a foreign private issuer, we are permitted to follow certain home country corporate governance practices instead of those otherwise required under the NYSE’s rules for domestic U.S. issuers, provided that we disclose which requirements we are not following and describe the equivalent home country requirement.
We have elected to apply the corporate governance rules of the NYSE that are applicable to U.S. domestic registrants that are not “controlled” companies, except in the case of our nominating and governance committee, as one of the members of our nominating and corporate governance committee is non-independent under NYSE standards.
Board of Directors
Our constitution gives our board of directors general powers to manage our business. The board of directors, which consists of seven directors, oversees and provides policy guidance on our strategic and business planning processes, oversees the conduct of our business by senior management and is principally responsible for the succession planning for our key executives. Cyril Pierre-Jean Ducau serves as our Chairman.
Director Independence
Pursuant to the NYSE’s listing standards, listed companies are required to have a majority of independent directors. Under the NYSE’s listing standards, (i) a director employed by us or that has, or had, certain relationships with us during the last three years, cannot be deemed to be an independent director, and (ii) directors will qualify as independent only if our board of directors affirmatively determines that they have no material relationship with us, either directly or as a partner, shareholder or officer of an organization that has a relationship with either us or IC. Ownership of a significant amount of our shares, by itself, does not constitute a material relationship.
Although we are permitted to follow home country practice in lieu of the requirement to have a board of directors comprised of a majority of independent directors, we have determined that we are in compliance with this requirement and that a majority of our board of directors is independent according to the NYSE’s listing standard. Our board of directors has affirmatively determined that each of Antoine Bonnier, Arunava Sen, Aviad Kaufman, Bill Foo, Laurence N. Charney and N. Scott Fine, representing six of our seven directors, are currently “independent directors” as defined under the applicable rules and regulations of the NYSE.
Election and Removal of Directors
See “
Item 10.B Constitution.
”
144
Service Contracts
None of our board members have service contracts with us or any of our businesses providing for benefits upon termination of employment.
Indemnifications and Limitations on Liability
For information on the indemnification and limitations on liability of our directors, see “
Item 10.B Constitution
.”
Committees of our Board of Directors
We have established three committees, which report regularly to our board of directors on matters relating to the specific areas of risk the committees oversee: the audit committee, the nominating and corporate governance committee, and the compensation committee. Although we are permitted to follow home country practices with respect to our establishment of the nominating and corporate governance and compensation committees, we have determined that we are in compliance with the NYSE’s requirements in these respects, except that one of the members of our nominating and corporate governance committee is non-independent under NYSE standards.
Audit Committee
We have established an audit committee to review and discuss with management significant financial, legal and regulatory risks and the steps management takes to monitor, control and report such exposures; our audit committee also oversees the periodic enterprise-wide risk evaluations conducted by management. Specifically, our audit committee oversees the process concerning:
| · |
the quality and integrity of our financial statements and internal controls;
|
| · |
the compensation, qualifications, evaluation and independence of, and making a recommendation to our board for recommendation to the annual general meeting for appointment of, our independent registered public accounting firm,;
|
| · |
the performance of our internal audit function;
|
| · |
our compliance with legal and regulatory requirements; and
|
| · |
review of related party transactions.
|
The members of our audit committee, Laurence N. Charney, N. Scott Fine and Arunava Sen, are independent directors. Our board of directors has determined that Laurence N. Charney is an audit committee financial expert, as defined under the applicable rules of the SEC, and that each of our audit committee members has the requisite financial sophistication as defined under the applicable rules and regulations of each of the SEC and the NYSE. Our audit committee operates under a written charter that satisfies the applicable standards of each of the SEC and the NYSE.
Nominating and Corporate Governance Committee
Our nominating and corporate governance committee oversees the management of risks associated with board governance, director independence and conflicts of interest. Specifically, our nominating and corporate governance committee is responsible for identifying qualified candidates to become directors, recommending to the board of directors candidates for all directorships, overseeing the annual evaluation of the board of directors and its committees and taking a leadership role in shaping our corporate governance.
Our nominating and corporate governance committee considers candidates for director who are recommended by its members, by other board members and members of our management, as well as those identified by any third-party search firms retained by it to assist in identifying and evaluating possible candidates. The nominating and corporate governance committee also considers recommendations for director candidates submitted by our shareholders. The nominating and corporate governance committee evaluates and recommends to the board of directors qualified candidates for election, re-election or appointment to the board, as applicable.
145
When evaluating director candidates, the nominating and corporate governance committee seeks to ensure that the board of directors has the requisite skills, experience and expertise and that its members consist of persons with appropriately diverse and independent backgrounds. The nominating and corporate governance committee considers all aspects of a candidate’s qualifications in the context of our needs, including: personal and professional integrity, ethics and values; experience and expertise as an officer in corporate management; experience in the industry of any of our portfolio businesses and international business and familiarity with our operations; experience as a board member of another publicly traded company; practical and mature business judgment; the extent to which a candidate would fill a present need on the board of directors; and the other ongoing commitments and obligations of the candidate. The nominating and corporate governance committee does not have any minimum criteria for director candidates. Consideration of new director candidates will typically involve a series of internal discussions, review of information concerning candidates and interviews with selected candidates.
As a foreign private issuer, we are permitted to follow home country practice in lieu of the requirement to have a nominating and corporate governance committee comprised entirely of independent directors. One of the members of our nominating and corporate governance committee is non-independent under NYSE standards and accordingly we rely on the NYSE exemption for foreign private issuers.
The members of our nominating and corporate governance committee are Cyril Pierre-Jean Ducau, Bill Foo and Aviad Kaufman. Our nominating and corporate governance committee operates under a written charter that satisfies the applicable standards of the NYSE for foreign private issuers.
Compensation Committee
Our compensation committee assists our board in reviewing and approving the compensation structure of our directors and officers, including all forms of compensation to be provided to our directors and officers. The compensation committee is responsible for, among other things:
| · |
reviewing and determining the compensation package for our co-Chief Executive Officers and other senior executives;
|
| · |
reviewing and making recommendations to our board with respect to the compensation of our non-employee directors;
|
| · |
reviewing and approving corporate goals and objectives relevant to the compensation of our co-Chief Executive Officers and other senior executives, including evaluating their performance in light of such goals and objectives; and
|
| · |
reviewing periodically and approving and administering stock options plans, long-term incentive compensation or equity plans, programs or similar arrangements, annual bonuses, employee pension and welfare benefit plans for all employees, including reviewing and approving the granting of options and other incentive awards.
|
As a foreign private issuer, we are permitted to follow home country practice in lieu of the requirement to have a compensation committee comprised entirely of independent directors. Nonetheless, we have determined that all of the members of our compensation committee, Laurence N. Charney, N. Scott Fine and Aviad Kaufman are independent directors as defined under the applicable rules of the NYSE. Our compensation committee operates under a written charter that satisfies the applicable standards of the NYSE.
Code of Ethics and Ethical Guidelines
Our board of directors has adopted a code of ethics that describes our commitment to, and requirements in connection with, ethical issues relevant to business practices and personal conduct.
146
D.
Employees
As of December 31, 2017, 2016 and 2015 we, and our consolidated subsidiaries, employed 10
8
, 115 and 118 individuals, respectively, as follows:
|
Number of Employees as of
December 31, |
||||||||||||
|
Company
|
2017
|
2016
|
2015
|
|||||||||
|
OPC
|
88
|
79
|
66
|
|||||||||
|
Primus
|
14
|
31
|
41
|
|||||||||
|
Kenon
|
6
|
5
|
11
|
|||||||||
|
Total
|
108
|
115
|
118
|
|||||||||
OPC
As of December 31, 2017, OPC employed 88 employees. For further information on OPC’s employees, see “
Item 4.B Business Overview—OPC—Employees.
”
Qoros
As of December 31, 2017, Qoros employed approximately 1,640 employees, consisting of headquarter and factory employees predominantly within China.
ZIM
As of December 31, 2017, ZIM employed approximately 3,600 employees (including employees of its subsidiaries).
A significant number of ZIM’s Israeli employees are unionized and ZIM is party to numerous collective agreements with respect to its employees. For further information on the risks related to ZIM's unionized employees, see “
Item 3.D Risk Factors—Risks Related to the Industries in Which Our Businesses Operate—Our businesses may be adversely affected by work stoppages, union negotiations, labor disputes and other matters associated with our labor force
.”
Other
As of December 31, 2017, Primus employed 14 employees, all of whom are located in the U.S.
E.
Share Ownership
Interests of our Directors and our Employees
Kenon has established the Share Incentive Plan 2014 and the Share Option Plan 2014 for its directors and management. The Share Incentive Plan 2014 and the Share Option Plan 2014 provide grants of Kenon’s shares, and stock options in respect of Kenon’s shares, respectively, to management and directors of Kenon, or to officers of Kenon’s subsidiaries or associated companies, as well as to officers of IC, pursuant to awards, which may be granted by Kenon from time to time. The total number of shares underlying awards which may be granted under the Share Incentive Plan 2014 or delivered pursuant to the exercise of options granted under the Share Option Plan 2014 shall not, in the aggregate, exceed 3% of the total issued shares (excluding treasury shares) of Kenon. Kenon granted awards of shares to directors and certain members of its management under the Share Incentive Plan 2014 in 2017, with a value of $1.1 million.
147
Equity Awards to Certain Executive Officers—Subsidiaries and Associated Companies
Kenon’s subsidiaries and associated companies may, from time to time, adopt equity compensation arrangements for officers and directors of the relevant entity. Kenon expects any such arrangements to be on customary terms and within customary limits (in terms of dilution).
A.
Major Shareholders
The following table sets forth information regarding the beneficial ownership of our ordinary shares as of April 4, 2018, by each person or entity beneficially owning 5% or more of our ordinary shares, based upon the 53,826,749 ordinary shares outstanding as of such date, which represents our entire issued and outstanding share capital as of such date. The information set out below is based on public filings with the SEC as of April 4, 2018.
To our knowledge, as of
April
4
, 2018, we had one shareholder of record in the United States holding approximately 99% of our outstanding ordinary shares. Such numbers are not representative of the portion of our shares held in the United States nor are they representative of the number of beneficial holders residing in the United States, since such ordinary shares (which includes the ordinary shares held by the TASE for trading on the TASE) were held of record by one U.S. nominee company, CEDE & Co, which holds all of our shares traded on the NYSE and the TASE indirectly.
All of our ordinary shares have the same voting rights.
|
Beneficial Owner (Name/Address)
|
Ordinary Shares
Owned |
Percentage of Ordinary Shares
|
||||||
|
Ansonia Holdings Singapore B.V.
1
|
31,156,869
|
58.0
|
%
|
|||||
|
XT Investments Ltd.
2
|
6,273,128
|
11.7
|
%
|
|||||
|
Clal Insurance Enterprises Holdings Ltd.
3
|
2,818,563
|
5.2
|
%
|
|||||
|
Laurence N. Charney
4
|
9,656
|
—
|
5
|
|||||
|
N. Scott Fine
4
|
5,652
|
—
|
5
|
|||||
|
Directors and Executive Officers
6
|
—
|
—
|
5
|
|||||
| (1) |
Based solely on the Schedule 13-D/A (Amendment No. 4) filed by Ansonia Holdings Singapore B.V. with the SEC on January 25, 2017. A discretionary trust, in which Mr. Idan Ofer is the prime beneficiary, indirectly holds 100% of Ansonia Holdings Singapore B.V.
|
| (2) |
Based solely upon the Schedule 13-D/A (Amendment No. 2) filed by XT Investments Ltd. and XT Holdings Ltd. with the SEC on August 22, 2017. XT Investments Ltd. is a direct wholly-owned subsidiary of XT Holdings Ltd., of which each of Orona Investments Ltd. and Lynav Holdings Ltd. is the direct owner of 50% of the outstanding ordinary shares. Orona Investments Ltd. is indirectly controlled by Mr. Ehud Angel. Lynav Holdings Ltd. is controlled by a discretionary trust in which Mr. Idan Ofer is a prime beneficiary.
|
| (3) |
Based solely upon the Schedule 13-G filed by Clal Insurance Enterprises Holdings Ltd. on January 2, 2018.
According to the Schedule 13-Gs, o
f the 2,818,563 ordinary shares reported on the Schedule 13-G, (i) 2,451,907 ordinary shares are held for members of the public through, among others, provident funds and/or pension funds and/or insurance policies, which are managed by subsidiaries of Clal Insurance Enterprises Holdings Ltd., which subsidiaries operate under independent management and make independent voting and investment decisions; and (ii) 366,656 ordinary shares are beneficially held for Clal Insurance Enterprises Holdings Ltd.’s own account.
|
| (4) |
Based solely on Exhibit 99.3 to the Form 6-K furnished by Kenon with the SEC on June 2, 2017.
|
| (5) |
Owns less than 1% of Kenon’s ordinary shares.
|
| (6) |
Excludes shares held by Laurence N. Charney and N. Scott Fine.
|
Beneficial ownership is determined in accordance with the rules and regulations of the SEC. In computing the number of shares beneficially owned by a person and the percentage ownership of that person, we have included shares that such person has the right to acquire within 60 days, including through the exercise of any option, warrant or other right or the conversion of any other security. These shares, however, are not included in the computation of the percentage ownership of any other person.
148
We are not aware of any arrangement that may, at a subsequent date, result in a change of our control.
B.
Related Party Transactions
Kenon
Pursuant to its charter, the audit committee must review and approve all related party transactions. The audit committee has a written policy with respect to the approval of related party transactions. In addition, we have undertaken that, for so long as we are listed on the NYSE, to the extent that we or our subsidiaries will enter into transactions with related parties, such transactions will be considered and approved by us or our wholly-owned subsidiaries in a manner that is consistent with customary practices followed by companies incorporated in Delaware and shall be reviewed in accordance with the requirements of Delaware law.
We are party to numerous related party transactions with certain of our affiliates. Set forth below is a summary of these transactions. For further information, see Note 31 to our financial statements included in this annual report.
OPC
Sales of Electricity and Gas
OPC-Rotem sells electricity through PPAs to some entities that may be considered to be related parties. OPC-Rotem recorded revenues from related parties in the amount of $103 million, $130 million and $147 million in the years ended December 31, 2017, 2016 and 2015, respectively.
OPC-Rotem and OPC-Hadera also sell an immaterial amount of gas to some entities that may be considered related parties.
Qoros
For information on Qoros’ commercial arrangements with its equity holders, see Note 29 to Qoros’ consolidated financial statements, included in this annual report.
Ansonia
Kenon is party to loan agreements with Kenon’s major shareholder Ansonia, which loan agreements were entered into in 2016 to provide loans to Kenon to fund Qoros. The total outstanding principal amount of the loans owing from Kenon to Ansonia was approximately $
75
million
(including interest)
as of December 31, 2017.
Under the terms of these loan agreements, Kenon is required to use the proceeds from realizations of a certain investment in Qoros and repayments of shareholder loans from Qoros to Kenon to repay the loans with Ansonia. Accordingly, $20 million in proceeds retained by Kenon was applied to the partial repayment of the Ansonia loans in January 2018, leaving a balance of approximately $55 million (linked to RMB proceeds received by Kenon) of loans owing to Ansonia. Amounts retained under the new investment, including a portion of any Qoros shareholder loan repayments or amounts retained by Kenon from the sale of its interest in Qoros to the New Qoros Investor, would similarly be required to be applied to the repayment of the Ansonia loans.
C.
Interests of Experts and Counsel
Not applicable.
149
A.
Consolidated Statements and Other Financial Information
For information on the financial statements filed as a part of this annual report, see “
Item 18. Financial Statements.
” For information on our legal proceedings, see “
Item 4.B Business Overview
” and Note 2
1
to our financial statements included in this annual report. For information on our dividend policy, see “
Item 10.B Constitution.
”
B.
Significant Changes
For information on any significant changes that may have occurred since the date of our annual financial statements, see “
Item 5. Operating and Financial Review and Prospects—Recent Developments.
”
A.
Offer and Listing Details.
The following table sets forth, for the periods indicated, the reported high and low closing sale prices of our ordinary shares on the NYSE.
|
Price per ordinary
share($) |
||||||||
|
High
|
Low
|
|||||||
|
Annual:
|
||||||||
|
Year ended December 31, 2015 (since January 6, 2015)
|
22.13
|
9.66
|
||||||
|
Year ended December 31, 2016
|
12.02
|
7.40
|
||||||
|
Year ended December 31, 2017
|
21.65
|
10.01
|
||||||
|
Quarterly:
|
||||||||
|
Three months ended March 31, 2016
|
9.80
|
7.46
|
||||||
|
Three months ended June 30, 2016
|
10.90
|
7.40
|
||||||
|
Three months ended September 30, 2016
|
12.02
|
9.57
|
||||||
|
Three months ended December 31, 2016
|
11.70
|
8.81
|
||||||
|
Three months ended March 31, 2017
|
13.11
|
10.01
|
||||||
|
Three months ended June 30, 2017
|
14.00
|
11.19
|
||||||
|
Three months ended September 30, 2017
|
17.19
|
13.05
|
||||||
|
Three months ended December 31, 2017
|
21.65
|
15.85
|
||||||
|
Three months ended March 31, 2018
1
|
32.28
|
16.25
|
||||||
|
Monthly
|
||||||||
|
October 2017
|
17.50
|
15.85
|
||||||
|
November 2017
|
20.65
|
16.50
|
||||||
|
December 2017
|
21.65
|
19.79
|
||||||
|
January 2018
|
30.35
|
21.79
|
||||||
|
February 2018
|
31.58
|
28.36
|
||||||
|
March 2018
1
|
32.28
|
16.25
|
||||||
| (1) |
In March 2018, Kenon’s share price was adjusted to reflect the $12.35 per share cash distribution to Kenon’s shareholders.
|
150
The following table sets forth, for the periods indicated, the reported high and low closing sale prices of our ordinary shares on the TASE.
|
Price per ordinary
share(NIS) |
||||||||
|
High
|
Low
|
|||||||
|
Annual:
|
||||||||
|
Year ended December 31, 2015 (since January 6, 2015)
|
84.98
|
37.75
|
||||||
|
Year ended December 31, 2016
|
46.34
|
28.10
|
||||||
|
Year ended December 31, 2017
|
74.15
|
37.55
|
||||||
|
Quarterly:
|
||||||||
|
Three months ended March 31, 2016
|
40.00
|
29.13
|
||||||
|
Three months ended June 30, 2016
|
41.75
|
28.10
|
||||||
|
Three months ended September 30, 2016
|
46.34
|
36.12
|
||||||
|
Three months ended December 31, 2016
|
45.33
|
33.30
|
||||||
|
Three months ended March 31, 2017
|
49.06
|
37.55
|
||||||
|
Three months ended June 30, 2017
|
48.85
|
40.40
|
||||||
|
Three months ended September 30, 2017
|
61.10
|
46.33
|
||||||
|
Three months ended December 31, 2017
|
74.15
|
55.06
|
||||||
|
Three months ended March 31, 2018
1
|
109.80
|
56.72
|
||||||
|
Monthly
|
||||||||
|
October 2017
|
60.70
|
55.06
|
||||||
|
November 2017
|
72.95
|
59.92
|
||||||
|
December 2017
|
74.15
|
69.55
|
||||||
|
January 2018
|
102.00
|
75.02
|
||||||
|
February 2018
|
109.80
|
98.77
|
||||||
|
March 2018
1
|
107.90
|
56.72
|
||||||
| (1) |
In March 2018, Kenon’s share price was adjusted to reflect the $12.35 per share cash distribution to Kenon’s shareholders.
|
B.
Plan of Distribution
Not applicable.
C.
Markets
Our ordinary shares are listed on each of the NYSE and the TASE under the symbol “KEN.”
D.
Selling Shareholders
Not applicable.
E.
Dilution.
Not applicable.
F.
Expenses of the Issue
Not applicable.
A.
Share Capital
Not applicable.
B.
Constitution
The following description of our constitution is a summary and is qualified by reference to the constitution, a copy of which has been filed with the SEC.
151
New Shares
Under Singapore law, new shares may be issued only with the prior approval of our shareholders in a general meeting. General approval may be sought from our shareholders in a general meeting for the issue of shares. Approval, if granted, will lapse at the earliest of:
| · |
the conclusion of the next annual general meeting;
|
| · |
the expiration of the period within which the next annual general meeting is required by law to be held (i.e., within 18 months from our incorporation date (and in the case of subsequent periods, 15 months)) or six months from our financial year end, being December 31, whichever is the earliest; or
|
| · |
the subsequent revocation or modification of approval by our shareholders acting at a duly convened general meeting.
|
Our shareholders have provided such general authority to issue new shares until the conclusion of our 2018 annual general meeting. Subject to this and the provisions of the Singapore Companies Act and our constitution, all new shares are under the control of the directors who may allot and issue new shares to such persons on such terms and conditions and with the rights and restrictions as they may think fit to impose.
Preference Shares
Our constitution provides that we may issue shares of a different class with preferential, deferred or other special rights, privileges or conditions as our board of directors may determine. Under the Singapore Companies Act, our preference shareholders will have the right to attend any general meeting insofar as the circumstances set forth below apply and on a poll at such general meeting, to have at least one vote for every preference share held:
| · |
upon any resolution concerning the winding-up of our company; and
|
| · |
upon any resolution which varies the rights attached to such preference shares.
|
We may, subject to the prior approval in a general meeting of our shareholders, issue preference shares which are, or at our option, subject to redemption provided that such preference shares may not be redeemed out of capital unless:
| · |
all the directors have made a solvency statement in relation to such redemption; and
|
| · |
we have lodged a copy of the statement with the Singapore Registrar of Companies.
|
Further, the shares must be fully paid-up before they are redeemed.
Transfer of Ordinary Shares
Subject to applicable securities laws in relevant jurisdictions and our constitution, our ordinary shares are freely transferable. Shares may be transferred by a duly signed instrument of transfer in any usual or common form or in a form acceptable to our directors. The directors may decline to register any transfer unless, among other things, evidence of payment of any stamp duty payable with respect to the transfer is provided together with other evidence of ownership and title as the directors may require. We will replace lost or destroyed certificates for shares upon notice to us and upon, among other things, the applicant furnishing evidence and indemnity as the directors may require and the payment of all applicable fees.
Election and Re-election of Directors
Under our constitution, our shareholders by ordinary resolution, or our board of directors, may appoint any person to be a director as an additional director or to fill a casual vacancy, provided that any person so appointed by our board of directors shall hold office only until the next annual general meeting, and shall then be eligible for re-election.
152
Our constitution provides that, subject to the Singapore Companies Act, no person other than a director retiring at a general meeting is eligible for appointment as a director at any general meeting, without the recommendation of the Board for election, unless (a) in the case of a member or members who in aggregate hold(s) more than fifty percent of the total number of our issued and paid-up shares (excluding treasury shares), not less than ten days, or (b) in the case of a member or members who in aggregate hold(s) more than five percent of the total number of our issued and paid-up shares (excluding treasury shares), not less than 120 days, before the date of the notice provided to members in connection with the general meeting, a written notice signed by such member or members (other than the person to be proposed for appointment) who (i) are qualified to attend and vote at the meeting for which such notice is given, and (ii) have held shares representing the prescribed threshold in (a) or (b) above, for a continuous period of at least one year prior to the date on which such notice is given, is lodged at our registered office. Such a notice must also include the consent of the person nominated.
Shareholders’ Meetings
We are required to hold an annual general meeting each year. Annual general meetings must be held not more than 15 months after the holding of the last preceding annual general meeting, and in each case, not later than six months from our financial year end, being December 31. The directors may convene an extraordinary general meeting whenever they think fit and they must do so upon the written request of shareholders representing not less than one-tenth of the paid-up shares as at the date of deposit carries the right to vote at general meetings (disregarding paid-up shares held as treasury shares). In addition, two or more shareholders holding not less than one-tenth of our total number of issued shares (excluding our treasury shares) may call a meeting of our shareholders. The Singapore Companies Act requires not less than:
| · |
14 days’ written notice to be given by Kenon of a general meeting to pass an ordinary resolution; and
|
| · |
21 days’ written notice to be given by Kenon of a general meeting to pass a special resolution,
|
to every member and the auditors of Kenon. Our constitution further provides that in computing the notice period, both the day on which the notice is served, or deemed to be served, and the day for which the notice is given shall be excluded.
Unless otherwise required by law or by our constitution, voting at general meetings is by ordinary resolution, requiring the affirmative vote of a simple majority of the shares present in person or represented by proxy at the meeting and entitled to vote on the resolution. An ordinary resolution suffices, for example, for appointments of directors. A special resolution, requiring an affirmative vote of not less than three-fourths of the shares present in person or represented by proxy at the meeting and entitled to vote on the resolution, is necessary for certain matters under Singapore law, such as an alteration of our constitution.
Voting Rights
Voting at any meeting of shareholders is by a show of hands unless a poll is duly demanded before or on the declaration of the result of the show of hands. If voting is by a show of hands, every shareholder who is entitled to vote and who is present in person or by proxy at the meeting has one vote. On a poll, every shareholder who is present in person or by proxy or by attorney, or in the case of a corporation, by a representative, has one vote for every share held by him or which he represents.
Dividends
We have no current plans to pay annual or semi-annual cash dividends. However, as part of our strategy, we may, in the event that we divest a portion of, or our entire equity interest in, any of our businesses, distribute such cash proceeds or declare a distribution-in-kind of shares in our investee companies. No dividend may be paid except out of profits and we currently do not have distributable profits from which dividends may be declared. Any dividends would be limited by the amount of available distributable reserves, which, under Singapore law, will be assessed on the basis of Kenon’s standalone unconsolidated accounts (which will be based upon the SFRS). Under Singapore law, it is also possible to effect a capital reduction exercise to return cash and/or assets to our shareholders. The completion of a capital reduction exercise may require the approval of the Singapore Courts, and we may not be successful in our attempts to obtain such approval.
153
Additionally, because we are a holding company, our ability to pay cash dividends, or declare a distribution-in-kind of the ordinary shares of any of our businesses, may be limited by restrictions on our ability to obtain sufficient funds through dividends from our businesses, including restrictions under the terms of the agreements governing the indebtedness of our businesses. Subject to the foregoing, the payment of cash dividends in the future, if any, will be at the discretion of our board of directors and will depend upon such factors as earnings levels, capital requirements, contractual restrictions, our overall financial condition, available distributable reserves and any other factors deemed relevant by our board of directors. Generally, a final dividend is declared out of profits disclosed by the accounts presented to the annual general meeting, and requires approval of our shareholders. However, our board of directors can declare interim dividends without approval of our shareholders.
Bonus and Rights Issues
In a general meeting, our shareholders may, upon the recommendation of the directors, capitalize any reserves or profits and distribute them as fully paid bonus shares to the shareholders in proportion to their shareholdings.
Takeovers
The Singapore Code on Take-overs and Mergers, the Singapore Companies Act and the Securities and Futures Act, Chapter 289 of Singapore regulate, among other things, the acquisition of ordinary shares of Singapore-incorporated public companies. Any person acquiring an interest, whether by a series of transactions over a period of time or not, either on his own or together with parties acting in concert with such person, in 30% or more of our voting shares, or, if such person holds, either on his own or together with parties acting in concert with such person, between 30% and 50% (both amounts inclusive) of our voting shares, and if such person (or parties acting in concert with such person) acquires additional voting shares representing more than 1% of our voting shares in any six-month period, must, except with the consent of the Securities Industry Council in Singapore, extend a mandatory takeover offer for the remaining voting shares in accordance with the provisions of the Singapore Code on Take-overs and Mergers.
“Parties acting in concert” comprise individuals or companies who, pursuant to an agreement or understanding (whether formal or informal), cooperate, through the acquisition by any of them of shares in a company, to obtain or consolidate effective control of that company. Certain persons are presumed (unless the presumption is rebutted) to be acting in concert with each other. They include:
| · |
a company and its related companies, the associated companies of any of the company and its related companies, companies whose associated companies include any of these companies and any person who has provided financial assistance (other than a bank in the ordinary course of business) to any of the foregoing for the purchase of voting rights;
|
| · |
a company and its directors (including their close relatives, related trusts and companies controlled by any of the directors, their close relatives and related trusts);
|
| · |
a company and its pension funds and employee share schemes;
|
| · |
a person and any investment company, unit trust or other fund whose investment such person manages on a discretionary basis but only in respect of the investment account which such person manages;
|
| · |
a financial or other professional adviser, including a stockbroker, and its clients in respect of shares held by the adviser and persons controlling, controlled by or under the same control as the adviser and all the funds managed by the adviser on a discretionary basis, where the shareholdings of the adviser and any of those funds in the client total 10% or more of the client’s equity share capital;
|
| · |
directors of a company (including their close relatives, related trusts and companies controlled by any of such directors, their close relatives and related trusts) which is subject to an offer or where the directors have reason to believe a bona fide offer for the company may be imminent;
|
| · |
partners; and
|
154
| · |
an individual and such person’s close relatives, related trusts, any person who is accustomed to act in accordance with such person’s instructions and companies controlled by the individual, such person’s close relatives, related trusts or any person who is accustomed to act in accordance with such person’s instructions and any person who has provided financial assistance (other than a bank in the ordinary course of business) to any of the foregoing for the purchase of voting rights.
|
Subject to certain exceptions, a mandatory takeover offer must be in cash or be accompanied by a cash alternative at not less than the highest price paid by the offeror or parties acting in concert with the offeror during the offer period and within the six months preceding the acquisition of shares that triggered the mandatory offer obligation.
Under the Singapore Code on Take-overs and Mergers, where effective control of a company is acquired or consolidated by a person, or persons acting in concert, a general offer to all other shareholders is normally required. An offeror must treat all shareholders of the same class in an offeree company equally. A fundamental requirement is that shareholders in the company subject to the takeover offer must be given sufficient information, advice and time to consider and decide on the offer. These legal requirements may impede or delay a takeover of our company by a third-party.
In October 2014, the Securities Industry Council of Singapore waived application of the Singapore Code on Take-overs and Mergers to the Company, subject to certain conditions. Pursuant to the waiver, for as long as Kenon is not listed on a securities exchange in Singapore, and except in the case of a tender offer (within the meaning of U.S. securities laws) where the offeror relies on a Tier 1 exemption to avoid full compliance with U.S. tender offer regulations, the Singapore Code on Take-overs and Mergers shall not apply to Kenon.
Insofar as the Singapore Code on Take-overs and Mergers applies to Kenon, the Singapore Code on Take-overs and Mergers generally provides that the board of directors of Kenon should bring the offer to the shareholders of Kenon in accordance with the Singapore Code on Take-overs and Mergers and refrain from an action which will deny the shareholders from the possibility to decide on the offer.
Liquidation or Other Return of Capital
On a winding-up or other return of capital, subject to any special rights attaching to any other class of shares, holders of ordinary shares will be entitled to participate in any surplus assets in proportion to their shareholdings.
Limitations on Rights to Hold or Vote Ordinary Shares
Except as discussed above under “—
Takeovers
,” there are no limitations imposed by the laws of Singapore or by our constitution on the right of non-resident shareholders to hold or vote ordinary shares.
Limitations of Liability and Indemnification Matters
Our constitution currently provides that, subject to the provisions of the Singapore Companies Act and every other act applicable to Kenon, every director, secretary or other officer of our company or our subsidiaries and affiliates shall be entitled to be indemnified by our company against all costs, charges, losses, expenses and liabilities incurred by him or her in the execution and discharge of his or her duties (and where he serves at our request as a director, officer, employee or agent of any of our subsidiaries or affiliates) or in relation thereto and in particular and without prejudice to the generality of the foregoing, no director, secretary or other officer of our company shall be liable for the acts, receipts, neglects or defaults of any other director or officer or for joining in any receipt or other act for conformity or for any loss or expense happening to our company through the insufficiency or deficiency of title to any property acquired by order of the directors for or on behalf of our company or for the insufficiency or deficiency of any security in or upon which any of the moneys of our company shall be invested or for any loss or damage arising from the bankruptcy, insolvency or tortious act of any person with whom any moneys, securities or effects shall be deposited or left or for any other loss, damage or misfortune whatever which shall happen in the execution of the duties of his or her office or in relation thereto unless the same shall happen through his or her own negligence, default, breach of duty or breach of trust.
155
The limitation of liability and indemnification provisions in our constitution may discourage shareholders from bringing a lawsuit against directors for breach of their fiduciary duties. They may also reduce the likelihood of derivative litigation against directors and officers, even though an action, if successful, might benefit us and our shareholders. A shareholder’s investment may be harmed to the extent we pay the costs of settlement and damage awards against directors and officers pursuant to these indemnification provisions. Insofar as indemnification for liabilities arising under the Securities Act of 1933, or the Securities Act, may be permitted to our directors, officers and controlling persons pursuant to the foregoing provisions, or otherwise, we have been advised that, in the opinion of the SEC, such indemnification is against public policy as expressed in the Securities Act, and is, therefore, unenforceable.
Comparison of Shareholder Rights
We are incorporated under the laws of Singapore. The following discussion summarizes material differences between the rights of holders of our ordinary shares and the rights of holders of the common stock of a typical corporation incorporated under the laws of the state of Delaware which result from differences in governing documents and the laws of Singapore and Delaware.
This discussion does not purport to be a complete statement of the rights of holders of our ordinary shares under applicable law in Singapore and our constitution or the rights of holders of the common stock of a typical corporation under applicable Delaware law and a typical certificate of incorporation and bylaws.
|
Delaware
|
Singapore—Kenon Holdings Ltd.
|
|
Board of Directors
|
||
|
A typical certificate of incorporation and bylaws would provide that the number of directors on the board of directors will be fixed from time to time by a vote of the majority of the authorized directors. Under Delaware law, a board of directors can be divided into classes and cumulative voting in the election of directors is only permitted if expressly authorized in a corporation’s certificate of incorporation.
|
The constitution of companies will typically state the minimum and maximum number of directors as well as provide that the number of directors may be increased or reduced by shareholders via ordinary resolution passed at a general meeting, provided that the number of directors following such increase or reduction is within the maximum and minimum number of directors provided in the constitution and the Singapore Companies Act, respectively. Our constitution provides that, unless otherwise determined by a general meeting, the minimum number of directors is five and the maximum number is 12.
|
|
|
Limitation on Personal Liability of Directors
|
||
|
A typical certificate of incorporation provides for the elimination of personal monetary liability of directors for breach of fiduciary duties as directors to the fullest extent permissible under the laws of Delaware, except for liability (i) for any breach of a director’s loyalty to the corporation or its stockholders, (ii) for acts or omissions not in good faith or which involve intentional misconduct or a knowing violation of law, (iii) under Section 174 of the Delaware General Corporation Law (relating to the liability of directors for unlawful payment of a dividend or an unlawful stock purchase or redemption) or (iv) for any transaction from which the director derived an improper personal benefit. A typical certificate of incorporation would also provide that if the Delaware General Corporation Law is amended so as to allow further elimination of, or limitations on, director liability, then the liability of directors will be eliminated or limited to the fullest extent permitted by the Delaware General Corporation Law as so amended.
|
Pursuant to the Singapore Companies Act, any provision (whether in the constitution, contract or otherwise) purporting to exempt a director (to any extent) from any liability attaching in connection with any negligence, default, breach of duty or breach of trust in relation to Kenon will be void except as permitted under the Singapore Companies Act. Nevertheless, a director can be released by the shareholders of Kenon for breaches of duty to Kenon, except in the case of fraud, illegality, insolvency and oppression or disregard of minority interests.
Our constitution currently provides that, subject to the provisions of the Singapore Companies Act and every other act for the time being in force concerning companies and affecting Kenon, every director, auditor, secretary or other officer of Kenon and its subsidiaries and affiliates shall be entitled to be indemnified by Kenon against all liabilities incurred by him in the execution and discharge of his duties and where he serves at the request of Kenon as a director, officer, employee or agent of any subsidiary or affiliate of Kenon or in relation thereto, including any liability incurred by him in defending any proceedings, whether civil or criminal, which relate to anything done or omitted or alleged to have been done or omitted by him as an officer or employee of Kenon, and in which judgment is given in his favor (or the proceedings otherwise disposed of without any finding or admission of any material breach of duty on his part) or in which he is acquitted, or in connection with an application under statute in respect of such act or omission in which relief is granted to him by the court.
|
|
156
|
Delaware
|
Singapore—Kenon Holdings Ltd.
|
|
Interested Shareholders
|
||
|
Section 203 of the Delaware General Corporation Law generally prohibits a Delaware corporation from engaging in specified corporate transactions (such as mergers, stock and asset sales, and loans) with an “interested stockholder” for three years following the time that the stockholder becomes an interested stockholder. Subject to specified exceptions, an “interested stockholder” is a person or group that owns 15% or more of the corporation’s outstanding voting stock (including any rights to acquire stock pursuant to an option, warrant, agreement, arrangement or understanding, or upon the exercise of conversion or exchange rights, and stock with respect to which the person has voting rights only), or is an affiliate or associate of the corporation and was the owner of 15% or more of the voting stock at any time within the previous three years.
A Delaware corporation may elect to “opt out” of, and not be governed by, Section 203 through a provision in either its original certificate of incorporation, or an amendment to its original certificate or bylaws that was approved by majority stockholder vote. With a limited exception, this amendment would not become effective until 12 months following its adoption.
|
There are no comparable provisions in Singapore with respect to public companies which are not listed on the Singapore Exchange Securities Trading Limited.
|
|
|
Removal of Directors
|
||
|
A typical certificate of incorporation and bylaws provide that, subject to the rights of holders of any preferred stock, directors may be removed at any time by the affirmative vote of the holders of at least a majority, or in some instances a supermajority, of the voting power of all of the then outstanding shares entitled to vote generally in the election of directors, voting together as a single class. A certificate of incorporation could also provide that such a right is only exercisable when a director is being removed for cause (removal of a director only for cause is the default rule in the case of a classified board).
|
According to the Singapore Companies Act, directors of a public company may be removed before expiration of their term of office with or without cause by ordinary resolution (i.e., a resolution which is passed by a simple majority of those shareholders present and voting in person or by proxy). Notice of the intention to move such a resolution has to be given to Kenon not less than 28 days before the meeting at which it is moved. Kenon shall then give notice of such resolution to its shareholders not less than 14 days before the meeting. Where any director removed in this manner was appointed to represent the interests of any particular class of shareholders or debenture holders, the resolution to remove such director will not take effect until such director’s successor has been appointed.
Our constitution provides that Kenon may by ordinary resolution of which special notice has been given, remove any director before the expiration of his period of office, notwithstanding anything in our constitution or in any agreement between Kenon and such director and appoint another person in place of the director so removed.
|
|
157
|
Delaware
|
Singapore—Kenon Holdings Ltd.
|
|
Filling Vacancies on the Board of Directors
|
||
|
A typical certificate of incorporation and bylaws provide that, subject to the rights of the holders of any preferred stock, any vacancy, whether arising through death, resignation, retirement, disqualification, removal, an increase in the number of directors or any other reason, may be filled by a majority vote of the remaining directors, even if such directors remaining in office constitute less than a quorum, or by the sole remaining director. Any newly elected director usually holds office for the remainder of the full term expiring at the annual meeting of stockholders at which the term of the class of directors to which the newly elected director has been elected expires.
|
The constitution of a Singapore company typically provides that the directors have the power to appoint any person to be a director, either to fill a vacancy or as an addition to the existing directors, but so that the total number of directors will not at any time exceed the maximum number fixed in the constitution. Any newly elected director shall hold office until the next following annual general meeting, where such director will then be eligible for re-election. Our constitution provides that the shareholders may by ordinary resolution, or the directors may, appoint any person to be a director as an additional director or to fill a vacancy provided that any person so appointed by the directors will only hold office until the next annual general meeting, and will then be eligible for re-election.
|
|
|
Amendment of Governing Documents
|
||
|
Under the Delaware General Corporation Law, amendments to a corporation’s certificate of incorporation require the approval of stockholders holding a majority of the outstanding shares entitled to vote on the amendment. If a class vote on the amendment is required by the Delaware General Corporation Law, a majority of the outstanding stock of the class is required, unless a greater proportion is specified in the certificate of incorporation or by other provisions of the Delaware General Corporation Law. Under the Delaware General Corporation Law, the board of directors may amend bylaws if so authorized in the charter. The stockholders of a Delaware corporation also have the power to amend bylaws.
|
Our constitution may be altered by special resolution (i.e., a resolution passed by at least a three-fourths majority of the shares entitled to vote, present in person or by proxy at a meeting for which not less than 21 days written notice is given). The board of directors has no right to amend the constitution.
|
|
158
|
Delaware
|
Singapore—Kenon Holdings Ltd.
|
|
Meetings of Shareholders
|
||
|
Annual and Special Meetings
Typical bylaws provide that annual meetings of stockholders are to be held on a date and at a time fixed by the board of directors. Under the Delaware General Corporation Law, a special meeting of stockholders may be called by the board of directors or by any other person authorized to do so in the certificate of incorporation or the bylaws.
Quorum Requirements
Under the Delaware General Corporation Law, a corporation’s certificate of incorporation or bylaws can specify the number of shares which constitute the quorum required to conduct business at a meeting, provided that in no event shall a quorum consist of less than one-third of the shares entitled to vote at a meeting.
|
Annual General Meetings
All companies are required to hold an annual general meeting once every calendar year. The first annual general meeting was required to be held within 18 months of Kenon’s incorporation and subsequently, annual general meetings must be held not more than 15 months after the holding of the last preceding annual general meeting, and in each case, not later than six months from Kenon’s financial year end.
Extraordinary General Meetings
Any general meeting other than the annual general meeting is called an “extraordinary general meeting.” Two or more members (shareholders) holding not less than 10% of the total number of issued shares (excluding treasury shares) may call an extraordinary general meeting. In addition, the constitution usually also provides that general meetings may be convened in accordance with the Singapore Companies Act by the directors.
Notwithstanding anything in the constitution, the directors are required to convene a general meeting if required to do so by requisition (i.e., written notice to directors requiring that a meeting be called) by shareholder(s) holding not less than 10% of the total number of paid-up shares of Kenon carrying voting rights.
Our constitution provides that the directors may, whenever they think fit, convene an extraordinary general meeting.
Quorum Requirements
Our constitution provides that shareholders entitled to vote holding 33 and 1/3 percent of our issued and paid-up shares, present in person or by proxy at a meeting, shall be a quorum. In the event a quorum is not present, the meeting may be adjourned for one week.
|
|
159
|
Delaware
|
Singapore—Kenon Holdings Ltd.
|
|
Indemnification of Officers, Directors and Employers
|
||
|
Under the Delaware General Corporation Law, subject to specified limitations in the case of derivative suits brought by a corporation’s stockholders in its name, a corporation may indemnify any person who is made a party to any third-party action, suit or proceeding on account of being a director, officer, employee or agent of the corporation (or was serving at the request of the corporation in such capacity for another corporation, partnership, joint venture, trust or other enterprise) against expenses, including attorney’s fees, judgments, fines and amounts paid in settlement actually and reasonably incurred by him or her in connection with the action, suit or proceeding through, among other things, a majority vote of a quorum consisting of directors who were not parties to the suit or proceeding, if the person:
·
acted in good faith and in a manner he or she reasonably believed to be in or not opposed to the best interests of the corporation or, in some circumstances, at least not opposed to its best interests; and
·
in a criminal proceeding, had no reasonable cause to believe his or her conduct was unlawful.
Delaware corporate law permits indemnification by a corporation under similar circumstances for expenses (including attorneys’ fees) actually and reasonably incurred by such persons in connection with the defense or settlement of a derivative action or suit, except that no indemnification may be made in respect of any claim, issue or matter as to which the person is adjudged to be liable to the corporation unless the Delaware Court of Chancery or the court in which the action or suit was brought determines upon application that the person is fairly and reasonably entitled to indemnity for the expenses which the court deems to be proper.
To the extent a director, officer, employee or agent is successful in the defense of such an action, suit or proceeding, the corporation is required by Delaware corporate law to indemnify such person for reasonable expenses incurred thereby. Expenses (including attorneys’ fees) incurred by such persons in defending any action, suit or proceeding may be paid in advance of the final disposition of such action, suit or proceeding upon receipt of an undertaking by or on behalf of that person to repay the amount if it is ultimately determined that that person is not entitled to be so indemnified.
|
The Singapore Companies Act specifically provides that Kenon is allowed to:
·
purchase and maintain for any officer insurance against any liability attaching to such officer in respect of any negligence, default, breach of duty or breach of trust in relation to Kenon;
·
indemnify such officer against liability incurred by a director to a person other than Kenon except when the indemnity is against (i) any liability of the director to pay a fine in criminal proceedings or a sum payable to a regulatory authority by way of a penalty in respect of non-compliance with any requirement of a regulatory nature (however arising); or (ii) any liability incurred by the officer (1) in defending criminal proceedings in which he is convicted, (2) in defending civil proceedings brought by Kenon or a related company of Kenon in which judgment is given against him or (3) in connection with an application for relief under specified sections of the Singapore Companies Act in which the court refuses to grant him relief.
·
indemnify any auditor against any liability incurred or to be incurred by such auditor in defending any proceedings (whether civil or criminal) in which judgment is given in such auditor’s favor or in which such auditor is acquitted; or
·
indemnify any auditor against any liability incurred by such auditor in connection with any application under specified sections of the Singapore Companies Act in which relief is granted to such auditor by a court.
In cases where, inter alia, an officer is sued by Kenon the Singapore Companies Act gives the court the power to relieve directors either wholly or partially from the consequences of their negligence, default, breach of duty or breach of trust. However, Singapore case law has indicated that such relief will not be granted to a director who has benefited as a result of his or her breach of trust. In order for relief to be obtained, it must be shown that (i) the director acted reasonably; (ii) the director acted honestly; and (iii) it is fair, having regard to all the circumstances of the case including those connected with such director’s appointment, to excuse the director.
Our constitution currently provides that, subject to the provisions of the Singapore Companies Act and every other act for the time being in force concerning companies and affecting Kenon, every director, auditor, secretary or other officer of Kenon and its subsidiaries and affiliates shall be entitled to be indemnified by Kenon against all liabilities incurred by him in the execution and discharge of his duties and where he serves at the request of Kenon as a director, officer, employee or agent of any subsidiary or affiliate of Kenon or in relation thereto, including any liability incurred by him in defending any proceedings, whether civil or criminal, which relate to anything done or omitted or alleged to have been done or omitted by him as an officer or employee of Kenon, and in which judgment is given in his favor (or the proceedings otherwise disposed of without any finding or admission of any material breach of duty on his part) or in which he is acquitted, or in connection with an application under statute in respect of such act or omission in which relief is granted to him by the court.
|
|
160
|
Delaware
|
Singapore—Kenon Holdings Ltd.
|
|
Shareholder Approval of Business Combinations
|
||
|
Generally, under the Delaware General Corporation Law, completion of a merger, consolidation, or the sale, lease or exchange of substantially all of a corporation’s assets or dissolution requires approval by the board of directors and by a majority (unless the certificate of incorporation requires a higher percentage) of outstanding stock of the corporation entitled to vote.
The Delaware General Corporation Law also requires a special vote of stockholders in connection with a business combination with an “interested stockholder” as defined in section 203 of the Delaware General Corporation Law. For further information on such provisions, see “—
Interested Shareholders
” above.
|
The Singapore Companies Act mandates that specified corporate actions require approval by the shareholders in a general meeting, notably:
·
notwithstanding anything in Kenon’s constitution, directors are not permitted to carry into effect any proposals for disposing of the whole or substantially the whole of Kenon’s undertaking or property unless those proposals have been approved by shareholders in a general meeting;
·
subject to the constitution of each amalgamating company, an amalgamation proposal must be approved by the shareholders of each amalgamating company via special resolution at a general meeting; and
·
notwithstanding anything in Kenon’s constitution, the directors may not, without the prior approval of shareholders, issue shares, including shares being issued in connection with corporate actions.
|
|
|
Shareholder Action Without a Meeting
|
||
|
Under the Delaware General Corporation Law, unless otherwise provided in a corporation’s certificate of incorporation, any action that may be taken at a meeting of stockholders may be taken without a meeting, without prior notice and without a vote if the holders of outstanding stock, having not less than the minimum number of votes that would be necessary to authorize such action, consent in writing. It is not uncommon for a corporation’s certificate of incorporation to prohibit such action.
|
There are no equivalent provisions under the Singapore Companies Act in respect of passing shareholders’ resolutions by written means that apply to public companies listed on a securities exchange.
|
|
|
Shareholder Suits
|
||
|
Under the Delaware General Corporation Law, a stockholder may bring a derivative action on behalf of the corporation to enforce the rights of the corporation. An individual also may commence a class action suit on behalf of himself or herself and other similarly situated stockholders where the requirements for maintaining a class action under the Delaware General Corporation Law have been met. A person may institute and maintain such a suit only if such person was a stockholder at the time of the transaction which is the subject of the suit or his or her shares thereafter devolved upon him or her by operation of law. Additionally, under Delaware case law, the plaintiff generally must be a stockholder not only at the time of the transaction which is the subject of the suit, but also through the duration of the derivative suit. The Delaware General Corporation Law also requires that the derivative plaintiff make a demand on the directors of the corporation to assert the corporate claim before the suit may be prosecuted by the derivative plaintiff, unless such demand would be futile.
|
Derivative actions
The Singapore Companies Act has a provision which provides a mechanism enabling shareholders to apply to the court for leave to bring a derivative action on behalf of Kenon.
Applications are generally made by shareholders of Kenon or individual directors, but courts are given the discretion to allow such persons as they deem proper to apply (e.g., beneficial owner of shares).
It should be noted that this provision of the Singapore Companies Act is primarily used by minority shareholders to bring an action in the name and on behalf of Kenon or intervene in an action to which Kenon is a party for the purpose of prosecuting, defending or discontinuing the action on behalf of Kenon.
|
|
161
|
Delaware
|
Singapore—Kenon Holdings Ltd.
|
|
Class actions
The concept of class action suits, which allows individual shareholders to bring an action seeking to represent the class or classes of shareholders, generally does not exist in Singapore. However, it is possible as a matter of procedure for a number of shareholders to lead an action and establish liability on behalf of themselves and other shareholders who join in or who are made parties to the action.
These shareholders are commonly known as “lead plaintiffs.” Further, there are circumstances under the provisions of certain Singapore statutes where shareholders may file and prove their claims for compensation in the event that Kenon has been convicted of a criminal offense or has a court order for the payment of a civil penalty made against it.
Additionally, for as long as Kenon is listed in the U.S. or in Israel, Kenon has undertaken not to claim that it is not subject to any derivative/class action that may be filed against it in the U.S. or Israel, as applicable, solely on the basis that it is a Singapore company.
|
|
Dividends or Other Distributions; Repurchases and Redemptions
|
||
|
The Delaware General Corporation Law permits a corporation to declare and pay dividends out of statutory surplus or, if there is no surplus, out of net profits for the fiscal year in which the dividend is declared and/or for the preceding fiscal year as long as the amount of capital of the corporation following the declaration and payment of the dividend is not less than the aggregate amount of the capital represented by the issued and outstanding stock of all classes having a preference upon the distribution of assets.
Under the Delaware General Corporation Law, any corporation may purchase or redeem its own shares, except that generally it may not purchase or redeem these shares if the capital of the corporation is impaired at the time or would become impaired as a result of the redemption. A corporation may, however, purchase or redeem out of capital shares that are entitled upon any distribution of its assets to a preference over another class or series of its shares if the shares are to be retired and the capital reduced.
|
The Singapore Companies Act provides that no dividends can be paid to shareholders except out of profits.
The Singapore Companies Act does not provide a definition on when profits are deemed to be available for the purpose of paying dividends and this is accordingly governed by case law. Our constitution provides that no dividend can be paid otherwise than out of profits of Kenon.
Acquisition of a company’s own shares
The Singapore Companies Act generally prohibits a company from acquiring its own shares subject to certain exceptions. Any contract or transaction by which a company acquires or transfers its own shares is void. However, provided that it is expressly permitted to do so by its constitution and subject to the special conditions of each permitted acquisition contained in the Singapore Companies Act, Kenon may:
·
redeem redeemable preference shares (the redemption of these shares will not reduce the capital of Kenon). Preference shares may be redeemed out of capital if all the directors make a solvency statement in relation to such redemption in accordance with the Singapore Companies Act;
|
|
162
|
Delaware
|
Singapore—Kenon Holdings Ltd.
|
|
·
whether listed on a securities exchange (in Singapore or outside Singapore) or not, make an off-market purchase of its own shares in accordance with an equal access scheme authorized in advance at a general meeting;
·
whether listed on a securities exchange (in Singapore or outside Singapore) or not, make a selective off-market purchase of its own shares in accordance with an agreement authorized in advance at a general meeting by a special resolution where persons whose shares are to be acquired and their associated persons have abstained from voting; and
·
whether listed on a securities exchange (in Singapore or outside Singapore) or not, make an acquisition of its own shares under a contingent purchase contract which has been authorized in advance at a general meeting by a special resolution.
Kenon may also purchase its own shares by an order of a Singapore court.
The total number of ordinary shares that may be acquired by Kenon in a relevant period may not exceed 20% of the total number of ordinary shares in that class as of the date of the resolution pursuant to the relevant share repurchase provisions under the Singapore Companies Act. Where, however, Kenon has reduced its share capital by a special resolution or a Singapore court made an order to such effect, the total number of ordinary shares shall be taken to be the total number of ordinary shares in that class as altered by the special resolution or the order of the court. Payment must be made out of Kenon’s distributable profits or capital, provided that Kenon is solvent. Such payment may include any expenses (including brokerage or commission) incurred directly in the purchase or acquisition by Kenon of its ordinary shares.
Financial assistance for the acquisition of shares
Kenon may not give financial assistance to any person whether directly or indirectly for the purpose of:
·
the acquisition or proposed acquisition of shares in Kenon or units of such shares; or
·
the acquisition or proposed acquisition of shares in its holding company or ultimate holding company, as the case may be, or units of such shares.
Financial assistance may take the form of a loan, the giving of a guarantee, the provision of security, the release of an obligation, the release of a debt or otherwise.
|
163
|
Delaware
|
Singapore—Kenon Holdings Ltd.
|
|
However, it should be noted that Kenon may provide financial assistance for the acquisition of its shares or shares in its holding company if it complies with the requirements (including, where applicable, approval by the board of directors or by the passing of a special resolution by its shareholders) set out in the Singapore Companies Act. Our constitution provides that subject to the provisions of the Singapore Companies Act, we may purchase or otherwise acquire our own shares upon such terms and subject to such conditions as we may deem fit. These shares may be held as treasury shares or cancelled as provided in the Singapore Companies Act or dealt with in such manner as may be permitted under the Singapore Companies Act. On cancellation of the shares, the rights and privileges attached to those shares will expire.
|
||
|
Transactions with Officers and Directors
|
||
|
Under the Delaware General Corporation Law, some contracts or transactions in which one or more of a corporation’s directors has an interest are not void or voidable because of such interest provided that some conditions, such as obtaining the required approval and fulfilling the requirements of good faith and full disclosure, are met. Under the Delaware General Corporation Law, either (a) the stockholders or the board of directors must approve in good faith any such contract or transaction after full disclosure of the material facts or (b) the contract or transaction must have been “fair” as to the corporation at the time it was approved. If board approval is sought, the contract or transaction must be approved in good faith by a majority of disinterested directors after full disclosure of material facts, even though less than a majority of a quorum.
|
Under the Singapore Companies Act, the chief executive officer and directors are not prohibited from dealing with Kenon, but where they have an interest in a transaction with Kenon, that interest must be disclosed to the board of directors. In particular, the chief executive officer and every director who is in any way, whether directly or indirectly, interested in a transaction or proposed transaction with Kenon must, as soon as practicable after the relevant facts have come to such officer or director’s knowledge, declare the nature of such officer or director’s interest at a board of directors’ meeting or send a written notice to Kenon containing details on the nature, character and extent of his interest in the transaction or proposed transaction with Kenon.
In addition, a director or chief executive officer who holds any office or possesses any property which, directly or indirectly, duties or interests might be created in conflict with such officer’s duties or interests as director or chief executive officer, is required to declare the fact and the nature, character and extent of the conflict at a meeting of directors or send a written notice to Kenon containing details on the nature, character and extent of the conflict.
The Singapore Companies Act extends the scope of this statutory duty of a director or chief executive officer to disclose any interests by pronouncing that an interest of a member of the director’s or, as the case may be, the chief executive officer’s family (including spouse, son, adopted son, step-son, daughter, adopted daughter and step-daughter) will be treated as an interest of the director.
|
|
164
|
Delaware
|
Singapore—Kenon Holdings Ltd.
|
|
There is however no requirement for disclosure where the interest of the director or chief executive officer (as the case may be) consists only of being a member or creditor of a corporation which is interested in the proposed transaction with Kenon if the interest may properly be regarded as immaterial. Where the proposed transaction relates to any loan to Kenon, no disclosure need be made where the director or chief executive officer has only guaranteed or joined in guaranteeing the repayment of such loan, unless the constitution provides otherwise.
Further, where the proposed transaction is to be made with or for the benefit of a related corporation (i.e. the holding company, subsidiary or subsidiary of a common holding company) no disclosure need be made of the fact that the director or chief executive officer is also a director or chief executive officer of that corporation, unless the constitution provides otherwise.
Subject to specified exceptions, including a loan to a director for expenditure in defending criminal or civil proceedings, etc. or in connection with an investigation, or an action proposed to be taken by a regulatory authority in connection with any alleged negligence, default, breach of duty or breach of trust by him in relation to Kenon, the Singapore Companies Act prohibits Kenon from: (i) making a loan or quasi-loan to its directors or to directors of a related corporation (each, a “relevant director”); (ii) giving a guarantee or security in connection with a loan or quasi-loan made to a relevant director by any other person; (iii) entering into a credit transaction as creditor for the benefit of a relevant director; (iv) giving a guarantee or security in connection with such credit transaction entered into by any person for the benefit of a relevant director; (v) taking part in an arrangement where another person enters into any of the transactions in (i) to (iv) above or (vi) below and such person obtains a benefit from Kenon or a related corporation; or (vi) arranging for the assignment to Kenon or assumption by Kenon of any rights, obligations or liabilities under a transaction in (i) to (v) above. Kenon is also prohibited from entering into the transactions in (i) to (vi) above with or for the benefit of a relevant director’s spouse or children (whether adopted or naturally or step-children).
|
||
|
Dissenters’ Rights
|
||
|
Under the Delaware General Corporation Law, a stockholder of a corporation participating in some types of major corporate transactions may, under varying circumstances, be entitled to appraisal rights pursuant to which the stockholder may receive cash in the amount of the fair market value of his or her shares in lieu of the consideration he or she would otherwise receive in the transaction.
|
There are no equivalent provisions under the Singapore Companies Act.
|
|
165
|
Delaware
|
Singapore—Kenon Holdings Ltd.
|
|
Cumulative Voting
|
||
|
Under the Delaware General Corporation Law, a corporation may adopt in its bylaws that its directors shall be elected by cumulative voting. When directors are elected by cumulative voting, a stockholder has the number of votes equal to the number of shares held by such stockholder times the number of directors nominated for election. The stockholder may cast all of such votes for one director or among the directors in any proportion.
|
There is no equivalent provision under the Singapore Companies Act in respect of companies incorporated in Singapore.
|
|
|
Anti-Takeover Measures
|
||
|
Under the Delaware General Corporation Law, the certificate of incorporation of a corporation may give the board the right to issue new classes of preferred stock with voting, conversion, dividend distribution, and other rights to be determined by the board at the time of issuance, which could prevent a takeover attempt and thereby preclude shareholders from realizing a potential premium over the market value of their shares.
In addition, Delaware law does not prohibit a corporation from adopting a stockholder rights plan, or “poison pill,” which could prevent a takeover attempt and also preclude shareholders from realizing a potential premium over the market value of their shares.
|
The constitution of a Singapore company typically provides that the company may allot and issue new shares of a different class with preferential, deferred, qualified or other special rights as its board of directors may determine with the prior approval of the company’s shareholders in a general meeting. Our constitution provides that our shareholders may grant to our board the general authority to issue such preference shares until the next general meeting. For further information, see “
Item 3D. Risk Factors—Risks Relating to Our Ordinary Shares—Our directors have general authority to allot and issue new shares on terms and conditions and with any preferences, rights or restrictions as may be determined by our board of directors in its sole discretion, which may dilute our existing shareholders. We may also issue securities that have rights and privileges that are more favorable than the rights and privileges accorded to our existing shareholders” and “Item 10.B Constitution—Preference Shares.
”
Singapore law does not generally prohibit a corporation from adopting “poison pill” arrangements which could prevent a takeover attempt and also preclude shareholders from realizing a potential premium over the market value of their shares.
However, under the Singapore Code on Take-overs and Mergers, if, in the course of an offer, or even before the date of the offer announcement, the board of the offeree company has reason to believe that a bona fide offer is imminent, the board must not, except pursuant to a contract entered into earlier, take any action, without the approval of shareholders at a general meeting, on the affairs of the offeree company that could effectively result in any bona fide offer being frustrated or the shareholders being denied an opportunity to decide on its merits.
For further information on the Singapore Code on Take-overs and Mergers, see “
—Takeovers
.”
|
|
C.
Material Contracts
For information concerning our material contracts, see “
Item 4. Information on the Company”
and
“Item 5. Operating and Financial Review and Prospects.
”
166
D.
Exchange Controls
There are currently no exchange control restrictions in effect in Singapore.
E.
Taxation
The following summary of the United States federal income tax and Singapore tax consequences of ownership of our ordinary shares is based upon laws, regulations, decrees, rulings, income tax conventions (treaties), administrative practice and judicial decisions in effect at the date of this annual report. Legislative, judicial or administrative changes or interpretations may, however, be forthcoming that could alter or modify the statements and conclusions set forth herein. Any such changes or interpretations may be retroactive and could affect the tax consequences to holders of our ordinary shares. This summary does not purport to be a legal opinion or to address all tax aspects that may be relevant to a holder of our ordinary shares. Each prospective holder is urged to consult its tax adviser as to the particular tax consequences to such holder of the ownership and disposition of our ordinary shares, including the applicability and effect of any other tax laws or tax treaties, of pending or proposed changes in applicable tax laws as of the date of this annual report, and of any actual changes in applicable tax laws after such date.
U.S. Federal Income Tax Considerations
The following summarizes U.S. federal income tax considerations of owning and disposing of our ordinary shares. This summary applies only to U.S. Holders that hold our ordinary shares as capital assets (generally, property held for investment) and that have the U.S. Dollar as their functional currency.
This summary is based on the Internal Revenue Code of 1986, as amended, or the Code, Treasury regulations promulgated thereunder and on judicial and administrative interpretations of the Code and the Treasury regulations, all as in effect on the date hereof, and all of which are subject to change, possibly with retroactive effect. This summary does not purport to be a complete description of the consequences of the transactions described in this annual report, nor does it address the application of estate, gift or other non-income federal tax laws or any state, local or foreign tax laws. Moreover, this summary does not address all the tax consequences that may be relevant to holders of our ordinary shares in light of their particular circumstances, including the alternative minimum tax, the Medicare tax on certain investment income and special rules that apply to certain holders such as (but not limited to):
| · |
persons that are not U.S. Holders;
|
| · |
persons that are subject to alternative minimum taxes;
|
| · |
insurance companies;
|
| · |
tax-exempt entities;
|
| · |
financial institutions;
|
| · |
broker-dealers;
|
| · |
persons that hold our ordinary shares through partnerships (or other entities classified as partnerships for U.S. federal income tax purposes);
|
| · |
pass-through entities;
|
| · |
persons that actually or constructively own 10% or more of the total combined voting power of all classes of our voting stock or 10% or more of the total value of shares of all classes of our stock;
|
| · |
traders in securities that elect to apply a mark-to-market method of accounting, holders that hold our ordinary shares as part of a “hedge,” “straddle,” “conversion,” or other risk reduction transaction for U.S. federal income tax purposes; and
|
167
| · |
individuals who receive our ordinary shares upon the exercise of compensatory options or otherwise as compensation.
|
Moreover, no advance rulings have been or will be sought from the U.S. Internal Revenue Service, or IRS, regarding any matter discussed in this annual report, and counsel to Kenon has not rendered any opinion with respect to any of the U.S. federal income tax consequences relating to the transactions addressed herein. No assurance can be given that the IRS would not assert, or that a court would not sustain, a position contrary to any of the tax aspects set forth below.
HOLDERS AND PROSPECTIVE INVESTORS SHOULD CONSULT THEIR TAX ADVISORS REGARDING THE APPLICATION OF THE U.S. FEDERAL TAX RULES TO THEIR PARTICULAR CIRCUMSTANCES AS WELL AS THE STATE, LOCAL, NON-U.S. AND OTHER TAX CONSEQUENCES TO THEM OF THE OWNERSHIP AND DISPOSITION OF OUR ORDINARY SHARES.
For purposes of this summary, a “U.S. Holder” is a beneficial owner of our ordinary shares that is, for U.S. federal income tax purposes:
| · |
an individual who is a citizen or resident of the United States;
|
| · |
a corporation (or other entity taxable as a corporation for U.S. federal income tax purposes) created or organized in the United States or under the laws of the United States, any state thereof or the District of Columbia;
|
| · |
an estate, the income of which is subject to U.S. federal income taxation regardless of its source; or
|
| · |
a trust that (1) is subject to the primary supervision of a court within the United States and the control of one or more U.S. persons for all substantial decisions or (2) has a valid election in effect under applicable U.S. Treasury regulations to be treated as a U.S. person.
|
If a partnership (or other entity taxable as a partnership for U.S. federal income tax purposes) holds our ordinary shares, the tax treatment of a partner in such partnership will generally depend upon the status of the partner and the activities of the partnership. If you are a partner in a partnership holding our ordinary shares, you should consult your tax advisor.
Taxation of Dividends and Other Distributions on the Ordinary Shares
The gross amount of any distribution made to a U.S. Holder with respect to our ordinary shares, including the amount of any non-U.S. taxes withheld from the distribution, generally will be includible in income on the day on which the distribution is actually or constructively received by a U.S. Holder as dividend income to the extent the distribution is paid out of our current or accumulated earnings and profits as determined for U.S. federal income tax purposes. A distribution in excess of our current and accumulated earnings and profits (as determined for U.S. federal income tax purposes), including the amount of any non-U.S. taxes withheld from the distribution, will be treated as a non-taxable return of capital to the extent of the U.S. Holder’s adjusted basis in our ordinary shares and as a capital gain to the extent it exceeds the U.S. Holder’s basis. We do not expect to maintain calculations of our earnings and profits under U.S. federal income tax principles, therefore, U.S. Holders should expect that distributions generally will be treated as dividends for U.S. federal income tax purposes. Such dividends will not be eligible for the dividends-received deduction generally allowed to U.S. corporations.
Distributions treated as dividends that are received by individuals and other non-corporate U.S. Holders from “qualified foreign corporations” generally qualify for a reduced maximum tax rate so long as certain holding period and other requirements are met. Dividends paid on our ordinary shares, should qualify for the reduced rate if we are treated as a “qualified foreign corporation.” For this purpose, a qualified foreign corporation means any foreign corporation provided that: (i) the corporation was not, in the year prior to the year in which the dividend was paid, and is not, in the year in which the dividend is paid, a PFIC (as discussed below), (ii) certain holding period requirements are met and (iii) either (A) the corporation is eligible for the benefits of a comprehensive income tax treaty with the United States that the IRS has approved for the purposes of the qualified dividend rules or (B) the stock with respect to which such dividend was paid is readily tradable on an established securities market in the United States. The United States does not currently have a comprehensive income tax treaty with Singapore. However, the ordinary shares should be considered to be readily tradable on established securities markets in the United States if they are listed on the NYSE. Therefore, we expect that our ordinary shares should generally be considered to be readily tradable on an established securities market in the United States, and we expect that dividends with respect to such ordinary shares should qualify for the reduced rate. U.S. Holders are encouraged to consult their tax advisors regarding the availability of the lower rate for dividends paid with respect to our ordinary shares.
168
Dividends on our ordinary shares received by a U.S. Holder will generally be treated as foreign source income for U.S. foreign tax credit purposes. The rules with respect to foreign tax credits are complex and U.S. Holders should consult their tax advisors regarding the availability of the foreign tax credit in their particular circumstances.
Taxation of Dispositions of the Ordinary Shares
A U.S. Holder will recognize gain or loss on the sale or other taxable disposition of our ordinary shares in an amount equal to the difference between the amount realized on such sale or other taxable disposition and such U.S. Holder’s adjusted tax basis in our ordinary shares. Such gain or loss generally will be long-term capital gain (taxable at a reduced rate for non-corporate U.S. Holders) or loss if, on the date of sale or disposition, such ordinary shares were held by such U.S. Holder for more than one year. The deductibility of capital losses is subject to significant limitations. Any gain or loss recognized by a U.S. Holder generally will be treated as U.S. source gain or loss, as the case may be, for foreign tax credit purposes.
The amount realized on a sale or other taxable disposition of our ordinary shares in exchange for foreign currency generally will equal the U.S. Dollar value of the foreign currency at the spot exchange rate in effect on the date of sale or other taxable disposition or, if the ordinary shares are traded on an established securities market (such as the NYSE or the TASE), in the case of a cash method or electing accrual method U.S. Holder of our ordinary shares, the settlement date. A U.S. Holder will have a tax basis in the foreign currency received equal to the U.S. Dollar amount realized. Any gain or loss realized by a U.S. Holder on a subsequent conversion or other disposition of the foreign currency will be foreign currency gain or loss, which is treated as U.S. source ordinary income or loss for foreign tax credit purposes.
Passive Foreign Investment Company
In general, a non-U.S. corporation will be classified as a passive foreign investment company, or PFIC, for U.S. federal income tax purposes for any taxable year in which either (i) 75% or more of its gross income consists of certain types of “passive” income or (ii) 50% or more of the fair market value (determined on the basis of a quarterly average) of its assets produce or are held for the production of passive income. For this purpose, cash is categorized as a passive asset and our unbooked intangibles will be taken into account and generally treated as non-passive assets. We will be treated as owning our proportionate share of the assets and earning our proportionate share of the income of any other corporation in which we own, directly or indirectly, 25% or more (by value) of the shares.
We do not believe that we were a PFIC for the taxable year ended December 31, 2017, but we may be a PFIC for our current, and any future, taxable year. Our status as a PFIC in any year depends on our assets and activities in that year. The sale of the Inkia Business and the investment in Qoros by the New Qoros Investor (which reduced our equity interest in Qoros to 24%) each may increase the value of our assets that produce, or are held for the production of, passive income and/or our passive income and result in us becoming a PFIC for our current, and any future, taxable year. The determination of PFIC status, however, is factual in nature and generally cannot be made until the close of the taxable year, and there can be no assurance that we will not be considered a PFIC for any taxable year.
If we are classified as a PFIC for any taxable year during which a U.S. Holder holds our ordinary shares, the U.S. Holder will generally be subject to imputed interest taxes, characterization of any gain from the sale or exchange of our ordinary shares as ordinary income, and other disadvantageous tax treatment with respect to our ordinary shares unless the U.S. Holder makes a mark-to-market election (as described below). Further, if we are classified as a PFIC for any taxable year during which a U.S. Holder holds our ordinary shares and any of our non-U.S. subsidiaries is also a PFIC, such U.S. Holder would be treated as owning a proportionate amount (by value) of the shares of each such non-U.S. subsidiary classified as a PFIC (each such subsidiary, a lower tier PFIC) for purposes of the application of these rules. U.S. Holders should consult their tax advisors regarding the application of the PFIC rules to any of our subsidiaries.
169
As an alternative to the foregoing rules, a U.S. Holder of “marketable stock” in a PFIC may make a mark-to-market election. A mark-to-market election may be made with respect to our ordinary shares, provided they are actively traded, defined for this purpose as being traded on a “qualified exchange,” other than in de minimis quantities, on at least 15 days during each calendar quarter. We anticipate that our ordinary shares should qualify as being actively traded, but no assurances may be given in this regard. If a U.S. Holder of our ordinary shares makes this election, the U.S. Holder will generally (i) include as income for each taxable year the excess, if any, of the fair market value of our ordinary shares held at the end of the taxable year over the adjusted tax basis of such ordinary shares and (ii) deduct as a loss the excess, if any, of the adjusted tax basis of our ordinary shares over the fair market value of such ordinary shares held at the end of the taxable year, but only to the extent of the net amount previously included in income as a result of the mark-to-market election. The U.S. Holder’s adjusted tax basis in our ordinary shares would be adjusted to reflect any income or loss resulting from the mark-to-market election. In addition, any gain such U.S. Holder recognizes upon the sale or other taxable disposition of our ordinary shares will be treated as ordinary income and any loss will be treated as ordinary loss, but only to the extent of the net amount previously included in income as a result of the mark-to-market election. If a U.S. Holder makes a mark-to-market election in respect of a corporation classified as a PFIC and such corporation ceases to be classified as a PFIC, the U.S. Holder will not be required to take into account the gain or loss described above during any period that such corporation is not classified as a PFIC. In the case of a U.S. Holder who has held our ordinary shares during any taxable year in respect of which we were classified as a PFIC and continues to hold such ordinary shares (or any portion thereof) and has not previously made a mark-to-market election, and who is considering making a mark-to-market election, special tax rules may apply relating to purging the PFIC taint of such ordinary shares. Because a mark-to-market election cannot be made for any lower tier PFICs that we may own, a U.S. Holder may continue to be subject to the PFIC rules with respect to such U.S. Holder’s indirect interest in any investments held by us that are treated as an equity interest in a PFIC for U.S. federal income tax purposes.
We do not intend to provide the information necessary for U.S. Holders of our ordinary shares to make qualified electing fund elections, which, if available, would result in tax treatment different from the general tax treatment for PFICs described above.
If a U.S. Holder owns our ordinary shares during any taxable year that we are a PFIC, such U.S. Holder may be subject to certain reporting obligations with respect to our ordinary shares, including reporting on IRS Form 8621.
Each U.S. Holder should consult its tax adviser concerning the U.S. federal income tax consequences of purchasing, holding, and disposing of our ordinary shares, including the possibility of making a mark-to-market election, if we are or become classified as a PFIC.
Material Singapore Tax Considerations
The following discussion is a summary of Singapore income tax, goods and services tax, or GST, stamp duty and estate duty considerations relevant to the acquisition, ownership and disposition of our ordinary shares by an investor who is not tax resident or domiciled in Singapore and who does not carry on business or otherwise have a presence in Singapore. The statements made herein regarding taxation are general in nature and based upon certain aspects of the current tax laws of Singapore and administrative guidelines issued by the relevant authorities in force as of the date hereof and are subject to any changes in such laws or administrative guidelines or the interpretation of such laws or guidelines occurring after such date, which changes could be made on a retrospective basis. The statements made herein do not purport to be a comprehensive or exhaustive description of all of the tax considerations that may be relevant to a decision to acquire, own or dispose of our ordinary shares and do not purport to deal with the tax consequences applicable to all categories of investors, some of which (such as dealers in securities) may be subject to special rules. Prospective shareholders are advised to consult their tax advisers as to the Singapore or other tax consequences of the acquisition, ownership or disposal of our ordinary shares, taking into account their own particular circumstances. The statements below are based upon the assumption that Kenon is tax resident in Singapore for Singapore income tax purposes. It is emphasized that neither Kenon nor any other persons involved in this annual report accepts responsibility for any tax effects or liabilities resulting from the acquisition, holding or disposal of our ordinary shares.
170
Income Taxation Under Singapore Law
Dividends or Other Distributions with Respect to Ordinary Shares
Under the one-tier corporate tax system which currently applies to all Singapore tax resident companies, tax on corporate profits is final, and dividends paid by a Singapore tax resident company will be tax exempt in the hands of a shareholder, whether or not the shareholder is a company or an individual and whether or not the shareholder is a Singapore tax resident.
Capital Gains upon Disposition of Ordinary Shares
Under current Singapore tax laws, there is no tax on capital gains. There are no specific laws or regulations which deal with the characterization of whether a gain is income or capital in nature. Gains arising from the disposal of our ordinary shares may be construed to be of an income nature and subject to Singapore income tax, if they arise from activities which the Inland Revenue Authority of Singapore regards as the carrying on of a trade or business in Singapore. However, under Singapore tax laws, any gains derived by a divesting company from its disposal of ordinary shares in an investee company between June 1, 2012 and May 31, 2022 are generally not taxable if immediately prior to the date of the relevant disposal, the investing company has held at least 20% of the ordinary shares in the investee company for a continuous period of at least 24 months.
Goods and Services Tax
The issue or transfer of ownership of our ordinary shares should be exempt from Singapore GST. Hence, the holders would not incur any GST on the subscription or subsequent transfer of the shares.
Stamp Duty
Where our ordinary shares evidenced in certificated forms are acquired in Singapore, stamp duty is payable on the agreement or instrument of their transfer at the rate of 0.2% of the consideration for or market value of our ordinary shares, whichever is higher.
Where an agreement or instrument of transfer is executed outside Singapore or no agreement and instrument of transfer is executed, no stamp duty is payable on the acquisition of our ordinary shares. However, stamp duty may be payable if the agreement or instrument of transfer is executed outside Singapore and is received in Singapore. The stamp duty is borne by the purchaser unless there is an agreement to the contrary.
On the basis that any agreements and transfer instruments in respect of our ordinary shares traded on the NYSE and the TASE are executed outside Singapore through our transfer agent and share registrar in the United States for registration in our branch share register maintained in the United States (without any agreements or transfer instruments being received in Singapore), no stamp duty should be payable in Singapore on such transfers.
Tax Treaties Regarding Withholding Taxes
There is no comprehensive avoidance of double taxation agreement between the United States and Singapore which applies to withholding taxes on dividends or capital gains.
F.
Dividends and Paying Agents
Not applicable.
G.
Statement by Experts
Not applicable.
H.
Documents on Display
We are subject to the information reporting requirements of the Exchange Act applicable to foreign private issuers, and under those requirements will file reports with the SEC. Those other reports or other information and this annual report may be inspected without charge at 1 Temasek Avenue #36-01, Millenia Tower, Singapore 039192 and inspected and copied at the public reference facilities of the SEC located at 100 F Street, N.E., Washington, D.C. 20549. You may also obtain copies of the documents at prescribed rates by writing to the Public Reference Section of the SEC at 100 F Street, N.E., Washington, DC 20549. Please call the SEC at 1-800-SEC-0330 for further information on the public reference room. The SEC also maintains a website at http://www.sec.gov from which certain filings may be accessed.
171
As a foreign private issuer, we will be exempt from the rules under the Exchange Act related to the furnishing and content of proxy statements, and our officers, directors and principal shareholders will be exempt from the reporting and short-swing profit recovery provisions contained in Section 16 of the Exchange Act. In addition, we will not be required under the Exchange Act to file annual, quarterly and current reports and financial statements with the SEC as frequently or as promptly as United States companies whose securities are registered under the Exchange Act. However, for so long as we are listed on the NYSE, or any other U.S. exchange, and are registered with the SEC, we will file with the SEC, within 120 days after the end of each fiscal year, or such applicable time as required by the SEC, an annual report on Form 20-F containing financial statements audited by an independent registered public accounting firm. We also submit to the SEC on Form 6-K the interim financial information that we publish.
We maintain a corporate website at http://www.kenon-holdings.com. Information contained on, or that can be accessed through, our website does not constitute a part of this annual report on Form 20-F. We have included our website address in this annual report solely as an inactive textual reference.
I.
Subsidiary Information
Not applicable.
Our multinational operations expose us to a variety of market risks, which embody the potential for changes in the fair value of the financial instruments or the cash flows deriving from them. Our risk management policies and those of each of our businesses seek to limit the adverse effects of these market risks on the financial performance of each of our businesses and, consequently, on our consolidated financial performance. Each of our businesses bear responsibility for the establishment and oversight of their financial risk management framework and have adopted individualized risk management policies to address those risks specific to their operations.
Our primary market risk exposures are to:
| · |
currency risk, as a result of changes in the rates of exchange of various foreign currencies (in particular, the Euro and the New Israeli Shekel) in relation to the U.S. Dollar, our functional currency and the currency against which we measure our exposure;
|
| · |
index risk, as a result of changes in the Consumer Price Index;
|
| · |
interest rate risk, as a result of changes in the market interest rates affecting certain of our businesses’ issuance of debt and related financial instruments; and
|
| · |
price risk, as a result of changes in market prices, such as the price of certain commodities (e.g., natural gas and heavy fuel oil).
|
For further information on our market risks and the sensitivity analyses of these risks, see Note 3
2
—Financial Instruments to our financial statements included in this annual report.
A.
Debt Securities
Not applicable.
172
B.
Warrants and Rights
Not applicable.
C.
Other Securities
Not applicable.
D.
American Depositary Shares
Not applicable.
None.
None.
Evaluation of Disclosure Controls and Procedures
Our management, with the participation of our co-chief executive officers and chief financial officer, has performed an evaluation of the effectiveness of our disclosure controls and procedures (as defined in Rule 13a-15(e) under the Exchange Act) as of the end of the period covered by this annual report, as required by Rule 13a-15(b) under the Exchange Act. Based upon this evaluation, our management, with the participation of our co-chief executive officers and chief financial officer, has concluded that, as of the end of the period covered by this annual report, our disclosure controls and procedures were effective in ensuring that the information required to be disclosed by us in the reports that we file or submit under the Exchange Act is recorded, processed, summarized and reported within the time periods specified in by the SEC’s rules and forms, and that the information required to be disclosed by us in the reports that we file or submit under the Exchange Act is accumulated and communicated to our management, including our co-chief executive officers and chief financial officer, as appropriate, to allow timely decisions regarding required disclosure.
Management’s Report on Internal Control over Financial Reporting
Our management is responsible for establishing and maintaining adequate “internal control over financial reporting,” as defined in Rules 13a-15(f) and 15d-15(f) under the Exchange Act. These rules define internal control over financial reporting as a process designed by, or under the supervision of, a company’s co-chief executive officers and chief financial officer and effected by our board of directors, management and other personnel, to provide reasonable assurance regarding the reliability of financial reporting and the preparation of financial statements for external purposes in accordance with generally accepted accounting principles and includes those policies and procedures that (1) pertain to the maintenance of records that, in reasonable detail, accurately and fairly reflect the transactions and dispositions of the assets of the company; (2) provide reasonable assurance that transactions are recorded as necessary to permit preparation of financial statements in accordance with generally accepted accounting principles, and that receipts and expenditures of the company are being made only in accordance with authorizations of management and directors of the company; and (3) provide reasonable assurance regarding prevention or timely detection of unauthorized acquisition, use, or disposition of the company’s assets that could have a material effect on the financial statements.
In December 2017, our wholly-owned subsidiary Inkia completed the sale of the Inkia Business, and, as a result, our management has excluded the Inkia Business from its assessment of internal control over financial reporting as of December 31, 2017.
173
Our management has assessed the design and operating effectiveness of our internal control over financial reporting as of December 31, 2017. This assessment was performed under the direction and supervision of our co-chief executive officers and chief financial officer, and based on criteria established in Internal Control—Integrated Framework (2013) issued by the Committee of Sponsoring Organizations of the Treadway Commission. Based on that evaluation, management concluded that as of December 31, 2017, our internal control over financial reporting was effective.
The effectiveness of our internal control over financial reporting as of December 31, 2017 has been audited by our independent registered public accounting firm and their report thereon is included elsewhere in this annual report.
Changes in Internal Control over Financial Reporting
During the year ended December 31, 2017, there have been no changes in our internal control over financial reporting that have materially affected, or are reasonably likely to materially affect, our internal control over financial reporting. In December 2017, our wholly-owned subsidiary Inkia completed the sale of the Inkia Business, and, as a result, our management has excluded the Inkia Business from its assessment of internal control over financial reporting as of December 31, 2017.
Inherent Limitations of Disclosure Controls and Procedures in Internal Control over Financial Reporting
It should be noted that any system of controls, however well-designed and operated, can provide only reasonable, and not absolute, assurance that the objectives of the system will be met. In addition, the design of any control system is based in part upon certain assumptions about the likelihood of future events. Projections regarding the effectiveness of a system of controls in future periods are subject to the risk that such controls may become inadequate because of changes in conditions or deterioration in the degree of compliance with the policies or procedures.
Our board of directors has determined that Mr. Laurence N. Charney is an “audit committee financial expert” as defined in Item 16A of Form 20-F under the Exchange Act. Our board of directors has also determined that Mr. Laurence N. Charney satisfies the NYSE’s listed company “independence” requirements.
We have adopted a Code of Ethics that applies to all our employees, officers and directors, including our co-chief executive officers and our chief financial officer. Our Code of Conduct is available on our website at www.kenon-holdings.com.
KPMG LLP, a member firm of KPMG International, is our independent registered public accounting firm for the audits of the years ending December 31, 2017 and 2016.
Our audit committee charter requires that all audit and non-audit services provided by our independent auditors are pre-approved by our audit committee.
174
The following table sets forth the aggregate fees by categories specified below in connection with certain professional services rendered by KPMG LLP, and other member firms within the KPMG network, for the years ended December 31, 2017 and 2016.
|
Year ended
December 31, |
||||||||
|
2017
|
2016
|
|||||||
|
(in thousands of USD)
|
||||||||
|
Audit Fees
1
|
$
|
5,170
|
$
|
4,064
|
||||
|
Audit-Related Fees
|
2
|
1,387
|
2
|
|||||
|
Tax Fees
3
|
974
|
144
|
||||||
|
All Other Fees
|
-
|
26
|
||||||
|
Total
|
$
|
6,146
|
$
|
5,621
|
||||
| (1) |
Includes fees billed or accrued for professional services rendered by the principal accountant, and member firms in their respective network, for the audit of our annual financial statements, and those of our consolidated subsidiaries, as well as additional services that are normally provided by the accountant in connection with statutory and regulatory filings or engagements, except for those not required by statute or regulation.
|
| (2) |
The audit-related fees for the year ended December 31, 2016 substantially reflect fees billed or accrued in connection with IC Power’s filing of a registration statement on Form F-1.
|
| (3) |
Tax fees consist of fees for professional services rendered during the fiscal year by the principal accountant mainly for tax compliance and assistance with tax audits and appeals.
|
None.
None.
None.
There are no significant differences between Kenon's corporate governance practices and those followed by domestic companies under the listing standards of the NYSE. As a foreign private issuer, we are permitted to follow home country practice in lieu of the requirement to have a nominating and corporate governance committee comprised entirely of independent directors. One of the members of our nominating and corporate governance committee is non-independent under NYSE standards and accordingly we rely on the NYSE exemption for foreign private issuers
in this respect
.
Not applicable.
Not applicable.
The financial statements and the related notes required by this Item 18 are included in this annual report beginning on page F-1.
175
Index to Exhibits
|
101.INS*
|
XBRL Instance Document
|
|
|
101.SCH*
|
XBRL Taxonomy Extension Schema Document
|
|
|
101.CAL*
|
XBRL Taxonomy Extension Calculation Linkbase Document
|
|
|
101.DEF*
|
XBRL Taxonomy Extension Definition Linkbase Document
|
|
|
101.LAB*
|
XBRL Taxonomy Extension Label Linkbase Document
|
|
|
101.PRE*
|
XBRL Taxonomy Extension Presentation Linkbase Document
|
*
Filed herewith.
†
Portions of this exhibit have been omitted pursuant to a request for confidential treatment under Rule 24b-2 of the Exchange Act. Omitted information has been filed separately with the SEC.
178
Kenon Holdings Ltd and subsidiaries
Consolidated Financial Statements
As at December 31, 2017, 2016 and 2015 and for the years then ended
Kenon Holdings Ltd
Consolidated Financial Statements
as at December 31, 2017, 2016 and 2015 and for the years then ended
Contents
|
|
Page
|
|
F-1 – F-6
|
|
|
F-7 – F-8
|
|
|
F-9
|
|
|
F-10
|
|
|
F-11 – F-13
|
|
|
F-14 – F-15
|
|
|
F-16 – F-98
|
|
Qoros Automotive Co., Ltd.
Financial Statements Filed Pursuant to Rule 3-09 of Regulation S-X
Consolidated Financial Statements for the Year Ended December 31, 2017
|
|
F- 100 – F - 101
|
|
|
F- 102 – F - 103
|
|
|
|
|
|
F - 104
|
|
|
|
|
|
F - 105 – F - 106
|
|
|
F - 107 – F - 109
|
|
|
|
|
|
F - 110 – F - 156
|

|
KPMG LLP
|
Telephone
|
+65 6213 3388
|
|
16 Raffles Quay #22-00
|
Fax
|
+65 6225 0984
|
|
|
Hong Leong Building
|
Internet
|
www.kpmg.com.sg
|
|
|
Singapore 048581
|
Report of Independent Registered Public Accounting Firm
To the Stockholders and Board of Directors
Kenon Holdings Ltd.:
Kenon Holdings Ltd.:
Opinion on the Consolidated Financial Statements
We have audited the accompanying consolidated statements of financial position of Kenon Holdings Ltd. (the ‘Company’) and subsidiaries as of December 31, 2017 and 2016, and the related consolidated statements of profit and loss, other comprehensive income (loss), changes in equity, and cash flows for each of the years in the three-year period ended December 31, 2017, and the related notes (collectively, the “consolidated financial statements”). In our opinion, based on our audits and the reports of the other auditors, the consolidated financial statements present fairly, in all material respects, the financial position of the Company and subsidiaries as of December 31, 2017 and 2016. and the results of their operations and their cash flows for each of the years in the three-year period ended December 31, 2017, in conformity with International Financial Reporting Standards as issued by the International Accounting Standards Board.
We did not audit the combined financial statements of certain discontinued operations relating to Distribuidora de Electricidad de Occidente. S. A. (‘DEOCSA’) and Distribuidora de Electricidad de Oriente, S. A. (‘DEORSA’). which statements reflect total assets constituting approximately S844 million of consolidated total assets as of December 31, 2016, and constituting approximately $16 million and $36 million of both profit for the year from discontinued operations and profit/(loss) for the year, for the years ended December 31, 2017 and 2016. respectively. Those combined financial statements were audited by other auditors whose reports have been furnished to us, and our opinion, insofar as it relates to the amounts included for DEOCSA and DEORSA, is based solely on the reports of the other auditors.
We also have audited, in accordance with the standards of the Public Company Accounting Oversight Board (United States) (‘PCAOB’), the Company’s internal control over financial reporting as of December 31, 2017, based on criteria established in
Internal Control - Integrated Framework (2013)
issued by the Committee of Sponsoring Organizations of the Treadway Commission, and our report dated April 9, 2018 expressed an unqualified opinion on the effectiveness of the Company’s internal control over financial reporting.
Basis for Opinion
These consolidated financial statements are the responsibility of the Company’s management. Our responsibility is to express an opinion on these consolidated financial statements based on our audits. We are a public accounting firm registered with the PCAOB and are required to be independent with respect to the Company in accordance with the U.S. federal securities laws and the applicable rules and regulations of the Securities and Exchange Commission and the PCAOB.
|
|
KPMG LLP (Registration No. T08LL1267L), an accounting
limited liability partnership registered in Singapore under the
Limited Liability Partnership Act (Chapter 163A) and a member firm
of the KPMG network of independent member firms
affiliated with
KPMG International Cooperative (“KPMG International”), a Swiss entity.
|
|
F - 1
We conducted our audits in accordance with the standards of the PCAOB. Those standards require that we plan and perform the audit to obtain reasonable assurance about whether the consolidated financial statements are free of material misstatement, whether due to error or fraud. Our audits included performing procedures to assess the risks of material misstatement of the consolidated financial statements, whether due to error or fraud, and performing procedures that respond to those risks. Such procedures included examining, on a test basis, evidence regarding the amounts and disclosures in the consolidated financial statements. Our audits also included evaluating the accounting policies used and significant estimates made by management, as well as evaluating the overall presentation of the consolidated financial statements. We believe that our audits provide a reasonable basis for our opinion.

KPMG LLP
Public Accountants and
Chartered Accountants
Public Accountants and
Chartered Accountants
We have served as the Company’s auditor since 2015.
Singapore
April 9, 2018
F - 2
|
|
KPMG LLP
|
Telephone
|
+65 6213 3388
|
|
16 Raffles Quay #22-00
|
Fax
|
+65 6225 0984
|
|
|
Hong Leong Building
|
Internet
|
www.kpmg.com.sg
|
|
|
Singapore 048581
|
Report of Independent Registered Public Accounting Firm
To the Stockholders and Board of Directors
Kenon Holdings Ltd.:
Opinion on Internal Control Over Financial Reporting
We have audited Kenon Holdings Ltd. (the ‘Company’) and subsidiaries’ internal control over financial reporting as of December 31, 2017, based on criteria established in
Internal Control – Integrated Framework (2013)
issued by the Committee of Sponsoring Organizations of the Treadway Commission. In our opinion, the Company maintained, in all material respects, effective internal control over financial reporting as of December 31, 2017, based on criteria established in
Internal Control – Integrated Framework (2013)
issued by the Committee of Sponsoring Organizations of the Treadway Commission.
We also have audited, in accordance with the standards of the Public Company Accounting Oversight Board (United States) (‘PCAOB’), the consolidated statements of financial position of the Company and subsidiaries as of December 31, 2017 and 2016, and the related consolidated statements of profit and loss, other comprehensive income (loss), changes in equity, and cash flows for each of the years in the three-year period ended December 31, 2017, and the related notes (collectively, the ‘consolidated financial statements’), and our report dated April 9, 2018 expressed an unqualified opinion on those consolidated financial statements.
Basis for Opinion
The Company’s management is responsible for maintaining effective internal control over financial reporting and for its assessment of the effectiveness of internal control over financial reporting, included in the accompanying Management’s Report on Internal Control Over Financial Reporting. Our responsibility is to express an opinion on the Company’s internal control over financial reporting based on our audit. We are a public accounting firm registered with the PCAOB and are required to be independent with respect to the Company in accordance with the U.S. federal securities laws and the applicable rules and regulations of the Securities and Exchange Commission and the PCAOB.
We conducted our audit in accordance with the standards of the PCAOB. Those standards require that we plan and perform the audit to obtain reasonable assurance about whether effective internal control over financial reporting was maintained in all material respects. Our audit of internal control over financial reporting included obtaining an understanding of internal control over financial reporting, assessing the risk that a material weakness exists, and testing and evaluating the design and operating effectiveness of internal control based on the assessed risk. Our audit also included performing such other procedures as we considered necessary in the circumstances. We believe that our audit provides a reasonable basis for our opinion.
KPMG LLP (Registration No. T08LL1267L), an accounting limited liability partnership registered in Singapore under the Limited Liability Partnership Act (Chapter 163A) and a member firm of the KPMG network of independent member firms affiliated with KPMG International Cooperative (“KPMG International”), a Swiss entity.
F - 3
Definition and Limitations of Internal Control Over Financial Reporting
A company’s internal control over financial reporting is a process designed to provide reasonable assurance regarding the reliability of financial reporting and the preparation of financial statements for external purposes in accordance with generally accepted accounting principles. A company’s internal control over financial reporting includes those policies and procedures that (1) pertain to the maintenance of records that, in reasonable detail, accurately and fairly reflect the transactions and dispositions of the assets of the company; (2) provide reasonable assurance that transactions are recorded as necessary to permit preparation of financial statements in accordance with generally accepted accounting principles, and that receipts and expenditures of the company are being made only in accordance with authorizations of management and directors of the company; and (3) provide reasonable assurance regarding prevention or timely detection of unauthorized acquisition, use or disposition of the company’s assets that could have a material effect on the financial statements.
Because of its inherent limitations, internal control over financial reporting may not prevent or detect misstatements. Also, projections of any evaluation of effectiveness to future periods are subject to the risk that controls may become inadequate because of changes in conditions, or that the degree of compliance with the policies or procedures may deteriorate.
KPMG LLP
Public Accountants and
Chartered Accountants
Public Accountants and
Chartered Accountants
Singapore
April 9, 2018
April 9, 2018
F - 4

|
Deloitte, Inc.
|
|
Contadores Públicos Autorizados
RUC 16292-152-155203 D.V. 65 Torre Banco Panamá, piso 12 Avenida Boulevard y la Rotonda
Costa del Este, Panamá
Apartado 0816-01558 Panamá, Rep. de Panamá |
|
|
Teléfono: (507) 303-4100
Fax: (507) 269-2386 infopanama@deloitte.com www.deloitte.com/pa |
REPORT OF INDEPENDENT REGISTERED PUBLIC ACCOUNTING FIRM
To the Board of Directors and Shareholders of
Distribuidora de Electricidad de Occidente, S.A. and
Distribuidora de Electricidad de Oriente, S.A.
(Guatemalan Entities)
Distribuidora de Electricidad de Occidente, S.A. and
Distribuidora de Electricidad de Oriente, S.A.
(Guatemalan Entities)
Opinion on the Combined Financial Statements
We have audited the combined statement of financial position of Distribuidora de Electricidad de Occidente, S.A. (DEOCSA) and Distribuidora de Electricidad de Oriente, S.A. (DEORSA, and together with DEOCSA, the “Combined Entities”) as of December 31, 2017, and 2016 and the related combined statements of profit or loss and other comprehensive income, changes in shareholders’ equity, and cash flows for each of the two years in the period ended December 31, 2017 (not presented herein) (collectively referred to as the “combined financial statements”). In our opinion, the combined financial statements present fairly, in all material respects, the financial position of the Combined Entities as of December 31, 2017 and 2016, and the combined results of their operations and their cash flows for each of the the two years in the period ended December 31, 2017, in conformity with International Financial Reporting Standards as issued by the International Accounting Standards Board.
Basis for Opinion
These combined financial statements are the responsibility of the Combined Entities’ management. Our responsibility is to express an opinion on the Combined Entities’ combined financial statements based on our audit. We are a public accounting firm registered with the Public Company Accounting Oversight Board (United States) (PCAOB) and are required to be independent with respect to the Combined Entities in accordance with the U. S. federal securities laws and the applicable rules and regulations of the Securities and Exchange Commission and the PCAOB.
We conducted our audits in accordance with the standards of the PCAOB. Those standards require that we plan and perform the audit to obtain reasonable assurance about whether the combined financial statements are free of material misstatement, whether due to error or fraud. The Combined Entities are not required to have, nor were we engaged to perform, an audit of its internal control over financial reporting. As part of our audit, we are required to obtain an understanding of internal control over financial reporting but not for the purpose of expressing an opinion on the effectiveness of the Combined Entities’ internal control over financial reporting. Accordingly, we express no such opinion.
Our audits included performing procedures to assess the risks of material misstatement of the combined financial statements, whether due to error or fraud, and performing procedures that respond to those risks. Such procedures included examining, on a test basis, evidence regarding the amounts and disclosures in the combined financial statements. Our audits also included evaluating the accounting principles used and significant estimates made by management, as well as evaluating the overall presentation of the combined financial statements. We believe that our audits provide a reasonable basis for our opinion.
|
Deloitte LATCO
|
|
|
Firma miembro de
|
|
|
Deloitte Touche Tohmatsu Limited
|
F - 5

Emphasis of a Matter
As discussed in Note 30c of the Combined Entities’ combined financial statements, in 2011, the previous owners of DEORSA and DEOCSA acquired the companies through a leveraged buy-out transaction. Years after the transaction, the Guatemalan Tax Authority (Superintendencia de Administración Tributaria, or the “SAT”) raised questions concerning tax deductions for interest expenses and amortization of goodwill that derived from that transaction. This culminated in the issuance in February 2015 of two binding tax opinions, one for DEOCSA and another for DEORSA (the “Binding Opinions”) addressing the deductions. The government of Guatemala changed in January 2016. After the new government took power, in July 2016, the SAT filed a complaint against DEORSA and DEOCSA (the “Complaint”) in disregard of its own conclusions stated in the Binding Opinions, which Opinions remain in force as of this date. The Complaint requests the payment of alleged back taxes, interest, and fines in relation to tax years 2011 and 2012. On August 9, 2016, the court hearing the Complaint ordered the Combined Entities to pay Q.130,499 thousand (US$17,171 thousand) in alleged back taxes immediately, plus interest and fines within 60 days following the court order, as a condition to lift an order freezing the bank accounts of the Combined Entities. Pursuant to this and another court order of 12 December 2016, on August 10, 2016, the Combined Entities paid Q. 130,499 thousand (US$17,171 thousand) to the SAT corresponding to the alleged back taxes, and, on December 13, 2016, they paid Q192,974 thousand (US$25,721 thousand) corresponding to the alleged fines and interest. Due to the actions of the government and in order to avoid the initiation of complaints concerning tax years 2013, 2014, and 2015, and the corresponding imposition of further fines and interest, the Combined Entities followed the instructions of the SAT and paid the alleged back taxes and interest for those years in the following manner: on 9 August 2016, the Combined Entities paid a total of Q. 137,505 thousand (US$18,093 thousand) for the years 2014 and 2015; and on 19 August 2016, they paid a total of US$13,189 thousand (Q.100,236 thousand) for the year 2013. In addition, during 2017 and 2016 the Combined Entities made additional payments of income tax in advance by Q.55,535 thousand (US$7,527 thousand) and Q.40,729 thousand (US$5,393 thousand), respectively, also considering non-deductible the items related to goodwill’s amortization and interests (until May 2017) that were subject to the tax claim. Finally, in January 2018 a new payment of Q.9,545 thousand (US$1,298 thousand) was made. The abovementioned measures were adopted in order not to put at risk the continuing operation and prevent irreversible damage to the Combined Entities. All payments were made under protest and subject to a broad reservation of rights, including but not limited to seeking restitution of such payments. The Combined Entities and their legal and tax advisors are of the view that the deductions for interest expenses and amortization of goodwill are legitimate tax deductions and are confident of their position under applicable legal frameworks. The Combined Entities are defending against the SAT Complaint and considering all available remedies with respect to this matter. Hence, the Combined Entities’ Management considers, based on the opinion of its tax and legal advisors that the receivable generated by these payments is more likely than not to be recovered as a result of the final outcome of this claim and of the other recourses to be initiated by the Combined Entities. As of December 31, 2017 and 2016, the total tax claim amounts to US$89,516 thousand (Q657,477 thousand) and US$80,023 thousand (Q.601,943 thousand), respectively. This tax claim has been recorded as Non-current tax receivable.
/s/ Deloitte
Panama, Republic of Panama
March 29, 2018
We have served as the Combined Entities’ auditor since 2016.
March 29, 2018
We have served as the Combined Entities’ auditor since 2016.
F - 6
Kenon Holdings Ltd and subsidiaries
|
As at December 31
|
||||||||||||
|
2017
|
2016
|
|||||||||||
|
Note
|
$ thousands
|
|||||||||||
|
Current assets
|
||||||||||||
|
Cash and cash equivalents
|
5
|
1,417,388
|
326,635
|
|||||||||
|
Short-term investments and deposits
|
6
|
7,144
|
89,545
|
|||||||||
|
Trade receivables, net
|
7
|
44,137
|
284,532
|
|||||||||
|
Other current assets, including derivatives
|
8
|
35,752
|
49,773
|
|||||||||
|
Income tax receivable
|
220
|
11,459
|
||||||||||
|
Inventories
|
9
|
-
|
91,659
|
|||||||||
|
Total current assets
|
1,504,641
|
853,603
|
||||||||||
|
Non-current assets
|
||||||||||||
|
Investments in associated companies
|
10
|
121,694
|
208,233
|
|||||||||
|
Deposits, loans and other receivables, including derivative instruments
|
12
|
106
,717
|
176,775
|
|||||||||
|
Deferred payment receivable
|
13
|
175,000
|
-
|
|||||||||
|
Deferred taxes, net
|
27
|
-
|
25,104
|
|||||||||
|
Property, plant and equipment, net
|
14
|
616,164
|
3,497,300
|
|||||||||
|
Goodwill and intangible assets, net
|
15
|
1,641
|
376,778
|
|||||||||
|
Total non-current assets
|
1,021,216
|
4,284,190
|
||||||||||
|
Total assets
|
2,525,857
|
5,137,793
|
||||||||||
The accompanying notes are an integral part of the consolidated financial statements.
F - 7
Kenon Holdings Ltd and subsidiaries
Consolidated Statements of Financial Position as at December 31, 2017 and 2016, continued
|
As at December 31
|
||||||||||||
|
2017
|
2016
|
|||||||||||
|
Note
|
$ thousands
|
|||||||||||
|
Current liabilities
|
||||||||||||
|
Loans and debentures
|
16
|
447,956
|
482,813
|
|||||||||
|
Trade payables
|
17
|
58,895
|
285,612
|
|||||||||
|
Other payables, including derivative instruments
|
18
|
82,522
|
91,303
|
|||||||||
|
Guarantee deposits from customers
|
19
|
-
|
56,833
|
|||||||||
|
Provisions
|
20
|
44,342
|
119,531
|
|||||||||
|
Income tax payable
|
172,607
|
8,671
|
||||||||||
|
Total current liabilities
|
806,322
|
1,044,763
|
||||||||||
|
Non-current liabilities
|
||||||||||||
|
Loans, excluding current portion
|
16
|
503,785
|
1,972,926
|
|||||||||
|
Debentures, excluding current portion
|
16
|
84,758
|
856,670
|
|||||||||
|
Derivative instruments
|
18
|
-
|
44,637
|
|||||||||
|
Deferred taxes, net
|
27
|
52,753
|
225,354
|
|||||||||
|
Trade payables
|
17
|
-
|
44,057
|
|||||||||
|
Income tax payable
|
26,811
|
-
|
||||||||||
|
Other non-current liabilities
|
81
|
55,182
|
||||||||||
|
Total non-current liabilities
|
668,188
|
3,198,826
|
||||||||||
|
Total liabilities
|
1,474,510
|
4,243,589
|
||||||||||
|
Equity
|
22
|
|||||||||||
|
Share capital
|
1,267,210
|
1,267,450
|
||||||||||
|
Shareholder transaction reserve
|
3,540
|
26,559
|
||||||||||
|
Translation reserve
|
(1,592
|
)
|
(21,745
|
)
|
||||||||
|
Capital reserve
|
19,297
|
11,575
|
||||||||||
|
Accumulated deficit
|
(305,337
|
)
|
(602,598
|
)
|
||||||||
|
Equity attributable to owners of the Company
|
983,118
|
681,241
|
||||||||||
|
Non-controlling interests
|
68,229
|
212,963
|
||||||||||
|
Total equity
|
1,051,347
|
894,204
|
||||||||||
|
Total liabilities and equity
|
2,525,857
|
5,137,793
|
||||||||||
|
/s/ Cyril Pierre-Jean Ducau
|
/s/ Barak Cohen
|
/s/ Robert Rosen
|
/s/ Mark Hasson
|
|||
|
Cyril Pierre-Jean Ducau
|
Barak Cohen
|
Robert Rosen
|
Mark Hasson
|
|||
|
Chairman of Board of Directors
|
Co-CEO
|
Co-CEO
|
CFO
|
Approval date of the consolidated financial statements:
April 9
, 2018
The accompanying notes are an integral part of the consolidated financial statements.
F - 8
Kenon Holdings Ltd and subsidiaries
|
For the year ended December 31
|
||||||||||||||||
|
2017
|
2016
|
*
|
2015
|
*
|
||||||||||||
|
Note
|
$ thousands
|
|||||||||||||||
|
Continuing Operations
|
||||||||||||||||
|
Revenue
|
365,704
|
324,253
|
325,899
|
|||||||||||||
|
Cost of sales and services (excluding depreciation)
|
24
|
(267,136
|
)
|
(251,666
|
)
|
(244,816
|
)
|
|||||||||
|
Depreciation
|
(30,102
|
)
|
(26,697
|
)
|
(25,435
|
)
|
||||||||||
|
Gross profit
|
68,466
|
45,890
|
55,648
|
|||||||||||||
|
Selling, general and administrative expenses
|
25
|
(56,292
|
)
|
(47,095
|
)
|
(49,726
|
)
|
|||||||||
|
Gain from distribution of dividend in kind
|
—
|
—
|
209,710
|
|||||||||||||
|
Write back/(impairment) of assets and investments
|
10.C.a
|
28,758
|
(72,263
|
)
|
(6,541
|
)
|
||||||||||
|
Dilution gains from reductions in equity interest held in associates
|
—
|
—
|
32,829
|
|||||||||||||
|
Other expenses
|
(51
|
)
|
(229
|
)
|
(802
|
)
|
||||||||||
|
Other income
|
1,410
|
2,757
|
3,742
|
|||||||||||||
|
Operating profit/(loss) from continuing operations
|
42,291
|
(70,940
|
)
|
244,860
|
||||||||||||
|
Financing expenses
|
26
|
(70,166
|
)
|
(47,276
|
)
|
(36,394
|
)
|
|||||||||
|
Financing income
|
26
|
2,904
|
7,724
|
10,721
|
||||||||||||
|
Financing expenses, net
|
(67,262
|
)
|
(39,552
|
)
|
(25,673
|
)
|
||||||||||
|
Provision of financial guarantee
|
10.C.b.7
|
—
|
(130,193
|
)
|
—
|
|||||||||||
|
Share in losses of associated companies, net of tax
|
10
|
(110,665
|
)
|
(186,215
|
)
|
(187,033
|
)
|
|||||||||
|
(Loss)/profit from continuing operations before income taxes
|
(135,636
|
)
|
(426,900
|
)
|
32,154
|
|||||||||||
|
Income taxes
|
27
|
(72,809
|
)
|
(2,252
|
)
|
(9,043
|
)
|
|||||||||
|
(Loss)/Profit for the year from continuing operations
|
(208,445
|
)
|
(429,152
|
)
|
23,111
|
|||||||||||
|
Profit and gain from sale of discontinued operations
|
1.B, 29
|
476,565
|
35,150
|
72,781
|
||||||||||||
|
Profit/(loss) for the year
|
268,120
|
(394,002
|
)
|
95,892
|
||||||||||||
|
Attributable to:
|
||||||||||||||||
|
Kenon’s shareholders
|
236,590
|
(411,937
|
)
|
72,992
|
||||||||||||
|
Non-controlling interests
|
31,530
|
17,935
|
22,900
|
|||||||||||||
|
Profit/(loss) for the year
|
268,120
|
(394,002
|
)
|
95,892
|
||||||||||||
|
Basic/diluted profit/(loss) per share attributable to Kenon’s shareholders (in dollars):
|
28
|
|||||||||||||||
|
Basic/diluted profit/(loss) per share
|
4.40
|
(7.67
|
)
|
1.36
|
||||||||||||
|
Basic/diluted (loss)/profit per share from continuing operations
|
(4.00
|
)
|
(8.08
|
)
|
0.24
|
|||||||||||
|
Basic/diluted profit per share from discontinued operations
|
8.40
|
0.41
|
1.12
|
|||||||||||||
* Restated (See
Note 2E
and
29
)
The accompanying notes are an integral part of the consolidated financial statements.
F - 9
Kenon Holdings Ltd and subsidiaries
Consolidated Statements of Other
Comprehensive Income (Loss) for the years ended December 31, 2017, 2016 and 2015
|
For the year ended December 31
|
||||||||||||
|
2017
|
2016
|
2015
|
||||||||||
|
$ thousands
|
||||||||||||
|
Profit/(loss) for the year
|
268,120
|
(394,002
|
)
|
95,892
|
||||||||
|
Items that
are or
will be subsequently reclassified to profit or loss
|
||||||||||||
|
Foreign currency translation differences in respect of foreign operations
|
29,
320
|
157
|
(18,132
|
)
|
||||||||
|
Change in fair value of derivatives used to hedge cash flows
|
19,489
|
14,397
|
(6,365
|
)
|
||||||||
|
Group’s share in other comprehensive loss of associated companies
|
(1,239
|
)
|
(3,968
|
)
|
(623
|
)
|
||||||
|
Income taxes in respect of components other comprehensive (loss)/income
|
(6,142
|
)
|
(1,507
|
)
|
773
|
|||||||
|
Total other comprehensive income/(loss) for the year
|
41,
428
|
9,079
|
(24,347
|
)
|
||||||||
|
Total comprehensive income/(loss) for the year
|
309,548
|
(384,923
|
)
|
71,545
|
||||||||
|
Attributable to:
|
||||||||||||
|
Kenon’s shareholders
|
270,175
|
(407,749
|
)
|
52,423
|
||||||||
|
Non-controlling interests
|
39,373
|
22,826
|
19,122
|
|||||||||
|
Total comprehensive income/(loss) for the year
|
309,548
|
(384,923
|
)
|
71,545
|
||||||||
The accompanying notes are an integral part of the consolidated financial statements.
F - 10
Kenon Holdings Ltd and subsidiaries
For the years ended December 31, 2017, 2016 and 2015
|
Non-
|
||||||||||||||||||||||||||||||||
|
controlling
|
||||||||||||||||||||||||||||||||
|
Attributable to the Kenon’s shareholders
|
interests
|
Total
|
||||||||||||||||||||||||||||||
|
Shareholder
|
||||||||||||||||||||||||||||||||
|
Share
|
transaction
|
Translation
|
Capital
|
Accumulated
|
||||||||||||||||||||||||||||
|
Capital
|
reserve
|
reserve
|
reserves
|
deficit
|
Total
|
|||||||||||||||||||||||||||
|
$ thousands
|
||||||||||||||||||||||||||||||||
|
Balance at January 1, 2017
|
1,267,450
|
26,559
|
(21,745
|
)
|
11,575
|
(602,598
|
)
|
681,241
|
212,963
|
894,204
|
||||||||||||||||||||||
|
Share based payments
|
(240
|
)
|
—
|
—
|
748
|
—
|
508
|
449
|
957
|
|||||||||||||||||||||||
|
Dividend to holders of non-controlling interests in
subsidiaries
|
—
|
—
|
—
|
—
|
—
|
—
|
(
33,848
|
)
|
(
33,848
|
)
|
||||||||||||||||||||||
|
Capital reduction to non-controlling interests in subsidiaries
|
—
|
—
|
—
|
—
|
—
|
—
|
(13,805
|
)
|
(13,805
|
)
|
||||||||||||||||||||||
|
Sale of Colombian assets
|
—
|
—
|
—
|
—
|
—
|
—
|
(8,890
|
)
|
(8,890
|
)
|
||||||||||||||||||||||
|
Non-controlling interests in respect of business combination
|
—
|
—
|
—
|
—
|
—
|
—
|
(50
|
)
|
(50
|
)
|
||||||||||||||||||||||
|
Sale of subsidiaries - Latin America and Caribbean businesses
|
—
|
—
|
(5,650
|
)
|
2,045
|
—
|
(3,605
|
)
|
(170,513
|
)
|
(174,118
|
)
|
||||||||||||||||||||
|
Dilution of investment in subsidiary (see Note
23
)
|
—
|
—
|
299
|
(4,691
|
)
|
62,210
|
57,818
|
42,550
|
100,368
|
|||||||||||||||||||||||
|
Fair value of shareholder loan
|
—
|
(23,019
|
)
|
—
|
—
|
—
|
(23,019
|
)
|
—
|
(23,019
|
)
|
|||||||||||||||||||||
|
Total comprehensive income for the year
|
||||||||||||||||||||||||||||||||
|
Net profit for the year
|
—
|
—
|
—
|
—
|
236,590
|
236,590
|
31,530
|
268,120
|
||||||||||||||||||||||||
|
Other comprehensive income/(loss) for the year, net of tax
|
—
|
—
|
25,504
|
9,620
|
(1,539
|
)
|
33,585
|
7,843
|
41,428
|
|||||||||||||||||||||||
|
Balance at December 31, 2017
|
1,267,210
|
3,540
|
(1,592
|
)
|
19,297
|
(305,337
|
)
|
983,118
|
68,229
|
1,051,347
|
||||||||||||||||||||||
The accompanying notes are an integral part of the consolidated financial statements.
F - 11
Kenon Holdings Ltd and subsidiaries
Consolidated Statements of Changes in Equity
For the years ended December 31, 2017, 2016 and 2015
|
Non-
|
||||||||||||||||||||||||||||||||
|
controlling
|
||||||||||||||||||||||||||||||||
|
Attributable to the Kenon’s shareholders
|
interests
|
Total
|
||||||||||||||||||||||||||||||
|
Shareholder
|
||||||||||||||||||||||||||||||||
|
Share
|
transaction
|
Translation
|
Capital
|
Accumulated
|
||||||||||||||||||||||||||||
|
Capital
|
reserve
|
reserve
|
reserves
|
deficit
|
Total
|
|||||||||||||||||||||||||||
|
$ thousands
|
||||||||||||||||||||||||||||||||
|
Balance at January 1, 2016
|
1,267,210
|
—
|
(16,916
|
)
|
2,212
|
(191,292
|
)
|
1,061,214
|
202,341
|
1,263,555
|
||||||||||||||||||||||
|
Share based payments
|
240
|
—
|
—
|
307
|
—
|
547
|
285
|
832
|
||||||||||||||||||||||||
|
Dividend to holders of non-controlling interests in a subsidiary
|
—
|
—
|
—
|
—
|
—
|
—
|
(35,255
|
)
|
(35,255
|
)
|
||||||||||||||||||||||
|
Acquisition of non- controlling interest in subsidiary
|
—
|
—
|
—
|
—
|
670
|
670
|
20,325
|
20,995
|
||||||||||||||||||||||||
|
Contribution from non-controlling interest
|
—
|
—
|
—
|
—
|
—
|
—
|
2,441
|
2,441
|
||||||||||||||||||||||||
|
Transactions with controlling shareholder (see Note 10.C.b.7)
|
—
|
3,540
|
—
|
—
|
—
|
3,540
|
—
|
3,540
|
||||||||||||||||||||||||
|
Gain in fair value of shareholder loan (see Note 10.C.b.5)
|
—
|
23,019
|
—
|
—
|
—
|
23,019
|
—
|
23,019
|
||||||||||||||||||||||||
|
Total comprehensive income for the year
|
||||||||||||||||||||||||||||||||
|
Net (loss)/profit for the year
|
—
|
—
|
—
|
—
|
(411,937
|
)
|
(411,937
|
)
|
17,935
|
(394,002
|
)
|
|||||||||||||||||||||
|
Other comprehensive (loss)/income for the year, net of tax
|
—
|
—
|
(4,829
|
)
|
9,056
|
(39
|
)
|
4,188
|
4,891
|
9,079
|
||||||||||||||||||||||
|
Balance at December 31, 2016
|
1,267,450
|
26,559
|
(21,745
|
)
|
11,575
|
(602,598
|
)
|
681,241
|
212,963
|
894,204
|
||||||||||||||||||||||
The accompanying notes are an integral part of the consolidated financial statements.
F - 12
Kenon Holdings Ltd and subsidiaries
Consolidated Statements of Changes in Equity
For the years ended December 31, 2017, 2016 and 2015
|
Non-
|
||||||||||||||||||||||||||||||||
|
controlling
|
||||||||||||||||||||||||||||||||
|
Attributable to the Kenon’s shareholders
|
interests
|
Total
|
||||||||||||||||||||||||||||||
|
Former
|
||||||||||||||||||||||||||||||||
|
Parent
|
||||||||||||||||||||||||||||||||
|
Share
|
company
|
Translation
|
Capital
|
Accumulated
|
||||||||||||||||||||||||||||
|
Capital
|
investment
|
reserve
|
reserves
|
deficit
|
Total
|
|||||||||||||||||||||||||||
|
$ thousands
|
||||||||||||||||||||||||||||||||
|
Balance at January 1, 2015
|
—
|
1,227,325
|
28,440
|
(25,274
|
)
|
—
|
1,230,491
|
207,207
|
1,437,698
|
|||||||||||||||||||||||
|
Transactions with owners, recognized directly in equity
|
||||||||||||||||||||||||||||||||
|
Share based payments
|
—
|
—
|
—
|
556
|
—
|
556
|
320
|
876
|
||||||||||||||||||||||||
|
Dividend to holders of non-controlling interests in a subsidiary
|
—
|
—
|
—
|
—
|
—
|
—
|
(12,340
|
)
|
(12,340
|
)
|
||||||||||||||||||||||
|
Acquisition of non- controlling interest in subsidiary
|
—
|
—
|
—
|
—
|
(1,222
|
)
|
(1,222
|
)
|
(18,078
|
)
|
(19,300
|
)
|
||||||||||||||||||||
|
Reclassification of net loss (pre spin-off)
|
—
|
8,552
|
—
|
—
|
(8,552
|
)
|
—
|
—
|
—
|
|||||||||||||||||||||||
|
Contribution from former parent company
|
—
|
34,271
|
—
|
—
|
—
|
34,271
|
—
|
34,271
|
||||||||||||||||||||||||
|
Issuance of shares of subsidiary to holders of non-controlling interests
|
—
|
—
|
—
|
—
|
—
|
—
|
6,110
|
6,110
|
||||||||||||||||||||||||
|
Distribution of dividend in kind (see note 10.C.c)
|
(14,062
|
)
|
—
|
498
|
—
|
(241,741
|
)
|
(255,305
|
)
|
—
|
(255,305
|
)
|
||||||||||||||||||||
|
Issuance of common stock and reclassification of former parent company investment in connection with the spin-off
|
1,281,272
|
(1,283,550
|
)
|
(28,440
|
)
|
30,718
|
—
|
—
|
—
|
—
|
||||||||||||||||||||||
|
Post spin-off restatement
|
—
|
13,402
|
—
|
—
|
(13,402
|
)
|
—
|
—
|
—
|
|||||||||||||||||||||||
|
Total comprehensive income for the year
|
||||||||||||||||||||||||||||||||
|
Net profit for the year
|
—
|
—
|
—
|
—
|
72,992
|
72,992
|
22,900
|
95,892
|
||||||||||||||||||||||||
|
Other comprehensive (loss)/income for the year, net of tax
|
—
|
—
|
(17,414
|
)
|
(3,788
|
)
|
633
|
(20,569
|
)
|
(3,778
|
)
|
(24,347
|
)
|
|||||||||||||||||||
|
Balance at December 31, 2015
|
1,267,210
|
—
|
(16,916
|
)
|
2,212
|
(191,292
|
)
|
1,061,214
|
202,341
|
1,263,555
|
||||||||||||||||||||||
The accompanying notes are an integral part of the consolidated financial statements.
F - 13
Kenon Holdings Ltd and subsidiaries
For the years ended December 31, 2017, 2016 and 2015
|
For the year ended December 31
|
||||||||||||
|
2017
|
2016
|
2015
|
||||||||||
|
$ thousands
|
||||||||||||
|
Cash flows from operating activities
|
||||||||||||
|
Profit/(loss) for the year
|
268,120
|
(394,002
|
)
|
95,892
|
||||||||
|
Adjustments:
|
||||||||||||
|
Depreciation and amortization
|
178,461
|
172,381
|
120,047
|
|||||||||
|
(Write back)/impairment of assets and investments
|
(
8,314
|
)
|
72,263
|
6,541
|
||||||||
|
Financing expenses, net
|
275,799
|
171,118
|
110,816
|
|||||||||
|
Share in losses of associated companies, net
|
109,980
|
185,592
|
186,759
|
|||||||||
|
Capital (gains)/losses, net *
|
(
25,529
|
)
|
2,534
|
4,506
|
||||||||
|
Gain from changes in interest held in associates
|
—
|
—
|
(32,829
|
)
|
||||||||
|
Gain from distribution of dividend in kind
|
—
|
—
|
(209,710
|
)
|
||||||||
|
Provision for financial guarantee
|
—
|
130,193
|
—
|
|||||||||
|
Bad debt expense
|
7,866
|
4,896
|
—
|
|||||||||
|
Share-based payments
|
957
|
832
|
876
|
|||||||||
|
Income taxes
|
278,447
|
59,334
|
62,378
|
|||||||||
|
1,085,787
|
405,141
|
345,276
|
||||||||||
|
Change in inventories
|
1,291
|
(40,076
|
)
|
4,361
|
||||||||
|
Change in trade and other receivables
|
(62,436
|
)
|
(68,634
|
)
|
35,491
|
|||||||
|
Change in trade and other payables
|
(568,364
|
)
|
22,835
|
(29,800
|
)
|
|||||||
|
Change in provisions and employee benefits
|
2,021
|
(41,243
|
)
|
(33,426
|
)
|
|||||||
|
Cash generated from operating activities
|
458,299
|
278,023
|
321,902
|
|||||||||
|
Income taxes paid, net
|
(66,830
|
)
|
(116,429
|
)
|
(36,218
|
)
|
||||||
|
Dividends received from investments in associates
|
382
|
743
|
4,487
|
|||||||||
|
Net cash provided by operating activities
|
391,851
|
162,337
|
290,171
|
|||||||||
* Mainly relate to (gains)/losses from disposal of property, plant and equipment.
The accompanying notes are an integral part of the consolidated financial statements.
F - 14
Kenon Holdings Ltd and subsidiaries
Consolidated Statements of Cash Flows, continued
For the years ended December 31, 2017, 2016 and 2017
|
For the year ended December 31
|
||||||||||||||||
|
2017
|
2016
|
2015
|
||||||||||||||
|
Note
|
$ thousands
|
|||||||||||||||
|
Cash flows from investing activities
|
||||||||||||||||
|
Proceeds from sale of property, plant and equipment and intangible assets
|
4,727
|
426
|
539
|
|||||||||||||
|
Short-term deposits and loans, net
|
(4,876
|
)
|
222,451
|
(83,408
|
)
|
|||||||||||
|
Cash paid for businesses purchased, less cash acquired
|
—
|
(206,059
|
)
|
(9,441
|
)
|
|||||||||||
|
Sale of subsidiaries - Latin America and Caribbean businesses, net of cash disposed off
|
29
|
792,585
|
—
|
—
|
||||||||||||
|
Sale of Colombian assets, net of cash disposed off
|
600
|
—
|
—
|
|||||||||||||
|
Investment in associates
|
—
|
(111,153
|
)
|
(129,241
|
)
|
|||||||||||
|
Sale of securities held for trade and available for sale, net
|
—
|
17,334
|
13,217
|
|||||||||||||
|
Acquisition of property, plant and equipment
|
(227,601
|
)
|
(280,955
|
)
|
(515,838
|
)
|
||||||||||
|
Acquisition of intangible assets
|
(10,412
|
)
|
(9,598
|
)
|
(16,844
|
)
|
||||||||||
|
Proceeds from realization of long-term deposits
|
4,655
|
—
|
—
|
|||||||||||||
|
Interest received
|
6,825
|
6,143
|
7,924
|
|||||||||||||
|
Payment of consideration retained
|
—
|
(2,204
|
)
|
(3,795
|
)
|
|||||||||||
|
Payment to release financial guarantee
|
(72,278
|
)
|
(36,023
|
)
|
—
|
|||||||||||
|
Energuate Purchase Adjustment
|
10,272
|
—
|
—
|
|||||||||||||
|
Insurance claim received
|
80,000
|
—
|
—
|
|||||||||||||
|
Net cash provided by/(used in) investing activities
|
584,497
|
(399,638
|
)
|
(736,887
|
)
|
|||||||||||
|
Cash flows from financing activities
|
||||||||||||||||
|
Dividend paid to non-controlling interests
|
(29,443
|
)
|
(32,694
|
)
|
(12,340
|
)
|
||||||||||
|
Proceeds from issuance of shares to holders of non-controlling interests in subsidiaries
|
100,478
|
9,468
|
6,110
|
|||||||||||||
|
Payment of issuance expenses related to long term debt
|
(34,391
|
)
|
—
|
—
|
||||||||||||
|
Payment of consent fee
|
(4,547
|
)
|
—
|
—
|
||||||||||||
|
Receipt of long-term loans and issuance of debentures
|
1,938,877
|
799,481
|
333,549
|
|||||||||||||
|
Repayment of long-term loans and debentures
|
(1,506,553
|
)
|
(444,976
|
)
|
(138,270
|
)
|
||||||||||
|
Short-term credit from banks and others, net
|
(126,287
|
)
|
(5,477
|
)
|
123,053
|
|||||||||||
|
Contribution from former parent company
|
—
|
—
|
34,271
|
|||||||||||||
|
Payment of swap unwinding and early repayment fee
|
(46,966
|
)
|
—
|
—
|
||||||||||||
|
Purchase of non-controlling interest
|
(13,805
|
)
|
—
|
(20,000
|
)
|
|||||||||||
|
Interest paid
|
(180,242
|
)
|
(151,241
|
)
|
(93,858
|
)
|
||||||||||
|
Net cash provided by financing activities
|
97,121
|
174,561
|
232,515
|
|||||||||||||
|
Increase/(decrease) in cash and cash equivalents
|
1,073,469
|
(62,740
|
)
|
(214,201
|
)
|
|||||||||||
|
Cash and cash equivalents at beginning of the year
|
326,635
|
383,953
|
610,056
|
|||||||||||||
|
Effect of exchange rate fluctuations on balances of cash and cash equivalents
|
17,284
|
5,422
|
(11,902
|
)
|
||||||||||||
|
Cash and cash equivalents at end of the year
|
1,417,388
|
326,635
|
383,953
|
|||||||||||||
The accompanying notes are an integral part of the consolidated financial statements.
F - 15
Kenon Holdings Ltd.
Note 1 – Financial Reporting Principles and Accounting Policies
| A. |
The Reporting Entity
|
Kenon Holdings Ltd (the “Company” or “Kenon”) was incorporated on March 7, 2014 in the Republic of Singapore under the Singapore Companies Act. Our registered office and principal place of business is located at 1 Temasek Avenue #36-01, Millenia Tower, Singapore 039192.
The Company is a holding company and was incorporated to receive investments spun-off from their former parent company, Israel Corporation Ltd. (“IC”). The Company was formed to serve as the holding company of several businesses (together referred to as the “Group”).
Kenon shares are traded on New York Stock Exchange (“NYSE”) and on Tel Aviv Stock Exchange (“TASE”) (NYSE and TASE: KEN).
| B. |
Sale of power business
|
In December 2017, Kenon, through its wholly-owned subsidiary Inkia Energy Limited (“Inkia”), sold its Latin American and Caribbean power business to an infrastructure private equity firm, I Squared Capital (“ISQ”). As a result, the Latin American and Caribbean businesses were classified as discontinued operations. Associated results of operations are separately reported for all periods presented. See note 29 for further information.
| C. |
Definitions
|
In these consolidated financial statements -
| 1. |
Subsidiaries
– Companies whose financial statements are fully consolidated with those of Kenon, directly or indirectly.
|
| 2. |
Associates
– Companies in which Kenon has significant influence and Kenon’s investment is stated, directly or indirectly, on the equity basis.
|
| 3. |
Investee companies
– subsidiaries and/or associated companies.
|
| 4. |
Related parties
– within the meaning thereof in International Accounting Standard (“IAS”) 24
“Related Parties”
.
|
F - 16
Note 2 – Basis of Preparation of the Financial Statements
| A. |
Declaration of compliance with International Financial Reporting Standards (IFRS)
|
The consolidated financial statements were prepared by management of the Group in accordance with International Financial Reporting Standards (“IFRS”) as issued by the International Accounting Standards Board (“IASB”).
The consolidated financial statements were approved for issuance by the Company’s Board of Directors on March
27
, 2018.
| B. |
Functional and presentation currency
|
These consolidated financial statements are presented in US dollars, which is Kenon’s functional currency, and have been rounded to the nearest thousands, except when otherwise indicated. The US dollar is the currency that represents the principal economic environment in which Kenon operates.
| C. |
Basis of measurement
|
The consolidated financial statements were prepared on the historical cost basis, with the exception of the following assets and liabilities:
| • |
Derivative financial instruments.
|
| • |
Deferred tax assets and liabilities.
|
| • |
Provisions.
|
| • |
Assets and liabilities in respect of employee benefits.
|
| • |
Investments in associates.
|
For additional information regarding measurement of these assets and liabilities – see Note 3 “Significant Accounting Policies”.
| D. |
Use of estimates and judgment
|
The preparation of consolidated financial statements in conformity with IFRS requires management to make judgments, estimates and assumptions that affect the application of accounting policies and the reported amounts of assets, liabilities, income and expenses. Actual results may differ from these estimates.
The preparation of accounting estimates used in the preparation of the consolidated financial statements requires management of the Group to make assumptions regarding circumstances and events that involve considerable uncertainty. Management prepares the estimates based on past experience, various facts, external circumstances, and reasonable assumptions according to the pertinent circumstances of each estimate.
Estimates and underlying assumptions are reviewed on an ongoing basis. Revisions to accounting estimates are recognized in the period in which the estimates are revised and in any future periods affected.
Following the Group’s business combination (“Note 11.A.1”), the Group had implemented additional accounting policies under the group of companies and information about assumptions made by management of the Group with respect to the future and other reasons for uncertainty with respect to estimates that have a significant risk of resulting in a material adjustment to carrying amounts of assets and liabilities in the next financial year are set forth below:
| 1. |
Useful life of property, plant and equipment
|
Property, plant and equipment is depreciated using the straight-line method over its estimated useful life.
At every year-end, or more often if necessary, management examines the estimated useful life of the property, plant and equipment by comparing it to the benchmark in the relevant industry, taking into account the level of maintenance and functioning over the years. If necessary, on the basis of this evaluation, the Group adjusts the estimated useful life of the property, plant and equipment. A change in estimates in subsequent periods could materially increase or decrease future depreciation expense.
F - 17
Note 2 – Basis of Preparation of the Financial Statements (Cont’d)
| 2. |
Recoverable amount of non-financial assets and Cash Generating Units
|
Each reporting date, the management of the Group examines whether there have been any events or changes in circumstances which would indicate impairment of one or more of its non-financial assets or Cash Generating Units (“CGUs”). When there are indications of impairment, an examination is made as to whether the carrying amount of the non-financial assets or CGUs exceeds their recoverable amount, and if necessary, an impairment loss is recognized. Assessment of the impairment of goodwill and of other intangible assets having an indeterminable life is performed at least once a year or when signs of impairment exist.
The recoverable amount of the asset or CGU is determined based on the higher of the fair value less selling costs of the asset or CGU and the present value of the future cash flows expected from the continued use of the asset or CGU in its present condition, including the cash flows expected upon retiring the asset from service and its eventual sale (value in use).
The future cash flows are discounted to their present value using a discount rate that reflects current market assessments of the time value of money and the risks specific to the asset or CGU.
The estimates regarding future cash flows are based on past experience with respect to this asset or similar assets (or CGUs), and on the Group’s best possible assessments regarding the economic conditions that will exist during the remaining useful life of the asset or CGU.
The estimate of the future cash flows relies on the Group’s budget and other forecasts. Since the actual cash flows may differ, the recoverable amount determined could change in subsequent periods, such that an additional impairment loss needs to be recognized or a previously recognized impairment loss needs to be reversed.
| 3. |
Fair value of derivative financial instruments
|
The Group is a party to derivative financial instruments used to hedge foreign currency risks, interest risks and price risks. The derivatives are recorded based on their respective fair values. The fair value of the derivative financial instruments is determined using acceptable valuation techniques that characterize the different derivatives, maximizing the use of observable inputs. Fair value measurement of long-term derivatives takes into account the counterparties credit risks. Changes in the economic assumptions and/or valuation techniques could give rise to significant changes in the fair value of the derivatives.
| 4. |
Separation of embedded derivatives
|
Management of the Group exercises significant judgment in determining whether it is necessary to separate an embedded derivative from a host contract. If it is determined that the embedded derivative is not closely related to the host contract and that it is necessary to separate the embedded derivative, this component is measured separately from the host contract as a financial instrument at fair value through profit or loss. Otherwise, the entire instrument is measured in accordance with the measurement principles applicable to the host contract.
Changes in the fair value of separable embedded derivatives are recognized immediately in profit or loss, as financing income or expenses.
| 5. |
Deferred tax assets
|
Deferred tax assets are recorded in relation to unutilized tax losses, as well as with respect to deductible temporary differences. Since such deferred tax assets may only be recognized where it is probable that there will be future taxable income against which said losses may be utilized, use of discretion by management of the Group is required in order to assess the probability that such future taxable income will exist. Management’s assessment is re-examined on a current basis and deferred tax assets are recognized if it is probable that future taxable income will permit recovery of the deferred tax assets.
F - 18
Note 2 – Basis of Preparation of the Financial Statements (Cont’d)
| 6. |
Business Combinations
|
The Group accounts for business combinations using the acquisition method when control is transferred to the Group. The consideration transferred in the acquisition is measured at fair value, as are the identifiable net assets acquired. Any goodwill that arises is tested annually for impairment. Any gain on a bargain purchase gain is recognized in profit or loss immediately. Transaction costs are expensed as incurred, except if related to the issue of debt or equity securities.
The consideration transferred does not include amounts related to the settlement of pre-existing relationships. Such amounts are recognized in profit or loss.
Any contingent consideration is measured at fair value at the acquisition date. If an obligation to pay contingent consideration that meets the definition of a financial instrument is classified as equity, then it is not re-measured and settlement is accounted for within equity. Otherwise, subsequent changes to the fair value of the contingent consideration are recognized in profit or loss.
| 7. |
Loss of control
|
Upon the loss of control, the Group derecognizes the assets and liabilities of the subsidiary, any NCI and the other components of equity related to the subsidiary. If the Group retains any interest in the previous subsidiary, then such interest is measured at fair value at the date that control is lost. The difference between the sum of the proceeds and fair value of the retained interest, and the derecognized balances is recognized in profit or loss under other income or other expenses. Subsequently, the retained interest is accounted for as an equity-accounted investee or as an available-for-sale asset depending on the level of influence retained by the Group in the relevant company.
The amounts recognized in capital reserves through other comprehensive income with respect to the same subsidiary are reclassified to profit or loss or to retained earnings in the same manner that would have been applicable if the subsidiary had itself realized the same assets or liabilities.
| 8. |
Contingent Liabilities
|
From time to time, the Group is involved in routine litigation that arises in the ordinary course of business. Provisions for litigation are recognized as set out in Note 3(P). Contingent liabilities for litigation and other claims do not result in provisions, but are disclosed in Note 21. The outcomes of legal proceedings with the Group are subjected to significant uncertainty and changes in factors impacting management’s assessments could materially impact the consolidated financial statements.
| E. |
Revision of the comparative figures
|
During the last quarter of 2017 the Group sold its IC Power businesses in Latin America. Comparative figures were restated to ensure comparability with current year’s presentation
(see Note 29).
F - 19
Note 3 – Significant Accounting Policies
The principal accounting policies applied in the preparation of these consolidated financial statements are set out below. The Group has consistently applied the following accounting policies to all periods presented in these consolidated financial statements, unless otherwise stated.
| A. |
Basis for consolidation/ combination
|
| (1) |
Business combinations
|
The Group accounts for all business combinations according to the acquisition method.
The acquisition date is the date on which the Group obtains control over an acquiree. Control exists when the Group is exposed, or has rights, to variable returns from its involvement with the acquiree and it has the ability to affect those returns through its power over the acquiree. Substantive rights held by the Group and others are taken into account when assessing control.
The Group recognizes goodwill on acquisition according to the fair value of the consideration transferred less the net amount of the fair value of identifiable assets acquired less the fair value of liabilities assumed.
If the Group pays a bargain price for the acquisition (meaning including negative goodwill), it recognizes the resulting gain in profit or loss on the acquisition date.
The Group recognizes contingent consideration measured at fair value at the acquisition date. The contingent consideration that meets the definition of a financial instrument that is not classified as equity will be measured at fair value through profit or loss; except for non-derivative financial instrument contingent consideration which will be measured through other comprehensive income.
Furthermore, goodwill is not adjusted in respect of the utilization of carry-forward tax losses that existed on the date of the business combination.
Costs associated with acquisitions that were incurred by the acquirer in the business combination such as: finder’s fees, advisory, legal, valuation and other professional or consulting fees are expensed in the period the services are received.
F - 20
Note 3 – Significant Accounting Policies (Cont’d)
| (2) |
Subsidiaries
|
Subsidiaries are entities controlled by the Company. The financial statements of subsidiaries are included in the consolidated financial statements from the date that control commences until the date when control ceased. The accounting policies of subsidiaries have been changed when necessary to align them with the policies adopted by the Company.
The Company has no interest in structured entities as of December 31, 2017 and 2016.
| (3) |
Non-Controlling Interest (“NCI”)
|
NCI
comprises the equity of a subsidiary that cannot be attributed, directly or indirectly, to the parent company, and they include additional components such as: share-based payments that will be settled with equity instruments of the subsidiaries and options for shares of subsidiaries.
NCIs
are measured at their proportionate share of the acquiree’s identifiable net assets at the acquisition date.
Changes in the Group’s interest in a subsidiary that do not result in a loss of control are accounted for as equity transactions.
Transactions with NCI, while retaining control
Transactions with NCI while retaining control are accounted for as equity transactions. Any difference between the consideration paid or received and the change in NCI is included directly in equity.
Allocation of comprehensive income to the shareholders
Profit or loss and any part of other comprehensive income are allocated to the owners of the Group and the NCI. Total comprehensive income is allocated to the owners of the Group and the NCI even if the result is a negative balance of NCI.
Furthermore, when the holding interest in the subsidiary changes, while retaining control, the Group re-attributes the accumulated amounts that were recognized in other comprehensive income to the owners of the Group and the NCI.
Cash flows deriving from transactions with holders of NCI while retaining control are classified under “financing activities” in the statement of cash flows.
| (4 ) |
Investments in equity-accounted investees
|
The Group’s interests in equity-accounted investees comprise interests in associates and a joint-venture.
Associates are entities in which the Group has the ability to exercise significant influence, but not control, over the financial and operating policies. In assessing significant influence, potential voting rights that are currently exercisable or convertible into shares of the investee are taken into account.
Joint-venture is an arrangement in which the Group has joint control, whereby the Group has the rights to assets of the arrangement, rather than rights to its assets and obligations for its liabilities.
Associates and joint-venture are accounted for using the equity method (equity accounted investees) and are recognized initially at cost. The cost of the investment includes transaction costs. The consolidated financial statements include the Group’s share of the income and expenses in profit or loss and of other comprehensive income of equity accounted investees, after adjustments to align the accounting policies with those of the Group, from the date that significant influence commences until the date that significant influence ceases.
F - 21
Note 3 – Significant Accounting Policies (Cont’d)
The Group’s share of post-acquisition profit or loss is recognized in the income statement, and its share of post-acquisition movements in other comprehensive income is recognized in other comprehensive income with a corresponding adjustment to the carrying amount of the investment.
When the Group’s share of losses exceeds its interest in an equity accounted investee, the carrying amount of that interest, including any long-term interests that form part thereof, is reduced to zero. When the Group’s share of long-term interests that form a part of the investment in the investee is different from its share in the investee’s equity, the Group continues to recognize its share of the investee’s losses, after the equity investment was reduced to zero, according to its economic interest in the long-term interests, after the aforesaid interests were reduced to zero. When the group’s share of losses in an associate equals or exceeds its interest in the associate, including any long-term interests that, in substance, form part of the entity’s net investment in the associate, the recognition of further losses is discontinued except to the extent that the Group has an obligation to support the investee or has made payments on behalf of the investee.
| (5) |
Loss of significant influence
|
The Group discontinues applying the equity method from the date it loses significant influence in an associate and it accounts for the retained investment as a financial asset, as relevant.
On the date of losing significant influence, the Group measures at fair value any retained interest it has in the former associate. The Group recognizes in profit or loss any difference between the sum of the fair value of the retained interest and any proceeds received from the partial disposal of the investment in the associate or joint venture, and the carrying amount of the investment on that date.
Amounts recognized in equity through other comprehensive income with respect to such associates are reclassified to profit or loss or to retained earnings in the same manner that would have been applicable if the associate had itself disposed the related assets or liabilities.
| (6) |
Change in interest held in equity accounted investees while retaining significant influence
|
When the Group increases its interest in an equity accounted investee while retaining significant influence, it implements the acquisition method only with respect to the additional interest obtained whereas the previous interest remains the same.
When there is a decrease in the interest in an equity accounted investee while retaining significant influence, the Group derecognizes a proportionate part of its investment and recognizes in profit or loss a gain or loss from the sale under other income or other expenses.
Furthermore, on the same date, a proportionate part of the amounts recognized in equity through other comprehensive income with respect to the same equity accounted investee are reclassified to profit or loss or to retained earnings in the same manner that would have been applicable if the associate had itself realized the same assets or liabilities.
| (7) |
Intra-group Transactions
|
Intra-group balances and transactions, and any unrealized income and expenses arising from intra-group transactions, are eliminated. Unrealized gains arising from transactions with equity accounted investees are eliminated against the investment to the extent of the Group’s interest in the investee. Unrealized losses are eliminated in the same way as unrealized gains, but only to the extent that there is no evidence of impairment.
| (8) |
Reorganizations under Common Control Transactions
|
Common control transactions that involve the setup of a new group company and the combination of entities under common control are recorded using the book values of the parent company.
F - 22
Note 3 – Significant Accounting Policies (Cont’d)
| B. |
Foreign currency
|
| (1) |
Foreign currency transactions
|
Transactions in foreign currencies are translated into the respective functional currencies of Group entities at exchange rates at the dates of the transactions.
Monetary assets and liabilities denominated in foreign currencies at the reporting date are translated into the functional currency at the exchange rate at that date. Non-monetary items measured at historical cost would be reported using the exchange rate at the date of the transaction.
Foreign currency differences are generally recognized in profit or loss, except for differences relating to qualifying cash flow hedges to the extent the hedge is effective which are recognized in other comprehensive income.
| (2) |
Foreign operations
|
The assets and liabilities of foreign operations, including goodwill and fair value adjustments arising on acquisition, are translated into US dollars at exchange rates at the reporting date. The income and expenses of foreign operations are translated into US dollars at exchange rates at the dates of the transactions.
Foreign operation translation differences are recognized in other comprehensive income.
When the foreign operation is a non-wholly-owned subsidiary of the Group, then the relevant proportionate share of the foreign operation translation difference is allocated to the NCI.
When a foreign operation is disposed of such that control or significant influence is lost, the cumulative amount in the translation reserve related to that foreign operation is reclassified to profit or loss as a part of the gain or loss on disposal.
Furthermore, when the Group’s interest in a subsidiary that includes a foreign operation changes, while retaining control in the subsidiary, a proportionate part of the cumulative amount of the translation difference that was recognized in other comprehensive income is reattributed to NCI.
The Group disposes of only part of its investment in an associate that includes a foreign operation, while retaining significant influence, the proportionate part of the cumulative amount of the translation difference is reclassified to profit or loss.
Generally, foreign currency differences from a monetary item receivable from or payable to a foreign operation, including foreign operations that are subsidiaries, are recognized in profit or loss in the consolidated financial statements.
Foreign exchange gains and losses arising from a monetary item receivable from or payable to a foreign operation, the settlement of which is neither planned nor likely in the foreseeable future, are considered to form part of a net investment in a foreign operation and are recognized in other comprehensive income, and are presented within equity in the translation reserve.
F - 23
Note 3 – Significant Accounting Policies (Cont’d)
| C. |
Financial instruments
|
The Group classifies non-derivative financial assets into the following categories: financial assets at fair value through profit and loss, held-to-maturity financial assets, loans and receivables and available-for-sale financial assets.
The Group classifies non- financial liabilities into the other financial liabilities categories.
| (1) |
Non-derivative financial assets and financial liabilities - recognition and de-recognition
|
The Group initially recognizes loans and receivables and debt securities issued on the date that they are originated. All other financial assets and financial liabilities are recognized initially on the trade date.
The Group derecognizes a financial asset when the contractual rights to the cash flows from the asset expire, or it transfers the rights to receive the contractual cash flows in a transaction in which substantially all of the risks and rewards of ownership
are transferred
and does not retains control over the transferred asset. Any interest in such derecognized financial asset that is created or retained by the Group is recognized as a separate asset or liability.
The Group derecognizes a financial liability when its contractual obligations are discharged, or cancelled or expire.
Financial assets and financial liabilities are offset and the net amount presented in the consolidated statement of financial position when, and only when, the Group currently has a legally enforceable right to offset the amounts and intends either to settle them on a net basis or to realize the asset and settle the liability simultaneously.
| (2) |
Non-derivative financial assets – measurement
|
|
Financial assets at fair value through profit and loss
|
A financial asset is classified at fair value through profit or loss if it is classified as held for trading or is designated as such on initial recognition. Directly attributable transaction costs are recognized in profit or loss as incurred. Financial assets at fair value through profit or loss are measured at fair value, and changes therein, including any interest or dividend income, are recognized in profit or loss.
|
|
|
Held-to-maturity financial assets
|
These assets are initially recognized at fair value plus any directly attributable transaction costs. Subsequent to initial recognition, they are measured at amortized cost using the effective interest method.
|
|
|
Loans and receivables
|
These assets are recognized initially at fair value plus any directly attributable transaction costs. Subsequent to initial recognition, they are measured at amortized cost using the effective interest method, less any impairment losses.
|
|
|
Available-for-sale financial assets
|
These assets are recognized initially at fair value plus any directly attributable transaction costs. Subsequent to initial recognition, they are measured at fair value and changes therein, other than impairment losses and foreign currency differences on debt instruments, are recognized in Other Comprehensive Income (“OCI”) and accumulated in the fair value reserve. When these assets are derecognized, the gain or loss accumulated in equity is reclassified to profit or loss.
|
| (3) |
Non-derivative financial liabilities - Measurement
|
Non-derivative financial liabilities include loans and credit from banks and others, debentures, trade and other payables and finance lease liabilities.
Non-derivative financial liabilities are initially recognized at fair value plus any directly attributable transaction costs. Subsequent to initial recognition, these liabilities are measured at amortized cost using the effective interest method.
| (4) |
Derivative financial instruments and hedge accounting
|
The Group holds derivative financial instruments to hedge its foreign currency and interest rate risk exposures.
Derivatives are recognized initially at fair value; any directly attributable transaction costs are recognized in profit or loss as incurred. Subsequent to initial recognition, derivatives are measured at fair value, and changes therein are generally recognized in profit or loss.
F - 24
Note 3 – Significant Accounting Policies (Cont’d)
| (5) |
Cash flow hedges
|
When a derivative is designated as a cash flow hedging instrument, the effective portion of changes in the fair value of the derivative is recognized in OCI and accumulated in the hedging reserve in equity. Any ineffective portion of changes in the fair value of the derivative is recognized immediately in profit or loss.
The amount accumulated in equity is retained in OCI and reclassified to profit or loss in the same period or periods during which the hedged item affects profit or loss.
If the hedging instrument no longer meets the criteria for hedge accounting, expires or is sold, terminated or exercised, or the designation is revoked, then hedge accounting is discontinued prospectively. If the forecast transaction is no longer expected to occur, then the amount accumulated in equity is reclassified to profit or loss.
| (6) |
Financial guarantees
|
A financial guarantee is initially recognized at fair value. In subsequent periods, a financial guarantee is measured at the higher of the amount recognized in accordance with the guidelines of IAS 37 Provisions, Contingent Liabilities and Contingent Assets, and the liability initially recognized under IAS 39 Financial Instruments: Recognition and Measurement and subsequently amortized in accordance with the guidelines of IAS 18 Revenue. Any resulting adjustment of the liability is recognized in profit or loss.
| D. |
Cash and Cash Equivalents
|
In the consolidated statement of cash flows, cash and cash equivalents includes cash on hand, deposits held at call with banks, other short-term highly liquid investments with original maturities of three months or less.
| E. |
Property, plant and equipment, net
|
| (1) |
Recognition and measurement
|
Items of property, plant and equipment comprise mainly power station structures, power distribution facilities and related offices. These items are measured at historical cost less accumulated depreciation and accumulated impairment losses. Historical cost includes expenditure that is directly attributable to the acquisition of the items.
| • |
The cost of materials and direct labor;
|
| • |
Any other costs directly attributable to bringing the assets to a working condition for their intended use;
|
| • |
When the Group has an obligation to remove the assets or restore the site, an estimate of the costs of dismantling and removing the items and restoring the site on which they are located; and
|
| • |
Capitalized borrowing costs.
|
If significant parts of an item of property, plant and equipment items have different useful lives, then they are accounted for as separate items (major components) of property, plant and equipment.
Any gain or loss on disposal of an item of property, plant and equipment is recognized in profit or loss in the year the asset is derecognized.
| (2) |
Subsequent Cost
|
Subsequent expenditure is capitalized only if it is probable that the future economic benefits associated with the expenditure will flow to the Group, and its cost can be measured reliably.
| (3) |
Depreciation
|
Depreciation is calculated to write off the cost of items of property, plant and equipment less their estimated residual values using the straight-line method over their estimated useful lives, and is generally recognized in profit or loss. Leased assets are depreciated over the shorter of the lease term and their useful lives unless it is reasonably certain that the Group will obtain ownership by the end of the lease term. Land is not depreciated.
F - 25
Note 3 – Significant Accounting Policies (Cont’d)
The following useful lives shown on an average basis are applied across the Group:
|
Years
|
|
|
Roads, buildings and leasehold improvements
|
2 – 50
|
|
Installations, machinery and equipment:
|
|
|
Thermal power plants
|
10 – 35
|
|
Hydro-electric plants
|
70 – 90
|
|
Wind power plants
|
25
|
|
Power generation and electrical
|
20
|
|
Dams
|
18 – 80
|
|
Office furniture, motor vehicles and other equipment
|
3 – 16
|
|
Substations, medium voltage equipment and transf.MV/LV
|
30 – 40
|
|
Meters and connections
|
10 – 25
|
Depreciation methods, useful lives and residual values are reviewed by management of the Group at each reporting date and adjusted if appropriate.
| F. |
Intangible assets, net
|
| (1) |
Recognition and measurement
|
|
Goodwill
|
Goodwill arising on the acquisition of subsidiaries is measured at cost less accumulated impairment losses. In respect of equity accounted investees, the carrying amount of goodwill is included in the carrying amount of the investment; and any impairment loss is allocated to the carrying amount of the equity investee as a whole.
|
|
Research and development
|
Expenditures on research activities is recognized in profit and loss as incurred.
Development activities involve expenditures incurred in relation to the design and evaluation of future power plant projects before the technical feasibility and commercial viability is fully completed, however the Group intends to and has sufficient resources to complete the development and to use or sell the asset.
At each reporting date, the management of the Group performs an evaluation of each project in order to identify facts and circumstances that suggest that the carrying amount of the assets may exceed their recoverable amount.
|
|
Concessions
|
Intangible assets granted by the Energy and Mining Ministry of Guatemala to DEORSA and DEOCSA to operate power distribution business in defined geographic areas, and acquired as part of business combination. The Group measures Concessions at cost less accumulated amortization and any accumulated impairment losses.
|
|
Customer relationships
|
Intangible assets acquired as part of a business combination and are recognized separately from goodwill if the assets are separable or arise from contractual or other legal rights and their fair value can be measured reliably. Customer relationships are measured at cost less accumulated amortization and any accumulated impairment losses.
|
|
Other intangible assets
|
Other intangible assets, including licenses, patents and trademarks, which are acquired by the Group and have finite useful lives are measured at cost less accumulated amortization and any accumulated impairment losses.
|
F - 26
Note 3 – Significant Accounting Policies (Cont’d)
| (2) |
Amortization
|
Amortization is calculated to charge to expense the cost of intangible assets less their estimated residual values using the straight-line method over their useful lives, and is generally recognized in profit or loss. Goodwill is not amortized.
The estimated useful lives for current and comparative year are as follows:
| · | Concessions | 33 years* |
| · | Customer relationships | 1-12 years |
| · | Software costs | 5 years |
| · | Others | 5-27 years |
* The concessions are amortized over the remaining life of the licenses from the date of the business combination.
Amortization methods and useful lives are reviewed by management of the Group at each reporting date and adjusted if appropriate.
| G. |
Subsequent expenditure
|
Subsequent expenditure is capitalized only when it increases the future economic benefits embodied in the specific asset to which it relates. All other expenditure, including expenditure on internally generated goodwill is expensed as incurred.
| H. |
Transfer of assets from customers
|
In the distribution industry, an entity may receive from its customers items of property, plant and equipment that must be used to connect those customers to a network and provide them with ongoing access to supply electricity. Alternatively, an entity may receive cash from customers for the acquisition or construction of such items of property, plant and equipment. In these cases, where the Group determines that the items qualify for recognition as an asset, the transferred assets are recognized as part of the property plant and equipment in the statement of financial position in accordance with IAS 16 and measured the cost on initial recognition at its fair value.
The transfer of an item of property, plant and equipment is an exchange for dissimilar goods or services. Consequently, the Group recognize revenue in accordance with IAS 18. The timing of the recognition of the revenue arising from the transfer will take place once the Company has control on the assets and the customers are connected to the distribution network.
| I. |
Service Concession arrangements
|
The Group has examined the characteristics, conditions and terms currently in effect under its electric energy distribution license and the guidelines established by IFRIC 12. On the basis of such analysis, the Group concluded that its license is outside the scope of IFRIC 12, primarily because the grantor does not control any significant residual interest in the infrastructure at the end of the term of the arrangement and the possibility of renewal.
The Group accounts for the assets acquired or constructed in connection with the Concessions in accordance with IAS 16 Property, plant and equipment.
| J. |
Leases
|
| (1) |
Leased assets
|
Assets held by the Group under leases that
transfer
to the Group substantially all of the risks and rewards of ownership are classified as finance leases. The leased assets are measured initially at an amount equal to the lower of their fair value and the present value of the minimum lease payments. Subsequent to initial recognition, the assets are accounted for in accordance with the accounting policy applicable to that asset.
Asset held under other leases are classified as operating leases and are not recognized in the Group’s consolidated statement of financial position.
F - 27
Note 3 – Significant Accounting Policies (Cont’d)
| (2) |
Lease payments
|
Payments made under operating leases, other than conditional lease payments, are recognized in profit or loss on a straight-line basis over the term of the lease. Lease incentives received are recognized as an integral part of the total lease expense, over the term of the lease.
Minimum lease payments made under finance leases are apportioned between the finance expense and the reduction of the outstanding liability. The finance expense is allocated to each period during the lease term so as to produce a constant periodic rate if interest on the remaining balance of the liability.
| K. |
Inventories
|
Inventories are measured at the lower of cost and net realizable value. Inventories consist of fuel, spare parts, materials and supplies. Cost is determined by using the average cost method.
| L. |
Trade Receivable, net
|
Trade receivables are amounts due from customers for the energy and capacity in the ordinary course of business. If collection is expected in one year or less (or in the normal operating cycle of the business if longer), they are classified as current assets. If not, they are presented as non-current assets.
Evidence of impairment of financial assets
The Group considers evidence of impairment for trade receivables at both a specific asset and collective level. All individually significant trade receivables are assessed for specific impairment. All individually significant trade receivables found not to be specifically impaired are then collectively assessed for any impairment that has been incurred but not yet identified. Trade receivables with similar risk characteristics that are not individually significant are collectively assessed for impairment. In assessing collective impairment, the Group uses historical trends of the probability of default, timing of recoveries and the amount of loss incurred, adjusted for management’s judgment as to whether current economic and credit conditions are such that the actual losses are likely to be greater or less than suggested by historical trends.
| M. |
Borrowing costs
|
Specific and non-specific borrowing costs are capitalized to qualifying assets throughout the period required for completion and construction until they are ready for their intended use. Non-specific borrowing costs are capitalized in the same manner to the same investment in qualifying assets, or portion thereof, which was not financed with specific credit by means of a rate which is the weighted-average cost of the credit sources which were not specifically capitalized. Foreign currency differences from credit in foreign currency are capitalized if they are considered an adjustment of interest costs. Other borrowing costs are expensed as incurred. Income earned on the temporary investment of specific credit received for investing in a qualifying asset is deducted from the borrowing costs eligible for capitalization.
| N. |
Impairment
|
| (1) |
Non-derivative financial assets
|
Financial assets not classified as at fair value through profit or loss, including an interest in an equity- account investee, are assessed by management of the Group at each reporting date to determine whether there is objective evidence of impairment.
Objective evidence that financial assets are impaired includes:
| · |
Default or delinquency by a debtor;
|
| · |
Restructuring of an amount due to the Group on terms that the Group would not consider otherwise;
|
| · |
Indications that a debtor or issuer will enter bankruptcy;
|
| · |
Adverse changes in the payment status of borrowers or issuers;
|
| · |
The disappearance of an active market for a security; or
|
| · |
Observable data indicating that there is measurable decrease in expected cash flows from a group of financial assets.
|
F - 28
Note 3 – Significant Accounting Policies (Cont’d)
For an investment in an equity security, objective evidence of impairment includes a significant or prolonged decline in its fair value below its cost.
|
Financial Assets measured at amortized costs
|
The Group considers evidence of impairment for these assets at both an individual asset and a collective level. All individually significant assets are individually assessed for impairment. Those found not to be impaired are then collectively assessed for any impairment that has been incurred but not yet individually identified. Assets that are not individually significant are collectively assessed for impairment. Collective assessment is carried out by grouping together assets with similar risk characteristics.
In assessing collective impairment, the group uses historical information on the timing of recoveries and the amount of loss incurred, and makes an adjustment if current economic and credit conditions are such that the actual losses are likely to be greater or lesser than suggested by historical trends.
An impairment loss is calculated as the difference between an asset's carrying amount and the present value of the estimated future cash flows discounted at the asset's original effective interest rate. Losses are recognized in profit or loss and reflected in an allowance account. When the Group considers that there are no realistic prospects of recovery of the asset, the relevant amounts are written off. If the amount of impairment loss subsequently decreases and the decrease can be related objectively to an event occurring after the impairment was recognized, then the previously recognized impairment loss is reversed through profit or loss.
|
|
Available-for-sale financial assets
|
Impairment losses on available-for-sale financial assets are recognized by reclassifying the losses accumulated in the fair value reserve to profit or loss. The amount reclassified is the difference between the acquisition cost (net of any principal repayment and amortization) and the current fair value, less any impairment loss previously recognized in profit or loss. If the fair value of an impaired available-for-sale debt security subsequently increases and the increase can be related objectively to an event occurring after the impairment loss was recognized, then the impairment loss is reversed through profit or loss; otherwise, it is reversed through OCI.
|
|
Equity-account investees
|
An impairment loss in respect of an equity-accounted investee is measured by comparing the recoverable amount of the investment with its carrying amount. An impairment loss is recognized in profit or loss, and is reversed if there has been a favorable change in the estimates used to determine the recoverable amount and only to the extent that the investment’s carrying amount, after the reversal of the impairment loss, does not exceed the carrying amount of the investment that would have been determined by the equity method if no impairment loss had been recognized.
|
| (2) |
Non-financial Assets
|
At each reporting date, management of the Group reviews the carrying amounts of its non-financial assets (other than inventories and deferred tax assets) to determine whether there is any indication of impairment. If any such indication exists, then the asset’s recoverable amount is estimated. Goodwill is tested annually for impairment or whenever impairment indicators exist.
For impairment testing, assets are grouped together into smallest group of assets that generates cash inflows from continuing use that are largely independent of the cash inflows of other assets or CGU. Goodwill arising from a business combination is allocated to CGUs or group of CGUs that are expected to benefit from these synergies of the combination.
The recoverable amount of an asset or CGU is the greater of its value in use and its fair value less costs to sell. Value in use is based on the estimated future cash flows, discounted to their present value using a pre-tax discount rate that reflects current market assessments of the time value of money and the risks specific to the asset or CGU.
An impairment loss is recognized if the carrying amount of an asset or CGU exceeds its recoverable amount.
Impairment losses are recognized in profit or loss. They are allocated first to reduce the carrying amount of any goodwill allocated to the CGU, and then to reduce the carrying amounts of the other assets in the CGU on a pro rata basis.
An impairment loss in respect of goodwill is not reversed. For other assets, an assessment is performed at each reporting date for any indications that these losses have decreased or no longer exist. An impairment loss is reversed if there has been a change in the estimates used to determine the recoverable amount and is reversed only to the extent that the asset’s carrying amount does not exceed the carrying amount that would have been determined, net of depreciation or amortization, if no impairment loss had been recognized.
F - 29
Note 3 – Significant Accounting Policies (Cont’d)
| O. |
Employee benefits
|
| (1) |
Short-term employee benefits
|
Short-term employee benefits are expensed as the related service is provided. A liability is recognized for the amount expected to be paid if the Group has a present legal or constructive obligation to pay this amount as a result of past service provided by the employee, and the obligation can be estimated reliably. The employee benefits are classified, for measurement purposes, as short-term benefits or as other long-term benefits depending on when the Group expects the benefits to be wholly settled.
| (2) |
Bonus plans transactions
|
The Group’s senior executives receive remuneration in the form of share-appreciations rights, which can only be settled in cash (cash-settled transactions). The cost of cash-settled transactions is measured initially at the grant date. With respect to grants made to senior executives of OPC Energy Ltd (“OPC”), this benefit is calculated by determining the present value of the settlement (execution) price set forth in the plan. The liability is re-measured at each reporting date and at the settlement date based on the formulas described above. Any changes in the liability are recognized as operating expenses in profit or loss.
| (3) |
Termination Benefits
|
Severance pay is charged to income statement when there is a clear obligation to pay termination of employees before they reach the customary age of retirement according to a formal, detailed plan, without any reasonable chance of cancellation, The benefits given to employees upon voluntary retirement are charged when the Group proposes a plan to the employees encouraging voluntary retirement, it is expected that the proposal will be accepted and the number of employee acceptances can be estimated reliably.
| (4) |
Defined Benefit Plans
|
The calculation of defined benefit obligation is performed at the end of each reporting period by a qualified actuary using the projected unit credit method. Remeasurements of the defined benefit liability, which comprise actuarial gains and losses and the effect of the asset ceiling (if any, excluding interest), are recognized immediately in OCI. Interest expense and other expenses related to defined benefit plan are recognized in profit or loss.
When the benefits of a plan are changed or when a plan is curtailed, the resulting change in benefit that relates to past service or the gain or loss on curtailment is recognized immediately in profit or loss. The Group recognizes gains and losses on the settlement of a defined benefit plan when the settlement occurs.
| (5) |
Share-based compensation plans
|
Qualifying employees are awarded grants of the Group’s shares under the Group’s 2014 Share Incentive Plan. The fair value of the grants are recognized as an employee compensation expense, with a corresponding increase in equity. The expense is amortised over the service period – the period that the employee must remain employed to receive the benefit of the award. At each balance sheet date, the Group revises its estimates of the number of grants that are expected to vest. It recognises the impact of the revision of original estimates in employee expenses and in a corresponding adjustment to equity over the remaining vesting period.
| P. |
Provisions
|
Provisions are recognized when the Group has a present legal or constructive obligation as a result of past events, it is probable that an outflow of resources embodying economic benefits will be required to settle the obligation and a reliable estimate can be made of the amount of the obligation.
Provisions are determined by discounting the expected future cash flows at a pre-tax rate that reflects current market assessments of the time value of money and the risks specific to the liability. The unwinding of the discount is recognized as finance cost.
F - 30
Note 3 – Significant Accounting Policies (Cont’d)
| Q. |
Revenue recognition
|
| (1) |
Revenue from electricity
|
Revenue is recognized to the extent that it is probable that the economic benefits will flow to the Group and the revenue can be reliably measured. Revenue comprises the fair value for the sale of electricity, net of value-added-tax, rebates and discounts and after eliminating sales within the Group. Revenues from the sale of energy are recognized in the period during which the sale occurs. The revenues of the Company are primarily from the sale of electricity to private customers and to Israel Electric Company Ltd. (“IEC”).
| (2) |
Revenue from shipping services and related expenses
(in associated company)
|
Revenue from cargo traffic is recognized in profit or loss in proportion to the stage of completion of the transaction at the balance sheet date. The stage of completion is assessed for each cargo by the reference to the time-based proportion. The operating expenses related to cargo traffic are recognized immediately as incurred. If the incremental expenses related to the cargo exceed the related revenue, the loss is recognized immediately in income statement.
| (3) |
Revenue from vehicles (in associated company)
|
| (i) |
Sales of vehicles
|
Revenue from the sale of vehicles in the course of ordinary activities is measured at the fair value of the consideration received or receivable, net of value-added tax (“VAT”), consumption tax and other sales taxes, returns or allowances, trade discounts and volume rebates. Revenue is recognized when persuasive evidence exists, usually in the form of an executed sales agreement, that the significant risks and rewards of ownership have been transferred to the customers, recovery of the consideration is probable, the associated costs and possible return of vehicles can be estimated reliably, there is no continuing management involvement with the goods, and the amount of revenue can be measured reliably.
| (ii) |
Rental income of vehicles
|
Rental income from operating leases is recognized as revenue on a straight-line basis over the term of the lease. Lease incentives granted are recognized as an integral part of the total rental income, over the term of the lease.
| (iii) |
Licensing income
|
License fee and royalties received for the use of the Group’s assets (such as platform technology and patent) are normally recognized in accordance with the substance of the agreement.
| (4) |
Revenue from biodiesel
|
Revenues are recorded if the material risks and rewards associated with ownership of the goods/merchandise sold have been assigned to the buyer. This usually occurs upon the delivery of products and merchandise.
Revenue is recorded to the extent that it is probable that the economic benefits will flow to the Group and the amount of the revenues can be reliably measured.
| R. |
Government grants
|
Government grants related to distribution projects are not recognized until there is reasonable assurance that the Group will comply with the conditions attaching to them and that the grants will be received. Government grants are recorded at the value of the grant received and any difference between this value and the actual construction cost is recognized in profit or loss of the year in which the asset is released.
Government grants related to distribution assets are deducted from the related assets. They are recognized in statement of income on a systematic basic over the useful life of the related asset reducing the depreciation expense.
| S. |
Deposits received from consumers
|
Deposits received from consumers, plus interest accrued and less any outstanding debt for past services, are refundable to the users when they cease using the electric energy service rendered by the Group. The Group has classified these deposits as current liabilities since the Group does not have legal rights to defer these payments in a period that exceed a year. However, the Group does not anticipate making significant payments in the next year.
F - 31
Note 3 – Significant Accounting Policies (Cont’d)
| T. |
Transfer of assets from customers
|
In the power distribution industry, an entity may receive from its customer items in the form of property, plant and equipment that are used to connect these customers to a network with continuous access to power supply. Alternatively, an entity may receive cash from customers in return for the acquisition or construction of such items of property, plant and equipment. In such cases, where the Group determines that these items qualify for recognition as an asset, the transferred assets are recognized as part of the property plant and equipment in the statement of financial position in accordance with IAS 16 and measured its cost on initial recognition at its fair value.
| U. |
Guarantee deposits from customers
|
Deposits received from customers, plus interest accrued and less any outstanding debt for past services, are refundable to the users when they cease using the electric energy service rendered by the Group. The Group has classified these deposits as current liabilities since the Group does not have legal rights to defer these payments in a period that exceed a year. However, the Group does not anticipate making significant payments in the next year.
| V. |
Energy purchase
|
Costs from energy purchases either acquired in the spot market or from contracts with suppliers are recorded on an accrual basis according to the energy actually delivered. Purchases of electric energy, including those which have not yet been billed as of the reporting date, are recorded based on estimates of the energy supplied at the prices prevailing in the spot market or agreed-upon in the respective purchase agreements, as the case may be.
| W. |
Financing income and expenses
|
Financing income includes income from interest on amounts invested and gains from exchange rate differences. Interest income is recognized as accrued, using the effective interest method.
Financing expenses include interest on loans received, commitment fees on borrowings, and changes in the fair value of derivatives financial instruments presented at fair value through profit or loss, and exchange rate losses. Borrowing costs, which are not capitalized, are recorded in the income statement using the effective interest method.
In the statements of cash flows, interest received is presented as part of cash flows from investing activities. Dividends received are presented as part of cash flows from operating activities. Interest paid and dividends paid are presented as part of cash flows from financing activities. Accordingly, financing costs that were capitalized to qualifying assets are presented together with interest paid as part of cash flows from financing activities. Gains and losses from exchange rate differences and gains and losses from derivative financial instruments are reported on a net basis as financing income or expenses, based on the fluctuations on the rate of exchange and their position (net gain or loss).
The Group’s finance income and finance costs include:
| · |
Interest income;
|
| · |
Interest expense;
|
| · |
The net gain or loss on the disposal of available-for-sale financial assets;
|
| · |
The net gain or loss on financial assets at fair value through profit or loss;
|
| · |
The foreign currency gain or loss on financial assets and financial liabilities;
|
| · |
The fair value loss on contingent consideration classified as financial liability;
|
| · |
Impairment losses recognized on financial assets (other than trade receivables);
|
| · |
The net gain or loss on hedging instruments that are recognized in profit or loss; and
|
| · |
The reclassification of net gains previously recognized in OCI.
|
Interest income or expense is recognized using the effective interest method.
F - 32
Note 3 – Significant Accounting Policies (Cont’d)
| X. |
Income taxes
|
Income tax expense comprises current and deferred tax. It is recognized in profit or loss except to the extent that it relates to a business combination, or items recognized directly in equity or in OCI.
(i)
Current tax
Current tax comprises the expected tax payable or receivable on the taxable income or loss for the year and any adjustment to tax payable or receivable in respect of previous years. It is measured using tax rates enacted or substantively enacted at the reporting date. Current tax also includes any tax liability arising from dividends.
Current tax assets and liabilities are offset only if certain criteria are met.
(ii)
Deferred tax
Deferred tax is recognized in respect of temporary differences between the carrying amounts of assets and liabilities for financial reporting purposes and the amounts used for taxation purposes. Deferred tax is not recognized for:
| • |
Temporary differences on the initial recognition of assets or liabilities in a transaction that is not a business combination and that affects neither accounting nor taxable profit or loss;
|
| • |
Temporary differences related to investments in subsidiaries and associates where the Group is able to control the timing of the reversal of the temporary differences and it is not probable that they will reverse it in the foreseeable future; and
|
| • |
Taxable temporary differences arising on the initial recognition of goodwill.
|
Deferred tax assets are recognized for unused tax losses, unused tax credits and deductible temporary differences to the extent that it is probable that future taxable profits will be available against which they can be used. Deferred tax assets are reviewed at each reporting date and are reduced to the extent that it is no longer probable that the related tax benefit will be realized; such reductions are reversed when the probability of future taxable profit improves.
Unrecognized deferred tax assets are reassessed at each reporting date and recognized to the extent that it has become probable that future taxable profits will be available against which they can be used.
Deferred tax is measured at the tax rates that are expected to be applied to temporary differences when they reverse, using tax rates enacted or substantively enacted at the reporting date.
Deferred tax assets and liabilities are offset if there is a legally enforceable right to offset current tax liabilities and assets, and they relate to taxes levied by the same tax authority on the same taxable entity, or on different tax entities, but they intend to settle current tax liabilities and assets on a net basis or their tax assets and liabilities will be realized simultaneously.
Management of the Group regularly reviews its deferred tax assets for recoverability, taking into consideration all available evidence, both positive and negative, including historical pre-tax and taxable income, projected future pre-tax and taxable income and the expected timing of the reversals of existing temporary differences. In arriving at these judgments, the weight given to the potential effect of all positive and negative evidence is commensurate with the extent to which it can be objectively verified.
Management believes the Group’s tax positions are in compliance with applicable tax laws and regulations. Tax benefits are recognized only for tax positions that are more likely than not to be sustained upon examination by tax authorities. The Group believes that its liabilities for unrecognized tax benefits, including related interest, are adequate in relation to the potential for additional tax assessments. There is a risk, however, that the amounts ultimately paid upon resolution of audits could be materially different from the amounts previously included in our income tax expense and, therefore, could have a material impact on our tax provision, net income and cash flows.
(iii)
Uncertain tax positions
A provision for uncertain tax positions, including additional tax and interest expenses, is recognized when it is more probable than not that the Group will have to use its economic resources to pay the obligation.
| Y. |
Earnings per share
|
The Group presents basic and diluted earnings per share data for its ordinary share capital. The basic earnings per share are calculated by dividing income or loss allocable to the Group’s ordinary equity holders by the weighted-average number of ordinary shares outstanding during the period. The diluted earnings per share are determined by adjusting the income or loss allocable to ordinary equity holders and the weighted-average number of ordinary shares outstanding for the effect of all potentially dilutive ordinary shares including options for shares granted to employees.
F - 33
Note 3 – Significant Accounting Policies (Cont’d)
| Z. |
Share capital – ordinary shares
|
Incremental costs directly attributable to the issue of ordinary shares, net of any tax effects, are recognized as a deduction from equity.
Distribution of Non-Cash Assets to owners of the Company
The Group measures a liability to distribute non-cash assets as a dividend to the owners of the Group at the fair value of the assets to be distributed. The carrying amount of the dividend is remeasured at each reporting date and at the settlement date, with any changes recognized directly in equity as adjustments to the amount of the distribution. On settlement of the transaction, the Group recognized the difference, if any, between the carrying amounts of the assets distributed and the carrying amount of the liability in profit or loss. Distribution of non-cash assets are distributed to shareholders when the shareholder is given a choice of taking cash in lieu of the non-cash assets.
| AA. |
Discontinued operation
|
A discontinued operation is a component of the Group´s business, the operations and cash flows of which can be clearly distinguished from the rest of the Group and which:
| · |
Represents a separate major line of business or geographic area of operations,
|
| · |
Is part of a single coordinated plan to dispose of a separate major line of business or geographic area of operations; or
|
| · |
Is a subsidiary acquired exclusively with a view to re-sell.
|
Classification as a discontinued operation occurs at the earlier of disposal or when the operation meets the criteria to be classified as held-for-sale. When an operation is classified as a discontinued operation, the comparative statement of profit or loss and other comprehensive income is re-presented as if the operation had been discontinued from the start of the comparative year.
In the cash flow, the net proceeds from discontinued operation is disclosed in a separate line. The changes based on operating, investing and financing activities are reported in Note 29.
| AB. |
Operating Segment and Geographic Information
The Company's co-CEOs and CFO are considered to be the Group's chief operating decision maker ("CODM"). Based on the internal financial information provided to the CODM, the Group has determined that it has two reportable segments in 2017, which are OPC segment and Qoros segment. In addition to the segments detailed above, the Group has other activities, such as a shipping services and renewable energy businesses categorized as Other.
The CODM evaluates the operating segments performance based on Adjusted EBITDA. Adjusted EBITDA is defined as the net income (loss) excluding depreciation and amortization, financing income, income taxes and other items. Qoros is an associated company of the Group and the CODM evaluates the performance of Qoros based on the share of profit/loss.
The CODM evaluates segment assets based on total assets and segment liabilities based on total liabilities.
The accounting policies used in the determination of the segment amounts are the same as those used in the preparation of the Group's consolidated financial statement, Inter-segment pricing is determined based on transaction prices occurring in the ordinary course of business.
In determining of the information to be presented on a geographic basis, revenues are based on the geographic location of the customer and non-current assets are based on the geographic location of the assets.
The segment information were restated to only present results from continuing operations following the discontinued operations.
|
| AC. |
Transactions with controlling shareholders
|
Assets, liabilities and benefits with respect to which a transaction is executed with the controlling shareholders are measured at fair value on the transaction date. The Group records the difference between the fair value and the consideration in equity.
F - 34
Note 3 – Significant Accounting Policies (Cont’d)
| AD. |
New standards and interpretations not yet adopted
A number of new standards and amendments to standards and interpretations are effective for annual periods beginning after 1 January 2018, and have not been applied in preparing these consolidated financial statements.
The impact
on the consolidated financial statements of the Group
is described below:
|
| 1) |
International Financial Reporting Standard IFRS 9 (2014) “
Financial Instruments
”
– replaces the existing guidance in IAS 39
Financial Instruments: Recognition and Measurement
. IFRS 9 includes revised guidance on the classification and measurement of financial instruments, a new expected credit loss model for calculating impairment on financial assets, and new general hedge accounting requirements. It also carries forward the guidance on recognition and derecognition of financial instruments from IAS 39
|
The Standard is to be applied for annual periods commencing on or after January 1, 2018, with the possibility of early adoption. The Standard is to be applied retroactively, except in a number of circumstances. Management of the Group is examining the effects of IFRS 9 on the financial statements with no plans for early adoption.
The Group has examined IFRS 9 in order to determine the qualitative impacts of the implementation. As of 31 December 2017, the Group considers that the overall impact of the implementation of IFRS 9 will be immaterial to the Group.
The examination of the potential qualitative impacts was conducted, considering the following
two
main areas of IFRS 9:
| a) |
Classification of financial assets
|
There are no material impacts expected concerning the classification and measurement of financial assets due to the types of financial assets held by the Group entities. The Group does not hold complex financial assets nor enters in complex structured financing transaction such as securitization transactions or factoring-arrangements.
| b) |
Impairment of financial assets
|
In general, the most important financial assets of the Group, trade receivables, do not contain a significant financing component. Therefore, the simplified approach as established in IFRS 9 is recommended to be applied. According to IFRS 9, provision matrix may be used to estimate expected credit losses (“ECL”) for these financial instruments without the use of hindsight of a default, and the matrix would include expectations of variations in credit risks of customers for the lifetime. Thus, the recognition of losses would be based on the maximum period over which ECL which is the maximum contractual period over which the entity is exposed to credit risk from the first day of the recognition of the receivable. The Group expects that the application of IFRS 9 will impact its deferred payment obligations impairment assessment using the expected credit loss method.
Using the expected credit loss method, the Group expects no significant impairment.
| 2) |
International Financial Reporting Standard IFRS 15
“Revenues from Contracts with Customers”
– The Standard replaces the presently existing guidelines regarding recognition of revenue from contracts with customers and provides two approaches for recognition of revenue: at one point in time or over time. The model includes five stages for analysis of transactions in order to determine the timing of recognition of the revenue and the amount thereof. In addition, the Standard provides new disclosure requirements that are more extensive that those currently in effect. The Standard is to be applied for annual periods commencing on January 1, 2018. The Group has examined the implications of implementation of the standard and does not expect its implementation to have a material effect on the financial statements.
|
| 3) |
International Financial Reporting Standard IFRS 16 “
Leases
”
– The standard replaces IAS 17 – Leases and its related interpretations. The standard's instructions annul the existing requirement from lessees to classify leases as operating or finance leases. Instead of this, for lessees, the new standard presents a unified model for the accounting treatment of all leases according to which the lessee has to recognize an asset and liability in respect of the lease in its financial statements. Similarly, the standard determines new and expanded disclosure requirements from those required at present. The standard will become effective for annual periods commencing on or after January 1, 2019, with the possibility of early adoption, so long as the Group has also early adopted IFRS 15 – Revenue from contracts with customers. The standard includes a number of alternatives for the implementation of transitional provisions, so that companies can choose one of the following alternatives at the implementation date: full retrospective implementation or implementation from the effective date while adjusting the balance of retained earnings at that date. The Group examined the expected effects of the implementation of the Standard, but is unable at this stage to reliably estimate the quantitative impact on its financial statements.
|
F - 35
Note 3 – Significant Accounting Policies (Cont’d)
| 4) |
International Financial Reporting Standard IFRS 2 “
Share-based payments”
– The amendment clarify that the measurement of cash-settled share-based payments (SBP) should follow the same approach as for equity-settled SBP;
as an exception, for classification purposes, a SBP transaction with employees is accounted for as equity-settled if the terms of the arrangement permit or require an entity to settle the transaction net by withholding a specified portion of the equity instruments to meet the statutory tax withholding requirement, and the entire SBP transaction would otherwise be classified as equity-settled if not for the net settlement feature; and
for modification of awards from cash-settled to equity-settled:
|
| - |
at the modification date, derecognise the liability for the original cash-settled SBP; and measure the equity-settled SBP at its fair value and recognise in equity to the extent that the goods or services have been received up to that date.
|
| - |
recognise in profit or loss immediately the difference between the carrying amount of the liability derecognised and the amount recognised in equity as at modification date.
|
As a practical simplification, the amendments can be applied prospectively so that prior periods do not have to be restated. Retrospective, or early, application is permitted if entities have the required information.
| 5) |
International Accounting Standard IAS 28 “
Investments in Associates and Joint Ventures”
– The amendment clarifies that:
|
| - |
a venture capital organisation, or other qualifying entity, may elect to measure its investments in an associate or joint venture at fair value through profit or loss on an investment-by-investment basis.
|
| - |
a non-investment entity investor may elect to retain the fair value accounting applied by an investment entity associate or investment entity joint venture to its subsidiaries. This election can be made separately for each investment entity associate or joint venture.
|
| 6) |
International Financial Reporting Interpretations Committee IFRIC 22 “
Foreign Currency Transactions and Advance Consideration”
– The Interpretation stipulates that the date of the transaction for the purpose of determining the exchange rate for recording a transaction in foreign currency that includes advance payments will be the date on which the Company first recognizes a non-monetary asset/liability in respect of the advance payment. When there are several payments or receipts in advance, the Company will set a transaction date for each payment/receipt separately. The Interpretation will be applied for annual periods commencing January 1, 2018, with the possibility of early adoption. The interpretation includes various alternatives for the implementation of the transitional provisions, such that companies may choose one of the following alternatives upon initial application: retroactive implementation; A prospective application from the first reporting period in which the entity first applied the Interpretation; Or a prospective application from the first reporting period presented in the comparative figures in the financial statements for the period in which the entity first applied the Interpretation. The Group examined the implications of applying the interpretation on its financial statements and intends to choose the transition alternative of prospective application effective from January 1, 2018. The Group has determined in the past that the "transaction date" used to determine the exchange rate for recording a foreign currency transaction that includes advance payments will be the date on which the Group first recognizes the non - monetary asset/liability in respect of the advance. As a result, it is not expected to have a material effect on the Group's financial statements.
|
F - 36
Note 4 – Determination of Fair Value
| A. |
Business Combinations
|
The Group measures the value of the acquired assets, liabilities, and contingent liabilities considering the fair value basis from the date on which the Group took control. The criteria considered to measure the fair value of the main items were the following:
| · |
Fixed assets were valued considering the market value provided by an appraiser;
|
| · |
Intangibles consider the valuation of Concessions;
|
| · |
Deferred taxes were valued based on the temporary differences between the accounting and tax basis of the business combination;
|
| · |
Non-controlling interests were measured as a proportional basis of the net assets identified on the acquisition date
|
| · |
Intangibles consider the valuation of its Power Purchase Agreements (PPAs); and,
|
| · |
Contingent liabilities were determined over the average probability established by third party legal processes.
|
| B. |
Cash Generating Unit for impairment testing
|
See Note 15.C.
| C. |
Derivatives
|
See Note 32 regarding “Financial Instruments”.
| D. |
Non-derivative financial liabilities
|
Non-derivative financial liabilities are measured at their respective fair values, at initial recognition and for disclosure purposes, at each reporting date. Fair value for disclosure purposes, is determined based on the quoted trading price in the market for traded debentures, whereas for non-traded loans, debentures and other financial liabilities is determined by discounting the future cash flows in respect of the principal and interest component using the market interest rate as at the date of the report.
F - 37
Note 5 – Cash and Cash Equivalents
|
As at December 31
|
||||||||
|
2017
|
2016
|
|||||||
|
$ thousands
|
||||||||
|
Cash in banks
|
1,313,710
|
320,199
|
||||||
|
Time deposits
|
103,678
|
6,436
|
||||||
|
Cash and cash equivalents
|
1,417,388
|
326,635
|
||||||
The Group’s exposure to credit risk, interest rate risk and currency risk and a sensitivity analysis with respect to the financial assets and liabilities is detailed in Note 32 “Financial Instruments”.
|
As at December 31
|
||||||||
|
2017
|
2016
|
|||||||
|
$ thousands
|
||||||||
|
Restricted cash and short-term deposits (1)
|
7,085
|
89,475
|
||||||
|
Other
|
59
|
70
|
||||||
|
7,144
|
89,545
|
|||||||
| (1) |
As at December 31, 2017, it mainly corresponds to the amount held in escrow account as collateral for contractual obligations, see note 21.B(a). It earns interest at a market interest rate of 0.07%
|
Note 7 – Trade Receivables, Net
|
As at December 31
|
||||||||
|
2017
|
2016
|
|||||||
|
$ thousands
|
||||||||
|
Trade Receivables
|
44,137
|
285,100
|
||||||
|
Less – allowance for doubtful debts
|
-
|
(568
|
)
|
|||||
|
44,137
|
284,532
|
|||||||
Note 8 – Other Current Assets
|
As at December 31
|
||||||||
|
2017
|
2016
|
|||||||
|
$ thousands
|
||||||||
|
Advances to suppliers
|
673
|
141
|
||||||
|
Prepaid expenses
|
1,818
|
6,039
|
||||||
|
Derivative instruments
|
1,471
|
1,831
|
||||||
|
Government agencies
|
7,408
|
14,677
|
||||||
|
Contingent consideration (a)
|
18,004
|
-
|
||||||
|
Other receivables (b)
|
6,378
|
27,085
|
||||||
|
35,752
|
49,773
|
|||||||
| (a) |
This represents the contingent consideration receivable from ISQ as a part of the transaction described in Note 29.
|
| (b) | As at December 31, 2016, this includes discontinued operations’ receivables of $16 million from insurance claims, transmission line sale, transaction costs and selective consumption tax on heavy fuel oil. |
F - 38
Note 9 – Inventories
|
As at December 31
|
||||||||
|
2017
|
2016
|
|||||||
|
$ thousands
|
||||||||
|
Fuel and spare parts (a)
|
-
|
91,659
|
||||||
| (a) |
Inventories as at December 31, 2016 belongs to discontinued operations.
|
Note 10 – Investment in Associated Companies
| A. |
Condensed information regarding significant associated companies
|
| 1. |
Condensed financial information with respect to the statement of financial position
|
|
ZIM
|
Qoros*
|
|||||||||||||||
|
As at December 31
|
||||||||||||||||
|
2017
|
2016
|
2017
|
2016
|
|||||||||||||
|
$ thousands
|
||||||||||||||||
|
Principal place of business
|
International
|
China
|
||||||||||||||
|
Proportion of ownership interest
|
32
|
%
|
32
|
%
|
50
|
%
|
50
|
%
|
||||||||
|
Current assets
|
579,595
|
465,892
|
235,237
|
259,804
|
||||||||||||
|
Non-current assets
|
1,222,743
|
1,237,740
|
1,259,762
|
1,273,862
|
||||||||||||
|
Current liabilities
|
(686,693
|
)
|
(530,842
|
)
|
(
870,192
|
)
|
(773,946
|
)
|
||||||||
|
Non-current liabilities
|
(1,209,137
|
)
|
(1,273,447
|
)
|
(
804,062
|
)
|
(695,484
|
)
|
||||||||
|
Non-controlling interests
|
(6,509
|
)
|
(3,125
|
)
|
-
|
—
|
||||||||||
|
Total net assets attributable to the Group
|
(100,001
|
)
|
(103,782
|
)
|
(
179,255
|
)
|
64,236
|
|||||||||
|
Share of Group in net assets
|
(32,000
|
)
|
(33,210
|
)
|
(89,627
|
)
|
32,118
|
|||||||||
|
Adjustments:
|
||||||||||||||||
|
Write back/(impairment) of assets and investments
|
28,758
|
(72,263
|
)
|
—
|
—
|
|||||||||||
|
Excess cost
|
123,242
|
187,216
|
—
|
—
|
||||||||||||
|
Loans
|
—
|
—
|
61,645
|
55,798
|
||||||||||||
|
Financial guarantee
|
—
|
—
|
29,676
|
29,677
|
||||||||||||
|
Book value of investment
|
120,000
|
81,743
|
1,694
|
117,593
|
||||||||||||
| * |
Qoros is a joint venture (See Note 10.C.b). The current assets include cash and cash equivalent of $12 million (2016: $67 million). The current and non-current liabilities excluding trade and other payables and provisions amount to $1 billion (2016: $1.1 billion). In January 2018, the Group’s equity interest in Qoros was reduced to 24% (see Note 33.2.A).
|
F - 39
Note 10 – Investment in Associated Companies (Cont’d)
| 2. |
Condensed financial information with respect to results of operations
|
|
ZIM
|
Tower*
|
Qoros**
|
||||||||||||||||||||||||||
|
For the year ended December 31
|
||||||||||||||||||||||||||||
|
2017
|
2016
|
2015
|
2015
|
2017
|
2016
|
2015
|
||||||||||||||||||||||
|
$ thousands
|
||||||||||||||||||||||||||||
|
Revenues
|
2,978,291
|
2,539,296
|
2,991,135
|
461,778
|
280,079
|
377,456
|
232,114
|
|||||||||||||||||||||
|
(Loss) / income ***
|
6,235
|
(168,290
|
)
|
2,253
|
(737
|
)
|
(
242,395
|
)
|
(285,069
|
)
|
(392,427
|
)
|
||||||||||||||||
|
Other comprehensive (loss) / income ***
|
(3,871
|
)
|
(12,351
|
)
|
(1,948
|
)
|
—
|
31
|
7
|
(19
|
)
|
|||||||||||||||||
|
Total comprehensive (loss) / income
|
2,364
|
(180,641
|
)
|
305
|
(737
|
)
|
(
242,364
|
)
|
(285,062
|
)
|
(392,446
|
)
|
||||||||||||||||
|
Kenon’s share of comprehensive
|
||||||||||||||||||||||||||||
|
(loss) / income
|
756
|
(57,805
|
)
|
98
|
(189
|
)
|
(121,182
|
)
|
(142,531
|
)
|
(196,223
|
)
|
||||||||||||||||
|
Adjustments
|
8,538
|
9,856
|
9,418
|
(609
|
)
|
(16
|
)
|
(3
|
)
|
—
|
||||||||||||||||||
|
Kenon’s share of comprehensive
|
||||||||||||||||||||||||||||
|
(Loss) / Income presented in the books
|
9,294
|
(47,949
|
)
|
9,516
|
(798
|
)
|
(121,198
|
)
|
(142,534
|
)
|
(196,223
|
)
|
||||||||||||||||
| * |
Distributed as dividend-in-kind in July 2015 (see Note 10.C.c). Results of operations for 2015 corresponds to the six months ended June 30, 2015.
|
| ** |
Qoros is a joint venture (See Note 10.C.b). The depreciation and amortization, interest income, interest expense and income tax expenses recorded by Qoros during the year were $
102
million, $2 million, $
50
million and $14 thousand (2016: $119 million, $2 million, $63 million and $37 thousand; 2015: $75 million, $2 million, $2 million and $92 thousand) respectively.
|
| *** |
Excludes portion attributable to non-controlling interest.
|
F - 40
Note 10 – Investment in Associated Companies (Cont’d)
| B. |
Associated companies that are individually immaterial
|
|
Associated Companies
|
||||||||||||
|
As at December 31
|
||||||||||||
|
2017
|
2016
|
2015
|
||||||||||
|
$ thousands
|
||||||||||||
|
Book value of investments as at December 31
|
-
|
8,897
|
9,008
|
|||||||||
| C. |
Additional information
|
| a. |
ZIM
|
| 1. |
The container shipping industry is dynamic and volatile and has been marked in recent years by instability, which is characterized by slower growth of demand and worsening overcapacity. This situation combined with carriers’ ambitions to increase and protect their market share led, freight rates to fall sharply in most of the trades, mainly since the second half of 2015. The first half of 2016 continued to be very challenging. Container freight rates hit historical lows across major trades, as new vessel capacity was added, while market demand remained weak. Since the second half of 2016
and through
the
third quarter
of 2017
,
freight rates have increased
marginally, while partially decreased towards the end of 2017
.
In view of the aforementioned business environment, the volatile bunker prices and in order to improve
ZIM’s
results of operations and liquidity position, Management continues to optimize
ZIM’s
network rationalizations including establishment of new partnerships, invest in upgrading customer services and constantly strive to create and maintain efficiencies and cost reductions. However, an adverse trend could negatively affect the entire industry and also affect
ZIM’s
business, financial position, assets value, results of operations, cash flows and compliance with certain financial covenants.
As of December 31, 2017
ZIM’s
total equity amounted to a negative balance of
$
93 million (compared to negative balance of
$
101 million as of December 31, 2016) and its working capital amounted to a negative balance of
$
107 million (compared to negative balance of
$
65 million as of December 31, 2016).
During the year ended December 31, 2017,
ZIM
recorded operating profit of
$
135 million (compared to operating loss of
$
52 million during the year ended December 31, 2016 and operating profit of
$
98 million during the year ended December 31, 2015) and net profit of
$
11 million (compared to net loss of
$
164 million during the year ended December 31, 2016 and net profit of
$
7 million during the year ended December 31, 2015).
As at December 31, 2017,
ZIM
complies with its amended financial covenants,
ZIM’s
liquidity amounts to
$
182 million (Minimum Liquidity required is
$
125 million).
In order to improve its financial position and liquidity, during the second half of 2016,
ZIM
took the following steps:
(a)
ZIM
approached some of its creditors for the purpose of rescheduling payments.
|
Below are the main components of the agreements reached:
| 1) |
Deferral of payments in a total amount of $116 million (the “Deferred Amounts”), during a period of up to 12 months starting on September 30, 2016, each creditor with relation to its specific contracts. The repayment of the Deferred Amounts will begin as from January 1, 2018 on a straight line basis and will end on December 31, 2020 (the “Repayment Period”). In case any respective agreement expires before the end of the Repayment Period, the unpaid balance of Deferred Amounts will be paid in full upon expiration.
|
| 2) |
The Deferred Amounts bear interest, at an annual rate of Libor + 2.8% paid quarterly in cash.
|
| 3 ) |
ZIM
granted security related to its rights and interests deriving from certain of its receivables, for securing the repayment of the Deferred Amounts (using a similar receivable-backed facility as described in No). The balance of the secured Deferred Amounts as of December 31, 2017 amounted to
$
108 million
|
| 4 ) |
In case of excess cash, as defined in the rescheduling agreements, a mechanism of mandatory prepayments of the abovementioned rescheduled amounts and their related accrued interest, will apply.
|
Further to such rescheduling, certain agreements of containers leases previously classified as operational leases were reclassified as financial leases, resulting in recognition of additional assets and liabilities in a total amount of US$ 73 million.
F - 41
Note 10 – Investment in Associated Companies (Cont’d)
| (b) |
ZIM obtained amendments to its financial covenants in 2016. Below are the current financial covenants of ZIM:
|
| 1) |
Fixed Charge Cover ratio - The required ratio will be examined on March 31, 2018 onwards, and will gradually increase from 0.78:1 as required on March 31, 2018 to 0.99:1 as required on March 31, 2019 and remain in that level thereafter.
|
| 2) |
Total Leverage ratio - The required ratio will be examined on March 31, 2018 onwards, and will gradually decrease from 23.69:1 as required on March 31, 2018 to 6.64:1 as required on December 31, 2018 and remain in that level thereafter.
|
| 3) |
Minimum Liquidity - This covenant was amended as from March 31, 2016 to include all cash and cash equivalents available to
ZIM
without any restrictions. In addition, during 2016 and through (and including) September 30, 2016
ZIM
was required to stand a minimum liquidity of
$
150 million. Starting December 31, 2016 the minimum Liquidity required is reinstated at
$
125 million.
|
As at December 31, 2017,
ZIM
is in compliance with its financial covenants. According to these consolidated Financial Statements,
ZIM’s
liquidity amounts to
$
182 million (Minimum Liquidity required is
$
125 million).
ZIM’s financial position, liquidity and the risk of deviation from financial covenants depend on the recovery of the shipping industry and especially the freight rates. Current economic conditions make forecasting difficult, and there is possibility that actual performance may be materially different from Management plans and expectations.
In the opinion of ZIM’s management and its Board of Directors, the updated forecast and the abovementioned actions with regards to rescheduling of payments and covenants amendment, enables
ZIM
to meet its liabilities and operational needs and to comply with the new set of financial covenants for a period of at least 12 months following the balance sheet date.
| 2. |
Further to the recent trends in the shipping industry, ZIM tested its assets for impairment based on IAS 36, where ZIM operates an integrated liner network, as one cash-generating unit (“CGU”). ZIM estimated its recoverable amount on the basis of fair value less costs to sell, using the discounted cash flow (“DCF”) method, measured at Level 3 fair value measurement under IFRS 13. The impairment test resulted with a recoverable amount exceeding the carrying amount of the CGU with a range between $
418
million and $
543
million, and therefore no impairment was recognized. Although ZIM believes the assumptions used for impairment are reasonable and acceptable, no assurance can be made against the level of bunker prices and freight rates sustainability.
|
Kenon independently and separately from ZIM, appointed a third-party to perform a valuation of its 32% equity investment in ZIM in accordance with IAS 28
Investments in Associates
and IAS 36
Impairment of Assets
. On March 20, 2018 Kenon concluded that as of December 31, 2017, the carrying amount of the investment in ZIM is lower than the recoverable amount, and therefore, no impairment was recognized.
For the purposes of management’s impairment evaluation of the Group’s investment, ZIM, which operates integrated network liner activity, has one CGU, which consists of all of ZIM’s assets. The recoverable amount is based on the higher of the value in use and the fair value less cost of disposal (“FVLCOD”). The valuation is predominantly based on publicly available information and earnings of ZIM over the 12-month periods to September 2017. The valuation approach was based on the equity method, recognizing the cost of investment and share of losses in ZIM, and subsequently to assess a maintainable level of earnings to form a view on the appropriate valuation range as at December 31, 2017.
During the recent valuation, due to the uncertainty experienced in shipping sector, and a limited evidence of a sustained industry recovery as at December 31, 2017, the following data points and benchmarks were considered by the independent valuer:
| A. |
The implied EV/EBITDA range based on the indicative range of fair values for Kenon’s 32% stake in ZIM and the actual EBITDA for the 12-month to December 31, 2017; and,
|
| B. |
The implied EV/EBITDA range based on the indicative range of fair values for Kenon’s 32% stake in ZIM and the estimated sustainable EBITDA computed based on a 9% margin and actual revenue for the 12-month to September 30, 2017. The estimated maintainable margin was based on a 30% discount applied to analyst estimate of the industry margin.
|
The independent valuer arrived at a range of equity valued between $
120 million and $180
million after adjustments for Net Debt. The fair value measurement was categorized as Level 3 fair value based on the inputs in the valuation technique used.
For the year ended December 31, 2016, Kenon recognized an impairment loss of $72 million in ZIM. Based on the above assessment, Kenon will
record a
write-back impairment of $29 million
in write back/(impairment) of assets and investments
, bringing the carrying value in ZIM as at December 31, 2017 to $120 million.
F - 42
Note 10 – Investment in Associated Companies (Cont’d)
| 3. |
In 2015, ZIM recognized an impairment of the vessels held for sale in an amount of $7 million as impairment under other operating expenses.
|
| 4. |
During 2015, ZIM sold all of its holdings in an associated company which resulted in a disposal gain of $32 million recognized in ZIM’s financial statements. Kenon's share of the disposal gain is $10 million and is recognized in share of net income and losses from associated companies.
|
| 5. |
During 2016, ZIM sold a portion of its holdings in an associated company and ceased to have significant influence over such investee. ZIM recognized a disposal gain in an amount of $16 million, Kenon's share of the disposal gain is $5 million and is recognized in share of net income and losses from associated companies.
|
| 6. |
During 2017, ZIM did not sell any of its holdings.
|
| b. |
Qoros Automotive Co. Ltd. (“Qoros”)
|
| 1. |
As at December 31, 2017, the Group holds, through a wholly-owned and controlled company, Quantum (2007) LLC (“Quantum”) the equity interest of Qoros in a 50/50 agreement with a Chinese vehicle manufacturer – Chery Automobiles Limited (“Chery”), which is engaged in manufacture of vehicles using advanced technology, and marketing and distribution of the vehicles worldwide under a quality brand name.
|
| 2. |
Qoros introduces a new strategic partner
In January 2018, Quantum and Chery diluted their shares in Qoros to an entity related to Baoneng Group, giving it a 51% equity interest in Qoros. Quantum and Chery’s equity interest in Qoros were reduced to 24% and 25%, respectively (see Note 33.2.A).
|
| 3. |
As at December 31, 2017, Kenon’s investment in Qoros amounts to $1.7 million (December 31, 2016 – $117 million).
|
| 4. |
In January and February 2016, Kenon and Wuhu Chery each, through Quantum, a Kenon subsidiary, provided a RMB275 million ($42 million) convertible loan to Qoros to support its working capital requirements.
|
During 2015, Kenon and Chery each, through a subsidiary, provided a RMB800 million ($130 million) convertible loan to Qoros to support its ongoing development.
| 5. |
Qoros incurred a net loss of RMB 1.4 billion (approximately $211 million) and had net current liabilities of approximately RMB 3.7 billion (approximately $555 million) for the year ended December 31, 2017 (RMB 1.9 billion (approximately $284 million) and RMB 3.57 billion (approximately $515 million) as of December 31, 2016 respectively).
Qoros has given careful consideration to the future of its liquidity. With its available sources of finance and the addition of the new strategic partner (see Note 33.2.A), Qoros believes it will have sufficient financial resources to continue as a going concern for the next twelve months.
|
| 6. |
Ansonia Loans
|
| a. |
Overview
|
On April 22 and September 2, 2016, Ansonia Holdings Singapore B.V. ("Ansonia"), which owns approximately 58% of the outstanding shares of Kenon, entered an agreement to provide loans (“Ansonia loans”) in an aggregate amount of up to RMB 450 million ($69 million) with an interest rate of 6% per annum, through Quantum, to support Qoros. Wuhu Chery completed its provision of loans to Qoros in the same amount and on similar conditions. Set forth below is an overview of the Ansonia loans as of December 31, 2017:
|
Date Granted
|
RMB million
|
Plus certain interest
|
Convertible into Equity
Discount Rate 1 |
Loan Transfer Date from
Quantum to Qoros 2 |
|
Tranche 1 / Apr 2016
|
150
|
6%
|
10%
|
May 20, 2016
|
|
Tranche 2 / Apr 2016
|
150
|
June 28, 2016
|
||
|
Tranche 3 / Sep 2016
|
150
|
25%
|
September 6, 2016
|
|
|
Total
|
450
($69 million) |
|||
1.
To facilitate potential investment by a third party in Qoros, Ansonia loans are automatically convertible into equity in Quantum in the event of a third-party financing at Qoros meets certain conditions, or when Ansonia loans are repaid in relation to such third-party financing. The loans will be convertible into equity of Quantum at a 10% (Tranche 1 and 2) and at a 25% discount (Tranche 3) discount to the implied value of Qoros based upon the third-party financing.
2.
Loans carry the same term of 9 months from the first transfer date
F - 43
Note 10 – Investment in Associated Companies (Cont’d)
| b. |
Repayment of the Ansonia loans
|
| i. |
Ansonia loans to Quantum are non-recourse to Kenon, and limited recourse to Quantum. Quantum’s obligations to repay these loans when Quantum receives loan repayments from Qoros; or Quantum sells all or portion of its interest in Qoros.
|
| ii. |
Qoros has agreed to secure and undertaken to enter into the pledge for the Quantum and Wuhu Chery loans with certain collateral. The pledge is subjected to approvals to be received. Qoros' pledge of this collateral will be released upon a conversion of the shareholder loans into equity (as described below) or upon repayment.
|
| iii. |
Quantum agreed to assign its rights, title and interests in the collateral securing these loans to Ansonia.
|
| iv. |
Ansonia loans can be repaid by Quantum without penalty or premium prior to the conversion into Equity of Quantum.
|
| v. |
Repayment of Ansonia loan of $20 million was made in January 2018 by Quantum. The remaining outstanding balance will be repaid
upon repayment of shareholder loans owing from Qoros to Quantum, which is expected to occur
within the next 6 months.
|
| c. |
Conversion of the Ansonia loans into Equity (“Conversion”)
|
Upon
a
conversion, Kenon's indirect interest in Qoros will be diluted. From the point of the conversion until the third anniversary of such conversion, Ansonia will have the option to convert its equity in Quantum into an equivalent value of equity in Qoros, subject to regulatory acceptance, Qoros', Chery's and Wuhu Chery's approvals. As the plan is to repay the outstanding Ansonia loan within the next 6 months, the conversion is unlikely to happen.
| 7. |
Financial Guarantees Provision and
Releases
|
| a. |
On June 30, 2016, Kenon increased its previously recognized provision of $30 million to $160 million in respect to Kenon’s “back-to-back” guarantee obligations to Chery (RMB1,100 million), in respect of guarantees that Chery has given for Qoros’ bank debt and has pledged a portion of its interests in Qoros to secure Qoros’ bank debt. In addition to the current liquidity needs of Qoros, its financial position and Kenon’s strategic intent, the provision was made due to uncertainty in the Chinese automobile market. As a result, Kenon recognized a $130 million charge to expense for such financial guarantees in its consolidated statement of profit or loss in 2016.
These back-to-back guarantees consist of (i) a back-to-back guarantee of one-half of the principal amount of Chery’s guarantee of RMB1.5 billion with respect to Qoros’ RMB3 billion facility, and (ii) a back-to-back guarantee of one-half of the principal amount of Chery’s guarantee of Qoros’ RMB700 million facility, and interest and fees, if applicable.
|
| b. |
On December 25, 2016. Kenon has agreed to provide a RMB250 million (approximately $36 million) shareholder loan to Qoros, and in relation to this loan, the maximum amount of Kenon’s back-to-back guarantee obligations to Chery has been reduced by RMB250 million. As part of the loan to Qoros, Kenon’s back-to-back guarantee obligations to Chery with respect to Chery’s guarantee of Qoros’ RMB3 billion loan facility with the Export-Import Bank of China (“EXIM Bank”) have been reduced by one third, and the maximum amount of Kenon’s obligations under this back-to-back guarantee (subject to certain obligations to negotiate fees and interest described in the table below) has been reduced from RMB750 million to RMB500 million (approximately $72 million). In addition, Ansonia has committed to fund RMB25 million (approximately $4 million) of Kenon’s remaining back-to-back guarantee obligations to Chery in certain circumstances (“Ansonia Commitment”).
|
Chery has agreed to make a corresponding RMB250 million loan to Qoros. The proceeds of these loans were used to support Qoros’ ordinary course working capital requirements and Qoros’ investments in new initiatives, such as new-energy vehicles, while it continues its fund raising efforts.
As part of this transaction, Quantum pledged approximately 9% of the outstanding shares of Qoros to Chery to secure the amount of the back-to-back guarantee reduction. Chery may also borrow from Quantum up to 5% of Qoros’ outstanding shares to meet its pledge obligations under a Qoros RMB 1.2 billion loan facility with EXIM Bank. The number of Qoros shares pledged to Chery is subject to adjustment from time to time. In certain circumstances Quantum must pledge additional shares (to the extent it has unencumbered shares), and in other circumstances the pledged shares may be released and the borrowed shares must be returned, e.g., in the event that Quantum is required to pledge additional shares to secure the RMB1.2 billion EXIM Bank facility (Quantum has previously pledged a significant portion of its Qoros shares to secure Qoros’ obligations under Qoros’ RMB 1.2 billion loan facility with EXIM Bank).
Kenon has been informed that, in order to facilitate Kenon’s above mentioned reduction in Kenon’s back-to-back guarantee obligations to Chery, an affiliate of Kenon’s major shareholder has given certain undertakings to Chery with respect to the released guarantee obligations.
F - 44
Note 10 – Investment in Associated Companies (Cont’d)
| c. |
On March 10, 2017, Kenon announces that it has agreed to fund up to RMB777 million (approximately $114 million) to Qoros in relation to the full release of its remaining RMB825 million (approximately $125 million) back-to-back guarantee obligations to Chery in two tranches, which releases Kenon from commitments to pay any related interest and fees to Chery under the guarantees.
|
On March 10, 2017, Kenon transferred RMB388.5 million (approximately $57 million) ("First Tranche Loans") to Qoros in relation to a reduction of RMB425 million (approximately $63 million) of Kenon's back-to-back guarantee obligations to Chery, including related interest and fees and the provision of the Second Tranche Loans shall be at Kenon's discretion.
As part of the First Tranche Loans, in relation to 50% reduction of the guarantee, Kenon funded 50% for Kenon and 50% on behalf of Chery.
On April 25, 2017, Kenon funded RMB100 million (approximately $15 million) as part of the remaining provision of RMB388.5 million to Qoros (the “Second Tranche Loans”) on similar terms in connection with the remaining RMB425 million reduction in its back-to-back guarantees.
Kenon’s remaining liability under its guarantee obligations totals
RMB320 million in respect of
RMB288.5 million (approximately $44 million)
principal amount of debt
as at December 31, 2017.
In the event that Chery's obligations under its guarantees are reduced, through amortization of the loans or guarantee releases, Kenon is entitled to the proportionate return from Chery of the loans provided on Chery's behalf (i.e., up to RMB388.5 million (approximately $57 million) with respect to the First Tranche Loans and the Second Tranche Loans) and the release of the pledges described above.
Quantum will pledge approximately 10.3% of the outstanding shares of Qoros to Chery in relation to 50% of the guarantee releases, which pledges are enforceable to the extent Kenon would have been required to make payments under such guarantees but for the guarantee releases.
In addition, Chery may also borrow from Quantum 5% of Qoros' outstanding shares in relation to Kenon's provision of the First Tranche Loans and the Second Tranche Loans. The number of Qoros shares pledged to Chery which are borrowed from Quantum is subject to adjustment from time to time.
Set forth below is an overview of the RMB850 million back-to-back guarantees provided by Kenon in respect of Qoros' indebtedness, reflecting the reduction of the back-to-back guarantees described above:
|
Loans
|
Timing
|
Amount of Loans to Qoros
|
Amount of Guarantee Obligations Prior to Investment
|
Release of Kenon Guarantees to Chery
|
Remaining Guarantee Obligations Post-Investment
|
Pledge of Qoros Shares in relation to Investment
|
|
|
|
in RMB million
|
||||
|
First Tranche
|
March 2017
|
388.5
|
850
1
|
425
3
|
425
|
5.17%
|
|
Second Tranche
|
April 2017
|
100
|
425
|
105
3
|
320
|
5.17%
|
|
Third Tranche
|
At Kenon's discretion
|
288.5
|
320
|
320
3
|
—
|
|
|
Total
|
|
777
|
—
|
850
3
|
—
|
10.3%
2
|
1. Kenon's major shareholder Ansonia Holdings Singapore B.V. has committed to fund RMB25 million (approximately $4 million) of Kenon's back-to-back guarantee
obligations
in certain circumstances.
2. Excludes up to 5% of Qoros shares which Chery may borrow from Quantum to meet its pledge obligations under the Qoros RMB1.2 billion loan facility, as discussed above.
3. Plus
interest
and fees.
Following the pledges above, and taking account of prior pledges by Quantum of Qoros shares to Qoros' lenders and to Chery, substantially all of Kenon's interest in Qoros will be pledged, or could be pledged pursuant to the equity borrowing arrangements with Chery described above.
The proceeds of the First Tranche Loans was used to support Qoros' ordinary course working capital requirements, debt service requirements and investments in new initiatives, such as new-energy vehicles, while Qoros continues its fund raising efforts. The transactions
enabled
Kenon to support Qoros and its fundraising efforts, while reducing its back-to-back guarantee obligations to Chery.
Due to the
change
in equity holdings of Qoros in 2018, adjustments to the respective parties’ pro rata obligations under the Qoros’ bank guarantees and pledges were made (see Note 33.2.A).
F - 45
Note 10 – Investment in Associated Companies (Cont’d)
| 8. |
Background of Financial Guarantees
|
The guarantees by Kenon described below have been amended and released as described in paragraph 7 above
| a. |
In July 2012, Chery provided a guarantee to the banks, in the amount of RMB1.5 billion ($242 million), in relation to an agreement with the banks to provide Qoros a loan, in the amount of RMB3 billion ($482 million). In November 2015, Kenon has provided back-to-back guarantees to Chery of RMB750 million (approximately $115 million) in respect of certain of Qoros’ indebtedness and has committed to negotiate with Chery in good faith to find a solution so that Kenon’s and Chery’s liabilities for the indebtedness of Qoros under Qoros’ RMB3 billion credit facility are equal in proportion; Kenon has similarly agreed to try to find an acceptable solution in respect of Kenon’s and Chery’s liabilities for the indebtedness of Qoros under Qoros’ 1.5 RMB billion facility, but without any obligation on Kenon to be liable for more than the amount set forth in its back-to-back guarantee to Chery. As a result, if Qoros is unable to meet its operating expenses or is unable to comply with the terms of certain of its debt agreements, Kenon may be required to make payments under its guarantees to Chery. In a back-to-back arrangement Kenon committed to Chery to pay half of every amount it will be required to pay with respect to the above-mentioned guarantee (“the 2012 Guarantee"). The fair value of the guarantee has been recorded in the financial statements.
|
Prior to Kenon’s spin-off from IC, IC provided the 2012 Guarantee to Qoros. This guarantee by IC is a back-to-back guarantee of Chery’s guarantee of up to RMB1.5 billion (approximately $240 million) under this credit facility, and the obligation of IC under this back-to-back guarantee is up to RMB888 million (approximately $142 million), including related interest and fees.
On February 12, 2015, Kenon has agreed to provide a RMB400 million (approximately $64 million) loan to Qoros to support its ongoing development, and in relation to the provision of this loan, IC’s back-to-back guarantee of Qoros’ debt was released in full. Chery’s guarantee under the Qoros facility of up to RMB1.5 billion (approximately $240 million) is not being released in relation to the release of IC’s back-to-back guarantees and, as described above, in November 2015 Kenon has provided back-to-back guarantees to Chery of RMB750 million
.
| b. |
On May 12, 2015, Qoros has signed a Consortium Loan Agreement with the Export-Import Bank of China, and China Construction Bank Co., LTD, Suzhou Branch, concerning the Project of Research and Development of Hybrid Model (“Loan Agreement”), for an amount of RMB700 million ($108 million) or in USD not exceeding the equivalent to RMB480 million ($78 million) (the “Facility”).
|
| c. |
On June 15, 2015, this Facility was secured by Chery Automobile Co., Ltd (“Chery Guarantee Deed”) and pledged with Qoros’ 90 vehicle patents with an appraisal value of minimum RMB3.1 billion ($
500 million
). The Loan Agreement’s term of 102 months bears a 5-years interest rate quoted by the People’s Bank of China in RMB at LIBOR+10%, or in USD at LIBOR+3.50% per annum.
|
With relation to the above, Kenon provided a RMB350 million ($54 million) guarantee of this financing agreement to Chery for up to 50% of Chery’s Guarantee. As at December 31, 2016, Qoros had drawn down the Facility of RMB700 million ($108 million) with an interest rate of 5.39% (RMB 700 million as at December 31, 2015). The fair value of the guarantee has been recorded in the financial statements.
| d. |
On May 15, 2015, Kenon and Chery each provided a RMB400 million ($65 million) loan to Qoros to support its ongoing development. RMB25 million ($5 million) of each loan can be converted into equity on conditions set out in the agreement. As a result, Kenon’s ownership percentage in Qoros will not increase upon Qoros’ full, or partial, conversion of Kenon’s RMB400 million ($65 million) shareholder loan into equity.
|
Kenon expects all, or a portion, of the shareholder loans to convert into additional equity in Qoros upon the satisfaction of certain conditions, including the approval by the relevant Chinese authority.
Kenon funded the RMB400 million ($65 million) shareholder loan through drawdowns of $65 million under a Credit Facility with its former parent, IC.
| e. |
On July 31, 2014, in order to secure additional funding for Qoros of approximately RMB 1.2 billion ($200 million as of August 7, 2014) IC pledged a portion of its shares (including dividends derived therefrom) in Qoros, in proportion to its share in Qoros’s capital, in favor of the Chinese bank providing Qoros with such financing. Simultaneously, the subsidiary of Chery that holds Chery’s rights in Qoros also pledged a proportionate part of its rights in Qoros. Such financing agreement includes, inter alia, liabilities, provisions regarding covenants, events of immediate payment and/or early payment for violations and/or events specified in the agreement. The lien agreement includes, inter alia, provisions concerning the ratio of securities and the pledging of further securities in certain circumstances, including pledges of up to all of Quantum’s shares in Qoros (or cash), provisions regarding events that would entitle the Chinese Bank to exercise the lien, certain representations and covenants, and provisions regarding the registration and approval of the lien.
|
F - 46
Note 10 – Investment in Associated Companies (Cont’d)
As part of the reduction of guarantee obligations in Note 10.C.b.7, Kenon has pledged approximately 9% of the outstanding shares of Qoros to Chery to secure the amount of the back-to-back guarantee reduction. Chery may also borrow from Kenon up to 5% of Qoros' outstanding shares to meet its pledge obligations under the abovementioned RMB 1.2 billion loan facility. As of December 31, 2016, in relation to this loan facility of RMB 1.2 billion, Kenon and Chery have each pledged 22.6% of its equity interest in Qoros.
Due to the introduction of the additional investor in January 2018, financial guarantees will be adjusted to the respective parties pro rata obligation based on the change in equity holdings of Qoros (see Note 33.2.A).
| 9. |
Business Plans
|
| a. |
In September 2014, Qoros’ board of directors reviewed a business development plan for the next ten years. Subsequently, Qoros’ board of directors approved a five-year business plan, which reflected lower forecasted sales volumes and assumed the minimal level of capital expenditure necessary for such sales volumes. As a result, Qoros management performed impairment tests in October 2015 and February 2016. In March 2017, Qoros’ board of directors approved a new business development plan for the next five years. As a result, Qoros management performed impairment tests in March 2017 on Qoros’ operating assets as of December 31, 2016 and intangible assets.
As at December 31, 2017, Kenon concluded that the recoverable amount of its CGU, based on the 3rd-party transaction with Baoneng Group (see Note 33.2.A), was higher than the carrying value (adjusted for depreciation and amortization). The recoverable amount was determined based on fair value of Qoros’ assets less the costs of disposal. Therefore, no impairment was recognized in Qoros’ December 31, 2017 financial statements in respect of its CGU.
|
| c. |
Tower
|
| 1. |
In March 2015, Tower accelerated the conversion of $80 million of its outstanding Series F Bonds into ordinary shares of Tower. As a result of the issuance of shares, Kenon's interest in Tower was reduced from 29% to 23% of Tower’s equity and Kenon realized a dilution gain of $32 million.
|
| 2. |
On May 27, 2015, Kenon’s shareholders approved a capital reduction, contingent upon the approval of the High Court of the Republic of Singapore, to enable Kenon to distribute, on a pro rata basis, some, or all, of the 18,030,041 ordinary shares of Tower held by Kenon, as well as 1,669,795 ordinary shares of Tower underlying the 1,669,795 Series 9 Warrants of Tower held by Kenon, to holders of Kenon’s ordinary shares. On June 25, 2015, the High Court of the Republic of Singapore approved the reduction of Kenon’s issued share capital, enabling Kenon to declare a distribution of some, or all, of its interest in Tower by distribution in specie. On June 30, 2015, the investment in Tower was reclassified to Assets held for distribution.
|
| 3. |
On July 7, 2015, Kenon’s board of directors declared a pro rata distribution (the “Distribution”) in specie of 18,030,041 ordinary shares of Tower (the “Tower Shares”) to Kenon’s shareholders of record as of the close of trading on July 20, 2015 (the “Record Date”). The Distribution occurred on July 23, 2015 (the “Distribution Date”) and is one of the first key steps in the implementation of Kenon’s strategy, which provided Kenon Shareholders with direct access to Tower, which Kenon believes is in the best interests of its shareholders.
|
| 4. |
The Tower Shares to be distributed in the Distribution represent all of the shares in Tower owned by Kenon, excluding the 1,669,795 shares in Tower underlying certain warrants held by Kenon. As of July 7, 2015, Kenon had 53,682,994 ordinary shares outstanding. Accordingly, each Kenon Shareholder as of the Record Date received approximately 0.335861 of a Tower Share for every Kenon Share held by such shareholder as of the Record Date. The fair value of the distribution in kind amounts to $255 million. As a result of this distribution, the Group recognized a gain from distribution of dividend in kind of $210 million. The gain arose from the difference between the fair value of the distribution and the carrying amount of the investment as required by IFRIC 17
Distributions of non-cash assets to owners
.
|
| 5. |
After the distribution, Kenon beneficially owned 1,669,795 Warrants representing approximately 2.0% of outstanding Ordinary Shares of Tower. On August 5, 2016, Kenon sold 1,699,795 Series 9 Warrants of Tower for proceeds of approximately $11.4 million.
|
F - 47
Note 10 – Investment in Associated Companies (Cont’d)
| D. |
Details regarding dividends received from associated companies
|
|
For the Year Ended December 31
|
||||||||||||
|
2017
|
2016
|
2015
|
||||||||||
|
$ thousands
|
||||||||||||
|
From associated companies
|
382
|
743
|
4,487
|
|||||||||
| E. |
Restrictions
|
Qoros
Qoros has restrictions with respect to distribution of dividends and sale of assets deriving from legal and regulatory restrictions, restrictions under the joint venture agreement and the Articles of Association and restrictions stemming from credit received.
ZIM
The holders of ordinary shares of ZIM are entitled to receive dividends when declared and are entitled to one vote per share at meetings of ZIM. All shares rank equally with regard to the ZIM's residual assets, except as disclosed below.
In the framework of the process of privatizing ZIM, all the State of Israel’s holdings in ZIM (about 48.6%) were acquired by IC pursuant to an agreement from February 5, 2004. As part of the process, ZIM allotted to the State of Israel a special State share so that it could protect the vital interests of the State.
On July 14, 2014 the State and ZIM have reached a settlement agreement (the “Settlement Agreement”) that has been validated as a judgment by the Supreme Court. The Settlement Agreement provides, inter alia, the following arrangement shall
apply
: State’s consent is required to any transfer of the shares in ZIM which confers on the holder a holding of 35% and more of the ZIM’s share capital. In addition, any transfer of shares which confers on the holders a holding exceeding 24% but not exceeding 35%, shall require prior notice to the State. To the extent the State determines that the transfer involves a potential damage to the State’s security or any of its vital interests or if the State did not receive the relevant information in order to formulate a decision regarding the transfer, the State shall be entitled to inform, within 30 days, that it objects to the transfer, and it will be required to reason its objection. In such an event, the transferor shall be entitled to approach a competent court on this matter.
The Special State Share, and the permit which accompanies it, also imposes transferability restrictions on our equity interest in ZIM. Furthermore, although there are no contractual restrictions on any sales of our shares by our controlling shareholders, if major shareholders’ ownership interest in Kenon (controlling shareholders of Kenon) is less than 36%, or major shareholders cease to be the controlling shareholder, or sole controlling shareholder of Kenon, then Kenon’s rights with respect to its shares in ZIM (e.g., Kenon’s right to vote and receive dividends in respect of its ZIM shares),will be limited to the rights applicable to an ownership of 24% of ZIM, until or unless the State of Israel provides its consent, or does not object to, this decrease in major shareholders’ ownership or “control” (as defined in the State of Israel consent received by IC in relation to the spin-off). The State of Israel may also revoke Kenon’s permit if there is a material change in the facts upon which the State of Israel’s consent was based, upon a breach of the provisions of the Special State Share by Kenon, Mr. Ofer, or ZIM, or if the cancellation of the provisions of the Special State Share with respect to a person holding shares in ZIM contrary to the Special State Share’s provisions apply (without limitation).
The Special State Share is non-transferable. Except for the rights attached to the said share, it does not confer upon its holder voting rights or any share capital related rights.
F - 48
Note 11 – Subsidiaries
| A. |
Investments
|
| 1. |
I.C. Power
|
| a. |
Subsidiaries acquired in 2016
|
On December 29, 2015, IC Power Distribution Holdings Pte, Limited (hereinafter - “ICP Distribution”), a wholly owned subsidiary of
I.C Power
, entered into an agreement with Deorsa-Deocsa Holdings Ltd. to acquire 100% of the shares of Estrella Cooperatief BA, a holding company that indirectly owned two distribution companies in Guatemala (90.6% of Distribuidora de Electricidad de Occidente S.A.-DEOCSA and 92.68% of Distribuidora de Electricidad de Oriente S.A.-DEORSA) and 100% of two smaller related businesses (Redes Electricas de Centroamerica S.A.-RECSA and Comercializadora Guatemalteca Mayorista de Electricidad S.A.-GUATEMEL), collectively referred as “Energuate” for a purchase price equal to (i) the base purchase price, plus (ii) the deferred payment, and (iii) the final adjustment amount. On January 22, 2016, ICP Distribution closed the acquisition of Estrella Cooperatief BA for a total consideration of
$
266 million which included a base price of
$
242.5 million paid at the closing date and a deferred payment of
$
23.7 million paid on April 12, 2016. The consideration agreed was subject to working capital adjustments.
On April 28, 2017, Ernst & Young LLP (“the consultant”) issued the Accountant Ruling in connection with the disagreement between Actis and the Company on the final working capital adjustment purchase price-consideration. As a result of the consultant ruling, a
$
10.2 million adjustment was required to be made in favor of the Company. The Company has recorded such amount as other income in the consolidated statement of profit or loss.
On May 12 and May 17, 2017, Actis paid
$
272 thousand and authorized the release of
$
10 million from Escrow account, respectively.
As at December 31, 2017, these subsidiaries were disposed (See Note 29).
F - 49
Note 11 – Subsidiaries (Cont’d)
| 1. |
Consideration transferred
|
The following table summarizes the acquisition-date fair value of each major class of consideration transferred:
|
In thousands of $
|
||||
|
Cash consideration
|
242,536
|
|||
|
Deferred payment
|
23,750
|
|||
|
Total consideration transferred
|
266,286
|
|||
|
In thousands of $
|
||||
|
Total consideration transferred
|
266,286
|
|||
|
Cash and cash equivalent acquired
|
(60,227
|
)
|
||
|
Total
|
206,059
|
|||
| 2. |
Identifiable assets acquired and liabilities assumed
|
The following table summarizes the recognized amounts of assets acquired and liabilities assumed at the date of acquisition:
|
In thousands of $
|
||||
|
Property, plant and equipment
|
392,495
|
|||
|
Intangibles
|
195,148
|
|||
|
Deferred income tax assets, net
|
20,289
|
|||
|
Trade receivables, net
|
100,508
|
|||
|
Cash and cash equivalent
|
60,227
|
|||
|
Other assets
|
22,457
|
|||
|
Credit from bank and others
|
(288,290
|
)
|
||
|
Deferred income tax liabilities
|
(54,642
|
)
|
||
|
Trade payables
|
(108,193
|
)
|
||
|
Guarantee deposits from customers
|
(51,072
|
)
|
||
|
Other liabilities
|
(39,418
|
)
|
||
|
Total identifiable net assets acquired
|
249,509
|
|||
| 3. |
Measurement of fair value
|
The Company has measured the value of the acquired assets and liabilities at fair value on January 22, 2016, the date in which the Company gained control over Estrella Cooperatief BA. Additional information regarding the fair value measurement of the main items acquired is as follows:
| § |
Fixed assets were valued considering the market value provided by an appraiser;
|
| § |
Intangibles were measured based on the valuation of its Concessions;
|
| § |
Deferred taxes were recorded based on the temporary differences between the carrying amount of the assets and liabilities and their tax basis; and,
|
| § |
Non-controlling interests were measured as a proportion of the net assets identified on the acquisition date.
|
| 4. |
Goodwill
|
Goodwill arising from the acquisition has been recognized as follows:
|
In thousands of $
|
||||
|
Total consideration transferred
|
266,286
|
|||
|
Non-controlling interest
|
20,325
|
|||
|
Fair value of identifiable net assets
|
(249,509
|
)
|
||
|
Goodwill*
|
37,102
|
|||
| (*) |
This amount is not deductible for tax purposes and was determined in Quetzales.
|
Goodwill is explained by the strategic interest of the Company to expand its presence in distribution business. The goodwill is attributable mainly to the synergies expected to be achieved from integrating this business into the Group.
F - 50
Note 11 – Subsidiaries (Cont’d)
| 5. |
Recognition of revenues and profit or loss
During the period from the acquisition date to December 31, 2016 the revenues and profit contributed by Estrella Cooperatief BA. to the consolidated results are
$
515 million and
$
29 million, respectively. If the acquisition had occurred on 1 January 2016, management estimates that contribution to consolidated revenue would have been
$
551 million, and to consolidated profit for the period would have been
$
30 million. In determining these amounts, management has assumed that the fair value adjustments that arose on the date of acquisition would have been the same if the acquisition had occurred on January 1, 2016.
|
| b. |
Subsidiaries acquired in 2015
|
Advanced Integrated Energy Ltd. -
On June 8, 2015, IC Power executed an agreement with Hadera Paper Ltd., pursuant to which IC Power agreed to acquire from Hadera Paper 100% of the shares in Advanced Integrated Energy Ltd. (hereinafter “AIE”) and the Hadera Paper’s energy center. AIE holds a conditional license for the construction of a 120MW cogeneration power station in Israel. The total payment amounted to NIS 60 million (approximately $15.6 million) which involved two transactions:
| i. |
A business combination in the amount of NIS 36 million
($
9.4 million) as follows: (i) On August 10, 2015, after fulfilling the conditions precedent contemplated in the aforementioned agreement, IC Power completed the acquisition of AIE and paid NIS 1.7 million (approximately
$
460 thousand) to Hadera Paper Ltd. for the acquisition of the shares. (ii) IC Power through AIE paid NIS 34 million (approximately
$
9 million) for the repayment of the loan between Hadera Paper Ltd. and its former shareholder.
The purchase price allocation was as follows: Property, plant and equipment:
$
9 million; Intangible: $464 thousand; deferred tax liabilities: $123 thousand; and goodwill: $119 thousand.
|
| ii. | AIE acquired Hadera Paper’s energy center in the aggregate amount of NIS 24,000 (approximately $ 6 million). The Hadera Paper’s energy center generates electricity with a 18MW steam turbine. |
During 2016, AIE issued to IC Power several capital notes of NIS 130 million (approximately $33.7 million), according to their terms, the notes bear no interest and are repayable subject to the AIE’s sole discretion no earlier than five years after the issuance. Additional investments by IC Power will be required to enable AIE to complete construction of the power plant, which is expected to commence operations in
the first half of
2019.
| 2. |
I.C. Green
Energy Ltd (I.C. Green)
|
| a. |
As of December 31, 2017,
I.C. Green
held 90.85% of the shares of Primus Green Energy Inc. (“PGE”). In 2016,
I.C. Green
granted PGE additional $7.5 million as convertible bridge financing agreement. On December 10, 2016, all of the convertible loans including interest have been consolidated to a convertible bridge financing agreement in the amount of $26 million with interest of 7% annually. During 2017 I.C. Green granted PGE additional $7.4 million as convertible bridge financing agreement. All of the convertible loans including interest have been consolidated to a convertible bridge financing agreement in the amount of $35 million with interest of 7% annually.
|
F - 51
Note 11 – Subsidiaries (Cont’d)
| B. |
The following table summarizes the information relating to each of the Group’s subsidiaries in 2017, 2016 and 2015 that has material NCI:
|
|
As at and for the year ended December 31
|
||||||||||||||||||||||||||||||||||||
| 2017 | 2016* | 2015* | ||||||||||||||||||||||||||||||||||
|
OPC
Energy Ltd.
|
Samay I.S.A
|
Nicaragua Energy Holding
|
Kallpa Generacion S.A.
|
Cerro del Aguila S.A.
|
Samay I.S.A
|
Nicaragua Energy Holding
|
Kallpa Generacion S.A.
|
Cerro del Aguila S.A.
|
||||||||||||||||||||||||||||
|
$ thousands
|
||||||||||||||||||||||||||||||||||||
|
NCI percentage
|
24.18
|
%
|
25.10
|
%
|
35.42
|
%
|
25.10
|
%
|
25.10
|
%
|
25.10
|
%
|
35.42
|
%
|
25.10
|
%
|
25.10
|
%
|
||||||||||||||||||
|
Current assets
|
204,461
|
75,485
|
41,630
|
108,246
|
53,843
|
47,766
|
43,390
|
92,120
|
23,841
|
|||||||||||||||||||||||||||
|
Non-current assets
|
736,123
|
380,947
|
144,313
|
611,928
|
949,440
|
344,052
|
172,917
|
638,325
|
847,015
|
|||||||||||||||||||||||||||
|
Current liabilities
|
(99,
441
|
)
|
(73,846
|
)
|
(26,053
|
)
|
(55,323
|
)
|
(85,935
|
)
|
(36,075
|
)
|
(22,044
|
)
|
(188,291
|
)
|
(25,909
|
)
|
||||||||||||||||||
|
Non-current liabilities
|
(
667,996
|
)
|
(311,030
|
)
|
(100,834
|
)
|
(511,277
|
)
|
(618,219
|
)
|
(289,560
|
)
|
(121,142
|
)
|
(356,900
|
)
|
(556,277
|
)
|
||||||||||||||||||
|
Net assets
|
173,147
|
71,556
|
59,056
|
153,574
|
299,129
|
66,183
|
73,121
|
185,254
|
288,670
|
|||||||||||||||||||||||||||
|
Carrying amount of NCI
|
41,863
|
17,961
|
20,918
|
38,547
|
75,081
|
16,612
|
25,899
|
46,499
|
72,456
|
|||||||||||||||||||||||||||
|
Revenues
|
365,395
|
40,000
|
90,017
|
438,475
|
49,646
|
—
|
111,428
|
447,679
|
—
|
|||||||||||||||||||||||||||
|
Profit/(loss)
|
5,896
|
548
|
7,511
|
35,820
|
9
|
(4,049
|
)
|
14,469
|
44,088
|
(8,579
|
)
|
|||||||||||||||||||||||||
|
Other comprehensive income/(loss)
|
8,514
|
4,825
|
—
|
—
|
10,449
|
(6,057
|
)
|
—
|
(53
|
)
|
(1,079
|
)
|
||||||||||||||||||||||||
|
Profit attributable to NCI
|
1,425
|
138
|
2,660
|
8,991
|
2
|
(1,016
|
)
|
5,125
|
11,066
|
(2,153
|
)
|
|||||||||||||||||||||||||
|
OCI attributable to NCI
|
2,058
|
1,211
|
—
|
—
|
2,623
|
(1,520
|
)
|
—
|
(13
|
)
|
(271
|
)
|
||||||||||||||||||||||||
|
Cash flows from operating activities
|
110,290
|
(1,276
|
)
|
17,737
|
114,838
|
25,629
|
—
|
42,480
|
120,438
|
—
|
||||||||||||||||||||||||||
|
Cash flows from investing activities
|
(
154,194
|
)
|
(60,468
|
)
|
(931
|
)
|
(16,082
|
)
|
(69,372
|
)
|
(236,207
|
)
|
(5,088
|
)
|
(13,589
|
)
|
(180,771
|
)
|
||||||||||||||||||
|
Cash flows from financing activities excluding dividends paid to non-controlling interests
|
165,107
|
—
|
(4,004
|
)
|
(16,943
|
)
|
—
|
138,000
|
(26,139
|
)
|
(91,084
|
)
|
95,000
|
|||||||||||||||||||||||
|
Dividends paid to non-controlling interests
|
(
4,159
|
)
|
47,088
|
(26,440
|
)
|
(88,911
|
)
|
62,823
|
—
|
(4,401
|
)
|
(7,530
|
)
|
—
|
||||||||||||||||||||||
|
Effect of changes in the exchange rate on cash and cash equivalents
|
7,126
|
373
|
(348
|
)
|
198
|
369
|
(3,266
|
)
|
(489
|
)
|
(5,334
|
)
|
(2,929
|
)
|
||||||||||||||||||||||
|
Net increase/(decrease) in cash equivalents
|
124,170
|
(14,283
|
)
|
(13,986
|
)
|
(6,900
|
)
|
19,449
|
(101,473
|
)
|
6,363
|
2,901
|
(88,700
|
)
|
||||||||||||||||||||||
* These entities are discontinued operations in 2017.
F - 52
Note 11 – Subsidiaries (Cont’d)
| C. |
Restrictions
|
I.C. Power
As at December 31, 2017, IC Power´s subsidiaries have no restrictions to transfer cash or other assets to the parent company as long as each subsidiary is in compliance with the covenants derived from the borrowing agreements described in Note
16
.
OPC had originally restrictions to transfer cash or paid dividends up to the third anniversary of Construction Completion. On October 13, 2015, OPC and its seniors lenders amended this restriction to pay dividends, which ended on June 30, 2015. Therefore, on October 19, 2015, OPC paid NIS 295 million (equivalent to $77 million). Out of this total, NIS 222 million (equivalent to $58 million) was paid as repayment of capital notes and NIS 72.5 million (equivalent to $19 million) as intercompany loan.
Note 12 – Deposits, Loans and Other Receivables, including Derivative Instruments
Composition:
|
As at December 31
|
||||||||
|
2017
|
2016
|
|||||||
|
$ thousands
|
||||||||
|
Deposits in banks and others – restricted cash
|
76,459
|
16,690
|
||||||
|
Long-term trade receivable
|
-
|
10,120
|
||||||
|
Financial derivatives not used for hedging
|
-
|
1,342
|
||||||
|
Income tax receivables and tax claims (1)
|
-
|
99,892
|
||||||
|
Other receivables (
2
)
|
30,258
|
48,731
|
||||||
|
106
,717
|
176,775
|
|||||||
| (1) |
Mainly from discontinued operations.
|
| (2) |
Mainly relates to OPC’s connectivity fees to the gas transmission network and the electricity grid classified as long-term deferred expenses.
|
Note 13 – Deferred Payment Obligation Receivable
|
As at December 31
|
||||||||
|
2017
|
2016
|
|||||||
|
$ thousands
|
||||||||
|
Deferred payment receivable
|
175,000
|
-
|
||||||
As part of the sale of IC Power’s Latin America businesses, proceeds from
I Squared Capital (“
ISQ
”)
include a four year deferred payment obligation accruing 8% interest per annum.
F - 53
Note 14 – Property, Plant and Equipment, Net
| A. |
Composition
|
|
As at December 31, 2017
|
||||||||||||||||||||||||
|
Balance at beginning of year
|
Additions
|
Disposals
|
Differences in translation reserves
|
Sale of
subsidiaries*
|
Balance at end of year
|
|||||||||||||||||||
|
$ thousands
|
||||||||||||||||||||||||
|
Cost
|
||||||||||||||||||||||||
|
Land, roads, buildings and leasehold improvements
|
1,041,723
|
4,139
|
(1,615
|
)
|
4,167
|
(1,005,625
|
)
|
42,789
|
||||||||||||||||
|
Installations, machinery and equipment
|
2,445,579
|
68,410
|
(70,142
|
)
|
49,825
|
(1,994,241
|
)
|
499,431
|
||||||||||||||||
|
Dams
|
164,469
|
105
|
(5
|
)
|
-
|
(164,569
|
)
|
-
|
||||||||||||||||
|
Office furniture and equipment and motor vehicles
|
455,352
|
43,744
|
(4,954
|
)
|
11,589
|
(500,163
|
)
|
5,568
|
||||||||||||||||
|
4,107,123
|
116,398
|
(76,716
|
)
|
65,581
|
(3,664,598
|
)
|
547,788
|
|||||||||||||||||
|
Plants under construction
|
131,178
|
109,709
|
(15
|
)
|
9,356
|
(85,609
|
)
|
164,619
|
||||||||||||||||
|
Spare parts for installations
|
68,854
|
4,364
|
(186
|
)
|
1,487
|
(61,129
|
)
|
13,390
|
||||||||||||||||
|
4,307,155
|
230,471
|
(76,917
|
)
|
76,424
|
(3,811,336
|
)
|
725,797
|
|||||||||||||||||
|
Accumulated depreciation
|
||||||||||||||||||||||||
|
Land, roads, buildings and leasehold improvements
|
83,737
|
20,523
|
(807
|
)
|
530
|
(96,690
|
)
|
7,293
|
||||||||||||||||
|
Installations, machinery and equipment
|
637,794
|
112,416
|
(13,466
|
)
|
8,547
|
(644,458
|
)
|
100,833
|
||||||||||||||||
|
Dams
|
48,385
|
8,097
|
(250
|
)
|
-
|
(56,232
|
)
|
-
|
||||||||||||||||
|
Office furniture and equipment and motor vehicles
|
39,939
|
23,824
|
(1,307
|
)
|
484
|
(61,433
|
)
|
1,507
|
||||||||||||||||
|
809,855
|
164,860
|
(15,830
|
)
|
9,561
|
(858,813
|
)
|
109,633
|
|||||||||||||||||
|
Balance as at December 31, 2017
|
3,497,300
|
65,611
|
(61,087
|
)
|
66,863
|
(2,952,523
|
)
|
616,164
|
||||||||||||||||
| * |
This amount includes impairment as a result of the sale of Colombian assets. The Company recorded the impairment in cost of sales of $ 10 million.
|
F - 54
Note 14 – Property, Plant and Equipment, Net (Cont’d)
|
As at December 31, 2016
|
||||||||||||||||||||||||||||
|
Balance at beginning of year
|
Additions
|
Disposals
|
Differences in translation reserves
|
Acquisition as part of business combination
|
Transfers and Reclassifications
|
Balance at end of year
|
||||||||||||||||||||||
|
$ thousands
|
||||||||||||||||||||||||||||
|
Cost
|
||||||||||||||||||||||||||||
|
Land, roads, buildings and leasehold improvements
|
288,538
|
7,759
|
(1,244
|
)
|
629
|
2,441
|
743,600
|
1,041,723
|
||||||||||||||||||||
|
Installations, machinery and equipment
|
1,840,754
|
46,652
|
(35,616
|
)
|
7,350
|
—
|
586,439
|
2,445,579
|
||||||||||||||||||||
|
Dams
|
138,310
|
159
|
(965
|
)
|
—
|
—
|
26,965
|
164,469
|
||||||||||||||||||||
|
Office furniture and equipment and motor vehicles
|
52,124
|
25,866
|
(8,958
|
)
|
12,129
|
375,063
|
(872
|
)
|
455,352
|
|||||||||||||||||||
|
2,319,726
|
80,436
|
(46,783
|
)
|
20,108
|
377,504
|
1,356,132
|
4,107,123
|
|||||||||||||||||||||
|
Plants under construction
|
1,260,375
|
217,278
|
(167
|
)
|
385
|
7,839
|
(1,354,532
|
)
|
131,178
|
|||||||||||||||||||
|
Spare parts for installations
|
44,299
|
20,139
|
(477
|
)
|
281
|
7,152
|
(2,540
|
)
|
68,854
|
|||||||||||||||||||
|
3,624,400
|
317,853
|
(47,427
|
)
|
20,774
|
392,495
|
(940
|
)
|
4,307,155
|
||||||||||||||||||||
|
Accumulated depreciation
|
||||||||||||||||||||||||||||
|
Land, roads, buildings and leasehold improvements
|
71,953
|
13,169
|
(1,434
|
)
|
48
|
—
|
1
|
83,737
|
||||||||||||||||||||
|
Installations, machinery and equipment
|
530,324
|
123,275
|
(16,512
|
)
|
970
|
—
|
(263
|
)
|
637,794
|
|||||||||||||||||||
|
Dams
|
46,764
|
1,742
|
(121
|
)
|
—
|
—
|
—
|
48,385
|
||||||||||||||||||||
|
Office furniture and equipment and motor vehicles
|
21,538
|
20,591
|
(2,665
|
)
|
212
|
—
|
263
|
39,939
|
||||||||||||||||||||
|
670,579
|
158,777
|
(20,732
|
)
|
1,230
|
—
|
1
|
809,855
|
|||||||||||||||||||||
|
Balance as at December 31, 2016
|
2,953,821
|
159,076
|
(26,695
|
)
|
19,544
|
392,495
|
(941
|
)
|
3,497,300
|
|||||||||||||||||||
|
Prepayments on account of property, plant & equipment
|
6,057
|
—
|
||||||||||||||||||||||||||
| 2,959,878 | 3,497,300 | |||||||||||||||||||||||||||
| B. |
Net carrying values
|
|
As at December 31
|
||||||||
|
2017
|
2016
|
|||||||
|
$ thousands
|
||||||||
|
Land, roads
, buildings and leasehold improvements
|
35,496
|
957,986
|
||||||
|
Installations, machinery and equipment
|
398,598
|
1,807,785
|
||||||
|
Dams
|
-
|
116,084
|
||||||
|
Office furniture and equipment, motor vehicles and other equipment
|
4,061
|
415,413
|
||||||
|
Plants under construction
|
164,619
|
131,178
|
||||||
|
Spare parts for installations
|
13,390
|
68,854
|
||||||
|
616,164
|
3,497,300
|
|||||||
| C. |
When there is any indication of impairment, the Group’s entities perform impairment tests for their long lived assets using fair values less cost to sell based on independent appraisals or value in use estimations, with similar assumptions as those described (Note 15.D).
|
| D. |
The amount of borrowing costs capitalized during 2017 was $3 million ($14 million during 2016).
|
F - 55
| E. |
In I.C. Power, property, plant and equipment includes assets acquired through financing leases. As at December 31, 2017 and 2016, the cost and corresponding accumulated depreciation of such assets are as follows:
|
|
As of December 31, 2017
|
As of December 31, 2016
|
|||||||||||||||||||||||
|
Cost
|
Accumulated depreciation
|
Net cost
|
Cost
|
Accumulated Depreciation
|
Net cost
|
|||||||||||||||||||
|
$ thousands
|
||||||||||||||||||||||||
|
Land, roads, buildings and leasehold improvements
|
-
|
-
|
-
|
42,288
|
(6,602
|
)
|
35,686
|
|||||||||||||||||
|
Installations, machinery and equipment
|
-
|
-
|
-
|
275,852
|
(117,368
|
)
|
158,484
|
|||||||||||||||||
|
Motor vehicles
|
-
|
-
|
-
|
410
|
(46
|
)
|
364
|
|||||||||||||||||
|
-
|
-
|
-
|
318,550
|
(124,016
|
)
|
194,534
|
||||||||||||||||||
| F. |
Fixed assets purchased on credit in 2017, 2016 and 2015 were $31 million, $25 million and $46 million respectively.
|
| G. |
The composition of the depreciation expense
from continuing operations
is as follows:
|
|
As at December 31
|
||||||||
|
2017
|
2016
|
|||||||
|
$ thousands
|
||||||||
|
Depreciation charged to results
|
30,794
|
27,286
|
||||||
|
As at December 31
|
||||||||
|
2017
|
2016
|
|||||||
|
$ thousands
|
||||||||
|
Depreciation charged to cost of sales
|
30,102
|
26,697
|
||||||
|
Depreciation charged to general, selling and administrative expenses
|
597
|
468
|
||||||
|
Depreciation charged to results
|
30,699
|
27,165
|
||||||
|
Amortization of intangibles charged to cost of sales
|
-
|
-
|
||||||
|
Amortization of intangibles charged to general, selling and administrative expenses
|
95
|
121
|
||||||
|
Depreciation and amortization from continuing operations
|
30,794
|
27,286
|
||||||
F - 56
Note 15 – Intangible Assets, Net
| A. |
Composition:
|
|
Goodwill
|
Concessions licenses
|
Customer relationships
|
Software
|
Others
|
Total
|
|||||||||||||||||||
|
$ thousands
|
||||||||||||||||||||||||
|
Cost
|
||||||||||||||||||||||||
|
Balance as at January 1, 2017
|
117,550
|
189,351
|
41,074
|
1,771
|
83,897
|
433,643
|
||||||||||||||||||
|
Acquisitions as part of business combinations
|
296
|
-
|
-
|
195
|
-
|
491
|
||||||||||||||||||
|
Acquisitions – self development
|
-
|
-
|
-
|
179
|
10,280
|
10,459
|
||||||||||||||||||
|
Disposals
|
-
|
-
|
-
|
-
|
(82
|
)
|
(82
|
)
|
||||||||||||||||
|
Sale of subsidiaries*
|
(97,167
|
)
|
(189,351
|
)
|
(41,074
|
)
|
(1,066
|
)
|
(93,842
|
)
|
(422,500
|
)
|
||||||||||||
|
Translation differences
|
1,235
|
-
|
-
|
74
|
256
|
1,565
|
||||||||||||||||||
|
Balance as at December 31, 2017
|
21,914
|
-
|
-
|
1,153
|
509
|
23,576
|
||||||||||||||||||
|
Amortization and impairment
|
||||||||||||||||||||||||
|
Balance as at January 1, 2017
|
21,455
|
5,434
|
20,942
|
1,015
|
8,019
|
56,865
|
||||||||||||||||||
|
Amortization for the year
|
-
|
5,759
|
3,970
|
209
|
2,984
|
12,922
|
||||||||||||||||||
|
Disposals
|
-
|
-
|
-
|
25
|
-
|
25
|
||||||||||||||||||
|
Sale of subsidiaries
|
-
|
(11,193
|
)
|
(24,912
|
)
|
(
804
|
)
|
(
11,021
|
)
|
(
47,930
|
)
|
|||||||||||||
|
Translation differences
|
-
|
-
|
-
|
-
|
53
|
53
|
||||||||||||||||||
|
Balance as at December 31, 2017
|
21,455
|
-
|
-
|
445
|
35
|
21,935
|
||||||||||||||||||
|
Carrying value
|
||||||||||||||||||||||||
|
As at January 1, 2017
|
96,095
|
183,917
|
20,132
|
756
|
75,878
|
376,778
|
||||||||||||||||||
|
As at December 31, 2017
|
459
|
-
|
-
|
708
|
474
|
1,641
|
||||||||||||||||||
| * |
This amount includes impairment as a result of the sale of Colombian assets. The Company recorded the impairment in cost of sales of $ 10 million ($3 million in Others and $7 million in Goodwill).
|
F - 57
Note 15 – Intangible Assets, Net (Cont’d)
| A. |
Composition (Cont’d):
|
|
Goodwill
|
Concessions licenses
|
Customer relationships
|
Software
|
Others
|
Total
|
|||||||||||||||||||
|
$ thousands
|
||||||||||||||||||||||||
|
Cost
|
||||||||||||||||||||||||
|
Balance as at January 1, 2016
|
79,581
|
—
|
41,074
|
1,776
|
68,806
|
191,237
|
||||||||||||||||||
|
Acquisitions as part of business combinations
|
37,102
|
189,351
|
—
|
—
|
5,796
|
232,249
|
||||||||||||||||||
|
Acquisitions – self development
|
—
|
—
|
—
|
138
|
9,331
|
9,469
|
||||||||||||||||||
|
Disposals
|
—
|
—
|
—
|
(153
|
)
|
—
|
(153
|
)
|
||||||||||||||||
|
Reclassification
|
—
|
—
|
—
|
—
|
(161
|
)
|
(161
|
)
|
||||||||||||||||
|
Translation differences
|
867
|
—
|
—
|
10
|
125
|
1,002
|
||||||||||||||||||
|
Balance as at December 31, 2016
|
117,550
|
189,351
|
41,074
|
1,771
|
83,897
|
433,643
|
||||||||||||||||||
|
Amortization and impairment
|
||||||||||||||||||||||||
|
Balance as at January 1, 2016
|
21,455
|
—
|
16,888
|
937
|
4,713
|
43,993
|
||||||||||||||||||
|
Amortization for the year
|
—
|
5,434
|
4,054
|
227
|
3,287
|
13,002
|
||||||||||||||||||
|
Disposals
|
—
|
—
|
—
|
(153
|
)
|
—
|
(153
|
)
|
||||||||||||||||
|
Translation differences
|
—
|
—
|
—
|
4
|
19
|
23
|
||||||||||||||||||
|
Balance as at December 31, 2016
|
21,455
|
5,434
|
20,942
|
1,015
|
8,019
|
56,865
|
||||||||||||||||||
|
Carrying value
|
||||||||||||||||||||||||
|
As at January 1, 2016
|
58,126
|
—
|
24,186
|
839
|
64,093
|
147,244
|
||||||||||||||||||
|
As at December 31, 2016
|
96,095
|
183,917
|
20,132
|
756
|
75,878
|
376,778
|
||||||||||||||||||
| B. |
The total carrying amounts of intangible assets with a finite useful life and with an indefinite useful life or not yet available for use
|
|
As at December 31
|
||||||||
|
2017
|
2016
|
|||||||
|
$ thousands
|
||||||||
|
Intangible assets with a finite useful life
|
1,182
|
280,683
|
||||||
|
Intangible assets with an indefinite useful life or not yet available for use
|
459
|
96,095
|
||||||
|
1,641
|
376,778
|
|||||||
F - 58
Note 15 – Intangible Assets, Net (Cont’d)
| C. |
Examination of impairment of cash generating units containing goodwill
|
For the purpose of testing impairment, goodwill is allocated to the Group’s cash-generating units that represent the lowest level within the Group at which the goodwill is monitored for internal management purposes. Goodwill is calculated based on the local currencies of the countries that the subsidiaries operate in and translated into US dollars at the exchange rate at the reporting date.
Goodwill arises from the following Group entities in I.C. Power (cash generating unit):
|
As at December 31
|
||||||||
|
2017
|
2016
|
|||||||
|
$ thousands
|
||||||||
|
Nejapa*
|
-
|
40,693
|
||||||
|
Kallpa*
|
-
|
10,934
|
||||||
|
Energuate*
|
-
|
37,651
|
||||||
|
Surpetroil*
|
-
|
6,699
|
||||||
|
OPC Rotem (former AIE)
|
459
|
118
|
||||||
|
459
|
96,095
|
|||||||
| * |
Discontinued operations
|
| D. |
Impairment testing
|
The recoverable amount of each CGU is based on the estimated value in use using discounted cash flows. The cash flows are derived from the 5-year budget.
The key assumptions used in the estimation of the recoverable amount are shown below. The values assigned to key assumptions represent management of the Group´s assessment of future trends in the power sector and have been based on historic data from external and internal sources.
|
2017
|
2016
|
|||||||
|
Discount rate
|
In percent
|
|||||||
|
Peru*
|
-
|
6.7
|
||||||
|
Energuate*
|
-
|
8.9
|
||||||
|
El Salvador*
|
-
|
9.8
|
||||||
|
Colombia*
|
-
|
8.2
|
||||||
|
Terminal value growth rate
|
-
|
2
|
||||||
*
Discontinued
operations
The discount rate is a post-tax measure based on the characteristics of each CGU with a possible debt leveraging of of 32% in 2016.
The cash flow projections included specific estimates for five years and a terminal growth rate thereafter. The terminal growth rate was determined based on management´s estimate of the long term inflation
In addition to the discount and growth rates, the key assumptions used to estimate future cash flows, based on past experience and current sector forecasts, are as follows:
| • |
Existing power purchase agreements (PPAs) signed and existing number of customers
|
| • |
Investment schedule—I.C. Power Management has used the updated investment schedule in countries in which those companies operate, in order that the supply satisfies the demand growth in an efficient manner.
|
| • |
The production mix of each country was determined using specifically-developed internal forecast models that consider factors such as prices and availability of commodities, forecast demand of electricity, planned construction or the commissioning of new capacity in the country’s various technologies.
|
| • |
The distribution business profits were determined using specifically-developed internal forecast models that consider factors such as forecasted demand, fuel prices, energy purchases, collection rates, percentage of losses, quality service improvement, among others.
|
F - 59
Note 15 – Intangible Assets, Net (Cont’d)
| • |
Fuel prices have been calculated based on existing supply contracts and on estimated future prices including a price differential adjustment specific to every product according to local characteristics.
|
| • |
Assumptions for energy sale and purchase prices and output of generation facilities are made based on complex specifically-developed internal forecast models for each country.
|
| • |
Demand—Demand forecast has taken into consideration the most probable economic performance as well as growth forecasts of different sources.
|
| • |
Technical performance—The forecast takes into consideration that the power plants have an appropriate preventive maintenance that permits their proper functioning and the distribution business has the required capital expenditure to expand and perform properly in order to reach the targeted quality levels.
|
Sensitivity to changes in assumptions
With regard to the assessment of value in use of the CGUs,
management believes that no reasonably possible change in any of the above key assumptions would cause the carrying value to materially exceed its recoverable amount.
Note 16 – Loans and Debentures
Following are the contractual conditions of the Group’s interest bearing loans and credit, which are measured based on amortized cost. Additional information regarding the Group’s exposure to interest risks, foreign currency and liquidity risk is provided in Note 32, in connection with financial instruments.
|
As at December 31
|
||||||||
|
2017
|
2016
|
|||||||
|
$ thousands
|
||||||||
|
Current liabilities
|
||||||||
|
Short-term loans from banks, financial institutions and others (1)
|
317,684
|
213,417
|
||||||
|
317,684
|
213,417
|
|||||||
|
Current maturities of long-term liabilities:
|
||||||||
|
Loans from banks, financial institutions and others
|
123,908
|
251,803
|
||||||
|
Non-convertible debentures
|
6,364
|
10,617
|
||||||
|
Liability in respect of financing lease
|
-
|
6,976
|
||||||
|
130,272
|
269,396
|
|||||||
|
Total current liabilities
|
447,956
|
482,813
|
||||||
|
Non-current liabilities
|
||||||||
|
Loans from banks and financial institutions
|
627,150
|
1,903,323
|
||||||
|
Non-convertible debentures
|
91,122
|
867,287
|
||||||
|
Liability in respect of financing lease
|
-
|
88,169
|
||||||
|
Other long-term balances
|
543
|
240,213
|
||||||
|
Total other long-term liabilities
|
718,815
|
3,098,992
|
||||||
|
Less current maturities
|
(130,272
|
)
|
(269,396
|
)
|
||||
|
Total non-current liabilities
|
588,543
|
2,829,596
|
||||||
| (1) |
Balances as at December 31, 2017 mainly relates to loans from related parties (see Note 31.E).
|
F - 60
Note 16 – Loans and Debentures (Cont’d)
| A. |
Composition of I.C. Power loans from Banks and Others (Cont’d)
|
|
As at
|
As at
|
|||||||||||||||||||||
|
December 31,2017
|
December 31,2016
|
|||||||||||||||||||||
|
$ thousands
|
||||||||||||||||||||||
|
Nominal annual Interest rate
|
Currency
|
Maturity
|
Current
|
Non-Current
|
Current
|
Non-Current
|
||||||||||||||||
|
Short-term loans from banks
|
||||||||||||||||||||||
|
I.C. Power Distribution Holdings
|
||||||||||||||||||||||
|
Credit Suisse
|
LIBOR + 4%
|
USD
|
2017
|
—
|
—
|
119,487
|
—
|
|||||||||||||||
|
Samay
|
||||||||||||||||||||||
|
Interbank
|
2.9%
|
USD
|
2017
|
—
|
—
|
31,945
|
—
|
|||||||||||||||
|
DEOCSA
|
||||||||||||||||||||||
|
Various entities
|
LIBOR + 4.75%
|
USD
|
2017
|
—
|
—
|
18,000
|
—
|
|||||||||||||||
|
DEORSA
|
||||||||||||||||||||||
|
Various entities
|
LIBOR + 4.75%
|
USD
|
2017
|
—
|
—
|
12,000
|
—
|
|||||||||||||||
|
CDA
|
||||||||||||||||||||||
|
Banco de Crédito del Perú
|
0.83%
|
USD
|
2017
|
—
|
—
|
14,000
|
—
|
|||||||||||||||
|
PQP
|
||||||||||||||||||||||
|
Banco Industrial Guatemala
|
4.75%
|
USD
|
2017
|
—
|
—
|
6,000
|
—
|
|||||||||||||||
|
Cobee
|
||||||||||||||||||||||
|
Various entities
|
4.2% / 5.5%
|
BOB
|
2016/2017
|
—
|
—
|
4,499
|
—
|
|||||||||||||||
|
Nejapa
|
||||||||||||||||||||||
|
Scotiabank El Salvador
|
5.50%
|
USD
|
2017
|
—
|
—
|
4,200
|
—
|
|||||||||||||||
|
Empresa Energética Corinto Ltd
|
||||||||||||||||||||||
|
Banco de América Central (BAC)
|
5.25%
|
USD
|
2017
|
—
|
—
|
1,586
|
—
|
|||||||||||||||
|
Cepp
|
||||||||||||||||||||||
|
Scotiabank
|
2.4%
|
USD
|
2017
|
—
|
—
|
1,000
|
—
|
|||||||||||||||
|
BHD Bank
|
2.53%
|
USD
|
2017
|
—
|
—
|
200
|
—
|
|||||||||||||||
|
Surenergy
|
||||||||||||||||||||||
|
Banco Davivienda
|
DTF + 4.5%
|
COP
|
2017
|
—
|
—
|
500
|
—
|
|||||||||||||||
|
Short-term loans from banks
|
||||||||||||||||||||||
|
Subtotal
|
—
|
—
|
213,417
|
—
|
||||||||||||||||||
|
Loans from Banks and others
|
||||||||||||||||||||||
|
Financial institutions:
|
||||||||||||||||||||||
|
Cerro del Aguila
|
||||||||||||||||||||||
|
Tranche A
|
LIBOR+4.25% - LIBOR +5.50%
|
USD
|
2024
|
—
|
—
|
15,344
|
320,437
|
|||||||||||||||
|
Tranche B
|
LIBOR+4.25% - LIBOR +6.25%
|
USD
|
2024
|
—
|
—
|
—
|
180,896
|
|||||||||||||||
|
Tranche 1D
|
LIBOR+2.75% - LIBOR +3.60%
|
USD
|
2024
|
—
|
—
|
1,760
|
38,697
|
|||||||||||||||
|
Tranche 2D
|
LIBOR+2.75% - LIBOR +3.60%
|
USD
|
2027
|
—
|
—
|
—
|
21,959
|
|||||||||||||||
F - 61
Note 16 – Loans and Debentures (Cont’d)
| A. |
Composition of I.C. Power loans from Banks and Others (Cont’d)
|
|
As at
|
As at
|
|||||||||||||||||||||
|
December 31,2017
|
December 31,2016
|
|||||||||||||||||||||
|
$ thousands
|
||||||||||||||||||||||
|
Nominal annual Interest rate
|
Currency
|
Maturity
|
Current
|
Non-Current
|
Current
|
Non-Current
|
||||||||||||||||
|
Samay I
|
||||||||||||||||||||||
|
Sumitomo /HSBC / Bank of Tokyo
|
LIBOR+2.125% - LIBOR +2.625%
|
USD
|
2021
|
—
|
—
|
5,047
|
302,247
|
|||||||||||||||
|
Central Cardones
|
||||||||||||||||||||||
|
Tranche One
|
||||||||||||||||||||||
|
BCI / Banco Itaú
|
LIBOR+1.90%
|
USD
|
2021
|
—
|
—
|
3,781
|
18,228
|
|||||||||||||||
|
Tranche Two
|
||||||||||||||||||||||
|
BCI / Banco Itaú
|
LIBOR+2.75%
|
USD
|
2021
|
—
|
—
|
—
|
13,383
|
|||||||||||||||
|
Colmito
|
||||||||||||||||||||||
|
Banco Bice
|
7.90%
|
CLP
|
2028
|
—
|
—
|
625
|
16,121
|
|||||||||||||||
|
Consorcio Eólico Amayo, S.A.
(I)
|
||||||||||||||||||||||
|
Banco Centroamericano de Integración Económica
|
8.45% - LIBOR +4%
|
USD
|
2023
|
—
|
—
|
5,307
|
37,376
|
|||||||||||||||
|
Consorcio Eólico Amayo (Fase II), S.A.
|
||||||||||||||||||||||
|
Various entities
|
LIBOR+5.75%, 8.53%,10.76%
|
USD
|
2025
|
—
|
—
|
3,029
|
28,250
|
|||||||||||||||
|
Empresa Energética Corinto, Ltd.
|
||||||||||||||||||||||
|
Banco de América Central (BAC)
|
8.35%
|
USD
|
2018
|
—
|
—
|
3,124
|
3,402
|
|||||||||||||||
|
Tipitapa Power Company, Ltd.
|
||||||||||||||||||||||
|
Banco de América Central (BAC)
|
8.35%
|
USD
|
2018
|
—
|
—
|
2,801
|
3,328
|
|||||||||||||||
|
Jamaica Private Power Company
|
||||||||||||||||||||||
|
Royal Bank of Canada
|
LIBOR + 5.50%
|
USD
|
2017
|
—
|
—
|
824
|
—
|
|||||||||||||||
|
Burmeister & Wain Scandinavian Contractor A/S
|
3.59%
|
USD
|
2018
|
—
|
—
|
338
|
233
|
|||||||||||||||
|
PQP
|
||||||||||||||||||||||
|
Banco Industrial
|
LIBOR + 4.50%
|
USD
|
2021
|
—
|
—
|
2,374
|
9,632
|
|||||||||||||||
|
Surpetroil S.A.S
|
||||||||||||||||||||||
|
Banco de Occidente S.A
|
IBR + 5.87%
|
COP
|
2018
|
—
|
—
|
504
|
375
|
|||||||||||||||
|
Banco Pichincha
|
DTF + 3%
|
COP
|
2017
|
—
|
—
|
100
|
—
|
|||||||||||||||
|
Kanan
|
||||||||||||||||||||||
|
Scotiabank
|
LIBOR + 3.5%
|
USD
|
2021
|
—
|
—
|
46,094
|
—
|
|||||||||||||||
|
Overseas Investments Peru
|
||||||||||||||||||||||
|
Credit Suisse (D)
|
LIBOR + 5%-6.5%
|
USD
|
2017
|
99,964
|
—
|
97,274
|
—
|
|||||||||||||||
|
DEORSA
|
||||||||||||||||||||||
|
Syndicated Loan – various banks
|
LIBOR + 4.7% - LIBOR + 4.75%
|
USD
|
2021/2025
|
—
|
—
|
10,167
|
67,857
|
|||||||||||||||
|
Syndicated Loan - various banks
|
TAPP minus 5.6% - TAPP minus 6.1%
|
GTQ
|
2021/2025
|
—
|
—
|
4,687
|
30,653
|
|||||||||||||||
F - 62
Note 16 – Loans and Debentures (Cont’d)
| A. |
Composition of I.C. Power loans from Banks and Others (Cont’d)
|
|
As at
|
As at
|
|||||||||||||||||||||
|
December 31,2017
|
December 31,2016
|
|||||||||||||||||||||
|
$ thousands
|
||||||||||||||||||||||
|
|
Nominal annual Interest rate
|
Currency
|
Maturity
|
Current
|
Non-Current
|
Current
|
Non-Current
|
|||||||||||||||
|
DEOCSA
|
||||||||||||||||||||||
|
Syndicated Loan – various banks
|
LIBOR + 4.7% - LIBOR + 4.75%
|
USD
|
2021/2025
|
—
|
—
|
16,876
|
107,488
|
|||||||||||||||
|
Syndicated Loan - various banks
|
TAPP minus 5.6% - TAPP minus 6.1%
|
GTQ
|
2021/2025
|
—
|
—
|
6,215
|
43,127
|
|||||||||||||||
|
RECSA
|
||||||||||||||||||||||
|
Banco G&T Continental
|
TAPP + 6.63%
|
GTQ
|
2020
|
—
|
—
|
931
|
3,722
|
|||||||||||||||
|
OPC Rotem Ltd
|
||||||||||||||||||||||
|
Lenders Consortium (E)
|
4.85% - 5.36%
|
NIS
|
2031
|
23,944
|
463,160
|
20,290
|
344,240
|
|||||||||||||||
|
OPC Hadera
|
||||||||||||||||||||||
|
Facility B—Amitim and Menora Pension Funds (F)
|
7.75%
|
NIS
|
2029
|
—
|
40,092
|
4,311
|
47,425
|
|||||||||||||||
|
IC Power Asua Development Ltd
|
||||||||||||||||||||||
|
Bank Hapoalim New York
|
0.75%
|
USD
|
2019
|
—
|
—
|
—
|
12,000
|
|||||||||||||||
|
AGS
|
||||||||||||||||||||||
|
Veolia Energy Israel Ltd
|
NIS
|
2019
|
—
|
—
|
—
|
444
|
||||||||||||||||
|
Sub total
|
123,908
|
503,242
|
251,803
|
1,651,520
|
||||||||||||||||||
|
Liabilities in respect of finance leases:
|
||||||||||||||||||||||
|
Kallpa Generación
|
||||||||||||||||||||||
|
Banco de Crédito del Perú
|
7.15%
|
USD
|
2023
|
—
|
—
|
6,624
|
81,193
|
|||||||||||||||
|
Surpetroil S.A.S.
|
||||||||||||||||||||||
|
Banco de Occidente S.A.
|
DTF + 3.5%
|
COP
|
2017
|
—
|
—
|
223
|
—
|
|||||||||||||||
|
DEORSA
|
||||||||||||||||||||||
|
Arrendadora Agromercantil
|
TAPP minus 2.47%
|
GTQ
|
2017
|
—
|
—
|
129
|
—
|
|||||||||||||||
|
Sub total
|
—
|
—
|
6,976
|
81,193
|
||||||||||||||||||
|
Debentures
|
||||||||||||||||||||||
|
Cobee
|
||||||||||||||||||||||
|
Bonds Cobee III-1B
|
6.50%
|
USD
|
2017
|
—
|
—
|
1,750
|
—
|
|||||||||||||||
|
Bonds Cobee III-1C (bolivianos)
|
9.00%
|
BOB
|
2020
|
—
|
—
|
1,586
|
4,757
|
|||||||||||||||
|
Bonds Cobee III-2
|
6.75%
|
USD
|
2017
|
—
|
—
|
5,000
|
—
|
|||||||||||||||
|
Bonds Cobee III-3 (bolivianos)
|
7.00%
|
BOB
|
2022
|
—
|
—
|
—
|
6,160
|
|||||||||||||||
|
Bonds Cobee IV-1A
|
6.00%
|
USD
|
2018
|
—
|
—
|
—
|
3,988
|
|||||||||||||||
|
Bonds Cobee IV-1B
|
7.00%
|
USD
|
2020
|
—
|
—
|
—
|
3,980
|
|||||||||||||||
|
Bonds Cobee IV-1C (bolivianos)
|
7.80%
|
BOB
|
2024
|
—
|
—
|
—
|
12,030
|
|||||||||||||||
|
Cobee Bonds-IV Issuance 3
|
6.70%
|
USD
|
2019
|
—
|
—
|
—
|
4,973
|
|||||||||||||||
|
Cobee Bonds-IV Issuance 4 (bolivianos)
|
7.80%
|
BOB
|
2024
|
—
|
—
|
—
|
15,039
|
|||||||||||||||
|
Cobee Bonds-IV Issuance 5 (bolivianos)
|
5.75%
|
BOB
|
2026
|
—
|
—
|
1,950
|
17,697
|
|||||||||||||||
F - 63
Note 16 – Loans and Debentures (Cont’d)
| A. |
Composition of I.C. Power loans from Banks and Others (Cont’d)
|
|
As at
|
As at
|
|||||||||||||||||||||
|
December 31,2017
|
December 31,2016
|
|||||||||||||||||||||
|
$ thousands
|
||||||||||||||||||||||
|
Nominal annual Interest rate
|
Currency
|
Maturity
|
Current
|
Non-Current
|
Current
|
Non-Current
|
||||||||||||||||
|
Inkia Energy Ltd
|
||||||||||||||||||||||
|
Inkia Bonds
|
8.38%
|
USD
|
2021
|
—
|
—
|
—
|
447,904
|
|||||||||||||||
|
Kallpa Generación
|
||||||||||||||||||||||
|
Kallpa Bonds
|
4.88%
|
USD
|
2026
|
—
|
—
|
—
|
325,970
|
|||||||||||||||
|
Cepp
|
||||||||||||||||||||||
|
Cepp Bonds
|
6.00%
|
USD
|
2019
|
—
|
—
|
—
|
9,945
|
|||||||||||||||
|
Cobee
|
||||||||||||||||||||||
|
Cobee Bonds (Premium)
|
USD-BOB
|
2017-2024
|
—
|
—
|
331
|
4,227
|
||||||||||||||||
|
OPC Energy Ltd
|
||||||||||||||||||||||
|
Bonds – Series A (G)
|
4.45%
|
NIS
|
2030
|
6,364
|
84,758
|
—
|
—
|
|||||||||||||||
|
Sub total
|
6,364
|
84,758
|
10,617
|
856,670
|
||||||||||||||||||
|
Total
|
130,272
|
588,000
|
482,813
|
2,589,383
|
||||||||||||||||||
DTF: “
Depósitos a Término Fijo
”. Fixed-term deposits rate calculated by Colombia’s Central Bank.
IBR: “
Indicador Bancario de Referencia
”. Bank Indicator of Reference calculated by Colombia’
s
Central Bank.
TAB: “
Tasa Activa Bancaria
”. Short-term credits average interest rate calculated by Chile’s Bank’s Association.
TRE:
“Tasa de Referencia”
. Weighted average for time deposits rates, calculated by Bolivia’s Central Bank.
F - 64
Note 16 – Loans and Debentures (Cont’d)
| B. |
Classification based on currencies and interest rates
|
|
Weighted-average interest rate December 31
|
As at December 31
|
|||||||||||
|
2017
|
2017
|
2016
|
||||||||||
|
%
|
$ thousands
|
|||||||||||
|
Current liabilities (without current maturities)
|
||||||||||||
|
Short-term loans from financial institutions
|
||||||||||||
|
In dollars
|
-
|
208,418
|
||||||||||
|
In other currencies
|
-
|
4,999
|
||||||||||
|
-
|
213,417
|
|||||||||||
|
Non-current liabilities (including current maturities)
|
||||||||||||
|
Debentures
|
||||||||||||
|
In dollars
|
-
|
804,052
|
||||||||||
|
In other currencies
|
4.80
|
%
|
91,122
|
63,235
|
||||||||
|
91,122
|
867,287
|
|||||||||||
|
Loans from financial institutions (including financing lease)
|
||||||||||||
|
In dollars
|
7.90
|
%
|
99,964
|
1,467,369
|
||||||||
|
In shekels
|
4.80
|
%
|
527,186
|
416,710
|
||||||||
|
In quetzales
|
-
|
89,464
|
||||||||||
|
In other currencies
|
-
|
17,948
|
||||||||||
|
627,150
|
1,991,491
|
|||||||||||
|
718,272
|
2,858,778
|
|||||||||||
| C. |
Liability in respect of financing lease
|
Information regarding the financing lease liability broken down by payment dates is presented below:
|
As at December 31, 2017
|
As at December 31, 2016
|
|||||||||||||||||||||||
|
Minimum future lease rentals
|
Interest component
|
Present value of minimum lease rentals
|
Minimum future lease rentals
|
Interest component
|
Present value of minimum lease rentals
|
|||||||||||||||||||
|
$ thousands
|
||||||||||||||||||||||||
|
Less than one year
|
-
|
-
|
-
|
13,016
|
6,040
|
6,976
|
||||||||||||||||||
|
From one year to five years
|
-
|
-
|
-
|
85,849
|
19,217
|
66,632
|
||||||||||||||||||
|
More than five years
|
-
|
-
|
-
|
15,207
|
646
|
14,561
|
||||||||||||||||||
|
-
|
-
|
-
|
114,072
|
25,903
|
88,169
|
|||||||||||||||||||
F - 65
Note 16 – Loans and Debentures (Cont’d)
Long term loans from banks and others
| D. |
Overseas Facility
— On May 9, 2016, Overseas Investments Peru S.A., a 100% whole-owned subsidiary of ICP, signed a $100 million Credit Facility with Credit Suisse AG. The proceeds from this facility were fully drawn on August 31, 2016. This facility had an original maturity on November 9, 2017 bears an interest rate of 90-day Libor plus 5.00% (from the funding date to the 6-month anniversary of the funding date); 90-day Libor plus 5.75% (from one day after the 6-month anniversary to the 12-month anniversary of the funding date); and 90-day Libor plus 6.50% thereafter. On September 8, 2017, Overseas Investment Peru signed an amendment changing the final maturity date to May 9, 2019. As of December 31, 2017, the outstanding principal amount under this facility was $ 100 million. ($99.9 million, net of transaction costs) ($97 million, net of transaction costs as of December 31, 2016).
On January
3
, 2018, this loan was prepaid for a total amount of $101 million (including the interest accrued), see note 33.3.A.
|
| E. |
OPC Lenders Consortium - In January 2011, OPC entered into a financing agreement with a consortium of lenders led by Bank Leumi L’Israel Ltd (“Bank Leumi”) (shareholder of Kenon - 14% shareholding) for the financing of its power plant project. The financing consortium includes Bank Leumi and institutional entities from the following groups: Clal Insurance Company Ltd.; Amitim Senior Pension Funds; Phoenix Insurance Company Ltd.; and Harel Insurance Company Ltd (“OPC’s lenders”). As part of the financing agreement, the lenders committed to provide OPC a long-term credit facility (including a facility for variances in the construction costs), a working capital facility, and a facility for financing the debt service, in the overall amount of approximately NIS 1,800 million (approximately $460 million). The loans are CPI linked and are repaid on a quarterly basis beginning in the fourth quarter of 2013 until 2031. As part of the financing agreement, OPC had certain restrictions to make distributions of dividends and repayments of shareholders’ loans, only after the third year after the completion of OPC’s power plant. On October 13, 2015, OPC and the senior lenders amended the Facility Agreement to remove this restriction.
|
As part of the Facility Agreement, OPC is required to keep a Debt Service Reserve equivalent to the following two quarterly debt payments (hereinafter- “the reserve”) within the period of two years following power plant construction completion. As of December 31, 2017 and 2016, the amount of the reserve is NIS72 million (equivalent to $21 million) and NIS73 million (equivalent to $19 million) respectively.
As of December 31, 2017 and 2016, OPC used NIS5 million ($1.4 million) and NIS4 million ($1.2 million), respectively from the guarantee.
Under the Facility Agreement, OPC and IC Power Asia Development Ltd (“ICPAD”) together and the non-controlling interests in Rotem ("Veridis"), issued corporate guarantees in favor of Rotem in amounts of NIS92 million ($26.5 million) and NIS23 million ($6.6 million), respectively.
In December 2017, an amended credit facility agreement was signed, according to which ICPAD was released from the corporate guarantee, in return for the accumulation of an additional fund in Rotem in the amount of NIS 57.5 million ($16.6 million) ("the owners' guarantee fund") and in return from the corporate guarantee of OPC and Veridis of NIS 57.5 million ($16.6 million), according to their relative portion in holdings. The owners' guarantee fund is subject to an adjustment mechanism under which in certain coverage ratios it can exceed a maximum amount of NIS115 million ($33 million). ICPAD's guarantee fund will accumulate in the following manner – NIS20 million ($5.8 million) upon signing the amended credit agreement and the balance will accumulate over 24 months in semi-annual deposits. After the completion of the accumulation of ICPAD's guarantee fund, Veridis and OPC will be released from the corporate guarantee. As at December 31, 2017, ICPAD's guarantee fund amounted to NIS20 million ($5.8 million).
| F. |
OPC Energy Ltd. —On June 22, 2014, OPC entered into a mezzanine financing agreement with Mivtachim Social Insurance and Makefet Fund Pension (“Amitim”) and Menora Mivtachim Insurance Ltd (“Menora”) in the aggregate amount of NIS350 million ($93 million), consisting of three Facilities: (i) Tranche A bridge loan for NIS150 million, bearing interest of 4.85% p.a. to be repaid until March 31, 2017; (ii) Tranche B long-term loan for NIS200 million, bearing interest of 7.75% p.a., repayable on annual basis until March 2029
.
These loans are linked to CPI.
|
During the year ended December 31, 2016, Tranche A was prepaid for a total of NIS162 million (approximately $41 million) and Tranche B was prepaid for a total of NIS38 million (approximately $10 million).
In May 2017, Tranche B was prepaid for a total of NIS23 million (approximately $7 million).
F - 66
Note 16 – Loans and Debentures (Cont’d)
Debentures
| G. |
In May, 2017, OPC issued Bonds (Series A) to classified investors under a private placement, which were listed for trade on the Institutional Continuous Trading Platform. The bonds, with a par value of NIS 320 million ($92 million), bear annual interest at the rate of 4.95% and are redeemable, principal and interest, every six months, commencing on June 30, 2018 (on June 30th and December 30th of every calendar year) through December 30, 2030. Under the terms, the interest on the bonds will be reduced by 0.5% in the event of their listing for trade on the main list of the TASE. The bonds have received a rating of A3 from Midroog and A- from S&P Global Ratings Maalot Ltd. (hereinafter -– “Maalot”).
|
On August 20, 2017, OPC listed the bonds for trade in the stock exchange under an issuance and the listing of its shares for trade and accordingly, from that date, interest on the bonds (series A) was reduced by 0.5% and is 4.45% per year.
According to the trust deed from May 2017, OPC has registered, in favor of the trustee on behalf of the bond holders, a first-ranking floating charge, unlimited in amount, on all of its assets. The floating charge will not preclude OPC from pledging specific assets and the performance of other asset dispositions by OPC.
Additionally, OPC has created a reserve for the servicing of the debt, out of the issuance consideration, in the amount of 12 months of interest up to the commencement of repayment of the principal of the bonds, and will pay 12 months of principal and interest payments subsequent to the commencement of the bonds' principal repayment. The trust account in which the reserve was deposited will be pledged in favor of the trustee on behalf of the bond holders. As of December 31, 2017, the deposit for the debt service fund amounts to NIS 18 million ($5 million) and is presented in the Statement of Financial Position under “Deposits, loans and other receivables”.
The trust deed contains customary
clauses
for calling for the immediate redemption of the bonds, including events of breach, insolvency, liquidation proceedings, receivership, stay of proceedings and creditors' arrangements, certain types of restructuring, material downturn in the position of OPC. The right to call for immediate redemption also arises upon: (1) the occurrence of certain events of loss of control by Kenon; (2) the call for immediate repayment of other debts (or guarantees) of the Company or of Hadera or Rotem in certain predefined minimum amounts; (3) a change in the area of operation of OPC such that OPC's main area of activity is not in the energy sector in Israel, including electricity generation in power plants and with renewable energy sources; (4) in the event that a rating is discontinued over a certain period of time, and the rating of the bond falls below the level of Baa3 (or BBB); and (5) in the event of suspending trading for a certain time period if the bonds are listed for trade on the main list of the Stock Exchange. All of such conditions, pursuant to the terms set out in the trust deed.
Furthermore, the trust deed includes an undertaking by OPC to comply with covenants on the basis of its stand-alone financial statements: debt coverage ratio of at least 1.05 (to be reviewed commencing in the financial statements as at June 30, 2018), minimum equity of NIS 80,000,000, and an equity-to-balance sheet ratio of at least 12.5%. As at December 31, 2017, the equity attributed to OPC’s shareholders amounted to approx. NIS 600 thousand and the equity-to-balance sheet ratio was 65%.
The trust deed also includes an undertaking by OPC to monitor the rating by a rating agency and for mandatory early redemption in the event of the sale of means of control in Rotem and Hadera.
Additionally, restrictions imposed on distributions, provision of loans to related parties and repayment of loans to related parties, are included as set forth in the trust deed, including compliance with certain covenants.
The terms of the bonds also provide for the possible raising of the interest rate in certain cases of lowering the rating, in certain cases of breach of financial covenants, and in certain cases of use of the reserve for servicing the debt where the reserve is not sufficiently funded within the time frame that is set forth in the trust deed. The ability of OPC to expand the series of the bonds has been limited under certain circumstances, including maintaining the rating of the bonds at its level shortly prior to the expansion of the series and the lack of breach. Additionally, should OPC raise additional bonds that are not secured (or that are secured with a pari passu ranking floating charge), these will not have preference over the bonds (Series A) upon liquidation.
| H. |
As at December 31, 2017, the main covenants that certain Group entities must comply with during the term of the debts were as follows:
|
|
|
Covenant
|
||
|
Group entities
|
Debt service
to coverage ratio
|
||
|
OPC Rotem
|
Not less than 1.25
|
||
Compliance with the covenants referred to above is overseen by
OPC’s management.
As of December 31, 2017
OPC
complied with all the covenants mentioned above.
F - 67
Note 17 – Trade Payables
|
As at December 31
|
||||||||
|
2017
|
2016
|
|||||||
|
$ thousands
|
||||||||
|
Current
|
||||||||
|
Trade Payables
|
36,994
|
264,720
|
||||||
|
Accrued expenses and other payables
|
21,901
|
20,892
|
||||||
|
58,895
|
285,612
|
|||||||
|
Non-current
|
||||||||
|
Trade Payables*
|
-
|
44,057
|
||||||
(*) As of December 31, 2016, non-current trade payables correspond mainly to spare parts, used for major maintenance of facilities of discontinued operations, acquired according to a long-term program (LTP) agreement signed with Siemens. During 2016, these trade payables have not generated interests and no specific guarantee have been granted.
Note 18 – Other Payables including Derivative Instruments
|
As at December 31
|
||||||||
|
2017
|
2016
|
|||||||
|
$ thousands
|
||||||||
|
Current liabilities:
|
||||||||
|
Financial derivatives not used for hedging
|
73
|
783
|
||||||
|
Financial derivatives used for hedging
|
439
|
11,563
|
||||||
|
The State of Israel and government agencies
|
1,208
|
4,206
|
||||||
|
Employees and payroll-related agencies
|
179
|
4,846
|
||||||
|
Customer advances and deferred income
|
-
|
944
|
||||||
|
Accrued expenses
|
14,
915
|
23,563
|
||||||
|
Dividend payable to non-controlling interest
|
-
|
2,893
|
||||||
|
Interest payable
|
21
|
23,038
|
||||||
|
Transaction costs
on
sale
of subsidiaries
|
59,000
|
-
|
||||||
|
Other
|
6,687
|
19,467
|
||||||
|
82,
522
|
91,303
|
|||||||
|
Non-current liabilities:
|
||||||||
|
Financial derivatives not used for hedging
|
-
|
1,342
|
||||||
|
Financial derivatives used for hedging
|
-
|
13,701
|
||||||
|
Other financial derivatives
|
-
|
29,594
|
||||||
|
-
|
44,637
|
|||||||
Note 19 - Guarantee Deposits from Customers
Deposits in cash are received from distribution customers. These deposits bear interest at a weighted average interest rate published by the Guatemalan Central Bank and are refundable to clients when they cease using the electric energy service.
Such deposits relate to the power distribution business sold to ISQ in December 2017.
F - 68
Note 20 – Provisions
|
Financial Guarantee*
|
Others
|
Total
|
Financial Guarantee*
|
Others**
|
Total
|
|||||||||||||||||||
|
2017
|
2016
|
|||||||||||||||||||||||
|
$ thousands
|
$ thousands
|
|||||||||||||||||||||||
|
Balance at January, 1
|
118,763
|
768
|
119,531
|
-
|
41,686
|
41,686
|
||||||||||||||||||
|
Reclassified from long-term liabilities
|
-
|
-
|
-
|
34,263
|
-
|
34,263
|
||||||||||||||||||
|
Provision made during the year
|
-
|
-
|
-
|
130,193
|
-
|
130,193
|
||||||||||||||||||
|
Provision reversed to profit/(loss) during the year
|
-
|
-
|
-
|
(4,587
|
)
|
-
|
(4,587
|
)
|
||||||||||||||||
|
Provision paid/ released
|
(74,421
|
)
|
(768
|
)
|
(75,189
|
)
|
(36,023
|
)
|
(40,170
|
)
|
(76,193
|
)
|
||||||||||||
|
Effects of foreign currency
|
-
|
-
|
-
|
(5,083
|
)
|
(748
|
)
|
(5,831
|
)
|
|||||||||||||||
|
Balance at December, 31
|
44,342
|
-
|
44,342
|
118,763
|
768
|
119,531
|
||||||||||||||||||
* Relates to Kenon’s provision of financial guarantees to Chery in respect of an obligation of Qoros (see Note 10.C.b.7).
** Corresponds to a provision made by an I.C. Power’s subsidiary as a result of a regulator charge. Expenses related to this provision were recognized in the cost of sales in the amount of $15 million in 2015.
F - 69
Note 21 – Contingent Liabilities, Commitments and Concessions
| A. |
Claims
|
I.C. Power
| a. |
OPC Rotem – Tamar
|
In July 2013, the EA published four generation component tariffs/power cost indicators, ranging from NIS 386 per megawatt hour, or MWh, to NIS 333.2 per MWh, instead of the single tariff that had previously been used. In January 2015, the EA published new tariffs, which reduced the tariff rates by approximately 10%. In connection with the indexation of their natural gas price formula for OPC’s gas supply agreement with the Tamar Partner, OPC and the Tamar Partners disagreed as to which of the EA’s July 2013 tariffs applied to the Tamar’s supply agreement and have a similar disagreement with respect to the tariffs published in January 2015. Subsequent to the period of the report, on February 2, 2017, OPC received a letter from Tamar's attorney claiming a debt of $ 24.6 million (including accrued interest) and requesting that such amount be deposited in escrow pursuant to the GSPA. Based on the OPC's legal consultant’s opinion it is not more likely than not that OPC will pay this claim and therefore no provision was included in the financial statements.
On June 21, 2017, the Tamar Partners filed a request for arbitration against OPC Rotem in accordance with the gas supply
agreement
. On July 20, 2017, OPC Rotem submitted its response to such request, rejecting the arguments of Tamar Partners and requesting (i) that it be determined that the relevant tariff in connection with the price of gas for the period in dispute is NIS 333.2 per MWh; (ii) that the amount deposited in escrow, plus the gains accrued thereon, should be released immediately; and (iii) that Tamar Partners bear OPC Rotem’s arbitration expenses. As at December 31, 2017, OPC Rotem has classified the amount deposited in escrow as non-current assets, since it is it is unable to assess whether this amount will be returned within the following 12 months.
| b. |
ORL Claim
|
In November 2017, a request was filed with the Tel Aviv-Jaffa District Court to approve a derivative claim on behalf of Oil Refineries Ltd. ("ORL"). The request is based on the petitioner's contention that the undertaking in the electricity purchase
transaction
between ORL and OPC-Rotem is an extraordinary interested party transaction that did not receive the approval of the general assembly of ORL shareholders on the relevant dates. The respondents to the request include ORL, Rotem, the Israel Corporation Ltd. and the members of ORL's Board of Directors at the time of entering into the electricity purchase transaction. The requested remedies include remedies such as a "do" order and financial remedies. OPC is studying the request and will respond to it as part of the legal process. OPC and its legal advisors are unable to assess the chances of the receipt of the request, the claim and the expectation of a negative cash flow. Therefore no provision was included in the financial statements.
| B. |
Commitments
|
I.C. Power
| (a) |
IC Power Asia Development Ltd (“ICPAD”)
|
As of
December
31, 2017, ICPAD has issued guarantees for a total amount of $44 million, as follows:
|
Guarantee party
|
Description
|
In thousands of NIS
|
In thousands of $
|
Cash Collateral
in thousands of $
|
||||||||||
|
Advanced Integrated Energy Ltd
|
IDOM - EPC Agreement
|
—
|
10,500
|
—
|
||||||||||
|
Advanced Integrated Energy Ltd
|
GE - CSA Agreement
|
—
|
21,000
|
—
|
||||||||||
|
OPC Rotem Ltd.
|
Facility agreement
|
45,000
|
12,980
|
6,505
|
||||||||||
F - 70
Note 21 – Contingent Liabilities, Commitments and Concessions (Cont’d)
| (b) |
OPC Rotem, Israel
|
Power Purchase Agreements (PPA)
On November 2, 2009, OPC signed a 20 year power purchase agreement (“the PPA”) with Israel Electric Company Ltd. (“IEC”) to purchase capacity and energy from OPC over a period of twenty (20) years from the commencement date of
commercial
operation (“COD”) of the plant. The PPA is a “capacity and energy” agreement, meaning, a right of OPC Rotem to provide the plant’s entire production capacity to IEC and to produce electricity in the quantities and on the dates as required by IEC.
PPA with end users
The PPA with IEC provides OPC Rotem with the option to allocate and sell the generated electricity of the power station directly to end users. OPC Rotem has exercised this option and sells all of its energy and capacity directly to end users.
Most
of the agreements are for a period of 10 years. The consideration, tariff, are set based on the TAOZ, the generation component of the time-of-use electricity tariff, less a discount from the generation component. Both the TAOZ and the generation component are determined by the Electricity Authority (EA, previously name PUA) and are updated from time to time.
If the consideration is less than a minimum tariff of the generation component, the Company has the right to terminate the agreements.
The agreements guaranty a certain level of availability of the power plant below which, customers are entitled to
compensation
.
Natural supply gas agreement
On November 25, 2012, OPC Rotem signed an agreement with Noble Energy Mediterranean Ltd., Delek Drilling Limited Partnership, Isramco Negev 2 Limited Partnership, Avner Oil Exploration Limited Partnership and Dor Gas Exploration Limited Partnership ("Tamar Partners") regarding the natural gas supply to the power plant. The agreement shall terminate upon the
earlier
of: June 2029 or until OPC Rotem has consumed the entire contractual quantity. In addition, each party has the right to extend the period of the agreement for a period of up two additional years under certain conditions or until the date of consuming the total contract quantity, whichever is earlier (the "Tamar Agreement").
The price of the gas is linked to changes in the "Production Cost" Tariff, which is part of the TAOZ, and partially linked to the USD
representative
exchange rate, and includes "a floor price". According to the Agreement, OPC Rotem shall purchase natural gas with a total contractual quantity of 10.6 BCM (billions of cubic meters). OPC Rotem is under a “take or pay” obligation regarding a certain annual quantity of natural gas based on a mechanism set forth in the Tamar Agreement. The Tamar Agreement contains certain conditions that provide in the future flexibility to reduce the minimum annual quantity.
On December 28, 2015 the agreement received the Israeli Antitrust Authority, ("Authority") approval. The agreement between Tamar and
OPC
Rotem allows cutting back the supply of gas to OPC Rotem during the "interim period" in the event of gas shortage and gives preference in such scenario to certain customers of Tamar Partners over OPC Rotem.
During the years 2015 and 2016, the EA updated the generation component of the TAOZ. This tariff is used to determine the price calculation between the OPC Rotem and the end users, and for the natural gas price indexation. As a result of these adjustments, the generation component was reduced in about 10% starting February 2015 and in about 5% starting September 13, 2015. A decline in generation component will result in a corresponding decline in the rates OPC Rotem charges its customers and, accordingly, its revenues. In December 2016, the EA published its decision regarding an update of the generation component of the TAOZ, which became effective on January 1, 2017, and further reduced the generation component tariff by approximately 0.5% from NIS 265.2 per MWh to NIS 264 per MWh (as opposed to the 8% reduction that was initially proposed in the October 2016 EA draft decision). However, as part of the December 2016 EA decision, TAOZ was also adjusted to reflect a decrease in certain payments made by IPPs to the IEC. As a result of such adjustment, OPC Rotem’s tariffs effectively increased by approximately 2% (despite the 0.5% reduction in the generation component tariff).
On January 8, 2018, the EA published a resolution which entered into force and effect on January 15, 2018, regarding the update of tariffs for 2018 (“2018 Tariff Update”), in which the rate of the production component was raised by 6.7% from NIS 265 per MWh
to
NIS 281.6 per MWh. As a result the 2018 Tariff Update, OPC Rotem may pay a price that is higher than the minimum price stipulated in their gas agreements.
F - 71
Note 21 – Contingent Liabilities, Commitments and Concessions (Cont’d)
| (b) |
OPC Rotem, Israel (cont´d)
|
System Management Charges
Since 2013, the EA had been in the process of determining a system cost tariff. In August 2015, the EA published a decision that IPPs in Israel would be obligated to pay system management service charges, which charges are retroactively effective as of June 1, 2013. According to the EA decision, as amended in September 2015, the amount of system management service charges that would be payable by OPC Rotem from the effective date of June 1, 2013 to June 30, 2015, was approximately NIS 159 million (approximately $41 million), excluding interest rate and linkage costs, based upon the “average rate” of the system management service charges. However, as the rate of the new system management service charges, like other rates of the EA, varies by season (e.g., summer and winter) and by demand period (peak, shoulder and off-peak), IEC’s final calculation of the amount payable by OPC Rotem was based upon the applicable time of use rates, which provides different energy rates for different seasons (e.g., summer and winter) and different periods of time during the day, or “Time of Use” rates. In December 2015, OPC Rotem received an invoice from IEC (in its capacity as the system manager) regarding the NIS 162.6 million (approximately $41.6 million) amount of system management service charges that would be payable by OPC Rotem for such period, including interest rate and linkage costs.
In February 2016, OPC Rotem paid NIS154 million (approximately $40 million) to IEC in satisfaction of this amount (excluding the interest rate, and linkage costs). In August 2016, the EA published a decision to change the method of calculation of the interest rate and to reduce the interest rate payable by IPPs (including OPC Rotem) with respect to system management service charges payable by them from the effective date of June 1, 2013 to September 13, 2015 (amounting to approximately 2.5% of the total amounts payable by IPPs in respect of the system management charges). As a result of the resolution, the system management cost provision was updated to a total amount of NIS 3 million
($
768 thousand). As of December 31, 2017, OPC Rotem paid the accrued balance.
| (c) |
OPC Hadera, Israel
|
Power
and Steam Purchase Agreement (“PSPA”)
On August 10, 2015, OPC Hadera and Hadera Paper entered into two agreements for the supply of electricity and steam to
Hadera
Paper’s facility:
| - |
Short Term PSPA - Pursuant this agreement, OPC Hadera will supply steam and electricity until COD of the power plant, which shall be done through the existing energy center.
|
| - |
Long Term PSPA – Pursuant this agreement, OPC Hadera will supply steam and electricity during the period commencing upon COD of the power plant and for a period of 18 years thereafter.
|
In consideration for electricity purchased under each of the PSPAs, Hadera Paper will pay an electricity tariff which is based on a certain discount in comparison with the electricity tariffs charged by the Israeli Electric Company Ltd. The steam price paid by Hadera Paper is subject to adjustment based upon Hadera Paper’s annual steam consumption.
Hadera
Paper
is under a “take or pay” obligation (hereinafter – "the TOP") regarding a certain annual quantity of steam based on a mechanism set forth in the agreements. Under the PSPAs, OPC Hadera is obligated to certain availability with respect to the supply of electricity and steam, which obligation excludes unavailability due to events predominately not in the control of OPC Hadera. In addition, in certain circumstances, OPC Hadera may be subject to penalties in the event of delays in the COD of the power plant. OPC Hadera’s liability is subject to an annual cap, as set out in the agreements.
PPA with end users
OPC Hadera completed the signing of agreements for the sale of most of the generation capacity of the power plant to end users. The agreements are for a period of 10 years, and under most of the agreements the end user has an early termination right in
accordance
, with the terms set forth in the agreement with right of refusal of OPC Hadera. The consideration was set based on the TAOZ rate, less a discount from the generation component.
If the consideration is less than the minimum tariff set for the generation component, OPC Hadera has the right to terminate the
agreements
. In addition, the agreements include compensation in the event of a delay of power plant’s COD and compensation for the unavailability of the power plant below an agreed minimum level.
F - 72
Note 21 – Contingent Liabilities, Commitments and Concessions (Cont’d)
| (c) |
OPC Hadera, Israel (cont’d)
|
Gas Sale and Purchase Agreement (“GSPA”)
On January 25, 2012, Hadera Paper entered into a gas sale and purchase agreement (hereinafter- the “GSPA”) with Noble Energy Mediterranean Ltd., Delek Drilling Limited Partnership, Isramco Negev 2 Limited Partnership, Dor Gas Exploration Limited Partnership and Everest Infrastructures Limited Partnership (hereinafter- the “Tamar Partners”) regarding the natural gas supply to Hadera Paper’s existing gas consuming facilities (i.e. the Energy Center) as well as the additional capacity of the power plant under construction. The agreement was amended on October 16, 2012. On August 10, 2015, the GSPA was assigned to OPC Hadera pursuant to the terms of the share purchase agreement. The GSPA will terminate upon the earlier of 15 years following the commencement of supply from the Tamar reservoir (April 2013) or until the date of consuming the total contract quantity (118,000,000 MMBTU). In addition, both parties have an option to extend the GSPA by up to two years in the event the total contract quantity was not yet consumed by the end of the GSPA term.
The price of the gas is linked to the weighted average generation cost tariff, published by the EA, and includes a “floor price”. In
addition
, the GSPA includes the TOP regarding a certain annual quantity of natural gas based on a mechanism set forth in the GSPA.
In addition, on September 6, 2016, OPC Hadera and the Tamar Partners entered into an additional GSPA (“Additional GSPA”) for the supply of additional quantities of natural gas (in addition to the original GSPA) as of the commissioning of the intended power plant.
The additional GSPA will terminate upon the earlier of 15 years following the completion of the commissioning of the power plant (
which
shall be concluded by no later than March 31, 2019) or until the date of consuming the total contract quantity (68,000,000 MMBTU, which shall be adjusted if and when the additional GSPA were to become on a firm supply basis). In addition, both parties have an option to extend the term of the additional GSPA by up to three years in the event the total contract quantity was not yet consumed by the end of the additional GSPA term.
The price of the gas is linked to the weighted average generation cost tariff, published by the EA, and includes a “floor price.”
As a part of Tamar Agreement with OPC Hadera, OPC Hadera has provided bank guarantees in the amount of $6 million (
approximately
NIS 21 million) in favor of Tamar Partners in connection with OPC Hadera’s undertaking under this agreement.
Israel Natural Gas Lines Ltd. Agreement for the Transmission of Natural Gas
On July 11, 2007, Hadera Paper signed a gas transmission agreement with Israel Natural Gas Lines Ltd. (hereinafter- “INGL”), which was assigned to OPC Hadera on August 10, 2015, in accordance to the SPA. The agreement as amended on
June
7, 2013 and March 31, 2015 is extended until July 14, 2018 and governs the transmission of natural gas to the Energy Center. The agreement was further extended and modified by a third amendment on December 28, 2015 which facilitates transmission of natural gas to the power plant, by means of the construction and installation of a new pressure regulation and measurement (PRMS) station, and includes additional commercial terms. The duration of the agreement, as modified by the third amendment, shall be 16 years from an agreed upon “start date” with an option for extension. The “start date” in accordance with the third amendment, will occur within a window of time as stipulated in the agreement. Such window may be postponed due to reasons attributable to changes in specifications of the PRMS or to the land on which the PRMS is to be constructed.
As part of the agreement, OPC Hadera extended to INGL a bank guarantee in the amount of approximately NIS 296
thousand
(approximately $85 thousand) linked to the CPI in connection with OPC Hadera's monthly payment commitment pursuant to the agreement, which replaces the original guarantee provided by the Company.
In
addition
, the OPC Hadera provided a CPI-linked corporate guarantee in an amount equal to NIS 4 million (approximately $1 million) in connection with the undertaking to construct the new PRMS facility for OPC Hadera under the agreement.
Gas Sale Agreement with Oil Refineries Ltd. (“ORL”)
On December 23, 2015, OPC Hadera contracted with ORL for the sale of surplus gas quantities supplied to it pursuant to the
Tamar
agreement. The agreement is for a period of three years from January 1, 2016, with an option for extension of such period as well as early termination rights. In addition, ORL is under the TOP obligation regarding a certain annual quantity of natural gas based on a mechanism set forth in the agreement. OPC Hadera has an option to stop selling gas if it reaches the commercial operation earlier than expected or in February 2018 with prior written notice.
F - 73
Note 21 – Contingent Liabilities, Commitments and Concessions (Cont’d)
| (c) |
OPC Hadera, Israel (cont’d)
|
IDOM Servicios Integrados
On January 21, 2016, an agreement was signed between OPC Hadera and SerIDOM Servicios Integrados IDOM, S.A.U (hereinafter - “IDOM”), for the design, engineering, procurement and construction of a cogeneration power plant in
consideration
of approximately $156 million (including additions to the Agreement that were signed at a later date), which is payable on the basis of progress and the achievement of milestones. The agreement contains a mechanism for the compensation of OPC Hadera in the event that IDOM fails to meet its contractual obligations, up to the amounts that are set forth in the agreement. IDOM has provided bank guarantees and a corporate guarantee by its parent company to secure said obligations and OPC Hadera has extended to IDOM a guarantee to secure part of OPC Hadera's liabilities.
General Electric International and GE Global Parts
On June 27, 2016, OPC Hadera entered into a long-term service agreement (hereinafter - “the Service Agreement”) with General Electric International Ltd. (hereinafter - “GEI”) and GE Global Parts & Products GmbH (hereinafter - “GEGPP”), pursuant to which these two companies will provide maintenance treatments for the two gas turbines of GEI, generators and
auxiliary
facilities of the OPC Hadera Power Plant for a period commencing on the date of commercial operation until the earlier of: (a) the date on which all of the covered units (as defined in the Service Agreement) have reach the end-date of their performance and (b) 25 years from the date of signing the Service Agreement. The cost of the service agreement amounts to $42 million when the consideration will be payable over the term of the Agreement, based on the formula prescribed therein.
The Service Agreement contains a guarantee of reliability and other obligations concerning the performance of the Power
Plant
and indemnification to OPC Hadera in the event of failure to meet the performance obligations. At the same time, OPC Hadera has undertaken to pay bonuses in the event of improvement in the performance of the plant as a result of the maintenance works, up to a cumulative ceiling for every inspection period. GEI provided its subsidiary with a corporate guarantee of the parent company. To secure these liabilities, IC Power Asia Development Ltd. (hereinafter ICPAD) provided GEI with a corporate guarantee to secure some of OPC Hadera's liabilities. Subsequent to the report date, in 2018, OPC Hadera assumed the corporate guarantee that was provided by ICPAD.
| (d) |
OPC Energy Ltd., Israel
|
Option agreement with Hadera Paper
On April 5, 2017, OPC Energy signed an option agreement with Hadera Paper, effective from February 9, 2017, concerning the lease of an area of some 68,000 sq.m. in proximity to the Hadera Power Plant, pending the approval of the competent organs. The option period commenced on the date of signing and expires on December 31, 2022. The option period is divided into three periods for which the option fees will be payable: NIS 500 thousand (approximately
$
144 thousand) for 2017; NIS 1.5 million (approximately
$
433 thousand) for 2018; and NIS 3 million (approximately
$
865 thousand) for each of the years 2019 through 2022 (inclusive). As part of the agreement, OPC Energy undertakes to work to obtain statutory authorization for the construction of a power plant on the leased area and to pursue the advancement and approval of the statutory plan within the option period. OPC Energy may terminate the option agreement with an advance notice of 14 days during the first option period (i.e. until December 31, 2017).
Additionally, OPC Energy is required to notify, at least 90 days prior to the end of each option year, of its intention to extent the option for an additional year. Otherwise, the option will expire at the end of the same year. According to the agreement, the option will expire if the National Infrastructure Committee refuses to approve the statutory plan and OPC Energy will not initiate legal proceedings in connection with such refusal. The agreement also prescribes the principles of the lease agreement that would be signed subject to the exercise of the option and stipulates that the option will expire if, at the end of 120 days of the date of signing of the option agreement, the parties fail to agree on the wording of the lease agreement. According to the principles that are set forth in the option agreement in relation to the lease agreement, the lease period will be 25 years less one month, starting on the handing over of possession in the leasehold (i.e. the date of exercising the option) or on the date of commencement of commercial operation, as set forth in the agreement, with an option to extend the engagement. It is further stipulated that the lease agreement will not include a liability limit and that OPC Energy will bear all fees, taxes and payments that are imposed in respect of the construction of a power plant on the leasehold.
F - 74
Note 21 – Contingent Liabilities, Commitments and Concessions (Cont’d)
| (d) |
OPC Energy Ltd., Israel (cont’d)
|
Zomet Energy Ltd.
On April 6, 2017, OPC Energy (formerly IC Power Israel) entered into a series of agreements to acquire 95% of the shares of
Zomet
Energy Ltd. (
Zomet
) from Ipswich Holdings Netherlands B.V. (47.5%) and Rapac Energy Ltd. (47.5%), and an agreement with Methy Invest S.A. (Methy) for the waiver of its rights in connection with the shares of Ipswich and Rapac.
Zomet
holds the rights to develop a natural gas fired power station at Plugot Junction (Israel) with an estimated capacity of approximately 396 MW, and the land rights and statutory approvals.
The total transaction consideration under the aforesaid agreements is expected to aggregate approximately $24 million, subject to adjustments pertaining to the volume of the Zomet Project and subject to the payment milestones that are stipulated in the agreement.
On August 7, 2017, OPC Energy received a letter from the Israel Antitrust Authority and the Chairman of the Committee for the
Reduction
of Concentration (“the Concentration Committee”), addressed to the Electricity Authority, stating that the Concentration Committee recommends not to grant a conditional license for the Zomet project.
Negotiations were held between OPC Energy and the Concentration Committee, including Kenon and interested parties
therein
. As of the date of this report, the decision of the Concentration Committee is pending and there is no certainty that its decision will permit the completion of the transaction.
In March 2018, OPC completed the acquisition of 95% of the shares of Zomet Energy, although Zomet still requires the necessary regulatory approvals, the approval for a new conditional licenses for electricity generation of the Electricity Authority and the approval of the Anti-Trust Commissioner.
| (e) |
OPC Rotem and OPC Hadera
|
Energean agreement
On December 6, 2017, OPC Rotem and OPC Hadera signed an agreement with Energean Israel Ltd. (hereinafter - "Energean"), which have holdings in the Karish and Tanin gas reservoirs (hereinafter - "the gas reservoir"), subject to the
fulfillment
of suspending conditions). The agreements with OPC Rotem and OPC Hadera are separate and independent. According to the terms set forth in the agreements, the total quantity of natural gas that OPC Rotem and OPC Hadera are expected to purchase is about 9 BCM (for OPC Rotem and OPC Hadera together) for the entire supply period (hereinafter - the "Total Contractual Quantity"). The agreement includes, among other things, TOP mechanism under which OPC Rotem and OPC Hadera will undertake to pay for a minimum quantity of natural gas, even if they have not used it.
The agreements include additional provisions and arrangements for the purchase of natural gas, and with regard to
maintenance
, gas quality, limitation of liability, buyer and seller collateral, assignments and liens, dispute resolution and operational mechanisms.
The agreements are valid for 15 years from the date the agreement comes into effect or until completion of the supply of the total contractual quantity from Energean to each of the subsidiaries (OPC Rotem and OPC Hadera ). According to each of the agreements, if after the elapse of 14 years from the date the agreement comes into effect, the contracting company did not
take
an amount equal to 90% of the total contractual quantity, subject to advance notice, each party may extend the agreement for an additional period which will begin at the end of 15 years from the date the agreement comes into effect until the earlier of: (1) completion of consumption of the total contractual quantity; or (2) at the end of 18 years from the date the agreement comes into effect. The agreement includes circumstances under which each party will be entitled to bring the relevant agreement to an end before the end of the contractual period, in case of prolonged non-supply, damage to collateral and more.
As for the
consideration
, the price of natural gas is based on an agreed formula, linked to the electricity generation component and includes a minimum price. The total financial volume of the agreements may reach $ 1.3 billion (assuming maximum consumption according to the agreements and according to the gas price formula as at the report date), and depends mainly on the electricity generation component and the gas consumption. On January 14, 2018, the agreement was approved by OPC Energy’s shareholders.
| (f) |
Inkia Energy Limited
|
Under the share purchase agreement, our subsidiary Inkia has agreed to indemnify the buyer and its successors, permitted assigns, and affiliates against certain losses arising from a breach of Inkia’s representations and warranties and certain tax matters, subject to certain time and monetary limits depending on the particular indemnity obligation. These indemnification obligations are supported by (a) a three-year pledge of shares of OPC which represent 25% of OPC’s outstanding shares, (b) a deferral of $175 million of the purchase price in the form of a four-year $175 million Deferred Payment Agreement, accruing interest at 8% per year and payable in-kind, and (c) a three-year corporate guarantee from Kenon for all of the Inkia’s indemnification obligations.
F - 75
Note 22 – Share Capital and Reserves
| A. |
Share Capital
|
|
Company
|
||||||||
|
No. of shares
|
||||||||
|
(’000)
|
||||||||
|
2017
|
2016
|
|||||||
|
Authorised and in issue at January, 1
|
53,720
|
53,694
|
||||||
|
Authorised and in issued as part of the spin-off from IC
|
—
|
—
|
||||||
|
53,720
|
53,694
|
|||||||
|
Issued for share plan
|
88
|
26
|
||||||
|
Authorised and in issue at December. 31
|
53,808
|
53,720
|
||||||
All shares rank equally with regards to Company’s residual assets. The holders of ordinary shares are entitled to receive dividends as declared from time to time, and are entitled to one vote per share at meetings of the Company. All issued share are fully paid with no par value.
The capital structure of the Company comprises of issued capital and accumulated profits. The management manages its capital structure to ensure that the Company will be able to continue to operate as a going concern. The Company is not subjected to externally imposed capital requirement.
In 2017, 87,
911
(2016: 25,692) ordinary shares were granted under the Share Incentive Plan to key management at an average price of $12.51 (2016: $9.34) per share.
Capital reduction
In December 2017, Kenon's shareholders approved a capital reduction to permit a distribution to shareholders of a portion of the proceeds received from the sale of Kenon's Latin American and Caribbean power generation and distribution businesses (the "Sale"). The capital reduction of up to $750 million was approved by the High Court of the Republic of Singapore on February 20, 2018. Kenon's Board of Directors considered a number of factors in determining the amount of the distribution, including the amount of proceeds from the Sale remaining after the repayment of debt, the payment of tax and other expenses, and Kenon's anticipated cash needs after the distribution.
On March 22, 2018, Kenon distributed an aggregate amount of $665 million, or $12.35 per share, to Kenon’s shareholders. The share capital and total equity of Kenon will be reduced by $665 million in 2018. Following
Kenon’s
payment of the distribution,
repayment of debt, payment of tax and other expenses,
Kenon will retain cash in excess of $50 million
at the holding company level
(see Note
33
.1.A).
| B. |
Translation reserve
|
The translation reserve includes all the foreign currency differences stemming from translation of financial statements of foreign activities as well as from translation of items defined as investments in foreign activities commencing from January 1, 2007 (the date IC first adopted IFRS).
| C. |
Capital reserves
|
Capital reserves reflect the unrealized portion of the effective part of the accrued net change in the fair value of hedging derivative instruments that have not yet been recorded in the statement of profit or loss.
| D. |
Kenon's share plan
|
Kenon has established a share incentive plan for its directors and management. The plan provides grants of Kenon shares, as well as stock options in respect of Kenon’s shares, to directors and officers of the Company, and IC pursuant to awards, which may be granted by Kenon from time to time, representing up to 3% of the total issued shares (excluding treasury shares) of Kenon. During 2015 and 2014, Kenon granted awards of shares to certain members of its management. Such shares are vested upon the satisfaction of certain conditions, including the recipient’s continued employment in a specified capacity and Kenon’s listing on each of the NYSE and the TASE. The fair value of the shares granted in 2017 is $1 million (2016: $240 thousand, 2015: $ 940 thousand) and was determined based on the fair value of Kenon’s shares on the grant date. Kenon recognized $508 thousand as general and administrative expenses in 2017 (2016: $547 thousand, 2015: $566 thousand).
F - 76
Note
23 – OPC Energy
Ltd’s
Initial Public Offering
On August 10, 2017, OPC Energy Ltd (“OPC”) completed the issuance of 31,866,700 ordinary shares on the Tel Aviv Stock Exchange to the public at a price of NIS 12.5 per share (approximately US$ 3.47 per share). The proceeds of the issuance amount to approximately NIS 399 million (approximately $ 111 million), net of issuance costs of NIS 39 million (approximately $11 million). After the completion of the issuance, the public holds 24.2% of OPC’s shares, while the Group’s equity interest was diluted to 75.8% of the total issued shares of OPC. As a result of the dilution, the Group, registered $57 million, net of capital reserves realization, in equity attributable to equity holders and $42 million in non-controlling interest.
Note 24 – Cost of Sales and Services
|
For the Year Ended December 31
|
||||||||||||
|
2017
|
2016*
|
|
2015*
|
|
||||||||
|
$ thousands
|
||||||||||||
|
Capacity and energy purchases and transmission costs
|
50,973
|
57,310
|
93,196
|
|||||||||
|
Fuel, gas and lubricants
|
137,832
|
133,012
|
142,967
|
|||||||||
|
Payroll and related expenses
|
6,269
|
5,942
|
4,325
|
|||||||||
|
Regulatory expenses
|
62,908
|
48,509
|
-
|
|||||||||
|
Third party services
|
2,670
|
2,890
|
-
|
|||||||||
|
Other
|
6,484
|
4,003
|
4,328
|
|||||||||
|
267,136
|
251,666
|
244,816
|
||||||||||
* Restated (See note 2.E)
Note 25 – Selling, General and Administrative Expenses
|
For the Year Ended December 31
|
||||||||||||
|
2017
|
2016*
|
|
2015*
|
|
||||||||
|
$ thousands
|
||||||||||||
|
Payroll and related expenses
|
21,380
|
14,830
|
17,085
|
|||||||||
|
Depreciation and amortization
|
691
|
641
|
817
|
|||||||||
|
Professional fees
|
20,334
|
23,863
|
9,576
|
|||||||||
|
Other expenses
|
13,887
|
7,761
|
22,248
|
|||||||||
|
56,292
|
47,095
|
49,726
|
||||||||||
* Restated (See note 2.E)
F - 77
Note 26 – Financing Income (Expenses), Net
|
For the Year Ended December 31
|
||||||||||||
|
2017
|
2016
|
2015
|
||||||||||
|
$ thousands
|
||||||||||||
|
Financing income
|
||||||||||||
|
Interest income from bank deposits
|
640
|
2,269
|
4,772
|
|||||||||
|
Net change from change in exchange rates
|
2,259
|
5,448
|
521
|
|||||||||
|
Net changes in fair value of Tower options series 9
|
-
|
-
|
2,119
|
|||||||||
|
Net change in fair value of derivative financial instruments
|
-
|
6
|
2,720
|
|||||||||
|
Other income
|
5
|
1
|
589
|
|||||||||
|
Financing income
|
2,904
|
7,724
|
10,721
|
|||||||||
|
Financing expenses
|
||||||||||||
|
Interest expenses to banks and others
|
(59,514
|
)
|
(45,317
|
)
|
(34,378
|
)
|
||||||
|
Net change from change in exchange rates
|
-
|
-
|
(648
|
)
|
||||||||
|
Net change in fair value of derivative financial instruments
|
(1,168
|
)
|
-
|
-
|
||||||||
|
Other expenses
|
(9,484
|
)
|
(1,959
|
)
|
(1,368
|
)
|
||||||
|
Financing expenses
|
(70,166
|
)
|
(47,276
|
)
|
(36,394
|
)
|
||||||
|
Net financing expenses recognized in the statement of profit and loss
|
(67,262
|
)
|
(39,552
|
)
|
(25,673
|
)
|
||||||
F - 78
Note 27 – Income Taxes
| A. |
Components of the Income Taxes
|
|
For the Year Ended December 31
|
||||||||||||
|
2017
|
2016
|
2015
|
||||||||||
|
$ thousands
|
||||||||||||
|
Current taxes on income
|
||||||||||||
|
In respect of current year*
|
64,291
|
1,687
|
25
|
|||||||||
|
In respect of prior years
|
44
|
92
|
(294
|
)
|
||||||||
|
Deferred tax income
|
||||||||||||
|
Creation and reversal of temporary differences
|
8,474
|
473
|
9,312
|
|||||||||
|
Total taxes on income
|
72,809
|
2,252
|
9,043
|
|||||||||
No previously unrecognized tax benefits were used in 2015, 2016 or 2017 to reduce our current tax expense.
| * |
Current taxes on income for the current year includes $61 million taxes payable in connection with a planned restructuring to simplify the holding structure of some of the companies remaining in the Kenon group subsequent to the Inkia transaction. As a result of this restructuring (which was substantially completed in January 2018), Kenon will hold its interest in OPC directly. Kenon does not expect any further tax liability in relation to any future sales of its interest in OPC.
|
| B. |
Reconciliation between the theoretical tax expense (benefit) on the pre-tax income (loss) and the actual income tax expenses
|
|
For the Year Ended December 31
|
||||||||||||
|
2017
|
2016
|
2015
|
||||||||||
|
$ thousands
|
||||||||||||
|
(Loss)/profit from continuing operations before income taxes
|
(135,636
|
)
|
(426,900
|
)
|
32,154
|
|||||||
|
Statutory tax rate
|
17.00
|
%
|
17.00
|
%
|
17.00
|
%
|
||||||
|
Tax computed at the statutory tax rate
|
(23,058
|
)
|
(72,573
|
)
|
5,466
|
|||||||
|
Increase (decrease) in tax in respect of:
|
||||||||||||
|
Elimination of tax calculated in respect of the Group’s share in losses of associated companies
|
20,924
|
31,651
|
18,880
|
|||||||||
|
Income subject to tax at a different tax rate
|
63,446
|
(2,548
|
)
|
7,218
|
||||||||
|
Non-deductible expenses
|
12,850
|
41,960
|
3,944
|
|||||||||
|
Exempt income
|
(7,006
|
)
|
-
|
(35,651
|
)
|
|||||||
|
Taxes in respect of prior years
|
44
|
92
|
(294
|
)
|
||||||||
|
Impact of change in tax rate
|
-
|
-
|
-
|
|||||||||
|
Changes in temporary differences in respect of which deferred taxes are not recognized
|
4,285
|
1,419
|
580
|
|||||||||
|
Tax losses and other tax benefits for the period regarding which deferred taxes were not recorded
|
350
|
2,449
|
8,335
|
|||||||||
|
Differences between the measurement base of income reported for tax purposes and the income reported in the financial statements
|
13
|
-
|
(419
|
)
|
||||||||
|
Other differences
|
961
|
(198
|
)
|
984
|
||||||||
|
Taxes on income included in the statement of profit and loss
|
72,809
|
2,252
|
9,043
|
|||||||||
F - 79
Note 27 – Income Taxes (Cont’d)
| C. |
Deferred tax assets and liabilities
|
| 1. |
Deferred tax assets and liabilities recognized
|
The deferred taxes are calculated based on the tax rate expected to apply at the time of the reversal as detailed below.
Deferred
taxes in respect of subsidiaries were calculated based on the tax rates relevant for each country.
The
deferred
tax assets and liabilities are derived from the following items:
|
Property plant and equipment
|
Employee benefits
|
Carryforward of losses and deductions for tax purposes
|
Other*
|
Total
|
||||||||||||||||
|
$ thousands
|
||||||||||||||||||||
|
Balance of deferred tax asset (liability) as at January 1, 2016
|
(123,968
|
)
|
601
|
61,943
|
(73,966
|
)
|
(135,390
|
)
|
||||||||||||
|
Changes recorded on the statement of profit and loss
|
(48,212
|
)
|
286
|
28,014
|
1,741
|
(18,171
|
)
|
|||||||||||||
|
Changes recorded to equity reserve
|
—
|
61
|
—
|
(5,249
|
)
|
(5,188
|
)
|
|||||||||||||
|
Translation differences
|
(1,495
|
)
|
15
|
398
|
791
|
(291
|
)
|
|||||||||||||
|
Impact of change in tax rate
|
7,638
|
—
|
(5,620
|
)
|
(8,875
|
)
|
(6,857
|
)
|
||||||||||||
|
Changes in respect of business combinations
|
(41,456
|
)
|
748
|
—
|
6,355
|
(34,353
|
)
|
|||||||||||||
|
Balance of deferred tax asset (liability) as at December 31, 2016
|
(207,493
|
)
|
1,711
|
84,735
|
(79,203
|
)
|
(200,250
|
)
|
||||||||||||
|
Changes recorded on the statement of profit and loss
|
(13,940
|
)
|
(1,097
|
)
|
(13,919
|
)
|
15,845
|
(13,111
|
)
|
|||||||||||
|
Changes recorded to equity reserve
|
-
|
882
|
-
|
(7,024
|
)
|
(6,142
|
)
|
|||||||||||||
|
Translation differences
|
(10,046
|
)
|
24
|
4,397
|
1,253
|
(4,372
|
)
|
|||||||||||||
|
Impact of change in tax rate
|
575
|
-
|
-
|
-
|
575
|
|||||||||||||||
|
Sale of subsidiaries
|
140,736
|
(1,520
|
)
|
(39,764
|
)
|
71,095
|
170,547
|
|||||||||||||
|
Balance of deferred tax asset (liability) as at December 31, 2017
|
(90,168
|
)
|
-
|
35,449
|
1,966
|
(52,753
|
)
|
|||||||||||||
| * |
This amount includes deferred tax
arising
from derivative instruments, intangibles, undistributed profits, non-monetary items and trade receivables distribution.
|
| 2. |
The deferred taxes are presented in the statements of financial position as follows:
|
|
As at December 31
|
||||||||
|
2017
|
2016
|
|||||||
|
$ thousands
|
||||||||
|
As part of non-current assets
|
-
|
25,104
|
||||||
|
As part of non-current liabilities
|
(52,753
|
)
|
(225,354
|
)
|
||||
|
(52,753
|
)
|
(200,250
|
)
|
|||||
Income tax rate in Israel is 24%, 25% and 26.5% for the years ended December 31, 2017 and December 31, 2016 and 2015,
respectively
.
On January 4, 2016, Amendment 216 to the Income Tax Ordinance (New Version) – 1961 (hereinafter – “the Ordinance”) was passed
in
the Knesset. As part of the amendment, OPC’s and Hadera’s income tax rate was reduced by 1.5% to a rate of 25% as from 2016. Furthermore, on December 22, 2016 the Knesset plenum passed the Economic Efficiency Law (Legislative Amendments for Achieving Budget Objectives in the Years 2017 and 2018) – 2016, by which, inter alia, the corporate tax rate would be reduced from 25% to 23% in two steps. The first step will be to a rate of 24% as from January 2017 and the second step will be to a rate of 23% as from January 2018.
As a result of reducing the tax rate to 25%, the deferred tax balances as at January 4, 2016 were calculated according to the new tax rate specified in the Law for the Amendment of the Income Tax Ordinance, at the tax rate expected to apply on the reversal date.
F - 80
Note 27 – Income Taxes (Cont’d)
In Singapore, under its one-tier corporate taxation system, profits are taxed at the corporate level at 17% and this is a final tax. Dividends paid by a Singapore resident company under the one-tier corporate tax system should not be taxable.
A Company is liable to pay tax in Singapore on income that is:
| · |
Accrued in or derived from Singapore; or
|
| · |
Received in Singapore from outside of Singapore.
|
Certain categories of foreign sourced income including,
| · |
dividend income;
|
| · |
trade or business profits of a foreign branch; or
|
| · |
service fee income derived from a business, trade or
|
| · |
profession carried on through a fixed place of operation in a foreign jurisdiction.
|
may be exempted from tax in Singapore.
Tax exemption should be granted when all of the three conditions below are met:
| 1. |
The highest corporate tax rate (headline tax rate) of the foreign jurisdiction from which the income is received is at least 15% at the time the foreign income is received in Singapore;
|
| 2. |
The foreign income had been subjected to tax in the foreign jurisdiction from which they were received (known as the "subject to tax" condition). The rate at which the foreign income was taxed can be different from the headline tax rate; and
|
| 3. |
The Tax Comptroller is satisfied that the tax exemption would be beneficial to the person resident in Singapore.
|
The Comptroller will regard the "subject to tax" condition as having met if the income is exempt from tax in the foreign jurisdiction due to tax incentive granted for substantive business activities carried out in that jurisdiction.
Extension of safe habour under Singapore Budget 2016
Singapore does not impose taxes on disposal gains, which are considered to be capital in nature, but imposes tax on income and gains of a trading nature. As such, whenever a gain is realized on the disposal of an asset, the practice of the IRAS is to rely upon a set of commonly-applied rules in determining the question of capital (not taxable) or revenue (taxable). Under Singapore tax laws, any gains derived by a divesting company from its disposal of ordinary shares in an investee company between June 1, 2012 and May 31, 2022 (extended from May 31, 2017 to May 31, 2022) are generally not taxable if, immediately prior to the date of such disposal, the divesting company has held at least 20% of the ordinary shares
in the investee company for a continuous period of at least 24 months.
Deferred tax liability on undistributed earnings
Subsidiaries pay dividends on quarterly basis as long as they are in compliance with covenants derived from the borrowings agreements described in Note 16. Deferred tax is recognized for temporary differences related to undistributed earnings in subsidiaries that will reverse it in the foreseeable future. During 2017, the Group recorded an expense of $3 million in relation to this timing difference ($1 million in 2016).
Distributions of the earnings of foreign subsidiaries are subject to the withholding taxes imposed by the foreign subsidiaries´ jurisdictions of incorporation. I.C.
Power does not have funds designated for, or subject to, permanent reinvestment in any country in which it operates.
F - 81
Note 28 – Earnings per Share
Data used in calculation of the basic / diluted earnings per share
| A. |
Income/(Loss) allocated to the holders of the ordinary shareholders
|
|
For the Year Ended December 31
|
||||||||||||
|
2017
|
2016
|
2015
|
||||||||||
|
$ thousands
|
||||||||||||
|
Income/(Loss) for the year attributable to Kenon’s shareholders
|
236,590
|
(411,937
|
)
|
72,992
|
||||||||
|
Income for the year from discontinued operations (after tax)
|
476,565
|
35,150
|
72,781
|
|||||||||
|
Less: NCI
|
(24,928
|
)
|
(13,250
|
)
|
(12,872
|
)
|
||||||
|
Income for the year from discontinued operations (after tax) attributable to Kenon’s shareholders
|
451,637
|
21,900
|
59,909
|
|||||||||
|
(Loss)/Income for the year from continuing operations attributable to Kenon’s shareholders
|
(215,047
|
)
|
(433,837
|
)
|
13,083
|
|||||||
| B. |
Number of ordinary shares
|
|
For the Year Ended December 31
|
||||||||||||
|
2017
|
2016
|
2015
|
||||||||||
|
('000)
|
||||||||||||
|
Weighted Average number of shares used in calculation of basic/diluted earnings per share
|
53,761
|
53,720
|
53,649
|
|||||||||
F - 82
Note 29 – Discontinued Operations
| (a) |
I.C. Power (Latin America businesses)
|
In December 2017, Inkia, a wholly-owned subsidiary of IC Power completed the sale of its Latin American and Caribbean businesses to ISQ
,
an infrastructure private equity firm.
The sale generated proceeds of approximately $1,332 million consisting of $1,110 million proceeds paid by ISQ plus retained unconsolidated cash at Inkia of $222 million. This reflects the base purchase price of $1,177 million after certain adjustments, including estimated working capital, debt and cash at closing. The purchase price is subject to adjustments, including a final adjustment based on actual working capital, debt and cash amounts as of the closing date.
As part of the transaction, ISQ
have assumed
Inkia’s $600 million of bonds, which were issued in November and December 2017.
At the date of closing,
ISQ
paid $935 million and entered into
a four year $175 million deferred payment obligation accruing 8% interest
payable in kind
.
In addition, Kenon’s subsidiaries is entitled to receive certain payments from ISQ in connection with certain insurance and other claims held by companies within the Inkia’s businesses. Included in the financials for FY2017, is $12 million that has been recognized in discontinued operations.
Set forth below are the results attributable to the discontinued operations
|
Year Ended December 31, 2017
|
Year Ended December 31, 2016
|
Year Ended December 31, 2015
|
||||||||||
|
$ thousands
|
||||||||||||
|
Revenue
|
1,777,232
|
1,517,391
|
962,677
|
|||||||||
|
Cost of sales and services (excluding depreciation and
amortization
)
|
(1,235,214
|
)
|
(1,076,563
|
)
|
(620,180
|
)
|
||||||
|
Depreciation and amortization
|
(135,733
|
)
|
(132,998
|
)
|
(85,482
|
)
|
||||||
|
Gross profit
|
406,285
|
307,830
|
257,015
|
|||||||||
|
Income before taxes on income
|
152,280
|
92,233
|
126,116
|
|||||||||
|
Taxes on income
|
(73,141
|
)
|
(57,083
|
)
|
(53,335
|
)
|
||||||
|
Income after taxes on income
|
79,139
|
35,150
|
72,781
|
|||||||||
|
Gain on sale of discontinued operations
|
529,923
|
-
|
-
|
|||||||||
|
Tax on gain on sale of discontinued operations
|
(132,497
|
)
|
-
|
-
|
||||||||
|
Income from discontinued operations
|
476,565
|
35,150
|
72,781
|
|||||||||
|
Net cash flows provided by operating activities
|
319,637
|
176,515
|
229,757
|
|||||||||
|
Net cash flows provided by
/(
used in) investing activities
|
816,544
|
(
300,833
|
)
|
(
637,994
|
)
|
|||||||
|
Net cash flows
(used in)/
provided by financing activities
|
(103,524
|
)
|
25,308
|
163,714
|
||||||||
|
Cash and cash equivalents
provided by/(
used in
)
discontinued operations
|
1,
032,657
|
(
99,010
|
)
|
(
244,523
|
)
|
|||||||
|
Property, plant and equipment
|
2,937,005
|
|||||||||||
|
Goodwill and intangible assets
|
357,835
|
|||||||||||
|
Investments in associated companies
|
9,155
|
|||||||||||
|
Deferred taxes, net
|
25,450
|
|||||||||||
|
Income tax receivable
|
112,457
|
|||||||||||
|
Trade and other receivables
|
379,143
|
|||||||||||
|
Inventories
|
91,718
|
|||||||||||
|
Cash and cash equivalents
|
138,708
|
|||||||||||
|
Trade and other liabilities
|
(2,753,476
|
)
|
||||||||||
|
Net asset
|
1,297,995
|
|||||||||||
|
Consideration received, satisfied in cash
|
934,573
|
|||||||||||
|
Transaction costs
|
(3,280
|
)
|
||||||||||
|
Cash and cash equivalents disposed off
|
(138,708
|
)
|
||||||||||
|
Net cash inflow
|
792,585
|
|||||||||||
F - 83
Note 30 – Segment, Customer and Geographic Information
| A. |
General
|
The following summary describes the Group’s reportable segments in 2017:
| 1. |
OPC –
OPC Energy Ltd operates in the Israeli electricity generation sector, including the initiation, development, construction and operation of power plants and the sale and supply of electricity.
|
| 2. |
Qoros Automotive
– A China-based automotive company that is jointly-owned with a subsidiary of Wuhu Chery, a state controlled holding enterprise and large Chinese automobile manufacturing company.
In addition to the segments detailed above, the Group has other activities, such as the discontinued power businesses in Latin America and Caribbean, container
shipping
services and renewable energy businesses categorized as Others.
Evaluation of the operating segments performance is based on Adjusted EBITDA. Adjusted EBITDA is defined as the net income (loss) excluding depreciation and amortization, financing income, income taxes and other items as presented in the tables below.
There were no intersegment sales in 2017, 2016 and 2015.
|
| B. |
Information regarding reportable segments
|
Financial information of the reportable segments is set forth in the following table.
|
OPC
|
Qoros*
|
Other
|
Adjustments
|
Total
|
||||||||||||||||
|
$ thousands
|
||||||||||||||||||||
|
2017
|
||||||||||||||||||||
|
Total sales
|
365,395
|
-
|
309
|
-
|
365,704
|
|||||||||||||||
|
Income/(loss) before taxes
|
22,708
|
(121,198
|
)
|
(37,146
|
)
|
-
|
(135,636
|
)
|
||||||||||||
|
Income Taxes
|
(8,945
|
)
|
-
|
(63,864
|
)
|
-
|
(72,809
|
)
|
||||||||||||
|
Income/(loss) from continuing operations
|
13,763
|
(121,198
|
)
|
(101,010
|
)
|
-
|
(208,445
|
)
|
||||||||||||
|
Depreciation and amortization
|
30,102
|
-
|
692
|
-
|
30,794
|
|||||||||||||||
|
Financing income
|
(1,088
|
)
|
-
|
(13,230
|
)
|
11,414
|
(2,904
|
)
|
||||||||||||
|
Financing expenses
|
33,753
|
-
|
47,827
|
(11,414
|
)
|
70,166
|
||||||||||||||
|
Other items:
|
||||||||||||||||||||
|
Share in losses/(income) of associated companies
|
-
|
121,198
|
(10,533
|
)
|
-
|
110,665
|
||||||||||||||
|
Write back of impairment of investments
|
-
|
-
|
(28,758
|
)
|
-
|
(28,758
|
)
|
|||||||||||||
|
62,767
|
121,198
|
(4,002
|
)
|
-
|
179,963
|
|||||||||||||||
|
Adjusted EBITDA
|
85,475
|
-
|
(41,148
|
)
|
-
|
44,327
|
||||||||||||||
|
Segment assets
|
939,809
|
-
|
1,464,354
|
-
|
2,404,163
|
|||||||||||||||
|
Investments in associated companies
|
-
|
1,694
|
120,000
|
-
|
121,694
|
|||||||||||||||
|
2,525,857
|
||||||||||||||||||||
|
Segment liabilities
|
742,692
|
-
|
731,818
|
-
|
1,474,510
|
|||||||||||||||
|
Capital expenditure
|
109,226
|
-
|
121,245
|
-
|
230,471
|
|||||||||||||||
* Associated Company – See Note 10.A.2 and 10.C.b.
F - 84
Note 30 – Segment, Customer and Geographic Information (Cont’d)
|
OPC
|
Qoros*
|
Other
|
Adjustments
|
Total
|
||||||||||||||||
|
$ thousands
|
||||||||||||||||||||
|
2016
|
||||||||||||||||||||
|
Total sales
|
324,188
|
-
|
65
|
-
|
324,253
|
|||||||||||||||
|
Income/(loss) before taxes
|
20,450
|
(142,534
|
)
|
(304,816
|
)
|
-
|
(426,900
|
)
|
||||||||||||
|
Income Taxes
|
(67
|
)
|
-
|
(2,185
|
)
|
-
|
(2,252
|
)
|
||||||||||||
|
Income/(loss) from continuing operations
|
20,383
|
(142,534
|
)
|
(307,001
|
)
|
-
|
(429,152
|
)
|
||||||||||||
|
Depreciation and amortization
|
26,697
|
-
|
589
|
-
|
27,286
|
|||||||||||||||
|
Financing income
|
(2,988
|
)
|
-
|
(17,081
|
)
|
12,345
|
(7,724
|
)
|
||||||||||||
|
Financing expenses
|
22,838
|
-
|
36,783
|
(12,345
|
)
|
47,276
|
||||||||||||||
|
Other items:
|
||||||||||||||||||||
|
Share in losses/(income) of associated companies
|
-
|
142,534
|
43,681
|
-
|
186,215
|
|||||||||||||||
|
Provision of financial guarantee
|
-
|
-
|
130,193
|
-
|
130,193
|
|||||||||||||||
|
Impairment of investments
|
-
|
-
|
72,263
|
-
|
72,263
|
|||||||||||||||
|
46,547
|
142,534
|
266,428
|
-
|
455,509
|
||||||||||||||||
|
Adjusted EBITDA
|
66,997
|
-
|
(38,388
|
)
|
-
|
28,609
|
||||||||||||||
|
Segment assets
|
667,631
|
-
|
4,261,929
|
-
|
4,929,560
|
|||||||||||||||
|
Investments in associated companies
|
-
|
117,593
|
90,640
|
-
|
208,233
|
|||||||||||||||
|
5,137,793
|
||||||||||||||||||||
|
Segment liabilities
|
533,684
|
-
|
3,709,905
|
-
|
4,243,589
|
|||||||||||||||
|
Capital expenditure
|
72,540
|
-
|
245,313
|
-
|
317,853
|
|||||||||||||||
| * |
Associated Company – See Note 10.A.2 and 10.C.b.
|
|
OPC
|
Qoros*
|
Other
|
Adjustments
|
Total
|
||||||||||||||||
|
$ thousands
|
||||||||||||||||||||
|
2015
|
||||||||||||||||||||
|
Total sales
|
325,570
|
-
|
329
|
-
|
325,899
|
|||||||||||||||
|
Income/(loss) before taxes
|
29,975
|
(196,223
|
)
|
198,402
|
-
|
32,154
|
||||||||||||||
|
Income Taxes
|
(8,151
|
)
|
-
|
(892
|
)
|
-
|
(9,043
|
)
|
||||||||||||
|
Income/(loss) from continuing operations
|
21,824
|
(196,223
|
)
|
197,510
|
-
|
23,111
|
||||||||||||||
|
Depreciation and amortization
|
25,435
|
-
|
1,605
|
-
|
27,040
|
|||||||||||||||
|
Financing income
|
(3,140
|
)
|
-
|
(7,581
|
)
|
-
|
(10,721
|
)
|
||||||||||||
|
Financing expenses
|
26,315
|
-
|
10,079
|
-
|
36,394
|
|||||||||||||||
|
Other items:
|
||||||||||||||||||||
|
Share in losses/(income) of associated companies
|
-
|
196,223
|
(9,190
|
)
|
-
|
187,033
|
||||||||||||||
|
Gain from distribution of dividend in kind
|
-
|
-
|
(209,710
|
)
|
-
|
(209,710
|
)
|
|||||||||||||
|
Asset impairment
|
-
|
-
|
6,541
|
-
|
6,541
|
|||||||||||||||
|
48,610
|
196,223
|
(208,256
|
)
|
-
|
36,577
|
|||||||||||||||
|
Adjusted EBITDA
|
78,585
|
-
|
(9,854
|
)
|
-
|
68,731
|
||||||||||||||
|
Segment assets
|
810,551
|
-
|
3,303,204
|
-
|
4,113,755
|
|||||||||||||||
|
Investments in associated companies
|
-
|
158,729
|
210,293
|
-
|
369,022
|
|||||||||||||||
|
4,482,777
|
||||||||||||||||||||
|
Segment liabilities
|
676,832
|
-
|
2,542,390
|
-
|
3,219,222
|
|||||||||||||||
|
Capital expenditure
|
18,273
|
-
|
556,116
|
-
|
574,389
|
|||||||||||||||
| * |
Associated Company – See Note 10.A.2 and 10.C.b.
|
F - 85
Note 30 – Segment, Customer and Geographic Information (Cont’d)
| C. |
Customer and Geographic Information
|
Major customers
Following is information on the total sales of the Group to material customers and the percentage of the Group’s total revenues (in $ thousand):
|
|
2017
|
2016
|
2015
|
|||||||||||||||||||||
|
Customer
|
Total revenues
|
Percentage of revenues of the Group
|
Total
revenues
|
Percentage of revenues of the Group
|
Total
revenues
|
Percentage of revenues of the Group
|
||||||||||||||||||
|
|
||||||||||||||||||||||||
|
Customer 1
|
75,735
|
20.71
|
%
|
59,880
|
18.47
|
%
|
70,545
|
21.65
|
%
|
|||||||||||||||
|
Customer 2
|
*
|
*
|
*
|
*
|
35,760
|
10.97
|
%
|
|||||||||||||||||
|
Customer 3
|
53,605
|
14.66
|
%
|
39,355
|
12.14
|
%
|
43,904
|
13.47
|
%
|
|||||||||||||||
|
Customer 4
|
50,447
|
13.79
|
%
|
32,446
|
10.01
|
%
|
35,650
|
10.94
|
%
|
|||||||||||||||
|
Customer 5
|
38,212
|
10.45
|
%
|
36,391
|
11.22
|
%
|
*
|
*
|
||||||||||||||||
| (*) |
Represents an amount less than 10% of revenues.
|
Information based on geographic areas
The Group’s geographic revenues are as follows:
|
For the year ended December 31
|
||||||||||||
|
2017
|
2016
|
2015
|
||||||||||
|
$ thousands
|
||||||||||||
|
Israel
|
365,395
|
324,188
|
325,570
|
|||||||||
|
Others
|
309
|
65
|
329
|
|||||||||
|
Total revenues
|
365,704
|
324,253
|
325,899
|
|||||||||
The Group’s non-current assets* on the basis of geographic location:
|
As at December 31
|
||||||||
|
2017
|
2016
|
|||||||
|
$ thousands
|
||||||||
|
Peru
|
-
|
1,910,421
|
||||||
|
Guatemala
|
-
|
682,985
|
||||||
|
Israel
|
617,358
|
495,639
|
||||||
|
Others
|
447
|
785,033
|
||||||
|
Total non-current assets
|
617,805
|
3,874,078
|
||||||
* Composed of property, plant and equipment and intangible assets.
F - 86
Note 31 – Related-party Information
| A. |
Identity of related parties:
|
The Group’s related parties are as defined in IAS 24 –
Related Party Disclosures
and included: Kenon’s beneficial owners and Kenon’s subsidiaries, affiliates and associates companies.
In the ordinary course of business, some of the Group’s subsidiaries and affiliates engage in business activities with each other.
Ordinary course of business transactions are aggregated in this Note. Other than disclosed elsewhere in the consolidated financial statements during the period, the Group engaged the following material related party transactions.
Key management personnel of the Company are those persons having the authority and responsibility for planning, directing and controlling the activities of the Company. The directors,
co-CEOs
, chief financial officer, general counsel and vice president of business development, are considered as key management personnel of the Company.
| B. |
Transactions with directors and officers (Kenon's directors and officers):
|
|
B. Key management personnel compensation
|
||||||||
|
2017
|
2016
|
|||||||
|
$ thousands
|
||||||||
|
Short-term benefits
|
5,632
|
4,352
|
||||||
|
Share-based payments
|
508
|
547
|
||||||
|
6,140
|
4,899
|
|||||||
| C. |
Transactions with related parties (excluding associates):
|
|
For the year ended December 31
|
||||||||||||
|
2017
|
2016
|
2015
|
||||||||||
|
$ thousands
|
||||||||||||
|
Sales of electricity
|
102,443
|
148,119
|
135,655
|
|||||||||
|
Administrative expenses
|
331
|
614
|
329
|
|||||||||
|
Sales of gas
|
31,296
|
29,873
|
—
|
|||||||||
|
Financing expenses, net
|
18,444
|
14,475
|
10,716
|
|||||||||
| D. |
Transactions with associates:
|
|
For the year ended December 31
|
||||||||||||
|
2017
|
2016
|
2015
|
||||||||||
|
$ thousands
|
||||||||||||
|
Sales of electricity
|
—
|
—
|
5,115
|
|||||||||
|
Operating expenses
|
—
|
—
|
204
|
|||||||||
|
Other income, net
|
198
|
178
|
95
|
|||||||||
F - 87
Note 31 – Related-party Information (Cont’d)
| E. |
Balances with related parties:
|
|
As at December
|
As at December
|
|||||||||||||||||||||||
|
2017
|
2016
|
|||||||||||||||||||||||
|
Ansonia
|
Other related parties *
|
Total
|
Ansonia
|
Other related parties *
|
Total
|
|||||||||||||||||||
| $ thousands | $ thousands | |||||||||||||||||||||||
|
Cash and short-term deposit
|
—
|
—
|
—
|
—
|
2,462
|
2,462
|
||||||||||||||||||
|
Trade receivables
|
—
|
12,778
|
12,778
|
—
|
12,245
|
12,245
|
||||||||||||||||||
|
Loans and Other Liabilities
|
||||||||||||||||||||||||
|
In US dollar or linked thereto
|
75,081
|
242,598
|
317,679
|
45,735
|
222,971
|
268,706
|
||||||||||||||||||
|
Weighted-average interest rates (%)
|
6.00
|
%
|
7.69
|
%
|
7.
29
|
%
|
6.00
|
%
|
7.24
|
%
|
6.62
|
%
|
||||||||||||
|
Repayment years
|
||||||||||||||||||||||||
|
Current maturities
|
75,081
|
242,598
|
—
|
—
|
||||||||||||||||||||
|
Second year
|
—
|
—
|
45,735
|
—
|
||||||||||||||||||||
|
Third year
|
—
|
—
|
—
|
—
|
||||||||||||||||||||
|
Fourth year
|
—
|
—
|
—
|
—
|
||||||||||||||||||||
|
Fifth year
|
—
|
—
|
—
|
—
|
||||||||||||||||||||
|
Sixth year and thereafter
|
—
|
—
|
—
|
222,971
|
||||||||||||||||||||
|
75,081
|
242,598
|
45,735
|
222,971
|
|||||||||||||||||||||
| * |
IC, Israel Chemicals Ltd (“ICL”), Oil Refineries Ltd (“ORL”).
|
These balances relate to amounts with entities that are related to Kenon's beneficial owners.
| F. |
Regarding the ZIM's restructuring and IC’s part in the restructuring, see Note 10.C.a.
|
| G. |
Regarding the convertible loan from Ansonia to Quantum, see Note 10.C.b.6.
|
| H. |
Gas Sale Agreement with ORL, see Note 21.B.(c).
|
F - 88
Note 32 – Financial Instruments
| A. |
General
|
The Group has international activity in which it is exposed to credit, liquidity and market risks (including currency, interest, inflation and other price risks). In order to reduce the exposure to these risks, the Group holds derivative financial instruments, (including forward transactions, interest rate swap (“SWAP”) transactions, and options) for the purpose of economic (not accounting) hedging of foreign currency risks, inflation risks, commodity price risks, interest risks and risks relating to the price of inputs.
This note presents information about the Group’s exposure to each of the above risks, and the Group’s objectives, policies and processes for measuring and managing the risk.
The risk management of the Group companies is executed by them as part of the ongoing current management of the companies. The Group companies monitor the above risks on a regular basis. The hedge policies with respect to all the different types of exposures are discussed by the boards of directors of the companies.
The comprehensive responsibility for establishing the base for the risk management of the Group and for supervising its implementation lies with the Board of Directors and the senior management of the Group.
| B. |
Credit risk
|
Counterparty credit risk is the risk that the financial benefits of contracts with a specific counterparty will be lost if a counterparty defaults on their obligations under the contract. This includes any cash amounts owed to the Group by those counterparties, less any amounts owed to the counterparty by the Group where a legal right of set-offs exist and also includes the fair values of contracts with individual counterparties which are included in the financial statements. The maximum exposure to credit risk at each reporting date is the carrying value of each class of financial assets mentioned in this note.
| (1) |
Exposure to credit risk
|
The carrying amount of financial assets represents the maximum credit exposure. The maximum exposure to credit risk at the reporting date was:
|
As at December 31
|
||||||||
|
2017
|
2016
|
|||||||
|
$ thousands
|
||||||||
|
Carrying amount
|
||||||||
|
Cash and cash equivalents
|
1,417,388
|
326,635
|
||||||
|
Short-term
investments
and deposits
|
7,144
|
89,545
|
||||||
|
Trade receivables
, net
|
44,137
|
284,532
|
||||||
|
Long-term trade receivables
|
-
|
10,120
|
||||||
|
Other current assets
|
35,
752
|
28,462
|
||||||
|
Deposits and other long-term receivables including derivative instruments
|
281,717
|
66,434
|
||||||
|
1,786,
138
|
805,728
|
|||||||
The maximum exposure to credit risk for trade receivables, as of the date of the report, by geographic region was as follows:
|
As at December 31
|
||||||||
|
2017
|
2016
|
|||||||
|
$ thousands
|
||||||||
|
Israel
|
44,058
|
34,779
|
||||||
|
South America
|
-
|
93,293
|
||||||
|
Central America
|
-
|
155,142
|
||||||
|
Other regions
|
79
|
11,438
|
||||||
|
44,137
|
294,652
|
|||||||
F - 89
Note 32 – Financial Instruments (Cont’d)
| (2) |
Aging of debts and impairment losses
|
Set
forth
below is an aging of the trade receivables:
|
As at December 31, 2017
|
As at December 31, 2016
|
|||||||||||||||||||||||
|
For which impairment was not recorded
|
For which impairment was recorded
|
For which impairment was not recorded
|
For which impairment was recorded
|
|||||||||||||||||||||
|
Gross
|
Impairment
|
Gross
|
Impairment
|
|||||||||||||||||||||
|
$ thousands
|
$ thousands
|
|||||||||||||||||||||||
|
Not past due
|
50
|
—
|
—
|
233,787
|
8
|
(8
|
)
|
|||||||||||||||||
|
Past due up to 3 months
|
40,879
|
—
|
—
|
50,723
|
—
|
—
|
||||||||||||||||||
|
Past due 3 – 6 months
|
3,208
|
—
|
—
|
9,160
|
282
|
(282
|
)
|
|||||||||||||||||
|
Past due 6 – 9 months
|
—
|
—
|
—
|
83
|
—
|
—
|
||||||||||||||||||
|
Past due 9 – 12 months
|
—
|
—
|
—
|
652
|
—
|
—
|
||||||||||||||||||
|
Past due more than one year
|
—
|
—
|
—
|
247
|
4,714
|
(4,714
|
)
|
|||||||||||||||||
|
44,137
|
—
|
—
|
294,652
|
5,004
|
(5,004
|
)
|
||||||||||||||||||
| C. |
Liquidity risk
|
Liquidity risk is the risk that the Group will not be able to meet its financial obligations as they fall due. The Group’s approach to managing liquidity is to ensure, as far as possible, that it will always have sufficient liquidity to meet its liabilities when due, under both normal and adverse credit and market conditions, without incurring unacceptable losses or risking damage to the Group’s reputation.
The Group manages its liquidity risk by means of holding cash balances, short-term deposits, other liquid financial assets and credit lines.
Set forth below are the anticipated repayment dates of the financial liabilities, including an estimate of the interest payments. This disclosure does not include amounts regarding which there are offset agreements:
|
As at December 31, 2017
|
||||||||||||||||||||||||
|
Book value
|
Projected cash flows
|
Up to 1 year
|
1-2 years
|
2-5 years
|
More than 5 years
|
|||||||||||||||||||
|
$ thousands
|
||||||||||||||||||||||||
|
Non-derivative financial liabilities
|
||||||||||||||||||||||||
|
Loans from banks and others *
|
317,684
|
317,786
|
317,786
|
-
|
-
|
-
|
||||||||||||||||||
|
Trade payables
|
58,895
|
58,895
|
58,895
|
-
|
-
|
-
|
||||||||||||||||||
|
Other payables
|
77,869
|
77,964
|
77,964
|
-
|
-
|
-
|
||||||||||||||||||
|
Non-convertible debentures **
|
91,122
|
125,089
|
13,153
|
7,086
|
34,033
|
70,817
|
||||||||||||||||||
|
Loans from banks and others **
|
627,150
|
846,652
|
157,805
|
50,768
|
173,222
|
464,857
|
||||||||||||||||||
|
Liabilities in respect of financing lease
|
-
|
-
|
-
|
-
|
-
|
-
|
||||||||||||||||||
|
Financial guarantee ***
|
44,342
|
44,342
|
44,342
|
-
|
-
|
-
|
||||||||||||||||||
|
Financial liabilities – hedging instruments
|
||||||||||||||||||||||||
|
Forward exchange rate contracts
|
439
|
439
|
439
|
-
|
-
|
-
|
||||||||||||||||||
|
Financial liabilities not for hedging
|
||||||||||||||||||||||||
|
Derivatives on exchange rates
|
73
|
73
|
73
|
-
|
-
|
-
|
||||||||||||||||||
|
1,217,574
|
1,471,240
|
670,457
|
57,854
|
207,255
|
535,674
|
|||||||||||||||||||
| * |
Excludes current portion of long-term liabilities.
|
| ** |
Includes current portion of long-term liabilities.
|
| *** |
Financial Guarantees contractual period in Qoros is dependent on Qoros’s timeliness to meet the obligation of current loans payable.
|
F - 90
Note 32 – Financial Instruments (Cont’d)
|
As at December 31, 2016
|
||||||||||||||||||||||||
|
Book value
|
Projected cash flows
|
Up to 1 year
|
1-2 years
|
2-5 years
|
More than 5 years
|
|||||||||||||||||||
|
$ thousands
|
||||||||||||||||||||||||
|
Non-derivative financial liabilities
|
||||||||||||||||||||||||
|
Loans from banks and others *
|
213,417
|
219,651
|
219,651
|
-
|
-
|
-
|
||||||||||||||||||
|
Trade payables
|
285,612
|
285,612
|
285,612
|
-
|
-
|
-
|
||||||||||||||||||
|
Other payables
|
160,540
|
160,540
|
59,650
|
10,121
|
21,718
|
69,051
|
||||||||||||||||||
|
Non-convertible debentures **
|
867,287
|
1,190,032
|
58,113
|
57,217
|
616,765
|
457,937
|
||||||||||||||||||
|
Loans from banks and others **
|
2,143,499
|
2,756,851
|
340,684
|
244,508
|
977,251
|
1,194,408
|
||||||||||||||||||
|
Liabilities in respect of financing lease
|
88,169
|
114,069
|
13,013
|
12,171
|
57,432
|
31,453
|
||||||||||||||||||
|
Financial guarantee ***
|
118,763
|
118,763
|
118,763
|
-
|
-
|
-
|
||||||||||||||||||
|
Financial liabilities – hedging instruments
|
||||||||||||||||||||||||
|
Interest SWAP contracts
|
22,865
|
22,865
|
9,930
|
5,788
|
4,192
|
2,955
|
||||||||||||||||||
|
Forward exchange rate contracts
|
2,399
|
2,399
|
1,627
|
772
|
-
|
-
|
||||||||||||||||||
|
Financial liabilities not for hedging
|
||||||||||||||||||||||||
|
Interest SWAP contracts and options
|
2,125
|
2,125
|
783
|
570
|
688
|
84
|
||||||||||||||||||
|
Derivatives from debt restructure
|
29,594
|
29,594
|
-
|
29,594
|
-
|
-
|
||||||||||||||||||
|
3,934,270
|
4,902,501
|
1,107,826
|
360,741
|
1,678,046
|
1,755,888
|
|||||||||||||||||||
| * |
Excludes current portion of long-term liabilities and long-term liabilities which were classified to short-term.
|
| ** |
Includes current portion of long-term liabilities and long-term liabilities which were classified to short-term.
|
| *** |
Financial Guarantees contractual period in Qoros is dependent on Qoros’s timeliness to meet the obligation of current loans payable.
|
| D. |
Market risks
|
Market risk is the risk that changes in market prices, such as foreign exchange rates, the CPI, interest rates and prices of capital products and instruments will affect the fair value of the future cash flows of a financial instrument.
The Group buys and sells derivatives in the ordinary course of business, and also incurs financial liabilities, in order to manage market risks. All such transactions are carried out within the guidelines set by the Boards of Directors of the companies. For the most part, the Group companies enter into hedging transactions for purposes of avoiding economic exposures that arise from their operating activities. Most of the transactions entered into do not meet the conditions for recognition as an accounting hedge and, therefore, differences in their fair values are recorded on the statement of profit and loss.
| (1) |
CPI and foreign currency risk
|
Currency risk
The Group’s functional currency is the U.S. dollar. The exposures of the Group companies are measured with reference to the
changes
in the exchange rate of the dollar vis-à-vis the other currencies in which it transacts business.
The
Group
is exposed to currency risk on sales, purchases, assets and liabilities that are denominated in a currency other than the respective functional currencies of the Group entities. The primary exposure is to the shekel, euro, pound, Peruvian Nuevo Sol and yuan (RMB).
The Group
uses
options and forward exchange contracts on exchange rates for purposes of hedging short-term currency risks, usually up to one year, in order to reduce the risk with respect to the final cash flows in dollars deriving from the existing assets and liabilities and sales and purchases of goods and services within the framework of firm or anticipated commitments, including in relation to future operating expenses.
The Group is exposed to currency risk in relation to loans it has taken out and debentures it has issued in currencies other than the dollar. The
principal
amounts of these bank loans and debentures have been hedged by swap transactions the repayment date of which corresponds with the payment date of the loans and debentures.
F - 91
Note 32 – Financial Instruments (Cont’d)
Inflation risk
The Group has CPI-linked loans. The Group is exposed to high payments of interest and principal as the result of an increase in the CPI.
It
is noted that part of the Group’s anticipated revenues will be linked to the CPI. The Group does not hedge this exposure beyond the expected hedge included in its revenues.
| (a) |
Exposure to CPI and foreign currency risks
The Group’s exposure to CPI and foreign currency risk, based on nominal amounts, is as follows:
|
|
As at December 31, 2017
|
||||||||||||
|
Foreign currency
|
||||||||||||
|
Shekel
|
||||||||||||
|
Unlinked
|
CPI linked
|
Other
|
||||||||||
|
Non-derivative instruments
|
||||||||||||
|
Cash and cash equivalents
|
158,679
|
—
|
18,593
|
|||||||||
|
Short-term investments, deposits and loans
|
60,855
|
—
|
—
|
|||||||||
|
Trade receivables
|
42,004
|
—
|
—
|
|||||||||
|
Other receivables
|
2,686
|
—
|
3,603
|
|||||||||
|
Long-term deposits and loans
|
25,600
|
—
|
—
|
|||||||||
|
Total financial assets
|
289,824
|
—
|
22,196
|
|||||||||
|
Loans from banks and others
|
—
|
—
|
30,308
|
|||||||||
|
Trade payables
|
31,286
|
—
|
86
|
|||||||||
|
Other payables
|
3,178
|
—
|
1,316
|
|||||||||
|
Long-term loans from banks and others and debentures
|
109,629
|
478,891
|
—
|
|||||||||
|
Total financial liabilities
|
144,093
|
478,891
|
31,710
|
|||||||||
|
Total non-derivative financial instruments, net
|
145,731
|
478,891
|
(9,514
|
)
|
||||||||
|
Derivative instruments
|
—
|
—
|
(439
|
)
|
||||||||
|
Net exposure
|
145,731
|
478,891
|
(9,953
|
)
|
||||||||
|
As at December 31, 2016
|
||||||||||||
|
Foreign currency
|
||||||||||||
|
Shekel
|
||||||||||||
|
Unlinked
|
CPI linked
|
Other
|
||||||||||
|
Non-derivative instruments
|
||||||||||||
|
Cash and cash equivalents
|
11,810
|
—
|
24,240
|
|||||||||
|
Short-term investments, deposits and loans
|
29,137
|
—
|
26,198
|
|||||||||
|
Trade receivables
|
34,779
|
—
|
172,664
|
|||||||||
|
Other receivables
|
665
|
—
|
6,964
|
|||||||||
|
Long-term deposits and loans
|
20,349
|
—
|
16,412
|
|||||||||
|
Total financial assets
|
96,740
|
—
|
246,478
|
|||||||||
|
Loans from banks and others
|
—
|
—
|
34,998
|
|||||||||
|
Trade payables
|
26,913
|
—
|
128,512
|
|||||||||
|
Other payables
|
1,093
|
1,205
|
17,266
|
|||||||||
|
Long-term loans from banks and others and debentures
|
444
|
416,266
|
465,262
|
|||||||||
|
Total financial liabilities
|
28,450
|
417,471
|
646,038
|
|||||||||
|
Total non-derivative financial instruments, net
|
68,290
|
(417,471
|
)
|
(399,560
|
)
|
|||||||
|
Derivative instruments
|
—
|
—
|
(2,421
|
)
|
||||||||
|
Net exposure
|
68,290
|
(417,471
|
)
|
(401,981
|
)
|
|||||||
F - 92
Note 32 – Financial Instruments (Cont’d)
| (b) |
Sensitivity analysis
|
A strengthening of the dollar exchange rate by 5%–10% against the following currencies and change of the CPI in rate of 5%–10% would have increased (decreased) the net income or net loss and the equity by the amounts shown below. This analysis assumes that all other variables, in particular interest rates, remain constant. The analysis is performed on the same basis for 2015.
|
As at December 31, 2017
|
||||||||||||||||
|
10% increase
|
5% increase
|
5% decrease
|
10% decrease
|
|||||||||||||
|
$ thousands
|
||||||||||||||||
|
Non-derivative instruments
|
||||||||||||||||
|
Shekel/dollar
|
13,248
|
6,940
|
(6,940
|
)
|
(13,248
|
)
|
||||||||||
|
CPI
|
(43,536
|
)
|
(22,804
|
)
|
22,804
|
43,536
|
||||||||||
|
Dollar/other
|
(2,559
|
)
|
(1,269
|
)
|
1,269
|
2,559
|
||||||||||
|
As at December 31, 2016
|
||||||||||||||||
|
10% increase
|
5% increase
|
5% decrease
|
10% decrease
|
|||||||||||||
|
$ thousands
|
||||||||||||||||
|
Non-derivative instruments
|
||||||||||||||||
|
Shekel/dollar
|
6,208
|
3,252
|
(3,252
|
)
|
(6,208
|
)
|
||||||||||
|
CPI
|
(37,952
|
)
|
(19,880
|
)
|
19,880
|
37,952
|
||||||||||
|
Dollar/other
|
(44,447
|
)
|
(21,044
|
)
|
19,037
|
36,332
|
||||||||||
| (2) |
Interest rate risk
|
The Group is exposed to changes in the interest rates with respect to loans bearing interest at variable rates, as well as in
relation
to swap transactions of liabilities in foreign currency for dollar liabilities bearing a variable interest rate.
The
Group
has not set a policy limiting the exposure and it hedges this exposure based on forecasts of future interest rates.
The
Group
enters into transactions mainly to reduce the exposure to cash flow risk in respect of interest rates. The transactions include interest rate swaps and “collars”. In addition, options are acquired and written for hedging the interest rate at different rates.
Type of interest
Set
forth below is detail of the type of interest borne by the Group’s interest-bearing financial instruments:
|
As at December 31
|
||||||||
|
2017
|
2016
|
|||||||
|
Carrying amount
|
||||||||
|
$ thousands
|
||||||||
|
Fixed rate instruments
|
||||||||
|
Financial assets
|
1,438,243
|
157,121
|
||||||
|
Financial liabilities
|
-
|
(1,530,715
|
)
|
|||||
|
1,438,243
|
(1,373,594
|
)
|
||||||
|
Variable rate instruments
|
||||||||
|
Financial assets
|
-
|
20,167
|
||||||
|
Financial liabilities
|
(239,876
|
)
|
(2,600,799
|
)
|
||||
|
(239,876
|
)
|
(2,580,632
|
)
|
|||||
F - 93
Note 32 – Financial Instruments (Cont’d)
Type of interest (Cont’d)
The Group’s assets and liabilities bearing fixed interest are not measured at fair value through the statement of profit and loss
and
the Group does not designate derivatives interest rate swaps as hedging instruments under a fair value hedge accounting model. Therefore, a change in the interest rates as at the date of the report would not be expected to affect the income or loss with respect to changes in the value of fixed – interest assets and liabilities.
A
change
of 100 basis points in interest rate at reporting date would have increased/(decreased) profit and loss before tax by the amounts below. This analysis assumes that all variables, in particular foreign currency rates, remain constant.
|
As at December 31, 2017
|
||||||||
|
100bp increase
|
100 bp decrease
|
|||||||
|
$ thousands
|
||||||||
|
Variable rate instruments
|
(2,399
|
)
|
2,399
|
|||||
|
As at December 31, 2016
|
||||||||
|
100bp increase
|
100 bp decrease
|
|||||||
|
$ thousands
|
||||||||
|
Variable rate instruments
|
(25,806
|
)
|
25,806
|
|||||
| E. |
Fair value
|
| (1) |
Fair value compared with carrying value
|
The Group’s financial instruments include mainly non-derivative assets, such as: cash and cash equivalents, investments, deposits and short-term loans, receivables and debit balances, investments and long-term receivables; non-derivative
liabilities
: such as: short-term credit, payables and credit balances, long-term loans, finance leases and other liabilities; as well as derivative financial instruments.
Due to their nature, the fair value of the financial instruments included in the Group’s working capital is generally identical or
approximates
the book value.
The following table shows in detail the carrying amount and the fair value of financial instrument groups presented in the financial
statements
not in accordance with their fair value.
|
As at December 31, 2017
|
||||||||
|
Carrying amount
|
Level 2
|
|||||||
|
$ thousands
|
||||||||
|
Non-convertible debentures
|
91,122
|
105,488
|
||||||
|
Long-term loans from banks and others (excluding interests)
|
527,706
|
649,487
|
||||||
|
As at December 31, 2016
|
||||||||
|
Carrying amount
|
Level 2
|
|||||||
|
$ thousands
|
||||||||
|
Non-convertible debentures
|
867,287
|
947,786
|
||||||
|
Long-term loans from banks and others (excluding interests)
|
2,116,740
|
2,354,612
|
||||||
| * |
The fair value is measured using the technique of discounting the future cash flows with respect to the principal component and the discounted interest using the market interest rate on the measurement date.
|
F - 94
Note 32 – Financial Instruments (Cont’d)
| (2) |
Hierarchy of fair value
|
The following table presents an analysis of the financial instruments measured at fair value, using an evaluation method. The various levels were defined as follows:
– Level 1: Quoted prices (not adjusted) in an active market for identical instruments.
– Level 2: Observed data, direct or indirect, not included in Level 1 above.
|
As at
|
As at
|
|||||||
|
December 31, 2017
|
December 31, 2016
|
|||||||
|
Level 2
|
Level 2
|
|||||||
|
$ thousands
|
$ thousands
|
|||||||
|
Assets
|
||||||||
|
Derivatives not used for accounting hedge (a)
|
1,471
|
3,173
|
||||||
|
1,471
|
3,173
|
|||||||
|
Liabilities
|
||||||||
|
Financial guarantee
|
-
|
-
|
||||||
|
Derivatives used for accounting hedge
|
439
|
25,264
|
||||||
|
Derivatives not used for accounting hedge
|
73
|
2,125
|
||||||
|
Other financial derivatives
|
-
|
29,594
|
||||||
|
512
|
56,983
|
|||||||
(a)
Includes
$3 million AIE’s embedded derivative not used for hedging. This embedded derivative corresponds to the fair value of AIE’s gas agreement which lets AIE to resell its not-used gas on the corresponding market to a third party.
| (3) |
Data and measurement of the fair value of financial instruments at Level 2
|
Level 2
The fair value of forward contracts on foreign currency is determined using trading programs that are based on market
prices
. The market price is determined based on a weighting of the exchange rate and the appropriate interest coefficient for the period of the transaction along with an index of the relevant currencies.
The
fair
value of contracts for exchange (SWAP) of interest rates and fuel prices is determined using trading programs which incorporate market prices, the remaining term of the contract and the credit risks of the parties to the contract.
The
fair
value of currency and interest exchange (SWAP) transactions is valued using discounted future cash flows at the market interest rate for the remaining term.
The fair
value
of transactions used to hedge inflation is valued using discounted future cash flows which incorporate the forward CPI curve, and market interest rates for the remaining term.
If the inputs used to measure the fair value of an asset or liability might be categorized in different levels of the fair value hierarchy,
then
the fair value measurement is categorized in its entirety in the same level of the fair value hierarchy as the lowest level input that is significant to the entire measurement.
The fair value of marketable securities held for trade is determined using the ‘Discounts for Lack of Marketability’ (“DLOM”)
valuation
method, which is a method used to calculate the value of restricted securities. The method purports that the only difference between a company’s common stock and its restricted securities is the lack of marketability of the restricted securities which is derived from the price difference between both prices.
F - 95
Note 32 – Financial Instruments (Cont’d)
The
following
table shows the valuation techniques used in measuring Level 2 fair values as at December 31, 2016 and 2015, as well as the significant unobservable inputs used.
|
Type
|
Valuation technique
|
Significant unobservable data
|
Inter-relationship between significant unobservable inputs and fair value measurement
|
|
Interest rate Swaps
|
The Group applies standard valuation techniques such as:
discounted cash flows
for fixed and variables coupons (estimated with forward curves) using as discounted rates the
projected LIBOR zero coupon curve
. The observable inputs are obtained through market information suppliers.
|
Not applicable
|
Not applicable
|
|
Foreign Exchange Forwards
|
The Group applies standard valuation techniques which include market observable parameters such as the implicit exchange rate calculated with forward points. These variables are obtained through market information suppliers.
|
Not applicable
|
Not applicable
|
|
Credit from banks, others and debentures
|
Discounted cash flows with market interest rate
|
Not applicable
|
Not applicable
|
|
Marketable Securities held for trade
|
DLOM valuation method
|
Not applicable
|
Not applicable
|
F - 96
Note 33 – Subsequent Events
| 1. |
Kenon
|
| A. |
Kenon distributed, by way of a capital distribution, an aggregate amount of $665 million, or $12.35 per share, to Kenon’s shareholders on March 22, 2018. The share capital and total equity of Kenon will be reduced by $665 million in 2018
(See Note 22).
|
| B. |
On January 2, 2018, Kenon fully repaid the loan from IC for a total amount of $242 million (including the interest accrued).
|
| 2. |
Qoros
|
| A. |
On January 8, 2018 Kenon announced that approvals for the ownership changes in Qoros had been obtained from the relevant office of the Chinese Ministry of Commerce and the new shareholding structure was registered with the relevant regulatory authority. As a result, the Baoneng group owns 51% of Qoros, and Kenon and Chery’s equity interest in Qoros is 24% and 25% respectively.
|
The investment is based on an RMB6.5 billion pre-investment valuation of Qoros (approximately $1 billion), excluding
RMB1
.89 billion (approximately $290 million) of existing shareholder loans.
The Investment Agreement provides for total funding by the Investor of RMB6.63 billion, of which RMB6.5 billion will be ultimately invested in Qoros’ equity and RMB130 million (approximately $20 million) of the Investment will be paid to Kenon. In addition, Qoros will be required to repay outstanding shareholder loans to each of Kenon and Chery in the
principal
amount of RMB944 million (approximately $145 million).
As part of the Investment Agreement, Kenon
has
a put option to sell its remaining interest in Qoros to the Baoneng group for total consideration of RMB3.12 billion (approximately $480 million), exercisable in two stages. The Baoneng group
has
an option exercisable over the next two years to increase its stake to 67% by investing further directly into Qoros
As a result of the transaction, Kenon will recognise
an estimated
gain on dilution of approximately $286 million in its financial statements in the first
half
of 2018.
Kenon
will also value its put option and record that value in its financial statements in the first quarter of 2018. The valuation of the put is in progress and no estimate can currently be given.
Any changes in the equity holdings of Qoros as among Kenon, Chery and Baoneng Group, including as a result of
exercising
the put option or investment right, will result in adjustments to the respective parties’ pro rata obligations under the Qoros’ bank guarantees and pledges.
| 3. |
IC Power
|
| A. |
Overseas Investment Peru S.A.
On January
3
, 2018, Overseas Investment Peru S.A. fully prepaid its
$
100 million loan with Credit Suisse with an original maturity in February 2019. The amount paid was
$
101 million, which include the capital and the interest accrued as of the date of payment.
|
| B. |
OPC Hadera, Israel
|
On January 10, 2018, an application was filed with the Tel Aviv-Jaffa District Court for the approval of a derivative claim by a shareholder of ORL against former directors of ORL, which include OPC Energy Ltd., OPC Rotem, OPC Hadera, Israel
Chemicals
Ltd., as well as against the Israel Corporation Ltd.
The subject of the request is the gas purchase transactions of ORL, Israel Chemicals Ltd., OPC Rotem and OPC Hadera (
hereinafter
- the "Group Companies"), including their inter-company aspects, including: (1) a transaction of the Group Companies for the purchase of natural gas from Tamar Partners; and (2) transactions of the Group Companies for the purchase of natural gas from Energean.
F - 97
Note 33 – Subsequent Events (Cont’d)
As for the transaction with Energean, the plaintiff contends that beyond the Group's transaction with a third party (i.e., Energean), a transaction is required among the Group Companies themselves regarding the distribution of the economic benefits achieved in the joint negotiations in a manner that suits the purchasing and bargaining power of
each
of the group companies.
The plaintiff contends that the alleged absence of such an inter-company transaction (or the alleged absence of a proper procedure regarding the distribution of the benefit) discriminates against ORL (the inter-company dimension is not at market conditions) and ORL does not receive its share in the economic benefits due to its large purchasing power and its contribution to the negotiations with Energean (inter alia, in view of the fact that the transaction was made at similar prices for the Group Companies.)
The main remedies for which the plaintiff is petitioning in relation to the Energean deal are a number of declarative and financial measures,
and
inter alia, an inter-company process that will reflect the differences in purchasing power between the companies.
With respect to the Tamar transaction, the petitioner claims that the Tamar transaction was not approved by ORL as required and additional claims regarding this transaction, including the question of its being beneficial to ORL and at market conditions; with respect to the Tamar transaction, declaratory remedies and compensatory remedies were requested from ORL and/or the refund of the amounts of the benefits that the
OPC Hadera
and the other parties to the transaction allegedly received, at the expense of ORL, with an additional coefficient petitioned.
OPC Hadera is currently unable to determine the financial impact.
| C. |
IC Power Asia Development Ltd. (“ICPAD”) – Investment treaty agreement
|
IC Power Asia Development Ltd. (hereinafter ICPAD) has instituted a claim against the Government of Guatemala in respect of tax
payments
made by ICPAD's former subsidiaries DEORSA and DEOCSA which entities were sold as part of the sale of the Latin American and Caribbean businesses.
On February 20, 2018, ICPAD filed a claim against the government of Guatemala under the Agreement between the Government of the State of Israel and the Government of the Republic of Guatemala for the Reciprocal Promotion and Protection of Investments, or the Treaty, seeking restitution on the basis that the government of Guatemala has breached several of its obligations of treatment towards Israeli investors under the Treaty. ICPAD is seeking damages for the taxes paid by former subsidiaries DEORSA and DEOCSA and related costs and expenses, including interest on the taxes paid.
F - 98
Qoros Automotive Co., Ltd.
Consolidated financial statements
31 December 2017
F - 99
|
KPMG Huazhen LLP
50th Floor, Plaza 66
1266 Nanjing West Road
Shanghai 200040
China
Telephone +86 (21) 2212 2888
Fax +86 (21) 6288 1889
Internet kpmg.com/cn
|
 : 200040
 +86 (21) 2212 2888
 +86 (21) 6288 1889
 kpmg.com/cn
|
The Board of Directors:
Qoros Automotive Co., Ltd.:
We have audited the accompanying consolidated financial statements of Qoros Automotive Co., Ltd. and its subsidiaries, which comprise the consolidated statements of financial position as of 31 December 2017 and 2016, and the related consolidated statements of profit or loss and other comprehensive income, changes in equity, and cash flows for each of the years in the three-year period ended 31 December 2017, and the related notes to the consolidated financial statements.
Management's Responsibility for the Consolidated Financial Statements
Management is responsible for the preparation and fair presentation of these consolidated financial statements in accordance with International Financial Reporting Standards as issued by the International Accounting Standard Board; this includes the design, implementation, and maintenance of internal control relevant to the preparation and fair presentation of consolidated financial statements that are free from material misstatement, whether due to fraud or error.
Auditors' Responsibility
Our responsibility is to express an opinion on these consolidated financial statements based on our audits. We conducted our audits in accordance with auditing standards generally accepted in the United States of America. Those standards require that we plan and perform the audit to obtain reasonable assurance about whether the consolidated financial statements are free from material misstatement.

F - 100

Auditors' Responsibility (continued)
An audit involves performing procedures to obtain audit evidence about the amounts and disclosures in the consolidated financial statements. The procedures selected depend on the auditors' judgment, including the assessment of the risks of material misstatement of the consolidated financial statements, whether due to fraud or error. In making those risk assessments, the auditor considers internal control relevant to the entity's preparation and fair presentation of the consolidated financial statements in order to design audit procedures that are appropriate in the circumstances, but not for the purpose of expressing an opinion on the effectiveness of the entity's internal control. Accordingly, we express no such opinion. An audit also includes evaluating the appropriateness of accounting policies used and the reasonableness of significant accounting estimates made by management, as well as evaluating the overall presentation of the consolidated financial statements.
We believe that the audit evidence we have obtained is sufficient and appropriate to provide a basis for our audit opinion.
Opinion
In our opinion, the consolidated financial statements referred to above present fairly, in all material respects, the consolidated financial position of Qoros Automotive Co., Ltd. and its subsidiaries as of 31 December 2017 and 2016, and their consolidated financial performance and their consolidated cash flows for each of the years in the three-year period ended 31 December 2017, in accordance with International Financial Reporting Standards as issued by the International Accounting Standards Board.
/s/ KPMG Huazhen LLP
Shanghai, China
9 April 2018
F - 101
|
In thousands of RMB
|
Note
|
2017
|
2016
|
|||||||||
|
Assets
|
||||||||||||
|
Property, plant and equipment
|
13
|
3,874,993
|
4,219,023
|
|||||||||
|
Intangible assets
|
14
|
4,011,628
|
4,322,900
|
|||||||||
|
Prepayments
|
19
|
21,679
|
1,061
|
|||||||||
|
Lease prepayments
|
15
|
194,890
|
199,303
|
|||||||||
|
Trade and other receivables
|
16
|
91,567
|
91,743
|
|||||||||
|
Pledged deposits
|
17
|
-
|
8,403
|
|||||||||
|
Equity-accounted investee
|
1,633
|
1,987
|
||||||||||
|
Non-current assets
|
8,196,390
|
8,844,420
|
||||||||||
|
Inventories
|
18
|
388,580
|
322,201
|
|||||||||
|
VAT recoverable
|
828,391
|
807,484
|
||||||||||
|
Trade and other receivables
|
16
|
37,917
|
60,091
|
|||||||||
|
Prepayments
|
19
|
173,046
|
13,049
|
|||||||||
|
Available-for-sale financial assets
|
-
|
100,000
|
||||||||||
|
Pledged deposits
|
17
|
25,636
|
36,237
|
|||||||||
|
Cash and cash equivalents
|
20
|
76,954
|
464,759
|
|||||||||
|
Current assets
|
1,530,524
|
1,803,821
|
||||||||||
|
|
||||||||||||
|
Total assets
|
9,726,914
|
10,648,241
|
||||||||||
The accompanying notes are an integral part of these consolidated financial statements.
F - 102
Consolidated statements of financial position (continued)
|
In thousands of RMB
|
Note
|
2017
|
2016
|
|||||||||
|
Equity
|
||||||||||||
|
Paid-in capital
|
21
|
10,425,480
|
10,425,480
|
|||||||||
|
Reserves
|
53,594
|
53,386
|
||||||||||
|
Accumulated losses
|
(11,645,360
|
)
|
(10,032,879
|
)
|
||||||||
|
Total (deficit) / equity
|
(1,166,286
|
)
|
445,987
|
|||||||||
|
|
|
|||||||||||
|
Liabilities
|
||||||||||||
|
Loans and borrowings
|
22
|
4,227,338
|
4,248,660
|
|||||||||
|
Deferred income
|
23
|
161,002
|
412,083
|
|||||||||
|
Trade and other payables
|
24
|
1,208,256
|
112,488
|
|||||||||
|
Provisions
|
25
|
65,136
|
55,516
|
|||||||||
|
Non-current liabilities
|
5,661,732
|
4,828,747
|
||||||||||
|
Loans and borrowings
|
22
|
2,510,700
|
2,641,486
|
|||||||||
|
Trade and other payables
|
24
|
2,704,095
|
2,684,669
|
|||||||||
|
Deferred income
|
23
|
16,673
|
47,352
|
|||||||||
|
Current liabilities
|
5,231,468
|
5,373,507
|
||||||||||
|
|
||||||||||||
|
Total liabilities
|
10,893,200
|
10,202,254
|
||||||||||
|
|
||||||||||||
|
Total (deficit) / equity and liabilities
|
9,726,914
|
10,648,241
|
||||||||||
Approved and authorised for issue by the management on 9 April 2018.
|
/s/ Feng Li
|
/s/ Ray Chen
|
|||
|
Feng Li
CEO
|
Ray Chen
CFO
|
The accompanying notes are an integral part of these consolidated financial statements.
F - 103
Consolidated statements of profit or loss and
other
comprehensive income for the year ended 31 December
|
In thousands of RMB
|
Note
|
2017
|
2016
|
2015
|
||||||||||||
|
Revenue
|
7
|
1,886,330
|
2,511,925
|
1,459,339
|
||||||||||||
|
Cost of sales
|
(2,262,283
|
)
|
(3,008,831
|
)
|
(1,713,043
|
)
|
||||||||||
|
Gross loss
|
(375,953
|
)
|
(496,906
|
)
|
(253,704
|
)
|
||||||||||
|
Other income
|
8
|
48,375
|
77,128
|
36,690
|
||||||||||||
|
Research and development expenses
|
9
|
(321,943
|
)
|
(204,242
|
)
|
(278,008
|
)
|
|||||||||
|
Selling, general and administrative expenses
|
(604,939
|
)
|
(762,966
|
)
|
(1,559,995
|
)
|
||||||||||
|
Other expenses
|
10
|
(19,199
|
)
|
(106,577
|
)
|
(74,174
|
)
|
|||||||||
|
Operating loss
|
(1,273,659
|
)
|
(1,493,563
|
)
|
(2,129,191
|
)
|
||||||||||
|
|
|
|
||||||||||||||
|
Finance income
|
11(a)
|
|
10,647
|
16,573
|
13,429
|
|||||||||||
|
Finance costs
|
11(a)
|
|
(349,019
|
)
|
(419,592
|
)
|
(359,126
|
)
|
||||||||
|
Net finance costs
|
11(a)
|
|
(338,372
|
)
|
(403,019
|
)
|
(345,697
|
)
|
||||||||
|
|
|
|
||||||||||||||
|
Share of (loss) / profit of equity - accounted investee, net of nil tax
|
(354
|
)
|
(45
|
)
|
7
|
|||||||||||
|
|
|
|||||||||||||||
|
Loss before tax
|
(1,612,385
|
)
|
(1,896,627
|
)
|
(2,474,881
|
)
|
||||||||||
|
Income tax expense
|
12
|
(96
|
)
|
(255
|
)
|
(575
|
)
|
|||||||||
|
Loss for the year
|
(1,612,481
|
)
|
(1,896,882
|
)
|
(2,475,456
|
)
|
||||||||||
|
|
|
|||||||||||||||
|
Other comprehensive income
|
||||||||||||||||
|
Items that are or may be reclassified to profit or loss
|
||||||||||||||||
|
Foreign operations - foreign currency translation differences
|
208
|
48
|
(
18
|
)
|
||||||||||||
|
Other comprehensive income , net of nil tax
|
208
|
48
|
(18
|
)
|
||||||||||||
|
|
||||||||||||||||
|
Total comprehensive Income for the year
|
(1,612,273
|
)
|
(1,896,834
|
)
|
(2,475,474
|
)
|
||||||||||
The accompanying notes are an integral part of these consolidated financial statements.
F - 104
|
In thousands of RMB
|
Note
|
Paid-in
capital |
Capital
reserve |
Translation
reserve |
Accumulated
losses |
Total
|
||||||||||||||||
|
Balance at 1 January 2015
|
6,531,840
|
147
|
(173
|
)
|
(5,660,541
|
)
|
871,273
|
|||||||||||||||
|
Loss for the year
|
-
|
-
|
-
|
(2,475,456
|
)
|
(2,475,456
|
)
|
|||||||||||||||
|
Other comprehensive income
|
-
|
-
|
(18
|
)
|
-
|
(18
|
)
|
|||||||||||||||
|
Total comprehensive income
|
-
|
-
|
(18
|
)
|
(2,475,456
|
)
|
(2,475,474
|
)
|
||||||||||||||
|
Conversion of shareholders’ loans to capital
|
1,800,000
|
-
|
-
|
-
|
1,800,000
|
|||||||||||||||||
|
Total contributions
|
1,800,000
|
-
|
-
|
-
|
1,800,000
|
|||||||||||||||||
|
|
|
|
|
|
||||||||||||||||||
|
Balance at 31 December 2015
|
8,331,840
|
147
|
(191
|
)
|
(8,135,997
|
)
|
195,799
|
|||||||||||||||
|
Balance at 1 January 2016
|
8,331,840
|
147
|
(191
|
)
|
(8,135,997
|
)
|
195,799
|
|||||||||||||||
|
Loss for the year
|
-
|
-
|
-
|
(1,896,882
|
)
|
(1,896,882
|
)
|
|||||||||||||||
|
Other comprehensive income
|
-
|
-
|
48
|
-
|
48
|
|||||||||||||||||
|
Total comprehensive income
|
-
|
-
|
48
|
(1,896,882
|
)
|
(1,896,834
|
)
|
|||||||||||||||
|
Conversion of shareholders’ loans to capital
|
2,093,640
|
53,382
|
-
|
-
|
2,147,022
|
|||||||||||||||||
|
Total contributions
|
2,093,640
|
53,382
|
-
|
-
|
2,147,022
|
|||||||||||||||||
|
|
|
|
|
|
||||||||||||||||||
|
Balance at 31 December 2016
|
10,425,480
|
53,529
|
(143
|
)
|
(10,032,879
|
)
|
445,987
|
|||||||||||||||
The accompanying notes are an integral part of these consolidated financial statements.
F - 105
Consolidated statements of changes in equity for the year ended 31 December (continued)
|
In thousands of RMB
|
Note
|
Paid-in
capital |
Capital
reserve |
Translation
reserve |
Accumulated
losses |
Total
|
||||||||||||||||
|
Balance at 1 January 2017
|
10,425,480
|
53,529
|
(143
|
)
|
(10,032,879
|
)
|
445,987
|
|||||||||||||||
|
Loss for the year
|
-
|
-
|
-
|
(1,612,481
|
)
|
(1,612,481
|
)
|
|||||||||||||||
|
Other comprehensive income
|
-
|
-
|
208
|
-
|
208
|
|||||||||||||||||
|
Total comprehensive income
|
-
|
-
|
208
|
(1,612,481
|
)
|
(1,612,273
|
)
|
|||||||||||||||
|
Balance at 31 December 2017
|
10,425,480
|
53,529
|
65
|
(11,645,360
|
)
|
(1,166,286
|
)
|
|||||||||||||||
The accompanying notes are an integral part of these consolidated financial statements
.
F - 106
|
In thousands of RMB
|
Note
|
2017
|
2016
|
2015
|
||||||||||
|
Cash flows from operating activities
|
||||||||||||||
|
Loss for the year
|
(1,612,481
|
)
|
(1,896,882
|
)
|
(2,475,456
|
)
|
||||||||
|
Adjustments for:
|
||||||||||||||
|
Depreciation
|
369,256
|
361,764
|
227,477
|
|||||||||||
|
Amortisation of
|
||||||||||||||
|
- intangible assets
|
311,256
|
422,492
|
236,223
|
|||||||||||
|
- lease prepayments
|
4,413
|
4,413
|
4,412
|
|||||||||||
|
(Reversal) / Provision of Impairment losses on other receivables
|
(7,113
|
)
|
10,859
|
9,493
|
||||||||||
|
Net finance costs
|
338,372
|
403,019
|
345,697
|
|||||||||||
|
Tax expense
|
96
|
255
|
575
|
|||||||||||
|
Share of loss / (profit) of equity - accounted, investee, net of tax
|
354
|
45
|
(7
|
)
|
||||||||||
|
Loss on disposal of property, plant, and equipment
|
237
|
2,679
|
4,813
|
|||||||||||
|
Deferred income
|
(288,988
|
)
|
(44,496
|
)
|
(11,079
|
)
|
||||||||
|
(884,598
|
)
|
(735,852
|
)
|
(1,657,852
|
)
|
|||||||||
|
Changes in:
|
||||||||||||||
|
- inventories
|
(66,379
|
)
|
(77,347
|
)
|
(47,332
|
)
|
||||||||
|
- trade and other receivables
|
29,506
|
(30,404
|
)
|
(322,106
|
)
|
|||||||||
|
- VAT recoverable
|
(20,907
|
)
|
25,019
|
170,112
|
||||||||||
|
- prepayments
|
(159,997
|
)
|
23,382
|
118,224
|
||||||||||
|
- trade and other payables
|
27,035
|
431,754
|
560,630
|
|||||||||||
|
- pledge deposit
|
18,104
|
25,576
|
-
|
|||||||||||
|
- deferred income
|
7,228
|
9,686
|
300,000
|
|||||||||||
|
Cash used in operating activities
|
(1,050,008
|
)
|
(328,186
|
)
|
(878,324
|
)
|
||||||||
|
Income taxes paid
|
(96
|
)
|
(255
|
)
|
(575
|
)
|
||||||||
|
Net cash used in operating activities
|
(1,050,104
|
)
|
(328,441
|
)
|
(878,899
|
)
|
||||||||
The accompanying notes are an integral part of these consolidated financial statements.
F - 107
Consolidated statements of cash flows for the year ended 31 December (continued)
|
In thousands of RMB
|
Note
|
2017
|
2016
|
2015
|
||||||||||
|
Cash flows from investing activities
|
||||||||||||||
|
Interest received
|
10,691
|
19,131
|
15,019
|
|||||||||||
|
Acquisition of available-for - sale financial assets
|
-
|
(126,000
|
)
|
(175,000
|
)
|
|||||||||
|
Proceeds from disposal of available-for-sale financial assets
|
100,000
|
26,000
|
175,000
|
|||||||||||
|
Collection of pledged deposits
|
900
|
10,519
|
508,093
|
|||||||||||
|
Placement of pledged deposits
|
-
|
(10,519
|
)
|
(330,420
|
)
|
|||||||||
|
Acquisition of property, plant and equipment and intangible assets
|
(64
,
075
|
)
|
(595,625
|
)
|
(1,334,856
|
)
|
||||||||
|
Net cash from (used in) investing activities
|
47,516
|
(676,494
|
)
|
(1,142,164
|
)
|
|||||||||
The accompanying notes are an integral part of these consolidated financial statements.
F - 108
Consolidated statements of cash flows for the year ended 31 December (continued)
|
In thousands of RMB
|
Note
|
2017
|
2016
|
2015
|
||||||||||||
|
Cash flows from financing activities
|
||||||||||||||||
|
Proceeds from advance capital injection
|
1,096
,
878
|
-
|
-
|
|||||||||||||
|
Proceeds from borrowings
|
20(c)
|
|
1,972,000
|
2,949,985
|
5,564,733
|
|||||||||||
|
Repayment of borrowings
|
20(c)
|
|
(2,15
0,
058
|
)
|
(1,470,344
|
)
|
(3,644,550
|
)
|
||||||||
|
Interest paid
|
20(c)
|
|
(303
,
452
|
)
|
(310,863
|
)
|
(393,837
|
)
|
||||||||
|
Collection of guarantee deposit
|
-
|
55,451
|
100,219
|
|||||||||||||
|
Placement of guarantee deposit
|
-
|
(12,500
|
)
|
(100,219
|
)
|
|||||||||||
|
Net cash from financing activities
|
615
,
368
|
1,211,729
|
1,526,346
|
|||||||||||||
|
|
||||||||||||||||
|
Net increase/(decrease) in cash and cash equivalents
|
(387,220
|
)
|
206,794
|
(494,717
|
)
|
|||||||||||
|
Cash and cash equivalents at 1 January
|
464,759
|
257,270
|
752,088
|
|||||||||||||
|
Effect of foreign exchange rate changes
|
(585
|
)
|
695
|
(101
|
)
|
|||||||||||
|
Cash and cash equivalents at 31 December
|
76,954
|
464,759
|
257,270
|
|||||||||||||
The accompanying notes are an integral part of these consolidated financial statements.
F - 109
| 1 |
Reporting entity
|
Qoros Automotive Co., Ltd. (“the Company”) is a sino-foreign joint equity enterprise established on 24 December 2007 in the People’s Republic of China (“PRC”) by Wuhu Chery Automobile Investment Co., Ltd (“Wuhu Chery”) and Quantum (2007) LLC (“Quantum”). The Company’s registered office is Changshu, Jiangsu Province, PRC. The Company has four wholly-owned subsidiaries, Qoros Automotive Europe GmbH incorporated in Germany, Qoros Car Sales Co., Ltd. incorporated in Changshu, Changshu Guanyizhizhong Auto Sales & Service Co., Ltd. incorporated in Changshu and Suzhou Guanqi Auto Sales & Service Co., Ltd. incorporated in Suzhou (“the Subsidiaries”). These consolidated financial statements comprise the Company and the Subsidiaries (together referred to as the “Group”).
The Group’s principal activities are research and development, manufacture and sale of automobiles and spare parts.
| 2 |
Basis of preparation
|
| (a) |
Basis of accounting
|
The consolidated financial statements have been prepared in accordance with International Financial Reporting Standards (“IFRSs”) , which collective terms includes International Accounting Standards and related interpretations, promulgated by the International Accounting Standards Board (“IASB”) . They were authorised for issue by the Group’s management on 9 April 2018.
| (b) |
Going concern basis of accounting
|
The Group incurred a net loss of RMB 1
.
6 billion for the year ended 31 December 2017. The Group had net current liabilities of approximately RMB 3.7 billion as of 31 December 2017, including short-term bank loans of RMB 0.6 billion and shareholder loans of RMB 1.9 billion.
Management has given careful consideration to the future liquidity of the Group and its available sources of finance in assessing whether the Group will have sufficient financial resources to continue as a going concern.
In 2017, Wuhu Chery, Quantum and Hangzhou Chengmao Investment Co., Ltd. (“HCI”) entered into a series of investment agreements, pursuant to which, within three months after 29 December 2017, the investors shall contribute RMB 6.5 billion in aggregate as additional capital (see note 21). As at 31 December 2017, the Group had already received RMB 1.1 billion from HCI. In the end of March 2018, the Group had received a further payment amounting to RMB 2.2 billion from HCI. The remaining capital contributions from Wuhu Chery and Quantum of RMB 3.2 billion are expected to be received by the Group in the end of April 2018.
F - 110
| 2 |
Basis of preparation (continued)
|
As at 31 December 2017, based on the Group’s cash flow forecast, including the above committed capital contributions from the investors, and the Group’s future non-cancellable capital commitments, management considers that the Group has sufficient working capital to meet in full its financial obligations as they fall due for at least the next twelve months from the end of the reporting period and accordingly, the financial statements have been prepared on a going concern basis.
| (c) |
Basis of measurement
|
The consolidated financial statements have been prepared on the historical cost basis except that the financial instruments classified as available-for-sale are measured at their fair value (see note 4 (c)).
| (d) |
Functional and presentation currency
|
These consolidated financial statements are presented in Renminbi (“RMB”, the “presentation currency”), which is also the Company’s functional currency. All amounts have been rounded to the nearest thousand unless otherwise stated.
| 3 |
Change in accounting policy
|
The IASB has issued several amendments to IFRSs that are first effective for the current accounting period of the Group. None of these impact on the accounting policies of the Group. However, additional disclosure has been included in note 20(c) to satisfy the new disclosure requirements introduced by the amendments to IAS 7, Disclosure initiative, which require entities to provide disclosures that enable users of financial statements to evaluate changes in liabilities arising from financing activities, including both changes arising from cash flows and non-cash changes.
The Group has not applied any new standard or interpretation that is not yet effective for the current accounting period.
| 4 |
Significant accounting policies
|
The accounting polices set out below have been applied consistently to all periods presented in these financial statements.
| (a) |
Subsidiaries
|
Subsidiaries are entities controlled by the Group. The Group controls an entity when it is exposed to, or has rights to, variable returns from its involvement with the entity and has the ability to affect those returns through its power over the entity. When assessing whether the Group has power, only substantive rights (held by the Group and other parties) are considered.
F - 111
| 4 |
Significant accounting policies (continued)
|
An investment in a subsidiary is consolidated into the consolidated financial statements from the date that control commences until the date that control ceases. Intra-group balances, transactions and cash flows and any unrealised profits arising from intra-group transactions are eliminated in full in preparing the consolidated financial statements. Unrealised losses resulting from intra-group transactions are eliminated in the same way as unrealised gains but only to the extent that there is no evidence of impairment.
| (b) |
Associates
|
An associate is an entity in which the Group has significant influence, but not control or joint control, over its management, including participation in the financial and operating policy decisions.
An investment in an associate is accounted for in the consolidated financial statements under the equity method, unless it is classified as held for sale. Under the equity method, the investment is initially recorded at cost, adjusted for any excess of the Group’s share of the acquisition-date fair values of the investee’s identifiable net assets over the cost of the investment (if any). Thereafter, the investment is adjusted for the post acquisition change in the Group’s share of the investee’s net assets and any impairment loss relating to the investment (see note 4(h)). Any acquisition-date excess over cost, the Group’s share of the post-acquisition, post-tax results of the investees and any impairment losses for the year are recognised in the consolidated statement of profit or loss, whereas the Group’s share of the post-acquisition post-tax items of the investees’ other comprehensive income is recognised in the consolidated statement of profit or loss and other comprehensive income.
When the Group’s share of losses exceeds its interest in the associate, the Group’s interest is reduced to nil and recognition of further losses is discontinued except to the extent that the Group has incurred legal or constructive obligations or made payments on behalf of the investee. For this purpose, the Group’s interest is the carrying amount of the investment under the equity method together with the Group’s long-term interests that in substance form part of the Group’s net investment in the associate.
Unrealised profits and losses resulting from transactions between the Group and its associates are eliminated to the extent of the Group’s interest in the investee, except where unrealised losses provide evidence of an impairment of the asset transferred, in which case they are recognised immediately in profit or loss.
In all other cases, when the Group ceases to have significant influence over an associate, it is accounted for as a disposal of the entire interest in that investee, with a resulting gain or loss being recognised in profit or loss. Any interest retained in that former investee at the date when significant influence is lost is recognised at fair value and this amount is regarded as the fair value on initial recognition of a financial asset.
F - 112
| 4 |
Significant accounting policies (continued)
|
| (c) |
Available-for-sale financial assets
|
Available-for-sale financial assets are initially stated at fair value, which is their transaction price unless it is determined that the fair value at initial recognition differs from the transaction price and that fair value is evidenced by a quoted price in an active market for an identical asset or liability or based on a valuation technique that uses only data from observable markets.
At the end of each reporting period the fair value is remeasured, with any resultant gain or loss being recognised in other comprehensive income and accumulated separately in equity in the fair value reserve.
When the investments are derecognised or impaired (see note 4(h)), the cumulative gain or loss recognised in equity is reclassified to profit or loss.
| (d) |
Property, plant and equipment
|
Property, plant and equipment are measured at cost less accumulated depreciation and accumulated impairment losses.
The cost of self-constructed items of property, plant and equipment includes the cost of materials, direct labour, the initial estimate, where relevant, of the costs of dismantling and removing the items and restoring the site on which they are located, and an appropriate proportion of production overheads and borrowing costs.
Gains or losses arising from the retirement or disposal of an item of property, plant and equipment are determined as the difference between the net disposal proceeds and the carrying amount of the item and are recognised in profit or loss on the date of retirement or disposal.
Except for toolings, depreciation is calculated to write off the cost or valuation of items of property, plant and equipment, less their estimated residual value, if any, using the straight line method over their estimated useful lives as follows:
|
-
|
Buildings | 30 years |
|
-
|
Equipment | 3 - 20 years |
|
-
|
Leasehold improvements | 3 years |
No depreciation is provided on construction in progress.
Toolings are depreciated using the units-of-production method based on the forecasted production volume.
Where parts of an item of property, plant and equipment have different useful lives or forecasted production volume, the cost or valuation of the item is allocated on a reasonable basis between the parts and each part is depreciated separately. The depreciation methods, the useful life or the forecasted production volume of an asset and its residual value, if any, are reviewed at each reporting date.
F - 113
| 4 |
Significant accounting policies (continued)
|
| (e) |
Intangible assets
|
Expenditure on research activities is recognised as an expense in the period in which it is incurred. Expenditure on development activities is capitalised if the product or process is technically and commercially feasible and the Group has sufficient resources and the intention to complete development. The expenditure capitalised includes the costs of materials, direct labour, and an appropriate proportion of overheads and borrowing costs, where applicable (see note 4(t)). Capitalised development costs are stated at cost less accumulated amortisation and impairment losses (see note 4(h)). Other development expenditure is recognised as an expense in the period in which it is incurred
Other intangible assets that are acquired by the Group are stated at cost less accumulated amortisation (where the estimated useful life is finite) and impairment losses (see note 4(h)). Expenditure on internally generated goodwill and brands is recognised as an expense in the period in which it is incurred.
Amortisation of intangible assets with finite useful lives is charged to profit or loss on a straight-line basis over the assets’ estimated useful lives. Except for the capitalised development costs, the following intangible assets with finite useful lives are amortised from the date they are available for use and their estimated useful lives are as follows:
|
-
|
Software | 10 years |
Capitalised development costs are depreciated using the units-of-production method based on the forecasted production volume.
The amortisation methods, the useful life or the forecasted production volume of an asset, are reviewed at each reporting date.
| (f) |
Lease prepayments
|
All land in PRC is state-owned and no private land ownership exists. The Group acquired the right to use certain land and the amounts paid for such right are recorded as lease prepayment. Lease prepayment is carried at historical cost less accumulated amortisation and any impairment losses. Amortisation is calculated on a straight-line basis over the respective periods of the rights.
| (g) |
Operating lease charges
|
Where the Group has the use of assets held under operating leases, payments made under the leases are charged to profit or loss in equal instalments over the accounting periods covered by the lease term, except where an alternative basis is more representative of the pattern of benefits to be derived from the leased asset. Lease incentives received are recognised in profit or loss as an integral part of the aggregate net lease payments made. Contingent rentals are charged to profit or loss in the accounting period in which they are incurred.
F - 114
| 4 |
Significant accounting policies (continued)
|
| (h) |
Impairment of assets
|
| (i) |
Impairment of investments in available-for-sale financial assets and other receivables
|
Available-for-sale financial assets and other current and non-current receivables that are stated at cost or amortised cost are reviewed at the end of each reporting period to determine whether there is objective evidence of impairment. Objective evidence of impairment includes observable data that comes to the attention of the Group about one or more of the following loss events:
| - |
significant financial difficulty of the debtor;
|
| - |
a breach of contract, such as a default or delinquency in interest or principal payments;
|
| - |
it becoming probable that the debtor will enter bankruptcy or other financial reorganisation;
|
| - |
significant changes in the technological, market, economic or legal environment that have an adverse effect on the debtor; and
|
| - |
a significant or prolonged decline in the fair value of an investment in an equity instrument below its cost.
|
If any such evidence exists, any impairment loss is determined and recognised as follows:
| - |
For investments in associates accounted for under the equity method in the consolidated financial statements (see note 4(b)), the impairment loss is measured by comparing the recoverable amount of the investment with its carrying amount in accordance with note 4(h)(ii). The impairment loss is reversed if there has been a favourable change in the estimates used to determine the recoverable amount in accordance with note 4(h)(ii).
|
| - |
For trade and other current receivables and other financial assets carried at amortised cost, the impairment loss is measured as the difference between the asset’s carrying amount and the present value of estimated future cash flows, discounted at the financial asset’s original effective interest rate (i.e. the effective interest rate computed at initial recognition of these assets), where the effect of discounting is material. This assessment is made collectively where these financial assets share similar risk characteristics, such as similar past due status, and have not been individually assessed as impaired. Future cash flows for financial assets which are assessed for impairment collectively are based on historical loss experience for assets with credit risk characteristics similar to the collective group.
If in a subsequent period the amount of an impairment loss decreases and the decrease can be linked objectively to an event occurring after the impairment loss was recognised, the impairment loss is reversed through profit or loss. A reversal of an impairment loss shall not result in the asset’s carrying amount exceeding that which would have been determined had no impairment loss been recognised in prior years.
|
F - 115
| 4 |
Significant accounting policies (continued)
|
| - |
For available-for-sale financial assets, the cumulative loss that has been recognised in the fair value reserve is reclassified to profit or loss. The amount of the cumulative loss that is recognised in profit or loss is the difference between the acquisition cost (net of any principal repayment and amortisation) and current fair value, less any impairment loss on that asset previously recognised in profit or loss.
|
Impairment losses recognised in profit or loss in respect of available-for-sale equity securities are not reversed through profit or loss. Any subsequent increase in the fair value of such assets is recognised in other comprehensive income.
Impairment losses in respect of available-for-sale debt securities are reversed if the subsequent increase in fair value can be objectively related to an event occurring after the impairment loss was recognised. Reversals of impairment losses in such circumstances are recognised in profit or loss.
Impairment losses are written off against the corresponding assets directly, except for impairment losses recognised in respect of trade debtors and bills receivable included within trade and other receivables, whose recovery is considered doubtful but not remote. In this case, the impairment losses for doubtful debts are recorded using an allowance account. When the Group is satisfied that recovery is remote, the amount considered irrecoverable is written off against trade debtors and bills receivable directly and any amounts held in the allowance account relating to that debt are reversed. Subsequent recoveries of amounts previously charged to the allowance account are reversed against the allowance account. Other changes in the allowance account and subsequent recoveries of amounts previously written off directly are recognised in profit or loss.
| (ii) |
Impairment of other assets
|
Internal and external sources of information are reviewed at the end of each reporting period to identify indications that the following assets may be impaired or, except in the case of goodwill, an impairment loss previously recognised no longer exists or may have decreased:
| - |
property, plant and equipment;
|
| - |
lease prepayments;
|
| - |
intangible assets; and
|
| - |
investment in associates.
|
If any such indication exists, the asset’s recoverable amount is estimated. In addition, for goodwill, intangible assets that are not yet available for use and intangible assets that have indefinite useful lives, the recoverable amount is estimated annually whether or not there is any indication of impairment.
F - 116
| 4 |
Significant accounting policies (continued)
|
| - |
Calculation of recoverable amount
|
The recoverable amount of an asset is the greater of its fair value less costs of disposal and value in use. In assessing value in use, the estimated future cash flows are discounted to their present value using a pre-tax discount rate that reflects current market assessments of the time value of money and the risks specific to the asset. Where an asset does not generate cash inflows largely independent of those from other assets, the recoverable amount is determined for the smallest group of assets that generates cash inflows independently (i.e. a cash-generating unit).
| - |
Recognition of impairment losses
|
An impairment loss is recognised in profit or loss if the carrying amount of an asset, or the cash-generating unit to which it belongs, exceeds its recoverable amount. Impairment losses recognised in respect of cash-generating units are allocated first to reduce the carrying amount of any goodwill allocated to the cash-generating unit (or group of units) and then, to reduce the carrying amount of the other assets in the unit (or group of units) on a pro rata basis, except that the carrying value of an asset will not be reduced below its individual fair value less costs of disposal (if measurable) or value in use (if determinable).
| - |
Reversals of impairment losses
|
In respect of assets other than goodwill, an impairment loss is reversed if there has been a favourable change in the estimates used to determine the recoverable amount. An impairment loss in respect of goodwill is not reversed.
A reversal of an impairment loss is limited to the asset’s carrying amount that would have been determined had no impairment loss been recognised in prior years. Reversals of impairment losses are credited to profit or loss in the year in which the reversals are recognised.
| (i) |
Inventories
|
Inventories are measured at the lower of cost and net realisable value. The cost of inventories is based on the weighted-average principle, and includes expenditure incurred in acquiring the inventories, production or conversion costs and other costs incurred to bring them to their existing location and condition. In the case of manufactured inventories and work in progress, cost includes direct labour and an appropriate share of production overheads based on normal operating capacity
.
Net realisable value is the estimated selling price in the ordinary course of business, less the estimated costs of completion and the estimated costs necessary to make the sale.
F - 117
| 4 |
Significant accounting policies (continued)
|
| (j) |
Trade and other receivables
|
Trade and other receivables are initially recognised at fair value and thereafter stated at amortised cost using the effective interest method, less allowance for impairment of doubtful debts (see note 4(h)), except where the receivables are interest-free loans made to related parties without any fixed repayment terms or the effect of discounting would be immaterial. In such cases, the receivables are stated at cost less allowance for impairment of doubtful debts.
| (k) |
Interest-bearing borrowings
|
Interest-bearing borrowings are recognised initially at fair value less attributable transaction costs. Subsequent to initial recognition, interest-bearing borrowings are stated at amortised cost with any difference between the amount initially recognised and redemption value being recognised in profit or loss over the period of the borrowings, together with any interest and fees payable, using the effective interest method.
| (l) |
Trade and other payables
|
Trade and other payables are initially recognised at fair value. Trade and other payables are subsequently stated at amortised cost unless the effect of discounting would be immaterial, in which case they are stated at cost.
| (m) |
Cash and cash equivalents
|
Cash and cash equivalents comprise cash at bank and on hand, demand deposits with banks and other financial institutions, and short-term, highly liquid investments that are readily convertible into known amounts of cash and which are subject to an insignificant risk of changes in value, having been within three months of maturity at acquisition.
| (n) |
Employee benefits
|
| (i) |
Short-term employee benefits
|
Short-term employee benefit obligations are measured on an undiscounted basis and are expensed as the related service is provided. A liability is recognised for the amount expected to be paid if the Group has a present legal or constructive obligations to pay this amount as a result of past service provided by the employee, and the obligation can be estimated reliably.
| (ii) |
Contributions to defined contribution retirement plans in the PRC
|
Contributions to local retirement schemes pursuant to the relevant labour rules and regulations in the PRC are recognised as an expense in profit or loss as incurred.
| (iii) |
Termination benefits
|
Termination benefits are expensed at the earlier of when the Group can no longer withdraw the offer of those benefits and when the Group recognises costs for a restructuring. If benefits are not expected to be settled wholly within 12 months of the reporting date, then they are discounted.
F - 118
| 4 |
Significant accounting policies (continued)
|
| (o) |
Income tax
|
Income tax for the year comprises current tax and movements in deferred tax assets and liabilities. Current tax and movements in deferred tax assets and liabilities are recognised in profit or loss except to the extent that they relate to items recognised in other
comprehensive
income or directly in equity, in which case the relevant amounts of tax are recognised in other comprehensive income or directly in equity, respectively.
Current tax is the expected tax payable on the taxable income for the year, using tax rates enacted or
substantively
enacted at the end of the reporting period, and any adjustment to tax payable in respect of previous years.
Deferred tax
assets
and liabilities arise from deductible and taxable temporary differences respectively, being the differences between the carrying amounts of assets and liabilities for financial reporting purposes and their tax bases. Deferred tax assets also arise from unused tax losses and unused tax credits.
Apart from certain limited exceptions, all deferred tax liabilities, and all deferred tax assets to the extent that it is probable that future taxable profits will be available against which the asset can be utilised, are recognised. Future taxable profits that may support the recognition of
deferred
tax assets arising from deductible temporary differences include those that will arise from the reversal of existing taxable temporary differences, provided those differences relate to the same taxation authority and the same taxable entity, and are expected to reverse either in the same period as the expected reversal of the deductible temporary difference or in periods into which a tax loss arising from the deferred tax asset can be carried back or forward. The same criteria are adopted when determining whether existing taxable temporary differences support the recognition of deferred tax assets arising from unused tax losses and credits, that is, those differences are taken into account if they relate to the same taxation authority and the same taxable entity, and are expected to reverse in a period, or periods, in which the tax loss or credit can be utilised.
The limited exceptions to recognition of deferred tax assets and liabilities are those temporary differences arising from goodwill not deductible for tax purposes, the initial recognition of
assets
or liabilities that affect neither accounting nor taxable profit (provided they are not part of a business combination), and temporary differences relating to investments in subsidiaries to the extent that, in the case of taxable differences, the Group controls the timing of the reversal and it is probable that the differences will not reverse in the foreseeable future, or in the case of deductible differences, unless it is probable that they will reverse in the future.
The amount of deferred tax recognised is measured based on the expected manner of realisation or settlement of the carrying amount of the assets and liabilities, using tax rates enacted or substantively enacted at the end of the reporting period. Deferred tax assets and liabilities are not discounted.
F - 119
| 4 |
Significant accounting policies (continued)
|
The carrying amount of a deferred tax asset is reviewed at the end of each reporting period and is reduced to the extent that it is no longer probable that sufficient taxable profits will be available to allow the related tax benefit to be utilised. Any such reduction is reversed to the extent that it becomes probable that sufficient taxable profits will be available.
Additional income taxes that arise from the distribution of dividends are recognised when the liability to pay the related dividends is recognised.
Current tax balances and deferred tax balances, and movements therein, are presented separately from each other and are not offset. Current tax assets are offset against current tax liabilities, and deferred tax assets against deferred tax liabilities, if the Group has the legally enforceable right to set off current tax assets against current tax liabilities and the following additional conditions are met:
| - |
in the case of current tax assets and liabilities, the Group intends either to settle on a net basis, or to realise the asset and settle the liability simultaneously; or
|
| - |
in the case of deferred tax assets and liabilities, if they relate to income taxes levied by the same taxation authority on either:
|
| - |
the same taxable entity; or
|
| - |
different taxable entities, which, in each future period in which significant amounts of deferred tax liabilities or assets are expected to be settled or recovered, intend to realise the current tax assets and settle the current tax liabilities on a net basis or realise and settle simultaneously.
|
| (p) |
Provision and contingent liabilities
|
Provisions are recognised for other liabilities of uncertain timing or amount when the Group has a legal or constructive obligation arising as a result of a past event, it is probable that an outflow of economic benefits will be required to settle the obligation and a reliable estimate can be made. Where the time value of money is material, provisions are stated at the present value of the expenditure expected to settle the obligation.
Where it is not probable that an outflow of economic benefits will be required, or the amount cannot be estimated reliably, the obligation is disclosed as a contingent liability, unless the probability of outflow of economic benefits is remote. Possible obligations, whose existence will only be confirmed by the occurrence or non-occurrence of one or more future events are also disclosed as contingent liabilities unless the probability of outflow of economic benefits is remote.
F - 120
| 4 |
Significant accounting policies (continued)
|
| (q) |
Revenue
|
| (i) |
Sale of goods
|
Revenue from the sale of goods in the course of ordinary activities is measured at the fair value of the consideration received or receivable, net of value-added tax (“VAT”), consumption tax and other sales taxes, returns or allowances, trade discounts and rebates. Revenue is recognised when persuasive evidence exists, usually in the form of an executed sales agreement, that the significant risks and rewards of ownership have been transferred to the customers, recovery of the consideration is probable, the associated costs and possible return of goods can be estimated reliably, there is no continuing management involvement with the goods, and the amount of revenue can be measured reliably.
| (ii) |
Rendering of services
|
Revenue is measured at the fair value of the consideration received or receivable under the contract or agreement.
Where the outcome of a transaction involving the rendering of services can be estimated reliably at the balance sheet date, revenue is recognised by reference to the stage of completion based on the proportion of services performed to date to the total services to be performed.
Where the outcome cannot be estimated reliably, revenues are recognised to the extent of the costs incurred that are expected to be recoverable, and an equivalent amount is charged to profit or loss as service cost; otherwise, the costs incurred are recognised in profit or loss and no service revenue is recognised.
| (iii) |
Rental income from operating leases
|
Rental income receivable under operating leases is recognised in profit or loss in equal instalments over the periods covered by the lease term, except where an alternative basis is more representative of the pattern of benefits to be derived from the use of the leased asset. Lease incentives granted are recognised in profit or loss as an integral part of the aggregate net lease payments receivable. Contingent rentals are recognised as income in the accounting period in which they are earned.
| (iv) |
Licencing income
|
Licencing income from the Group’s assets (such as platform technology and patent) is recognized in accordance with the substance of the agreement, including assessment on whether the Group still retains significant risks and rewards of ownership upon the transfer of such assets, and when the Group has no remaining obligations to perform under the agreement.
F - 121
| 4 |
Significant accounting policies (continued)
|
| (r) |
Government grants
|
Government grants are recognised in the statement of financial position initially when there is reasonable assurance that they will be received and that the Group will comply with the conditions attaching to them. Grants that compensate the Group for expenses incurred are recognised as income in profit or loss on a systematic basis in the same periods in which the expenses are incurred. Grants that compensate the Group for the cost of an asset are recognised as deferred income and amortised over the useful life of the related asset on a reasonable and systematic manner as other income.
| (s) |
Translation of foreign currencies
|
Foreign currency transactions during the year are translated at the foreign exchange rates ruling at the transaction dates. Monetary assets and liabilities denominated in foreign currencies are translated at the foreign exchange rates ruling at the end of the reporting period. Exchange gains and losses are recognised in profit or loss.
Non-monetary assets and liabilities that are measured in terms of historical cost in a foreign currency are translated using the foreign exchange rates ruling at the transaction dates. Nonmonetary assets and liabilities denominated in foreign currencies that are stated at fair value are translated using the foreign exchange rates ruling at the dates the fair value was measured.
The results of foreign operations are translated into RMB at the exchange rates approximating the foreign exchange rates ruling at the dates of the transactions. Statement of financial position items are translated into RMB at the closing foreign exchange rates at the end of the reporting period. The resulting exchange differences are recognised in other comprehensive income and accumulated separately in equity in the exchange reserve.
On disposal of a foreign operation, the cumulative amount of the exchange differences relating to that foreign operation is reclassified from equity to profit or loss when the profit or loss on disposal is recognised.
| (t) |
Borrowing costs
|
Borrowing costs that are directly attributable to the acquisition, construction or production of an asset which necessarily takes a substantial period of time to get ready for its intended use or sale are capitalised as part of the cost of that asset. Other borrowing costs are expensed in the period in which they are incurred.
The capitalisation of borrowing costs as part of the cost of a qualifying asset commences when expenditure for the asset is being incurred, borrowing costs are being incurred and activities that are necessary to prepare the asset for its intended use or sale are in progress. Capitalisation of borrowing costs is suspended or ceases when substantially all the activities necessary to prepare the qualifying asset for its intended use or sale are interrupted or complete.
F - 122
| 4 |
Significant accounting policies (continued)
|
| (u) |
Related parties
|
| (a) |
A person, or a close member of that person’s family, is related to the Group if that person:
|
| (i) |
has control or joint control over the Group;
|
| (ii) |
has significant influence over the Group; or
|
| (iii) |
is a member of the key management personnel of the Group or the Group’s parent or ultimate controlling shareholders.
|
| (b) |
An entity is related to the Group if any of the following conditions applies:
|
| (i) |
The entity and the Group are members of the same Group;
|
| (ii) |
One entity is an associate or joint venture of the other entity (or an associate of joint venture of a member of a Group of which the other entity is a member);
|
| (iii) |
Both entities are joint ventures of the same third party;
|
| (iv) |
One entity is a joint venture of a third entity and the other entity is an associate of the third entity;
|
| (v) |
The entity is a post-employment benefit plan for the benefit of employees of the Group or an entity related to the Group;
|
| (vi) |
The entity is controlled or jointly controlled by a person identified in (a);
|
| (vii) |
A person identified in (a)(i) has significant influence over the entity or is a member of the key management personnel of the entity (or of a parent of the entity);
|
| (viii) |
The entity, or any member of a group of which it is a part, provides key management personnel services to the group or to the group’s parent.
|
Close members of the family of a person are those family members who may be expected to influence, or be influenced by, that person in their dealings with the entity.
| (v) |
Segment reporting
|
Operating segments, and the amounts of each segment item reported in the financial statements, are identified from the financial information provided regularly to the Group’s most senior executive management for the purposes of allocating resources to, and assessing the performance of, the Group’s various lines of business and geographical locations.
F - 123
| 4 |
Significant accounting policies (continued)
|
Individually material operating segments are not aggregated for financial reporting purposes unless the segments have similar economic characteristics and are similar in respect of the nature of products and services, the nature of production processes, the type or class of customers, the methods used to distribute the products or provide the services, and the nature of the regulatory environment. Operating segments which are not individually material may be aggregated if they share a majority of these criteria.
| (w) |
Standards and interpretation issued but not yet adopted
|
Up to date of issue of the Financial Statements, the IASB has issued a number of amendments and new standards which are not yet effective for the year ended 31 December 2017 and which have not been adopted in the Financial Statements. These include the following which may be relevant to the Group.
|
Effective for accounting
periods beginning on or after
|
|
|
Amendments to IFRS 2,
Classification and measurement of share-based payment transactions
|
1 January 2018
|
|
Amendments to IFRS 4,
Applying IFRS 9 Financial instruments with IFRS 4 Insurance contracts
|
1 January 2018
|
|
Amendments to IAS 40,
Transfers of Investment Property
|
1 January 2018
|
|
IFRIC 22,
Foreign currency transactions and advance consideration
|
1 January 2018
|
|
IFRS 15,
Revenue from contracts with customers
|
1 January 2018
|
|
IFRS 9,
Financial instruments (2014)
|
1 January 2018
|
|
|
|
|
IFRS 16,
Leases
|
1 January 2019
|
|
IFRIC 23,
Uncertainty over Income Tax Treatments
|
1 January 2019
|
The Group is in the process of making an assessment of what the impact of these amendments, new standards and interpretations is expected to be in the period of initial application. So far the group has identified some aspects of the new standards which may have an impact on the consolidated financial statements. Further details of the expected impacts are discussed below. While the assessment has been substantially completed for IFRS 9 and IFRS 15, the actual impacts upon the initial adoption of the standards may differ as the assessment completed to date is based on the information currently available to the group. The group may also change its accounting policy elections, including the transition options, until the standards are initially applied in that financial report.
F - 124
| 4 |
Significant accounting policies (continued)
|
IFRS 9
Financial instruments
IFRS 9 will replace the current standard on accounting for financial instruments, IAS 39, Financial instruments: Recognition and measurement. IFRS 9 introduces new requirements for classification and measurement of financial assets, including the measurement of impairment for financial assets and hedge accounting. On the other hand, IFRS 9 incorporates without substantive changes the requirements of IAS 39 for recognition and derecognition of financial instruments and the classification and measurement of financial liabilities.
IFRS 9 is effective for annual periods beginning on or after 1 January 2018 on a retrospective basis. The group plans to use the exemption from restating comparative information and will recognise any transition adjustments against the opening balance of equity at 1 January 2018.
Expected impacts of the new requirements on the group’s financial statements are as follows:
| (a) |
Classification and measurement
|
IFRS 9 contains three principal classification categories for financial assets: measured at (1) amortised cost, (2) fair value through profit or loss (FVTPL) and (3) fair value through other comprehensive income (FVTOCI) as follows:
| · |
The classification for debt instruments is determined based on the entity’s business model for managing the financial assets and the contractual cash flow characteristics of the asset. If a debt instrument is classified as FVTOCI then effective interest, impairments and gains/losses on disposal will be recognised in profit or loss.
|
| · |
For equity securities, the classification is FVTPL regardless of the entity’s business model. The only exception is if the equity security is not held for trading and the entity irrevocably elects to designate that security as FVTOCI. If an equity security is designated as FVTOCI then only dividend income on that security will be recognised in profit or loss. Gains, losses and impairments on that security will be recognised in other comprehensive income without recycling.
|
The Group currently does not have any financial assets measured at FVTPL or FVTOCI.
Based on the assessment so far, the Group expects that its financial assets currently measured at amortised cost will continue with their respective classification and measurements upon the adoption of IFRS 9.
F - 125
| 4 |
Significant accounting policies (continued)
|
The classification and measurement requirements for financial liabilities under IFRS 9 are largely unchanged from IAS 39, except that IFRS 9 requires the fair value change of a financial liability designated at FVTPL that is attributable to changes of that financial liability’s own credit risk to be recognised in other comprehensive income (without reclassification to profit or loss). The Group currently does not have any financial liabilities designated at FVTPL and therefore this new requirement may not have any impact on the Group on adoption of IFRS 9.
| (b) |
Impairment
|
The new impairment model in IFRS 9 replaces the “incurred loss” model in IAS 39 with an “expected credit loss” model. Under the expected credit loss model, it will no longer be necessary for a loss event to occur before an impairment loss is recognised. Instead, an entity is required to recognise and measure expected credit losses as either 12- month expected credit losses or lifetime expected credit losses, depending on the asset and the facts and circumstances. This new impairment model may result in an earlier recognition of credit losses on the Group’s trade receivables and other financial assets. Based on a preliminary assessment, the application of the new impairment model may not have a significant impact on the Group.
| (c) |
Hedge accounting
|
IFRS 9 does not fundamentally change the requirements relating to measuring and recognising ineffectiveness under IAS 39. However, greater flexibility has been introduced to the types of transactions eligible for hedge accounting. The Group currently does not have any hedge relationship and therefore it may not have any impact on the Group on adoption of IFRS 9.
Based on the above assessment so far, the Group considers that the initial application of IFRS 9 will not have a significant impact on the Group’s results of operations and financial position.
IFRS 15 Revenue from contracts with customers
IFRS 15 establishes a comprehensive framework for recognising revenue from contracts with customers. IFRS 15 will replace the existing revenue standards, IAS 18,
Revenue
, which covers revenue arising from sale of goods and rendering of services, and IAS 11, Construction
contracts
, which specifies the accounting for revenue from construction contracts.
The core principle of IFRS 15 is that an entity should recognise revenue to depict the transfer of promised goods or services to customers in an amount that reflects the consideration to which the entity expects to be entitled in exchange for goods or services. Specifically, the standard introduces a 5-step approach to revenue recognition.
F - 126
| 4 |
Significant accounting policies (continued)
|
| ● |
Step 1: Identify the contract(s) with customer
|
| ● |
Step 2: Identify the performance obligations in the contract
|
| ● |
Step 3: Determine the transaction price
|
| ● |
Step 4: Allocate the transaction price to the performance obligations in the contract
|
| ● |
Step 5: Recognise revenue when (or as) the entity satisfies a performance obligation
|
Under IFRS 15, an entity recognises revenue when (or as) a performance obligation is satisfied, i.e. when “control” of the goods or services underlying the particular performance obligation is transferred to the customer. Far more prescriptive guidance has been added in IFRS 15 to deal with specific scenarios. Furthermore, extensive disclosures are required by IFRS 15.
Based on the assessment so far, the Group has identified the following area which is likely to be affected:
| (a) |
Timing of revenue recognition
|
The Group’s revenue recognition policies are disclosed in note 4(q). Currently, revenue arising from the provision of services is recognised over time, whereas revenue from the sale of goods is generally recognised when the risks and rewards of ownership have passed to the customers.
The Group has assessed that the new revenue standard is expected to affect the recognition for sales of goods as follows:
| · |
Bundled sales of vehicles: the application of IFRS 15 may result in the identification of separate performance obligations which could affect the timing of the recognition of revenue.
|
The Group plans to use the cumulative effect transition method for the adoption of IFRS 15 and will recognise the cumulative effect of initial application as an adjustment to the opening balance of equity at 1 January 2018.
F - 127
| 4 |
Significant accounting policies (continued)
|
IFRS 16 Leases
As disclosed in note 27, currently the group enters into some operating leases as the lessor and others as the lessee.
IFRS 16 is not expected to impact significantly on the way that lessors account for their rights and obligations under a lease. However, once IFRS 16 is adopted, lessees will no longer distinguish between finance leases and operating leases. Instead, subject to practical expedients, lessees will account for all leases in a similar way to current finance lease accounting, i.e. at the commencement date of the lease the lessee will recognise and measure a lease liability at the present value of the minimum future lease payments and will recognise a corresponding
“
right-of-use
”
asset. After initial recognition of this asset and liability, the lessee will recognise interest expense accrued on the outstanding balance of the lease liability, and the depreciation of the right-of-use asset, instead of the current policy of recognising rental expenses incurred under operating leases on a systematic basis over the lease term. As a practical expedient, the lessee can elect not to apply this accounting model to short-term leases (i.e. where the lease term is 12 months or less) and to leases of low-value assets, in which case the rental expenses would continue to be recognised on a systematic basis over the lease term.
IFRS 16 will primarily affect the Group’s accounting as a lessee of leases for properties, plant and equipment which are currently classified as operating leases. The application of the new accounting model is expected to lead to an increase in both assets and liabilities and to impact on the timing of the expense recognition in the statement of profit or loss over the period of the lease. As disclosed in note 27(a), at 31 December 2017 the Group’s future minimum lease payments under non-cancellable operating leases amount to RMB147 million for properties and other assets. Some of these amounts may therefore need to be recognised as lease liabilities, with corresponding right-of-use assets, once IFRS 16 is adopted. The Group will need to perform a more detailed analysis to determine the amounts of new assets and liabilities arising from operating lease commitments on adoption of IFRS 16, after taking into account the applicability of the practical expedient and adjusting for any leases entered into or terminated between now and the adoption of IFRS 16 and the effects of discounting.
IFRS 16 is effective for annual periods beginning on or after 1 January 2019. The standard offers different transition options and practical expedients, including the practical expedient to grandfather the previous assessment of which existing arrangements are, or contain, leases. The Group has not yet decided whether it will choose to take advantage of practical expedients, and which transition approach to be taken.
| 5 |
Use of estimates and judgements
|
In preparing these consolidated financial statements, the management has made judgements, estimates and assumptions that affect the application of the Group’s accounting policies and the reported amounts of assets, liabilities, income and expenses. Actual results may differ from these estimates.
Estimates and underlying assumptions are reviewed on an ongoing basis. Revisions to estimates are recognised prospectively.
F - 128
| 5 |
Use of estimates and judgements (continued)
|
| (a) |
Judgements
|
| (i) |
Research and development costs
|
Determining capitalisation of development costs involves management judgements in assessing whether a product is technically and commercially feasible, and whether the Group has sufficient resources to complete development and to use or sell the asset.
| (b) |
Assumptions and estimation uncertainties
|
| (i) |
Depreciation and amortisation
|
Property, plant and equipment, intangible assets and lease prepayments are depreciated/amortised on a straight-line basis over the estimated useful lives or other systematic basis, after taking into account the estimated residual value. The Group reviews annually the useful life of an asset and its residual value, if any. The useful lives are based on the management’s knowledge and historical experience with similar assets and taking into account anticipated technology changes. The depreciation and amortisation expenses for future periods are adjusted if there are significant changes from previous estimates.
| (ii) |
Net realisable value of inventories
|
The management reviews the carrying amounts of the inventories at each reporting period end date to determine whether the inventories are carried at the lower of cost and net realisable value. Management estimates the net realisable value based on the current market situation and their historical experience on similar inventories. Any change in the assumptions would increase or decrease the amount of inventories write-down or the related reversals of write-downs and affect the Group’s net asset value.
| (iii) |
Impairment for non-current assets
|
If circumstances indicate that the carrying value of property, plant and equipment, lease prepayments, intangible assets may not be recoverable, their recoverable amounts are estimated. An impairment loss is recognised when the recoverable amount has declined below the carrying amounts in accordance with IAS 36, “
Impairment of assets
”. In addition, for intangible assets that are not yet available for use, the recoverable amount is estimated annually whether or not there is an indication of impairment.
Determining the recoverable amount requires an estimation of the fair value less costs of disposal or the value in use of these assets or the CGU to which these assets belong. It is difficult to precisely estimate fair value of these assets because quoted market prices for most of these assets are not readily available. In determining the value in use, expected cash flows generated by the asset are discounted to their present value, which requires significant judgment relating to level of sales volume, sales revenue and amount of operating costs. The Group uses all readily available information in determining an amount that is a reasonable approximation of recoverable amount, including estimates based on reasonable and supportable assumptions and projections of sales volume, sales revenue and amount of operating costs.
F - 129
| 6 |
Segment reporting
|
IFRS 8, Operating Segments, requires identification and disclosure of operating segment based on internal financial reports that are regularly reviewed by the Group’s chief operating decision maker for the purpose of resources allocation and performance assessment. On this basis, the Group has determined that it have only one operating segment and the amount of each significant category of revenue is disclosed in Note 7.
Substantially all (99%) of the Groups plant and equipment, intangible assets and lease prepayments are located in Mainland China.
| 7 |
Revenue
|
|
In thousands of RMB
|
2017
|
2016
|
2015
|
|||||||||
|
Sales of goods
|
1,583,826
|
2,495,479
|
1,435,136
|
|||||||||
|
Licencing income (note 23)
|
270,000
|
-
|
-
|
|||||||||
|
Rental income
|
23
,
291
|
9,150
|
12,009
|
|||||||||
|
Others
|
9
,
213
|
7,296
|
12,194
|
|||||||||
|
Total
|
1,886,330
|
2,511,925
|
1,459,339
|
|||||||||
The Group has only one customer with whom transactions have exceeded 10% of the Group’s revenues (2016: nil, 2015: nil). In 2017, revenues from sales of goods to this customer amounted to approximately RMB 209 million (2016: nil, 2015: nil).
| 8 |
Other income
|
|
In thousands of RMB
|
2017
|
2016
|
2015
|
|||||||||
|
Government grants
|
46,120
|
35,796
|
33,024
|
|||||||||
|
Others
|
2,255
|
41,332
|
3,666
|
|||||||||
|
Total
|
48,375
|
77,128
|
36,690
|
|||||||||
| 9 |
Research and development expenses
|
Research and development expenses are the expenses incurred for the research and development activities as follows:
|
In thousands of RMB
|
2017
|
2016
|
2015
|
|||||||||
|
Car platform and models
|
321,943
|
204,242
|
278,008
|
|||||||||
F - 130
| 10 |
Other expenses
|
|
In thousands of RMB
|
2017
|
2016
|
2015
|
|||||||||
|
(Reversal) / Provision of Impairment losses
|
(7
,
113
|
)
|
10,859
|
9,493
|
||||||||
|
Price adjustment on purchase of material and parts (Note 29(c))
|
-
|
72,953
|
42,877
|
|||||||||
|
Other taxes and surcharges
|
12,520
|
13,106
|
8,066
|
|||||||||
|
Others
|
13
,
792
|
9,659
|
13,738
|
|||||||||
|
Total
|
19,199
|
106,577
|
74,174
|
|||||||||
| 11 |
Loss before income tax
|
Loss for the year is arrived at after charging:
|
In thousands of RMB
|
2017
|
2016
|
2015
|
|||||||||
|
(a)
Net finance costs:
|
||||||||||||
|
Interest income from available-for-sale financial assets
|
69
|
2
|
39
|
|||||||||
|
Interest income from bank deposits
|
10,578
|
16,571
|
13,390
|
|||||||||
|
Finance income
|
10,647
|
16,573
|
13,429
|
|||||||||
|
|
|
|
||||||||||
|
Interest expense
|
(338,561
|
)
|
(435,693
|
)
|
(381,586
|
)
|
||||||
|
Less: interest expenses capitalised into property, plant and equipment, and development costs
|
-
|
24,603
|
92,975
|
|||||||||
|
Net foreign exchange loss
|
(1,974
|
)
|
(3,719
|
)
|
(65,725
|
)
|
||||||
|
Others
|
(8
,
484
|
)
|
(4,783
|
)
|
(4
,
790
|
)
|
||||||
|
|
||||||||||||
|
Finance costs
|
(349,019
|
)
|
(414,592
|
)
|
(359,126
|
)
|
||||||
|
|
|
|||||||||||
|
Net finance costs
|
(338,372
|
)
|
(403,019
|
)
|
(345,697
|
)
|
||||||
|
(b)
Personnel expenses:
|
||||||||||||
|
Contributions to defined contribution retirement plan
|
(29,644
|
)
|
(30,954
|
)
|
(34,928
|
)
|
||||||
|
Salaries, wages and other benefits
|
(264,018
|
)
|
(253,148
|
)
|
(448,836
|
)
|
||||||
|
(293,662
|
)
|
(284,102
|
)
|
(483,764
|
)
|
|||||||
F - 131
| 11 |
Loss before income tax (continued)
|
|
In thousands of RMB
|
2017
|
2016
|
2015
|
|||||||||
|
(c)
Other items:
|
||||||||||||
|
|
||||||||||||
|
Amortisation
|
||||||||||||
|
- lease prepayment
|
(4,413
|
)
|
(4,413
|
)
|
(4,412
|
)
|
||||||
|
- intangible assets
|
(311,256
|
)
|
(422,492
|
)
|
(236,223
|
)
|
||||||
|
(315,669
|
)
|
(426,905
|
)
|
(240,635
|
)
|
|||||||
|
Depreciation
|
||||||||||||
|
- property, plant and equipment
|
(369,256
|
)
|
(361,764
|
)
|
(227,477
|
)
|
||||||
|
Operating lease charges
|
||||||||||||
|
- hire of office rentals
|
(27,664
|
)
|
(24,026
|
)
|
(28,579
|
)
|
||||||
|
- hire of cars
|
(5,047
|
)
|
(2,516
|
)
|
(3,515
|
)
|
||||||
|
(32,711
|
)
|
(26,542
|
)
|
(32,094
|
)
|
|||||||
| 12 |
Income taxes
|
|
(a)
Amounts recognised in profit or loss
|
|
In thousands of RMB
|
2017
|
2016
|
2015
|
|||||||||
|
Current tax expense - Germany Income Tax
|
||||||||||||
|
Current year
|
96
|
255
|
575
|
|||||||||
Under the Corporate Income Tax Law of the PRC (the “CIT Law”), the statutory corporate income tax rate of the Company and its subsidiaries in China is 25% (2016: 25%).
The statutory corporate income tax rate of Qoros Automotive Europe GmbH, the Group’s subsidiary incorporated in Germany, is 15%.
F - 132
| 12 |
Income taxes (continued)
|
| (b) |
Reconciliation of effective tax rate
|
|
In thousands of RMB
|
2017
|
2016
|
2015
|
|||||||||
|
Loss before tax
|
(1,612,385
|
)
|
(1,896,627
|
)
|
(2,474,881
|
)
|
||||||
|
Income tax credit at the applicable PRC income tax rate of 25%
|
(403,096
|
)
|
(474,157
|
)
|
(618,720
|
)
|
||||||
|
Effect of tax rate differential
|
45
|
99
|
155
|
|||||||||
|
Effect of tax losses not recognised
|
571,104
|
539,836
|
521,005
|
|||||||||
|
Effect of other temporary differences not recognised
|
-
|
-
|
98,021
|
|||||||||
|
Utilisation of previously unrecognised deductible temporary differences
|
(167
,
979
|
)
|
(65,590
|
)
|
-
|
|||||||
|
Non-deductible expenses
|
22
|
67
|
114
|
|||||||||
|
Income tax expense
|
96
|
255
|
575
|
|||||||||
| (c) |
Unrecognised deferred tax assets
|
Deferred tax assets have not been recognised in respect of the following items because it is not probable that future taxable profit will be available against which the Group can utilise the benefits therefrom:
|
In thousands of RMB
|
31 December
|
|||||||||||
|
2017
|
2016
|
2015
|
||||||||||
|
Tax losses
|
10,009,308
|
7,506,001
|
5,457,817
|
|||||||||
|
Other temporary differences
|
963,792
|
2,250,829
|
2,513,187
|
|||||||||
|
Total
|
10,973,100
|
9,756,830
|
7,971,004
|
|||||||||
Under current tax legislation, the above deductible tax losses will expire in the following years:
|
In thousands of RMB
|
31 December
2017
|
|||
|
2019
|
2,476,346
|
|||
|
2020
|
2,474,084
|
|||
|
2021
|
2,774,461
|
|||
|
2022
|
2,284,417
|
|||
|
10,009,308
|
||||
F - 133
| 13 |
Property, plant and equipment
|
|
In thousands of RMB
|
Leasehold improvements
|
Equipment
|
Building
|
Construction in progress
|
Total
|
|||||||||||||||
|
Cost
|
||||||||||||||||||||
|
Balance at 1 January 2016
|
41,411
|
2,465,516
|
1,246,143
|
957,342
|
4,710,412
|
|||||||||||||||
|
Additions
|
4
,
577
|
3,851
|
895
|
335,965
|
345,288
|
|||||||||||||||
|
Transfer
|
-
|
1,189,159
|
43,443
|
(1,269,669
|
)
|
(37,067
|
)
|
|||||||||||||
|
Disposal
|
(332
|
)
|
(4,401
|
)
|
-
|
-
|
(4,733
|
)
|
||||||||||||
|
Effect of movement in exchange rates
|
6
|
103
|
-
|
-
|
109
|
|||||||||||||||
|
Balance at 31 December 2016
|
45,662
|
3,654,228
|
1,290,481
|
23,638
|
5,014,009
|
|||||||||||||||
|
Additions
|
7,702
|
94
|
-
|
38,132
|
45,928
|
|||||||||||||||
|
Transfer
|
-
|
137
|
14,883
|
(15,020
|
)
|
-
|
||||||||||||||
|
Disposal
|
(89
|
)
|
(237
|
)
|
-
|
-
|
(326
|
)
|
||||||||||||
|
Adjustment
|
(126
|
)
|
(14,824
|
)
|
(5,604
|
)
|
-
|
(20,554
|
)
|
|||||||||||
|
Effect of movement in exchange rates
|
3
|
220
|
-
|
-
|
223
|
|||||||||||||||
|
Balance at 31 December 2017
|
53,152
|
3,639,618
|
1,299,760
|
46,750
|
5,039,280
|
|||||||||||||||
|
|
||||||||||||||||||||
|
Depreciation
|
||||||||||||||||||||
|
Balance at 1 January 2016
|
(26,442
|
)
|
(322,672
|
)
|
(86,131
|
)
|
-
|
(435,245
|
)
|
|||||||||||
|
Depreciation for the year
|
(6,339
|
)
|
(304,455
|
)
|
(50,970
|
)
|
-
|
(361,764
|
)
|
|||||||||||
|
Written off on disposal
|
332
|
1,722
|
-
|
-
|
2,054
|
|||||||||||||||
|
Effect of movement in exchange rates
|
(1
|
)
|
(30
|
)
|
-
|
-
|
(31
|
)
|
||||||||||||
|
Balance at 31 December 2016
|
(32,450
|
)
|
(625,435
|
)
|
(137,101
|
)
|
-
|
(794,986
|
)
|
|||||||||||
|
Depreciation for the year
|
(10,146
|
)
|
(315,702
|
)
|
(43,408
|
)
|
-
|
(369,256
|
)
|
|||||||||||
|
Written off on disposal
|
89
|
-
|
-
|
-
|
89
|
|||||||||||||||
|
Effect of movement in exchange rates
|
(2
|
)
|
(132
|
)
|
-
|
-
|
(134
|
)
|
||||||||||||
|
Balance at 31 December 2017
|
(42,509
|
)
|
(941,269
|
)
|
(180,509
|
)
|
-
|
(1,164,287
|
)
|
|||||||||||
|
|
|
|
|
|
||||||||||||||||
|
Carrying amount
|
||||||||||||||||||||
|
Balance at 31 December 2015
|
14,969
|
2,142,844
|
1,160,012
|
957,342
|
4,275,167
|
|||||||||||||||
|
Balance at 31 December 2016
|
13,212
|
3,028,793
|
1,153,380
|
23,638
|
4,219,023
|
|||||||||||||||
|
Balance at 31 December 2017
|
10,643
|
2,698,349
|
1,119,251
|
46,750
|
3,874,993
|
|||||||||||||||
In 2017, there is no borrowing costs capitalised (2016: RMB 24,603 thousand; 2015: RMB 59,900 thousand
,
capitalisation rate per annum in 2016: 5.04%; 2015: 5.72%).
As at 31 December 2017, all equipment and properties were pledged to bank as security as required by a consortium financing agreement. (Note 22(a)(i))
F - 134
| 14 |
Intangible assets
|
|
In thousands of RMB
|
Software
|
Development costs
|
Total
|
|||||||||
|
Cost
|
||||||||||||
|
Balance at 1 January 2016
|
434,852
|
4,522,631
|
4,957,483
|
|||||||||
|
Additions
|
493
|
221,926
|
222,419
|
|||||||||
|
Transfer
|
37,067
|
-
|
37,067
|
|||||||||
|
Adjustment
|
-
|
(170,607
|
)
|
(170,607
|
)
|
|||||||
|
Effect of movement in exchange rates
|
47
|
-
|
47
|
|||||||||
|
Balance at 31 December 2016
|
472,459
|
4,573,950
|
5,046,409
|
|||||||||
|
Additions
|
-
|
-
|
-
|
|||||||||
|
Disposal
|
(415
|
)
|
-
|
(415
|
)
|
|||||||
|
Effect of movement in exchange rates
|
97
|
-
|
97
|
|||||||||
|
Balance at 31 December 2017
|
472,141
|
4,573,950
|
5,046,091
|
|||||||||
|
|
|
|||||||||||
|
Amortisation
|
||||||||||||
|
Balance at 1 January 2016
|
(84,457
|
)
|
(216,552
|
)
|
(301,009
|
)
|
||||||
|
Amortisation for the year
|
(48,820
|
)
|
(373,672
|
)
|
(422,492
|
)
|
||||||
|
Effect of movement in exchange rates
|
(8
|
)
|
-
|
(8
|
)
|
|||||||
|
Balance at 31 December 2016
|
(133,285
|
)
|
(590,224
|
)
|
(723,509
|
)
|
||||||
|
Amortisation for the year
|
(48,482
|
)
|
(262,774
|
)
|
(311,256
|
)
|
||||||
|
Disposal
|
412
|
-
|
412
|
|||||||||
|
Effect of movement in exchange rates
|
(110
|
)
|
-
|
(110
|
)
|
|||||||
|
Balance at 31 December 2017
|
(181,465
|
)
|
(852,998
|
)
|
(1,034,463
|
)
|
||||||
|
Carrying amount
|
||||||||||||
|
Balance at 31 December 2015
|
350,395
|
4,306,079
|
4,656,474
|
|||||||||
|
Balance at 31 December 2016
|
339,174
|
3,983,726
|
4,322,900
|
|||||||||
|
Balance at 31 December 2017
|
290,676
|
3,720,952
|
4,011,628
|
|||||||||
The amortisation of software and capitalised development cost is included in the selling, general and administrative expenses and cost of sales, respectively, in the consolidated statement of profit or loss and other comprehensive income.
See Note 24 for payables for research and development activities as at reporting date.
There is no borrowing costs capitalised during 2017 (2016: Nil, 2015: RMB 33,075 thousand).
F - 135
| 15 |
Lease prepayments
|
|
In thousands of RMB
|
2017
|
2016
|
||||||
|
Cost
|
||||||||
|
Balance at 1 January and 31 December
|
220,631
|
220,631
|
||||||
|
|
|
|||||||
|
Amortisation
|
||||||||
|
Balance at 1 January
|
(21,328
|
)
|
(16,915
|
)
|
||||
|
Amortisation for the year
|
(4,413
|
)
|
(4,413
|
)
|
||||
|
Balance at 31 December
|
(25,741
|
)
|
(21,328
|
)
|
||||
|
|
|
|||||||
|
Carrying amount
|
||||||||
|
Balance at 1 January
|
199,303
|
203,716
|
||||||
|
Balance at 31 December
|
194,890
|
199,303
|
||||||
As at 31 December 2017 and 2016, the Group’s lease prepayments represented the lease prepayments of land use rights located in Changshu, Jiangsu Province. Such lease prepayments were pledged to bank as security for a consortium financing agreement (Note 22(a)(i)).
F - 136
| 16 |
Trade and other receivables
|
| (a) |
Trade and other receivables in the consolidated statement of financial position comprised:
|
|
31 December
|
||||||||
|
In thousands of RMB
|
2017
|
2016
|
||||||
|
Trade receivables
|
14,300
|
20,168
|
||||||
|
Bills receivables
|
-
|
3,500
|
||||||
|
Deposits
|
81,407
|
76,805
|
||||||
|
Deferred expenses
|
21,498
|
26,275
|
||||||
|
Receivables due from employees
|
24
|
14,813
|
||||||
|
Receivables due from related parties
|
20,288
|
16,284
|
||||||
|
Others
|
5,602
|
14,737
|
||||||
|
143,119
|
172,582
|
|||||||
|
Less: allowance for doubtful debts
|
(13,635
|
)
|
(20,748
|
)
|
||||
|
129,484
|
151,834
|
|||||||
|
Non-current
|
91,567
|
91,743
|
||||||
|
Current
|
37,917
|
60,091
|
||||||
|
129,484
|
151,834
|
|||||||
| (b) |
Impairment of trade and other receivables
|
|
31 December
|
||||||||
|
In thousands of RMB
|
2017
|
2016
|
||||||
|
Balance at 1 January
|
(20,748
|
)
|
(9,889
|
)
|
||||
|
Impairment loss recognised
|
(2,463
|
)
|
(10,859
|
)
|
||||
|
Impairment loss reversed
|
9,576
|
-
|
||||||
|
Balance at 31 December
|
(13,635
|
)
|
(20,748
|
)
|
||||
F - 137
| 17 |
Pledged deposits
|
Pledged deposits in the consolidated statement of financial position comprised:
|
31 December
|
||||||||
|
In thousands of RMB
|
2017
|
2016
|
||||||
|
Non-current
|
-
|
8,403
|
||||||
|
Current
|
25,636
|
36,237
|
||||||
|
25,636
|
44,640
|
|||||||
Guarantee deposits of RMB 25,636 thousand (31 December 2016: RMB 44,640 thousand) have been pledged with various banks to obtain bank financing or to issue letter of credit facilities for purchases. The pledge in respect of the bank deposits will be released with the expiration of the relevant bank guarantees and the letter of credit facilities. All of these deposits are to be collected within one year.
| 18 |
Inventories
|
| (a) |
Inventory in the consolidated statement of financial position comprised:
|
|
31 December
|
||||||||
|
In thousands of RMB
|
2017
|
2016
|
||||||
|
Raw materials and consumables
|
102,309
|
81,723
|
||||||
|
Work in progress
|
5,641
|
2,861
|
||||||
|
Finished goods
|
280,630
|
237,617
|
||||||
|
Total
|
388,580
|
322,201
|
||||||
| (b) |
The analysis of the amount of inventories recognised as an expense and included in profit or loss as follow:
|
|
In thousands of RMB
|
2017
|
2016
|
2015
|
|||||||||
|
Carrying amount of inventories sold
|
2,164,541
|
2,999,396
|
1,704,515
|
|||||||||
|
Total
|
2,164,541
|
2,999,396
|
1,704,515
|
|||||||||
F - 138
| 19 |
Prepayments
|
|
31 December
|
||||||||
|
In thousands of RMB
|
2017
|
2016
|
||||||
|
Prepayment for purchase of equipment
|
21
,
679
|
1,061
|
||||||
|
Prepayment for services and materials
|
171
,
517
|
12,435
|
||||||
|
Prepayment for staff rent
|
1,498
|
584
|
||||||
|
Others
|
31
|
30
|
||||||
|
194,725
|
14,110
|
|||||||
|
Non-current
|
21
,
679
|
1,061
|
||||||
|
Current
|
173,046
|
13,049
|
||||||
|
194,725
|
14,110
|
|||||||
F - 139
| 20 |
Cash and cash equivalents
|
| (a) |
Cash and cash equivalents comprise:
|
|
31 December
|
||||||||
|
In thousands of RMB
|
2017
|
2016
|
||||||
|
Cash at bank
|
76,954
|
464,759
|
||||||
|
76,954
|
464,759
|
|||||||
| (b) |
Investing and financing activities not requiring the use of cash or cash equivalents:
|
|
31 December
|
||||||||
|
In thousands of RMB
|
2017
|
2016
|
||||||
|
Conversion of debt into capital
|
-
|
2,147,022
|
||||||
| (c) |
Reconciliation of liabilities arising from financing activities
|
The table below details changes in the company’s liabilities from financing activities, including both cash and non-cash changes. Liabilities arising from financing activities are liabilities for which cash flows were, or future cash flows will be, classified in the cash flow statement as cash flows from financing activities.
|
Loans and borrowings
|
Trade and other
payables
|
Total
|
||||||||||
|
(Note 22)
|
||||||||||||
|
Balance at 1 January 2017
|
6,890,146
|
123,739
|
7,013,885
|
|||||||||
|
Changes from financing cash flows:
|
||||||||||||
|
Proceeds from borrowings
|
1,972,000
|
-
|
1,972,000
|
|||||||||
|
Repayment of borrowings
|
(2,150,058
|
)
|
-
|
(2,150,058
|
)
|
|||||||
|
Interest paid
|
-
|
(303,452
|
)
|
(303,452
|
)
|
|||||||
|
Total changes from financing cash flows
|
(178,058
|
)
|
(303,452
|
)
|
(481,510
|
)
|
||||||
|
Other changes:
|
||||||||||||
|
Reclassifications
|
25,950
|
(25,950
|
)
|
-
|
||||||||
|
Interest expense (Note 11(a))
|
-
|
338,561
|
338,561
|
|||||||||
|
Total other changes
|
25,950
|
312,611
|
338,561
|
|||||||||
|
Balance at 31 December 2017
|
6,738,038
|
132,898
|
6,870,936
|
|||||||||
F - 140
| 21 |
Paid-in capital
|
|
31 December
|
||||||||
|
In thousands of RMB
|
2017
|
2016
|
||||||
|
Wuhu Chery
|
2,606,370
|
5,212,740
|
||||||
|
Quantum
|
2,502
,
115
|
5,212,740
|
||||||
|
HCI
|
5,316
,
995
|
-
|
||||||
|
10,425,480
|
10,425,480
|
|||||||
In 2017, Wuhu Chery, Quantum and HCI entered into equity transaction agreements pursuant to which Quantum and Wuhu Chery sold 26% and 25% equity interests of the Company, respectively, to HCI. As the result of the equity transaction, HCI, Wuhu Chery, and Quantum owns 51%, 25% and 24% equity interests, respectively, in the Company. By the end of 31 December 2017, the equity transaction had been completed and HCI became the immediate holding company of the Group.
In addition, based on the terms of the investment agreements, within three months after the equity transaction, the Group shall increase its registered capital by RMB 6.5 billion among which (i) HCI agrees to contribute RMB 3.31 billion to subscribe for 51% of the aforesaid increased registered capital in cash and/or convertible loans; (ii) Quantum shall contribute RMB 1.56 billion in cash and/or convertible loans to subscribe for 24% of the aforesaid increased registered capital; and (iii) Wuhu Chery shall contribute RMB 1.63 billion in cash and/or convertible loans to subscribe for 25% of the aforesaid increased registered capital.
In connection with the increase in the registered capital, HCI contributed RMB 1.1 billion advances by 31 December 2017. In the case of termination of the investment agreements, this advance is repayable by the Group within 1 to 2 years from the date of termination depending on different circumstances at an interest rate of 4.35% per annum.
F - 141
| 22 |
Loans and borrowings
|
|
31 December
|
||||||||||||
|
In thousands of RMB
|
Note
|
2017
|
2016
|
|||||||||
|
Denominated in:
|
||||||||||||
|
RMB
|
6,738,038
|
6,890,146
|
||||||||||
|
6,738,038
|
6,890,146
|
|||||||||||
|
Non-current
|
22(a)
|
|
4,227,338
|
4,248,660
|
||||||||
|
Current
|
22(b)
|
|
2,510,700
|
2,641,486
|
||||||||
|
6,738,038
|
6,890,146
|
|||||||||||
| (a) |
Non-current loan and borrowings
|
|
In thousands of RMB
|
Note
|
Banking
facility
|
Accumulated
drawdown
|
Accumulated
repayment
|
Reclassified
to current
|
Balance as at 31 December 2017
|
||||||||||||||||
|
Consortium loan I
|
(i)
|
3,000,000
|
2,906,000
|
(354,245
|
)
|
(24,417
|
)
|
2,527,338
|
||||||||||||||
|
Consortium loan II
|
(ii)
|
1,200,000
|
1,200,000
|
(30,000
|
)
|
(90,000
|
)
|
1,080,000
|
||||||||||||||
|
Consortium loan III
|
(iii)
|
700,000
|
700,000
|
-
|
(80,000
|
)
|
620,000
|
|||||||||||||||
|
PingAn
|
(iv)
|
62,500
|
62,500
|
(54,167
|
)
|
(8,333
|
)
|
-
|
||||||||||||||
|
Total
|
4,962,500
|
4,868,500
|
(438,412
|
)
|
(202,750
|
)
|
4,227,338
|
|||||||||||||||
Details of non-current loans and borrowings are set out below.
| (i) |
Consortium loan I: On 23 July 2012, the Company entered into a consortium financing arrangement with a group of banks. Under the arrangement, the Company can draw down loans in either RMB or USD, up to an aggregate maximum principal amount of RMB 3 billion. The RMB loan bears the 5-year interest rate quoted by the People’s Bank of China from time to time and the USD loan bears interest rate of LIBOR+4.8% per annum. The repayment schedule of loans is based on the instalments schedule as set out in the agreement within 10 years from the first draw down date. The arrangement is secured by the Company’s land use right, equipment, properties and construction in progress and is guaranteed by Wuhu Chery and Changshu Port Development and Construction Co., Ltd (“CPDC”) respectively. Each party provides guarantee to an aggregate principal amount of no more than RMB 1.5 billion or its equivalent. The guarantee from Wuhu Chery and CPDC are several but not joint. In connection with CPDC’s guarantee, the Company made a guarantee deposit of RMB 100 million to CPDC and Wuhu Chery also entered into an agreement to provide a counter-guarantee to CPDC in September 2012. The guarantee deposit was initially recorded in trade and other receivables at fair value and subsequently measured at amortised cost. The difference between RMB 100 million and fair value on the initial date was deferred and amortised as interest expenses over the loan period using effective interest rate as the guarantee deposit is directly attributable to the loan.
|
F - 142
| 22 |
Loans and borrowings (continued)
|
| (a) |
Non-current loan and borrowings (continued)
|
As at 31 December 2017, the Company has drawn down RMB loans of RMB 2,906 million (31 December 2016: RMB 2,906 million) with an interest rate of 4.90% and repaid RMB 354 million accumulatively.
The loans drawn down from this consortium arrangement contains financial related covenants, that is, debt-to-asset ratio not exceeding 65% and current ratio not below 1.0. In 2013, the Company obtained a confirmation from the banks that compliance of the financial covenants is not required for 2013 and 2014. In September 2014, the banks further extended the covenant waiver to July 2017. In 2016, the Company obtained further confirmation from the banks that the compliance of the financial covenants is not required for the next three years until July 2020.
| (ii) |
Consortium loan II: On 31 July 2014, the Company entered into an additional consortium financing arrangement with a bank consortium. Under this arrangement, the Company can draw down loans in either RMB or USD, up to an aggregate maximum principal amount of RMB 1.2 billion. The RMB loan bears the 5-year interest rate quoted by the People’s Bank of China with 10% mark-up and the USD loan bears interest rate of LIBOR+5% per annum. The repayment schedule of loans is based on the instalment schedule as set out in the agreement within 10 years from the first draw down date.
|
Wuhu Chery Automobile Investment Co., Ltd. and Quantum, shareholders of the Company, have each pledged 28.38% of its then equity interest in the Company, which is being equivalent to a registered capital of RMB 1.9 billion respectively to the bank consortium.
As at 31 December 2017, the Company has drawn down in full an amount of RMB 1.2 billion (31 December 2016: RMB 1.2 billion) with the interest rate of 5.39% and repaid RMB 30 million accumulatively.
| (iii) |
Consortium loan III: On 12 May 2015, the Company entered into a financing arrangement with a bank consortium. Under the arrangement, the Company can draw down loans in either RMB or USD, up to an aggregate maximum principal amount of RMB 700 million. The loan agreement covers a period of 102 months starting from 15 May 2015, secured by Chery Automobile Co., Ltd (“Chery”) and pledged by the Company’s 90 vehicle patents with an appraisal value totalling no less than RMB 3.1 billion. The RMB loan bears the 5-year interest rate quoted by the People’s Bank of China with 10% mark-up and the USD loan bears interest of LIBOR+3.5% per annum. Kenon Holdings Ltd. (“Kenon”) provided a back-to-back guarantee to Chery for RMB 350 million, plus up to RMB 60 million of related fees, in connection with the Company’s drawdown of RMB 700 million.
|
As at 31 December 2017, the Company has drawn down in full an amount of RMB 700 million (31 December 2016: RMB 700 million) with the interest rate of 5.39%.
F - 143
| 22 |
Loans and borrowings (continued)
|
| (a) |
Non-current loan and borrowings (continued)
|
| (iv) |
Ping An: On 30 November 2016, the Company entered into a 15-month financing arrangement with Ping An International Financing and Leasing Co., Ltd through a designated bank loan arrangement with Bank of Ningbo. The Company drew down the maximum principal amount of RMB 62.5 million with an interest rate of 6.70%. The Company provided guarantee deposit of RMB 12.5 million with Bank of Ningbo. Under this arrangement, the Company will make a monthly repayment on principal of RMB 4.2 million for the 15-month period ending 28 February 2018. The current portion of the loan is RMB 8.3 million as at 31 December 2017.
|
| (b) |
Current loan and borrowings
|
Current loans and borrowings represented unsecured bank loans of RMB 394 million with maturity period within one year with the interest rates from 4.55% to 5.22%; current portion of the long-term loans (Note 22(a)); and shareholder loans payable to Wuhu Chery and Quantum totalling RMB 1.9 billion.
As at 31 December 2017, the Company has unutilised loan facilities of RMB 67.2 million (31 December 2016: RMB 205 million).
| 23 |
Deferred income
|
|
In thousands of RMB
|
Government Grant
|
Licence rights
|
First Free Service
|
Total
|
||||||||||||
|
Balance at 1 January 2016
|
194,245
|
300,000
|
-
|
494,245
|
||||||||||||
|
Addition
|
-
|
-
|
9,686
|
9,686
|
||||||||||||
|
Amortisation
|
(11,082
|
)
|
(30,000
|
)
|
(3,414
|
)
|
(44,496
|
)
|
||||||||
|
Balance at 31 December 2016
|
183,163
|
270,000
|
6,272
|
459,435
|
||||||||||||
|
Addition
|
-
|
-
|
7,228
|
7,228
|
||||||||||||
|
Amortisation
|
(11,080
|
)
|
(270,000
|
)
|
(7,908
|
)
|
(288,988
|
)
|
||||||||
|
Balance at 31 December 2017
|
172,083
|
-
|
5,592
|
177,675
|
||||||||||||
|
Non-current
|
161,002
|
-
|
-
|
161,002
|
||||||||||||
|
Current
|
11,081
|
-
|
5,592
|
16,673
|
||||||||||||
|
172,083
|
-
|
5,592
|
177,675
|
|||||||||||||
F - 144
| 23 |
Deferred income (continued)
|
In November 2012, the Group received RMB 213.5 million from the Management Committee of Changshu Economic & Technology Development Zone, as a result of the Group’s investment in the Development Zone. Such government grant was initially recognised as “deferred income” upon receipt and is amortised and recognised as “other income” over the Group’s expected remaining period of operation.
In 2015, the Group received RMB 300 million from Chery Auto as a payment in connection with the licence agreement for the use of the Group’s platform technology and patent, which was recognised as current liability in “deferred income” as the licence agreement had not been effective by then. In 2016, after the licence agreement became effective, this amount was recognized on a straight line basis over the period of the agreement. In 2017, the Group recognized all of the remaining unamortised balance relating to the licence agreement because the Group does not retain significant risks and rewards of ownership and has no remaining obligations to perform under the licence agreement.
According to the Group’s policy regarding warranty, the first free maintenance service will be delivered in 6 months after retail sales of vehicle or mileage reached 5000 km. The service is provided by 4S stores and claimed against the Group. Even though the service is provided for free, there is a market price with amount of approximately RMB 431 per vehicle. The revenue from maintenance should be recognised nine months after sales, in consideration of three month for retail.
| 24 |
Trade and other payables
|
|
At 31 December
|
||||||||
|
In thousands of RMB
|
2017
|
2016
|
||||||
|
Trade payables
|
745,337
|
826,070
|
||||||
|
Bills payables
|
11,000
|
43,000
|
||||||
|
Other payables for
|
||||||||
|
- research and development activities
|
242,383
|
246,763
|
||||||
|
- property, plant and equipment
|
131,014
|
181,717
|
||||||
|
- marketing and promotion
|
424,494
|
519,642
|
||||||
|
- services
|
252,404
|
267,503
|
||||||
|
Accrued payroll and other employee benefits
|
44,017
|
53,628
|
||||||
|
Interest payable
|
132,898
|
37,379
|
||||||
|
Liabilities due to related parties
|
558,370
|
402,188
|
||||||
|
Advance capital injection from HCI (note 21)
|
1,096
,
878
|
-
|
||||||
|
Receipt in advance
|
17,766
|
39,950
|
||||||
|
Others
|
255,790
|
179,317
|
||||||
|
3,912,351
|
2,797,157
|
|||||||
|
Non-current
|
1,208,256
|
112,488
|
||||||
|
Current
|
2,704,095
|
2,684,669
|
||||||
|
3,912,351
|
2,797,157
|
|||||||
F - 145
| 25 |
Provisions
|
The provision balance as at 31 December 2017 and 2016 mainly represents warranties related to cars sold. As no adequate historical warranty data associated with cars sold is available, the Group accrues warranty provisions based on the estimation made by the Group’s technical department taking into account available warranty data of similar cars in the market.
| 26 |
Financial risk management and fair values of financial instruments
|
Exposure to credit, liquidity, interest rate and currency risks arises in the normal course of the Group’s business.
The Group’s exposure to these risks and the financial risk management policies and practice used by the Group to manage these risks are described below.
| (a) |
Credit risk
|
Credit risk is the risk of financial loss to the Group if a customer or counterparty to a financial instrument fails to meet its contractual obligations, and arises principally from the Group’s receivables from counterparties and the Group’s deposits with banks (including available-for-sale financial assets).
The Group establishes an allowance for impairment that represents its estimate of incurred losses in respect of trade and other receivables. The main components of this allowance are a specific loss component that relates to individually significant exposures.
The management has a credit policy in place and the exposures to these credit risks are monitored on an ongoing basis. Individual credit evaluations are performed on all customers requiring credit over a certain amount. These evaluations focus on the customer’s past history of making payments when due and current ability to pay, and take into account information specific to the customer as well as pertaining to the economic environment in which the customer operates. Trade debtors are mainly due within 30 days to 360 days from the date of billing.
The Group is also subject to potential financial loss in connection with the guarantee provided to Chery Huiyin Motor Finance Service Co., Ltd (“Huiyin”), a subsidiary of Chery, for the financing arrangement between dealers and Huiyin. In case of loan default, the Group may need to compensate Huiyin for an amount up to the actual loss incurred. As at 31 December 2017, the outstanding loan balance were RMB 247 million and none of them were overdue. Refer to note 29(c)(i) for this guarantee arrangement with Huiyin.
The Group limits its exposure to credit risk by investing only in liquid investment products issued by financial institutions. Management actively monitors credit ratings and given that the Group only has invested in investment products with high credit ratings, management does not expect any counterparty to fail to meet its obligations.
The carrying amounts of cash and cash equivalents, pledged deposits, trade and other receivables and available-for-sale financial assets represent its maximum credit exposure on these assets.
F - 146
| 26 |
Financial risk management and fair values of financial instruments (continued)
|
| (b) |
Liquidity risk
|
Liquidity risk is the risk that the Group will encounter difficulty in meeting the obligations associated with its financial liabilities that are settled by delivering cash or another financial asset.
The Group's policy is to regularly monitor its liquidity requirements and its compliance with lending covenants, to ensure that it maintains sufficient reserves of cash and readily realisable marketable securities and adequate committed lines of funding from major financial institutions and/or from investors to meet the liquidity requirements in the short and long term.
Consortium loan II and III (see Note 22), contains a “cross-default” provision which provides for an event of default if any other debt of Qoros in excess of RMB 50 million becomes payable prior to maturity, so a default under other debt facilities would result in a default under the facilities referenced above and a default that leads to acceleration under either facility above will result in an event of default under the other facility.
The following are the remaining contractual maturities at the end of the reporting period of financial liabilities, including estimated interest payments and excluding the impact of netting agreements:
|
Contractual undiscounted cash flow
|
||||||||||||||||||||||||
|
Within 1 year or on demand
|
More than 1 year but less than 2 years
|
More than 2 years but less than 5 years
|
More than 5 years
|
Total
|
Carrying amount at balance sheet date
|
|||||||||||||||||||
|
As at 31 December 2017
|
||||||||||||||||||||||||
|
Trade and other payables
|
2,704,095
|
46,096
|
74,398
|
1
,
096
,
878
|
3,921
,
467
|
3,912,351
|
||||||||||||||||||
|
Loans and borrowings
|
2,788,020
|
1,067,208
|
3,037,039
|
627,385
|
7,519,652
|
6,738,038
|
||||||||||||||||||
|
Total
|
5,492,115
|
1,113,304
|
3,111,437
|
1,724,263
|
11,441,119
|
10,650
,
389
|
||||||||||||||||||
|
As at 31 December 2016
|
||||||||||||||||||||||||
|
Trade and other payables
|
2,684,669
|
21,426
|
103,885
|
-
|
2,809,980
|
2,797,157
|
||||||||||||||||||
|
Loans and borrowings
|
2,881,389
|
852,455
|
2,646,014
|
1,489,919
|
7,869,777
|
6,890,146
|
||||||||||||||||||
|
Total
|
5,566,058
|
873,881
|
2,749,899
|
1,489,919
|
10,679,757
|
9,687,303
|
||||||||||||||||||
F - 147
| 26 |
Financial risk management and fair values of financial instruments (continued)
|
| (c) |
Foreign currency risk
|
The Group is exposed to currency risk on purchases relating to research and development activities, bank borrowings as well as normal productions that are denominated in currencies other than the functional currencies. The currencies in which these transactions primarily are denominated are RMB, US dollars (“USD”), Euros (“EUR”) and Great British pounds (“GBP”). The functional currency of the Company is RMB.
In respect of monetary assets and liabilities denominated in foreign currencies, the Group’s policy is to ensure that its net exposure is kept to an acceptable level by buying or selling foreign currencies at spot rates when necessary to address short-term imbalances.
Exposure to
currency
risk
The summary quantitative data about the Group’s exposure to currency risk as reported to the management of the Group is as follows:
|
At 31 December
|
||||||||
|
EUR
|
2017
|
2016
|
||||||
|
RMB’000
|
RMB’000
|
|||||||
|
Cash and cash equivalent
|
912
|
1,549
|
||||||
|
Prepayments
|
741
|
784
|
||||||
|
Trade and other payables
|
(22,135
|
)
|
(18,673
|
)
|
||||
|
Net statement of financial position exposure
|
(20,482
|
)
|
(16,340
|
)
|
||||
|
At 31 December
|
||||||||
|
USD
|
2017
|
2016
|
||||||
|
RMB’000
|
RMB’000
|
|||||||
|
Cash and cash equivalent
|
9,411
|
9,987
|
||||||
|
Prepayments
|
131
|
284
|
||||||
|
Trade and other payables
|
(7,652
|
)
|
(7,922
|
)
|
||||
|
Net statement of financial position exposure
|
1,890
|
2,349
|
||||||
|
At 31 December
|
||||||||
|
GBP
|
2017
|
2016
|
||||||
|
RMB’000
|
RMB’000
|
|||||||
|
Trade and other payables
|
(1,229
|
)
|
(706
|
)
|
||||
|
Net statement of financial position exposure
|
(1,229
|
)
|
(706
|
)
|
||||
F - 148
| 26 |
Financial risk management and fair values of financial instruments (continued)
|
| (c) |
Foreign currency risk (continued)
|
The following significant exchange rates have been applied during the year:
|
Average rate
|
Year end spot rate
|
|||||||||||||||
|
2017
|
2016
|
2017
|
2016
|
|||||||||||||
|
EUR
|
7.5546
|
7.2010
|
7.8023
|
7.3068
|
||||||||||||
|
USD
|
6.7356
|
6.7153
|
6.5342
|
6.9370
|
||||||||||||
|
GBP
|
8.6443
|
9.0627
|
8.7792
|
8.5094
|
||||||||||||
A reasonably possible strengthening (weakening) of the EUR, USD and GBP against RMB at 31 December would have affected the measurement of financial instruments denominated in a foreign currency and affected equity and profit or loss by the amounts shown below. The analysis assumes that all other variables, in particular interest rates, remain constant and ignores any impact of forecast sales and purchases.
|
At 31 December
|
||||||||||||||||
|
2017
|
2016
|
|||||||||||||||
|
Strengthening
|
Weakening
|
Strengthening
|
Weakening
|
|||||||||||||
|
RMB’000
|
RMB’000
|
RMB’000
|
RMB’000
|
|||||||||||||
|
EUR (10% movement)
|
(2,048
|
)
|
2,048
|
(1,634
|
)
|
1,634
|
||||||||||
|
USD (10% movement)
|
189
|
(189
|
)
|
235
|
(235
|
)
|
||||||||||
|
GBP (10% movement)
|
(123
|
)
|
123
|
(71
|
)
|
71
|
||||||||||
| (d) |
Interest rate risk
|
The Group’s interest rate risk arises primarily from interest-bearing borrowings. Borrowings issued at variable rates and at fixed rates expose the Group to cash flow interest rate risk and fair value interest rate risk respectively. Management monitors interest rate exposures and will consider hedging significant interest rate risk should the need arise.
Interest rate profile
The following table details the interest rate profile of the Group’s net borrowings at the end of the reporting period, after taking into account the effect of swap contracts.
F - 149
| 26 |
Financial risk management and fair values of financial instruments (continued)
|
| (d) |
Interest rate risk (continued)
|
|
2017
|
2016
|
|||||||||||||||
|
Interest rate %
|
RMB’000
|
Interest rate %
|
RMB’000
|
|||||||||||||
|
Net fixed rate borrowings:
|
||||||||||||||||
|
Bank loans
|
4.35~6.70
|
2
,
316,283
|
4.35~6.70
|
2,232,333
|
||||||||||||
|
|
||||||||||||||||
|
Net variable rate borrowings:
|
||||||||||||||||
|
Bank loans
|
4.90~5.39
|
4,421,755
|
4.90~5.39
|
4,657,813
|
||||||||||||
|
Total net borrowings
|
6,738,038
|
6,980,146
|
||||||||||||||
|
Net fixed rate borrowings as a percentage of total net borrowings
|
34
|
%
|
32
|
%
|
||||||||||||
Sensitivity
analysis
The Group does not account for any fixed rate borrowings at fair value through profit or loss. Therefore a change in interest rate at the reporting date would not affect profit or loss.
As at 31 December 2017, it is estimated that a change of 100 basis points in interest rates would have increased or decreased equity by RMB 44,218 thousand (2016: RMB 46,578 thousand; 2015: RMB 47,566 thousand). This sensitivity analysis has been determined assuming that the change in interest rates had occurred at the end of reporting period and the change was applied to the Group’s variable rate borrowings at that date with exposure to cash flow interest rate risk. The impact on the Group’s equity is estimated as an annualised impact on interest expense or income of such a change in interest rates. The analysis is performed on the same basis for 2016 and 2015.
A change of 100 basis points in interest rates would have increased or decreased equity by RMB 44,218 thousand (2016: RMB 46,578 thousand; 2015: RMB 47,566 thousand).
| (e) |
Fair value measurement
|
| (i) |
Financial assets and liabilities carried at fair value
|
Fair value hierarchy
The following table presents the fair value of the Group’s financial instruments measured at the end of the reporting period on a recurring basis, categorised into the three-level fair value hierarchy as defined in IFRS 13,
Fair value measurement
. The level into which a fair value measurement is classified is determined with reference to the observability and significance of the inputs used in the valuation technique as follows:
F - 150
| 26 |
Financial risk management and fair values of financial instruments (continued)
|
| (e) |
Fair value measurement (continued)
|
| (i) |
Financial assets and liabilities carried at fair value (continued)
|
| · |
Level 1 valuations: Fair value measured using only Level 1 inputs i.e. unadjusted quoted prices in active markets for identical assets or liabilities at the measurement date
|
| · |
Level 2 valuations: Fair value measured using Level 2 inputs i.e. observable inputs which fail to meet Level 1, and not using significant unobservable inputs. Unobservable inputs are inputs for which market data are not available
|
| · |
Level 3 valuations: Fair value measured using significant unobservable inputs
|
The Group has a team headed by the finance manager performing valuations for the financial instruments. The team reports directly to the chief financial officer and the audit commitee. A valuation report with analysis of changes in fair value measurement is prepared by the team at each interim and annual reporting date, and is reviewed and approved by the chief financial officer. Discussion of the valuation process and results with the chief financial officer and the audit commitee is held twice a year, to coincide with the reporting dates.
As at 31 December 2017, the Group does not have financial assets or financial liabilities carried at fair value. As of 31 December 2016, the Group had the following financial assets carried at fair value:
|
Fair value measurements as at
31 December 2016 categorised into
|
||||||||||||||||
|
Fair value at 31 December 2016
|
Level 1
|
Level 2
|
Level 3
|
|||||||||||||
|
RMB’000
|
RMB’000
|
RMB’000
|
RMB’000
|
|||||||||||||
|
Recurring fair value measurement
|
||||||||||||||||
|
Available-for-sale financial assets
|
100,000
|
-
|
100,000
|
-
|
||||||||||||
| (ii) |
Fair values of financial assets and liabilities carried at other than fair value.
|
The carrying amounts of the Group’s financial instruments carried at cost or amortised cost are not materially different from their fair values as at 31 December 2016 and 2017.
| (f) |
Capital management
|
The Board’s policy is to maintain a strong capital base so as to maintain investor, creditor and market confidence and to sustain future development of the business. Capital consists of paid in capital and retained earnings.
There were no changes in the Group’s approach to capital management during the year.
F - 151
| 27 |
Operating leases
|
| (a) |
Leases as lessee
|
As at 31 December, the future minimum lease payments under non-cancellable operating lease rentals were payable as follows:
|
At 31 December
|
||||||||
|
In thousands of RMB
|
2017
|
2016
|
||||||
|
Within 1 year
|
28,202
|
35,202
|
||||||
|
After 1 year but within 5 years
|
94
,
113
|
96,197
|
||||||
|
After 5 years
|
24,881
|
49,762
|
||||||
|
147
,
196
|
181,161
|
|||||||
| (b) |
Leases as lessor
|
The Group leases out its part of machinery.
As at 31 December, the future minimum lease payments under non-cancellable leases were receivable as follows:
|
At 31 December
|
||||||||
|
In thousands of RMB
|
2017
|
2016
|
||||||
|
Within 1 year
|
-
|
20,016
|
||||||
|
After 1 year but within 5 years
|
-
|
-
|
||||||
|
-
|
20,016
|
|||||||
| 28 |
Commitments
|
Capital commitments outstanding not provided for in the financial statements:
|
At 31 December
|
||||||||
|
In thousands of RMB
|
2017
|
2016
|
||||||
|
Contracted for
|
216,875
|
266,103
|
||||||
|
Authorised but not contracted for
|
-
|
-
|
||||||
|
216,875
|
266,103
|
|||||||
F - 152
| 29 |
Related parties
|
| (a) |
Parent company
|
As at 31 December 2016 and 2015, the Company was jointly-controlled by Wuhu Chery and Quantum. Chery Automobile Co., Ltd. (“Chery Auto”) is the ultimate parent company of Wuhu Chery and Kenon Holdings Ltd. is the immediate parent company of Quantum.
As at December 31 2017, HCI became the controlling shareholder of the Group.
The following is a summary of principal related parties transactions carried out by the Group with the related parties for the year presented.
| (b) |
Transactions with key management personnel
|
|
In thousands of RMB
|
2017
|
2016
|
2015
|
|||||||||
|
Salaries, benefit and contribution to the defined contribution retirement plan
|
17,007
|
12,979
|
19,700
|
|||||||||
F - 153
| 29 |
Related parties (continued)
|
| (c) |
Other related party transactions
|
|
In thousands of RMB
|
Note
|
2017
|
2016
|
2015
|
||||||||||||
|
Loan from Wuhu Chery
|
244,250
|
975,000
|
1,662,783
|
|||||||||||||
|
Loan from Quantum
|
244,250
|
975,000
|
800,000
|
|||||||||||||
|
Conversion of loan to capital
|
||||||||||||||||
|
- Wuhu Chery
|
-
|
1,046,820
|
900,000
|
|||||||||||||
|
- Quantum
|
-
|
1,046,820
|
900,000
|
|||||||||||||
|
Advance capital injection from HCI
|
1,096,878
|
-
|
-
|
|||||||||||||
|
Sale of goods
|
||||||||||||||||
|
- Chery Auto
|
3,567
|
11,170
|
6,717
|
|||||||||||||
|
- Fund & Liberty Car Rental/Leasing Co., Ltd. (“Fund”)
|
-
|
-
|
1,153
|
|||||||||||||
|
- Chery Auto's subsidiary
|
6,074
|
4,533
|
||||||||||||||
|
Purchase of materials and parts
|
||||||||||||||||
|
- Chery Auto
|
166,327
|
327,694
|
189,754
|
|||||||||||||
|
- Chery Auto’s subsidiaries
|
1,574
|
2,317
|
-
|
|||||||||||||
| Price adjustment on purchase of material and parts | ||||||||||||||||
|
- Chery Auto
|
10
|
-
|
72,953
|
42,877
|
||||||||||||
|
Service fee
|
||||||||||||||||
|
- Chery Auto
|
1,951
|
4,817
|
42,339
|
|||||||||||||
|
- Shanghai SICAR Vehicle Technology Development Co., Ltd. (“SICAR”)
|
-
|
-
|
4,453
|
|||||||||||||
|
Rental and other expenses
|
||||||||||||||||
|
- Chery Huiyin Motor Finance Service Co., Ltd. (“Huiyin”)
|
32,045
|
33,644
|
16,821
|
|||||||||||||
|
- Chery Auto’s subsidy
|
61
|
-
|
18
|
|||||||||||||
|
- Fund
|
171
|
2,703
|
-
|
|||||||||||||
|
- Chery Holdings Ltd.
|
69
|
59
|
-
|
|||||||||||||
|
- Kenon Holdings Ltd.
|
-
|
-
|
2,167
|
|||||||||||||
|
Charge for licence agreement
|
23
|
-
|
-
|
300,000
|
||||||||||||
|
Sales proceeds received from Huiyin pursuant to tri-party agreements
|
(i)
|
1,022,822
|
2,425,437
|
1,173,051
|
||||||||||||
F - 154
| 29 |
Related parties (continued)
|
| (c) |
Other related party transactions (continued)
|
In addition to the above transactions, guarantees provided by Wuhu Chery and Kenon in respect of the consortium financing agreement were disclosed in Note 22.
The outstanding balances arising from the above transactions at the end of the reporting periods are as follows:
|
In thousands of RMB
|
Note
|
At 31 December 2017
|
At 31 December 2016
|
|||||||
|
Amounts due from related parties
|
||||||||||
|
- trade receivables from Fund
|
-
|
3,790
|
||||||||
|
- trade receivables from Chery Auto’s subsidiary
|
5,692
|
1,689
|
||||||||
|
- trade receivables from Chery Auto
|
1,144
|
1,144
|
||||||||
|
- other receivables from Chery Auto
|
13,447
|
9,661
|
||||||||
|
- other receivables from Chery Auto’s subsidiary
|
5
|
-
|
||||||||
|
- prepayment to Chery Auto’s subsidiary
|
445
|
-
|
||||||||
|
20,733
|
16,284
|
|||||||||
|
Amounts due to related parties
|
||||||||||
|
- loan payable to Wuhu Chery
|
944,250
|
700,000
|
||||||||
|
- loan payable to Quantum
|
944,250
|
700,000
|
||||||||
|
- payables to Chery Auto
|
554,907
|
373,058
|
||||||||
|
- payables to Kenon Holdings Ltd.
|
-
|
-
|
||||||||
|
- payables to Fund
|
-
|
200
|
||||||||
|
- payables to Chery Auto’s subsidiary
|
852
|
624
|
||||||||
|
- payables to SICAR
|
1,570
|
1,570
|
||||||||
|
- receipt in advance from Huiyin
|
(i)
|
-
|
26,408
|
|||||||
|
- receipt in advance from Chery Auto’s subsidiary
|
1,041
|
328
|
||||||||
|
-
advance capital injection from HCI
|
1,096,878
|
-
|
||||||||
|
3,543,748
|
1,802,188
|
|||||||||
F - 155
| 29 |
Related parties (continued)
|
| (c) |
Other related party transactions (continued)
|
Notes
:
| (i) |
In 2014, the Group entered into tri-party arrangements with Huiyin and certain car dealers, who are the Group’s direct customers. According to such arrangements, Huiyin provides financing to the dealers for their purchases from the Group. Huiyin is a subsidiary of Chery Group, which is engaged in providing financing to buyers of car manufacturing companies. Huiyin performs credit assessment on dealers and grants short-term (12-month or less) revolving lines of credit to them. The Group accepts purchase orders from these dealers only if they have sufficient unused credit from Huiyin. Upon confirmation of sales orders accepted by the Group, Huiyin remits purchase amount directly to the Group on behalf of individual dealers, and outstanding loan balances payable of dealers due to Huiyin are increased by the equivalent amount at the same time. The Group was not responsible for the repayment of loans between the dealers and Huiyin.
|
In March 2016, in order to help increase the credit lines of dealers from Huiyin, the Group offered guarantees to Huiyin for selected dealers pursuant to which the Group was responsible for any default of the loans released during the period between March 2016 and February 2017, including both principal and interests, for a maximum amount of RMB 700 million which were the amount of total lines of credit of these dealers with Huiyin. The interest rate of loans offered by Huiyin to dealers before and after the Group committed such guarantee was the same. As at 31 December 2017, the outstanding loan balance were RMB 247 million and none of them were overdue. The guarantee was subsequently extended to December 2018.
| (d) |
Relationship with the related parties under the transactions stated in 29(c) above
|
|
Name of the entities
|
Relationship with the Group
|
|
|
Hangzhou Chengmao Investment Co., Ltd.
|
Parent Company
|
|
|
Wuhu Chery Automobile Investment Co., Ltd.
|
Investor
|
|
|
Quantum (2007) LLC
|
Investor
|
|
|
Wuhu Chery Car Rental Co., Ltd
|
Chery Auto’s subsidiary
|
|
|
Chery Investment Co., Ltd in Ordos
|
Chery Auto’s subsidiary
|
|
|
Huiyin
|
Chery Auto’s subsidiary
|
|
|
SICAR
|
Joint venture invested by Chery Auto
|
|
|
Fund
|
Associate invested by the Group
|
|
F - 156
SIGNATURES
The registrant hereby certifies that it meets all of the requirements for filing on Form 20-F and that it has duly caused and authorized the undersigned to sign this annual report on its behalf.
|
Kenon Holdings Ltd.
|
|||
|
By:
|
/s/ Barak Cohen
|
||
|
Name: Barak Cohen
|
|||
|
Title: Co-Chief Executive Officer
|
|||
|
By:
|
/s/ Robert L. Rosen
|
||
|
Name: Robert L. Rosen
|
|||
|
Title: Co-Chief Executive Officer
|
|||
Date: April 9, 2018
ITEM 19.
Exhibits
Index to Exhibits
|
101.INS*
|
XBRL Instance Document
|
|
|
101.SCH*
|
XBRL Taxonomy Extension Schema Document
|
|
|
101.CAL*
|
XBRL Taxonomy Extension Calculation Linkbase Document
|
|
|
101.DEF*
|
XBRL Taxonomy Extension Definition Linkbase Document
|
|
|
101.LAB*
|
XBRL Taxonomy Extension Label Linkbase Document
|
|
|
101.PRE*
|
XBRL Taxonomy Extension Presentation Linkbase Document
|
*
Filed herewith.
†
Portions of this exhibit have been omitted pursuant to a request for confidential treatment under Rule 24b-2 of the Exchange Act. Omitted information has been filed separately with the SEC.
TABLE OF CONTENTS
Part IItem 1. Identity Of Directors, Senior Management and AdvisersItem 2. Offer Statistics and Expected TimetableItem 3. Key InformationItem 4. B Business Overview Our Businesses Opc Legal ProceedingsItem 5. B Liquidity and Capital ResourcesItem 4. B Business Overview Our Businesses Qoros Qoros Investment AgreementItem 4. B Business Overview Our Businesses Opc Industry OverviewItem 5. Operating and Financial Review and Prospects Material Factors Affecting Results Of Operations Opc Sales Ea TariffsItem 4. B Business Overview Our Businesses Opc EmployeesItem 4. B Business Overview Our Businesses Opc InsuranceItem 4. B Business Overview Opc Regulatory, Environmental and Compliance Matters Regulatory Framework For Cogeneration IppsItem 4. B Business Overview Discontinued Operations Inkia Business Sale Of The Inkia Business Share Purchase AgreementItem 4. B Business Overview Discontinued Operations Inkia Business Nautilus Energy Topco Llc Deferred Payment AgreementItem 4. B Business Overview Our Businesses Qoros Qoros Joint Venture AgreementItem 5. B Liquidity and Capital Resources Zim S Liquidity and Capital ResourcesItem 4. B Business Overview Our Businesses Zim Zim S Special State ShareItem 10. B ConstitutionItem 10. E Taxation U.s. Federal Income Tax Considerations Passive Foreign Investment CompanyItem 4. Information on The CompanyItem 4. B Business Overview Discontinued Operations Inkia Business Sale Of The Inkia BusinessItem 3. D Risk Factors Risks Related To OpcItem 3. A Selected Financial Data Selected Reportable Segment Data OpcItem 3. A Selected Financial Data OpcItem 5. B Liquidity and Capital Resources Opc S Liquidity and Capital Resources Opc S Material Indebtedness Opc-hadera FinancingItem 3. D Risk Factors Risks Related To Opc Changes in The Ea S Electricity Rates May Reduce Opc S ProfitabilityItem 3. D Risk Factors Risks Related To Our Interest in Qoros Qoros Is Dependent Upon Its SuppliersItem 3. D Risk Factors Risks Related To Our Interest in Qoros Qoros Business Is Subject To Intense CompetitionItem 3. D Risk Factors Risks Related To Our Interest in Qoros Our Interest in Qoros Is Only 24%Item 3. D. Risk Factors Risks Related To Our Interest in Qoros Qoros Requires Qualified Personnel To Manage Its OperationsItem 4. B Business OverviewItem 4A. Unresolved Staff CommentsItem 5. Operating and Financial Review and ProspectsItem 4. B Business Overview Discontinued Operations Inkia BusinessItem 3. D Risk Factors Risks Related To Our Strategy and Operations Some Of Our Businesses Have Significant Capital RequirementsItem 4. B Business Overview Our Businesses Zim Zim S Industry UpdateItem 4. B Business Overview Discontinued Operations Inkia Business Sale Of The Inkia Business Kenon GuaranteeItem 3. D. Risk Factors Risk Factors Related To Our Interest in Qoros Qoros Is Dependent Upon Its SuppliersItem 3. D Risk Factors Risks Related To Our Other Businesses Risks Related To Our Interest in ZimItem 3. D Risk FactorsItem 5. Operating and Financial Review and Prospects Recent DevelopmentsItem 6. Directors, Senior Management and EmployeesItem 6. E Share OwnershipItem 4. B Business Overview Opc EmployeesItem 7. Major Shareholders and Related Party TransactionsItem 8. Financial InformationItem 18. Financial StatementsItem 9. The Offer and ListingItem 10. Additional InformationItem 11. Quantitative and Qualitative Disclosures About Market RiskItem 12. Description Of Securities Other Than Equity SecuritiesPart IIItem 13. Defaults, Dividend Arrearages and DelinquenciesItem 14. Material Modifications To The Rights Of Security Holders and Use Of ProceedsItem 15. Controls and ProceduresItem 16. [reserved]Item 16A. Audit Committee Financial ExpertItem 16B. Code Of EthicsItem 16C. Principal Accountant Fees and ServicesItem 16D. Exemptions From The Listing Standards For Audit CommitteesItem 16E. Purchases Of Equity Securities By The Issuer and Affiliated PurchasersItem 16F. Change in Registrant S Certifying AccountantItem 16G. Corporate GovernanceItem 16H. Mine Safety DisclosurePart IIIItem 17. Financial StatementsItem 19. ExhibitsNote 1 Financial Reporting Principles and Accounting PoliciesNote 2 Basis Of Preparation Of The Financial StatementsNote 2 Basis Of Preparation Of The Financial Statements (cont D)Note 3 Significant Accounting PoliciesNote 3 Significant Accounting Policies (cont D)Note 4 Determination Of Fair ValueNote 5 Cash and Cash EquivalentsNote 6 Short-term Investments and DepositsNote 7 Trade Receivables, NetNote 8 Other Current AssetsNote 9 InventoriesNote 10 Investment in Associated CompaniesNote 10 Investment in Associated Companies (cont D)Note 11 SubsidiariesNote 11 Subsidiaries (cont D)Note 12 Deposits, Loans and Other Receivables, Including Derivative InstrumentsNote 13 Deferred Payment Obligation Receivable As At December 31 2017 2016 $ Thousands Deferred Payment Receivable 175,000 -Note 13 Deferred Payment Obligation ReceivableNote 14 Property, Plant and Equipment, NetNote 14 Property, Plant and Equipment, Net (cont D)Note 15 Intangible Assets, NetNote 15 Intangible Assets, Net (cont D)Note 16 Loans and DebenturesNote 16 Loans and Debentures (cont D)Note 17 Trade PayablesNote 18 Other Payables Including Derivative InstrumentsNote 19 - Guarantee Deposits From CustomersNote 20 ProvisionsNote 21 Contingent Liabilities, Commitments and ConcessionsNote 21 Contingent Liabilities, Commitments and Concessions (cont D)Note 22 Share Capital and ReservesNote 23 Opc Energy Ltd S Initial Public OfferingNote 24 Cost Of Sales and ServicesNote 25 Selling, General and Administrative ExpensesNote 26 Financing Income (expenses), NetNote 27 Income TaxesNote 27 Income Taxes (cont D)Note 28 Earnings Per ShareNote 29 Discontinued OperationsNote 30 Segment, Customer and Geographic InformationNote 30 Segment, Customer and Geographic Information (cont D)Note 31 Related-party InformationNote 31 Related-party Information (cont D)Note 32 Financial InstrumentsNote 32 Financial Instruments (cont D)Note 33 Subsequent EventsNote 33 Subsequent Events (cont D)