KEYCORP /NEW/
10-Ks and 10-Qs
|
|
|
|
|
|
|
|
|
|
|
|
|
|
|
|
|
|
|
|
|
|
|
|
|
|
|
|
|
|
|
|
|
|
|
|
|
|
|
|
|
|
|
|
|
|
|
|
|
|
|
|
|
|
|
|
UNITED STATES
SECURITIES AND EXCHANGE COMMISSION
Washington D.C. 20549
FORM 10-Q
QUARTERLY REPORT PURSUANT TO SECTION 13 OR 15(d)
OF THE SECURITIES EXCHANGE ACT OF 1934
For the Quarterly Period Ended
March 31, 2018
Commission File Number 001-11302

Exact name of registrant as specified in its charter:
|
Ohio
|
34-6542451
|
|
State or other jurisdiction of incorporation or organization:
|
I.R.S. Employer Identification Number:
|
|
127 Public Square, Cleveland, Ohio
|
44114-1306
|
|
Address of principal executive offices:
|
Zip Code:
|
(216) 689-3000
Registrant’s telephone number, including area code:
Indicate by check mark whether the registrant (1) has filed all reports required to be filed by Section 13 or 15(d) of the Securities Exchange Act of 1934 during the preceding 12 months (or for such shorter period that the registrant was required to file such reports), and (2) has been subject to such filing requirements for the past 90 days. Yes
☒
No
☐
Indicate by check mark whether the registrant has submitted electronically and posted on its corporate Web site, if any, every Interactive Data File required to be submitted and posted pursuant to Rule 405 of Regulation S-T (§232.405 of this chapter) during the preceding 12 months (or for such shorter period that the registrant was required to submit and post such files). Yes
☒
No
☐
Indicate by check mark whether the registrant is a large accelerated filer, an accelerated filer, a non-accelerated filer, smaller reporting company, or an emerging growth company. See the definitions of “large accelerated filer,” “accelerated filer,” “smaller reporting company,” and “emerging growth company” in Rule 12b-2 of the Exchange Act. (Check one):
|
Large accelerated filer
|
☒
|
Accelerated filer
|
☐
|
|
Non-accelerated filer
|
☐ (Do not check if a smaller reporting company)
|
Smaller reporting company
|
☐
|
|
Emerging growth company
|
☐
|
||
If an emerging growth company, indicate by check mark if the registrant has elected not to use the extended transition period for complying with any new or revised financial accounting standards provided pursuant to Section 13(a) of the Exchange Act. ☐
Indicate by check mark whether the registrant is a shell company (as defined in Rule 12b-2 of the Exchange Act). Yes ☐ No ☒
Indicate the number of shares outstanding of each of the issuer’s classes of common stock, as of the latest practicable date.
|
Common Shares with a par value of $1 each
|
1,061,663,471 shares
|
|
Title of class
|
Outstanding at April 30, 2018
|
KEYCORP
TABLE OF CONTENTS
PART I. FINANCIAL INFORMATION
|
|
|
Page Number
|
|
Item 1.
|
||
2
|
Item 2.
|
||
|
Item 3.
|
||
|
Item 4.
|
||
|
PART II. OTHER INFORMATION
|
||
|
Item 1.
|
||
|
Item 1A.
|
||
|
Item 2.
|
||
|
Item 6.
|
||
3
Introduction
This section reviews the financial condition and results of operations of KeyCorp and its subsidiaries for the quarterly periods ended
March 31, 2018
, and
March 31, 2017
. Some tables may include additional periods to comply with disclosure requirements or to illustrate trends in greater depth. When you read this discussion, you should also refer to the consolidated financial statements and related notes in this report. The page locations of specific sections and notes that we refer to are presented in the Table of Contents.
References to our “
2017
Form 10-K” refer to our Form 10-K for the year ended
December 31, 2017
, which has been filed with the SEC and is available on its website (
www.sec.gov
) and on our website (
www.key.com/ir
).
Terminology
Throughout this discussion, references to “Key,” “we,” “our,” “us,” and similar terms refer to the consolidated entity consisting of KeyCorp and its subsidiaries. “KeyCorp” refers solely to the parent holding company, and “KeyBank” refers to KeyCorp’s subsidiary bank, KeyBank National Association.
We want to explain some industry-specific terms at the outset so you can better understand the discussion that follows.
|
•
|
We use the phrase
continuing operations
in this document to mean all of our businesses other than the education lending business and Austin. The education lending business and Austin have been accounted for as
discontinued operations
since 2009.
|
|
•
|
Our
exit loan portfolios
are separate from our
discontinued operations
. These portfolios, which are in a run-off mode, stem from product lines we decided to cease because they no longer fit with our corporate strategy. These exit loan portfolios are included in
Other Segments.
|
|
•
|
We engage in
capital markets activities
primarily through business conducted by our Key Corporate Bank segment
.
These activities encompass a variety of products and services. Among other things, we trade securities as a dealer, enter into derivative contracts (both to accommodate clients’ financing needs and to mitigate certain risks), and conduct transactions in foreign currencies (both to accommodate clients’ needs and to benefit from fluctuations in exchange rates).
|
|
•
|
For regulatory purposes, capital is divided into two classes. Federal regulations currently prescribe that at least one-half of a bank or BHC’s
total risk-based capital
must qualify as
Tier 1 capital
. Both total and Tier 1 capital serve as bases for several measures of capital adequacy, which is an important indicator of financial stability and condition. As described under the heading “Regulatory capital requirements – Capital planning and stress testing” in the section entitled “Supervision and Regulation” that begins on page 8 of our
2017
Form 10-K, the regulators are required to conduct a supervisory capital assessment of all BHCs with assets of at least $50 billion, including KeyCorp. As part of this capital adequacy review, banking regulators evaluate a component of Tier 1 capital, known as
Common Equity Tier 1
, under the
Regulatory Capital Rules
. The “Capital” section of this report under the heading “Capital adequacy” provides more information on total capital, Tier 1 capital, and the Regulatory Capital Rules, including Common Equity Tier 1, and describes how these measures are calculated.
|
4
The acronyms and abbreviations identified below are used in the Management’s Discussion & Analysis of Financial Condition & Results of Operations as well as in the Notes to Consolidated Financial Statements (Unaudited). You may find it helpful to refer back to this page as you read this report.
|
ALCO: Asset/Liability Management Committee.
|
KAHC: Key Affordable Housing Corporation.
|
|
ALLL: Allowance for loan and lease losses.
|
KBCM: KeyBanc Capital Markets, Inc.
|
|
A/LM: Asset/liability management.
|
KCC: Key Capital Corporation.
|
|
AOCI: Accumulated other comprehensive income (loss).
|
KCDC: Key Community Development Corporation.
|
|
APBO: Accumulated postretirement benefit obligation.
|
KEF: Key Equipment Finance.
|
|
ASC: Accounting Standards Codification.
|
KMS: Key Merchant Services, LLC.
|
|
Austin: Austin Capital Management, Ltd.
|
KPP: Key Principal Partners.
|
|
BHCs: Bank holding companies.
|
KREEC: Key Real Estate Equity Capital, Inc.
|
|
Board: KeyCorp Board of Directors.
|
LCR: Liquidity coverage ratio.
|
|
Cain Brothers: Cain Brothers & Company, LLC.
|
LIBOR: London Interbank Offered Rate.
|
|
CCAR: Comprehensive Capital Analysis and Review.
|
LIHTC: Low-income housing tax credit.
|
|
CMBS: Commercial mortgage-backed securities.
|
LTV: Loan-to-value.
|
|
CME: Chicago Mercantile Exchange.
|
Moody’s: Moody’s Investor Services, Inc.
|
|
CMO: Collateralized mortgage obligation.
|
MRM: Market Risk Management group.
|
|
Common Shares: KeyCorp common shares, $1 par value.
|
N/A: Not applicable.
|
|
DIF: Deposit Insurance Fund of the FDIC.
|
NASDAQ: The NASDAQ Stock Market LLC.
|
|
Dodd-Frank Act: Dodd-Frank Wall Street Reform and
|
NAV: Net asset value.
|
|
Consumer Protection Act of 2010.
|
N/M: Not meaningful.
|
|
EBITDA: Earnings before interest, taxes, depreciation, and
|
NOW: Negotiable Order of Withdrawal.
|
|
amortization.
|
NPR: Notice of proposed rulemaking.
|
|
EPS: Earnings per share.
|
NYSE: New York Stock Exchange.
|
|
ERISA: Employee Retirement Income Security Act of 1974.
|
OCC: Office of the Comptroller of the Currency.
|
|
ERM: Enterprise risk management.
|
OCI: Other comprehensive income (loss).
|
|
EVE: Economic value of equity.
|
OREO: Other real estate owned.
|
|
FASB: Financial Accounting Standards Board.
|
OTTI: Other-than-temporary impairment.
|
|
FDIC: Federal Deposit Insurance Corporation.
|
PBO: Projected benefit obligation.
|
|
Federal Reserve: Board of Governors of the Federal
|
PCI: Purchased credit impaired.
|
|
Reserve System.
|
S&P: Standard and Poor’s Ratings Services,
|
|
FHLB: Federal Home Loan Bank of Cincinnati.
|
a Division of The McGraw-Hill Companies, Inc.
|
|
FHLMC: Federal Home Loan Mortgage Corporation.
|
SEC: U.S. Securities and Exchange Commission.
|
|
FICO: Fair Isaac Corporation.
|
Series A Preferred Stock: KeyCorp’s 7.750%
|
|
First Niagara: First Niagara Financial Group, Inc.
|
Noncumulative Perpetual Convertible Preferred
|
|
(NASDAQ: FNFG).
|
Stock, Series A.
|
|
FNMA: Federal National Mortgage Association, or Fannie
|
TCJ Act: Tax Cuts and Jobs Act.
|
|
Mae.
|
TDR: Troubled debt restructuring.
|
|
FSOC: Financial Stability Oversight Council.
|
TE: Taxable-equivalent.
|
|
GAAP: U.S. generally accepted accounting principles.
|
U.S. Treasury: United States Department of the
|
|
GNMA: Government National Mortgage Association, or
|
Treasury.
|
|
Ginnie Mae.
|
VaR: Value at risk.
|
|
HelloWallet: HelloWallet, LLC.
|
VEBA: Voluntary Employee Beneficiary Association.
|
|
ISDA: International Swaps and Derivatives Association.
|
VIE: Variable interest entity.
|
Forward-looking statements
From time to time, we have made or will make forward-looking statements within the meaning of the Private Securities Litigation Reform Act of 1995. These statements do not relate strictly to historical or current facts. Forward-looking statements usually can be identified by the use of words such as “goal,” “objective,” “plan,” “expect,” “assume,” “anticipate,” “intend,” “project,” “believe,” “estimate,” or other words of similar meaning. Forward-looking statements provide our current expectations or forecasts of future events, circumstances, results or aspirations. Our disclosures in this report contain forward-looking statements. We may also make forward-looking
5
statements in other documents filed with or furnished to the SEC. In addition, we may make forward-looking statements orally to analysts, investors, representatives of the media, and others.
Forward-looking statements, by their nature, are subject to assumptions, risks, and uncertainties, many of which are outside of our control. Our actual results may differ materially from those set forth in our forward-looking statements. There is no assurance that any list of risks and uncertainties or risk factors is complete. Factors that could cause our actual results to differ from those described in forward-looking statements include, but are not limited to:
|
•
|
deterioration of commercial real estate market fundamentals;
|
|
•
|
defaults by our loan counterparties or clients;
|
|
•
|
adverse changes in credit quality trends;
|
|
•
|
declining asset prices;
|
|
•
|
our concentrated credit exposure in commercial and industrial loans;
|
|
•
|
the extensive regulation of the U.S. financial services industry;
|
|
•
|
changes in accounting policies, standards, and interpretations;
|
|
•
|
operational or risk management failures by us or critical third parties;
|
|
•
|
breaches of security or failures of our technology systems due to technological or other factors and cybersecurity threats;
|
|
•
|
negative outcomes from claims or litigation;
|
|
•
|
failure or circumvention of our controls and procedures;
|
|
•
|
the occurrence of natural or man-made disasters, conflicts, or terrorist attacks, or other adverse external events;
|
|
•
|
evolving capital and liquidity standards under applicable regulatory rules;
|
|
•
|
disruption of the U.S. financial system;
|
|
•
|
our ability to receive dividends from our subsidiary, KeyBank;
|
|
•
|
unanticipated changes in our liquidity position, including but not limited to, changes in our access to or the cost of funding and our ability to secure alternative funding sources;
|
|
•
|
downgrades in our credit ratings or those of KeyBank;
|
|
•
|
a reversal of the U.S. economic recovery due to financial, political or other shocks;
|
|
•
|
our ability to anticipate interest rate changes and manage interest rate risk;
|
|
•
|
deterioration of economic conditions in the geographic regions where we operate;
|
|
•
|
the soundness of other financial institutions;
|
|
•
|
tax reform and other changes in tax laws, including the impact of the TCJ Act;
|
|
•
|
our ability to attract and retain talented executives and employees and to manage our reputational risks;
|
|
•
|
our ability to timely and effectively implement our strategic initiatives;
|
|
•
|
increased competitive pressure from banks and non-banks;
|
|
•
|
our ability to adapt our products and services to industry standards and consumer preferences;
|
|
•
|
unanticipated adverse effects of strategic partnerships or acquisitions and dispositions of assets or businesses;
|
|
•
|
our ability to realize the anticipated benefits of the First Niagara merger; and
|
|
•
|
our ability to develop and effectively use the quantitative models we rely upon in our business planning.
|
Any forward-looking statements made by us or on our behalf speak only as of the date they are made, and we do not undertake any obligation to update any forward-looking statement to reflect the impact of subsequent events or circumstances. Before making an investment decision, you should carefully consider all risks and uncertainties disclosed in our SEC filings, including this report on Form 10-Q and our subsequent reports on Forms 8-K, 10-Q, and 10-K and our registration statements under the Securities Act of 1933, as amended, all of which are or will upon filing be accessible on the SEC’s website at www.sec.gov and on our website at www.key.com/ir.
6
Selected financial data
Our financial performance for each of the last five quarters is summarized in Figure
1
.
Figure 1. Selected Financial Data
|
2018
|
2017
|
|||||||||||||||
|
dollars in millions, except per share amounts
|
First
|
|
Fourth
|
|
Third
|
|
Second
|
|
First
|
|
||||||
|
FOR THE PERIOD
|
||||||||||||||||
|
Interest income
|
$
|
1,137
|
|
$
|
1,114
|
|
$
|
1,109
|
|
$
|
1,117
|
|
$
|
1,050
|
|
|
|
Interest expense
|
193
|
|
176
|
|
161
|
|
144
|
|
132
|
|
||||||
|
Net interest income
|
944
|
|
938
|
|
948
|
|
973
|
|
918
|
|
||||||
|
Provision for credit losses
|
61
|
|
49
|
|
51
|
|
66
|
|
63
|
|
||||||
|
Noninterest income
|
601
|
|
656
|
|
592
|
|
653
|
|
577
|
|
||||||
|
Noninterest expense
|
1,006
|
|
1,098
|
|
992
|
|
995
|
|
1,013
|
|
||||||
|
Income (loss) from continuing operations before income taxes
|
478
|
|
447
|
|
497
|
|
565
|
|
419
|
|
||||||
|
Income (loss) from continuing operations attributable to Key
|
416
|
|
195
|
|
363
|
|
407
|
|
324
|
|
||||||
|
Income (loss) from discontinued operations, net of taxes
|
2
|
|
1
|
|
1
|
|
5
|
|
—
|
|
||||||
|
Net income (loss) attributable to Key
|
418
|
|
196
|
|
364
|
|
412
|
|
324
|
|
||||||
|
Income (loss) from continuing operations attributable to Key common shareholders
|
402
|
|
181
|
|
349
|
|
393
|
|
296
|
|
||||||
|
Income (loss) from discontinued operations, net of taxes
|
2
|
|
1
|
|
1
|
|
5
|
|
—
|
|
||||||
|
Net income (loss) attributable to Key common shareholders
|
404
|
|
182
|
|
350
|
|
398
|
|
296
|
|
||||||
|
PER COMMON SHARE
|
||||||||||||||||
|
Income (loss) from continuing operations attributable to Key common shareholders
|
$
|
.38
|
|
$
|
.17
|
|
$
|
.32
|
|
$
|
.36
|
|
$
|
.28
|
|
|
|
Income (loss) from discontinued operations, net of taxes
|
—
|
|
—
|
|
—
|
|
—
|
|
—
|
|
||||||
|
Net income (loss) attributable to Key common shareholders
(a)
|
.38
|
|
.17
|
|
.32
|
|
.37
|
|
.28
|
|
||||||
|
Income (loss) from continuing operations attributable to Key common shareholders —
assuming dilution
|
.38
|
|
.17
|
|
.32
|
|
.36
|
|
.27
|
|
||||||
|
Income (loss) from discontinued operations, net of taxes — assuming dilution
|
—
|
|
—
|
|
—
|
|
—
|
|
—
|
|
||||||
|
Net income (loss) attributable to Key common shareholders — assuming dilution
(a)
|
.38
|
|
.17
|
|
.32
|
|
.36
|
|
.27
|
|
||||||
|
Cash dividends paid
|
.105
|
|
.105
|
|
.095
|
|
.095
|
|
.085
|
|
||||||
|
Book value at period end
|
13.07
|
|
13.09
|
|
13.18
|
|
13.02
|
|
12.71
|
|
||||||
|
Tangible book value at period end
|
10.35
|
|
10.35
|
|
10.52
|
|
10.40
|
|
10.21
|
|
||||||
|
Market price:
|
||||||||||||||||
|
High
|
22.15
|
|
20.44
|
|
19.37
|
|
19.10
|
|
19.53
|
|
||||||
|
Low
|
19.04
|
|
17.64
|
|
16.47
|
|
16.91
|
|
16.54
|
|
||||||
|
Close
|
19.55
|
|
20.17
|
|
18.82
|
|
18.74
|
|
17.78
|
|
||||||
|
Weighted-average common shares outstanding (000)
|
1,056,037
|
|
1,062,348
|
|
1,073,390
|
|
1,076,203
|
|
1,068,609
|
|
||||||
|
Weighted-average common shares and potential common shares outstanding (000)
(b)
|
1,071,786
|
|
1,079,330
|
|
1,088,841
|
|
1,093,039
|
|
1,086,540
|
|
||||||
|
AT PERIOD END
|
||||||||||||||||
|
Loans
|
$
|
88,089
|
|
$
|
86,405
|
|
$
|
86,492
|
|
$
|
86,503
|
|
$
|
86,125
|
|
|
|
Earning assets
|
122,961
|
|
123,490
|
|
122,625
|
|
121,243
|
|
120,261
|
|
||||||
|
Total assets
|
137,049
|
|
137,698
|
|
136,733
|
|
135,824
|
|
134,476
|
|
||||||
|
Deposits
|
104,751
|
|
105,235
|
|
103,446
|
|
102,821
|
|
103,982
|
|
||||||
|
Long-term debt
|
13,749
|
|
14,333
|
|
15,100
|
|
13,261
|
|
12,324
|
|
||||||
|
Key common shareholders’ equity
|
13,919
|
|
13,998
|
|
14,224
|
|
14,228
|
|
13,951
|
|
||||||
|
Key shareholders’ equity
|
14,944
|
|
15,023
|
|
15,249
|
|
15,253
|
|
14,976
|
|
||||||
|
PERFORMANCE RATIOS — FROM CONTINUING OPERATIONS
|
||||||||||||||||
|
Return on average total assets
|
1.25
|
%
|
.57
|
%
|
1.07
|
%
|
1.23
|
%
|
.99
|
%
|
||||||
|
Return on average common equity
|
11.76
|
|
5.04
|
|
9.74
|
|
11.12
|
|
8.76
|
|
||||||
|
Return on average tangible common equity
(c)
|
14.89
|
|
6.35
|
|
12.21
|
|
13.80
|
|
10.98
|
|
||||||
|
Net interest margin (TE)
|
3.15
|
|
3.09
|
|
3.15
|
|
3.30
|
|
3.13
|
|
||||||
|
Cash efficiency ratio
(c)
|
62.9
|
|
66.7
|
|
62.2
|
|
59.3
|
|
65.8
|
|
||||||
|
PERFORMANCE RATIOS — FROM CONSOLIDATED OPERATIONS
|
||||||||||||||||
|
Return on average total assets
|
1.24
|
%
|
.57
|
%
|
1.06
|
%
|
1.23
|
%
|
.98
|
%
|
||||||
|
Return on average common equity
|
11.82
|
|
5.07
|
|
9.77
|
|
11.26
|
|
8.76
|
|
||||||
|
Return on average tangible common equity
(c)
|
14.97
|
|
6.39
|
|
12.25
|
|
13.98
|
|
10.98
|
|
||||||
|
Net interest margin (TE)
|
3.13
|
|
3.07
|
|
3.13
|
|
3.28
|
|
3.11
|
|
||||||
|
Loan-to-deposit
(d)
|
86.9
|
|
84.4
|
|
86.2
|
|
87.2
|
|
85.6
|
|
||||||
|
CAPITAL RATIOS AT PERIOD END
|
||||||||||||||||
|
Key shareholders’ equity to assets
|
10.90
|
%
|
10.91
|
%
|
11.15
|
%
|
11.23
|
%
|
11.14
|
%
|
||||||
|
Key common shareholders’ equity to assets
|
10.16
|
|
10.17
|
|
10.40
|
|
10.48
|
|
10.37
|
|
||||||
|
Tangible common equity to tangible assets
(c)
|
8.22
|
|
8.23
|
|
8.49
|
|
8.56
|
|
8.51
|
|
||||||
|
Common Equity Tier 1
|
9.99
|
|
10.16
|
|
10.26
|
|
9.91
|
|
9.91
|
|
||||||
|
Tier 1 risk-based capital
|
10.82
|
|
11.01
|
|
11.11
|
|
10.73
|
|
10.74
|
|
||||||
|
Total risk-based capital
|
12.73
|
|
12.92
|
|
13.09
|
|
12.64
|
|
12.69
|
|
||||||
|
Leverage
|
9.76
|
|
9.73
|
|
9.83
|
|
9.95
|
|
9.81
|
|
||||||
|
TRUST ASSETS
|
||||||||||||||||
|
Assets under management
|
$
|
39,003
|
|
$
|
39,588
|
|
$
|
38,660
|
|
$
|
37,613
|
|
$
|
37,417
|
|
|
|
OTHER DATA
|
||||||||||||||||
|
Average full-time-equivalent employees
|
18,540
|
|
18,379
|
|
18,548
|
|
18,344
|
|
18,386
|
|
||||||
|
Branches
|
1,192
|
|
1,197
|
|
1,208
|
|
1,210
|
|
1,216
|
|
||||||
|
(a)
|
EPS may not foot due to rounding.
|
|
(b)
|
Assumes conversion of Common Share options and other stock awards as applicable.
|
|
(c)
|
See Figure
2
entitled “
GAAP to Non-GAAP Reconciliations
,” which presents the computations of certain financial measures related to “tangible common equity” and “cash efficiency.” The table reconciles the GAAP performance measures to the corresponding non-GAAP measures, which provides a basis for period-to-period comparisons.
|
|
(d)
|
Represents period-end consolidated total loans and loans held for sale divided by period-end consolidated total deposits.
|
7
Figure
2
presents certain non-GAAP financial measures related to “tangible common equity,” “return on tangible common equity,” “cash efficiency ratio,” certain financial measures excluding notable items, and “Common Equity Tier 1 under the Regulatory Capital Rules (estimates).”
Notable items include certain revenue or expense items that may occur in a reporting period which management does not consider indicative of ongoing financial performance. Management believes it is useful to consider certain financial metrics with and without merger-related charges and/or other notable items in order to enable a better understanding of Company results, increase comparability of period-to-period results, and to evaluate and forecast those results.
The tangible common equity ratio and the return on tangible common equity ratio have been a focus for some investors, and management believes that these ratios may assist investors in analyzing Key’s capital position without regard to the effects of intangible assets and preferred stock. Since analysts and banking regulators may assess our capital adequacy using tangible common equity, we believe it is useful to enable investors to assess our capital adequacy on these same bases. Figure
2
reconciles the GAAP performance measures to the corresponding non-GAAP measures.
Beginning in the first quarter of 2018, we no longer separately report merger-related charges. Prior to that, we reported merger-related charges as a result of our purchase of First Niagara on August 1, 2016. The definitive agreement and plan of merger to acquire First Niagara was originally announced on October 30, 2015. For every quarter of 2017, merger-related charges are included in the total for "notable items." The table below shows the computation of return on average tangible common equity excluding notable items, pre-provision net revenue excluding notable items, cash efficiency ratio excluding notable items, and return on average assets from continuing operations excluding notable items. Management believes that eliminating the effects of the merger-related charges and other notable items made it easier to analyze the results by presenting them on a more comparable basis.
Figure
2
also shows the computation for and reconciliation of pre-provision net revenue, which is not formally
defined by GAAP. We believe that eliminating the effects of the provision for credit losses makes it easier to analyze
our results by presenting them on a more comparable basis.
The cash efficiency ratio is a ratio of two non-GAAP performance measures. Accordingly, there is no directly comparable GAAP performance measure. The cash efficiency ratio excludes the impact of our intangible asset amortization from the calculation. We also disclose the cash efficiency ratio excluding notable items. We believe these ratios provide greater consistency and comparability between our results and those of our peer banks. Additionally, these ratios are used by analysts and investors as they develop earnings forecasts and peer bank analysis.
Non-GAAP financial measures have inherent limitations, are not required to be uniformly applied, and are not audited. Although these non-GAAP financial measures are frequently used by investors to evaluate a company, they have limitations as analytical tools, and should not be considered in isolation, nor as a substitute for analyses of results as reported under GAAP.
8
Figure 2. GAAP to Non-GAAP Reconciliations
|
|
Three months ended
|
|||||||||||||||
|
dollars in millions
|
3/31/2018
|
12/31/2017
|
9/30/2017
|
6/30/2017
|
3/31/2017
|
|||||||||||
|
Tangible common equity to tangible assets at period-end
|
||||||||||||||||
|
Key shareholders’ equity (GAAP)
|
$
|
14,944
|
|
$
|
15,023
|
|
$
|
15,249
|
|
$
|
15,253
|
|
$
|
14,976
|
|
|
|
Less:
|
Intangible assets
(a)
|
2,902
|
|
2,928
|
|
2,870
|
|
2,866
|
|
2,751
|
|
|||||
|
Preferred Stock
(b)
|
1,009
|
|
1,009
|
|
1,009
|
|
1,009
|
|
1,009
|
|
||||||
|
Tangible common equity (non-GAAP)
|
$
|
11,033
|
|
$
|
11,086
|
|
$
|
11,370
|
|
$
|
11,378
|
|
$
|
11,216
|
|
|
|
Total assets (GAAP)
|
$
|
137,049
|
|
$
|
137,698
|
|
$
|
136,733
|
|
$
|
135,824
|
|
$
|
134,476
|
|
|
|
Less:
|
Intangible assets
(a)
|
2,902
|
|
2,928
|
|
2,870
|
|
2,866
|
|
2,751
|
|
|||||
|
Tangible assets (non-GAAP)
|
$
|
134,147
|
|
$
|
134,770
|
|
$
|
133,863
|
|
$
|
132,958
|
|
$
|
131,725
|
|
|
|
Tangible common equity to tangible assets ratio (non-GAAP)
|
8.22
|
%
|
8.23
|
%
|
8.49
|
%
|
8.56
|
%
|
8.51
|
%
|
||||||
|
Notable items
|
||||||||||||||||
|
Merger-related charges
|
—
|
|
$
|
(56
|
)
|
$
|
(36
|
)
|
$
|
(44
|
)
|
$
|
(81
|
)
|
||
|
Impacts of tax reform and related actions
|
—
|
|
(30
|
)
|
—
|
|
—
|
|
—
|
|
||||||
|
Merchant services gain
|
—
|
|
—
|
|
(5
|
)
|
64
|
|
—
|
|
||||||
|
Purchase accounting finalization, net
|
—
|
|
—
|
|
—
|
|
43
|
|
—
|
|
||||||
|
Charitable contribution
|
—
|
|
—
|
|
—
|
|
(20
|
)
|
—
|
|
||||||
|
Total notable items
|
—
|
|
$
|
(86
|
)
|
$
|
(41
|
)
|
$
|
43
|
|
$
|
(81
|
)
|
||
|
Income taxes
|
—
|
|
(26
|
)
|
(13
|
)
|
16
|
|
(30
|
)
|
||||||
|
Reevaluation of certain tax related assets
|
—
|
|
147
|
|
—
|
|
—
|
|
—
|
|
||||||
|
Total notable items after tax
|
—
|
|
$
|
(207
|
)
|
$
|
(28
|
)
|
$
|
27
|
|
$
|
(51
|
)
|
||
|
Average tangible common equity
|
||||||||||||||||
|
Average Key shareholders’ equity (GAAP)
|
$
|
14,889
|
|
$
|
15,268
|
|
$
|
15,241
|
|
$
|
15,200
|
|
$
|
15,184
|
|
|
|
Less:
|
Intangible assets (average)
(c)
|
2,916
|
|
2,939
|
|
2,878
|
|
2,756
|
|
2,772
|
|
|||||
|
Preferred Stock (average)
|
1,025
|
|
1,025
|
|
1,025
|
|
1,025
|
|
1,480
|
|
||||||
|
Average tangible common equity (non-GAAP)
|
$
|
10,948
|
|
$
|
11,304
|
|
$
|
11,338
|
|
$
|
11,419
|
|
$
|
10,932
|
|
|
|
Return on average tangible common equity from continuing operations
|
||||||||||||||||
|
Net income (loss) from continuing operations attributable to Key common shareholders (GAAP)
|
$
|
402
|
|
$
|
181
|
|
$
|
349
|
|
$
|
393
|
|
$
|
296
|
|
|
|
Plus:
|
Notable items, after tax
|
—
|
|
207
|
|
28
|
|
(27
|
)
|
51
|
|
|||||
|
Net income (loss) from continuing operations attributable to Key common shareholders after notable items (non-GAAP)
|
$
|
402
|
|
$
|
388
|
|
$
|
377
|
|
$
|
366
|
|
$
|
347
|
|
|
|
Average tangible common equity (non-GAAP)
|
10,948
|
|
11,304
|
|
11,338
|
|
11,419
|
|
10,932
|
|
||||||
|
Return on average tangible common equity from continuing operations (non-GAAP)
|
14.89
|
%
|
6.35
|
%
|
12.21
|
%
|
13.80
|
%
|
10.98
|
%
|
||||||
|
Return on average tangible common equity from continuing operations excluding notable items (non-GAAP)
|
14.89
|
|
13.62
|
|
13.19
|
|
12.86
|
|
12.87
|
|
||||||
|
Return on average tangible common equity consolidated
|
||||||||||||||||
|
Net income (loss) attributable to Key common shareholders (GAAP)
|
$
|
404
|
|
$
|
182
|
|
$
|
350
|
|
$
|
398
|
|
$
|
296
|
|
|
|
Average tangible common equity (non-GAAP)
|
10,948
|
|
11,304
|
|
11,338
|
|
11,419
|
|
10,932
|
|
||||||
|
Return on average tangible common equity consolidated (non-GAAP)
|
14.97
|
%
|
6.39
|
%
|
12.25
|
%
|
13.98
|
%
|
10.98
|
%
|
||||||
|
Pre-provision net revenue
|
||||||||||||||||
|
Net interest income (GAAP)
|
$
|
944
|
|
$
|
938
|
|
$
|
948
|
|
$
|
973
|
|
$
|
918
|
|
|
|
Plus:
|
Taxable-equivalent adjustment
|
8
|
|
14
|
|
14
|
|
14
|
|
11
|
|
|||||
|
Noninterest income (GAAP)
|
601
|
|
656
|
|
592
|
|
653
|
|
577
|
|
||||||
|
Less:
|
Noninterest expense (GAAP)
|
1,006
|
|
1,098
|
|
992
|
|
995
|
|
1,013
|
|
|||||
|
Pre-provision net revenue from continuing operations (non-GAAP)
|
$
|
547
|
|
$
|
510
|
|
$
|
562
|
|
$
|
645
|
|
$
|
493
|
|
|
|
Plus:
|
Notable items
|
—
|
|
86
|
|
41
|
|
(43
|
)
|
81
|
|
|||||
|
Pre-provision net revenue from continuing operations excluding notable items (non-GAAP)
|
547
|
|
596
|
|
603
|
|
602
|
|
574
|
|
||||||
|
Cash efficiency ratio
|
||||||||||||||||
|
Noninterest expense (GAAP)
|
$
|
1,006
|
|
$
|
1,098
|
|
$
|
992
|
|
$
|
995
|
|
$
|
1,013
|
|
|
|
Less:
|
Intangible asset amortization
|
29
|
|
26
|
|
25
|
|
22
|
|
22
|
|
|||||
|
Adjusted noninterest expense (non-GAAP)
|
$
|
977
|
|
$
|
1,072
|
|
$
|
967
|
|
$
|
973
|
|
$
|
991
|
|
|
|
Less:
|
Notable items
|
—
|
|
85
|
|
36
|
|
60
|
|
81
|
|
|||||
|
Adjusted noninterest expense excluding notable items (non-GAAP)
|
$
|
977
|
|
$
|
987
|
|
$
|
931
|
|
$
|
913
|
|
$
|
910
|
|
|
|
Net interest income (GAAP)
|
$
|
944
|
|
$
|
938
|
|
$
|
948
|
|
$
|
973
|
|
$
|
918
|
|
|
|
Plus:
|
Taxable-equivalent adjustment
|
8
|
|
14
|
|
14
|
|
14
|
|
11
|
|
|||||
|
Noninterest income (GAAP)
|
601
|
|
656
|
|
592
|
|
653
|
|
577
|
|
||||||
|
Total taxable-equivalent revenue (non-GAAP)
|
$
|
1,553
|
|
$
|
1,608
|
|
$
|
1,554
|
|
$
|
1,640
|
|
$
|
1,506
|
|
|
|
Plus:
|
Notable items
|
—
|
|
1
|
|
5
|
|
(103
|
)
|
—
|
|
|||||
|
Adjusted noninterest income excluding notable items (non-GAAP)
|
$
|
1,553
|
|
$
|
1,609
|
|
$
|
1,559
|
|
$
|
1,537
|
|
$
|
1,506
|
|
|
|
Cash efficiency ratio (non-GAAP)
|
62.9
|
%
|
66.7
|
%
|
62.2
|
%
|
59.3
|
%
|
65.8
|
%
|
||||||
|
Cash efficiency ratio excluding notable items (non-GAAP)
|
62.9
|
|
61.3
|
|
59.7
|
|
59.4
|
|
60.4
|
|
||||||
|
Return on average total assets from continuing operations excluding notable items
|
||||||||||||||||
|
Income from continuing operations attributable to Key (GAAP)
|
$
|
416
|
|
$
|
195
|
|
$
|
363
|
|
$
|
407
|
|
$
|
324
|
|
|
|
Plus:
|
Notable items, after tax
|
—
|
|
207
|
|
28
|
|
(27
|
)
|
51
|
|
|||||
|
Income from continuing operations attributable to Key excluding notable items, after tax (non-GAAP)
|
$
|
416
|
|
$
|
402
|
|
$
|
391
|
|
$
|
380
|
|
$
|
375
|
|
|
|
Average total assets from continuing operations (GAAP)
|
$
|
134,915
|
|
$
|
135,255
|
|
$
|
134,356
|
|
$
|
132,491
|
|
$
|
132,741
|
|
|
|
Return on average total assets from continuing operations excluding notable items (non-GAAP)
|
1.25
|
%
|
1.18
|
%
|
1.15
|
%
|
1.15
|
%
|
1.15
|
%
|
||||||
9
Figure 2. GAAP to Non-GAAP Reconciliations
, continued
|
dollars in millions
|
Three months ended March 31, 2018
|
||
|
Common Equity Tier 1 under the Regulatory Capital Rules (estimates)
|
|||
|
Common Equity Tier 1 under current Regulatory Capital Rules
|
$
|
12,086
|
|
|
Adjustments from current Regulatory Capital Rules to the fully phased-in Regulatory Capital Rules:
|
|||
|
Deferred tax assets and other intangible assets
(d)
|
—
|
|
|
|
Common Equity Tier 1 anticipated under the fully phased-in Regulatory Capital Rules
(e)
|
$
|
12,086
|
|
|
Net risk-weighted assets under current Regulatory Capital Rules
|
$
|
120,986
|
|
|
Adjustments from current Regulatory Capital Rules to the fully phased-in Regulatory Capital Rules:
|
|||
|
Mortgage servicing assets
(f)
|
700
|
|
|
|
All other assets
|
319
|
|
|
|
Total risk-weighted assets anticipated under the fully phased-in Regulatory Capital Rules
(e)
|
$
|
122,005
|
|
|
Common Equity Tier 1 ratio under the fully phased-in Regulatory Capital Rules
(e)
|
9.91
|
%
|
|
|
(a)
|
For the three months ended
March 31, 2018
,
December 31, 2017
,
September 30, 2017
,
June 30, 2017
, and
March 31, 2017
, intangible assets exclude
$23 million
,
$26 million
,
$30 million
,
$33 million
, and
$38 million
, respectively, of period-end purchased credit card relationships.
|
|
(b)
|
Net of capital surplus.
|
|
(c)
|
For the three months ended
March 31, 2018
,
December 31, 2017
,
September 30, 2017
,
June 30, 2017
, and
March 31, 2017
, average intangible assets exclude
$24 million
,
$28 million
,
$32 million
,
$36 million
, and
$40 million
, respectively, of average purchased credit card relationships.
|
|
(d)
|
Includes the deferred tax assets subject to future taxable income for realization, primarily tax credit carryforwards, as well as intangible assets (other than goodwill and mortgage servicing assets) subject to the transition provisions of the final rule.
|
|
(e)
|
The anticipated amount of regulatory capital and risk-weighted assets is based upon the federal banking agencies’ Regulatory Capital Rules (as fully phased-in on January 1, 2019); we are subject to the Regulatory Capital Rules under the “standardized approach.”
|
|
(f)
|
|
Long-term financial targets
Our long-term financial targets are as follows:
|
•
|
Generate positive operating leverage and a cash efficiency ratio in the range of
54.0%
to
56.0%
;
|
|
•
|
Maintain a moderate risk profile by targeting a net loan charge-offs to average loans ratio in the range of
.40%
to
.60%
; and
|
|
•
|
Achieve a return on tangible common equity ratio in the range of
15.00%
to
18.00%
.
|
Figure
3
shows the evaluation of our long-term financial targets for the
three months ended March 31, 2018
.
Figure 3. Evaluation of Our Long-Term Targets
|
Key Metrics
(a)
|
1Q18
|
|
Targets
|
|
|
Positive operating leverage
|
Cash efficiency ratio
(b)
|
62.9
|
%
|
54.0 - 56.0%
|
|
Moderate Risk Profile
|
Net loan charge-offs to average loans
|
.25
|
%
|
.40 - .60%
|
|
Financial Returns
|
Return on average tangible common equity
(b)
|
14.89
|
%
|
15.00 - 18.00%
|
|
(a)
|
Calculated from continuing operations, unless otherwise noted.
|
|
(b)
|
Non-GAAP measure; see Figure
2
entitled “
GAAP to Non-GAAP Reconciliations
” for reconciliation.
|
Strategic developments
Our actions and results during the first
three
months of
2018
supported our corporate strategy described in the “Introduction” section under the “Corporate strategy” heading on page 38 of our
2017
Form 10-K.
|
•
|
Total revenue was up 3.1% compared to the first quarter of last year driven by a higher net interest margin, solid loan growth, and strong performance from our fee-based businesses. Excluding purchase accounting accretion, net interest income was up $43 million from the first quarter of 2017, driven by higher interest rates and well-managed deposit betas. The growth in average loans for the first quarter of 2018 was primarily in our commercial and industrial portfolio which was up 6.8% from a year ago, reflecting broad-based growth in commercial and industrial loans with middle-market clients. We had a record first quarter for investment banking and debt placement fees of $143 million, an increase of 12.6% from the year-ago quarter, as we benefited from the acquisition of Cain Brothers as well as continued growth in our core franchise.
|
|
•
|
Net loan charge-offs were
.25%
of average loans for the first
three
months of
2018
, down from
.27%
for the same period one-year ago and below our targeted range. Total net loan charge-offs decreased during the first
three
months of
2018
compared to the year-ago period. Total loans charged off decreased in our commercial lease financing, home equity loan, and consumer indirect loan portfolios. Partially offsetting these decreases in loan charge-offs were increases in total loans charged off in our commercial and industrial and real estate — residential mortgage loan portfolios. Total loan loss recoveries were down slightly from the year-ago quarter.
|
10
|
•
|
Capital management remains a priority for
2018
. As previously reported, share repurchases of up to
$800 million
were included in the 2017 capital plan, which is effective through the second quarter of 2018. We completed
$199 million
of Common Share repurchases, including
$156 million
of Common Share repurchases in the open market and
$43 million
of Common Share repurchases related to employee equity compensation programs, in the
first
quarter of
2018
under this authorization.
|
|
•
|
Consistent with our 2017 capital plan, the Board declared a quarterly dividend of
$.105
per Common Share for the
first
quarter of
2018
. In the second quarter of 2018, the Board plans to consider a potential increase in our quarterly common share dividend, up to
$.12
per share.
|
|
•
|
On March 29, 2018, we announced that we had entered into a definitive agreement to sell Key Insurance & Benefits Services, Inc. to USI Insurance Services. We acquired Key Insurance & Benefits Services, Inc. as a part of the 2016 merger with First Niagara. The transaction is subject to regulatory approvals and other customary closing conditions and is expected to close in the second quarter of 2018.
|
Demographics
We have two major business segments: Key Community Bank and Key Corporate Bank.
Key Community Bank serves individuals and small to mid-sized businesses by offering a variety of deposit and investment, lending, mortgage and home equity, credit card, and personalized wealth management products and business advisory services. Key Community Bank offers personal property and casualty insurance, such as home, auto, renters, watercraft, and umbrella policies. Key Community Bank also purchases retail auto sales contracts via a network of auto dealerships. These products and services are provided through our relationship managers and specialists working in our 15-state branch network, which is organized into ten internally defined geographic regions: Washington, Oregon/Alaska, Rocky Mountains, Indiana/Northwest Ohio/Michigan, Central/Southwest Ohio, East Ohio/Western Pennsylvania, Atlantic, Western New York, Eastern New York, and New England. In addition, some of these product capabilities are delivered by Key Corporate Bank to clients of Key Community Bank.
Key Corporate Bank is a full-service corporate and investment bank focused principally on serving the needs of middle market clients in seven industry sectors: consumer, energy, healthcare, industrial, public sector, real estate, and technology. Key Corporate Bank delivers a broad suite of banking and capital markets products to its clients, including syndicated finance, debt and equity capital markets, commercial payments, equipment finance, commercial mortgage banking, derivatives, foreign exchange, financial advisory, and public finance. Key Corporate Bank is also a significant servicer of commercial mortgage loans and a significant special servicer of CMBS. Key Corporate Bank delivers many of its product capabilities to clients of Key Community Bank.
Further information regarding the products and services offered by our Key Community Bank and Key Corporate Bank segments is included in this report in Note
18
(“
Line of Business Results
”).
Supervision and regulation
The following discussion provides a summary of recent regulatory developments and should be read in conjunction with the disclosure included in our
2017
Form 10-K under the heading “Supervision and Regulation” in Item 1. Business and under the heading “II. Compliance Risk” in Item 1A. Risk Factors.
Regulatory capital requirements
The final rule to implement the Basel III international capital framework (“Basel III”) was effective January 1, 2015, with a multi-year transition period ending on December 31, 2018 (“Regulatory Capital Rules”). The Basel III capital framework and the U.S. implementation of the Basel III capital framework are discussed in more detail in Item 1. Business of our
2017
Form 10-K under the heading “Supervision and Regulation - Regulatory capital requirements.”
Under the Regulatory Capital Rules, standardized approach banking organizations, such as KeyCorp and KeyBank, are required to meet the minimum capital and leverage ratios set forth in Figure
4
below. At
March 31, 2018
, Key had an estimated Common Equity Tier 1 Capital Ratio of
9.91%
under the fully phased-in Regulatory Capital Rules. Also at
March 31, 2018
, based on the fully phased-in Regulatory Capital Rules, Key estimates that its capital and leverage ratios, after adjustment for market risk, would be as set forth in Figure
4
.
11
Figure 4. Pro Forma Ratios vs. Minimum Capital Ratios Calculated Under the Fully Phased-In Regulatory Capital Rules
|
Ratios (including capital conservation buffer)
|
Key
March 31, 2018 Pro forma |
Minimum
January 1, 2018 |
Phase-in
Period
|
Minimum
January 1, 2019
|
|||
|
Common Equity Tier 1
(a)
|
9.91
|
%
|
4.5
|
%
|
None
|
4.5
|
%
|
|
Capital conservation buffer
(b)
|
—
|
|
1/1/16-1/1/19
|
2.5
|
|
||
|
Common Equity Tier 1 + Capital conservation buffer
|
4.5
|
|
1/1/16-1/1/19
|
7.0
|
|
||
|
Tier 1 Capital
|
10.73
|
%
|
6.0
|
|
None
|
6.0
|
|
|
Tier 1 Capital + Capital conservation buffer
|
6.0
|
|
1/1/16-1/1/19
|
8.5
|
|
||
|
Total Capital
|
12.64
|
%
|
8.0
|
|
None
|
8.0
|
|
|
Total Capital + Capital conservation buffer
|
8.0
|
|
1/1/16-1/1/19
|
10.5
|
|
||
|
Leverage
(c)
|
9.76
|
%
|
4.0
|
|
None
|
4.0
|
|
|
(a)
|
See Figure
2
entitled “
GAAP to Non-GAAP Reconciliations
,” which presents the computation of Common Equity Tier 1 capital under the fully phased-in regulatory capital rules.
|
|
(b)
|
Capital conservation buffer must consist of Common Equity Tier 1 capital. As a standardized approach banking organization, KeyCorp is not subject to the countercyclical capital buffer of up to 2.5% imposed upon an advanced approaches banking organization under the Regulatory Capital Rules.
|
|
(c)
|
As a standardized approach banking organization, KeyCorp is not subject to the 3% supplemental leverage ratio requirement, which became effective January 1, 2018.
|
Revised prompt corrective action framework
The federal prompt corrective action (“PCA”) framework under the FDIA groups FDIC-insured depository institutions into one of five prompt corrective action capital categories: “well capitalized,” “adequately capitalized,” “undercapitalized,” “significantly undercapitalized,” and “critically undercapitalized.” In addition to implementing the Basel III capital framework in the United States, the Regulatory Capital Rules also revised the prompt corrective action capital category threshold ratios applicable to FDIC-insured depository institutions such as KeyBank, with an effective date of January 1, 2015. The revised Prompt Corrective Action Framework table in Figure
5
identifies the capital category thresholds for a “well capitalized” and an “adequately capitalized” institution under the Prompt Corrective Action Framework.
Figure 5. "Well Capitalized" and "Adequately Capitalized" Capital Category Ratios under Revised PCA Framework
|
Prompt Corrective Action
|
Capital Category
|
||||
|
Ratio
|
Well Capitalized
(a)
|
Adequately Capitalized
|
|||
|
Common Equity Tier 1 Risk-Based
|
6.5
|
%
|
4.5
|
%
|
|
|
Tier 1 Risk-Based
|
8.0
|
|
6.0
|
|
|
|
Total Risk-Based
|
10.0
|
|
8.0
|
|
|
|
Tier 1 Leverage
(b)
|
5.0
|
|
4.0
|
|
|
|
(a)
|
A “well capitalized” institution also must not be subject to any written agreement, order, or directive to meet and maintain a specific capital level for any capital measure.
|
|
(b)
|
As a “standardized approach” banking organization, KeyBank is not subject to the 3% supplemental leverage ratio requirement, which became effective January 1, 2018.
|
We believe that, as of
March 31, 2018
, KeyBank (consolidated) satisfied the risk-based and leverage capital requirements necessary to be considered “well capitalized” for purposes of the PCA framework. However, investors should not regard this determination as a representation of the overall financial condition or prospects of KeyBank because the prompt corrective action framework is intended to serve a limited supervisory function. Moreover, it is important to note that the prompt corrective action framework does not apply to BHCs, like KeyCorp.
Recent regulatory capital-related developments
On September 27, 2017, the federal banking agencies issued a joint proposal to simplify certain aspects of the Regulatory Capital Rules for standardized approach banking organizations (the “Simplification Proposal”), including Key. In anticipation of the Simplification Proposal, on August 22, 2017, the agencies issued a companion proposal to extend the current capital treatment for certain items that are part of the Simplification Proposal and also subject to the multi-year transition period for the Regulatory Capital Rules, which ends on December 31, 2018 (the “Transitions Proposal”). The Transitions Proposal was published as a final rule in the Federal Register on November 21, 2017, and is expected to alleviate the burden that would have resulted from the continued phase-in of those capital requirements as the agencies seek public comment on and work to finalize the Simplification Proposal. The Simplification Proposal and the Transitions Proposal are discussed in more detail in Item 1. Business of our 2017 Form 10-K under the heading “Supervision and Regulation - Regulatory capital requirements - Recent regulatory capital-related developments.”
In December 2017, the Basel Committee released its final revisions to Basel III. The revisions seek to restore credibility in the calculation of risk-weighted assets and improve the comparability of regulatory capital ratios across banking organizations. The revisions are discussed in more detail in Item 1. Business of our 2017 Form 10-K under
12
the heading “Supervision and Regulation - Regulatory capital requirements - Recent regulatory capital-related developments.”
The U.S. federal banking agencies released a statement announcing their support for the Basel Committee’s efforts, but cautioned that they will consider how to appropriately incorporate these revisions into the Regulatory Capital Rules, and that any proposed changes based on the Basel Committee revisions would be subject to notice-and-comment rulemaking. In view of the prohibition under the Dodd-Frank Act on the use of credit ratings in federal regulation, there is some uncertainty as to whether or how the agencies would implement the ratings-based aspects of the Basel Committee revisions to Basel III, as well as any other aspect of the Basel Committee revisions that permit the U.S. agencies to exercise home-country discretion, for example, due to differences in accounting or market practices, and legal requirements.
Subsequently, in February 2018, the Basel Committee released for public consultation a proposal to update the Pillar 3 disclosure framework, to more appropriately align it to the changes adopted under the Basel Committee’s final revisions to Basel III. The public consultation period ends on May 25, 2018. Before any action is taken by the federal banking agencies with respect to the revised Pillar 3 disclosure framework, it first must be adopted in final form by the Basel Committee, and the federal agencies must determine whether and to what extent they will implement the final revisions to Basel III released by the Basel Committee in December 2017.
Capital planning and stress testing
On December 7, 2017, the Federal Reserve released for public comment a package of proposals that would increase the transparency of its stress testing program while maintaining the Federal Reserve’s ability to test the resilience of the nation’s largest, most complex banks. The proposals responded to public and industry calls for more transparency around the CCAR program. The proposals are discussed in more detail in Item 1. Business of our 2017 Form 10-K under the heading “Supervision and Regulation - Regulatory capital requirements - Recent developments in capital planning and stress testing.”
In a separate release, published April 10, 2018, the Federal Reserve invited comment on a proposal to integrate certain aspects of the Federal Reserve’s Regulatory Capital Rules with the CCAR and stress test rules, in order to simplify the overall capital framework that is currently applicable to banking organizations subject to the capital plan rule (including KeyCorp). Under the proposal, the Federal Reserve would (1) amend the capital conservation buffer requirement under the Regulatory Capital Rules by replacing the static risk-weighted assets component of the buffer with a new measure, the stress capital buffer, which would be based on the results of an individual banking organization’s annual supervisory stress test; (2) introduce a stress leverage buffer requirement that would replace the existing Tier 1 leverage requirement under CCAR; (3) modify certain assumptions under the supervisory stress test; (4) remove the 30% dividend payout ratio limitation as a criterion for heightened supervisory scrutiny of an organization’s capital plan; and (5) eliminate the CCAR quantitative objection.
Under the proposed rule, a banking organization would not be subject to any limitations on capital distributions and discretionary bonus payments if it satisfies all minimum capital requirements and its capital conservation requirement (as amended to incorporate the stress capital buffer), stress leverage buffer requirement, and, if applicable, the advanced approaches capital conservation buffer requirement and supplementary leverage ratio standard (the latter two of which do not apply to KeyCorp). If it is adopted as a final rule, the proposal would be effective December 31, 2018; however, the stressed capital buffer and stress leverage buffer requirements would generally not be effective until October 1, 2019. Key expects that the proposal would have a marginally favorable impact on its capital requirements.
Liquidity requirements
In October 2014, the federal banking agencies published a final rule to implement the Basel III liquidity coverage ratio (“Basel III LCR”) for U.S. banking organizations (the “Liquidity Coverage Rules”) that establishes a minimum LCR for certain internationally active bank and nonbank financial companies (excluding KeyCorp) and a modified version of the LCR (“Modified LCR”) for BHCs and other depository institution holding companies with over $50 billion in consolidated assets that are not internationally active (including KeyCorp). KeyBank will not be subject to the LCR or the Modified LCR under the Liquidity Coverage Rules unless the OCC affirmatively determines that application to KeyBank is appropriate in light of KeyBank’s asset size, level of complexity, risk profile, scope of operations, affiliation with foreign or domestic covered entities, or risk to the financial system.
13
Under the Liquidity Coverage Rules, KeyCorp must calculate a Modified LCR on a monthly basis, and was required to satisfy a minimum Modified LCR requirement of 100% by January 1, 2017. At
March 31, 2018
, Key’s Modified LCR was above 100%. In the future, KeyCorp may change the composition of our investment portfolio, increase the size of the overall investment portfolio, and modify product offerings to enhance or optimize our liquidity position.
Net stable funding ratio
The federal banking agencies commenced the U.S. implementation of the Basel III net stable funding ratio (“NSFR”) in April and May 2016, with the release of a proposed rule to implement a NSFR requirement for certain internationally active banking organizations (excluding KeyCorp) and a modified version of the minimum NSFR requirement (“Modified NSFR”) for BHCs and other depository institution holding companies with over $50 billion in consolidated assets that are not internationally active (including KeyCorp), together with quarterly public disclosure requirements. The proposed rule would require banking organizations to satisfy a minimum NSFR requirement of 1.0 on an ongoing basis. However, banking organizations subject to the Modified NSFR (like KeyCorp) would be required to maintain a lower minimum amount of available stable funding, equal to 70% of the required stable funding under the NSFR. The proposed rule was scheduled to be effective on January 1, 2018; however, it has not been adopted in final form. The comment period for the NPR expired on August 5, 2016. If the proposed NSFR requirement is adopted as a final rule, then similar to actions taken in connection with the implementation of the Liquidity Coverage Rules, KeyCorp may adjust its balance sheet or modify product offerings to enhance its liquidity position.
Resolution and recovery planning
BHCs with at least $50 billion in total consolidated assets, like KeyCorp, are required to periodically submit to the Federal Reserve and FDIC a plan discussing how the company could be rapidly and efficiently resolved if the company failed or experienced material financial distress. Insured depository institutions with at least $50 billion in total consolidated assets, like KeyBank, are also required to submit a resolution plan to the FDIC. These plans are due annually, usually by December 31 of each year. For 2015, these resolution plans, the third required from
KeyCorp and KeyBank, were submitted on December 1, 2015. KeyCorp and KeyBank were not required to submit
resolution plans for 2016 because the FDIC and Federal Reserve deferred such requirement (for 38 firms, including
KeyCorp) until December 2017 and the FDIC deferred such requirement (for a number of insured depository
institutions, including KeyBank) until July 1, 2018. On December 1, 2017, KeyCorp submitted its resolution plan to the Federal Reserve and the FDIC. The Federal Reserve and FDIC make available on their websites the public sections of resolution plans for the companies, including KeyCorp and KeyBank, that submitted plans. The public section of the resolution plans of KeyCorp and KeyBank is available at http://www.federalreserve.gov/supervisionreg/resolution-plans.htm and https://www.fdic.gov/regulations/reform/resplans/.
On September 28, 2016, the OCC released final guidelines that establish standards for recovery planning by certain large OCC-regulated institutions, including KeyBank. The guidelines require such institutions to establish a comprehensive framework for evaluating the financial effects of severe stress events, and recovery actions an institution may pursue to remain a viable, going concern during a period of severe financial stress. Under the final guidelines, an institution’s recovery plan must include triggers to alert the institution of severe stress events, escalation procedures, recovery options, and a process for periodic review and approval by senior management and the board of directors. The recovery plan should be tailored to the complexity, scope of operations, and risk profile of the institution. Because KeyBank had average total consolidated assets of greater than $100 billion but less than $750 billion as reported on KeyBank’s Consolidated Reports of Condition and Income for the four most recent consecutive quarters prior to January 1, 2017, it was required to be in compliance with the guidelines not later than January 1, 2018. We believe that KeyBank is in compliance with the guidelines.
14
Deposit insurance and assessments
As required under the Dodd-Frank Act, in March 2015, the FDIC approved a final rule to impose a surcharge on the quarterly deposit insurance assessments of insured depository institutions having total consolidated assets of at least $10 billion (like KeyBank). The surcharge is 4.5 cents per $100 of the institution’s assessment base (after making certain adjustments). The final rule became effective on July 1, 2016. As of July 1, 2016, KeyBank must pay a surcharge to assist in bringing the reserve ratio to the statutory minimum of 1.35%. Surcharges will continue through the quarter that the DIF reserve ratio reaches or exceeds 1.35%, but not later than December 31, 2018. If the reserve ratio does not reach 1.35% by December 31, 2018 (provided it is at least 1.15%), the FDIC will impose a shortfall assessment on March 31, 2019, on insured depository institutions with total consolidated assets of $10 billion or more (like KeyBank).
In December 2016, the FDIC issued a final rule that imposes recordkeeping requirements on insured depository institutions with two million or more deposit accounts (including KeyBank) in order to facilitate rapid payment of insured deposits to customers if the institutions were to fail. The rule requires those insured depository institutions to: (i) maintain complete and accurate data on each depositor’s ownership interest by right and capacity for all of the institution’s deposit accounts; and (ii) develop the capability to calculate the insured and uninsured amounts for each deposit owner within 24 hours of failure. The FDIC will conduct periodic testing of compliance with these requirements, and institutions subject to the rule must submit to the FDIC a certification of compliance, signed by the KeyBank chief executive officer, and deposit insurance coverage summary report on or before the mandatory compliance date and annually thereafter. The final rule became effective on April 1, 2017, with a mandatory compliance date of April 1, 2020. The FDIC has been releasing Frequently Asked Questions for Part 370 on a rolling basis, and has committed to continue this practice as institutions subject to the rule present issues associated with its implementation that require FDIC consultation.
Supervision and governance
On August 3, 2017, the Federal Reserve published an NPR to align its supervisory rating system for large financial
institutions, including KeyCorp, with the post-crisis supervisory programs for these firms (the “LFI Rating System”).
If adopted in final form, the LFI Rating System would provide a supervisory evaluation of whether an institution
possesses sufficient operational strength and resilience to maintain safe and sound operations through a range of
conditions, and assess an institution’s capital planning and positions, liquidity risk management and positions, and
governance and controls. Institutions subject to the LFI Rating System would be rated using the following scale:
Satisfactory, Satisfactory Watch, Deficient-1, and Deficient-2, with the Satisfactory Watch rating intended to be used
as a transitory rating to allow an institution time to remediate a concern identified during the supervisory evaluation.
The governance and controls component of the LFI Rating System is the subject of two separate, but related
proposals: (1) proposed guidance regarding supervisory expectations for boards of directors of large financial
institutions; and (2) proposed guidance regarding core principles for effective senior management, business
management, and independent risk management and controls for large financial institutions.
On January 4, 2018, the Federal Reserve released the final component of the proposed LFI Rating System
—
proposed guidance regarding core principles for effective senior management, business management, and
independent risk management and controls for large financial institutions. The proposals and guidance are discussed in more detail in Item 1. Business of our 2017 Form 10-K under the heading “Supervision and Regulation - Other Regulatory Developments under the Dodd-Frank Act - Supervision and governance.”
ERISA fiduciary standard
In April 2016, the Department of Labor published final rules and amendments to certain prohibited transaction exemptions regarding which service providers would be regarded as fiduciaries under ERISA for making investment advice recommendations to: (i) certain retirement plan fiduciaries, participants, or beneficiaries; and (ii) owners or beneficiaries of individual retirement accounts and health savings accounts, among other retirement plans. The purpose of the rules is to place fiduciary obligations, rather than the lesser legal obligations that currently apply, on these service providers. Accordingly, the rules subject any financial institution making recommendations for either the purchase or sale of investments in or rollover of the respective retirement plan to certain fiduciary obligations under ERISA such as an impartial conduct standard and not selling certain investment products whose compensation may raise a conflict of interest for the advisor without entering into a contract providing certain disclosures and legal remedies to the customer. Under the Department of Labor’s original rules, the impartial
15
standard requirement for financial institutions and their advisors was to become effective April 10, 2017. However, in response to a Presidential Order, the Department of Labor extended the effective date to June 9, 2017. The contract provisions were required to be in place by January 1, 2018. However, on November 29, 2017, the Department of Labor extended the applicability of the contract rules until July 1, 2019, while it continues to review requested comments concerning whether to modify, further delay, or rescind these rules in whole or in part. On March 15, 2018, the United States Court of Appeals for the Fifth Circuit invalidated the rule in its entirety. Other federal courts have upheld the rule. It is unclear what impact these decisions will have on the rules.
Results of Operations
Earnings overview
The following chart provides a reconciliation of net income from continuing operations attributable to Key common shareholders for the three months ended
March 31, 2017
, to the three months ended
March 31, 2018
(dollars in millions):
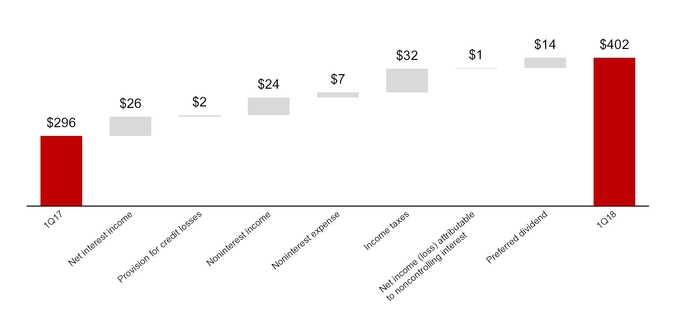
The following discussion explains the key factors that caused these elements to change.
Net interest income
One of our principal sources of revenue is net interest income. Net interest income is the difference between interest income received on earning assets (such as loans and securities) and loan-related fee income, and interest expense paid on deposits and borrowings. There are several factors that affect net interest income, including:
|
•
|
the volume, pricing, mix, and maturity of earning assets and interest-bearing liabilities;
|
|
•
|
the volume and value of net free funds, such as noninterest-bearing deposits and equity capital;
|
|
•
|
the use of derivative instruments to manage interest rate risk;
|
|
•
|
interest rate fluctuations and competitive conditions within the marketplace;
|
|
•
|
asset quality; and
|
|
•
|
fair value accounting of acquired earning assets and interest-bearing liabilities.
|
To make it easier to compare both the results across several periods and the yields on various types of earning assets (some taxable, some not), we present net interest income in this discussion on a “TE basis” (i.e., as if all income were taxable and at the same rate). For example, $100 of tax-exempt income would be presented as $126, an amount that, if taxed at the statutory federal income tax rate of 21%, would yield $100. Prior to 2018, $100 of tax-exempt income would be presented as $154, an amount that, if taxed at the previous statutory federal income tax rate of 35%, would yield $100.
16
Figure
6
shows the various components of our balance sheet that affect interest income and expense, and their respective yields or rates over the past five quarters. This figure also presents a reconciliation of TE net interest income to net interest income reported in accordance with GAAP for each of those quarters. The net interest margin, which is an indicator of the profitability of the earning assets portfolio less cost of funding, is calculated by dividing annualized TE net interest income by average earning assets.
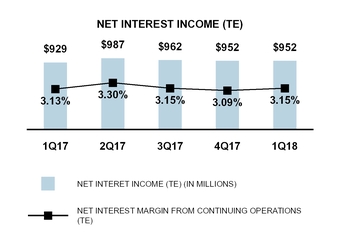
TE net interest income was
$952 million
for the
first
quarter of
2018
, and the net interest margin was
3.15%
, compared to TE net interest income of
$929 million
and a net interest margin of
3.13%
for the
first
quarter of
2017
, reflecting the benefit from higher interest rates and low deposit betas. First quarter 2018 net interest income included $33 million of purchase accounting accretion, a decline of $20 million from the first quarter of 2017. In 2018, we expect net interest income to be in the range of $3.95 billion to $4.05 billion.
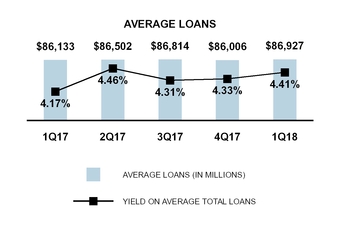
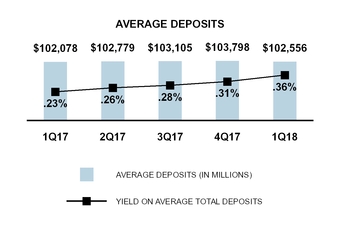
Average loans were
$86.9 billion
for the
first
quarter of
2018
,
an increase
of
$794 million
compared to the
first
quarter of
2017
, reflecting broad-based growth in commercial and industrial loans with middle-market clients, as well as strength in auto lending as the company expands into existing geographies and dealer relationships. In addition, reductions in commercial real estate loans over the past year reflect significantly higher debt placements and paydowns. For 2018, we anticipate average loans to be in the range of $88.5 billion to $89.5 billion.
Average deposits totaled
$102.6 billion
for the
first
quarter of
2018
,
an increase
of
$478 million
compared to the year-ago quarter. Certificates of deposits and other time deposits increased $1.5 billion, reflecting strength in Key’s retail banking franchise and growth from commercial relationships. Additionally, consumer noninterest-bearing balances grew 10% from the prior year. NOW and money-market deposit accounts declined $792 million, partially driven by a shift to higher-yielding deposit products and the managed exit of certain higher cost corporate and public sector deposits. For 2018, we anticipate average deposits to be in the range of $104.5 billion to $105.5 billion.
17
Figure 6. Consolidated Average Balance Sheets, Net Interest Income, and Yields/Rates from Continuing Operations
|
|
First Quarter 2018
|
Fourth Quarter 2017
|
|||||||||||||||
|
dollars in millions
|
Average
Balance
|
Interest
(a)
|
Yield/
Rate
(a)
|
Average
Balance
|
Interest
(a)
|
Yield/
Rate
(a)
|
|||||||||||
|
ASSETS
|
|||||||||||||||||
|
Loans
(b), (c)
|
|||||||||||||||||
|
Commercial and industrial
(d)
|
$
|
42,733
|
|
$
|
434
|
|
4.11
|
%
|
$
|
41,289
|
|
$
|
417
|
|
4.01
|
%
|
|
|
Real estate — commercial mortgage
|
14,085
|
|
165
|
|
4.76
|
|
14,386
|
|
167
|
|
4.60
|
|
|||||
|
Real estate — construction
|
1,957
|
|
22
|
|
4.64
|
|
1,967
|
|
23
|
|
4.55
|
|
|||||
|
Commercial lease financing
|
4,663
|
|
41
|
|
3.53
|
|
4,687
|
|
45
|
|
3.86
|
|
|||||
|
Total commercial loans
|
63,438
|
|
662
|
|
4.23
|
|
62,329
|
|
652
|
|
4.15
|
|
|||||
|
Real estate — residential mortgage
|
5,479
|
|
54
|
|
3.95
|
|
5,474
|
|
54
|
|
3.95
|
|
|||||
|
Home equity loans
|
11,877
|
|
134
|
|
4.56
|
|
12,128
|
|
134
|
|
4.39
|
|
|||||
|
Consumer direct loans
|
1,766
|
|
33
|
|
7.53
|
|
1,782
|
|
32
|
|
7.15
|
|
|||||
|
Credit cards
|
1,080
|
|
30
|
|
11.32
|
|
1,061
|
|
30
|
|
11.14
|
|
|||||
|
Consumer indirect loans
|
3,287
|
|
35
|
|
4.29
|
|
3,232
|
|
36
|
|
4.42
|
|
|||||
|
Total consumer loans
|
23,489
|
|
286
|
|
4.91
|
|
23,677
|
|
286
|
|
4.80
|
|
|||||
|
Total loans
|
86,927
|
|
948
|
|
4.41
|
|
86,006
|
|
938
|
|
4.33
|
|
|||||
|
Loans held for sale
|
1,187
|
|
12
|
|
4.10
|
|
1,420
|
|
13
|
|
3.81
|
|
|||||
|
Securities available for sale
(b), (e)
|
17,889
|
|
95
|
|
2.06
|
|
18,447
|
|
93
|
|
1.97
|
|
|||||
|
Held-to-maturity securities
(b)
|
12,041
|
|
69
|
|
2.30
|
|
11,121
|
|
61
|
|
2.20
|
|
|||||
|
Trading account assets
|
907
|
|
7
|
|
2.99
|
|
898
|
|
6
|
|
2.72
|
|
|||||
|
Short-term investments
|
2,048
|
|
8
|
|
1.51
|
|
3,684
|
|
12
|
|
1.29
|
|
|||||
|
Other investments
(e)
|
723
|
|
6
|
|
2.96
|
|
725
|
|
5
|
|
2.80
|
|
|||||
|
Total earning assets
|
121,722
|
|
1,145
|
|
3.78
|
|
122,301
|
|
1,128
|
|
3.66
|
|
|||||
|
Allowance for loan and lease losses
|
(875
|
)
|
(871
|
)
|
|||||||||||||
|
Accrued income and other assets
|
14,068
|
|
13,825
|
|
|||||||||||||
|
Discontinued assets
|
1,304
|
|
1,358
|
|
|||||||||||||
|
Total assets
|
$
|
136,219
|
|
$
|
136,613
|
|
|||||||||||
|
LIABILITIES
|
|||||||||||||||||
|
NOW and money market deposit accounts
|
$
|
53,503
|
|
46
|
|
.34
|
|
$
|
53,601
|
|
40
|
|
.29
|
|
|||
|
Savings deposits
|
6,232
|
|
5
|
|
.29
|
|
6,372
|
|
3
|
|
.24
|
|
|||||
|
Certificates of deposit ($100,000 or more)
|
6,972
|
|
27
|
|
1.58
|
|
6,776
|
|
26
|
|
1.50
|
|
|||||
|
Other time deposits
|
4,865
|
|
13
|
|
1.12
|
|
4,771
|
|
13
|
|
1.05
|
|
|||||
|
Total interest-bearing deposits
|
71,572
|
|
91
|
|
.51
|
|
71,520
|
|
82
|
|
.45
|
|
|||||
|
Federal funds purchased and securities sold under repurchase
agreements
|
1,421
|
|
4
|
|
1.11
|
|
360
|
|
—
|
|
.08
|
|
|||||
|
Bank notes and other short-term borrowings
|
1,342
|
|
6
|
|
1.87
|
|
693
|
|
3
|
|
1.72
|
|
|||||
|
Long-term debt
(f), (g)
|
12,465
|
|
92
|
|
2.95
|
|
13,140
|
|
91
|
|
2.76
|
|
|||||
|
Total interest-bearing liabilities
|
86,800
|
|
193
|
|
.90
|
|
85,713
|
|
176
|
|
.81
|
|
|||||
|
Noninterest-bearing deposits
|
30,984
|
|
32,278
|
|
|||||||||||||
|
Accrued expense and other liabilities
|
2,241
|
|
1,994
|
|
|||||||||||||
|
Discontinued liabilities
(g)
|
1,304
|
|
1,359
|
|
|||||||||||||
|
Total liabilities
|
121,329
|
|
121,344
|
|
|||||||||||||
|
EQUITY
|
|||||||||||||||||
|
Key shareholders’ equity
|
14,889
|
|
15,268
|
|
|||||||||||||
|
Noncontrolling interests
|
1
|
|
1
|
|
|||||||||||||
|
Total equity
|
14,890
|
|
15,269
|
|
|||||||||||||
|
Total liabilities and equity
|
$
|
136,219
|
|
$
|
136,613
|
|
|||||||||||
|
Interest rate spread (TE)
|
2.88
|
%
|
2.85
|
%
|
|||||||||||||
|
Net interest income (TE) and net interest margin (TE)
|
952
|
|
3.15
|
%
|
952
|
|
3.09
|
%
|
|||||||||
|
TE adjustment
(b)
|
8
|
|
14
|
|
|||||||||||||
|
Net interest income, GAAP basis
|
$
|
944
|
|
$
|
938
|
|
|||||||||||
|
(a)
|
Results are from continuing operations. Interest excludes the interest associated with the liabilities referred to in (g), calculated using a matched funds transfer pricing methodology.
|
|
(b)
|
Interest income on tax-exempt securities and loans has been adjusted to a TE basis using the statutory federal income tax rate in effect for that period.
|
|
(c)
|
For purposes of these computations, nonaccrual loans are included in average loan balances.
|
|
(d)
|
Commercial and industrial average balances include
$120 million
,
$119 million
,
$117 million
,
$117 million
, and
$114 million
of assets from commercial credit cards for the
three months ended March 31, 2018
,
December 31, 2017
,
September 30, 2017
,
June 30, 2017
, and
March 31, 2017
, respectively.
|
18
Figure 6. Consolidated Average Balance Sheets, Net Interest Income, and Yields/Rates from Continuing Operations
|
Third Quarter 2017
|
Second Quarter 2017
|
First Quarter 2017
|
|||||||||||||||||||||||
|
Average
Balance
|
Interest
(a)
|
Yield/
Rate
(a)
|
Average
Balance
|
Interest
(a)
|
Yield/
Rate
(a)
|
Average
Balance
|
Interest
(a)
|
Yield/
Rate
(a)
|
|||||||||||||||||
|
$
|
41,416
|
|
$
|
414
|
|
3.97
|
%
|
$
|
40,666
|
|
$
|
409
|
|
4.04
|
%
|
$
|
40,002
|
|
$
|
373
|
|
3.77
|
%
|
||
|
14,850
|
|
169
|
|
4.51
|
|
15,096
|
|
187
|
|
4.97
|
|
15,187
|
|
164
|
|
4.39
|
|
||||||||
|
2,054
|
|
23
|
|
4.51
|
|
2,204
|
|
31
|
|
5.51
|
|
2,353
|
|
26
|
|
4.54
|
|
||||||||
|
4,694
|
|
46
|
|
3.89
|
|
4,690
|
|
50
|
|
4.33
|
|
4,635
|
|
44
|
|
3.76
|
|
||||||||
|
63,014
|
|
652
|
|
4.11
|
|
62,656
|
|
677
|
|
4.34
|
|
62,177
|
|
607
|
|
3.95
|
|
||||||||
|
5,493
|
|
54
|
|
3.92
|
|
5,509
|
|
52
|
|
3.77
|
|
5,520
|
|
54
|
|
3.94
|
|
||||||||
|
12,314
|
|
136
|
|
4.41
|
|
12,473
|
|
135
|
|
4.31
|
|
12,611
|
|
131
|
|
4.22
|
|
||||||||
|
1,774
|
|
33
|
|
7.26
|
|
1,743
|
|
31
|
|
7.07
|
|
1,762
|
|
30
|
|
6.97
|
|
||||||||
|
1,049
|
|
30
|
|
11.34
|
|
1,044
|
|
29
|
|
11.04
|
|
1,067
|
|
29
|
|
11.06
|
|
||||||||
|
3,170
|
|
37
|
|
4.64
|
|
3,077
|
|
38
|
|
5.02
|
|
2,996
|
|
37
|
|
4.91
|
|
||||||||
|
23,800
|
|
290
|
|
4.85
|
|
23,846
|
|
285
|
|
4.77
|
|
23,956
|
|
281
|
|
4.75
|
|
||||||||
|
86,814
|
|
942
|
|
4.31
|
|
86,502
|
|
962
|
|
4.46
|
|
86,133
|
|
888
|
|
4.17
|
|
||||||||
|
1,607
|
|
17
|
|
4.13
|
|
1,082
|
|
9
|
|
3.58
|
|
1,188
|
|
13
|
|
4.28
|
|
||||||||
|
18,574
|
|
91
|
|
1.96
|
|
17,997
|
|
90
|
|
1.97
|
|
19,181
|
|
95
|
|
1.95
|
|
||||||||
|
10,469
|
|
55
|
|
2.12
|
|
10,469
|
|
55
|
|
2.09
|
|
9,988
|
|
51
|
|
2.04
|
|
||||||||
|
889
|
|
7
|
|
2.74
|
|
1,042
|
|
7
|
|
3.00
|
|
968
|
|
7
|
|
2.75
|
|
||||||||
|
2,166
|
|
6
|
|
1.21
|
|
1,970
|
|
5
|
|
.96
|
|
1,610
|
|
3
|
|
.79
|
|
||||||||
|
728
|
|
5
|
|
2.46
|
|
687
|
|
3
|
|
1.87
|
|
709
|
|
4
|
|
2.26
|
|
||||||||
|
121,247
|
|
1,123
|
|
3.68
|
|
119,749
|
|
1,131
|
|
3.78
|
|
119,777
|
|
1,061
|
|
3.57
|
|
||||||||
|
(868
|
)
|
(864
|
)
|
(855
|
)
|
||||||||||||||||||||
|
13,977
|
|
13,606
|
|
13,819
|
|
||||||||||||||||||||
|
1,417
|
|
1,477
|
|
1,540
|
|
||||||||||||||||||||
|
$
|
135,773
|
|
$
|
133,968
|
|
$
|
134,281
|
|
|||||||||||||||||
|
$
|
53,826
|
|
37
|
|
.27
|
|
$
|
54,416
|
|
34
|
|
.25
|
|
$
|
54,295
|
|
32
|
|
.24
|
|
|||||
|
6,697
|
|
5
|
|
.25
|
|
6,854
|
|
4
|
|
.21
|
|
6,351
|
|
1
|
|
.10
|
|
||||||||
|
6,402
|
|
21
|
|
1.31
|
|
6,111
|
|
19
|
|
1.23
|
|
5,627
|
|
16
|
|
1.16
|
|
||||||||
|
4,664
|
|
9
|
|
.81
|
|
4,650
|
|
9
|
|
.77
|
|
4,706
|
|
9
|
|
.76
|
|
||||||||
|
71,589
|
|
72
|
|
.40
|
|
72,031
|
|
66
|
|
.36
|
|
70,979
|
|
58
|
|
.33
|
|
||||||||
|
456
|
|
—
|
|
.23
|
|
466
|
|
—
|
|
.23
|
|
795
|
|
1
|
|
.32
|
|
||||||||
|
865
|
|
3
|
|
1.49
|
|
1,216
|
|
4
|
|
1.43
|
|
1,802
|
|
5
|
|
1.06
|
|
||||||||
|
12,631
|
|
86
|
|
2.75
|
|
11,046
|
|
74
|
|
2.68
|
|
10,833
|
|
68
|
|
2.54
|
|
||||||||
|
85,541
|
|
161
|
|
.75
|
|
84,759
|
|
144
|
|
.68
|
|
84,409
|
|
132
|
|
.63
|
|
||||||||
|
31,516
|
|
30,748
|
|
31,099
|
|
||||||||||||||||||||
|
2,057
|
|
1,782
|
|
2,048
|
|
||||||||||||||||||||
|
1,417
|
|
1,477
|
|
1,540
|
|
||||||||||||||||||||
|
120,531
|
|
118,766
|
|
119,096
|
|
||||||||||||||||||||
|
15,241
|
|
15,200
|
|
15,184
|
|
||||||||||||||||||||
|
1
|
|
2
|
|
1
|
|
||||||||||||||||||||
|
15,242
|
|
15,202
|
|
15,185
|
|
||||||||||||||||||||
|
$
|
135,773
|
|
$
|
133,968
|
|
$
|
134,281
|
|
|||||||||||||||||
|
2.93
|
%
|
3.10
|
%
|
2.94
|
%
|
||||||||||||||||||||
|
962
|
|
3.15
|
%
|
987
|
|
3.30
|
%
|
929
|
|
3.13
|
%
|
||||||||||||||
|
14
|
|
14
|
|
11
|
|
||||||||||||||||||||
|
$
|
948
|
|
$
|
973
|
|
$
|
918
|
|
|||||||||||||||||
|
(e)
|
Yield is calculated on the basis of amortized cost.
|
|
(f)
|
Rate calculation excludes basis adjustments related to fair value hedges.
|
|
(g)
|
A portion of long-term debt and the related interest expense is allocated to discontinued liabilities as a result of applying our matched funds transfer pricing methodology to discontinued operations.
|
19
Figure
7
shows how the changes in yields or rates and average balances from the prior year period affected net interest income. The section entitled “Financial Condition” contains additional discussion about changes in earning assets and funding sources.
Figure 7. Components of Net Interest Income Changes from Continuing Operations
|
From three months ended March 31, 2017
|
|||||||||
|
|
to three months ended March 31, 2018
|
||||||||
|
in millions
|
Average
Volume
|
Yield/
Rate
|
Net
Change
(a)
|
||||||
|
INTEREST INCOME
|
|||||||||
|
Loans
|
$
|
8
|
|
$
|
52
|
|
$
|
60
|
|
|
Loans held for sale
|
—
|
|
(1
|
)
|
(1
|
)
|
|||
|
Securities available for sale
|
(7
|
)
|
7
|
|
—
|
|
|||
|
Held-to-maturity securities
|
11
|
|
7
|
|
18
|
|
|||
|
Trading account assets
|
—
|
|
—
|
|
—
|
|
|||
|
Short-term investments
|
1
|
|
4
|
|
5
|
|
|||
|
Other investments
|
—
|
|
2
|
|
2
|
|
|||
|
Total interest income (TE)
|
13
|
|
71
|
|
84
|
|
|||
|
INTEREST EXPENSE
|
|||||||||
|
NOW and money market deposit accounts
|
—
|
|
14
|
|
14
|
|
|||
|
Savings deposits
|
—
|
|
4
|
|
4
|
|
|||
|
Certificates of deposit ($100,000 or more)
|
4
|
|
7
|
|
11
|
|
|||
|
Other time deposits
|
—
|
|
4
|
|
4
|
|
|||
|
Total interest-bearing deposits
|
4
|
|
29
|
|
33
|
|
|||
|
Federal funds purchased and securities sold under repurchase agreements
|
1
|
|
2
|
|
3
|
|
|||
|
Bank notes and other short-term borrowings
|
(2
|
)
|
3
|
|
1
|
|
|||
|
Long-term debt
|
11
|
|
13
|
|
24
|
|
|||
|
Total interest expense
|
14
|
|
47
|
|
61
|
|
|||
|
Net interest income (TE)
|
$
|
(1
|
)
|
$
|
24
|
|
$
|
23
|
|
|
(a)
|
The change in interest not due solely to volume or rate has been allocated in proportion to the absolute dollar amounts of the change in each.
|
Provision for credit losses
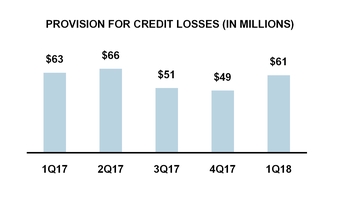
Our provision for credit losses was
$61 million
for the
three months ended March 31, 2018
, compared to
$63 million
for the
three months ended March 31, 2017
. The
decrease
of
$2 million
in our provision for credit losses was related to a decrease in net loan-charge offs during the first quarter of 2018 compared to one year ago. In 2018, we expect the provision to slightly exceed net loan charge-offs to provide for loan growth.
Noninterest income
As shown in Figure
8
, noninterest income was
$601 million
for the
first
quarter of
2018
, compared to
$577 million
for the year-ago quarter. Noninterest income represented
39%
of total revenue for the
three
months ended
March 31, 2018
, compared to
38%
for the
three
months ended
March 31, 2017
. In 2018, we expect noninterest income to be in the range of $2.5 billion to $2.6 billion.
The following discussion explains the composition of certain elements of our noninterest income and the factors that caused those elements to change.
20
Figure 8. Noninterest Income
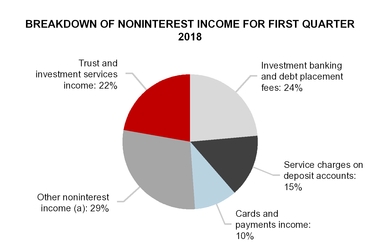
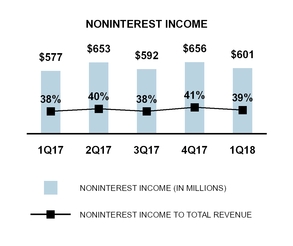
|
(a)
|
Other noninterest income includes operating lease income and other leasing gains, corporate services income, corporate-owned life insurance income, consumer mortgage income, mortgage servicing fees, net gains (losses) from principal investing, and other income. See the "Consolidated Statements of Income" in Item 1. Financial Statements of this report.
|
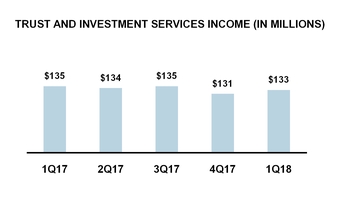
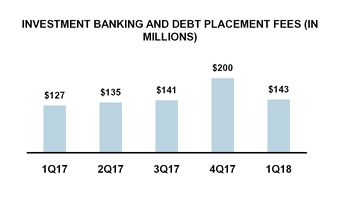
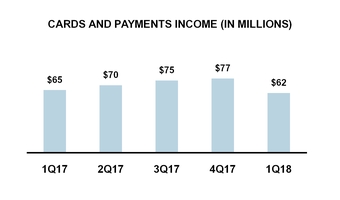
Trust and investment services income
Trust and investment services income consists of brokerage commissions, trust and asset management fees, and insurance income. The assets under management that primarily generate these revenues are shown in Figure
9
. For the
three months ended March 31, 2018
, trust and investment services income
decrease
d
$2 million
, or
1.5%
, compared to the same period one year ago, primarily due to a decrease in fixed income brokerage commissions.
A significant portion of our trust and investment services income depends on the value and mix of assets under management. At
March 31, 2018
, our bank, trust, and registered investment advisory subsidiaries had assets under management of
$39.0 billion
, compared to
$37.4 billion
at
March 31, 2017
. As shown in Figure
9
, the
increase
in assets under management was primarily attributable to market growth over the past twelve months.
21
Figure 9. Assets Under Management
|
in millions
|
March 31, 2018
|
December 31, 2017
|
September 30, 2017
|
June 30, 2017
|
March 31, 2017
|
||||||||||
|
Assets under management by investment type:
|
|||||||||||||||
|
Equity
|
$
|
23,629
|
|
$
|
24,081
|
|
$
|
23,342
|
|
$
|
22,824
|
|
$
|
22,522
|
|
|
Securities lending
|
837
|
|
947
|
|
876
|
|
807
|
|
1,095
|
|
|||||
|
Fixed income
|
11,098
|
|
10,930
|
|
11,009
|
|
10,819
|
|
10,497
|
|
|||||
|
Money market
|
3,439
|
|
3,630
|
|
3,433
|
|
3,163
|
|
3,303
|
|
|||||
|
Total assets under management
|
$
|
39,003
|
|
$
|
39,588
|
|
$
|
38,660
|
|
$
|
37,613
|
|
$
|
37,417
|
|
Investment banking and debt placement fees
Investment banking and debt placement fees consists of syndication fees, debt and equity financing fees, financial adviser fees, gains on sales of commercial mortgages, and agency origination fees. Investment banking and debt placement fees
increase
d
$16 million
, or
12.6%
, from the year-ago quarter, primarily related to the Cain Brothers acquisition during the fourth quarter of 2017, as well as continued growth in our core franchise. In the first quarter of 2018, commercial mortgage banking and mergers and acquisitions advisory fees contributed to the strong performance.
Cards and payments income
Cards and payments income, which consists of debit card, consumer and commercial credit card, and merchant services income,
decrease
d
$3 million
, or
4.6%
, from the year-ago quarter. Cards and payments income and other expense both declined due to the adoption of the new revenue recognition accounting standard.
The new accounting standard had no net impact to income during the first quarter of 2018.
Excluding the impact of the new revenue recognition accounting standard, cards and payments increased $8 million from the year-ago quarter driven by strength in our core products and the impact of the Key Merchant Services acquisition in the second quarter of 2017.
Service charges on deposit accounts
Service charges on deposit accounts
increase
d
$2 million
, or
2.3%
, for the
three months ended March 31, 2018
, compared to the same period one year ago. The
increase
from the three months ended
March 31, 2017
, was driven by an increase in account analysis fees.
Other noninterest income
Other noninterest income includes operating lease income and other leasing gains, corporate services income,
corporate-owned life insurance income, consumer mortgage income, mortgage servicing fees, net gains (losses)
from principal investing, and other income. Other noninterest income increased $11 million, or 6.7%, from the year-ago quarter. Operating lease income and other leasing gains contributed to the increase, up $9 million from the year-ago period, driven by higher originations. Corporate services income grew $8 million related to higher loan and derivative trading income. These increases were partially offset by a decline in other income.
Noninterest expense
As shown in Figure
10
, noninterest expense was
$1.0 billion
for the
first
quarter of
2018
and
first
quarter of
2017
. Figure
10
gives a breakdown of our major categories of noninterest expense as a percentage of total noninterest expense for the
three months ended March 31, 2018
. In 2018, we expect noninterest expense to be in the range of $3.85 billion to $3.95 billion.
Beginning in the first quarter of 2018, we no longer separately report merger-related charges.
22
Figure 10. Noninterest Expense
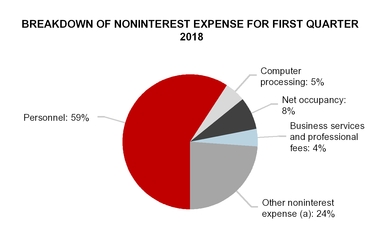
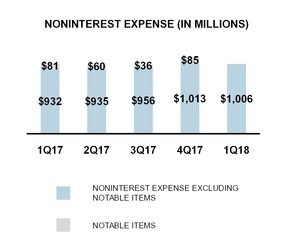
|
(a)
|
Other noninterest expense includes equipment, operating lease expense, marketing, FDIC assessment, intangible asset amortization, OREO expense, net, and other expense. See the "Consolidated Statements of Income" in Item 1. Financial Statements of this report.
|
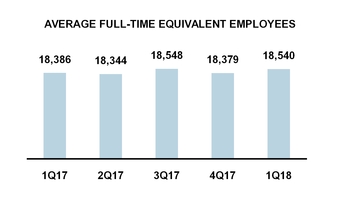
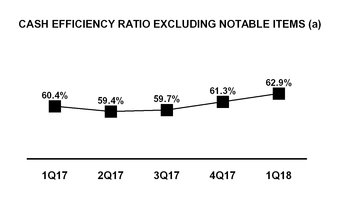
|
(a)
|
See Figure
2
entitled “
GAAP to Non-GAAP Reconciliations
,” which presents the computations of certain financial measures related to “cash efficiency.” The table reconciles the GAAP performance measures to the corresponding non-GAAP measures, which provides a basis for period-to-period comparisons.
|
Figure 11. Merger-Related Charges
|
|
Three months ended
March 31, |
||||
|
dollars in millions
|
2018
|
2017
|
|||
|
Personnel
|
—
|
|
$
|
30
|
|
|
Net occupancy
|
—
|
|
5
|
|
|
|
Business services and professional fees
|
—
|
|
5
|
|
|
|
Computer processing
|
—
|
|
5
|
|
|
|
Marketing
|
—
|
|
6
|
|
|
|
Other nonpersonnel expense
|
—
|
|
30
|
|
|
|
Noninterest expense
|
—
|
|
81
|
|
|
|
Total merger-related charges
|
—
|
|
$
|
81
|
|
Personnel
As shown in Figure
12
, personnel expense, the largest category of our noninterest expense,
increase
d by
$38 million
, or
6.8%
, for the
first
quarter of
2018
compared to the year-ago quarter. This
increase
was largely due to recent acquisitions, as well as accelerated technology investments and higher performance-based compensation.
23
Figure 12. Personnel Expense
|
|
Three months ended
March 31, |
Change
|
|||||||||
|
dollars in millions
|
2018
|
2017
|
Amount
|
Percent
|
|||||||
|
Salaries and contract labor
|
$
|
339
|
|
$
|
324
|
|
$
|
15
|
|
4.6
|
%
|
|
Incentive and stock-based compensation
|
145
|
|
127
|
|
18
|
|
14.2
|
|
|||
|
Employee benefits
|
105
|
|
96
|
|
9
|
|
9.4
|
|
|||
|
Severance
|
5
|
|
9
|
|
(4
|
)
|
(44.4
|
)
|
|||
|
Total personnel expense
|
$
|
594
|
|
$
|
556
|
|
$
|
38
|
|
6.8
|
%
|
|
Merger-related charges
|
—
|
|
30
|
|
(30
|
)
|
N/M
|
|
|||
|
Total personnel expense excluding merger-related charges
|
$
|
594
|
|
$
|
526
|
|
$
|
68
|
|
12.9
|
%
|
Net occupancy
Net occupancy expense
decrease
d
$9 million
, or
10.3%
, for the
first
quarter of
2018
, compared to the same period one year ago. This decrease was primarily due to lower property reserve and rental expenses.
Other noninterest expense
Other noninterest expense includes equipment, operating lease expense, marketing, FDIC assessment, intangible asset amortization, OREO expenses, and other miscellaneous expense categories. Other noninterest expense decreased $23 million, or 8.7%, from the year-ago quarter. Other expense declined from a year ago, primarily driven by a $20 million philanthropic contribution made in the first quarter of 2017. These declines are partially offset by higher marketing expense, higher operating lease expenses driven by increased volumes, and costs related to recent acquisitions.
Income taxes
We recorded tax expense from continuing operations of
$62 million
for the
first
quarter of
2018
and
$94 million
for the
first
quarter of
2017
.
Our federal tax expense differs from the amount that would be calculated using the federal statutory tax rate, primarily because we generate income from investments in tax-advantaged assets, such as corporate-owned life insurance and credits associated with renewable energy and low-income housing investments, and make periodic adjustments to our tax reserves. Tax expense for the three months ended
March 31, 2018
, and
March 31, 2017
, was affected by net discrete income tax benefits of $26 million and $19 million, respectively. Excluding those benefits, the tax expense for the
first
quarter of
2018
was $88 million.
Additional information pertaining to how our tax expense (benefit) and the resulting effective tax rates were derived is included in Note
14
(“
Income Taxes
”) beginning on page 156 of our
2017
Form 10-K.
Line of Business Results
This section summarizes the financial performance of our two major business segments (operating segments): Key Community Bank and Key Corporate Bank. Note
18
(“
Line of Business Results
”) describes the products and services offered by each of these business segments, provides more detailed financial information pertaining to the segments, and explains “Other Segments” and “Reconciling Items.”
Figure
13
summarizes the contribution made by each major business segment to our “taxable-equivalent revenue from continuing operations” and “income (loss) from continuing operations attributable to Key” for the
three-
month periods ended
March 31, 2018
, and
March 31, 2017
.
24
Figure 13. Major Business Segments — Taxable-Equivalent Revenue from Continuing Operations and Income (Loss) from Continuing Operations Attributable to Key
|
|
Three months ended
March 31, |
Change
|
|||||||||
|
dollars in millions
|
2018
|
2017
|
Amount
|
Percent
|
|||||||
|
REVENUE FROM CONTINUING OPERATIONS (TE)
|
|||||||||||
|
Key Community Bank
|
$
|
973
|
|
$
|
905
|
|
$
|
68
|
|
7.5
|
%
|
|
Key Corporate Bank
|
559
|
|
578
|
|
(19
|
)
|
(3.3
|
)
|
|||
|
Other Segments
|
22
|
|
29
|
|
(7
|
)
|
(24.1
|
)
|
|||
|
Total Segments
|
1,554
|
|
1,512
|
|
42
|
|
2.8
|
|
|||
|
Reconciling Items
(a)
|
(1
|
)
|
(6
|
)
|
5
|
|
N/M
|
|
|||
|
Total
|
$
|
1,553
|
|
$
|
1,506
|
|
$
|
47
|
|
3.1
|
%
|
|
INCOME (LOSS) FROM CONTINUING OPERATIONS ATTRIBUTABLE TO KEY
|
|
|
|||||||||
|
Key Community Bank
|
$
|
196
|
|
$
|
147
|
|
$
|
49
|
|
33.3
|
%
|
|
Key Corporate Bank
|
207
|
|
180
|
|
27
|
|
15.0
|
|
|||
|
Other Segments
|
19
|
|
21
|
|
(2
|
)
|
(9.5
|
)
|
|||
|
Total Segments
|
422
|
|
348
|
|
74
|
|
21.3
|
|
|||
|
Reconciling Items
(a)
|
(6
|
)
|
(24
|
)
|
18
|
|
N/M
|
|
|||
|
Total
|
$
|
416
|
|
$
|
324
|
|
$
|
92
|
|
28.4
|
%
|
|
|
|
||||||||||
|
(a)
|
Reconciling items consist primarily of the unallocated portion of merger-related charges and items not allocated to the business segments because they do not reflect their normal operations.
|
Key Community Bank summary of operations
As shown in Figure
14
, Key Community Bank recorded net income attributable to Key of
$196 million
for the
first
quarter of
2018
, compared to
$147 million
for the same period one year ago.
TE net interest income increased in the
first
quarter of
2018
compared to the
first
quarter of
2017
, primarily attributable to the benefit from higher interest rates and growth in loans. Average loans and leases increased from the year-ago quarter largely driven by a $1.1 billion, or 6.1%, increase in commercial and industrial loans. Average deposit balances increased from the year-ago quarter driven by increases in certificates of deposits and other time deposits.
The provision for credit losses increased slightly from the year-ago quarter while net loan charge-offs were flat as overall credit quality was stable.
Noninterest income was up from the year-ago quarter, driven by higher assets under management from market growth, as well as increases across several fee categories. During the first quarter of 2018, cards and payments income and other expense both declined due to the adoption of the new revenue recognition accounting standard resulting in no net impact to income. Excluding the impact of the new revenue recognition accounting standard, cards and payments income increased from the year-ago quarter driven by strength in our core products and the impact of the Key Merchant Services acquisition in the second quarter of 2017.
Noninterest expense increased from the year-ago quarter, as personnel expense increased $17 million driven by recent acquisitions and ongoing investments, including our residential mortgage platform and HelloWallet. Nonpersonnel expense increased $26 million driven by technology development costs, marketing expenses, higher volume related expenses, and the impact of recent acquisitions, including HelloWallet and Key Merchant Services.
25
Figure 14. Key Community Bank
|
|
Three months ended
March 31, |
Change
|
|||||||||
|
dollars in millions
|
2018
|
2017
|
Amount
|
Percent
|
|||||||
|
SUMMARY OF OPERATIONS
|
|||||||||||
|
Net interest income (TE)
|
$
|
688
|
|
$
|
628
|
|
$
|
60
|
|
9.6
|
%
|
|
Noninterest income
|
285
|
|
277
|
|
8
|
|
2.9
|
|
|||
|
Total revenue (TE)
|
973
|
|
905
|
|
68
|
|
7.5
|
|
|||
|
Provision for credit losses
|
48
|
|
46
|
|
2
|
|
4.3
|
|
|||
|
Noninterest expense
|
668
|
|
625
|
|
43
|
|
6.9
|
|
|||
|
Income (loss) before income taxes (TE)
|
257
|
|
234
|
|
23
|
|
9.8
|
|
|||
|
Allocated income taxes (benefit) and TE adjustments
|
61
|
|
87
|
|
(26
|
)
|
(29.9
|
)
|
|||
|
Net income (loss) attributable to Key
|
$
|
196
|
|
$
|
147
|
|
$
|
49
|
|
33.3
|
%
|
|
AVERAGE BALANCES
|
|||||||||||
|
Loans and leases
|
$
|
47,680
|
|
$
|
47,085
|
|
$
|
595
|
|
1.3
|
%
|
|
Total assets
|
51,681
|
|
51,063
|
|
618
|
|
1.2
|
|
|||
|
Deposits
|
79,945
|
|
79,148
|
|
797
|
|
1.0
|
|
|||
|
Assets under management at period end
|
$
|
39,003
|
|
$
|
37,417
|
|
$
|
1,586
|
|
4.2
|
%
|
ADDITIONAL KEY COMMUNITY BANK DATA
|
|
Three months ended
March 31, |
Change
|
|||||||||
|
dollars in millions
|
2018
|
2017
|
Amount
|
Percent
|
|||||||
|
NONINTEREST INCOME
|
|||||||||||
|
Trust and investment services income
|
$
|
104
|
|
$
|
98
|
|
$
|
6
|
|
6.1
|
%
|
|
Services charges on deposit accounts
|
76
|
|
75
|
|
1
|
|
1.3
|
|
|||
|
Cards and payments income
|
51
|
|
55
|
|
(4
|
)
|
(7.3
|
)
|
|||
|
Other noninterest income
|
54
|
|
49
|
|
5
|
|
10.2
|
|
|||
|
Total noninterest income
|
$
|
285
|
|
$
|
277
|
|
$
|
8
|
|
2.9
|
%
|
|
AVERAGE DEPOSITS OUTSTANDING
|
|||||||||||
|
NOW and money market deposit accounts
|
$
|
44,291
|
|
$
|
44,780
|
|
$
|
(489
|
)
|
(1.1
|
)%
|
|
Savings deposits
|
5,056
|
|
5,268
|
|
(212
|
)
|
(4.0
|
)
|
|||
|
Certificates of deposits ($100,000 or more)
|
4,961
|
|
3,879
|
|
1,082
|
|
27.9
|
|
|||
|
Other time deposits
|
4,856
|
|
4,692
|
|
164
|
|
3.5
|
|
|||
|
Noninterest-bearing deposits
|
20,781
|
|
20,529
|
|
252
|
|
1.2
|
|
|||
|
Total deposits
|
$
|
79,945
|
|
$
|
79,148
|
|
$
|
797
|
|
1.0
|
%
|
|
HOME EQUITY LOANS
|
|||||||||||
|
Average balance
|
$
|
11,763
|
|
$
|
12,456
|
|
|
|
|
||
|
Combined weighted-average loan-to-value ratio (at date of origination)
|
70
|
%
|
70
|
%
|
|||||||
|
Percent first lien positions
|
60
|
|
60
|
|
|||||||
|
OTHER DATA
|
|||||||||||
|
Branches
|
1,192
|
|
1,216
|
|
|
|
|
||||
|
Automated teller machines
|
1,569
|
|
1,594
|
|
|
|
|||||
Key Corporate Bank summary of operations
As shown in Figure
15
, Key Corporate Bank recorded net income attributable to Key of
$207 million
for the
first
quarter of
2018
, compared to
$180 million
for the same period one year ago.
TE net interest income decreased in the
first
quarter of
2018
compared to the
first
quarter of
2017
, primarily attributable to lower spreads on earning assets and lower purchase accounting accretion. Average loans and leases increased from the year-ago quarter largely driven by a $1.2 billion, or 5.2%, increase in commercial and industrial loans. Average deposit balances decreased from the year-ago quarter driven by the managed exit of higher cost corporate and public sector deposits.
The provision for credit losses and net loan charge-offs both decreased slightly from the year-ago quarter as overall credit quality continued to improve.
Noninterest income was up from the year-ago quarter, driven by higher investment banking and debt placement fees related to the acquisition of Cain Brothers as well as continued growth in our core franchise. Operating lease income and other leasing gains increased due to higher originations, and corporate services income increased due
26
to higher derivatives revenues. These increases were partially offset by a decline in other noninterest income related to lower gains from certain real estate investments.
Noninterest expense increased from the year-ago quarter, largely driven by higher operating lease expense and intangible asset amortization.
Figure 15. Key Corporate Bank
|
|
Three months ended
March 31, |
Change
|
|||||||||
|
dollars in millions
|
2018
|
2017
|
Amount
|
Percent
|
|||||||
|
SUMMARY OF OPERATIONS
|
|||||||||||
|
Net interest income (TE)
|
$
|
272
|
|
$
|
304
|
|
$
|
(32
|
)
|
(10.5
|
)%
|
|
Noninterest income
|
287
|
|
274
|
|
13
|
|
4.7
|
|
|||
|
Total revenue (TE)
|
559
|
|
578
|
|
(19
|
)
|
(3.3
|
)
|
|||
|
Provision for credit losses
|
14
|
|
18
|
|
(4
|
)
|
(22.2
|
)
|
|||
|
Noninterest expense
|
314
|
|
304
|
|
10
|
|
3.3
|
|
|||
|
Income (loss) before income taxes (TE)
|
231
|
|
256
|
|
(25
|
)
|
(9.8
|
)
|
|||
|
Allocated income taxes and TE adjustments
|
24
|
|
76
|
|
(52
|
)
|
(68.4
|
)
|
|||
|
Net income (loss)
|
$
|
207
|
|
$
|
180
|
|
$
|
27
|
|
15.0
|
|
|
Net income (loss) attributable to Key
|
$
|
207
|
|
$
|
180
|
|
$
|
27
|
|
15.0
|
%
|
|
AVERAGE BALANCES
|
|||||||||||
|
Loans and leases
|
$
|
38,260
|
|
$
|
37,688
|
|
$
|
572
|
|
1.5
|
%
|
|
Loans held for sale
|
1,118
|
|
1,097
|
|
21
|
|
1.9
|
|
|||
|
Total assets
|
45,549
|
|
44,124
|
|
1,425
|
|
3.2
|
|
|||
|
Deposits
|
20,815
|
|
21,002
|
|
(187
|
)
|
(.9
|
)%
|
|||
ADDITIONAL KEY CORPORATE BANK DATA
|
|
Three months ended
March 31, |
Change
|
|||||||||
|
dollars in millions
|
2018
|
2017
|
Amount
|
Percent
|
|||||||
|
NONINTEREST INCOME
|
|||||||||||
|
Trust and investment services income
|
$
|
29
|
|
$
|
37
|
|
$
|
(8
|
)
|
(21.6
|
)%
|
|
Investment banking and debt placement fees
|
141
|
|
124
|
|
17
|
|
13.7
|
|
|||
|
Operating lease income and other leasing gains
|
27
|
|
21
|
|
6
|
|
28.6
|
|
|||
|
Corporate services income
|
43
|
|
38
|
|
5
|
|
13.2
|
|
|||
|
Service charges on deposit accounts
|
13
|
|
12
|
|
1
|
|
8.3
|
|
|||
|
Cards and payments income
|
11
|
|
9
|
|
2
|
|
22.2
|
|
|||
|
Payments and services income
|
67
|
|
59
|
|
8
|
|
13.6
|
|
|||
|
Mortgage servicing fees
|
17
|
|
16
|
|
1
|
|
6.3
|
|
|||
|
Other noninterest income
|
6
|
|
17
|
|
(11
|
)
|
(64.7
|
)
|
|||
|
Total noninterest income
|
$
|
287
|
|
$
|
274
|
|
$
|
13
|
|
4.7
|
%
|
Other Segments
Other Segments consist of Corporate Treasury, Key’s Principal Investing unit, and various exit portfolios. Other Segments generated net income attributable to Key of $
19 million
for the
first
quarter of
2018
, compared to $
21 million
for the same period last year.
27
Financial Condition
Loans and loans held for sale
Figure 16. Breakdown of Loans at March 31, 2018
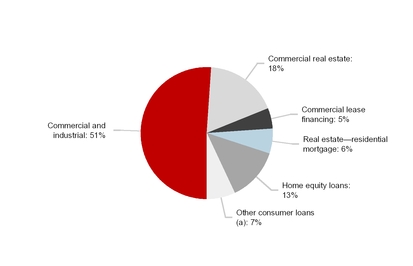
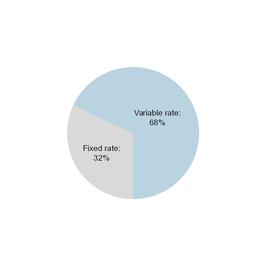
|
(a)
|
Other consumer loans include Consumer direct loans, Credit cards, and Consumer indirect loans. See Note
3
(“
Loans and Loans Held for Sale
”) Item 1. Financial Statements of this report.
|
At
March 31, 2018
, total loans outstanding from continuing operations were $
88.1 billion
, compared to
$86.4 billion
at
December 31, 2017
. For more information on balance sheet carrying value, see Note
1
(“
Summary of Significant Accounting Policies
”) under the headings “Loans” and “Loans Held for Sale” on page 100 of our
2017
Form 10-K.
Commercial loan portfolio
Commercial loans outstanding were $
64.8 billion
at
March 31, 2018
,
an increase
of $
2.0 billion
, or
3.3%
, compared to
December 31, 2017
, primarily driven by an increase in commercial and industrial loans. Figure
17
provides our commercial loan portfolios by industry classification at
March 31, 2018
, and
December 31, 2017
.
28
Figure 17. Commercial Loans by Industry
|
March 31, 2018
|
Commercial and industrial
|
Commercial
real estate
|
Commercial
lease financing
|
Total commercial
loans
|
Percent of
total
|
|||||||||||||
|
dollars in millions
|
||||||||||||||||||
|
Industry classification:
|
||||||||||||||||||
|
Agricultural
|
$
|
687
|
|
$
|
149
|
|
$
|
90
|
|
$
|
926
|
|
1.4
|
%
|
||||
|
Automotive
|
2,206
|
|
483
|
|
61
|
|
2,750
|
|
4.2
|
|
||||||||
|
Business products
|
2,053
|
|
151
|
|
51
|
|
2,255
|
|
3.5
|
|
||||||||
|
Business services
|
2,786
|
|
154
|
|
236
|
|
3,176
|
|
4.9
|
|
||||||||
|
Commercial real estate
|
6,061
|
|
10,242
|
|
22
|
|
16,325
|
|
25.2
|
|
||||||||
|
Construction materials and contractors
|
1,702
|
|
331
|
|
175
|
|
2,208
|
|
3.4
|
|
||||||||
|
Consumer discretionary
|
3,697
|
|
579
|
|
555
|
|
4,831
|
|
7.5
|
|
||||||||
|
Consumer services
|
2,990
|
|
952
|
|
214
|
|
4,156
|
|
6.4
|
|
||||||||
|
Equipment
|
1,542
|
|
131
|
|
112
|
|
1,785
|
|
2.7
|
|
||||||||
|
Financial
|
4,765
|
|
62
|
|
338
|
|
5,165
|
|
8.0
|
|
||||||||
|
Healthcare
|
3,396
|
|
2,173
|
|
367
|
|
5,936
|
|
9.2
|
|
||||||||
|
Materials manufacturing and mining
|
1,903
|
|
99
|
|
132
|
|
2,134
|
|
3.3
|
|
||||||||
|
Media
|
404
|
|
22
|
|
38
|
|
464
|
|
.7
|
|
||||||||
|
Oil and gas
|
1,217
|
|
45
|
|
50
|
|
1,312
|
|
2.0
|
|
||||||||
|
Public exposure
|
2,745
|
|
52
|
|
1,029
|
|
3,826
|
|
5.9
|
|
||||||||
|
Technology
|
599
|
|
10
|
|
8
|
|
617
|
|
1.0
|
|
||||||||
|
Transportation
|
1,444
|
|
227
|
|
782
|
|
2,453
|
|
3.8
|
|
||||||||
|
Utilities
|
3,505
|
|
6
|
|
338
|
|
3,849
|
|
5.9
|
|
||||||||
|
Other
|
611
|
|
—
|
|
—
|
|
611
|
|
1.0
|
|
||||||||
|
Total
|
$
|
44,313
|
|
$
|
15,868
|
|
$
|
4,598
|
|
$
|
64,779
|
|
100.0
|
%
|
||||
|
December 31, 2017
|
Commercial and industrial
|
Commercial
real estate
|
Commercial
lease financing
|
Total commercial
loans
|
Percent of
total
|
|||||||||||||
|
dollars in millions
|
||||||||||||||||||
|
Industry classification:
|
||||||||||||||||||
|
Agricultural
|
$
|
742
|
|
$
|
156
|
|
$
|
100
|
|
$
|
998
|
|
1.5
|
%
|
||||
|
Automotive
|
2,156
|
|
474
|
|
73
|
|
2,703
|
|
4.3
|
|
||||||||
|
Business products
|
1,845
|
|
148
|
|
52
|
|
2,045
|
|
3.3
|
|
||||||||
|
Business services
|
2,711
|
|
158
|
|
245
|
|
3,114
|
|
5.0
|
|
||||||||
|
Commercial real estate
|
5,595
|
|
10,392
|
|
23
|
|
16,010
|
|
25.5
|
|
||||||||
|
Construction materials and contractors
|
1,693
|
|
320
|
|
162
|
|
2,175
|
|
3.5
|
|
||||||||
|
Consumer discretionary
|
3,646
|
|
565
|
|
542
|
|
4,753
|
|
7.6
|
|
||||||||
|
Consumer services
|
3,005
|
|
937
|
|
262
|
|
4,204
|
|
6.7
|
|
||||||||
|
Equipment
|
1,505
|
|
137
|
|
118
|
|
1,760
|
|
2.8
|
|
||||||||
|
Financial
|
4,081
|
|
62
|
|
341
|
|
4,484
|
|
7.1
|
|
||||||||
|
Healthcare
|
3,246
|
|
2,233
|
|
389
|
|
5,868
|
|
9.4
|
|
||||||||
|
Materials manufacturing and mining
|
1,819
|
|
113
|
|
133
|
|
2,065
|
|
3.3
|
|
||||||||
|
Media
|
364
|
|
21
|
|
42
|
|
427
|
|
.7
|
|
||||||||
|
Oil and gas
|
1,095
|
|
21
|
|
51
|
|
1,167
|
|
1.9
|
|
||||||||
|
Public exposure
|
2,783
|
|
52
|
|
1,055
|
|
3,890
|
|
6.2
|
|
||||||||
|
Technology
|
579
|
|
3
|
|
8
|
|
590
|
|
.9
|
|
||||||||
|
Transportation
|
1,418
|
|
242
|
|
890
|
|
2,550
|
|
4.1
|
|
||||||||
|
Utilities
|
3,067
|
|
6
|
|
340
|
|
3,413
|
|
5.4
|
|
||||||||
|
Other
|
509
|
|
8
|
|
—
|
|
517
|
|
.8
|
|
||||||||
|
Total
|
$
|
41,859
|
|
$
|
16,048
|
|
$
|
4,826
|
|
$
|
62,733
|
|
100.0
|
%
|
||||
Commercial and industrial.
Commercial and industrial loans are the largest component of our loan portfolio, representing
50%
of our total loan portfolio at
March 31, 2018
, and
48%
at
December 31, 2017
. This portfolio is approximately 83% variable rate and consists of loans originated in both Key Corporate Bank and Key Community Bank to large corporate, middle market, and small business clients.
Commercial and industrial loans totaled
$44.3 billion
at
March 31, 2018
,
an increase
of
$2.5 billion
, or
5.9%
, compared to
December 31, 2017
. The growth was broad-based and spread across most industry categories, including increased lending in the financial, commercial real estate, and utilities industries, which combined accounted for approximately 65% of the growth at
March 31, 2018
.
Commercial real estate loans
. Our commercial real estate portfolio includes both mortgage and
construction loans, and is originated through two primary sources: our 15-state banking franchise, and KeyBank
Real Estate Capital, a national line of business that cultivates relationships with owners of commercial real estate
located both within and beyond the branch system. Approximately
69%
of our average commercial real estate loans are generated by our KeyBank Real Estate Capital line of business. Nonowner-occupied properties, generally properties for which at least 50% of the debt service is provided by rental income from nonaffiliated third parties, represented 79% of total commercial real estate loans outstanding at
March 31, 2018
. Construction loans, which provide a stream of funding for properties not fully leased at origination to support debt service payments over the term of the contract or project, represented 12% of commercial real estate loans at period end.
29
At
March 31, 2018
, commercial real estate loans totaled
$15.9 billion
, which includes
$1.9 billion
of construction loans. Compared to
December 31, 2017
, this portfolio
decreased
$180 million
, or
1.1%
. We continue to focus primarily on owners of completed and stabilized commercial real estate in accordance with our relationship strategy.
As shown in Figure
18
, our commercial real estate loan portfolio includes various property types and geographic
locations of the underlying collateral. These loans include commercial mortgage and construction loans in both Key
Community Bank and Key Corporate Bank.
Figure 18. Commercial Real Estate Loans
|
|
Geographic Region
|
Total
|
Percent of
Total
|
Construction
|
Commercial
Mortgage
|
|||||||||||||||||||||||||||
|
dollars in millions
|
West
|
Southwest
|
Central
|
Midwest
|
Southeast
|
Northeast
|
National
|
|||||||||||||||||||||||||
|
March 31, 2018
|
||||||||||||||||||||||||||||||||
|
Nonowner-occupied:
|
||||||||||||||||||||||||||||||||
|
Retail properties
|
$
|
220
|
|
$
|
129
|
|
$
|
118
|
|
$
|
191
|
|
$
|
205
|
|
$
|
834
|
|
$
|
313
|
|
$
|
2,010
|
|
12.7
|
%
|
$
|
255
|
|
$
|
1,755
|
|
|
Multifamily properties
|
441
|
|
234
|
|
770
|
|
409
|
|
802
|
|
1,982
|
|
238
|
|
4,876
|
|
30.7
|
|
1,107
|
|
3,769
|
|
||||||||||
|
Health facilities
|
98
|
|
—
|
|
55
|
|
157
|
|
211
|
|
886
|
|
453
|
|
1,860
|
|
11.7
|
|
75
|
|
1,785
|
|
||||||||||
|
Office buildings
|
251
|
|
13
|
|
87
|
|
121
|
|
165
|
|
1,017
|
|
64
|
|
1,718
|
|
10.8
|
|
125
|
|
1,593
|
|
||||||||||
|
Warehouses
|
71
|
|
25
|
|
20
|
|
101
|
|
68
|
|
343
|
|
92
|
|
720
|
|
4.5
|
|
37
|
|
683
|
|
||||||||||
|
Manufacturing facilities
|
9
|
|
—
|
|
5
|
|
2
|
|
22
|
|
72
|
|
66
|
|
176
|
|
1.1
|
|
9
|
|
167
|
|
||||||||||
|
Hotels/Motels
|
39
|
|
—
|
|
26
|
|
—
|
|
1
|
|
194
|
|
34
|
|
294
|
|
1.9
|
|
5
|
|
289
|
|
||||||||||
|
Residential properties
|
—
|
|
—
|
|
—
|
|
3
|
|
19
|
|
166
|
|
—
|
|
188
|
|
1.2
|
|
76
|
|
112
|
|
||||||||||
|
Land and development
|
23
|
|
—
|
|
5
|
|
3
|
|
3
|
|
69
|
|
—
|
|
103
|
|
.7
|
|
74
|
|
28
|
|
||||||||||
|
Other
|
5
|
|
—
|
|
29
|
|
13
|
|
2
|
|
335
|
|
205
|
|
589
|
|
3.7
|
|
6
|
|
584
|
|
||||||||||
|
Total nonowner-occupied
|
1,157
|
|
401
|
|
1,115
|
|
1,000
|
|
1,498
|
|
5,898
|
|
1,465
|
|
12,534
|
|
79.0
|
|
1,769
|
|
10,765
|
|
||||||||||
|
Owner-occupied
|
881
|
|
10
|
|
268
|
|
547
|
|
44
|
|
1,584
|
|
—
|
|
3,334
|
|
21.0
|
|
102
|
|
3,232
|
|
||||||||||
|
Total
|
$
|
2,038
|
|
$
|
411
|
|
$
|
1,383
|
|
$
|
1,547
|
|
$
|
1,542
|
|
$
|
7,482
|
|
$
|
1,465
|
|
15,868
|
|
100.0
|
%
|
$
|
1,871
|
|
$
|
13,997
|
|
|
|
December 31, 2017
|
||||||||||||||||||||||||||||||||
|
Total
|
$
|
2,071
|
|
$
|
387
|
|
$
|
1,320
|
|
$
|
1,730
|
|
$
|
1,939
|
|
$
|
7,758
|
|
$
|
843
|
|
$
|
16,048
|
|
$
|
1,960
|
|
$
|
14,088
|
|
||
|
March 31, 2018
|
||||||||||||||||||||||||||||||||
|
Nonowner-occupied:
|
||||||||||||||||||||||||||||||||
|
Nonperforming loans
|
—
|
|
—
|
|
—
|
|
$
|
1
|
|
$
|
10
|
|
$
|
11
|
|
—
|
|
$
|
22
|
|
N/M
|
|
—
|
|
$
|
22
|
|
|||||
|
Accruing loans past due 90 days or more
|
$
|
—
|
|
—
|
|
—
|
|
—
|
|
—
|
|
10
|
|
—
|
|
10
|
|
N/M
|
|
1
|
|
9
|
|
|||||||||
|
Accruing loans past due 30 through 89 days
|
—
|
|
—
|
|
—
|
|
2
|
|
3
|
|
43
|
|
—
|
|
48
|
|
N/M
|
|
$
|
34
|
|
14
|
|
|||||||||
|
West –
|
Alaska, California, Hawaii, Idaho, Montana, Oregon, Washington, and Wyoming
|
|
Southwest –
|
Arizona, Nevada, and New Mexico
|
|
Central –
|
Arkansas, Colorado, Oklahoma, Texas, and Utah
|
|
Midwest –
|
Illinois, Indiana, Iowa, Kansas, Michigan, Minnesota, Missouri, Nebraska, North Dakota, Ohio, South Dakota, and Wisconsin
|
|
Southeast –
|
Alabama, Delaware, Florida, Georgia, Kentucky, Louisiana, Maryland, Mississippi, North Carolina, South Carolina, Tennessee, Virginia, Washington D.C., and West Virginia
|
|
Northeast –
|
Connecticut, Maine, Massachusetts, New Hampshire, New Jersey, New York, Pennsylvania, Rhode Island, and Vermont
|
|
National –
|
Accounts in three or more regions
|
Consumer loan portfolio
Consumer loans outstanding
decreased
by
$362 million
, or
1.5%
, from
December 31, 2017
, driven by continued declines in the home equity loan portfolio, largely the result of pay downs on home equity lines of credit.
The home equity portfolio is comprised of loans originated by our Key Community Bank within our 15-state footprint and is the largest segment of our consumer loan portfolio, representing
50%
of consumer loans outstanding at
March 31, 2018
.
As shown in Figure
14
, we held the first lien position for approximately
60%
of the Key Community Bank home equity portfolio at both
March 31, 2018
, and
March 31, 2017
. For loans with real estate collateral, we track borrower performance monthly. Regardless of the lien position, credit metrics are refreshed quarterly, including recent FICO scores as well as updated loan-to-value ratios. This information is used in establishing the ALLL. Our methodology is described in Note
1
(“
Summary of Significant Accounting Policies
”) under the heading “Allowance for Loan and Lease Losses” beginning on page 102 of our
2017
Form 10-K.
30
Figure 19. Consumer Loans by State
|
March 31, 2018
|
Real estate — residential mortgage
|
Home equity loans
|
Consumer direct loans
|
Credit cards
|
Consumer indirect loans
|
Total
|
||||||||||||
|
State
|
||||||||||||||||||
|
New York
|
$
|
1,204
|
|
$
|
3,054
|
|
$
|
379
|
|
$
|
385
|
|
$
|
746
|
|
$
|
5,768
|
|
|
Ohio
|
435
|
|
1,619
|
|
382
|
|
239
|
|
298
|
|
2,973
|
|
||||||
|
Washington
|
662
|
|
1,772
|
|
223
|
|
99
|
|
14
|
|
2,770
|
|
||||||
|
Pennsylvania
|
323
|
|
775
|
|
68
|
|
45
|
|
233
|
|
1,444
|
|
||||||
|
California
|
49
|
|
34
|
|
16
|
|
4
|
|
50
|
|
153
|
|
||||||
|
Connecticut
|
811
|
|
416
|
|
19
|
|
19
|
|
151
|
|
1,416
|
|
||||||
|
Colorado
|
227
|
|
522
|
|
78
|
|
33
|
|
3
|
|
863
|
|
||||||
|
Oregon
|
342
|
|
918
|
|
82
|
|
43
|
|
3
|
|
1,388
|
|
||||||
|
Texas
|
4
|
|
23
|
|
8
|
|
3
|
|
22
|
|
60
|
|
||||||
|
New Jersey
|
22
|
|
23
|
|
13
|
|
3
|
|
514
|
|
575
|
|
||||||
|
Other
|
1,394
|
|
2,564
|
|
490
|
|
195
|
|
1,257
|
|
5,900
|
|
||||||
|
Total
|
$
|
5,473
|
|
$
|
11,720
|
|
$
|
1,758
|
|
$
|
1,068
|
|
$
|
3,291
|
|
$
|
23,310
|
|
|
December 31, 2017
|
||||||||||||||||||
|
Total
|
$
|
5,483
|
|
$
|
12,028
|
|
$
|
1,794
|
|
$
|
1,106
|
|
$
|
3,261
|
|
$
|
23,672
|
|
Loan sales
As shown in Figure
20
, during the first
three
months of
2018
, we sold
$2.7 billion
of loans. Sales of loans classified as held for sale generated net gains of
$44 million
in the first
three
months of
2018
.
Among the factors that we consider in determining which loans to sell are:
|
•
|
our business strategy for particular lending areas;
|
|
•
|
whether particular lending businesses meet established performance standards or fit with our relationship banking strategy;
|
|
•
|
our A/LM needs;
|
|
•
|
the cost of alternative funding sources;
|
|
•
|
the level of credit risk;
|
|
•
|
capital requirements; and
|
|
•
|
market conditions and pricing.
|
Figure
20
summarizes our loan sales for the first
three
months of
2018
and all of
2017
.
Figure 20. Loans Sold (Including Loans Held for Sale)
|
in millions
|
Commercial
|
Commercial
Real Estate
|
Commercial
Lease
Financing
|
Residential
Real Estate
|
Total
|
||||||||||
|
2018
|
|
|
|
|
|
||||||||||
|
First quarter
|
$
|
141
|
|
$
|
2,251
|
|
$
|
66
|
|
$
|
284
|
|
$
|
2,742
|
|
|
Total
|
$
|
141
|
|
$
|
2,251
|
|
$
|
66
|
|
$
|
284
|
|
$
|
2,742
|
|
|
2017
|
|
|
|
|
|
||||||||||
|
Fourth quarter
|
$
|
88
|
|
$
|
3,394
|
|
$
|
81
|
|
$
|
275
|
|
$
|
3,838
|
|
|
Third quarter
|
337
|
|
2,534
|
|
93
|
|
279
|
|
3,243
|
|
|||||
|
Second quarter
|
205
|
|
2,097
|
|
14
|
|
230
|
|
2,546
|
|
|||||
|
First quarter
|
49
|
|
2,011
|
|
83
|
|
194
|
|
2,337
|
|
|||||
|
Total
|
$
|
679
|
|
$
|
10,036
|
|
$
|
271
|
|
$
|
978
|
|
$
|
11,964
|
|
31
Figure
21
shows loans that are either administered or serviced by us, but not recorded on the balance sheet; this includes loans that were sold.
Figure 21. Loans Administered or Serviced
|
in millions
|
March 31, 2018
|
|
December 31, 2017
|
|
September 30, 2017
|
|
June 30, 2017
|
|
March 31, 2017
|
|
|||||
|
Commercial real estate loans
|
$
|
246,089
|
|
$
|
238,718
|
|
$
|
224,361
|
|
$
|
218,667
|
|
$
|
218,387
|
|
|
Residential mortgage
|
4,585
|
|
4,582
|
|
4,458
|
|
4,345
|
|
4,272
|
|
|||||
|
Education loans
|
888
|
|
932
|
|
974
|
|
1,019
|
|
1,067
|
|
|||||
|
Commercial lease financing
|
873
|
|
862
|
|
856
|
|
833
|
|
916
|
|
|||||
|
Commercial loans
|
498
|
|
488
|
|
458
|
|
446
|
|
427
|
|
|||||
|
Total
|
$
|
252,933
|
|
$
|
245,582
|
|
$
|
231,107
|
|
$
|
225,310
|
|
$
|
225,069
|
|
In the event of default by a borrower, we are subject to recourse with respect to approximately
$3.4 billion
of the
$252.9 billion
of loans administered or serviced at
March 31, 2018
. Additional information about this recourse arrangement is included in Note
15
(“
Contingent Liabilities and Guarantees
”) under the heading “Recourse agreement with FNMA.”
We derive income from several sources when retaining the right to administer or service loans that are sold. We earn noninterest income (recorded as “mortgage servicing fees”) from fees for servicing or administering loans. This fee income is reduced by the amortization of related servicing assets. In addition, we earn interest income from investing funds generated by escrow deposits collected in connection with the servicing loans. Additional information about our mortgage servicing assets is included in Note
8
(“
Mortgage Servicing Assets
”).
Securities
Our securities portfolio totaled
$30.1 billion
at
March 31, 2018
, compared to
$30.0 billion
at
December 31, 2017
. Available-for-sale securities were
$17.9 billion
at
March 31, 2018
, compared to
$18.1 billion
at
December 31, 2017
. Held-to-maturity securities were
$12.2 billion
at
March 31, 2018
, and
$11.8 billion
at
December 31, 2017
.
As shown in Figure
22
, all of our mortgage-backed securities, which include both securities available for sale and held-to-maturity securities, are issued by government-sponsored enterprises or GNMA and traded in liquid secondary markets. These securities are recorded on the balance sheet at fair value for the available-for-sale portfolio and at amortized cost for the held-to-maturity portfolio. For more information about these securities, see Note
5
(“
Fair Value Measurements
”) under the heading “Qualitative Disclosures of Valuation Techniques,” and Note
6
(“
Securities
”).
Figure 22. Mortgage-Backed Securities by Issuer
|
in millions
|
March 31, 2018
|
December 31, 2017
|
||||
|
FHLMC
|
$
|
5,896
|
|
$
|
5,897
|
|
|
FNMA
|
10,489
|
|
10,328
|
|
||
|
GNMA
|
13,502
|
|
13,543
|
|
||
|
Total
(a)
|
$
|
29,887
|
|
$
|
29,768
|
|
|
(a)
|
Includes securities held in the available-for-sale and held-to-maturity portfolios.
|
Securities available for sale
The majority of our securities available for sale portfolio consists of federal agency CMOs and mortgage-backed securities. CMOs are debt securities secured by a pool of mortgages or mortgage-backed securities. These mortgage securities generate interest income, serve as collateral to support certain pledging agreements, and provide liquidity value under regulatory requirements.
We periodically evaluate our securities available for sale portfolio in light of established A/LM objectives, changing market conditions that could affect the profitability of the portfolio, the regulatory requirements, and the level of interest rate risk to which we are exposed. These evaluations may cause us to take steps to adjust our overall balance sheet positioning.
In addition, the size and composition of our securities available for sale portfolio could vary with our needs for liquidity and the extent to which we are required (or elect) to hold these assets as collateral to secure public funds
32
and trust deposits. Although we generally use debt securities for this purpose, other assets, such as securities purchased under resale agreements or letters of credit, are used occasionally when they provide a lower cost of collateral or more favorable risk profiles.
Our investing activities continue to complement other balance sheet developments and provide for our ongoing liquidity management needs. Our actions to not reinvest the monthly security cash flows at various times provide the liquidity necessary to address our funding requirements. These funding requirements include ongoing loan growth and occasional debt maturities. At other times, we may make additional investments that go beyond the replacement of maturities or mortgage security cash flows as our liquidity position and/or interest rate risk management strategies may require. Lastly, our focus on investing in high quality liquid assets, including GNMA securities, is related to liquidity management strategies to satisfy regulatory requirements.
Figure
23
shows the composition, yields, and remaining maturities of our securities available for sale. For more information about these securities, including gross unrealized gains and losses by type of security and securities pledged, see Note
6
(“
Securities
”).
Figure 23. Securities Available for Sale
|
dollars in millions
|
U.S. Treasury, Agencies, and Corporations
|
States and
Political
Subdivisions
|
Agency Residential Collateralized Mortgage Obligations
(a)
|
Agency Residential Mortgage-backed Securities
(a)
|
Agency Commercial Mortgage-backed Securities
(a)
|
Other Securities
|
Total
|
Weighted-Average Yield
(b)
|
|||||||||||||||
|
March 31, 2018
|
|||||||||||||||||||||||
|
Remaining maturity:
|
|||||||||||||||||||||||
|
One year or less
|
—
|
|
$
|
3
|
|
$
|
112
|
|
$
|
17
|
|
—
|
|
—
|
|
$
|
132
|
|
3.29
|
%
|
|||
|
After one through five years
|
$
|
106
|
|
6
|
|
9,345
|
|
1,259
|
|
$
|
1,723
|
|
$
|
20
|
|
12,459
|
|
2.12
|
|
||||
|
After five through ten years
|
39
|
|
—
|
|
5,109
|
|
53
|
|
83
|
|
—
|
|
5,284
|
|
2.26
|
|
|||||||
|
After ten years
|
1
|
|
—
|
|
—
|
|
12
|
|
—
|
|
—
|
|
13
|
|
3.11
|
|
|||||||
|
Fair value
|
$
|
146
|
|
$
|
9
|
|
$
|
14,566
|
|
$
|
1,341
|
|
$
|
1,806
|
|
$
|
20
|
|
$
|
17,888
|
|
—
|
|
|
Amortized cost
|
151
|
|
9
|
|
15,037
|
|
1,376
|
|
1,902
|
|
17
|
|
18,492
|
|
2.17
|
%
|
|||||||
|
Weighted-average yield
(b)
|
1.78
|
%
|
5.20
|
%
|
2.18
|
%
|
2.11
|
%
|
2.22
|
%
|
—
|
|
2.17
|
%
|
—
|
|
|||||||
|
Weighted-average maturity
|
4.1 years
|
|
1.5 years
|
|
4.6 years
|
|
3.8 years
|
|
4.1 years
|
|
2.6 years
|
|
4.5 years
|
|
—
|
|
|||||||
|
December 31, 2017
|
|||||||||||||||||||||||
|
Fair value
|
$
|
157
|
|
$
|
9
|
|
$
|
14,660
|
|
$
|
1,439
|
|
$
|
1,854
|
|
$
|
20
|
|
$
|
18,139
|
|
—
|
|
|
Amortized cost
|
159
|
|
9
|
|
14,985
|
|
1,456
|
|
1,920
|
|
17
|
|
18,546
|
|
2.09
|
%
|
|||||||
|
(a)
|
Maturity is based upon expected average lives rather than contractual terms.
|
|
(b)
|
Weighted-average yields are calculated based on amortized cost. Such yields have been adjusted to a TE basis using the statutory federal income tax rate of
21%
.
|
Held-to-maturity securities
Federal agency CMOs and mortgage-backed securities constitute essentially all of our held-to-maturity securities. The remaining balance is comprised of foreign bonds. Figure
24
shows the composition, yields, and remaining maturities of these securities.
Figure 24. Held-to-Maturity Securities
|
dollars in millions
|
Agency Residential Collateralized Mortgage Obligations
(a)
|
Agency Residential Mortgage-backed Securities
(a)
|
Agency Commercial Mortgage-backed Securities
(a)
|
Other
Securities
|
Total
|
Weighted-Average Yield
(a)
|
|||||||||||
|
March 31, 2018
|
|||||||||||||||||
|
Remaining maturity:
|
|||||||||||||||||
|
One year or less
|
$
|
38
|
|
—
|
|
—
|
|
$
|
9
|
|
$
|
47
|
|
2.36
|
%
|
||
|
After one through five years
|
4,543
|
|
—
|
|
$
|
1,713
|
|
6
|
|
6,262
|
|
2.26
|
|
||||
|
After five through ten years
|
3,371
|
|
$
|
554
|
|
1,695
|
|
—
|
|
5,620
|
|
2.42
|
|
||||
|
After ten years
|
—
|
|
—
|
|
260
|
|
—
|
|
260
|
|
2.22
|
|
|||||
|
Amortized cost
|
$
|
7,952
|
|
$
|
554
|
|
$
|
3,668
|
|
$
|
15
|
|
$
|
12,189
|
|
2.34
|
%
|
|
Fair value
|
7,622
|
|
538
|
|
3,554
|
|
15
|
|
11,729
|
|
—
|
|
|||||
|
Weighted-average yield
|
2.08
|
%
|
2.69
|
%
|
2.84
|
%
|
2.85
|
%
|
2.34
|
%
|
—
|
|
|||||
|
Weighted-average maturity
|
4.7 years
|
|
6.5 years
|
|
6.8 years
|
|
1.4 years
|
|
5.4 years
|
|
—
|
|
|||||
|
December 31, 2017
|
|||||||||||||||||
|
Amortized cost
|
$
|
8,055
|
|
$
|
574
|
|
$
|
3,186
|
|
$
|
15
|
|
$
|
11,830
|
|
2.27
|
%
|
|
Fair value
|
7,831
|
|
571
|
|
3,148
|
|
15
|
|
11,565
|
|
—
|
|
|||||
|
(a)
|
Maturity is based upon expected average lives rather than contractual terms.
|
|
(a)
|
Weighted-average yields are calculated based on amortized cost. Such yields have been adjusted to a TE basis using the statutory federal income tax rate of
21%
.
|
33
Deposits and other sources of funds
Figure 25. Breakdown of Deposits at March 31, 2018
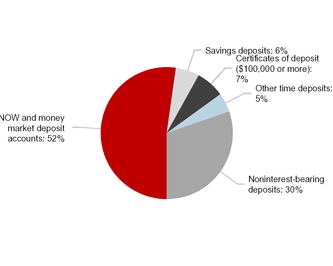
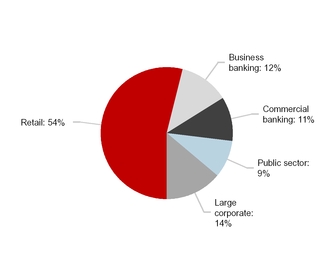
Deposits are our primary source of funding. At
March 31, 2018
, our deposits totaled
$104.8 billion
,
a decrease
of
$484 million
compared to
December 31, 2017
. Noninterest-bearing deposits decreased $2.1 billion, which were elevated during the fourth quarter of 2017 as a result of short-term escrows and seasonal deposit inflows. Partly offsetting the decline in noninterest-bearing deposits were increases in NOW and money market deposit accounts, which increased $979 million, and certificates of deposits and other time deposits, which increased $576 million, reflecting strength in Key’s retail banking franchise and growth from commercial relationships.
Wholesale funds, consisting of short-term borrowings and long-term debt, totaled
$15.5 billion
at March 31, 2018, compared to
$15.3 billion
at
December 31, 2017
. The
increase
in wholesale funds from
December 31, 2017
, reflects an increase in short-term borrowings as a result of strong commercial loan growth and seasonal deposit outflows during the first quarter of
2018
.
Capital
The objective of capital management is to maintain capital levels consistent with our risk appetite and of a sufficient amount to operate under a wide range of economic conditions. We have identified four primary uses of capital:
1. Investing in our businesses, supporting our clients, and loan growth;
2. Maintaining or increasing our Common Share dividend;
3. Returning capital in the form of Common Share repurchases to our shareholders; and
4. Remaining disciplined and opportunistic about how we invest in our franchise to include selective acquisitions
over time.
The following sections discuss certain ways we have deployed our capital. For further information, see the Consolidated Statements of Changes in Equity and Note
17
(“
Shareholders' Equity
”).
34
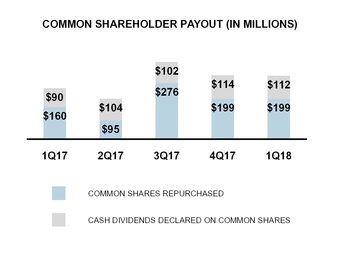
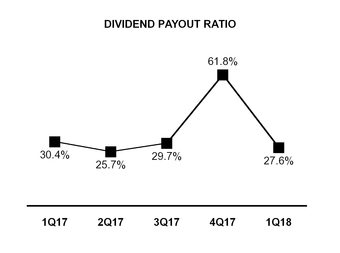
Dividends
Consistent with our 2017 capital plan, we paid a quarterly dividend of
$.105
per Common Share, for the
first
quarter of
2018
. We made a payment of
$12.50
per depositary share on the depositary shares related to our Series D Preferred Stock during the
first
quarter of
2018
, for a total of
$7 million
. We made a payment of
$.382813
per depositary share on the depositary shares related to our Series E Preferred Stock during the
first
quarter of
2018
, for a total of
$8 million
.
Further information regarding the capital planning process and CCAR is included under the heading “Capital planning and stress testing” in the “Supervision and Regulation” section beginning on page 12 of our
2017
Form 10-K.
Common shares outstanding
Our Common Shares are traded on the NYSE under the symbol KEY with 35,674 holders of record at
March 31, 2018
. Our book value per Common Share was
$13.07
based on
1.065 billion
shares outstanding at
March 31, 2018
, compared to
$13.09
per Common Share based on
1.069 billion
shares outstanding at
December 31, 2017
. At
March 31, 2018
, our tangible book value per Common Share was
$10.35
, compared to
$10.35
per Common Share at
December 31, 2017
.
Figure
26
shows activities that caused the change in outstanding common shares over the past five quarters.
Figure 26. Changes in Common Shares Outstanding
|
|
2018
|
2017
|
|||||||||
|
in thousands
|
First
|
|
Fourth
|
|
Third
|
|
Second
|
|
First
|
|
|
|
Shares outstanding at beginning of period
|
1,069,084
|
|
1,079,039
|
|
1,092,739
|
|
1,097,479
|
|
1,079,314
|
|
|
|
Open market repurchases and return of shares under employee compensation plans
|
(9,399
|
)
|
(10,617
|
)
|
(15,298
|
)
|
(5,072
|
)
|
(8,673
|
)
|
|
|
Shares issued under employee compensation plans (net of cancellations)
|
5,254
|
|
662
|
|
1,598
|
|
332
|
|
6,270
|
|
|
|
Series A Preferred Stock exchanged for common shares
|
—
|
|
—
|
|
—
|
|
—
|
|
20,568
|
|
|
|
Shares outstanding at end of period
|
1,064,939
|
|
1,069,084
|
|
1,079,039
|
|
1,092,739
|
|
1,097,479
|
|
|
As shown above, Common Shares outstanding decreased by 4.1 million shares during the
first
quarter of
2018
. This decrease was primarily due to common share repurchases under our 2017 capital plan.
At
March 31, 2018
, we had
191.8 million
treasury shares, compared to
187.6 million
treasury shares at
December 31, 2017
. Going forward we expect to reissue treasury shares as needed in connection with stock-based compensation awards and for other corporate purposes.
Information on repurchases of Common Shares by KeyCorp is included in Part II, Item 2. “Unregistered Sales of Equity Securities and Use of Proceeds” of this report.
35
Capital adequacy
Capital adequacy is an important indicator of financial stability and performance. All of our capital ratios remained in excess of regulatory requirements at
March 31, 2018
. Our capital and liquidity levels are intended to position us to weather an adverse operating environment while continuing to serve our clients’ needs, as well as to meet the Regulatory Capital Rules described in the “Supervision and regulation” section of Item 2 of this report. Our shareholders’ equity to assets ratio was
10.90%
at
March 31, 2018
, compared to
10.91%
at
December 31, 2017
. Our tangible common equity to tangible assets ratio was
8.22%
at
March 31, 2018
, compared to
8.23%
at
December 31, 2017
. The minimum capital and leverage ratios under the Regulatory Capital Rules together with the estimated ratios of KeyCorp at
March 31, 2018
, calculated on a fully phased-in basis, are set forth under the heading “Basel III” in the “Supervision and Regulation” section in Item 1 of our
2017
Form 10-K.
Figure
27
represents the details of our regulatory capital positions at
March 31, 2018
, and
December 31, 2017
, under the Regulatory Capital Rules. Information regarding the regulatory capital ratios of KeyCorp’s banking subsidiaries is presented annually, in Note
24
(“
Shareholders' Equity
”) beginning on page 182 of our
2017
Form 10-K.
Figure 27. Capital Components and Risk-Weighted Assets
|
dollars in millions
|
March 31, 2018
|
December 31, 2017
|
|||||
|
COMMON EQUITY TIER 1
|
|||||||
|
Key shareholders’ equity (GAAP)
|
$
|
14,944
|
|
$
|
15,023
|
|
|
|
Less:
|
Preferred Stock
(a)
|
1,009
|
|
1,009
|
|
||
|
Common Equity Tier 1 capital before adjustments and deductions
|
13,935
|
|
14,014
|
|
|||
|
Less:
|
Goodwill, net of deferred taxes
|
2,491
|
|
2,495
|
|
||
|
Intangible assets, net of deferred taxes
|
307
|
|
266
|
|
|||
|
Deferred tax assets
|
85
|
|
2
|
|
|||
|
Net unrealized gains (losses) on available-for-sale securities, net of deferred taxes
|
(461
|
)
|
(311
|
)
|
|||
|
Accumulated gains (losses) on cash flow hedges, net of deferred taxes
|
(185
|
)
|
(122
|
)
|
|||
|
Amounts in AOCI attributed to pension and postretirement benefit costs, net of deferred taxes
|
(388
|
)
|
(391
|
)
|
|||
|
Total Common Equity Tier 1 capital
|
$
|
12,086
|
|
$
|
12,075
|
|
|
|
TIER 1 CAPITAL
|
|||||||
|
Common Equity Tier 1
|
$
|
12,086
|
|
$
|
12,075
|
|
|
|
Additional Tier 1 capital instruments and related surplus
|
1,009
|
|
1,009
|
|
|||
|
Less:
|
Deductions
|
—
|
|
1
|
|
||
|
Total Tier 1 capital
|
13,095
|
|
13,083
|
|
|||
|
TIER 2 CAPITAL
|
|||||||
|
Tier 2 capital instruments and related surplus
|
1,351
|
|
1,310
|
|
|||
|
Allowance for losses on loans and liability for losses on lending-related commitments
(b)
|
959
|
|
952
|
|
|||
|
Less:
|
Deductions
|
—
|
|
—
|
|
||
|
Total Tier 2 capital
|
2,310
|
|
2,262
|
|
|||
|
Total risk-based capital
|
$
|
15,405
|
|
$
|
15,345
|
|
|
|
RISK-WEIGHTED ASSETS
|
|||||||
|
Risk-weighted assets on balance sheet
|
$
|
96,781
|
|
$
|
94,735
|
|
|
|
Risk-weighted off-balance sheet exposure
|
22,888
|
|
23,058
|
|
|||
|
Market risk-equivalent assets
|
1,317
|
|
1,019
|
|
|||
|
Gross risk-weighted assets
|
120,986
|
|
118,812
|
|
|||
|
Less:
|
Excess allowance for loan and lease losses
|
—
|
|
—
|
|
||
|
Net risk-weighted assets
|
$
|
120,986
|
|
$
|
118,812
|
|
|
|
AVERAGE QUARTERLY TOTAL ASSETS
|
$
|
134,225
|
|
$
|
134,484
|
|
|
|
CAPITAL RATIOS
|
|||||||
|
Tier 1 risk-based capital
|
10.82
|
%
|
11.01
|
%
|
|||
|
Total risk-based capital
|
12.73
|
|
12.92
|
|
|||
|
Leverage
(c)
|
9.76
|
|
9.73
|
|
|||
|
Common Equity Tier 1
|
9.99
|
|
10.16
|
|
|||
|
(a)
|
Net of capital surplus.
|
|
(b)
|
The ALLL included in Tier 2 capital is limited by regulation to 1.25% of the institution’s standardized total risk-weighted assets (excluding its standardized market risk-weighted assets). The ALLL includes
$16 million
of allowance classified as “discontinued assets” on the balance sheet at
March 31, 2018
, and
December 31, 2017
, respectively.
|
|
(c)
|
This ratio is Tier 1 capital divided by average quarterly total assets as defined by the Federal Reserve less: (i) goodwill, (ii) the disallowed intangible and deferred tax assets, and (iii) other deductions from assets for leverage capital purposes.
|
36
Risk Management
Overview
Like all financial services companies, we engage in business activities and assume the related risks. The most significant risks we face are credit, compliance, operational, liquidity, market, reputation, strategic, and model risks. Our risk management activities are focused on ensuring that we properly identify, measure, and manage such risks across the entire enterprise to maintain safety and soundness, and to maximize profitability.
The Board serves in an oversight capacity, ensuring that Key’s risks are managed in a manner that is not only effective and balanced, but also adds value for the shareholders. The Board understands Key’s risk philosophy, approves the risk appetite, inquires about risk practices, reviews the portfolio of risks, compares the actual risks to the risk appetite, and is apprised of significant risks, both actual and emerging, and determines whether management is responding appropriately. The Board challenges management and ensures accountability.
The Board’s Audit Committee assists the Board in oversight of financial statement integrity, regulatory and legal requirements, independent auditors’ qualifications and independence, and the performance of the internal audit function and independent auditors. The Audit Committee meets with management and approves significant policies relating to the risk areas overseen by the Audit Committee. The Audit Committee has responsibility over all risk review functions, including internal audit, as well as financial reporting, legal matters, and fraud risk. The Audit Committee also receives reports on enterprise risk. In addition to regularly scheduled bi-monthly meetings, the Audit Committee convenes to discuss the content of our financial disclosures and quarterly earnings releases.
The Board’s Risk Committee assists the Board in oversight of strategies, policies, procedures, and practices relating to the assessment and management of enterprise-wide risk, including credit, market, liquidity, model, operational, compliance, reputation, and strategic risks. The Risk Committee also assists the Board in overseeing risks related to capital adequacy, capital planning, and capital actions. The Risk Committee reviews and provides oversight of management’s activities related to the enterprise-wide risk management framework, which includes review of the ERM Policy, including the Risk Appetite Statement, and management and ERM reports. The Risk Committee also approves any material changes to the charter of the ERM Committee and significant policies relating to risk management.
The Audit and Risk Committees meet jointly, as appropriate, to discuss matters that relate to each committee’s responsibilities. Committee chairpersons routinely meet with management during interim months to plan agendas for upcoming meetings and to discuss emerging trends and events that have transpired since the preceding meeting. All members of the Board receive formal reports designed to keep them abreast of significant developments during the interim months.
Our ERM Committee, chaired by the Chief Executive Officer and comprising other senior level executives, is responsible for managing risk and ensuring that the corporate risk profile is managed in a manner consistent with our risk appetite. The ERM Program encompasses our risk philosophy, policy, framework, and governance structure for the management of risks across the entire company. The ERM Committee reports to the Board’s Risk Committee. Annually, the Board reviews and approves the ERM Policy, as well as the risk appetite, including corporate risk tolerances for major risk categories. We use a risk-adjusted capital framework to manage risks. This framework is approved and managed by the ERM Committee.
Tier 2 Risk Governance Committees support the ERM Committee by identifying early warning events and trends, escalating emerging risks, and discussing forward-looking assessments. Risk Governance Committees include attendees from each of the Three Lines of Defense. The First Line of Defense is the line of business primarily responsible to accept, own, proactively identify, monitor, and manage risk. The Second Line of Defense comprises Risk Management representatives who provide independent, centralized oversight over all risk categories by aggregating, analyzing, and reporting risk information. Risk Review, our internal audit function, provides the Third Line of Defense in its role to provide independent assessment and testing of the effectiveness of, appropriateness of, and adherence to KeyCorp’s risk management policies, practices, and controls. The Chief Risk Officer ensures that relevant risk information is properly integrated into strategic and business decisions, ensures appropriate ownership of risks, provides input into performance and compensation decisions, assesses aggregate enterprise risk, monitors capabilities to manage critical risks, and executes appropriate Board and stakeholder reporting.
37
Federal banking regulators continue to emphasize with financial institutions the importance of relating capital management strategy to the level of risk at each institution. We believe our internal risk management processes help us achieve and maintain capital levels that are commensurate with our business activities and risks, and conform to regulatory expectations.
Market risk management
Market risk is the risk that movements in market risk factors, including interest rates, foreign exchange rates, equity prices, commodity prices, credit spreads, and volatilities will reduce Key’s income and the value of its portfolios. These factors influence prospective yields, values, or prices associated with the instrument. We are exposed to market risk both in our trading and nontrading activities, which include asset and liability management activities. Information regarding our fair value policies, procedures, and methodologies is provided in Note
1
(“
Summary of Significant Accounting Policies
”) under the heading “Fair Value Measurements” on page 103 of our
2017
Form 10-K and Note
5
(“
Fair Value Measurements
”) in this report.
Trading market risk
Key incurs market risk as a result of trading activities that are used in support of client facilitation and hedging activities, principally within our investment banking and capital markets businesses. Key has exposures to a wide range of risk factors including interest rates, equity prices, foreign exchange rates, credit spreads, and commodity prices, as well as the associated implied volatilities and spreads. Our primary market risk exposures are a result of trading and hedging activities in the derivative and fixed income markets, including securitization exposures. At quarter-end, we did not have any re-securitization positions. We maintain modest trading inventories to facilitate customer flow, make markets in securities, and hedge certain risks including but not limited to credit risk and interest rate risk. The risks associated with these activities are mitigated in accordance with the Market Risk hedging policy. The majority of our positions are traded in active markets.
Market risk management is an integral part of Key’s risk culture. The Risk Committee of our Board provides oversight of trading market risks. The ERM Committee and the Market Risk Committee regularly review and discuss market risk reports prepared by our MRM group that contain our market risk exposures and results of monitoring activities. Market risk policies and procedures have been defined and approved by the Market Risk Committee, a Tier 2 Risk Governance Committee, and take into account our tolerance for risk and consideration for the business environment. Information regarding monitoring of trading positions and the activities related to the Market Risk Rule compliance can be found within the latest 10-K.
VaR and stressed VaR.
VaR is the estimate of the maximum amount of loss on an instrument or portfolio due to adverse market conditions during a given time interval within a stated confidence level. Stressed VaR is used to assess extreme conditions on market risk within our trading portfolios. The MRM group calculates VaR and stressed VaR on a daily basis, and the results are distributed to appropriate management. VaR and stressed VaR results are also provided to our regulators and utilized in regulatory capital calculations.
We use a historical simulation VaR model to measure the potential adverse effect of changes in interest rates, foreign exchange rates, equity prices, and credit spreads on the fair value of our covered positions and other non-covered positions. We analyze market risk by portfolios, and do not separately measure and monitor our portfolios by risk type. VaR is calculated using daily observations over a one-year time horizon, and approximates a 95% confidence level. Statistically, this means that we would expect to incur losses greater than VaR, on average, five out of 100 trading days, or three to four times each quarter. We also calculate VaR and stressed VaR at a 99% confidence level. For more information regarding our VaR model, its governance and assumptions see ”Market Risk Management” in Part II, Item 7, “Management’s Discussion and Analysis of Financial Condition and Results of Operations” on page 68 of our 2017 Form 10-K.
Actual losses for the total covered positions did not exceed aggregate daily VaR on any day during the quarters ended
March 31, 2018
, and
March 31, 2017
. The MRM group backtests our VaR model on a daily basis to evaluate its predictive power. The test compares VaR model results at the 99% confidence level to daily held profit and loss. Results of backtesting are provided to the Market Risk Committee. Backtesting exceptions occur when trading losses exceed VaR. We do not engage in correlation trading, or utilize the internal model approach for measuring default and credit migration risk. Our net VaR approach incorporates diversification, but our VaR calculation does not include the impact of counterparty risk and our own credit spreads on derivatives.
38
The aggregate VaR at the 99% confidence level with a one day holding period for all covered positions was $1 million at
March 31, 2018
, and $2 million at
March 31, 2017
. The decrease in aggregate VaR was primarily due to the decreased exposure in our fixed income portfolios. Starting with the third quarter of 2017, the aggregate VaR does not include the VaR for the credit derivatives that represented the hedging activities for the commercial real estate warehouse portfolio. These activities are no longer considered as covered portfolios. Figure
28
summarizes our VaR at the 99% confidence level with a one day holding period for significant portfolios of covered positions for the three months ended
March 31, 2018
, and
March 31, 2017
.
Figure 28. VaR for Significant Portfolios of Covered Positions
|
|
2018
|
2017
|
|||||||||||||||||||||||
|
|
Three months ended March 31,
|
|
Three months ended March 31,
|
|
|||||||||||||||||||||
|
in millions
|
High
|
|
Low
|
|
Mean
|
|
March 31,
|
|
High
|
|
Low
|
|
Mean
|
|
March 31,
|
||||||||||
|
Trading account assets:
|
|||||||||||||||||||||||||
|
Fixed income
|
$
|
1.0
|
|
$
|
.3
|
|
$
|
.7
|
|
$
|
.8
|
|
$
|
1.4
|
|
$
|
.7
|
|
$
|
1.1
|
|
$
|
1.2
|
|
|
|
Derivatives:
|
|||||||||||||||||||||||||
|
Interest rate
|
$
|
.1
|
|
—
|
|
$
|
.1
|
|
$
|
.1
|
|
$
|
.2
|
|
$
|
.1
|
|
$
|
.1
|
|
$
|
.1
|
|
||
|
Credit
|
—
|
|
—
|
|
—
|
|
—
|
|
.6
|
|
.1
|
|
.2
|
|
.6
|
|
|||||||||
Stressed VaR is calculated by running the portfolios through a predetermined stress period which is approved by the MRC and is calculated at the 99% confidence level using the same model and assumptions used for general VaR. The aggregate stressed VaR for all covered positions was $5.2 million at
March 31, 2018
, and $4.5 million at
March 31, 2017
. Figure
29
summarizes our stressed VaR at the 99% confidence level with a one day holding period for significant portfolios of covered positions for the three months ended
March 31, 2018
, and
March 31, 2017
.
Figure 29. Stressed VaR for Significant Portfolios of Covered Positions
|
|
2018
|
2017
|
|||||||||||||||||||||||
|
|
Three months ended March 31,
|
|
Three months ended March 31,
|
|
|||||||||||||||||||||
|
in millions
|
High
|
|
Low
|
|
Mean
|
|
March 31,
|
|
High
|
|
Low
|
|
Mean
|
|
March 31,
|
|
|||||||||
|
Trading account assets:
|
|||||||||||||||||||||||||
|
Fixed income
|
$
|
6.0
|
|
$
|
3.0
|
|
$
|
4.7
|
|
$
|
4.1
|
|
$
|
3.8
|
|
$
|
1.9
|
|
$
|
2.6
|
|
$
|
2.6
|
|
|
|
Derivatives:
|
|||||||||||||||||||||||||
|
Interest rate
|
$
|
.5
|
|
$
|
.3
|
|
$
|
.4
|
|
$
|
.4
|
|
$
|
.3
|
|
$
|
.1
|
|
$
|
.2
|
|
$
|
.2
|
|
|
|
Credit
|
—
|
|
—
|
|
—
|
|
—
|
|
1.2
|
|
.1
|
|
.4
|
|
1.1
|
|
|||||||||
Internal capital adequacy assessment.
Market risk is a component of our internal capital adequacy assessment. Our risk-weighted assets include a market risk-equivalent asset amount, which consists of a VaR component, stressed VaR component, a
de minimis
exposure amount, and a specific risk add-on including the securitization positions. The aggregate market value of the securitization positions as defined by the Market Risk Rule was $52 million at
March 31, 2018
. This amount included $25 million of mortgage-backed securities positions and $27 million of asset-backed securities positions. Specific risk is the price risk of individual financial instruments, which is not accounted for by changes in broad market risk factors and is measured through a standardized approach. Market risk weighted assets, including the specific risk calculations, are run quarterly by the MRM in accordance with the Market Risk Rule, and approved by the Chief Market Risk Officer.
Nontrading market risk
Most of our nontrading market risk is derived from interest rate fluctuations and its impacts on our traditional loan and deposit products, as well as investments, hedging relationships, long-term debt, and certain short-term borrowings. Interest rate risk, which is inherent in the banking industry, is measured by the potential for fluctuations in net interest income and the EVE. Such fluctuations may result from changes in interest rates and differences in the repricing and maturity characteristics of interest-earning assets and interest-bearing liabilities. We manage the exposure to changes in net interest income and the EVE in accordance with our risk appetite and in accordance with the Board approved ERM policy.
Interest rate risk positions are influenced by a number of factors including the balance sheet positioning that arises out of customer preferences for loan and deposit products, economic conditions, the competitive environment within our markets, changes in market interest rates that affect client activity, and our hedging, investing, funding, and capital positions. The primary components of interest rate risk exposure consist of reprice risk, basis risk, yield curve risk, and option risk.
39
|
•
|
“Reprice risk”
is the exposure to changes in the level of interest rates and occurs when the volume of interest-bearing liabilities and the volume of interest-earning assets they fund (e.g., deposits used to fund loans) do not mature or reprice at the same time.
|
|
•
|
“Basis risk”
is the exposure to asymmetrical changes in interest rate indices and occurs when floating-rate assets and floating-rate liabilities reprice at the same time, but in response to different market factors or indexes.
|
|
•
|
“Yield curve risk”
is the exposure to nonparallel changes in the slope of the yield curve (where the yield curve depicts the relationship between the yield on a particular type of security and its term to maturity) and occurs when interest-bearing liabilities and the interest-earning assets that they fund do not price or reprice to the same term point on the yield curve.
|
|
•
|
“Option risk”
is the exposure to a customer or counterparty’s ability to take advantage of the interest rate environment and terminate or reprice one of our assets, liabilities, or off-balance sheet instruments prior to contractual maturity without a penalty. Option risk occurs when exposures to customer and counterparty early withdrawals or prepayments are not mitigated with an offsetting position or appropriate compensation.
|
The management of nontrading market risk is centralized within Corporate Treasury. The Risk Committee of our Board provides oversight of nontrading market risk. The ERM Committee and the ALCO review reports on the interest rate risk exposures described above. In addition, the ALCO reviews reports on stress tests and sensitivity analyses related to interest rate risk. These committees have various responsibilities related to managing nontrading market risk, including recommending, approving, and monitoring strategies that maintain risk positions within approved tolerance ranges. The A/LM policy provides the framework for the oversight and management of interest rate risk and is administered by the ALCO. The MRM, as the second line of defense, provides additional oversight.
Net interest income simulation analysis.
The primary tool we use to measure our interest rate risk is simulation analysis. For purposes of this analysis, we estimate our net interest income based on the current and projected composition of our on- and off-balance sheet positions, accounting for recent and anticipated trends in customer activity. The analysis also incorporates assumptions for the current and projected interest rate environments, and balance sheet growth projections based on a most likely macroeconomic view. The results of simulation analysis reflect management’s desired interest rate risk positioning. The modeling incorporates investment portfolio and swap portfolio balances consistent with management’s desired interest rate risk positioning. The simulation model estimates the amount of net interest income at risk by simulating the change in net interest income that would occur if interest rates were to gradually increase or decrease over the next 12 months. Our standard rate scenarios encompass a gradual, parallel increase or decrease of 200 basis points, but due to the low interest rate environment, we have modified the standard decrease scenario to a gradual, parallel decrease of 150 basis points over nine months with no change over the following three months. After calculating the amount of net interest income at risk to interest rate changes, we compare that amount with the net interest income generated in an unchanged interest rate environment.
Figure
30
presents the results of the simulation analysis at
March 31, 2018
, and
March 31, 2017
. At
March 31, 2018
, our simulated impact to changes in interest rates was modestly asset-sensitive. In March 2018, the Federal Reserve increased the range for the Federal Funds Target Rate, which led to an increase in the magnitude of the declining rate scenario to 150 basis points. Tolerance levels for risk management require the development of remediation plans to maintain residual risk within tolerance if simulation modeling demonstrates that a gradual, parallel 200 basis point increase or 150 basis point decrease in interest rates over the next 12 months would adversely affect net interest income over the same period by more than 5.5%. As a result of the Federal Reserve’s interest rate increases, our modeled exposure to declining rates remains close to our tolerance levels.
Figure 30. Simulated Change in Net Interest Income
|
March 31, 2018
|
|
|
|||
|
Basis point change assumption (short-term rates)
|
-150
|
|
+200
|
||
|
Tolerance level
|
-5.50
|
|
%
|
-5.50
|
%
|
|
Interest rate risk assessment
|
-5.46
|
|
%
|
3.22
|
%
|
|
March 31, 2017
|
|
|
|||
|
Basis point change assumption (short-term rates)
|
-100
|
|
+200
|
||
|
Tolerance level
|
-5.50
|
|
%
|
-5.50
|
%
|
|
Interest rate risk assessment
|
-4.03
|
|
%
|
1.05
|
%
|
40
Simulation analysis produces a sophisticated estimate of interest rate exposure based on assumptions input into the model. We tailor certain assumptions to the specific interest rate environment and yield curve shape being modeled, and validate those assumptions on a regular basis. However, actual results may differ from those derived in simulation analysis due to unanticipated changes to the balance sheet composition, customer behavior, product pricing, market interest rates, changes in management’s desired interest rate risk positioning, investment, funding and hedging activities, and repercussions from unanticipated or unknown events.
We also perform regular stress tests and sensitivity analyses on the model inputs that could materially change the resulting risk assessments. Assessments are performed using different shapes of the yield curve, including steepening or flattening of the yield curve, immediate changes in market interest rates, and changes in the relationship of money market interest rates. Assessments are also performed on changes to the following assumptions: loan and deposit balances, the pricing of deposits without contractual maturities, changes in lending spreads, prepayments on loans and securities, investment, funding and hedging activities, and liquidity and capital management strategies.
The results of additional assessments indicate that net interest income could increase or decrease from the base simulation results presented in Figure
30
. Net interest income is highly dependent on the timing, magnitude, frequency, and path of interest rate changes and the associated assumptions for deposit repricing relationships, lending spreads, and the balance behavior of transaction accounts. If fixed rate assets increase by $1 billion, or fixed rate liabilities decrease by $1 billion, then the benefit to rising rates would decrease by approximately 30 basis points. If the interest bearing liquid deposit beta assumption increases or decreases by 5% (e.g. 40% to 45%), then the benefit to rising rates would change by approximately 90 basis points.
Our current interest rate risk position could fluctuate to higher or lower levels of risk depending on the competitive environment and client behavior that may affect the actual volume, mix, maturity, and repricing characteristics of loan and deposit flows. Treasury discretionary activities related to funding, investing, and hedging may also change as a result of changes in customer business flows, or changes in management’s desired interest rate risk positioning. As changes occur to both the configuration of the balance sheet and the outlook for the economy, management proactively evaluates hedging opportunities that may change our interest rate risk profile.
We also conduct simulations that measure the effect of changes in market interest rates in the second and third years of a three-year horizon. These simulations are conducted in a manner similar to those based on a 12-month horizon. To capture longer-term exposures, we calculate exposures to changes of the EVE as discussed in the following section.
Economic value of equity modeling.
EVE complements net interest income simulation analysis as it estimates risk exposure beyond 12-, 24-, and 36-month horizons. EVE modeling measures the extent to which the economic values of assets, liabilities and off-balance sheet instruments may change in response to fluctuations in interest rates. EVE is calculated by subjecting the balance sheet to an immediate 200 basis point increase or decrease in interest rates, measuring the resulting change in the values of assets, liabilities, and off-balance sheet instruments, and comparing those amounts with the base case of the current interest rate environment. Because the calculation of EVE under an immediate 200 basis point decrease in interest rates in the current low rate environment results in certain interest rates declining to zero and a less than 200 basis point decrease in certain yield curve term points, we have modified the standard declining rate scenario to an immediate 150 basis point decrease. This analysis is highly dependent upon assumptions applied to assets and liabilities with non-contractual maturities. Those assumptions are based on historical behaviors, as well as our expectations. We develop remediation plans that would maintain residual risk within tolerance if this analysis indicates that our EVE will decrease by more than 15% in response to an immediate increase or decrease in interest rates. We are operating within these guidelines as of
March 31, 2018
.
Management of interest rate exposure.
We use the results of our various interest rate risk analyses to formulate A/LM strategies to achieve the desired risk profile while managing to our objectives for capital adequacy and liquidity risk exposures. Specifically, we manage interest rate risk positions by purchasing securities, issuing term debt with floating or fixed interest rates, and using derivatives — predominantly in the form of interest rate swaps, which modify the interest rate characteristics of certain assets and liabilities.
Figure
31
shows all swap positions that we hold for A/LM purposes. These positions are used to convert the contractual interest rate index of agreed-upon amounts of assets and liabilities (i.e., notional amounts) to another interest rate index. For example, fixed-rate debt is converted to a floating rate through a “receive fixed/pay variable”
41
interest rate swap. The volume, maturity, and mix of portfolio swaps change frequently as we adjust our broader A/LM objectives and the balance sheet positions to be hedged. For more information about how we use interest rate swaps to manage our risk profile, see Note
7
(“
Derivatives and Hedging Activities
”).
Figure 31. Portfolio Swaps by Interest Rate Risk Management Strategy
|
|
March 31, 2018
|
|
|
|
||||||||||||||||
|
|
|
|
|
Weighted-Average
|
December 31, 2017
|
|
||||||||||||||
|
dollars in millions
|
Notional
Amount |
Fair
Value |
|
Maturity
(Years) |
Receive
Rate |
Pay
Rate |
Notional
Amount |
Fair
Value |
|
|||||||||||
|
Receive fixed/pay variable — conventional A/LM
(a)
|
$
|
18,125
|
|
$
|
(211
|
)
|
|
2.1
|
1.6
|
%
|
1.7
|
%
|
$
|
16,425
|
|
$
|
(126
|
)
|
|
|
|
Receive fixed/pay variable — forward A/LM
|
400
|
|
—
|
|
1.7
|
2.3
|
|
1.9
|
|
—
|
|
—
|
|
|||||||
|
Receive fixed/pay variable — conventional debt
|
9,210
|
|
(81
|
)
|
|
2.8
|
1.7
|
|
1.7
|
|
9,691
|
|
(9
|
)
|
|
|||||
|
Pay fixed/receive variable — conventional debt
|
50
|
|
(4
|
)
|
10.3
|
1.7
|
|
3.6
|
|
50
|
|
(6
|
)
|
|||||||
|
Total portfolio swaps
|
$
|
27,785
|
|
$
|
(296
|
)
|
(b)
|
2.3
|
1.6
|
%
|
1.7
|
%
|
$
|
26,166
|
|
$
|
(141
|
)
|
(b)
|
|
|
(a)
|
Portfolio swaps designated as A/LM are used to manage interest rate risk tied to both assets and liabilities.
|
|
(b)
|
Excludes accrued interest of
$333 million
and
$176 million
at
March 31, 2018
, and
December 31, 2017
, respectively.
|
Liquidity risk management
Liquidity risk, which is inherent in the banking industry, is measured by our ability to accommodate liability maturities and deposit withdrawals, meet contractual obligations, and fund new business opportunities at a reasonable cost, in a timely manner, and without adverse consequences. Liquidity management involves maintaining sufficient and diverse sources of funding to accommodate planned, as well as unanticipated, changes in assets and liabilities under both normal and adverse conditions.
Factors affecting liquidity
Our liquidity could be adversely affected by both direct and indirect events. An example of a direct event would be a downgrade in our public credit ratings by a rating agency. Examples of indirect events (events unrelated to us) that could impair our access to liquidity would be an act of terrorism or war, natural disasters, political events, or the default or bankruptcy of a major corporation, mutual fund or hedge fund. Similarly, market speculation, or rumors about us or the banking industry in general, may adversely affect the cost and availability of normal funding sources.
Our credit ratings at
March 31, 2018
, are shown in Figure
32
. We believe these credit ratings, under normal conditions in the capital markets, would enable KeyCorp or KeyBank to issue fixed income securities to investors.
Figure 32. Credit Ratings
|
March 31, 2018
|
Short-Term
Borrowings
|
Long-Term
Deposits
|
Senior
Long-Term
Debt
|
Subordinated
Long-Term
Debt
|
Capital
Securities
|
Preferred
Stock
|
|
KEYCORP (THE PARENT COMPANY)
|
||||||
|
Standard & Poor’s
|
A-2
|
N/A
|
BBB+
|
BBB
|
BB+
|
BB+
|
|
Moody’s
|
P-2
|
N/A
|
Baa1
|
Baa1
|
Baa2
|
Baa3
|
|
Fitch Ratings, Inc.
|
F1
|
N/A
|
A-
|
BBB+
|
BB+
|
BB
|
|
DBRS, Inc.
|
R-1 (low)
|
N/A
|
A (low)
|
BBB (high)
|
BBB (high)
|
BBB (low)
|
|
KEYBANK
|
||||||
|
Standard & Poor’s
|
A-2
|
N/A
|
A-
|
BBB+
|
N/A
|
N/A
|
|
Moody’s
|
P-2
|
Aa3
|
A3
|
Baa1
|
N/A
|
N/A
|
|
Fitch Ratings, Inc.
|
F1
|
A
|
A-
|
BBB+
|
N/A
|
N/A
|
|
DBRS, Inc.
|
R-1 (low)
|
A
|
A
|
A (low)
|
N/A
|
N/A
|
42
Sources of liquidity
Our primary source of funding for KeyBank is retail and commercial deposits. As of
March 31, 2018
, our loan-to-deposit ratio was
87%
. In addition, we also have available unused sources of wholesale funding and liquid assets and borrowing capacity at the FHLB of Cincinnati and Federal Reserve Bank of Cleveland. Our liquid asset portfolio at
March 31, 2018
, totaled $22.3 billion, consisting of $20.8 billion of unpledged securities, $264 million of securities available for secured funding at the FHLB, and $1.3 billion of net balances of federal funds sold and balances in our Federal Reserve account. Additionally, as of
March 31, 2018
, our unused borrowing capacity secured by loan collateral was $25.0 billion at the Federal Reserve Bank of Cleveland and $7.0 billion at the FHLB. During the
first
quarter of
2018
, our outstanding FHLB of Cincinnati advances were increased by $494 million as term advances were added.
During the first quarter of 2018, KeyBank issued $500 million of 3.375% Senior Bank Notes due March 7, 2023, under its Global Bank Note Program.
Liquidity for KeyCorp
The primary source of liquidity for KeyCorp is from subsidiary dividends, primarily from KeyBank. KeyCorp has sufficient liquidity when it can service its debt, support customary corporate operations and activities (including acquisitions), support occasional guarantees of subsidiaries’ obligations in transactions with third parties at a reasonable cost, in a timely manner, and without adverse consequences, and pay dividends to shareholders.
At
March 31, 2018
, KeyCorp held
$2.1 billion
in cash, which we projected to be sufficient to meet our projected obligations, including the repayment of our maturing debt obligations for the periods prescribed by our risk tolerance.
Typically, KeyCorp meets its liquidity requirements through regular dividends from KeyBank. During the
first
quarter of
2018
, KeyBank paid
$375 million
in dividends to KeyCorp. As of
March 31, 2018
, KeyBank had regulatory capacity to pay
$1.0 billion
in dividends to KeyCorp without prior regulatory approval.
Our liquidity position and recent activity
Over the past quarter, our liquid asset portfolio, which includes overnight and short-term investments, as well as unencumbered, high quality liquid securities held as protection against a range of potential liquidity stress scenarios, has decreased as a result of lower balances held at the Federal Reserve and a decrease in unpledged securities. The liquid asset portfolio continues to exceed the amount that we estimate would be necessary to manage through an adverse liquidity event by providing sufficient time to develop and execute a longer-term solution.
We generate cash flows from operations and from investing and financing activities. We have approximately $177 million of cash, cash equivalents, and short-term investments in international tax jurisdictions as of
March 31, 2018
. As we consider alternative long-term strategic and liquidity plans, opportunities to repatriate these amounts would result in approximately $2 million in taxes to be paid. We have included the appropriate amount as a deferred tax liability at
March 31, 2018
.
The Consolidated Statements of Cash Flows summarize our sources and uses of cash by type of activity for the
three-month
periods ended
March 31, 2018
, and
March 31, 2017
.
For more information regarding liquidity governance structure, factorings affecting liquidity, management of liquidity risk at KeyBank and KeyCorp, long-term liquidity strategies, and other liquidity programs see ”Liquidity Risk Management” in Part II, Item 7, “Management’s Discussion and Analysis of Financial Condition and Results of Operations” on page 73 of our 2017 Form 10-K.
Credit risk management
Credit risk is the risk of loss to us arising from an obligor’s inability or failure to meet contractual payment or performance terms. Like other financial services institutions, we make loans, extend credit, purchase securities, add financial and payments products, and enter into financial derivative contracts, all of which have related credit risk.
43
Credit policy, approval, and evaluation
We manage credit risk exposure through a multifaceted program. The Credit Risk Committee approves management credit policies and recommends for approval significant credit policies to the appropriate Board or Board committee. These policies are communicated throughout the organization to foster a consistent approach to granting credit.
Our credit risk management team and certain individuals within our lines of business, to whom credit risk management has delegated limited credit authority, are responsible for credit approval. Individuals with assigned credit authority are authorized to grant exceptions to credit policies. It is not unusual to make exceptions to established policies when mitigating circumstances dictate, however, a corporate level tolerance has been established to keep exceptions at an acceptable level based upon portfolio and economic considerations.
Our credit risk management team uses risk models to evaluate consumer loans. These models, known as scorecards, forecast the probability of serious delinquency and default for an applicant. The scorecards are embedded in the application processing system, which allows for real-time scoring and automated decisions for many of our products. We periodically validate the loan grading and scoring processes.
We maintain an active concentration management program to mitigate concentration risk in our credit portfolios. For individual obligors, we employ a sliding scale of exposure, known as hold limits, which is dictated by the type of loan and strength of the borrower. Our legal lending limit is approximately $2.2 billion for any individual borrower. However, internal hold limits generally restrict the largest exposures to less than 20% of that amount. As of
March 31, 2018
, we had 16 client relationships with loan commitments net of credit default swaps of more than $200 million. The average amount outstanding on these 16 individual net obligor commitments was $110 million at
March 31, 2018
. In general, our philosophy is to maintain a diverse portfolio with regard to credit exposures.
Credit default swaps are recorded on the balance sheet at fair value. Related gains or losses, as well as the premium paid or received for credit protection, are included in the “corporate services income” and “other income” components of noninterest income.
Selected asset quality statistics for each of the past five quarters are presented in Figure
33
. The factors that drive these statistics are discussed in the remainder of this section.
Figure 33. Selected Asset Quality Statistics from Continuing Operations
|
|
2018
|
2017
|
||||||||||||||
|
dollars in millions
|
First
|
|
Fourth
|
|
Third
|
|
Second
|
|
First
|
|
||||||
|
Net loan charge-offs
|
$
|
54
|
|
$
|
52
|
|
$
|
32
|
|
$
|
66
|
|
$
|
58
|
|
|
|
Net loan charge-offs to average total loans
|
.25
|
%
|
.24
|
%
|
.15
|
%
|
.31
|
%
|
.27
|
%
|
||||||
|
Allowance for loan and lease losses
|
$
|
881
|
|
$
|
877
|
|
$
|
880
|
|
$
|
870
|
|
$
|
870
|
|
|
|
Allowance for credit losses
(a)
|
941
|
|
934
|
|
937
|
|
918
|
|
918
|
|
||||||
|
Allowance for loan and lease losses to period-end loans
|
1.00
|
%
|
1.01
|
%
|
1.02
|
%
|
1.01
|
%
|
1.01
|
%
|
||||||
|
Allowance for credit losses to period-end loans
|
1.07
|
|
1.08
|
|
1.08
|
|
1.06
|
|
1.07
|
|
||||||
|
Allowance for loan and lease losses to nonperforming loans
(b)
|
162.8
|
|
174.4
|
|
170.2
|
|
171.6
|
|
151.8
|
|
||||||
|
Allowance for credit losses to nonperforming loans
(b)
|
173.9
|
|
185.7
|
|
181.2
|
|
181.1
|
|
160.2
|
|
||||||
|
Nonperforming loans at period end
(b)
|
$
|
541
|
|
$
|
503
|
|
$
|
517
|
|
$
|
507
|
|
$
|
573
|
|
|
|
Nonperforming assets at period end
(b)
|
569
|
|
534
|
|
556
|
|
556
|
|
623
|
|
||||||
|
Nonperforming loans to period-end portfolio loans
(b)
|
.61
|
%
|
.58
|
%
|
.60
|
%
|
.59
|
%
|
.67
|
%
|
||||||
|
Nonperforming assets to period-end portfolio loans plus OREO and other nonperforming assets
(b)
|
.65
|
|
.62
|
|
.64
|
|
.64
|
|
.72
|
|
||||||
|
(a)
|
Includes the ALLL plus the liability for credit losses on lending-related unfunded commitments.
|
|
(b)
|
Nonperforming loan balances exclude
$690 million
,
$738 million
,
$783 million
,
$835 million
, and
$812 million
of PCI loans at
March 31, 2018
,
December 31, 2017
,
September 30, 2017
,
June 30, 2017
, and
March 31, 2017
, respectively.
|
We estimate the appropriate level of the ALLL on at least a quarterly basis. The methodology used is described in Note
1
(“
Summary of Significant Accounting Policies
”) under the heading “Allowance for Loan and Lease Losses” beginning on page 102 of our
2017
Form 10-K. Briefly, our allowance applies incurred loss rates to existing loans with similar risk characteristics. We exercise judgment to assess any adjustment to the incurred loss rates for the impact of factors such as changes in economic conditions, lending policies including underwriting standards, and the level of credit risk associated with specific industries and markets. The ALLL at
March 31, 2018
, represents our best estimate of the incurred credit losses inherent in the loan portfolio at that date. For more information about impaired loans, see Note
4
(“
Asset Quality
”).
44
As shown in Figure
34
, our ALLL from continuing operations
increased
by
$4 million
, or
0.5%
, from
December 31, 2017
. Our commercial ALLL
increased
by
$7 million
, or
1.0%
, from
December 31, 2017
, primarily because of loan growth in the commercial and industrial loan portfolio, as well as credit quality migration. Our consumer ALLL
decreased
by
$3 million
, or
2.1%
, from
December 31, 2017
,
primarily due to continued improvement in credit quality metrics.
Figure 34. Allocation of the Allowance for Loan Lease Losses
|
|
March 31, 2018
|
December 31, 2017
|
|||||||||||||
|
dollars in millions
|
Amount
|
Percent of
Allowance to
Total Allowance
|
Percent of
Loan Type to
Total Loans
|
Amount
|
Percent of
Allowance to
Total Allowance
|
Percent of
Loan Type to
Total Loans
|
|||||||||
|
Commercial and industrial
|
$
|
533
|
|
60.5
|
%
|
50.3
|
%
|
$
|
529
|
|
60.3
|
%
|
48.4
|
%
|
|
|
Commercial real estate:
|
|||||||||||||||
|
Commercial mortgage
|
136
|
|
15.4
|
|
15.9
|
|
133
|
|
15.2
|
|
16.3
|
|
|||
|
Construction
|
33
|
|
3.8
|
|
2.1
|
|
30
|
|
3.4
|
|
2.3
|
|
|||
|
Total commercial real estate loans
|
169
|
|
19.2
|
|
18.0
|
|
163
|
|
18.6
|
|
18.6
|
|
|||
|
Commercial lease financing
|
40
|
|
4.5
|
|
5.2
|
|
43
|
|
4.9
|
|
5.6
|
|
|||
|
Total commercial loans
|
742
|
|
84.2
|
|
73.5
|
|
735
|
|
83.8
|
|
72.6
|
|
|||
|
Real estate — residential mortgage
|
9
|
|
1.0
|
|
6.2
|
|
7
|
|
.8
|
|
6.3
|
|
|||
|
Home equity loans
|
38
|
|
4.3
|
|
13.3
|
|
43
|
|
4.9
|
|
13.9
|
|
|||
|
Consumer direct loans
|
27
|
|
3.1
|
|
2.0
|
|
28
|
|
3.2
|
|
2.1
|
|
|||
|
Credit cards
|
45
|
|
5.1
|
|
1.2
|
|
44
|
|
5.0
|
|
1.3
|
|
|||
|
Consumer indirect loans
|
20
|
|
2.3
|
|
3.8
|
|
20
|
|
2.3
|
|
3.8
|
|
|||
|
Total consumer loans
|
139
|
|
15.8
|
|
26.5
|
|
142
|
|
16.2
|
|
27.4
|
|
|||
|
Total loans
(a)
|
$
|
881
|
|
100.0
|
%
|
100.0
|
%
|
$
|
877
|
|
100.0
|
%
|
100.0
|
%
|
|
|
(a)
|
Excludes allocations of the ALLL related to the discontinued operations of the education lending business in the amount of
$16 million
at
March 31, 2018
, and
December 31, 2017
, respectively.
|
Net loan charge-offs
Figure
35
shows the trend in our net loan charge-offs by loan type, while the composition of loan charge-offs and recoveries by type of loan is presented in Figure
36
.
Over the past 12 months, net loan charge-offs
decreased
$4 million
. This
decrease
is attributable to continued portfolio strength in our consumer loan portfolio. Net loan charge-offs for our commercial loan portfolio was flat compared to the year-ago quarter.
Figure 35. Net Loan Charge-offs from Continuing Operations
(a)
|
|
2018
|
2017
|
||||||||||||||
|
dollars in millions
|
First
|
|
Fourth
|
|
Third
|
|
Second
|
|
First
|
|
||||||
|
Commercial and industrial
|
$
|
31
|
|
$
|
24
|
|
$
|
4
|
|
$
|
38
|
|
$
|
27
|
|
|
|
Real estate — Commercial mortgage
|
1
|
|
1
|
|
5
|
|
3
|
|
—
|
|
||||||
|
Real estate — Construction
|
(1
|
)
|
—
|
|
2
|
|
—
|
|
(1
|
)
|
||||||
|
Commercial lease financing
|
—
|
|
4
|
|
(2
|
)
|
1
|
|
5
|
|
||||||
|
Total commercial loans
|
31
|
|
29
|
|
9
|
|
42
|
|
31
|
|
||||||
|
Real estate — Residential mortgage
|
1
|
|
1
|
|
(1
|
)
|
3
|
|
(4
|
)
|
||||||
|
Home equity loans
|
1
|
|
4
|
|
2
|
|
4
|
|
5
|
|
||||||
|
Consumer direct loans
|
6
|
|
6
|
|
7
|
|
6
|
|
9
|
|
||||||
|
Credit cards
|
11
|
|
9
|
|
10
|
|
10
|
|
10
|
|
||||||
|
Consumer indirect loans
|
4
|
|
3
|
|
5
|
|
1
|
|
7
|
|
||||||
|
Total consumer loans
|
23
|
|
23
|
|
23
|
|
24
|
|
27
|
|
||||||
|
Total net loan charge-offs
|
$
|
54
|
|
$
|
52
|
|
$
|
32
|
|
$
|
66
|
|
$
|
58
|
|
|
|
Net loan charge-offs to average loans
|
.25
|
%
|
.24
|
%
|
.15
|
%
|
.31
|
%
|
.27
|
%
|
||||||
|
Net loan charge-offs from discontinued operations — education lending business
|
$
|
2
|
|
$
|
4
|
|
$
|
8
|
|
$
|
2
|
|
$
|
4
|
|
|
|
(a)
|
Credit amounts indicate that recoveries exceeded charge-offs.
|
45
Figure 36. Summary of Loan and Lease Loss Experience from Continuing Operations
|
|
Three months ended March 31,
|
|||||
|
dollars in millions
|
2018
|
|
2017
|
|
||
|
Average loans outstanding
|
$
|
86,927
|
|
$
|
86,133
|
|
|
Allowance for loan and lease losses at beginning of period
|
$
|
877
|
|
$
|
858
|
|
|
Loans charged off:
|
||||||
|
Commercial and industrial
|
37
|
|
32
|
|
||
|
Real estate — commercial mortgage
|
1
|
|
—
|
|
||
|
Real estate — construction
|
—
|
|
—
|
|
||
|
Total commercial real estate loans
(a)
|
1
|
|
—
|
|
||
|
Commercial lease financing
|
1
|
|
7
|
|
||
|
Total commercial loans
(b)
|
39
|
|
39
|
|
||
|
Real estate — residential mortgage
|
1
|
|
(2
|
)
|
||
|
Home equity loans
|
4
|
|
8
|
|
||
|
Consumer direct loans
|
8
|
|
10
|
|
||
|
Credit cards
|
12
|
|
11
|
|
||
|
Consumer indirect loans
|
8
|
|
11
|
|
||
|
Total consumer loans
|
33
|
|
38
|
|
||
|
Total loans charged off
|
72
|
|
77
|
|
||
|
Recoveries:
|
||||||
|
Commercial and industrial
|
6
|
|
5
|
|
||
|
Real estate — commercial mortgage
|
—
|
|
—
|
|
||
|
Real estate — construction
|
1
|
|
1
|
|
||
|
Total commercial real estate loans
(a)
|
1
|
|
1
|
|
||
|
Commercial lease financing
|
1
|
|
2
|
|
||
|
Total commercial loans
(b)
|
8
|
|
8
|
|
||
|
Real estate — residential mortgage
|
—
|
|
2
|
|
||
|
Home equity loans
|
3
|
|
3
|
|
||
|
Consumer direct loans
|
2
|
|
1
|
|
||
|
Credit cards
|
1
|
|
1
|
|
||
|
Consumer indirect loans
|
4
|
|
4
|
|
||
|
Total consumer loans
|
10
|
|
11
|
|
||
|
Total recoveries
|
18
|
|
19
|
|
||
|
Net loan charge-offs
|
(54
|
)
|
(58
|
)
|
||
|
Provision (credit) for loan and lease losses
|
58
|
|
70
|
|
||
|
Allowance for loan and lease losses at end of period
|
$
|
881
|
|
$
|
870
|
|
|
Liability for credit losses on lending-related commitments at beginning of period
|
$
|
57
|
|
$
|
55
|
|
|
Provision (credit) for losses on lending-related commitments
|
3
|
|
(7
|
)
|
||
|
Liability for credit losses on lending-related commitments at end of period
(c)
|
$
|
60
|
|
$
|
48
|
|
|
Total allowance for credit losses at end of period
|
$
|
941
|
|
$
|
918
|
|
|
Net loan charge-offs to average total loans
|
.25
|
%
|
.27
|
%
|
||
|
Allowance for loan and lease losses to period-end loans
|
1.00
|
|
1.01
|
|
||
|
Allowance for credit losses to period-end loans
|
1.07
|
|
1.07
|
|
||
|
Allowance for loan and lease losses to nonperforming loans
|
162.8
|
|
151.8
|
|
||
|
Allowance for credit losses to nonperforming loans
|
173.9
|
|
160.2
|
|
||
|
Discontinued operations — education lending business:
|
||||||
|
Loans charged off
|
$
|
4
|
|
$
|
6
|
|
|
Recoveries
|
2
|
|
2
|
|
||
|
Net loan charge-offs
|
$
|
(2
|
)
|
$
|
(4
|
)
|
|
(a)
|
See Figure
18
entitled “
Commercial Real Estate Loans
” and the accompanying discussion in the “Loans and loans held for sale” section for more information related to our commercial real estate loan portfolio.
|
|
(b)
|
See Figure
17
entitled “
Commercial Loans by Industry
” and the accompanying discussion in the “Loans and loans held for sale” section for more information related to our commercial loan portfolio.
|
|
(c)
|
Included in “accrued expense and other liabilities” on the balance sheet.
|
46
Nonperforming assets
Figure
37
shows the composition of our nonperforming assets. As shown in Figure
37
, nonperforming assets at
March 31, 2018
,
increased
$35 million
from
December 31, 2017
. This increase was largely driven by credit migration within our commercial and industrial loan portfolio. See Note
1
(“
Summary of Significant Accounting Policies
”) under the headings “Nonperforming Loans,” “Impaired Loans,” and “Allowance for Loan and Lease Losses” beginning on page 101 of our
2017
Form 10-K for a summary of our nonaccrual and charge-off policies.
Figure 37. Summary of Nonperforming Assets and Past Due Loans from Continuing Operations
|
dollars in millions
|
March 31, 2018
|
|
December 31, 2017
|
|
September 30, 2017
|
|
June 30, 2017
|
|
March 31, 2017
|
|
|||||
|
Commercial and industrial
|
$
|
189
|
|
$
|
153
|
|
$
|
169
|
|
$
|
178
|
|
$
|
258
|
|
|
Real estate — commercial mortgage
|
33
|
|
30
|
|
30
|
|
34
|
|
32
|
|
|||||
|
Real estate — construction
|
2
|
|
2
|
|
2
|
|
4
|
|
2
|
|
|||||
|
Total commercial real estate loans
(a)
|
35
|
|
32
|
|
32
|
|
38
|
|
34
|
|
|||||
|
Commercial lease financing
|
5
|
|
6
|
|
11
|
|
11
|
|
5
|
|
|||||
|
Total commercial loans
(b)
|
229
|
|
191
|
|
212
|
|
227
|
|
297
|
|
|||||
|
Real estate — residential mortgage
|
59
|
|
58
|
|
57
|
|
58
|
|
54
|
|
|||||
|
Home equity loans
|
229
|
|
229
|
|
227
|
|
208
|
|
207
|
|
|||||
|
Consumer direct loans
|
4
|
|
4
|
|
3
|
|
2
|
|
3
|
|
|||||
|
Credit cards
|
2
|
|
2
|
|
2
|
|
2
|
|
3
|
|
|||||
|
Consumer indirect loans
|
18
|
|
19
|
|
16
|
|
10
|
|
9
|
|
|||||
|
Total consumer loans
|
312
|
|
312
|
|
305
|
|
280
|
|
276
|
|
|||||
|
Total nonperforming loans
(c)
|
541
|
|
503
|
|
517
|
|
507
|
|
573
|
|
|||||
|
OREO
|
28
|
|
31
|
|
39
|
|
48
|
|
49
|
|
|||||
|
Other nonperforming assets
|
—
|
|
—
|
|
—
|
|
1
|
|
1
|
|
|||||
|
Total nonperforming assets
(c)
|
$
|
569
|
|
$
|
534
|
|
$
|
556
|
|
$
|
556
|
|
$
|
623
|
|
|
Accruing loans past due 90 days or more
|
$
|
82
|
|
$
|
89
|
|
$
|
86
|
|
$
|
85
|
|
$
|
79
|
|
|
Accruing loans past due 30 through 89 days
|
305
|
|
359
|
|
329
|
|
340
|
|
312
|
|
|||||
|
Restructured loans — accruing and nonaccruing
(d)
|
317
|
|
317
|
|
315
|
|
333
|
|
302
|
|
|||||
|
Restructured loans included in nonperforming loans
(d)
|
179
|
|
189
|
|
187
|
|
193
|
|
161
|
|
|||||
|
Nonperforming assets from discontinued operations — education lending business
|
6
|
|
7
|
|
8
|
|
5
|
|
4
|
|
|||||
|
Nonperforming loans to period-end portfolio loans
(c)
|
.61
|
%
|
.58
|
%
|
.60
|
%
|
.59
|
%
|
.67
|
%
|
|||||
|
Nonperforming assets to period-end portfolio loans plus OREO and other nonperforming assets
(c)
|
.65
|
|
.62
|
%
|
.64
|
%
|
.64
|
%
|
.72
|
%
|
|||||
|
(a)
|
See Figure
18
and the accompanying discussion in the “Loans and loans held for sale” section for more information related to our commercial real estate loan portfolio.
|
|
(b)
|
See Figure
17
and the accompanying discussion in the “Loans and loans held for sale” section for more information related to our commercial loan portfolio.
|
|
(c)
|
Nonperforming loan balances exclude
$690 million
,
$738 million
,
$783 million
,
$835 million
, and
$812 million
of PCI loans at
March 31, 2018
,
December 31, 2017
,
September 30, 2017
,
June 30, 2017
, and
March 31, 2017
, respectively.
|
|
(d)
|
Restructured loans (i.e., TDRs) are those for which Key, for reasons related to a borrower’s financial difficulties, grants a concession to the borrower that it would not otherwise consider. These concessions are made to improve the collectability of the loan and generally take the form of a reduction of the interest rate, extension of the maturity date or reduction in the principal balance.
|
Figure
38
shows the types of activity that caused the change in our nonperforming loan balance during each of the last five quarters.
Figure 38. Summary of Changes in Nonperforming Loans from Continuing Operations
|
|
2018
|
2017
|
||||||||||||||
|
in millions
|
First
|
|
Fourth
|
|
Third
|
|
Second
|
|
First
|
|
||||||
|
Balance at beginning of period
|
$
|
503
|
|
$
|
517
|
|
$
|
507
|
|
$
|
573
|
|
$
|
625
|
|
|
|
Loans placed on nonaccrual status
|
182
|
|
137
|
|
181
|
|
143
|
|
218
|
|
||||||
|
Charge-offs
|
(70
|
)
|
(67
|
)
|
(71
|
)
|
(82
|
)
|
(77
|
)
|
||||||
|
Loans sold
|
—
|
|
—
|
|
(1
|
)
|
—
|
|
(8
|
)
|
||||||
|
Payments
|
(29
|
)
|
(52
|
)
|
(32
|
)
|
(84
|
)
|
(59
|
)
|
||||||
|
Transfers to OREO
|
(4
|
)
|
(8
|
)
|
(10
|
)
|
(8
|
)
|
(11
|
)
|
||||||
|
Loans returned to accrual status
|
(41
|
)
|
(24
|
)
|
(57
|
)
|
(35
|
)
|
(115
|
)
|
||||||
|
Balance at end of period
(a)
|
$
|
541
|
|
$
|
503
|
|
$
|
517
|
|
$
|
507
|
|
$
|
573
|
|
|
|
(a)
|
Nonperforming loan balances exclude
$690 million
,
$738 million
,
$783 million
,
$835 million
, and
$812 million
of PCI loans at
March 31, 2018
,
December 31, 2017
,
September 30, 2017
,
June 30, 2017
, and
March 31, 2017
, respectively.
|
Operational and compliance risk management
Like all businesses, we are subject to operational risk, which is the risk of loss resulting from human error or malfeasance, inadequate or failed internal processes and systems, and external events. These events include, among other things, threats to our cybersecurity, as we are reliant upon information systems and the Internet to
47
conduct our business activities. Operational risk also encompasses compliance risk, which is the risk of loss from violations of, or noncompliance with, laws, rules and regulations, prescribed practices, and ethical standards. Under the Dodd-Frank Act, large financial companies like Key are subject to heightened prudential standards and regulation. This heightened level of regulation has increased our operational risk. Resulting operational risk losses and/or additional regulatory compliance costs could take the form of explicit charges, increased operational costs, harm to our reputation, or foregone opportunities.
We seek to mitigate operational risk through identification and measurement of risk, alignment of business strategies with risk appetite and tolerance, and a system of internal controls and reporting. We continuously strive to strengthen our system of internal controls to improve the oversight of our operational risk and to ensure compliance with laws, rules, and regulations. For example, an operational event database tracks the amounts and sources of operational risk and losses. This tracking mechanism helps to identify weaknesses and to highlight the need to take corrective action. We also rely upon software programs designed to assist in assessing operational risk and monitoring our control processes. This technology has enhanced the reporting of the effectiveness of our controls to senior management and the Board.
The Operational Risk Management Program provides the framework for the structure, governance, roles, and responsibilities, as well as the content, to manage operational risk for Key. The Compliance Risk Committee serves the same function in managing compliance risk for Key. Primary responsibility for managing and monitoring internal control mechanisms lies with the managers of our various lines of business. The Operational Risk Committee and Compliance Risk Committee are senior management committees that oversee our level of operational and compliance risk and direct and support our operational and compliance infrastructure and related activities. These committees and the Operational Risk Management and Compliance functions are an integral part of our ERM Program. Our Risk Review function regularly assesses the overall effectiveness of our Operational Risk Management and Compliance Programs and our system of internal controls. Risk Review reports the results of reviews on internal controls and systems to senior management and the Risk and Audit Committees and independently supports the Risk Committee’s oversight of these controls.
Cybersecurity
We maintain comprehensive Cyber Incident Response Plans, and we devote significant time and resources to maintaining and regularly updating our technology systems and processes to protect the security of our computer systems, software, networks, and other technology assets against attempts by third parties to obtain unauthorized access to confidential information, destroy data, disrupt or degrade service, sabotage systems, or cause other damage. We and many other U.S. financial institutions have experienced distributed denial-of-service attacks from technologically sophisticated third parties. These attacks are intended to disrupt or disable online banking services and prevent banking transactions. We also periodically experience other attempts to breach the security of our systems and data. These cyberattacks have not, to date, resulted in any material disruption of our operations or material harm to our customers, and have not had a material adverse effect on our results of operations.
Cyberattack risks may also occur with our third-party technology service providers, and may result in financial loss or liability that could adversely affect our financial condition or results of operations. Cyberattacks could also interfere with third-party providers’ ability to fulfill their contractual obligations to us. Recent high-profile cyberattacks have targeted retailers, credit bureaus, and other businesses for the purpose of acquiring the confidential information (including personal, financial, and credit card information) of customers, some of whom are customers of ours. We may incur expenses related to the investigation of such attacks or related to the protection of our customers from identity theft as a result of such attacks. We may also incur expenses to enhance our systems or processes in order to protect our customers whose information may have been exposed through the recent breach of the Equifax credit bureau or other external security incidents. Risks and exposures related to cyberattacks are expected to remain high for the foreseeable future due to the rapidly evolving nature and sophistication of these threats, as well as due to the expanding use of Internet banking, mobile banking, and other technology-based products and services by us and our clients.
48
Critical Accounting Policies and Estimates
Our business is dynamic and complex. Consequently, we must exercise judgment in choosing and applying accounting policies and methodologies. These choices are critical – not only are they necessary to comply with GAAP, they also reflect our view of the appropriate way to record and report our overall financial performance. All accounting policies are important, and all policies described in Note
1
(“
Summary of Significant Accounting Policies
”) beginning on page 100 of our
2017
Form 10-K should be reviewed for a greater understanding of how we record and report our financial performance. Note
1
(“
Basis of Presentation and Accounting Policies
”) of this report should also be reviewed for more information on accounting standards that have been adopted during the period.
In our opinion, some accounting policies are more likely than others to have a critical effect on our financial results and to expose those results to potentially greater volatility. These policies apply to areas of relatively greater business importance, or require us to exercise judgment and to make assumptions and estimates that affect amounts reported in the financial statements. Because these assumptions and estimates are based on current circumstances, they may prove to be inaccurate, or we may find it necessary to change them.
We rely heavily on the use of judgment, assumptions, and estimates to make a number of core decisions, including accounting for the ALLL; contingent liabilities, guarantees and income taxes; derivatives and related hedging activities; and assets and liabilities that involve valuation methodologies. In addition, we may employ outside valuation experts to assist us in determining fair values of certain assets and liabilities. A brief discussion of each of these areas appears on pages 86 through 89 of our
2017
Form 10-K.
During the first
three
months of
2018
, we did not significantly alter the manner in which we applied our critical accounting policies or developed related assumptions and estimates.
49
Accounting and Reporting Developments
Accounting Guidance Pending Adoption at
March 31, 2018
|
Standard
|
Required Adoption
|
Description
|
Effect on Financial Statements or
Other Significant Matters
|
|
ASU 2016-02,
Leases (Topic 842)
ASU 2018-01,
Leases (Topic 842): Land Easement Practical Expedient
|
January 1, 2019
Early adoption is permitted
|
The ASU creates ASC Topic 842,
Leases
, and supersedes Topic 840,
Leases.
The ASU requires that a lessee recognize assets and liabilities for leases with lease terms of more than 12 months. For leases with a term of 12 months or less, a lessee is permitted to make an accounting policy election by class of underlying asset not to recognize lease assets and lease liabilities. Leveraged leases that commenced before the effective date of the new guidance are grandfathered. The recognition, measurement, and presentation of expenses and cash flows arising from a lease by a lessee primarily will depend on its classification as a finance or operating lease. However, the ASU will require both types of leases to be recognized on the balance sheet. It also requires disclosures to better understand the amount, timing, and uncertainty of cash flows arising from leases. These disclosures include qualitative and quantitative requirements, providing additional information about the amounts recorded in the financial statements. Upon transition, lessees and lessors are required to recognize and measure leases at the beginning of the earliest period presented using a modified retrospective approach.
|
Key has formed a cross-functional team to oversee the implementation of this ASU. Implementation efforts are ongoing, including the review of our lease portfolios and related lease accounting policies, the review of our service contracts for embedded leases, and the deployment of a new lease software solution. Key’s adoption of this ASU, which is expected to occur January 1, 2019, will result in an increase in right-of-use assets and associated lease liabilities, arising from operating leases in which Key is the lessee, on our Consolidated Balance Sheet.
The amount of the right-of-use assets and associated lease liabilities recorded upon adoption will be based primarily on the present value of unpaid future minimum lease payments, the amount of which will depend on the population of leases in effect at the date of adoption. Key’s minimum future rental payments under noncancelable operating leases would be measured and recognized when the new guidance is adopted (refer to Note 22 (“Commitments, Contingent Liabilities, and Guarantees” in our 2017 Form 10-K). While these leases represent a large majority of the leases that are within scope of the new leasing standard, we continue to review service contracts to identify potential additional leases embedded in those arrangements that would be within the scope of the new standard. Between now and January 1, 2019, Key will likely have changes to the lease portfolio as we continue to evaluate and execute branch and occupancy optimization initiatives. In addition to final determination of the lease portfolio at the effective date, the initial measurement of the right-of-use asset and the corresponding liability will be affected by certain key assumptions such as expectations of renewals or extensions and the interest rate to be used to discount the future lease obligations. Up through the date of adoption, the evaluation of the impact of the standard will be adjusted based on new leases that are executed, leases that are terminated prior to the effective date, and any leases with changes to key assumptions or expectations such as renewals and extensions, and discount rates. We do not expect the adoption of this guidance to have a material impact on the recognition of operating lease expense in our Consolidated Statements of Income.
|
|
ASU 2017-08,
Premium
Amortization on
Purchased
Callable Debt
Securities
|
January 1, 2019
Early adoption is permitted.
|
The ASU amends ASC Topic 310-20,
Receivables
— Nonrefundable Fees and Other Costs
, and shortens the amortization period to the earliest call date for certain callable debt securities held at a premium. Securities held at a discount will continue to be amortized to maturity.
The guidance should be implemented on a modified
retrospective basis using a cumulative-effect adjustment.
|
The adoption of this guidance is not expected to have a material effect on our financial condition or results of operations.
|
|
ASU 2016-13
Measurement of
Credit Losses on
Financial
Instruments
|
January 1, 2020
Early adoption is permitted as of January 1, 2019
|
The ASU amends ASC Topic 326,
Financial Instruments-Credit Losses, and
significantly changes how entities will measure credit losses for most financial assets and certain other instruments that are not measured at fair value through net income. The standard replaces today’s “incurred loss” approach with an “expected loss” model for instruments such as loans and HTM securities that are measured at amortized cost. The standard requires credit losses relating to AFS debt securities to be recorded through an allowance rather than a reduction of the carrying amount. It also changes the accounting for purchased credit-impaired debt securities and loans. The ASU retains many of the current disclosure requirements in current GAAP and expands certain disclosure requirements.
|
This new guidance will affect the accounting for our loans, debt securities held to maturity and available for sale, and liabilities for credit losses on unfunded lending-related commitments as well as purchased financial assets with a more-than-insignificant amount of credit deterioration since origination.
Key has formed a cross-functional implementation working group comprised of teams throughout Key, including finance and credit. The implementation team has developed a project plan that results in the adoption of the standard on January 1, 2020. During 2017, the implementation team focused on understanding the standard, identifying and researching key interpretive issues and designing models. The implementation team is also in the process of assessing governance related to the reasonable and supportable forecast period and continues to assess whether data that is required to comply with the standard is available and accurate. During 2018, the focus will be on execution and implementation, continued review and challenge of our models, data resolution, processes and controls, and reporting.
Key expects that the new guidance will generally result in an increase in its allowance for credit losses, as it will cover credit losses over the full remaining expected life of loans and commitments and will consider future changes in macroeconomic conditions. Since the magnitude of the anticipated increase in the allowance for credit losses will be impacted by economic conditions and trends in the Company’s portfolio at the time of adoption, the quantitative impact cannot yet be reasonably estimated.
|
|
ASU 2017-04,
Simplifying the
Test for Goodwill
Impairment
|
January 1, 2020
Early adoption is permitted
|
The ASU amends ASC Topic 350,
Intangibles - Goodwill and Other and
eliminates the second step of the test for goodwill impairment. Under the new guidance, entities will compare the fair value of a reporting unit with its carrying amount. If the carrying amount exceeds the reporting unit’s fair value, the entity is required to recognize an impairment charge for this amount. The new method applies to all reporting units and the performance of a qualitative assessment is still allowable.
The guidance should be implemented using a prospective approach.
|
The adoption of this accounting guidance is not expected to have a material effect on our financial condition or results of operations.
|
50
Our total European sovereign and Nonsovereign debt exposure is presented in Figure
39
.
Figure 39. European Sovereign and Nonsovereign Debt Exposures
|
March 31, 2018
|
Short-and Long-
Term Commercial
Total
(a)
|
Foreign Exchange
and Derivatives
with Collateral (b) |
Net
Exposure
|
||||||
|
in millions
|
|||||||||
|
France:
|
|
||||||||
|
Sovereigns
|
—
|
|
—
|
|
—
|
|
|||
|
Nonsovereign financial institutions
|
—
|
|
$
|
—
|
|
$
|
—
|
|
|
|
Nonsovereign non-financial institutions
|
$
|
9
|
|
—
|
|
9
|
|
||
|
Total
|
9
|
|
—
|
|
9
|
|
|||
|
Germany:
|
|
||||||||
|
Sovereigns
|
—
|
|
—
|
|
—
|
|
|||
|
Nonsovereign financial institutions
|
—
|
|
—
|
|
—
|
|
|||
|
Nonsovereign non-financial institutions
|
32
|
|
—
|
|
32
|
|
|||
|
Total
|
32
|
|
—
|
|
32
|
|
|||
|
Italy:
|
|
||||||||
|
Sovereigns
|
—
|
|
—
|
|
—
|
|
|||
|
Nonsovereign financial institutions
|
—
|
|
—
|
|
—
|
|
|||
|
Nonsovereign non-financial institutions
|
7
|
|
—
|
|
7
|
|
|||
|
Total
|
7
|
|
—
|
|
7
|
|
|||
|
Netherlands:
|
|
||||||||
|
Sovereigns
|
—
|
|
—
|
|
—
|
|
|||
|
Nonsovereign financial institutions
|
—
|
|
—
|
|
—
|
|
|||
|
Nonsovereign non-financial institutions
|
7
|
|
—
|
|
7
|
|
|||
|
Total
|
7
|
|
—
|
|
7
|
|
|||
|
Spain:
|
|
||||||||
|
Sovereigns
|
—
|
|
—
|
|
—
|
|
|||
|
Nonsovereign financial institutions
|
—
|
|
—
|
|
—
|
|
|||
|
Nonsovereign non-financial institutions
|
2
|
|
—
|
|
2
|
|
|||
|
Total
|
2
|
|
—
|
|
2
|
|
|||
|
Switzerland:
|
|
||||||||
|
Sovereigns
|
—
|
|
—
|
|
—
|
|
|||
|
Nonsovereign financial institutions
|
—
|
|
(3
|
)
|
(3
|
)
|
|||
|
Nonsovereign non-financial institutions
|
51
|
|
—
|
|
51
|
|
|||
|
Total
|
51
|
|
(3
|
)
|
48
|
|
|||
|
United Kingdom:
|
|
||||||||
|
Sovereigns
|
—
|
|
—
|
|
—
|
|
|||
|
Nonsovereign financial institutions
|
—
|
|
146
|
|
146
|
|
|||
|
Nonsovereign non-financial institutions
|
33
|
|
—
|
|
33
|
|
|||
|
Total
|
33
|
|
146
|
|
179
|
|
|||
|
Other Europe:
(c)
|
|
||||||||
|
Sovereigns
|
—
|
|
—
|
|
—
|
|
|||
|
Nonsovereign financial institutions
|
—
|
|
—
|
|
—
|
|
|||
|
Nonsovereign non-financial institutions
|
—
|
|
—
|
|
—
|
|
|||
|
Total
|
—
|
|
—
|
|
—
|
|
|||
|
Total Europe:
|
|
||||||||
|
Sovereigns
|
—
|
|
—
|
|
—
|
|
|||
|
Nonsovereign financial institutions
|
—
|
|
143
|
|
143
|
|
|||
|
Nonsovereign non-financial institutions
|
141
|
|
—
|
|
141
|
|
|||
|
Total
|
$
|
141
|
|
$
|
143
|
|
$
|
284
|
|
|
(a)
|
Represents our outstanding leases.
|
|
(b)
|
Represents contracts to hedge our balance sheet asset and liability needs, and to accommodate our clients’ trading and/or hedging needs. Our derivative mark-to-market exposures are calculated and reported on a daily basis. These exposures are largely covered by cash or highly marketable securities collateral with daily collateral calls.
|
|
(c)
|
Other Europe consists of the following countries: Austria, Belarus, Belgium, Bulgaria, Cyprus, Czech Republic, Denmark, Finland, Greece, Hungary, Iceland, Ireland, Lithuania, Luxembourg, Malta, Norway, Poland, Portugal, Romania, Russia, Slovakia, Slovenia, Sweden, and Ukraine. 100% of our current exposure in Other Europe is in Austria, Belgium, and Sweden.
|
Our credit risk exposure is largely concentrated in developed countries with emerging market exposure essentially limited to commercial facilities; these exposures are actively monitored by management. We do not have at-risk exposures in the rest of the world.
51
|
in millions, except per share data
|
March 31,
2018 |
|
December 31,
2017 |
|
||
|
|
(Unaudited)
|
|
|
|||
|
ASSETS
|
||||||
|
Cash and due from banks
|
$
|
643
|
|
$
|
671
|
|
|
Short-term investments
|
1,644
|
|
4,447
|
|
||
|
Trading account assets
|
769
|
|
836
|
|
||
|
Securities available for sale
|
17,888
|
|
18,139
|
|
||
|
Held-to-maturity securities (fair value: $11,729 and $11,565)
|
12,189
|
|
11,830
|
|
||
|
Other investments
|
715
|
|
726
|
|
||
|
Loans, net of unearned income of $705 and $736
|
88,089
|
|
86,405
|
|
||
|
Less: Allowance for loan and lease losses
|
(881
|
)
|
(877
|
)
|
||
|
Net loans
|
87,208
|
|
85,528
|
|
||
|
Loans held for sale
(a)
|
1,667
|
|
1,107
|
|
||
|
Premises and equipment
|
916
|
|
930
|
|
||
|
Operating lease assets
|
838
|
|
821
|
|
||
|
Goodwill
|
2,538
|
|
2,538
|
|
||
|
Other intangible assets
|
387
|
|
416
|
|
||
|
Corporate-owned life insurance
|
4,142
|
|
4,132
|
|
||
|
Accrued income and other assets
|
4,216
|
|
4,237
|
|
||
|
Discontinued assets
|
1,289
|
|
1,340
|
|
||
|
Total assets
|
$
|
137,049
|
|
$
|
137,698
|
|
|
LIABILITIES
|
||||||
|
Deposits in domestic offices:
|
||||||
|
NOW and money market deposit accounts
|
$
|
54,606
|
|
$
|
53,627
|
|
|
Savings deposits
|
6,321
|
|
6,296
|
|
||
|
Certificates of deposit ($100,000 or more)
|
7,295
|
|
6,849
|
|
||
|
Other time deposits
|
4,928
|
|
4,798
|
|
||
|
Total interest-bearing deposits
|
73,150
|
|
71,570
|
|
||
|
Noninterest-bearing deposits
|
31,601
|
|
33,665
|
|
||
|
Total deposits
|
104,751
|
|
105,235
|
|
||
|
Federal funds purchased and securities sold under repurchase agreements
|
616
|
|
377
|
|
||
|
Bank notes and other short-term borrowings
|
1,133
|
|
634
|
|
||
|
Accrued expense and other liabilities
|
1,854
|
|
2,094
|
|
||
|
Long-term debt
|
13,749
|
|
14,333
|
|
||
|
Total liabilities
|
122,103
|
|
122,673
|
|
||
|
EQUITY
|
||||||
|
Preferred stock
|
1,025
|
|
1,025
|
|
||
|
Common shares, $1 par value; authorized 1,400,000,000 shares; issued
1,256,702,081, and
1,256,702,081
shares
|
1,257
|
|
1,257
|
|
||
|
Capital surplus
|
6,289
|
|
6,335
|
|
||
|
Retained earnings
|
10,624
|
|
10,335
|
|
||
|
Treasury stock, at cost (191,763,406 and 187,617,832 shares)
|
(3,260
|
)
|
(3,150
|
)
|
||
|
Accumulated other comprehensive income (loss)
|
(991
|
)
|
(779
|
)
|
||
|
Key shareholders’ equity
|
14,944
|
|
15,023
|
|
||
|
Noncontrolling interests
|
2
|
|
2
|
|
||
|
Total equity
|
14,946
|
|
15,025
|
|
||
|
Total liabilities and equity
|
$
|
137,049
|
|
$
|
137,698
|
|
|
(a)
|
Total loans held for sale include real estate — residential mortgage loans held for sale at fair value of
$47 million
at
March 31, 2018
, and
$71 million
at
December 31, 2017
.
|
See Notes to Consolidated Financial Statements (Unaudited).
52
|
dollars in millions, except per share amounts
|
Three months ended March 31,
|
|||||
|
(Unaudited)
|
2018
|
|
2017
|
|
||
|
INTEREST INCOME
|
||||||
|
Loans
|
$
|
940
|
|
$
|
877
|
|
|
Loans held for sale
|
12
|
|
13
|
|
||
|
Securities available for sale
|
95
|
|
95
|
|
||
|
Held-to-maturity securities
|
69
|
|
51
|
|
||
|
Trading account assets
|
7
|
|
7
|
|
||
|
Short-term investments
|
8
|
|
3
|
|
||
|
Other investments
|
6
|
|
4
|
|
||
|
Total interest income
|
1,137
|
|
1,050
|
|
||
|
INTEREST EXPENSE
|
||||||
|
Deposits
|
91
|
|
58
|
|
||
|
Federal funds purchased and securities sold under repurchase agreements
|
4
|
|
1
|
|
||
|
Bank notes and other short-term borrowings
|
6
|
|
5
|
|
||
|
Long-term debt
|
92
|
|
68
|
|
||
|
Total interest expense
|
193
|
|
132
|
|
||
|
NET INTEREST INCOME
|
944
|
|
918
|
|
||
|
Provision for credit losses
|
61
|
|
63
|
|
||
|
Net interest income after provision for credit losses
|
883
|
|
855
|
|
||
|
NONINTEREST INCOME
|
||||||
|
Trust and investment services income
|
133
|
|
135
|
|
||
|
Investment banking and debt placement fees
|
143
|
|
127
|
|
||
|
Service charges on deposit accounts
|
89
|
|
87
|
|
||
|
Operating lease income and other leasing gains
|
32
|
|
23
|
|
||
|
Corporate services income
|
62
|
|
54
|
|
||
|
Cards and payments income
|
62
|
|
65
|
|
||
|
Corporate-owned life insurance income
|
32
|
|
30
|
|
||
|
Consumer mortgage income
|
7
|
|
6
|
|
||
|
Mortgage servicing fees
|
20
|
|
18
|
|
||
|
Other income
(a)
|
21
|
|
32
|
|
||
|
Total noninterest income
|
601
|
|
577
|
|
||
|
NONINTEREST EXPENSE
|
||||||
|
Personnel
|
594
|
|
556
|
|
||
|
Net occupancy
|
78
|
|
87
|
|
||
|
Computer processing
|
52
|
|
60
|
|
||
|
Business services and professional fees
|
41
|
|
46
|
|
||
|
Equipment
|
26
|
|
27
|
|
||
|
Operating lease expense
|
27
|
|
19
|
|
||
|
Marketing
|
25
|
|
21
|
|
||
|
FDIC assessment
|
21
|
|
20
|
|
||
|
Intangible asset amortization
|
29
|
|
22
|
|
||
|
OREO expense, net
|
2
|
|
2
|
|
||
|
Other expense
|
111
|
|
153
|
|
||
|
Total noninterest expense
|
1,006
|
|
1,013
|
|
||
|
INCOME (LOSS) FROM CONTINUING OPERATIONS BEFORE INCOME TAXES
|
478
|
|
419
|
|
||
|
Income taxes
|
62
|
|
94
|
|
||
|
INCOME (LOSS) FROM CONTINUING OPERATIONS
|
416
|
|
325
|
|
||
|
Income (loss) from discontinued operations
|
2
|
|
—
|
|
||
|
NET INCOME (LOSS)
|
418
|
|
325
|
|
||
|
Less: Net income (loss) attributable to noncontrolling interests
|
—
|
|
1
|
|
||
|
NET INCOME (LOSS) ATTRIBUTABLE TO KEY
|
$
|
418
|
|
$
|
324
|
|
|
Income (loss) from continuing operations attributable to Key common shareholders
|
$
|
402
|
|
$
|
296
|
|
|
Net income (loss) attributable to Key common shareholders
|
404
|
|
296
|
|
||
|
Per common share:
|
||||||
|
Income (loss) from continuing operations attributable to Key common shareholders
|
$
|
.38
|
|
$
|
.28
|
|
|
Income (loss) from discontinued operations, net of taxes
|
—
|
|
—
|
|
||
|
Net income (loss) attributable to Key common shareholders
(b)
|
.38
|
|
.28
|
|
||
|
Per common share — assuming dilution:
|
||||||
|
Income (loss) from continuing operations attributable to Key common shareholders
|
$
|
.38
|
|
$
|
.27
|
|
|
Income (loss) from discontinued operations, net of taxes
|
—
|
|
—
|
|
||
|
Net income (loss) attributable to Key common shareholders
(b)
|
.38
|
|
.27
|
|
||
|
Cash dividends declared per common share
|
$
|
.105
|
|
$
|
.085
|
|
|
Weighted-average common shares outstanding (000)
|
1,056,037
|
|
1,068,609
|
|
||
|
Effect of common share options and other stock awards
|
15,749
|
|
17,931
|
|
||
|
Weighted-average common shares and potential common shares outstanding (000)
(c)
|
1,071,786
|
|
1,086,540
|
|
||
|
(a)
|
For the
three months ended March 31, 2018
, net securities gains totaled less than $1 million. For the three months ended
March 31, 2017
, net securities gains totaled $1 million. For the three months ended
March 31, 2018
, and
March 31, 2017
, we did not have any impairment losses related to securities.
|
|
(b)
|
EPS may not foot due to rounding.
|
|
(c)
|
Assumes conversion of common share options and other stock awards and/or convertible preferred stock, as applicable.
|
See Notes to Consolidated Financial Statements (Unaudited).
53
Consolidated Statements of Comprehensive Income
|
in millions
|
Three months ended March 31,
|
|||||
|
(Unaudited)
|
2018
|
|
2017
|
|
||
|
Net income (loss)
|
$
|
418
|
|
$
|
325
|
|
|
Other comprehensive income (loss), net of tax:
|
||||||
|
Net unrealized gains (losses) on securities available for sale, net of income taxes of ($47) and $4
|
(150
|
)
|
6
|
|
||
|
Net unrealized gains (losses) on derivative financial instruments, net of income taxes of ($20) and ($15)
|
(63
|
)
|
(24
|
)
|
||
|
Foreign currency translation adjustments, net of income taxes of $0 and $1
|
(2
|
)
|
1
|
|
||
|
Net pension and postretirement benefit costs, net of income taxes of $1 and $2
|
3
|
|
4
|
|
||
|
Total other comprehensive income (loss), net of tax
|
(212
|
)
|
(13
|
)
|
||
|
Comprehensive income (loss)
|
206
|
|
312
|
|
||
|
Less: Comprehensive income attributable to noncontrolling interests
|
—
|
|
1
|
|
||
|
Comprehensive income (loss) attributable to Key
|
$
|
206
|
|
$
|
311
|
|
See Notes to Consolidated Financial Statements (Unaudited).
54
Consolidated Statements of Changes in Equity
|
|
Key Shareholders’ Equity
|
|
|||||||||||||||||||||||
|
dollars in millions, except per share amounts
(Unaudited)
|
Preferred
Shares
Outstanding
(000)
|
Common
Shares
Outstanding
(000)
|
Preferred
Stock
|
Common
Shares
|
Capital
Surplus
|
Retained
Earnings
|
Treasury
Stock,
at Cost
|
Accumulated
Other
Comprehensive
Income (Loss)
|
Noncontrolling
Interests
|
||||||||||||||||
|
BALANCE AT DECEMBER 31, 2016
|
17,421
|
|
1,079,314
|
|
$
|
1,665
|
|
$
|
1,257
|
|
$
|
6,385
|
|
$
|
9,378
|
|
$
|
(2,904
|
)
|
$
|
(541
|
)
|
$
|
—
|
|
|
Net income (loss)
|
324
|
|
1
|
|
|||||||||||||||||||||
|
Other comprehensive income (loss)
|
(13
|
)
|
|||||||||||||||||||||||
|
Deferred compensation
|
3
|
|
|||||||||||||||||||||||
|
Cash dividends declared
|
|||||||||||||||||||||||||
|
Common Shares ($.085 per share)
|
(90
|
)
|
|||||||||||||||||||||||
|
Series A Preferred Stock ($1.9375 per share)
|
(6
|
)
|
|||||||||||||||||||||||
|
Series C Preferred Stock ($.539063 per share)
|
(7
|
)
|
|||||||||||||||||||||||
|
Series D Preferred Stock ($12.50 per share)
|
(7
|
)
|
|||||||||||||||||||||||
|
Series E Preferred Stock ($.395573 per share)
|
(8
|
)
|
|||||||||||||||||||||||
|
Open market Common Share repurchases
|
(5,844
|
)
|
(107
|
)
|
|||||||||||||||||||||
|
Employee equity compensation program Common Share repurchases
|
(2,829
|
)
|
(53
|
)
|
|||||||||||||||||||||
|
Series A Preferred Stock exchanged for Common Shares
|
(2,900
|
)
|
20,568
|
|
(290
|
)
|
(49
|
)
|
338
|
|
|||||||||||||||
|
Redemption of Series C Preferred Stock
|
(14,000
|
)
|
(350
|
)
|
|||||||||||||||||||||
|
Common Shares reissued (returned) for stock options and other employee benefit plans
|
6,270
|
|
(52
|
)
|
103
|
|
|||||||||||||||||||
|
Net contribution from (distribution to) noncontrolling interests
|
1
|
|
|||||||||||||||||||||||
|
BALANCE AT MARCH 31, 2017
|
521
|
|
1,097,479
|
|
$
|
1,025
|
|
$
|
1,257
|
|
$
|
6,287
|
|
$
|
9,584
|
|
$
|
(2,623
|
)
|
$
|
(554
|
)
|
$
|
2
|
|
|
BALANCE AT DECEMBER 31, 2017
|
521
|
|
1,069,084
|
|
$
|
1,025
|
|
$
|
1,257
|
|
$
|
6,335
|
|
$
|
10,335
|
|
$
|
(3,150
|
)
|
$
|
(779
|
)
|
$
|
2
|
|
|
Cumulative effect from changes in accounting principle
(a)
|
(2
|
)
|
|||||||||||||||||||||||
|
Net income (loss)
|
418
|
|
—
|
|
|||||||||||||||||||||
|
Other comprehensive income (loss)
|
(212
|
)
|
|||||||||||||||||||||||
|
Deferred compensation
|
6
|
|
|||||||||||||||||||||||
|
Cash dividends declared
|
|||||||||||||||||||||||||
|
Common Shares ($.105 per share)
|
(112
|
)
|
|||||||||||||||||||||||
|
Series D Preferred Stock ($12.50 per share)
|
(7
|
)
|
|||||||||||||||||||||||
|
Series E Preferred Stock ($.382813 per share)
|
(8
|
)
|
|||||||||||||||||||||||
|
Open market Common Share repurchases
|
(7,333
|
)
|
(156
|
)
|
|||||||||||||||||||||
|
Employee equity compensation program Common Share repurchases
|
(2,066
|
)
|
(43
|
)
|
|||||||||||||||||||||
|
Common Shares reissued (returned) for stock options and other employee benefit plans
|
5,254
|
|
(52
|
)
|
89
|
|
|||||||||||||||||||
|
BALANCE AT MARCH 31, 2018
|
521
|
|
1,064,939
|
|
$
|
1,025
|
|
$
|
1,257
|
|
$
|
6,289
|
|
$
|
10,624
|
|
$
|
(3,260
|
)
|
$
|
(991
|
)
|
$
|
2
|
|
|
(a)
|
Includes the impact of implementing ASU 2014-09, ASU 2016-01, and ASU 2017-12.
|
See Notes to Consolidated Financial Statements (Unaudited).
55
|
in millions
|
Three months ended March 31,
|
||||||
|
(Unaudited)
|
2018
|
|
2017
|
|
|||
|
OPERATING ACTIVITIES
|
|||||||
|
Net income (loss)
|
$
|
418
|
|
$
|
325
|
|
|
|
Adjustments to reconcile net income (loss) to net cash provided by (used in) operating activities:
|
|||||||
|
Provision for credit losses
|
61
|
|
63
|
|
|||
|
Depreciation and amortization expense, net
|
103
|
|
100
|
|
|||
|
Accretion of acquired loans
|
27
|
|
43
|
|
|||
|
Increase in cash surrender value of corporate-owned life insurance
|
(28
|
)
|
(28
|
)
|
|||
|
Stock-based compensation expense
|
27
|
|
27
|
|
|||
|
FDIC reimbursement (payments), net of FDIC expense
|
1
|
|
(2
|
)
|
|||
|
Deferred income taxes (benefit)
|
22
|
|
137
|
|
|||
|
Proceeds from sales of loans held for sale
|
2,748
|
|
2,334
|
|
|||
|
Originations of loans held for sale, net of repayments
|
(3,280
|
)
|
(2,562
|
)
|
|||
|
Net losses (gains) on sales of loans held for sale
|
(44
|
)
|
(35
|
)
|
|||
|
Net losses (gains) and writedown on OREO
|
—
|
|
1
|
|
|||
|
Net losses (gains) on leased equipment
|
3
|
|
(2
|
)
|
|||
|
Net securities losses (gains)
|
—
|
|
(1
|
)
|
|||
|
Net losses (gains) on sales of fixed assets
|
—
|
|
12
|
|
|||
|
Net decrease (increase) in trading account assets
|
67
|
|
(54
|
)
|
|||
|
Other operating activities, net
|
(336
|
)
|
(763
|
)
|
|||
|
NET CASH PROVIDED BY (USED IN) OPERATING ACTIVITIES
|
(211
|
)
|
(405
|
)
|
|||
|
INVESTING ACTIVITIES
|
|||||||
|
Net decrease (increase) in short-term investments, excluding acquisitions
|
2,803
|
|
250
|
|
|||
|
Purchases of securities available for sale
|
(787
|
)
|
(195
|
)
|
|||
|
Proceeds from sales of securities available for sale
|
—
|
|
912
|
|
|||
|
Proceeds from prepayments and maturities of securities available for sale
|
833
|
|
1,061
|
|
|||
|
Proceeds from prepayments and maturities of held-to-maturity securities
|
398
|
|
456
|
|
|||
|
Purchases of held-to-maturity securities
|
(756
|
)
|
(411
|
)
|
|||
|
Purchases of other investments
|
(4
|
)
|
(2
|
)
|
|||
|
Proceeds from sales of other investments
|
10
|
|
51
|
|
|||
|
Proceeds from prepayments and maturities of other investments
|
—
|
|
1
|
|
|||
|
Net decrease (increase) in loans, excluding acquisitions, sales and transfers
|
(1,793
|
)
|
(255
|
)
|
|||
|
Proceeds from sales of portfolio loans
|
38
|
|
37
|
|
|||
|
Proceeds from corporate-owned life insurance
|
18
|
|
9
|
|
|||
|
Purchases of premises, equipment, and software
|
(19
|
)
|
(2
|
)
|
|||
|
Proceeds from sales of premises and equipment
|
1
|
|
—
|
|
|||
|
Proceeds from sales of OREO
|
7
|
|
11
|
|
|||
|
NET CASH PROVIDED BY (USED IN) INVESTING ACTIVITIES
|
749
|
|
1,923
|
|
|||
|
FINANCING ACTIVITIES
|
|||||||
|
Net increase (decrease) in deposits, excluding acquisitions
|
(484
|
)
|
(105
|
)
|
|||
|
Net increase (decrease) in short-term borrowings
|
738
|
|
(925
|
)
|
|||
|
Net proceeds from issuance of long-term debt
|
501
|
|
—
|
|
|||
|
Payments on long-term debt
|
(1,005
|
)
|
(10
|
)
|
|||
|
Open market common share repurchases
|
(156
|
)
|
(107
|
)
|
|||
|
Employee equity compensation program common share repurchases
|
(43
|
)
|
(53
|
)
|
|||
|
Redemption of Preferred Stock Series C
|
—
|
|
(350
|
)
|
|||
|
Net proceeds from reissuance of common shares
|
10
|
|
22
|
|
|||
|
Cash dividends paid
|
(127
|
)
|
(118
|
)
|
|||
|
NET CASH PROVIDED BY (USED IN) FINANCING ACTIVITIES
|
(566
|
)
|
(1,646
|
)
|
|||
|
NET INCREASE (DECREASE) IN CASH AND DUE FROM BANKS
|
(28
|
)
|
(128
|
)
|
|||
|
CASH AND DUE FROM BANKS AT BEGINNING OF PERIOD
|
671
|
|
677
|
|
|||
|
CASH AND DUE FROM BANKS AT END OF PERIOD
|
$
|
643
|
|
$
|
549
|
|
|
|
Additional disclosures relative to cash flows:
|
|||||||
|
Interest paid
|
$
|
199
|
|
$
|
151
|
|
|
|
Income taxes paid (refunded)
|
9
|
|
(11
|
)
|
|||
|
Noncash items:
|
|||||||
|
Reduction of secured borrowing and related collateral
|
$
|
7
|
|
13
|
|
||
|
Loans transferred to portfolio from held for sale
|
14
|
|
8
|
|
|||
|
Loans transferred to held for sale from portfolio
|
—
|
|
25
|
|
|||
|
Loans transferred to OREO
|
4
|
|
11
|
|
|||
See Notes to Consolidated Financial Statements (Unaudited).
56
Notes to Consolidated Financial Statements (Unaudited)
1. Basis of Presentation and Accounting Policies
The consolidated financial statements include the accounts of KeyCorp and its subsidiaries. All significant intercompany accounts and transactions have been eliminated in consolidation. Some previously reported amounts have been reclassified to conform to current reporting practices.
The consolidated financial statements include any voting rights entities in which we have a controlling financial interest. In accordance with the applicable accounting guidance for consolidations, we consolidate a VIE if we have: (i) a variable interest in the entity; (ii) the power to direct activities of the VIE that most significantly affect the entity’s economic performance; and (iii) the obligation to absorb losses of the entity or the right to receive benefits from the entity that could potentially be significant to the VIE (i.e., we are considered to be the primary beneficiary). Variable interests can include equity interests, subordinated debt, derivative contracts, leases, service agreements, guarantees, standby letters of credit, loan commitments, and other contracts, agreements, and financial instruments. See Note
9
(“
Variable Interest Entities
”) for information on our involvement with VIEs.
We use the equity method to account for unconsolidated investments in voting rights entities or VIEs if we have significant influence over the entity’s operating and financing decisions (usually defined as a voting or economic interest of
20%
to
50%
, but not controlling). Unconsolidated investments in voting rights entities or VIEs in which we have a voting or economic interest of less than
20%
are carried at the cost measurement alternative or at fair value. Investments held by our registered broker-dealer and investment company subsidiaries (principal investing entities and Real Estate Capital line of business) are carried at fair value.
We believe that the unaudited consolidated interim financial statements reflect all adjustments of a normal recurring nature and disclosures that are necessary for a fair presentation of the results for the interim periods presented. The results of operations for the interim period are not necessarily indicative of the results of operations to be expected for the full year. The interim financial statements should be read in conjunction with the audited consolidated financial statements and related notes included in our
2017
Form 10-K.
In preparing these financial statements, subsequent events were evaluated through the time the financial statements were issued. Financial statements are considered issued when they are widely distributed to all shareholders and other financial statement users or filed with the SEC.
57
Accounting Guidance Adopted in
2018
|
Standard
|
Date of Adoption
|
Description
|
Effect on Financial Statements or Other Significant Matters
|
|
ASU 2014-09,
Revenue from Contracts with Customers (Topic 606)
ASU 2015-14,
Deferral of Effective Date
ASU 2016-08,
Principal versus Agent Considerations
ASU 2016-10,
Identifying Performance Obligations and Licensing
ASU 2016-11,
Rescission of SEC Guidance because of Accounting Standard Updates 2014-09 and 2014-16 pursuant to Staff Announcements at the March 3, 2016 EITF Meeting
ASU 2016-12,
Narrow-scope Improvements and Practical Expedients
ASU 2016-20,
Technical Corrections and Improvements to Topic 606, Revenue from Contracts with Customers
|
January 1, 2018
|
These ASUs supersede the revenue recognition guidance in ASC 605,
Revenue Recognition,
and most industry-specific guidance. The core principle of these ASUs is that an entity should recognize revenue to depict the transfer of promised goods or services to customers in an amount that reflects the consideration to which the entity expects to be entitled in exchange for those goods or services.
These ASUs can be implemented using a retrospective method, or a cumulative-effect approach to new contracts and existing contracts with performance obligations as of the effective date.
|
On January 1, 2018, we adopted ASC 606, Revenue from Contracts with Customers (ASC 606), using the modified retrospective method for those contracts which were not completed as of that date. Results for reporting periods beginning January 1, 2018 are presented under ASC 606. As allowed under the new guidance, the comparative information has not been restated and continues to be reported under the accounting standards in effect for those periods.
As a result of adopting ASC 606, we changed the timing of recognition for revenues related to insurance commissions, securities underwriting, and deposit account maintenance fees, however, those changes did not have a material impact on our consolidated financial statements, results of operations, equity, or cash flows as of the adoption date or for the three months ended March 31, 2018.
The presentation of underwriting costs and reimbursed out-of-pocket expenses related to underwriting and M&A advisory services was changed from net to gross within the income statement as Key acts as the principal in the transactions. Securities underwriting revenue is recorded within "investment banking and debt placement fees" and underwriting costs and reimbursed out-of-pocket expenses within "other expense" on the income statement. Additionally, because Key acts as an agent, certain credit and debit card reward costs and certain card network costs were changed from a gross presentation to net within "cards and payment income" on the income statement. Credit and debit card reward costs and card network costs were recorded as "other expense" on the income statement in prior periods. These changes in presentation did not have a material impact on our consolidated financial statements for the three months ended March 31, 2018.
ASC 606 requires quantitative disclosure of the allocation of the transaction price to the remaining performance obligations when those amounts are expected to be recognized as revenue. However, the standard provides exemptions from this disclosure for (i) contracts with an original expected length of one year or less and (ii) contracts for which we recognize revenue at the amount to which we have the right to invoice for services provided. Most of our revenue subject to ASC 606 fits into one of these exemptions, or is immaterial. We elected to use the optional exemption to not disclose the aggregate amount of the transaction price to remaining performance obligations.
|
|
ASU 2017-12,
Targeted Improvements to Accounting for Hedging Activities
|
January 1, 2018
|
The ASU amends ASC Topic 815,
Derivatives and Hedging
, to simplify the requirements for hedge accounting and facilitate financial reporting that more closely aligns with an entity’s risk management activities. Key amendments include: eliminating the requirement to separately measure and report hedge ineffectiveness, requiring changes in the value of the hedging instrument to be presented in the same income statement line as the earnings effect of the hedged item, and the ability to measure the hedged item based on the benchmark interest rate component of the total contractual coupon for fair value hedges.
Additional disclosures are also required for reporting periods subsequent to the date of adoption.
The guidance should be implemented on a modified retrospective basis to existing hedge relationships as of the adoption date.
|
On January 1, 2018 we adopted this ASU using a modified retrospective basis. Accordingly, our financial statements for the quarter ended March 31, 2018, include an immaterial cumulative-effect adjustment to decrease opening retained earnings to reflect the application of the new guidance as of January 1, 2018. The primary impact to Key at adoption was the election to measure the change in fair value of hedged items in fair value hedges on the basis of the benchmark interest rate component of contractual coupon cash flows. This change has resulted in a reduction of hedge ineffectiveness for impacted fair value hedges.
Instruments designated as hedges are recorded at fair value and included in “accrued income and other assets” or “accrued expense and other liabilities” on the balance sheet. Under the revised guidance, the change in the fair value of an instrument designated as a fair value hedge is recorded in earnings at the same time and in the same income statement line as the offsetting change in the fair value of the hedged item. For cash flow hedges, the change in the fair value of an instrument designated as a cash flow hedge is initially recorded in AOCI on the balance sheet. This amount is subsequently reclassified into income when the hedged transaction affects earnings and is presented in the same income statement line item as the earnings effect of the hedged item.
|
58
|
Standard
|
Date of Adoption
|
Description
|
Effect on Financial Statements or Other Significant Matters
|
|
ASU 2016-01,
Recognition and Measurement of Financial Assets and Financial Liabilities
|
January 1, 2018
|
The ASU amends ASC Topic 825,
Financial Instruments-Overall,
and requires equity investments, except those accounted for under the equity method of accounting or consolidated, to be measured at fair value with changes recognized in net income. If there is no readily determinable fair value, the guidance allows entities the ability to measure investments at cost less impairment, whereby impairment is based on a qualitative assessment. The guidance eliminates the requirement to disclose the methods and significant assumptions used to estimate the fair value of financial instruments measured at amortized cost and changes the presentation of financial assets and financial liabilities on the balance sheet or in the footnotes. If an entity has elected the fair value option to measure liabilities, the new accounting guidance requires the portion of the change in the fair value of a liability resulting from credit risk to be presented in OCI.
With the exception of disclosure requirements that will be adopted prospectively, the ASU must be adopted on a modified retrospective basis.
|
The adoption of this guidance did not have a material effect on our financial condition or results of operations.
|
|
ASU 2016-15,
Classification of Certain Cash Receipts and Cash Payments
|
January 1, 2018
|
The ASU amends ASC Topic 230,
Statement of Cash Flows
, and clarifies how cash receipts and cash payments in certain transactions should be presented and classified in the statement of cash flows. These specific transactions include, but are not limited to, debt prepayment or extinguishment costs, contingent considerations made after a business combination, proceeds from the settlement of insurance claims, proceeds from the settlement of corporate-owned life insurance policies, and distributions from equity method investees. This guidance also clarifies that in instances of cash flows with multiple aspects that cannot be separately identified, classification should be based on the activity that is likely to be the predominant source of or use of cash flow.
The guidance should be implemented using a retrospective approach.
|
The adoption of this guidance did not have a material effect on our financial condition or results of operations.
|
|
ASU 2017-01,
Clarifying the Definition of a Business
|
January 1, 2018
|
The ASU amends Topic 805,
Business Combinations,
and clarifies the definition of a business and removes the requirement for a market participant to consider whether it could replace missing elements in an integrated set of assets and activities. The guidance states that if substantially all of the fair value of the assets acquired or disposed of is concentrated in a single identifiable asset or a group of similar identifiable assets, the set is not a business.
The guidance should be implemented using a prospective approach.
|
The adoption of this guidance did not have a material effect on our financial condition or results of operations.
|
|
ASU 2017-05,
Other Income- Gains and Losses from the Derecognition of Nonfinancial Assets
|
January 1, 2018
|
The ASU amends ASC Topic 610-20,
Other Income - Gains and Losses from the Derecognition of Nonfinancial Assets
to clarify the scope of the Topic by
clarifying the definition of the term "in substance nonfinancial asset" and also adding guidance for partial sales of nonfinancial assets. Under the new guidance, an entity will derecognize a nonfinancial asset when it does not have or ceases to have a controlling interest in the legal entity that holds the asset and when control of the asset has transferred in accordance with ASC 606. The ASU can be adopted on a retrospective or modified retrospective approach.
|
The adoption of this guidance did not have a material effect on our financial condition or results of operations.
|
|
ASU 2017-07,
Improving the Presentation of Net Periodic Pension Cost and Net Periodic Postretirement Benefit Cost
|
January 1, 2018
|
The ASU amends ASC Topic 715,
Compensation - Retirement Benefits
, and requires service costs to be included in the same line item as certain other compensation costs related to services rendered by employees. We record compensation costs under personnel expense on the income statement. Other elements of net benefit cost should be presented separately.
The guidance should be implemented on a retrospective basis.
|
The adoption of this guidance did not have a material effect on our financial condition or results of operations.
|
|
ASU 2017-09,
Scope of Modification Accounting
|
January 1, 2018
|
The ASU amends ASC Topic 718,
Compensation - Stock Compensation
, and clarifies when changes to terms and conditions for share-based payment awards should be accounted for as modifications. Under the new guidance, entities should apply the modification guidance unless the fair value of the modified award is the same as the fair value of the original award immediately before modification, the vesting conditions of the modified award are the same as the vesting conditions of the original award immediately before modification, and the classification of the modified award (as equity or liability instrument) is the same as the classification of the original award immediately before modification.
The guidance should be applied on a prospective basis.
|
The adoption of this guidance did not have a material effect on our financial condition or results of operations.
|
59
2. Earnings Per Common Share
Basic earnings per share is the amount of earnings (adjusted for dividends declared on our preferred stock) available to each common share outstanding during the reporting periods. Diluted earnings per share is the amount of earnings available to each common share outstanding during the reporting periods adjusted to include the effects of potentially dilutive common shares. Potentially dilutive common shares include stock options and other stock-based awards. Potentially dilutive common shares are excluded from the computation of diluted earnings per share in the periods where the effect would be antidilutive.
Our basic and diluted earnings per common share are calculated as follows:
|
|
Three months ended March 31,
|
|||||
|
dollars in millions, except per share amounts
|
2018
|
|
2017
|
|
||
|
EARNINGS
|
||||||
|
Income (loss) from continuing operations
|
$
|
416
|
|
$
|
325
|
|
|
Less: Net income (loss) attributable to noncontrolling interests
|
—
|
|
1
|
|
||
|
Income (loss) from continuing operations attributable to Key
|
416
|
|
324
|
|
||
|
Less: Dividends on Preferred Stock
|
14
|
|
28
|
|
||
|
Income (loss) from continuing operations attributable to Key common shareholders
|
402
|
|
296
|
|
||
|
Income (loss) from discontinued operations, net of taxes
|
2
|
|
—
|
|
||
|
Net income (loss) attributable to Key common shareholders
|
$
|
404
|
|
$
|
296
|
|
|
WEIGHTED-AVERAGE COMMON SHARES
|
||||||
|
Weighted-average common shares outstanding (000)
|
1,056,037
|
|
1,068,609
|
|
||
|
Effect of common share options and other stock awards
|
15,749
|
|
17,931
|
|
||
|
Weighted-average common shares and potential common shares outstanding (000)
(a)
|
1,071,786
|
|
1,086,540
|
|
||
|
EARNINGS PER COMMON SHARE
|
||||||
|
Income (loss) from continuing operations attributable to Key common shareholders
|
$
|
.38
|
|
$
|
.28
|
|
|
Income (loss) from discontinued operations, net of taxes
|
—
|
|
—
|
|
||
|
Net income (loss) attributable to Key common shareholders
(b)
|
.38
|
|
.28
|
|
||
|
Income (loss) from continuing operations attributable to Key common shareholders — assuming dilution
|
$
|
.38
|
|
$
|
.27
|
|
|
Income (loss) from discontinued operations, net of taxes
|
—
|
|
—
|
|
||
|
Net income (loss) attributable to Key common shareholders — assuming dilution
(b)
|
.38
|
|
.27
|
|
||
|
(a)
|
Assumes conversion of common share options and other stock awards and/or convertible preferred stock, as applicable.
|
|
(b)
|
EPS may not foot due to rounding.
|
3. Loans and Loans Held for Sale
|
in millions
|
March 31, 2018
|
|
December 31, 2017
|
|
||
|
Commercial and industrial
(a)
|
$
|
44,313
|
|
$
|
41,859
|
|
|
Commercial real estate:
|
||||||
|
Commercial mortgage
|
13,997
|
|
14,088
|
|
||
|
Construction
|
1,871
|
|
1,960
|
|
||
|
Total commercial real estate loans
|
15,868
|
|
16,048
|
|
||
|
Commercial lease financing
(b)
|
4,598
|
|
4,826
|
|
||
|
Total commercial loans
|
64,779
|
|
62,733
|
|
||
|
Residential — prime loans:
|
||||||
|
Real estate — residential mortgage
|
5,473
|
|
5,483
|
|
||
|
Home equity loans
|
11,720
|
|
12,028
|
|
||
|
Total residential — prime loans
|
17,193
|
|
17,511
|
|
||
|
Consumer direct loans
|
1,758
|
|
1,794
|
|
||
|
Credit cards
|
1,068
|
|
1,106
|
|
||
|
Consumer indirect loans
|
3,291
|
|
3,261
|
|
||
|
Total consumer loans
|
23,310
|
|
23,672
|
|
||
|
Total loans
(c)
|
$
|
88,089
|
|
$
|
86,405
|
|
|
(a)
|
Loan balances include
$121 million
and
$119 million
of commercial credit card balances at
March 31, 2018
, and
December 31, 2017
, respectively.
|
|
(b)
|
Commercial lease financing includes receivables held as collateral for a secured borrowing of
$16 million
and
$24 million
at
March 31, 2018
, and
December 31, 2017
, respectively. Principal reductions are based on the cash payments received from these related receivables. Additional information pertaining to this secured borrowing is included in Note
20
(“
Long-Term Debt
”) beginning on page 174 of our
2017
Form 10-K.
|
|
(c)
|
Total loans exclude loans of
$1.3 billion
at
March 31, 2018
, and
$1.3 billion
at
December 31, 2017
, related to the discontinued operations of the education lending business.
|
60
Our loans held for sale are summarized as follows:
|
in millions
|
March 31, 2018
|
|
December 31, 2017
|
|
||
|
Commercial and industrial
|
$
|
194
|
|
$
|
139
|
|
|
Real estate — commercial mortgage
|
1,426
|
|
897
|
|
||
|
Real estate — residential mortgage
(a)
|
47
|
|
71
|
|
||
|
Total loans held for sale
|
$
|
1,667
|
|
$
|
1,107
|
|
|
(a)
|
Real estate — residential mortgage loans held for sale are held at fair value at
March 31, 2018
, and
December 31, 2017
. The contractual amount due on these loans totaled
$47 million
at
March 31, 2018
, and
$71 million
at
December 31, 2017
. Changes in fair value are recorded in “Consumer mortgage income” on the income statement. Additional information regarding the residential mortgage loans held for sale fair value methodology is provided in Note
5
(“
Fair Value Measurements
”).
|
Our quarterly summary of changes in loans held for sale is provided below:
|
in millions
|
March 31, 2018
|
|
December 31, 2017
|
|
||
|
Balance at beginning of the period
|
$
|
1,107
|
|
$
|
1,341
|
|
|
New originations
|
3,280
|
|
3,566
|
|
||
|
Transfers from (to) held to maturity, net
|
(14
|
)
|
(10
|
)
|
||
|
Loan sales
|
(2,705
|
)
|
(3,783
|
)
|
||
|
Loan draws (payments), net
|
(1
|
)
|
(7
|
)
|
||
|
Balance at end of period
(a)
|
$
|
1,667
|
|
$
|
1,107
|
|
|
(a)
|
Total loans held for sale include real estate — residential mortgage loans held for sale at fair value of
$47 million
at
March 31, 2018
and
$71 million
at
December 31, 2017
.
|
4. Asset Quality
We assess the credit quality of the loan portfolio by monitoring net credit losses, levels of nonperforming assets, delinquencies, and credit quality ratings as defined by management.
Credit Quality Indicators
The prevalent risk characteristic for both commercial and consumer loans is the risk of loss arising from an obligor’s inability or failure to meet contractual payment or performance terms. Evaluation of this risk is stratified and monitored by the loan risk rating grades assigned for the commercial loan portfolios and the refreshed FICO score assigned for the consumer loan portfolios.
Most extensions of credit are subject to loan grading or scoring. Loan grades are assigned at the time of origination, verified by credit risk management, and periodically re-evaluated thereafter. This risk rating methodology blends our judgment with quantitative modeling. Commercial loans generally are assigned two internal risk ratings. The first rating reflects the probability that the borrower will default on an obligation; the second rating reflects expected recovery rates on the credit facility. Default probability is determined based on, among other factors, the financial strength of the borrower, an assessment of the borrower’s management, the borrower’s competitive position within its industry sector, and our view of industry risk in the context of the general economic outlook. Types of exposure, transaction structure, and collateral, including credit risk mitigants, affect the expected recovery assessment.
Commercial Credit Exposure
—
Excluding PCI
Credit Risk Profile by Creditworthiness Category
(a), (b)
|
Commercial and industrial
|
RE — Commercial
|
RE — Construction
|
Commercial lease
|
Total
|
||||||||||||||||||||||||||
|
in millions
|
March 31,
|
|
December 31,
|
|
March 31,
|
|
December 31,
|
|
March 31,
|
|
December 31,
|
|
March 31,
|
|
December 31,
|
|
March 31,
|
|
December 31,
|
|
||||||||||
|
RATING
|
2018
|
|
2017
|
|
2018
|
|
2017
|
|
2018
|
|
2017
|
|
2018
|
|
2017
|
|
2018
|
|
2017
|
|
||||||||||
|
Pass
|
$
|
42,191
|
|
$
|
39,833
|
|
$
|
13,159
|
|
$
|
13,328
|
|
$
|
1,815
|
|
$
|
1,894
|
|
$
|
4,503
|
|
$
|
4,730
|
|
$
|
61,668
|
|
$
|
59,785
|
|
|
Criticized (Accruing)
|
1,860
|
|
1,790
|
|
564
|
|
482
|
|
51
|
|
38
|
|
90
|
|
90
|
|
2,565
|
|
2,400
|
|
||||||||||
|
Criticized (Nonaccruing)
|
189
|
|
153
|
|
33
|
|
30
|
|
2
|
|
2
|
|
5
|
|
6
|
|
229
|
|
191
|
|
||||||||||
|
Total
|
$
|
44,240
|
|
$
|
41,776
|
|
$
|
13,756
|
|
$
|
13,840
|
|
$
|
1,868
|
|
$
|
1,934
|
|
$
|
4,598
|
|
$
|
4,826
|
|
$
|
64,462
|
|
$
|
62,376
|
|
|
(a)
|
Credit quality indicators are updated on an ongoing basis and reflect credit quality information as of the dates indicated.
|
|
(b)
|
The term criticized refers to those loans that are internally classified by Key as special mention or worse, which are asset quality categories defined by regulatory authorities. These assets have an elevated level of risk and may have a high probability of default or total loss. Pass rated refers to all loans not classified as criticized.
|
61
Consumer Credit Exposure
—
Excluding PCI
Non-PCI Loans by Refreshed FICO Score
(a)
|
Residential — Prime
|
Consumer direct loans
|
Credit cards
|
Consumer indirect loans
|
Total
|
||||||||||||||||||||||||||
|
in millions
|
March 31,
|
|
December 31,
|
|
March 31,
|
|
December 31,
|
|
March 31,
|
|
December 31,
|
|
March 31,
|
|
December 31,
|
|
March 31,
|
|
December 31,
|
|
||||||||||
|
FICO SCORE
|
2018
|
|
2017
|
|
2018
|
|
2017
|
|
2018
|
|
2017
|
|
2018
|
|
2017
|
|
2018
|
|
2017
|
|
||||||||||
|
750 and above
|
$
|
10,046
|
|
$
|
10,226
|
|
$
|
503
|
|
$
|
519
|
|
$
|
451
|
|
$
|
477
|
|
$
|
1,449
|
|
$
|
1,472
|
|
$
|
12,449
|
|
$
|
12,694
|
|
|
660 to 749
|
5,028
|
|
5,181
|
|
665
|
|
690
|
|
499
|
|
508
|
|
1,172
|
|
1,184
|
|
7,364
|
|
7,563
|
|
||||||||||
|
Less than 660
|
1,475
|
|
1,519
|
|
220
|
|
225
|
|
118
|
|
121
|
|
515
|
|
529
|
|
2,328
|
|
2,394
|
|
||||||||||
|
No Score
|
275
|
|
208
|
|
366
|
|
356
|
|
—
|
|
—
|
|
155
|
|
76
|
|
796
|
|
640
|
|
||||||||||
|
Total
|
$
|
16,824
|
|
$
|
17,134
|
|
$
|
1,754
|
|
$
|
1,790
|
|
$
|
1,068
|
|
$
|
1,106
|
|
$
|
3,291
|
|
$
|
3,261
|
|
$
|
22,937
|
|
$
|
23,291
|
|
|
(a)
|
Borrower FICO scores provide information about the credit quality of our consumer loan portfolio as they provide an indication as to the likelihood that a debtor will repay its debts. The scores are obtained from a nationally recognized consumer rating agency and are presented in the above table at the dates indicated.
|
Commercial Credit Exposure
—
PCI
Credit Risk Profile by Creditworthiness Category
(a), (b)
|
Commercial and Industrial
|
RE — Commercial
|
RE — Construction
|
Commercial Lease
|
Total
|
||||||||||||||||||||||||
|
in millions
|
March 31,
|
|
December 31,
|
|
March 31,
|
|
December 31,
|
|
March 31,
|
|
December 31,
|
|
March 31,
|
|
December 31,
|
|
March 31,
|
|
December 31,
|
|
||||||||
|
RATING
|
2018
|
|
2017
|
|
2018
|
|
2017
|
|
2018
|
|
2017
|
|
2018
|
|
2017
|
|
2018
|
|
2017
|
|
||||||||
|
Pass
|
$
|
27
|
|
$
|
41
|
|
$
|
163
|
|
$
|
153
|
|
$
|
3
|
|
$
|
26
|
|
—
|
|
—
|
|
$
|
193
|
|
$
|
220
|
|
|
Criticized
|
46
|
|
42
|
|
78
|
|
95
|
|
—
|
|
—
|
|
—
|
|
—
|
|
124
|
|
137
|
|
||||||||
|
Total
|
$
|
73
|
|
$
|
83
|
|
$
|
241
|
|
$
|
248
|
|
$
|
3
|
|
$
|
26
|
|
—
|
|
—
|
|
$
|
317
|
|
$
|
357
|
|
|
(a)
|
Credit quality indicators are updated on an ongoing basis and reflect credit quality information as of the dates indicated.
|
|
(b)
|
The term “criticized” refers to those loans that are internally classified by Key as special mention or worse, which are asset quality categories defined by regulatory authorities. These assets have an elevated level of risk and may have a high probability of default or total loss. Pass rated refers to all loans not classified as criticized.
|
Consumer Credit Exposure
—
PCI
PCI Loans by Refreshed FICO Score
(a)
|
Residential — Prime
|
Consumer direct loans
|
Credit cards
|
Consumer indirect loans
|
Total
|
||||||||||||||||||||||
|
in millions
|
March 31,
|
|
December 31,
|
|
March 31,
|
|
December 31,
|
|
March 31,
|
|
December 31,
|
|
March 31,
|
|
December 31,
|
|
March 31,
|
|
December 31,
|
|
||||||
|
FICO SCORE
|
2018
|
|
2017
|
|
2018
|
|
2017
|
|
2018
|
|
2017
|
|
2018
|
|
2017
|
|
2018
|
|
2017
|
|
||||||
|
750 and above
|
$
|
139
|
|
$
|
149
|
|
—
|
|
—
|
|
—
|
|
—
|
|
—
|
|
—
|
|
$
|
139
|
|
$
|
149
|
|
||
|
660 to 749
|
119
|
|
117
|
|
$
|
2
|
|
$
|
2
|
|
—
|
|
—
|
|
—
|
|
—
|
|
121
|
|
119
|
|
||||
|
Less than 660
|
99
|
|
105
|
|
2
|
|
2
|
|
—
|
|
—
|
|
—
|
|
—
|
|
101
|
|
107
|
|
||||||
|
No Score
|
12
|
|
6
|
|
—
|
|
—
|
|
—
|
|
—
|
|
—
|
|
—
|
|
12
|
|
6
|
|
||||||
|
Total
|
$
|
369
|
|
$
|
377
|
|
$
|
4
|
|
$
|
4
|
|
—
|
|
—
|
|
—
|
|
—
|
|
$
|
373
|
|
$
|
381
|
|
|
(a)
|
Borrower FICO scores provide information about the credit quality of our consumer loan portfolio as they provide an indication as to the likelihood that a debtor will repay its debts. The scores are obtained from a nationally recognized consumer rating agency and are presented in the above table at the dates indicated.
|
Nonperforming and Past Due Loans
Our policies for determining past due loans, placing loans on nonaccrual, applying payments on nonaccrual loans, and resuming accrual of interest for our commercial and consumer loan portfolios are disclosed in Note
1
(“
Summary of Significant Accounting Policies
”) under the heading “Nonperforming Loans” beginning on page 101 of our
2017
Form 10-K.
The following aging analysis of past due and current loans as of
March 31, 2018
, and
December 31, 2017
, provides further information regarding Key’s credit exposure.
62
Aging Analysis of Loan Portfolio
(a)
|
March 31, 2018
|
Current
|
30-59
Days Past
Due
(b)
|
60-89
Days Past
Due
(b)
|
90 and
Greater
Days Past
Due
(b)
|
Non-performing
Loans
|
Total Past
Due and
Non-performing
Loans
|
Purchased
Credit
Impaired
|
Total
Loans
(c), (d)
|
||||||||||||||||
|
in millions
|
||||||||||||||||||||||||
|
LOAN TYPE
|
||||||||||||||||||||||||
|
Commercial and industrial
|
$
|
43,905
|
|
$
|
93
|
|
$
|
26
|
|
$
|
27
|
|
$
|
189
|
|
$
|
335
|
|
$
|
73
|
|
$
|
44,313
|
|
|
Commercial real estate:
|
||||||||||||||||||||||||
|
Commercial mortgage
|
13,684
|
|
17
|
|
9
|
|
13
|
|
33
|
|
72
|
|
241
|
|
13,997
|
|
||||||||
|
Construction
|
1,829
|
|
26
|
|
9
|
|
2
|
|
2
|
|
39
|
|
3
|
|
1,871
|
|
||||||||
|
Total commercial real estate loans
|
15,513
|
|
43
|
|
18
|
|
15
|
|
35
|
|
111
|
|
244
|
|
15,868
|
|
||||||||
|
Commercial lease financing
|
4,577
|
|
4
|
|
4
|
|
8
|
|
5
|
|
21
|
|
—
|
|
4,598
|
|
||||||||
|
Total commercial loans
|
$
|
63,995
|
|
$
|
140
|
|
$
|
48
|
|
$
|
50
|
|
$
|
229
|
|
$
|
467
|
|
$
|
317
|
|
$
|
64,779
|
|
|
Real estate — residential mortgage
|
$
|
5,044
|
|
$
|
14
|
|
$
|
5
|
|
$
|
4
|
|
$
|
59
|
|
$
|
82
|
|
$
|
347
|
|
$
|
5,473
|
|
|
Home equity loans
|
11,424
|
|
25
|
|
10
|
|
10
|
|
229
|
|
274
|
|
22
|
|
11,720
|
|
||||||||
|
Consumer direct loans
|
1,720
|
|
21
|
|
4
|
|
5
|
|
4
|
|
34
|
|
4
|
|
1,758
|
|
||||||||
|
Credit cards
|
1,045
|
|
6
|
|
4
|
|
11
|
|
2
|
|
23
|
|
—
|
|
1,068
|
|
||||||||
|
Consumer indirect loans
|
3,243
|
|
22
|
|
6
|
|
2
|
|
18
|
|
48
|
|
—
|
|
3,291
|
|
||||||||
|
Total consumer loans
|
$
|
22,476
|
|
$
|
88
|
|
$
|
29
|
|
$
|
32
|
|
$
|
312
|
|
$
|
461
|
|
$
|
373
|
|
$
|
23,310
|
|
|
Total loans
|
$
|
86,471
|
|
$
|
228
|
|
$
|
77
|
|
$
|
82
|
|
$
|
541
|
|
$
|
928
|
|
$
|
690
|
|
$
|
88,089
|
|
|
(a)
|
Amounts in table represent recorded investment and exclude loans held for sale. Recorded investment represents the face amount of the loan increased or decreased by applicable accrued interest, net deferred loan fees and costs, and unamortized premium or discount, and reflects direct charge-offs.
|
|
(b)
|
Past due loan amounts exclude PCI, even if contractually past due (or if we do not expect to collect principal or interest in full based on the original contractual terms), as we are currently accreting income over the remaining term of the loans.
|
|
(c)
|
Net of unearned income, net deferred loan fees and costs, and unamortized discounts and premiums.
|
|
(d)
|
Future accretable yield related to PCI loans is not included in the analysis of the loan portfolio.
|
|
December 31, 2017
|
Current
|
30-59
Days Past
Due
(b)
|
60-89
Days Past
Due
(b)
|
90 and
Greater
Days Past
Due
(b)
|
Non-performing
Loans
|
Total Past
Due and
Non-performing
Loans
|
Purchased
Credit
Impaired
|
Total
Loans
(c), (d)
|
||||||||||||||||
|
in millions
|
||||||||||||||||||||||||
|
LOAN TYPE
|
||||||||||||||||||||||||
|
Commercial and industrial
|
$
|
41,444
|
|
$
|
111
|
|
$
|
34
|
|
$
|
34
|
|
$
|
153
|
|
$
|
332
|
|
83
|
|
$
|
41,859
|
|
|
|
Commercial real estate:
|
||||||||||||||||||||||||
|
Commercial mortgage
|
13,750
|
|
26
|
|
13
|
|
21
|
|
30
|
|
90
|
|
248
|
|
14,088
|
|
||||||||
|
Construction
|
1,919
|
|
4
|
|
9
|
|
—
|
|
2
|
|
15
|
|
26
|
|
1,960
|
|
||||||||
|
Total commercial real estate loans
|
15,669
|
|
30
|
|
22
|
|
21
|
|
32
|
|
105
|
|
274
|
|
16,048
|
|
||||||||
|
Commercial lease financing
|
4,791
|
|
23
|
|
4
|
|
2
|
|
6
|
|
35
|
|
—
|
|
4,826
|
|
||||||||
|
Total commercial loans
|
$
|
61,904
|
|
$
|
164
|
|
$
|
60
|
|
$
|
57
|
|
$
|
191
|
|
$
|
472
|
|
357
|
|
$
|
62,733
|
|
|
|
Real estate — residential mortgage
|
$
|
5,043
|
|
$
|
16
|
|
$
|
7
|
|
$
|
4
|
|
$
|
58
|
|
$
|
85
|
|
$
|
355
|
|
$
|
5,483
|
|
|
Home equity loans
|
11,721
|
|
32
|
|
15
|
|
9
|
|
229
|
|
285
|
|
22
|
|
12,028
|
|
||||||||
|
Consumer direct loans
|
1,768
|
|
9
|
|
4
|
|
5
|
|
4
|
|
22
|
|
4
|
|
1,794
|
|
||||||||
|
Credit cards
|
1,081
|
|
7
|
|
5
|
|
11
|
|
2
|
|
25
|
|
—
|
|
1,106
|
|
||||||||
|
Consumer indirect loans
|
3,199
|
|
33
|
|
7
|
|
3
|
|
19
|
|
62
|
|
—
|
|
3,261
|
|
||||||||
|
Total consumer loans
|
$
|
22,812
|
|
$
|
97
|
|
$
|
38
|
|
$
|
32
|
|
$
|
312
|
|
$
|
479
|
|
$
|
381
|
|
$
|
23,672
|
|
|
Total loans
|
$
|
84,716
|
|
$
|
261
|
|
$
|
98
|
|
$
|
89
|
|
$
|
503
|
|
$
|
951
|
|
$
|
738
|
|
$
|
86,405
|
|
|
(a)
|
Amounts in table represent recorded investment and exclude loans held for sale. Recorded investment represents the face amount of the loan increased or decreased by applicable accrued interest, net deferred loan fees and costs, and unamortized premium or discount, and reflects direct charge-offs.
|
|
(b)
|
Past due loan amounts exclude PCI, even if contractually past due (or if we do not expect to collect principal or interest in full based on the original contractual terms), as we are currently accreting income over the remaining term of the loans.
|
|
(c)
|
Net of unearned income, net deferred loan fees and costs, and unamortized discounts and premiums.
|
|
(d)
|
Future accretable yield related to purchased credit impaired loans is not included in the analysis of the loan portfolio.
|
At
March 31, 2018
, the approximate carrying amount of our commercial nonperforming loans outstanding represented
70%
of their original contractual amount owed, total nonperforming loans outstanding represented
79%
of their original contractual amount owed, and nonperforming assets in total were carried at
79%
of their original contractual amount owed.
Nonperforming loans and loans held for sale reduced expected interest income by
$7 million
for the
three months ended March 31, 2018
, and
$6 million
for the
three months ended March 31, 2017
.
63
The following tables set forth a further breakdown of individually impaired loans as of
March 31, 2018
, and
December 31, 2017
:
|
March 31, 2018
|
Recorded
Investment
(a)
|
Unpaid Principal Balance
(b)
|
Specific
Allowance
|
||||||
|
in millions
|
|||||||||
|
With no related allowance recorded:
|
|||||||||
|
Commercial and industrial
|
$
|
166
|
|
$
|
206
|
|
—
|
|
|
|
Commercial real estate:
|
|||||||||
|
Commercial mortgage
|
13
|
|
18
|
|
—
|
|
|||
|
Total commercial real estate loans
|
13
|
|
18
|
|
—
|
|
|||
|
Total commercial loans
|
179
|
|
224
|
|
—
|
|
|||
|
Real estate — residential mortgage
|
17
|
|
26
|
|
—
|
|
|||
|
Home equity loans
|
58
|
|
67
|
|
—
|
|
|||
|
Consumer indirect loans
|
2
|
|
4
|
|
—
|
|
|||
|
Total consumer loans
|
77
|
|
97
|
|
—
|
|
|||
|
Total loans with no related allowance recorded
|
256
|
|
321
|
|
—
|
|
|||
|
With an allowance recorded:
|
|||||||||
|
Commercial and industrial
|
4
|
|
13
|
|
$
|
1
|
|
||
|
Total commercial loans
|
4
|
|
13
|
|
1
|
|
|||
|
Real estate — residential mortgage
|
32
|
|
49
|
|
4
|
|
|||
|
Home equity loans
|
65
|
|
70
|
|
9
|
|
|||
|
Consumer direct loans
|
4
|
|
4
|
|
—
|
|
|||
|
Credit cards
|
3
|
|
3
|
|
—
|
|
|||
|
Consumer indirect loans
|
33
|
|
33
|
|
4
|
|
|||
|
Total consumer loans
|
137
|
|
159
|
|
17
|
|
|||
|
Total loans with an allowance recorded
|
141
|
|
172
|
|
18
|
|
|||
|
Total
|
$
|
397
|
|
$
|
493
|
|
$
|
18
|
|
|
(a)
|
The Recorded Investment represents the face amount of the loan increased or decreased by applicable accrued interest, net deferred loan fees and costs, and unamortized premium or discount, and reflects direct charge-offs. This amount is a component of total loans on our Consolidated Balance Sheet.
|
|
(b)
|
The Unpaid Principal Balance represents the customer’s legal obligation to us.
|
|
December 31, 2017
|
Recorded
Investment
(a)
|
Unpaid Principal Balance
(b)
|
Specific
Allowance
|
||||||
|
in millions
|
|||||||||
|
With no related allowance recorded:
|
|||||||||
|
Commercial and industrial
|
$
|
126
|
|
$
|
153
|
|
—
|
|
|
|
Commercial real estate:
|
|||||||||
|
Commercial mortgage
|
12
|
|
18
|
|
—
|
|
|||
|
Total commercial real estate loans
|
12
|
|
18
|
|
—
|
|
|||
|
Total commercial loans
|
138
|
|
171
|
|
—
|
|
|||
|
Real estate — residential mortgage
|
17
|
|
17
|
|
—
|
|
|||
|
Home equity loans
|
56
|
|
56
|
|
—
|
|
|||
|
Consumer indirect loans
|
2
|
|
2
|
|
—
|
|
|||
|
Total consumer loans
|
75
|
|
75
|
|
—
|
|
|||
|
Total loans with no related allowance recorded
|
213
|
|
246
|
|
—
|
|
|||
|
With an allowance recorded:
|
|||||||||
|
Commercial and industrial
|
10
|
|
28
|
|
$
|
6
|
|
||
|
Total commercial loans
|
10
|
|
28
|
|
6
|
|
|||
|
Real estate — residential mortgage
|
32
|
|
32
|
|
5
|
|
|||
|
Home equity loans
|
61
|
|
61
|
|
9
|
|
|||
|
Consumer direct loans
|
4
|
|
4
|
|
—
|
|
|||
|
Credit cards
|
2
|
|
2
|
|
—
|
|
|||
|
Consumer indirect loans
|
32
|
|
32
|
|
3
|
|
|||
|
Total consumer loans
|
131
|
|
131
|
|
17
|
|
|||
|
Total loans with an allowance recorded
|
141
|
|
159
|
|
23
|
|
|||
|
Total
|
$
|
354
|
|
$
|
405
|
|
$
|
23
|
|
|
(a)
|
The Recorded Investment represents the face amount of the loan increased or decreased by applicable accrued interest, net deferred loan fees and costs, and unamortized premium or discount, and reflects direct charge-offs. This amount is a component of total loans on our Consolidated Balance Sheet.
|
|
(b)
|
The Unpaid Principal Balance represents the customer’s legal obligation to us.
|
64
The following table sets forth a further breakdown of the average individually impaired loans reported by Key:
|
Average Recorded Investment
(a)
|
Three Months Ended March 31,
|
|||||
|
in millions
|
2018
|
|
2017
|
|
||
|
Commercial and industrial
|
$
|
153
|
|
$
|
260
|
|
|
Commercial real estate:
|
||||||
|
Commercial mortgage
|
12
|
|
10
|
|
||
|
Construction
|
—
|
|
—
|
|
||
|
Total commercial real estate loans
|
12
|
|
10
|
|
||
|
Total commercial loans
|
165
|
|
270
|
|
||
|
Real estate — residential mortgage
|
49
|
|
51
|
|
||
|
Home equity loans
|
120
|
|
125
|
|
||
|
Consumer direct loans
|
4
|
|
3
|
|
||
|
Credit cards
|
3
|
|
2
|
|
||
|
Consumer indirect loans
|
35
|
|
33
|
|
||
|
Total consumer loans
|
211
|
|
214
|
|
||
|
Total
|
$
|
376
|
|
$
|
484
|
|
|
(a)
|
The Recorded Investment represents the face amount of the loan increased or decreased by applicable accrued interest, net deferred loan fees and costs, and unamortized premium or discount, and reflects direct charge-offs. This amount is a component of total loans on our Consolidated Balance Sheet.
|
For the three months ended March 31, 2018 and March 31, 2017, interest income recognized on the outstanding balances of accruing impaired loans totaled
$2 million
and
$3 million
, respectively.
TDRs
We classify loan modifications as TDRs when a borrower is experiencing financial difficulties and we have granted a concession without commensurate financial, structural, or legal consideration. Acquired loans that were previously modified by First Niagara in a TDR are no longer classified as TDRs at the Acquisition Date. An acquired loan may only be classified as a TDR if a modification meeting the above TDR criteria is performed after the Acquisition Date. PCI loans cannot be classified as TDRs. All commercial and consumer loan TDRs, regardless of size, are individually evaluated for impairment to determine the probable loss content and are assigned a specific loan allowance. This designation has the effect of moving the loan from the general reserve methodology (i.e., collectively evaluated) to the specific reserve methodology (i.e., individually evaluated) and may impact the ALLL through a charge-off or increased loan loss provision. These components affect the ultimate allowance level.
As TDRs are individually evaluated for impairment under the specific reserve methodology, subsequent defaults do not generally have a significant additional impact on the ALLL. Commitments outstanding to lend additional funds to borrowers whose loan terms have been modified in TDRs are
$2 million
and
$2 million
at
March 31, 2018
and
December 31, 2017
, respectively.
Our loan modifications are handled on a case-by-case basis and are negotiated to achieve mutually agreeable terms that maximize loan collectability and meet the borrower’s financial needs. The consumer TDR other concession category primarily includes those borrowers’ debts that are discharged through bankruptcy and have not been formally re-affirmed. At
March 31, 2018
, and
December 31, 2017
, the recorded investment of consumer residential mortgage loans in the process of foreclosure was approximately
$155 million
and
$142 million
, respectively. At
March 31, 2018
, and
December 31, 2017
, we had
$28 million
and
$31 million
, respectively, of OREO which included the carrying value of foreclosed residential real estate of approximately
$22 million
and
$26 million
, respectively.
The following table shows the post-modification outstanding recorded investment by concession type for our commercial and consumer accruing and nonaccruing TDRs that occurred during the periods indicated:
65
|
Three Months Ended March 31,
|
||||||
|
in millions
|
2018
|
2017
|
||||
|
Commercial loans:
|
||||||
|
Interest rate reduction
|
—
|
|
—
|
|
||
|
Forgiveness of principal
|
—
|
|
—
|
|
||
|
Extension of Maturity Date
|
$
|
1
|
|
$
|
3
|
|
|
Payment or Covenant Modification/Deferment
|
—
|
|
25
|
|
||
|
Bankruptcy Plan Modification
|
—
|
|
—
|
|
||
|
Total
|
$
|
1
|
|
$
|
28
|
|
|
Consumer loans:
|
||||||
|
Interest rate reduction
|
$
|
8
|
|
$
|
2
|
|
|
Forgiveness of principal
|
—
|
|
—
|
|
||
|
Other
|
12
|
|
13
|
|
||
|
Total
|
$
|
20
|
|
$
|
15
|
|
|
Total commercial and consumer TDRs
|
$
|
21
|
|
$
|
43
|
|
The following table summarizes the change in the post-modification outstanding recorded investment of our accruing and nonaccruing TDRs during the periods indicated:
|
Three Months Ended March 31,
|
||||||
|
in millions
|
2018
|
2017
|
||||
|
Balance at beginning of the period
|
$
|
317
|
|
280
|
|
|
|
Additions
|
21
|
|
47
|
|
||
|
Payments
|
(19
|
)
|
(14
|
)
|
||
|
Charge-offs
|
(2
|
)
|
$
|
(11
|
)
|
|
|
Balance at end of period
(a)
|
$
|
317
|
|
$
|
302
|
|
A further breakdown of TDRs included in nonperforming loans by loan category for the periods indicated are as follows:
|
March 31, 2018
|
Number of
Loans
|
Pre-modification
Outstanding
Recorded
Investment
|
Post-modification
Outstanding
Recorded
Investment
|
|||||
|
dollars in millions
|
||||||||
|
LOAN TYPE
|
||||||||
|
Nonperforming:
|
||||||||
|
Commercial and industrial
|
30
|
|
$
|
109
|
|
$
|
77
|
|
|
Commercial real estate:
|
||||||||
|
Commercial mortgage
|
7
|
|
14
|
|
9
|
|
||
|
Total commercial real estate loans
|
7
|
|
14
|
|
9
|
|
||
|
Total commercial loans
|
37
|
|
123
|
|
86
|
|
||
|
Real estate — residential mortgage
|
264
|
|
17
|
|
17
|
|
||
|
Home equity loans
|
1,133
|
|
68
|
|
61
|
|
||
|
Consumer direct loans
|
104
|
|
2
|
|
2
|
|
||
|
Credit cards
|
277
|
|
1
|
|
1
|
|
||
|
Consumer indirect loans
|
868
|
|
16
|
|
13
|
|
||
|
Total consumer loans
|
2,646
|
|
104
|
|
94
|
|
||
|
Total nonperforming TDRs
|
2,683
|
|
227
|
|
180
|
|
||
|
Prior-year accruing:
(a)
|
||||||||
|
Commercial and industrial
|
14
|
|
30
|
|
13
|
|
||
|
Commercial real estate
|
||||||||
|
Commercial mortgage
|
2
|
|
3
|
|
3
|
|
||
|
Total commercial real estate loans
|
2
|
|
3
|
|
3
|
|
||
|
Total commercial loans
|
16
|
|
33
|
|
16
|
|
||
|
Real estate — residential mortgage
|
516
|
|
32
|
|
31
|
|
||
|
Home equity loans
|
1,338
|
|
78
|
|
62
|
|
||
|
Consumer direct loans
|
74
|
|
4
|
|
3
|
|
||
|
Credit cards
|
493
|
|
2
|
|
2
|
|
||
|
Consumer indirect loans
|
450
|
|
33
|
|
23
|
|
||
|
Total consumer loans
|
2,871
|
|
149
|
|
121
|
|
||
|
Total prior-year accruing TDRs
|
2,887
|
|
182
|
|
137
|
|
||
|
Total TDRs
|
5,570
|
|
$
|
409
|
|
$
|
317
|
|
|
(a)
|
All TDRs that were restructured prior to January 1,
2018
, and are fully accruing.
|
66
A further breakdown of TDRs included in nonperforming loans by loan category as of
December 31, 2017
, follows:
|
December 31, 2017
|
Number
of Loans
|
Pre-modification
Outstanding
Recorded
Investment
|
Post-modification
Outstanding
Recorded
Investment
|
|||||
|
dollars in millions
|
||||||||
|
LOAN TYPE
|
||||||||
|
Nonperforming:
|
||||||||
|
Commercial and industrial
|
20
|
|
$
|
109
|
|
$
|
86
|
|
|
Commercial real estate:
|
||||||||
|
Commercial mortgage
|
8
|
|
16
|
|
12
|
|
||
|
Total commercial real estate loans
|
8
|
|
16
|
|
12
|
|
||
|
Total commercial loans
|
28
|
|
125
|
|
98
|
|
||
|
Real estate — residential mortgage
|
308
|
|
18
|
|
18
|
|
||
|
Home equity loans
|
1,025
|
|
64
|
|
57
|
|
||
|
Consumer direct loans
|
114
|
|
2
|
|
2
|
|
||
|
Credit cards
|
322
|
|
2
|
|
1
|
|
||
|
Consumer indirect loans
|
825
|
|
16
|
|
13
|
|
||
|
Total consumer loans
|
2,594
|
|
102
|
|
91
|
|
||
|
Total nonperforming TDRs
|
2,622
|
|
227
|
|
189
|
|
||
|
Prior-year accruing:
(a)
|
||||||||
|
Commercial and Industrial
|
4
|
|
30
|
|
13
|
|
||
|
Total commercial loans
|
4
|
|
30
|
|
13
|
|
||
|
Real estate — residential mortgage
|
484
|
|
31
|
|
31
|
|
||
|
Home equity loans
|
1,276
|
|
75
|
|
59
|
|
||
|
Consumer direct loans
|
48
|
|
3
|
|
2
|
|
||
|
Credit cards
|
430
|
|
1
|
|
1
|
|
||
|
Consumer indirect loans
|
320
|
|
31
|
|
22
|
|
||
|
Total consumer loans
|
2,558
|
|
141
|
|
115
|
|
||
|
Total prior-year accruing TDRs
|
2,562
|
|
171
|
|
128
|
|
||
|
Total TDRs
|
5,184
|
|
$
|
398
|
|
$
|
317
|
|
|
(a)
|
All TDRs that were restructured prior to January 1,
2017
, and are fully accruing.
|
Commercial loan TDRs are considered defaulted when principal and interest payments are 90 days past due. Consumer loan TDRs are considered defaulted when principal and interest payments are more than 60 days past due. During the
three months ended March 31, 2018
, there were
no
commercial loan TDRs and
41
consumer loan TDRs with a combined recorded investment of
$1 million
that experienced payment defaults after modifications resulting in TDR status during
2017
. During the
three months ended March 31, 2017
, there were
no
commercial loan TDRs and
3
consumer loan TDRs with a combined recorded investment of less than
$1 million
that experienced payment defaults after modifications resulting in TDR status during
2016
.
ALLL and Liability for Credit Losses on Unfunded Lending-Related Commitments
We determine the appropriate level of the ALLL on at least a quarterly basis. The methodology is described in Note 1 (“Summary of Significant Accounting Policies”) under the heading “Allowance for Loan and Lease Losses” beginning on page 102 of our 2017 Form 10-K.
The ALLL on the acquired non-impaired loan portfolio is estimated using the same methodology as the originated portfolio, however, the estimated ALLL is compared to the remaining accretable yield to determine if an ALLL must be recorded. For PCI loans, Key estimates cash flows expected to be collected quarterly. Decreases in expected cash flows are recognized as impairment through a provision for loan and lease losses and an increase in the ALLL. There was
$3 million
of provision for loan and lease losses on PCI loans during the
three
months ended
March 31, 2018
. There was
$3 million
of provision for loan and lease losses on PCI loans during the twelve months ended
December 31, 2017
. There was
$4 million
of provision for loan and lease losses on PCI loans during the three months ended
March 31, 2017
.
The ALLL at
March 31, 2018
, represents our best estimate of the incurred credit losses inherent in the loan portfolio at that date. A summary of the changes in the ALLL for the periods indicated is presented in the table below:
67
|
|
Three months ended March 31,
|
|||||
|
in millions
|
2018
|
|
2017
|
|
||
|
Balance at beginning of period — continuing operations
|
$
|
877
|
|
$
|
858
|
|
|
Charge-offs
|
(72
|
)
|
(77
|
)
|
||
|
Recoveries
|
18
|
|
19
|
|
||
|
Net loans and leases charged off
|
(54
|
)
|
(58
|
)
|
||
|
Provision for loan and lease losses from continuing operations
|
58
|
|
70
|
|
||
|
Balance at end of period — continuing operations
|
$
|
881
|
|
$
|
870
|
|
The changes in the ALLL by loan category for the periods indicated are as follows:
Three months ended March 31, 2018
:
|
in millions
|
December 31, 2017
|
Provision
|
Charge-offs
|
Recoveries
|
March 31, 2018
|
|||||||||||
|
Commercial and Industrial
|
$
|
529
|
|
$
|
35
|
|
$
|
(37
|
)
|
$
|
6
|
|
$
|
533
|
|
|
|
Commercial real estate:
|
||||||||||||||||
|
Real estate — commercial mortgage
|
133
|
|
4
|
|
(1
|
)
|
—
|
|
136
|
|
||||||
|
Real estate — construction
|
30
|
|
2
|
|
—
|
|
1
|
|
33
|
|
||||||
|
Total commercial real estate loans
|
163
|
|
6
|
|
(1
|
)
|
1
|
|
169
|
|
||||||
|
Commercial lease financing
|
43
|
|
(3
|
)
|
(1
|
)
|
1
|
|
40
|
|
||||||
|
Total commercial loans
|
735
|
|
38
|
|
(39
|
)
|
8
|
|
742
|
|
||||||
|
Real estate — residential mortgage
|
7
|
|
3
|
|
(1
|
)
|
—
|
|
9
|
|
||||||
|
Home equity loans
|
43
|
|
(4
|
)
|
(4
|
)
|
3
|
|
38
|
|
||||||
|
Consumer direct loans
|
28
|
|
5
|
|
(8
|
)
|
2
|
|
27
|
|
||||||
|
Credit cards
|
44
|
|
12
|
|
(12
|
)
|
1
|
|
45
|
|
||||||
|
Consumer indirect loans
|
20
|
|
4
|
|
(8
|
)
|
4
|
|
20
|
|
||||||
|
Total consumer loans
|
142
|
|
20
|
|
(33
|
)
|
10
|
|
139
|
|
||||||
|
Total ALLL — continuing operations
|
877
|
|
58
|
|
(a)
|
(72
|
)
|
18
|
|
881
|
|
|||||
|
Discontinued operations
|
16
|
|
2
|
|
(4
|
)
|
2
|
|
16
|
|
||||||
|
Total ALLL — including discontinued operations
|
$
|
893
|
|
$
|
60
|
|
$
|
(76
|
)
|
$
|
20
|
|
$
|
897
|
|
|
|
(a)
|
Excludes a
provision
for losses on lending-related commitments of
$3 million
.
|
Three months ended March 31, 2017
:
|
in millions
|
December 31, 2016
|
Provision
|
Charge-offs
|
Recoveries
|
March 31, 2017
|
|||||||||||
|
Commercial and Industrial
|
$
|
508
|
|
$
|
31
|
|
$
|
(32
|
)
|
$
|
5
|
|
$
|
512
|
|
|
|
Commercial real estate:
|
||||||||||||||||
|
Real estate — commercial mortgage
|
144
|
|
2
|
|
—
|
|
—
|
|
146
|
|
||||||
|
Real estate — construction
|
22
|
|
6
|
|
—
|
|
1
|
|
29
|
|
||||||
|
Total commercial real estate loans
|
166
|
|
8
|
|
—
|
|
1
|
|
175
|
|
||||||
|
Commercial lease financing
|
42
|
|
3
|
|
(7
|
)
|
2
|
|
40
|
|
||||||
|
Total commercial loans
|
716
|
|
42
|
|
(39
|
)
|
8
|
|
727
|
|
||||||
|
Real estate — residential mortgage
|
17
|
|
(3
|
)
|
2
|
|
2
|
|
18
|
|
||||||
|
Home equity loans
|
54
|
|
4
|
|
(8
|
)
|
3
|
|
53
|
|
||||||
|
Consumer direct loans
|
24
|
|
9
|
|
(10
|
)
|
1
|
|
24
|
|
||||||
|
Credit cards
|
38
|
|
10
|
|
(11
|
)
|
1
|
|
38
|
|
||||||
|
Consumer indirect loans
|
9
|
|
8
|
|
(11
|
)
|
4
|
|
10
|
|
||||||
|
Total consumer loans
|
142
|
|
28
|
|
(38
|
)
|
11
|
|
143
|
|
||||||
|
Total ALLL — continuing operations
|
858
|
|
70
|
|
(a)
|
(77
|
)
|
19
|
|
870
|
|
|||||
|
Discontinued operations
|
24
|
|
3
|
|
(6
|
)
|
2
|
|
23
|
|
||||||
|
Total ALLL — including discontinued operations
|
$
|
882
|
|
$
|
73
|
|
$
|
(83
|
)
|
$
|
21
|
|
$
|
893
|
|
|
|
(a)
|
Excludes a
credit
for losses on lending-related commitments of
$7 million
.
|
68
A breakdown of the individual and collective ALLL and the corresponding loan balances as of
March 31, 2018
, follows:
|
|
Allowance
|
Outstanding
|
|||||||||||||||||||||
|
March 31, 2018
|
Individually
Evaluated for
Impairment
|
Collectively
Evaluated for
Impairment
|
Purchased
Credit
Impaired
|
Loans
|
Individually
Evaluated for
Impairment
|
Collectively
Evaluated for
Impairment
|
Purchased
Credit
Impaired
|
||||||||||||||||
|
in millions
|
|
|
|||||||||||||||||||||
|
Commercial and industrial
|
$
|
1
|
|
$
|
529
|
|
3
|
|
$
|
44,313
|
|
|
$
|
170
|
|
$
|
44,070
|
|
|
$
|
73
|
|
|
|
Commercial real estate:
|
|||||||||||||||||||||||
|
Commercial mortgage
|
—
|
|
132
|
|
4
|
|
13,997
|
|
|
13
|
|
13,743
|
|
|
241
|
|
|||||||
|
Construction
|
—
|
|
33
|
|
—
|
|
1,871
|
|
|
—
|
|
1,868
|
|
|
3
|
|
|||||||
|
Total commercial real estate loans
|
—
|
|
165
|
|
4
|
|
15,868
|
|
|
13
|
|
15,611
|
|
|
244
|
|
|||||||
|
Commercial lease financing
|
—
|
|
40
|
|
—
|
|
4,598
|
|
|
—
|
|
4,598
|
|
|
—
|
|
|||||||
|
Total commercial loans
|
1
|
|
734
|
|
7
|
|
64,779
|
|
|
183
|
|
64,279
|
|
|
317
|
|
|||||||
|
Real estate — residential mortgage
|
4
|
|
3
|
|
2
|
|
5,473
|
|
|
49
|
|
5,077
|
|
|
347
|
|
|||||||
|
Home equity loans
|
9
|
|
28
|
|
1
|
|
11,720
|
|
|
123
|
|
11,575
|
|
|
22
|
|
|||||||
|
Consumer direct loans
|
—
|
|
27
|
|
—
|
|
1,758
|
|
|
4
|
|
1,750
|
|
|
4
|
|
|||||||
|
Credit cards
|
—
|
|
45
|
|
—
|
|
1,068
|
|
|
3
|
|
1,065
|
|
|
—
|
|
|||||||
|
Consumer indirect loans
|
4
|
|
16
|
|
—
|
|
3,291
|
|
|
35
|
|
3,256
|
|
|
—
|
|
|||||||
|
Total consumer loans
|
17
|
|
119
|
|
3
|
|
23,310
|
|
|
214
|
|
22,723
|
|
|
373
|
|
|||||||
|
Total ALLL — continuing operations
|
18
|
|
853
|
|
10
|
|
88,089
|
|
|
397
|
|
87,002
|
|
|
690
|
|
|||||||
|
Discontinued operations
|
3
|
|
13
|
|
—
|
|
1,256
|
|
(a)
|
21
|
|
1,235
|
|
(a)
|
—
|
|
|||||||
|
Total ALLL — including discontinued operations
|
$
|
21
|
|
$
|
866
|
|
10
|
|
$
|
89,345
|
|
|
$
|
418
|
|
$
|
88,237
|
|
|
$
|
690
|
|
|
|
(a)
|
Amount includes
$2 million
of loans carried at fair value that are excluded from ALLL consideration.
|
A breakdown of the individual and collective ALLL and the corresponding loan balances as of
December 31, 2017
, follows:
|
|
Allowance
|
Outstanding
|
||||||||||||||||||||||
|
December 31, 2017
|
Individually
Evaluated for
Impairment
|
Collectively
Evaluated for
Impairment
|
Purchased
Credit
Impaired
|
Loans
|
Individually
Evaluated for
Impairment
|
Collectively
Evaluated for
Impairment
|
Purchased
Credit
Impaired
|
|||||||||||||||||
|
in millions
|
|
|
||||||||||||||||||||||
|
Commercial and Industrial
|
$
|
6
|
|
$
|
520
|
|
3
|
|
$
|
41,859
|
|
|
$
|
136
|
|
$
|
41,640
|
|
|
$
|
83
|
|
||
|
Commercial real estate:
|
||||||||||||||||||||||||
|
Commercial mortgage
|
—
|
|
131
|
|
2
|
|
14,088
|
|
|
12
|
|
13,828
|
|
|
248
|
|
||||||||
|
Construction
|
—
|
|
30
|
|
—
|
|
1,960
|
|
|
—
|
|
1,934
|
|
|
26
|
|
||||||||
|
Total commercial real estate loans
|
—
|
|
161
|
|
2
|
|
16,048
|
|
|
12
|
|
15,762
|
|
|
274
|
|
||||||||
|
Commercial lease financing
|
—
|
|
43
|
|
—
|
|
4,826
|
|
|
—
|
|
4,826
|
|
|
—
|
|
||||||||
|
Total commercial loans
|
6
|
|
724
|
|
5
|
|
62,733
|
|
|
148
|
|
62,228
|
|
|
357
|
|
||||||||
|
Real estate — residential mortgage
|
5
|
|
2
|
|
—
|
|
5,483
|
|
|
49
|
|
5,079
|
|
|
355
|
|
||||||||
|
Home equity loans
|
9
|
|
33
|
|
1
|
|
12,028
|
|
|
117
|
|
11,889
|
|
|
22
|
|
||||||||
|
Consumer direct loans
|
—
|
|
28
|
|
—
|
|
1,794
|
|
|
4
|
|
1,786
|
|
|
4
|
|
||||||||
|
Credit cards
|
—
|
|
44
|
|
—
|
|
1,106
|
|
|
2
|
|
1,104
|
|
|
—
|
|
||||||||
|
Consumer indirect loans
|
3
|
|
17
|
|
—
|
|
3,261
|
|
|
34
|
|
3,227
|
|
|
—
|
|
||||||||
|
Total consumer loans
|
17
|
|
124
|
|
1
|
|
23,672
|
|
|
206
|
|
23,085
|
|
|
381
|
|
||||||||
|
Total ALLL — continuing operations
|
23
|
|
848
|
|
6
|
|
86,405
|
|
|
354
|
|
85,313
|
|
|
738
|
|
||||||||
|
Discontinued operations
|
3
|
|
13
|
|
—
|
|
1,314
|
|
(a)
|
21
|
|
1,293
|
|
(a)
|
—
|
|
||||||||
|
Total ALLL — including discontinued operations
|
$
|
26
|
|
$
|
861
|
|
$
|
6
|
|
$
|
87,719
|
|
|
$
|
375
|
|
$
|
86,606
|
|
|
$
|
738
|
|
|
|
(a)
|
Amount includes
$2 million
of loans carried at fair value that are excluded from ALLL consideration.
|
The liability for credit losses inherent in unfunded lending-related commitments, such as letters of credit and unfunded loan commitments, is included in “accrued expense and other liabilities” on the balance sheet. We establish the amount of this reserve by considering both historical trends and current market conditions quarterly, or more often if deemed necessary.
Changes in the liability for credit losses on unfunded lending-related commitments are summarized as follows:
|
|
Three months ended March 31,
|
|||||
|
in millions
|
2018
|
2017
|
||||
|
Balance at beginning of period
|
$
|
57
|
|
$
|
55
|
|
|
Provision (credit) for losses on lending-related commitments
|
3
|
|
(7
|
)
|
||
|
Balance at end of period
|
$
|
60
|
|
$
|
48
|
|
69
PCI Loans
Purchased loans that have evidence of deterioration in credit quality since origination and for which it is probable, at acquisition, that all contractually required payments will not be collected are deemed PCI. Several factors were considered when evaluating whether a loan was considered a PCI loan, including the delinquency status of the loan, updated borrower credit status, geographic information, and updated LTV. In accordance with ASC 310-30, excluded from the purchased impaired loans were leases, revolving credit arrangements, and loans held for sale.
The excess of a PCI loan's contractually required payments over the amount of its undiscounted cash flows expected to be collected is referred to as the nonaccretable difference. The nonaccretable difference, which is not accreted into income, reflects estimated future credit losses and uncollectible contractual interest expected to be incurred over the life of the PCI loan. The excess of cash flows expected to be collected over the carrying amount of the PCI loans is referred to as the accretable yield. This amount is accreted into interest income over the remaining life of the PCI loans or pools using the level yield method.
Over the life of PCI loans, Key evaluates the remaining contractual required payments receivable and estimates cash flows expected to be collected. Contractually required payments receivable may increase or decrease for a variety of reasons, for example, when the contractual terms of the loan agreement are modified, when interest rates on variable rate loans change, or when principal and/or interest payments are received. Cash flows expected to be collected on PCI loans are estimated by incorporating several key assumptions similar to the initial estimate of fair value. These key assumptions include probability of default, loss given default, and the amount of actual prepayments after the Acquisition Date. Increases in expected cash flows of PCI loans subsequent to acquisition are recognized prospectively through adjustment of the yield on the loans or pools over its remaining life, while decreases in expected cash flows are recognized as impairment through a provision for loan and lease losses and an increase in the ALLL.
The difference between the fair value of a non-impaired acquired loan and contractual amounts due at the acquisition date is accreted into income over the estimated life of the loan. Contractually required payments represent the total undiscounted amount of all uncollected principal and interest payments.
We have PCI loans from two separate acquisitions, one in 2012 and one in 2016. The following tables present the roll-forward of the accretable yield and the beginning and ending outstanding unpaid principal balance and carrying amount of all PCI loans for the
three
months ended
March 31, 2018
, and the twelve months ended
December 31, 2017
.
|
Three Months Ended March 31,
|
|||||||||
|
2018
|
|||||||||
|
in millions
|
Accretable Yield
|
Carrying Amount
|
Outstanding Unpaid Principal Balance
|
||||||
|
Balance at beginning of period
|
$
|
131
|
|
$
|
738
|
|
$
|
803
|
|
|
Additions
|
—
|
|
|||||||
|
Accretion
|
(12
|
)
|
|||||||
|
Net reclassifications from nonaccretable to accretable
|
22
|
|
|||||||
|
Payments received, net
|
(9
|
)
|
|||||||
|
Disposals
|
—
|
|
|||||||
|
Balance at end of period
|
$
|
132
|
|
$
|
680
|
|
$
|
737
|
|
|
Twelve Months Ended December 31,
|
|||||||||||||
|
2017
|
|||||||||||||
|
in millions
|
Accretable Yield
|
Carrying Amount
|
Outstanding Unpaid Principal Balance
|
||||||||||
|
Balance at beginning of period
|
$
|
197
|
|
$
|
865
|
|
$
|
1,002
|
|
||||
|
Additions
|
(32
|
)
|
|||||||||||
|
Accretion
|
(44
|
)
|
|||||||||||
|
Net reclassifications from nonaccretable to accretable
|
15
|
|
|||||||||||
|
Payments received, net
|
(4
|
)
|
|||||||||||
|
Disposals
|
(1
|
)
|
|||||||||||
|
Balance at end of period
|
$
|
131
|
|
$
|
738
|
|
$
|
803
|
|
||||
70
5. Fair Value Measurements
Fair Value Determination
We have established and documented our process for determining the fair values of our assets and liabilities, where applicable. Fair value is based on quoted market prices, when available, for identical or similar assets or liabilities. In the absence of quoted market prices, we determine the fair value of our assets and liabilities using valuation models or third-party pricing services. Both of these approaches rely on market-based parameters, when available, such as interest rate yield curves, option volatilities, and credit spreads, or on unobservable inputs. Unobservable inputs may be based on our judgment, assumptions, and estimates related to credit quality, liquidity, interest rates, and other relevant inputs.
We make liquidity valuation adjustments to the fair value of certain assets to reflect the uncertainty in the pricing and trading of the instruments when we are unable to observe recent market transactions for identical or similar instruments. Liquidity valuation adjustments are based on the following factors:
|
•
|
the amount of time since the last relevant valuation;
|
|
•
|
whether there is an actual trade or relevant external quote available at the measurement date; and
|
|
•
|
volatility associated with the primary pricing components.
|
We ensure that our fair value measurements are accurate and appropriate by relying upon various controls, including:
|
•
|
an independent review and approval of valuation models and assumptions;
|
|
•
|
recurring detailed reviews of profit and loss; and
|
|
•
|
a validation of valuation model components against benchmark data and similar products, where possible.
|
We recognize transfers between levels of the fair value hierarchy at the end of the reporting period. Quarterly, we review any changes to our valuation methodologies to ensure they are appropriate and justified, and refine our valuation methodologies if more market-based data becomes available. The Fair Value Committee, which is governed by ALCO, oversees the valuation process. Various working groups that report to the Fair Value Committee analyze and approve the underlying assumptions and valuation adjustments. Changes in valuation methodologies for Level 1 and Level 2 instruments are presented to the Accounting Policy group for approval. Changes in valuation methodologies for Level 3 instruments are presented to the Fair Value Committee for approval. The working groups are discussed in more detail in the qualitative disclosures within this note. Formal documentation of the fair valuation methodologies is prepared by the lines of business and support areas as appropriate. The documentation details the asset or liability class and related general ledger accounts, valuation techniques, fair value hierarchy level, market participants, accounting methods, valuation methodology, group responsible for valuations, and valuation inputs.
Additional information regarding our accounting policies for determining fair value is provided in Note
1
(“
Summary of Significant Accounting Policies
”) under the heading “Fair Value Measurements.”
Qualitative Disclosures of Valuation Techniques
Loans
. Most loans recorded as trading account assets are valued based on market spreads for similar assets since they are actively traded. Therefore, these loans are classified as Level 2 because the fair value recorded is based on observable market data for similar assets.
Securities (trading and available for sale)
.
We own several types of securities, requiring a range of valuation methods:
|
•
|
Securities are classified as Level 1 when quoted market prices are available in an active market for the identical securities. Level 1 instruments include exchange-traded equity securities.
|
|
•
|
Securities are classified as Level 2 if quoted prices for identical securities are not available, and fair value is determined using pricing models (either by a third-party pricing service or internally) or quoted prices of similar securities. These instruments include municipal bonds, bonds backed by the U.S. government, corporate bonds, agency residential and CMBS, securities issued by the U.S. Treasury, money markets, and certain agency and corporate CMOs. Inputs to the pricing models include standard inputs (i.e. yields, benchmark
|
71
securities, bids, and offers), actual trade data (i.e. spreads, credit ratings, and interest rates) for comparable assets, spread tables, matrices, high-grade scales, and option-adjusted spreads.
|
•
|
Securities are classified as Level 3 when there is limited activity in the market for a particular instrument. To determine fair value in such cases, depending on the complexity of the valuations required, we use internal models based on certain assumptions or a third-party valuation service. At
March 31, 2018
, our Level 3 instruments consist of debt securities. Our Corporate Strategy group is responsible for reviewing the valuation model and determining the fair value of these investments on a quarterly basis. The securities are valued using a cash flow analysis of the associated private company issuers. The valuations of the securities are negatively affected by projected net losses of the associated private companies and positively affected by projected net gains.
|
The valuations provided by the third-party pricing service are based on observable market inputs, which include benchmark yields, reported trades, issuer spreads, benchmark securities, bids, offers, and reference data obtained from market research publications. Inputs used by the third-party pricing service in valuing CMOs and other mortgage-backed securities also include new issue data, monthly payment information, whole loan collateral performance, and “To Be Announced” prices. In valuations of securities issued by state and political subdivisions, inputs used by the third-party pricing service also include material event notices.
On a monthly basis, we validate the pricing methodologies utilized by our third-party pricing service to ensure that the fair value determination is consistent with the applicable accounting guidance and that our assets are properly classified in the fair value hierarchy. To perform this validation, we:
|
•
|
review documentation received from our third-party pricing service regarding the inputs used in their valuations and determine a level assessment for each category of securities;
|
|
•
|
substantiate actual inputs used for a sample of securities by comparing the actual inputs used by our third-party pricing service to comparable inputs for similar securities; and
|
|
•
|
substantiate the fair values determined for a sample of securities by comparing the fair values provided by our third-party pricing service to prices from other independent sources for the same and similar securities. We analyze variances and conduct additional research with our third-party pricing service and take appropriate steps based on our findings.
|
Principal investments
.
Principal investments consist of investments in equity and debt instruments made by our principal investing entities. They include direct investments (investments made in a particular company) and indirect investments (investments made through funds that include other investors). Our principal investing entities are accounted for as investment companies in accordance with the applicable accounting guidance, whereby each investment is adjusted to fair value with any net realized or unrealized gain/loss recorded in the current period’s earnings. This process is a coordinated and documented effort by the Principal Investing Entities Deal Team (individuals from one of the independent investment managers who oversee these instruments), accounting staff, and the Investment Committee (individual employees and one of the independent investment managers). This process involves an in-depth review of the condition of each investment depending on the type of investment.
Our direct investments include investments in debt and equity instruments of private companies. In most cases, quoted market prices are not available for our direct investments, and we must perform valuations using other methods. These direct investment valuations are an in-depth analysis of the condition of each investment and are based on the unique facts and circumstances related to each individual investment. There is a certain amount of subjectivity surrounding the valuation of these investments due to the combination of quantitative and qualitative factors that are used in the valuation models. Therefore, these direct investments are classified as Level 3 assets.
Our indirect investments include primary and secondary investments in private equity funds engaged mainly in venture- and growth-oriented investing. These investments do not have readily determinable fair values. Indirect investments are valued using a methodology that is consistent with accounting guidance allowing us to estimate fair value based upon net asset value per share (or its equivalent, such as member units or an ownership interest in partners’ capital to which a proportionate share of net assets is attributed). Under the requirements of the Volcker
Rule, we will be required to dispose of some or all of our indirect investments. On February 14, 2017, Key’s
application for an extension to comply with this rule for illiquid funds was approved. Key will retain certain indirect
investments until the earlier of the date on which the investment is conformed or is expected to mature, but no later than July 21, 2022; as of
March 31, 2018
, we have not committed to a plan to sell these investments, therefore, these investments continue to be valued using the net asset value per share methodology.
72
The following table presents the fair value of our direct and indirect principal investments and related unfunded commitments at
March 31, 2018
, as well as financial support provided for the
three
months ended
March 31, 2018
, and
March 31, 2017
.
|
|
|
|
Financial support provided
|
||||||||||||||
|
|
|
|
Three months ended March 31,
|
||||||||||||||
|
|
March 31, 2018
|
2018
|
2017
|
||||||||||||||
|
in millions
|
Fair
Value
|
Unfunded
Commitments
|
Funded
Commitments
|
Funded
Other
|
Funded
Commitments
|
Funded
Other
|
|||||||||||
|
INVESTMENT TYPE
|
|||||||||||||||||
|
Direct investments
(a)
|
$
|
12
|
|
—
|
|
—
|
|
—
|
|
—
|
|
—
|
|
||||
|
Indirect investments
(b)
(measured at NAV)
|
114
|
|
$
|
29
|
|
—
|
|
—
|
|
$
|
1
|
|
—
|
|
|||
|
Total
|
$
|
126
|
|
$
|
29
|
|
—
|
|
—
|
|
$
|
1
|
|
—
|
|
||
|
(a)
|
Our direct investments consist of equity and debt investments directly in independent business enterprises. Operations of the business enterprises are handled by management of the portfolio company. The purpose of funding these enterprises is to provide financial support for business development and acquisition strategies. We infuse equity capital based on an initial contractual cash contribution and later from additional requests on behalf of the companies’ management.
|
|
(b)
|
Our indirect investments consist of buyout funds, venture capital funds, and fund of funds. These investments are generally not redeemable. Instead, distributions are received through the liquidation of the underlying investments of the fund. An investment in any one of these funds typically can be sold only with the approval of the fund’s general partners. We estimate that the underlying investments of the funds will be liquidated over a period of
one
to
six
years. The purpose of funding our capital commitments to these investments is to allow the funds to make additional follow-on investments and pay fund expenses until the fund dissolves. We, and all other investors in the fund, are obligated to fund the full amount of our respective capital commitments to the fund based on our and their respective ownership percentages, as noted in the applicable Limited Partnership Agreement.
|
Other Equity Investments.
Our other equity investments are direct investments in equity instruments of private companies. Quoted market prices are not available for these investments and we must perform valuations using other methods in a similar manner to our direct principal investments. There is a certain amount of subjectivity surrounding the valuation of these investments due to the combination of quantitative and qualitative factors that are used in the valuation models. Accordingly, these investments are classified as Level 3 assets.
Loans Held for Sale.
As of August 1, 2016, we account for our residential mortgage loans held for sale at fair value on a recurring basis. The election of the fair value option aligns the accounting for the residential mortgages held for sale with the related forward mortgage loan sale commitments.
Residential mortgage loans are valued based on quoted market prices, where available, prices for other traded mortgage loans with similar characteristics, and purchase commitments and bid information received from market participants. The prices are adjusted as necessary to include the embedded servicing value in the loans and to take into consideration the specific characteristics of certain loans that are priced based on the pricing of similar loans. These adjustments represent unobservable inputs to the valuation, but are not considered significant given the relative insensitivity of the fair value of the loans when changes are made to these inputs. Accordingly, the majority of residential mortgage loans held for sale are classified as Level 2. Our residential mortgage activity also includes temporarily unsalable residential mortgage loans that are included in “Loans, net of unearned income” and loans with salability issues included in “Loans held for sale” on the balance sheet. These loans have an origination defect that makes them temporarily unable to be sold into the performing loan sales market. Because transaction details regarding sales of this type of loan are often unavailable, unobservable bid information from brokers and investors is heavily relied upon. Accordingly, based on the significance of unobservable inputs, these loans are classified as Level 3.
Derivatives
.
Exchange-traded derivatives are valued using quoted prices and, therefore, are classified as Level 1 instruments. However, only a few types of derivatives are exchange-traded. The majority of our derivative positions are valued using internally developed models, based on market convention, that use observable market inputs, such as interest rate curves, LIBOR and Overnight Index Swap discount rates and curves, index pricing curves, foreign currency curves, and volatility surfaces (a three-dimensional graph of implied volatility against strike price and maturity), as well as current prices for mortgage securities and investor supplied prices. These derivative contracts, which are classified as Level 2 instruments, include interest rate swaps, certain options, cross-currency swaps, credit default swaps, and forward mortgage loan sale commitments.
We have several customized derivative instruments and risk participations that are classified as Level 3 instruments. These derivative positions are priced monthly by our MRM group using a model acquired from a third party that employs a credit valuation adjustment methodology. The model utilizes inputs consisting of available market data, including bond spreads and asset values, as well as unobservable, internally derived assumptions, such as loss probabilities and internal risk ratings of customers. Swap details with the customer and our related participation percentage, if applicable, are obtained from our derivatives accounting system. Applicable customer rating information is obtained from the relevant loan system and represents an unobservable input to this valuation process. In summary, the fair value represents an estimate of the amount that the risk participation counterparty
73
would need to pay/receive as of the measurement date based on the probability of customer default on the swap transaction and the fair value of the underlying customer swap. Therefore, a higher loss probability and a lower credit rating would negatively affect the fair value of the risk participations and a lower loss probability and higher credit rating would positively affect the fair value of the risk participations.
We use interest rate lock commitments for our residential mortgage business. These instruments are accounted for as derivatives and valued using models containing unobservable significant inputs. For valuation purposes, the loan amount associated with each interest rate lock commitment is adjusted by its modeled pull through (an unobservable input) defined as the percentage of loans that will close prior to the expiration of the rate lock commitment, as adjusted for approved changes to the terms. Based on the significance of unobservable inputs, these instruments are classified as Level 3.
Market convention implies a credit rating of “AA” equivalent in the pricing of derivative contracts, which assumes that all counterparties have the same creditworthiness. To reflect the actual exposure on our derivative contracts related to both counterparty and our own creditworthiness, we record a fair value adjustment in the form of a credit valuation adjustment. The credit component is determined by individual counterparty based on the probability of default and considers master netting and collateral agreements. The credit valuation adjustment is classified as Level 3. Our MRM group is responsible for the valuation policies and procedures related to this credit valuation adjustment. A weekly reconciliation process is performed to ensure that all applicable derivative positions are covered in the calculation, which includes transmitting customer exposures and reserve reports to trading management, derivative traders and marketers, derivatives middle office, and accounting personnel. On a quarterly basis, MRM prepares the credit valuation adjustment calculation, which includes a detailed reserve comparison with the previous quarter, an analysis for change in reserve, and a reserve forecast to ensure that the credit valuation adjustment recorded at period end is sufficient.
74
Assets and Liabilities Measured at Fair Value on a Recurring Basis
Certain assets and liabilities are measured at fair value on a recurring basis in accordance with GAAP. The following tables present these assets and liabilities at
March 31, 2018
, and
December 31, 2017
.
|
March 31, 2018
|
Level 1
|
Level 2
|
Level 3
|
Total
|
||||||||
|
in millions
|
||||||||||||
|
ASSETS MEASURED ON A RECURRING BASIS
|
||||||||||||
|
Trading account assets:
|
||||||||||||
|
U.S. Treasury, agencies and corporations
|
—
|
|
$
|
500
|
|
—
|
|
$
|
500
|
|
||
|
States and political subdivisions
|
—
|
|
81
|
|
—
|
|
81
|
|
||||
|
Other mortgage-backed securities
|
—
|
|
118
|
|
—
|
|
118
|
|
||||
|
Other securities
|
—
|
|
59
|
|
—
|
|
59
|
|
||||
|
Total trading account securities
|
—
|
|
758
|
|
—
|
|
758
|
|
||||
|
Commercial loans
|
—
|
|
11
|
|
—
|
|
11
|
|
||||
|
Total trading account assets
|
—
|
|
769
|
|
—
|
|
769
|
|
||||
|
Securities available for sale:
|
||||||||||||
|
U.S. Treasury, agencies and corporations
|
—
|
|
146
|
|
—
|
|
146
|
|
||||
|
States and political subdivisions
|
—
|
|
9
|
|
—
|
|
9
|
|
||||
|
Agency residential collateralized mortgage obligations
|
—
|
|
14,566
|
|
—
|
|
14,566
|
|
||||
|
Agency residential mortgage-backed securities
|
—
|
|
1,341
|
|
—
|
|
1,341
|
|
||||
|
Agency commercial mortgage-backed securities
|
—
|
|
1,806
|
|
—
|
|
1,806
|
|
||||
|
Other securities
|
—
|
|
—
|
|
$
|
20
|
|
20
|
|
|||
|
Total securities available for sale
|
—
|
|
17,868
|
|
20
|
|
17,888
|
|
||||
|
Other investments:
|
||||||||||||
|
Principal investments:
|
||||||||||||
|
Direct
|
—
|
|
—
|
|
12
|
|
12
|
|
||||
|
Indirect (measured at NAV)
(a)
|
—
|
|
—
|
|
—
|
|
114
|
|
||||
|
Total principal investments
|
—
|
|
—
|
|
12
|
|
126
|
|
||||
|
Equity investments:
|
||||||||||||
|
Direct
|
—
|
|
—
|
|
7
|
|
7
|
|
||||
|
Direct (measured at NAV)
(a)
|
—
|
|
—
|
|
—
|
|
1
|
|
||||
|
Total equity investments
|
—
|
|
—
|
|
7
|
|
8
|
|
||||
|
Total other investments
|
—
|
|
—
|
|
19
|
|
134
|
|
||||
|
Loans, net of unearned income
|
—
|
|
—
|
|
2
|
|
2
|
|
||||
|
Loans held for sale
|
—
|
|
46
|
|
1
|
|
47
|
|
||||
|
Derivative assets:
|
||||||||||||
|
Interest rate
|
—
|
|
361
|
|
4
|
|
365
|
|
||||
|
Foreign exchange
|
$
|
82
|
|
40
|
|
—
|
|
122
|
|
|||
|
Commodity
|
—
|
|
345
|
|
—
|
|
345
|
|
||||
|
Credit
|
—
|
|
—
|
|
—
|
|
—
|
|
||||
|
Other
|
—
|
|
3
|
|
3
|
|
6
|
|
||||
|
Derivative assets
|
82
|
|
749
|
|
7
|
|
838
|
|
||||
|
Netting adjustments
(b)
|
—
|
|
—
|
|
—
|
|
(207
|
)
|
||||
|
Total derivative assets
|
82
|
|
749
|
|
7
|
|
631
|
|
||||
|
Accrued income and other assets
|
—
|
|
—
|
|
—
|
|
—
|
|
||||
|
Total assets on a recurring basis at fair value
|
$
|
82
|
|
$
|
19,432
|
|
$
|
49
|
|
$
|
19,471
|
|
|
LIABILITIES MEASURED ON A RECURRING BASIS
|
||||||||||||
|
Bank notes and other short-term borrowings:
|
||||||||||||
|
Short positions
|
$
|
92
|
|
$
|
541
|
|
—
|
|
$
|
633
|
|
|
|
Derivative liabilities:
|
||||||||||||
|
Interest rate
|
—
|
|
388
|
|
—
|
|
388
|
|
||||
|
Foreign exchange
|
78
|
|
37
|
|
—
|
|
115
|
|
||||
|
Commodity
|
—
|
|
334
|
|
—
|
|
334
|
|
||||
|
Credit
|
—
|
|
3
|
|
—
|
|
3
|
|
||||
|
Other
|
—
|
|
18
|
|
—
|
|
18
|
|
||||
|
Derivative liabilities
|
78
|
|
780
|
|
—
|
|
858
|
|
||||
|
Netting adjustments
(b)
|
—
|
|
—
|
|
—
|
|
(483
|
)
|
||||
|
Total derivative liabilities
|
78
|
|
780
|
|
—
|
|
375
|
|
||||
|
Accrued expense and other liabilities
|
—
|
|
—
|
|
—
|
|
—
|
|
||||
|
Total liabilities on a recurring basis at fair value
|
$
|
170
|
|
$
|
1,321
|
|
—
|
|
$
|
1,008
|
|
|
|
(a)
|
Certain investments that are measured at fair value using the net asset value per share (or its equivalent) practical expedient have not been classified in the fair value hierarchy. The fair value amounts presented in this table are intended to permit reconciliation of the fair value hierarchy to the amounts presented in the consolidated balance sheet.
|
|
(b)
|
Netting adjustments represent the amounts recorded to convert our derivative assets and liabilities from a gross basis to a net basis in accordance with the applicable accounting guidance. The net basis takes into account the impact of bilateral collateral and master netting agreements that allow us to settle all derivative contracts with a single counterparty on a net basis and to offset the net derivative position with the related cash collateral. Total derivative assets and liabilities include these netting adjustments.
|
75
|
December 31, 2017
|
Level 1
|
Level 2
|
Level 3
|
Total
|
||||||||
|
in millions
|
||||||||||||
|
ASSETS MEASURED ON A RECURRING BASIS
|
||||||||||||
|
Trading account assets:
|
||||||||||||
|
U.S. Treasury, agencies and corporations
|
—
|
|
$
|
615
|
|
—
|
|
$
|
615
|
|
||
|
States and political subdivisions
|
—
|
|
37
|
|
—
|
|
37
|
|
||||
|
Other mortgage-backed securities
|
—
|
|
104
|
|
—
|
|
104
|
|
||||
|
Other securities
|
—
|
|
65
|
|
—
|
|
65
|
|
||||
|
Total trading account securities
|
—
|
|
821
|
|
—
|
|
821
|
|
||||
|
Commercial loans
|
—
|
|
15
|
|
—
|
|
15
|
|
||||
|
Total trading account assets
|
—
|
|
836
|
|
—
|
|
836
|
|
||||
|
Securities available for sale:
|
||||||||||||
|
U.S. Treasury, agencies and corporations
|
—
|
|
157
|
|
—
|
|
157
|
|
||||
|
States and political subdivisions
|
—
|
|
9
|
|
—
|
|
9
|
|
||||
|
Agency residential collateralized mortgage obligations
|
—
|
|
14,660
|
|
—
|
|
14,660
|
|
||||
|
Agency residential mortgage-backed securities
|
—
|
|
1,439
|
|
—
|
|
1,439
|
|
||||
|
Agency commercial mortgage-backed securities
|
—
|
|
1,854
|
|
—
|
|
1,854
|
|
||||
|
Other securities
|
—
|
|
—
|
|
$
|
20
|
|
20
|
|
|||
|
Total securities available for sale
|
—
|
|
18,119
|
|
20
|
|
18,139
|
|
||||
|
Other investments:
|
||||||||||||
|
Principal investments:
|
||||||||||||
|
Direct
|
—
|
|
—
|
|
13
|
|
13
|
|
||||
|
Indirect (measured at NAV)
(a)
|
—
|
|
—
|
|
—
|
|
124
|
|
||||
|
Total principal investments
|
—
|
|
—
|
|
13
|
|
137
|
|
||||
|
Equity investments:
|
||||||||||||
|
Direct
|
—
|
|
4
|
|
3
|
|
7
|
|
||||
|
Total equity investments
|
—
|
|
4
|
|
3
|
|
7
|
|
||||
|
Total other investments
|
—
|
|
4
|
|
16
|
|
144
|
|
||||
|
Loans, net of unearned income
|
—
|
|
—
|
|
2
|
|
2
|
|
||||
|
Loans held for sale
|
—
|
|
70
|
|
1
|
|
71
|
|
||||
|
Derivative assets:
|
||||||||||||
|
Interest rate
|
—
|
|
713
|
|
9
|
|
722
|
|
||||
|
Foreign exchange
|
$
|
100
|
|
30
|
|
—
|
|
130
|
|
|||
|
Commodity
|
—
|
|
255
|
|
—
|
|
255
|
|
||||
|
Credit
|
—
|
|
—
|
|
1
|
|
1
|
|
||||
|
Other
|
—
|
|
1
|
|
3
|
|
4
|
|
||||
|
Derivative assets
|
100
|
|
999
|
|
13
|
|
1,112
|
|
||||
|
Netting adjustments
(b)
|
—
|
|
—
|
|
—
|
|
(443
|
)
|
||||
|
Total derivative assets
|
100
|
|
999
|
|
13
|
|
669
|
|
||||
|
Accrued income and other assets
|
—
|
|
—
|
|
—
|
|
—
|
|
||||
|
Total assets on a recurring basis at fair value
|
$
|
100
|
|
$
|
20,028
|
|
$
|
52
|
|
$
|
19,861
|
|
|
LIABILITIES MEASURED ON A RECURRING BASIS
|
||||||||||||
|
Bank notes and other short-term borrowings:
|
||||||||||||
|
Short positions
|
$
|
72
|
|
$
|
562
|
|
—
|
|
$
|
634
|
|
|
|
Derivative liabilities:
|
||||||||||||
|
Interest rate
|
—
|
|
520
|
|
—
|
|
520
|
|
||||
|
Foreign exchange
|
98
|
|
26
|
|
—
|
|
124
|
|
||||
|
Commodity
|
—
|
|
246
|
|
—
|
|
246
|
|
||||
|
Credit
|
—
|
|
4
|
|
—
|
|
4
|
|
||||
|
Other
|
—
|
|
13
|
|
—
|
|
13
|
|
||||
|
Derivative liabilities
|
98
|
|
809
|
|
—
|
|
907
|
|
||||
|
Netting adjustments
(b)
|
—
|
|
—
|
|
—
|
|
(616
|
)
|
||||
|
Total derivative liabilities
|
98
|
|
809
|
|
—
|
|
291
|
|
||||
|
Accrued expense and other liabilities
|
—
|
|
—
|
|
—
|
|
—
|
|
||||
|
Total liabilities on a recurring basis at fair value
|
$
|
170
|
|
$
|
1,371
|
|
—
|
|
$
|
925
|
|
|
|
(a)
|
Certain investments that are measured at fair value using the net asset value per share (or its equivalent) practical expedient have not been classified in the fair value hierarchy. The fair value amounts presented in this table are intended to permit reconciliation of the fair value hierarchy to the amounts presented in the consolidated balance sheet.
|
|
(b)
|
Netting adjustments represent the amounts recorded to convert our derivative assets and liabilities from a gross basis to a net basis in accordance with the applicable accounting guidance. The net basis takes into account the impact of bilateral collateral and master netting agreements that allow us to settle all derivative contracts with a single counterparty on a net basis and to offset the net derivative position with the related cash collateral. Total derivative assets and liabilities include these netting adjustments.
|
Changes in Level 3 Fair Value Measurements
The following table shows the components of the change in the fair values of our Level 3 financial instruments for the
three
months ended
March 31, 2018
, and
March 31, 2017
. We mitigate the credit risk, interest rate risk, and risk of loss related to many of these Level 3 instruments by using securities and derivative positions classified as Level 1 or Level 2. Level 1 and Level 2 instruments are not included in the following table, therefore, the gains or losses shown do not include the impact of our risk management activities.
76
|
in millions
|
Beginning of Period Balance
|
Gains (Losses) Included in Other Comprehensive Income
|
Gains (Losses) Included in Earnings
|
Purchases
|
Sales
|
Settlements
|
Transfers Other
|
Transfers into Level 3
(a)
|
Transfers out of Level 3
(a)
|
End of Period Balance
(f)
|
Unrealized Gains (Losses) Included in Earnings
|
|||||||||||||||||||||||
|
Three months ended March 31, 2018
|
||||||||||||||||||||||||||||||||||
|
Securities available for sale
|
||||||||||||||||||||||||||||||||||
|
Other securities
|
$
|
20
|
|
$
|
—
|
|
—
|
|
|
—
|
|
—
|
|
—
|
|
—
|
|
—
|
|
|
—
|
|
|
$
|
20
|
|
—
|
|
|
|||||
|
Other investments
|
||||||||||||||||||||||||||||||||||
|
Principal investments
|
||||||||||||||||||||||||||||||||||
|
Direct
|
13
|
|
—
|
|
$
|
(1
|
)
|
(b)
|
—
|
|
—
|
|
—
|
|
—
|
|
—
|
|
|
—
|
|
|
12
|
|
$
|
(1
|
)
|
(b)
|
||||||
|
Equity investments
|
||||||||||||||||||||||||||||||||||
|
Direct
|
3
|
|
—
|
|
—
|
|
—
|
|
—
|
|
—
|
|
—
|
|
$
|
4
|
|
—
|
|
7
|
|
—
|
|
|||||||||||
|
Loans held for sale
|
1
|
|
—
|
|
—
|
|
—
|
|
—
|
|
—
|
|
—
|
|
—
|
|
—
|
|
1
|
|
—
|
|
||||||||||||
|
Loans held for investment
|
2
|
|
—
|
|
—
|
|
—
|
|
—
|
|
—
|
|
—
|
|
—
|
|
—
|
|
2
|
|
—
|
|
||||||||||||
|
Derivative instruments
(c)
|
||||||||||||||||||||||||||||||||||
|
Interest rate
|
9
|
|
—
|
|
(1
|
)
|
(d)
|
—
|
|
—
|
|
—
|
|
—
|
|
1
|
|
(e)
|
$
|
(5
|
)
|
(e)
|
4
|
|
—
|
|
|
|||||||
|
Credit
|
1
|
|
—
|
|
(5
|
)
|
(d)
|
—
|
|
—
|
|
$
|
4
|
|
—
|
|
—
|
|
|
—
|
|
|
—
|
|
—
|
|
|
|||||||
|
Other
(f)
|
3
|
|
—
|
|
—
|
|
—
|
|
—
|
|
—
|
|
—
|
|
—
|
|
—
|
|
3
|
|
—
|
|
||||||||||||
|
in millions
|
Beginning of Period Balance
|
Gains (Losses) Included in Other Comprehensive Income
|
Gains (Losses) Included in Earnings
|
Purchases
|
Sales
|
Settlements
|
Transfers Other
|
Transfers into Level 3
(a)
|
Transfers out of Level 3
(a)
|
End of Period Balance
|
Unrealized Gains (Losses) Included in Earnings
|
|||||||||||||||||||||||||
|
Three months ended March 31, 2017
|
||||||||||||||||||||||||||||||||||||
|
Securities available for sale
|
||||||||||||||||||||||||||||||||||||
|
Other securities
|
$
|
17
|
|
—
|
|
—
|
|
|
—
|
|
—
|
|
—
|
|
—
|
|
—
|
|
|
—
|
|
|
$
|
17
|
|
—
|
|
|
||||||||
|
Other investments
|
||||||||||||||||||||||||||||||||||||
|
Principal investments
|
||||||||||||||||||||||||||||||||||||
|
Direct
|
27
|
|
$
|
—
|
|
$
|
(2
|
)
|
(b)
|
—
|
|
$
|
(4
|
)
|
—
|
|
—
|
|
—
|
|
|
—
|
|
|
21
|
|
$
|
(6
|
)
|
(b)
|
||||||
|
Derivative instruments
(c)
|
||||||||||||||||||||||||||||||||||||
|
Interest rate
|
7
|
|
—
|
|
—
|
|
—
|
|
—
|
|
—
|
|
—
|
|
$
|
1
|
|
(e)
|
$
|
(3
|
)
|
(e)
|
5
|
|
—
|
|
|
|||||||||
|
Credit
|
1
|
|
—
|
|
(3
|
)
|
(d)
|
—
|
|
—
|
|
$
|
3
|
|
—
|
|
—
|
|
|
—
|
|
|
1
|
|
—
|
|
|
|||||||||
|
Other
(g)
|
2
|
|
—
|
|
—
|
|
—
|
|
—
|
|
—
|
|
$
|
2
|
|
—
|
|
—
|
|
4
|
|
—
|
|
|||||||||||||
|
(a)
|
Our policy is to recognize transfers into and transfers out of Level 3 as of the end of the reporting period.
|
|
(b)
|
Realized and unrealized gains and losses on principal investments are reported in “other income” on the income statement.
|
|
(c)
|
Amounts represent Level 3 derivative assets less Level 3 derivative liabilities.
|
|
(d)
|
Realized and unrealized gains and losses on derivative instruments are reported in “corporate services income” and “other income” on the income statement.
|
|
(e)
|
Certain derivatives previously classified as Level 2 were transferred to Level 3 because Level 3 unobservable inputs became significant. Certain derivatives previously classified as Level 3 were transferred to Level 2 because Level 3 unobservable inputs became less significant.
|
|
(f)
|
Amounts represent Level 3 interest rate lock commitments.
|
Assets and Liabilities Measured at Fair Value on a Nonrecurring Basis
Certain assets and liabilities are measured at fair value on a nonrecurring basis in accordance with GAAP. The adjustments to fair value generally result from the application of accounting guidance that requires assets and liabilities to be recorded at the lower of cost or fair value, or assessed for impairment. There were
no
liabilities measured at fair value on a nonrecurring basis at
March 31, 2018
, and
December 31, 2017
. The following table presents our assets measured at fair value on a nonrecurring basis at
March 31, 2018
, and
December 31, 2017
:
|
|
March 31, 2018
|
December 31, 2017
|
||||||||||||||||||||||
|
in millions
|
Level 1
|
Level 2
|
Level 3
|
Total
|
Level 1
|
Level 2
|
Level 3
|
Total
|
||||||||||||||||
|
ASSETS MEASURED ON A NONRECURRING BASIS
|
||||||||||||||||||||||||
|
Impaired loans
|
—
|
|
$
|
3
|
|
—
|
|
$
|
3
|
|
—
|
|
—
|
|
$
|
9
|
|
$
|
9
|
|
||||
|
Accrued income and other assets
|
—
|
|
—
|
|
$
|
7
|
|
7
|
|
—
|
|
$
|
5
|
|
133
|
|
(a)
|
138
|
|
|||||
|
Total assets on a nonrecurring basis at fair value
|
—
|
|
$
|
3
|
|
$
|
7
|
|
$
|
10
|
|
—
|
|
$
|
5
|
|
$
|
142
|
|
$
|
147
|
|
||
|
(a)
|
At December 31, 2017, we recorded
$31 million
of impairment related to
$119 million
of LIHTC and Historic Tax Credit investments impacted by the enactment of the TCJ Act. Refer to the “LIHTC and Historic Tax Credit Investments” section below for a description of the valuation technique and inputs applied for this fair value measurement.
|
Impaired loans
. Loans are evaluated for impairment on a quarterly basis. Loans included in the previous quarter’s review are re-evaluated, and if their values have changed materially, the underlying information (loan balance and in most cases, collateral value) is compared. Material differences are evaluated for reasonableness, and the relationship managers and their senior managers consider these differences and determine if any adjustment is necessary. The inputs are developed and substantiated on a quarterly basis based on current borrower developments, market conditions, and collateral values. The following two internal methods are used to value impaired loans:
|
•
|
Cash flow analysis considers internally developed inputs, such as discount rates, default rates, costs of foreclosure, and changes in collateral values.
|
|
•
|
The fair value of the collateral, which may take the form of real estate or personal property, is based on internal estimates, field observations, and assessments provided by third-party appraisers. We perform or reaffirm
|
77
appraisals of collateral-dependent impaired loans at least annually. Appraisals may occur more frequently if the most recent appraisal does not accurately reflect the current market, if the debtor is seriously delinquent or chronically past due, or there has been a material deterioration in the performance of the project or condition of the property. Adjustments to outdated appraisals that result in an appraisal value less than the carrying amount of a collateral-dependent impaired loan are reflected in the ALLL.
We adjust the carrying amount of our impaired loans when there is evidence of probable loss and the expected fair
value of the loan is less than its contractual amount. The amount of the impairment may be determined based on
the estimated present value of future cash flows, the fair value of the underlying collateral, or the loan’s observable
market price. Impaired loans with a specifically allocated allowance based on a cash flow analysis or the value of
the underlying collateral are classified as Level 3 assets. Impaired loans with a specifically allocated allowance
based on an observable market price that reflects recent sale transactions for similar loans and collateral are
classified as Level 2 assets.
Impairment valuations are back-tested each quarter, based on a look-back of actual incurred losses on closed deals
previously evaluated for impairment. The overall percent variance of actual net loan charge-offs on closed deals
compared to the specific allocations on such deals is considered in determining each quarter’s specific allocations.
The evaluations for impairment are prepared by the responsible relationship managers in our Asset Recovery
Group and are reviewed and approved by the Asset Recovery Group Executive. The Asset Recovery Group is part
of the Risk Management Group and reports to our Chief Credit Officer. These evaluations are performed in
conjunction with the quarterly ALLL process.
Commercial loans held for sale
. Through a quarterly analysis of our loan portfolios held for sale, which include both performing and nonperforming commercial loans, we determine any adjustments necessary to record the portfolios at the lower of cost or fair value in accordance with GAAP. Our analysis concluded that there were
no
commercial loans held for sale adjusted to fair value at
March 31, 2018
, and
December 31, 2017
.
Direct financing leases and operating lease assets held for sale
. Our KEF Accounting and Capital Markets groups are responsible for the valuation policies and procedures related to these assets. The Managing Director of the KEF Capital Markets group reports to the President of the KEF line of business. A weekly report that lists all equipment finance deals booked in the warehouse portfolio is distributed to both groups. On a quarterly basis, the KEF Accounting group prepares a detailed held-for-sale roll-forward schedule that is reconciled to the general ledger and the above-mentioned weekly report. KEF management uses the held-for-sale roll-forward schedule to determine whether an impairment adjustment is necessary in accordance with lower of cost or fair value guidelines.
Valuations of direct financing leases and operating lease assets held for sale are performed using an internal model that relies on market data, such as swap rates and bond ratings, as well as on our own assumptions about the exit market for the leases and details about the individual leases in the portfolio. The inputs based on our assumptions include changes in the value of leased items and internal credit ratings. These leases have been classified as Level 3 assets. KEF has master sale and assignment agreements with numerous institutional investors. Historically, multiple quotes are obtained, with the most reasonable formal quotes retained. These nonbinding quotes generally lead to a sale to one of the parties who provided the quote. Leases for which we receive a current nonbinding bid, and for which the sale is considered probable, may be classified as Level 2. The validity of these quotes is supported by historical and continued dealings with these institutions that have fulfilled the nonbinding quote in the past. In a distressed market where market data were not available, an estimate of the fair value of the leased asset may be used to value the lease, resulting in a Level 3 classification. In an inactive market, the market value of the assets held for sale is determined as the present value of the future cash flows discounted at the current buy rate. KEF Accounting calculates an estimated fair value buy rate based on the credit premium inherent in the relevant bond index and the appropriate swap rate on the measurement date. The amount of the adjustment is calculated as book value minus the present value of future cash flows discounted at the calculated buy rate.
Other assets.
OREO and other repossessed properties are valued based on inputs such as appraisals and third-party price opinions, less estimated selling costs. Generally, we classify these assets as Level 3, but OREO and other repossessed properties for which we receive binding purchase agreements are classified as Level 2. Returned lease inventory is valued based on market data for similar assets and is classified as Level 2. Assets that are acquired through, or in lieu of, loan foreclosures are recorded initially as held for sale at fair value less estimated selling costs at the date of foreclosure. After foreclosure, valuations are updated periodically, and current market conditions may require the assets to be marked down further to a new cost basis.
78
|
•
|
Commercial Real Estate Valuation Process: When a loan is reclassified from loan status to OREO because we took possession of the collateral, the Asset Recovery Group Loan Officer, in consultation with our OREO group, obtains a broker price opinion or a third-party appraisal, which is used to establish the fair value of the underlying collateral. The determined fair value of the underlying collateral less estimated selling costs becomes the carrying value of the OREO asset. In addition to valuations from independent third-party sources, our OREO group also writes down the carrying balance of OREO assets once a bona fide offer is contractually accepted, where the accepted price is lower than the current balance of the particular OREO asset. The fair value of OREO property is re-evaluated every
90 days
, and the OREO asset is adjusted as necessary.
|
|
•
|
Residential Real Estate Valuation Process: The Asset Management team within our Risk Operations group is responsible for valuation policies and procedures of these loans. The current vendor partner provides monthly reporting of all broker price opinion evaluations, appraisals, and the monthly market plans. Market plans are reviewed monthly, and valuations are reviewed and tested monthly to ensure proper pricing has been established and guidelines are being met. Risk Operations Compliance validates and provides periodic testing of the valuation process. The Asset Management team reviews changes in fair value measurements. Third-party broker price opinions are reviewed every
180 days
, and the fair value is written down based on changes to the valuation. External factors are documented and monitored as appropriate.
|
LIHTC and Historic Tax Credit Investments.
LIHTC and Historic Tax Credit (HTC) operating partnerships are
subject to quarterly impairment testing. This evaluation involves measuring the present value of future tax benefits
and comparing that value against the current carrying value of the investment. Expected future tax benefit
schedules are provided by the partnerships’ general partners on a quarterly basis. These future benefits are
discounted to their present value using discounted cash flow modeling that incorporates an appropriate risk
premium. LIHTC and HTC investments are impaired when it is more likely than not that the carrying amount of the
investment will not be realized. A primarily driver of impairment in the fourth quarter of 2017 was the enactment of
the TCJ Act, which reduced future depreciation tax benefits expected to be realized by certain LIHTC and HTC
investments.
Other Equity Investments.
We have other investments in equity securities that do not have readily determinable fair values and do not qualify for the practical expedient to measure the investment using a net asset value per share. We have elected to measure these securities at cost less impairment plus or minus adjustments due to observable orderly transactions. At each reporting period, we assess if these investments continue to qualify for this measurement alternative. At
March 31, 2018
, the carrying amount of equity investments recorded under this method was
$95 million
. No impairment was recorded for the
three months ended March 31, 2018
. Impairment is recorded w
hen there is evidence that the expected fair value of the investment has declined to below the recorded cost.
Quantitative Information about Level 3 Fair Value Measurements
The range and weighted average of the significant unobservable inputs used to fair value our material Level 3 recurring and nonrecurring assets at
March 31, 2018
, and
December 31, 2017
, along with the valuation techniques used, are shown in the following table:
|
March 31, 2018
|
Fair Value of
Level 3 Assets
|
Valuation Technique
|
Significant
Unobservable Input
|
Weighted Average
|
||
|
dollars in millions
|
||||||
|
Recurring
|
||||||
|
Other investments — principal investments — direct:
|
$
|
12
|
|
Individual analysis of the
condition of each investment
|
||
|
Debt instruments
|
EBITDA multiple
|
6.00
|
||||
|
Equity instruments of private companies
|
EBITDA multiple
|
6.00
|
||||
|
Nonrecurring
|
||||||
|
Impaired loans
|
—
|
|
Fair value of underlying collateral
|
Discount
|
N/A
|
|
79
|
December 31, 2017
|
Fair Value of
Level 3 Assets
|
Valuation Technique
|
Significant
Unobservable Input
|
Range
(Weighted-Average)
|
||
|
dollars in millions
|
||||||
|
Recurring
|
||||||
|
Other investments — principal investments — direct:
|
$
|
13
|
|
Individual analysis of the condition of each investment
|
||
|
Debt instruments
|
EBITDA multiple
|
N/A (6.00)
|
||||
|
Equity instruments of private companies
|
EBITDA multiple
|
N/A (6.00)
|
||||
|
Nonrecurring
|
||||||
|
Impaired loans
|
9
|
|
Fair value of underlying collateral
|
Discount
|
00.00 - 50.00% (23.00%)
|
|
Fair Value Disclosures of Financial Instruments
The levels in the fair value hierarchy ascribed to our financial instruments and the related carrying amounts at
March 31, 2018
, and
December 31, 2017
, are shown in the following tables. Assets and liabilities are further arranged by measurement category.
|
|
March 31, 2018
|
|||||||||||||||||||||
|
|
|
Fair Value
|
||||||||||||||||||||
|
in millions
|
Carrying
Amount
|
Level 1
|
Level 2
|
Level 3
|
Measured
at NAV
|
Netting
Adjustment
|
|
Total
|
||||||||||||||
|
ASSETS (by measurement category)
|
||||||||||||||||||||||
|
Fair value - net income
|
||||||||||||||||||||||
|
Trading account assets
(b)
|
$
|
769
|
|
—
|
|
$
|
769
|
|
—
|
|
—
|
|
—
|
|
|
$
|
769
|
|
||||
|
Other investments
(b)
|
715
|
|
—
|
|
—
|
|
$
|
600
|
|
$
|
115
|
|
—
|
|
|
715
|
|
|||||
|
Loans, net of unearned income
(d)
|
2
|
|
—
|
|
—
|
|
2
|
|
—
|
|
—
|
|
|
2
|
|
|||||||
|
Loans held for sale
(b)
|
47
|
|
—
|
|
46
|
|
1
|
|
—
|
|
—
|
|
|
47
|
|
|||||||
|
Derivative assets - trading
(b)
|
603
|
|
$
|
81
|
|
710
|
|
7
|
|
—
|
|
$
|
(195
|
)
|
(f)
|
603
|
|
|||||
|
Fair value - OCI
|
||||||||||||||||||||||
|
Securities available for sale
(b)
|
17,888
|
|
—
|
|
17,868
|
|
$
|
20
|
|
—
|
|
—
|
|
|
17,888
|
|
||||||
|
Derivative assets - hedging
(b)
|
28
|
|
1
|
|
39
|
|
—
|
|
—
|
|
(12
|
)
|
(f)
|
28
|
|
|||||||
|
Amortized cost
|
||||||||||||||||||||||
|
Held-to-maturity securities
(c)
|
12,189
|
|
—
|
|
11,729
|
|
—
|
|
—
|
|
—
|
|
|
11,729
|
|
|||||||
|
Loans, net of unearned income
(d)
|
87,206
|
|
—
|
|
—
|
|
85,166
|
|
—
|
|
—
|
|
|
85,166
|
|
|||||||
|
Loans held for sale
(b)
|
1,620
|
|
—
|
|
—
|
|
1,620
|
|
—
|
|
—
|
|
1,620
|
|
||||||||
|
Other
|
||||||||||||||||||||||
|
Cash and short-term investments
(a)
|
2,287
|
|
2,287
|
|
—
|
|
—
|
|
—
|
|
—
|
|
2,287
|
|
||||||||
|
LIABILITIES (by measurement category)
|
||||||||||||||||||||||
|
Fair value - net income
|
||||||||||||||||||||||
|
Derivative liabilities - trading
(b)
|
$
|
371
|
|
$
|
74
|
|
$
|
778
|
|
—
|
|
—
|
|
$
|
(481
|
)
|
(f)
|
$
|
371
|
|
||
|
Fair value - OCI
|
||||||||||||||||||||||
|
Derivative liabilities - hedging
(b)
|
4
|
|
4
|
|
2
|
|
—
|
|
—
|
|
(2
|
)
|
(f)
|
4
|
|
|||||||
|
Amortized cost
|
||||||||||||||||||||||
|
Time deposits
(e)
|
12,223
|
|
—
|
|
12,285
|
|
—
|
|
—
|
|
—
|
|
|
12,285
|
|
|||||||
|
Short-term borrowings
(a)
|
1,749
|
|
$
|
92
|
|
1,657
|
|
—
|
|
—
|
|
—
|
|
|
1,749
|
|
||||||
|
Long-term debt
(e)
|
13,749
|
|
12,176
|
|
1,690
|
|
—
|
|
—
|
|
—
|
|
|
13,866
|
|
|||||||
|
Other
|
||||||||||||||||||||||
|
Deposits with no stated maturity
(a)
|
92,528
|
|
—
|
|
92,528
|
|
—
|
|
—
|
|
—
|
|
|
93,588
|
|
|||||||
80
|
December 31, 2017
|
||||||||||||||||||||||
|
|
Fair Value
|
|||||||||||||||||||||
|
in millions
|
Carrying
Amount
|
Level 1
|
Level 2
|
Level 3
|
Measured
at NAV
|
Netting
Adjustment
|
|
Total
|
||||||||||||||
|
ASSETS (by measurement category)
|
||||||||||||||||||||||
|
Fair value - net income
|
||||||||||||||||||||||
|
Trading account assets
(b)
|
$
|
836
|
|
—
|
|
$
|
836
|
|
—
|
|
—
|
|
—
|
|
$
|
836
|
|
|||||
|
Other investments
(b)
|
726
|
|
—
|
|
4
|
|
$
|
598
|
|
$
|
124
|
|
—
|
|
726
|
|
||||||
|
Loans, net of unearned income
(d)
|
2
|
|
—
|
|
—
|
|
2
|
|
—
|
|
—
|
|
2
|
|
||||||||
|
Loans held for sale
(b)
|
71
|
|
—
|
|
70
|
|
1
|
|
—
|
|
—
|
|
71
|
|
||||||||
|
Derivative assets - trading
(b)
|
681
|
|
$
|
99
|
|
918
|
|
13
|
|
—
|
|
$
|
(349
|
)
|
(f)
|
681
|
|
|||||
|
Fair value - OCI
|
||||||||||||||||||||||
|
Securities available for sale
(b)
|
18,139
|
|
—
|
|
18,119
|
|
20
|
|
—
|
|
—
|
|
18,139
|
|
||||||||
|
Derivative assets - hedging
(b)
|
(12
|
)
|
1
|
|
81
|
|
—
|
|
—
|
|
(94
|
)
|
(f)
|
(12
|
)
|
|||||||
|
Amortized cost
|
||||||||||||||||||||||
|
Held-to-maturity securities
(c)
|
11,830
|
|
—
|
|
11,565
|
|
—
|
|
—
|
|
—
|
|
11,565
|
|
||||||||
|
Loans, net of unearned income
(d)
|
85,526
|
|
—
|
|
—
|
|
84,003
|
|
—
|
|
—
|
|
84,003
|
|
||||||||
|
Loans held for sale
(b)
|
1,036
|
|
—
|
|
—
|
|
1,036
|
|
—
|
|
—
|
|
1,036
|
|
||||||||
|
Other
|
||||||||||||||||||||||
|
Cash and short-term investments
(a)
|
5,118
|
|
5,118
|
|
—
|
|
—
|
|
—
|
|
—
|
|
5,118
|
|
||||||||
|
LIABILITIES (by measurement category)
|
||||||||||||||||||||||
|
Fair value - net income
|
||||||||||||||||||||||
|
Derivative liabilities - trading
(b)
|
$
|
289
|
|
$
|
94
|
|
$
|
763
|
|
—
|
|
—
|
|
$
|
(568
|
)
|
(f)
|
$
|
289
|
|
||
|
Fair value - OCI
|
||||||||||||||||||||||
|
Derivative liabilities - hedging
(b)
|
2
|
|
4
|
|
46
|
|
—
|
|
—
|
|
(48
|
)
|
(f)
|
2
|
|
|||||||
|
Amortized cost
|
||||||||||||||||||||||
|
Time deposits
(e)
|
11,647
|
|
—
|
|
11,750
|
|
—
|
|
—
|
|
—
|
|
11,750
|
|
||||||||
|
Short-term borrowings
(a)
|
1,011
|
|
72
|
|
939
|
|
—
|
|
—
|
|
—
|
|
1,011
|
|
||||||||
|
Long-term debt
(e)
|
14,333
|
|
13,407
|
|
$
|
1,219
|
|
—
|
|
—
|
|
—
|
|
14,626
|
|
|||||||
|
Other
|
||||||||||||||||||||||
|
Deposits with no stated maturity
(a)
|
93,588
|
|
—
|
|
93,588
|
|
—
|
|
—
|
|
—
|
|
93,588
|
|
||||||||
Valuation Methods and Assumptions
|
(a)
|
Fair value equals or approximates carrying amount. The fair value of deposits with no stated maturity does not take into consideration the value ascribed to core deposit intangibles.
|
|
(b)
|
Information pertaining to our methodology for measuring the fair values of these assets and liabilities is included in the sections entitled “Qualitative Disclosures of Valuation Techniques” and “Assets and Liabilities Measured at Fair Value on a Nonrecurring Basis” in this Note. Investments accounted for under the cost method (or cost less impairment adjusted for observable price changes for certain equity investments) are classified as Level 3 assets. These investments are not actively traded in an open market as sales for these types of investments are rare. The carrying amount of the investments carried at cost are adjusted for declines in value if they are considered to be other-than-temporary (or due to observable orderly transactions of the same issuer for equity investments eligible for the cost less impairment measurement alternative). These adjustments are included in “other income” on the income statement.
|
|
(c)
|
Fair values of held-to-maturity securities are determined by using models that are based on security-specific details, as well as relevant industry and economic factors. The most significant of these inputs are quoted market prices, interest rate spreads on relevant benchmark securities, and certain prepayment assumptions. We review the valuations derived from the models to ensure that they are reasonable and consistent with the values placed on similar securities traded in the secondary markets.
|
|
(d)
|
The fair value of loans is based on the present value of the expected cash flows. The projected cash flows are based on the contractual terms of the loans, adjusted for prepayments and use of a discount rate based on the relative risk of the cash flows, taking into account the loan type, maturity of the loan, liquidity risk, servicing costs, and a required return on debt and capital. In addition, an incremental liquidity discount is applied to certain loans, using historical sales of loans during periods of similar economic conditions as a benchmark. The fair value of loans includes lease financing receivables at their aggregate carrying amount, which is equivalent to their fair value.
|
|
(e)
|
Fair values of time deposits and long-term debt are based on discounted cash flows utilizing relevant market inputs.
|
|
(f)
|
Netting adjustments represent the amounts recorded to convert our derivative assets and liabilities from a gross basis to a net basis in accordance with the applicable accounting guidance. The net basis takes into account the impact of bilateral collateral and master netting agreements that allow us to settle all derivative contracts with a single counterparty on a net basis and to offset the net derivative position with the related cash collateral. Total derivative assets and liabilities include these netting adjustments.
|
We determine fair value based on assumptions pertaining to the factors that a market participant would consider in
valuing the asset. A substantial portion of our fair value adjustments are related to liquidity. During 2017 and the first quarter of 2018, the fair values of our loan portfolios generally remained stable, primarily due to increasing liquidity in the loan markets. If we were to use different assumptions, the fair values shown in the preceding table could change. Also, because the applicable accounting guidance for financial instruments excludes certain financial instruments and all nonfinancial instruments from its disclosure requirements, the fair value amounts shown in the table above do not, by themselves, represent the underlying value of our company as a whole.
Education lending business
.
The discontinued education lending business consists of loans in portfolio recorded at carrying value with appropriate valuation reserves, and loans in portfolio recorded at fair value. All of these loans were excluded from the table above as follows:
|
•
|
Loans at carrying value, net of allowance, of
$1.2 billion
(
$1.1 billion
at fair value) at
March 31, 2018
, and
$1.3 billion
(
$1.1 billion
at fair value) at
December 31, 2017
;
|
|
•
|
Portfolio loans at fair value of
$2 million
at
March 31, 2018
, and
$2 million
at
December 31, 2017
.
|
These loans and securities are classified as Level 3 because we rely on unobservable inputs when determining fair value since observable market data is not available.
Short-term financial instruments.
For financial instruments with a remaining average life to maturity of less than
six
months, carrying amounts were used as an approximation of fair values.
81
6. Securities
The amortized cost, unrealized gains and losses, and approximate fair value of our securities available for sale and held-to-maturity securities are presented in the following tables. Gross unrealized gains and losses represent the difference between the amortized cost and the fair value of securities on the balance sheet as of the dates indicated. Accordingly, the amount of these gains and losses may change in the future as market conditions change.
|
|
March 31, 2018
|
|||||||||||
|
in millions
|
Amortized
Cost
|
Gross Unrealized Gains
|
Gross Unrealized Losses
|
Fair
Value
|
||||||||
|
SECURITIES AVAILABLE FOR SALE
|
||||||||||||
|
U.S. Treasury, agencies, and corporations
|
$
|
151
|
|
—
|
|
$
|
5
|
|
$
|
146
|
|
|
|
States and political subdivisions
|
9
|
|
—
|
|
—
|
|
9
|
|
||||
|
Agency residential collateralized mortgage obligations
|
15,037
|
|
$
|
7
|
|
478
|
|
14,566
|
|
|||
|
Agency residential mortgage-backed securities
|
1,376
|
|
2
|
|
37
|
|
1,341
|
|
||||
|
Agency commercial mortgage-backed securities
|
1,902
|
|
—
|
|
96
|
|
1,806
|
|
||||
|
Other securities
|
17
|
|
3
|
|
—
|
|
20
|
|
||||
|
Total securities available for sale
|
$
|
18,492
|
|
$
|
12
|
|
$
|
616
|
|
$
|
17,888
|
|
|
HELD-TO-MATURITY SECURITIES
|
||||||||||||
|
Agency residential collateralized mortgage obligations
|
$
|
7,952
|
|
1
|
|
$
|
331
|
|
$
|
7,622
|
|
|
|
Agency residential mortgage-backed securities
|
554
|
|
$
|
—
|
|
16
|
|
538
|
|
|||
|
Agency commercial mortgage-backed securities
|
3,668
|
|
—
|
|
114
|
|
3,554
|
|
||||
|
Other securities
|
15
|
|
—
|
|
—
|
|
15
|
|
||||
|
Total held-to-maturity securities
|
$
|
12,189
|
|
$
|
1
|
|
$
|
461
|
|
$
|
11,729
|
|
|
|
December 31, 2017
|
|||||||||||
|
in millions
|
Amortized
Cost
|
Gross Unrealized Gains
|
Gross Unrealized Losses
|
Fair
Value
|
||||||||
|
SECURITIES AVAILABLE FOR SALE
|
||||||||||||
|
U.S. Treasury, agencies, and corporations
|
$
|
159
|
|
—
|
|
$
|
2
|
|
$
|
157
|
|
|
|
States and political subdivisions
|
9
|
|
—
|
|
—
|
|
9
|
|
||||
|
Agency residential collateralized mortgage obligations
|
14,985
|
|
$
|
10
|
|
335
|
|
14,660
|
|
|||
|
Agency residential mortgage-backed securities
|
1,456
|
|
3
|
|
20
|
|
1,439
|
|
||||
|
Agency commercial mortgage-backed securities
|
1,920
|
|
—
|
|
66
|
|
1,854
|
|
||||
|
Other securities
|
17
|
|
3
|
|
—
|
|
20
|
|
||||
|
Total securities available for sale
|
$
|
18,546
|
|
$
|
16
|
|
$
|
423
|
|
$
|
18,139
|
|
|
HELD-TO-MATURITY SECURITIES
|
||||||||||||
|
Agency residential collateralized mortgage obligations
|
$
|
8,055
|
|
$
|
—
|
|
$
|
224
|
|
$
|
7,831
|
|
|
Agency residential mortgage-backed securities
|
574
|
|
1
|
|
4
|
|
571
|
|
||||
|
Agency commercial mortgage-backed securities
|
3,186
|
|
6
|
|
44
|
|
3,148
|
|
||||
|
Other securities
|
15
|
|
—
|
|
—
|
|
15
|
|
||||
|
Total held-to-maturity securities
|
$
|
11,830
|
|
$
|
7
|
|
$
|
272
|
|
$
|
11,565
|
|
82
The following table summarizes our securities that were in an unrealized loss position as of
March 31, 2018
, and
December 31, 2017
.
|
|
Duration of Unrealized Loss Position
|
|
|
|||||||||||||||
|
|
Less than 12 Months
|
12 Months or Longer
|
Total
|
|||||||||||||||
|
in millions
|
Fair
Value
|
Gross
Unrealized
Losses
|
Fair
Value
|
Gross
Unrealized
Losses
|
Fair
Value
|
Gross
Unrealized
Losses
|
||||||||||||
|
March 31, 2018
|
||||||||||||||||||
|
Securities available for sale:
|
||||||||||||||||||
|
U.S Treasury, agencies, and corporations
|
$
|
40
|
|
$
|
1
|
|
$
|
106
|
|
$
|
4
|
|
$
|
146
|
|
$
|
5
|
|
|
Agency residential collateralized mortgage obligations
|
5,974
|
|
125
|
|
7,025
|
|
353
|
|
12,999
|
|
478
|
|
||||||
|
Agency residential mortgage-backed securities
|
618
|
|
14
|
|
667
|
|
23
|
|
1,285
|
|
37
|
|
||||||
|
Agency commercial mortgage-backed securities
|
194
|
|
7
|
|
1,611
|
|
89
|
|
1,805
|
|
96
|
|
||||||
|
Held-to-maturity securities:
|
||||||||||||||||||
|
Agency residential collateralized mortgage obligations
|
2,137
|
|
56
|
|
5,319
|
|
275
|
|
7,456
|
|
331
|
|
||||||
|
Agency residential mortgage-backed securities
|
345
|
|
9
|
|
193
|
|
7
|
|
538
|
|
16
|
|
||||||
|
Agency commercial mortgage-backed securities
|
3,071
|
|
71
|
|
484
|
|
43
|
|
3,555
|
|
114
|
|
||||||
|
Other securities
(a)
|
2
|
|
—
|
|
—
|
|
—
|
|
2
|
|
—
|
|
||||||
|
Total temporarily impaired securities
|
$
|
12,381
|
|
$
|
283
|
|
$
|
15,405
|
|
$
|
794
|
|
$
|
27,786
|
|
$
|
1,077
|
|
|
December 31, 2017
|
||||||||||||||||||
|
Securities available for sale:
|
||||||||||||||||||
|
U.S. Treasury, agencies, and corporations
|
$
|
41
|
|
$
|
—
|
|
116
|
|
2
|
|
$
|
157
|
|
$
|
2
|
|
||
|
Agency residential collateralized mortgage obligations
|
6,153
|
|
74
|
|
$
|
7,270
|
|
$
|
261
|
|
13,423
|
|
335
|
|
||||
|
Agency residential mortgage-backed securities
|
666
|
|
7
|
|
702
|
|
13
|
|
1,368
|
|
20
|
|
||||||
|
Agency commercial mortgage-backed securities
|
205
|
|
4
|
|
1,649
|
|
62
|
|
1,854
|
|
66
|
|
||||||
|
Held-to-maturity securities:
|
||||||||||||||||||
|
Agency residential collateralized mortgage obligations
|
2,201
|
|
27
|
|
5,599
|
|
197
|
|
7,800
|
|
224
|
|
||||||
|
Agency residential mortgage-backed securities
|
252
|
|
1
|
|
206
|
|
3
|
|
458
|
|
4
|
|
||||||
|
Agency commercial mortgage-backed securities
|
1,470
|
|
12
|
|
495
|
|
32
|
|
1,965
|
|
44
|
|
||||||
|
Other securities
(a)
|
3
|
|
—
|
|
4
|
|
—
|
|
7
|
|
—
|
|
||||||
|
Total temporarily impaired securities
|
$
|
10,991
|
|
$
|
125
|
|
$
|
16,041
|
|
$
|
570
|
|
$
|
27,032
|
|
$
|
695
|
|
|
(a)
|
Gross unrealized losses totaled less than
$1 million
for other securities held-to maturity at
March 31, 2018
and
December 31, 2017
.
|
At
March 31, 2018
, we had
$478 million
of gross unrealized losses related to
457
fixed-rate agency residential CMOs that we invested in as part of our overall A/LM strategy. These securities had a weighted-average maturity of
4.54
years at
March 31, 2018
. At
March 31, 2018
, we also had
$37 million
of gross unrealized losses related to
262
agency residential mortgage-backed securities positions and
$96 million
of gross unrealized losses related to
14
agency commercial mortgage backed securities positions with weighted-average maturities of
3.92
years and
4.12
years, respectively. Because these securities have a fixed interest rate, their fair value is sensitive to movements in market interest rates. These unrealized losses are considered temporary since we expect to collect all contractually due amounts from these securities. Accordingly, these investments were reduced to their fair value through OCI, not through earnings.
We regularly assess our securities portfolio for OTTI. The assessments are based on the nature of the securities, the underlying collateral, the financial condition of the issuer, the extent and duration of the loss, our intent related to the individual securities, and the likelihood that we will have to sell securities prior to expected recovery. As shown in the following table, we did not have any impairment losses recognized in earnings for the
three
months ended
March 31, 2018
, and
March 31, 2017
.
|
Three months ended March 31, 2018
|
|||
|
in millions
|
|
||
|
Balance at December 31, 2017
|
$
|
4
|
|
|
Impairment recognized in earnings
|
—
|
|
|
|
Balance at March 31, 2018
|
$
|
4
|
|
At
March 31, 2018
, securities available for sale and held-to-maturity securities totaling
$9.0 billion
were pledged to secure securities sold under repurchase agreements, to secure public and trust deposits, to facilitate access to secured funding, and for other purposes required or permitted by law.
The following table shows our securities by remaining maturity. CMOs and other mortgage-backed securities available for sale portfolio and held-to-maturity portfolio are presented based on their expected average lives. The remaining securities, in both the available-for-sale and held-to-maturity portfolios, are presented based on their
83
remaining contractual maturity. Actual maturities may differ from expected or contractual maturities since borrowers have the right to prepay obligations with or without prepayment penalties.
|
|
Securities
Available for Sale
|
Held to Maturity
Securities
|
||||||||||
|
March 31, 2018
|
Amortized
Cost
|
Fair
Value
|
Amortized
Cost
|
Fair
Value
|
||||||||
|
in millions
|
||||||||||||
|
Due in one year or less
|
$
|
132
|
|
$
|
132
|
|
$
|
47
|
|
$
|
46
|
|
|
Due after one through five years
|
12,901
|
|
12,459
|
|
6,262
|
|
6,059
|
|
||||
|
Due after five through ten years
|
5,446
|
|
5,284
|
|
5,620
|
|
5,388
|
|
||||
|
Due after ten years
|
13
|
|
13
|
|
260
|
|
236
|
|
||||
|
Total
|
$
|
18,492
|
|
$
|
17,888
|
|
$
|
12,189
|
|
$
|
11,729
|
|
7. Derivatives and Hedging Activities
We are a party to various derivative instruments, mainly through our subsidiary, KeyBank. The primary derivatives that we use are interest rate swaps, caps, floors, and futures; foreign exchange contracts; commodity derivatives; and credit derivatives. Generally, these instruments help us manage exposure to interest rate risk, mitigate the credit risk inherent in our loan portfolio, hedge against changes in foreign currency exchange rates, and meet client financing and hedging needs. As further discussed in this note:
|
•
|
interest rate risk is the risk that the EVE or net interest income will be adversely affected by fluctuations in interest rates;
|
|
•
|
credit risk is the risk of loss arising from an obligor’s inability or failure to meet contractual payment or performance terms; and
|
|
•
|
foreign exchange risk is the risk that an exchange rate will adversely affect the fair value of a financial instrument.
|
At
March 31, 2018
, after taking into account the effects of bilateral collateral and master netting agreements, we had
$28 million
of derivative assets and
$4 million
of derivative liabilities that relate to contracts entered into for hedging purposes. As of the same date, after taking into account the effects of bilateral collateral and master netting agreements and a reserve for potential future losses, we had derivative assets of
$603 million
and derivative liabilities of
$371 million
that were not designated as hedging instruments. These positions are primarily comprised
of derivative contracts entered into for client accommodation purposes.
Additional information regarding our accounting policies for derivatives is provided in Note
1
(“
Summary of Significant Accounting Policies
”) under the heading “Derivatives and Hedging” beginning on page 105 of our 2017 Form 10-K
Derivatives Designated in Hedge Relationships
Net interest income and the EVE change in response to changes in the mix of assets, liabilities, and off-balance sheet instruments and the associated interest rates tied to each instrument. In addition, differences in the repricing and maturity characteristics of interest-earning assets and interest-bearing liabilities cause net interest income and the EVE to fluctuate. We utilize derivatives that have been designated as part of a hedge relationship in accordance with the applicable accounting guidance to manage net interest income and EVE to within our stated risk tolerances. The primary derivative instruments used to manage interest rate risk are interest rate swaps.
We designate certain “receive fixed/pay variable” interest rate swaps as fair value hedges. These contracts convert certain fixed-rate long-term debt into variable-rate obligations, thereby modifying our exposure to changes in interest rates. As a result, we receive fixed-rate interest payments in exchange for making variable-rate payments over the lives of the contracts without exchanging the notional amounts.
Similarly, we designate certain “receive fixed/pay variable” interest rate swaps as cash flow hedges. These contracts effectively convert certain floating-rate loans into fixed-rate loans to reduce the potential adverse effect of interest rate decreases on future interest income. Again, we receive fixed-rate interest payments in exchange for making variable-rate payments over the lives of the contracts without exchanging the notional amounts.
We also designate certain “pay fixed/receive variable” interest rate swaps as cash flow hedges. These swaps convert certain floating-rate debt into fixed-rate debt. We also use these swaps to manage the interest rate risk
84
associated with anticipated sales of certain commercial real estate loans. The swaps protect against the possible short-term decline in the value of the loans that could result from changes in interest rates between the time they are originated and the time they are sold.
We use foreign currency forward transactions to hedge the foreign currency exposure of our net investment in various foreign equipment finance entities. These entities are denominated in a non-U.S. currency. These forward transactions are designated as net investment hedges to mitigate the exposure of measuring the net investment at the spot foreign exchange rate.
Derivatives Not Designated in Hedge Relationships
We may enter into interest rate swap contracts to manage economic risks, but do not designate the instruments in hedge relationships. Excluding contracts addressing customer exposures, the amount of derivatives hedging risks on an economic basis at
March 31, 2018
, was not significant.
Like other financial services institutions, we originate loans and extend credit, both of which expose us to credit risk. We actively manage our overall loan portfolio and the associated credit risk in a manner consistent with asset quality objectives and concentration risk tolerances to mitigate portfolio credit risk. Purchasing credit protection through default swaps enables us to transfer to a third party a portion of the credit risk associated with a particular extension of credit, including situations where there is a forecast sale of loans. We purchase credit default swaps to reduce the credit risk associated with the debt securities held in our trading portfolio.
We also enter into derivative contracts for other purposes, including:
|
•
|
interest rate swap, cap, and floor contracts generally entered into to accommodate the needs of commercial loan clients;
|
|
•
|
energy and base metal swap and option contracts entered into to accommodate the needs of clients;
|
|
•
|
foreign exchange forward and option contracts entered into primarily to accommodate the needs of clients; and
|
|
•
|
futures contracts and positions with third parties that are intended to offset or mitigate the interest rate or market risk related to client positions discussed above.
|
These contracts are not designated as part of hedge relationships.
Fair Values, Volume of Activity, and Gain/Loss Information Related to Derivative Instruments
The following table summarizes the fair values of our derivative instruments on a gross and net basis as of
March 31, 2018
, and
December 31, 2017
. The change in the notional amounts of these derivatives by type from
December 31, 2017
, to
March 31, 2018
, indicates the volume of our derivative transaction activity during the first
three
months of
2018
. The notional amounts are not affected by bilateral collateral and master netting agreements. The derivative asset and liability balances are presented on a gross basis, prior to the application of bilateral collateral and master netting agreements, but after the variation margin payments with central clearing organizations have been applied as settlement, as applicable. Total derivative assets and liabilities are adjusted to take into account the impact of legally enforceable master netting agreements that allow us to settle all derivative contracts with a single counterparty on a net basis and to offset the net derivative position with the related cash collateral. Where master netting agreements are not in effect or are not enforceable under bankruptcy laws, we do not adjust those derivative assets and liabilities with counterparties. Securities collateral related to legally enforceable master netting agreements is not offset on the balance sheet. Our derivative instruments are included in “accrued income and other assets” or “accrued expenses and other liabilities” on the balance sheet, as follows:
85
|
|
March 31, 2018
|
December 31, 2017
|
|||||||||||||||||
|
|
|
Fair Value
|
|
Fair Value
|
|||||||||||||||
|
in millions
|
Notional
Amount
|
Derivative
Assets
|
Derivative
Liabilities
|
Notional
Amount
|
Derivative
Assets
|
Derivative
Liabilities
|
|||||||||||||
|
Derivatives designated as hedging instruments:
|
|||||||||||||||||||
|
Interest rate
|
$
|
27,906
|
|
$
|
39
|
|
$
|
2
|
|
$
|
26,176
|
|
$
|
81
|
|
$
|
46
|
|
|
|
Foreign exchange
|
281
|
|
1
|
|
4
|
|
302
|
|
1
|
|
4
|
|
|||||||
|
Total
|
28,187
|
|
40
|
|
6
|
|
26,478
|
|
82
|
|
50
|
|
|||||||
|
Derivatives not designated as hedging instruments:
|
|||||||||||||||||||
|
Interest rate
|
64,935
|
|
326
|
|
386
|
|
61,390
|
|
641
|
|
474
|
|
|||||||
|
Foreign exchange
|
8,458
|
|
121
|
|
111
|
|
8,317
|
|
129
|
|
120
|
|
|||||||
|
Commodity
|
1,902
|
|
345
|
|
334
|
|
1,687
|
|
255
|
|
246
|
|
|||||||
|
Credit
|
351
|
|
—
|
|
3
|
|
315
|
|
1
|
|
4
|
|
|||||||
|
Other
(a)
|
1,944
|
|
6
|
|
18
|
|
2,006
|
|
4
|
|
13
|
|
|||||||
|
Total
|
77,590
|
|
798
|
|
852
|
|
73,715
|
|
1,030
|
|
857
|
|
|||||||
|
Netting adjustments
(b)
|
—
|
|
(207
|
)
|
(483
|
)
|
—
|
|
(443
|
)
|
(616
|
)
|
|||||||
|
Net derivatives in the balance sheet
|
105,777
|
|
631
|
|
375
|
|
100,193
|
|
669
|
|
291
|
|
|||||||
|
Other collateral
(c)
|
—
|
|
(2
|
)
|
(69
|
)
|
—
|
|
(5
|
)
|
(84
|
)
|
|||||||
|
Net derivative amounts
|
$
|
105,777
|
|
$
|
629
|
|
$
|
306
|
|
$
|
100,193
|
|
$
|
664
|
|
$
|
207
|
|
|
|
(a)
|
Other derivatives include interest rate lock commitments and forward sale commitments related to our residential mortgage banking activities, forward purchase and sales contracts consisting of contractual commitments associated with “to be announced” securities and when issued securities, and when-issued security transactions in connection with an “at-the-market” equity offering program.
|
|
(b)
|
Netting adjustments represent the amounts recorded to convert our derivative assets and liabilities from a gross basis to a net basis in accordance with the applicable accounting guidance.
|
|
(c)
|
Other collateral represents the amount that cannot be used to offset our derivative assets and liabilities from a gross basis to a net basis in accordance with the applicable accounting guidance. The other collateral consists of securities and is exchanged under bilateral collateral and master netting agreements that allow us to offset the net derivative position with the related collateral. The application of the other collateral cannot reduce the net derivative position below zero. Therefore, excess other collateral, if any, is not reflected above.
|
Fair value hedges.
During the
three
-month period ended
March 31, 2018
, we did not exclude any portion of these hedging instruments from the assessment of hedge effectiveness.
The following table summarizes the amounts that were recorded on the balance sheet as of
March 31, 2018
related to cumulative basis adjustments for fair value hedges.
|
March 31, 2018
|
||||||
|
in millions
|
Balance sheet line item in which the hedge item is included
|
Carrying amount of hedged item
(a)
|
Hedge accounting basis adjustment
(b)
|
|||
|
Interest rate contracts
|
Long-term debt
|
$
|
9,106
|
|
(82
|
)
|
|
(a)
|
The carrying amount represents the portion of the liability designated as the hedged item.
|
|
(b)
|
Basis adjustment includes
$11 million
related to de-designated hedged items no longer in qualifying fair value hedging relationships.
|
Cash flow hedges.
During the
three
-month period ended
March 31, 2018
, we did not exclude any portion of these hedging instruments from the assessment of hedge effectiveness.
Considering the interest rates, yield curves, and notional amounts as of
March 31, 2018
, we would expect to reclassify an estimated
$55 million
of after-tax net
gains
on derivative instruments designated as cash flow hedges from AOCI to income during the next
12 months
. In addition, we expect to reclassify approximately
$3 million
of net
losses
related to terminated cash flow hedges from AOCI to income during the next 12 months. As of
March 31, 2018
, the maximum length of time over which we hedge forecast transactions is
10
years.
The following table summarizes the effect of fair value and cash flow hedge accounting on the income statement for the three month periods ended
March 31, 2018
, and
March 31, 2017
.
86
|
Location and amount of net gains (losses) recognized in income on fair value and cash flow hedging relationships
(a)
|
|||||||||
|
in millions
|
Interest expense – long-term debt
|
Interest income – loans
|
Other income
|
||||||
|
Three months ended March 31, 2018
|
|||||||||
|
Total amounts presented in the consolidated statement of income
|
$
|
(92
|
)
|
$
|
940
|
|
$
|
21
|
|
|
Net gains (losses) on fair value hedging relationships
|
|||||||||
|
Interest contracts
|
|||||||||
|
Recognized on hedged items
|
71
|
|
—
|
|
—
|
|
|||
|
Recognized on derivatives designated as hedging instruments
|
(69
|
)
|
—
|
|
—
|
|
|||
|
Net income (expense) recognized on fair value hedges
|
2
|
|
—
|
|
—
|
|
|||
|
Net gain (loss) on cash flow hedging relationships
|
|||||||||
|
Interest contracts
|
|||||||||
|
Realized gains (losses) (pre-tax) reclassified from AOCI into net income
|
(1
|
)
|
(2
|
)
|
—
|
|
|||
|
Net income (expense) recognized on cash flow hedges
|
$
|
(1
|
)
|
$
|
(2
|
)
|
—
|
|
|
|
Three months ended March 31, 2017
|
|||||||||
|
Total amounts presented in the consolidated statement of income
|
$
|
(68
|
)
|
$
|
877
|
|
$
|
32
|
|
|
Net gains (losses) on fair value hedging relationships
|
|||||||||
|
Interest contracts
|
|||||||||
|
Recognized on hedged items
|
—
|
|
—
|
|
35
|
|
|||
|
Recognized on derivatives designated as hedging instruments
|
18
|
|
—
|
|
(35
|
)
|
|||
|
Net income (expense) recognized on fair value hedges
|
18
|
|
—
|
|
—
|
|
|||
|
Net gain (loss) on cash flow hedging relationships
|
|||||||||
|
Interest contracts
|
|||||||||
|
Realized gains (losses) (pre-tax) reclassified from AOCI into net income
|
(1
|
)
|
15
|
|
—
|
|
|||
|
Gains (losses) (before tax) recognized in income for hedge ineffectiveness
|
—
|
|
—
|
|
—
|
|
|||
|
Net income (expense) recognized on cash flow hedges
|
$
|
(1
|
)
|
$
|
15
|
|
—
|
|
|
|
(a)
|
Prior period gain or loss amounts were not restated to conform to the new hedge accounting guidance adopted in 2017.
|
Net investment hedges.
We enter into foreign currency forward contracts to hedge our exposure to changes in the carrying value of our investments as a result of changes in the related foreign exchange rates. At
March 31, 2018
, AOCI reflected unrecognized, after-tax gains totaling
$37 million
related to cumulative changes in the fair value of our net investment hedges, which offset the unrecognized, after-tax foreign currency losses on net investment balances. We did not exclude any portion of our hedging instruments from the assessment of hedge effectiveness during the
three
-month period ended
March 31, 2018
.
The following table summarizes the pre-tax net gains (losses) on our cash flow and net investment hedges for the
three
-month periods ended
March 31, 2018
, and
March 31, 2017
, and where they are recorded on the income statement. The table includes net gains (losses) recognized in OCI during the period and net gains (losses) reclassified from OCI into income during the current period.
|
in millions
|
Net Gains (Losses)
Recognized in OCI
|
Income Statement Location of Net Gains (Losses)
Reclassified From OCI Into Income
|
Net Gains
(Losses) Reclassified
From OCI Into Income
(a)
|
Net Gains (Losses) Recognized in Other Income
(a)
|
||||||
|
Three months ended March 31, 2018
|
||||||||||
|
Cash Flow Hedges
|
||||||||||
|
Interest rate
|
$
|
(88
|
)
|
Interest income — Loans
|
$
|
(2
|
)
|
$
|
—
|
|
|
Interest rate
|
2
|
|
Interest expense — Long-term debt
|
(1
|
)
|
—
|
|
|||
|
Net Investment Hedges
|
||||||||||
|
Foreign exchange contracts
|
—
|
|
Other Income
|
—
|
|
—
|
|
|||
|
Total
|
$
|
(86
|
)
|
$
|
(3
|
)
|
$
|
—
|
|
|
|
Three months ended March 31, 2017
|
||||||||||
|
Cash Flow Hedges
|
||||||||||
|
Interest rate
|
$
|
(22
|
)
|
Interest income — Loans
|
$
|
15
|
|
$
|
—
|
|
|
Interest rate
|
—
|
|
Interest expense — Long-term debt
|
(1
|
)
|
—
|
|
|||
|
Net Investment Hedges
|
||||||||||
|
Foreign exchange contracts
|
(3
|
)
|
Other Income
|
—
|
|
—
|
|
|||
|
Total
|
$
|
(25
|
)
|
$
|
14
|
|
$
|
—
|
|
|
|
(a)
|
Prior period gain or loss amounts were not restated to conform to the new hedge accounting guidance adopted in 2017.
|
87
Nonhedging instruments
The following table summarizes the pre-tax net gains (losses) on our derivatives that are not designated as hedging instruments for the
three-month
periods ended
March 31, 2018
, and
March 31, 2017
, and where they are recorded on the income statement.
|
|
Three months ended March 31, 2018
|
Three months ended March 31, 2017
|
|||||||||||||||||||||||
|
in millions
|
Corporate
services
income
|
Consumer mortgage income
|
Other income
|
Total
|
Corporate services income
|
Consumer mortgage income
|
Other income
|
Total
|
|||||||||||||||||
|
NET GAINS (LOSSES)
|
|||||||||||||||||||||||||
|
Interest rate
|
$
|
9
|
|
$
|
—
|
|
$
|
2
|
|
$
|
11
|
|
$
|
6
|
|
—
|
|
$
|
(1
|
)
|
$
|
5
|
|
||
|
Foreign exchange
|
11
|
|
—
|
|
—
|
|
11
|
|
11
|
|
—
|
|
—
|
|
11
|
|
|||||||||
|
Commodity
|
3
|
|
—
|
|
—
|
|
3
|
|
2
|
|
—
|
|
—
|
|
2
|
|
|||||||||
|
Credit
|
2
|
|
—
|
|
(5
|
)
|
(3
|
)
|
1
|
|
—
|
|
(5
|
)
|
(4
|
)
|
|||||||||
|
Other
|
—
|
|
—
|
|
(4
|
)
|
(4
|
)
|
—
|
|
$
|
(1
|
)
|
(1
|
)
|
(2
|
)
|
||||||||
|
Total net gains (losses)
|
$
|
25
|
|
$
|
—
|
|
$
|
(7
|
)
|
$
|
18
|
|
$
|
20
|
|
$
|
(1
|
)
|
$
|
(7
|
)
|
$
|
12
|
|
|
Counterparty Credit Risk
Like other financial instruments, derivatives contain an element of credit risk. This risk is measured as the expected positive replacement value of the contracts. We use several means to mitigate and manage exposure to credit risk on derivative contracts. We enter into bilateral collateral and master netting agreements that provide for the net settlement of all contracts with a single counterparty in the event of default. Additionally, we monitor counterparty credit risk exposure on each contract to determine appropriate limits on our total credit exposure across all product types. We review our collateral positions on a daily basis and exchange collateral with our counterparties in accordance with standard ISDA documentation, central clearing rules, and other related agreements. We hold collateral in the form of cash and highly rated securities issued by the U.S. Treasury, government-sponsored enterprises, or GNMA. Cash collateral of
$105 million
was included in derivative assets on the balance sheet at
March 31, 2018
, compared to
$23 million
of cash collateral netted against derivative assets at
December 31, 2017
. The cash collateral netted against derivative liabilities totaled
$171 million
at
March 31, 2018
, and
$150 million
at
December 31, 2017
.
The following table summarizes the fair value of our derivative assets by type at the dates indicated. These assets represent our gross exposure to potential loss after taking into account the effects of bilateral collateral and master netting agreements and other means used to mitigate risk.
|
in millions
|
March 31, 2018
|
|
December 31, 2017
|
|
||
|
Interest rate
|
$
|
241
|
|
$
|
401
|
|
|
Foreign exchange
|
74
|
|
77
|
|
||
|
Commodity
|
205
|
|
163
|
|
||
|
Credit
|
—
|
|
1
|
|
||
|
Other
|
6
|
|
4
|
|
||
|
Derivative assets before collateral
|
526
|
|
646
|
|
||
|
Less: Related collateral
|
(105
|
)
|
(23
|
)
|
||
|
Total derivative assets
|
$
|
631
|
|
$
|
669
|
|
We enter into derivative transactions with two primary groups: broker-dealers and banks, and clients. Given that these groups have different economic characteristics, we have different methods for managing counterparty credit exposure and credit risk.
We enter into transactions with broker-dealers and banks for various risk management purposes. These types of transactions are generally high dollar volume. We generally enter into bilateral collateral and master netting agreements with these counterparties. We clear certain types of derivative transactions with these counterparties, whereby central clearing organizations become the counterparties to our derivative contracts. In addition, we enter into derivative contracts through swap execution facilities. Swap clearing and swap execution facilities reduce our exposure to counterparty credit risk. At
March 31, 2018
, we had gross exposure of
$103 million
to broker-dealers and banks. We had net exposure of
$192 million
after the application of master netting agreements and cash collateral, where such qualifying agreements exist. We had net exposure of
$181 million
after considering
$11 million
of additional collateral held in the form of securities.
88
We enter into transactions with clients to accommodate their business needs. These types of transactions are generally low dollar volume. We generally enter into master netting agreements with these counterparties. In addition, we mitigate our overall portfolio exposure and market risk by buying and selling U.S. Treasuries and Eurodollar futures and entering into offsetting positions and other derivative contracts, sometimes with entities other than broker-dealers and banks. Due to the smaller size and magnitude of the individual contracts with clients, we generally do not exchange collateral in connection with these derivative transactions. To address the risk of default associated with the uncollateralized contracts, we have established a credit valuation adjustment (included in “accrued income and other assets”) in the amount of
$4 million
at
March 31, 2018
, which we estimate to be the potential future losses on amounts due from client counterparties in the event of default. At
March 31, 2018
, we had gross exposure of
$515 million
to client counterparties and other entities that are not broker-dealers or banks for derivatives that have associated master netting agreements. We had net exposure of
$439 million
on our derivatives with these counterparties after the application of master netting agreements, collateral, and the related reserve.
Credit Derivatives
We are a buyer and, under limited circumstances, may be a seller of credit protection through the credit derivative market. We purchase credit derivatives to manage the credit risk associated with swap obligations as well as exposures to debt securities.
The following table summarizes the fair value of our credit derivatives purchased and sold by type as of
March 31, 2018
, and
December 31, 2017
. The fair value of credit derivatives presented below does not take into account the effects of bilateral collateral or master netting agreements.
|
|
March 31, 2018
|
December 31, 2017
|
|||||||||||||||
|
in millions
|
Purchased
|
Sold
|
Net
|
Purchased
|
Sold
|
Net
|
|||||||||||
|
Single-name credit default swaps
|
$
|
(1
|
)
|
—
|
|
$
|
(1
|
)
|
$
|
(1
|
)
|
—
|
|
$
|
(1
|
)
|
|
|
Traded credit default swap indices
|
(1
|
)
|
—
|
|
(1
|
)
|
(2
|
)
|
—
|
|
(2
|
)
|
|||||
|
Other
|
—
|
|
(1
|
)
|
(1
|
)
|
—
|
|
—
|
|
—
|
|
|||||
|
Total credit derivatives
|
$
|
(2
|
)
|
(1
|
)
|
$
|
(3
|
)
|
$
|
(3
|
)
|
—
|
|
$
|
(3
|
)
|
|
The majority of transactions represented by the “other” category shown in the above table consist of risk participation agreements. In risk participation agreements, the lead participant has a swap agreement with a customer. The lead participant (purchaser of protection) then enters into a risk participation agreement with a counterparty (seller of protection), under which the counterparty receives a fee to accept a portion of the lead participant’s credit risk. If the customer defaults on the swap contract, the counterparty to the risk participation agreement must reimburse the lead participant for the counterparty’s percentage of the positive fair value of the customer swap as of the default date. If the customer swap has a negative fair value, the counterparty has no reimbursement requirements. If the customer defaults on the swap contract and the seller fulfills its payment obligations under the risk participation agreement, the seller is entitled to a
pro rata
share of the lead participant’s claims against the customer under the terms of the swap agreement. In a credit default swap option we are given the right, but not the obligation, to purchase credit protection on a stated entity for a specified period of time.
The following table provides information on the types of credit derivatives sold by us and held on the balance sheet at
March 31, 2018
, and
December 31, 2017
. The notional amount represents the maximum amount that the seller could be required to pay. The payment/performance risk assessment is based on the default probabilities for the underlying reference entities’ debt obligations using a Moody’s credit ratings matrix known as Moody’s “Idealized” Cumulative Default Rates. The payment/performance risk shown in the table represents a weighted-average of the default probabilities for all reference entities in the respective portfolios. These default probabilities are directly correlated to the probability that we will have to make a payment under the credit derivative contracts.
|
|
March 31, 2018
|
December 31, 2017
|
|||||||||||||
|
dollars in millions
|
Notional
Amount
|
Average
Term
(Years)
|
Payment /
Performance
Risk
|
Notional
Amount
|
Average
Term
(Years)
|
Payment /
Performance
Risk
|
|||||||||
|
Other
|
$
|
33
|
|
11.07
|
|
7.20
|
%
|
$
|
15
|
|
3.08
|
|
6.64
|
%
|
|
|
Total credit derivatives sold
|
$
|
33
|
|
—
|
|
—
|
|
$
|
15
|
|
—
|
|
—
|
|
|
89
Credit Risk Contingent Features
We have entered into certain derivative contracts that require us to post collateral to the counterparties when these contracts are in a net liability position. The amount of collateral to be posted is based on the amount of the net liability and thresholds generally related to our long-term senior unsecured credit ratings with Moody’s and S&P. Collateral requirements also are based on minimum transfer amounts, which are specific to each Credit Support Annex (a component of the ISDA Master Agreement) that we have signed with the counterparties. In a limited number of instances, counterparties have the right to terminate their ISDA Master Agreements with us if our ratings fall below a certain level, usually investment-grade level (i.e., “Baa3” for Moody’s and “BBB-” for S&P). At
March 31, 2018
, KeyBank’s rating was “
A3
” with Moody’s and “
A-
” with S&P, and KeyCorp’s rating was “
Baa1
” with Moody’s and “
BBB+
” with S&P. As of
March 31, 2018
, the aggregate fair value of all derivative contracts with credit risk contingent features (i.e., those containing collateral posting or termination provisions based on our ratings) held by KeyBank that were in a net
liability
position totaled
$235 million
, which was comprised of
$189 million
in derivative assets and
$424 million
in derivative liabilities. We had
$228 million
in cash and securities collateral posted to cover those positions as of
March 31, 2018
. There were
no
derivative contracts with credit risk contingent features held by KeyCorp at
March 31, 2018
.
The following table summarizes the additional cash and securities collateral that KeyBank would have been required to deliver under the ISDA Master Agreements had the credit risk contingent features been triggered for the derivative contracts in a net liability position as of
March 31, 2018
, and
December 31, 2017
. The additional collateral amounts were calculated based on scenarios under which KeyBank’s ratings are downgraded one, two, or three ratings as of
March 31, 2018
, and
December 31, 2017
, and take into account all collateral already posted. A similar calculation was performed for KeyCorp, and
no
additional collateral would have been required as of
December 31, 2017
. For more information about the credit ratings for KeyBank and KeyCorp, see the discussion under the heading “Factors affecting liquidity” in the section entitled “Liquidity risk management” in Item 2 of this report.
|
|
March 31, 2018
|
December 31, 2017
|
|||||||||||
|
in millions
|
Moody’s
|
S&P
|
Moody’s
|
S&P
|
|||||||||
|
KeyBank’s long-term senior unsecured credit ratings
|
A3
|
|
A-
|
|
A3
|
|
A-
|
|
|||||
|
One rating downgrade
|
$
|
2
|
|
$
|
2
|
|
$
|
2
|
|
$
|
2
|
|
|
|
Two rating downgrades
|
2
|
|
2
|
|
2
|
|
2
|
|
|||||
|
Three rating downgrades
|
2
|
|
2
|
|
2
|
|
2
|
|
|||||
KeyBank’s long-term senior unsecured credit rating was
four
ratings above noninvestment grade at Moody’s and S&P as of
March 31, 2018
, and
December 31, 2017
. If KeyBank’s ratings had been downgraded below investment grade as of
March 31, 2018
, or
December 31, 2017
, payments of up to
$3 million
and
$12 million
, respectively, would have been required to either terminate the contracts or post additional collateral for those contracts in a net liability position, taking into account all collateral already posted. If KeyCorp’s ratings had been downgraded below investment grade as of
March 31, 2018
, or
December 31, 2017
,
no
payments, respectively, would have been required to either terminate the contracts or post additional collateral for those contracts in a net liability position, taking into account all collateral already posted.
8. Mortgage Servicing Assets
We originate and periodically sell commercial and residential mortgage loans but continue to service those loans for the buyers. We also may purchase the right to service commercial mortgage loans for other lenders. We record a servicing asset if we purchase or retain the right to service loans in exchange for servicing fees that exceed the going market servicing rate and are considered more than adequate compensation for servicing. Additional information pertaining to the accounting for mortgage and other servicing assets is included in Note
1
(“
Summary of Significant Accounting Policies
”) under the heading “Servicing Assets” beginning on page 106 of our
2017
Form 10-K.
90
Commercial
Changes in the carrying amount of commercial mortgage servicing assets are summarized as follows:
|
|
Three months ended March 31,
|
|||||
|
in millions
|
2018
|
|
2017
|
|
||
|
Balance at beginning of period
|
$
|
412
|
|
$
|
356
|
|
|
Servicing retained from loan sales
|
27
|
|
28
|
|
||
|
Purchases
|
21
|
|
7
|
|
||
|
Amortization
|
(25
|
)
|
(22
|
)
|
||
|
Balance at end of period
|
$
|
435
|
|
$
|
369
|
|
|
Fair value at end of period
|
$
|
537
|
|
$
|
480
|
|
The fair value of commercial mortgage servicing assets is determined by calculating the present value of future cash flows associated with servicing the loans. This calculation uses a number of assumptions that are based on current market conditions. The range and weighted average of the significant unobservable inputs used to determine the fair value of our commercial mortgage servicing assets at
March 31, 2018
, and
March 31, 2017
, along with the valuation techniques, are shown in the following table:
|
March 31, 2018
|
Valuation Technique
|
Significant
Unobservable Input
|
Range
(Weighted Average)
|
|
dollars in millions
|
|||
|
Commercial mortgage servicing assets
|
Discounted cash flow
|
Expected defaults
|
1.00 - 3.00% (1.18%)
|
|
Residual cash flows discount rate
|
7.00 - 15.00% (8.99%)
|
||
|
Escrow earn rate
|
2.17 - 3.45% (2.84%)
|
||
|
Servicing cost
|
$150 - $38,500 ($1,433)
|
||
|
Loan assumption rate
|
0.00 - 2.84% (1.18%)
|
||
|
Percentage late
|
0.00 - 2.00% (.23%)
|
||
|
March 31, 2017
|
Valuation Technique
|
Significant
Unobservable Input
|
Range
(Weighted Average)
|
|
dollars in millions
|
|||
|
Commercial mortgage servicing assets
|
Discounted cash flow
|
Expected defaults
|
1.00 - 3.00% (1.30%)
|
|
Residual cash flows discount rate
|
7.00 - 15.00% (8.60%)
|
||
|
Escrow earn rate
|
1.20 - 3.20% (2.60%)
|
||
|
Servicing cost
|
$150 - $38,500 ($1,342)
|
||
|
Loan assumption rate
|
0.00 - 3.00% (1.25%)
|
||
|
Percentage late
|
0.00 - 2.00% (.31%)
|
||
If these economic assumptions change or prove incorrect, the fair value of commercial mortgage servicing assets may also change. Expected credit losses, escrow earning rates, and discount rates are critical to the valuation of commercial mortgage servicing assets. Estimates of these assumptions are based on how a market participant would view the respective rates, and reflect historical data associated with the commercial mortgage loans, industry trends, and other considerations. Actual rates may differ from those estimated due to changes in a variety of economic factors. A decrease in the value assigned to the escrow earning rates would cause a decrease in the fair value of our commercial mortgage servicing assets. An increase in the assumed default rates of commercial mortgage loans or an increase in the assigned discount rates would cause a decrease in the fair value of our commercial mortgage servicing assets. Prepayment activity on commercial serviced loans does not significantly affect the valuation of our commercial mortgage servicing assets. Unlike residential mortgages, commercial mortgages experience significantly lower prepayments due to certain contractual restrictions affecting the borrower’s ability to prepay the mortgage.
The amortization of commercial servicing assets is determined in proportion to, and over the period of, the estimated net servicing income. The amortization of commercial servicing assets for each period, as shown in the table at the beginning of this note, is recorded as a reduction to contractual fee income. The contractual fee income from servicing commercial mortgage loans totaled
$42 million
for the
three-month
period ended
March 31, 2018
, and
$38 million
for the
three-month
period ended
March 31, 2017
. This fee income was offset by
$25 million
of amortization for the
three-month
period ended
March 31, 2018
, and
$22 million
for the
three-month
period ended
March 31, 2017
. Both the contractual fee income and the amortization are recorded, net, in “mortgage servicing fees” on the income statement.
91
Residential
Changes in the carrying amount of residential mortgage servicing assets are summarized as follows:
|
Three months ended March 31,
|
||||||
|
in millions
|
2018
|
|
2017
|
|
||
|
Balance at beginning of period
|
$
|
31
|
|
28
|
|
|
|
Servicing retained from loan sales
|
2
|
|
$
|
2
|
|
|
|
Purchases
|
—
|
|
—
|
|
||
|
Amortization
|
(1
|
)
|
(1
|
)
|
||
|
Balance at end of period
|
$
|
32
|
|
$
|
29
|
|
|
Fair value at end of period
|
$
|
42
|
|
$
|
35
|
|
The fair value of mortgage servicing assets is determined by calculating the present value of future cash flows associated with servicing the loans. This calculation uses a number of assumptions that are based on current market conditions. The range and weighted-average of the significant unobservable inputs used to fair value our mortgage servicing assets at
March 31, 2018
, and
March 31, 2017
, along with the valuation techniques, are shown in the following table:
|
March 31, 2018
|
Valuation Technique
|
Significant
Unobservable Input
|
Range
(Weighted Average)
|
|
dollars in millions
|
|||
|
Residential mortgage servicing assets
|
Discounted cash flow
|
Prepayment speed
|
8.37 - 48.63% (9.12%)
|
|
Discount rate
|
8.50 - 11.00% (8.54%)
|
||
|
Servicing cost
|
$76 - $4,385 ($83.05)
|
||
|
March 31, 2017
|
Valuation Technique
|
Significant
Unobservable Input
|
Range
(Weighted Average)
|
|
dollars in millions
|
|||
|
Residential mortgage servicing assets
|
Discounted cash flow
|
Prepayment speed
|
7.68 - 19.68% (9.24%)
|
|
Discount rate
|
8.50 - 11.00% (8.55%)
|
||
|
Servicing cost
|
$76 - $3,335 ($83.03)
|
||
If these economic assumptions change or prove incorrect, the fair value of residential mortgage servicing assets may also change. Prepayment speed, discount rates, and servicing cost are critical to the valuation of servicing assets. Estimates of these assumptions are based on how a market participant would view the respective rates, and reflect historical data associated with the loans, industry trends, and other considerations. Actual rates may differ from those estimated due to changes in a variety of economic factors. An increase in the prepayment speed, assigned discount rates, and servicing cost assumptions would also cause a negative impact on the fair value of our residential mortgage servicing assets.
The amortization of residential servicing assets is determined in proportion to, and over the period of, the estimated net residential servicing income. The amortization of servicing assets for
March 31, 2018
, as shown in the table above, is recorded as a reduction to contractual fee income. The contractual fee income from servicing residential mortgage loans totaled
$3 million
for the
three-month
periods ended
March 31, 2018
and
March 31, 2017
. This fee income was offset by
$1 million
of amortization for the
three-month
periods ended
March 31, 2018
and
March 31, 2017
. Both the contractual fee income and the amortization are recorded, net, in “mortgage servicing fees” on the income statement.
9. Variable Interest Entities
A VIE is a partnership, limited liability company, trust, or other legal entity that meets any one of the following criteria:
|
•
|
The entity does not have sufficient equity to conduct its activities without additional subordinated financial support from another party.
|
|
•
|
The entity’s investors lack the power to direct the activities that most significantly affect the entity’s economic performance.
|
|
•
|
The entity’s equity at risk holders do not have the obligation to absorb losses or the right to receive residual returns.
|
|
•
|
The voting rights of some investors are not proportional to their economic interests in the entity, and substantially all of the entity’s activities involve, or are conducted on behalf of, investors with disproportionately few voting rights.
|
92
Our significant VIEs are summarized below. We define a “significant interest” in a VIE as a subordinated interest that exposes us to a significant portion, but not the majority, of the VIE’s expected losses or residual returns, even though we do not have the power to direct the activities that most significantly affect the entity’s economic performance.
LIHTC investments.
Through KCDC, we have made investments directly and indirectly in LIHTC operating partnerships formed by third parties. As a limited partner in these operating partnerships, we are allocated tax credits and deductions associated with the underlying properties. We have determined that we are not the primary beneficiary of these investments because the general partners have the power to direct the activities that most significantly influence the economic performance of their respective partnerships and have the obligation to absorb expected losses and the right to receive residual returns. As we are not the primary beneficiary of these investments, we do not consolidate them.
Our maximum exposure to loss in connection with these partnerships consists of our unamortized investment balance plus any unfunded equity commitments and tax credits claimed but subject to recapture. We had
$1.3 billion
of investments in LIHTC operating partnerships at both
March 31, 2018
, and
December 31, 2017
. These investments are recorded in “accrued income and other assets” on our balance sheet. We do not have any loss reserves recorded related to these investments because we believe the likelihood of any loss to be remote. For all legally binding, unfunded equity commitments, we increase our recognized investment and recognize a liability. As of
March 31, 2018
, and
December 31, 2017
, we had liabilities of
$473 million
and
$476 million
, respectively, related to investments in qualified affordable housing projects, which are recorded in “accrued expenses and other liabilities” on our balance sheet. We continue to invest in these LIHTC operating partnerships.
The assets and liabilities presented in the table below convey the size of KCDC’s direct and indirect investments at
March 31, 2018
, and
December 31, 2017
. As these investments represent unconsolidated VIEs, the assets and liabilities of the investments themselves are not recorded on our balance sheet.
|
|
Unconsolidated VIEs
|
||||||||
|
in millions
|
Total
Assets
|
Total
Liabilities
|
Maximum
Exposure to Loss
|
||||||
|
March 31, 2018
|
|||||||||
|
LIHTC investments
|
$
|
6,035
|
|
$
|
2,938
|
|
$
|
1,559
|
|
|
December 31, 2017
|
|||||||||
|
LIHTC investments
|
$
|
6,003
|
|
$
|
2,943
|
|
$
|
1,561
|
|
We amortize our LIHTC investments over the period that we expect to receive the tax benefits. During the first
three
months of
2018
, we recognized
$41 million
of amortization and
$40 million
of tax credits associated with these investments within “income taxes” on our income statement. During the first
three
months of
2017
, we recognized
$40 million
of amortization and
$39 million
of tax credits associated with these investments within “income taxes” on our income statement.
Principal investments.
Through our principal investing entities, we have made investments in private equity funds engaged in venture- and growth-oriented investing. As a limited partner to these funds, we record these investments at fair value and receive distributions from the funds in accordance with the funds’ partnership agreements. We are not the primary beneficiary of these investments as we do not hold the power to direct the activities that most significantly affect the funds’ economic performance. Such power rests with the funds’ general partners. In addition, we have neither the obligation to absorb the funds’ expected losses nor the right to receive their residual returns. Our voting rights are also disproportionate to our economic interests, and substantially all of the funds’ activities are conducted on behalf of investors with disproportionately few voting rights. Because we are not the primary beneficiary of these investments, we do not consolidate them.
Our maximum exposure to loss associated with indirect principal investments consists of the investments’ fair value plus any unfunded equity commitments. The fair value of our indirect principal investments totaled
$114 million
and
$124 million
at
March 31, 2018
, and
December 31, 2017
, respectively. These investments are recorded in “other investments” on our balance sheet. Additional information on indirect principal investments is provided in Note
5
(“
Fair Value Measurements
”). The table below reflects the size of the private equity funds in which we were invested as well as our maximum exposure to loss in connection with these investments at
March 31, 2018
and
December 31, 2017
.
93
|
|
Unconsolidated VIEs
|
||||||||
|
in millions
|
Total
Assets
|
Total
Liabilities
|
Maximum
Exposure to Loss
|
||||||
|
March 31, 2018
|
|||||||||
|
Indirect investments
|
$
|
21,778
|
|
$
|
242
|
|
$
|
143
|
|
|
December 31, 2017
|
|||||||||
|
Indirect investments
|
$
|
26,817
|
|
$
|
292
|
|
$
|
153
|
|
Through our principal investing entities, we have formed and funded operating entities that provide management and other related services to our investment company funds, which directly invest in portfolio companies. In return for providing services to our direct investment funds, these entities’ receive a minority equity interest in the funds. This minority equity ownership is recorded at fair value on the entities’ financial statements. Additional information on our direct principal investments is provided in Note
5
(“
Fair Value Measurements
”). While other equity investors manage the daily operations of these entities, we retain the power, through voting rights, to direct the activities of the entities that most significantly affect their economic performance. In addition, we have the obligation to absorb losses and the right to receive residual returns that could potentially be significant to these entities. As a result, we have determined that we are the primary beneficiary of these funds and have consolidated them since formation. The entities had
no
assets at
March 31, 2018
that can only be used to settle the entities’ obligations, and
$4 million
of such assets at
December 31, 2017
. These assets are recorded in “cash and due from banks” and “accrued income and other assets” on our balance sheet. The entities had
no
liabilities at
March 31, 2018
, and
December 31, 2017
, and other equity investors have no recourse to our general credit.
Other unconsolidated VIEs.
We are involved with other various entities in the normal course of business which we have determined to be VIEs. We have determined that we are not the primary beneficiary of these VIEs because we do not have the power to direct the activities that most significantly impact their economic performance. Our assets associated with these unconsolidated VIEs totaled
$231 million
at
March 31, 2018
, and
$230 million
at
December 31, 2017
. These assets are recorded in “accrued income and other assets,” “other investments,” “securities available for sale”, and “loans, net of unearned income” on our balance sheet. We had liabilities totaling
$4 million
associated with these unconsolidated VIEs at both
March 31, 2018
, and
December 31, 2017
. These liabilities are recorded in “accrued expenses and other liabilities” on our balance sheet. We have excluded certain transactions with unconsolidated VIEs from the balances above where we determine our continuing involvement is not significant. In addition, where we only have a lending arrangement in the normal course of business with unconsolidated VIEs we present the balances related to the lending arrangements in Note
4
(“
Asset Quality
”).
10. Income Taxes
Bipartisan Budget Act of 2018
On February 9, 2018, the Bipartisan Budget Act (BBA) of 2018 was signed into law. The BBA includes a retroactive one year tax extenders package back to January 1, 2017 that reinstated several energy investment tax credits that had expired on December 31, 2016. Due to these retroactive provisions, Key recognized additional net investment tax credits in the first quarter of
$13.6 million
, or a
2.8%
reduction to our income tax provision, for energy tax credit transactions entered into during 2017.
TCJ Act
On December 22, 2017, the TCJ Act was signed into law. This comprehensive tax legislation provides for significant changes to the U.S. Internal Revenue Code of 1986, as amended, that impact corporate taxation requirements, such as the reduction in the federal corporate income tax rate from 35% to 21% effective January 1, 2018. The TCJ Act retains the low-income housing and research and development credits and repeals the corporate alternative minimum tax. Other relevant corporate changes include earlier recognition of certain revenue; accelerating expensing of investments in tangible property, including leasing assets; and limiting several deductions such as FDIC premiums, certain executive compensation, and meals and entertainment expenses.
Key was required to re-value certain tax-related assets under the provisions of the TCJ Act at December 31, 2017. Under current U.S. GAAP, deferred tax assets and liabilities are to be adjusted for the effect of a change in tax laws or rates with the effect included in income from continuing operations in the reporting period that includes the enactment date. The tax-related assets consist primarily of deferred tax assets and liabilities and investments in low-income housing transactions. Due to the close proximity of our year end to the date the TCJ Act was signed into
94
law, we estimated the impact of the income tax effects as of December 31, 2017, based upon currently available information which resulted in a reduction to our net income of
$161 million
. The significant components of this reduction included a
$14 million
reduction in our investments in certain low-income housing that is reflected in other expenses and a
$147 million
, or
7.6%
, increase in our income tax provision for the twelve months ended December 31, 2017, due to the reduction to our net deferred tax asset and related actions. This reduction is primarily the result of the lower federal corporate income tax rate, is based on information available at this time, and is subject to change due to a variety of factors, including among others: (i) completion of Key’s 2017 federal and state income tax returns, and (ii) management’s further assessment of the TCJ Act and related regulatory guidance. Adjustments may be made in future periods to these estimates as we continue to obtain, prepare and analyze information about facts and circumstances that existed as of the enactment date that, if known, would have affected the income tax effects reported as provisional amounts. Key expects to finalize this impact in the quarter ending September 30, 2018.
The accounting for the changes in tax law resulted in stranded tax effects within accumulated other comprehensive income for items that were originally recognized in other comprehensive income rather than in net income. The FASB issued an accounting standard update allowing companies to reclassify stranded tax effects resulting from the TCJ Act from accumulated other comprehensive income to retained earnings. We early adopted this guidance during the quarter ended December 31, 2017, and utilizing the portfolio method reclassified
$141 million
from accumulated other comprehensive income to retained earnings to eliminate the stranded tax effects.
Income Tax Provision
In accordance with the applicable accounting guidance, the principal method established for computing the provision for income taxes in interim periods requires us to make our best estimate of the effective tax rate expected to be applicable for the full year. This estimated effective tax rate is then applied to interim consolidated pre-tax operating income to determine the interim provision for income taxes.
The effective tax rate, which is the provision for income taxes as a percentage of income from continuing operations before income taxes, was
12.9%
for the
first
quarter of
2018
and
22.4%
for the
first
quarter of
2017
. The effective tax rates are below our combined federal and state statutory tax rate of
23.7%
for the
first
quarter of
2018
and
37.2%
for the
first
quarter of
2017
, primarily due to income from investments in tax-advantaged assets such as corporate-owned life insurance and credits associated with renewable energy and low-income housing investments. The effective tax rates for the three months ended
March 31, 2018
, and
March 31, 2017
, were affected by net discrete income tax benefits of
5.5%
and
4.7%
, respectively.
Deferred Tax Asset
At
March 31, 2018
, from continuing operations we had a net deferred tax asset of
$363 million
, compared to a net deferred tax asset of
$320 million
at
December 31, 2017
, included in “accrued income and other assets” on the balance sheet.
To determine the amount of deferred tax assets that are more likely than not to be realized, and therefore recorded, we conduct a quarterly assessment of all available evidence. This evidence includes, but is not limited to, taxable income in prior periods, projected future taxable income, and projected future reversals of deferred tax items. These assessments involve a degree of subjectivity and may undergo change. Based on these criteria, we had a valuation allowance of
$15 million
at
March 31, 2018
, and
$15 million
at
December 31, 2017
. The valuation allowance is associated with certain state net operating loss carryforwards, state credit carryforwards, and federal and state capital loss carryforwards.
Unrecognized Tax Benefits
As permitted under the applicable accounting guidance for income taxes, it is our policy to recognize interest and penalties related to unrecognized tax benefits in “income tax expense.” At
March 31, 2018
, Key’s unrecognized tax benefits were
$39 million
.
Pre-1988 Bank Reserves Acquired in a Business Combination
Retained earnings of KeyBank included approximately
$92 million
of allocated bad debt deductions for which no income taxes have been recorded. Under current federal law, these reserves are subject to recapture into taxable
95
income if KeyBank, or any successor, fails to maintain its bank status under the Internal Revenue Code or makes non-dividend distributions or distributions greater than its accumulated earnings and profits. No deferred tax liability has been established as these events are not expected to occur in the foreseeable future.
11. Acquisitions, Divestiture, and Discontinued Operations
Acquisitions
Cain Brothers & Company, LLC.
On October 2, 2017, KBCM acquired all outstanding interests in Cain Brothers, a healthcare-focused investment banking and public finance firm. This acquisition expands KBCM’s investment banking group in the healthcare vertical by adding distinctive capabilities and broadening KBCM’s existing healthcare investment banking network. The acquisition was accounted for as a business combination. As a result of the acquisition, Key recognized identifiable intangible assets with a fair value of
$30 million
and goodwill of
$53 million
, which are deductible for tax purposes. The valuation of the acquired assets and liabilities of Cain Brothers was final at March 31, 2018.
HelloWallet Holdings, Inc.
On July 1, 2017, KeyBank acquired all of the outstanding capital stock of HelloWallet Holdings, Inc., the sole owner of HelloWallet, LLC, a digital financial wellness company. Key’s retail banking franchise is leveraging HelloWallet’s technology to provide data-driven insights to clients, allowing clients to better understand and improve their personal finances. The acquisition was accounted for as a business combination. As a result of the acquisition, Key recognized identifiable intangible assets with a fair value of
$12 million
, comprised primarily of propriety software, and goodwill of
$17 million
, which are not deductible for tax purposes. The valuation of the acquired assets and liabilities of HelloWallet was final at March 31, 2018.
Key Merchant Services, LLC.
On June 30, 2017, KeyBank (consolidated) acquired an additional
51%
interest in Key Merchant Services, LLC (“KMS”), increasing our ownership interest from
49%
to
100%
. This acquisition enables us to grow our merchant services business and enhance our merchant product offerings. This transaction is accounted for as a business combination achieved in stages. Prior to the acquisition, KMS was operated as a merchant services joint venture and accounted for as an equity method investment in our consolidated financial statements.
As of June 30, 2017, the provisional estimated fair value of our equity interest in KMS immediately before the acquisition was
$74 million
. The fair value of our previously held equity interest was measured using discounted cash flow modeling that incorporates an appropriate risk premium and forecast earnings information. On June 30, 2017, we recognized a provisional non-cash holding gain of
$64 million
for the difference between the fair value and the book value of our previously held equity interest. In the third quarter of 2017, we recognized a measurement-period adjustment of
$5 million
to reduce the provisional estimated fair value of our equity interest immediately before the acquisition to
$69 million
, which reduced the total non-cash holding gain to
$59 million
. The initial gain and subsequent adjustment were included in “other income” on the income statement for the three months ended September 30, 2017. Upon acquisition, we recorded estimated identifiable intangible assets of
$95 million
and goodwill of less than
$1 million
. In the third quarter of 2017, we recognized a measurement-period adjustment of
$10 million
to reduce the fair value of acquired intangible assets to
$85 million
. In the fourth quarter of 2017, we recognized a measurement period adjustment increasing deferred tax assets and decreasing goodwill by
$2 million
. In aggregate, the measurement-period adjustments recognized as of December 31, 2017, increased goodwill recorded in connection with the KMS acquisition to
$4 million
. The fair value estimates related to this acquisition represent our best estimate of fair value and are expected to be finalized over a period of up to one year from the acquisition date.
Divestiture
Key Insurance & Benefits Services, Inc.
On March 29, 2018, we announced that we had entered into a definitive agreement to sell Key Insurance & Benefits Services, Inc. to USI Insurance Services. We acquired Key Insurance & Benefits Services, Inc. as a part of the 2016 merger with First Niagara. The transaction is subject to regulatory approvals and other customary closing conditions and is expected to close in the second quarter of 2018.
96
Discontinued operations
Discontinued operations primarily includes our government-guaranteed education lending business. At
March 31, 2018
, and
December 31, 2017
, approximately
$1.3 billion
and
$1.3 billion
, respectively, of education loans are included in discontinued assets on the consolidated balance sheets. Net interest income after provision for credit losses for this business is not material and is included in income (loss) from discontinued operations, net of taxes on the consolidated statements of income.
12. Securities Financing Activities
We enter into repurchase agreements to finance overnight customer sweep deposits. We also enter into repurchase and reverse repurchase agreements to settle other securities obligations. We account for these securities financing agreements as collateralized financing transactions. Repurchase and reverse repurchase agreements are recorded on the balance sheet at the amounts for which the securities will be subsequently sold or repurchased. Securities borrowed transactions are recorded on the balance sheet at the amounts of cash collateral advanced. While our securities financing agreements incorporate a right of set off, the assets and liabilities are reported on a gross basis. Reverse repurchase agreements and securities borrowed transactions are included in “short-term investments” on the balance sheet; repurchase agreements are included in “federal funds purchased and securities sold under repurchase agreements.”
The following table summarizes our securities financing agreements at
March 31, 2018
, and
December 31, 2017
:
|
|
March 31, 2018
|
||||||||||
|
in millions
|
Gross Amount
Presented in
Balance Sheet
|
Netting
Adjustments
(a)
|
Collateral
(b)
|
Net
Amounts
|
|||||||
|
Offsetting of financial assets:
|
|||||||||||
|
Reverse repurchase agreements
|
$
|
3
|
|
$
|
(3
|
)
|
$
|
—
|
|
—
|
|
|
Total
|
$
|
3
|
|
$
|
(3
|
)
|
$
|
—
|
|
—
|
|
|
Offsetting of financial liabilities:
|
|||||||||||
|
Repurchase agreements
(c)
|
$
|
614
|
|
$
|
(7
|
)
|
$
|
(607
|
)
|
—
|
|
|
Total
|
$
|
614
|
|
$
|
(7
|
)
|
$
|
(607
|
)
|
—
|
|
|
|
December 31, 2017
|
||||||||||
|
in millions
|
Gross Amount
Presented in
Balance Sheet
|
Netting Adjustments
(a)
|
Collateral
(b)
|
Net
Amounts
|
|||||||
|
Offsetting of financial assets:
|
|||||||||||
|
Reverse repurchase agreements
|
$
|
3
|
|
$
|
(3
|
)
|
—
|
|
—
|
|
|
|
Total
|
$
|
3
|
|
$
|
(3
|
)
|
—
|
|
—
|
|
|
|
Offsetting of financial liabilities:
|
|||||||||||
|
Repurchase agreements
(c)
|
$
|
374
|
|
$
|
(4
|
)
|
$
|
(370
|
)
|
—
|
|
|
Total
|
$
|
374
|
|
$
|
(4
|
)
|
$
|
(370
|
)
|
—
|
|
|
(a)
|
Netting adjustments take into account the impact of master netting agreements that allow us to settle with a single counterparty on a net basis.
|
|
(b)
|
These adjustments take into account the impact of bilateral collateral agreements that allow us to offset the net positions with the related collateral. The application of collateral cannot reduce the net position below zero. Therefore, excess collateral, if any, is not reflected above.
|
|
(c)
|
Repurchase agreements are collateralized by mortgaged-backed agency securities and are contracted on an overnight or continuous basis.
|
As of
March 31, 2018
, the carrying amount of assets pledged as collateral against repurchase agreements totaled
$520 million
. Assets pledged as collateral are reported in “securities available for sale” and “held-to-maturity securities” on our balance sheet. At
March 31, 2018
, the liabilities associated with collateral pledged were solely comprised of customer sweep financing activity and had a carrying value of
$379 million
. The collateral pledged under customer sweep repurchase agreements is posted to a third-party custodian and cannot be sold or repledged by the secured party. The risk related to a decline in the market value of collateral pledged is minimal given the collateral's high credit quality and the overnight duration of the repurchase agreements.
Like other financing transactions, securities financing agreements contain an element of credit risk. To mitigate and manage credit risk exposure, we generally enter into master netting agreements and other collateral arrangements that give us the right, in the event of default, to liquidate collateral held and to offset receivables and payables with the same counterparty. Additionally, we establish and monitor limits on our counterparty credit risk exposure by product type. For the reverse repurchase agreements, we monitor the value of the underlying securities we received from counterparties and either request additional collateral or return a portion of the collateral based on the
97
value of those securities. We generally hold collateral in the form of highly rated securities issued by the U.S. Treasury and fixed income securities. In addition, we may need to provide collateral to counterparties under our repurchase agreements. With the exception of collateral pledged against customer sweep repurchase agreements, the collateral we pledge and receive can generally be sold or repledged by the secured parties.
13. Employee Benefits
Pension Plans
Effective December 31, 2009, we amended our cash balance pension plan and other defined benefit plans to freeze all benefit accruals and close the plans to new employees. We will continue to credit participants’ existing account balances for interest until they receive their plan benefits. We changed certain pension plan assumptions after freezing the plans. As part of the acquisition of First Niagara, Key also obtained
two
frozen defined benefit plans sponsored by First Niagara, both of which provide benefits based upon length of service and compensation levels. Effective September 30, 2016, the two First Niagara plans merged into another defined benefit plan maintained by Key to form the KeyCorp Consolidated Cash Balance Plan. Effective December 31, 2016, our original cash balance pension plan merged into the KeyCorp Consolidated Cash Balance Plan.
The components of net pension cost (benefit) for all funded and unfunded plans are as follows:
|
|
Three months ended March 31,
|
|||||
|
in millions
|
2018
|
|
2017
|
|
||
|
Interest cost on PBO
|
$
|
10
|
|
$
|
12
|
|
|
Expected return on plan assets
|
(13
|
)
|
(17
|
)
|
||
|
Amortization of losses
|
4
|
|
4
|
|
||
|
Net pension cost
|
$
|
1
|
|
$
|
(1
|
)
|
Other Postretirement Benefit Plans
We sponsor a retiree healthcare plan in which all employees age
55
with
5 years
of service (or employees age
50
with
15 years
of service who are terminated under conditions that entitle them to a severance benefit) are eligible to participate. Participant contributions are adjusted annually. Key may provide a subsidy toward the cost of coverage for certain employees hired before 2001 with a minimum of
15 years
of service at the time of termination. We use a separate VEBA trust to fund the retiree healthcare plan. Effective November 29, 2016, an unfunded retiree welfare plan previously sponsored by First Niagara merged into our current retiree healthcare plan.
14. Trust Preferred Securities Issued by Unconsolidated Subsidiaries
We own the outstanding common stock of business trusts formed by us that issued corporation-obligated, mandatorily redeemable, trust preferred securities. The trusts used the proceeds from the issuance of their trust preferred securities and common stock to buy debentures issued by KeyCorp. These debentures are the trusts’ only assets; the interest payments from the debentures finance the distributions paid on the mandatorily redeemable trust preferred securities. The outstanding common stock of these business trusts is recorded in “other investments” on our balance sheet.
We unconditionally guarantee the following payments or distributions on behalf of the trusts:
|
•
|
required distributions on the trust preferred securities;
|
|
•
|
the redemption price when a capital security is redeemed; and
|
|
•
|
the amounts due if a trust is liquidated or terminated.
|
The Regulatory Capital Rules, discussed in “Supervision and regulation” in Item 2 of this report, implement a phase-out of trust preferred securities as Tier 1 capital, consistent with the requirements of the Dodd-Frank Act. For “standardized approach” banking organizations such as Key, the phase-out period began on January 1, 2015, and starting in 2016 requires us to treat our mandatorily redeemable, trust preferred securities as Tier 2 capital.
98
The trust preferred securities, common stock, and related debentures are summarized as follows:
|
dollars in millions
|
Trust Preferred Securities, Net of Discount
(a)
|
Common Stock
|
Principal Amount of Debentures, Net of Discount
(b)
|
Interest Rate of Trust Preferred Securities and Debentures
(c)
|
Maturity of Trust Preferred Securities and Debentures
|
||||||||
|
March 31, 2018
|
|||||||||||||
|
KeyCorp Capital I
|
$
|
155
|
|
$
|
6
|
|
$
|
161
|
|
2.435
|
%
|
2028
|
|
|
KeyCorp Capital II
|
102
|
|
4
|
|
106
|
|
6.875
|
|
2029
|
|
|||
|
KeyCorp Capital III
|
132
|
|
4
|
|
136
|
|
7.750
|
|
2029
|
|
|||
|
HNC Statutory Trust III
|
18
|
|
1
|
|
19
|
|
3.320
|
|
2035
|
|
|||
|
Willow Grove Statutory Trust I
|
18
|
|
1
|
|
19
|
|
3.435
|
|
2036
|
|
|||
|
HNC Statutory Trust IV
|
16
|
|
1
|
|
17
|
|
3.053
|
|
2037
|
|
|||
|
Westbank Capital Trust II
|
7
|
|
—
|
|
7
|
|
4.392
|
|
2034
|
|
|||
|
Westbank Capital Trust III
|
7
|
|
—
|
|
7
|
|
4.392
|
|
2034
|
|
|||
|
Total
|
$
|
455
|
|
$
|
17
|
|
$
|
472
|
|
5.128
|
%
|
—
|
|
|
December 31, 2017
|
$
|
463
|
|
$
|
17
|
|
$
|
480
|
|
4.977
|
%
|
—
|
|
|
(a)
|
The trust preferred securities must be redeemed when the related debentures mature, or earlier if provided in the governing indenture. Each issue of trust preferred securities carries an interest rate identical to that of the related debenture. Certain trust preferred securities include basis adjustments related to fair value hedges totaling
$47 million
at
March 31, 2018
, and
$55 million
at
December 31, 2017
. See Note
7
(“
Derivatives and Hedging Activities
”) for an explanation of fair value hedges.
|
|
(b)
|
We have the right to redeem these debentures. If the debentures purchased by KeyCorp Capital I, HNC Statutory Trust III, Willow Grove Statutory Trust I, HNC Statutory Trust IV, Westbank Capital Trust II, or Westbank Capital Trust III are redeemed before they mature, the redemption price will be the principal amount, plus any accrued but unpaid interest. If the debentures purchased by KeyCorp Capital II or KeyCorp Capital III are redeemed before they mature, the redemption price will be the greater of: (i) the principal amount, plus any accrued but unpaid interest, or (ii) the sum of the present values of principal and interest payments discounted at the Treasury Rate (as defined in the applicable indenture), plus 20 basis points for KeyCorp Capital II or 25 basis points for KeyCorp Capital III, or 50 basis points in the case of redemption upon either a tax or a capital treatment event for either KeyCorp Capital II or KeyCorp Capital III, plus any accrued but unpaid interest. The principal amount of certain debentures includes basis adjustments related to fair value hedges totaling
$47 million
at
March 31, 2018
, and
$55 million
at
December 31, 2017
. See Note
7
for an explanation of fair value hedges. The principal amount of debentures, net of discounts, is included in “long-term debt” on the balance sheet.
|
|
(c)
|
The interest rates for the trust preferred securities issued by KeyCorp Capital II and KeyCorp Capital III are fixed. The trust preferred securities issued by KeyCorp Capital I have a floating interest rate, equal to three-month LIBOR plus 74 basis points, that reprices quarterly. The trust preferred securities issued by HNC Statutory Trust III have a floating interest rate, equal to three-month LIBOR plus 140 basis points, that reprices quarterly. The trust preferred securities issued by Willow Grove Statutory Trust I have a floating interest rate, equal to three-month LIBOR plus 131 basis points, that reprices quarterly. The trust preferred securities issued by HNC Statutory Trust IV have a floating interest rate, equal to three-month LIBOR plus 128 basis points, that reprices quarterly. The trust preferred securities issued by Westbank Capital Trust II and Westbank Capital Trust III each have a floating interest rate, equal to three-month LIBOR plus 219 basis points, that reprices quarterly. The total interest rates are weighted-average rates.
|
15. Contingent Liabilities and Guarantees
Legal Proceedings
Litigation.
From time to time, in the ordinary course of business, we and our subsidiaries are subject to various litigation, investigations, and administrative proceedings. Private, civil litigations may range from individual actions involving a single plaintiff to putative class action lawsuits with potentially thousands of class members. Investigations may involve both formal and informal proceedings, by both government agencies and self-regulatory bodies. These matters may involve claims for substantial monetary relief. At times, these matters may present novel claims or legal theories. Due to the complex nature of these various other matters, it may be years before some matters are resolved. While it is impossible to ascertain the ultimate resolution or range of financial liability, based on information presently known to us, we do not believe there is any matter to which we are a party, or involving any of our properties that, individually or in the aggregate, would reasonably be expected to have a material adverse effect on our financial condition. We continually monitor and reassess the potential materiality of these litigation matters. We note, however, that in light of the inherent uncertainty in legal proceedings there can be no assurance that the ultimate resolution will not exceed established reserves. As a result, the outcome of a particular matter, or a combination of matters, may be material to our results of operations for a particular period, depending upon the size of the loss or our income for that particular period.
Guarantees
We are a guarantor in various agreements with third parties. The following table shows the types of guarantees that we had outstanding at
March 31, 2018
. Information pertaining to the basis for determining the liabilities recorded in connection with these guarantees is included in Note
1
(“
Summary of Significant Accounting Policies
”) under the heading “Guarantees” beginning on page 108 of our
2017
Form 10-K.
99
|
March 31, 2018
|
Maximum Potential Undiscounted Future Payments
|
Liability Recorded
|
||||
|
in millions
|
||||||
|
Financial guarantees:
|
||||||
|
Standby letters of credit
|
$
|
2,996
|
|
$
|
70
|
|
|
Recourse agreement with FNMA
|
3,365
|
|
6
|
|
||
|
Residential mortgage reserve
|
1,362
|
|
6
|
|
||
|
Return guarantee agreement with LIHTC investors
|
3
|
|
3
|
|
||
|
Written put options
(a)
|
2,357
|
|
73
|
|
||
|
Total
|
$
|
10,083
|
|
$
|
158
|
|
|
(a)
|
The maximum potential undiscounted future payments represent notional amounts of derivatives qualifying as guarantees.
|
We determine the payment/performance risk associated with each type of guarantee described below based on the probability that we could be required to make the maximum potential undiscounted future payments shown in the preceding table. We use a scale of low (
0%
to
30%
probability of payment), moderate (greater than
30%
to
70%
probability of payment), or high (greater than
70%
probability of payment) to assess the payment/performance risk, and have determined that the payment/performance risk associated with each type of guarantee outstanding at
March 31, 2018
, is low.
Standby letters of credit.
KeyBank issues standby letters of credit to address clients’ financing needs. These instruments obligate us to pay a specified third party when a client fails to repay an outstanding loan or debt instrument or fails to perform some contractual nonfinancial obligation. Any amounts drawn under standby letters of credit are treated as loans to the client; they bear interest (generally at variable rates) and pose the same credit risk to us as a loan. At
March 31, 2018
, our standby letters of credit had a remaining weighted-average life of
two years
, with remaining actual lives ranging from less than
one
year to as many as
17 years
.
Recourse agreement with FNMA.
We participate as a lender in the FNMA Delegated Underwriting and Servicing program. FNMA delegates responsibility for originating, underwriting, and servicing mortgages, and we assume a limited portion of the risk of loss during the remaining term on each commercial mortgage loan that we sell to FNMA. We maintain a reserve for such potential losses in an amount that we believe approximates the fair value of our liability. At
March 31, 2018
, the outstanding commercial mortgage loans in this program had a weighted-average remaining term of
7.9 years
, and the unpaid principal balance outstanding of loans sold by us as a participant was
$11.9 billion
. The maximum potential amount of undiscounted future payments that we could be required to make under this program, as shown in the preceding table, is equal to approximately
28%
of the principal balance of loans outstanding at
March 31, 2018
. If we are required to make a payment, we would have an interest in the collateral underlying the related commercial mortgage loan; any loss we incur could be offset by the amount of any recovery from the collateral.
Residential Mortgage Banking.
We often originate and sell residential mortgage loans with servicing retained. Our loan sales activity is generally conducted through loan sales in a secondary market sponsored by FNMA and FHLMC. Subsequent to the sale of mortgage loans, we do not typically retain any interest in the underlying loans except through our relationship as the servicer of the loans.
As is customary in the mortgage banking industry, we, or banks we have acquired, have made certain representations and warranties related to the sale of residential mortgage loans (including loans sold with servicing released) and to the performance of our obligations as servicer. The breach of any such representations or warranties could result in losses for us. Our maximum exposure to loss is equal to the outstanding principal balance of the sold loans; however, any loss would be reduced by any payments received on the loans or through the sale of collateral.
At
March 31, 2018
, the outstanding residential mortgage loans in this program had a weighted-average LTV ratio of
72%
, and the unpaid principal balance outstanding of loans sold by us was
$4.5 billion
. The risk assessment is low for the residential mortgage product. The maximum potential amount of undiscounted future payments that we could be required to make under this program, as shown in the preceding table, is equal to approximately
30%
of the principal balance of loans outstanding at
March 31, 2018
.
Our liability for estimated repurchase obligations on loans sold, which is included in other liabilities on our balance sheet, was
$6 million
at
March 31, 2018
.
100
Return guarantee agreement with LIHTC investors.
KAHC, a subsidiary of KeyBank, offered limited partnership interests to qualified investors. Partnerships formed by KAHC invested in low-income residential rental properties that qualify for federal low-income housing tax credits under Section 42 of the Internal Revenue Code. In certain partnerships, investors paid a fee to KAHC for a guaranteed return that is based on the financial performance of the property and the property’s confirmed LIHTC status throughout a
15
-year compliance period. Typically, KAHC fulfills these guaranteed returns by distributing tax credits and deductions associated with the specific properties. If KAHC defaults on its obligation to provide the guaranteed return, KeyBank is obligated to make any necessary payments to investors. No recourse or collateral is available to offset our guarantee obligation other than the underlying income streams from the properties and the residual value of the operating partnership interests.
As shown in the previous table, KAHC maintained a reserve in the amount of
$3 million
at
March 31, 2018
, which is sufficient to cover estimated future obligations under the guarantees. The maximum exposure to loss reflected in the table represents undiscounted future payments due to investors for the return on and of their investments.
These guarantees have expiration dates that
extend through 2018
, but KAHC has not formed any new partnerships under this program since October 2003. Additional information regarding these partnerships is included in Note
9
(“
Variable Interest Entities
”).
Written put options.
In the ordinary course of business, we “write” put options for clients that wish to mitigate their exposure to changes in interest rates and commodity prices. At
March 31, 2018
, our written put options had an average life of
three years
. These instruments are considered to be guarantees, as we are required to make payments to the counterparty (the client) based on changes in an underlying variable that is related to an asset, a liability, or an equity security that the client holds. We are obligated to pay the client if the applicable benchmark interest rate or commodity price is above or below a specified level (known as the “strike rate”). These written put options are accounted for as derivatives at fair value, as further discussed in Note
7
(“
Derivatives and Hedging Activities
”). We mitigate our potential future payment obligations by entering into offsetting positions with third parties.
Written put options where the counterparty is a broker-dealer or bank are accounted for as derivatives at fair value but are not considered guarantees since these counterparties typically do not hold the underlying instruments. In addition, we are a purchaser and seller of credit derivatives, which are further discussed in Note
7
(“
Derivatives and Hedging Activities
”).
Default guarantees.
Some lines of business participate in guarantees that obligate us to perform if the debtor (typically a client) fails to satisfy all of its payment obligations to third parties. We generally undertake these guarantees for one of two possible reasons: (i) either the risk profile of the debtor should provide an investment return, or (ii) we are supporting our underlying investment in the debtor. We do not hold collateral for the default guarantees. If we were required to make a payment under a guarantee, we would receive a
pro rata
share should the third party collect some or all of the amounts due from the debtor. At
March 31, 2018
, we had less than
$1 million
of default guarantees.
Other Off-Balance Sheet Risk
Other off-balance sheet risk stems from financial instruments that do not meet the definition of a guarantee as specified in the applicable accounting guidance, and from other relationships.
Indemnifications provided in the ordinary course of business.
We provide certain indemnifications, primarily through representations and warranties in contracts that we execute in the ordinary course of business in connection with loan and lease sales and other ongoing activities, as well as in connection with purchases and sales of businesses. We maintain reserves, when appropriate, with respect to liability that reasonably could arise as a result of these indemnities.
Intercompany guarantees.
KeyCorp, KeyBank, and certain of our affiliates are parties to various guarantees that facilitate the ongoing business activities of other affiliates. These business activities include issuing debt, assuming certain lease and insurance obligations, purchasing or issuing investments and securities, and engaging in certain leasing transactions involving clients.
101
16. Accumulated Other Comprehensive Income
Our changes in AOCI for the three months ended
March 31, 2018
, and
March 31, 2017
, are as follows:
|
in millions
|
Unrealized gains (losses) on securities available for sale
|
Unrealized gains (losses) on derivative financial instruments
|
Foreign currency translation adjustment
|
Net pension and postretirement benefit costs
|
Total
|
||||||||||
|
Balance at December 31, 2017
|
$
|
(311
|
)
|
$
|
(86
|
)
|
$
|
9
|
|
$
|
(391
|
)
|
$
|
(779
|
)
|
|
Other comprehensive income before reclassification, net of income taxes
|
(150
|
)
|
(65
|
)
|
(2
|
)
|
—
|
|
(217
|
)
|
|||||
|
Amounts reclassified from accumulated other comprehensive income, net of income taxes
(a)
|
—
|
|
2
|
|
—
|
|
3
|
|
5
|
|
|||||
|
Net current-period other comprehensive income, net of income taxes
|
(150
|
)
|
(63
|
)
|
(2
|
)
|
3
|
|
(212
|
)
|
|||||
|
Balance at March 31, 2018
|
$
|
(461
|
)
|
$
|
(149
|
)
|
$
|
7
|
|
$
|
(388
|
)
|
$
|
(991
|
)
|
|
Balance at December 31, 2016
|
$
|
(185
|
)
|
$
|
(14
|
)
|
$
|
(3
|
)
|
$
|
(339
|
)
|
$
|
(541
|
)
|
|
Other comprehensive income before reclassification, net of income taxes
|
6
|
|
(15
|
)
|
1
|
|
1
|
|
(7
|
)
|
|||||
|
Amounts reclassified from accumulated other comprehensive income, net of income taxes
(a)
|
—
|
|
(9
|
)
|
—
|
|
3
|
|
(6
|
)
|
|||||
|
Net current-period other comprehensive income, net of income taxes
|
6
|
|
(24
|
)
|
1
|
|
4
|
|
(13
|
)
|
|||||
|
Balance at March 31, 2017
|
$
|
(179
|
)
|
$
|
(38
|
)
|
$
|
(2
|
)
|
$
|
(335
|
)
|
$
|
(554
|
)
|
|
(a)
|
See table below for details about these reclassifications.
|
Our reclassifications out of AOCI for the
three
months ended
March 31, 2018
, and
March 31, 2017
, are as follows:
|
Three months ended March 31, 2018
|
Amount Reclassified from Accumulated Other Comprehensive Income
|
Affected Line Item in the Statement Where Net Income is Presented
|
||
|
in millions
|
||||
|
Unrealized gains (losses) on derivative financial instruments
|
||||
|
Interest rate
|
$
|
(2
|
)
|
Interest income — Loans
|
|
Interest rate
|
(1
|
)
|
Interest expense — Long-term debt
|
|
|
(3
|
)
|
Income (loss) from continuing operations before income taxes
|
||
|
(1
|
)
|
Income taxes
|
||
|
$
|
(2
|
)
|
Income (loss) from continuing operations
|
|
|
Net pension and postretirement benefit costs
|
||||
|
Amortization of losses
|
$
|
(4
|
)
|
Personnel expense
|
|
(4
|
)
|
Income (loss) from continuing operations before income taxes
|
||
|
(1
|
)
|
Income taxes
|
||
|
$
|
(3
|
)
|
Income (loss) from continuing operations
|
|
|
Three months ended March 31, 2017
|
Amount Reclassified from Accumulated Other Comprehensive Income
|
Affected Line Item in the Statement
Where Net Income is Presented
|
||
|
in millions
|
||||
|
Unrealized gains (losses) on derivative financial instruments
|
||||
|
Interest rate
|
$
|
15
|
|
Interest income — Loans
|
|
Interest rate
|
(1
|
)
|
Interest expense — Long term debt
|
|
|
14
|
|
Income (loss) from continuing operations before income taxes
|
||
|
5
|
|
Income taxes
|
||
|
$
|
9
|
|
Income (loss) from continuing operations
|
|
|
Net pension and postretirement benefit costs
|
||||
|
Amortization of losses
|
$
|
(4
|
)
|
Personnel expense
|
|
(4
|
)
|
Income (loss) from continuing operations before income taxes
|
||
|
(1
|
)
|
Income taxes
|
||
|
$
|
(3
|
)
|
Income (loss) from continuing operations
|
|
17. Shareholders' Equity
Comprehensive Capital Plan
As previously reported and as authorized by the Board and pursuant to our 2017 capital plan (which is effective through the second quarter of 2018) submitted and not objected to by the Federal Reserve, we have authority to repurchase up to
$800 million
of our Common Shares. We completed
$199 million
of Common Share repurchases, including
$156 million
of Common Share repurchases in the open market and
$43 million
of Common Share
102
repurchases related to employee equity compensation programs, in the
first
quarter of
2018
under this authorization.
Consistent with our 2017 capital plan, the Board declared a quarterly dividend of
$.105
per Common Share for the
first
quarter of
2018
. Our 2017 capital plan proposed an increase in our quarterly Common Share dividend, up to
$.12
per Common share, which the Board plans to consider for the second quarter of 2018.
Preferred Stock
We have
$525 million
of depositary shares, each representing a 1/25
th
ownership interest in a share of our Fixed-to-Floating Rate Perpetual Noncumulative Series D Preferred Stock outstanding at
March 31, 2018
, and
December 31, 2017
. Our Series D Preferred Stock has a
$1
par value with a
$25,000
liquidation preference. There are
21,000
shares authorized and outstanding at
March 31, 2018
, and
December 31, 2017
. We made payments of
$12.50
per depositary share on the depositary shares related to our Series D Preferred Stock during the
first
quarter of
2018
.
We have
$500 million
of depositary shares, each representing a 1/40
th
ownership interest in a share of our Fixed-to-Floating Rate Perpetual Noncumulative Series E Preferred Stock outstanding at
March 31, 2018
, and
December 31, 2017
. Our Series E Preferred Stock has a
$1
par value with a
$1,000
liquidation preference. There are
500,000
shares authorized and outstanding at
March 31, 2018
, and
December 31, 2017
. We made payments of
$.382813
per depositary share on the depositary shares related to our Series E Preferred Stock during the
first
quarter of
2018
.
18. Line of Business Results
The specific lines of business that constitute each of the major business segments (operating segments) are described below.
Key Community Bank
Key Community Bank serves individuals and small to mid-sized businesses primarily through its
15
-state branch network.
Individuals are provided with branch-based deposit and investment products, personal finance services, and loans, including residential mortgages, home equity, credit card, and various types of installment loans. Key Community Bank offers personal property and casualty insurance, such as home, auto, renters, watercraft, and umbrella policies. Key Community Bank also purchases retail auto sales contracts via a network of auto dealerships. The auto dealerships finance the sale of automobiles as the initial lender and then assign the contracts to us pursuant to dealer agreements. In addition, financial, estate and retirement planning, asset management services, and Delaware Trust capabilities are offered to assist high net worth clients with their banking, trust, portfolio management, life insurance, charitable giving, and related needs.
Small businesses are provided with deposit, investment and credit products, and business advisory services. Mid-sized businesses are provided with products and services, some of which are delivered by Key Corporate Bank, that include commercial lending, cash management, equipment leasing, investment, insurance including commercial property and casualty as well as captive insurance and employee benefit programs, succession planning, access to capital markets, derivatives, and foreign exchange.
Key Corporate Bank
Key Corporate Bank is a full-service corporate and investment bank focused principally on serving the needs of middle market clients in
seven
industry sectors: consumer, energy, healthcare, industrial, public sector, real estate, and technology. Key Corporate Bank delivers a broad suite of banking and capital markets products to its clients, including syndicated finance, debt and equity capital markets, commercial payments, equipment finance, commercial mortgage banking, derivatives, foreign exchange, financial advisory, and public finance. Key Corporate Bank is also a significant servicer of commercial mortgage loans and a significant special servicer of CMBS. Key Corporate Bank delivers many of its product capabilities to clients of Key Community Bank.
103
Other Segments
Other Segments consists of corporate treasury, our principal investing unit, and various exit portfolios.
Reconciling Items
Total assets included under “Reconciling Items” primarily represent the unallocated portion of nonearning assets of corporate support functions. Charges related to the funding of these assets are part of net interest income and are allocated to the business segments through noninterest expense. Reconciling Items also includes intercompany eliminations and certain items that are not allocated to the business segments because they do not reflect their normal operations, including merger-related charges.
The information was derived from the internal financial reporting system that we use to monitor and manage our financial performance. GAAP guides financial accounting, but there is no authoritative guidance for “management accounting,” i.e., the way we apply judgment and experience to make reporting decisions. Consequently, the line of business results we report may not be comparable to line of business results presented by other companies.
The selected financial data are based on internal accounting policies designed to compile results on a consistent basis and in a manner that reflects the underlying economics of the businesses. In accordance with our policies:
|
•
|
Net interest income is determined by assigning a standard cost for funds used or a standard credit for funds provided based on their assumed maturity, prepayment, and/or repricing characteristics;
|
|
•
|
Indirect expenses, such as computer servicing costs and corporate overhead, are allocated based on assumptions regarding the extent that each line of business actually uses the services;
|
|
•
|
The consolidated provision for credit losses is allocated among the lines of business primarily based on their actual net loan charge-offs, adjusted periodically for loan growth and changes in risk profile. The amount of the consolidated provision is based on the methodology that we use to estimate our consolidated ALLL. This methodology is described in Note
1
(“
Summary of Significant Accounting Policies
”) under the heading “Allowance for Loan and Lease Losses” beginning on page 102 of our
2017
Form 10-K.
|
|
•
|
Income taxes are allocated based on the statutory federal income tax rate of
21%
for periods after December 31, 2017, and
35%
for periods prior to December 31, 2017. Income taxes are allocated based on a blended state income tax rate (net of the federal income tax benefit) of
2.7%
for periods after December 31, 2017, and
2.2%
for periods prior to December 31, 2017; and
|
|
•
|
Capital is assigned to each line of business based on economic equity.
|
The development and application of the methodologies that we use to allocate items among our lines of business is a dynamic process. Accordingly, financial results may be revised periodically to reflect enhanced alignment of expense base allocation drivers, changes in the risk profile of a particular business, or changes in our organizational structure.
The table on the following pages shows selected financial data for our major business segments for the
three-
month periods ended
March 31, 2018
, and
March 31, 2017
.
104
|
Three months ended March 31,
|
Key Community Bank
|
Key Corporate Bank
|
|||||||||||
|
dollars in millions
|
2018
|
|
2017
|
|
2018
|
|
2017
|
|
|||||
|
SUMMARY OF OPERATIONS
|
|||||||||||||
|
Net interest income (TE)
|
$
|
688
|
|
$
|
628
|
|
$
|
272
|
|
$
|
304
|
|
|
|
Noninterest income
|
285
|
|
277
|
|
287
|
|
274
|
|
|||||
|
Total revenue (TE)
(a)
|
973
|
|
905
|
|
559
|
|
578
|
|
|||||
|
Provision for credit losses
|
48
|
|
46
|
|
14
|
|
18
|
|
|||||
|
Depreciation and amortization expense
|
29
|
|
28
|
|
33
|
|
20
|
|
|||||
|
Other noninterest expense
|
639
|
|
597
|
|
281
|
|
284
|
|
|||||
|
Income (loss) from continuing operations before income taxes (TE)
|
257
|
|
234
|
|
231
|
|
256
|
|
|||||
|
Allocated income taxes and TE adjustments
|
61
|
|
87
|
|
24
|
|
76
|
|
|||||
|
Income (loss) from continuing operations
|
196
|
|
147
|
|
207
|
|
180
|
|
|||||
|
Income (loss) from discontinued operations, net of taxes
|
—
|
|
—
|
|
—
|
|
—
|
|
|||||
|
Net income (loss)
|
196
|
|
147
|
|
207
|
|
180
|
|
|||||
|
Less: Net income (loss) attributable to noncontrolling interests
|
—
|
|
—
|
|
—
|
|
—
|
|
|||||
|
Net income (loss) attributable to Key
|
$
|
196
|
|
$
|
147
|
|
$
|
207
|
|
$
|
180
|
|
|
|
AVERAGE BALANCES
(b)
|
|||||||||||||
|
Loans and leases
|
$
|
47,680
|
|
$
|
47,085
|
|
$
|
38,260
|
|
$
|
37,688
|
|
|
|
Total assets
(a)
|
51,681
|
|
51,063
|
|
45,549
|
|
44,124
|
|
|||||
|
Deposits
|
79,945
|
|
79,148
|
|
20,815
|
|
21,002
|
|
|||||
|
OTHER FINANCIAL DATA
|
|||||||||||||
|
Net loan charge-offs
(b)
|
$
|
42
|
|
$
|
43
|
|
$
|
11
|
|
$
|
14
|
|
|
|
Return on average allocated equity
(b)
|
16.48
|
%
|
12.56
|
%
|
29.46
|
%
|
24.94
|
%
|
|||||
|
Return on average allocated equity
|
16.48
|
|
12.56
|
|
29.46
|
|
24.94
|
|
|||||
|
Average full-time equivalent employees
(c)
|
10,988
|
|
10,804
|
|
2,543
|
|
2,384
|
|
|||||
|
(a)
|
Substantially all revenue generated by our major business segments is derived from clients that reside in the United States. Substantially all long-lived assets, including premises and equipment, capitalized software, and goodwill held by our major business segments, are located in the United States.
|
|
(b)
|
From continuing operations.
|
|
(c)
|
The number of average full-time equivalent employees was not adjusted for discontinued operations.
|
105
|
Other Segments
|
Total Segments
|
Reconciling Items
|
Key
|
|||||||||||||||||||||||
|
2018
|
|
2017
|
|
2018
|
|
2017
|
|
2018
|
|
2017
|
|
2018
|
|
2017
|
|
|||||||||||
|
$
|
(14
|
)
|
$
|
(4
|
)
|
$
|
946
|
|
$
|
928
|
|
$
|
6
|
|
$
|
1
|
|
$
|
952
|
|
$
|
929
|
|
|||
|
36
|
|
33
|
|
608
|
|
584
|
|
(7
|
)
|
(7
|
)
|
601
|
|
577
|
|
|||||||||||
|
22
|
|
29
|
|
1,554
|
|
1,512
|
|
(1
|
)
|
(6
|
)
|
1,553
|
|
1,506
|
|
|||||||||||
|
(2
|
)
|
(1
|
)
|
60
|
|
63
|
|
1
|
|
—
|
|
61
|
|
63
|
|
|||||||||||
|
1
|
|
1
|
|
63
|
|
49
|
|
40
|
|
44
|
|
103
|
|
93
|
|
|||||||||||
|
8
|
|
10
|
|
928
|
|
891
|
|
(25
|
)
|
29
|
|
903
|
|
920
|
|
|||||||||||
|
15
|
|
19
|
|
503
|
|
509
|
|
(17
|
)
|
(79
|
)
|
486
|
|
430
|
|
|||||||||||
|
(4
|
)
|
(4
|
)
|
81
|
|
159
|
|
(11
|
)
|
(54
|
)
|
70
|
|
105
|
|
|||||||||||
|
19
|
|
23
|
|
422
|
|
350
|
|
(6
|
)
|
(25
|
)
|
416
|
|
325
|
|
|||||||||||
|
—
|
|
—
|
|
—
|
|
—
|
|
2
|
|
—
|
|
2
|
|
—
|
|
|||||||||||
|
19
|
|
23
|
|
422
|
|
350
|
|
(4
|
)
|
(25
|
)
|
418
|
|
325
|
|
|||||||||||
|
—
|
|
2
|
|
—
|
|
2
|
|
—
|
|
(1
|
)
|
—
|
|
1
|
|
|||||||||||
|
$
|
19
|
|
$
|
21
|
|
$
|
422
|
|
$
|
348
|
|
$
|
(4
|
)
|
$
|
(24
|
)
|
$
|
418
|
|
$
|
324
|
|
|||
|
$
|
993
|
|
$
|
1,328
|
|
$
|
86,933
|
|
$
|
86,101
|
|
$
|
(6
|
)
|
$
|
32
|
|
$
|
86,927
|
|
$
|
86,133
|
|
|||
|
37,253
|
|
36,549
|
|
134,483
|
|
131,736
|
|
432
|
|
1,005
|
|
134,915
|
|
132,741
|
|
|||||||||||
|
1,718
|
|
2,030
|
|
102,478
|
|
102,180
|
|
78
|
|
(102
|
)
|
102,556
|
|
102,078
|
|
|||||||||||
|
1
|
|
$
|
1
|
|
$
|
54
|
|
$
|
58
|
|
—
|
|
—
|
|
$
|
54
|
|
$
|
58
|
|
||||||
|
59.27
|
%
|
55.66
|
%
|
21.94
|
%
|
18.04
|
%
|
(.34
|
)%
|
(1.32
|
)%
|
11.33
|
%
|
8.65
|
%
|
|||||||||||
|
59.27
|
|
55.66
|
|
21.94
|
|
18.04
|
|
(.23
|
)
|
(1.32
|
)
|
11.39
|
|
8.65
|
|
|||||||||||
|
2
|
|
3
|
|
13,533
|
|
13,191
|
|
5,007
|
|
5,195
|
|
18,540
|
|
18,386
|
|
|||||||||||
19. Revenue from Contracts with Customers
The following table represents a disaggregation of revenue from contracts with customers, by line of business, for the
three
-month period ended
March 31, 2018
:
|
Three months ended March 31, 2018
|
|||||||||
|
dollars in millions
|
Key Community Bank
|
Key Corporate Bank
|
Total Contract Revenue
|
||||||
|
NONINTEREST INCOME
|
|||||||||
|
Trust and investment services income
|
$
|
103
|
|
$
|
16
|
|
$
|
119
|
|
|
Investment banking and debt placement fees
|
—
|
|
47
|
|
47
|
|
|||
|
Services charges on deposit accounts
|
76
|
|
13
|
|
89
|
|
|||
|
Cards and payments income
|
34
|
|
26
|
|
60
|
|
|||
|
Other noninterest income
|
5
|
|
—
|
|
5
|
|
|||
|
Total revenue from contracts with customers
|
$
|
218
|
|
$
|
102
|
|
$
|
320
|
|
|
Other noninterest income
(a)
|
$
|
252
|
|
||||||
|
Noninterest income from other segments
(b)
|
36
|
|
|||||||
|
Reconciling items
(c)
|
(7
|
)
|
|||||||
|
Total noninterest income
|
$
|
601
|
|
||||||
|
(a)
|
Noninterest income considered earned outside the scope of contracts with customers.
|
|
(b)
|
Other Segments consist of corporate treasury, our principle investing unit, and various exit portfolios.
|
|
(c)
|
Reconciling items include intercompany eliminations and certain items that are not allocated to the business segments. Refer to the Line of Business Results footnote for more information.
|
We have no material contract assets or contract liabilities for the
three
-month period ended
March 31, 2018
.
106
Report of Ernst & Young LLP, Independent Registered Public Accounting Firm
To the Shareholders and Board of Directors of KeyCorp
Results of Review of Interim Financial Statements
We have reviewed the accompanying consolidated balance sheet of KeyCorp as of March 31, 2018, the related consolidated statements of income, comprehensive income, changes in equity and cash flows for the three-month periods ended March 31, 2018 and 2017, and the related notes (collectively referred to as the “ consolidated interim financial statements”). Based on our reviews, we are not aware of any material modifications that should be made to the consolidated interim financial statements for them to be in conformity with U.S. generally accepted accounting principles.
We have previously audited, in accordance with the standards of the Public Company Accounting Oversight Board (United States) (PCAOB), the consolidated balance sheet of KeyCorp as of December 31, 2017, and the related consolidated statements of income, comprehensive income, changes in equity and cash flows for the year then ended, and the related notes (not presented herein); and in our report dated February 26, 2018, we expressed an unqualified opinion on those consolidated financial statements. In our opinion, the information set forth in the accompanying consolidated balance sheet as of December 31, 2017 is fairly stated, in all material respects, in relation to the consolidated balance sheet from which it has been derived.
Basis for Review Results
These financial statements are the responsibility of the Company's management. We are a public accounting firm registered with the PCAOB and are required to be independent with respect to KeyCorp in accordance with the U.S. federal securities laws and the applicable rules and regulations of the SEC and the PCAOB. We conducted our review in accordance with the standards of the PCAOB. A review of interim financial statements consists principally of applying analytical procedures and making inquiries of persons responsible for financial and accounting matters. It is substantially less in scope than an audit conducted in accordance with the standards of the PCAOB, the objective of which is the expression of an opinion regarding the financial statements taken as a whole. Accordingly, we do not express such an opinion.

|
|
|
Cleveland, Ohio
|
Ernst & Young LLP
|
|
May 3, 2018
|
|
107
|
Item 3.
|
Quantitative and Qualitative Disclosure about Market Risk
|
The information presented in the “Market risk management” section of the Management’s Discussion & Analysis of Financial Condition & Results of Operations is incorporated herein by reference.
|
Item 4.
|
Controls and Procedures
|
As of the end of the period covered by this report, KeyCorp carried out an evaluation, under the supervision and with the participation of KeyCorp’s management, including our Chief Executive Officer and Chief Financial Officer, of the effectiveness of the design and operation of KeyCorp’s disclosure controls and procedures (as defined in Rule 13a-15(e) under the Securities Exchange Act of 1934 (the “Exchange Act”), to ensure that information required to be disclosed by KeyCorp in reports that it files or submits under the Exchange Act, is recorded, processed, summarized and reported within the time periods specified in the SEC’s rules and forms, and that such information is accumulated and communicated to KeyCorp’s management, including its Chief Executive Officer and Chief Financial Officer, as appropriate, to allow for timely decisions regarding required disclosure. Based upon that evaluation, KeyCorp’s Chief Executive Officer and Chief Financial Officer concluded that the design and operation of these disclosure controls and procedures were effective, in all material respects, as of the end of the period covered by this report.
No changes were made to KeyCorp’s internal control over financial reporting (as defined in Rule 13a-15(f) under
the Exchange Act) during the last fiscal year that materially affected, or are reasonably likely to materially affect,
KeyCorp’s internal control over financial reporting. We implemented internal controls to ensure we adequately evaluated our contracts and properly assessed the impact of the new accounting standards related to revenue recognition on our financial statements to facilitate its adoption on January 1, 2018. There were no significant changes to our internal control over financial reporting due to the adoption of the new standard.
|
Item 1.
|
Legal Proceedings
|
The information presented in the Legal Proceedings section of Note
15
(“
Contingent Liabilities and Guarantees
”) of the Notes to Consolidated Financial Statements (Unaudited) is incorporated herein by reference.
On at least a quarterly basis, we assess our liabilities and contingencies in connection with outstanding legal proceedings utilizing the latest information available. Where it is probable that we will incur a loss and the amount of the loss can be reasonably estimated, we record a liability in our consolidated financial statements. These legal reserves may be increased or decreased to reflect any relevant developments on a quarterly basis. Where a loss is not probable or the amount of the loss is not estimable, we have not accrued legal reserves, consistent with applicable accounting guidance. Based on information currently available to us, advice of counsel, and available insurance coverage, we believe that our established reserves are adequate and the liabilities arising from the legal proceedings will not have a material adverse effect on our consolidated financial condition. We note, however, that in light of the inherent uncertainty in legal proceedings there can be no assurance that the ultimate resolution will not exceed established reserves. As a result, the outcome of a particular matter or a combination of matters may be material to our results of operations for a particular period, depending upon the size of the loss or our income for that particular period.
|
Item 1A.
|
Risk Factors
|
For a discussion of certain risk factors affecting us, see the section titled “Supervision and Regulation” in Part I, Item 1. Business, on pages 8-20 of our
2017
Form 10-K; Part I, Item 1A. Risk Factors, on pages 20-29 of our
2017
Form 10-K; the section titled “Supervision and regulation” in this Form 10-Q; and our disclosure regarding forward-looking statements in this Form 10-Q.
|
Item 2.
|
Unregistered Sales of Equity Securities and Use of Proceeds
|
From time to time, KeyCorp or its principal subsidiary, KeyBank, may seek to retire, repurchase, or exchange outstanding debt of KeyCorp or KeyBank, and capital securities or preferred stock of KeyCorp, through cash purchase, privately negotiated transactions, or otherwise. Such transactions, if any, depend on prevailing market
108
conditions, our liquidity and capital requirements, contractual restrictions, and other factors. The amounts involved may be material.
In April 2017, we submitted to the Federal Reserve and provided to the OCC our 2017 capital plan under the annual CCAR process. On June 28, 2017, the Federal Reserve announced that it did not object to our 2017 capital plan. Share repurchases of up to
$800 million
were included in the 2017 capital plan, which is effective from the third quarter of 2017 through the second quarter of 2018.
We completed
$199 million
of Common Share repurchases, including
$156 million
of Common Share repurchases in the open market and
$43 million
of Common Share repurchases related to employee equity compensation programs, in the
first
quarter of
2018
under our
2018
capital plan authorization.
The following table summarizes our repurchases of our common shares for the three months ended
March 31, 2018
.
|
Calendar month
|
Total number of shares
purchased (a) |
Average price paid
per share
|
Total number of shares purchased as
part of publicly announced plans or
programs
|
Maximum number of shares that may
yet be purchased as part of publicly
announced plans or programs
(b)
|
|||||||
|
January 1-31
|
3,376,647
|
|
21.62
|
|
3,376,647
|
|
11,733,598
|
|
|||
|
February 1-28
|
6,007,957
|
|
20.98
|
|
6,007,957
|
|
5,918,420
|
|
|||
|
March 1-31
|
14,968
|
|
19.93
|
|
14,968
|
|
6,381,476
|
|
|||
|
Total
|
9,399,572
|
|
21.21
|
|
9,399,572
|
|
|||||
|
(a)
|
Includes common shares deemed surrendered by employees in connection with our stock compensation and benefit plans to satisfy tax obligations.
|
|
(b)
|
Calculated using the remaining general repurchase amount divided by the closing price of KeyCorp common shares as follows: on January 31, 2018 at
$21.40
; on February 28, 2018, at
$21.13
; and on March 31, 2018, at
$19.55
.
|
|
101
|
The following materials from KeyCorp’s Form 10-Q Report for the quarterly period ended March 31, 2018, formatted in XBRL: (i) the Consolidated Balance Sheets, (ii) the Consolidated Statements of Income and Consolidated Statements of Comprehensive Income; (iii) the Consolidated Statements of Changes in Equity; (iv) the Consolidated Statements of Cash Flows; and (v) the Notes to Consolidated Financial Statements.
|
|
*
|
Furnished herewith.
|
Information Available on Website
KeyCorp makes available free of charge on its website,
www.key.com
, its
2017
Form 10-K, quarterly reports on Form 10-Q, current reports on Form 8-K, and amendments to these reports as soon as reasonably practicable after KeyCorp electronically files such material with, or furnishes it to, the SEC. We also make available a summary of filings made with the SEC of statements of beneficial ownership of our equity securities filed by our directors and officers under Section 16 of the Exchange Act. The “Regulatory Disclosures and Filings” tab of the investor relations section of our website includes public disclosures concerning our annual and mid-year stress-testing activities under the Dodd-Frank Act. Information contained on or accessible through our website or any other website referenced in this report is not part of this report.
109
SIGNATURE
Pursuant to the requirements of the Securities Exchange Act of 1934, the Registrant has duly caused this report to be signed on its behalf by the undersigned, thereunto duly authorized, on the date indicated.
|
KEYCORP
|
|
|
(Registrant)
|
|
|
Date: May 3, 2018
|
/s/ Douglas M. Schosser
|
|
By: Douglas M. Schosser
|
|
|
Chief Accounting Officer
(Principal Accounting Officer)
|
|
110
TABLE OF CONTENTS
Part I. Financial InformationItem 2. Management S Discussion & Analysis Of Financial Condition & Results Of OperationsItem Is Included in The 10%/15% Exceptions Bucket Calculation and Is Risk-weighted At 250%Item 1. Financial StatementsItem 3. Quantitative and Qualitative Disclosure About Market RiskItem 4. Controls and ProceduresPart II. Other InformationItem 1. Legal ProceedingsItem 1A. Risk FactorsItem 2. Unregistered Sales Of Equity Securities and Use Of ProceedsItem 6. Exhibits