KRAFT HEINZ CO
10-Ks and 10-Qs
|
|
|
|
|
|
|
|
|
|
|
|
|
|
|
|
|
|
|
|
|
|
|
|
|
|
|
|
|
|
|
|
|
|
|
|
|
|
UNITED STATES
SECURITIES AND EXCHANGE COMMISSION
WASHINGTON, D.C. 20549
FORM 10-K
(Mark One)
|
x
|
|
ANNUAL REPORT PURSUANT TO SECTION 13 OR 15(d) OF THE SECURITIES EXCHANGE ACT OF 1934
|
For the fiscal year ended
December 29, 2018
or
|
o
|
|
TRANSITION REPORT PURSUANT TO SECTION 13 OR 15(d) OF THE SECURITIES EXCHANGE ACT OF 1934
|
For the transition period from __________ to __________
Commission File Number 001-37482

The Kraft Heinz Company
(Exact name of registrant as specified in its charter)
|
Delaware
(State or other jurisdiction of incorporation or organization)
|
|
46-2078182
(I.R.S. Employer Identification No.)
|
|
One PPG Place, Pittsburgh, Pennsylvania
(Address of Principal Executive Offices)
|
|
15222
(Zip Code)
|
Registrant’s telephone number, including area code:
(412) 456-5700
Securities registered pursuant to Section 12(b) of the Act:
|
Title of each class
|
Trading Symbol
|
Name of exchange on which registered
|
|
Common stock, $0.01 par value
|
KHC
|
The Nasdaq Stock Market LLC
|
Securities registered pursuant to Section 12(g) of the Act:
None.
Indicate by check mark if the registrant is a well-known seasoned issuer, as defined in Rule 405 of the Securities Act. Yes
o
No
x
Indicate by check mark if the registrant is not required to file reports pursuant to Section 13 or Section 15(d) of the Act. Yes
o
No
x
Indicate by check mark whether the registrant (1) has filed all reports required to be filed by Section 13 or 15(d) of the Securities Exchange Act of 1934 during the preceding 12 months (or for such shorter period that the registrant was required to file such reports), and (2) has been subject to such filing requirements for the past 90 days. Yes
o
No
x
Indicate by check mark whether the registrant has submitted electronically every Interactive Data File required to be submitted pursuant to Rule 405 of Regulation S-T (§ 232.405 of this chapter) during the preceding 12 months (or for such shorter period that the registrant was required to submit such files). Yes
o
No
x
Indicate by check mark whether the registrant is a large accelerated filer, an accelerated filer, a non-accelerated filer, a smaller reporting company, or an emerging growth company. See the definitions of “large accelerated filer,” “accelerated filer,” “smaller reporting company,” and “emerging growth company” in Rule 12b-2 of the Exchange Act.
|
Large accelerated filer
x
|
Accelerated filer
o
|
|
|
Non-accelerated filer
o
|
Smaller reporting company
o
|
Emerging growth company
o
|
If an emerging growth company, indicate by check mark if the registrant has elected not to use the extended transition period for complying with any new or revised financial accounting standards provided pursuant to Section 13(a) of the Exchange Act.
o
Indicate by check mark whether the registrant is a shell company (as defined in Rule 12b-2 of the Exchange Act). Yes
o
No
x
The aggregate market value of the shares of common stock held by non-affiliates of the registrant, computed by reference to the closing price of such stock as of the last business day of the registrant’s most recently completed second quarter, was
$38 billion
. As of
June 5, 2019
, there were
1,219,938,804
shares of the registrant’s common stock outstanding.
Table of Contents
1
Unless the context otherwise requires, the terms “we,” “us,” “our,” “Kraft Heinz,” and the “Company” each refer to The Kraft Heinz Company and all of its consolidated subsidiaries.
2
Forward-Looking Statements
This Annual Report on Form 10-K contains a number of forward-looking statements. Words such as “anticipate,” “reflect,” “invest,” “see,” “make,” “expect,” “give,” “deliver,” “drive,” “believe,” “improve,” “assess,” “reassess,” “remain,” “evaluate,” “grow,” “will,” “plan,” and variations of such words and similar future or conditional expressions are intended to identify forward-looking statements. These forward-looking statements include, but are not limited to, statements regarding our plans, impacts of accounting standards and guidance, growth, legal matters, taxes, costs and cost savings, impairments, and dividends. These forward-looking statements are not guarantees of future performance and are subject to a number of risks and uncertainties, many of which are difficult to predict and beyond our control.
Important factors that may affect our business and operations and that may cause actual results to differ materially from those in the forward-looking statements include, but are not limited to, operating in a highly competitive industry; our ability to correctly predict, identify, and interpret changes in consumer preferences and demand, to offer new products to meet those changes, and to respond to competitive innovation; changes in the retail landscape or the loss of key retail customers; changes in our relationships with significant customers, suppliers, and other business relationships; our ability to maintain, extend, and expand our reputation and brand image; our ability to leverage our brand value to compete against private label products; our ability to drive revenue growth in our key product categories, increase our market share, or add products that are in faster-growing and more profitable categories; product recalls or product liability claims; unanticipated business disruptions; our ability to identify, complete, or realize the benefits from strategic acquisitions, alliances, divestitures, joint ventures, or other investments; our ability to realize the anticipated benefits from prior or future streamlining actions to reduce fixed costs, simplify or improve processes, and improve our competitiveness; our ability to successfully execute our strategic initiatives; the impacts of our international operations; economic and political conditions in the United States and in various other nations where we do business; changes in our management team or other key personnel and our ability to hire or retain key personnel or a highly skilled and diverse global workforce; risks associated with information technology and systems, including service interruptions, misappropriation of data, or breaches of security; impacts of natural events in the locations in which we or our customers, suppliers, distributors, or regulators operate; our ownership structure; our indebtedness and ability to pay such indebtedness; additional impairments of the carrying amounts of goodwill or other indefinite-lived intangible assets; exchange rate fluctuations; volatility in commodity, energy, and other input costs; volatility in the market value of all or a portion of the derivatives we use; increased pension, labor and people-related expenses; compliance with laws, regulations, and related interpretations and related legal claims or other regulatory enforcement actions, including additional risks and uncertainties related to our restatement and any potential actions resulting from the Securities and Exchange Commission’s ongoing investigation, as well as potential additional subpoenas, litigation, and regulatory proceedings; an inability to remediate the material weaknesses in our internal control over financial reporting or additional material weaknesses or other deficiencies in the future or the failure to maintain an effective system of internal controls; our failure to prepare and timely file our periodic reports; the restatement of certain of our previously issued consolidated financial statements, which resulted in unanticipated costs and may affect investor confidence and raise reputational issues; our ability to protect intellectual property rights; tax law changes or interpretations; the impact of future sales of our common stock in the public markets; our ability to continue to pay a regular dividend and the amounts of any such dividends; volatility of capital markets and other macroeconomic factors. For additional information on these and other factors that could affect our forward-looking statements, see Item 1A,
Risk Factors
. We disclaim and do not undertake any obligation to update or revise any forward-looking statement in this report, except as required by applicable law or regulation.
3
Explanatory Note
General
On May 2, 2019, management, in consultation with the Audit Committee of our Board of Directors, concluded that our audited consolidated financial statements and related disclosures for the fiscal years ended December 30, 2017 and December 31, 2016 included in our Annual Reports on Form 10-K, and each of our unaudited condensed consolidated financial statements for the quarterly and year-to-date periods in fiscal year 2017 and each of our unaudited condensed consolidated financial statements for the quarterly and year-to-date periods for the nine months ended September 29, 2018 included in our Quarterly Reports on Form 10-Q (unaudited condensed consolidated financial statements for the quarterly periods ended September 29, 2018, June 30, 2018, March 31, 2018, and September 30, 2017) and Form 10-Q/A (unaudited condensed consolidated financial statements for the quarterly periods ended July 1, 2017 and April 1, 2017) should no longer be relied upon due to misstatements that are described in greater detail below, and that we would restate such financial statements to make the necessary accounting corrections. We discussed this conclusion with our independent registered public accounting firm, PricewaterhouseCoopers LLP.
Restatement
This Annual Report on Form 10-K for the year ended December 29, 2018 includes audited consolidated financial statements at December 29, 2018 and December 30, 2017 and for the years ended December 29, 2018, December 30, 2017, and December 31, 2016, as well as relevant unaudited interim financial information for the quarterly periods ended December 29, 2018, September 29, 2018, June 30, 2018, March 31, 2018, December 30, 2017, September 30, 2017, July 1, 2017, and April 1, 2017. We have restated certain information within this Annual Report on Form 10-K, including our consolidated financial statements at December 30, 2017 and for the years ended December 30, 2017 and December 31, 2016, selected financial data at and for the year ended January 3, 2016, and the relevant unaudited interim financial information for the quarterly periods ended September 29, 2018, June 30, 2018, March 31, 2018, December 30, 2017, September 30, 2017, July 1, 2017, and April 1, 2017 (collectively known as the “Financial Statements”).
Restatement Background
As described in our Current Report on Form 8-K filed with the Securities and Exchange Commission (“SEC”) on May 6, 2019, management noted certain misstatements contained in the Financial Statements relating principally to the accounting treatment for supplier contracts and related arrangements. As previously disclosed, we received a subpoena from the SEC in October 2018
related to our procurement area, specifically the accounting policies, procedures, and internal controls related to our procurement function, including, but not limited to, agreements, side agreements, and changes or modifications to agreements with our suppliers. Following the receipt of this subpoena, we, together with external counsel and forensic accountants, and subsequently, under the oversight of the Audit Committee of our Board of Directors (the “Audit Committee”), conducted an internal investigation into the procurement area and related matters. As a result of the findings from this internal investigation, which is now complete and which identified that multiple employees in the procurement area engaged in misconduct, we corrected prior period misstatements that generally increased the total cost of products sold in prior financial periods. These misstatements principally related to the incorrect timing of when certain cost and rebate elements associated with supplier contracts and related arrangements were initially recognized.
The findings from the internal investigation did not identify any misconduct by any member of the senior management team. We continue to cooperate with the SEC concerning its investigation of these matters.
In connection with the internal investigation, we also conducted a comprehensive review of supplier contracts and related arrangements to identify other potential misstatements in the timing of the recognition of supplier rebates, incentive payments, and pricing arrangements. The review identified further misstatements, which we also investigated and have been unable to conclude if they resulted from the misconduct described above.
These misstatements were primarily related to certain supplier contracts and related arrangements where the allocation of value of all or a portion of rebates and up-front payments to contractual elements in the current period should have been deferred and recognized over an applicable contractual period. We corrected these misstatements to defer the up-front consideration from suppliers when the retention or receipt of that consideration was contingent upon future events and to correctly recognize the consideration as a reduction of cost of products sold over the terms of the arrangements with the suppliers.
4
Our internal investigation and review identified adjustments that resulted in an understatement of cost of products sold totaling
$208 million
, including
$175 million
relating to the periods up through September 29, 2018 that are being restated in this Annual Report on Form 10-K.
The misstatements of cost of products sold related to our internal investigation and review included
$22 million
for fiscal year 2018,
$94 million
for fiscal year 2017,
$35 million
for fiscal year 2016, and
$24 million
for fiscal year 2015.
We do not believe that the misstatements are quantitatively material to any period presented in our prior financial statements. However, due to the qualitative nature of the matters identified in our internal investigation, including the number of years over which the misconduct occurred and the number of transactions, suppliers, and procurement employees involved, we determined that it would be appropriate to correct the misstatements in our previously issued consolidated financial statements by restating such financial statements. The restatement also included corrections for additional identified out-of-period and uncorrected misstatements in the impacted periods.
Accordingly, we have restated our consolidated financial statements and the impacted amounts within the accompanying footnotes thereto.
In addition, the statements of income for fiscal years 2017 and 2016, as previously reported, did not originally reflect the adoption of accounting standards update (“ASU”) 2017-07 related to the presentation of net periodic benefit cost (pension and postretirement cost). This ASU was adopted in the first quarter of 2018 and was applied retrospectively for statement of income presentation of service cost components and other net periodic benefit cost components. The restated statements of income for fiscal years 2017 and 2016 reflect the retrospective application of ASU 2017-07 and are labeled “As Recast.”
Restatement of Previously Issued Consolidated Financial Statements
This Annual Report on Form 10-K restates amounts included in the 2017 Annual Report described above, including the audited consolidated financial statements at December 30, 2017 and for the fiscal years ended December 30, 2017 and December 31, 2016.
In addition to the misstatements related to the supplier contracts and related arrangements, including the misstatements related to lease classification
, we corrected additional identified out-of-period and uncorrected misstatements that were not material, individually or in the aggregate, to our consolidated financial statements.
These misstatements were related to customer incentive program expense misclassifications, balance sheet misclassifications, income taxes, impairments, and other misstatements
.
See Note 2
, Restatement of Previously Issued Consolidated Financial Statements
, in
Item 8,
Financial Statements and Supplementary Data
, for additional information.
The relevant unaudited interim financial information for the quarterly periods ended September 29, 2018, June 30, 2018, March 31, 2018, December 30, 2017, September 30, 2017, July 1, 2017, and April 1, 2017, has also been restated.
The 2018 quarterly restatements will be effective with the filing of our future 2019 unaudited interim condensed consolidated financial statement filings in Quarterly Reports on Form 10-Q.
See Note 23,
Quarterly Financial Information (Unaudited)
, in
Item 8,
Financial Statements and Supplementary Data
, for such restated information, and see
Supplemental Unaudited Quarterly Financial Information
, in Item 7,
Management’s Discussion and Analysis of Financial Condition and Results of Operations
, for additional interim financial information.
Selected financial information for the fiscal year ended January 3, 2016 has also been restated. See Item 6,
Selected Financial Data
.
This restatement resulted in the following decreases to our results:
|
For the Nine Months Ended
|
For the Year Ended
|
||||||||||
|
September 29,
2018
|
December 30,
2017 |
December 31,
2016 |
|||||||||
|
(in millions, except per share data)
|
|||||||||||
|
Net income
|
$
|
(2
|
)
|
$
|
(58
|
)
|
$
|
(36
|
)
|
||
|
Adjusted EBITDA
(a)
|
(35
|
)
|
(106
|
)
|
(79
|
)
|
|||||
|
Diluted earnings per common share
|
—
|
|
(0.04
|
)
|
(0.03
|
)
|
|||||
|
Adjusted EPS
(a)
|
(0.01
|
)
|
(0.05
|
)
|
(0.02
|
)
|
|||||
|
(a)
|
Adjusted EBITDA and Adjusted EPS are non-GAAP financial measures. See the
Non-GAAP Financial Measures
section within Item 7,
Management’s Discussion and Analysis of Financial Condition and Results of Operations
, for the related definitions and reconciliations.
|
5
Control Considerations
In connection with the restatement, management has assessed the effectiveness of our internal control over financial reporting. Based on this assessment, management identified material weaknesses in our internal control over financial reporting resulting in the conclusion by our Chief Executive Officer and Chief Financial Officer that our disclosure controls and procedures were not effective as of December 29, 2018. Management has taken and is taking additional steps to remediate the material weaknesses in our internal control over financial reporting. See Item 9A,
Controls and Procedures
, for additional information related to these material weaknesses in internal control over financial reporting and the related remedial measures.
Additional Information Specific to Goodwill and Indefinite-Lived Intangible Asset Impairment
We announced on February 21, 2019 that as part of our normal quarterly reporting procedures and planning processes for the fourth quarter of 2018, the fair values of certain goodwill and intangible assets were below their carrying amounts. As a result, we announced non-cash impairment losses of $15.4 billion to lower the carrying amount of goodwill in certain reporting units, primarily U.S. Refrigerated and Canada Retail, and certain intangible assets, primarily the Kraft and Oscar Mayer brands. As disclosed in our Current Report on Form 8-K filed with the SEC on May 6, 2019, we subsequently identified errors in the calculations performed in connection with the interim goodwill and indefinite-lived intangible asset impairment testing in the fourth quarter of 2018. Specifically, we identified certain errors in projected net cash flows and allocations to certain brands. Correcting this allocation error resulted in an increase to the impairment losses initially calculated for brands of approximately $278 million, partially offset by a reduction to the impairment losses initially calculated for reporting units of approximately $171 million.
In addition, the corrections to the carrying values on our balance sheet at December 29, 2018 recorded as part of the correction of the procurement-related misstatements described above resulted in an adjustment to the carrying amounts of certain reporting units, and therefore resulted in a reduction to goodwill impairment losses of approximately $92 million. The net impact of these misstatements was an increase of approximately $15 million from the $15.4 billion total impairment losses in the fourth quarter of 2018 previously announced in our earnings release and investor call on February 21, 2019.
As discussed in Item 9A,
Controls and Procedures
, of this Annual Report on Form 10-K, we did not design and maintain effective controls to reassess the level of precision used to review the allocation of cash flow projections to certain brands used as a basis for performing our fourth quarter 2018 interim impairment assessments in response to the significant reduction in, and in certain instances elimination of, the excess fair value over carrying amount for certain brands that resulted from the changing business environment. This material weakness resulted in the errors in the calculations performed in connection with the interim goodwill and indefinite-lived intangible asset impairment testing in the fourth quarter of 2018, as described above, because approximately five to ten percent of cash flows were not subjected to our control procedures. This material weakness arose during our interim impairment testing in the fourth quarter of 2018 due to the significant reduction in excess fair value over carrying amount for certain brands as noted above, which required us to increase the percentage of cash flows subject to our control procedures to nearly one hundred percent. This did not result in a misstatement of any previously reported consolidated financial statements but was determined to be a material weakness because it could have resulted in a material misstatement that would not have been prevented or detected.
PART I
Item 1. Business.
General
For 150 years, we have produced some of the world’s most beloved products at The Kraft Heinz Company (Nasdaq: KHC). Our Vision is
To Be the Best Food Company, Growing a Better World
. We are one of the largest global food and beverage companies, with 2018 net sales of approximately
$26 billion
. Our portfolio is a diverse mix of iconic and emerging brands. As the guardians of these brands and the creators of innovative new products, we are dedicated to the sustainable health of our people and our planet.
On July 2, 2015
, through a series of transactions, we consummated the merger of Kraft Foods Group, Inc. (“Kraft”) with and into a wholly-owned subsidiary of H.J. Heinz Holding Corporation (“Heinz”) (the “2015 Merger”). At the closing of the 2015 Merger, Heinz was renamed The Kraft Heinz Company
, and H. J. Heinz Company changed its name to Kraft Heinz Foods Company.
Before the consummation of the 2015 Merger, Heinz was controlled by Berkshire Hathaway Inc. (“Berkshire Hathaway”) and 3G Global Food Holdings, L.P.
(“3G Capital”) (together, the “Sponsors”)
, following their acquisition of H. J. Heinz Company on June 7, 2013.
6
Reportable Segments
We manage and report our operating results through
four
segments. We have
three
reportable segments defined by geographic region: United States, Canada, and
Europe, Middle East, and Africa (“EMEA”)
. Our remaining businesses are combined and disclosed as “Rest of World.” Rest of World comprises
two
operating segments: Latin America and
Asia Pacific (“APAC”).
Our segments reflect a change, effective in the first quarter of our fiscal year 2018, to reorganize our international businesses to better align our global geographies. We moved our Middle East and Africa businesses from the historical
Asia Pacific, Middle East, and Africa (“AMEA”)
operating segment into the historical Europe reportable segment, forming the new
EMEA
reportable segment. The remaining businesses from the
AMEA
operating segment became the
APAC
operating segment. We have reflected this change in all historical periods presented.
See Note 22,
Segment Reporting
, in Item 8,
Financial Statements and Supplementary Data
, for our geographic financial information by segment.
Trademarks and Intellectual Property
Our trademarks are material to our business and are among our most valuable assets. Depending on the country, trademarks generally remain valid for as long as they are in use or their registration status is maintained. Trademark registrations generally are for renewable, fixed terms. Significant trademarks by segment based on net sales in 2018 were:
|
Majority Owned and Licensed Trademarks
|
||
|
United States
|
Kraft, Oscar Mayer, Heinz, Philadelphia, Lunchables, Velveeta, Planters, Maxwell House, Capri Sun*, Ore-Ida, Kool-Aid, Jell-O
|
|
|
Canada
|
Kraft, Cracker Barrel, Heinz, Philadelphia, Maxwell House, Classico, McCafe*, P’Tit Quebec, Tassimo*
|
|
|
EMEA
|
Heinz, Plasmon, Pudliszki, Honig, HP, Kraft, Benedicta, Karvan Cevitam
|
|
|
Rest of World
|
Heinz, ABC, Master, Quero, Kraft, Golden Circle, Wattie's, Glucon-D, Complan
|
|
*Used under license. Additionally, our license to use the
McCafe
brand in Canada will expire in December 2019.
In the fourth quarter of 2018, we announced our plans to divest certain assets and operations, predominantly in Canada and India,
including the intellectual property rights to
Cracker Barrel
and
P’Tit Quebec
in Canada, as well as
Glucon-D
and
Complan
globally
. See Note 5,
Acquisitions and Divestitures
, in Item 8,
Financial Statements and Supplementary Data
, for additional information on these transactions.
We sell certain products under brands we license from third parties. In 2018, brands used under licenses from third parties included
Capri Sun
packaged drink pouches for sale in the United States,
TGI Fridays
frozen snacks and appetizers in the United States and Canada
, McCafe
ground, whole bean, and on-demand single cup coffees in the United States and Canada
,
and
Taco Bell Home Originals
Mexican-style food products in U.S. grocery stores. In addition, in our agreements with Mondelēz International, Inc. (“Mondelēz International”) following the spin-off of Kraft from Mondelēz International in 2012, we each granted the other party various licenses to use certain of our and their respective intellectual property rights in named jurisdictions for certain periods of time.
We also own numerous patents worldwide. We consider our portfolio of patents, patent applications, patent licenses under patents owned by third parties, proprietary trade secrets, technology, know-how processes, and related intellectual property rights to be material to our operations. Patents, issued or applied for, cover inventions ranging from packaging techniques to processes relating to specific products and to the products themselves. While our patent portfolio is material to our business, the loss of one patent or a group of related patents would not have a material adverse effect on our business.
Our issued patents extend for varying periods according to the date of the patent application filing or grant and the legal term of patents in the various countries where patent protection is obtained. The actual protection afforded by a patent, which can vary from country to country, depends upon the type of patent, the scope of its coverage as determined by the patent office or courts in the country, and the availability of legal remedies in the country.
7
Research and Development
Our research and development focuses on achieving the following four objectives:
|
•
|
product innovations, renovations, and new technologies to meet changing consumer needs and drive growth;
|
|
•
|
world-class and uncompromising food safety, quality, and consistency;
|
|
•
|
superior, customer-preferred product and package performance; and
|
|
•
|
continuous process improvement and product optimization in pursuit of cost reductions.
|
Competition
Our products are sold in highly competitive marketplaces, which have experienced increased concentration and the growing presence of e-commerce retailers, large-format retailers, and discounters. Competitors include large national and international food and beverage companies and numerous local and regional companies. We compete with both branded and private label products sold by retailers, wholesalers, and cooperatives. We compete on the basis of product quality and innovation, brand recognition and loyalty, service, the ability to identify and satisfy consumer preferences, the introduction of new products and the effectiveness of our advertising campaigns and marketing programs, distribution, shelf space, merchandising support, and price. Improving our market position or introducing new products requires substantial advertising and promotional expenditures.
Sales and Customers
Our products are sold through our own sales organizations and through independent brokers, agents, and distributors to chain, wholesale, cooperative and independent grocery accounts, convenience stores, drug stores, value stores, bakeries, pharmacies, mass merchants, club stores, foodservice distributors, and institutions, including hotels, restaurants, hospitals, health care facilities, and certain government agencies. Our products are also sold online through various e-commerce platforms and retailers. Our largest customer, Walmart Inc., represented approximately
21%
of our net sales in 2018, approximately
21%
of our net sales in 2017, and approximately
22%
of our net sales in 2016.
Additionally, we have significant customers in different regions around the world; however, none of these customers are individually material to our consolidated business. In 2018, the five largest customers in our U.S. segment accounted for approximately 49% of U.S. segment net sales, the five largest customers in our Canada segment accounted for approximately 71% of Canada segment net sales, and the five largest customers in our EMEA segment accounted for approximately 26% of our EMEA segment net sales.
Net Sales by Product Category
In 2018, we reorganized the products within our product categories to reflect how we manage our business. We have reflected this change for all historical periods presented. The product categories that contributed 10% or more to consolidated net sales in any of the periods presented were:
|
December 29,
2018 |
December 30,
2017 |
December 31,
2016 |
||||||
|
Condiments and sauces
|
26
|
%
|
25
|
%
|
24
|
%
|
||
|
Cheese and dairy
|
20
|
%
|
21
|
%
|
21
|
%
|
||
|
Ambient foods
|
10
|
%
|
10
|
%
|
9
|
%
|
||
|
Frozen and chilled foods
|
10
|
%
|
10
|
%
|
10
|
%
|
||
|
Meats and seafood
|
10
|
%
|
10
|
%
|
10
|
%
|
||
8
Raw Materials and Packaging
We manufacture (and contract for the manufacture of) our products from a wide variety of raw materials. We purchase and use large quantities of commodities, including dairy products, meat products, coffee beans, nuts, tomatoes, potatoes, soybean and vegetable oils, sugar and other sweeteners, corn products, and wheat products, to manufacture our products. In addition, we purchase and use significant quantities of resins, metals, and cardboard to package our products and natural gas to operate our facilities. For commodities that we use across many of our product categories, such as corrugated paper and energy, we coordinate sourcing requirements and centralize procurement to leverage our scale. In addition, some of our product lines and brands separately source raw materials that are specific to their operations. We source these commodities from a variety of providers, including large, international producers and smaller, local, independent sellers. Where appropriate, we seek to establish preferred purchaser status and have developed strategic partnerships with many of our suppliers with the objective of achieving favorable pricing and dependable supply for many of our commodities. The prices of raw materials and agricultural materials that we use in our products are affected by external factors, such as global competition for resources, currency fluctuations, severe weather or global climate change, consumer, industrial or investment demand, and changes in governmental regulation and trade, tariffs, alternative energy, and agricultural programs.
Our procurement teams monitor worldwide supply and cost trends so we can obtain ingredients and packaging needed for production at competitive prices. Although the prices of our principal raw materials can be expected to fluctuate, we believe there will be an adequate supply of the raw materials we use and that they are generally available from numerous sources. We use a range of hedging techniques in an effort to limit the impact of price fluctuations on many of our principal raw materials. However, we do not fully hedge against changes in commodity prices, and our hedging strategies may not protect us from increases in specific raw material costs. We actively monitor changes to commodity costs so that we can seek to mitigate the effect through pricing and other operational measures.
Seasonality and Working Capital
Although crops constituting certain of our raw food ingredients are harvested on a seasonal basis, the majority of our products are produced throughout the year.
Seasonal factors inherent in our business change the demand for products, including holidays, changes in seasons, or other annual events. While these factors influence our quarterly net sales, operating income/(loss), and cash flows at the product level, unless the timing of such events shift period-over-period (e.g., a shift in Easter timing), this seasonality does not typically have a significant effect on our consolidated results of operations or segment results.
For information related to our cash flows provided by/(used for) operating activities, including working capital items, see
Liquidity and Capital Resources
in Item 7,
Management’s Discussion and Analysis of Financial Condition and Results of Operations
, of this report.
Employees
We had approximately 38,000 employees as of
December 29, 2018
.
Regulation
The manufacture and sale of consumer food and beverage products is highly regulated. Our business operations, including the production, transportation, storage, distribution, sale, display, advertising, marketing, labeling, quality and safety of our products and their ingredients, and our occupational safety, health, and privacy practices, are subject to various laws and regulations. These laws and regulations are administered by federal, state, and local government agencies in the United States, as well as government entities and agencies outside the United States in markets where our products are manufactured, distributed or sold. In the United States, our activities are subject to regulation by various federal government agencies, including the Food and Drug Administration, U.S. Department of Agriculture, Federal Trade Commission, Department of Labor, Department of Commerce, and Environmental Protection Agency, as well as various state and local agencies. We are also subject to numerous similar and other laws and regulations outside of the United States, including but not limited to laws and regulations governing food safety, health and safety, anti-corruption, and data privacy. In our business dealings, we are also required to comply with the Foreign Corrupt Practices Act (“FCPA”), the U.K. Bribery Act, the Trade Sanctions Reform and Export Enhancement Act, and various other anti-corruption regulations in the regions in which we operate. We rely on legal and operational compliance programs, as well as in-house and outside counsel, to guide our businesses in complying with applicable laws and regulations of the countries in which we do business. In addition, the United Kingdom's impending withdrawal from the European Union (commonly referred to as “Brexit”) and other regulatory regime changes may add cost and complexity to our compliance efforts.
9
Environmental Regulation
Our activities throughout the world are highly regulated and subject to government oversight regarding environmental matters. Various laws concerning the handling, storage, and disposal of hazardous materials and the operation of facilities in environmentally sensitive locations may impact aspects of our operations.
In the United States, where a significant portion of our business operates, these laws and regulations include the Clean Air Act, the Clean Water Act, the Resource Conservation and Recovery Act, and the Comprehensive Environmental Response, Compensation, and Liability Act (“CERCLA”). CERCLA imposes joint and several liability on each potentially responsible party. We are involved in a number of active proceedings in the United States under CERCLA (and other similar state actions under similar legislation) related to our current operations and certain closed, inactive, or divested operations for which we retain liability.
As of
December 29, 2018
, we had accrued an amount we deemed appropriate for environmental remediation. Based on information currently available, we believe that the ultimate resolution of existing environmental remediation actions and our compliance in general with environmental laws and regulations will not have a material effect on our earnings or financial condition. However, it is difficult to predict with certainty the potential impact of future compliance efforts and environmental remedial actions and thus, future costs associated with such matters may exceed current reserves.
Information about our Executive Officers
The following are our executive officers as of June 5, 2019 and all persons chosen to become executive officers as of the filing date of this Annual Report on Form 10-K:
|
Name
|
Age
|
Title
|
||
|
Bernardo Hees
|
49
|
Chief Executive Officer
|
||
|
Miguel Patricio
|
53
|
Advisor and Incoming Chief Executive Officer
|
||
|
David Knopf
|
31
|
Executive Vice President and Chief Financial Officer
|
||
|
Nina Barton
|
45
|
Zone President of Canada and President of Digital Growth
|
||
|
Paulo Basilio
|
44
|
President of U.S. Commercial Business
|
||
|
Pedro Drevon
|
36
|
Zone President of Latin America
|
||
|
Rashida La Lande
|
45
|
Senior Vice President, Global General Counsel and Head of CSR and Government Affairs; Corporate Secretary
|
||
|
Rafael Oliveira
|
44
|
Zone President of EMEA
|
||
|
Rodrigo Wickbold
|
42
|
Zone President of APAC
|
||
Bernardo Hees
became Chief Executive Officer upon the closing of the 2015 Merger. He had previously served as Chief Executive Officer of Heinz since June 2013. Previously, Mr. Hees served as Chief Executive Officer of Burger King Worldwide Holdings, Inc., a global fast food restaurant chain, from September 2010 to June 2013 and Burger King Worldwide, Inc. from June 2012 to June 2013 and as Chief Executive Officer of América Latina Logística (“ALL”), a logistics company, from January 2005 to September 2010. Mr. Hees has also been a partner at 3G Capital, a global investment firm, since July 2010. On April 22, 2019, we announced that Bernardo Hees will leave Kraft Heinz in 2019 to focus on other projects as a Partner of 3G Capital.
Miguel Patricio
was appointed to succeed Mr. Hees as Chief Executive Officer and has served as Advisor to Kraft Heinz since May 5, 2019. Mr. Patricio has been
Chief of Special Global Projects-Marketing at Anheuser-Busch Inbev SA/NV (“AB InBev”), a multinational drink and brewing holdings company, since January 1, 2019. Prior to that, he served as the Chief Marketing Officer at AB InBev since 2012. Prior to his role as Chief Marketing Officer, since joining AB InBev in 1998, he also served as Zone President Asia Pacific, Zone President North America, Vice President Marketing of North America, and Vice President Marketing. Mr. Patricio has also held several senior positions across the Americas at The Coca-Cola Company and Johnson & Johnson. Mr. Patricio also invests in the 3G Special Situation Fund III (the “Fund”); his investment represents less than 1% of the Fund’s assets.
David Knopf
became Executive Vice President and Chief Financial Officer in October 2017. He had previously served as Vice President, Category Head of Planters Business since August 2016. Prior to that role, Mr. Knopf served as Vice President of Finance, Head of Global Budget & Business Planning, Zero-Based Budgeting, and Financial & Strategic Planning from July 2015 to August 2016. Prior to joining Kraft Heinz in July 2015, Mr. Knopf served in various roles at 3G Capital, including as an associate partner. Before joining 3G Capital in October 2013, Mr. Knopf served in various roles at Onex Partners, a private equity firm, and Goldman Sachs, a global investment banking, securities, and investment management firm. Mr. Knopf has also been a partner of 3G Capital since July 2015.
10
Nina Barton
became Zone President of Canada and President of Digital Growth effective January 1, 2019. Prior to assuming her current role, Ms. Barton had served as President, Global Digital and Online Growth since October 2017, and from July 2015 through October 2017, she served as Senior Vice President of Marketing, Innovation and Research & Development for the U.S. business. From July 2013 through July 2015, she served as Vice President, Marketing at Kraft Foods Group, Inc. and managed the total coffee portfolio including the
Maxwell House
,
Gevalia,
and
McCafe
brands. Ms. Barton joined Kraft Foods in 2011 as Senior Marketing Director responsible for growing the
Philadelphia
cream cheese brand. Prior to that, Ms. Barton served in a variety of marketing and brand-building roles in the consumer products industry.
Paulo Basilio
assumed his current role as President of the U.S. Commercial Business in October 2017. Mr. Basilio previously served as Executive Vice President and Chief Financial Officer upon the closing of the 2015 Merger until October 2017. He had previously served as Chief Financial Officer of Heinz since June 2013. Previously, Mr. Basilio served as Chief Executive Officer of ALL from September 2010 to June 2012, after having served in various roles at ALL, including Chief Operating Officer, Chief Financial Officer, and Analyst. Mr. Basilio has also been a partner of 3G Capital since July 2012.
Pedro Drevon
assumed his current role as Zone President of Latin America in October 2017. Previously he served as Managing Director for Kraft Heinz Brazil since August 2015. Prior to joining Kraft Heinz in 2015, Mr. Drevon served in various capacities at 3G Capital. Before joining 3G Capital in 2008, Mr. Drevon served in various roles at Banco BBM, a financial advisory and wealth management firm. Mr. Drevon has also been a partner of 3G Capital since January 2011.
Rashida La Lande
joined Kraft Heinz as Senior Vice President, Global General Counsel and Corporate Secretary in January 2018. In October 2018, Ms. La Lande’s responsibilities expanded to include leadership of our corporate social responsibility and government affairs functions, and she was later appointed Head of Corporate Social Responsibility and Government Affairs in addition to her role as Senior Vice President, Global General Counsel and Corporate Secretary. Prior to joining Kraft Heinz, Ms. La Lande was a partner at the law firm of Gibson, Dunn & Crutcher, where she advised clients with respect to mergers and acquisitions, leveraged buyouts, private equity deals, and joint ventures. Throughout Ms. La Lande’s career, she has advised companies and private equity sponsors in the consumer products, retail, financial services, and technology industries.
Rafael Oliveira
assumed his current role as Zone President of EMEA in October 2016 after serving as the Managing Director of Kraft Heinz UK & Ireland. Mr. Oliveira joined Kraft Heinz in July 2014 and served as President of Kraft Heinz Australia, New Zealand, and Papua New Guinea until September 2016. Prior to joining Kraft Heinz, Mr. Oliveira spent 17 years in the financial industry, the final 10 of which he held a variety of leadership positions with Goldman Sachs.
Rodrigo Wickbold
assumed his current role as Zone President of APAC in January 2018 after serving as Chief Marketing Officer of APAC since January 2016. Prior to joining Kraft Heinz in January 2016, Mr. Wickbold served in various marketing and business leadership roles at Unilever, a consumer products company, since 2000, including as Global Senior Brand Manager - Skin Care.
Available Information
Our website address is
www.kraftheinzcompany.com
. The information on our website is not, and shall not be deemed to be, a part of this Annual Report on Form 10-K or incorporated into any other filings we make with the Securities and Exchange Commission (the “SEC”). Our Annual Reports on Form 10-K, Quarterly Reports on Form 10-Q, Current Reports on Form 8-K and amendments to those reports filed or furnished pursuant to Section 13(a) or 15(d) of the Securities Exchange Act of 1934, as amended, (the “Exchange Act”) are available free of charge on our website as soon as reasonably practicable after we electronically file them with, or furnish them to, the SEC. In addition, the SEC maintains a website at
www.sec.gov
that contains reports, proxy and information statements, and other information regarding issuers, including Kraft Heinz, that are electronically filed with the SEC.
Item 1A. Risk Factors.
Industry Risks
We operate in a highly competitive industry.
The food and beverage industry is highly competitive across all of our product offerings. Our principal competitors in these categories are manufacturers, as well as retailers with their own branded and private label products. We compete based on product innovation, price, product quality, nutritional value, service, taste, convenience, brand recognition and loyalty, effectiveness of marketing and distribution, promotional activity, and the ability to identify and satisfy changing consumer preferences.
We may need to reduce our prices in response to competitive and customer pressures, including pressures in relation to private label products that are generally sold at lower prices. These pressures have restricted and may in the future continue to restrict our ability to increase prices in response to commodity and other cost increases. Failure to effectively assess, timely change and set proper pricing, promotions, or trade incentives may negatively impact the achievement of our objectives.
11
The rapid emergence of new distribution channels, particularly e-commerce, may create consumer price deflation, affecting our retail customer relationships and presenting additional challenges to increasing prices in response to commodity or other cost increases. We may also need to increase or reallocate spending on marketing, retail trade incentives, materials, advertising, and new product or channel innovation to maintain or increase market share. These expenditures are subject to risks, including uncertainties about trade and consumer acceptance of our efforts. If we are unable to compete effectively, our profitability, financial condition, and operating results may decline.
Our success depends on our ability to correctly predict, identify, and interpret changes in consumer preferences and demand, to offer new products to meet those changes, and to respond to competitive innovation.
Consumer preferences for food and beverage products change continually and rapidly. Our success depends on our ability to predict, identify, and interpret the tastes and dietary habits of consumers and to offer products that appeal to consumer preferences, including with respect to health and wellness. If we do not offer products that appeal to consumers, our sales and market share will decrease, which could materially and adversely affect our product sales, financial condition, and operating results.
We must distinguish between short-term trends and long-term changes in consumer preferences. If we do not accurately predict which shifts in consumer preferences will be long-term, or if we fail to introduce new and improved products to satisfy those preferences, our sales could decline. In addition, because of our varied consumer base, we must offer an array of products that satisfy a broad spectrum of consumer preferences. If we fail to expand our product offerings successfully across product categories, or if we do not rapidly develop products in faster-growing or more profitable categories, demand for our products could decrease, which could materially and adversely affect our product sales, financial condition, and operating results.
Prolonged negative perceptions concerning the health implications of certain food and beverage products (including as they relate to obesity or other health concerns) could influence consumer preferences and acceptance of some of our products and marketing programs. We strive to respond to consumer preferences and social expectations, but we may not be successful in our efforts. Continued negative perceptions and failure to satisfy consumer preferences could materially and adversely affect our product sales, financial condition, and operating results.
In addition, achieving growth depends on our successful development, introduction, and marketing of innovative new products and line extensions. There are inherent risks associated with new product or packaging introductions, including uncertainties about trade and consumer acceptance or potential impacts on our existing product offerings. We may be required to increase expenditures for new product development. Successful innovation depends on our ability to correctly anticipate customer and consumer acceptance, to obtain, protect, and maintain necessary intellectual property rights, and to avoid infringing upon the intellectual property rights of others. We must also be able to respond successfully to technological advances by and intellectual property rights of our competitors, and failure to do so could compromise our competitive position and impact our product sales, financial condition, and operating results.
Changes in the retail landscape or the loss of key retail customers could adversely affect our financial performance.
Retail customers, such as supermarkets, warehouse clubs, and food distributors in our major markets, may continue to consolidate, resulting in fewer but larger customers for our business across various channels. Consolidation also produces larger retail customers that may seek to leverage their positions to improve their profitability by demanding improved efficiency, lower pricing, more favorable terms, increased promotional programs, or specifically-tailored product offerings. In addition, larger retailers have scale to develop supply chains that permit them to operate with reduced inventories or to develop and market their own private label products. Retail consolidation and increasing retailer power could materially and adversely affect our product sales, financial condition, and operating results.
Retail consolidation also increases the risk that adverse changes in our customers’ business operations or financial performance may have a corresponding material and adverse effect on us. For example, if our customers cannot access sufficient funds or financing, then they may delay, decrease, or cancel purchases of our products, or delay or fail to pay us for previous purchases, which could materially and adversely affect our product sales, financial condition, and operating results.
In addition, technology-based systems, which give consumers the ability to shop through e-commerce websites and mobile commerce applications, are also significantly altering the retail landscape in many of our markets. If we are unable to adjust to developments in these changing landscapes, we may be disadvantaged in key channels and with certain consumers, which could materially and adversely affect our product sales, financial condition, and operating results.
12
Changes in our relationships with significant customers, suppliers, or other business relationships could adversely impact us.
We derive significant portions of our sales from certain significant customers (see
Sales and Customers
within Item 1,
Business
). There can be no assurance that all of our significant customers will continue to purchase our products in the same mix or quantities or on the same terms as in the past, particularly as increasingly powerful retailers may demand lower pricing and focus on developing their own brands. The loss of a significant customer or a material reduction in sales or a change in the mix of products we sell to a significant customer could materially and adversely affect our product sales, financial condition, and operating results.
Disputes with significant suppliers, including disputes related to pricing or performance, could adversely affect our ability to supply products to our customers and could materially and adversely affect our product sales, financial condition, and operating results. In addition, terminations of relationships with other significant contractual counterparties, including licensors, could adversely affect our portfolio, product sales, financial condition, and operating results.
In addition, the financial condition of such customers, suppliers, and other significant contractual counterparties are affected in large part by conditions and events that are beyond our control. Significant deteriorations in the financial conditions of significant customers, suppliers, and other business relationships could materially and adversely affect our product sales, financial condition, and operating results.
Maintaining, extending, and expanding our reputation and brand image are essential to our business success.
We have many iconic brands with long-standing consumer recognition across the globe. Our success depends on our ability to maintain brand image for our existing products, extend our brands to new platforms, and expand our brand image with new product offerings.
We seek to maintain, extend, and expand our brand image through marketing investments, including advertising and consumer promotions, and product innovation. Negative perceptions on the role of food and beverage marketing could adversely affect our brand image or lead to stricter regulations and scrutiny of marketing practices. Moreover, adverse publicity about legal or regulatory action against us, our quality and safety, our environmental or social impacts, our products becoming unavailable to consumers, or our suppliers and, in some cases, our competitors, could damage our reputation and brand image, undermine our customers’ confidence, and reduce demand for our products, even if the regulatory or legal action is unfounded or not material to our operations. Furthermore, existing or increased legal or regulatory restrictions on our advertising, consumer promotions, and marketing, or our response to those restrictions, could limit our efforts to maintain, extend, and expand our brands.
In addition, our success in maintaining, extending, and expanding our brand image depends on our ability to adapt to a rapidly changing media environment. We increasingly rely on social media and online dissemination of advertising campaigns. The growing use of social and digital media increases the speed and extent that information, including misinformation, and opinions can be shared. Negative posts or comments about us, our brands or our products, or our suppliers and, in some cases, our competitors, on social or digital media, whether or not valid, could seriously damage our brands and reputation. In addition, we might fail to appropriately target our marketing efforts, anticipate consumer preferences, or invest sufficiently in maintaining, extending, and expanding our brand image. If we do not maintain, extend, and expand our reputation or brand image, then our product sales, financial condition, and operating results could be materially and adversely affected.
We must leverage our brand value to compete against private label products.
In nearly all of our product categories, we compete with branded products as well as private label products, which are typically sold at lower prices. Our products must provide higher value and/or quality to our consumers than alternatives, particularly during periods of economic uncertainty. Consumers may not buy our products if relative differences in value and/or quality between our products and private label products change in favor of competitors’ products or if consumers perceive this type of change. If consumers prefer private label products, then we could lose market share or sales volumes or shift our product mix to lower margin offerings. A change in consumer preferences could also cause us to increase capital, marketing, and other expenditures, which could materially and adversely affect our product sales, financial condition, and operating results.
We may be unable to drive revenue growth in our key product categories, increase our market share, or add products that are in faster-growing and more profitable categories.
Our future results will depend on our ability to drive revenue growth in our key product categories and growth in the food and beverage industry in the countries in which we operate. Our future results will also depend on our ability to enhance our portfolio by adding innovative new products in faster-growing and more profitable categories and our ability to increase market share in our existing product categories. Our failure to drive revenue growth, limit market share decreases in our key product categories, or develop innovative products for new and existing categories could materially and adversely affect our product sales, financial condition, and operating results.
13
Product recalls or other product liability claims could materially and adversely affect us.
Selling products for human consumption involves inherent legal and other risks, including product contamination, spoilage, product tampering, allergens, or other adulteration. We have decided and could in the future decide to, and have been or could in the future be required to, recall products due to suspected or confirmed product contamination, adulteration, product mislabeling or misbranding, tampering, undeclared allergens, or other deficiencies. Product recalls or market withdrawals could result in significant losses due to their costs, the destruction of product inventory, and lost sales due to the unavailability of the product for a period of time.
We could be adversely affected if consumers lose confidence in the safety and quality of certain food products or ingredients, or the food safety system generally. Adverse attention about these types of concerns, whether or not valid, may damage our reputation, discourage consumers from buying our products, or cause production and delivery disruptions that could negatively impact our net sales and financial condition.
We may also suffer losses if our products or operations violate applicable laws or regulations, or if our products cause injury, illness, or death. In addition, our marketing could face claims of false or deceptive advertising or other criticism. A significant product liability or other legal judgment or a related regulatory enforcement action against us, or a significant product recall, may materially and adversely affect our reputation and profitability. Moreover, even if a product liability or fraud claim is unsuccessful, has no merit, or is not pursued, the negative publicity surrounding assertions against our products or processes could materially and adversely affect our product sales, financial condition, and operating results.
Unanticipated business disruptions could adversely affect our ability to provide our products to our customers.
We have a complex network of suppliers, owned and leased manufacturing locations, co-manufacturing locations, distribution networks, and information systems that support our ability to consistently provide our products to our customers. Factors that are hard to predict or beyond our control, such as weather, raw material shortages, natural disasters, fires or explosions, political unrest, terrorism, generalized labor unrest, or health pandemics, could damage or disrupt our operations or our suppliers’, co-manufacturers’ or distributors’ operations. These disruptions may require additional resources to restore our supply chain or distribution network. If we cannot respond to disruptions in our operations, whether by finding alternative suppliers or replacing capacity at key manufacturing or distribution locations, or if we are unable to quickly repair damage to our information, production, or supply systems, we may be late in delivering, or be unable to deliver, products to our customers and may also be unable to track orders, inventory, receivables, and payables. If that occurs, our customers’ confidence in us and long-term demand for our products could decline. Any of these events could materially and adversely affect our product sales, financial condition, and operating results.
Business Risks
We may not successfully identify, complete, or realize the benefits from strategic acquisitions, alliances, divestitures, joint ventures, or other investments.
From time to time, we have evaluated and may continue to evaluate acquisition candidates, alliances, joint ventures, or other investments that may strategically fit our business objectives, and we have divested and may consider divesting businesses that do not meet our strategic objectives or growth or profitability targets. These activities may present financial, managerial, and operational risks including, but not limited to, diversion of management’s attention from existing core businesses, difficulties integrating or separating personnel and financial and other systems, inability to effectively and immediately implement control environment processes across a diverse employee population, adverse effects on existing or acquired customer and supplier business relationships, and potential disputes with buyers, sellers, or partners. Activities in such areas are regulated by numerous antitrust and competition laws in the United States, Canada, the European Union, and other jurisdictions, and we may be required to obtain the approval of these transactions by competition authorities, as well as to satisfy other legal requirements.
To the extent we undertake acquisitions, alliances, joint ventures, investments, or other developments outside our core regions or in new categories, we may face additional risks related to such developments. For example, risks related to foreign operations include compliance with U.S. laws affecting operations outside of the United States, such as the FCPA, currency rate fluctuations, compliance with foreign regulations and laws, including tax laws, and exposure to politically and economically volatile developing markets. Any of these factors could materially and adversely affect our product sales, financial condition, and operating results.
14
We may be unable to realize the anticipated benefits from prior or future streamlining actions to reduce fixed costs, simplify or improve processes, and improve our competitiveness.
We have implemented a number of cost savings initiatives, including our Integration Program (as defined in
Overview
, in Item 7,
Management’s Discussion and Analysis of Financial Condition and Results of Operations
), that we believe are important to position our business for future success and growth. We have evaluated and continue to evaluate changes to our organizational structure to enable us to reduce costs, simplify or improve processes, and improve our competitiveness. Our future success may depend upon our ability to realize the benefits of these or other cost savings initiatives. In addition, certain of our initiatives may lead to increased costs in other aspects of our business such as increased conversion, outsourcing, or distribution costs. We must accurately predict costs and be efficient in executing any plans to achieve cost savings and operate efficiently in the highly competitive food and beverage industry, particularly in an environment of increased competitive activity. To capitalize on our efforts, we must carefully evaluate investments in our business, and execute in those areas with the most potential return on investment. If we are unable to realize the anticipated benefits from any cost-saving efforts, we could be cost disadvantaged in the marketplace, and our competitiveness, production, profitability, financial conditions, and operating results could be adversely affected.
We may not be able to successfully execute our strategic initiatives.
We plan to continue to conduct strategic initiatives in various markets. Consumer demands, behaviors, tastes and purchasing trends may differ in these markets and, as a result, our sales may not be successful or meet expectations, or the margins on those sales may be less than currently anticipated. We may also face difficulties integrating new business operations with our current sourcing, distribution, information technology systems, and other operations. Any of these challenges could hinder our success in new markets or new distribution channels. We may also face difficulties divesting business operations with minimal impact to the retained businesses. There can be no assurance that we will successfully complete any planned strategic initiatives, that any new business will be profitable or meet our expectations, or that any divestiture will be completed without disruption, which could adversely affect our results of operations and financial condition.
Our international operations subject us to additional risks and costs and may cause our profitability to decline.
We are a global company with sales and operations in numerous countries within developed and emerging markets. Approximately
31%
of our 2018 net sales were generated outside of the United States. As a result, we are subject to risks inherent in global operations. These risks, which can vary substantially by market, are described in many of the risk factors discussed in this section and also include:
|
•
|
compliance with U.S. laws affecting operations outside of the United States, including anti-bribery laws such as the FCPA;
|
|
•
|
changes in the mix of earnings in countries with differing statutory tax rates, changes in the valuation of deferred tax assets and liabilities, changes in tax laws or their interpretations, or tax audit implications;
|
|
•
|
the imposition of increased or new tariffs, quotas, trade barriers, or similar restrictions on our sales or imports, trade agreements, regulations, taxes, or policies that might negatively affect our sales or costs;
|
|
•
|
currency devaluations or fluctuations in currency values;
|
|
•
|
compliance with antitrust and competition laws, data privacy laws, and a variety of other local, national, and multi-national regulations and laws in multiple jurisdictions;
|
|
•
|
discriminatory or conflicting fiscal policies in or across foreign jurisdictions;
|
|
•
|
changes in capital controls, including currency exchange controls, government currency policies, or other limits on our ability to import raw materials or finished product into various countries or repatriate cash from outside the United States;
|
|
•
|
challenges associated with cross-border product distribution;
|
|
•
|
changes in local regulations and laws, the uncertainty of enforcement of remedies in foreign jurisdictions, and foreign ownership restrictions and the potential for nationalization or expropriation of property or other resources;
|
|
•
|
risks and costs associated with political and economic instability, corruption, anti-American sentiment, and social and ethnic unrest in the countries in which we operate;
|
|
•
|
the risks of operating in developing or emerging markets in which there are significant uncertainties regarding the interpretation, application, and enforceability of laws and regulations and the enforceability of contract rights and intellectual property rights;
|
|
•
|
risks arising from the significant and rapid fluctuations in currency exchange markets and the decisions made and positions taken to hedge such volatility;
|
|
•
|
changing labor conditions and difficulties in staffing our operations;
|
|
•
|
greater risk of uncollectible accounts and longer collection cycles; and
|
15
|
•
|
design, implementation, and use of effective control environment processes across our diverse operations and employee base.
|
In addition, political and economic changes or volatility, geopolitical conflicts, terrorist activity, political unrest, civil strife, acts of war, public corruption, expropriation, and other economic or political uncertainties could interrupt and negatively affect our business operations or customer demand. Slow economic growth or high unemployment in the markets in which we operate could constrain consumer spending, and declining consumer purchasing power could adversely impact our profitability. All of these factors could result in increased costs or decreased sales, and could materially and adversely affect our product sales, financial condition, and results of operations.
Our performance may be adversely affected by economic and political conditions in the United States and in various other nations where we do business.
Our performance has been in the past and may continue in the future to be impacted by economic and political conditions in the United States and in other nations where we do business. Economic and financial uncertainties in our international markets, including uncertainties surrounding the legal and regulatory effects of Brexit, changes to major international trade arrangements (e.g., the United States-Mexico-Canada Agreement), and the imposition of tariffs by certain foreign governments, including China and Canada, in response to the imposition of tariffs or modification of trade relationships by the United States, could negatively impact our operations and sales. Other factors impacting our operations in the United States and in international locations where we do business include export and import restrictions, currency exchange rates, currency devaluation, cash repatriation restrictions, recessionary conditions, foreign ownership restrictions, nationalization, the impact of hyperinflationary environments, terrorist acts, and political unrest. Such factors in either domestic or foreign jurisdictions, and our responses to them, could materially and adversely affect our product sales, financial condition, and operating results. For further information on Venezuela, see Note 16,
Venezuela - Foreign Currency and Inflation,
in Item 8,
Financial Statements and Supplementary Data
.
We rely on our management team and other key personnel and may be unable to hire or retain key personnel or a highly skilled and diverse global workforce.
We depend on the skills, working relationships, and continued services of key personnel, including our experienced management team. In addition, our ability to achieve our operating goals depends on our ability to identify, hire, train, and retain qualified individuals. We compete with other companies both within and outside of our industry for talented personnel, and we may lose key personnel or fail to attract, train, and retain other talented personnel and a diverse global workforce with the skills and in the locations we need to operate and grow our business. Unplanned turnover, failure to attract and develop personnel with key emerging capabilities such as e-commerce and digital marketing skills, or failure to develop adequate succession plans for leadership positions, including the Chief Executive Officer position, could deplete our institutional knowledge base and erode our competitiveness. Changes in immigration laws and policies could also make it more difficult for us to recruit or relocate skilled employees. Any such loss, failure, or limitation could adversely affect our product sales, financial condition, and operating results.
We are significantly dependent on information technology, and we may be unable to protect our information systems against service interruption, misappropriation of data, or breaches of security.
We rely on information technology networks and systems, including the Internet, to process, transmit, and store electronic and financial information, to manage a variety of business processes and activities, and to comply with regulatory, legal, and tax requirements. We also depend on our information technology infrastructure for digital marketing activities and for electronic communications among our locations, personnel, customers, and suppliers. These information technology systems, some of which are managed by third parties, may be susceptible to damage, invasions, disruptions, or shutdowns due to hardware failures, computer viruses, hacker attacks and other cybersecurity risks, telecommunication failures, user errors, catastrophic events or other factors. If our information technology systems suffer severe damage, disruption, or shutdown, by unintentional or malicious actions of employees and contractors or by cyber-attacks, and our business continuity plans do not effectively resolve the issues in a timely manner, we could experience business disruptions, reputational damage, transaction errors, processing inefficiencies, the leakage of confidential information, and the loss of customers and sales, causing our product sales, financial condition, and operating results to be adversely affected and the reporting of our financial results to be delayed.
In addition, if we are unable to prevent security breaches or disclosure of non-public information, we may suffer financial and reputational damage, litigation or remediation costs, fines, or penalties because of the unauthorized disclosure of confidential information belonging to us or to our partners, customers, consumers, or suppliers.
16
Misuse, leakage, or falsification of information could result in violations of data privacy laws and regulations, damage to our reputation and credibility, loss of opportunities to acquire or divest of businesses or brands, and loss of ability to commercialize products developed through research and development efforts and, therefore, could have a negative impact on net sales. In addition, we may suffer financial and reputational damage because of lost or misappropriated confidential information belonging to us, our current or former employees, or to our suppliers or consumers, and may become subject to legal action and increased regulatory oversight. We could also be required to spend significant financial and other resources to remedy the damage caused by a security breach or to repair or replace networks and information systems.
Our results of operations could be affected by natural events in the locations in which we or our customers, suppliers, distributors, or regulators operate.
We have been and may in the future be impacted by severe weather and other geological events, including hurricanes, earthquakes, floods, or tsunamis that could disrupt our operations or the operations of our customers, suppliers, distributors, or regulators. Natural disasters or other disruptions at any of our facilities or our suppliers’ or distributors’ facilities may impair or delay the delivery of our products. Influenza or other pandemics could disrupt production of our products, reduce demand for certain of our products, or disrupt the marketplace in the foodservice or retail environment with consequent material adverse effects on our results of operations. While we insure against many of these events and certain business interruption risks and have policies and procedures to manage business continuity planning, we cannot provide any assurance that such insurance will compensate us for any losses incurred as a result of natural or other disasters or that our business continuity plans will effectively resolve the issues in a timely manner. To the extent we are unable to, or cannot, financially mitigate the likelihood or potential impact of such events, or effectively manage such events if they occur, particularly when a product is sourced from a single location, there could be a material adverse effect on our business and results of operations, and additional resources could be required to restore our supply chain.
The Sponsors have substantial control over us and may have conflicts of interest with us in the future.
As of December 29, 2018, the Sponsors own approximately 49% of our common stock. Four of our current 11 directors had been directors of Heinz prior to the closing of the 2015 Merger and remained directors of Kraft Heinz pursuant to the merger agreement. In addition, the Board elected Joao M. Castro-Neves, a partner of 3G Capital, one of the Sponsors, effective June 12, 2019. Furthermore, some of our executive officers, including Bernardo Hees, our Chief Executive Officer, are partners of 3G Capital. As a result, the Sponsors have the potential to exercise influence over management and have substantial control over decisions of our Board of Directors as well as over any action requiring the approval of the holders of our common stock, including adopting any amendments to our charter, electing directors, and approving mergers or sales of substantially all of our capital stock or our assets. In addition, to the extent that the Sponsors were to collectively hold a majority of our common stock, they together would have the power to take shareholder action by written consent to adopt amendments to our charter or take other actions, such as corporate transactions, that require the vote of holders of a majority of our outstanding common stock. The directors designated by the Sponsors may have significant authority to effect decisions affecting our capital structure, including the issuance of additional capital stock, the incurrence of additional indebtedness, the implementation of stock repurchase programs, and the decision of whether to declare dividends and the amount of any such dividends. Additionally, the Sponsors are in the business of making investments in companies and may from time to time acquire and hold interests in businesses that compete directly or indirectly with us. The Sponsors may also pursue acquisition opportunities that may be complementary to our business, and, as a result, those acquisition opportunities may not be available to us. So long as the Sponsors continue to own a significant amount of our equity, they will continue to be able to strongly influence or effectively control our decisions.
Financial Risks
Our level of indebtedness, as well as our failure to comply with covenants under our debt instruments, could adversely affect our business and financial condition.
We have a substantial amount of indebtedness, and are permitted to incur a substantial amount of additional indebtedness, including secured debt. Our existing debt, together with any incurrence of additional indebtedness, could have important consequences, including, but not limited to:
|
•
|
increasing our vulnerability to general adverse economic and industry conditions;
|
|
•
|
limiting our ability to obtain additional financing for working capital, capital expenditures, research and development, debt service requirements, acquisitions, and general corporate or other purposes;
|
|
•
|
resulting in a downgrade to our credit rating, which could adversely affect our cost of funds, including our commercial paper programs; liquidity; and access to capital markets;
|
|
•
|
restricting us from making strategic acquisitions or causing us to make non-strategic divestitures;
|
|
•
|
limiting our ability to adjust to changing market conditions and place us at a competitive disadvantage compared to our competitors who are not as highly leveraged;
|
17
|
•
|
making it more difficult for us to make payments on our existing indebtedness;
|
|
•
|
requiring a substantial portion of cash flows from operations to be dedicated to the payment of principal and interest on our indebtedness, thereby reducing our ability to use our cash flow to fund our operations, payments of dividends, capital expenditures, and future business opportunities;
|
|
•
|
exposing us to risks related to fluctuations in foreign currency, as we earn profits in a variety of currencies around the world and substantially all of our debt is denominated in U.S. dollars; and
|
|
•
|
in the case of any additional indebtedness, exacerbating the risks associated with our substantial financial leverage.
|
In addition, there can be no assurance that we will generate sufficient cash flow from operations or that future debt or equity financings will be available to us to enable us to pay our indebtedness or to fund other needs. As a result, we may need to refinance all or a portion of our indebtedness on or before maturity. There is no assurance that we will be able to refinance any of our indebtedness on favorable terms, or at all. Any inability to generate sufficient cash flow or to refinance our indebtedness on favorable terms could have a material adverse effect on our financial condition.
Our indebtedness instruments contain customary representations, warranties and covenants, including a financial covenant in our senior unsecured revolving credit facility (the “Senior Credit Facility”) to maintain a minimum shareholders’ equity (excluding accumulated other comprehensive income/(losses)). The creditors who hold our debt could accelerate amounts due in the event that we default, which could potentially trigger a default or acceleration of the maturity of our other debt. If our operating performance declines, or if we are unable to comply with any covenant, such as our ability to timely prepare and file our periodic reports with the SEC, we have needed and may in the future need to obtain waivers from the required creditors under our indebtedness instruments to avoid being in default.
During the period from December 29, 2018 to the filing date of this Annual Report on Form 10-K, due to the delays in the preparation of our financial statements for the fiscal year ended December 29, 2018 and the fiscal quarter ended March 30, 2019, we were not in compliance with certain reporting covenants under the Senior Credit Facility. As previously disclosed, we entered into two waiver agreements with respect to the Senior Credit Facility, pursuant to which the lenders, as party to the Senior Credit Facility, and JPMorgan Chase Bank, N.A., as administrative agent, granted temporary waivers of compliance by us with respect to the requirement to furnish the lenders a copy of the consolidated financial statements for our fiscal year ended December 29, 2018 no later than June 28, 2019 and for our fiscal quarter ended March 30, 2019 no later than July 31, 2019. The filing of this Annual Report on Form 10-K will constitute compliance with the requirement to furnish the lenders a copy of the consolidated financial statements for our fiscal year ended December 29, 2018 no later than June 28, 2019. We also currently expect to file our Quarterly Report on Form 10-Q for the quarter ended March 30, 2019 on or before July 31, 2019 in compliance with the requirement to furnish the lenders a copy of the consolidated financial statements for such quarter no later than July 31, 2019. For further information related to the two waiver agreements, see
Liquidity and Capital Resources
in Item 7,
Management’s Discussion and Analysis of Financial Condition and Results of Operations
.
However, we may not be able to secure similar waivers for any future delays in our periodic reports with the SEC. Furthermore, if we breach any covenants under our indebtedness instruments and seek a waiver, we may not be able to obtain a waiver from the required creditors, or we may not be able to remedy compliance within the terms of any waivers approved by the required creditors. If this occurs, we would be in default under our indebtedness instruments and unable to access our Senior Credit Facility. In addition, certain creditors could exercise their rights, as described above, and we could be forced into bankruptcy or liquidation.
Additional impairments of the carrying amounts of goodwill or other indefinite-lived intangible assets could negatively affect our financial condition and results of operations.
Our goodwill balance consists of
20
reporting units, and our indefinite-lived intangible asset balance primarily consists of a number of individual brands.
We test our reporting units and brands for impairment annually as of the first day of our second quarter, or more frequently if events or circumstances indicate it is more likely than not that the fair value of a reporting unit or brand is less than its carrying amount. Such events and circumstances could include a sustained decrease in our market capitalization, increased competition or unexpected loss of market share, increased input costs beyond projections (for example due to regulatory or industry changes), disposals of significant brands or components of our business, unexpected business disruptions (for example due to a natural disaster or loss of a customer, supplier, or other significant business relationship), unexpected significant declines in operating results, or significant adverse changes in the markets in which we operate. We test reporting units for impairment by comparing the estimated fair value of each reporting unit with its carrying amount. We test brands for impairment by comparing the estimated fair value of each brand with its carrying amount. If the carrying amount of a reporting unit or brand exceeds its estimated fair value, we record an impairment loss based on the difference between fair value and carrying amount, in the case of reporting units, not to exceed to the associated carrying amount of goodwill.
18
As detailed in Note 10,
Goodwill and Intangible Assets
, in Item 8,
Financial Statements and Supplementary Data
, as a result of our 2018 annual impairment test in the second quarter of 2018, we recognized a goodwill impairment loss of
$133 million
and an indefinite-lived intangible asset impairment loss of
$101 million
. Additionally, as part of our interim impairment test in the third quarter of 2018, we recognized an indefinite-lived intangible asset impairment loss of
$215 million
and a definite-lived intangible asset impairment loss of
$3 million
.
For the fourth quarter of 2018, in connection with the preparation of our year-end financial statements, we assessed the changes in circumstances that occurred during the quarter to determine if it was more likely than not that the fair values of any reporting units or brands were below their carrying amounts. Although our annual impairment test is performed during the second quarter, we perform this qualitative assessment each interim reporting period.
While there was no single determinative event or factor, the consideration in totality of several factors that developed during the fourth quarter of 2018 led us to conclude that it was more likely than not that the fair values of certain reporting units and brands were below their carrying amounts.
These factors included: (i) a sustained decrease in our share price in November and December of 2018, which reduced our market capitalization below the book value of net assets; (ii) the completion of our fourth quarter results, which were below management’s expectations due to several factors such as higher than expected supply chain costs and increased competition; (iii) the development and approval of our 2019 annual operating plan in December 2018, which provided additional insights into expectations and priorities for the coming years, such as lower growth and margin expectations; (iv) the announcement in November 2018 to sell certain assets in our natural cheese portfolio in Canada, which changed the composition and use of the remaining assets and brands in the associated reporting unit; (v) fluctuations in foreign exchange rates in certain countries; (vi) increased interest rates in certain locations, including an increase in the United States in December 2018; and (vii) increased and prolonged economic and regulatory uncertainty in the United States and global economies as of the end of December 2018.
Accordingly, we performed an interim impairment test on these reporting units and brands as of December 29, 2018. As a result of our interim impairment test, we recognized goodwill impairment losses of
$6.9 billion
and indefinite-lived intangible asset impairment losses of
$8.6 billion
in the fourth quarter of 2018.
Fair value determinations require considerable judgment and are sensitive to changes in underlying assumptions, estimates, and market factors. Estimating the fair value of individual
reporting units and brands
requires us to make assumptions and estimates regarding our future plans, as well as industry, economic, and regulatory conditions. These assumptions and estimates include
estimated future annual net cash flows, income tax considerations, discount rates, growth rates, royalty rates, contributory asset charges
, and other market factors. If current expectations of future growth rates and margins are not met, if market factors outside of our control, such as discount rates, change, or if management’s expectations or plans otherwise change, including as a result of the development of our global five-year operating plan, then one or more of our
reporting units or brands
might become impaired in the future.
As detailed in Note 10,
Goodwill and Intangible Assets
, in Item 8,
Financial Statements and Supplementary Data
, we recorded impairment losses totaling
$15.9 billion
for the year ended December 29, 2018.
Our
reporting units and brands
that were impaired in 2018 were written down to their respective fair values resulting in zero excess fair value over carrying amount as of their latest 2018 impairment testing dates. Accordingly, these and other individual
reporting units and brands
that have
20%
or less excess fair value over carrying amount as of their latest testing date have a heightened risk of future impairments if any assumptions, estimates, or market factors change in the future.
Reporting units with a heightened risk of future impairments had an aggregate goodwill carrying amount of
$29.0 billion
at December 29, 2018 and included: U.S. Grocery, U.S. Refrigerated, Canada Retail, Latin America Exports, Southeast Europe, Australia and New Zealand, and Northeast Asia.
Of the
$29.0 billion
with a heightened risk of future impairments,
$9.3 billion
is attributable to
reporting units
with
0%
excess fair value over carrying amount.
Brands with a heightened risk of future impairments had an aggregate carrying amount of
$29.3 billion
at December 29, 2018 and included:
Kraft
,
Philadelphia
,
Oscar Mayer
,
Velveeta
,
Miracle Whip
,
Planters
,
A1
,
Cool Whip
,
Stove Top
,
ABC
, and
Quero
.
Of the
$29.3 billion
with a heightened risk of future impairments,
$24.0 billion
is attributable to
brands
with
0%
excess fair value over carrying amount.
Although the remaining
reporting units and brands
have more than
20%
excess fair value over carrying amount as of their latest 2018 impairment testing date, these amounts are also associated with the 2013 Heinz acquisition and the 2015 Merger and are recorded on the balance sheet at their estimated acquisition date fair values. Therefore, if any assumptions, estimates, or market factors change in the future, these amounts are also susceptible to impairments
, which could negatively affect our operating results or net worth.
19
Our net sales and net income may be exposed to foreign exchange rate fluctuations.
We derive a substantial portion of our net sales from international operations. We hold assets and incur liabilities, earn revenue, and pay expenses in a variety of currencies other than the U.S. dollar, primarily the British pound sterling, euro, Australian dollar, Canadian dollar, New Zealand dollar, Brazilian real, Indonesian rupiah, Chinese renminbi, and Indian rupee. Since our consolidated financial statements are reported in U.S. dollars, fluctuations in exchange rates from period to period will have an impact on our reported results. We have implemented currency hedges intended to reduce our exposure to changes in foreign currency exchange rates. However, these hedging strategies may not be successful, and any of our unhedged foreign exchange exposures will continue to be subject to market fluctuations. In addition, in certain circumstances, we may incur costs in one currency related to services or products for which we are paid in a different currency. As a result, factors associated with international operations, including changes in foreign currency exchange rates, could significantly affect our results of operations and financial condition.
Commodity, energy, and other input prices are volatile and could negatively affect our consolidated operating results.
We purchase and use large quantities of commodities, including dairy products, meat products, coffee beans, nuts, tomatoes, potatoes, soybean and vegetable oils, sugar and other sweeteners, corn products, wheat products, cucumbers, onions, other fruits and vegetables, spices, and flour to manufacture our products. In addition, we purchase and use significant quantities of resins, metals, cardboard, glass, plastic, paper, fiberboard, and other materials to package our products, and we use other inputs, such as natural gas and water, to operate our facilities. We are also exposed to changes in oil prices, which influence both our packaging and transportation costs. Prices for commodities, energy, and other supplies are volatile and can fluctuate due to conditions that are difficult to predict, including global competition for resources, currency fluctuations, severe weather or global climate change, crop failures, or shortages due to plant disease or insect and other pest infestation, consumer, industrial, or investment demand, and changes in governmental regulation and trade, tariffs, alternative energy, including increased demand for biofuels, and agricultural programs. Additionally, we may be unable to maintain favorable arrangements with respect to the costs of procuring raw materials, packaging, services, and transporting products, which could result in increased expenses and negatively affect our operations. Furthermore, the cost of raw materials and finished products may fluctuate due to movements in cross-currency transaction rates. Rising commodity, energy, and other input costs could materially and adversely affect our cost of operations, including the manufacture, transportation, and distribution of our products, which could materially and adversely affect our financial condition and operating results.
Although we monitor our exposure to commodity prices as an integral part of our overall risk management program, and seek to hedge against input price increases to the extent we deem appropriate, we do not fully hedge against changes in commodity prices, and our hedging strategies may not protect us from increases in specific raw materials costs. For example, hedging our costs for one of our key commodities, dairy products, is difficult because dairy futures markets are not as developed as many other commodities futures markets. Continued volatility or sustained increases in the prices of commodities and other supplies we purchase could increase the costs of our products, and our profitability could suffer. Moreover, increases in the prices of our products to cover these increased costs may result in lower sales volumes, or we may be constrained from increasing the prices of our products by competitive and consumer pressures. If we are not successful in our hedging activities, or if we are unable to price our products to cover increased costs, then commodity and other input price volatility or increases could materially and adversely affect our financial condition and operating results.
Volatility in the market value of all or a portion of the derivatives we use to manage exposures to fluctuations in commodity prices may cause volatility in our gross profit and net income.
We use commodity futures, options, and swaps to economically hedge the price of certain input costs, including dairy products, meat products, coffee beans, sugar, vegetable oils, wheat products, corn products, cocoa products, packaging products, diesel fuel, and natural gas. We recognize gains and losses based on changes in the values of these commodity derivatives. We recognize these gains and losses in cost of products sold in our consolidated statements of income to the extent we utilize the underlying input in our manufacturing process. We recognize these gains and losses in general corporate expenses in our segment operating results until we sell the underlying products, at which time we reclassify the gains and losses to segment operating results. Accordingly, changes in the values of our commodity derivatives may cause volatility in our gross profit and net income.
Our results could be adversely impacted as a result of increased pension, labor, and people-related expenses.
Inflationary pressures and any shortages in the labor market could increase labor costs, which could have a material adverse effect on our consolidated operating results or financial condition. Our labor costs include the cost of providing employee benefits in the United States, Canada, and other foreign jurisdictions, including pension, health and welfare, and severance benefits. Any declines in market returns could adversely impact the funding of pension plans, the assets of which are invested in a diversified portfolio of equity and fixed-income securities and other investments. Additionally, the annual costs of benefits vary with increased costs of health care and the outcome of collectively-bargained wage and benefit agreements.
20
Furthermore, we may be subject to increased costs or experience adverse effects to our operating results if we are unable to renew collectively bargained agreements on satisfactory terms. Our financial condition and ability to meet the needs of our customers could be materially and adversely affected if strikes or work stoppages and interruptions occur as a result of delayed negotiations with union-represented employees both in and outside of the United States.
Regulatory Risks
Compliance with laws, regulations, and related interpretations and related legal claims or other regulatory enforcement actions could impact our business, and we face additional risks and uncertainties related to any potential actions resulting from the SEC’s ongoing investigation, as well as potential additional subpoenas, litigation, and regulatory proceedings.
As a large, global food and beverage company, we operate in a highly-regulated environment with constantly-evolving legal and regulatory frameworks. Various laws and regulations govern production, storage, distribution, sales, advertising, labeling, including on-pack claims, information or disclosures, marketing, licensing, trade, labor, tax, environmental matters, privacy, as well as health and safety and data protection practices. Government authorities regularly change laws and regulations and their interpretations. In particular, Brexit could result in a new regulatory regime in the United Kingdom that may or may not follow that of the European Union, and the creation of new and divergent laws and regulations could increase the cost and complexity of our compliance. In addition, this shift in regime could create a number of legal and accounting complexities with respect to existing relationships, including uncertainty regarding the continuity of contracts entered into by entities in the United Kingdom or the European Union. Our compliance with new or revised laws and regulations, or the interpretation and application of existing laws and regulations, could materially and adversely affect our product sales, financial condition, and results of operations. As a consequence of the legal and regulatory environment in which we operate, we are faced with a heightened risk of legal claims and regulatory enforcement actions.
As previously disclosed on February 21, 2019, we received a subpoena in October 2018 from the SEC related to our procurement area, specifically the accounting policies, procedures, and internal controls related to our procurement function, including, but not limited to, agreements, side agreements, and changes or modifications to agreements with our suppliers. Following the receipt of this subpoena, we, together with external counsel and forensic accountants, and subsequently, under the oversight of the Audit Committee, conducted an internal investigation into our procurement area and related matters. Following our earnings release and investor call on February 21, 2019, when we announced the results of our interim assessment of goodwill and intangible asset impairments, the SEC requested additional information related to our financial reporting, internal controls, and disclosures, our assessment of goodwill and intangible asset impairments, and our communications with certain shareholders. It is our understanding that the United States Attorney’s Office for the Northern District of Illinois also is reviewing this matter, working with the SEC and receiving materials from it.
After our earnings release, four securities class action lawsuits, one class action lawsuit under the Employee Retirement Income Security Act (“ERISA”), and five stockholder derivative actions were filed against us and certain of our current and former officers, directors, and employees. One of the securities class action lawsuits was voluntarily dismissed without prejudice, while the other matters are still pending.
We intend to vigorously defend against these lawsuits. We are unable, at this time, to estimate our potential liability in these matters, but we may be required to pay judgments, settlements, or other penalties and incur other costs and expenses in connection with the securities and ERISA class action lawsuits and the stockholder derivative actions. See Item 3,
Legal Proceedings
, and Note 18,
Commitment and Contingencies
, in Item 8,
Financial Statements and Supplementary Data
, for additional information.
Furthermore, if the SEC commences legal action as a result of the investigation, we could be required to pay significant penalties and become subject to injunctions, cease and desist orders, and other equitable remedies. The SEC investigation will not be resolved as a result of the completion of the internal investigation and the filing of this Annual Report on Form 10-K. We can provide no assurances as to the outcome or timing of any governmental or regulatory investigation.
We have incurred, and may continue to incur, significant expenses related to legal, accounting, and other professional services in connection with the internal investigation, the SEC investigation, and related legal and regulatory matters. These expenses, the delay in timely filing this Annual Report on Form 10-K, the delay in timely filing our Quarterly Report on Form 10-Q for the fiscal quarter ended March 30, 2019, and the diversion of the attention of the management team that has occurred, and is expected to continue, has adversely affected, and could continue to adversely affect, our business, financial condition, and cash flows.
As a result of matters associated with the internal investigation related to the SEC investigation and various lawsuits, we are exposed to greater risks associated with litigation, regulatory proceedings, and government enforcement actions and additional subpoenas. Any future investigations or additional lawsuits may have a material adverse effect on our business, financial condition, results of operations, and cash flows.
21
We identified material weaknesses in our internal control over financial reporting. If we are unable to remediate these material weaknesses, or if we experience additional material weaknesses or other deficiencies in the future or otherwise fail to maintain an effective system of internal controls, we may not be able to accurately and timely report our financial results, in which case our business may be harmed, investors may lose confidence in the accuracy and completeness of our financial reports, and the price of our common stock may decline.
Our management is responsible for establishing and maintaining adequate internal control over financial reporting and for evaluating and reporting on the effectiveness of our system of internal control. Our internal control over financial reporting is a process designed to provide reasonable assurance regarding the reliability of financial reporting and the preparation of financial statements for external reporting purposes in accordance with accounting principles generally accepted in the United States of America (“U.S. GAAP”). As a public company, we are required to comply with the Sarbanes-Oxley Act and other rules that govern public companies. In particular, we are required to certify our compliance with Section 404 of the Sarbanes-Oxley Act, which requires us to furnish annually a report by management on the effectiveness of our internal control over financial reporting. In addition, our independent registered public accounting firm is required to report on the effectiveness of our internal control over financial reporting.
In connection with our most recent year-end assessment of internal control over financial reporting, we determined that, as of December 29, 2018, we did not maintain effective internal control over financial reporting because of a material weakness in our risk assessment process related to designing and maintaining controls sufficient to appropriately respond to changes in our business environment. This material weakness in risk assessment also contributed to material weaknesses arising from (i) supplier contracts and related arrangements, and (ii) goodwill and indefinite-lived intangible asset impairment testing, and we have taken and are taking certain remedial steps to improve our internal control over financial reporting. For further discussion of the material weaknesses identified and our remedial efforts, see Item 9A,
Controls and Procedures
.
Remediation efforts place a significant burden on management and add increased pressure to our financial resources and processes. As a result, we may not be successful in making the improvements necessary to remediate the material weaknesses identified by management, be able to do so in a timely manner, or be able to identify and remediate additional control deficiencies, including material weaknesses, in the future.
If we are unable to successfully remediate our existing or any future material weaknesses or other deficiencies in our internal control over financial reporting, the accuracy and timing of our financial reporting may be adversely affected; our liquidity, our access to capital markets, the perceptions of our creditworthiness, and our ability to complete acquisitions may be adversely affected; we may be unable to maintain or regain compliance with applicable securities laws, The Nasdaq Stock Market LLC (“Nasdaq”) listing requirements, and the covenants under our debt instruments or derivative arrangements regarding the timely filing of periodic reports; we may be subject to regulatory investigations and penalties; investors may lose confidence in our financial reporting; we may suffer defaults, accelerations, or cross-accelerations under our debt instruments or derivative arrangements to the extent we are unable to obtain waivers from the required creditors or counterparties or are unable to cure any breaches; and our stock price may decline.
Our failure to prepare and timely file our periodic reports with the SEC limits our access to the public markets to raise debt or equity capital, restricts our ability to issue equity securities, including within the Kraft Heinz Savings Plan and the Kraft Heinz Union Savings Plan (collectively, the “Plan”), and could impact our listing on Nasdaq.
We did not file our Annual Report on Form 10-K for the year ended December 29, 2018 or our Quarterly Report on Form 10-Q for the fiscal quarter ended March 30, 2019 within each respective timeframe required by the SEC, meaning we have not remained current in our reporting requirements with the SEC. This limits our ability to access the public markets to raise debt or equity capital, which could prevent us from pursuing transactions or implementing business strategies that we might otherwise believe are beneficial to our business. We are not currently eligible to use a registration statement on Form S-3 that would allow us to continuously incorporate by reference our SEC reports into the registration statement, or to use “shelf” registration statements to conduct offerings, until approximately one year from the date we regain and maintain status as a current filer. If we wish to pursue a public offering now, we would be required to file a registration statement on Form S-1 and have it reviewed and declared effective by the SEC. Doing so would likely take significantly longer than using a registration statement on Form S-3 and increase our transaction costs, and the necessity of using a Form S-1 for a public offering of registered securities could, to the extent we are not able to conduct offerings using alternative methods, adversely impact our ability to raise capital or complete acquisitions of other companies in a timely manner.
22
In addition, as a result of the failure to remain current in our reporting requirements with the SEC, we are not currently eligible to use Form S-8 registration statements. As a result, on April 23, 2019, the administrator of the Plan issued a notice to Plan participants advising participants of a blackout period during which participants are prohibited from acquiring beneficial ownership of additional interests in The Kraft Heinz Company Stock Fund. If we are not able to become and remain current in our reporting requirements with the SEC, it restricts our ability to maintain The Kraft Heinz Company Stock Fund or issue other equity securities to our employees.
As previously disclosed, we also received notices from Nasdaq regarding our noncompliance with Nasdaq Listing Rule 5250(c)(1), which requires listed companies to timely file all required periodic financial reports with the SEC. We timely submitted our plan to regain compliance, and Nasdaq granted the Company until September 11, 2019 to regain compliance, subject to our compliance with certain terms outlined in the notice received on May 15, 2019, including filing this Annual Report on Form 10-K for the fiscal year ended December 29, 2018 and filing our Quarterly Report on Form 10-Q for the fiscal quarter ended March 30, 2019, which we expect to file as promptly as practicable following the filing of this Annual Report on Form 10-K. If we are not able to file before September 11, 2019, however, our common stock may be subject to delisting by Nasdaq.
We reached a determination to restate certain of our previously issued consolidated financial statements, which resulted in unanticipated costs and may affect investor confidence and raise reputational issues.
As discussed in the Explanatory Note, in Note 2,
Restatement of Previously Issued Consolidated Financial Statements
, and in Note 23,
Quarterly Financial Data (Unaudited)
, in this Annual Report on Form 10-K, we reached a determination to restate our consolidated financial statements and related disclosures for the years ended December 30, 2017 and December 31, 2016 and to restate each of the quarterly and year-to-date periods for the nine months ended September 29, 2018 and for fiscal year 2017, following the identification of misstatements as a result of the internal investigation conducted.
We do not believe that the misstatements are quantitatively material to any period presented in our prior financial statements. However, due to the qualitative nature of the matters identified in our internal investigation, including the number of years over which the misconduct occurred and the number of transactions, suppliers, and procurement employees involved, we determined that it would be appropriate to correct the misstatements in our previously issued consolidated financial statements by restating such financial statements. The restatement also included corrections for additional identified out-of-period and uncorrected misstatements in the impacted periods.
As a result, we have incurred unanticipated costs for accounting and legal fees in connection with or related to the restatement, and have become subject to a number of additional risks and uncertainties, which may affect investor confidence in the accuracy of our financial disclosures and may raise reputational issues for our business.
Our intellectual property rights are valuable, and any inability to protect them could reduce the value of our products and brands.
We consider our intellectual property rights, particularly and most notably our trademarks, but also our patents, trade secrets, trade dress, copyrights, and licensing agreements, to be a significant and valuable aspect of our business. We attempt to protect our intellectual property rights through a combination of patent, trademark, copyright, trade secret, and trade dress laws, as well as licensing agreements, third-party nondisclosure and assignment agreements, and policing of third-party misuses of our intellectual property. Our failure to develop or adequately protect our trademarks, products, new features of our products, or our technology, or any change in law or other changes that serve to lessen or remove the current legal protections of our intellectual property, may diminish our competitiveness and could materially harm our business and financial condition. We also license certain intellectual property, most notably trademarks, from third parties. To the extent that we are not able to contract with these third parties on favorable terms or maintain our relationships with these third parties, our rights to use certain intellectual property could be impacted.
We may be unaware of intellectual property rights of others that may cover some of our technology, brands, or products. Any litigation regarding patents or other intellectual property could be costly and time-consuming and could divert the attention of our management and key personnel from our business operations. Third-party claims of intellectual property infringement might also require us to enter into costly license agreements. We also may be subject to significant damages or injunctions against development and sale of certain products.
23
Changes in tax laws and interpretations could adversely affect our business.
We are subject to income and other taxes in the United States and in numerous foreign jurisdictions. Our domestic and foreign tax liabilities are dependent on the jurisdictions in which profits are determined to be earned and taxed. Additionally, the amount of taxes paid is subject to our interpretation of applicable tax laws in the jurisdictions in which we operate. A number of factors influence our effective tax rate, including changes in tax laws and treaties as well as the interpretation of existing laws and rules. Federal, state, and local governments and administrative bodies within the United States, which represents the majority of our operations, and other foreign jurisdictions have implemented, or are considering, a variety of broad tax, trade, and other regulatory reforms that may impact us. For example, the Tax Cuts and Jobs Act (the “U.S. Tax Reform”) enacted on December 22, 2017 resulted in changes in our corporate tax rate, our deferred income taxes, and the taxation of foreign earnings. The comprehensive impact of U.S. Tax Reform is yet to be determined, and future guidance and interpretations may have adverse or uncertain effects. Relatedly, changes in tax laws resulting from the Organization for Economic Co-operation and Development’s (“OECD”) multi-jurisdictional plan of action to address base erosion and profit sharing (“BEPS”) could impact our effective tax rate. It is not currently possible to accurately determine the potential comprehensive impact of these or future changes, but these changes could have a material impact on our business and financial condition.
Significant judgment, knowledge, and experience are required in determining our worldwide provision for income taxes. Our future effective tax rate is impacted by a number of factors including changes in the valuation of our deferred tax assets and liabilities, changes in geographic mix of income, increases in expenses not deductible for tax, including impairment of goodwill, and changes in available tax credits. In the ordinary course of our business, there are many transactions and calculations where the ultimate tax determination is uncertain. We are also regularly subject to audits by tax authorities. Although we believe our tax estimates are reasonable, the final determination of tax audits and any related litigation could be materially different from our historical income tax provisions and accruals. Economic and political pressures to increase tax revenue in various jurisdictions may make resolving tax disputes more difficult. The results of an audit or litigation could adversely affect our financial statements in the period or periods for which that determination is made.
Registered Securities Risks
Sales of our common stock in the public market could cause volatility in the price of our common stock or cause the share price to fall.
Sales of a substantial number of shares of our common stock in the public market, sales of our common stock by the Sponsors, or the perception that these sales might occur, could depress the market price of our common stock, and could impair our ability to raise capital through the sale of additional equity securities. A sustained depression in the market price of our common stock has happened (in November and December 2018, which was a contributing factor to our decision to perform an interim impairment test for certain reporting units and brands in the fourth quarter of 2018, for which we ultimately recorded impairment losses) and could in the future happen, which could also reduce our market capitalization below the book value of net assets, which could increase the likelihood of recognizing goodwill or indefinite-lived intangible asset impairment losses that could negatively affect our financial condition and results of operations.
Kraft Heinz, 3G Capital, and Berkshire Hathaway entered into a registration rights agreement requiring us to register for resale under the Securities Act all registrable shares held by 3G Capital and Berkshire Hathaway, which represents all shares of our common stock held by the Sponsors as of the date of the closing of the 2015 Merger. As of December 29, 2018, registrable shares represented approximately 49% of all outstanding shares of our common stock. Although the registrable shares are subject to certain holdback and suspension periods, the registrable shares are not subject to a “lock-up” or similar restriction under the registration rights agreement. Accordingly, offers and sales of a large number of registrable shares may be made pursuant to an effective registration statement under the Securities Act in accordance with the terms of the registration rights agreement. Sales of our common stock by the Sponsors to other persons would likely result in an increase in the number of shares being traded in the public market and may increase the volatility of the price of our common stock.
Our ability to pay regular dividends to our shareholders and the amounts of any such dividends are subject to the discretion of the Board of Directors and may be limited by our financial condition, debt agreements, or limitations under Delaware law.
Although it is currently anticipated that we will continue to pay regular quarterly dividends, any such determination to pay dividends and the amounts thereof will be at the discretion of the Board of Directors and will be dependent on then-existing conditions, including our financial condition, income, legal requirements, including limitations under Delaware law, debt agreements, and other factors the Board of Directors deems relevant. The Board of Directors has decided, and may in the future decide, in its sole discretion, to change the amount or frequency of dividends or discontinue the payment of dividends entirely. For these reasons, shareholders will not be able to rely on dividends to receive a return on investment. Accordingly, realization of any gain on shares of our common stock may depend on the appreciation of the price of our common stock, which may never occur.
24
Volatility of capital markets or macroeconomic factors could adversely affect our business.
Changes in financial and capital markets, including market disruptions, limited liquidity, uncertainty regarding Brexit, and interest rate volatility, including as a result of the use or discontinued use of certain benchmark rates such as LIBOR, may increase the cost of financing as well as the risks of refinancing maturing debt. In addition, our borrowing costs can be affected by short and long-term ratings assigned by rating organizations. A decrease in these ratings could limit our access to capital markets and increase our borrowing costs, which could materially and adversely affect our financial condition and operating results.
Some of our customers and counterparties are highly leveraged. Consolidations in some of the industries in which our customers operate have created larger customers, some of which are highly leveraged and facing increased competition and continued credit market volatility. These factors have caused some customers to be less profitable, increasing our exposure to credit risk. A significant adverse change in the financial and/or credit position of a customer or counterparty could require us to assume greater credit risk relating to that customer or counterparty and could limit our ability to collect receivables. This could have an adverse impact on our financial condition and liquidity.
Item 1B. Unresolved Staff Comments.
None.
Item 2. Properties.
Our corporate co-headquarters are located in Pittsburgh, Pennsylvania and Chicago, Illinois. Our co-headquarters are leased and house certain executive offices, our U.S. business units, and our administrative, finance, legal, and human resource functions. We maintain additional owned and leased offices throughout the regions in which we operate.
We manufacture our products in our network of manufacturing and processing facilities located throughout the world. As of
December 29, 2018
, we operated 84 manufacturing and processing facilities. We own 81 and lease three of these facilities. Our manufacturing and processing facilities count by segment as of
December 29, 2018
was:
|
Owned
|
Leased
|
||
|
United States
|
40
|
1
|
|
|
Canada
|
2
|
—
|
|
|
EMEA
|
12
|
—
|
|
|
Rest of World
|
27
|
2
|
|
We maintain all of our manufacturing and processing facilities in good condition and believe they are suitable and are adequate for our present needs. We also enter into co-manufacturing arrangements with third parties if we determine it is advantageous to outsource the production of any of our products.
In the fourth quarter of 2018, we announced our plans to divest certain assets and operations, predominantly in Canada and India,
including one owned manufacturing facility in Canada and one owned and one leased facility in India
. See Note 5,
Acquisitions and Divestitures
, in Item 8,
Financial Statements and Supplementary Data
, for additional information on these transactions.
Item 3. Legal Proceedings.
See Note 18,
Commitments and Contingencies
, in Item 8,
Financial Statements and Supplementary Data
.
Item 4. Mine Safety Disclosures.
Not applicable.
PART II
Item 5. Market for Registrant's Common Equity, Related Stockholder Matters and Issuer Purchases of Equity Securities.
Our common stock is listed on Nasdaq under the ticker symbol “KHC”. At June 5, 2019, there were approximately 49,000 holders of record of our common stock.
See
Equity and Dividends
in Item 7,
Management’s Discussion and Analysis of Financial Condition and Results of Operations
, for a discussion of cash dividends declared on our common stock.
25
Comparison of Cumulative Total Return
The following graph compares the cumulative total return on our common stock with the cumulative total return of the Standard & Poor's (“S&P”) 500 Index and the S&P Consumer Staples Food and Soft Drink Products, which we consider to be our peer group. Companies included in the S&P Consumer Staples Food and Soft Drink Products index change periodically and are presented on the basis of the index as it is comprised on December 29, 2018. This graph covers the period from July 6, 2015 (the first day our common stock began trading on Nasdaq) through December 28, 2018 (the last trading day of our fiscal year 2018). The graph shows total shareholder return assuming $100 was invested on July 6, 2015 and the dividends were reinvested on a daily basis.
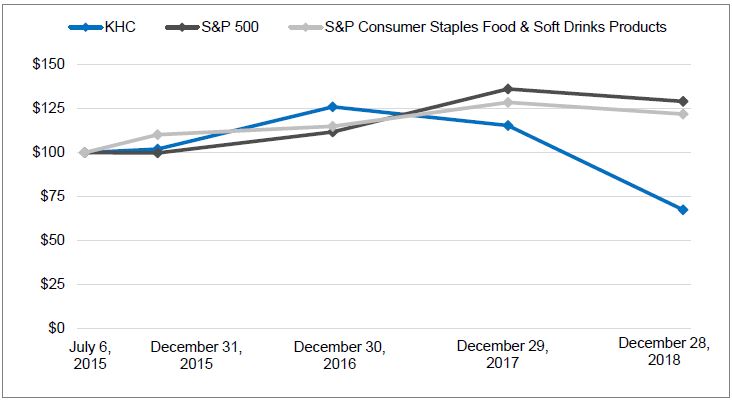
|
Kraft Heinz
|
S&P 500
|
S&P Consumer Staples Food and Soft Drink Products
|
|||||||||
|
July 6, 2015
|
$
|
100.00
|
|
$
|
100.00
|
|
$
|
100.00
|
|
||
|
December 31, 2015
|
102.07
|
|
99.85
|
|
110.18
|
|
|||||
|
December 30, 2016
|
125.99
|
|
111.79
|
|
114.98
|
|
|||||
|
December 29, 2017
|
115.44
|
|
136.20
|
|
128.53
|
|
|||||
|
December 28, 2018
|
67.49
|
|
129.11
|
|
121.93
|
|
|||||
The above performance graph shall not be deemed to be “soliciting material” or to be “filed” with the SEC or subject to Regulation 14A or 14C, or to the liabilities of Section 18 of the Exchange Act.
26
Issuer Purchases of Equity Securities During the Three Months Ended
December 29, 2018
Our share repurchase activity in the three months ended
December 29, 2018
was:
|
|
Total Number
of Shares Purchased
(a)
|
Average Price
Paid Per Share
|
Total Number of Shares Purchased as Part of Publicly Announced Plans or Programs
(b)
|
Approximate Dollar Value of Shares that May Yet Be Purchased Under the Plans or Programs
|
||||||||||
|
9/30/2018 - 11/3/2018
|
48,358
|
|
$
|
55.58
|
|
—
|
|
$
|
—
|
|
||||
|
11/4/2018 - 12/1/2018
|
79,925
|
|
52.18
|
|
—
|
|
—
|
|
||||||
|
12/2/2018 - 12/29/2018
|
231,409
|
|
49.16
|
|
—
|
|
—
|
|
||||||
|
Total
|
359,692
|
|
—
|
|
||||||||||
|
(a)
|
Includes the following types of share repurchase activity, when they occur: (1) shares repurchased in connection with the exercise of stock options (including periodic repurchases using option exercise proceeds), (2) shares withheld for tax liabilities associated with the vesting of restricted stock units, and (3) shares repurchased related to employee benefit programs (including our annual bonus swap program) or to offset the dilutive effect of equity issuances.
|
|
(b)
|
We do not have any publicly announced share repurchase plans or programs.
|
Item 6. Selected Financial Data.
The following table presents selected consolidated financial data for the last five fiscal years. Our fiscal years 2018, 2017, and 2016 include a full year of Kraft Heinz results. Our fiscal year 2015 includes a full year of Heinz results and post-merger Kraft results. Our fiscal year 2014 includes a full year of Heinz results.
Certain prior period amounts have been restated for the correction of misstatements described below. This information should be read in conjunction with the “Explanatory Note” immediately preceding Item 1 of this Annual Report on Form 10-K, with Item 7,
Management's Discussion and Analysis of Financial Condition and Results of Operations
, and with our consolidated financial statements and notes thereto included elsewhere in this Annual Report on Form 10-K, including further details related to the misstatements discussed in Note 2,
Restatement of Previously Issued Consolidated Financial Statements
.
|
As Restated
|
|||||||||||||||||||
|
(Unaudited)
|
|||||||||||||||||||
|
December 29,
2018
(52 weeks)
|
December 30,
2017 (52 weeks) |
December 31,
2016 (52 weeks) (h) |
January 3,
2016 (53 weeks) |
December 28,
2014 (52 weeks) |
|||||||||||||||
|
(in millions, except per share data)
|
|||||||||||||||||||
|
Period Ended:
|
|||||||||||||||||||
|
Net sales
(a)(b)(c)
|
$
|
26,268
|
|
$
|
26,076
|
|
$
|
26,300
|
|
$
|
18,318
|
|
$
|
10,922
|
|
||||
|
Income/(loss)
(c)(d)(e)
|
(10,254
|
)
|
10,932
|
|
3,606
|
|
614
|
|
672
|
|
|||||||||
|
Income/(loss) attributable to common shareholders
(c)(d)(e)
|
(10,192
|
)
|
10,941
|
|
3,416
|
|
(299
|
)
|
(63
|
)
|
|||||||||
|
Income/(loss) per common share:
|
|||||||||||||||||||
|
Basic
(c)(d)(e)
|
(8.36
|
)
|
8.98
|
|
2.81
|
|
(0.38
|
)
|
(0.17
|
)
|
|||||||||
|
Diluted
(c)(d)(e)
|
(8.36
|
)
|
8.91
|
|
2.78
|
|
(0.38
|
)
|
(0.17
|
)
|
|||||||||
|
As Restated
|
|||||||||||||||||||
|
(Unaudited)
|
|||||||||||||||||||
|
December 29,
2018 |
December 30,
2017 |
December 31,
2016 |
January 3,
2016 |
December 28,
2014 |
|||||||||||||||
|
(in millions, except per share data)
|
|||||||||||||||||||
|
As of:
|
|||||||||||||||||||
|
Total assets
(b)(c)(e)
|
103,461
|
|
120,092
|
|
120,617
|
|
123,110
|
|
36,571
|
|
|||||||||
|
Long-term debt
(b)(c)(f)
|
30,770
|
|
28,308
|
|
29,712
|
|
25,148
|
|
13,358
|
|
|||||||||
|
Redeemable preferred stock
(g)
|
—
|
|
—
|
|
—
|
|
8,320
|
|
8,320
|
|
|||||||||
|
Cash dividends per common share
|
2.50
|
|
2.45
|
|
2.35
|
|
1.70
|
|
—
|
|
|||||||||
|
(a)
|
As previously disclosed, we adopted a new accounting standard related to revenue recognition in the first quarter of 2018, and at the same time, we retrospectively corrected immaterial misclassifications in our statements of income principally related to customer incentive program expense misclassifications. This resulted in net sales decreases of $147 million in 2017, $152 million in 2016, and $55 million in 2015.
|
|
(b)
|
The increases in net sales in 2016 and in 2015 compared to the prior year, and the increases in total assets and long-term debt from December 28, 2014 to January 3, 2016, were primarily driven by the 2015 Merger.
|
27
|
(c)
|
We have restated previously disclosed consolidated financial data for fiscal years 2017, 2016, and 2015, as well as the related balance sheet dates, to correct misstatements principally related to supplier contracts and related arrangements, as well as other identified out-of-period and uncorrected misstatements. See Note 2,
Restatement of Previously Issued Consolidated Financial Statements
, in Item 8,
Financial Statements and Supplementary Data
, for additional information.
|
|
(d)
|
The increases in income/(loss), income/(loss) attributable to common shareholders, and basic and diluted income/(loss) per common share in 2017 compared to 2016 were primarily driven by U.S. Tax Reform, which was enacted in December 2017. See Note 11,
Income Taxes
, in Item 8,
Financial Statements and Supplementary Data
, for additional information.
|
|
(e)
|
The decreases in income/(loss), income/(loss) attributable to common shareholders, and basic and diluted income/(loss) per common share in 2018 compared to 2017, and the decrease in total assets from December 30, 2017 to December 29, 2018, were primarily driven by non-cash impairment losses in 2018. See Note 10,
Goodwill and Intangible Assets,
in Item 8,
Financial Statements and Supplementary Data
, for additional information.
|
|
(f)
|
Amounts exclude the current portion of long-term debt.
|
|
(g)
|
On June 7, 2016, we redeemed all outstanding shares of our 9.00% cumulative compounding preferred stock, Series A (“Series A Preferred Stock”). See
Equity and Dividends
in Item 7
, Management’s Discussion and Analysis of Financial Condition and Results of Operations,
along with Note 19,
Debt
, and Note 20,
Capital Stock
, in Item 8,
Financial Statements and Supplementary Data
, for additional information.
|
|
(h)
|
On December 9, 2016, our Board of Directors approved a change to our fiscal year end from Sunday to Saturday. Effective December 31, 2016, we operate on a 52- or 53-week fiscal year ending on the last Saturday in December in each calendar year. In prior years, we operated on a 52- or 53-week fiscal year ending the Sunday closest to December 31. As a result, we occasionally have a 53rd week in a fiscal year. Our 2015 fiscal year includes a 53rd week of activity.
|
Item 7. Management’s Discussion and Analysis of Financial Condition and Results of Operations.
Overview
The following discussion should be read in conjunction with the other sections of this Annual Report on Form 10-K, including the consolidated financial statements and related notes contained in Item 8,
Financial Statements and Supplementary Data
.
Restatement of Previously Issued Consolidated Financial Statements:
We have restated our previously issued consolidated financial statements contained in this Annual Report on Form 10-K. Refer to the “Explanatory Note” preceding Item 1,
Business
, for background on the restatement, the fiscal periods impacted, control considerations, and other information.
In addition, we have restated certain previously reported financial information at December 30, 2017 and for the fiscal years ended December 30, 2017 and December 31, 2016 in this Item 7,
Management’s Discussion and Analysis of Financial Condition and Results of Operations
, including but not limited to information within the
Consolidated Results of Operations
,
Results of Operations by Segment
, and
Non-GAAP Financial Measures
sections. We have also included certain restated quarterly information in the
Supplemental Quarterly Financial Information
section at the end of this item.
See Note 2,
Restatement of Previously Issued Consolidated Financial Statements
, in Item 8,
Financial Statements and Supplementary Data
, for additional information related to the restatement, including descriptions of the misstatements and the impacts on our consolidated financial statements.
Description of the Company:
We manufacture and market food and beverage products, including condiments and sauces, cheese and dairy, meals, meats, refreshment beverages, coffee, and other grocery products throughout the world.
We manage and report our operating results through
four
segments. We have
three
reportable segments defined by geographic region: United States, Canada, and
EMEA
. Our remaining businesses are combined and disclosed as “Rest of World.” Rest of World comprises
two
operating segments: Latin America and
APAC.
Our segments reflect a change, effective in the first quarter of our fiscal year 2018, to reorganize our international businesses to better align our global geographies. We moved our Middle East and Africa businesses from the historical
AMEA
operating segment into the historical Europe reportable segment, forming the new
EMEA
reportable segment. The remaining businesses from the
AMEA
operating segment became the
APAC
operating segment. We have reflected this change in all historical periods presented.
See Note 22,
Segment Reporting
, in Item 8,
Financial Statements and Supplementary Data
, to the consolidated financial statements for our financial information by segment.
28
Items Affecting Comparability of Financial Results
Impairment Losses:
Our 2018 results reflect goodwill and intangible asset impairment losses of
$15.9 billion
compared to
$49 million
in 2017. The increase was primarily driven by impairment losses of
$15.5 billion
recognized in the fourth quarter of 2018.
For the fourth quarter of 2018, in connection with the preparation of our year-end financial statements, we assessed the changes in circumstances that occurred during the quarter to determine if it was more likely than not that the fair values of any reporting units or brands were below their carrying amounts. Although our annual impairment test is performed during the second quarter, we perform this qualitative assessment each interim reporting period.
While there was no single determinative event or factor, the consideration in totality of several factors that developed during the fourth quarter of 2018 led us to conclude that it was more likely than not that the fair values of certain reporting units and brands were below their carrying amounts.
These factors included: (i) a sustained decrease in our share price in November and December of 2018, which reduced our market capitalization below the book value of net assets; (ii) the completion of our fourth quarter results, which were below management’s expectations due to several factors such as higher than expected supply chain costs and increased competition; (iii) the development and approval of our 2019 annual operating plan in December 2018, which provided additional insights into expectations and priorities for the coming years, such as lower growth and margin expectations; (iv) the announcement in November 2018 to sell certain assets in our natural cheese portfolio in Canada, which changed the composition and use of the remaining assets and brands in the associated reporting unit; (v) fluctuations in foreign exchange rates in certain countries; (vi) increased interest rates in certain locations, including an increase in the United States in December 2018; and (vii) increased and prolonged economic and regulatory uncertainty in the United States and global economies as of the end of December 2018.
As we determined that it was more likely than not that the fair values of certain reporting units or brands were below their carrying amounts, we performed an interim impairment test as of December 29, 2018. As a result of our interim impairment test, we recognized goodwill impairment losses of
$6.9 billion
and indefinite-lived intangible asset impairment losses of
$8.6 billion
in the fourth quarter of 2018.
See
Critical Accounting Estimates
within this item and Note 10,
Goodwill and Intangible Assets
, in Item 8,
Financial Statements and Supplementary Data
, to the consolidated financial statements for additional information.
U.S. Tax Reform:
U.S. Tax Reform legislation enacted by the federal government on December 22, 2017 significantly changed U.S. tax laws by, among other things, lowering the federal corporate tax rate from
35.0%
to
21.0%
, effective January 1, 2018 and imposing a one-time toll charge on deemed repatriated earnings of foreign subsidiaries as of December 30, 2017. In addition, there were many new provisions, including changes to bonus depreciation, revised deductions for executive compensation and interest expense, a tax on global intangible low-taxed income (“GILTI”), the base erosion anti-abuse tax (“BEAT”), and a deduction for foreign-derived intangible income (“FDII”). While the corporate tax rate reduction was effective January 1, 2018, we accounted for this anticipated rate change in 2017, the period of enactment.
As a result of U.S. Tax Reform, we recorded a net tax benefit of approximately $7.0 billion in 2017. As a result, U.S. Tax Reform significantly impacted our provision for/(benefit from) income taxes and our effective tax rate, primarily in 2017, resulting in a lack of comparability year over year.
See Note 11,
Income Taxes
, in Item 8,
Financial Statements and Supplementary Data
, for additional information.
Integration and Restructuring Expenses:
At the end of 2017, we had substantially completed our multi-year program announced following the 2015 Merger (the “Integration Program”), which was designed to reduce costs and integrate and optimize our combined organization
. As of
December 29, 2018
, we had incurred cumulative pre-tax costs of
$2,146 million
related to the Integration Program. These costs primarily included severance and employee benefit costs (including cash and non-cash severance), costs to exit facilities (including non-cash costs such as accelerated depreciation), and other costs incurred as a direct result of integration activities. Approximately
60%
of total Integration Program costs were cash expenditures.
As of December 29, 2018, we had incurred approximately $1.4 billion in capital expenditures related to the Integration Program since its inception in 2015.
Related to our restructuring activities, including the Integration Program, we recognized expenses of
$460 million
in 2018,
$434 million
in 2017, and
$1.0 billion
in 2016. Integration Program expenses included in these totals were
$92 million
in 2018,
$316 million
, in 2017, and
$887 million
in 2016.
See Note 6,
Integration and Restructuring Expenses,
in Item 8,
Financial Statements and Supplementary Data
, for additional information.
29
Results of Operations
We disclose in this report certain non-GAAP financial measures. These non-GAAP financial measures assist management in comparing our performance on a consistent basis for purposes of business decision-making by removing the impact of certain items that management believes do not directly reflect our underlying operations. For additional information and reconciliations from our consolidated financial statements see
Non-GAAP Financial Measures.
The restatement described in the
Overview
section within this item did not significantly impact the drivers of our consolidated results of operations or our results of operations by segment. See Note 2,
Restatement of Previously Issued Consolidated Financial Statements,
in Item 8,
Financial Statements and Supplementary Data
, for additional information.
In addition, during the period between December 29, 2018 and the filing of this Annual Report on Form 10-K, certain industry trends impacting our results of operations as described herein, including increased costs in procurement and logistics, pricing pressure as a result of increased private label competition, and consumer trends focused on health and wellness, have continued.
Consolidated Results of Operations
Summary of Results:
|
As Restated & Recast
|
As Restated & Recast
|
||||||||||||||||||||
|
December 29,
2018 |
December 30,
2017 |
% Change
|
December 30,
2017 |
December 31,
2016 |
% Change
|
||||||||||||||||
|
(in millions, except per share data)
|
(in millions, except per share data)
|
||||||||||||||||||||
|
Net sales
|
$
|
26,268
|
|
$
|
26,076
|
|
0.7
|
%
|
$
|
26,076
|
|
$
|
26,300
|
|
(0.9
|
)%
|
|||||
|
Operating income/(loss)
|
(10,220
|
)
|
6,057
|
|
(268.7
|
)%
|
6,057
|
|
5,601
|
|
8.1
|
%
|
|||||||||
|
Net income/(loss) attributable to common shareholders
|
(10,192
|
)
|
10,941
|
|
(193.2
|
)%
|
10,941
|
|
3,416
|
|
220.3
|
%
|
|||||||||
|
Diluted EPS
|
(8.36
|
)
|
8.91
|
|
(193.8
|
)%
|
8.91
|
|
2.78
|
|
220.5
|
%
|
|||||||||
Net Sales:
|
As Restated
|
As Restated
|
||||||||||||||||||||
|
December 29,
2018 |
December 30,
2017 |
% Change
|
December 30,
2017 |
December 31,
2016 |
% Change
|
||||||||||||||||
|
(in millions)
|
(in millions)
|
||||||||||||||||||||
|
Net sales
|
$
|
26,268
|
|
$
|
26,076
|
|
0.7
|
%
|
$
|
26,076
|
|
$
|
26,300
|
|
(0.9
|
)%
|
|||||
|
Organic Net Sales
(a)
|
26,105
|
|
25,876
|
|
0.9
|
%
|
25,963
|
|
26,188
|
|
(0.9
|
)%
|
|||||||||
|
(a)
|
Organic Net Sales is a non-GAAP financial measure. See the
Non-GAAP Financial Measures
section within this item.
|
Fiscal
Year
2018 Compared to Fiscal
Year
2017:
Net sales increased
0.7%
to
$26.3 billion
in 2018 compared to
$26.1 billion
in 2017, despite the
unfavorable
impact of foreign currency (
0.6 pp
) and the
net favorable
impact of acquisitions and divestitures (
0.4 pp
). Organic Net Sales increased
0.9%
to
$26.1 billion
in 2018 compared to
$25.9 billion
in 2017 driven by
favorable
volume/mix (
0.9 pp
). Volume/mix was favorable in all segments. Pricing was
flat
, with lower pricing in the United States and Canada offset by higher pricing in Rest of World (primarily driven by highly inflationary environments in certain markets within Latin America) and EMEA.
Fiscal
Year
2017 Compared to Fiscal
Year
2016:
Net sales
decreased
0.9%
to
$26.1 billion
in 2017 compared to
$26.3 billion
in 2016. The impacts of foreign currency and acquisitions and divestitures were
flat
. Organic Net Sales
decreased
0.9%
to
$26.0 billion
in 2017 compared to
$26.2 billion
in 2016 due to
unfavorable
volume/mix (
1.5 pp
), partially offset by
higher
pricing (
0.6 pp
). Volume/mix was unfavorable in the United States and Canada, partially offset by growth in Rest of World and EMEA. Higher pricing in Rest of World and the United States was partially offset by lower pricing in Canada and EMEA.
30
Net Income:
|
As Restated & Recast
|
As Restated & Recast
|
||||||||||||||||||||
|
December 29,
2018 |
December 30,
2017 |
% Change
|
December 30,
2017 |
December 31,
2016 |
% Change
|
||||||||||||||||
|
(in millions)
|
(in millions)
|
||||||||||||||||||||
|
Operating income/(loss)
|
$
|
(10,220
|
)
|
$
|
6,057
|
|
(268.7
|
)%
|
$
|
6,057
|
|
$
|
5,601
|
|
8.1
|
%
|
|||||
|
Net income/(loss) attributable to common shareholders
|
(10,192
|
)
|
10,941
|
|
(193.2
|
)%
|
10,941
|
|
3,416
|
|
220.3
|
%
|
|||||||||
|
Adjusted EBITDA
(a)
|
7,024
|
|
7,664
|
|
(8.3
|
)%
|
7,664
|
|
7,574
|
|
1.2
|
%
|
|||||||||
|
(a)
|
Adjusted EBITDA is a non-GAAP financial measure. See the
Non-GAAP Financial Measures
section within this item.
|
Fiscal
Year
2018 Compared to Fiscal
Year
2017:
Operating income/(loss) decreased
268.7%
to a loss of
$10.2 billion
in 2018 compared to income of
$6.1 billion
in 2017. This decrease was primarily due to higher impairment losses in 2018. Impairment losses were
$15.9 billion
in 2018 compared to
$49 million
in 2017. The remaining $390 million decrease in operating income/(loss) was due to higher input costs and strategic investments. These decreases to operating income/(loss) were partially offset by lower Integration Program and other restructuring expenses, the favorable impact of foreign currency (4.2 pp), the benefit from the postemployment benefits accounting change adopted in the first quarter of 2018, savings from Integration Program and other restructuring activities, and productivity savings. See Note 10,
Goodwill and Intangible Assets
, in Item 8,
Financial Statements and Supplementary Data
, for additional information on our impairment losses.
Net income/(loss) attributable to common shareholders decreased
193.2%
to a loss of
$10.2 billion
in 2018 compared to income of
$10.9 billion
in 2017. The decrease was primarily due to the operating income/(loss) factors described above (primarily higher impairment losses in 2018), as well as a lower tax benefit, unfavorable changes in other expense/(income), net, and higher interest expense, which are detailed as follows:
|
•
|
The effective tax rate was a benefit of
9.4%
in 2018 on a pre-tax loss compared to a benefit of
100.6%
in 2017 on pre-tax income.
The 2018 effective tax rate was lower, primarily due to a decrease in the U.S. federal statutory rate, non-deductible items (including goodwill impairments, nonmonetary currency devaluation losses, and the wind-up of non-U.S. pension plans), the impact of the federal tax on GILTI, and the revaluation of our deferred tax balances due to changes in state tax laws following U.S. Tax Reform, which were partially offset by the benefit from intangible asset impairment losses in the fourth quarter of 2018.
See Note 11,
Income Taxes
, in Item 8,
Financial Statements and Supplementary Data
, for additional information related to our effective tax rates.
|
|
•
|
Other expense/(income), net was income of
$183 million
in 2018 compared to income of
$627 million
in 2017. This decrease was primarily due to a
$162 million
non-cash settlement charge in 2018 related to the wind-up of our Canadian salaried and Canadian hourly defined benefit pension plans compared to a
$177 million
non-cash curtailment gain from postretirement plan remeasurements in 2017. In addition, this decrease was due to a
$146 million
nonmonetary currency devaluation loss in the current period compared to a
$36 million
loss in the prior period related to our Venezuelan operations. See Note 16,
Venezuela - Foreign Currency and Inflation
, in Item 8,
Financial Statements and Supplementary Data
, for additional information.
|
|
•
|
Interest expense was
$1.3 billion
in 2018 compared to
$1.2 billion
in 2017. This increase was primarily driven by $3.0 billion aggregate principal amount of long-term debt issued in June 2018. See Note 19,
Debt
, in Item 8,
Financial Statements and Supplementary Data
, for additional information.
|
Adjusted EBITDA
decreased
8.3%
to
$7.0 billion
in 2018 compared to
$7.7 billion
in 2017, primarily due to higher input costs, strategic investments, higher overhead costs, and the
unfavorable
impact of foreign currency (
0.5 pp
), partially offset by savings from Integration Program and other restructuring activities, and productivity savings.
Fiscal
Year
2017 Compared to Fiscal
Year
2016:
Operating income/(loss) increased
8.1%
to
$6.1 billion
in 2017 compared to
$5.6 billion
in 2016. This increase was primarily driven by savings from the Integration Program and other restructuring activities, lower Integration Program and other restructuring expenses in 2017, and lower overhead costs, partially offset by higher input costs in local currency, lower Organic Net Sales, lower unrealized gains on commodity hedges in 2017, and the unfavorable impact of foreign currency (0.4 pp).
31
Net income/(loss) attributable to common shareholders increased
220.3%
to
$10.9 billion
in 2017 compared to
$3.4 billion
in 2016. The increase was primarily driven by U.S. Tax Reform, the operating income/(loss) factors discussed above, the absence of the Series A Preferred Stock dividend in 2017, and favorable changes in other expense/(income), net, partially offset by higher interest expense, detailed as follows:
|
•
|
The effective tax rate was a
100.6%
benefit in 2017 compared to
27.0%
expense in 2016. The change in the effective tax rate was primarily driven by the $7.0 billion tax benefit from U.S. Tax Reform, lower tax benefits associated with deferred tax effects of statutory rate changes, and taxes on income of foreign subsidiaries in 2017. See Note 11,
Income Taxes
, in Item 8,
Financial Statements and Supplementary Data
, for additional information related to our effective tax rates.
|
|
•
|
The Series A Preferred Stock was fully redeemed on June 7, 2016. Accordingly, there were no dividends for 2017, compared to $180 million in 2016. See
Equity and Dividends
within this item for additional information.
|
|
•
|
Other expense/(income), net was
$627 million
of income in 2017 compared to
$472 million
of income in 2016. This increase was primarily driven by a
$177 million
non-cash curtailment gain from postretirement plan remeasurements in 2017. This was partially offset by a
$36 million
nonmonetary currency devaluation loss in 2017 compared to
$24 million
in 2016 related to our Venezuelan operations. See Note 16,
Venezuela - Foreign Currency and Inflation
, in Item 8,
Financial Statements and Supplementary Data
, for additional information.
|
|
•
|
Interest expense increased to
$1.2 billion
in 2017 compared to
$1.1 billion
in 2016. This increase was primarily driven by the May 2016 issuances of long-term debt and borrowings under our commercial paper programs, which began in the second quarter of 2016.
|
Adjusted EBITDA
increased
1.2%
to
$7.7 billion
in 2017 compared to
$7.6 billion
in 2016, primarily driven by savings from the Integration Program and other restructuring activities and lower overhead costs, partially offset by higher input costs in local currency, the unfavorable impact of foreign currency (0.2 pp), and a decline in Organic Net Sales.
Diluted EPS:
|
As Restated
|
As Restated
|
||||||||||||||||||||
|
December 29,
2018 |
December 30,
2017 |
% Change
|
December 30,
2017 |
December 31,
2016 |
% Change
|
||||||||||||||||
|
(in millions, except per share data)
|
(in millions, except per share data)
|
||||||||||||||||||||
|
Diluted EPS
|
$
|
(8.36
|
)
|
$
|
8.91
|
|
(193.8
|
)%
|
$
|
8.91
|
|
$
|
2.78
|
|
220.5
|
%
|
|||||
|
Adjusted EPS
(a)
|
3.51
|
|
3.50
|
|
0.3
|
%
|
3.50
|
|
3.31
|
|
5.7
|
%
|
|||||||||
|
(a)
|
Adjusted EPS is a non-GAAP financial measure. See the
Non-GAAP Financial Measures
section within this item.
|
32
Fiscal
Year
2018 Compared to Fiscal
Year
2017:
Diluted EPS
decreased
193.8%
to a loss of
$8.36
in 2018 compared to earnings of
$8.91
in 2017, primarily due to the net income/(loss) attributable to common shareholders factors discussed above.
|
As Restated
|
||||||||||||||
|
December 29,
2018 |
December 30,
2017 |
$ Change
|
% Change
|
|||||||||||
|
Diluted EPS
|
$
|
(8.36
|
)
|
$
|
8.91
|
|
$
|
(17.27
|
)
|
(193.8
|
)%
|
|||
|
Integration and restructuring expenses
|
0.32
|
|
0.24
|
|
0.08
|
|
||||||||
|
Deal costs
|
0.02
|
|
—
|
|
0.02
|
|
||||||||
|
Unrealized losses/(gains) on commodity hedges
|
0.01
|
|
0.01
|
|
—
|
|
||||||||
|
Impairment losses
|
11.28
|
|
0.03
|
|
11.25
|
|
||||||||
|
Losses/(gains) on sale of business
|
0.01
|
|
—
|
|
0.01
|
|
||||||||
|
Other losses/(gains) related to acquisitions and divestitures
|
0.02
|
|
—
|
|
0.02
|
|
||||||||
|
Nonmonetary currency devaluation
|
0.12
|
|
0.03
|
|
0.09
|
|
||||||||
|
U.S. Tax Reform
discrete income tax expense/(benefit)
|
0.09
|
|
(5.72
|
)
|
5.81
|
|
||||||||
|
Adjusted EPS
(a)
|
$
|
3.51
|
|
$
|
3.50
|
|
$
|
0.01
|
|
0.3
|
%
|
|||
|
Key drivers of change in Adjusted EPS
(a)
:
|
||||||||||||||
|
Results of operations
|
$
|
(0.37
|
)
|
|||||||||||
|
Change in interest expense
|
(0.03
|
)
|
||||||||||||
|
Change in effective tax rate
|
0.39
|
|
||||||||||||
|
Effect of dilutive equity awards
|
0.02
|
|
||||||||||||
|
$
|
0.01
|
|
||||||||||||
|
(a)
|
Adjusted EPS is a non-GAAP financial measure. See the
Non-GAAP Financial Measures
section at the end of this item.
|
Adjusted EPS increased
0.3%
to
$3.51
in 2018 compared to
$3.50
in 2017, driven by lower taxes on adjusted earnings in the current period, the benefit from the postemployment benefits accounting change adopted in the first quarter of 2018, and the effect of dilutive equity awards, partially offset by lower Adjusted EBITDA, higher interest expense, and higher depreciation and amortization in the current period. We have excluded the effect of dilutive equity awards in 2018 as their inclusion would have had an anti-dilutive effect on EPS because of the net loss attributable to common shareholders. In 2017, the effect of dilutive equity awards was included.
33
Fiscal
Year
2017 Compared to Fiscal
Year
2016:
Diluted EPS
increased
220.5%
to
$8.91
in 2017 compared to
$2.78
in 2016, primarily driven by the net income/(loss) attributable to common shareholders factors discussed above.
|
As Restated
|
||||||||||||||
|
December 30,
2017 |
December 31,
2016 |
$ Change
|
% Change
|
|||||||||||
|
Diluted EPS
|
$
|
8.91
|
|
$
|
2.78
|
|
$
|
6.13
|
|
220.5
|
%
|
|||
|
Integration and restructuring expenses
|
0.24
|
|
0.57
|
|
(0.33
|
)
|
||||||||
|
Deal costs
|
—
|
|
0.02
|
|
(0.02
|
)
|
||||||||
|
Unrealized losses/(gains) on commodity hedges
|
0.01
|
|
(0.02
|
)
|
0.03
|
|
||||||||
|
Impairment losses
|
0.03
|
|
0.04
|
|
(0.01
|
)
|
||||||||
|
Nonmonetary currency devaluation
|
0.03
|
|
0.02
|
|
0.01
|
|
||||||||
|
Preferred dividend adjustment
|
—
|
|
(0.10
|
)
|
0.10
|
|
||||||||
|
U.S. Tax Reform
discrete income tax expense/(benefit)
|
(5.72
|
)
|
—
|
|
(5.72
|
)
|
||||||||
|
Adjusted EPS
(a)
|
$
|
3.50
|
|
$
|
3.31
|
|
$
|
0.19
|
|
5.7
|
%
|
|||
|
Key drivers of change in Adjusted EPS
(a)
:
|
||||||||||||||
|
Results of operations
|
$
|
0.03
|
|
|||||||||||
|
Change in preferred dividends
|
0.25
|
|
||||||||||||
|
Change in interest expense
|
(0.06
|
)
|
||||||||||||
|
Change in effective tax rate and other
|
(0.03
|
)
|
||||||||||||
|
$
|
0.19
|
|
||||||||||||
|
(a)
|
Adjusted EPS is a non-GAAP financial measure. See the
Non-GAAP Financial Measures
section at the end of this item.
|
Adjusted EPS increased
5.7%
to
$3.50
in 2017 compared to
$3.31
in 2016, primarily driven by the absence of Series A Preferred Stock dividends in 2017 and Adjusted EBITDA growth despite the unfavorable impact of foreign currency, partially offset by higher interest expense.
Results of Operations by Segment
Management evaluates segment performance based on several factors, including net sales, Organic Net Sales, and segment adjusted earnings before interest, tax, depreciation, and amortization (“Segment Adjusted EBITDA”).
Segment Adjusted EBITDA is defined as net income/(loss) from continuing operations before interest expense, other expense/(income), net, provision for/(benefit from) income taxes, and depreciation and amortization (excluding integration and restructuring expenses); in addition to these adjustments, we exclude, when they occur, the impacts of integration and restructuring expenses, deal costs, unrealized gains/(losses) on commodity hedges (the unrealized gains and losses are recorded in general corporate expenses until realized; once realized, the gains and losses are recorded in the applicable segment’s operating results), impairment losses, gains/(losses) on the sale of a business, other gains/(losses) related to acquisitions and divestitures (e.g., tax and hedging impacts), nonmonetary currency devaluation (e.g., remeasurement gains and losses), and equity award compensation expense (excluding integration and restructuring expenses). Segment Adjusted EBITDA is a tool that can assist management and investors in comparing our performance on a consistent basis by removing the impact of certain items that management believes do not directly reflect our underlying operations.
Under highly inflationary accounting, the functional currency of our Venezuelan subsidiary is the U.S. dollar. As a result, we must revalue the results of our Venezuelan subsidiary to U.S. dollars. We revalue the income statement using daily weighted average Sistema de Divisa Complementaria (“DICOM”) rates, and we revalue the bolivar denominated monetary assets and liabilities at the period-end DICOM spot rate. The resulting revaluation gains and losses are recorded in current net income and are classified within other expense/(income), net as nonmonetary currency devaluation. See Note 16,
Venezuela - Foreign Currency and Inflation
, in Item 8,
Financial Statements and Supplementary Data
, for additional information.
34
Net Sales:
|
As Restated
|
|||||||||||
|
December 29,
2018 |
December 30,
2017 |
December 31,
2016 |
|||||||||
|
(in millions)
|
|||||||||||
|
Net sales:
|
|||||||||||
|
United States
|
$
|
18,122
|
|
$
|
18,230
|
|
$
|
18,469
|
|
||
|
Canada
|
2,173
|
|
2,177
|
|
2,302
|
|
|||||
|
EMEA
|
2,718
|
|
2,585
|
|
2,586
|
|
|||||
|
Rest of World
|
3,255
|
|
3,084
|
|
2,943
|
|
|||||
|
Total net sales
|
$
|
26,268
|
|
$
|
26,076
|
|
$
|
26,300
|
|
||
Organic Net Sales:
|
2018 Compared to 2017
|
2017 Compared to 2016
|
||||||||||||||
|
As Restated
|
|||||||||||||||
|
December 29,
2018 |
December 30,
2017 |
December 30,
2017 |
December 31,
2016 |
||||||||||||
|
(in millions)
|
|||||||||||||||
|
Organic Net Sales
(a)
:
|
|||||||||||||||
|
United States
|
$
|
18,122
|
|
$
|
18,230
|
|
$
|
18,230
|
|
$
|
18,469
|
|
|||
|
Canada
|
2,178
|
|
2,177
|
|
2,135
|
|
2,302
|
|
|||||||
|
EMEA
|
2,633
|
|
2,529
|
|
2,549
|
|
2,529
|
|
|||||||
|
Rest of World
|
3,172
|
|
2,940
|
|
3,049
|
|
2,888
|
|
|||||||
|
Total Organic Net Sales
|
$
|
26,105
|
|
$
|
25,876
|
|
$
|
25,963
|
|
$
|
26,188
|
|
|||
|
(a)
|
Organic Net Sales is a non-GAAP financial measure. See the
Non-GAAP Financial Measures
section within this item.
|
Drivers of the changes in net sales and Organic Net Sales were:
|
Net Sales
|
Currency
|
Acquisitions and Divestitures
|
Organic Net Sales
|
Price
|
Volume/Mix
|
||||||||
|
2018 Compared to 2017
|
|||||||||||||
|
United States
|
(0.6
|
)%
|
0.0 pp
|
0.0 pp
|
(0.6
|
)%
|
(0.9) pp
|
0.3 pp
|
|||||
|
Canada
|
(0.2
|
)%
|
(0.3) pp
|
0.0 pp
|
0.1
|
%
|
(0.6) pp
|
0.7 pp
|
|||||
|
EMEA
|
5.1
|
%
|
2.5 pp
|
(1.5) pp
|
4.1
|
%
|
0.9 pp
|
3.2 pp
|
|||||
|
Rest of World
|
5.6
|
%
|
(7.6) pp
|
5.3 pp
|
7.9
|
%
|
5.4 pp
|
2.5 pp
|
|||||
|
Kraft Heinz
|
0.7
|
%
|
(0.6) pp
|
0.4 pp
|
0.9
|
%
|
0.0 pp
|
0.9 pp
|
|||||
|
2017 Compared to 2016 (As Restated)
|
|||||||||||||
|
United States
|
(1.3
|
)%
|
0.0 pp
|
0.0 pp
|
(1.3
|
)%
|
0.5 pp
|
(1.8) pp
|
|||||
|
Canada
|
(5.4
|
)%
|
1.9 pp
|
0.0 pp
|
(7.3
|
)%
|
(1.8) pp
|
(5.5) pp
|
|||||
|
EMEA
|
—
|
%
|
(0.5) pp
|
(0.3) pp
|
0.8
|
%
|
(0.5) pp
|
1.3 pp
|
|||||
|
Rest of World
|
4.8
|
%
|
(0.8) pp
|
0.0 pp
|
5.6
|
%
|
4.2 pp
|
1.4 pp
|
|||||
|
Kraft Heinz
|
(0.9
|
)%
|
0.0 pp
|
0.0 pp
|
(0.9
|
)%
|
0.6 pp
|
(1.5) pp
|
|||||
35
Adjusted EBITDA:
|
As Restated & Recast
|
|||||||||||
|
December 29,
2018 |
December 30,
2017 |
December 31,
2016 |
|||||||||
|
|
(in millions)
|
||||||||||
|
Segment Adjusted EBITDA:
|
|||||||||||
|
United States
|
$
|
5,218
|
|
$
|
5,873
|
|
$
|
5,744
|
|
||
|
Canada
|
608
|
|
636
|
|
632
|
|
|||||
|
EMEA
|
724
|
|
673
|
|
741
|
|
|||||
|
Rest of World
|
635
|
|
590
|
|
621
|
|
|||||
|
General corporate expenses
|
(161
|
)
|
(108
|
)
|
(164
|
)
|
|||||
|
Depreciation and amortization (excluding integration and restructuring expenses)
|
(919
|
)
|
(907
|
)
|
(875
|
)
|
|||||
|
Integration and restructuring expenses
|
(297
|
)
|
(583
|
)
|
(992
|
)
|
|||||
|
Deal costs
|
(23
|
)
|
—
|
|
(30
|
)
|
|||||
|
Unrealized gains/(losses) on commodity hedges
|
(21
|
)
|
(19
|
)
|
38
|
|
|||||
|
Impairment losses
|
(15,936
|
)
|
(49
|
)
|
(71
|
)
|
|||||
|
Gains/(losses) on sale of business
|
(15
|
)
|
—
|
|
—
|
|
|||||
|
Nonmonetary currency devaluation
|
—
|
|
—
|
|
(4
|
)
|
|||||
|
Equity award compensation expense (excluding integration and restructuring expenses)
|
(33
|
)
|
(49
|
)
|
(39
|
)
|
|||||
|
Operating income/(loss)
|
(10,220
|
)
|
6,057
|
|
5,601
|
|
|||||
|
Interest expense
|
1,284
|
|
1,234
|
|
1,134
|
|
|||||
|
Other expense/(income), net
|
(183
|
)
|
(627
|
)
|
(472
|
)
|
|||||
|
Income/(loss) before income taxes
|
$
|
(11,321
|
)
|
$
|
5,450
|
|
$
|
4,939
|
|
||
United States:
|
2018 Compared to 2017
|
2017 Compared to 2016
|
||||||||||||||||||||
|
As Restated & Recast
|
As Restated & Recast
|
||||||||||||||||||||
|
December 29,
2018 |
December 30,
2017 |
% Change
|
December 30,
2017 |
December 31,
2016 |
% Change
|
||||||||||||||||
|
(in millions)
|
(in millions)
|
||||||||||||||||||||
|
Net sales
|
$
|
18,122
|
|
$
|
18,230
|
|
(0.6
|
)%
|
$
|
18,230
|
|
$
|
18,469
|
|
(1.3
|
)%
|
|||||
|
Organic Net Sales
(a)
|
18,122
|
|
18,230
|
|
(0.6
|
)%
|
18,230
|
|
18,469
|
|
(1.3
|
)%
|
|||||||||
|
Segment Adjusted EBITDA
|
5,218
|
|
5,873
|
|
(11.2
|
)%
|
5,873
|
|
5,744
|
|
2.2
|
%
|
|||||||||
|
(a)
|
Organic Net Sales is a non-GAAP financial measure. See the
Non-GAAP Financial Measures
section within this item.
|
Fiscal
Year
2018 Compared to Fiscal
Year
2017:
Net sales and Organic Net Sales
decreased
0.6%
to
$18.1 billion
in 2018 compared to
$18.2 billion
in 2017 primarily due to
lower
pricing (
0.9 pp
), partially offset by
favorable
volume/mix (
0.3 pp
). Pricing was lower across most categories, particularly in ready-to-drink beverages, cheese, and meat, partially offset by increases in boxed dinners and condiments and sauces. Favorable volume/mix across several categories, particularly in ready-to-drink beverages, was partially offset by lower shipments in cheese.
Segment Adjusted EBITDA
decreased
11.2%
to
$5.2 billion
in 2018 compared to
$5.9 billion
in 2017 primarily due to non-key commodity cost inflation, lower Organic Net Sales, strategic investments, and higher overhead costs, partially offset by favorable key commodity costs, and Integration Program savings.
Fiscal
Year
2017 Compared to Fiscal
Year
2016:
Net sales and Organic Net Sales
decreased
1.3%
to
$18.2 billion
in 2018 compared to
$18.5 billion
in 2017 due to
unfavorable
volume/mix (
1.8 pp
), partially offset by
higher
pricing (
0.5 pp
). Unfavorable volume/mix was primarily driven by distribution losses in nuts, cheese, and meat, and lower shipments in foodservice. The decline was partially offset by gains in refrigerated meal combinations, boxed dinners, and frozen meals. Pricing was
higher
driven primarily by price increases in cheese.
36
Segment Adjusted EBITDA
increased
2.2%
to
$5.9 billion
in 2017 compared to
$5.7 billion
in 2016 primarily driven by Integration Program savings and lower overhead costs, partially offset by unfavorable key commodity costs, primarily in dairy, meat, and coffee, as well as unfavorable volume/mix.
Canada:
|
2018 Compared to 2017
|
2017 Compared to 2016
|
||||||||||||||||||||
|
As Restated & Recast
|
As Restated & Recast
|
||||||||||||||||||||
|
December 29,
2018 |
December 30,
2017 |
% Change
|
December 30,
2017 |
December 31,
2016 |
% Change
|
||||||||||||||||
|
(in millions)
|
(in millions)
|
||||||||||||||||||||
|
Net sales
|
$
|
2,173
|
|
$
|
2,177
|
|
(0.2
|
)%
|
$
|
2,177
|
|
$
|
2,302
|
|
(5.4
|
)%
|
|||||
|
Organic Net Sales
(a)
|
2,178
|
|
2,177
|
|
0.1
|
%
|
2,135
|
|
2,302
|
|
(7.3
|
)%
|
|||||||||
|
Segment Adjusted EBITDA
|
608
|
|
636
|
|
(4.4
|
)%
|
636
|
|
632
|
|
0.7
|
%
|
|||||||||
|
(a)
|
Organic Net Sales is a non-GAAP financial measure. See the
Non-GAAP Financial Measures
section within this item.
|
Fiscal
Year
2018 Compared to Fiscal
Year
2017:
Net sales
decreased
0.2%
to
$2.2 billion
in 2018 compared to
$2.2 billion
in 2017 due to the
unfavorable
impact of foreign currency (
0.3 pp
). Organic Net Sales
increased
0.1%
to
$2.2 billion
in 2018 compared to
$2.2 billion
in 2017 driven by
favorable
volume/mix (
0.7 pp
), partially offset by
lower
pricing (
0.6 pp
). Favorable volume/mix was primarily driven by higher shipments in cheese and coffee, primarily due to earlier execution of go-to-market agreements with key retailers, partially offset by lower shipments in condiments and sauces. Lower pricing in cheese was partially offset by increases across a number of categories, particularly in foodservice.
Segment Adjusted EBITDA
decreased
4.4%
to
$608 million
in 2018 compared to
$636 million
in 2017, partially due to the
unfavorable
impact of foreign currency (
0.3 pp
). Excluding the currency impact, Segment Adjusted EBITDA decreased primarily due to lower pricing, higher overhead costs, and higher input costs in local currency.
Fiscal
Year
2017 Compared to Fiscal
Year
2016:
Net sales
decreased
5.4%
to
$2.2 billion
in 2017 compared to
$2.3 billion
in 2016, despite the
favorable
impact of foreign currency (
1.9 pp
). Organic Net Sales
decreased
7.3%
to
$2.1 billion
in 2017 compared to
$2.3 billion
in 2016 due to
unfavorable
volume/mix (
5.5 pp
) and
lower
pricing (
1.8 pp
). Volume/mix was
unfavorable
across several categories and was most pronounced in cheese, coffee, and boxed dinners, primarily due to delayed execution of go-to-market agreements with key retailers, retail distribution losses (primarily in cheese), and lower inventory levels at retail versus the prior year. Lower pricing was due to higher promotional activity, primarily in cheese.
Segment Adjusted EBITDA increased
0.7%
to
$636 million
in 2017 compared to
$632 million
in 2016, despite the
favorable
impact of foreign currency (
1.7 pp
). Excluding the currency impact, Segment Adjusted EBITDA decreased primarily due to lower Organic Net Sales partially offset by Integration Program savings and lower overhead costs in 2017.
EMEA
:
|
2018 Compared to 2017
|
2017 Compared to 2016
|
||||||||||||||||||||
|
As Restated & Recast
|
As Restated & Recast
|
||||||||||||||||||||
|
December 29,
2018 |
December 30,
2017 |
% Change
|
December 30,
2017 |
December 31,
2016 |
% Change
|
||||||||||||||||
|
(in millions)
|
(in millions)
|
||||||||||||||||||||
|
Net sales
|
$
|
2,718
|
|
$
|
2,585
|
|
5.1
|
%
|
$
|
2,585
|
|
$
|
2,586
|
|
—
|
%
|
|||||
|
Organic Net Sales
(a)
|
2,633
|
|
2,529
|
|
4.1
|
%
|
2,549
|
|
2,529
|
|
0.8
|
%
|
|||||||||
|
Segment Adjusted EBITDA
|
724
|
|
673
|
|
7.6
|
%
|
673
|
|
741
|
|
(9.3
|
)%
|
|||||||||
|
(a)
|
Organic Net Sales is a non-GAAP financial measure. See the
Non-GAAP Financial Measures
section within this item.
|
37
Fiscal
Year
2018 Compared to Fiscal
Year
2017:
Net sales
increased
5.1%
to
$2.7 billion
in 2018 compared to
$2.6 billion
in 2017 driven by the favorable impact of foreign currency (
2.5 pp
), partially offset by the
unfavorable
impact of acquisitions and divestitures (
1.5 pp
). Organic Net Sales
increased
4.1%
to
$2.6 billion
in 2018 compared to
$2.5 billion
in 2017 driven by
favorable
volume/mix (
3.2 pp
) and
higher
pricing (
0.9 pp
). Favorable volume/mix was primarily driven by growth in condiments and sauces, including the addition of Kraft products in certain regions, and gains in foodservice. Pricing was
higher
, primarily driven by higher pricing in Middle East and Africa, and favorable timing of promotional activity versus the prior year in the UK, partially offset by lower pricing in eastern Europe.
Segment Adjusted EBITDA
increased
7.6%
to
$724 million
in 2018 compared to
$673 million
in 2017, including the
favorable
impact of foreign currency (
3.2 pp
). Excluding the currency impact, the increase was primarily driven by Organic Net Sales growth, productivity savings, and the benefit from the postemployment benefits accounting change adopted in the first quarter of 2018, partially offset by higher supply chain costs in the Middle East and Africa.
Fiscal
Year
2017 Compared to Fiscal
Year
2016:
Net sales were
flat
at
$2.6 billion
in 2017 and in 2016, despite the
unfavorable
impacts of foreign currency (
0.5 pp
) and acquisitions and divestitures (
0.3 pp
). Organic Net Sales
increased
0.8%
to
$2.5 billion
in 2017 compared to
$2.5 billion
in 2016 driven by
favorable
volume/mix (
1.3 pp
), partially offset by
lower
pricing (
0.5 pp
). Favorable volume/mix was primarily driven by higher shipments in foodservice and growth in condiments and sauces, partially offset by ongoing declines in infant nutrition in Italy. Pricing was
lower
, primarily driven by higher promotional activity in the UK and Italy versus the prior period, partially offset by higher pricing in the Middle East and Africa.
Segment Adjusted EBITDA
decreased
9.3%
to
$673 million
in 2017 compared to
$741 million
in 2016, including the
unfavorable
impact of foreign currency (
1.4 pp
). Excluding the currency impact, the decrease was due to higher input costs in local currency, partially offset by productivity savings.
Rest of World:
|
2018 Compared to 2017
|
2017 Compared to 2016
|
||||||||||||||||||||
|
As Restated & Recast
|
As Restated & Recast
|
||||||||||||||||||||
|
December 29,
2018 |
December 30,
2017 |
% Change
|
December 30,
2017 |
December 31,
2016 |
% Change
|
||||||||||||||||
|
(in millions)
|
(in millions)
|
||||||||||||||||||||
|
Net sales
|
$
|
3,255
|
|
$
|
3,084
|
|
5.6
|
%
|
$
|
3,084
|
|
$
|
2,943
|
|
4.8
|
%
|
|||||
|
Organic Net Sales
(a)
|
3,172
|
|
2,940
|
|
7.9
|
%
|
3,049
|
|
2,888
|
|
5.6
|
%
|
|||||||||
|
Segment Adjusted EBITDA
|
635
|
|
590
|
|
7.5
|
%
|
590
|
|
621
|
|
(5.0
|
)%
|
|||||||||
|
(a)
|
Organic Net Sales is a non-GAAP financial measure. See the
Non-GAAP Financial Measures
section within this item.
|
Fiscal
Year
2018 Compared to Fiscal
Year
2017:
Net sales
increased
5.6%
to
$3.3 billion
in 2018 compared to
$3.1 billion
in 2017, despite the
unfavorable
impact of foreign currency (
7.6 pp
, including 5.1 pp from the devaluation of the Venezuelan bolivar), which more than offset the
favorable
impact of acquisitions and divestitures (
5.3 pp
). Organic Net Sales
increased
7.9%
to
$3.2 billion
in 2018 compared to
$2.9 billion
in 2017 driven by
higher
pricing (
5.4 pp
) and
favorable
volume/mix (
2.5 pp
). Pricing was
higher
primarily driven by highly inflationary environments in certain markets within Latin America. Favorable volume/mix was driven by growth across several categories, which was most pronounced in condiments and sauces, partially offset by lower shipments in Southeast Asia.
Segment Adjusted EBITDA increased
7.5%
to
$635 million
in 2018 compared to
$590 million
in 2017, despite the
unfavorable
impact of foreign currency (
12.7 pp
, including 11.4 pp from the devaluation of the Venezuelan bolivar). Excluding the currency impact, the increase in Segment Adjusted EBITDA was primarily driven by Organic Net Sales growth, partially offset by higher input costs in local currency.
38
Fiscal
Year
2017 Compared to Fiscal
Year
2016:
Net sales
increased
4.8%
to
$3.1 billion
in 2017 compared to
$2.9 billion
in 2016, despite the
unfavorable
impact of foreign currency (
0.8 pp
, including 2.0 pp from the devaluation of the Venezuelan bolivar). Organic Net Sales
increased
5.6%
to
$3.0 billion
in 2017 compared to
$2.9 billion
in 2016 driven by
higher
pricing (
4.2 pp
) and
favorable
volume/mix (
1.4 pp
). Higher pricing was primarily driven by pricing actions taken to offset higher input costs in local currency, primarily in Latin America. Favorable volume/mix was primarily driven by growth in condiments and sauces across all regions partially offset by volume/mix declines in several markets associated with distributor network re-alignment.
Segment Adjusted EBITDA
decreased
5.0%
to
$590 million
in 2017 compared to
$621 million
in 2016, including the
unfavorable
impact of foreign currency (
2.9 pp
, including 3.5 pp from the devaluation of the Venezuelan bolivar). Excluding the currency impact, Segment Adjusted EBITDA decreased primarily due to higher input costs in local currency and higher commercial investments, partially offset by Organic Net Sales growth.
Critical Accounting Estimates
Note 3,
Significant Accounting Policies
, in Item 8,
Financial Statements and Supplementary Data
, includes a summary of the significant accounting policies we used to prepare our consolidated financial statements. The following is a review of the more significant assumptions and estimates as well as accounting policies we used to prepare our consolidated financial statements.
Revenue Recognition:
Our revenues are primarily derived from customer orders for the purchase of our products. We recognize revenues as performance obligations are fulfilled when control passes to our customers. We record revenues net of variable consideration, including consumer incentives and performance obligations related to trade promotions, excluding taxes, and including all shipping and handling charges billed to customers (accounting for shipping and handling charges that occur after the transfer of control as fulfillment costs). We also record a refund liability for estimated product returns and customer allowances as reductions to revenues within the same period that the revenue is recognized. We base these estimates principally on historical and current period experience factors. We recognize costs paid to third party brokers to obtain contracts as expenses as our contracts are generally less than one year.
Advertising, Consumer Incentives, and Trade Promotions:
We promote our products with advertising, consumer incentives, and performance obligations related to trade promotions. Consumer incentives and trade promotions include, but are not limited to, discounts, coupons, rebates, performance-based in-store display activities, and volume-based incentives. Variable consideration related to consumer incentive and trade promotion activities is recorded as a reduction to revenues based on amounts estimated as being due to customers and consumers at the end of a period. We base these estimates principally on historical utilization, redemption rates, and/or current period experience factors. We review and adjust these estimates at least quarterly based on actual experience and other information.
Advertising expenses are recorded in selling, general and administrative expenses (“SG&A”). For interim reporting purposes, we charge advertising to operations as a percentage of estimated full year sales activity and marketing costs. We review and adjust these estimates each quarter based on actual experience and other information. We recorded advertising expenses of
$584 million
in 2018,
$629 million
in 2017, and
$708 million
in 2016, which represented costs to obtain physical advertisement spots in television, radio, print, digital, and social channels. The decrease in advertising expenses in 2018 compared to 2017 was driven by a shift from traditional ad spaces to non-traditional ad spaces. We also incur other advertising and marketing costs such as shopper marketing, sponsorships, and agency advertisement conception, design, and public relations fees. Total advertising and marketing costs were
$1,140 million
in 2018,
$1,115 million
in 2017, and
$1,221 million
in 2016.
Goodwill and Intangible Assets:
Our goodwill balance consists of
20
reporting units and had an aggregate carrying amount of
$36.5 billion
as of
December 29, 2018
.
Our indefinite-lived intangible asset balance primarily consists of a number of individual brands, which had an aggregate carrying amount of
$44.0 billion
as of
December 29, 2018
.
39
We test our reporting units and brands for impairment annually as of the first day of our second quarter, or more frequently if events or circumstances indicate it is more likely than not that the fair value of a reporting unit or brand is less than its carrying amount. Such events and circumstances could include a sustained decrease in our market capitalization, increased competition or unexpected loss of market share, increased input costs beyond projections (for example due to regulatory or industry changes), disposals of significant brands or components of our business, unexpected business disruptions (for example due to a natural disaster or loss of a customer, supplier, or other significant business relationship), unexpected significant declines in operating results, or significant adverse changes in the markets in which we operate. We test reporting units for impairment by comparing the estimated fair value of each reporting unit with its carrying amount. We test brands for impairment by comparing the estimated fair value of each brand with its carrying amount. If the carrying amount of a reporting unit or brand exceeds its estimated fair value, we record an impairment loss based on the difference between fair value and carrying amount, in the case of reporting units, not to exceed to the associated carrying amount of goodwill.
Fair value determinations require considerable judgment and are sensitive to changes in underlying assumptions, estimates, and market factors. Estimating the fair value of individual
reporting units and brands
requires us to make assumptions and estimates regarding our future plans, as well as industry, economic, and regulatory conditions. These assumptions and estimates include
estimated future annual net cash flows, income tax considerations, discount rates, growth rates, royalty rates, contributory asset charges
, and other market factors. If current expectations of future growth rates and margins are not met, if market factors outside of our control, such as discount rates, change, or if management’s expectations or plans otherwise change, including as a result of the development of our global five-year operating plan, then one or more of our
reporting units or brands
might become impaired in the future.
As detailed in Note 10,
Goodwill and Intangible Assets
, in Item 8,
Financial Statements and Supplementary Data
, we recorded impairment losses totaling
$15.9 billion
for the year ended December 29, 2018.
Our
reporting units and brands
that were impaired in 2018 were written down to their respective fair values resulting in zero excess fair value over carrying amount as of their latest 2018 impairment testing dates. Accordingly, these and other individual
reporting units and brands
that have
20%
or less excess fair value over carrying amount as of their latest testing date have a heightened risk of future impairments if any assumptions, estimates, or market factors change in the future.
Reporting units with a heightened risk of future impairments had an aggregate goodwill carrying amount of
$29.0 billion
at December 29, 2018 and included: U.S. Grocery, U.S. Refrigerated, Canada Retail, Latin America Exports, Southeast Europe, Australia and New Zealand, and Northeast Asia.
Of the
$29.0 billion
with a heightened risk of future impairments,
$9.3 billion
is attributable to
reporting units
with
0%
excess fair value over carrying amount.
Brands with a heightened risk of future impairments had an aggregate carrying amount of
$29.3 billion
at December 29, 2018 and included:
Kraft
,
Philadelphia
,
Oscar Mayer
,
Velveeta
,
Miracle Whip
,
Planters
,
A1
,
Cool Whip
,
Stove Top
,
ABC
, and
Quero
.
Of the
$29.3 billion
with a heightened risk of future impairments,
$24.0 billion
is attributable to
brands
with
0%
excess fair value over carrying amount.
Although the remaining
reporting units and brands
have more than
20%
excess fair value over carrying amount as of their latest 2018 impairment testing date, these amounts are also associated with the 2013 Heinz acquisition and the 2015 Merger and are recorded on the balance sheet at their estimated acquisition date fair values. Therefore, if any assumptions, estimates, or market factors change in the future, these amounts are also susceptible to impairments
.
We generally utilize the discounted cash flow method under the income approach to estimate the fair value of our reporting units. Some of the more significant assumptions inherent in estimating the fair values include the estimated future annual net cash flows for each reporting unit (including net sales, cost of products sold, SG&A, depreciation and amortization, working capital, and capital expenditures), income tax rates, long-term growth rates, and a discount rate that appropriately reflects the risks inherent in each future cash flow stream. We selected the assumptions used in the financial forecasts using historical data, supplemented by current and anticipated market conditions, estimated product category growth rates, management’s plans, and guideline companies.
We generally utilize the excess earnings method under the income approach to estimate the fair value of certain of our largest brands. Some of the more significant assumptions inherent in estimating the fair values include the estimated future annual net cash flows for each brand (including net sales, cost of products sold, and SG&A), contributory asset charges, income tax considerations, long-term growth rates, a discount rate that reflects the level of risk associated with the future earnings attributable to the brand, and management’s intent to invest in the brand indefinitely. We selected the assumptions used in the financial forecasts using historical data, supplemented by current and anticipated market conditions, estimated product category growth rates, management’s plans, and guideline companies.
We generally utilize the relief from royalty method under the income approach to estimate the fair value of our remaining brands. Some of the more significant assumptions inherent in estimating the fair values include the estimated future annual net sales for each brand, royalty rates (as a percentage of net sales that would hypothetically be charged by a licensor of the brand to an unrelated licensee), income tax considerations, long-term growth rates, a discount rate that reflects the level of risk associated with the future cost savings attributable to the brand, and management’s intent to invest in the brand indefinitely. We selected the assumptions used in the financial forecasts using historical data, supplemented by current and anticipated market conditions, estimated product category growth rates, management’s plans, and guideline companies.
40
The discount rates, long-term growth rates, and royalty rates we used to estimate the fair values of our reporting units and brands with 20% or less excess fair value over carrying amount, as of the latest 2018 impairment testing date for each reporting unit or brand, were as follows:
|
Goodwill Carrying Value
(in billions)
|
Discount Rate
|
Long-Term Growth Rate
|
Royalty Rate
|
||||||||||||||||||
|
Minimum
|
Maximum
|
Minimum
|
Maximum
|
Minimum
|
Maximum
|
||||||||||||||||
|
Reporting units
|
$
|
29.0
|
|
7.0
|
%
|
10.7
|
%
|
1.5
|
%
|
4.7
|
%
|
||||||||||
|
Brands
(excess earnings method)
|
24.4
|
|
7.5
|
%
|
7.5
|
%
|
0.8
|
%
|
2.1
|
%
|
|||||||||||
|
Brands
(relief from royalty method)
|
4.9
|
|
7.5
|
%
|
10.2
|
%
|
0.5
|
%
|
4.0
|
%
|
1.0
|
%
|
20.0
|
%
|
|||||||
Assumptions used in impairment testing are made at a point in time and require significant judgment; therefore, they are subject to change based on the facts and circumstances present at each annual and interim impairment test date. Additionally, these assumptions are generally interdependent and do not change in isolation. However, as it is reasonably possible that changes in assumptions could occur, as a sensitivity measure, we have presented the estimated effects of isolated changes in discount rates, long-term growth rates, and royalty rates for our reporting units and brands with 20% or less excess fair value over carrying amount. If we had changed the assumptions used to estimate the fair value of our reporting units and brands with 20% or less excess fair value over carrying amount, as of the latest testing date for each of these reporting units and brands, these isolated changes, which are reasonably possible to occur, would have led to the following increase/(decrease) in the aggregate fair value of these reporting units and brands (in billions):
|
Discount Rate
|
Long-Term Growth Rate
|
Royalty Rate
|
|||||||||||||||||||||
|
50-Basis-Point
|
25-Basis-Point
|
100-Basis-Point
|
|||||||||||||||||||||
|
Increase
|
Decrease
|
Increase
|
Decrease
|
Increase
|
Decrease
|
||||||||||||||||||
|
Reporting units
(a)
|
$
|
(5.3
|
)
|
$
|
6.3
|
|
$
|
2.6
|
|
$
|
(2.4
|
)
|
|||||||||||
|
Brands (excess earnings method)
(a)
|
(1.9
|
)
|
2.3
|
|
0.9
|
|
(0.8
|
)
|
|||||||||||||||
|
Brands (relief from royalty method)
(a)
|
(0.4
|
)
|
0.5
|
|
0.2
|
|
(0.2
|
)
|
$
|
0.4
|
|
$
|
(0.4
|
)
|
|||||||||
|
(a)
|
A reduction in fair value would not necessarily cause an impairment in all cases, but due to the low or zero excess fair value over carrying amount for these reporting units and brands, it is reasonably possible that a reduction in fair value would lead to an impairment.
|
Definite-lived intangible assets are amortized on a straight-line basis over the estimated periods benefited. We review definite-lived intangible assets for impairment when conditions exist that indicate the carrying amount of the assets may not be recoverable. Such conditions could include significant adverse changes in the business climate, current-period operating or cash flow losses, significant declines in forecasted operations, or a current expectation that an asset group will be disposed of before the end of its useful life. We perform undiscounted operating cash flow analyses to determine if an impairment exists. When testing for impairment of definite-lived intangible assets held for use, we group assets at the lowest level for which cash flows are separately identifiable. If an impairment is determined to exist, the loss is calculated based on estimated fair value. Impairment losses on definite-lived intangible assets to be disposed of, if any, are based on the estimated proceeds to be received, less costs of disposal.
See Note 10,
Goodwill and Intangible Assets
, in Item 8,
Financial Statements and Supplementary Data
, for details related to our 2018 impairment testing.
Although our annual impairment test is performed during the second quarter, we perform a qualitative assessment each interim reporting period to determine if it is more likely than not that the fair value of any reporting unit is below its carrying amount. While we have not completed such impairment assessment for the first fiscal quarter of 2019, nor have we completed our 2019 annual impairment testing as of the first day of our second fiscal quarter, it is reasonably possible that an impairment of certain reporting units or brands could occur based on continued industry trends impacting our results of operations.
Postemployment Benefit Plans:
We maintain various retirement plans for the majority of our employees. These include pension benefits, postretirement health care benefits, and defined contribution benefits. The cost of these plans is charged to expense over an appropriate term based on, among other things, the cost component and whether the plan is active or inactive. Changes in the fair value of our plan assets result in net actuarial gains or losses. These net actuarial gains and losses are deferred into accumulated other comprehensive income/(losses) and amortized within other expense/(income), net in future periods using the corridor approach. The corridor is
10%
of the greater of the market-related value of the plan’s asset or projected benefit obligation. Any actuarial gains and losses in excess of the corridor are then amortized over an appropriate term based on whether the plan is active or inactive.
41
For our postretirement benefit plans, our 2019 health care cost trend rate assumption will be 6.7%. We established this rate based upon our most recent experience as well as our expectation for health care trend rates going forward. We anticipate the weighted average assumed ultimate trend rate will be 4.9%. The year in which the ultimate trend rate is reached varies by plan, ranging between the years 2019 and 2030. Assumed health care cost trend rates have a significant effect on the amounts reported for the health care plans. A one-percentage-point change in assumed health care cost trend rates would have had the following effects, increase/(decrease) in cost and obligation, as of
December 29, 2018
(in millions):
|
One-Percentage-Point
|
|||||||
|
Increase
|
(Decrease)
|
||||||
|
Effect on annual service and interest cost
|
$
|
3
|
|
$
|
(3
|
)
|
|
|
Effect on postretirement benefit obligation
|
48
|
|
(41
|
)
|
|||
Our 2019 discount rate assumption will be 4.3% for service cost and 4.1% for interest cost for our postretirement plans. Our 2019 discount rate assumption will be 4.6% for service cost and 4.4% for interest cost for our U.S. pension plans and 3.4% for service cost and 3.3% for interest cost for our non-U.S. pension plans. We model these discount rates using a portfolio of high quality, fixed-income debt instruments with durations that match the expected future cash flows of the plans. Changes in our discount rates were primarily the result of changes in bond yields year-over-year.
In 2016, we changed the method we use to estimate the service cost and interest cost components of net pension cost/(benefit) and net postretirement benefit plan costs resulting in a decrease to these cost components. We now use a full yield curve approach to estimate service cost and interest cost by applying the specific spot rates along the yield curve used to determine the benefit obligation to the relevant projected cash flows. Previously, we estimated service cost and interest cost using a single weighted-average discount rate derived from the yield curve used to measure the benefit obligation at the beginning of the period. We made this change to provide a more precise measurement of service cost and interest cost by improving the correlation between projected benefit cash flows and the corresponding spot yield curve rates. This change will not affect the measurement of our total benefit obligations. We accounted for this change prospectively as a change in accounting estimate.
Our 2019 expected return on plan assets will be 5.4% (net of applicable taxes) for our postretirement plans. Our 2019 expected rate of return on plan assets will be 5.7% for our U.S. pension plans and 5.4% for our non-U.S. pension plans. We determine our expected rate of return on plan assets from the plan assets’ historical long-term investment performance, current and future asset allocation, and estimates of future long-term returns by asset class. We attempt to maintain our target asset allocation by re-balancing between asset classes as we make contributions and monthly benefit payments.
While we do not anticipate further changes in the 2019 assumptions for our U.S. and non-U.S. pension and postretirement benefit plans, as a sensitivity measure, a 100-basis-point change in our discount rate or a 100-basis-point change in the expected rate of return on plan assets would have the following effects, increase/(decrease) in cost (in millions):
|
U.S. Plans
|
Non-U.S. Plans
|
||||||||||||||
|
100-Basis-Point
|
100-Basis-Point
|
||||||||||||||
|
Increase
|
Decrease
|
Increase
|
Decrease
|
||||||||||||
|
Effect of change in discount rate on pension costs
|
$
|
11
|
|
$
|
(17
|
)
|
$
|
(2
|
)
|
$
|
(7
|
)
|
|||
|
Effect of change in expected rate of return on plan assets on pension costs
|
(41
|
)
|
41
|
|
(27
|
)
|
27
|
|
|||||||
|
Effect of change in discount rate on postretirement costs
|
(8
|
)
|
1
|
|
—
|
|
(1
|
)
|
|||||||
|
Effect of change in expected rate of return on plan assets on postretirement costs
|
(10
|
)
|
10
|
|
—
|
|
—
|
|
|||||||
42
Income Taxes:
We compute our annual tax rate based on the statutory tax rates and tax planning opportunities available to us in the various jurisdictions in which we earn income. Significant judgment is required in determining our annual tax rate and in evaluating the uncertainty of our tax positions. We recognize a benefit for tax positions that we believe will more likely than not be sustained upon examination. The amount of benefit recognized is the largest amount of benefit that we believe has more than a 50% probability of being realized upon settlement. We regularly monitor our tax positions and adjust the amount of recognized tax benefit based on our evaluation of information that has become available since the end of our last financial reporting period. The annual tax rate includes the impact of these changes in recognized tax benefits. When adjusting the amount of recognized tax benefits, we do not consider information that has become available after the balance sheet date, however we do disclose the effects of new information whenever those effects would be material to our financial statements. Unrecognized tax benefits represent the difference between the amount of benefit taken or expected to be taken in a tax return and the amount of benefit recognized for financial reporting. These unrecognized tax benefits are recorded primarily within other non-current liabilities on the consolidated balance sheets.
We record valuation allowances to reduce deferred tax assets to the amount that is more likely than not to be realized. When assessing the need for valuation allowances, we consider future taxable income and ongoing prudent and feasible tax planning strategies. Should a change in circumstances lead to a change in judgment about the realizability of deferred tax assets in future years, we would adjust related valuation allowances in the period that the change in circumstances occurs, along with a corresponding increase or decrease to income. The resolution of tax reserves and changes in valuation allowances could be material to our results of operations for any period but is not expected to be material to our financial position.
New Accounting Pronouncements
See Note 4,
New Accounting Standards
, in Item 8,
Financial Statements and Supplementary Data
, for a discussion of new accounting pronouncements.
Contingencies
See Note 18,
Commitments and Contingencies
, in Item 8,
Financial Statements and Supplementary Data
, for a discussion of our contingencies.
Commodity Trends
We purchase and use large quantities of commodities, including dairy products, meat products, coffee beans, nuts, tomatoes, potatoes, soybean and vegetable oils, sugar and other sweeteners, corn products, and wheat products to manufacture our products. In addition, we purchase and use significant quantities of resins, metals, and cardboard to package our products and natural gas to operate our facilities. We continuously monitor worldwide supply and cost trends of these commodities.
We define our key commodities in the United States and Canada as dairy, meat, coffee, and nuts. In 2018, we experienced cost decreases for dairy, coffee, and meat, while costs for nuts increased. We manage commodity cost volatility primarily through pricing and risk management strategies. As a result of these risk management strategies, our commodity costs may not immediately correlate with market price trends.
Dairy commodities, primarily milk and cheese, are the most significant cost components of our cheese products. We purchase our dairy raw material requirements from independent third parties, such as agricultural cooperatives and independent processors. Market supply and demand, as well as government programs, significantly influence the prices for milk and other dairy products. Significant cost components of our meat products include pork, beef, and poultry, which we primarily purchase from applicable local markets. Livestock feed costs and the global supply and demand for U.S. meats influence the prices of these meat products. The most significant cost component of our coffee products is coffee beans, which we purchase on global markets. Quality and availability of supply, currency fluctuations, and consumer demand for coffee products impact coffee bean prices. The most significant cost components in our nut products include peanuts, cashews, and almonds, which we purchase on both domestic and global markets, where global market supply and demand is the primary driver of prices.
Liquidity and Capital Resources
We believe that cash generated from our operating activities, commercial paper programs, and Senior Credit Facility will provide sufficient liquidity to meet our working capital needs, future contractual obligations (including repayments of long-term debt), payment of our anticipated quarterly dividends, planned capital expenditures, restructuring expenditures, and contributions to our postemployment benefit plans. An additional potential source of liquidity is access to capital markets. We intend to use our cash on hand and our commercial paper programs for daily funding requirements. Overall, while, as noted above, we are not currently eligible to use a registration statement on Form S-3, we do not expect any negative effects on our funding sources that would have a material effect on our short-term or long-term liquidity.
43
During the period from December 29, 2018 to the filing date of this Annual Report on Form 10-K, due to the delays in the preparation of our financial statements for the fiscal year ended December 29, 2018 and the fiscal quarter ended March 30, 2019, we were not in compliance with certain reporting covenants under the Senior Credit Facility and certain indentures. As a result, we obtained temporary waivers from certain creditors under our indebtedness instruments. The filing of this Annual Report on Form 10-K will constitute compliance with the requirement to furnish the lenders a copy of the consolidated financial statements for our fiscal year ended December 29, 2018 no later than June 28, 2019. We also currently expect to file our Quarterly Report on Form 10-Q for the quarter ended March 30, 2019 on or before July 31, 2019 in compliance with the requirement to furnish the lenders a copy of the consolidated financial statements for such quarter no later than July 31, 2019. See the “Total Debt” section below for additional information.
Cash Flow Activity for 2018 Compared to 2017:
Net Cash Provided by/Used for Operating Activities:
Net cash provided by operating activities was
$2.6 billion
for the
year
ended
December 29, 2018
compared to
$501 million
for the
year
ended
December 30, 2017
. This increase was primarily driven by decreased postemployment benefit contributions in 2018, the timing of income tax payments, higher collections on trade receivables as fewer were non-cash exchanged for sold receivables in connection with the unwind of all of our accounts receivable securitization and factoring programs (the “Programs”) in 2018, and decreased cash payments for employee bonuses in 2018. These increases in cash provided by operating activities were partially offset by unfavorable changes in accounts payable, primarily due to the timing of payments.
Net Cash Provided by/Used for Investing Activities:
Net cash provided by investing activities was
$288 million
for the
year
ended
December 29, 2018
compared to
$1.2 billion
for the
year
ended
December 30, 2017
. This decrease was primarily due to lower cash collections on previously sold receivables of
$990 million
, as we unwound all of our Programs in 2018, and cash payments to acquire businesses in 2018, primarily Cerebos Pacific Limited. These decreases in cash provided by investing activities were partially offset by decreased capital expenditures, which was driven by the wind-up of Integration Program footprint costs in the prior year. We expect 2019 capital expenditures to be approximately $800 million. Refer to Item 8,
Financial Statements and Supplementary Data
, including Note 17,
Financing Arrangements
, for additional information on our Programs, Note 5,
Acquisitions and Divestitures
, for additional information on our 2018 acquisitions, and Note 6,
Integration and Restructuring Expenses
, for additional information on the Integration Program.
Net Cash Provided by/Used for Financing Activities:
Net cash used for financing activities was
$3.4 billion
for the
year
ended
December 29, 2018
compared to
$4.2 billion
for the
year
ended
December 30, 2017
. This decrease was primarily driven by increased proceeds from long-term debt issuances, which more than offset increased cash distributions related to our dividends, higher net repayments of commercial paper, and higher repayments of long-term debt. See Note 19,
Debt
, in Item 8,
Financial Statements and Supplementary Data
, for additional information on our long-term debt issuances and repayments. See
Equity and Dividends
in this item for additional information on our dividends.
Cash Flow Activity for 2017 Compared to 2016:
Net Cash Provided by/Used for Operating Activities:
Net cash provided by operating activities was
$501 million
for the year ended
December 30, 2017
compared to
$2.6 billion
for the year ended
December 31, 2016
. The decrease in cash provided by operating activities was primarily driven by the $1.2 billion pre-funding of our postretirement benefit plans in 2017, lower collections on receivables as more were non-cash exchanged for sold receivables, favorable changes in accounts payable from vendor payment term renegotiations that were less pronounced than the prior year, and increased cash payments of employee bonuses in 2017. The decrease in cash provided by operating activities was partially offset by lower cash payments for income taxes in 2017 driven by our pre-funding of postretirement plan benefits following U.S. Tax Reform enactment on December 22, 2017.
Net Cash Provided by/Used for Investing Activities
:
Net cash provided by investing activities was
$1.2 billion
for the year ended
December 30, 2017
compared to
$1.5 billion
for the year ended
December 31, 2016
. The decrease in cash provided by investing activities was primarily due to lower cash inflows from our Programs, as well as lower proceeds from cash settlements on net investment hedges. Capital expenditures were flat in 2017 compared to 2016.
Net Cash Provided by/Used for Financing Activities:
Net cash used for financing activities was
$4.2 billion
for the year ended
December 30, 2017
compared to
$4.6 billion
for the year ended
December 31, 2016
. The decrease was driven by the benefit of fewer dividend payments in 2017 compared to 2016, which more than offset higher net repayments of long-term debt and commercial paper in 2017 compared to 2016, including cash outflows associated with the redemption of our Series A Preferred Stock in 2016. Dividend payments were lower in 2017 compared to 2016 due to the absence of the Series A Preferred Stock dividend and the impact of four common stock cash distributions in 2017 compared to five such distributions in 2016. See
Equity and Dividends
for additional information on cash distributions related to common stock and Series A Preferred Stock.
44
Cash Held by International Subsidiaries:
Of the
$1.1 billion
cash and cash equivalents on our consolidated balance sheet at
December 29, 2018
, $923 million was held by international subsidiaries.
We consider the unremitted current year earnings of certain international subsidiaries that impose local country taxes on dividends to be indefinitely reinvested. For those undistributed earnings considered to be indefinitely reinvested, our intent is to reinvest these funds in our international operations, and our current plans do not demonstrate a need to repatriate the accumulated earnings to fund our U.S. cash requirements. The amount of unrecognized deferred tax liabilities for local country withholding taxes that would be owed related to our current year earnings of certain international subsidiaries is approximately
$20 million
.
Our historic earnings in foreign subsidiaries through December 30, 2017 are undistributed and currently not considered to be indefinitely reinvested. As of December 29, 2018, we have recorded a deferred tax liability of
$78 million
on
$1.2 billion
of historic earnings related to local withholding taxes that will be owed when this cash is distributed.
Total Debt:
We obtain funding through our U.S. and European commercial paper programs. At
December 29, 2018
, we had
no
commercial paper outstanding. At
December 30, 2017
, we had commercial paper outstanding of
$448 million
with a weighted average interest rate of
1.541%
. The maximum amount of commercial paper outstanding during the
year
ended
December 29, 2018
was
$1.1 billion
.
We maintain our $4.0 billion Senior Credit Facility, and subject to certain conditions, we may increase the amount of revolving commitments and/or add additional tranches of term loans in a combined aggregate amount of up to $1.0 billion. No amounts were drawn on our Senior Credit Facility at
December 29, 2018
, at
December 30, 2017
, or during the years ended
December 29, 2018
,
December 30, 2017
, and
December 31, 2016
.
In June 2018, we entered into an agreement that became effective on July 6, 2018 to extend the maturity date of our Senior Credit Facility from July 6, 2021 to July 6, 2023 and to establish a
$400 million
euro equivalent swing line facility, which is available under the
$4.0 billion
revolving credit facility limit for short-term loans denominated in euros on a same-day basis.
The Senior Credit Facility contains representations, warranties, and covenants that are typical for these types of facilities and could upon the occurrence of certain events of default restrict our ability to access our Senior Credit Facility. We were in compliance with all financial covenants during the year ended
December 29, 2018
.
During the period from December 29, 2018 to the filing date of this Annual Report on Form 10-K, due to the delays in the preparation of our financial statements for the fiscal year ended December 29, 2018 and the fiscal quarter ended March 30, 2019, we were not in compliance with certain reporting covenants under the Senior Credit Facility.
However, as previously disclosed, on March 22, 2019, we entered into a Waiver and Consent No. 1 (the “Original Waiver”) with respect to the Senior Credit Facility, pursuant to which the lenders party thereto and JPMorgan Chase Bank, N.A., as administrative agent, granted a temporary waiver of compliance by us with respect to the requirement to furnish the lenders a copy of the consolidated financial statements for our fiscal year ended December 29, 2018. Pursuant to the Original Waiver, we were required to provide consolidated financial statements no later than May 14, 2019. Due to additional delays in our financial reporting, on May 10, 2019, we entered into a Waiver and Consent No. 2 (the “Second Waiver”) with respect to the Senior Credit Facility, pursuant to which the lenders, as party to the Senior Credit Facility, and JPMorgan Chase Bank, N.A., as administrative agent, granted a temporary waiver of compliance by us with respect to the requirements to furnish the lenders copies of the consolidated financial statements for our fiscal year ended December 29, 2018 and for the fiscal quarter ended March 30, 2019. Pursuant to the Second Waiver and in order to remedy our noncompliance, we are required to provide consolidated financial statements for our fiscal year ended December 29, 2018 no later than June 28, 2019 and for our fiscal quarter ended March 30, 2019 no later than July 31, 2019. If we had not obtained these waivers, we would not have been able to access our Senior Credit Facility.
Our long-term debt, including the current portion, was
$31.1 billion
at
December 29, 2018
and
$31.0 billion
at
December 30, 2017
.
Our long-term debt contains customary representations, covenants, and events of default. We were in compliance with all financial covenants during the year ended
December 29, 2018
.
During the period from December 29, 2018 to the filing date of this Annual Report on Form 10-K, due to the delays in the preparation of our financial statements for the fiscal year ended December 29, 2018 and the fiscal quarter ended March 30, 2019, we were not in compliance with certain reporting covenants under certain indentures. The filing of this Annual Report on Form 10-K will constitute compliance with the requirement to furnish the lenders a copy of the consolidated financial statements for our fiscal year ended December 29, 2018 no later than June 28, 2019. We also currently expect to file our Quarterly Report on Form 10-Q for the quarter ended March 30, 2019 on or before July 31, 2019 in compliance with the requirement to furnish the lenders a copy of the consolidated financial statements for such quarter no later than July 31, 2019.
45
Under our existing indentures, if we do not file required reports within specified time periods, the trustee or holders of at least
30%
in the case of our Second Lien Senior Secured Notes due 2025 and
25%
in the case of any other series of notes may deliver a notice of default for such series of notes which would commence the applicable cure period under such indenture. As of June 5, 2019, none of the cure periods under our existing indentures have been triggered in connection with our failure to comply with the respective reporting covenants set forth in such indentures. However, if a cure period is triggered under such indentures and we fail to file our annual and interim financial statements within such cure period, any outstanding notes issued thereunder would become callable.
Our senior notes maturing in 2019 and 2020 include aggregate principal amounts of approximately
$350 million
in August 2019, approximately $900 million in February 2020, and approximately 800 million Canadian dollars and $1.5 billion in July 2020. We expect to fund these long-term debt repayments primarily with cash on hand, cash generated from our operating activities, proceeds from our divestiture in Canada, and potential new issuances of short-term or long-term debt.
See Note 19,
Debt
, in Item 8,
Financial Statements and Supplementary Data
, for additional information related to our long-term debt.
Off-Balance Sheet Arrangements and Aggregate Contractual Obligations
Off-Balance Sheet Arrangements:
We do not have guarantees or other off-balance sheet financing arrangements that we believe are reasonably likely to have a current or future effect on our financial condition, changes in financial condition, revenue or expenses, results of operations, liquidity, capital expenditures, or capital resources.
We have utilized accounts receivable securitization and factoring programs globally for our working capital needs and to provide efficient liquidity.
During 2018, we had Programs in place in various countries across the globe.
In the second quarter of 2018, we unwound our U.S. securitization program, which represented the majority of our Programs, using proceeds from the issuance of long-term debt in June 2018.
As of
December 29, 2018
, we have unwound all of our Programs.
See Note 17,
Financing Arrangements
, in Item 8,
Financial Statements and Supplementary Data
, for a discussion of our Programs and other financing arrangements.
Aggregate Contractual Obligations:
The following table summarizes our contractual obligations at
December 29, 2018
(in millions):
|
Payments Due
|
||||||||||||||
|
2019
|
2020-2021
|
2022-2023
|
2024 and Thereafter
|
Total
|
||||||||||
|
Long-term debt
(a)
|
1,641
|
|
6,369
|
|
8,046
|
|
32,195
|
|
48,251
|
|
||||
|
Capital leases
(b)(f)
|
27
|
|
98
|
|
27
|
|
85
|
|
237
|
|
||||
|
Operating leases
(c)(f)
|
185
|
|
242
|
|
119
|
|
148
|
|
694
|
|
||||
|
Purchase obligations
(d)(f)
|
1,569
|
|
1,162
|
|
497
|
|
217
|
|
3,445
|
|
||||
|
Other long-term liabilities
(e)
|
41
|
|
83
|
|
98
|
|
203
|
|
425
|
|
||||
|
Total
|
3,463
|
|
7,954
|
|
8,787
|
|
32,848
|
|
53,052
|
|
||||
|
(a)
|
Amounts represent the expected cash payments of our long-term debt, including interest on variable and fixed rate long-term debt. Interest on variable rate long-term debt is calculated based on interest rates at
December 29, 2018
.
|
|
(b)
|
Amounts represent the expected cash payments of our capital leases, including expected cash payments of interest expense.
|
|
(c)
|
Operating leases represent the minimum rental commitments under non-cancelable operating leases.
|
|
(d)
|
We have purchase obligations for materials, supplies, property, plant and equipment, and co-packing, storage, and distribution services based on projected needs to be utilized in the normal course of business. Other purchase obligations include commitments for marketing, advertising, capital expenditures, information technology, and professional services. Arrangements are considered purchase obligations if a contract specifies all significant terms, including fixed or minimum quantities to be purchased, a pricing structure, and approximate timing of the transaction. Several of these obligations are long-term and are based on minimum purchase requirements. Certain purchase obligations contain variable pricing components, and, as a result, actual cash payments are expected to fluctuate based on changes in these variable components. Due to the proprietary nature of some of our materials and processes, certain supply contracts contain penalty provisions for early terminations. We do not believe that a material amount of penalties is reasonably likely to be incurred under these contracts based upon historical experience and current expectations. We exclude amounts reflected on the consolidated balance sheet as accounts payable and accrued liabilities from the table above.
|
|
(e)
|
Other long-term liabilities primarily consist of estimated payments for the one-time toll charge related to U.S. Tax Reform, as well as postretirement benefit commitments. Certain other long-term liabilities related to income taxes, insurance accruals, and other accruals included on the consolidated balance sheet are excluded from the above table as we are unable to estimate the timing of payments for these items.
|
|
(f)
|
As part of the restatement described in Note 2,
Restatement of Previously Issued Consolidated Financial Statements
, in Item 8,
Financial Statements and Supplementary Data
, certain amounts in prior years, if presented, would have been recategorized between capital leases, operating leases, and purchase
|
46
obligations as well as across future periods. There would have been no impact on the total future contractual obligations as of December 30, 2017 or December 31, 2016.
Pension plan contributions were
$57 million
in 2018. We estimate that 2019 pension plan contributions will be approximately
$15 million
. Beyond 2019, we are unable to reliably estimate the timing of contributions to our pension plans. Our actual contributions and plans may change due to many factors, including changes in tax, employee benefit, or other laws and regulations, tax deductibility, significant differences between expected and actual pension asset performance or interest rates, or other factors. As such, estimated pension plan contributions for 2019 have been excluded from the above table.
Postretirement benefit plan contributions were
$19 million
in 2018. We estimate that 2019 postretirement benefit plan contributions will be approximately
$15 million
. Beyond 2019, we are unable to reliably estimate the timing of contributions to our postretirement benefit plans. Our actual contributions and plans may change due to many factors, including changes in tax, employee benefit, or other laws and regulations, tax deductibility, significant differences between expected and actual postretirement plan asset performance or interest rates, or other factors. As such, estimated postretirement benefit plan contributions for 2019 have been excluded from the above table.
At
December 29, 2018
, the amount of net unrecognized tax benefits for uncertain tax positions, including an accrual of related interest and penalties along with positions only impacting the timing of tax benefits, was approximately
$445 million
. The timing of payments will depend on the progress of examinations with tax authorities. We do not expect a significant tax payment related to these obligations within the next year. We are unable to make a reasonably reliable estimate as to if or when any significant cash settlements with taxing authorities may occur; therefore, we have excluded the amount of net unrecognized tax benefits from the above table.
Equity and Dividends
Common Stock Dividends:
We paid common stock dividends of
$3.2 billion
in 2018,
$2.9 billion
in 2017, and
$3.6 billion
in 2016. Additionally, on February 21, 2019, our Board of Directors declared a cash dividend of $0.40 per share of common stock, which was payable on March 22, 2019 to shareholders of record on March 8, 2019. Additionally, on May 21, 2019, our Board of Directors declared a cash dividend of $0.40 per share of common stock, which is payable on June 14, 2019 to holders of record as of May 31, 2019.
The declaration of dividends is subject to the discretion of our Board of Directors and depends on various factors, including our net income, financial condition, cash requirements, future prospects, and other factors that our Board of Directors deems relevant to its analysis and decision making.
Series A Preferred Stock Dividends:
On June 7, 2016, we redeemed all outstanding shares of our Series A Preferred Stock. Accordingly, we no longer pay any associated dividends, and there were no such dividend payments in 2018 or 2017. Prior to the redemption, we made cash distributions of $180 million in 2016.
See Note 19,
Debt
, and Note 20,
Capital Stock
, in Item 8,
Financial Statements and Supplementary Data
, for additional information.
Non-GAAP Financial Measures
The non-GAAP financial measures we provide in this report should be viewed in addition to, and not as an alternative for, results prepared in accordance with U.S. GAAP.
To supplement the consolidated financial statements prepared in accordance with U.S. GAAP, we have presented Organic Net Sales, Adjusted EBITDA, and Adjusted EPS, which are considered non-GAAP financial measures. The non-GAAP financial measures presented may differ from similarly titled non-GAAP financial measures presented by other companies, and other companies may not define these non-GAAP financial measures in the same way. These measures are not substitutes for their comparable U.S. GAAP financial measures, such as net sales, net income/(loss), diluted earnings per common share (“EPS”), or other measures prescribed by U.S. GAAP, and there are limitations to using non-GAAP financial measures.
Management uses these non-GAAP financial measures to assist in comparing our performance on a consistent basis for purposes of business decision making by removing the impact of certain items that management believes do not directly reflect our underlying operations. Management believes that presenting our non-GAAP financial measures (i.e., Organic Net Sales, Adjusted EBITDA, and Adjusted EPS) is useful to investors because it (i) provides investors with meaningful supplemental information regarding financial performance by excluding certain items, (ii) permits investors to view performance using the same tools that management uses to budget, make operating and strategic decisions, and evaluate historical performance, and (iii) otherwise provides supplemental information that may be useful to investors in evaluating our results. We believe that the presentation of these non-GAAP financial measures, when considered together with the corresponding U.S. GAAP financial measures and the reconciliations
47
to those measures, provides investors with additional understanding of the factors and trends affecting our business than could be obtained absent these disclosures.
Organic Net Sales is defined as net sales excluding, when they occur, the impact of currency, acquisitions and divestitures, and a 53rd week of shipments. We calculate the impact of currency on net sales by holding exchange rates constant at the previous year’s exchange rate, with the exception of Venezuela, for which we calculate the previous year’s results using the current year’s exchange rate. Organic Net Sales is a tool that can assist management and investors in comparing our performance on a consistent basis by removing the impact of certain items that management believes do not directly reflect our underlying operations.
Adjusted EBITDA is defined as net income/(loss) from continuing operations before interest expense, other expense/(income), net, provision for/(benefit from) income taxes, and depreciation and amortization (excluding integration and restructuring expenses); in addition to these adjustments, we exclude, when they occur, the impacts of integration and restructuring expenses, deal costs, unrealized losses/(gains) on commodity hedges, impairment losses, losses/(gains) on the sale of a business, other losses/(gains) related to acquisitions and divestitures (e.g., tax and hedging impacts), nonmonetary currency devaluation (e.g., remeasurement gains and losses), and equity award compensation expense (excluding integration and restructuring expenses). Adjusted EBITDA is a tool that can assist management and investors in comparing our performance on a consistent basis by removing the impact of certain items that management believes do not directly reflect our underlying operations.
Adjusted EPS is defined as diluted earnings per share excluding, when they occur, the impacts of integration and restructuring expenses, deal costs, unrealized losses/(gains) on commodity hedges, impairment losses, losses/(gains) on the sale of a business, other losses/(gains) related to acquisitions and divestitures (e.g., tax and hedging impacts), nonmonetary currency devaluation (e.g., remeasurement gains and losses), and U.S. Tax Reform discrete income tax expense/(benefit), and including, when they occur, adjustments to reflect preferred stock dividend payments on an accrual basis. We believe Adjusted EPS provides important comparability of underlying operating results, allowing investors and management to assess operating performance on a consistent basis.
48
The Kraft Heinz Company
Reconciliation of Net Sales to Organic Net Sales
(dollars in millions)
(Unaudited)
|
Net Sales
|
Currency
|
Acquisitions and Divestitures
|
Organic Net Sales
|
Price
|
Volume/Mix
|
||||||||||||||
|
2018
|
|||||||||||||||||||
|
United States
|
$
|
18,122
|
|
$
|
—
|
|
$
|
—
|
|
$
|
18,122
|
|
|||||||
|
Canada
|
2,173
|
|
(5
|
)
|
—
|
|
2,178
|
|
|||||||||||
|
EMEA
|
2,718
|
|
66
|
|
19
|
|
2,633
|
|
|||||||||||
|
Rest of World
|
3,255
|
|
(75
|
)
|
158
|
|
3,172
|
|
|||||||||||
|
Kraft Heinz
|
$
|
26,268
|
|
$
|
(14
|
)
|
$
|
177
|
|
$
|
26,105
|
|
|||||||
|
2017 (As Restated)
|
|||||||||||||||||||
|
United States
|
$
|
18,230
|
|
$
|
—
|
|
$
|
—
|
|
$
|
18,230
|
|
|||||||
|
Canada
|
2,177
|
|
—
|
|
—
|
|
2,177
|
|
|||||||||||
|
EMEA
|
2,585
|
|
—
|
|
56
|
|
2,529
|
|
|||||||||||
|
Rest of World
|
3,084
|
|
144
|
|
—
|
|
2,940
|
|
|||||||||||
|
Kraft Heinz
|
$
|
26,076
|
|
$
|
144
|
|
$
|
56
|
|
$
|
25,876
|
|
|||||||
|
Year-over-year growth rates
|
|||||||||||||
|
United States
|
(0.6
|
)%
|
0.0 pp
|
0.0 pp
|
(0.6
|
)%
|
(0.9) pp
|
0.3 pp
|
|||||
|
Canada
|
(0.2
|
)%
|
(0.3) pp
|
0.0 pp
|
0.1
|
%
|
(0.6) pp
|
0.7 pp
|
|||||
|
EMEA
|
5.1
|
%
|
2.5 pp
|
(1.5) pp
|
4.1
|
%
|
0.9 pp
|
3.2 pp
|
|||||
|
Rest of World
|
5.6
|
%
|
(7.6) pp
|
5.3 pp
|
7.9
|
%
|
5.4 pp
|
2.5 pp
|
|||||
|
Kraft Heinz
|
0.7
|
%
|
(0.6) pp
|
0.4 pp
|
0.9
|
%
|
0.0 pp
|
0.9 pp
|
|||||
49
The Kraft Heinz Company
Reconciliation of Net Sales to Organic Net Sales
(dollars in millions)
(Unaudited)
|
Net Sales
|
Currency
|
Acquisitions and Divestitures
|
Organic Net Sales
|
Price
|
Volume/Mix
|
||||||||||||||
|
2017 (As Restated)
|
|||||||||||||||||||
|
United States
|
$
|
18,230
|
|
$
|
—
|
|
$
|
—
|
|
$
|
18,230
|
|
|||||||
|
Canada
|
2,177
|
|
42
|
|
—
|
|
2,135
|
|
|||||||||||
|
EMEA
|
2,585
|
|
(14
|
)
|
50
|
|
2,549
|
|
|||||||||||
|
Rest of World
|
3,084
|
|
35
|
|
—
|
|
3,049
|
|
|||||||||||
|
Kraft Heinz
|
$
|
26,076
|
|
$
|
63
|
|
$
|
50
|
|
$
|
25,963
|
|
|||||||
|
2016 (As Restated)
|
|||||||||||||||||||
|
United States
|
$
|
18,469
|
|
$
|
—
|
|
$
|
—
|
|
$
|
18,469
|
|
|||||||
|
Canada
|
2,302
|
|
—
|
|
—
|
|
2,302
|
|
|||||||||||
|
EMEA
|
2,586
|
|
—
|
|
57
|
|
2,529
|
|
|||||||||||
|
Rest of World
|
2,943
|
|
55
|
|
—
|
|
2,888
|
|
|||||||||||
|
Kraft Heinz
|
$
|
26,300
|
|
$
|
55
|
|
$
|
57
|
|
$
|
26,188
|
|
|||||||
|
Year-over-year growth rates
|
|||||||||||||
|
United States
|
(1.3
|
)%
|
0.0 pp
|
0.0 pp
|
(1.3
|
)%
|
0.5 pp
|
(1.8) pp
|
|||||
|
Canada
|
(5.4
|
)%
|
1.9 pp
|
0.0 pp
|
(7.3
|
)%
|
(1.8) pp
|
(5.5) pp
|
|||||
|
EMEA
|
—
|
%
|
(0.5) pp
|
(0.3) pp
|
0.8
|
%
|
(0.5) pp
|
1.3 pp
|
|||||
|
Rest of World
|
4.8
|
%
|
(0.8) pp
|
0.0 pp
|
5.6
|
%
|
4.2 pp
|
1.4 pp
|
|||||
|
Kraft Heinz
|
(0.9
|
)%
|
0.0 pp
|
0.0 pp
|
(0.9
|
)%
|
0.6 pp
|
(1.5) pp
|
|||||
50
The Kraft Heinz Company
Reconciliation of Net Income/(Loss) to Adjusted EBITDA
(in millions)
(Unaudited)
|
As Restated & Recast
|
|||||||||||
|
December 29,
2018 |
December 30,
2017 |
December 31,
2016 |
|||||||||
|
Net income/(loss)
|
$
|
(10,254
|
)
|
$
|
10,932
|
|
$
|
3,606
|
|
||
|
Interest expense
|
1,284
|
|
1,234
|
|
1,134
|
|
|||||
|
Other expense/(income), net
|
(183
|
)
|
(627
|
)
|
(472
|
)
|
|||||
|
Provision for/(benefit from) income taxes
|
(1,067
|
)
|
(5,482
|
)
|
1,333
|
|
|||||
|
Operating income/(loss)
|
(10,220
|
)
|
6,057
|
|
5,601
|
|
|||||
|
Depreciation and amortization (excluding integration and restructuring expenses)
|
919
|
|
907
|
|
875
|
|
|||||
|
Integration and restructuring expenses
|
297
|
|
583
|
|
992
|
|
|||||
|
Deal costs
|
23
|
|
—
|
|
30
|
|
|||||
|
Unrealized losses/(gains) on commodity hedges
|
21
|
|
19
|
|
(38
|
)
|
|||||
|
Impairment losses
|
15,936
|
|
49
|
|
71
|
|
|||||
|
Losses/(gains) on sale of business
|
15
|
|
—
|
|
—
|
|
|||||
|
Nonmonetary currency devaluation
|
—
|
|
—
|
|
4
|
|
|||||
|
Equity award compensation expense (excluding integration and restructuring expenses)
|
33
|
|
49
|
|
39
|
|
|||||
|
Adjusted EBITDA
|
$
|
7,024
|
|
$
|
7,664
|
|
$
|
7,574
|
|
||
51
The Kraft Heinz Company
Reconciliation of Diluted EPS to Adjusted EPS
(Unaudited)
|
As Restated
|
|||||||||||
|
December 29,
2018 |
December 30,
2017 |
December 31,
2016 |
|||||||||
|
Diluted EPS
|
$
|
(8.36
|
)
|
$
|
8.91
|
|
$
|
2.78
|
|
||
|
Integration and restructuring expenses
(a)
|
0.32
|
|
0.24
|
|
0.57
|
|
|||||
|
Deal costs
(b)
|
0.02
|
|
—
|
|
0.02
|
|
|||||
|
Unrealized losses/(gains) on commodity hedges
(c)
|
0.01
|
|
0.01
|
|
(0.02
|
)
|
|||||
|
Impairment losses
(d)
|
11.28
|
|
0.03
|
|
0.04
|
|
|||||
|
Losses/(gains) on sale of business
(e)
|
0.01
|
|
—
|
|
—
|
|
|||||
|
Other losses/(gains) related to acquisitions and divestitures
(f)
|
0.02
|
|
—
|
|
—
|
|
|||||
|
Nonmonetary currency devaluation
(g)
|
0.12
|
|
0.03
|
|
0.02
|
|
|||||
|
Preferred dividend adjustment
(h)
|
—
|
|
—
|
|
(0.10
|
)
|
|||||
|
U.S. Tax Reform discrete income tax expense/(benefit)
(i)
|
0.09
|
|
(5.72
|
)
|
—
|
|
|||||
|
Adjusted EPS
|
$
|
3.51
|
|
$
|
3.50
|
|
$
|
3.31
|
|
||
|
(a)
|
Gross expenses included in integration and restructuring expenses were
$460 million
in 2018 (
$396 million
after-tax),
$434 million
in 2017 (
$305 million
after-tax), and
$1.0 billion
in 2016 (
$697 million
after-tax) and were recorded in the following income statement line items:
|
|
•
|
Cost of products sold included
$194 million
in 2018,
$464 million
in 2017, and
$699 million
in 2016;
|
|
•
|
SG&A included
$103 million
in 2018,
$119 million
in 2017, and
$293 million
in 2016; and
|
|
•
|
Other expense/(income), net, included expenses of
$163 million
in 2018, income of
$149 million
in 2017, and expenses of
$20 million
in 2016.
|
|
(b)
|
Gross expenses included in deal costs were
$23 million
in 2018 (
$19 million
after-tax) and
$30 million
in 2016 (
$20 million
after-tax) and were recorded in the following income statement line items:
|
|
•
|
Cost of products sold included
$4 million
in 2018 and
$3 million
in 2016; and
|
|
•
|
SG&A included
$19 million
in 2018 and
$27 million
in 2016.
|
|
(c)
|
Gross expenses/(income) included in unrealized losses/(gains) on commodity hedges were expenses of
$21 million
in 2018 (
$16 million
after-tax), expenses of
$19 million
in 2017 (
$12 million
after-tax), and income of
$38 million
in 2016 (
$25 million
after-tax) and were recorded in cost of products sold.
|
|
(d)
|
Gross expenses included in impairment losses were
$15.9 billion
in 2018 (
$13.8 billion
after-tax),
$49 million
in 2017 (
$36 million
after-tax), and
$71 million
in 2016 (
$46 million
after-tax) and were recorded in the following income statement line items:
|
|
•
|
Cost of products sold included
$53 million
in 2016; and
|
|
•
|
SG&A included
$15.9 billion
in 2018,
$49 million
in 2017, and
$18 million
in 2016.
|
|
(e)
|
Gross expenses included in losses/(gains) on sale of business were
$15 million
in 2018 (
$15 million
after-tax) and were recorded in SG&A.
|
|
(f)
|
Gross expenses included in other losses/(gains) related to acquisitions and divestitures were
$27 million
in 2018 (
$15 million
after-tax) and were recorded in the following income statement line items:
|
|
•
|
Interest expense included
$3 million
in 2018;
|
|
•
|
Other expense/(income), net, included
$17 million
in 2018; and
|
|
•
|
Provision for/(benefit from) income taxes included
$7 million
in 2018.
|
|
(g)
|
Gross expenses included in nonmonetary currency devaluation were
$146 million
in 2018 (
$146 million
after tax),
$36 million
in 2017 (
$36 million
after-tax), and
$28 million
in 2016 (
$28 million
after-tax) and were recorded in the following income statement line items:
|
|
•
|
Cost of products sold included
$4 million
in 2016; and
|
|
•
|
Other expense/(income), net, included
$146 million
in 2018,
$36 million
in 2017, and
$24 million
in 2016.
|
|
(h)
|
For Adjusted EPS, we present the impact of the Series A Preferred Stock dividend payments on an accrual basis. Accordingly, we included adjustments to EPS to include $180 million Series A Preferred Stock dividends in the first quarter of 2016 (to reflect the March 7, 2016 Series A Preferred Stock dividend that was paid in December 2015) and to exclude $51 million of Series A Preferred Stock dividends from the second quarter of 2016 (to reflect that it was redeemed on June 7, 2016).
|
|
(i)
|
U.S. Tax Reform discrete income tax expense/(benefit) was an expense of $104 million in 2018 and a benefit of $7.0 billion in 2017. Expenses in 2018 primarily related to the revaluation of our deferred tax balances due to changes in state tax laws following U.S. Tax Reform. These expenses were partially offset by net benefits related to changes in U.S. tax reserves, U.S. Tax Reform measurement period adjustments, changes in estimates of certain 2017 U.S. income tax deductions, and the release of valuation allowances related to foreign tax credits. The benefit in 2017 was related to the enactment of U.S. Tax Reform.
See Note 11,
Income Taxes
, in Item 8,
Financial Statements and Supplementary Data
, for additional information.
|
52
Supplemental Unaudited Quarterly Financial Information
The following unaudited quarterly financial information is presented to illustrate the effects of the corrections of misstatements to previously reported quarterly financial information as a result of the restatement. Such corrections of misstatements are described in more detail in Note 2,
Restatement of Previously Issued Consolidated Financial Statements
, in Item 8,
Financial Statements and Supplementary Data
.
The following unaudited quarterly financial information for the fiscal quarters ended December 29, 2018 September 29, 2018, June 30, 2018, March 31, 2018, December 30, 2017, September 30, 2017, July 1, 2017, and April 1, 2017 is derived from our audited consolidated financial statements for the year ended December 29, 2018 and our restated audited consolidated financial statements for the year ended December 30, 2017. This unaudited quarterly financial information should be read in conjunction with the other sections of this Annual Report on Form 10-K, including the consolidated financial statements and related notes contained in Item 8,
Financial Statements and Supplementary Data
.
The following tables represent the unaudited reconciliation of net sales to Organic Net Sales. Organic Net Sales is a non-GAAP financial measure. See the
Non-GAAP Financial Measures
section within this item for the related definition.
|
As Restated
|
|||||||||||||||||||||||||||||||
|
For the Three Months Ended December 29, 2018
|
For the Three Months Ended December 30, 2017
|
||||||||||||||||||||||||||||||
|
Net Sales
|
Currency
|
Acquisitions and Divestitures
|
Organic Net Sales
|
Net Sales
|
Currency
|
Acquisitions and Divestitures
|
Organic Net Sales
|
||||||||||||||||||||||||
|
(in millions)
|
(in millions)
|
||||||||||||||||||||||||||||||
|
United States
|
$
|
4,810
|
|
$
|
—
|
|
$
|
—
|
|
$
|
4,810
|
|
$
|
4,760
|
|
$
|
—
|
|
$
|
—
|
|
$
|
4,760
|
|
|||||||
|
Canada
|
600
|
|
(24
|
)
|
—
|
|
624
|
|
589
|
|
—
|
|
—
|
|
589
|
|
|||||||||||||||
|
EMEA
|
692
|
|
(31
|
)
|
—
|
|
723
|
|
696
|
|
—
|
|
13
|
|
683
|
|
|||||||||||||||
|
Rest of World
|
789
|
|
(42
|
)
|
48
|
|
783
|
|
796
|
|
53
|
|
—
|
|
743
|
|
|||||||||||||||
|
Kraft Heinz
|
$
|
6,891
|
|
$
|
(97
|
)
|
$
|
48
|
|
$
|
6,940
|
|
$
|
6,841
|
|
$
|
53
|
|
$
|
13
|
|
$
|
6,775
|
|
|||||||
|
As Restated
|
|||||||||||||||||||||||||||||||
|
For the Three Months Ended September 29, 2018
|
For the Three Months Ended September 30, 2017
|
||||||||||||||||||||||||||||||
|
Net Sales
|
Currency
|
Acquisitions and Divestitures
|
Organic Net Sales
|
Net Sales
|
Currency
|
Acquisitions and Divestitures
|
Organic Net Sales
|
||||||||||||||||||||||||
|
(in millions)
|
(in millions)
|
||||||||||||||||||||||||||||||
|
United States
|
$
|
4,431
|
|
$
|
—
|
|
$
|
—
|
|
$
|
4,431
|
|
$
|
4,351
|
|
$
|
—
|
|
$
|
—
|
|
$
|
4,351
|
|
|||||||
|
Canada
|
525
|
|
(24
|
)
|
—
|
|
549
|
|
556
|
|
—
|
|
—
|
|
556
|
|
|||||||||||||||
|
EMEA
|
634
|
|
(12
|
)
|
—
|
|
646
|
|
650
|
|
—
|
|
12
|
|
638
|
|
|||||||||||||||
|
Rest of World
|
793
|
|
(46
|
)
|
47
|
|
792
|
|
722
|
|
18
|
|
—
|
|
704
|
|
|||||||||||||||
|
Kraft Heinz
|
$
|
6,383
|
|
$
|
(82
|
)
|
$
|
47
|
|
$
|
6,418
|
|
$
|
6,279
|
|
$
|
18
|
|
$
|
12
|
|
$
|
6,249
|
|
|||||||
|
As Restated
|
|||||||||||||||||||||||||||||||
|
For the Three Months Ended June 30, 2018
|
For the Three Months Ended July 1, 2017
|
||||||||||||||||||||||||||||||
|
Net Sales
|
Currency
|
Acquisitions and Divestitures
|
Organic Net Sales
|
Net Sales
|
Currency
|
Acquisitions and Divestitures
|
Organic Net Sales
|
||||||||||||||||||||||||
|
(in millions)
|
(in millions)
|
||||||||||||||||||||||||||||||
|
United States
|
$
|
4,513
|
|
$
|
—
|
|
$
|
—
|
|
$
|
4,513
|
|
$
|
4,601
|
|
$
|
—
|
|
$
|
—
|
|
$
|
4,601
|
|
|||||||
|
Canada
|
564
|
|
21
|
|
—
|
|
543
|
|
592
|
|
—
|
|
—
|
|
592
|
|
|||||||||||||||
|
EMEA
|
707
|
|
35
|
|
11
|
|
661
|
|
644
|
|
—
|
|
15
|
|
629
|
|
|||||||||||||||
|
Rest of World
|
906
|
|
(4
|
)
|
63
|
|
847
|
|
797
|
|
33
|
|
—
|
|
764
|
|
|||||||||||||||
|
Kraft Heinz
|
$
|
6,690
|
|
$
|
52
|
|
$
|
74
|
|
$
|
6,564
|
|
$
|
6,634
|
|
$
|
33
|
|
$
|
15
|
|
$
|
6,586
|
|
|||||||
53
|
As Restated
|
|||||||||||||||||||||||||||||||
|
For the Three Months Ended March 31, 2018
|
For the Three Months Ended April 1, 2017
|
||||||||||||||||||||||||||||||
|
Net Sales
|
Currency
|
Acquisitions and Divestitures
|
Organic Net Sales
|
Net Sales
|
Currency
|
Acquisitions and Divestitures
|
Organic Net Sales
|
||||||||||||||||||||||||
|
(in millions)
|
(in millions)
|
||||||||||||||||||||||||||||||
|
United States
|
$
|
4,368
|
|
$
|
—
|
|
$
|
—
|
|
$
|
4,368
|
|
$
|
4,518
|
|
$
|
—
|
|
$
|
—
|
|
$
|
4,518
|
|
|||||||
|
Canada
|
484
|
|
22
|
|
—
|
|
462
|
|
440
|
|
—
|
|
—
|
|
440
|
|
|||||||||||||||
|
EMEA
|
685
|
|
74
|
|
8
|
|
603
|
|
595
|
|
—
|
|
16
|
|
579
|
|
|||||||||||||||
|
Rest of World
|
767
|
|
17
|
|
|
750
|
|
769
|
|
40
|
|
|
729
|
|
|||||||||||||||||
|
Kraft Heinz
|
$
|
6,304
|
|
$
|
113
|
|
$
|
8
|
|
$
|
6,183
|
|
$
|
6,322
|
|
$
|
40
|
|
$
|
16
|
|
$
|
6,266
|
|
|||||||
The following tables represent the unaudited reconciliation of net income/(loss) to Adjusted EBITDA. Adjusted EBITDA is a non-GAAP financial measure. See the
Non-GAAP Financial Measures
section within this item for the related definition.
|
As Restated
|
|||||||||||||||
|
For the Three Months Ended
|
|||||||||||||||
|
December 29, 2018
|
September 29, 2018
|
June 30,
2018 |
March 31,
2018 |
||||||||||||
|
(in millions)
|
|||||||||||||||
|
Net income/(loss)
|
$
|
(12,628
|
)
|
$
|
618
|
|
$
|
753
|
|
$
|
1,003
|
|
|||
|
Interest expense
|
325
|
|
326
|
|
316
|
|
317
|
|
|||||||
|
Other expense/(income), net
|
13
|
|
(71
|
)
|
(35
|
)
|
(90
|
)
|
|||||||
|
Provision for/(benefit from) income taxes
|
(1,846
|
)
|
201
|
|
308
|
|
270
|
|
|||||||
|
Operating income/(loss)
|
(14,136
|
)
|
1,074
|
|
1,342
|
|
1,500
|
|
|||||||
|
Depreciation and amortization (excluding integration and restructuring expenses)
|
240
|
|
245
|
|
235
|
|
199
|
|
|||||||
|
Integration and restructuring expenses
|
82
|
|
32
|
|
93
|
|
90
|
|
|||||||
|
Deal costs
|
4
|
|
3
|
|
7
|
|
9
|
|
|||||||
|
Unrealized losses/(gains) on commodity hedges
|
10
|
|
6
|
|
3
|
|
2
|
|
|||||||
|
Impairment losses
|
15,485
|
|
217
|
|
234
|
|
—
|
|
|||||||
|
Losses/(gains) on sale of business
|
—
|
|
—
|
|
15
|
|
—
|
|
|||||||
|
Equity award compensation expense (excluding integration and restructuring expenses)
|
(11
|
)
|
17
|
|
20
|
|
7
|
|
|||||||
|
Adjusted EBITDA
|
$
|
1,674
|
|
$
|
1,594
|
|
$
|
1,949
|
|
$
|
1,807
|
|
|||
|
As Restated & Recast
|
|||||||||||||||
|
For the Three Months Ended
|
|||||||||||||||
|
December 30, 2017
|
September 30,
2017 |
July 1,
2017 |
April 1,
2017 |
||||||||||||
|
(in millions)
|
|||||||||||||||
|
Net income/(loss)
|
$
|
7,982
|
|
$
|
912
|
|
$
|
1,157
|
|
$
|
881
|
|
|||
|
Interest expense
|
308
|
|
306
|
|
307
|
|
313
|
|
|||||||
|
Other expense/(income), net
|
(116
|
)
|
(127
|
)
|
(254
|
)
|
(130
|
)
|
|||||||
|
Provision for/(benefit from) income taxes
|
(6,665
|
)
|
400
|
|
429
|
|
354
|
|
|||||||
|
Operating income/(loss)
|
1,509
|
|
1,491
|
|
1,639
|
|
1,418
|
|
|||||||
|
Depreciation and amortization (excluding integration and restructuring expenses)
|
224
|
|
243
|
|
219
|
|
221
|
|
|||||||
|
Integration and restructuring expenses
|
208
|
|
108
|
|
132
|
|
135
|
|
|||||||
|
Unrealized losses/(gains) on commodity hedges
|
(5
|
)
|
(5
|
)
|
(13
|
)
|
42
|
|
|||||||
|
Impairment losses
|
—
|
|
1
|
|
48
|
|
—
|
|
|||||||
|
Equity award compensation expense (excluding integration and restructuring expenses)
|
11
|
|
12
|
|
14
|
|
12
|
|
|||||||
|
Adjusted EBITDA
|
$
|
1,947
|
|
$
|
1,850
|
|
$
|
2,039
|
|
$
|
1,828
|
|
|||
54
The following tables represent the unaudited reconciliation of diluted EPS to Adjusted EPS. Adjusted EPS is a non-GAAP financial measure. See the
Non-GAAP Financial Measures
section within this item for the related definition.
|
As Restated
|
|||||||||||||||
|
For the Three Months Ended
|
|||||||||||||||
|
December 29, 2018
|
September 29,
2018 |
June 30,
2018 |
March 31, 2018
|
||||||||||||
|
(in millions)
|
|||||||||||||||
|
Diluted EPS
|
$
|
(10.30
|
)
|
$
|
0.50
|
|
$
|
0.62
|
|
$
|
0.82
|
|
|||
|
Integration and restructuring expenses
(a)
|
0.13
|
|
0.03
|
|
0.11
|
|
0.05
|
|
|||||||
|
Deal costs
(b)
|
—
|
|
—
|
|
0.01
|
|
0.01
|
|
|||||||
|
Unrealized losses/(gains) on commodity hedges
(c)
|
0.01
|
|
—
|
|
—
|
|
—
|
|
|||||||
|
Impairment losses
(d)
|
10.97
|
|
0.13
|
|
0.17
|
|
—
|
|
|||||||
|
Losses/(gains) on sale of business
(e)
|
—
|
|
—
|
|
0.01
|
|
—
|
|
|||||||
|
Other losses/(gains) related to acquisitions and divestitures
(f)
|
0.02
|
|
—
|
|
—
|
|
—
|
|
|||||||
|
Nonmonetary currency devaluation
(g)
|
0.01
|
|
0.05
|
|
0.02
|
|
0.04
|
|
|||||||
|
U.S. Tax Reform discrete income tax expense/(benefit)
(h)
|
—
|
|
0.05
|
|
0.05
|
|
(0.02
|
)
|
|||||||
|
Adjusted EPS
|
$
|
0.84
|
|
$
|
0.76
|
|
$
|
0.99
|
|
$
|
0.90
|
|
|||
|
(a)
|
Gross expenses included in integration and restructuring expenses were
$182 million
(
$159 million
after-tax),
$31 million
(
$31 million
after-tax),
$157 million
(
$135 million
after-tax), and
$90 million
(
$72 million
after-tax) for the three months ended December 29, 2018, September 29, 2018, June 30, 2018, and March 31, 2018, respectively, and were recorded in the following income statement line items:
|
|
•
|
Cost of products sold included
$19 million
,
$18 million
,
$79 million
, and
$78 million
for the three months ended December 29, 2018, September 29, 2018, June 30, 2018, and March 31, 2018, respectively;
|
|
•
|
SG&A included
$63 million
,
$14 million
,
$14 million
, and
$12 million
for the three months ended December 29, 2018, September 29, 2018, June 30, 2018, and March 31, 2018, respectively; and
|
|
•
|
Other expense/(income), net, included expenses of
$100 million
, income of
$1 million
, and expenses of
$64 million
for the three months ended December 29, 2018, September 29, 2018 and June 30, 2018, respectively.
|
|
(b)
|
Gross expenses included in deal costs were
$4 million
(
$4 million
after-tax),
$3 million
(
$2 million
after-tax),
$7 million
(
$6 million
after-tax), and
$9 million
(
$7 million
after-tax) for the three months ended December 29, 2018, September 29, 2018, June 30, 2018, and March 31, 2018, respectively, and were recorded in the following income statement line items:
|
|
•
|
Cost of products sold included
$4 million
for the three months ended June 30, 2018; and
|
|
•
|
SG&A included
$4 million
,
$3 million
,
$3 million
, and
$9 million
for the three months ended December 29, 2018, September 29, 2018, June 30, 2018, and March 31, 2018, respectively.
|
|
(c)
|
Gross expenses included in unrealized losses/(gains) on commodity hedges were
$10 million
(
$6 million
after-tax),
$6 million
($5 million after-tax),
$3 million
(
$3 million
after-tax), and
$2 million
(
$1 million
after-tax) for the three months ended December 29, 2018, September 29, 2018, June 30, 2018, and March 31, 2018, respectively, and were recorded in cost of products sold.
|
|
(d)
|
Gross expenses included in impairment losses were
$15.5 billion
(
$13.4 billion
after-tax),
$217 million
(
$153 million
after-tax), and
$234 million
(
$213 million
after-tax) for the three months ended December 29, 2018, September 29, 2018, and June 30, 2018, respectively, and were recorded in SG&A.
|
|
(e)
|
Gross expenses included in losses/(gains) on sale of business were
$15 million
(
$15 million
after-tax) for the three months ended June 30, 2018 and were recorded in SG&A.
|
|
(f)
|
Gross expenses included in other losses/(gains) related to acquisitions and divestitures were
$27 million
for the three months ended December, 29 2018 (
$15 million
after-tax) and were recorded in the following income statement line items:
|
|
•
|
Interest expense included
$3 million
for the three months ended December, 29 2018;
|
|
•
|
Other expense/(income), net, included
$17 million
for the three months ended December, 29 2018; and
|
|
•
|
Provision for/(benefit from) income taxes included
$7 million
for the three months ended December, 29 2018.
|
|
(g)
|
Gross expenses included in nonmonetary currency devaluation were
$15 million
(
$15 million
after-tax),
$64 million
(
$64 million
after-tax),
$20 million
(
$20 million
after-tax), and
$47 million
(
$47 million
after-tax) for the three months ended December 29, 2018, September 29, 2018, June 30, 2018, and March 31, 2018, respectively, and were recorded in other expense/(income), net.
|
|
(h)
|
U.S. Tax Reform discrete income tax expense/(benefit) included a benefit of
$2 million
, expenses of
$62 million
, expenses of
$64 million
, and a benefit of
$20 million
for the three months ended December 29, 2018, September 29, 2018, June 30, 2018, and March 31, 2018, respectively.
|
55
|
As Restated
|
|||||||||||||||
|
For the Three Months Ended
|
|||||||||||||||
|
December 30,
2017 |
September 30,
2017 |
July 1,
2017 |
April 1,
2017
|
||||||||||||
|
(in millions)
|
|||||||||||||||
|
Diluted EPS
|
$
|
6.50
|
|
$
|
0.74
|
|
$
|
0.94
|
|
$
|
0.72
|
|
|||
|
Integration and restructuring expenses
(a)
|
0.11
|
|
0.07
|
|
(0.01
|
)
|
0.08
|
|
|||||||
|
Unrealized losses/(gains) on commodity hedges
(b)
|
—
|
|
—
|
|
(0.01
|
)
|
0.02
|
|
|||||||
|
Impairment losses
(c)
|
—
|
|
—
|
|
0.03
|
|
—
|
|
|||||||
|
Nonmonetary currency devaluation
(d)
|
—
|
|
—
|
|
0.02
|
|
0.01
|
|
|||||||
|
U.S. Tax Reform discrete income tax expense/(benefit)
(e)
|
(5.72
|
)
|
—
|
|
—
|
|
—
|
|
|||||||
|
Adjusted EPS
|
$
|
0.89
|
|
$
|
0.81
|
|
$
|
0.97
|
|
$
|
0.83
|
|
|||
|
(a)
|
Gross expenses/(income) included in integration and restructuring expenses were expenses of
$210 million
(
$140 million
after-tax),
$104 million
(
$79 million
after-tax), income of
$28 million
(
$17 million
after-tax), and expenses of
$148 million
(
$101 million
after-tax) for the three months ended December 30, 2017, September 30, 2017, July 1, 2017, and April 1, 2017, respectively, and were recorded in the following income statement line items:
|
|
•
|
Cost of products sold included expenses of
$190 million
,
$94 million
,
$83 million
, and
$96 million
for the three months ended December 30, 2017, September 30, 2017, July 1, 2017, and April 1, 2017, respectively;
|
|
•
|
SG&A included expenses of
$18 million
,
$14 million
,
$49 million
, and
$39 million
for the three months ended December 30, 2017, September 30, 2017, July 1, 2017, and April 1, 2017, respectively; and
|
|
•
|
Other expense/(income), net, included expenses of
$2 million
, income of
$4 million
, income of
$160 million
, and expenses of
$13 million
for the three months ended December 30, 2017, September 30, 2017, July 1, 2017, and April 1, 2017, respectively.
|
|
(b)
|
Gross expenses/(income) included in unrealized losses/(gains) on commodity hedges were income of
$5 million
(
$4 million
after-tax), income of
$5 million
(
$3 million
after-tax), income of
$13 million
(
$7 million
after-tax), and expenses of
$42 million
(
$27 million
after-tax) for the three months ended December 30, 2017, September 30, 2017, July 1, 2017, and April 1, 2017, respectively, and were recorded in cost of products sold.
|
|
(c)
|
Gross expenses included in impairment losses were
$1 million
(
$1 million
after-tax) and
$48 million
(
$34 million
after-tax) for the three months ended September 30, 2017 and July 1, 2017, respectively, and were recorded in SG&A.
|
|
(d)
|
Gross expenses included in nonmonetary currency devaluation were
$3 million
(
$3 million
after-tax),
$25 million
(
$25 million
after-tax), and
$8 million
(
$8 million
after-tax) for the three months ended September 30, 2017, July 1, 2017, and April 1, 2017, respectively, and were recorded in other expense/(income), net.
|
|
(e)
|
U.S. Tax Reform discrete income tax expense/(benefit) included a benefit of
$7.0 billion
for the three months ended December 30, 2017.
|
Item 7A. Quantitative and Qualitative Disclosures About Market Risk.
We are exposed to market risks from adverse changes in commodity prices, foreign exchange rates, and interest rates. We monitor and manage these exposures as part of our overall risk management program. Our risk management program focuses on the unpredictability of financial markets and seeks to reduce the potentially adverse effects that volatility in these markets may have on our operating results. We maintain risk management policies that principally use derivative financial instruments to reduce significant, unanticipated fluctuations in earnings and cash flows that may arise from variations in commodity prices, foreign currency exchange rates, and interest rates. We manage market risk by incorporating parameters within our risk management strategy that limit the types of derivative instruments, the derivative strategies we use, and the degree of market risk that we hedge with derivative instruments. See Note 3,
Significant Accounting Policies
, and Note 14,
Financial Instruments
, in Item 8,
Financial Statements and Supplementary Data
, for details of our market risk management policies and the financial instruments used to hedge those exposures.
When we use financial instruments, we are exposed to credit risk that a counterparty might fail to fulfill its performance obligations under the terms of our agreement. We minimize our credit risk by entering into transactions with counterparties with investment grade credit ratings, limiting the amount of exposure we have with each counterparty, and monitoring the financial condition of our counterparties. All of our non-exchange traded derivative contracts are governed by an International Swaps and Derivatives Association master agreement. By policy, we do not engage in speculative or leveraged transactions, nor do we hold or issue financial instruments for trading purposes.
56
Effect of Hypothetical 10% Fluctuation in Market Prices:
The potential gain or loss on the fair value of our outstanding commodity contracts, foreign exchange contracts, and cross-currency swap contracts, assuming a hypothetical 10% fluctuation in commodity prices and foreign currency exchange rates, would have been (in millions):
|
December 29,
2018 |
December 30,
2017 |
||||||
|
Commodity contracts
|
$
|
38
|
|
$
|
23
|
|
|
|
Foreign currency contracts
|
100
|
|
173
|
|
|||
|
Cross-currency swap contracts
|
402
|
|
287
|
|
|||
It should be noted that any change in the fair value of our derivative contracts, real or hypothetical, would be significantly offset by an inverse change in the value of the underlying hedged items. In relation to foreign currency contracts, this hypothetical calculation assumes that each exchange rate would change in the same direction relative to the U.S. dollar. Our utilization of financial instruments in managing market risk exposures described above is consistent with the prior year. Changes in our portfolio of financial instruments are a function of our results of operations, debt repayments and debt issuances, market effects on debt and foreign currency, and our acquisition and divestiture activities.
Effect of Hypothetical 1% Fluctuation in LIBOR and CDOR:
Based on our current variable rate debt balance as of
December 29, 2018
, a hypothetical 1% increase in LIBOR and CDOR would increase our annual interest expense by approximately $19 million.
57
Item 8. Financial Statements and Supplementary Data.
Report of Independent Registered Public Accounting Firm
To the Shareholders and Board of Directors of The Kraft Heinz Company
Opinions on the Financial Statements and Internal Control over Financial Reporting
We have audited the accompanying consolidated balance sheets of The Kraft Heinz Company and its subsidiaries (the “Company”) as of December 29, 2018 and December 30, 2017, and the related consolidated statements of income, comprehensive income, equity and cash flows for each of the three years in the period ended December 29, 2018, including the related notes and financial statement schedule listed in the index appearing under Item 15 (a) (collectively referred to as the “consolidated financial statements”). We also have audited the Company's internal control over financial reporting as of December 29, 2018, based on criteria established in
Internal Control - Integrated Framework
(2013)
issued by the Committee of Sponsoring Organizations of the Treadway Commission (COSO).
In our opinion, the consolidated financial statements referred to above present fairly, in all material respects, the financial position of the Company as of December 29, 2018 and December 30, 2017, and the results of its operations and its cash flows for each of the three years in the period ended December 29, 2018 in conformity with accounting principles generally accepted in the United States of America. Also in our opinion, the Company did not maintain, in all material respects, effective internal control over financial reporting as of December 29, 2018, based on criteria established in
Internal Control - Integrated Framework
(2013)
issued by the COSO because material weaknesses in internal control over financial reporting existed as of that date related to the risk assessment component of internal control, as the Company did not appropriately design controls in response to the risk of material misstatement due to changes in their business environment. The risk assessment material weakness gave rise to additional material weaknesses as the Company did not design and maintain effective controls over the accounting for supplier contracts and related arrangements or to reassess the level of precision used to review the impairment assessments related to forecasted cash flows used within goodwill and indefinite-lived intangible asset impairment calculations.
A material weakness is a deficiency, or a combination of deficiencies, in internal control over financial reporting, such that there is a reasonable possibility that a material misstatement of the annual or interim financial statements will not be prevented or detected on a timely basis. The material weaknesses referred to above are described in Management's Report on Internal Control Over Financial Reporting appearing under Item 9A. We considered these material weaknesses in determining the nature, timing, and extent of audit tests applied in our audit of the 2018
consolidated financial statements, and our opinion regarding the effectiveness of the Company’s internal control over financial reporting does not affect our opinion on those consolidated
financial statements.
Restatement of Previously Issued Financial Statements
As discussed in Note 2 to the consolidated financial statements, the Company has restated its 2017 and 2016 financial statements to correct misstatements.
Change in Accounting Principle
As discussed in Note
4 to the consolidated financial statements, the Company changed the manner in which it presents net periodic benefit costs in 2018.
Basis for Opinions
The Company's management is responsible for these consolidated financial statements, for maintaining effective internal control over financial reporting, and for its assessment of the effectiveness of internal control over financial reporting included in management’s report referred to above. Our responsibility is to express opinions on the Company’s consolidated financial statements and on the Company's internal control over financial reporting based on our audits. We are a public accounting firm registered with the Public Company Accounting Oversight Board (United States) (PCAOB) and are required to be independent with respect to the Company in accordance with the U.S. federal securities laws and the applicable rules and regulations of the Securities and Exchange Commission and the PCAOB.
58
We conducted our audits in accordance with the standards of the PCAOB. Those standards require that we plan and perform the audits to obtain reasonable assurance about whether the consolidated financial statements are free of material misstatement, whether due to error or fraud, and whether effective internal control over financial reporting was maintained in all material respects.
Our audits of the consolidated
financial statements included performing procedures to assess the risks of material misstatement of the consolidated financial statements, whether due to error or fraud, and performing procedures that respond to those risks. Such procedures included examining, on a test basis, evidence regarding the amounts and disclosures in the consolidated
financial statements. Our audits also included evaluating the accounting principles used and significant estimates made by management, as well as evaluating the overall presentation of the consolidated financial statements. Our audit of internal control over financial reporting included obtaining an understanding of internal control over financial reporting, assessing the risk that a material weakness exists, and testing and evaluating the design and operating effectiveness of internal control based on the assessed risk. Our audits also included performing such other procedures as we considered necessary in the circumstances. We believe that our audits provide a reasonable basis for our opinions.
Definition and Limitations of Internal Control over Financial Reporting
A company’s internal control over financial reporting is a process designed to provide reasonable assurance regarding the reliability of financial reporting and the preparation of financial statements for external purposes in accordance with generally accepted accounting principles. A company’s internal control over financial reporting includes those policies and procedures that (i) pertain to the maintenance of records that, in reasonable detail, accurately and fairly reflect the transactions and dispositions of the assets of the company; (ii) provide reasonable assurance that transactions are recorded as necessary to permit preparation of financial statements in accordance with generally accepted accounting principles, and that receipts and expenditures of the company are being made only in accordance with authorizations of management and directors of the company; and (iii) provide reasonable assurance regarding prevention or timely detection of unauthorized acquisition, use, or disposition of the company’s assets that could have a material effect on the financial statements.
Because of its inherent limitations, internal control over financial reporting may not prevent or detect misstatements. Also, projections of any evaluation of effectiveness to future periods are subject to the risk that controls may become inadequate because of changes in conditions, or that the degree of compliance with the policies or procedures may deteriorate.
/s/ PricewaterhouseCoopers LLP
Chicago, Illinois
June 7, 2019
We have served as the Company’s or its predecessor’s auditor since 1979.
59
The Kraft Heinz Company
Consolidated Statements of Income
(in millions, except per share data)
|
As Restated & Recast
|
|||||||||||
|
December 29,
2018 |
December 30,
2017 |
December 31,
2016 |
|||||||||
|
Net sales
|
$
|
26,268
|
|
$
|
26,076
|
|
$
|
26,300
|
|
||
|
Cost of products sold
|
17,347
|
|
17,043
|
|
17,154
|
|
|||||
|
Gross profit
|
8,921
|
|
9,033
|
|
9,146
|
|
|||||
|
Selling, general and administrative expenses, excluding impairment losses
|
3,205
|
|
2,927
|
|
3,527
|
|
|||||
|
Goodwill impairment losses
|
7,008
|
|
—
|
|
—
|
|
|||||
|
Intangible asset impairment losses
|
8,928
|
|
49
|
|
18
|
|
|||||
|
Selling, general and administrative expenses
|
19,141
|
|
2,976
|
|
3,545
|
|
|||||
|
Operating income/(loss)
|
(10,220
|
)
|
6,057
|
|
5,601
|
|
|||||
|
Interest expense
|
1,284
|
|
1,234
|
|
1,134
|
|
|||||
|
Other expense/(income), net
|
(183
|
)
|
(627
|
)
|
(472
|
)
|
|||||
|
Income/(loss) before income taxes
|
(11,321
|
)
|
5,450
|
|
4,939
|
|
|||||
|
Provision for/(benefit from) income taxes
|
(1,067
|
)
|
(5,482
|
)
|
1,333
|
|
|||||
|
Net income/(loss)
|
(10,254
|
)
|
10,932
|
|
3,606
|
|
|||||
|
Net income/(loss) attributable to noncontrolling interest
|
(62
|
)
|
(9
|
)
|
10
|
|
|||||
|
Net income/(loss) attributable to Kraft Heinz
|
(10,192
|
)
|
10,941
|
|
3,596
|
|
|||||
|
Preferred dividends
|
—
|
|
—
|
|
180
|
|
|||||
|
Net income/(loss) attributable to common shareholders
|
$
|
(10,192
|
)
|
$
|
10,941
|
|
$
|
3,416
|
|
||
|
Per share data applicable to common shareholders:
|
|||||||||||
|
Basic earnings/(loss)
|
$
|
(8.36
|
)
|
$
|
8.98
|
|
$
|
2.81
|
|
||
|
Diluted earnings/(loss)
|
(8.36
|
)
|
8.91
|
|
2.78
|
|
|||||
See accompanying notes to the consolidated financial statements.
60
The Kraft Heinz Company
Consolidated Statements of Comprehensive Income
(in millions)
|
As Restated
|
|||||||||||
|
December 29,
2018 |
December 30,
2017 |
December 31,
2016 |
|||||||||
|
Net income/(loss)
|
$
|
(10,254
|
)
|
$
|
10,932
|
|
$
|
3,606
|
|
||
|
Other comprehensive income/(loss), net of tax:
|
|||||||||||
|
Foreign currency translation adjustments
|
(1,187
|
)
|
1,185
|
|
(979
|
)
|
|||||
|
Net deferred gains/(losses) on net investment hedges
|
284
|
|
(353
|
)
|
226
|
|
|||||
|
Amounts excluded from the effectiveness assessment of net investment hedges
|
7
|
|
—
|
|
—
|
|
|||||
|
Net deferred losses/(gains) on net investment hedges reclassified to net income/(loss)
|
(7
|
)
|
—
|
|
—
|
|
|||||
|
Net deferred gains/(losses) on cash flow hedges
|
99
|
|
(113
|
)
|
46
|
|
|||||
|
Amounts excluded from the effectiveness assessment of cash flow hedges
|
2
|
|
—
|
|
—
|
|
|||||
|
Net deferred losses/(gains) on cash flow hedges reclassified to net income/(loss)
|
(44
|
)
|
85
|
|
(87
|
)
|
|||||
|
Net actuarial gains/(losses) arising during the period
|
58
|
|
69
|
|
(40
|
)
|
|||||
|
Prior service credits/(costs) arising during the period
|
3
|
|
17
|
|
31
|
|
|||||
|
Net postemployment benefit losses/(gains) reclassified to net income/(loss)
|
(118
|
)
|
(309
|
)
|
(204
|
)
|
|||||
|
Total other comprehensive income/(loss)
|
(903
|
)
|
581
|
|
(1,007
|
)
|
|||||
|
Total comprehensive income/(loss)
|
(11,157
|
)
|
11,513
|
|
2,599
|
|
|||||
|
Comprehensive income/(loss) attributable to noncontrolling interest
|
(76
|
)
|
(3
|
)
|
16
|
|
|||||
|
Comprehensive income/(loss) attributable to Kraft Heinz
|
$
|
(11,081
|
)
|
$
|
11,516
|
|
$
|
2,583
|
|
||
See accompanying notes to the consolidated financial statements.
61
The Kraft Heinz Company
Consolidated Balance Sheets
(in millions, except per share data)
|
As Restated
|
|||||||
|
|
December 29, 2018
|
December 30, 2017
|
|||||
|
ASSETS
|
|||||||
|
Cash and cash equivalents
|
$
|
1,130
|
|
$
|
1,629
|
|
|
|
Trade receivables (net of allowances of $24 at December 29, 2018 and $23 at December 30, 2017)
|
2,129
|
|
921
|
|
|||
|
Sold receivables
|
—
|
|
353
|
|
|||
|
Income taxes receivable
|
152
|
|
538
|
|
|||
|
Inventories
|
2,667
|
|
2,760
|
|
|||
|
Prepaid expenses
|
400
|
|
345
|
|
|||
|
Other current assets
|
1,221
|
|
655
|
|
|||
|
Assets held for sale
|
1,376
|
|
—
|
|
|||
|
Total current assets
|
9,075
|
|
7,201
|
|
|||
|
Property, plant and equipment, net
|
7,078
|
|
7,061
|
|
|||
|
Goodwill
|
36,503
|
|
44,825
|
|
|||
|
Intangible assets, net
|
49,468
|
|
59,432
|
|
|||
|
Other non-current assets
|
1,337
|
|
1,573
|
|
|||
|
TOTAL ASSETS
|
$
|
103,461
|
|
$
|
120,092
|
|
|
|
LIABILITIES AND EQUITY
|
|||||||
|
Commercial paper and other short-term debt
|
$
|
21
|
|
$
|
462
|
|
|
|
Current portion of long-term debt
|
377
|
|
2,733
|
|
|||
|
Trade payables
|
4,153
|
|
4,362
|
|
|||
|
Accrued marketing
|
722
|
|
689
|
|
|||
|
Interest payable
|
408
|
|
419
|
|
|||
|
Other current liabilities
|
1,767
|
|
1,489
|
|
|||
|
Liabilities held for sale
|
55
|
|
—
|
|
|||
|
Total current liabilities
|
7,503
|
|
10,154
|
|
|||
|
Long-term debt
|
30,770
|
|
28,308
|
|
|||
|
Deferred income taxes
|
12,202
|
|
14,039
|
|
|||
|
Accrued postemployment costs
|
306
|
|
427
|
|
|||
|
Other non-current liabilities
|
902
|
|
1,088
|
|
|||
|
TOTAL LIABILITIES
|
51,683
|
|
54,016
|
|
|||
|
Commitments and Contingencies (Note 18)
|
|
|
|||||
|
Redeemable noncontrolling interest
|
3
|
|
6
|
|
|||
|
Equity:
|
|
||||||
|
Common stock, $0.01 par value (5,000 shares authorized; 1,224 shares issued and 1,220
shares outstanding at December 29, 2018; 1,221 shares issued and 1,219 shares outstanding at December 30, 2017)
|
12
|
|
12
|
|
|||
|
Additional paid-in capital
|
58,723
|
|
58,634
|
|
|||
|
Retained earnings/(deficit)
|
(4,853
|
)
|
8,495
|
|
|||
|
Accumulated other comprehensive income/(losses)
|
(1,943
|
)
|
(1,054
|
)
|
|||
|
Treasury stock, at cost (4 shares at December 29, 2018 and 2 shares at December 30, 2017)
|
(282
|
)
|
(224
|
)
|
|||
|
Total shareholders' equity
|
51,657
|
|
65,863
|
|
|||
|
Noncontrolling interest
|
118
|
|
207
|
|
|||
|
TOTAL EQUITY
|
51,775
|
|
66,070
|
|
|||
|
TOTAL LIABILITIES AND EQUITY
|
$
|
103,461
|
|
$
|
120,092
|
|
|
See accompanying notes to the consolidated financial statements.
62
The Kraft Heinz Company
Consolidated Statements of Equity
(in millions)
|
Common Stock
|
Additional Paid-in Capital
|
Retained Earnings/(Deficit)
|
Accumulated Other Comprehensive Income/(Losses)
|
Treasury Stock, at Cost
|
Noncontrolling Interest
|
Total Equity
|
|||||||||||||||||||||
|
Balance at January 3, 2016 (As Restated)
|
12
|
|
58,298
|
|
—
|
|
(616
|
)
|
(31
|
)
|
208
|
|
57,871
|
|
|||||||||||||
|
Net income/(loss) excluding redeemable noncontrolling interest
|
—
|
|
—
|
|
3,596
|
|
—
|
|
—
|
|
10
|
|
3,606
|
|
|||||||||||||
|
Other comprehensive income/(loss) excluding redeemable noncontrolling interest
|
—
|
|
—
|
|
—
|
|
(1,013
|
)
|
—
|
|
6
|
|
(1,007
|
)
|
|||||||||||||
|
Dividends declared-Series A Preferred Stock ($2,250.00 per share)
|
—
|
|
—
|
|
(180
|
)
|
—
|
|
—
|
|
—
|
|
(180
|
)
|
|||||||||||||
|
Dividends declared-common stock ($2.35 per share)
|
—
|
|
—
|
|
(2,862
|
)
|
—
|
|
—
|
|
—
|
|
(2,862
|
)
|
|||||||||||||
|
Dividends declared-noncontrolling interest ($90.82 per share)
|
—
|
|
—
|
|
—
|
|
—
|
|
—
|
|
(8
|
)
|
(8
|
)
|
|||||||||||||
|
Exercise of stock options, issuance of other stock awards, and other
|
—
|
|
218
|
|
(2
|
)
|
—
|
|
(176
|
)
|
—
|
|
40
|
|
|||||||||||||
|
Balance at December 31, 2016 (As Restated)
|
12
|
|
58,516
|
|
552
|
|
(1,629
|
)
|
(207
|
)
|
216
|
|
57,460
|
|
|||||||||||||
|
Net income/(loss) excluding redeemable noncontrolling interest
|
—
|
|
—
|
|
10,941
|
|
—
|
|
—
|
|
(5
|
)
|
10,936
|
|
|||||||||||||
|
Other comprehensive income/(loss)
|
—
|
|
—
|
|
—
|
|
575
|
|
—
|
|
6
|
|
581
|
|
|||||||||||||
|
Dividends declared-common stock ($2.45 per share)
|
—
|
|
—
|
|
(2,988
|
)
|
—
|
|
—
|
|
—
|
|
(2,988
|
)
|
|||||||||||||
|
Dividends declared-noncontrolling interest ($52.75 per share)
|
—
|
|
—
|
|
—
|
|
—
|
|
—
|
|
(10
|
)
|
(10
|
)
|
|||||||||||||
|
Exercise of stock options, issuance of other stock awards, and other
|
—
|
|
118
|
|
(10
|
)
|
—
|
|
(17
|
)
|
—
|
|
91
|
|
|||||||||||||
|
Balance at December 30, 2017 (As Restated)
|
12
|
|
58,634
|
|
8,495
|
|
(1,054
|
)
|
(224
|
)
|
207
|
|
66,070
|
|
|||||||||||||
|
Net income/(loss) excluding redeemable noncontrolling interest
|
—
|
|
—
|
|
(10,192
|
)
|
—
|
|
—
|
|
(50
|
)
|
(10,242
|
)
|
|||||||||||||
|
Other comprehensive income/(loss)
|
—
|
|
—
|
|
—
|
|
(889
|
)
|
—
|
|
(14
|
)
|
(903
|
)
|
|||||||||||||
|
Dividends declared-common stock ($2.50 per share)
|
—
|
|
—
|
|
(3,048
|
)
|
—
|
|
—
|
|
—
|
|
(3,048
|
)
|
|||||||||||||
|
Dividends declared-noncontrolling interest ($174.76 per share)
|
—
|
|
—
|
|
—
|
|
—
|
|
—
|
|
(12
|
)
|
(12
|
)
|
|||||||||||||
|
Cumulative effect of accounting standards adopted in the period
|
—
|
|
—
|
|
(97
|
)
|
—
|
|
—
|
|
—
|
|
(97
|
)
|
|||||||||||||
|
Exercise of stock options, issuance of other stock awards, and other
|
—
|
|
89
|
|
(11
|
)
|
—
|
|
(58
|
)
|
(13
|
)
|
7
|
|
|||||||||||||
|
Balance at December 29, 2018
|
$
|
12
|
|
$
|
58,723
|
|
$
|
(4,853
|
)
|
$
|
(1,943
|
)
|
$
|
(282
|
)
|
$
|
118
|
|
$
|
51,775
|
|
||||||
See accompanying notes to the consolidated financial statements.
63
The Kraft Heinz Company
Consolidated Statements of Cash Flows
(in millions)
|
As Restated
|
|||||||||||
|
December 29,
2018 |
December 30,
2017 |
December 31,
2016 |
|||||||||
|
CASH FLOWS FROM OPERATING ACTIVITIES:
|
|||||||||||
|
Net income/(loss)
|
$
|
(10,254
|
)
|
$
|
10,932
|
|
$
|
3,606
|
|
||
|
Adjustments to reconcile net income/(loss) to operating cash flows:
|
|
|
|
|
|||||||
|
Depreciation and amortization
|
983
|
|
1,031
|
|
1,337
|
|
|||||
|
Amortization of postretirement benefit plans prior service costs/(credits)
|
(339
|
)
|
(328
|
)
|
(347
|
)
|
|||||
|
Equity award compensation expense
|
33
|
|
46
|
|
46
|
|
|||||
|
Deferred income tax provision/(benefit)
|
(1,967
|
)
|
(6,495
|
)
|
(72
|
)
|
|||||
|
Postemployment benefit plan contributions
|
(76
|
)
|
(1,659
|
)
|
(494
|
)
|
|||||
|
Goodwill and intangible asset impairment losses
|
15,936
|
|
49
|
|
18
|
|
|||||
|
Nonmonetary currency devaluation
|
146
|
|
36
|
|
24
|
|
|||||
|
Other items, net
|
175
|
|
253
|
|
25
|
|
|||||
|
Changes in current assets and liabilities:
|
|||||||||||
|
Trade receivables
|
(2,280
|
)
|
(2,629
|
)
|
(2,055
|
)
|
|||||
|
Inventories
|
(251
|
)
|
(236
|
)
|
(130
|
)
|
|||||
|
Accounts payable
|
(23
|
)
|
441
|
|
879
|
|
|||||
|
Other current assets
|
(146
|
)
|
(64
|
)
|
(41
|
)
|
|||||
|
Other current liabilities
|
637
|
|
(876
|
)
|
(148
|
)
|
|||||
|
Net cash provided by/(used for) operating activities
|
2,574
|
|
501
|
|
2,648
|
|
|||||
|
CASH FLOWS FROM INVESTING ACTIVITIES:
|
|||||||||||
|
Cash receipts on sold receivables
|
1,296
|
|
2,286
|
|
2,589
|
|
|||||
|
Capital expenditures
|
(826
|
)
|
(1,194
|
)
|
(1,247
|
)
|
|||||
|
Payments to acquire business, net of cash acquired
|
(248
|
)
|
—
|
|
—
|
|
|||||
|
Other investing activities, net
|
66
|
|
85
|
|
110
|
|
|||||
|
Net cash provided by/(used for) investing activities
|
288
|
|
1,177
|
|
1,452
|
|
|||||
|
CASH FLOWS FROM FINANCING ACTIVITIES:
|
|||||||||||
|
Repayments of long-term debt
|
(2,713
|
)
|
(2,641
|
)
|
(85
|
)
|
|||||
|
Proceeds from issuance of long-term debt
|
2,990
|
|
1,496
|
|
6,981
|
|
|||||
|
Proceeds from issuance of commercial paper
|
2,784
|
|
6,043
|
|
6,680
|
|
|||||
|
Repayments of commercial paper
|
(3,213
|
)
|
(6,249
|
)
|
(6,043
|
)
|
|||||
|
Dividends paid - Series A Preferred Stock
|
—
|
|
—
|
|
(180
|
)
|
|||||
|
Dividends paid - common stock
|
(3,183
|
)
|
(2,888
|
)
|
(3,584
|
)
|
|||||
|
Redemption of Series A Preferred Stock
|
—
|
|
—
|
|
(8,320
|
)
|
|||||
|
Other financing activities, net
|
(28
|
)
|
18
|
|
(69
|
)
|
|||||
|
Net cash provided by/(used for) financing activities
|
(3,363
|
)
|
(4,221
|
)
|
(4,620
|
)
|
|||||
|
Effect of exchange rate changes on cash, cash equivalents, and restricted cash
|
(132
|
)
|
57
|
|
(137
|
)
|
|||||
|
Cash, cash equivalents, and restricted cash
|
|||||||||||
|
Net increase/(decrease)
|
(633
|
)
|
(2,486
|
)
|
(657
|
)
|
|||||
|
Balance at beginning of period
|
1,769
|
|
4,255
|
|
4,912
|
|
|||||
|
Balance at end of period
|
$
|
1,136
|
|
$
|
1,769
|
|
$
|
4,255
|
|
||
See accompanying notes to the consolidated financial statements.
64
The Kraft Heinz Company
Consolidated Statements of Cash Flows
(in millions)
|
As Restated
|
|||||||||||
|
December 29,
2018 |
December 30,
2017 |
December 31,
2016 |
|||||||||
|
NON-CASH INVESTING ACTIVITIES:
|
|||||||||||
|
Beneficial interest obtained in exchange for securitized trade receivables
|
$
|
938
|
|
$
|
2,519
|
|
$
|
2,213
|
|
||
|
CASH PAID DURING THE PERIOD FOR:
|
|||||||||||
|
Interest
|
$
|
1,322
|
|
$
|
1,269
|
|
$
|
1,176
|
|
||
|
Income taxes
|
543
|
|
1,206
|
|
1,619
|
|
|||||
See accompanying notes to the consolidated financial statements.
65
The Kraft Heinz Company
Notes to Consolidated Financial Statements
Note 1. Basis of Presentation
Organization
On July 2, 2015
(the “2015 Merger Date”)
, through a series of transactions, we consummated the merger of Kraft Foods Group, Inc. (“Kraft”) with and into a wholly-owned subsidiary of H.J. Heinz Holding Corporation (“Heinz”) (the “2015 Merger”). At the closing of the 2015 Merger, Heinz was renamed The Kraft Heinz Company
(“Kraft Heinz”). Before the consummation of the 2015 Merger, Heinz was controlled by Berkshire Hathaway Inc. and 3G Global Food Holdings, LP (“3G Global Food Holdings” and together with its affiliates, “3G Capital”), following their acquisition of H. J. Heinz Company on June 7, 2013.
Principles of Consolidation
The consolidated financial statements include Kraft Heinz, as well as our wholly-owned and majority-owned subsidiaries. All intercompany transactions are eliminated.
Reportable Segments
We manage and report our operating results through
four
segments. We have
three
reportable segments defined by geographic region: United States, Canada, and
Europe, Middle East, and Africa (“EMEA”)
. Our remaining businesses are combined and disclosed as “Rest of World.” Rest of World comprises
two
operating segments: Latin America and
Asia Pacific (“APAC”).
Our segments reflect a change, effective in the first quarter of our fiscal year 2018, to reorganize our international businesses to better align our global geographies. We moved our Middle East and Africa businesses from the historical
Asia Pacific, Middle East, and Africa (“AMEA”)
operating segment into the historical Europe reportable segment, forming the new
EMEA
reportable segment. The remaining businesses from the
AMEA
operating segment became the
APAC
operating segment. We have reflected this change in all historical periods presented.
See Note 22,
Segment Reporting
, for our financial information by segment.
Held for Sale
In the fourth quarter of 2018, we announced our plans to divest certain assets and operations, predominantly in Canada and India. At
December 29, 2018
, we have classified the assets and liabilities related to these disposal groups as held for sale in our consolidated balance sheets. These assets and liabilities are included in assets held for sale within current assets and liabilities held for sale within current liabilities. See Note 5,
Acquisitions and Divestitures
, for additional information.
Use of Estimates
We prepare our consolidated financial statements in accordance with accounting principles generally accepted in the United States of America (“U.S. GAAP”), which requires us to make accounting policy elections, estimates, and assumptions that affect the reported amount of assets, liabilities, reserves, and expenses. These policy elections, estimates, and assumptions are based on our best estimates and judgments. We evaluate our policy elections, estimates, and assumptions on an ongoing basis using historical experience and other factors, including the current economic environment. We believe these estimates to be reasonable given the current facts available. We adjust our policy elections, estimates, and assumptions when facts and circumstances dictate. Market volatility, including foreign currency exchange rates, increases the uncertainty inherent in our estimates and assumptions. As future events and their effects cannot be determined with precision, actual results could differ significantly from estimates. If actual amounts differ from estimates, we include the revisions in our consolidated results of operations in the period the actual amounts become known. Historically, the aggregate differences, if any, between our estimates and actual amounts in any year have not had a material effect on our consolidated financial statements.
Reclassifications
We made reclassifications to certain previously reported financial information to conform to our current period presentation.
66
Note 2. Restatement of Previously Issued Consolidated Financial Statements
We have restated herein our audited consolidated financial statements at December 30, 2017 and for the years ended December 30, 2017 and December 31, 2016. We have also restated impacted amounts within the accompanying footnotes to the consolidated financial statements.
Restatement Background
As previously disclosed on February 21, 2019, we received a subpoena from the Securities and Exchange Commission (“SEC”) in October 2018
related to our procurement area, specifically the accounting policies, procedures, and internal controls related to our procurement function, including, but not limited to, agreements, side agreements, and changes or modifications to agreements with our suppliers. Following the receipt of this subpoena, we, together with external counsel and forensic accountants, and subsequently, under the oversight of the Audit Committee of our Board of Directors (the “Audit Committee”), conducted an internal investigation into the procurement area and related matters. As a result of the findings from this internal investigation, which is now complete and which identified that multiple employees in the procurement area engaged in misconduct, we corrected prior period misstatements that generally increased the total cost of products sold in prior financial periods. These misstatements principally related to the incorrect timing of when certain cost and rebate elements associated with supplier contracts and related arrangements were initially recognized.
In connection with the internal investigation, we also conducted a comprehensive review of supplier contracts and related arrangements to identify other potential misstatements in the timing of the recognition of supplier rebates, incentive payments, and pricing arrangements. The review identified further misstatements, which we also investigated and have been unable to conclude if they resulted from the misconduct described above.
These misstatements are described in more detail in
restatement reference (a) below.
Our internal investigation and review identified adjustments that resulted in an understatement of cost of products sold totaling
$208 million
, including
misstatements of
$175 million
relating to the periods up through September 29, 2018 that are being restated in this Annual Report on Form 10-K.
The misstatements of cost of products sold related to our internal investigation and review included
$22 million
for fiscal year 2018,
$94 million
for fiscal year 2017,
$35 million
for fiscal year 2016, and
$24 million
for fiscal year 2015.
We do not believe that the misstatements are quantitatively material to any period presented in our prior financial statements. However, due to the qualitative nature of the matters identified in our internal investigation, including the number of years over which the misconduct occurred and the number of transactions, suppliers, and procurement employees involved, we determined that it would be appropriate to correct the misstatements in our previously issued consolidated financial statements by restating such financial statements. The restatement also included corrections for additional identified out-of-period and uncorrected misstatements in the impacted periods.
Accordingly, we have restated herein our consolidated financial statements at December 30, 2017 and for the fiscal years ended December 30, 2017 and December 31, 2016, in accordance with Accounting Standards Codification (“ASC”) Topic 250,
Accounting Changes and Error Corrections
.
In addition to the misstatements related to the supplier contracts and related arrangements, including the misstatements related to lease classification
described in restatement reference (b) below
, we corrected additional identified out-of-period and uncorrected misstatements that were not material, individually or in the aggregate, to our consolidated financial statements.
These misstatements were related to customer incentive program expense misclassifications, balance sheet misclassifications, income taxes, impairments, and other misstatements
, all of which are described in more detail in restatement references (c) through (g) below.
The restated interim financial information for the relevant unaudited interim financial information for the quarterly periods ended September 29, 2018, June 30, 2018, March 31, 2018, December 30, 2017, September 30, 2017, July 1, 2017, and April 1, 2017, is included in Note 23,
Quarterly Financial Information (Unaudited)
. The categories of misstatements and their impact on our previously issued consolidated financial statements are described in more detail below.
67
Description of Misstatements
Misstatements Associated with Supplier Contracts and Related Arrangements
(a) Supplier Rebates
We recorded adjustments to correct the misstatements found as a result of the internal investigation related to procurement described above.
In connection with the internal investigation, we also conducted a comprehensive review of supplier contracts and related arrangements to identify other potential misstatements in the timing of the recognition of supplier rebates, incentive payments, and pricing arrangements. The review identified further misstatements, which we also investigated and have been unable to conclude if they resulted from the misconduct described above.
These misstatements were primarily related to certain supplier contracts and related arrangements where the allocation of value of all or a portion of rebates and up-front payments to contractual elements in the current period should have been deferred and recognized over an applicable contractual period. We corrected these misstatements to defer the up-front consideration from suppliers when the retention or receipt of that consideration was contingent upon future events and to correctly recognize the consideration as a reduction of cost of products sold over the terms of the arrangements with the suppliers.
The impacts of the supplier rebate misstatements on each period are discussed in restatement reference (a) throughout this note and in Note 23,
Quarterly Financial Data (Unaudited)
.
(b) Capital Leases
As part of our review of supplier contracts and related arrangements in connection with the internal investigation, we evaluated additional elements of such arrangements, including the classification of embedded lease provisions as capital or operating. We had initially classified certain embedded lease provisions as capital leases and allocated their fixed consideration to the lease components. As a result of our analysis, and also taking into consideration, among other elements, the total value of supplier contracts and related arrangements,
we determined that the classification of the embedded lease element for certain contracts should have been classified as an operating lease instead of a capital lease. In addition, we identified certain arrangements that were improperly accounted for as embedded capital leases.
The impacts of the capital lease misstatements on each period are discussed in restatement reference (b) throughout this note and in Note 23,
Quarterly Financial Data (Unaudited)
.
Additional Misstatements
(c) Customer Incentive Program Expense Misclassifications
As previously disclosed in March 2018, we retrospectively corrected immaterial misclassifications in our statements of income principally related to customer incentive program expense misclassifications. The impacts of the customer incentive program expense misclassifications on each period are discussed in restatement reference (c) throughout this note and in Note 23,
Quarterly Financial Data (Unaudited)
.
(d) Balance Sheet Misclassifications
We recorded adjustments to recognize certain balance sheet misclassifications in the correct period. These adjustments primarily related to the classification of state income taxes, capital expenditures, and the classification of products held at co-packer locations. The impacts of the balance sheet misclassifications on each period are discussed in restatement reference (d) throughout this note and in Note 23,
Quarterly Financial Data (Unaudited)
.
(e) Income Taxes
We recorded adjustments to recognize certain income tax items in the correct period, primarily deferred tax adjustments related to a Brazilian subsidiary, as well as return-to-provision adjustments and various other misclassifications. The income tax impacts of all misstatements outside of this category are included in their respective misstatement categories. The impacts of income tax misstatements on each period are discussed in restatement reference (e) throughout this note and in Note 23,
Quarterly Financial Data (Unaudited)
.
(f) Impairments
We recorded an adjustment to recognize certain non-cash impairment losses in the correct period. In 2018, we had determined that a definite-lived intangible asset had been impaired in the fourth quarter of 2016 due to a license termination in that period and recorded an out-of-period correction to recognize the non-cash impairment loss. In addition, we recorded an adjustment to correct goodwill impairment losses related to our Australia and New Zealand reporting unit, which had been overstated. The impacts of the impairment misstatements on each period are discussed in restatement reference (f) throughout this note and in Note 23,
Quarterly Financial Data (Unaudited)
.
68
(g) Other
We recorded adjustments to correct other identified out-of-period and uncorrected misstatements that were not material, individually or in the aggregate, to our consolidated financial statements. These other misstatements were primarily related to structured payable and product financing arrangements, postemployment benefit plans, inventory write-offs, certain accrued liabilities, and other misstatements within net sales and certain income tax and balance sheet accounts. The impacts of the other misstatements on each period are discussed in restatement reference (g) throughout this note and in Note 23,
Quarterly Financial Data (Unaudited)
.
Description of Restatement Tables
The following tables represent our restated consolidated statements of income, statements of comprehensive income, statements of equity, and statements of cash flows for the years ended December 30, 2017 and December 31, 2016, as well as our restated consolidated balance sheet at December 30, 2017.
Following the restated consolidated financial statement tables, we have presented a reconciliation from our prior periods as previously reported to the restated values. The values as previously reported for fiscal years 2017 and 2016 were derived from our Annual Report on Form 10-K for the fiscal year ended December 30, 2017 filed on February 16, 2018.
In addition, the statements of income for fiscal years 2017 and 2016, as previously reported, did not originally reflect the adoption of accounting standards update (“ASU”) 2017-07 related to the presentation of net periodic benefit cost (pension and postretirement cost). This ASU was adopted in the first quarter of 2018 and was applied retrospectively for statement of income presentation of service cost components and other net periodic benefit cost components. The restated statements of income for fiscal years 2017 and 2016 reflect the retrospective application of ASU 2017-07 and are labeled “As Recast.”
See Note 4,
New Accounting Standards
, for additional information related to our adoption of ASU 2017-07.
69
The Kraft Heinz Company
Consolidated Statement of Income
(in millions, except per share data)
|
For the Year Ended December 30, 2017
|
|||||||||||||||||||||
|
As Previously Reported
|
Restatement Impacts
|
Restatement Reference
|
As Restated
|
ASU Adoption Impacts
|
As Restated & Recast
|
||||||||||||||||
|
Net sales
|
$
|
26,232
|
|
$
|
(156
|
)
|
(c)(g)
|
$
|
26,076
|
|
$
|
—
|
|
$
|
26,076
|
|
|||||
|
Cost of products sold
|
16,529
|
|
(44
|
)
|
(a)(b)(c)(g)
|
16,485
|
|
558
|
|
17,043
|
|
||||||||||
|
Gross profit
|
9,703
|
|
(112
|
)
|
9,591
|
|
(558
|
)
|
9,033
|
|
|||||||||||
|
Selling, general and administrative expenses, excluding impairment losses
|
2,881
|
|
(32
|
)
|
(c)(g)
|
2,849
|
|
78
|
|
2,927
|
|
||||||||||
|
Goodwill impairment losses
|
—
|
|
—
|
|
—
|
|
—
|
|
—
|
|
|||||||||||
|
Intangible asset impairment losses
|
49
|
|
—
|
|
(f)
|
49
|
|
—
|
|
49
|
|
||||||||||
|
Selling, general and administrative expenses
|
2,930
|
|
(32
|
)
|
2,898
|
|
78
|
|
2,976
|
|
|||||||||||
|
Operating income/(loss)
|
6,773
|
|
(80
|
)
|
6,693
|
|
(636
|
)
|
6,057
|
|
|||||||||||
|
Interest expense
|
1,234
|
|
—
|
|
(b)(g)
|
1,234
|
|
—
|
|
1,234
|
|
||||||||||
|
Other expense/(income), net
|
9
|
|
—
|
|
9
|
|
(636
|
)
|
(627
|
)
|
|||||||||||
|
Income/(loss) before income taxes
|
5,530
|
|
(80
|
)
|
5,450
|
|
—
|
|
5,450
|
|
|||||||||||
|
Provision for/(benefit from) income taxes
|
(5,460
|
)
|
(22
|
)
|
(a)(b)(e)(f)(g)
|
(5,482
|
)
|
—
|
|
(5,482
|
)
|
||||||||||
|
Net income/(loss)
|
10,990
|
|
(58
|
)
|
10,932
|
|
—
|
|
10,932
|
|
|||||||||||
|
Net income/(loss) attributable to noncontrolling interest
|
(9
|
)
|
—
|
|
(9
|
)
|
—
|
|
(9
|
)
|
|||||||||||
|
Net income/(loss) attributable to Kraft Heinz
|
10,999
|
|
(58
|
)
|
10,941
|
|
—
|
|
10,941
|
|
|||||||||||
|
Preferred dividends
|
—
|
|
—
|
|
—
|
|
—
|
|
—
|
|
|||||||||||
|
Net income/(loss) attributable to common shareholders
|
$
|
10,999
|
|
$
|
(58
|
)
|
$
|
10,941
|
|
$
|
—
|
|
$
|
10,941
|
|
||||||
|
Per share data applicable to common shareholders:
|
|||||||||||||||||||||
|
Basic earnings/(loss)
|
$
|
9.03
|
|
$
|
(0.05
|
)
|
$
|
8.98
|
|
$
|
—
|
|
$
|
8.98
|
|
||||||
|
Diluted earnings/(loss)
|
8.95
|
|
(0.04
|
)
|
8.91
|
|
—
|
|
8.91
|
|
|||||||||||
(a) Supplier Rebates—The correction of these misstatements resulted in an increase to cost of products sold of
$94 million
and an increase to benefit from income taxes of
$18 million
for the year ended December 30, 2017.
(b) Capital Leases—The correction of these misstatements resulted in a decrease to cost of products sold of less than
$1 million
, a decrease to interest expense of less than
$1 million
, and a decrease to benefit from income taxes of less than
$1 million
for the year ended December 30, 2017.
(c) Customer Incentive Program Expense Misclassifications—As previously disclosed in March 2018, the correction of these misstatements resulted in a decrease to net sales of
$147 million
, a decrease to cost of products sold of
$139 million
, and a decrease to selling, general and administrative expenses (“SG&A”) of
$8 million
for the year ended December 30, 2017.
(d) Balance Sheet Misclassifications—None.
(e) Income Taxes—The correction of these misstatements resulted in an increase to benefit from income taxes of
$12 million
for the year ended December 30, 2017.
(f) Impairments—The correction of these misstatements resulted in a decrease to SG&A of less than
$1 million
and a decrease to benefit from income taxes of less than
$1 million
for the year ended December 30, 2017.
(g) Other—The correction of these misstatements resulted in a decrease to net sales of
$9 million
, an increase to cost of products sold of
$1 million
, a decrease to SG&A of
$24 million
, a decrease to interest expense of less than
$1 million
, and a decrease to benefit from income taxes of
$8 million
for the year ended December 30, 2017.
The values as previously reported for the year ended December 30, 2017 were derived from our Annual Report on Form 10-K for the year ended December 30, 2017 filed on February 16, 2018.
70
The Kraft Heinz Company
Consolidated Statement of Income
(in millions, except per share data)
|
For the Year Ended December 31, 2016
|
|||||||||||||||||||||
|
As Previously Reported
|
Restatement Impacts
|
Restatement Reference
|
As Restated
|
ASU Adoption Impacts
|
As Restated & Recast
|
||||||||||||||||
|
Net sales
|
$
|
26,487
|
|
$
|
(187
|
)
|
(c)(g)
|
$
|
26,300
|
|
$
|
—
|
|
$
|
26,300
|
|
|||||
|
Cost of products sold
|
16,901
|
|
(116
|
)
|
(a)(c)(g)
|
16,785
|
|
369
|
|
17,154
|
|
||||||||||
|
Gross profit
|
9,586
|
|
(71
|
)
|
9,515
|
|
(369
|
)
|
9,146
|
|
|||||||||||
|
Selling, general and administrative expenses, excluding impairment losses
|
3,444
|
|
(5
|
)
|
(c)(g)
|
3,439
|
|
88
|
|
3,527
|
|
||||||||||
|
Goodwill impairment losses
|
—
|
|
—
|
|
—
|
|
—
|
|
—
|
|
|||||||||||
|
Intangible asset impairment losses
|
—
|
|
18
|
|
(f)
|
18
|
|
—
|
|
18
|
|
||||||||||
|
Selling, general and administrative expenses
|
3,444
|
|
13
|
|
3,457
|
|
88
|
|
3,545
|
|
|||||||||||
|
Operating income/(loss)
|
6,142
|
|
(84
|
)
|
6,058
|
|
(457
|
)
|
5,601
|
|
|||||||||||
|
Interest expense
|
1,134
|
|
—
|
|
(g)
|
1,134
|
|
—
|
|
1,134
|
|
||||||||||
|
Other expense/(income), net
|
(15
|
)
|
—
|
|
(g)
|
(15
|
)
|
(457
|
)
|
(472
|
)
|
||||||||||
|
Income/(loss) before income taxes
|
5,023
|
|
(84
|
)
|
4,939
|
|
—
|
|
4,939
|
|
|||||||||||
|
Provision for/(benefit from) income taxes
|
1,381
|
|
(48
|
)
|
(a)(e)(f)(g)
|
1,333
|
|
—
|
|
1,333
|
|
||||||||||
|
Net income/(loss)
|
3,642
|
|
(36
|
)
|
3,606
|
|
—
|
|
3,606
|
|
|||||||||||
|
Net income/(loss) attributable to noncontrolling interest
|
10
|
|
—
|
|
10
|
|
—
|
|
10
|
|
|||||||||||
|
Net income/(loss) attributable to Kraft Heinz
|
3,632
|
|
(36
|
)
|
3,596
|
|
—
|
|
3,596
|
|
|||||||||||
|
Preferred dividends
|
180
|
|
—
|
|
180
|
|
—
|
|
180
|
|
|||||||||||
|
Net income/(loss) attributable to common shareholders
|
$
|
3,452
|
|
$
|
(36
|
)
|
$
|
3,416
|
|
$
|
—
|
|
$
|
3,416
|
|
||||||
|
Per share data applicable to common shareholders:
|
|||||||||||||||||||||
|
Basic earnings/(loss)
|
$
|
2.84
|
|
$
|
(0.03
|
)
|
$
|
2.81
|
|
$
|
—
|
|
$
|
2.81
|
|
||||||
|
Diluted earnings/(loss)
|
2.81
|
|
(0.03
|
)
|
2.78
|
|
—
|
|
2.78
|
|
|||||||||||
(a) Supplier Rebates—The correction of these misstatements resulted in an increase to cost of products sold of
$35 million
and a decrease to provision for income taxes of
$13 million
for the year ended December 31, 2016.
(b) Capital Leases—None.
(c) Customer Incentive Program Expense Misclassifications—As previously disclosed in March 2018, the correction of these misstatements resulted in a decrease to net sales of
$152 million
, a decrease to cost of products sold of
$145 million
, and a decrease to SG&A of
$7 million
for the year ended December 31, 2016.
(d) Balance Sheet Misclassifications—None.
(e) Income Taxes—The correction of these misstatements resulted in a decrease to provision for income taxes of
$18 million
for the year ended December 31, 2016.
(f) Impairments—The correction of these misstatements resulted in an increase to SG&A of
$18 million
and a decrease to provision for income taxes of
$4 million
for the year ended December 31, 2016.
(g) Other—The correction of these misstatements resulted in a decrease to net sales of
$35 million
, a decrease to cost of products sold of
$6 million
, an increase to SG&A of
$2 million
, a decrease to interest expense of less than
$1 million
, a decrease to other expense/(income), net, of less than
$1 million
, and a decrease to provision for income taxes of
$13 million
for the year ended December 31, 2016.
The values as previously reported for the year ended December 31, 2016 were derived from our Annual Report on Form 10-K for the year ended December 30, 2017 filed on February 16, 2018.
71
The Kraft Heinz Company
Consolidated Statement of Comprehensive Income
(in millions)
|
For the Year Ended December 30, 2017
|
|||||||||||||
|
As Previously Reported
|
Restatement Impacts
|
Restatement Reference
|
As Restated
|
||||||||||
|
Net income/(loss)
|
$
|
10,990
|
|
$
|
(58
|
)
|
(a)(b)(e)(f)(g)
|
$
|
10,932
|
|
|||
|
Other comprehensive income/(loss), net of tax:
|
|||||||||||||
|
Foreign currency translation adjustments
|
1,184
|
|
1
|
|
(b)(e)
|
1,185
|
|
||||||
|
Net deferred gains/(losses) on net investment hedges
|
(353
|
)
|
—
|
|
(353
|
)
|
|||||||
|
Amounts excluded from the effectiveness assessment of net investment hedges
|
—
|
|
—
|
|
—
|
|
|||||||
|
Net deferred losses/(gains) on net investment hedges reclassified to net income/(loss)
|
—
|
|
—
|
|
—
|
|
|||||||
|
Net deferred gains/(losses) on cash flow hedges
|
(113
|
)
|
—
|
|
(113
|
)
|
|||||||
|
Amounts excluded from the effectiveness assessment of cash flow hedges
|
—
|
|
—
|
|
—
|
|
|||||||
|
Net deferred losses/(gains) on cash flow hedges reclassified to net income/(loss)
|
85
|
|
—
|
|
85
|
|
|||||||
|
Net actuarial gains/(losses) arising during the period
|
69
|
|
—
|
|
69
|
|
|||||||
|
Prior service credits/(costs) arising during the period
|
17
|
|
—
|
|
17
|
|
|||||||
|
Net postemployment benefit losses/(gains) reclassified to net income/(loss)
|
(309
|
)
|
—
|
|
(309
|
)
|
|||||||
|
Total other comprehensive income/(loss)
|
580
|
|
1
|
|
581
|
|
|||||||
|
Total comprehensive income/(loss)
|
11,570
|
|
(57
|
)
|
11,513
|
|
|||||||
|
Comprehensive income/(loss) attributable to noncontrolling interest
|
(3
|
)
|
—
|
|
(3
|
)
|
|||||||
|
Comprehensive income/(loss) attributable to Kraft Heinz
|
$
|
11,573
|
|
$
|
(57
|
)
|
$
|
11,516
|
|
||||
The
$58 million
decrease to net income was primarily driven by misstatements in the supplier rebates category, partially offset by misstatements in the income taxes, other, impairments, and capital leases categories. See additional descriptions of the net income impacts in the consolidated statement of income for the year ended December 30, 2017 section above.
The
$1 million
increase to foreign currency translation adjustments is the result of misstatements in the capital leases and income taxes categories.
72
The Kraft Heinz Company
Consolidated Statement of Comprehensive Income
(in millions)
|
For the Year Ended December 31, 2016
|
|||||||||||||
|
As Previously Reported
|
Restatement Impacts
|
Restatement Reference
|
As Restated
|
||||||||||
|
Net income/(loss)
|
$
|
3,642
|
|
$
|
(36
|
)
|
(a)(e)(f)(g)
|
$
|
3,606
|
|
|||
|
Other comprehensive income/(loss), net of tax:
|
|||||||||||||
|
Foreign currency translation adjustments
|
(986
|
)
|
7
|
|
(d)(g)(e)
|
(979
|
)
|
||||||
|
Net deferred gains/(losses) on net investment hedges
|
226
|
|
—
|
|
226
|
|
|||||||
|
Amounts excluded from the effectiveness assessment of net investment hedges
|
—
|
|
—
|
|
—
|
|
|||||||
|
Net deferred losses/(gains) on net investment hedges reclassified to net income/(loss)
|
—
|
|
—
|
|
—
|
|
|||||||
|
Net deferred gains/(losses) on cash flow hedges
|
46
|
|
—
|
|
46
|
|
|||||||
|
Amounts excluded from the effectiveness assessment of cash flow hedges
|
—
|
|
—
|
|
—
|
|
|||||||
|
Net deferred losses/(gains) on cash flow hedges reclassified to net income/(loss)
|
(87
|
)
|
—
|
|
(87
|
)
|
|||||||
|
Net actuarial gains/(losses) arising during the period
|
(40
|
)
|
—
|
|
(40
|
)
|
|||||||
|
Prior service credits/(costs) arising during the period
|
97
|
|
(66
|
)
|
(g)
|
31
|
|
||||||
|
Net postemployment benefit losses/(gains) reclassified to net income/(loss)
|
(207
|
)
|
3
|
|
(g)
|
(204
|
)
|
||||||
|
Total other comprehensive income/(loss)
|
(951
|
)
|
(56
|
)
|
(1,007
|
)
|
|||||||
|
Total comprehensive income/(loss)
|
2,691
|
|
(92
|
)
|
2,599
|
|
|||||||
|
Comprehensive income/(loss) attributable to noncontrolling interest
|
16
|
|
—
|
|
16
|
|
|||||||
|
Comprehensive income/(loss) attributable to Kraft Heinz
|
$
|
2,675
|
|
$
|
(92
|
)
|
$
|
2,583
|
|
||||
The
$36 million
decrease to net income was primarily driven by the misstatements in the other, supplier rebates, and impairments categories, partially offset by the misstatements in the income taxes category. See additional descriptions of the net income impacts in the consolidated statement of income for the year ended December 31, 2016 section above.
The
$7 million
increase to foreign currency translation adjustments is primarily the result of misstatements in the balance sheet misclassifications and the other misstatements categories, partially offset by misstatements in the income taxes category.
The
$66 million
decrease to prior service credits arising during the period and the
$3 million
increase to net postemployment benefit gains reclassified to net income are the result of misstatements in the other category.
73
The Kraft Heinz Company
Consolidated Balance Sheets
(in millions, except per share data)
|
December 30, 2017
|
|||||||||||||
|
As Previously Reported
|
Restatement Impacts
|
Restatement Reference
|
As Restated
|
||||||||||
|
ASSETS
|
|||||||||||||
|
Cash and cash equivalents
|
$
|
1,629
|
|
$
|
—
|
|
$
|
1,629
|
|
||||
|
Trade receivables (net of allowances of $23 at December 30, 2017)
|
921
|
|
—
|
|
921
|
|
|||||||
|
Sold receivables
|
353
|
|
—
|
|
353
|
|
|||||||
|
Income taxes receivable
|
582
|
|
(44
|
)
|
(a)(b)(d)(e)(g)
|
538
|
|
||||||
|
Inventories
|
2,815
|
|
(55
|
)
|
(d)(g)
|
2,760
|
|
||||||
|
Prepaid expenses
|
345
|
|
—
|
|
345
|
|
|||||||
|
Other current assets
|
621
|
|
34
|
|
(a)(d)
|
655
|
|
||||||
|
Total current assets
|
7,266
|
|
(65
|
)
|
7,201
|
|
|||||||
|
Property, plant and equipment, net
|
7,120
|
|
(59
|
)
|
(b)(d)(g)
|
7,061
|
|
||||||
|
Goodwill
|
44,824
|
|
1
|
|
(g)
|
44,825
|
|
||||||
|
Intangible assets, net
|
59,449
|
|
(17
|
)
|
(f)
|
59,432
|
|
||||||
|
Other non-current assets
|
1,573
|
|
—
|
|
1,573
|
|
|||||||
|
TOTAL ASSETS
|
$
|
120,232
|
|
$
|
(140
|
)
|
$
|
120,092
|
|
||||
|
LIABILITIES AND EQUITY
|
|||||||||||||
|
Commercial paper and other short-term debt
|
$
|
460
|
|
$
|
2
|
|
(g)
|
$
|
462
|
|
|||
|
Current portion of long-term debt
|
2,743
|
|
(10
|
)
|
(b)(g)
|
2,733
|
|
||||||
|
Trade payables
|
4,449
|
|
(87
|
)
|
(d)(g)
|
4,362
|
|
||||||
|
Accrued marketing
|
680
|
|
9
|
|
(g)
|
689
|
|
||||||
|
Interest payable
|
419
|
|
—
|
|
419
|
|
|||||||
|
Other current liabilities
|
1,381
|
|
108
|
|
(a)(d)(g)
|
1,489
|
|
||||||
|
Total current liabilities
|
10,132
|
|
22
|
|
10,154
|
|
|||||||
|
Long-term debt
|
28,333
|
|
(25
|
)
|
(b)
|
28,308
|
|
||||||
|
Deferred income taxes
|
14,076
|
|
(37
|
)
|
(a)(d)(e)(f)(g)
|
14,039
|
|
||||||
|
Accrued postemployment costs
|
427
|
|
—
|
|
427
|
|
|||||||
|
Other non-current liabilities
|
1,017
|
|
71
|
|
(a)
|
1,088
|
|
||||||
|
TOTAL LIABILITIES
|
53,985
|
|
31
|
|
54,016
|
|
|||||||
|
Commitments and Contingencies
|
|
|
|
||||||||||
|
Redeemable noncontrolling interest
|
6
|
|
—
|
|
6
|
|
|||||||
|
Equity:
|
|
||||||||||||
|
Common stock, $0.01 par value (5,000 shares authorized; 1,221 shares issued and 1,219 shares outstanding at December 30, 2017)
|
12
|
|
—
|
|
12
|
|
|||||||
|
Additional paid-in capital
|
58,711
|
|
(77
|
)
|
(d)
|
58,634
|
|
||||||
|
Retained earnings/(deficit)
|
8,589
|
|
(94
|
)
|
(a)(b)(d)(e)(f)(g)
|
8,495
|
|
||||||
|
Accumulated other comprehensive income/(losses)
|
(1,054
|
)
|
—
|
|
(1,054
|
)
|
|||||||
|
Treasury stock, at cost (2 shares at December 30, 2017)
|
(224
|
)
|
—
|
|
(224
|
)
|
|||||||
|
Total shareholders' equity
|
66,034
|
|
(171
|
)
|
65,863
|
|
|||||||
|
Noncontrolling interest
|
207
|
|
—
|
|
207
|
|
|||||||
|
TOTAL EQUITY
|
66,241
|
|
(171
|
)
|
66,070
|
|
|||||||
|
TOTAL LIABILITIES AND EQUITY
|
$
|
120,232
|
|
$
|
(140
|
)
|
$
|
120,092
|
|
||||
74
(a) Supplier Rebates—The correction of these misstatements resulted in a decrease to income taxes receivable of
$1 million
, a decrease to other current assets of
$21 million
, an increase to other current liabilities of
$57 million
, a decrease to deferred income taxes of
$37 million
, an increase to other non-current liabilities of
$71 million
, and a decrease to retained earnings of
$113 million
at December 30, 2017.
(b) Capital Leases—The correction of these misstatements resulted in a decrease to income taxes receivable of less than
$1 million
, a decrease to property, plant and equipment, net, of
$34 million
, a decrease to current portion of long-term debt of
$9 million
, a decrease to long-term debt of
$25 million
, and a decrease to retained earnings of less than
$1 million
at December 30, 2017.
(c) Customer Incentive Program Expense Misclassifications—None.
(d) Balance Sheet Misclassifications—The correction of these misstatements resulted in a decrease to income taxes receivable of
$83 million
, a decrease to inventories of
$55 million
, an increase to other current assets of
$55 million
, a decrease to property, plant and equipment, net, of
$23 million
, a decrease to trade payables of
$23 million
, a decrease to other current liabilities of
$28 million
, a decrease to deferred income taxes of
$55 million
, a decrease to additional paid-in capital of
$77 million
, and an increase to retained earnings of
$77 million
at December 30, 2017.
(e) Income Taxes—The correction of these misstatements resulted in an increase to income taxes receivable of
$33 million
, an increase to deferred income taxes of
$58 million
, and a decrease to retained earnings of
$25 million
at December 30, 2017.
(f) Impairments—The correction of these misstatements resulted in a decrease to intangible assets, net, of
$17 million
, a decrease to deferred income taxes of
$4 million
, and a decrease to retained earnings of
$13 million
at December 30, 2017.
(g) Other—The correction of these misstatements resulted in an increase to income taxes receivable of
$7 million
, a decrease to inventories of less than
$1 million
, a decrease to property, plant and equipment, net, of
$2 million
, an increase to goodwill of
$1 million
, an increase to commercial paper and other short-term debt of
$2 million
, a decrease to current portion of long-term debt of
$1 million
, a decrease to trade payables of
$64 million
, an increase to accrued marketing of
$9 million
, an increase to other current liabilities of
$79 million
, an increase to deferred income taxes of
$1 million
, and a decrease to retained earnings of
$20 million
at December 30, 2017.
75
The Kraft Heinz Company
Consolidated Statement of Equity
For the Year Ended December 30, 2017
(in millions)
|
Restatement Reference
|
Common Stock
|
Additional Paid-in Capital
|
Retained Earnings/(Deficit)
|
Accumulated Other Comprehensive Income/(Losses)
|
Treasury Stock, at Cost
|
Noncontrolling Interest
|
Total Equity
|
||||||||||||||||||||||
|
As Previously Reported
|
|||||||||||||||||||||||||||||
|
Balance at December 31, 2016
|
$
|
12
|
|
$
|
58,593
|
|
$
|
588
|
|
$
|
(1,628
|
)
|
$
|
(207
|
)
|
$
|
216
|
|
$
|
57,574
|
|
||||||||
|
Net income/(loss) excluding redeemable noncontrolling interest
|
—
|
|
—
|
|
10,999
|
|
—
|
|
—
|
|
(5
|
)
|
10,994
|
|
|||||||||||||||
|
Other comprehensive income/(loss)
|
—
|
|
—
|
|
—
|
|
574
|
|
—
|
|
6
|
|
580
|
|
|||||||||||||||
|
Dividends declared-common stock ($2.45 per share)
|
—
|
|
—
|
|
(2,988
|
)
|
—
|
|
—
|
|
—
|
|
(2,988
|
)
|
|||||||||||||||
|
Dividends declared-noncontrolling interest ($52.75 per share)
|
—
|
|
—
|
|
—
|
|
—
|
|
—
|
|
(10
|
)
|
(10
|
)
|
|||||||||||||||
|
Exercise of stock options, issuance of other stock awards, and other
|
—
|
|
118
|
|
(10
|
)
|
—
|
|
(17
|
)
|
—
|
|
91
|
|
|||||||||||||||
|
Balance at December 30, 2017
|
$
|
12
|
|
$
|
58,711
|
|
$
|
8,589
|
|
$
|
(1,054
|
)
|
$
|
(224
|
)
|
$
|
207
|
|
$
|
66,241
|
|
||||||||
|
Restatement Impacts
|
|||||||||||||||||||||||||||||
|
Balance at December 31, 2016
|
$
|
—
|
|
$
|
(77
|
)
|
$
|
(36
|
)
|
$
|
(1
|
)
|
$
|
—
|
|
$
|
—
|
|
$
|
(114
|
)
|
||||||||
|
Net income/(loss) excluding redeemable noncontrolling interest
|
(a)(b)(e)(f)(g)
|
—
|
|
—
|
|
(58
|
)
|
—
|
|
—
|
|
—
|
|
(58
|
)
|
||||||||||||||
|
Other comprehensive income/(loss)
|
(b)(e)
|
—
|
|
—
|
|
—
|
|
1
|
|
—
|
|
—
|
|
1
|
|
||||||||||||||
|
Dividends declared-common stock ($2.45 per share)
|
—
|
|
—
|
|
—
|
|
—
|
|
—
|
|
—
|
|
—
|
|
|||||||||||||||
|
Dividends declared-noncontrolling interest ($52.75 per share)
|
—
|
|
—
|
|
—
|
|
—
|
|
—
|
|
—
|
|
—
|
|
|||||||||||||||
|
Exercise of stock options, issuance of other stock awards, and other
|
—
|
|
—
|
|
—
|
|
—
|
|
—
|
|
—
|
|
—
|
|
|||||||||||||||
|
Balance at December 30, 2017
|
$
|
—
|
|
$
|
(77
|
)
|
$
|
(94
|
)
|
$
|
—
|
|
$
|
—
|
|
$
|
—
|
|
$
|
(171
|
)
|
||||||||
|
As Restated
|
|||||||||||||||||||||||||||||
|
Balance at December 31, 2016
|
$
|
12
|
|
$
|
58,516
|
|
$
|
552
|
|
$
|
(1,629
|
)
|
$
|
(207
|
)
|
$
|
216
|
|
$
|
57,460
|
|
||||||||
|
Net income/(loss) excluding redeemable noncontrolling interest
|
—
|
|
—
|
|
10,941
|
|
—
|
|
—
|
|
(5
|
)
|
10,936
|
|
|||||||||||||||
|
Other comprehensive income/(loss)
|
—
|
|
—
|
|
—
|
|
575
|
|
—
|
|
6
|
|
581
|
|
|||||||||||||||
|
Dividends declared-common stock ($2.45 per share)
|
—
|
|
—
|
|
(2,988
|
)
|
—
|
|
—
|
|
—
|
|
(2,988
|
)
|
|||||||||||||||
|
Dividends declared-noncontrolling interest ($52.75 per share)
|
—
|
|
—
|
|
—
|
|
—
|
|
—
|
|
(10
|
)
|
(10
|
)
|
|||||||||||||||
|
Exercise of stock options, issuance of other stock awards, and other
|
—
|
|
118
|
|
(10
|
)
|
—
|
|
(17
|
)
|
—
|
|
91
|
|
|||||||||||||||
|
Balance at December 30, 2017
|
$
|
12
|
|
$
|
58,634
|
|
$
|
8,495
|
|
$
|
(1,054
|
)
|
$
|
(224
|
)
|
$
|
207
|
|
$
|
66,070
|
|
||||||||
See descriptions of the net income and other comprehensive income impacts in the consolidated statement of income and consolidated statement of comprehensive income for the year ended December 30, 2017 sections above.
76
The Kraft Heinz Company
Consolidated Statement of Equity
For the Year Ended December 31, 2016
(in millions)
|
Restatement Reference
|
Common Stock
|
Additional Paid-in Capital
|
Retained Earnings/(Deficit)
|
Accumulated Other Comprehensive Income/(Losses)
|
Treasury Stock, at Cost
|
Noncontrolling Interest
|
Total Equity
|
||||||||||||||||||||||
|
As Previously Reported
|
|||||||||||||||||||||||||||||
|
Balance at January 3, 2016
|
$
|
12
|
|
$
|
58,375
|
|
$
|
—
|
|
$
|
(671
|
)
|
$
|
(31
|
)
|
$
|
208
|
|
$
|
57,893
|
|
||||||||
|
Net income/(loss) excluding redeemable noncontrolling interest
|
—
|
|
—
|
|
3,632
|
|
—
|
|
—
|
|
10
|
|
3,642
|
|
|||||||||||||||
|
Other comprehensive income/(loss) excluding redeemable noncontrolling interest
|
—
|
|
—
|
|
—
|
|
(957
|
)
|
—
|
|
6
|
|
(951
|
)
|
|||||||||||||||
|
Dividends declared-Series A Preferred Stock ($2,250.00 per share)
|
—
|
|
—
|
|
(180
|
)
|
—
|
|
—
|
|
—
|
|
(180
|
)
|
|||||||||||||||
|
Dividends declared-common stock ($2.35 per share)
|
—
|
|
—
|
|
(2,862
|
)
|
—
|
|
—
|
|
—
|
|
(2,862
|
)
|
|||||||||||||||
|
Dividends declared-noncontrolling interest ($90.82 per share)
|
—
|
|
—
|
|
—
|
|
—
|
|
—
|
|
(8
|
)
|
(8
|
)
|
|||||||||||||||
|
Exercise of stock options, issuance of other stock awards, and other
|
—
|
|
218
|
|
(2
|
)
|
—
|
|
(176
|
)
|
—
|
|
40
|
|
|||||||||||||||
|
Balance at December 31, 2016
|
$
|
12
|
|
$
|
58,593
|
|
$
|
588
|
|
$
|
(1,628
|
)
|
$
|
(207
|
)
|
$
|
216
|
|
$
|
57,574
|
|
||||||||
|
Restatement Impacts
|
|||||||||||||||||||||||||||||
|
Balance at January 3, 2016
|
(a)(d)(e)(g)
|
$
|
—
|
|
$
|
(77
|
)
|
$
|
—
|
|
$
|
55
|
|
$
|
—
|
|
$
|
—
|
|
$
|
(22
|
)
|
|||||||
|
Net income/(loss) excluding redeemable noncontrolling interest
|
(a)(e)(f)(g)
|
—
|
|
—
|
|
(36
|
)
|
—
|
|
—
|
|
—
|
|
(36
|
)
|
||||||||||||||
|
Other comprehensive income/(loss) excluding redeemable noncontrolling interest
|
(g)
|
—
|
|
—
|
|
—
|
|
(56
|
)
|
—
|
|
—
|
|
(56
|
)
|
||||||||||||||
|
Dividends declared-Series A Preferred Stock ($2,250.00 per share)
|
—
|
|
—
|
|
—
|
|
—
|
|
—
|
|
—
|
|
—
|
|
|||||||||||||||
|
Dividends declared-common stock ($2.35 per share)
|
—
|
|
—
|
|
—
|
|
—
|
|
—
|
|
—
|
|
—
|
|
|||||||||||||||
|
Dividends declared-noncontrolling interest ($90.82 per share)
|
—
|
|
—
|
|
—
|
|
—
|
|
—
|
|
—
|
|
—
|
|
|||||||||||||||
|
Exercise of stock options, issuance of other stock awards, and other
|
—
|
|
—
|
|
—
|
|
—
|
|
—
|
|
—
|
|
—
|
|
|||||||||||||||
|
Balance at December 31, 2016
|
$
|
—
|
|
$
|
(77
|
)
|
$
|
(36
|
)
|
$
|
(1
|
)
|
$
|
—
|
|
$
|
—
|
|
$
|
(114
|
)
|
||||||||
|
As Restated
|
|||||||||||||||||||||||||||||
|
Balance at January 3, 2016
|
$
|
12
|
|
$
|
58,298
|
|
$
|
—
|
|
$
|
(616
|
)
|
$
|
(31
|
)
|
$
|
208
|
|
$
|
57,871
|
|
||||||||
|
Net income/(loss) excluding redeemable noncontrolling interest
|
—
|
|
—
|
|
3,596
|
|
—
|
|
—
|
|
10
|
|
3,606
|
|
|||||||||||||||
|
Other comprehensive income/(loss) excluding redeemable noncontrolling interest
|
—
|
|
—
|
|
—
|
|
(1,013
|
)
|
—
|
|
6
|
|
(1,007
|
)
|
|||||||||||||||
|
Dividends declared-Series A Preferred Stock ($2,250.00 per share)
|
—
|
|
—
|
|
(180
|
)
|
—
|
|
—
|
|
—
|
|
(180
|
)
|
|||||||||||||||
|
Dividends declared-common stock ($2.35 per share)
|
—
|
|
—
|
|
(2,862
|
)
|
—
|
|
—
|
|
—
|
|
(2,862
|
)
|
|||||||||||||||
|
Dividends declared-noncontrolling interest ($90.82 per share)
|
—
|
|
—
|
|
—
|
|
—
|
|
—
|
|
(8
|
)
|
(8
|
)
|
|||||||||||||||
|
Exercise of stock options, issuance of other stock awards, and other
|
—
|
|
218
|
|
(2
|
)
|
—
|
|
(176
|
)
|
—
|
|
40
|
|
|||||||||||||||
|
Balance at December 31, 2016
|
$
|
12
|
|
$
|
58,516
|
|
$
|
552
|
|
$
|
(1,629
|
)
|
$
|
(207
|
)
|
$
|
216
|
|
$
|
57,460
|
|
||||||||
77
The
$77 million
decrease to additional paid-in capital was primarily driven by the misstatements in the income taxes, supplier rebates, and other categories, which resulted in a decrease to net income for the fiscal year ended January 3, 2016, which has been reflected as a reduction to additional paid-in capital rather than retained earnings due to certain dividends declared in 2015 without a corresponding amount in retained earnings.
The
$55 million
decrease to accumulated other comprehensive losses at January 3, 2016 was primarily driven by the misstatements in the other and income taxes categories, partially offset by the misstatements in the balance sheet reclassifications category.
See descriptions of the net income and other comprehensive income impacts in the consolidated statement of income and consolidated statement of comprehensive income for the year ended December 31, 2016 sections above.
78
The Kraft Heinz Company
Consolidated Statement of Cash Flows
(in millions)
|
For the Year Ended December 30, 2017
|
|||||||||||||
|
As Previously Reported
|
Restatement Impacts
|
Restatement Reference
|
As Restated
|
||||||||||
|
CASH FLOWS FROM OPERATING ACTIVITIES:
|
|||||||||||||
|
Net income/(loss)
|
$
|
10,990
|
|
$
|
(58
|
)
|
(a)(b)(e)(f)(g)
|
$
|
10,932
|
|
|||
|
Adjustments to reconcile net income/(loss) to operating cash flows:
|
|
|
|||||||||||
|
Depreciation and amortization
|
1,036
|
|
(5
|
)
|
(b)(f)(g)
|
1,031
|
|
||||||
|
Amortization of postretirement benefit plans prior service costs/(credits)
|
(328
|
)
|
—
|
|
(328
|
)
|
|||||||
|
Equity award compensation expense
|
46
|
|
—
|
|
46
|
|
|||||||
|
Deferred income tax provision/(benefit)
|
(6,467
|
)
|
(28
|
)
|
(a)(e)(g)
|
(6,495
|
)
|
||||||
|
Postemployment benefit plan contributions
|
(1,659
|
)
|
—
|
|
(1,659
|
)
|
|||||||
|
Goodwill and intangible asset impairment losses
|
49
|
|
—
|
|
49
|
|
|||||||
|
Nonmonetary currency devaluation
|
36
|
|
—
|
|
36
|
|
|||||||
|
Other items, net
|
219
|
|
34
|
|
(a)(g)
|
253
|
|
||||||
|
Changes in current assets and liabilities:
|
—
|
|
—
|
|
|||||||||
|
Trade receivables
|
(2,629
|
)
|
—
|
|
(2,629
|
)
|
|||||||
|
Inventories
|
(251
|
)
|
15
|
|
(d)
|
(236
|
)
|
||||||
|
Accounts payable
|
464
|
|
(23
|
)
|
(d)
|
441
|
|
||||||
|
Other current assets
|
(67
|
)
|
3
|
|
(a)(d)
|
(64
|
)
|
||||||
|
Other current liabilities
|
(912
|
)
|
36
|
|
(a)(e)(g)
|
(876
|
)
|
||||||
|
Net cash provided by/(used for) operating activities
|
527
|
|
(26
|
)
|
501
|
|
|||||||
|
CASH FLOWS FROM INVESTING ACTIVITIES:
|
|||||||||||||
|
Cash receipts on sold receivables
|
2,286
|
|
—
|
|
2,286
|
|
|||||||
|
Capital expenditures
|
(1,217
|
)
|
23
|
|
(d)
|
(1,194
|
)
|
||||||
|
Payments to acquire business, net of cash acquired
|
—
|
|
—
|
|
—
|
|
|||||||
|
Other investing activities, net
|
87
|
|
(2
|
)
|
(g)
|
85
|
|
||||||
|
Net cash provided by/(used for) investing activities
|
1,156
|
|
21
|
|
1,177
|
|
|||||||
|
CASH FLOWS FROM FINANCING ACTIVITIES:
|
|||||||||||||
|
Repayments of long-term debt
|
(2,644
|
)
|
3
|
|
(b)(g)
|
(2,641
|
)
|
||||||
|
Proceeds from issuance of long-term debt
|
1,496
|
|
—
|
|
1,496
|
|
|||||||
|
Proceeds from issuance of commercial paper
|
6,043
|
|
—
|
|
6,043
|
|
|||||||
|
Repayments of commercial paper
|
(6,249
|
)
|
—
|
|
(6,249
|
)
|
|||||||
|
Dividends paid - Series A Preferred Stock
|
—
|
|
—
|
|
—
|
|
|||||||
|
Dividends paid - common stock
|
(2,888
|
)
|
—
|
|
(2,888
|
)
|
|||||||
|
Redemption of Series A Preferred Stock
|
—
|
|
—
|
|
—
|
|
|||||||
|
Other financing activities, net
|
16
|
|
2
|
|
(g)
|
18
|
|
||||||
|
Net cash provided by/(used for) financing activities
|
(4,226
|
)
|
5
|
|
(4,221
|
)
|
|||||||
|
Effect of exchange rate changes on cash, cash equivalents, and restricted cash
|
57
|
|
—
|
|
57
|
|
|||||||
|
Cash, cash equivalents, and restricted cash
|
|||||||||||||
|
Net increase/(decrease)
|
(2,486
|
)
|
—
|
|
(2,486
|
)
|
|||||||
|
Balance at beginning of period
|
4,255
|
|
—
|
|
4,255
|
|
|||||||
|
Balance at end of period
|
$
|
1,769
|
|
$
|
—
|
|
$
|
1,769
|
|
||||
|
NON-CASH INVESTING ACTIVITIES:
|
|||||||||||||
|
Beneficial interest obtained in exchange for securitized trade receivables
|
$
|
2,519
|
|
$
|
—
|
|
$
|
2,519
|
|
||||
|
CASH PAID DURING THE PERIOD FOR:
|
|||||||||||||
|
Interest
|
$
|
1,269
|
|
$
|
—
|
|
$
|
1,269
|
|
||||
|
Income taxes
|
1,206
|
|
—
|
|
1,206
|
|
|||||||
79
See descriptions of the net income impacts in the consolidated statement of income for the year ended December 30, 2017 section above.
The misstatements in the balance sheet misclassifications category resulted in a decrease to net cash flows provided by operating activities of
$23 million
and an increase to net cash flows provided by investing activities of
$23 million
for the year ended December 30, 2017.
The misstatements in the other misclassifications category resulted in a decrease to net cash flows provided by operating activities of
$1 million
, a decrease to net cash flows provided by investing activities of
$2 million
, and an increase to net cash flows provided by financing activities of
$3 million
for the year ended December 30, 2017.
The misstatements in the capital leases misclassifications category resulted in a decrease to net cash flows provided by operating activities of
$2 million
and an increase to net cash flows provided by financing activities of
$2 million
for the year ended December 30, 2017.
No other misstatements impacted the classifications between net operating, net investing, or net financing cash flow activities for the year ended December 30, 2017.
80
The Kraft Heinz Company
Consolidated Statement of Cash Flows
(in millions)
|
For the Year Ended December 31, 2016
|
|||||||||||||
|
As Previously Reported
|
Restatement Impacts
|
Restatement Reference
|
As Restated
|
||||||||||
|
CASH FLOWS FROM OPERATING ACTIVITIES:
|
|||||||||||||
|
Net income/(loss)
|
$
|
3,642
|
|
$
|
(36
|
)
|
(a)(e)(f)(g)
|
$
|
3,606
|
|
|||
|
Adjustments to reconcile net income/(loss) to operating cash flows:
|
|
|
|||||||||||
|
Depreciation and amortization
|
1,337
|
|
—
|
|
1,337
|
|
|||||||
|
Amortization of postretirement benefit plans prior service costs/(credits)
|
(333
|
)
|
(14
|
)
|
(g)
|
(347
|
)
|
||||||
|
Equity award compensation expense
|
46
|
|
—
|
|
46
|
|
|||||||
|
Deferred income tax provision/(benefit)
|
(29
|
)
|
(43
|
)
|
(a)(e)(f)(g)
|
(72
|
)
|
||||||
|
Postemployment benefit plan contributions
|
(494
|
)
|
—
|
|
(494
|
)
|
|||||||
|
Goodwill and intangible asset impairment losses
|
—
|
|
18
|
|
(f)
|
18
|
|
||||||
|
Nonmonetary currency devaluation
|
24
|
|
—
|
|
24
|
|
|||||||
|
Other items, net
|
16
|
|
9
|
|
(a)(g)
|
25
|
|
||||||
|
Changes in current assets and liabilities:
|
—
|
|
—
|
|
|||||||||
|
Trade receivables
|
(2,055
|
)
|
—
|
|
(2,055
|
)
|
|||||||
|
Inventories
|
(130
|
)
|
—
|
|
(130
|
)
|
|||||||
|
Accounts payable
|
943
|
|
(64
|
)
|
(d)
|
879
|
|
||||||
|
Other current assets
|
(42
|
)
|
1
|
|
(a)
|
(41
|
)
|
||||||
|
Other current liabilities
|
(276
|
)
|
128
|
|
(a)(d)(e)(g)
|
(148
|
)
|
||||||
|
Net cash provided by/(used for) operating activities
|
2,649
|
|
(1
|
)
|
2,648
|
|
|||||||
|
CASH FLOWS FROM INVESTING ACTIVITIES:
|
|||||||||||||
|
Cash receipts on sold receivables
|
2,589
|
|
—
|
|
2,589
|
|
|||||||
|
Capital expenditures
|
(1,247
|
)
|
—
|
|
(1,247
|
)
|
|||||||
|
Payments to acquire business, net of cash acquired
|
—
|
|
—
|
|
—
|
|
|||||||
|
Other investing activities, net
|
110
|
|
—
|
|
110
|
|
|||||||
|
Net cash provided by/(used for) investing activities
|
1,452
|
|
—
|
|
1,452
|
|
|||||||
|
CASH FLOWS FROM FINANCING ACTIVITIES:
|
|||||||||||||
|
Repayments of long-term debt
|
(86
|
)
|
1
|
|
(g)
|
(85
|
)
|
||||||
|
Proceeds from issuance of long-term debt
|
6,981
|
|
—
|
|
6,981
|
|
|||||||
|
Proceeds from issuance of commercial paper
|
6,680
|
|
—
|
|
6,680
|
|
|||||||
|
Repayments of commercial paper
|
(6,043
|
)
|
—
|
|
(6,043
|
)
|
|||||||
|
Dividends paid - Series A Preferred Stock
|
(180
|
)
|
—
|
|
(180
|
)
|
|||||||
|
Dividends paid - common stock
|
(3,584
|
)
|
—
|
|
(3,584
|
)
|
|||||||
|
Redemption of Series A Preferred Stock
|
(8,320
|
)
|
—
|
|
(8,320
|
)
|
|||||||
|
Other financing activities, net
|
(69
|
)
|
—
|
|
(69
|
)
|
|||||||
|
Net cash provided by/(used for) financing activities
|
(4,621
|
)
|
1
|
|
(4,620
|
)
|
|||||||
|
Effect of exchange rate changes on cash, cash equivalents, and restricted cash
|
(137
|
)
|
—
|
|
(137
|
)
|
|||||||
|
Cash, cash equivalents, and restricted cash
|
|||||||||||||
|
Net increase/(decrease)
|
(657
|
)
|
—
|
|
(657
|
)
|
|||||||
|
Balance at beginning of period
|
4,912
|
|
—
|
|
4,912
|
|
|||||||
|
Balance at end of period
|
$
|
4,255
|
|
$
|
—
|
|
$
|
4,255
|
|
||||
|
NON-CASH INVESTING ACTIVITIES:
|
|||||||||||||
|
Beneficial interest obtained in exchange for securitized trade receivables
|
$
|
2,213
|
|
$
|
—
|
|
$
|
2,213
|
|
||||
|
CASH PAID DURING THE PERIOD FOR:
|
|||||||||||||
|
Interest
|
$
|
1,176
|
|
$
|
—
|
|
$
|
1,176
|
|
||||
|
Income taxes
|
1,619
|
|
—
|
|
1,619
|
|
|||||||
81
See descriptions of the net income impacts in the consolidated statement of income for the year ended December 31, 2016 section above.
The misstatements in the other misclassifications category resulted in a decrease to net cash flows provided by operating activities of
$1 million
and an increase to net cash flows provided by financing activities of
$1 million
for the year ended December 31, 2016.
No other misstatements impacted the classifications between net operating, net investing, or net financing cash flow activities for the year ended December 31, 2016.
Note 3. Significant Accounting Policies
Revenue Recognition:
Our revenues are primarily derived from customer orders for the purchase of our products. We recognize revenues as performance obligations are fulfilled when control passes to our customers. We record revenues net of variable consideration, including consumer incentives and performance obligations related to trade promotions, excluding taxes, and including all shipping and handling charges billed to customers (accounting for shipping and handling charges that occur after the transfer of control as fulfillment costs). We also record a refund liability for estimated product returns and customer allowances as reductions to revenues within the same period that the revenue is recognized. We base these estimates principally on historical and current period experience factors. We recognize costs paid to third party brokers to obtain contracts as expenses as our contracts are generally less than one year.
Advertising, Consumer Incentives, and Trade Promotions:
We promote our products with advertising, consumer incentives, and performance obligations related to trade promotions. Consumer incentives and trade promotions include, but are not limited to, discounts, coupons, rebates, performance-based in-store display activities, and volume-based incentives. Variable consideration related to consumer incentive and trade promotion activities is recorded as a reduction to revenues based on amounts estimated as being due to customers and consumers at the end of a period. We base these estimates principally on historical utilization, redemption rates, and/or current period experience factors. We review and adjust these estimates at least quarterly based on actual experience and other information.
Advertising expenses are recorded in SG&A. For interim reporting purposes, we charge advertising to operations as a percentage of estimated full year sales activity and marketing costs. We review and adjust these estimates each quarter based on actual experience and other information. We recorded advertising expenses of
$584 million
in 2018,
$629 million
in 2017, and
$708 million
in 2016, which represented costs to obtain physical advertisement spots in television, radio, print, digital, and social channels. We also incur other advertising and marketing costs such as shopper marketing, sponsorships, and agency advertisement conception, design, and public relations fees. Total advertising and marketing costs were
$1,140 million
in 2018,
$1,115 million
in 2017, and
$1,221 million
in 2016.
Research and Development Expense:
We expense costs as incurred for product research and development within SG&A. Research and development expenses were approximately
$109 million
in 2018,
$93 million
in 2017, and
$120 million
in 2016.
Stock-Based Compensation:
We recognize compensation costs related to equity awards on a straight-line basis over the vesting period of the award, which is generally
five
years. These costs are primarily recognized within SG&A. We estimate expected forfeitures rather than recognizing forfeitures as they occur in determining our equity award compensation costs. We classify equity award compensation costs primarily within general corporate expenses. See Note 12,
Employees’ Stock Incentive Plans
, for additional information.
Postemployment Benefit Plans:
We maintain various retirement plans for the majority of our employees. These include pension benefits, postretirement health care benefits, and defined contribution benefits. The cost of these plans is charged to expense over an appropriate term based on, among other things, the cost component and whether the plan is active or inactive. Changes in the fair value of our plan assets result in net actuarial gains or losses. These net actuarial gains and losses are deferred into accumulated other comprehensive income/(losses) and amortized within other expense/(income), net in future periods using the corridor approach. The corridor is
10%
of the greater of the market-related value of the plan’s asset or projected benefit obligation. Any actuarial gains and losses in excess of the corridor are then amortized over an appropriate term based on whether the plan is active or inactive.
See Note 13,
Postemployment Benefits
, for additional information.
82
Income Taxes:
We recognize income taxes based on amounts refundable or payable for the current year and record deferred tax assets or liabilities for any difference between the financial reporting and tax basis of our assets and liabilities. We also recognize deferred tax assets for temporary differences, operating loss carryforwards, and tax credit carryforwards. Inherent in determining our annual tax rate are judgments regarding business plans, planning opportunities, and expectations about future outcomes. Realization of certain deferred tax assets, primarily net operating loss and other carryforwards, is dependent upon generating sufficient taxable income in the appropriate jurisdiction prior to the expiration of the carryforward periods.
We apply a more-likely-than-not threshold to the recognition and derecognition of uncertain tax positions. Accordingly, we recognize the amount of tax benefit that has a greater than 50 percent likelihood of being ultimately realized upon settlement. Future changes in judgment related to the expected ultimate resolution of uncertain tax positions will affect our results in the quarter of such change.
We record valuation allowances to reduce deferred tax assets to the amount that is more likely than not to be realized. When assessing the need for valuation allowances, we consider future taxable income and ongoing prudent and feasible tax planning strategies. Should a change in circumstances lead to a change in judgment about the realizability of deferred tax assets in future years, we would adjust related valuation allowances in the period that the change in circumstances occurs, along with a corresponding adjustment to our provision for/(benefit from) income taxes. The resolution of tax reserves and changes in valuation allowances could be material to our results of operations for any period, but is not expected to be material to our financial position.
Common Stock and Preferred Stock Dividends:
Dividends are recorded as a reduction to retained earnings. When we have an accumulated deficit, dividends are recorded as a reduction of additional paid-in capital.
Cash and Cash Equivalents:
Cash equivalents include demand deposits with banks and all highly liquid investments with original maturities of three months or less. Cash and cash equivalents that are legally restricted as to withdrawal or usage is classified in other current assets or other non-current assets, as applicable, on the consolidated balance sheets.
Inventories:
Inventories are stated at the lower of cost or net realizable value. We value inventories primarily using the average cost method.
Property, Plant and Equipment:
Property, plant and equipment are stated at historical cost and depreciated on the straight-line method over the estimated useful lives of the assets. Machinery and equipment are depreciated over periods ranging from
three
to
20
years and buildings and improvements over periods up to
40
years. Capitalized software costs are included in property, plant and equipment and amortized on a straight-line basis over the estimated useful lives of the software, which do not exceed
seven
years. We review long-lived assets for impairment when conditions exist that indicate the carrying amount of the assets may not be fully recoverable. Such conditions could include significant adverse changes in the business climate, current-period operating or cash flow losses, significant declines in forecasted operations, or a current expectation that an asset group will be disposed of before the end of its useful life. We perform undiscounted operating cash flow analyses to determine if an impairment exists. When testing for impairment of assets held for use, we group assets at the lowest level for which cash flows are separately identifiable. If an impairment is determined to exist, the loss is calculated based on estimated fair value. Impairment losses on assets to be disposed of, if any, are based on the estimated proceeds to be received, less costs of disposal.
83
Goodwill and Intangible Assets
:
Our goodwill balance consists of
20
reporting units, and our indefinite-lived intangible asset balance primarily consists of a number of individual brands.
We test our reporting units and brands for impairment annually as of the first day of our second quarter, or more frequently if events or circumstances indicate it is more likely than not that the fair value of a reporting unit or brand is less than its carrying amount. Such events and circumstances could include a sustained decrease in our market capitalization, increased competition or unexpected loss of market share, increased input costs beyond projections (for example due to regulatory or industry changes), disposals of significant brands or components of our business, unexpected business disruptions (for example due to a natural disaster or loss of a customer, supplier, or other significant business relationship), unexpected significant declines in operating results, or significant adverse changes in the markets in which we operate. We test reporting units for impairment by comparing the estimated fair value of each reporting unit with its carrying amount. We test brands for impairment by comparing the estimated fair value of each brand with its carrying amount. If the carrying amount of a reporting unit or brand exceeds its estimated fair value, we record an impairment loss based on the difference between fair value and carrying amount, in the case of reporting units, not to exceed to the associated carrying amount of goodwill.
Definite-lived intangible assets are amortized on a straight-line basis over the estimated periods benefited. We review definite-lived intangible assets for impairment when conditions exist that indicate the carrying amount of the assets may not be recoverable. Such conditions could include significant adverse changes in the business climate, current-period operating or cash flow losses, significant declines in forecasted operations, or a current expectation that an asset group will be disposed of before the end of its useful life. We perform undiscounted operating cash flow analyses to determine if an impairment exists. When testing for impairment of definite-lived intangible assets held for use, we group assets at the lowest level for which cash flows are separately identifiable. If an impairment is determined to exist, the loss is calculated based on estimated fair value. Impairment losses on definite-lived intangible assets to be disposed of, if any, are based on the estimated proceeds to be received, less costs of disposal.
See Note 10,
Goodwill and Intangible Assets
, for additional information.
Financial Instruments:
As we source our commodities on global markets and periodically enter into financing or other arrangements abroad, we use a variety of risk management strategies and financial instruments to manage commodity price, foreign currency exchange rate, and interest rate risks. Our risk management program focuses on the unpredictability of financial markets and seeks to reduce the potentially adverse effects that the volatility of these markets may have on our operating results. One way we do this is through actively hedging our risks through the use of derivative instruments. As a matter of policy, we do not use highly leveraged derivative instruments, nor do we use financial instruments for speculative purposes.
Derivatives are recorded on our consolidated balance sheets as assets or liabilities at fair value, which fluctuates based on changing market conditions.
Certain derivatives are designated as cash flow hedges and qualify for hedge accounting treatment, while others are not designated as hedging instruments and are marked to market through net income/(loss). The gains and losses on cash flow hedges are deferred as a component of accumulated other comprehensive income/(losses) and are recognized in net income/(loss) at the time the hedged item affects net income/(loss), in the same line item as the underlying hedged item. The excluded component on cash flow hedges is recognized in net income/(loss) over the life of the hedging relationship in the same income statement line item as the underlying hedged item. We also designate certain derivatives and non-derivatives as net investment hedges to hedge the net assets of certain foreign subsidiaries which are exposed to volatility in foreign currency exchange rates. Changes in the value of these derivatives and remeasurements of our non-derivatives designated as net investment hedges are calculated each period using the spot method, with changes reported in foreign currency translation adjustment within accumulated other comprehensive income/(losses). Such amounts will remain in accumulated other comprehensive income/(losses) until the complete or substantially complete liquidation of our investment in the underlying foreign operations. The excluded component on derivatives designated as net investment hedges is recognized in net income/(loss) within interest expense. The income statement classification of gains and losses related to derivative instruments not designated as hedging instruments is determined based on the underlying intent of the contracts. Cash flows related to the settlement of derivative instruments designated as net investment hedges of foreign operations are classified in the consolidated statements of cash flows within investing activities. All other cash flows related to derivative instruments are classified in the same line item as the cash flows of the related hedged item, which is generally within operating activities.
84
To qualify for hedge accounting, a specified level of hedging effectiveness between the hedging instrument and the item being hedged must be achieved at inception and maintained throughout the hedged period. When a hedging instrument no longer meets the specified level of hedging effectiveness, we reclassify the related hedge gains or losses previously deferred into other comprehensive income/(losses) to net income within other expense/(income), net. We formally document our risk management objectives, our strategies for undertaking the various hedge transactions, the nature of and relationships between the hedging instruments and hedged items, and the method for assessing hedge effectiveness. Additionally, for qualified hedges of forecasted transactions, we specifically identify the significant characteristics and expected terms of the forecasted transactions. If it becomes probable that a forecasted transaction will not occur, the hedge will no longer be effective and all of the derivative gains or losses would be recognized in net income in the current period.
Unrealized gains and losses on our commodity derivatives not designated as hedging instruments are recorded in cost of products sold and are included within general corporate expenses until realized. Once realized, the gains and losses are included within the applicable segment operating results. See Note 14,
Financial Instruments
, for additional information.
Our designated and undesignated derivative contracts include:
|
•
|
Net investment hedges.
We have numerous investments in our foreign subsidiaries, the net assets of which are exposed to volatility in foreign currency exchange rates. We manage this risk by utilizing derivative and non-derivative instruments, including cross-currency swap contracts, foreign exchange contracts, and certain foreign denominated debt designated as net investment hedges. We exclude the interest accruals on cross-currency swap contracts and the forward points on foreign exchange forward contracts from the assessment and measurement of hedge effectiveness. We recognize the interest accruals on cross-currency swap contracts in net income/(loss) within interest expense. We amortize the forward points on foreign exchange contracts into net income/(loss) within interest expense over the life of the hedging relationship.
|
|
•
|
Foreign currency cash flow hedges.
We use various financial instruments to mitigate our exposure to changes in exchange rates from third-party and intercompany actual and forecasted transactions. Our principal foreign currency exposures that are hedged include the British pound sterling, euro, and Canadian dollar. These instruments include cross-currency swap contracts and foreign exchange forward and option contracts. Substantially all of these derivative instruments are highly effective and qualify for hedge accounting treatment. We exclude the interest accruals on cross-currency swap contracts and the forward points and option premiums or discounts on foreign exchange contracts from the assessment and measurement of hedge effectiveness and amortize such amounts into net income/(loss) in the same line item as the underlying hedged item over the life of the hedging relationship.
|
|
•
|
Interest rate cash flow hedges.
From time to time, we have used derivative instruments, including interest rate swaps, as part of our interest rate risk management strategy. We have primarily used interest rate swaps to hedge the variability of interest payment cash flows on a portion of our future debt obligations.
|
|
•
|
Commodity derivatives.
We are exposed to price risk related to forecasted purchases of certain commodities that we primarily use as raw materials. We enter into commodity purchase contracts primarily for dairy products, meat products, coffee beans, sugar, vegetable oils, wheat products, corn products, and cocoa products. These commodity purchase contracts generally are not subject to the accounting requirements for derivative instruments and hedging activities under the normal purchases and normal sales exception. We also use commodity futures, options, and swaps to economically hedge the price of certain commodity costs, including the commodities noted above, as well as packaging products, diesel fuel, and natural gas. We do not designate these commodity contracts as hedging instruments. We also occasionally use futures to economically cross hedge a commodity exposure.
|
Translation of Foreign Currencies:
For all significant foreign operations, the functional currency is the local currency. Assets and liabilities of these operations are translated at the exchange rate in effect at each period end. Income statement accounts are translated at the average rate of exchange prevailing during the period. Translation adjustments arising from the use of differing exchange rates from period to period are included as a component of accumulated other comprehensive income/(losses) on the balance sheet. Gains and losses from foreign currency transactions are included in net income/(loss) for the period.
85
Highly Inflationary Accounting:
We apply highly inflationary accounting if the cumulative inflation rate in an economy for a three-year period meets or exceeds 100%. Under highly inflationary accounting, the financial statements of a subsidiary are remeasured into our reporting currency (U.S. dollars) based on the legally available exchange rate at which we expect to settle the underlying transactions. Exchange gains and losses from the remeasurement of monetary assets and liabilities are reflected in net income/(loss), rather than accumulated other comprehensive income/(losses) on the balance sheet, until such time as the economy is no longer considered highly inflationary. Certain non-monetary assets and liabilities are recorded at the applicable historical exchange rates. We apply highly inflationary accounting to the results of our subsidiaries in Venezuela and Argentina. The net monetary assets of our subsidiary in Argentina were approximately
$2 million
at
December 29, 2018
. See Note 16,
Venezuela - Foreign Currency and Inflation
, for additional information related to our subsidiary in Venezuela.
Note 4. New Accounting Standards
Accounting Standards Adopted in the Current Year
Presentation of Net Periodic Benefit Costs:
In March 2017, the
Financial Accounting Standards Board (the “FASB”) issued ASU
2017-07 related to the presentation of net periodic benefit cost (pension and postretirement cost).
This ASU became effective beginning in the first quarter of our fiscal year 2018. Under the new guidance, the service cost component of net periodic benefit cost must be presented in the same statement of income line item as other employee compensation costs arising from services rendered by employees during the period. Other components of net periodic benefit cost must be disaggregated from the service cost component in the statements of income and must be presented outside the operating income/(loss) subtotal. Additionally, only the service cost component is eligible for capitalization in assets.
The new guidance must be applied retrospectively for the statement of income presentation of service cost components and other net periodic benefit cost components and prospectively for the capitalization of service cost components. There is a practical expedient that allows us to use historical amounts disclosed in our
Postemployment Benefits
footnote as an estimation basis for retrospectively applying the statement of income presentation requirements.
In the first quarter of 2018, we adopted this ASU using the practical expedient described above.
There was no impact to our consolidated balance sheet at
December 30, 2017
or to our consolidated statements of cash flows for the years ended
December 30, 2017
and
December 31, 2016
. See Note 2,
Restatement of Previously Issued Consolidated Financial Statements
, for the impacts on our consolidated statements of income for the years ended
December 30, 2017
and
December 31, 2016
.
Revenue Recognition:
In May 2014, the FASB issued ASU 2014-09, which superseded previously existing revenue recognition guidance.
Under this ASU, companies must apply a five step model to recognize revenue upon the transfer of promised goods or services to customers and in an amount that reflects the consideration to which the company expects to be entitled in exchange for those goods or services. The ASU may be applied using a full retrospective method or a modified retrospective transition method, with a cumulative-effect adjustment as of the date of adoption.
The ASU also provides for certain practical expedients, including the option to expense as incurred the incremental costs of obtaining a contract, if the contract period is for one year or less.
This ASU was effective beginning in the first quarter of our fiscal year 2018.
We adopted this ASU in the first quarter of 2018 using the full retrospective method and the practical expedient described above. Upon adoption, we made the following policy elections: (i) we account for shipping and handling costs as contract fulfillment costs, and (ii) we exclude taxes imposed on and collected from customers in revenue producing transactions (e.g., sales, use, and value added taxes) from the transaction price. The impact of adopting this guidance was immaterial to our financial statements and related disclosures.
Income Tax Impacts of Certain Intercompany Transfers:
In October 2016, the FASB issued
ASU 2016-16 related to the income tax accounting impacts of intra-entity transfers of assets other than inventory
, such as intellectual property and property, plant and equipment.
Under the new accounting guidance, current and deferred income taxes should be recognized upon transfer of the assets. Previously, recognition of current and deferred income taxes was prohibited until the asset was sold to an external party.
This ASU became effective beginning in the first quarter of our fiscal year 2018.
We adopted this new guidance on a modified retrospective basis through a cumulative-effect adjustment of
$95 million
to decrease retained earnings in the first quarter of 2018.
86
Definition of a Business Clarification:
In January 2017, the FASB issued ASU 2017-01 clarifying the definition of a business used in determining whether transactions should be accounted for as acquisitions (or disposals) of assets or businesses.
The ASU provides a screen for companies to determine if an integrated set of assets and activities (“set”) is not a business.
If substantially all of the fair value of the gross assets acquired (or disposed of) is concentrated in a single identifiable asset or a group of similar identifiable assets, the set is not a business. If this screen is not met, the entity then determines if the set meets the minimum requirement of a business. For a set to be a business, it must include an input and a substantive process which together significantly contribute to the ability to create outputs. This ASU became effective beginning in the first quarter of our fiscal year 2018.
We adopted this ASU on a prospective basis. The adoption of this ASU did not impact our financial statements or related disclosures.
Goodwill Impairment Test Simplification:
In January 2017, the FASB issued ASU 2017-04 related to goodwill impairment testing. This ASU eliminates Step 2 from the goodwill impairment test. Under the new guidance, if a reporting unit’s carrying amount exceeds its fair value, the entity will record an impairment loss based on that difference.
The impairment loss will be limited to the amount of goodwill allocated to that reporting unit.
Previously, if the fair value of a reporting unit was lower than its carrying amount (Step 1), an entity was required to calculate any impairment loss by comparing the implied fair value of goodwill with its carrying amount (Step 2). Additionally, under the new standard, companies that have reporting units with zero or negative carrying amounts will no longer be required to perform the qualitative assessment to determine whether to perform Step 2 of the goodwill impairment test. As a result, reporting units with zero or negative carrying amounts will generally be expected to pass the simplified impairment test; however, additional disclosure will be required of those companies.
We early adopted this guidance on a prospective basis as of April 1, 2018 (our annual impairment testing date in the second quarter of 2018). As a result of adopting this ASU, we no longer perform Step 2 while completing our goodwill impairment testing, beginning with our annual goodwill impairment testing in the second quarter of 2018.
Accounting for Hedging Activities:
In August 2017, the FASB issued ASU 2017-12 related to accounting for hedging activities. This guidance impacted the accounting for financial (e.g., foreign exchange and interest rate) and non-financial (e.g., commodity) hedging activities. We early adopted this guidance on a modified retrospective basis in the third quarter of 2018. Upon adoption, we recognized an insignificant cumulative-effect adjustment to retained earnings/(deficit). The most significant impacts of adoption are that we now:
|
•
|
Recognize changes in the fair value of excluded components in net income/(loss) in the current period or in other comprehensive income/(loss) (and then amortize into net income/(loss) over the life of the hedging relationship);
|
|
•
|
Defer changes in the spot rate of the hedging instrument into other comprehensive income/(loss), while the excluded component (i.e., forward points or option premiums or discounts) is amortized into net income/(loss) over the life of the hedging relationship. When the excluded component is released or the forecasted transaction occurs, it is recognized in the same income statement line item affected by the hedged item; and
|
|
•
|
Present additional details in our tabular disclosures in the footnotes to the financial statements.
|
Additionally, ASU 2017-12 eliminated the requirement to separately measure and report hedge ineffectiveness; therefore, we removed disclosures related to hedge ineffectiveness.
See our consolidated statements of other comprehensive income, Note 3,
Significant Accounting Policies
, Note 14,
Financial Instruments
, and Note 15,
Accumulated Other Comprehensive Income/(Losses)
, for updated disclosures pursuant to ASU 2017-12.
87
Accounting Standards Not Yet Adopted
Leases:
In February 2016, the FASB issued ASU 2016-02 to establish the principles that lessees and lessors shall apply to report useful information to users of financial statements about the amount, timing, and uncertainty of cash flows arising from a lease.
The updated guidance requires lessees to reflect the majority of leases on their balance sheets as assets and obligations.
This ASU will be effective beginning in the first quarter of our fiscal year 2019.
Early adoption is permitted. The guidance must be adopted using a modified retrospective transition method.
The ASU also provides for certain practical expedients. Among the practical expedients is an optional transition method that allows companies to apply the guidance at the adoption date and recognize a cumulative-effect adjustment to retained earnings/(deficit) on the adoption date. We plan to elect this practical expedient upon adoption. We also plan to elect the package of practical expedients that will allow us to carry forward our determination of whether a lease exists, the classification of a lease, and whether initial direct lease costs exist for purposes of transition to the new standard. We do not expect to use the hindsight practical expedient. We do plan to elect the land easement option, which will allow us to continue to use prior accounting conclusions reached in our accounting for land easements. We also plan to elect the short-term lease exemption whereby we will not record an asset or liability for short-term leases.
We have completed our scoping reviews, identified our significant leases by geography and by asset type, and developed our accounting policies and expected policy elections, which will take effect upon adoption of the standard. We have executed our lease data extraction strategy and completed data extraction efforts. Our identified accounting system, which will support the future state leasing process, is also ready for implementation. We have completed our future state process design as part of the overall system implementation. Upon adoption, we expect that our financial statement disclosures will be expanded to present additional details of our leasing arrangements. We expect this guidance to have a significant impact on our financial statements. We currently estimate that, upon adoption, we will have total lease assets between approximately
$750 million
and
$910 million
and total lease liabilities between approximately
$810 million
and
$990 million
. We will adopt this ASU on the first day of our fiscal year 2019.
Measurement of Current Expected Credit Losses:
In June 2016, the FASB issued ASU 2016-13 to update the methodology used to measure current expected credit losses (“CECL”).
This ASU applies to financial assets measured at amortized cost, including loans, held-to-maturity debt securities, net investments in leases, and trade accounts receivable as well as certain off-balance sheet credit exposures, such as loan commitments.
This ASU replaces the current incurred loss impairment methodology with a methodology to reflect CECL and requires consideration of a broader range of reasonable and supportable information to explain credit loss estimates.
The guidance must be adopted using a modified retrospective transition method through a cumulative-effect adjustment to retained earnings/(deficit) in the period of adoption.
This ASU will be effective beginning in the first quarter of our fiscal year 2020. Early adoption is permitted. We are currently evaluating the impact this ASU will have on our financial statements and related disclosures as well as the timing of adoption.
Reclassification of Certain Tax Effects from Accumulated Other Comprehensive Income:
In February 2018, the FASB issued ASU 2018-02 related to reclassifying tax effects stranded in accumulated other comprehensive income/(losses) because of the Tax Cuts and Jobs Act (“U.S. Tax Reform”) enacted on December 22, 2017.
U.S. Tax Reform reduced the U.S. federal corporate tax rate from 35.0% to 21.0%. ASC Topic 740,
Income Taxes
, requires the remeasurement of deferred tax assets and liabilities as a result of such changes in tax laws or rates to be presented in net income/(loss) from continuing operations. However, the related tax effects of such deferred tax assets and liabilities may have been originally recorded in other comprehensive income/(loss).
This ASU allows companies to reclassify such stranded tax effects from accumulated other comprehensive income/(losses) to retained earnings/(deficit). This reclassification adjustment is optional, and if elected, may be applied either to the period of adoption or retrospectively to the period(s) impacted by U.S. Tax Reform.
Additionally, this ASU requires companies to disclose the policy election for stranded tax effects as well as the general accounting policy for releasing income tax effects from accumulated other comprehensive income/(losses). This ASU will be effective beginning in the first quarter of our fiscal year 2019. Early adoption is permitted.
We will adopt this ASU on the first day of our fiscal year 2019 and will make the policy election to reclassify stranded tax effects from accumulated other comprehensive income/(losses) to retained earnings/(deficit). We currently estimate the increase to retained earnings/(deficit) upon adoption will be between approximately
$130 million
and
$140 million
.
88
Fair Value Measurement Disclosures:
In August 2018, the FASB issued ASU 2018-13 related to fair value measurement disclosures. This ASU removes the requirement to disclose the amount of and reasons for transfers between Levels 1 and 2 of the fair value hierarchy, the policy for determining that a transfer has occurred, and valuation processes for Level 3 fair value measurements. Additionally, this ASU modifies the disclosures related to the measurement uncertainty for recurring Level 3 fair value measurements (by removing the requirement to disclose sensitivity to future changes) and the timing of liquidation of investee assets (by removing the timing requirement in certain instances). The guidance also requires new disclosures for Level 3 financial assets and liabilities, including the amount and location of unrealized gains and losses recognized in other comprehensive income/(loss) and additional information related to significant unobservable inputs used in determining Level 3 fair value measurements. This ASU will be effective beginning in the first quarter of our fiscal year 2020. Early adoption of the guidance in whole is permitted. Alternatively, companies may early adopt removed or modified disclosures and delay adoption of the additional disclosures until their effective date. Certain of the amendments in this ASU must be applied prospectively upon adoption, while other amendments must be applied retrospectively upon adoption. We elected to early adopt the provisions related to removing disclosures in the fourth quarter of our fiscal year 2018 on a retrospective basis. Accordingly, we have removed information related to our valuation process for Level 3 fair value measurements for pension plan investments within Note 13,
Postemployment Benefits
. We also removed information about the amount of and reasons for transfers between Levels 1 and 2 of the fair value hierarchy from Note 14,
Financial Instruments
. There was no other impact to our financial statement disclosures as a result of early adopting the provisions related to removing disclosures. We are currently evaluating the disclosure impact of the provisions related to modifying and adding disclosures as well as the timing of adoption.
Disclosure Requirements for Certain Employer-Sponsored Benefit Plans:
In August 2018, the FASB issued ASU 2018-14 related to the disclosure requirements for employers that sponsor defined benefit pension and other postretirement benefit plans. The guidance requires sponsors of these plans to provide additional disclosures, including weighted-average interest rates used in the company’s cash balance plans and a narrative description of reasons for any significant gains or losses impacting the benefit obligation for the period. Additionally, this guidance eliminates certain previous disclosure requirements. This ASU will be effective beginning in the first quarter of our fiscal year 2020. Early adoption is permitted. This guidance must be applied on a retrospective basis to all periods presented. We are currently evaluating the impact this ASU will have on our financial statements and related disclosures as well as the timing of adoption.
Implementation Costs Incurred in Hosted Cloud Computing Service Arrangements:
In August 2018, the FASB issued ASU 2018-15 related to accounting for implementation costs incurred in hosted cloud computing service arrangements. Under the new guidance, implementation costs incurred in a hosting arrangement that is a service contract should be expensed or capitalized based on the nature of the costs and the project stage during which such costs are incurred. If the implementation costs qualify for capitalization, they must be amortized over the term of the hosting arrangement and assessed for impairment. Companies must disclose the nature of any hosted cloud computing service arrangements. This ASU also provides guidance for balance sheet and income statement presentation of capitalized implementation costs and statement of cash flows presentation for the related payments. This ASU will be effective beginning in the first quarter of our fiscal year 2020. Early adoption is permitted, including in an interim period. This guidance may be adopted either retrospectively or prospectively to all implementation costs incurred after the date of adoption. We are currently evaluating the impact this ASU will have on our financial statements and related disclosures as well as the timing of adoption and the application method.
Note 5. Acquisitions and Divestitures
Cerebos Acquisition
On March 9, 2018 (the “Acquisition Date”), we acquired all of the outstanding equity interests in Cerebos Pacific Limited (“Cerebos”) (the “Cerebos Acquisition”), an Australian food and beverage company with several local brands in Australia and New Zealand.
The Cerebos business manufactures, markets, and sells food and beverage products, including gravies, sauces, instant coffee, salt, herbs and spices, and tea. Cerebos is included in our consolidated financial statements as of the Acquisition Date. We have not included unaudited pro forma results, prepared in accordance with ASC 805, as if Cerebos had been acquired as of January 1, 2018, as it would not yield significantly different results.
The Cerebos Acquisition was accounted for under the acquisition method of accounting for business combinations. The total consideration paid for Cerebos was
$244 million
. We utilized estimated fair values at the Acquisition Date to allocate the total consideration exchanged to the net tangible and intangible assets acquired and liabilities assumed. Such allocation was final as of
December 29, 2018
.
89
The final purchase price allocation to assets acquired and liabilities assumed in the Cerebos Acquisition was (in millions):
|
Cash
|
$
|
23
|
|
|
Other current assets
|
65
|
|
|
|
Property, plant and equipment, net
|
75
|
|
|
|
Identifiable intangible assets
|
100
|
|
|
|
Trade and other payables
|
(41
|
)
|
|
|
Other non-current liabilities
|
(3
|
)
|
|
|
Net assets acquired
|
219
|
|
|
|
Goodwill on acquisition
|
25
|
|
|
|
Total consideration
|
$
|
244
|
|
The Cerebos Acquisition resulted in
$25 million
of non tax deductible goodwill relating principally to planned expansion of Cerebos brands into new categories and markets.
This goodwill was allocated to Rest of World as shown in Note 10,
Goodwill and Intangible Assets
.
The final purchase price allocation to identifiable intangible assets acquired in the Cerebos Acquisition was:
|
Fair Value
(in millions of dollars)
|
Weighted Average Life
(in years)
|
||||
|
Definite-lived trademarks
|
$
|
87
|
|
22
|
|
|
Customer-related assets
|
13
|
|
12
|
||
|
Total
|
$
|
100
|
|
||
We valued trademarks using the relief from royalty method and customer-related assets using the distributor method. Some of the more significant assumptions inherent in developing the valuations included the estimated annual net cash flows for each definite-lived intangible asset (including net sales, cost of products sold, selling and marketing costs, and working capital/contributory asset charges), the discount rate that appropriately reflects the risk inherent in each future cash flow stream, the assessment of each asset’s life cycle, and competitive trends, as well as other factors. We determined the assumptions used in the financial forecasts using historical data, supplemented by current and anticipated market conditions, estimated product category growth rates, management plans, and market comparables.
We used carrying values as of the Acquisition Date to value trade receivables and payables, as well as certain other current and non-current assets and liabilities, as we determined that they represented the fair value of those items at the Acquisition Date.
We valued finished goods and work-in-process inventory using a net realizable value approach. Raw materials and packaging inventory was valued using the replacement cost approach.
We valued property, plant and equipment using a combination of the income approach, the market approach, and the cost approach, which is based on the current replacement and/or reproduction cost of the asset as new, less depreciation attributable to physical, functional, and economic factors.
We incurred deal costs of
$18 million
in 2018
related to the Cerebos Acquisition.
Other Acquisitions
In the third quarter of 2018, we had two additional acquisitions of businesses, including The Ethical Bean Coffee Company Ltd., a Canadian-based coffee roaster, and Wellio, Inc., a full-service meal planning and preparation technology start-up in the U.S. The aggregate consideration paid related to these acquisitions was
$27 million
.
In November 2018, we entered into a definitive agreement with a third party to acquire all of the outstanding equity interests in Primal Nutrition, LLC (“Primal Nutrition”) for approximately
$200 million
(the “Primal Acquisition”).
Primal Nutrition is a better-for-you brand primarily focused on condiments, sauces, and dressings, with growing product lines in healthy snacks and other categories. The brand holds leading positions in the e-commerce and natural channels. The Primal Acquisition closed on January 3, 2019.
We incurred aggregate deal costs related to other acquisitions of
$2 million
in 2018.
90
Divestitures
In May 2018, we sold our
50.1%
interest in our South African subsidiary to our minority interest partner. The transaction included proceeds of
$18 million
, which are included in other investing activities, net on the consolidated statement of cash flows for 2018
. We recorded a pre-tax loss on sale of business of approximately
$15 million
. The pre-tax loss was included in SG&A on the consolidated statement of income for 2018.
In October 2018, we entered into a definitive agreement with Zydus Wellness Limited and Cadila Healthcare Limited (collectively, the “Buyers”) to sell
100%
of our equity interests in Heinz India Private Limited (“Heinz India”) for approximately
46 billion
Indian rupees (approximately
$660 million
at
December 29, 2018
) (the “Heinz India Transaction”). In connection with the Heinz India Transaction, we will transfer to the Buyers, among other assets and operations, our global intellectual property rights to several brands, including
Complan
,
Glucon-D
,
Nycil
, and
Sampriti
. Our core brands (i.e.,
Heinz
and
Kraft
) will not be transferred. The Heinz India Transaction closed on January 30, 2019. We expect to recognize a gain on this transaction upon closing
. We have presented the assets and liabilities related to the Heinz India Transaction as held for sale on the consolidated balance sheet at
December 29, 2018
. This divestiture is not considered a strategic shift that will have a major effect on our operations or financial results; therefore, it will not be reported as discontinued operations.
We entered into foreign exchange derivative contracts to economically hedge the foreign currency exposure related to the Heinz India Transaction.
Additionally, we entered into foreign exchange derivative contracts, which are designated as net investment hedges related to our investment in Heinz India.
See Note 14,
Financial Instruments
, for additional information. We also recorded changes in our deferred tax liabilities related to the Heinz India Transaction. See Note 11,
Income Taxes
, for additional information.
Additionally, in November 2018, we entered into a definitive agreement with Parmalat SpA (“Parmalat”) to sell certain assets in our natural cheese portfolio in Canada for approximately
1.6 billion
Canadian dollars (approximately
$1.2 billion
at
December 29, 2018
) (the “Canada Natural Cheese Transaction”). In connection with the Canada Natural Cheese Transaction, we will transfer certain assets to Parmalat, including the intellectual property rights to
Cracker Barrel
in Canada and
P’Tit Quebec
globally. While this transaction is contingent on customary closing conditions, we expect the Canada Natural Cheese Transaction to be finalized in mid-2019. We expect to recognize a gain on this transaction upon closing. We have presented the assets and liabilities related to the Canada Natural Cheese Transaction as held for sale on the consolidated balance sheet at
December 29, 2018
. This divestiture is not considered a strategic shift that will have a major effect on our operations or financial results; therefore, it will not be reported as discontinued operations.
Our assets and liabilities held for sale, by major class, were (in millions):
|
December 29, 2018
|
|||
|
ASSETS
|
|||
|
Inventories
|
$
|
92
|
|
|
Property, plant and equipment, net
|
139
|
|
|
|
Goodwill
|
669
|
|
|
|
Intangible assets, net
|
437
|
|
|
|
Other
|
39
|
|
|
|
Total assets held for sale
|
$
|
1,376
|
|
|
LIABILITIES
|
|||
|
Trade payables
|
$
|
16
|
|
|
Other
|
39
|
|
|
|
Total liabilities held for sale
|
$
|
55
|
|
We incurred aggregate deal costs related to these divestitures of
$3 million
in 2018.
91
Note 6. Integration and Restructuring Expenses
As part of our restructuring activities, we incur expenses that qualify as exit and disposal costs under U.S. GAAP. These include severance and employee benefit costs and other exit costs. Severance and employee benefit costs primarily relate to cash severance, non-cash severance, including accelerated equity award compensation expense, and pension and other termination benefits. Other exit costs primarily relate to lease and contract terminations. We also incur expenses that are an integral component of, and directly attributable to, our restructuring activities, which do not qualify as exit and disposal costs under U.S. GAAP. These include asset-related costs and other implementation costs. Asset-related costs primarily relate to accelerated depreciation and asset impairment charges. Other implementation costs primarily relate to start-up costs of new facilities, professional fees, asset relocation costs, costs to exit facilities, and costs associated with restructuring benefit plans.
Employee severance and other termination benefit packages are primarily determined based on established benefit arrangements, local statutory requirements, or historical benefit practices. We recognize the contractual component of these benefits when payment is probable and estimable; additional elements of severance and termination benefits associated with non-recurring benefits are recognized ratably over each employee’s required future service period. Charges for accelerated depreciation are recognized on long-lived assets that will be taken out of service before the end of their normal service, in which case depreciation estimates are revised to reflect the use of the asset over its shortened useful life. Asset impairments establish a new fair value basis for assets held for disposal or sale, and those assets are written down to expected net realizable value if carrying value exceeds fair value. All other costs are recognized as incurred.
Integration Program:
At the end of 2017, we had substantially completed our multi-year program announced following the 2015 Merger (the “Integration Program”), which was designed to reduce costs and integrate and optimize our combined organization
, primarily in the U.S. and Canada segments. Overall, as part of the Integration Program, we closed net
six
factories, consolidated our distribution network, and eliminated
4,900
positions. Approximately
65%
of total Integration Program costs were reflected in cost of products sold, and approximately
60%
were cash expenditures.
As of
December 29, 2018
, we had incurred cumulative pre-tax costs of
$2,146 million
, including
$92 million
in 2018,
$316 million
in 2017, and
$887 million
in 2016. The
$2,146 million
of cumulative pre-tax costs included
$541 million
of severance and employee benefit costs,
$889 million
of non-cash asset-related costs,
$609 million
of other implementation costs, and
$107 million
of other exit costs. The related amounts incurred in 2018 were
$2 million
of severance and employee benefit costs,
$32 million
of non-cash asset-related costs,
$59 million
of other implementation costs, and
$1 million
of credits in other exit costs.
Our cumulative pre-tax costs related to the Integration Program, as well as the associated costs for the year ended December 30, 2017, reflect the restatements described in Note 2,
Restatement of Previously Issued Consolidated Financial Statements
.
As of
December 29, 2018
, we do not expect to incur significant additional expenses related to the Integration Program.
Our liability balance for Integration Program costs that qualify as exit and disposal costs under U.S. GAAP (i.e., severance and employee benefit costs and other exit costs) was (in millions):
|
Severance and Employee Benefit Costs
|
Other Exit Costs
(a)
|
Total
|
|||||||||
|
Balance at December 30, 2017
|
$
|
24
|
|
$
|
22
|
|
$
|
46
|
|
||
|
Charges/(credits)
|
2
|
|
(1
|
)
|
1
|
|
|||||
|
Cash payments
|
(12
|
)
|
(2
|
)
|
(14
|
)
|
|||||
|
Non-cash utilization
|
(9
|
)
|
(19
|
)
|
(28
|
)
|
|||||
|
Balance at December 29, 2018
|
$
|
5
|
|
$
|
—
|
|
$
|
5
|
|
||
(a) Other exit costs primarily consist of lease and contract terminations.
The Integration Program liability at
December 29, 2018
relates to the elimination of salaried positions in Canada. We expect the majority of this liability to be paid by the end of 2019.
92
Restructuring Activities:
In addition to our Integration Program in North America, we have other restructuring programs globally, which are focused primarily on workforce reduction, factory closure and consolidation, and benefit plan restructuring. Related to these programs, we expect to eliminate approximately
1,900
positions,
1,400
of which were eliminated in 2018. These programs resulted in expenses of
$368 million
in 2018, including
$48 million
of severance and employee benefit costs,
$63 million
of non-cash asset-related costs,
$251 million
of other implementation costs, and
$6 million
of other exit costs. Other implementation costs included a non-cash settlement charge related to the settlement of our Canadian salaried and Canadian hourly defined benefit pension plans in 2018. See Note 13,
Postemployment Benefit Plans
, for additional information. Other restructuring program expenses totaled
$118 million
in 2017 and
$125 million
in 2016.
Our liability balance for restructuring project costs that qualify as exit and disposal costs under U.S. GAAP (i.e., severance and employee benefit costs and other exit costs) was (in millions):
|
Severance and Employee Benefit Costs
|
Other Exit Costs
(a)
|
Total
|
|||||||||
|
Balance at December 30, 2017
|
$
|
16
|
|
$
|
25
|
|
$
|
41
|
|
||
|
Charges/(credits)
|
48
|
|
6
|
|
54
|
|
|||||
|
Cash payments
|
(35
|
)
|
(12
|
)
|
(47
|
)
|
|||||
|
Non-cash utilization
|
3
|
|
14
|
|
17
|
|
|||||
|
Balance at December 29, 2018
|
$
|
32
|
|
$
|
33
|
|
$
|
65
|
|
||
(a) Other exit costs primarily consist of lease and contract terminations.
We expect the liability for severance and employee benefit costs as of
December 29, 2018
to be paid by the end of 2019. The liability for other exit costs primarily relates to lease obligations. The cash impact of these obligations will continue for the duration of the lease terms, which expire between 2019 and 2026.
Total Integration and Restructuring:
Total expense/(income) related to the Integration Program and restructuring activities, by income statement caption, were (in millions):
|
As Restated & Recast
|
As Recast
|
||||||||||
|
December 29,
2018 |
December 30,
2017 |
December 31,
2016 |
|||||||||
|
Severance and employee benefit costs - COGS
|
$
|
12
|
|
$
|
9
|
|
$
|
41
|
|
||
|
Severance and employee benefit costs - SG&A
|
32
|
|
26
|
|
96
|
|
|||||
|
Severance and employee benefit costs - Other expense/(income), net
|
6
|
|
(149
|
)
|
20
|
|
|||||
|
Asset-related costs - COGS
|
59
|
|
191
|
|
496
|
|
|||||
|
Asset-related costs - SG&A
|
36
|
|
26
|
|
41
|
|
|||||
|
Other costs - COGS
|
123
|
|
264
|
|
162
|
|
|||||
|
Other costs - SG&A
|
35
|
|
67
|
|
156
|
|
|||||
|
Other costs - Other expense/(income), net
|
157
|
|
—
|
|
—
|
|
|||||
|
$
|
460
|
|
$
|
434
|
|
$
|
1,012
|
|
|||
Total expense/(income) for the year ended December 30, 2017 reflects the restatements described in Note 2,
Restatement of Previously Issued Consolidated Financial Statements
.
93
We do not include Integration Program and restructuring expenses within Segment Adjusted EBITDA (as defined in Note 22,
Segment Reporting
). The pre-tax impact of allocating such expenses to our segments would have been (in millions):
|
As Restated
|
|||||||||||
|
|
December 29,
2018 |
December 30,
2017 |
December 31,
2016 |
||||||||
|
United States
|
$
|
205
|
|
$
|
270
|
|
$
|
759
|
|
||
|
Canada
|
176
|
|
34
|
|
45
|
|
|||||
|
EMEA
|
16
|
|
56
|
|
85
|
|
|||||
|
Rest of World
|
25
|
|
13
|
|
6
|
|
|||||
|
General corporate expenses
|
38
|
|
61
|
|
117
|
|
|||||
|
$
|
460
|
|
$
|
434
|
|
$
|
1,012
|
|
|||
In the first quarter of 2018, we reorganized our segment structure to move our Middle East and Africa businesses from the Rest of World segment to the EMEA reportable segment. We have reflected this change in all historical periods presented. This change did not have a material impact on our current or any prior period results. See Note 22,
Segment Reporting
, for additional information.
In addition, total expense/(income) for the year ended December 30, 2017 reflects the restatements described in Note 2,
Restatement of Previously Issued Consolidated Financial Statements
.
Note 7. Restricted Cash
The following table provides a reconciliation of cash and cash equivalents, as reported on our consolidated balance sheets, to cash, cash equivalents, and restricted cash, as reported on our consolidated statements of cash flows (in millions):
|
December 29,
2018 |
December 30, 2017
|
||||||
|
Cash and cash equivalents
|
$
|
1,130
|
|
$
|
1,629
|
|
|
|
Restricted cash included in other current assets
|
1
|
|
140
|
|
|||
|
Restricted cash included in other non-current assets
|
5
|
|
—
|
|
|||
|
Cash, cash equivalents, and restricted cash
|
$
|
1,136
|
|
$
|
1,769
|
|
|
Our restricted cash at
December 30, 2017
primarily related to withholding taxes on our common stock dividends to our only significant international shareholder, 3G Capital.
Note 8. Inventories
Inventories consisted of the following (in millions):
|
As Restated
|
|||||||
|
December 29, 2018
|
December 30, 2017
|
||||||
|
Packaging and ingredients
|
$
|
510
|
|
$
|
560
|
|
|
|
Work in process
|
343
|
|
384
|
|
|||
|
Finished product
|
1,814
|
|
1,816
|
|
|||
|
Inventories
|
$
|
2,667
|
|
$
|
2,760
|
|
|
At
December 29, 2018
, inventories excluded amounts classified as held for sale. See Note 5,
Acquisitions and Divestitures
, for additional information. Additionally, inventories at December 30, 2017 reflect the restatements described in Note 2,
Restatement of Previously Issued Consolidated Financial Statements
.
94
Note 9. Property, Plant and Equipment
Property, plant and equipment consisted of the following (in millions):
|
As Restated
|
|||||||
|
December 29, 2018
|
December 30,
2017 |
||||||
|
Land
|
$
|
218
|
|
$
|
250
|
|
|
|
Buildings and improvements
|
2,375
|
|
2,232
|
|
|||
|
Equipment and other
|
5,904
|
|
5,323
|
|
|||
|
Construction in progress
|
1,165
|
|
1,345
|
|
|||
|
9,662
|
|
9,150
|
|
||||
|
Accumulated depreciation
|
(2,584
|
)
|
(2,089
|
)
|
|||
|
Property, plant and equipment, net
|
$
|
7,078
|
|
$
|
7,061
|
|
|
At
December 29, 2018
, property, plant and equipment, net, excluded amounts classified as held for sale. See Note 5,
Acquisitions and Divestitures
, for additional information. Additionally, property, plant and equipment balances at December 30, 2017 reflect the restatements described in Note 2,
Restatement of Previously Issued Consolidated Financial Statements
.
Note 10. Goodwill and Intangible Assets
Goodwill:
Changes in the carrying amount of goodwill, by segment, were (in millions):
|
United States
|
Canada
|
EMEA
|
Rest of World
|
Total
|
|||||||||||||||
|
Balance at December 30, 2017 (As Restated)
|
$
|
33,701
|
|
$
|
5,246
|
|
$
|
3,238
|
|
$
|
2,640
|
|
$
|
44,825
|
|
||||
|
Impairment losses
|
(4,104
|
)
|
(1,947
|
)
|
—
|
|
(957
|
)
|
(7,008
|
)
|
|||||||||
|
Reclassified to assets held for sale
|
—
|
|
(496
|
)
|
—
|
|
(173
|
)
|
(669
|
)
|
|||||||||
|
Acquisitions
|
—
|
|
16
|
|
—
|
|
25
|
|
41
|
|
|||||||||
|
Translation adjustments and other
|
—
|
|
(381
|
)
|
(164
|
)
|
(141
|
)
|
(686
|
)
|
|||||||||
|
Balance at December 29, 2018
|
$
|
29,597
|
|
$
|
2,438
|
|
$
|
3,074
|
|
$
|
1,394
|
|
$
|
36,503
|
|
||||
Goodwill at December 30, 2017 reflects the restatements described in Note 2,
Restatement of Previously Issued Consolidated Financial Statements
.
In the first quarter of 2018, we reorganized our segment structure to move our Middle East and Africa businesses from the Rest of World segment to the EMEA reportable segment. We have reflected this change in all historical periods presented. Accordingly, the segment goodwill balances at December 30, 2017 reflect an increase of
$179 million
in EMEA and a corresponding decrease in Rest of World. This change did not have a material impact on our current or any prior period results. See Note 22,
Segment Reporting
, for additional information.
See Note 5,
Acquisitions and Divestitures
, for additional information related to our acquisitions in 2018, as well as assets held for sale at December 29, 2018 related to the Canada Natural Cheese Transaction and the Heinz India Transaction.
Our goodwill balance consists of
20
reporting units and had an aggregate carrying amount of
$36.5 billion
as of
December 29, 2018
.
We test our reporting units for impairment annually as of the first day of our second quarter, or more frequently if events or circumstances indicate it is more likely than not that the fair value of a reporting unit is less than its carrying amount.
We performed our 2018 annual impairment test
as of April 1, 2018. We utilized the discounted cash flow method under the income approach to estimate the fair value of our reporting units. As a result of our 2018 annual impairment test, we recognized a non-cash impairment loss of
$133 million
in SG&A related to our Australia and New Zealand reporting unit within our Rest of World segment primarily due to anticipated and sustained margin declines in the region. The goodwill carrying amount of this reporting unit was
$509 million
prior to its impairment.
For the fourth quarter of 2018, in connection with the preparation of our year-end financial statements, we assessed the changes in circumstances that occurred during the quarter to determine if it was more likely than not that the fair values of any reporting units were below their carrying amounts. Although our annual impairment test is performed during the second quarter, we perform this qualitative assessment each interim reporting period.
95
While there was no single determinative event or factor, the consideration in totality of several factors that developed during the fourth quarter of 2018 led us to conclude that it was more likely than not that the fair values of
seven
of our
20
reporting units, including U.S. Grocery, U.S. Refrigerated, Canada Retail, Australia and New Zealand, Northeast Asia, Southeast Asia, and Other Latin America, were below their carrying amounts.
These factors included: (i) a sustained decrease in our share price in November and December of 2018, which reduced our market capitalization below the book value of net assets; (ii) the completion of our fourth quarter results, which were below management’s expectations due to several factors such as higher than expected supply chain costs and increased competition; (iii) the development and approval of our 2019 annual operating plan in December 2018, which provided additional insights into expectations and priorities for the coming years, such as lower growth and margin expectations; (iv) the announcement in November 2018 to sell certain assets in our natural cheese portfolio in Canada, which changed the composition and use of the remaining assets and brands in the associated reporting unit; (v) fluctuations in foreign exchange rates in certain countries; (vi) increased interest rates in certain locations, including an increase in the United States in December 2018; and (vii) increased and prolonged economic and regulatory uncertainty in the United States and global economies as of the end of December 2018.
As we determined that it was more likely than not that the fair values of these
seven
reporting units were below their carrying amounts, we performed an interim impairment test on these reporting units as of December 29, 2018. After assessing the totality of circumstances, we determined that each of the remaining
13
reporting units was unlikely to have a fair value below carrying amount.
As a result of our interim test, we recognized a non-cash impairment loss of
$6.9 billion
in SG&A related to
five
reporting units, including U.S. Refrigerated, Canada Retail, Southeast Asia, Northeast Asia, and Other Latin America. The other
two
reporting units we tested were determined to not be impaired. We utilized the discounted cash flow method under the income approach to estimate the fair value of our reporting units. Drivers of these impairment losses, by reporting unit, were as follows:
|
•
|
We recognized a
$4.1 billion
impairment loss in our U.S. Refrigerated reporting unit within our United States segment due to revised 2019 base and future year margin expectations, primarily in the natural cheese and meats categories, and, to a lesser extent, expectations for lower long-term net sales growth in the natural and processed cheese categories. Changes in future year margin expectations were primarily driven by sustained increases in supply chain costs, expectations for lower pricing to maintain competitive positioning, and expectations for increased marketing investments, primarily in response to private label competition, as well as customer-driven packaging investments. Changes in expectations for lower long-term net sales growth were primarily due to sustained private label competition and anticipated trends in consumer preferences. Our revised expectations were based on the completion of our fourth quarter results, which were below management’s expectations, and the development of our 2019 annual operating plan in December 2018. Additionally, our revised expectations were based on the development of our global five-year operating plan, which commenced in November 2018 and we expect to be completed in 2019. The goodwill carrying amount of the U.S. Refrigerated reporting unit was
$11.3 billion
prior to its impairment.
|
|
•
|
We recognized a
$1.9 billion
impairment loss in our Canada Retail reporting unit within our Canada segment due to lower positive net sales growth expectations and revised 2019 base and future year margin expectations, as well as the reassessment of our Canadian operations following the announcement in November to sell certain assets in our natural cheese portfolio in Canada. We revised our net sales growth expectations primarily due to our expected exit of the natural cheese category and expected declines in the coffee category (exclusive of our coffee business acquisition in Canada in 2018). Our revised expectations were based on the completion of our fourth quarter results, which were below management’s expectations, and the development of our 2019 annual operating plan in December 2018. Changes in future year margin expectations were primarily driven by sustained increases in supply chain costs and expectations for lower pricing to maintain competitive positioning. The goodwill carrying amount of the Canada Retail reporting unit was
$4.0 billion
prior to its impairment.
|
|
•
|
We recognized a
$315 million
impairment loss in our Southeast Asia reporting unit within our Rest of World segment due to margin and net sales declines in the seafood and seasonal cordials categories and foreign exchange rate declines in Indonesia and Papua New Guinea. Our revised expectations were based on the completion of our fourth quarter results, which were below management’s expectations, and the development of our 2019 annual operating plan in December 2018. This impairment represents all of the goodwill of the Southeast Asia reporting unit.
|
|
•
|
We recognized a
$302 million
impairment loss in our Northeast Asia reporting unit within our Rest of World segment due to margin and net sales declines as well as foreign exchange rate declines in Japan and Korea. Our revised expectations were based on the completion of our fourth quarter results, which were below management’s expectations, and the development of our 2019 annual operating plan in December 2018. The goodwill carrying amount of the Northeast Asia reporting unit was
$391 million
prior to its impairment.
|
96
|
•
|
We recognized a
$207 million
impairment loss in our Other Latin America reporting unit within our Rest of World segment due to net sales and margin declines in the region. Our revised expectations were based on the completion of our fourth quarter results, which were below management’s expectations, and the development of our 2019 annual operating plan in December 2018. This impairment represents all of the goodwill of the Other Latin America reporting unit.
|
The goodwill carrying amounts associated with an additional
four
reporting units, which each had excess fair value over its carrying amount of
20%
or less, were
$18.5 billion
for U.S. Grocery,
$424 million
for Latin America Exports,
$404 million
for Southeast Europe, and
$367 million
for Australia and New Zealand as of December 29, 2018.
Accumulated impairment losses to goodwill were
$7.0 billion
at
December 29, 2018
.
Fair value determinations require considerable judgment and are sensitive to changes in underlying assumptions, estimates, and market factors. Estimating the fair value of individual
reporting units
requires us to make assumptions and estimates regarding our future plans, as well as industry, economic, and regulatory conditions. These assumptions and estimates include
estimated future annual net cash flows, income tax rates, discount rates, growth rates
, and other market factors. If current expectations of future growth rates and margins are not met, if market factors outside of our control, such as discount rates, change, or if management’s expectations or plans otherwise change, including as a result of the development of our global five-year operating plan, then one or more of our
reporting units
might become impaired in the future.
Our
reporting units
that were impaired in 2018 were written down to their respective fair values resulting in zero excess fair value over carrying amount as of their latest 2018 impairment testing dates. Accordingly, these and other individual
reporting units
that have
20%
or less excess fair value over carrying amount as of their latest testing date have a heightened risk of future impairments if any assumptions, estimates, or market factors change in the future.
Reporting units with a heightened risk of future impairments had an aggregate goodwill carrying amount of
$29.0 billion
at December 29, 2018 and included: U.S. Grocery, U.S. Refrigerated, Canada Retail, Latin America Exports, Southeast Europe, Australia and New Zealand, and Northeast Asia.
Of the
$29.0 billion
with a heightened risk of future impairments,
$9.3 billion
is attributable to
reporting units
with
0%
excess fair value over carrying amount.
Although the remaining
reporting units
have more than
20%
excess fair value over carrying amount as of their latest 2018 impairment testing date, these amounts are also associated with the 2013 Heinz acquisition and the 2015 Merger and are recorded on the balance sheet at their estimated acquisition date fair values. Therefore, if any assumptions, estimates, or market factors change in the future, these amounts are also susceptible to impairments
.
Indefinite-lived intangible assets:
Changes in the carrying amount of indefinite-lived intangible assets, which primarily consisted of trademarks, were (in millions):
|
Balance at December 30, 2017
|
$
|
53,655
|
|
|
Impairment losses
|
(8,925
|
)
|
|
|
Reclassified to assets held for sale
|
(341
|
)
|
|
|
Transfers to definite-lived intangible assets
|
(72
|
)
|
|
|
Translation adjustments
|
(351
|
)
|
|
|
Balance at December 29, 2018
|
$
|
43,966
|
|
Indefinite-lived intangible assets reclassified to assets held for sale included the
Cracker Barrel
trademark
in Canada and
Complan
and
Glucon-D
trademarks in India. See Note 5,
Acquisitions and Divestitures
, for additional information on assets held for sale at December 29, 2018 related to the Canada Natural Cheese Transaction and the Heinz India Transaction.
Our indefinite-lived intangible asset balance primarily consists of a number of individual brands, which had an aggregate carrying amount of
$44.0 billion
as of
December 29, 2018
.
We test our brands for impairment annually as of the first day of our second quarter, or more frequently if events or circumstances indicate it is more likely than not that the fair value of a brand is less than its carrying amount.
We performed our 2018 annual impairment test
as of April 1, 2018. As a result of our 2018 annual impairment test, we recognized a non-cash impairment loss of
$101 million
in SG&A in the second quarter of 2018. This impairment loss was due to net sales and margin declines related to the
Quero
brand in Brazil, which was valued using the relief from royalty method. The impairment loss was recorded in our Rest of World segment, consistent with the ownership of the trademark.
In the third quarter of 2018, we recognized a non-cash impairment loss of
$215 million
in SG&A related to the
Smart Ones
brand, which was valued using the relief from royalty method. This impairment loss was primarily due to reduced future investment expectations and continued sales declines in the third quarter of 2018. The impairment loss was recorded in our United States segment, consistent with the ownership of the trademark.
We transferred the remaining carrying amount of
Smart Ones
to definite-lived intangible assets due to a shift in future investments to other brands in the frozen and chilled foods category.
97
For the fourth quarter of 2018, in connection with the preparation of our year-end financial statements, we assessed the changes in circumstances that occurred during the quarter to determine if it was more likely than not that the fair values of any brands were below their carrying amounts. Although our annual impairment test is performed during the second quarter, we perform this qualitative assessment each interim reporting period.
While there was no single determinative event or factor, the consideration in totality of several factors that developed during the fourth quarter of 2018 led us to conclude that it was more likely than not that the fair values of
six
of our brands, including
Kraft
,
Philadelphia
,
Oscar Mayer
,
Velveeta
,
Cool Whip
, and
ABC
, were below their carrying amounts. These factors were the same fourth quarter circumstances outlined in the goodwill impairment discussion above. As we determined that it was more likely than not that the fair values of these
six
brands were below their carrying amounts, we performed an interim impairment test on these brands as of December 29, 2018. After assessing the totality of circumstances, we determined that each of the remaining brands was unlikely to have a fair value below its carrying amount.
As a result of our interim test, we recognized a non-cash impairment loss of
$8.6 billion
in SG&A related to
five
brands, including
three
that were valued using the excess earnings method (
Kraft
,
Oscar
Mayer
, and
Philadelphia
) and
two
that were valued using the relief from royalty method (
Velveeta
and
ABC
). The other brand we tested was determined to not be impaired. The impairment losses for
Kraft
,
Oscar
Mayer
,
Philadelphia,
and
Velveeta
were recorded in our United States segment, and the
ABC
impairment loss was recorded in our Rest of World segment, consistent with the ownership of each trademark. Drivers of these impairment losses, by brand, were as follows:
|
•
|
We recognized a
$4.3 billion
impairment loss related to the
Kraft
brand, primarily due to lower long-term net sales growth expectations in the natural cheese category in the United States, lower net sales growth expectations in the processed cheese category in the United States and Canada, and the exit of the natural cheese category in Canada announced in November 2018. Changes in expectations for lower net sales growth were primarily due to distribution losses driven by sustained private label competition and anticipated trends in consumer preferences. Our revised expectations were based on the completion of our fourth quarter results, which were below management’s expectations, and the development of our 2019 annual operating plan in December 2018. Additionally, our revised expectations were based on the development of our global five-year operating plan, which commenced in November 2018 and we expect to be completed in 2019. The carrying amount of the
Kraft
brand was
$15.9 billion
prior to its impairment.
|
|
•
|
We recognized a
$3.3 billion
impairment loss related to the
Oscar Mayer
brand, primarily due to revised 2019 annual and future margin expectations in the United States. Changes in future year margin expectations were primarily driven by sustained increases in supply chain costs, expectations for lower pricing to maintain competitive positioning, and expectations for increased marketing investments and customer-driven packaging investments. Our revised expectations were based on the completion of our fourth quarter results, which were below management’s expectations, and the development of our 2019 annual operating plan in December 2018. Additionally, our revised expectations were based on the development of our global five-year operating plan, which commenced in November 2018 and we expect to be completed in 2019. The carrying amount of the
Oscar Mayer
brand was
$6.6 billion
prior to its impairment.
|
|
•
|
We recognized a
$797 million
impairment loss related to the
Philadelphia
brand, primarily due to revised 2019 annual and future margin expectations, and to a lesser extent, lower future positive net sales growth expectations in the United States. Changes in future year margin expectations were primarily driven by sustained increases in supply chain costs and expectations for lower pricing to maintain competitive positioning, as well as unfavorable changes in product mix and customer-driven packaging investments. Our revised expectations were based on the completion of our fourth quarter results, which were below management’s expectations, and the development of our 2019 annual operating plan in December 2018. Additionally, our revised expectations were based on the development of our global five-year operating plan, which commenced in November 2018 and we expect to be completed in 2019. The carrying amount of the
Philadelphia
brand was
$6.7 billion
prior to its impairment.
|
|
•
|
We recognized a
$168 million
impairment loss related to the
Velveeta
brand, primarily due to expectations for lower long-term net sales growth due to anticipated trends in consumer preferences. The carrying amount of the
Velveeta
brand was
$2.5 billion
prior to its impairment.
|
|
•
|
We recognized an
$84 million
impairment loss related to the
ABC
brand, primarily due to revised expectations of future net sales growth and margins in the seafood and seasonal cordials categories in Southeast Asia as well as foreign exchange rates in the regions in which this brand is sold. The carrying amount of the
ABC
brand was
$357 million
prior to its impairment.
|
The aggregate carrying amount associated with an additional
six
brands (
Miracle Whip
,
Planters
,
A1
,
Cool Whip
,
Stove Top
, and
Quero
), which each had excess fair value over its carrying amount of
20%
or less, was
$5.8 billion
as of December 29, 2018.
98
As a result of our 2017 annual impairment testing, we recognized a non-cash impairment loss of
$49 million
in SG&A in the second quarter of 2017. This loss was due to continued declines in nutritional beverages in India. The loss was recorded in our EMEA segment as the related trademark is owned by an Italian subsidiary.
Fair value determinations require considerable judgment and are sensitive to changes in underlying assumptions, estimates, and market factors. Estimating the fair value of individual
brands
requires us to make assumptions and estimates regarding our future plans, as well as industry, economic, and regulatory conditions. These assumptions and estimates include
estimated future annual net cash flows, income tax considerations, discount rates, growth rates, royalty rates, contributory asset charges
, and other market factors. If current expectations of future growth rates and margins are not met, if market factors outside of our control, such as discount rates, change, or if management’s expectations or plans otherwise change, including as a result of the development of our global five-year operating plan, then one or more of our
brands
might become impaired in the future.
Our
brands
that were impaired in 2018 were written down to their respective fair values resulting in zero excess fair value over carrying amount as of their latest 2018 impairment testing dates. Accordingly, these and other individual
brands
that have
20%
or less excess fair value over carrying amount as of their latest testing date have a heightened risk of future impairments if any assumptions, estimates, or market factors change in the future.
Brands with a heightened risk of future impairments had an aggregate carrying amount of
$29.3 billion
at December 29, 2018 and included:
Kraft
,
Philadelphia
,
Oscar Mayer
,
Velveeta
,
Miracle Whip
,
Planters
,
A1
,
Cool Whip
,
Stove Top
,
ABC
, and
Quero
.
Of the
$29.3 billion
with a heightened risk of future impairments,
$24.0 billion
is attributable to
brands
with
0%
excess fair value over carrying amount.
Although the remaining
brands
have more than
20%
excess fair value over carrying amount as of their latest 2018 impairment testing date, these amounts are also associated with the 2013 Heinz acquisition and the 2015 Merger and are recorded on the balance sheet at their estimated acquisition date fair values. Therefore, if any assumptions, estimates, or market factors change in the future, these amounts are also susceptible to impairments
.
Definite-lived intangible assets:
Definite-lived intangible assets were (in millions):
|
As Restated
|
|||||||||||||||||||||||
|
|
December 29, 2018
|
December 30, 2017
|
|||||||||||||||||||||
|
Gross
|
Accumulated
Amortization
|
Net
|
Gross
|
Accumulated
Amortization
|
Net
|
||||||||||||||||||
|
Trademarks
|
$
|
2,474
|
|
$
|
(402
|
)
|
$
|
2,072
|
|
$
|
2,368
|
|
$
|
(287
|
)
|
$
|
2,081
|
|
|||||
|
Customer-related assets
|
4,097
|
|
(681
|
)
|
3,416
|
|
4,231
|
|
(544
|
)
|
3,687
|
|
|||||||||||
|
Other
|
18
|
|
(4
|
)
|
14
|
|
14
|
|
(5
|
)
|
9
|
|
|||||||||||
|
$
|
6,589
|
|
$
|
(1,087
|
)
|
$
|
5,502
|
|
$
|
6,613
|
|
$
|
(836
|
)
|
$
|
5,777
|
|
||||||
Definite-lived intangible asset balances at December 30, 2017 reflect the restatements described in Note 2,
Restatement of Previously Issued Consolidated Financial Statements
.
Amortization expense for definite-lived intangible assets was
$290 million
in 2018,
$278 million
in 2017, and
$267 million
in 2016.
Aside from amortization expense, the changes in definite-lived intangible assets from
December 30, 2017
to
December 29, 2018
primarily reflect the reclassification to assets held for sale of
$96 million
, additions of
$100 million
related to purchase accounting for Cerebos, transfers of
$72 million
from indefinite-lived intangible assets, impairment losses of
$3 million
, and foreign currency.
The impairment of definite-lived intangible assets in 2018 related to a trademark which had a carrying amount that was deemed not to be recoverable. This non-cash impairment loss was recognized in SG&A.
Definite-lived intangible assets reclassified to assets held for sale included customer-related assets in Canada and India and certain trademarks, including
P’Tit Quebec
in Canada.
See Note 5,
Acquisitions and Divestitures
, for additional information related to our acquisition of Cerebos in 2018, as well as our assets held for sale at December 29, 2018.
We estimate that amortization expense related to definite-lived intangible assets will be approximately
$284 million
in 2019 and approximately
$274 million
in each of the four fiscal years thereafter.
Note 11. Income Taxes
U.S. Tax Reform:
On December 22, 2017, U.S. Tax Reform legislation was enacted by the federal government. The legislation significantly changed U.S. tax laws by, among other things, lowering the federal corporate tax rate from
35.0%
to
21.0%
, effective January 1, 2018 and imposing a one-time toll charge on deemed repatriated earnings of foreign subsidiaries as of December 30, 2017. In addition, there were many new provisions, including changes to bonus depreciation, revised deductions for executive compensation and interest expense, a tax on global intangible low-taxed income (“GILTI”), the base erosion anti-abuse tax (“BEAT”), and a deduction for foreign-derived intangible income (“FDII”). While the corporate tax rate reduction was effective January 1, 2018, we accounted for this anticipated rate change in 2017, the period of enactment.
99
Staff Accounting Bulletin No. 118 issued by the SEC in December 2017 provided us with up to one year to finalize accounting for the impacts of U.S. Tax Reform and allowed for provisional estimates when actual amounts could not be determined. As of December 30, 2017, we had made estimates of our deferred income tax benefit related to the corporate rate change, the toll charge, certain components of the revaluation of deferred tax assets and liabilities, including depreciation and executive compensation, and a change in our indefinite reinvestment assertion. In connection with U.S. Tax Reform, we reassessed our international investment assertion and no longer consider the historic earnings of our foreign subsidiaries as of December 30, 2017 to be indefinitely reinvested. We made an estimate of local country withholding taxes that would be owed when our historic earnings are distributed. Additionally, we elected to account for the tax on GILTI as a period cost and thus did not adjust any of the deferred tax assets and liabilities of our foreign subsidiaries for U.S. Tax Reform.
Our initial accounting for U.S. Tax Reform as of December 30, 2017 resulted in a net tax benefit of approximately
$7.0 billion
, including an estimate of our deferred income tax benefit of approximately
$7.5 billion
related to the corporate rate change, which was partially offset by an estimate of
$312 million
for the toll charge and approximately
$125 million
for other tax expenses, including a change in our indefinite reinvestment assertion. Related to our indefinite reinvestment assertion change, we had recorded an estimate of deferred tax liabilities of
$96 million
on approximately
$1.2 billion
of historic earnings as of December 30, 2017.
In the first quarter of 2018, we recorded a measurement period adjustment to reduce income tax expense and reduce deferred tax liabilities each by approximately
$20 million
. We also recorded insignificant measurement period adjustments in the second, third, and fourth quarters of 2018.
As of December 29, 2018, we had finalized our accounting for U.S. Tax Reform. The final impact (the majority of which was recorded in 2017, the period of enactment) was a net tax benefit of approximately
$7.1 billion
, including a deferred tax benefit of approximately
$7.5 billion
related to the corporate rate change, partially offset by tax expense of
$224 million
related to the toll charge
and
$120 million
for other tax expenses, including the deferred tax liability recorded for changing our indefinite reinvestment assertion.
Related to our indefinite reinvestment assertion change, we had a deferred tax liability of
$111 million
on approximately
$1.2 billion
of historic earnings as of December 30, 2017.
Additionally, w
e recorded a deferred tax liability of
$33 million
as of December 29, 2018 to reflect our investment in an Indian subsidiary that is no longer considered to be indefinitely reinvested. At the same time, we reversed
$28 million
of deferred tax liabilities related to local withholding tax obligations.
As of December 29, 2018, we have recorded a deferred tax liability of
$78 million
on
$1.2 billion
of historic earnings related to local withholding taxes that will be owed when this cash is distributed.
We consider the unremitted current year earnings of certain international subsidiaries that impose local country taxes on dividends to be indefinitely reinvested. For those undistributed earnings considered to be indefinitely reinvested, our intent is to reinvest these funds in our international operations, and our current plans do not demonstrate a need to repatriate the accumulated earnings to fund our U.S. cash requirements. The amount of unrecognized deferred tax liabilities for local country withholding taxes that would be owed related to our current year earnings of certain international subsidiaries is approximately
$20 million
.
100
Provision for/(Benefit from) Income Taxes:
Income/(loss) before income taxes and the provision for/(benefit from) income taxes, consisted of the following (in millions):
|
As Restated
|
|||||||||||
|
December 29,
2018 |
December 30,
2017 |
December 31,
2016 |
|||||||||
|
Income/(loss) before income taxes:
|
|||||||||||
|
United States
|
$
|
(10,305
|
)
|
$
|
3,811
|
|
$
|
3,271
|
|
||
|
International
|
(1,016
|
)
|
1,639
|
|
1,668
|
|
|||||
|
Total
|
$
|
(11,321
|
)
|
$
|
5,450
|
|
$
|
4,939
|
|
||
|
Provision for/(benefit from) income taxes:
|
|||||||||||
|
Current:
|
|||||||||||
|
U.S. federal
|
$
|
444
|
|
$
|
765
|
|
$
|
1,085
|
|
||
|
U.S. state and local
|
134
|
|
(47
|
)
|
82
|
|
|||||
|
International
|
322
|
|
295
|
|
238
|
|
|||||
|
900
|
|
1,013
|
|
1,405
|
|
||||||
|
Deferred:
|
|||||||||||
|
U.S. federal
|
(1,843
|
)
|
(6,590
|
)
|
(11
|
)
|
|||||
|
U.S. state and local
|
(121
|
)
|
97
|
|
(63
|
)
|
|||||
|
International
|
(3
|
)
|
(2
|
)
|
2
|
|
|||||
|
(1,967
|
)
|
(6,495
|
)
|
(72
|
)
|
||||||
|
Total provision for/(benefit from) income taxes
|
$
|
(1,067
|
)
|
$
|
(5,482
|
)
|
$
|
1,333
|
|
||
Tax benefits related to the exercise of stock options and other equity instruments recorded directly to additional paid-in capital totaled
$30 million
in 2016. In the first quarter of 2017, we prospectively adopted ASU 2016-09. We now record tax benefits related to the exercise of stock options and other equity instruments within our tax provision, rather than within equity. Accordingly, we recognized a tax benefit in our statements of income of
$12 million
in 2018 and
$22 million
in 2017 related to tax benefits upon the exercise of stock options and other equity instruments.
Effective Tax Rate:
The effective tax rate on income/(loss) before income taxes differed from the U.S. federal statutory tax rate for the following reasons:
|
As Restated
|
||||||||
|
December 29,
2018 |
December 30,
2017 |
December 31,
2016 |
||||||
|
U.S. federal statutory tax rate
|
21.0
|
%
|
35.0
|
%
|
35.0
|
%
|
||
|
Tax on income of foreign subsidiaries
|
3.4
|
%
|
(4.8
|
)%
|
(3.6
|
)%
|
||
|
Domestic manufacturing deduction
|
—
|
%
|
(1.5
|
)%
|
(2.0
|
)%
|
||
|
U.S. state and local income taxes, net of federal tax benefit
|
1.6
|
%
|
1.1
|
%
|
0.8
|
%
|
||
|
Tax exempt income
|
—
|
%
|
(0.7
|
)%
|
(3.4
|
)%
|
||
|
Deferred tax effect of statutory tax rate changes
|
(0.9
|
)%
|
0.3
|
%
|
(2.0
|
)%
|
||
|
Audit settlements and changes in uncertain tax positions
|
(0.3
|
)%
|
(0.2
|
)%
|
1.9
|
%
|
||
|
Venezuela nondeductible devaluation loss
|
(0.4
|
)%
|
—
|
%
|
0.3
|
%
|
||
|
U.S. Tax Reform discrete income tax benefit
|
0.5
|
%
|
(129.0
|
)%
|
—
|
%
|
||
|
Global intangible low-taxed income
|
(0.5
|
)%
|
—
|
%
|
—
|
%
|
||
|
Goodwill impairment
|
(15.1
|
)%
|
—
|
%
|
—
|
%
|
||
|
Wind-up of non-U.S. pension plans
|
(0.4
|
)%
|
—
|
%
|
—
|
%
|
||
|
Other
|
0.5
|
%
|
(0.8
|
)%
|
—
|
%
|
||
|
Effective tax rate
|
9.4
|
%
|
(100.6
|
)%
|
27.0
|
%
|
||
101
The provision for income taxes consists of provisions for federal, state, and foreign income taxes. We operate in an international environment; accordingly, the consolidated effective tax rate is a composite rate reflecting the earnings in various locations and the applicable tax rates. Additionally, the calculation of the percentage point impact of U.S. Tax Reform, tax exempt income, and other items on the effective tax rate shown in the table above are affected by income/(loss) before income taxes. Fluctuations in the amount of income generated across locations around the world could impact comparability of reconciling items between periods. Additionally, small movements in tax rates due to a change in tax law or a change in tax rates that causes us to revalue our deferred tax balances produces volatility in our effective tax rate.
The 2018 effective tax rate was lower, primarily due to a decrease in the U.S. federal statutory rate, non-deductible items (including goodwill impairments, nonmonetary currency devaluation losses, and the wind-up of non-U.S. pension plans), the impact of the federal tax on GILTI, and the revaluation of our deferred tax balances due to changes in state tax laws following U.S. Tax Reform, which were partially offset by the benefit from intangible asset impairment losses in the fourth quarter of 2018.
See Note 10,
Goodwill and Intangible Assets
, for additional information related to our impairment losses in the fourth quarter of 2018.
The tax provision for the 2017 tax year benefited from U.S. Tax Reform enacted on December 22, 2017. The related income tax benefit of
129.0%
in 2017 primarily reflects adjustments to our deferred tax positions for the lower federal income tax rate, partially offset by our provision for the one-time toll charge.
The tax provision for the 2016 tax year included a benefit related to the tax effect of statutory tax rate changes, including a benefit related to the impact on deferred taxes of a 10-basis-point reduction in the state tax rate and a 100-basis-point statutory rate reduction in the United Kingdom.
Deferred Income Tax Assets and Liabilities:
The tax effects of temporary differences and carryforwards that gave rise to deferred income tax assets and liabilities consisted of the following (in millions):
|
As Restated
|
|||||||
|
December 29, 2018
|
December 30, 2017
|
||||||
|
Deferred income tax liabilities:
|
|||||||
|
Intangible assets, net
|
$
|
11,571
|
|
$
|
13,567
|
|
|
|
Property, plant and equipment, net
|
735
|
|
676
|
|
|||
|
Other
|
410
|
|
288
|
|
|||
|
Deferred income tax liabilities
|
12,716
|
|
14,531
|
|
|||
|
Deferred income tax assets:
|
|||||||
|
Benefit plans
|
(172
|
)
|
(212
|
)
|
|||
|
Other
|
(470
|
)
|
(422
|
)
|
|||
|
Deferred income tax assets
|
(642
|
)
|
(634
|
)
|
|||
|
Valuation allowance
|
81
|
|
80
|
|
|||
|
Net deferred income tax liabilities
|
$
|
12,155
|
|
$
|
13,977
|
|
|
At
December 29, 2018
, deferred income tax liabilities excluded amounts classified as held for sale. See Note 5,
Acquisitions and Divestitures
, for additional information.
The decrease in deferred tax liabilities from December 30, 2017 to December 29, 2018 was primarily driven by intangible asset impairment losses recorded in the fourth quarter of 2018. See Note 10,
Goodwill and Intangible Assets
, for additional information.
At
December 29, 2018
, foreign operating loss carryforwards totaled
$307 million
. Of that amount,
$26 million
expire between 2019 and 2038; the other
$281 million
do not expire. We have recorded
$86 million
of deferred tax assets related to these foreign operating loss carryforwards. Deferred tax assets of
$90 million
have been recorded for U.S. state and local operating loss carryforwards. These losses expire between 2019 and 2038.
Uncertain Tax Positions:
At
December 29, 2018
, our unrecognized tax benefits for uncertain tax positions were
$387 million
. If we had recognized all of these benefits, the impact on our effective tax rate would have been
$352 million
. It is reasonably possible that our unrecognized tax benefits will decrease by as much as
$54 million
in the next 12 months primarily due to the progression of federal, state, and foreign audits in process. Our unrecognized tax benefits for uncertain tax positions are included in income taxes payable and other non-current liabilities on our consolidated balance sheets.
102
The changes in our unrecognized tax benefits were (in millions):
|
December 29,
2018 |
December 30,
2017 |
December 31,
2016 |
|||||||||
|
Balance at the beginning of the period
|
$
|
408
|
|
$
|
389
|
|
$
|
353
|
|
||
|
Increases for tax positions of prior years
|
9
|
|
2
|
|
59
|
|
|||||
|
Decreases for tax positions of prior years
|
(81
|
)
|
(35
|
)
|
(18
|
)
|
|||||
|
Increases based on tax positions related to the current year
|
74
|
|
135
|
|
62
|
|
|||||
|
Decreases due to settlements with taxing authorities
|
(3
|
)
|
(59
|
)
|
(62
|
)
|
|||||
|
Decreases due to lapse of statute of limitations
|
(10
|
)
|
(24
|
)
|
(5
|
)
|
|||||
|
Reclassified to liabilities held for sale
|
(10
|
)
|
—
|
|
—
|
|
|||||
|
Balance at the end of the period
|
$
|
387
|
|
$
|
408
|
|
$
|
389
|
|
||
Our unrecognized tax benefits decreased during 2018 mainly as a result of audit settlements with federal, state, and foreign taxing authorities and statute of limitations expirations. Our unrecognized tax benefits increased during 2017 as a result of evaluating tax positions taken or expected to be taken on our federal, state, and foreign income tax returns.
In 2016, we reached an agreement with the IRS resolving all Kraft open matters related to the audits of taxable years 2012 through 2014. This settlement reduced our reserves for uncertain tax positions and resulted in a non-cash tax benefit of
$42 million
.
We include interest and penalties related to uncertain tax positions in our tax provision. Our provision for/(benefit from) income taxes included a
$5 million
expense in 2018,
$24 million
benefit in 2017, and
$8 million
expense in 2016 related to interest and penalties. Accrued interest and penalties were
$62 million
as of
December 29, 2018
and
$57 million
as of
December 30, 2017
.
Other Income Tax Matters:
In the normal course of business, we are subject to examination by taxing authorities throughout the world, including such major jurisdictions as Australia, Canada, Italy, the Netherlands, the United Kingdom, and the United States. As of December 29, 2018, we have substantially concluded all national income tax matters through 2016 for the Netherlands, through 2014 for the United States, through 2012 for the United Kingdom, through 2011 for Australia, Canada, and Italy. We have substantially concluded all state income tax matters through 2007. Additionally, as of April 2019, we had substantially concluded all national income tax matters through 2015 for the United States.
We have a tax sharing agreement with Mondelēz International, Inc. (“Mondelēz International”), which generally provides that (i) we are liable for U.S. state income taxes and Canadian federal and provincial income taxes for Kraft periods prior to October 1, 2012 and (ii) Mondelēz International is responsible for U.S. federal income taxes and substantially all non-U.S. income taxes, excluding Canadian income taxes, for Kraft periods prior to October 1, 2012.
Kraft's U.S. operations were included in Mondelēz International's U.S. federal consolidated income tax returns for tax periods through October 1, 2012. In December 2016, Mondelēz International reached a final resolution on a U.S. federal income tax audit of the 2010-2012 tax years. As noted above, we are indemnified for U.S. federal income taxes related to these periods.
Note 12. Employees’ Stock Incentive Plans
We grant equity awards, including stock options, restricted stock units (“RSUs”), and performance share units (“PSUs”), to select employees to provide long-term performance incentives to our employees. As a result of the failure to remain current in our reporting requirements with the SEC, we are not currently eligible to use Form S-8 registration statements.
Stock Plans
We had activity related to equity awards from the following plans in 2018, 2017, and 2016:
2016 Omnibus Incentive Plan:
In April 2016, our Board of Directors approved the 2016 Omnibus Incentive Plan (“2016 Omnibus Plan”), which authorized grants of options, stock appreciation rights, RSUs, deferred stock, performance awards, investment rights, other stock-based awards, and cash-based awards. This plan authorizes the issuance of up to
18 million
shares of our common stock. Equity awards granted under the 2016 Omnibus Plan generally have a
five
-year cliff vest period, and non-qualified stock options have a maximum exercise term of
10
years. Equity awards granted under the 2016 Omnibus Plan since inception include non-qualified stock options, RSUs, and PSUs.
103
2013 Omnibus Incentive Plan:
Prior to approval of the 2016 Omnibus Plan, we issued non-qualified stock options to select employees under the 2013 Omnibus Incentive Plan (“2013 Omnibus Plan”). As a result of the 2015 Merger, each outstanding Heinz stock option was converted into
0.443332
of a Kraft Heinz stock option. Following this conversion, the 2013 Omnibus Plan authorized the issuance of up to
17,555,947
shares of our common stock. Non-qualified stock options awarded under the 2013 Omnibus Plan have a
five
-year cliff vest period and a maximum exercise term of
10
years. These non-qualified stock options will continue to vest and become exercisable in accordance with the terms and conditions of the 2013 Omnibus Plan and the relevant award agreements.
Kraft 2012 Performance Incentive Plan:
Prior to the 2015 Merger, Kraft issued equity-based awards, including stock options and RSUs, under its 2012 Performance Incentive Plan. As a result of the 2015 Merger, each outstanding Kraft stock option was converted into an option to purchase a number of shares of our common stock based upon an option adjustment ratio, and each outstanding Kraft RSU was converted into
one
Kraft Heinz RSU. These Kraft Heinz equity awards will continue to vest and become exercisable in accordance with the terms and conditions that were applicable immediately prior to the completion of the 2015 Merger. These options generally become exercisable in
three
annual installments beginning on the first anniversary of the original grant date, and have a maximum exercise term of
10
years. RSUs generally cliff vest on the third anniversary of the original grant date. In accordance with the terms of the 2012 Performance Incentive Plan, vesting generally accelerates for holders of Kraft awards who are terminated without cause within
two
years of the 2015 Merger Date.
In addition, prior to the 2015 Merger, Kraft issued performance-based, long-term incentive awards (“Performance Shares”), which vested based on varying performance, market, and service conditions. In connection with the 2015 Merger, all outstanding Performance Shares were converted into cash awards, payable in
two
installments: (i) a 2015 pro-rata payment based upon the portion of the Performance Share cycle completed prior to the 2015 Merger and (ii) the remaining value of the award to be paid on the earlier of the first anniversary of the closing of the 2015 Merger and a participant's termination without cause.
Stock Options
We use the Black-Scholes model to estimate the fair value of stock option grants. Our weighted average Black-Scholes fair value assumptions were:
|
December 29,
2018 |
December 30,
2017 |
December 31,
2016 |
|||||||||
|
Risk-free interest rate
|
2.75
|
%
|
2.25
|
%
|
1.63
|
%
|
|||||
|
Expected term
|
7.5 years
|
|
7.5 years
|
|
7.5 years
|
|
|||||
|
Expected volatility
|
21.3
|
%
|
19.6
|
%
|
22.0
|
%
|
|||||
|
Expected dividend yield
|
3.6
|
%
|
2.8
|
%
|
3.1
|
%
|
|||||
|
Weighted average grant date fair value per share
|
$
|
10.26
|
|
$
|
14.24
|
|
$
|
12.48
|
|
||
The risk-free interest rate represented the constant maturity U.S. Treasury rate in effect at the grant date, with a remaining term equal to the expected life of the options. The expected life is the period over which our employees are expected to hold their options. Due to the lack of historical data, we calculated expected life using the Safe Harbor method, which uses the weighted average vesting period and the contractual term of the options. In 2018, we estimated volatility using a blended volatility approach of term-matched historical volatility from our daily stock prices and weighted average implied volatility. In 2017 and 2016, we estimated volatility using a blended approach of implied volatility and peer volatility. We calculated peer volatility as the average of the term-matched, leverage-adjusted historical volatilities of Colgate-Palmolive Co., The Coca-Cola Company, Mondelēz International, Altria Group, Inc., PepsiCo, Inc., and Unilever plc. We estimated the expected dividend yield using the quarterly dividend divided by the three-month average stock price, annualized and continuously compounded.
Our stock option activity and related information was:
|
Number of Stock Options
|
Weighted Average Exercise Price
(per share) |
Aggregate Intrinsic Value
(in millions) |
Average Remaining Contractual Term
|
|||||||||
|
Outstanding at December 30, 2017
|
19,289,564
|
|
$
|
41.63
|
|
|||||||
|
Granted
|
2,143,730
|
|
64.37
|
|
||||||||
|
Forfeited
|
(1,136,924
|
)
|
61.10
|
|
||||||||
|
Exercised
|
(2,036,405
|
)
|
27.68
|
|
||||||||
|
Outstanding at December 29, 2018
|
18,259,965
|
|
44.64
|
|
$
|
168
|
|
6 years
|
||||
|
Exercisable at December 29, 2018
|
10,492,048
|
|
33.48
|
|
124
|
|
4 years
|
|||||
104
The aggregate intrinsic value of stock options exercised during the period was
$67 million
in 201
8,
$124 million
in 2017, and
$186 million
in 2016.
Cash received from options exercised was
$56 million
in 2018,
$66 million
in 2017, and
$140 million
in 2016. The tax benefit realized from stock options exercised was
$23 million
in 2018,
$44 million
in 2017, and
$68 million
in 2016.
Our unvested stock options and related information was:
|
Number of Stock Options
|
Weighted Average Grant Date Fair Value
(per share) |
|||||
|
Unvested options at December 30, 2017
|
11,827,142
|
|
$
|
8.36
|
|
|
|
Granted
|
2,143,730
|
|
10.26
|
|
||
|
Vested
|
(5,135,897
|
)
|
5.99
|
|
||
|
Forfeited
|
(1,067,058
|
)
|
10.45
|
|
||
|
Unvested options at December 29, 2018
|
7,767,917
|
|
10.16
|
|
||
Restricted Stock Units
RSUs represent a right to receive
one
share or the value of one share upon the terms and conditions set forth in the plan and the applicable award agreement.
We used the stock price on the grant date to estimate the fair value of our RSUs. Certain of our RSUs are not dividend-eligible. We discounted the fair value of these RSUs based on the dividend yield. Dividend yield was estimated using the quarterly dividend divided by the three-month average stock price, annualized and continuously compounded. The grant date fair value of RSUs is amortized to expense over the vesting period.
The weighted average grant date fair value per share of our RSUs granted during the year was
$58.59
in 2018,
$91.25
in 2017, and
$77.53
in 2016. Our expected dividend yield was
3.31%
in 2018. All RSUs granted in 2017 and 2016 were dividend-eligible.
Our RSU activity and related information was:
|
Number of Units
|
Weighted Average Grant Date Fair Value
(per share)
|
|||||
|
Outstanding at December 30, 2017
|
1,284,262
|
|
$
|
81.91
|
|
|
|
Granted
|
1,443,088
|
|
58.59
|
|
||
|
Forfeited
|
(253,249
|
)
|
77.42
|
|
||
|
Vested
|
(135,143
|
)
|
73.57
|
|
||
|
Outstanding at December 29, 2018
|
2,338,958
|
|
68.49
|
|
||
The aggregate fair value of RSUs that vested during the period was
$9 million
in 2018,
$12 million
in 2017, and
$40 million
in 2016.
Performance Share Units
PSUs represent a right to receive
one
share or the value of one share upon the terms and conditions set forth in the plan and the applicable award agreement and are subject to achievement or satisfaction of performance conditions specified by the Compensation Committee of our Board of Directors.
We used the stock price on the grant date to estimate the fair value of our PSUs. None of our PSUs are dividend-eligible; therefore, we discounted the fair value of our PSUs based on the dividend yield. Dividend yield was estimated using the quarterly dividend divided by the three-month average stock price, annualized and continuously compounded. The grant date fair value of PSUs is amortized to expense over the vesting period. We adjust the expense based on the likelihood of future achievement of performance metrics.
The weighted average grant date fair value per share of our PSUs granted during the year was
$56.31
in 2018 and
$79.85
in 2017. Our expected dividend yield was
3.31%
in 2018 and
2.73%
in 2017. There were no PSUs granted in 2016.
105
Our PSU activity and related information was:
|
Number of Units
|
Weighted Average Grant Date Fair Value
(per share)
|
|||||
|
Outstanding at December 30, 2017
|
815,383
|
|
$
|
70.16
|
|
|
|
Granted
|
2,730,130
|
|
56.31
|
|
||
|
Forfeited
|
(293,457
|
)
|
62.28
|
|
||
|
Outstanding at December 29, 2018
|
3,252,056
|
|
59.24
|
|
||
Total Equity Awards
Equity award compensation cost and the related tax benefit was (in millions):
|
December 29,
2018 |
December 30,
2017 |
December 31,
2016 |
|||||||||
|
Pre-tax compensation cost
|
$
|
33
|
|
$
|
46
|
|
$
|
46
|
|
||
|
Related tax benefit
|
(7
|
)
|
(14
|
)
|
(15
|
)
|
|||||
|
After-tax compensation cost
|
$
|
26
|
|
$
|
32
|
|
$
|
31
|
|
||
Unrecognized compensation cost related to unvested equity awards was
$149 million
at
December 29, 2018
and is expected to be recognized over a weighted average period of
four
years.
Note 13. Postemployment Benefits
As noted above, as a result of the failure to remain current in our reporting requirements with the SEC, we are not currently eligible to use Form S-8 registration statements. As a result, on April 23, 2019, the administrator of the Kraft Heinz Savings Plan and the Kraft Heinz Union Savings Plan (collectively, the “Plan”) issued a notice to Plan participants advising participants of a blackout period during which participants are prohibited from acquiring beneficial ownership of additional interests in The Kraft Heinz Company Stock Fund. If we are not able to become and remain current in our reporting requirements with the SEC, it restricts our ability to maintain The Kraft Heinz Company Stock Fund or issue other equity securities to our employees.
We maintain various retirement plans for the majority of our employees. Current defined benefit pension plans are provided primarily for certain domestic union and foreign employees. Local statutory requirements govern many of these plans. The pension benefits of our unionized workers are in accordance with the applicable collective bargaining agreement covering their employment. Defined contribution plans are provided for certain domestic unionized, non-union hourly, and salaried employees as well as certain employees in foreign locations.
We provide health care and other postretirement benefits to certain of our eligible retired employees and their eligible dependents. Certain of our U.S. and Canadian employees may become eligible for such benefits. We may modify plan provisions or terminate plans at our discretion. The postretirement benefits of our unionized workers are in accordance with the applicable collective bargaining agreement covering their employment.
We remeasure our postemployment benefit plans at least annually.
We capitalize a portion of net pension and postretirement cost/(benefit) into inventory based on our production activities. Beginning January 1, 2018, only the service cost component of net pension and postretirement cost/(benefit) is capitalized into inventory. As part of the adoption of ASU 2017-07 in the first quarter of 2018, we recognized a one-time favorable credit of
$42 million
within cost of products sold related to amounts that were previously capitalized into inventory. Included in this credit was
$28 million
related to prior service credits that were previously capitalized to inventory.
Pension Plans
In 2018, we settled our Canadian salaried and Canadian hourly defined benefit pension plans, which resulted in settlement charges of
$162 million
for the year ended December 29, 2018. Additionally, the settlement of these plans impacted the projected benefit obligation, accumulated benefit obligation, fair value of plan assets, and service costs associated with our non-U.S. pension plans.
We had approved the wind-up of the Canadian salaried and Canadian hourly defined benefit pension plans in 2016, and the wind-up was effective on December 31, 2016. This action resulted in an increase to our projected benefit obligations of approximately
$85 million
at December 31, 2016. This action had no impact on the consolidated statements of income or consolidated statements of cash flows for the year ended December 31, 2016.
106
Obligations and Funded Status:
The projected benefit obligations, fair value of plan assets, and funded status of our pension plans were (in millions):
|
U.S. Plans
|
Non-U.S. Plans
|
||||||||||||||
|
December 29, 2018
|
December 30, 2017
|
December 29, 2018
|
December 30, 2017
|
||||||||||||
|
Benefit obligation at beginning of year
|
$
|
4,719
|
|
$
|
5,157
|
|
$
|
3,464
|
|
$
|
3,099
|
|
|||
|
Service cost
|
10
|
|
11
|
|
19
|
|
19
|
|
|||||||
|
Interest cost
|
158
|
|
178
|
|
67
|
|
66
|
|
|||||||
|
Benefits paid
|
(191
|
)
|
(224
|
)
|
(126
|
)
|
(161
|
)
|
|||||||
|
Actuarial losses/(gains)
|
(447
|
)
|
270
|
|
(118
|
)
|
120
|
|
|||||||
|
Plan amendments
|
1
|
|
—
|
|
14
|
|
(2
|
)
|
|||||||
|
Currency
|
—
|
|
—
|
|
(175
|
)
|
264
|
|
|||||||
|
Settlements
|
(190
|
)
|
(692
|
)
|
(1,221
|
)
|
(1
|
)
|
|||||||
|
Curtailments
|
—
|
|
—
|
|
(1
|
)
|
—
|
|
|||||||
|
Special/contractual termination benefits
|
—
|
|
19
|
|
7
|
|
9
|
|
|||||||
|
Other
|
—
|
|
—
|
|
—
|
|
51
|
|
|||||||
|
Benefit obligation at end of year
|
4,060
|
|
4,719
|
|
1,930
|
|
3,464
|
|
|||||||
|
Fair value of plan assets at beginning of year
|
4,785
|
|
4,788
|
|
4,156
|
|
3,628
|
|
|||||||
|
Actual return on plan assets
|
(185
|
)
|
613
|
|
49
|
|
289
|
|
|||||||
|
Employer contributions
|
—
|
|
300
|
|
57
|
|
30
|
|
|||||||
|
Benefits paid
|
(191
|
)
|
(224
|
)
|
(126
|
)
|
(161
|
)
|
|||||||
|
Currency
|
—
|
|
—
|
|
(221
|
)
|
322
|
|
|||||||
|
Settlements
|
(190
|
)
|
(692
|
)
|
(1,221
|
)
|
(1
|
)
|
|||||||
|
Other
|
—
|
|
—
|
|
(5
|
)
|
49
|
|
|||||||
|
Fair value of plan assets at end of year
|
4,219
|
|
4,785
|
|
2,689
|
|
4,156
|
|
|||||||
|
Net pension liability/(asset) recognized at end of year
|
$
|
(159
|
)
|
$
|
(66
|
)
|
$
|
(759
|
)
|
$
|
(692
|
)
|
|||
The accumulated benefit obligation, which represents benefits earned to the measurement date, was
$4.1 billion
at
December 29, 2018
and
$4.7 billion
at
December 30, 2017
for the U.S. pension plans. The accumulated benefit obligation for the non-U.S. pension plans was
$1.7 billion
at
December 29, 2018
and
$3.3 billion
at
December 30, 2017
.
The combined U.S. and non-U.S. pension plans resulted in net pension assets of
$918 million
at
December 29, 2018
and
$758 million
at
December 30, 2017
. We recognized these amounts on our consolidated balance sheets as follows (in millions):
|
December 29, 2018
|
December 30, 2017
|
||||||
|
Other non-current assets
|
$
|
999
|
|
$
|
871
|
|
|
|
Other current liabilities
|
(4
|
)
|
(41
|
)
|
|||
|
Accrued postemployment costs
|
(77
|
)
|
(72
|
)
|
|||
|
Net pension asset/(liability) recognized
|
$
|
918
|
|
$
|
758
|
|
|
For certain of our U.S. and non-U.S. plans that were underfunded based on accumulated benefit obligations in excess of plan assets, the projected benefit obligations, accumulated benefit obligations, and the fair value of plan assets were (in millions):
|
U.S. Plans
|
Non-U.S. Plans
|
||||||||||||||
|
December 29, 2018
|
December 30, 2017
|
December 29, 2018
|
December 30, 2017
|
||||||||||||
|
Projected benefit obligation
|
$
|
—
|
|
$
|
—
|
|
$
|
146
|
|
$
|
1,368
|
|
|||
|
Accumulated benefit obligation
|
—
|
|
—
|
|
139
|
|
1,360
|
|
|||||||
|
Fair value of plan assets
|
—
|
|
—
|
|
65
|
|
1,254
|
|
|||||||
All of our U.S. plans were overfunded based on plan assets in excess of accumulated benefit obligations as of
December 29, 2018
and
December 30, 2017
.
107
For certain of our U.S. and non-U.S. plans that were underfunded based on projected benefit obligations in excess of plan assets, the projected benefit obligations, accumulated benefit obligations, and the fair value of plan assets were (in millions):
|
U.S. Plans
|
Non-U.S. Plans
|
||||||||||||||
|
December 29, 2018
|
December 30, 2017
|
December 29, 2018
|
December 30, 2017
|
||||||||||||
|
Projected benefit obligation
|
$
|
—
|
|
$
|
—
|
|
$
|
148
|
|
$
|
1,400
|
|
|||
|
Accumulated benefit obligation
|
—
|
|
—
|
|
141
|
|
1,392
|
|
|||||||
|
Fair value of plan assets
|
—
|
|
—
|
|
67
|
|
1,287
|
|
|||||||
All of our U.S. plans were overfunded based on plan assets in excess of projected benefit obligations as of
December 29, 2018
and
December 30, 2017
.
We used the following weighted average assumptions to determine our projected benefit obligations under the pension plans:
|
U.S. Plans
|
Non-U.S. Plans
|
||||||||||
|
December 29, 2018
|
December 30, 2017
|
December 29, 2018
|
December 30, 2017
|
||||||||
|
Discount rate
|
4.4
|
%
|
3.7
|
%
|
2.9
|
%
|
2.4
|
%
|
|||
|
Rate of compensation increase
|
4.1
|
%
|
4.1
|
%
|
3.9
|
%
|
3.9
|
%
|
|||
Discount rates for our U.S. and non-U.S. plans were developed from a model portfolio of high quality, fixed-income debt instruments with durations that match the expected future cash flows of the plans.
Components of Net Pension Cost/(Benefit):
Net pension cost/(benefit) consisted of the following (in millions):
|
U.S. Plans
|
Non-U.S. Plans
|
||||||||||||||||||||||
|
December 29,
2018 |
December 30,
2017 |
December 31,
2016 |
December 29,
2018 |
December 30,
2017 |
December 31,
2016 |
||||||||||||||||||
|
Service cost
|
$
|
10
|
|
$
|
11
|
|
$
|
13
|
|
$
|
19
|
|
$
|
19
|
|
$
|
25
|
|
|||||
|
Interest cost
|
158
|
|
178
|
|
203
|
|
67
|
|
66
|
|
87
|
|
|||||||||||
|
Expected return on plan assets
|
(247
|
)
|
(262
|
)
|
(290
|
)
|
(175
|
)
|
(180
|
)
|
(182
|
)
|
|||||||||||
|
Amortization of unrecognized losses/(gains)
|
—
|
|
—
|
|
—
|
|
2
|
|
1
|
|
—
|
|
|||||||||||
|
Settlements
|
(4
|
)
|
2
|
|
23
|
|
158
|
|
—
|
|
2
|
|
|||||||||||
|
Curtailments
|
—
|
|
—
|
|
—
|
|
(1
|
)
|
—
|
|
—
|
|
|||||||||||
|
Special/contractual termination benefits
|
—
|
|
19
|
|
—
|
|
7
|
|
9
|
|
3
|
|
|||||||||||
|
Other
|
—
|
|
2
|
|
—
|
|
—
|
|
(15
|
)
|
—
|
|
|||||||||||
|
Net pension cost/(benefit)
|
$
|
(83
|
)
|
$
|
(50
|
)
|
$
|
(51
|
)
|
$
|
77
|
|
$
|
(100
|
)
|
$
|
(65
|
)
|
|||||
We present all non-service cost components of net pension cost/(benefit) within other expense/(income), net on our consolidated statements of income.
We used the following weighted average assumptions to determine our net pension costs:
|
U.S. Plans
|
Non-U.S. Plans
|
||||||||||||||||
|
December 29,
2018 |
December 30,
2017 |
December 31,
2016 |
December 29,
2018 |
December 30,
2017 |
December 31,
2016 |
||||||||||||
|
Discount rate - Service cost
|
3.8
|
%
|
4.2
|
%
|
4.5
|
%
|
3.0
|
%
|
3.2
|
%
|
4.2
|
%
|
|||||
|
Discount rate - Interest cost
|
3.6
|
%
|
3.6
|
%
|
3.5
|
%
|
2.9
|
%
|
2.1
|
%
|
3.3
|
%
|
|||||
|
Expected rate of return on plan assets
|
5.5
|
%
|
5.7
|
%
|
5.7
|
%
|
4.5
|
%
|
4.8
|
%
|
5.6
|
%
|
|||||
|
Rate of compensation increase
|
4.1
|
%
|
4.1
|
%
|
4.1
|
%
|
3.9
|
%
|
4.0
|
%
|
3.4
|
%
|
|||||
Discount rates for our U.S. and non-U.S. plans were developed from a model portfolio of high quality, fixed-income debt instruments with durations that match the expected future cash flows of the plans. We determine our expected rate of return on plan assets from the plan assets' historical long-term investment performance, target asset allocation, and estimates of future long-term returns by asset class.
108
Plan Assets:
The underlying basis of the investment strategy of our defined benefit plans is to ensure that pension funds are available to meet the plans’ benefit obligations when they are due. Our investment objectives include: investing plan assets in a high-quality, diversified manner in order to maintain the security of the funds; achieving an optimal return on plan assets within specified risk tolerances; and investing according to local regulations and requirements specific to each country in which a defined benefit plan operates. The investment strategy expects equity investments to yield a higher return over the long term than fixed-income securities, while fixed-income securities are expected to provide certain matching characteristics to the plans’ benefit payment cash flow requirements. Our investment policy specifies the type of investment vehicles appropriate for the applicable plan, asset allocation guidelines, criteria for the selection of investment managers, procedures to monitor overall investment performance as well as investment manager performance. It also provides guidelines enabling the applicable plan fiduciaries to fulfill their responsibilities.
Our weighted average asset allocations were:
|
U.S. Plans
|
Non-U.S. Plans
|
||||||||||
|
December 29, 2018
|
December 30, 2017
|
December 29, 2018
|
December 30, 2017
|
||||||||
|
Fixed-income securities
|
84
|
%
|
62
|
%
|
45
|
%
|
39
|
%
|
|||
|
Equity securities
|
14
|
%
|
27
|
%
|
34
|
%
|
27
|
%
|
|||
|
Cash and cash equivalents
|
2
|
%
|
11
|
%
|
16
|
%
|
4
|
%
|
|||
|
Real estate
|
—
|
%
|
—
|
%
|
3
|
%
|
6
|
%
|
|||
|
Certain insurance contracts
|
—
|
%
|
—
|
%
|
2
|
%
|
24
|
%
|
|||
|
Total
|
100
|
%
|
100
|
%
|
100
|
%
|
100
|
%
|
|||
Our pension investment strategy for U.S. plans is designed to align our pension assets with our projected benefit obligation to reduce volatility by targeting an investment of approximately
85%
of our U.S. plan assets in fixed-income securities and approximately
15%
in return-seeking assets, primarily equity securities.
For pension plans outside the United States, our investment strategy is subject to local regulations and the asset/liability profiles of the plans in each individual country. In aggregate, the long-term asset allocation targets of our non-U.S. plans are broadly characterized as a mix of approximately
65%
fixed-income securities and annuity contracts, and approximately
35%
in return-seeking assets, primarily equity securities and real estate.
The fair value of pension plan assets at
December 29, 2018
was determined using the following fair value measurements (in millions):
|
Asset Category
|
Total Fair Value
|
Quoted Prices in Active Markets for Identical Assets
(Level 1) |
Significant Other Observable Inputs
(Level 2) |
Significant Unobservable Inputs
(Level 3) |
|||||||||||
|
Corporate bonds and other fixed-income securities
|
$
|
3,089
|
|
$
|
—
|
|
$
|
3,089
|
|
$
|
—
|
|
|||
|
Government bonds
|
366
|
|
366
|
|
—
|
|
—
|
|
|||||||
|
Total fixed-income securities
|
3,455
|
|
366
|
|
3,089
|
|
—
|
|
|||||||
|
Equity securities
|
665
|
|
665
|
|
—
|
|
—
|
|
|||||||
|
Cash and cash equivalents
|
422
|
|
419
|
|
3
|
|
—
|
|
|||||||
|
Real estate
|
79
|
|
—
|
|
—
|
|
79
|
|
|||||||
|
Certain insurance contracts
|
53
|
|
—
|
|
—
|
|
53
|
|
|||||||
|
Fair value excluding investments measured at net asset value
|
4,674
|
|
1,450
|
|
3,092
|
|
132
|
|
|||||||
|
Investments measured at net asset value
(a)
|
2,234
|
|
|||||||||||||
|
Total plan assets at fair value
|
$
|
6,908
|
|
||||||||||||
|
(a)
|
Amount includes cash collateral of
$269 million
associated with our securities lending program, which is reflected as an asset, and a corresponding securities lending payable of
$269 million
, which is reflected as a liability. The net impact on total plan assets at fair value is
zero
.
|
109
The fair value of pension plan assets at
December 30, 2017
was determined using the following fair value measurements (in millions):
|
Asset Category
|
Total Fair Value
|
Quoted Prices in Active Markets for Identical Assets
(Level 1) |
Significant Other Observable Inputs
(Level 2) |
Significant Unobservable Inputs
(Level 3) |
|||||||||||
|
Corporate bonds and other fixed-income securities
|
$
|
2,606
|
|
$
|
—
|
|
$
|
2,606
|
|
$
|
—
|
|
|||
|
Government bonds
|
467
|
|
467
|
|
—
|
|
—
|
|
|||||||
|
Total fixed-income securities
|
3,073
|
|
467
|
|
2,606
|
|
—
|
|
|||||||
|
Equity securities
|
1,044
|
|
1,044
|
|
—
|
|
—
|
|
|||||||
|
Cash and cash equivalents
|
208
|
|
205
|
|
3
|
|
—
|
|
|||||||
|
Real estate
|
262
|
|
—
|
|
—
|
|
262
|
|
|||||||
|
Certain insurance contracts
|
983
|
|
—
|
|
—
|
|
983
|
|
|||||||
|
Fair value excluding investments measured at net asset value
|
5,570
|
|
1,716
|
|
2,609
|
|
1,245
|
|
|||||||
|
Investments measured at net asset value
(a)
|
3,371
|
|
|||||||||||||
|
Total plan assets at fair value
|
$
|
8,941
|
|
||||||||||||
|
(a)
|
Amount includes cash collateral of
$278 million
associated with our securities lending program, which is reflected as an asset, and a corresponding securities lending payable of
$278 million
, which is reflected as a liability. The net impact on total plan assets at fair value is
zero
.
|
The following section describes the valuation methodologies used to measure the fair value of pension plan assets, including an indication of the level in the fair value hierarchy in which each type of asset is generally classified.
Corporate Bonds and Other Fixed-Income Securities.
These securities consist of publicly traded U.S. and non-U.S. fixed interest obligations (principally corporate bonds). Such investments are valued through consultation and evaluation with brokers in the institutional market using quoted prices and other observable market data. As such, these securities are included in Level 2.
Government Bonds.
These securities consist of direct investments in publicly traded U.S. fixed interest obligations (principally debentures). Such investments are valued using quoted prices in active markets. These securities are included in Level 1.
Equity Securities.
These securities consist of direct investments in the stock of publicly traded companies. Such investments are valued based on the closing price reported in an active market on which the individual securities are traded. As such, the direct investments are classified as Level 1.
Cash and Cash Equivalents.
This consists of direct cash holdings and institutional short-term investment vehicles. Direct cash holdings are valued based on cost, which approximates fair value and are classified as Level 1. Certain institutional short-term investment vehicles are valued daily and are classified as Level 1. Other cash equivalents that are not traded on an active exchange, such as bank deposits, are classified as Level 2.
Real Estate.
These holdings consist of real estate investments and are generally classified as Level 3.
Certain Insurance Contracts.
This category consists of group annuity contracts that have been purchased to cover a portion of the plan members and have been classified as Level 3.
Investments Measured at Net Asset Value
. This category consists of pooled funds, short-term investments and partnership/corporate feeder interests.
|
•
|
Pooled funds.
The fair values of participation units held in collective trusts are based on their net asset values, as reported by the managers of the collective trusts and as supported by the unit prices of actual purchase and sale transactions occurring as of or close to the financial statement date. The fair value of these investments measured at net asset value is excluded from the fair value hierarchy. Investments in the collective trusts can be redeemed on each business day based upon the applicable net asset value per unit. Investments in the international large/mid cap equity collective trust can be redeemed on the last business day of each month and at least one business day during the month.
|
The mutual fund investments are not traded on an exchange, and a majority of these funds are held in a separate account managed by a fixed income manager. The fair values of these investments are based on their net asset values, as reported by the managers and as supported by the unit prices of actual purchase and sale transactions occurring as of or close to the financial statement date. The fair value of these investments measured at net asset value is excluded from the fair value hierarchy. The objective of the account is to provide superior return with reasonable risk, where performance is expected to exceed Barclays Long U.S. Credit Index. Investments in this account can be redeemed with a written notice to the investment manager.
110
|
•
|
Short-term investments.
Short-term investments largely consist of a money market fund, the fair value of which is based on the net asset value reported by the manager of the fund and supported by the unit prices of actual purchase and sale transactions. The fair value of these investments measured at net asset value is excluded from the fair value hierarchy. The money market fund is designed to provide safety of principal, daily liquidity, and a competitive yield by investing in high quality money market instruments. The investment objective of the money market fund is to provide the highest possible level of current income while still maintaining liquidity and preserving capital.
|
|
•
|
Partnership/corporate feeder interests.
Fair value estimates of the equity partnership are based on their net asset values, as reported by the manager of the partnership. The fair value of these investments measured at net asset value is excluded from the fair value hierarchy. Investments in the equity partnership may be redeemed once per month upon 10 days’ prior written notice to the General Partner, subject to the discretion of the General Partner. The investment objective of the equity partnership is to seek capital appreciation by investing primarily in equity securities.
|
The fair values of the corporate feeder are based upon the net asset values of the equity master fund in which it invests. The fair value of these investments measured at net asset value is excluded from the fair value hierarchy. Investments in the corporate feeder can be redeemed quarterly with at least 90 days’ notice. The investment objective of the corporate feeder is to generate long-term returns by investing in large, liquid equity securities with attractive fundamentals.
Changes in our Level 3 plan assets for the year ended
December 29, 2018
included (in millions):
|
Asset Category
|
December 30,
2017 |
Additions
|
Net Realized Gain/(Loss)
|
Net Unrealized Gain/(Loss)
|
Net Purchases, Issuances and Settlements
|
Transfers Into/(Out of) Level 3
|
December 29,
2018 |
||||||||||||||||||||
|
Real estate
|
$
|
262
|
|
$
|
—
|
|
$
|
49
|
|
$
|
(7
|
)
|
$
|
(210
|
)
|
$
|
(15
|
)
|
$
|
79
|
|
||||||
|
Certain insurance contracts
|
983
|
|
—
|
|
(82
|
)
|
(3
|
)
|
(845
|
)
|
—
|
|
53
|
|
|||||||||||||
|
Total Level 3 investments
|
$
|
1,245
|
|
$
|
—
|
|
$
|
(33
|
)
|
$
|
(10
|
)
|
$
|
(1,055
|
)
|
$
|
(15
|
)
|
$
|
132
|
|
||||||
Net purchases, issuances and settlements of
$845 million
principally related to insurance contract settlements in Canada in connection with the wind-up of our Canadian salaried and hourly defined benefit pension plans.
Changes in our Level 3 plan assets for the year ended
December 30, 2017
included (in millions):
|
Asset Category
|
December 31,
2016 |
Additions
|
Net Realized Gain/(Loss)
|
Net Unrealized Gain/(Loss)
|
Net Purchases, Issuances and Settlements
|
Transfers Into/(Out of) Level 3
|
December 30,
2017 |
||||||||||||||||||||
|
Real estate
|
$
|
234
|
|
$
|
—
|
|
$
|
14
|
|
$
|
14
|
|
$
|
—
|
|
$
|
—
|
|
$
|
262
|
|
||||||
|
Certain insurance contracts
|
189
|
|
797
|
|
—
|
|
36
|
|
(39
|
)
|
—
|
|
983
|
|
|||||||||||||
|
Total Level 3 investments
|
$
|
423
|
|
797
|
|
$
|
14
|
|
$
|
50
|
|
$
|
(39
|
)
|
$
|
—
|
|
$
|
1,245
|
|
|||||||
Additions of
$797 million
were principally related to insurance contracts entered into in Canada in connection with the wind-up of our Canadian salaried and hourly defined benefit pension plans.
Employer Contributions:
In 2018, we contributed
$57 million
to our non-U.S. pension plans. We did
no
t contribute to our U.S. pension plans. We estimate that 2019 pension contributions will be approximately
$15 million
to our non-U.S. plans. We do
no
t plan to make contributions to our U.S. pension plans in 2019. Our actual contributions and plans may change due to many factors, including changes in tax, employee benefit, or other laws and regulations, tax deductibility, significant differences between expected and actual pension asset performance or interest rates, or other factors.
Future Benefit Payments:
The estimated future benefit payments from our pension plans at
December 29, 2018
were (in millions):
|
U.S. Plans
|
Non-U.S. Plans
|
||||||
|
2019
|
$
|
331
|
|
$
|
70
|
|
|
|
2020
|
320
|
|
70
|
|
|||
|
2021
|
317
|
|
72
|
|
|||
|
2022
|
309
|
|
80
|
|
|||
|
2023
|
301
|
|
79
|
|
|||
|
2024-2028
|
1,351
|
|
436
|
|
|||
111
Postretirement Plans
Obligations and Funded Status:
The accumulated benefit obligation, fair value of plan assets, and funded status of our postretirement benefit plans were (in millions):
|
December 29, 2018
|
December 30, 2017
|
||||||
|
Benefit obligation at beginning of year
|
$
|
1,553
|
|
$
|
1,714
|
|
|
|
Service cost
|
8
|
|
10
|
|
|||
|
Interest cost
|
45
|
|
49
|
|
|||
|
Benefits paid
|
(136
|
)
|
(142
|
)
|
|||
|
Actuarial losses/(gains)
|
(142
|
)
|
(70
|
)
|
|||
|
Plan amendments
|
(21
|
)
|
(24
|
)
|
|||
|
Currency
|
(13
|
)
|
13
|
|
|||
|
Other
|
—
|
|
3
|
|
|||
|
Benefit obligation at end of year
|
1,294
|
|
1,553
|
|
|||
|
Fair value of plan assets at beginning of year
|
1,188
|
|
—
|
|
|||
|
Actual return on plan assets
|
(26
|
)
|
—
|
|
|||
|
Employer contributions
|
19
|
|
1,329
|
|
|||
|
Benefits paid
|
(137
|
)
|
(142
|
)
|
|||
|
Other
|
—
|
|
1
|
|
|||
|
Fair value of plan assets at end of year
|
1,044
|
|
1,188
|
|
|||
|
Net postretirement benefit liability/(asset) recognized at end of year
|
$
|
250
|
|
$
|
365
|
|
|
We recognized the net postretirement benefit asset/(liability) on our consolidated balance sheets as follows (in millions):
|
December 29, 2018
|
December 30, 2017
|
||||||
|
Other current liabilities
|
$
|
(14
|
)
|
$
|
(10
|
)
|
|
|
Accrued postemployment costs
|
(236
|
)
|
(355
|
)
|
|||
|
Net postretirement benefit asset/(liability) recognized
|
$
|
(250
|
)
|
$
|
(365
|
)
|
|
For certain of our postretirement benefit plans that were underfunded based on accumulated postretirement benefit obligations in excess of plan assets, the accumulated benefit obligations and the fair value of plan assets were (in millions):
|
December 29, 2018
|
December 30, 2017
|
||||||
|
Accumulated benefit obligation
|
$
|
1,294
|
|
$
|
1,553
|
|
|
|
Fair value of plan assets
|
1,044
|
|
1,188
|
|
|||
We used the following weighted average assumptions to determine our postretirement benefit obligations:
|
December 29, 2018
|
December 30, 2017
|
||||
|
Discount rate
|
4.2
|
%
|
3.5
|
%
|
|
|
Health care cost trend rate assumed for next year
|
6.7
|
%
|
6.7
|
%
|
|
|
Ultimate trend rate
|
4.9
|
%
|
4.9
|
%
|
|
Discount rates for our plans were developed from a model portfolio of high-quality, fixed-income debt instruments with durations that match the expected future cash flows of the plans. Our expected health care cost trend rate is based on historical costs and our expectation for health care cost trend rates going forward.
The year that the health care cost trend rate reaches the ultimate trend rate varies by plan and ranges between
2019
and
2030
as of
December 29, 2018
.
112
Assumed health care costs trend rates have a significant impact on the amounts reported for the postretirement benefit plans. A one-percentage-point change in assumed health care cost trend rates would have the following effects, increase/(decrease) in cost and obligation, as of
December 29, 2018
(in millions):
|
One-Percentage-Point
|
|||||||
|
Increase
|
(Decrease)
|
||||||
|
Effect on annual service and interest cost
|
$
|
3
|
|
$
|
(3
|
)
|
|
|
Effect on postretirement benefit obligation
|
48
|
|
(41
|
)
|
|||
Components of Net Postretirement Cost/(Benefit):
Net postretirement cost/(benefit) consisted of the following (in millions):
|
As Restated
|
|||||||||||
|
December 29,
2018 |
December 30,
2017 |
December 31,
2016 |
|||||||||
|
Service cost
|
$
|
8
|
|
$
|
10
|
|
$
|
12
|
|
||
|
Interest cost
|
45
|
|
49
|
|
52
|
|
|||||
|
Expected return on plan assets
|
(50
|
)
|
—
|
|
—
|
|
|||||
|
Amortization of prior service costs/(credits)
|
(311
|
)
|
(328
|
)
|
(355
|
)
|
|||||
|
Amortization of unrecognized losses/(gains)
|
—
|
|
—
|
|
(1
|
)
|
|||||
|
Curtailments
|
—
|
|
(177
|
)
|
—
|
|
|||||
|
Net postretirement cost/(benefit)
|
$
|
(308
|
)
|
$
|
(446
|
)
|
$
|
(292
|
)
|
||
The amortization of prior service credits was primarily driven by plan amendments in 2015 and 2016. We estimate that amortization of prior service credits will be approximately
$306 million
in 2019,
$122 million
in 2020,
$8 million
in 2021,
$6 million
in 2022, and
$6 million
in 2023.
In 2017, we remeasured certain of our postretirement plans and recognized a curtailment gain of
$177 million
. The curtailment was triggered by the number of cumulative headcount reductions after the closure of certain U.S. factories during the year. The resulting gain is attributed to accelerating a portion of the previously deferred actuarial gains and prior service credits. The headcount reductions and factory closures were part of our Integration Program. See Note 6,
Integration and Restructuring Expenses
, for additional information.
We used the following weighted average assumptions to determine our net postretirement benefit plans cost:
|
December 29,
2018 |
December 30,
2017 |
December 31,
2016 |
||||||
|
Discount rate - Service cost
|
3.6
|
%
|
4.0
|
%
|
4.3
|
%
|
||
|
Discount rate - Interest cost
|
3.0
|
%
|
3.0
|
%
|
3.0
|
%
|
||
|
Expected rate of return on plan assets
|
4.4
|
%
|
—
|
%
|
—
|
%
|
||
|
Health care cost trend rate
|
6.7
|
%
|
6.3
|
%
|
6.5
|
%
|
||
Discount rates for our plans were developed from a model portfolio of high-quality, fixed-income debt instruments with durations that match the expected future cash flows of the plans. We determine our expected rate of return on plan assets from the plan assets' target asset allocation and estimates of future long-term returns by asset class. Our expected health care cost trend rate is based on historical costs and our expectation for health care cost trend rates going forward.
Plan Assets:
In December 2017, we made a cash contribution of approximately
$1.2 billion
to pre-fund a portion of our U.S. postretirement plan benefits following enactment of U.S. Tax Reform on December 22, 2017. The underlying basis of the investment strategy of our U.S. postretirement plans is to ensure that funds are available to meet the plans’ benefit obligations when they are due by investing plan assets in a high-quality, diversified manner in order to maintain the security of the funds. The investment strategy expects equity investments to yield a higher return over the long term than fixed-income securities, while fixed-income securities are expected to provide certain matching characteristics to the plans’ benefit payment cash flow requirements.
113
Our weighted average asset allocations were:
|
December 29, 2018
|
December 30, 2017
|
||||
|
Fixed-income securities
|
65
|
%
|
—
|
%
|
|
|
Equity securities
|
27
|
%
|
—
|
%
|
|
|
Cash and cash equivalents
|
8
|
%
|
100
|
%
|
|
Our postretirement benefit plan investment strategy is subject to local regulations and the asset/liability profiles of the plans in each individual country. Our investment strategy is designed to align our postretirement benefit plan assets with our postretirement benefit obligation to reduce volatility. In aggregate, our long-term asset allocation targets are broadly characterized as a mix of approximately
70%
in fixed-income securities and approximately
30%
in return-seeking assets, primarily equity securities.
The fair value of postretirement benefit plan assets at
December 29, 2018
was determined using the following fair value measurements (in millions):
|
Asset Category
|
Total Fair Value
|
Quoted Prices in Active Markets for Identical Assets
(Level 1) |
Significant Other Observable Inputs
(Level 2) |
Significant Unobservable Inputs
(Level 3) |
|||||||||||
|
Government bonds
|
$
|
26
|
|
$
|
26
|
|
$
|
—
|
|
$
|
—
|
|
|||
|
Corporate bonds and other fixed-income securities
|
567
|
|
—
|
|
567
|
|
—
|
|
|||||||
|
Total fixed-income securities
|
593
|
|
26
|
|
567
|
|
—
|
|
|||||||
|
Equity securities
|
146
|
|
146
|
|
—
|
|
—
|
|
|||||||
|
Fair value excluding investments measured at net asset value
|
739
|
|
172
|
|
567
|
|
—
|
|
|||||||
|
Investments measured at net asset value
|
305
|
|
|||||||||||||
|
Total plan assets at fair value
|
$
|
1,044
|
|
||||||||||||
The fair value of our postretirement benefit plan assets was
$1.2 billion
at
December 30, 2017
. These assets were all classified as Level 1 short-term investments.
The following section describes the valuation methodologies used to measure the fair value of postretirement benefit plan assets, including an indication of the level in the fair value hierarchy in which each type of asset is generally classified.
Corporate Bonds and Other Fixed-Income Securities.
These securities consist of publicly traded U.S. and non-U.S. fixed interest obligations (principally corporate bonds an tax-exempt municipal bonds). Such investments are valued through consultation and evaluation with brokers in the institutional market using quoted prices and other observable market data. As such, these securities are included in Level 2.
Government Bonds.
These securities consist of direct investments in publicly traded U.S. fixed interest obligations (principally debentures). Such investments are valued using quoted prices in active markets. These securities are included in Level 1.
Equity Securities.
These securities consist of direct investments in the stock of publicly traded companies. Such investments are valued based on the closing price reported in an active market on which the individual securities are traded. As such, the direct investments are classified as Level 1.
Investments Measured at Net Asset Value
. This category consists of pooled funds and short-term investments.
|
•
|
Pooled funds.
The fair values of participation units held in collective trusts are based on their net asset values, as reported by the managers of the collective trusts and as supported by the unit prices of actual purchase and sale transactions occurring as of or close to the financial statement date. The fair value of these investments measured at net asset value is excluded from the fair value hierarchy. Investments in the collective trusts can be redeemed on each business day based upon the applicable net asset value per unit. Investments in the international large/mid cap equity collective trust can be redeemed on the last business day of each month and at least one business day during the month.
|
The mutual fund investments are not traded on an exchange. The fair values of the mutual fund investments that are not traded on an exchange are based on their net asset values, as reported by the managers and as supported by the unit prices of actual purchase and sale transactions occurring as of or close to the financial statement date. The fair value of these investments measured at net asset value is excluded from the fair value hierarchy.
114
|
•
|
Short-term investments.
Short-term investments largely consist of a money market fund, the fair value of which is based on the net asset value reported by the manager of the fund and supported by the unit prices of actual purchase and sale transactions. The fair value of these investments measured at net asset value is excluded from the fair value hierarchy. The money market fund is designed to provide safety of principal, daily liquidity, and a competitive yield by investing in high quality money market instruments. The investment objective of the money market fund is to provide the highest possible level of current income while still maintaining liquidity and preserving capital.
|
Employer Contributions:
In 2018, we contributed
$19 million
to our postretirement benefit plans. We estimate that 2019 postretirement benefit plan contributions will be approximately
$15 million
. Our actual contributions and plans may change due to many factors, including changes in tax, employee benefit, or other laws and regulations, tax deductibility, significant differences between expected and actual postretirement plan asset performance or interest rates, or other factors.
Future Benefit Payments:
Our estimated future benefit payments for our postretirement plans at
December 29, 2018
were (in millions):
|
2019
|
$
|
131
|
|
|
2020
|
127
|
|
|
|
2021
|
120
|
|
|
|
2022
|
114
|
|
|
|
2023
|
107
|
|
|
|
2024-2028
|
440
|
|
|
Other Plans
We sponsor and contribute to employee savings plans that cover eligible salaried, non-union, and union employees. Our contributions and costs are determined by the matching of employee contributions, as defined by the plans. Amounts charged to expense for defined contribution plans totaled
$85 million
in 2018,
$78 million
in 2017, and
$74 million
in 2016.
Accumulated Other Comprehensive Income/(Losses)
Our accumulated other comprehensive income/(losses) pension and postretirement benefit plans balances, before tax, consisted of the following (in millions):
|
Pension Benefits
|
Postretirement Benefits
|
Total
|
|||||||||||||||||||||
|
December 29, 2018
|
December 30, 2017
|
December 29, 2018
|
December 30, 2017
|
December 29, 2018
|
December 30, 2017
|
||||||||||||||||||
|
Net actuarial gain/(loss)
|
$
|
175
|
|
$
|
13
|
|
$
|
177
|
|
$
|
111
|
|
$
|
352
|
|
$
|
124
|
|
|||||
|
Prior service credit/(cost)
|
(14
|
)
|
1
|
|
458
|
|
748
|
|
444
|
|
749
|
|
|||||||||||
|
$
|
161
|
|
$
|
14
|
|
$
|
635
|
|
$
|
859
|
|
$
|
796
|
|
$
|
873
|
|
||||||
115
The net postemployment benefits recognized in other comprehensive income/(loss), consisted of the following (in millions):
|
As Restated
|
|||||||||||
|
December 29,
2018 |
December 30,
2017 |
December 31,
2016 |
|||||||||
|
Net postemployment benefit gains/(losses) arising during the period:
|
|||||||||||
|
Net actuarial gains/(losses) arising during the period - Pension Benefits
|
$
|
8
|
|
$
|
45
|
|
$
|
(73
|
)
|
||
|
Net actuarial gains/(losses) arising during the period - Postretirement Benefits
|
66
|
|
71
|
|
(5
|
)
|
|||||
|
Prior service credits/(costs) arising during the period - Pension Benefits
|
(15
|
)
|
1
|
|
—
|
|
|||||
|
Prior service credits/(costs) arising during the period - Postretirement Benefits
|
21
|
|
24
|
|
51
|
|
|||||
|
80
|
|
141
|
|
(27
|
)
|
||||||
|
Tax benefit/(expense)
|
(19
|
)
|
(55
|
)
|
18
|
|
|||||
|
$
|
61
|
|
$
|
86
|
|
$
|
(9
|
)
|
|||
|
Reclassification of net postemployment benefit losses/(gains) to net income/(loss):
|
|||||||||||
|
Amortization of unrecognized losses/(gains) - Pension Benefits
|
$
|
2
|
|
$
|
1
|
|
$
|
—
|
|
||
|
Amortization of unrecognized losses/(gains) - Postretirement Benefits
|
—
|
|
—
|
|
(1
|
)
|
|||||
|
Amortization of prior service costs/(credits) - Postretirement Benefits
|
(311
|
)
|
(328
|
)
|
(355
|
)
|
|||||
|
Net settlement and curtailment losses/(gains) - Pension Benefits
|
153
|
|
2
|
|
25
|
|
|||||
|
Net settlement and curtailment losses/(gains) - Postretirement Benefits
|
—
|
|
(177
|
)
|
—
|
|
|||||
|
(156
|
)
|
(502
|
)
|
(331
|
)
|
||||||
|
Tax benefit/(expense)
|
38
|
|
193
|
|
127
|
|
|||||
|
$
|
(118
|
)
|
$
|
(309
|
)
|
$
|
(204
|
)
|
|||
As of
December 29, 2018
, we expect to amortize
$306 million
of postretirement benefit plans prior service credits from accumulated other comprehensive income/(losses) into net postretirement benefit plans costs/(benefits) during 2019. We do not expect to amortize any other significant postemployment benefit losses/(gains) into net pension or net postretirement benefit plan costs/(benefits) during 2019.
Note 14. Financial Instruments
All of our non-exchange traded derivative contracts are governed by an International Swaps and Derivatives Association master agreement, and these master agreements and their schedules contain certain obligations regarding the delivery of certain financial information upon demand.
Derivative Volume:
The notional values of our outstanding derivative instruments were (in millions):
|
Notional Amount
|
|||||||
|
December 29, 2018
|
December 30, 2017
|
||||||
|
Commodity contracts
|
$
|
478
|
|
$
|
272
|
|
|
|
Foreign exchange contracts
|
3,263
|
|
2,876
|
|
|||
|
Cross-currency contracts
|
10,146
|
|
3,161
|
|
|||
The increase in our derivative volume for cross-currency contracts was primarily driven by the addition of new Canadian dollar and British pound sterling cross-currency swaps. A portion of these new contracts is being used to offset existing cross-currency contracts that are no longer designated as hedging instruments. The remaining portion of the new contracts is designated as net investment hedges.
116
Fair Value of Derivative Instruments:
Fair value is defined as the price that would be received to sell an asset or paid to transfer a liability in an orderly transaction between market participants at the measurement date. The fair values and the levels within the fair value hierarchy of derivative instruments recorded on the consolidated balance sheets were (in millions):
|
December 29, 2018
|
|||||||||||||||||||||||
|
Quoted Prices in Active Markets for Identical Assets and Liabilities
(Level 1) |
Significant Other Observable Inputs
(Level 2) |
Total Fair Value
|
|||||||||||||||||||||
|
Assets
|
Liabilities
|
Assets
|
Liabilities
|
Assets
|
Liabilities
|
||||||||||||||||||
|
Derivatives designated as hedging instruments:
|
|||||||||||||||||||||||
|
Foreign exchange contracts
(a)
|
$
|
—
|
|
$
|
—
|
|
$
|
51
|
|
$
|
26
|
|
$
|
51
|
|
$
|
26
|
|
|||||
|
Cross-currency contracts
(b)
|
—
|
|
—
|
|
139
|
|
3
|
|
139
|
|
3
|
|
|||||||||||
|
Derivatives not designated as hedging instruments:
|
|||||||||||||||||||||||
|
Commodity contracts
(c)
|
5
|
|
27
|
|
—
|
|
2
|
|
5
|
|
29
|
|
|||||||||||
|
Foreign exchange contracts
(c)
|
—
|
|
—
|
|
5
|
|
42
|
|
5
|
|
42
|
|
|||||||||||
|
Cross-currency contracts
(b)
|
—
|
|
—
|
|
557
|
|
119
|
|
557
|
|
119
|
|
|||||||||||
|
Total fair value
|
$
|
5
|
|
$
|
27
|
|
$
|
752
|
|
$
|
192
|
|
$
|
757
|
|
$
|
219
|
|
|||||
|
(a)
|
The fair value of derivative assets was recorded in other current assets and the fair value of derivative liabilities was recorded in other current liabilities.
|
|
(b)
|
The fair value of derivative assets was recorded in other current assets (
$557 million
) and other non-current assets (
$139 million
), and the fair value of derivative liabilities was recorded within other current liabilities (
$119 million
) and other non-current liabilities (
$3 million
).
|
|
(c)
|
The fair value of derivative assets was recorded in other current assets and the fair value of derivative liabilities was recorded in other current liabilities.
|
|
December 30, 2017
|
|||||||||||||||||||||||
|
Quoted Prices in Active Markets for Identical Assets and Liabilities
(Level 1)
|
Significant Other Observable Inputs
(Level 2)
|
Total Fair Value
|
|||||||||||||||||||||
|
Assets
|
Liabilities
|
Assets
|
Liabilities
|
Assets
|
Liabilities
|
||||||||||||||||||
|
Derivatives designated as hedging instruments:
|
|||||||||||||||||||||||
|
Foreign exchange contracts
(a)
|
$
|
—
|
|
$
|
—
|
|
$
|
8
|
|
$
|
42
|
|
$
|
8
|
|
$
|
42
|
|
|||||
|
Cross-currency contracts
(b)
|
—
|
|
—
|
|
344
|
|
—
|
|
344
|
|
—
|
|
|||||||||||
|
Derivatives not designated as hedging instruments:
|
|||||||||||||||||||||||
|
Commodity contracts
(c)
|
4
|
|
8
|
|
—
|
|
—
|
|
4
|
|
8
|
|
|||||||||||
|
Foreign exchange contracts
(c)
|
—
|
|
—
|
|
17
|
|
3
|
|
17
|
|
3
|
|
|||||||||||
|
Cross-currency contracts
(b)
|
—
|
|
—
|
|
19
|
|
—
|
|
19
|
|
—
|
|
|||||||||||
|
Total fair value
|
$
|
4
|
|
$
|
8
|
|
$
|
388
|
|
$
|
45
|
|
$
|
392
|
|
$
|
53
|
|
|||||
|
(a)
|
The fair value of derivative assets was recorded in other current assets and the fair value of derivative liabilities was recorded in other current liabilities (
$41 million
) and other non-current liabilities (
$1 million
).
|
|
(b)
|
The fair value of our derivative assets was recorded in other non-current assets.
|
|
(c)
|
The fair value of derivative assets was recorded in other current assets and the fair value of derivative liabilities was recorded in other current liabilities.
|
Our derivative financial instruments are subject to master netting arrangements that allow for the offset of assets and liabilities in the event of default or early termination of the contract. We elect to record the gross assets and liabilities of our derivative financial instruments on the consolidated balance sheets. If the derivative financial instruments had been netted on the consolidated balance sheets, the asset and liability positions each would have been reduced by
$124 million
at
December 29, 2018
and
$23 million
at
December 30, 2017
. At
December 29, 2018
, collateral of
$32 million
was posted related to commodity derivative margin requirements. This was included in other current assets on our consolidated balance sheet at
December 29, 2018
.
Level 1 financial assets and liabilities consist of commodity future and options contracts and are valued using quoted prices in active markets for identical assets and liabilities.
117
Level 2 financial assets and liabilities consist of commodity swaps, foreign exchange forwards, options, and swaps, and cross-currency swaps. Commodity swaps are valued using an income approach based on the observable market commodity index prices less the contract rate multiplied by the notional amount. Foreign exchange forwards and swaps are valued using an income approach based on observable market forward rates less the contract rate multiplied by the notional amount. Foreign exchange options are valued using an income approach based on a Black-Scholes-Merton formula. This formula uses present value techniques and reflects the time value and intrinsic value based on observable market rates. Cross-currency swaps are valued based on observable market spot and swap rates.
We did not have any Level 3 financial assets or liabilities in any period presented.
Our calculation of the fair value of financial instruments takes into consideration the risk of nonperformance, including counterparty credit risk.
Net Investment Hedging:
At
December 29, 2018
, we had the following items designated as net investment hedges:
|
•
|
Non-derivative foreign denominated debt with principal amounts of
€2,550 million
and
£400 million
;
|
|
•
|
Cross-currency contracts with notional amounts of
£1.0 billion
(
$1.4 billion
),
C$2.1 billion
(
$1.6 billion
), and
¥9.6 billion
(
$85 million
); and
|
|
•
|
Foreign exchange contracts, including contracts denominated in:
|
|
◦
|
Chinese renminbi with an aggregate notional amount of
$127 million
,
|
|
◦
|
Euros with an aggregate notional amount of
$264 million
, and
|
|
◦
|
Indian rupees with an aggregate notional amount of
$279 million
.
|
The component of the gains and losses on our net investment in these designated foreign operations, driven by changes in foreign exchange rates, are economically offset by fair value movements on the effective portion of our cross-currency contracts and foreign exchange contracts and remeasurements of our foreign denominated debt.
Interest Rate Hedging:
From time to time we have had derivatives designated as interest rate hedges, including interest rate swaps. We no longer have any outstanding interest rate swaps. We continue to amortize the realized hedge losses that were deferred into accumulated other comprehensive income/(losses) into interest expense through the original maturity of the related long-term debt instruments.
Cash Flow Hedge Coverage:
At
December 29, 2018
, we had entered into foreign exchange contracts designated as cash flow hedges for periods not exceeding the next
12
months and into cross-currency contracts designated as cash flow hedges for periods not exceeding the next
five
years.
Deferred Hedging Gains and Losses on Cash Flow Hedges:
Based on our valuation at
December 29, 2018
and assuming market rates remain constant through contract maturities, we expect transfers to net income/(loss) of unrealized gains for foreign currency cash flow hedges during the next 12 months to be approximately
$32 million
. Additionally, we expect transfers to net income/(loss) of unrealized losses for interest rate cash flow hedges and cross-currency cash flow hedges during the next 12 months to be insignificant.
Concentration of Credit Risk:
Counterparties to our foreign exchange derivatives consist of major international financial institutions. We continually monitor our positions and the credit ratings of the counterparties involved and, by policy, limit the amount of our credit exposure to any one party. While we may be exposed to potential losses due to the credit risk of non-performance by these counterparties, losses are not anticipated. We closely monitor the credit risk associated with our counterparties and customers and to date have not experienced material losses.
Economic Hedging:
We enter into certain derivative contracts not designated as hedging instruments in accordance with our risk management strategy which have an economic impact of largely mitigating commodity price risk and foreign currency exposures. Gains and losses are recorded in net income/(loss) as a component of cost of products sold for our commodity contracts and other expense/(income), net for our cross currency and foreign exchange contracts.
118
Divestiture Hedging:
We entered into foreign exchange derivative contracts to economically hedge the foreign currency exposure related to the Heinz India Transaction. The related derivative losses were
$20 million
, including
$17 million
recorded within other expense/(income), net, and
$3 million
recorded within interest expense for the year ended December 29, 2018. These losses are classified as other losses/(gains) related to acquisitions and divestitures. Additionally, we entered into foreign exchange contracts, which are designated as net investment hedges related to our investment in Heinz India. Related to these net investment hedges, we had unrealized hedge losses of
$10 million
, which were recognized in accumulated other comprehensive income/(losses).
See Note 5,
Acquisitions and Divestitures
, for additional information related to the Heinz India Transaction.
Derivative Impact on the Statements of Comprehensive Income:
The following table presents the pre-tax amounts of derivative gains/(losses) deferred into accumulated other comprehensive income/(losses) and the income statement line item that will be affected when reclassified to net income/(loss) (in millions):
|
Accumulated Other Comprehensive Income/(Losses) Component
|
Gains/(Losses) Recognized in Other Comprehensive Income/(Losses) Related to Derivatives Designated as Hedging Instruments
|
Location of Gains/(Losses) When Reclassified to Net Income/(Loss)
|
||||||||||||
|
December 29,
2018 |
December 30,
2017 |
December 31,
2016 |
||||||||||||
|
Cash flow hedges:
|
||||||||||||||
|
Foreign exchange contracts
|
$
|
—
|
|
$
|
1
|
|
$
|
3
|
|
Net sales
|
||||
|
Foreign exchange contracts
|
64
|
|
(42
|
)
|
6
|
|
Cost of products sold
|
|||||||
|
Foreign exchange contracts (excluded component)
|
(2
|
)
|
—
|
|
—
|
|
Cost of products sold
|
|||||||
|
Foreign exchange contracts
|
56
|
|
(82
|
)
|
39
|
|
Other expense/(income), net
|
|||||||
|
Foreign exchange contracts (excluded component)
|
3
|
|
—
|
|
—
|
|
Other expense/(income), net
|
|||||||
|
Interest rate contracts
|
—
|
|
—
|
|
(8
|
)
|
Interest expense
|
|||||||
|
Cross-currency contracts
|
(4
|
)
|
—
|
|
—
|
|
Other expense/(income), net
|
|||||||
|
Cross-currency contracts (excluded component)
|
1
|
|
—
|
|
—
|
|
Other expense/(income), net
|
|||||||
|
Net investment hedges:
|
||||||||||||||
|
Foreign exchange contracts
|
(11
|
)
|
(23
|
)
|
45
|
|
SG&A
|
|||||||
|
Foreign exchange contracts (excluded component)
|
(3
|
)
|
—
|
|
—
|
|
Interest expense
|
|||||||
|
Cross-currency contracts
|
214
|
|
(184
|
)
|
147
|
|
SG&A
|
|||||||
|
Cross-currency contracts (excluded component)
|
13
|
|
—
|
|
—
|
|
Interest expense
|
|||||||
|
Total gains/(losses) recognized in statements of comprehensive income
|
$
|
331
|
|
$
|
(330
|
)
|
$
|
232
|
|
|||||
119
Derivative Impact on the Statements of Income:
The following tables present the pre-tax amounts of derivative gains/(losses) reclassified from accumulated other comprehensive income/(losses) to net income/(loss) and the affected income statement line items (in millions):
|
December 29,
2018 |
|||||||||||
|
Cost of products sold
|
Interest expense
|
Other expense/ (income), net
|
|||||||||
|
Total amounts presented in the consolidated statements of income in which the following effects were recorded
|
$
|
17,347
|
|
$
|
1,284
|
|
$
|
(183
|
)
|
||
|
Gains/(losses) related to derivatives designated as hedging instruments:
|
|||||||||||
|
Cash flow hedges:
|
|||||||||||
|
Foreign exchange contracts
|
$
|
(2
|
)
|
$
|
—
|
|
$
|
56
|
|
||
|
Foreign exchange contracts (excluded component)
|
(2
|
)
|
—
|
|
3
|
|
|||||
|
Interest rate contracts
|
—
|
|
(4
|
)
|
—
|
|
|||||
|
Cross-currency contracts
|
—
|
|
—
|
|
(7
|
)
|
|||||
|
Cross-currency contracts (excluded component)
|
—
|
|
—
|
|
1
|
|
|||||
|
Net investment hedges:
|
|||||||||||
|
Foreign exchange contracts (excluded component)
|
—
|
|
(3
|
)
|
—
|
|
|||||
|
Cross-currency contracts (excluded component)
|
—
|
|
13
|
|
—
|
|
|||||
|
Gains/(losses) related to derivatives not designated as hedging instruments:
|
|||||||||||
|
Commodity contracts
|
(44
|
)
|
—
|
|
—
|
|
|||||
|
Foreign exchange contracts
|
—
|
|
—
|
|
(84
|
)
|
|||||
|
Cross-currency contracts
|
—
|
|
—
|
|
4
|
|
|||||
|
Total gains/(losses) recognized in statements of income
|
$
|
(48
|
)
|
$
|
6
|
|
$
|
(27
|
)
|
||
|
December 30,
2017 |
December 31,
2016 |
||||||||||||||||||||||||||
|
Cost of products sold
|
Interest expense
|
Other expense/ (income), net
|
Net sales
|
Cost of products sold
|
Interest expense
|
Other expense/ (income), net
|
|||||||||||||||||||||
|
Total amounts presented in the consolidated statements of income in which the following effects were recorded (As Restated & Recast)
|
$
|
17,043
|
|
$
|
1,234
|
|
$
|
(627
|
)
|
$
|
26,300
|
|
$
|
17,154
|
|
$
|
1,134
|
|
$
|
(472
|
)
|
||||||
|
Gains/(losses) related to derivatives designated as hedging instruments:
|
|||||||||||||||||||||||||||
|
Cash flow hedges:
|
|||||||||||||||||||||||||||
|
Foreign exchange contracts
|
$
|
—
|
|
$
|
—
|
|
$
|
(81
|
)
|
$
|
6
|
|
$
|
41
|
|
$
|
—
|
|
$
|
38
|
|
||||||
|
Interest rate contracts
|
—
|
|
(4
|
)
|
—
|
|
—
|
|
—
|
|
(4
|
)
|
—
|
|
|||||||||||||
|
Gains/(losses) related to derivatives not designated as hedging instruments:
|
|||||||||||||||||||||||||||
|
Commodity contracts
|
(37
|
)
|
—
|
|
—
|
|
—
|
|
9
|
|
—
|
|
—
|
|
|||||||||||||
|
Foreign exchange contracts
|
—
|
|
—
|
|
54
|
|
—
|
|
—
|
|
—
|
|
(63
|
)
|
|||||||||||||
|
Cross-currency contracts
|
—
|
|
—
|
|
(2
|
)
|
—
|
|
—
|
|
—
|
|
(3
|
)
|
|||||||||||||
|
Total gains/(losses) recognized in statements of income
|
$
|
(37
|
)
|
$
|
(4
|
)
|
$
|
(29
|
)
|
$
|
6
|
|
$
|
50
|
|
$
|
(4
|
)
|
$
|
(28
|
)
|
||||||
Non-Derivative Impact on Statements of Comprehensive Income:
Related to our non-derivative, foreign denominated debt instruments designated as net investment hedges, we recognized pre-tax gains of
$174 million
in 2018, pre-tax losses of
$425 million
in 2017, and pre-tax gains of
$234 million
in 2016. These amounts were recognized in other comprehensive income/(loss).
120
Note 15. Accumulated Other Comprehensive Income/(Losses)
Certain prior period balances herein reflect the restatements described in Note 2,
Restatement of Previously Issued Consolidated Financial Statements
.
The components of, and changes in, accumulated other comprehensive income/(losses), net of tax, were as follows (in millions):
|
Foreign Currency Translation Adjustments
|
Net Postemployment Benefit Plan Adjustments
|
Net Cash Flow Hedge Adjustments
|
Total
|
||||||||||||
|
Balance as of January 3, 2016 (As Restated)
|
$
|
(1,654
|
)
|
$
|
985
|
|
$
|
53
|
|
$
|
(616
|
)
|
|||
|
Foreign currency translation adjustments
|
(985
|
)
|
—
|
|
—
|
|
(985
|
)
|
|||||||
|
Net deferred gains/(losses) on net investment hedges
|
226
|
|
—
|
|
—
|
|
226
|
|
|||||||
|
Net deferred gains/(losses) on cash flow hedges
|
—
|
|
—
|
|
46
|
|
46
|
|
|||||||
|
Net deferred losses/(gains) on cash flow hedges reclassified to net income/(loss)
|
—
|
|
—
|
|
(87
|
)
|
(87
|
)
|
|||||||
|
Net postemployment benefit gains/(losses) arising during the period
|
—
|
|
(9
|
)
|
—
|
|
(9
|
)
|
|||||||
|
Net postemployment benefit losses/(gains) reclassified to net income/(loss)
|
—
|
|
(204
|
)
|
—
|
|
(204
|
)
|
|||||||
|
Total other comprehensive income/(loss)
|
(759
|
)
|
(213
|
)
|
(41
|
)
|
(1,013
|
)
|
|||||||
|
Balance as of December 31, 2016
(As Restated)
|
(2,413
|
)
|
772
|
|
12
|
|
(1,629
|
)
|
|||||||
|
Foreign currency translation adjustments
|
1,179
|
|
—
|
|
—
|
|
1,179
|
|
|||||||
|
Net deferred gains/(losses) on net investment hedges
|
(353
|
)
|
—
|
|
—
|
|
(353
|
)
|
|||||||
|
Net deferred gains/(losses) on cash flow hedges
|
—
|
|
—
|
|
(113
|
)
|
(113
|
)
|
|||||||
|
Net deferred losses/(gains) on cash flow hedges reclassified to net income/(loss)
|
—
|
|
—
|
|
85
|
|
85
|
|
|||||||
|
Net postemployment benefit gains/(losses) arising during the period
|
—
|
|
86
|
|
—
|
|
86
|
|
|||||||
|
Net postemployment benefit losses/(gains) reclassified to net income/(loss)
|
—
|
|
(309
|
)
|
—
|
|
(309
|
)
|
|||||||
|
Total other comprehensive income/(loss)
|
826
|
|
(223
|
)
|
(28
|
)
|
575
|
|
|||||||
|
Balance as of December 30, 2017
(As Restated)
|
(1,587
|
)
|
549
|
|
(16
|
)
|
(1,054
|
)
|
|||||||
|
Foreign currency translation adjustments
|
(1,173
|
)
|
—
|
|
—
|
|
(1,173
|
)
|
|||||||
|
Net deferred gains/(losses) on net investment hedges
|
284
|
|
—
|
|
—
|
|
284
|
|
|||||||
|
Amounts excluded from the effectiveness assessment of net investment hedges
|
7
|
|
—
|
|
—
|
|
7
|
|
|||||||
|
Net deferred losses/(gains) on net investment hedges reclassified to net income/(loss)
|
(7
|
)
|
—
|
|
—
|
|
(7
|
)
|
|||||||
|
Net deferred gains/(losses) on cash flow hedges
|
—
|
|
—
|
|
99
|
|
99
|
|
|||||||
|
Amounts excluded from the effectiveness assessment of cash flow hedges
|
—
|
|
—
|
|
2
|
|
2
|
|
|||||||
|
Net deferred losses/(gains) on cash flow hedges reclassified to net income/(loss)
|
—
|
|
—
|
|
(44
|
)
|
(44
|
)
|
|||||||
|
Net postemployment benefit gains/(losses) arising during the period
|
—
|
|
61
|
|
—
|
|
61
|
|
|||||||
|
Net postemployment benefit losses/(gains) reclassified to net income/(loss)
|
—
|
|
(118
|
)
|
—
|
|
(118
|
)
|
|||||||
|
Total other comprehensive income/(loss)
|
(889
|
)
|
(57
|
)
|
57
|
|
(889
|
)
|
|||||||
|
Balance as of December 29, 2018
|
$
|
(2,476
|
)
|
$
|
492
|
|
$
|
41
|
|
$
|
(1,943
|
)
|
|||
Reclassification of net postemployment benefit losses/(gains) included amounts reclassified to net income and amounts reclassified into inventory (consistent with our capitalization policy).
121
The gross amount and related tax benefit/(expense) recorded in, and associated with, each component of other comprehensive income/(loss) were as follows (in millions):
|
As Restated
|
|||||||||||||||||||||||||||||||||||
|
December 29,
2018 |
December 30,
2017 |
December 31,
2016 |
|||||||||||||||||||||||||||||||||
|
Before Tax Amount
|
Tax
|
Net of Tax Amount
|
Before Tax Amount
|
Tax
|
Net of Tax Amount
|
Before Tax Amount
|
Tax
|
Net of Tax Amount
|
|||||||||||||||||||||||||||
|
Foreign currency translation adjustments
|
$
|
(1,173
|
)
|
$
|
—
|
|
$
|
(1,173
|
)
|
$
|
1,179
|
|
$
|
—
|
|
$
|
1,179
|
|
$
|
(985
|
)
|
$
|
—
|
|
$
|
(985
|
)
|
||||||||
|
Net deferred gains/(losses) on net investment hedges
|
377
|
|
(93
|
)
|
284
|
|
(632
|
)
|
279
|
|
(353
|
)
|
426
|
|
(200
|
)
|
226
|
|
|||||||||||||||||
|
Amounts excluded from the effectiveness assessment of net investment hedges
|
10
|
|
(3
|
)
|
7
|
|
—
|
|
—
|
|
—
|
|
—
|
|
—
|
|
—
|
|
|||||||||||||||||
|
Net deferred losses/(gains) on net investment hedges reclassified to net income/(loss)
|
(10
|
)
|
3
|
|
(7
|
)
|
—
|
|
—
|
|
—
|
|
—
|
|
—
|
|
—
|
|
|||||||||||||||||
|
Net deferred gains/(losses) on cash flow hedges
|
116
|
|
(17
|
)
|
99
|
|
(123
|
)
|
10
|
|
(113
|
)
|
40
|
|
6
|
|
46
|
|
|||||||||||||||||
|
Amounts excluded from the effectiveness assessment of cash flow hedges
|
2
|
|
—
|
|
2
|
|
—
|
|
—
|
|
—
|
|
—
|
|
—
|
|
—
|
|
|||||||||||||||||
|
Net deferred losses/(gains) on cash flow hedges reclassified to net income/(loss)
|
(45
|
)
|
1
|
|
(44
|
)
|
85
|
|
—
|
|
85
|
|
(81
|
)
|
(6
|
)
|
(87
|
)
|
|||||||||||||||||
|
Net actuarial gains/(losses) arising during the period
|
74
|
|
(16
|
)
|
58
|
|
116
|
|
(47
|
)
|
69
|
|
(78
|
)
|
38
|
|
(40
|
)
|
|||||||||||||||||
|
Prior service credits/(costs) arising during the period
|
6
|
|
(3
|
)
|
3
|
|
25
|
|
(8
|
)
|
17
|
|
51
|
|
(20
|
)
|
31
|
|
|||||||||||||||||
|
Net postemployment benefit losses/(gains) reclassified to net income/(loss)
|
(156
|
)
|
38
|
|
(118
|
)
|
(502
|
)
|
193
|
|
(309
|
)
|
(331
|
)
|
127
|
|
(204
|
)
|
|||||||||||||||||
122
The amounts reclassified from accumulated other comprehensive income/(losses) were as follows (in millions):
|
Accumulated Other Comprehensive Income/(Losses) Component
|
Reclassified from Accumulated Other Comprehensive Income/(Losses) to Net Income/(Loss)
|
Affected Line Item in the Statements of Income
|
||||||||||||
|
As Restated
|
||||||||||||||
|
December 29,
2018 |
December 30,
2017 |
December 31,
2016 |
||||||||||||
|
Losses/(gains) on net investment hedges:
|
||||||||||||||
|
Foreign exchange contracts
(a)
|
$
|
3
|
|
$
|
—
|
|
$
|
—
|
|
Interest expense
|
||||
|
Cross-currency contracts
(a)
|
(13
|
)
|
—
|
|
—
|
|
Interest expense
|
|||||||
|
Losses/(gains) on cash flow hedges:
|
|
|||||||||||||
|
Foreign exchange contracts
(b)
|
—
|
|
—
|
|
(6
|
)
|
Net sales
|
|||||||
|
Foreign exchange contracts
(b)
|
4
|
|
—
|
|
(41
|
)
|
Cost of products sold
|
|||||||
|
Foreign exchange contracts
(b)
|
(59
|
)
|
81
|
|
(38
|
)
|
Other expense/(income), net
|
|||||||
|
Cross-currency contracts
(a)
|
6
|
|
—
|
|
—
|
|
Other expense/(income), net
|
|||||||
|
Interest rate contracts
(c)
|
4
|
|
4
|
|
4
|
|
Interest expense
|
|||||||
|
Losses/(gains) on hedges before income taxes
|
(55
|
)
|
85
|
|
(81
|
)
|
||||||||
|
Losses/(gains) on hedges, income taxes
|
4
|
|
—
|
|
(6
|
)
|
||||||||
|
Losses/(gains) on hedges
|
$
|
(51
|
)
|
$
|
85
|
|
$
|
(87
|
)
|
|||||
|
Losses/(gains) on postemployment benefits:
|
|
|||||||||||||
|
Amortization of unrecognized losses/(gains)
|
$
|
2
|
|
$
|
1
|
|
$
|
(1
|
)
|
(d)
|
||||
|
Amortization of prior service costs/(credits)
|
(311
|
)
|
(328
|
)
|
(355
|
)
|
(d)
|
|||||||
|
Settlement and curtailment losses/(gains)
|
153
|
|
(175
|
)
|
25
|
|
(d)
|
|||||||
|
Losses/(gains) on postemployment benefits before income taxes
|
(156
|
)
|
(502
|
)
|
(331
|
)
|
||||||||
|
Losses/(gains) on postemployment benefits, income taxes
|
38
|
|
193
|
|
127
|
|
||||||||
|
Losses/(gains) on postemployment benefits
|
$
|
(118
|
)
|
$
|
(309
|
)
|
$
|
(204
|
)
|
|||||
|
(a)
|
Represents recognition of the excluded component in net income/(loss).
|
|
(b)
|
Includes amortization of the excluded component and the effective portion of the related hedges.
|
|
(c)
|
Represents amortization of realized hedge losses that were deferred into accumulated other comprehensive income/(losses) through the maturity of the related long-term debt instruments.
|
|
(d)
|
These components are included in the computation of net periodic postemployment benefit costs. See Note 13,
Postemployment Benefits
, for additional information.
|
In this note we have excluded activity and balances related to noncontrolling interest due to its insignificance. This activity was primarily related to foreign currency translation adjustments.
Note 16. Venezuela - Foreign Currency and Inflation
We have a subsidiary in Venezuela that manufactures and sells a variety of products, primarily in the condiments and sauces and infant and nutrition categories.
We apply highly inflationary accounting to the results of our Venezuelan subsidiary and include these results in our consolidated financial statements. Under highly inflationary accounting, the functional currency of our Venezuelan subsidiary is the U.S. dollar (the reporting currency of Kraft Heinz), although the majority of its transactions are in Venezuelan bolivars. As a result, we must revalue the results of our Venezuelan subsidiary to U.S. dollars. We revalue the income statement using daily weighted average DICOM (as defined below) rates, and we revalue the bolivar denominated monetary assets and liabilities at the period-end DICOM spot rate. The resulting revaluation gains and losses are recorded in current net income/(loss), rather than accumulated other comprehensive income/(losses). These gains and losses are classified within other expense/(income), net as nonmonetary currency devaluation on our consolidated statements of income.
In February 2018, the Venezuelan government eliminated the official exchange rate, which was available through the Sistema de Divisa Protegida (“DIPRO”) for purchases and sales of certain essential items, including food products. At
December 30, 2017
, we had outstanding invoice reimbursement requests of
$26 million
related to the purchase of ingredients and packaging materials for the years 2012 through 2015. Following the elimination of this preferential rate, we determined that these outstanding requests, which were approved by the Venezuelan government, were no longer collectible. There was no impact on our consolidated statements of income for 2018.
123
Following elimination of the DIPRO rate, the Sistema de Divisa Complementaria (“DICOM”) is the only foreign currency exchange mechanism legally available to us for converting Venezuelan bolivars to U.S. dollars. As of
December 29, 2018
, we believe the DICOM rate is the most appropriate legally available rate at which to translate the results of our Venezuelan subsidiary. We continue to monitor the DICOM rate, and the nonmonetary assets supported by the underlying operations in Venezuela, for impairment.
The auction-based DICOM system was temporarily frozen in September 2017 and reopened in February 2018. The last published DICOM rate before the auction freeze was BsF
3,345
per U.S. dollar compared to BsF
25,000
per U.S. dollar upon reopening. In August 2018, the Venezuelan government changed the unit for measuring bolivars from the bolivar fuerte (“BsF”) to the bolivar soberano (“BsS”). The conversion ratio is BsF
100,000
to BsS
1
. Upon converting to the bolivar soberano measurement unit, the Venezuelan government further devalued the currency. On August 20, 2018, the published DICOM rate was BsF
6,000,000
(BsS
60.00
) per U.S. dollar compared to approximately BsF
249,000
(BsS
2.49
) per U.S. dollar immediately preceding the conversion to BsS.
The DICOM rate at December 29, 2018 was BsS
638.18
per U.S. dollar compared to BsS
0.03
at
December 30, 2017
. We remeasured the bolivar denominated assets and liabilities of our Venezuelan subsidiary at December 29, 2018 using the DICOM spot rate of BsS
638.18
per U.S. dollar.
We remeasured the income statements of our Venezuelan subsidiary using a weighted average rate of BsS
25.06
in 2018, BsS
0.02
in 2017, and BsS
0.01
in 2016.
Remeasurements of the monetary assets and liabilities and operating results of our Venezuelan subsidiary at DICOM rates resulted in nonmonetary currency devaluation losses of
$146 million
in 2018,
$36 million
in 2017, and
$24 million
in 2016. These losses were recorded in other expense/(income), net in the consolidated statements of income.
Additionally, in the second quarter of 2016, we assessed the nonmonetary assets of our Venezuelan subsidiary for impairment, resulting in a
$53 million
loss to write down property, plant and equipment, net, and prepaid spare parts, which was recorded within cost of products sold in the consolidated statement of income in 2016.
We did not obtain any U.S. dollars at DICOM rates during 2018
. In addition to DICOM, there is an unofficial market for obtaining U.S. dollars with Venezuelan bolivars. The exact exchange rate is widely debated but is generally accepted to be substantially higher than the latest published DICOM rate. We have not transacted at any unofficial market rates and have no plans to transact at unofficial market rates in the foreseeable future.
Our Venezuelan subsidiary obtains U.S. dollars through exports and royalty payments. These U.S. dollars are primarily used for purchases of tomato paste and spare parts for manufacturing, as well as a limited amount of other operating costs.
As of
December 29, 2018
,
our Venezuelan subsidiary has sufficient U.S. dollars to fund these operational needs in the foreseeable future. However, further deterioration of the economic environment or regulation changes could jeopardize our export business. Our Venezuelan subsidiary has increasingly sourced production inputs locally, including tomato paste and sugar, in order to reduce reliance on U.S. dollars, which we expect to continue in the foreseeable future.
Our results of operations in Venezuela reflect a controlled subsidiary. We continue to have sufficient currency liquidity and pricing flexibility to control our operations. However, the continuing economic uncertainty, strict labor laws, and evolving government controls over imports, prices, currency exchange, and payments present a challenging operating environment. Increased restrictions imposed by the Venezuelan government or further deterioration of the economic environment could impact our ability to control our Venezuelan operations and could lead us to deconsolidate our Venezuelan subsidiary in the future. We currently do not expect to make any new investments or contributions into Venezuela.
Note 17. Financing Arrangements
We have utilized accounts receivable securitization and factoring programs (the “Programs”) globally for our working capital needs and to provide efficient liquidity.
During 2018, we had Programs in place in various countries across the globe.
In the second quarter of 2018, we unwound our U.S. securitization program, which represented the majority of our Programs, using proceeds from the issuance of long-term debt in June 2018.
As of
December 29, 2018
, we have unwound all of our Programs.
We operated the Programs such that we generally utilized the majority of the available aggregate cash consideration limits. We accounted for transfers of receivables pursuant to the Programs as a sale and removed them from our consolidated balance sheets. Under the Programs, we generally received cash consideration up to a certain limit and recorded a non-cash exchange for sold receivables for the remainder of the purchase price. We maintained a “beneficial interest,” or a right to collect cash, in the sold receivables. Cash receipts from the payments on sold receivables (which are cash receipts on the underlying trade receivables that have already been securitized in these Programs) are classified as investing activities and presented as cash receipts on sold receivables on our consolidated statements of cash flows.
124
The carrying value of trade receivables removed from our consolidated balance sheets in connection with the Programs was
$1.0 billion
at
December 30, 2017
. In exchange for the sale of trade receivables, we received cash of
$673 million
at
December 30, 2017
and recorded sold receivables of
$353 million
at
December 30, 2017
. There were
no
such balances at
December 29, 2018
. The carrying value of sold receivables approximated the fair value at
December 30, 2017
.
We acted as servicer for certain of the Programs. We did not record any related servicing assets or liabilities as of
December 30, 2017
because they were not material to the financial statements.
Our U.S. securitization program utilized a bankruptcy-remote special-purpose entity (“SPE”). The SPE was wholly-owned by a subsidiary of Kraft Heinz, and its sole business consisted of the purchase or acceptance, through capital contributions, of receivables and related assets from a Kraft Heinz subsidiary and the subsequent transfer of such receivables and related assets to a bank. Although the SPE is included in our consolidated financial statements, it was a separate legal entity with separate creditors who were entitled, upon its liquidation in the second quarter of 2018, to be satisfied out of the SPE's assets prior to any assets or value in the SPE becoming available to Kraft Heinz or its subsidiaries.
Additionally, we enter into various structured payable and product financing arrangements to facilitate supply from our vendors. Balance sheet classification is based on the nature of the agreements. For certain arrangements, we classify amounts outstanding within other current liabilities on our consolidated balance sheets. We had approximately
$267 million
on our consolidated balance sheets at
December 29, 2018
and approximately
$268 million
at
December 30, 2017
related to these arrangements.
Note 18. Commitments and Contingencies
Legal Proceedings
We are involved in legal proceedings, claims, and governmental inquiries, inspections, or investigations (“Legal Matters”) arising in the ordinary course of our business.
While we cannot predict with certainty the results of Legal Matters in which we are currently involved or may in the future be involved, we do not expect that the ultimate costs to resolve any of the Legal Matters that are currently pending will have a material adverse effect on our financial condition or results of operations.
Class Actions and Stockholder Derivative Actions:
We and certain of our current and former officers and directors are currently defendants in
three
securities class action lawsuits filed in February, March, and April 2019. The first filed action,
Hedick v. The Kraft Heinz Company
, was filed on February 24, 2019 against the Company and
three
of its officers (the “Hedick Action”). The second filed action,
Iron Workers District Council (Philadelphia and Vicinity) Retirement and Pension Plan v. The Kraft Heinz Company
, was filed on March 15, 2019 against, among others, the Company and
six
of its current and former officers (the “Iron Workers Action”). The third filed action,
Timber Hill LLC v. The Kraft Heinz Company
, was filed on April 25, 2019 against, among others, the Company and
six
of its current and former officers and
one
of its directors (the “Timber Hill Action”). All of these securities class action lawsuits were filed in the United States District Court for the Northern District of Illinois. Another securities class action lawsuit,
Walling v. Kraft Heinz Company
, was filed on February 26, 2019 in the United States District Court for the Western District of Pennsylvania against, among others, the Company and
six
of its current and former officers (the “Walling Action”). Plaintiff in the Walling Action filed a notice of voluntary dismissal of his complaint, without prejudice, on April 26, 2019.
Plaintiffs in these lawsuits purport to represent a class of all individuals and entities who purchased, sold, or otherwise acquired or disposed of publicly traded securities of the Company (including in the Timber Hill Action, the purchase of call options on Company common stock, the sale of put options on Company common stock, and the purchase of futures on the Company’s common stock) from May 4, 2017 through February 21, 2019, in the case of the Hedick Action and the Walling Action, and from July 6, 2015 through February 21, 2019, in the case of the Iron Workers Action and the Timber Hill Action. The complaints assert claims under Sections 10(b) and 20(a) of the Securities Exchange Act of 1934, as amended (the “Exchange Act”), and Rule 10b-5 promulgated thereunder, based on allegedly materially false or misleading statements and omissions in public statements, press releases, investor presentations, earnings calls, and SEC filings regarding the Company’s business, financial results, and internal controls. The plaintiffs seek damages in an unspecified amount, attorneys’ fees and other relief.
125
In addition, our Employee Benefits Administration Board and certain of our current and former employees are currently defendants in
one
class action lawsuit,
Osborne v. Employee Benefits Administration Board of Kraft Heinz
, which was filed on March 19, 2019 in the United States District Court for the Western District of Pennsylvania. Plaintiffs in the lawsuit purport to represent a class of current and former employees who were participants in and beneficiaries of various retirement plans which were co-invested in a commingled investment fund known as the Kraft Foods Savings Plan Master Trust (the “Master Trust”) during the period of May 4, 2017 through February 21, 2019. The complaint alleges violations of Section 502 of the Employee Retirement Income Security Act (“ERISA”) based on alleged breaches of obligations as fiduciaries subject to ERISA by allowing the Master Trust to continue investing in our common stock. The plaintiffs seek damages in an unspecified amount, attorneys’ fees, and other relief.
Certain of our current and former officers and directors, among others, are also currently defendants in
five
stockholder derivative actions:
DeFabiis v. Hees
filed on April 16, 2019,
Vladimir Gusinsky Revocable Trust
v. Hees
filed on May 8, 2019,
Kailas v. Hees
filed on May 13, 2019,
Silverman v. Behring
filed on May 15, 2019, and
Green v. Behring
filed on May 23, 2019, with the Company named as a nominal defendant. Plaintiffs, derivatively on behalf of the Company, assert claims under the common law and statutory law of Delaware for alleged breaches of fiduciary duties as well as alleged violations of Sections 10(b) and 14(a) of the Exchange Act and Rule 10b-5 promulgated thereunder, based on allegedly materially false or misleading statements and omissions in public statements and SEC filings. The plaintiffs seek damages in an unspecific amount, attorneys’ fees, and other relief. All of these stockholder derivative actions were filed in the United States District Court for the Western District of Pennsylvania.
We intend to vigorously defend against these lawsuits; however, we cannot reasonably estimate the potential range of loss, if any, due to the early stage of these proceedings.
Securities and Exchange Commission Investigation:
As previously disclosed on February 21, 2019, we received a subpoena in October 2018 from the SEC related to our procurement area, specifically the accounting policies, procedures, and internal controls related to our procurement function, including, but not limited to, agreements, side agreements, and changes or modifications to agreements with our suppliers. Following the receipt of this subpoena, we, together with external counsel and forensic accountants, and subsequently, under the oversight of the Audit Committee, conducted an internal investigation into our procurement area and related matters. Following our earnings release and investor call on February 21, 2019, when we announced the results of our interim assessment of goodwill and intangible asset impairments, the SEC requested additional information related to our financial reporting, internal controls, and disclosures, our assessment of goodwill and intangible asset impairments, and our communications with certain shareholders. It is our understanding that the United States Attorney’s Office for the Northern District of Illinois also is reviewing this matter, working with the SEC and receiving materials from it.
We cannot predict the eventual scope, duration or outcome of any potential SEC legal action or other action or whether it could have a material impact on our financial condition, results of operations, or cash flow. We have been responsive to the ongoing subpoenas and other document requests and will continue to cooperate fully with any governmental or regulatory inquiries or investigations.
Other Commitments and Contingencies
As a result of our review of supplier contracts and related arrangements,
we determined that the classification of the embedded lease element for certain contracts should have been classified as an operating lease instead of a capital lease. In addition, we identified certain arrangements that were improperly accounted for as embedded capital leases.
Therefore, future obligations associated with operating leases and purchase obligations have been restated below. See Note 2,
Restatement of Previously Issued Consolidated Financial Statements
, for additional information related to the restatement and our review of supplier contracts and related arrangements.
Leases:
Rental expenses for leases of warehouse, production, and office facilities and equipment were
$200 million
in 2018,
$244 million
in 2017, and
$198 million
in 2016.
Minimum rental commitments under non-cancelable operating leases in effect at
December 29, 2018
were (in millions):
|
2019
|
$
|
185
|
|
|
2020
|
137
|
|
|
|
2021
|
105
|
|
|
|
2022
|
70
|
|
|
|
2023
|
49
|
|
|
|
Thereafter
|
148
|
|
|
|
Total
|
$
|
694
|
|
126
Purchase Obligations:
We have purchase obligations for materials, supplies, property, plant and equipment, and co-packing, storage, and distribution services based on projected needs to be utilized in the normal course of business. Other purchase obligations include commitments for marketing, advertising, capital expenditures, information technology, and professional services.
As of
December 29, 2018
, our take-or-pay purchase obligations were as follows (in millions):
|
2019
|
$
|
1,569
|
|
|
2020
|
757
|
|
|
|
2021
|
405
|
|
|
|
2022
|
287
|
|
|
|
2023
|
210
|
|
|
|
Thereafter
|
217
|
|
|
|
Total
|
$
|
3,445
|
|
Redeemable Noncontrolling Interest:
In 2017, we commenced operations of a joint venture with a minority partner to manufacture, package, market, and distribute refrigerated soups and meal sides. We control operations and include this business in our consolidated results. Our minority partner has put options that, if it chooses to exercise, would require us to purchase portions of its equity interest at a future date. These put options will become exercisable beginning in 2025 (on the eighth anniversary of the product launch date) at a price to be determined at that time based upon an independent third party valuation. The minority partner’s put options are reflected on our consolidated balance sheets as a redeemable noncontrolling interest. We accrete the redeemable noncontrolling interest to its estimated redemption value over the term of the put options. At
December 29, 2018
, we estimate the redemption value to be approximately
$35 million
.
Note 19. Debt
Borrowing Arrangements:
On July 6, 2015, together with Kraft Heinz Foods Company (“KHFC”), our 100% owned operating subsidiary, we entered into a credit agreement (as amended, the “Credit Agreement”), which provides for a
$4.0 billion
senior unsecured revolving credit facility (the “Senior Credit Facility”).
In June 2018, we entered into an agreement that became effective on July 6, 2018 to extend the maturity date of our Senior Credit Facility from July 6, 2021 to July 6, 2023 and to establish a
$400 million
euro equivalent swing line facility, which is available under the
$4.0 billion
revolving credit facility limit for short-term loans denominated in euros on a same-day basis.
No
amounts were drawn on our Senior Credit Facility at
December 29, 2018
, at
December 30, 2017
, or during the years ended
December 29, 2018
,
December 30, 2017
, and
December 31, 2016
.
The Senior Credit Facility includes a
$1.0 billion
sub-limit for borrowings in alternative currencies (i.e., euro, sterling, Canadian dollars, or other lawful currencies readily available and freely transferable and convertible into U.S. dollars), as well as a letter of credit sub-facility of up to
$300 million
. Subject to certain conditions, we may increase the amount of revolving commitments and/or add additional tranches of term loans in a combined aggregate amount of up to
$1.0 billion
.
Any committed borrowings under the Senior Credit Facility bear interest at a variable annual rate based on LIBOR/EURIBOR/CDOR loans or an alternate base rate/Canadian prime rate, in each case subject to an applicable margin based upon the long-term senior unsecured, non-credit enhanced debt rating assigned to us. The borrowings under the Senior Credit Facility have interest rates based on, at our election, base rate, LIBOR, EURIBOR, CDOR, or Canadian prime rate plus a spread ranging from
87.5
to
175
basis points for LIBOR, EURIBOR, and CDOR loans, and
0
to
75
basis points for base rate or Canadian prime rate loans.
The Senior Credit Facility contains representations, warranties, and covenants that are typical for these types of facilities and could upon the occurrence of certain events of default restrict our ability to access our Senior Credit Facility. Our Senior Credit Facility requires us to maintain a minimum shareholders’ equity (excluding accumulated other comprehensive income/(losses)) of at least
$35 billion
. We were in compliance with all financial covenants during the year ended December 29, 2018.
During the period from December 29, 2018 to the filing date of this Annual Report on Form 10-K, due to the delays in the preparation of our financial statements for the fiscal year ended December 29, 2018 and the fiscal quarter ended March 30, 2019, we were not in compliance with certain reporting covenants under the Senior Credit Facility.
127
However, as previously disclosed, on March 22, 2019, we entered into a Waiver and Consent No. 1 (the “Original Waiver”) with respect to the Senior Credit Facility, pursuant to which the lenders party thereto and JPMorgan Chase Bank, N.A., as administrative agent, granted a temporary waiver of compliance by us with respect to the requirement to furnish the lenders a copy of the consolidated financial statements for our fiscal year ended December 29, 2018. Pursuant to the Original Waiver, we were required to provide consolidated financial statements no later than May 14, 2019. Due to additional delays in our financial reporting, on May 10, 2019, we entered into a Waiver and Consent No. 2 (the “Second Waiver”) with respect to the Senior Credit Facility, pursuant to which the lenders, as party to the Senior Credit Facility, and JPMorgan Chase Bank, N.A., as administrative agent, granted a temporary waiver of compliance by us with respect to the requirements to furnish the lenders copies of the consolidated financial statements for our fiscal year ended December 29, 2018 and for the fiscal quarter ended March 30, 2019. Pursuant to the Second Waiver and in order to remedy our noncompliance, we are required to provide consolidated financial statements for our fiscal year ended December 29, 2018 no later than June 28, 2019 and for our fiscal quarter ended March 30, 2019 no later than July 31, 2019. If we had not obtained these waivers, we would not have been able to access our Senior Credit Facility.
The obligations under the Credit Agreement are guaranteed by KHFC in the case of indebtedness and other liabilities of any subsidiary borrower and by Kraft Heinz in the case of indebtedness and other liabilities of any subsidiary borrower and KHFC.
In August 2017, we repaid
$600 million
aggregate principal amount of our previously outstanding senior unsecured loan facility (the “Term Loan Facility”). Accordingly, there were
no
amounts outstanding on the Term Loan Facility at
December 29, 2018
or
December 30, 2017
.
We obtain funding through our U.S. and European commercial paper programs. At
December 29, 2018
, we had
no
commercial paper outstanding. At
December 30, 2017
, we had commercial paper outstanding of
$448 million
with a weighted average interest rate of
1.541%
.
Long-Term Debt:
The following table summarizes our long-term debt obligations. Long-term debt at December 30, 2017 reflects the restatements described in Note 2,
Restatement of Previously Issued Consolidated Financial Statements
.
|
Priority
(a)
|
Maturity Dates
|
Interest Rates
(b)
|
Carrying Values
|
|||||||||||
|
As Restated
|
||||||||||||||
|
December 29, 2018
|
December 30, 2017
|
|||||||||||||
|
(in millions)
|
||||||||||||||
|
U.S. dollar notes:
|
||||||||||||||
|
2025 Notes
(c)
|
Senior Secured Notes
|
February 15, 2025
|
4.875%
|
$
|
1,193
|
|
$
|
1,192
|
|
|||||
|
Other U.S. dollar notes
(d)(e)
|
Senior Notes
|
2019-2046
|
2.800% - 7.125%
|
25,551
|
|
25,165
|
|
|||||||
|
Euro notes
(d)
|
Senior Notes
|
2023-2028
|
1.500% - 2.250%
|
2,899
|
|
3,038
|
|
|||||||
|
Canadian dollar notes
(f)
|
Senior Notes
|
July 6, 2020
|
2.700% - 3.128%
|
586
|
|
794
|
|
|||||||
|
British pound sterling notes:
|
||||||||||||||
|
2030 Notes
(g)
|
Senior Secured Notes
|
February 18, 2030
|
6.250%
|
165
|
|
176
|
|
|||||||
|
Other British pound sterling notes
(d)
|
Senior Notes
|
July 1, 2027
|
4.125%
|
504
|
|
536
|
|
|||||||
|
Other long-term debt
|
Various
|
2019-2035
|
0.800% - 5.500%
|
50
|
|
56
|
|
|||||||
|
Capital lease obligations
|
199
|
|
84
|
|
||||||||||
|
Total long-term debt
|
31,147
|
|
31,041
|
|
||||||||||
|
Current portion of long-term debt
|
377
|
|
2,733
|
|
||||||||||
|
Long-term debt, excluding current portion
|
$
|
30,770
|
|
$
|
28,308
|
|
||||||||
|
(a)
|
Priority of debt indicates the order which debt would be paid if all debt obligations were due on the same day. Senior secured debt takes priority over unsecured debt. Senior debt has greater seniority than subordinated debt.
|
|
(b)
|
Floating interest rates are stated as of December 29, 2018.
|
|
(c)
|
The
4.875%
Second Lien Senior Secured Notes due February 15, 2025 (the “2025 Notes”) are senior in right of payment of existing and future unsecured and subordinated indebtedness. Kraft Heinz fully and unconditionally guarantees these notes.
|
|
(d)
|
Kraft Heinz fully and unconditionally guarantees these notes, which were issued by KHFC.
|
|
(e)
|
Includes current year issuances (the “New Notes”) described below.
|
|
(f)
|
Kraft Heinz fully and unconditionally guarantees these notes, which were issued by Kraft Heinz Canada ULC (formerly Kraft Canada Inc.).
|
|
(g)
|
The
6.250%
Pound Sterling Senior Secured Notes due February 18, 2030 (the “2030 Notes”) were issued by H.J. Heinz Finance UK Plc. Kraft Heinz and KHFC fully and unconditionally guarantee the 2030 Notes. This guarantee is secured and senior in right of payment of existing and future unsecured and subordinated indebtedness. Kraft Heinz became guarantor of the 2030 Notes in connection with the 2015 Merger. The 2030 Notes were previously only guaranteed by KHFC.
|
128
Our long-term debt contains customary representations, covenants, and events of default. We were in compliance with all financial covenants during the year ended
December 29, 2018
.
During the period from December 29, 2018 to the filing date of this Annual Report on Form 10-K, due to the delays in the preparation of our financial statements for the fiscal year ended December 29, 2018 and the fiscal quarter ended March 30, 2019, we were not in compliance with certain reporting covenants under certain indentures. The filing of this Annual Report on Form 10-K will constitute compliance with the requirement to furnish the lenders a copy of the consolidated financial statements for our fiscal year ended December 29, 2018 no later than June 28, 2019. We also currently expect to file our Quarterly Report on Form 10-Q for the quarter ended March 30, 2019 on or before July 31, 2019 in compliance with the requirement to furnish the lenders a copy of the consolidated financial statements for such quarter no later than July 31, 2019.
Under our existing indentures, if we do not file required reports within specified time periods, the trustee or holders of at least
30%
in the case of our Second Lien Senior Secured Notes due 2025 and
25%
in the case of any other series of notes may deliver a notice of default for such series of notes which would commence the applicable cure period under such indenture. As of June 5, 2019, none of the cure periods under our existing indentures have been triggered in connection with our failure to comply with the respective reporting covenants set forth in such indentures. However, if a cure period is triggered under such indentures and we fail to file our annual and interim financial statements within such cure period, any outstanding notes issued thereunder would become callable.
At
December 29, 2018
, our long-term debt excluded amounts classified as held for sale. See Note 5,
Acquisitions and Divestitures
, for additional information.
At
December 29, 2018
, aggregate principal maturities of our long-term debt excluding capital leases were (in millions):
|
2019
|
$
|
355
|
|
|
2020
|
2,992
|
|
|
|
2021
|
990
|
|
|
|
2022
|
3,508
|
|
|
|
2023
|
2,460
|
|
|
|
Thereafter
|
20,329
|
|
|
Debt Issuances:
In June 2018, KHFC, our 100% owned operating subsidiary, issued
$300 million
aggregate principal amount of
3.375%
senior notes due 2021,
$1.6 billion
aggregate principal amount of
4.000%
senior notes due 2023, and
$1.1 billion
aggregate principal amount of
4.625%
senior notes due 2029 (collectively, the “New Notes”). The New Notes are fully and unconditionally guaranteed by Kraft Heinz as to payment of principal, premium, and interest on a senior unsecured basis.
We used approximately
$500 million
of the proceeds from the New Notes in connection with the wind-down of our U.S. securitization program in the second quarter of 2018. We also used proceeds from the New Notes to refinance a portion of our commercial paper borrowings in the second quarter of 2018, to repay certain notes that matured in July and August 2018, and for other general corporate purposes.
In August 2017, KHFC issued
$350 million
aggregate principal amount of floating rate senior notes due 2019,
$650 million
aggregate principal amount of floating rate senior notes due 2021, and
$500 million
aggregate principal amount of floating rate senior notes due 2022 (collectively, the “2017 Notes”). The 2017 Notes are fully and unconditionally guaranteed by Kraft Heinz as to payment of principal, premium, and interest on a senior unsecured basis.
We used the net proceeds from the 2017 Notes primarily to repay all amounts outstanding under our
$600 million
Term Loan Facility together with accrued interest thereon, to refinance a portion of our commercial paper programs, and for other general corporate purposes.
In May 2016, KHFC issued
$2.0 billion
aggregate principal amount of
3.000%
senior notes due June 2026,
$3.0 billion
aggregate principal amount of
4.375%
senior notes due June 2046,
€550 million
aggregate principal amount of
1.500%
senior notes due May 2024, and
€1,250 million
aggregate principal amount of
2.250%
senior notes due May 2028 (collectively, the “2016 Notes”). The 2016 Notes are fully and unconditionally guaranteed by Kraft Heinz as to payment of principal, premium, and interest on a senior unsecured basis.
We used the net proceeds from the 2016 Notes primarily to redeem all outstanding shares of our
9.00%
cumulative compounding preferred stock, Series A (“Series A Preferred Stock”) for
$8.3 billion
. See Note 20,
Capital Stock
, for additional information.
129
Debt Issuance Costs:
Debt issuance costs are reflected as a direct deduction of our long-term debt balance on the consolidated balance sheets. We incurred debt issuance costs of
$15 million
in 2018 and
$53 million
in 2016. Debt issuance costs in 2017 were insignificant. Unamortized debt issuance costs were
$115 million
at
December 29, 2018
,
$114 million
at
December 30, 2017
, and
$124 million
at
December 31, 2016
. Amortization of debt issuance costs was
$16 million
in 2018,
$16 million
in 2017, and
$14 million
in 2016.
Debt Premium:
Unamortized debt premiums are presented on the consolidated balance sheets as a direct addition to the carrying amount of debt. Unamortized debt premium, net, was
$430 million
at
December 29, 2018
and
$505 million
at
December 30, 2017
. Amortization of our debt premium, net, was
$65 million
in 2018,
$81 million
in 2017, and
$88 million
in 2016.
Debt Repayments:
In July and August 2018, we repaid
$2.7 billion
aggregate principal amount of senior notes that matured in the period. We funded these long-term debt repayments primarily with proceeds from the New Notes issued in June 2018.
Additionally, in June 2017, we repaid
$2.0 billion
aggregate principal amount of senior notes that matured in the period. We funded these long-term debt repayments primarily with cash on hand and our commercial paper programs.
Fair Value of Debt:
At
December 29, 2018
, the aggregate fair value of our total debt was
$30.1 billion
as compared with a carrying value of
$31.2 billion
. At
December 30, 2017
, the aggregate fair value of our total debt was
$33.0 billion
as compared with a carrying value of
$31.5 billion
. Our short-term debt and commercial paper had carrying values that approximated their fair values at
December 29, 2018
and December 30, 2017. We determined the fair value of our long-term debt using Level 2 inputs. Fair values are generally estimated based on quoted market prices for identical or similar instruments.
Note 20. Capital Stock
Preferred Stock
Our Second Amended and Restated Certificate of Incorporation authorizes the issuance of up to
920,000
shares of preferred stock.
On June 7, 2016, we redeemed all
80,000
outstanding shares of our Series A Preferred Stock for
$8.3 billion
. We funded this redemption primarily through the issuance of long-term debt in May 2016, as well as other sources of liquidity, including our U.S. commercial paper program, U.S. securitization program, and cash on hand. In connection with the redemption, all Series A Preferred Stock was canceled and automatically retired.
Common Stock
Our Second Amended and Restated Certificate of Incorporation authorizes the issuance of up to
5.0 billion
shares of common stock.
Shares of common stock issued, in treasury, and outstanding were (in millions of shares):
|
Shares Issued
|
Treasury Shares
|
Shares Outstanding
|
||||||
|
Balance at January 3, 2016
|
1,214
|
|
—
|
|
1,214
|
|
||
|
Exercise of stock options, issuance of other stock awards, and other
|
5
|
|
(2
|
)
|
3
|
|
||
|
Balance at December 31, 2016
|
1,219
|
|
(2
|
)
|
1,217
|
|
||
|
Exercise of stock options, issuance of other stock awards, and other
|
2
|
|
—
|
|
2
|
|
||
|
Balance at December 30, 2017
|
1,221
|
|
(2
|
)
|
1,219
|
|
||
|
Exercise of stock options, issuance of other stock awards, and other
|
3
|
|
(2
|
)
|
1
|
|
||
|
Balance at December 29, 2018
|
1,224
|
|
(4
|
)
|
1,220
|
|
||
130
Note 21. Earnings Per Share
Our earnings per common share (“EPS”) were:
|
As Restated
|
|||||||||||
|
December 29,
2018 |
December 30,
2017 |
December 31,
2016 |
|||||||||
|
|
(in millions, except per share data)
|
||||||||||
|
Basic Earnings Per Common Share:
|
|||||||||||
|
Net income/(loss) attributable to common shareholders
|
$
|
(10,192
|
)
|
$
|
10,941
|
|
$
|
3,416
|
|
||
|
Weighted average shares of common stock outstanding
|
1,219
|
|
1,218
|
|
1,217
|
|
|||||
|
Net earnings/(loss)
|
$
|
(8.36
|
)
|
$
|
8.98
|
|
$
|
2.81
|
|
||
|
Diluted Earnings Per Common Share:
|
|||||||||||
|
Net income/(loss) attributable to common shareholders
|
$
|
(10,192
|
)
|
$
|
10,941
|
|
$
|
3,416
|
|
||
|
Weighted average shares of common stock outstanding
|
1,219
|
|
1,218
|
|
1,217
|
|
|||||
|
Effect of dilutive equity awards
|
—
|
|
10
|
|
9
|
|
|||||
|
Weighted average shares of common stock outstanding, including dilutive effect
|
1,219
|
|
1,228
|
|
1,226
|
|
|||||
|
Net earnings/(loss)
|
$
|
(8.36
|
)
|
$
|
8.91
|
|
$
|
2.78
|
|
||
Basic and diluted EPS for the years ended December 30, 2017 and December 31, 2016 reflect the restatements that impacted net income/(loss) attributable to common shareholders. The restatements had no impact on weighted average shares of common stock outstanding or dilutive equity awards in prior periods. See Note 2,
Restatement of Previously Issued Consolidated Financial Statements
, for additional information.
We use the treasury stock method to calculate the dilutive effect of outstanding equity awards in the denominator for diluted EPS. We had net losses attributable to common shareholders in 2018. Therefore, we have excluded the dilutive effects of equity awards in 2018 as their inclusion would have had an anti-dilutive effect on EPS. Anti-dilutive shares were
13 million
in 2018,
2 million
in 2017, and
3 million
in 2016.
Note 22. Segment Reporting
Management evaluates segment performance based on several factors, including net sales and Segment Adjusted EBITDA.
Segment Adjusted EBITDA is defined as net income/(loss) from continuing operations before interest expense, other expense/(income), net, provision for/(benefit from) income taxes, and depreciation and amortization (excluding integration and restructuring expenses); in addition to these adjustments, we exclude, when they occur, the impacts of integration and restructuring expenses, deal costs, unrealized gains/(losses) on commodity hedges (the unrealized gains and losses are recorded in general corporate expenses until realized; once realized, the gains and losses are recorded in the applicable segment’s operating results), impairment losses, gains/(losses) on the sale of a business, other gains/(losses) related to acquisitions and divestitures (e.g., tax and hedging impacts), nonmonetary currency devaluation (e.g., remeasurement gains and losses), and equity award compensation expense (excluding integration and restructuring expenses). Segment Adjusted EBITDA is a tool that can assist management and investors in comparing our performance on a consistent basis by removing the impact of certain items that management believes do not directly reflect our underlying operations.
Management uses Segment Adjusted EBITDA to evaluate segment performance and allocate resources.
Management does not use assets by segment to evaluate performance or allocate resources. Therefore, we do not disclose assets by segment.
Net sales by segment were (in millions):
|
As Restated
|
|||||||||||
|
December 29,
2018 |
December 30,
2017 |
December 31,
2016 |
|||||||||
|
Net sales:
|
|||||||||||
|
United States
|
$
|
18,122
|
|
$
|
18,230
|
|
$
|
18,469
|
|
||
|
Canada
|
2,173
|
|
2,177
|
|
2,302
|
|
|||||
|
EMEA
|
2,718
|
|
2,585
|
|
2,586
|
|
|||||
|
Rest of World
|
3,255
|
|
3,084
|
|
2,943
|
|
|||||
|
Total net sales
|
$
|
26,268
|
|
$
|
26,076
|
|
$
|
26,300
|
|
||
131
Net sales for the years ended December 30, 2017 and December 31, 2016 reflect the restatements described in Note 2,
Restatement of Previously Issued Consolidated Financial Statements
.
Segment Adjusted EBITDA was (in millions):
|
As Restated & Recast
|
|||||||||||
|
December 29,
2018 |
December 30,
2017 |
December 31,
2016 |
|||||||||
|
Segment Adjusted EBITDA:
|
|||||||||||
|
United States
|
$
|
5,218
|
|
$
|
5,873
|
|
$
|
5,744
|
|
||
|
Canada
|
608
|
|
636
|
|
632
|
|
|||||
|
EMEA
|
724
|
|
673
|
|
741
|
|
|||||
|
Rest of World
|
635
|
|
590
|
|
621
|
|
|||||
|
General corporate expenses
|
(161
|
)
|
(108
|
)
|
(164
|
)
|
|||||
|
Depreciation and amortization (excluding integration and restructuring expenses)
|
(919
|
)
|
(907
|
)
|
(875
|
)
|
|||||
|
Integration and restructuring expenses
|
(297
|
)
|
(583
|
)
|
(992
|
)
|
|||||
|
Deal costs
|
(23
|
)
|
—
|
|
(30
|
)
|
|||||
|
Unrealized gains/(losses) on commodity hedges
|
(21
|
)
|
(19
|
)
|
38
|
|
|||||
|
Impairment losses
|
(15,936
|
)
|
(49
|
)
|
(71
|
)
|
|||||
|
Gains/(losses) on sale of business
|
(15
|
)
|
—
|
|
—
|
|
|||||
|
Nonmonetary currency devaluation
|
—
|
|
—
|
|
(4
|
)
|
|||||
|
Equity award compensation expense (excluding integration and restructuring expenses)
|
(33
|
)
|
(49
|
)
|
(39
|
)
|
|||||
|
Operating income/(loss)
|
(10,220
|
)
|
6,057
|
|
5,601
|
|
|||||
|
Interest expense
|
1,284
|
|
1,234
|
|
1,134
|
|
|||||
|
Other expense/(income), net
|
(183
|
)
|
(627
|
)
|
(472
|
)
|
|||||
|
Income/(loss) before income taxes
|
$
|
(11,321
|
)
|
$
|
5,450
|
|
$
|
4,939
|
|
||
Segment Adjusted EBITDA for the years ended December 30, 2017 and December 31, 2016 reflects restatements and has been recast to reflect the impact of adopting ASU 2017-07 in the first quarter of 2018. See Note 2,
Restatement of Previously Issued Consolidated Financial Statements
, for additional information. In addition, see Note 23,
Quarterly Financial Data (Unaudited)
, for restated Segment Adjusted EBITDA for the interim periods within fiscal years 2018 and 2017.
Total depreciation and amortization expense by segment was (in millions):
|
As Restated
|
|||||||||||
|
December 29,
2018 |
December 30,
2017 |
December 31,
2016 |
|||||||||
|
Depreciation and amortization expense:
|
|||||||||||
|
United States
|
$
|
626
|
|
$
|
658
|
|
$
|
966
|
|
||
|
Canada
|
39
|
|
48
|
|
56
|
|
|||||
|
EMEA
|
102
|
|
99
|
|
87
|
|
|||||
|
Rest of World
|
119
|
|
98
|
|
84
|
|
|||||
|
General corporate expenses
|
97
|
|
128
|
|
144
|
|
|||||
|
Total depreciation and amortization expense
|
$
|
983
|
|
$
|
1,031
|
|
$
|
1,337
|
|
||
Depreciation and amortization expense for the year ended December 30, 2017 reflects the restatements described in Note 2,
Restatement of Previously Issued Consolidated Financial Statements
.
The decrease in depreciation and amortization expense in 2017 compared to 2016 was primarily driven by accelerated depreciation recognized in 2016 resulting from factory closures as part of our Integration Program. See Note 6,
Integration and Restructuring Expenses
, for additional information.
132
Total capital expenditures by segment were (in millions):
|
As Restated
|
|||||||||||
|
December 29,
2018 |
December 30,
2017 |
December 31,
2016 |
|||||||||
|
Capital expenditures:
|
|||||||||||
|
United States
|
$
|
388
|
|
$
|
764
|
|
$
|
843
|
|
||
|
Canada
|
21
|
|
42
|
|
30
|
|
|||||
|
EMEA
|
124
|
|
127
|
|
115
|
|
|||||
|
Rest of World
|
236
|
|
184
|
|
96
|
|
|||||
|
General corporate expenses
|
57
|
|
77
|
|
163
|
|
|||||
|
Total capital expenditures
|
$
|
826
|
|
$
|
1,194
|
|
$
|
1,247
|
|
||
Capital expenditures for the year ended December 30, 2017 reflect the restatements described in Note 2,
Restatement of Previously Issued Consolidated Financial Statements
.
Net sales by product category were (in millions):
|
As Restated
|
|||||||||||
|
December 29,
2018 |
December 30,
2017 |
December 31,
2016 |
|||||||||
|
Condiments and sauces
|
$
|
6,752
|
|
$
|
6,429
|
|
$
|
6,297
|
|
||
|
Cheese and dairy
|
5,287
|
|
5,409
|
|
5,537
|
|
|||||
|
Ambient foods
|
2,576
|
|
2,564
|
|
2,488
|
|
|||||
|
Frozen and chilled foods
|
2,548
|
|
2,578
|
|
2,577
|
|
|||||
|
Meats and seafood
|
2,505
|
|
2,567
|
|
2,659
|
|
|||||
|
Refreshment beverages
|
1,507
|
|
1,506
|
|
1,517
|
|
|||||
|
Coffee
|
1,438
|
|
1,422
|
|
1,489
|
|
|||||
|
Infant and nutrition
|
756
|
|
755
|
|
761
|
|
|||||
|
Desserts, toppings and baking
|
1,038
|
|
1,033
|
|
1,054
|
|
|||||
|
Nuts and salted snacks
|
967
|
|
970
|
|
1,069
|
|
|||||
|
Other
|
894
|
|
843
|
|
852
|
|
|||||
|
Total net sales
|
$
|
26,268
|
|
$
|
26,076
|
|
$
|
26,300
|
|
||
In 2018, we reorganized the products within our product categories to reflect how we manage our business. We have reflected this change for all historical periods presented. In addition, net sales by product category for the years ended December 30, 2017 and December 31, 2016 reflect the restatements described in Note 2,
Restatement of Previously Issued Consolidated Financial Statements
.
Concentration of Risk:
Our largest customer, Walmart Inc., represented approximately
21%
of our net sales in 2018,
21%
of our net sales in 2017, and approximately
22%
of our net sales in 2016. All of our segments have sales to Walmart Inc.
Geographic Financial Information:
We had significant sales in the United States, Canada, and the United Kingdom. Our net sales by geography were (in millions):
|
As Restated
|
|||||||||||
|
December 29,
2018 |
December 30,
2017 |
December 31,
2016 |
|||||||||
|
Net sales:
|
|||||||||||
|
United States
|
$
|
18,218
|
|
$
|
18,324
|
|
$
|
18,556
|
|
||
|
Canada
|
2,173
|
|
2,177
|
|
2,302
|
|
|||||
|
United Kingdom
|
1,071
|
|
1,018
|
|
1,053
|
|
|||||
|
Other
|
4,806
|
|
4,557
|
|
4,389
|
|
|||||
|
Total net sales
|
$
|
26,268
|
|
$
|
26,076
|
|
$
|
26,300
|
|
||
133
Net sales by geography for the years ended December 30, 2017 and December 31, 2016 reflect the restatements described in Note 2,
Restatement of Previously Issued Consolidated Financial Statements
.
We had significant long-lived assets in the United States, Canada, and the United Kingdom. Long-lived assets include property, plant and equipment, goodwill, trademarks, and other intangible assets, net of related depreciation and amortization. Our long-lived assets by geography were (in millions):
|
As Restated
|
|||||||
|
December 29,
2018 |
December 30,
2017 |
||||||
|
Long-lived assets:
|
|||||||
|
United States
|
$
|
79,057
|
|
$
|
92,504
|
|
|
|
United Kingdom
|
4,996
|
|
6,226
|
|
|||
|
Canada
|
3,620
|
|
6,585
|
|
|||
|
Other
|
5,376
|
|
6,003
|
|
|||
|
Total long-lived assets
|
$
|
93,049
|
|
$
|
111,318
|
|
|
At
December 29, 2018
, long-lived assets by geography excluded amounts classified as held for sale. See Note 5,
Acquisitions and Divestitures
, for additional information. Long-lived assets at December 30, 2017 reflect the restatements described in Note 2,
Restatement of Previously Issued Consolidated Financial Statements
.
Note 23. Quarterly Financial Data (Unaudited)
Our quarterly financial data for 2018 and 2017 is summarized as follows:
|
2018 Quarters
|
|||||||||||||||
|
As Restated
|
|||||||||||||||
|
Fourth
|
Third
|
Second
|
First
|
||||||||||||
|
(in millions, except per share data)
|
|||||||||||||||
|
Net sales
|
$
|
6,891
|
|
$
|
6,383
|
|
$
|
6,690
|
|
$
|
6,304
|
|
|||
|
Gross profit
|
2,216
|
|
2,094
|
|
2,347
|
|
2,264
|
|
|||||||
|
Net income/(loss)
|
(12,628
|
)
|
618
|
|
753
|
|
1,003
|
|
|||||||
|
Net income/(loss) attributable to common shareholders
|
(12,568
|
)
|
619
|
|
754
|
|
1,003
|
|
|||||||
|
Per share data applicable to common shareholders:
|
|||||||||||||||
|
Basic earnings/(loss)
|
(10.30
|
)
|
0.51
|
|
0.62
|
|
0.82
|
|
|||||||
|
Diluted earnings/(loss)
|
(10.30
|
)
|
0.50
|
|
0.62
|
|
0.82
|
|
|||||||
|
2017 Quarters
|
|||||||||||||||
|
As Restated & Recast
|
|||||||||||||||
|
Fourth
|
Third
|
Second
|
First
|
||||||||||||
|
(in millions, except per share data)
|
|||||||||||||||
|
Net sales
|
$
|
6,841
|
|
$
|
6,279
|
|
$
|
6,634
|
|
$
|
6,322
|
|
|||
|
Gross profit
|
2,287
|
|
2,156
|
|
2,407
|
|
2,183
|
|
|||||||
|
Net income/(loss)
|
7,982
|
|
912
|
|
1,157
|
|
881
|
|
|||||||
|
Net income/(loss) attributable to common shareholders
|
7,989
|
|
913
|
|
1,156
|
|
883
|
|
|||||||
|
Per share data applicable to common shareholders:
|
|||||||||||||||
|
Basic earnings/(loss)
|
6.55
|
|
0.75
|
|
0.95
|
|
0.73
|
|
|||||||
|
Diluted earnings/(loss)
|
6.50
|
|
0.74
|
|
0.94
|
|
0.72
|
|
|||||||
134
Restatement of Previously Issued Unaudited Condensed Consolidated Financial Statements
We have restated herein our previously issued unaudited condensed consolidated financial statements for each interim period within the nine months ended September 29, 2018 and the fiscal year ended December 30, 2017. See Note 2,
Restatement of Previously Issued Consolidated Financial Statements
, for additional information.
The following tables represent our restated unaudited condensed consolidated financial statements for each quarter-to-date and year-to-date interim period within the nine months ended September 29, 2018 and the fiscal year ended December 30, 2017 and at each interim period therein.
The 2018 quarterly restatements will be effective with the filing of our future 2019 unaudited interim condensed consolidated financial statement filings in Quarterly Reports on Form 10-Q.
The values as previously reported for the fiscal quarters ended September 29, 2018, June 30, 2018, and March 31, 2018 were derived from our Quarterly Reports on Form 10-Q filed on November 2, 2018, August 3, 2018, and May 3, 2018, respectively. The values as previously reported for the fiscal quarter ended December 30, 2017 were derived from our Annual Report on Form 10-K for the year ended December 30, 2017 filed on February 16, 2018. The values as previously reported for the fiscal quarters ended September 30, 2017, July 1, 2017, and April 1, 2017 were derived from our Quarterly Reports on Form 10-Q, as amended for the first and second quarters, all of which were filed on November 7, 2017.
See Note 2,
Restatement of Previously Issued Consolidated Financial Statements
, for a description of the misstatements in each category of restatements referenced by (a) through (g).
In addition, the condensed consolidated statements of income for the interim periods within the year ended December 30, 2017, as previously reported, did not originally reflect the adoption of ASU 2017-07 related to the presentation of net periodic benefit cost (pension and postretirement cost). This ASU was adopted in the first quarter of 2018 and was applied retrospectively for statement of income presentation of service cost components and other net periodic benefit cost components. Our condensed consolidated statements of income for the interim periods within fiscal year 2017 have been recast accordingly. See Note 4,
New Accounting Standards
, for additional information related to our adoption of ASU 2017-07.
135
The Kraft Heinz Company
Condensed Consolidated Statements of Income
(in millions, except per share data)
|
As Restated
|
|||||||||||||||||||||||
|
December 29, 2018
|
September 29,
2018
|
June 30,
2018 |
March 31, 2018
|
||||||||||||||||||||
|
Three Months Ended
|
Three Months Ended
|
Nine Months Ended
|
Three Months Ended
|
Six Months Ended
|
Three Months Ended
|
||||||||||||||||||
|
Net sales
|
$
|
6,891
|
|
$
|
6,383
|
|
$
|
19,377
|
|
$
|
6,690
|
|
$
|
12,994
|
|
$
|
6,304
|
|
|||||
|
Cost of products sold
|
4,675
|
|
4,289
|
|
12,672
|
|
4,343
|
|
8,383
|
|
4,040
|
|
|||||||||||
|
Gross profit
|
2,216
|
|
2,094
|
|
6,705
|
|
2,347
|
|
4,611
|
|
2,264
|
|
|||||||||||
|
Selling, general and administrative expenses, excluding impairment losses
|
867
|
|
803
|
|
2,338
|
|
771
|
|
1,535
|
|
764
|
|
|||||||||||
|
Goodwill impairment losses
|
6,875
|
|
—
|
|
133
|
|
133
|
|
133
|
|
—
|
|
|||||||||||
|
Intangible asset impairment losses
|
8,610
|
|
217
|
|
318
|
|
101
|
|
101
|
|
—
|
|
|||||||||||
|
Selling, general and administrative expenses
|
16,352
|
|
1,020
|
|
2,789
|
|
1,005
|
|
1,769
|
|
764
|
|
|||||||||||
|
Operating income/(loss)
|
(14,136
|
)
|
1,074
|
|
3,916
|
|
1,342
|
|
2,842
|
|
1,500
|
|
|||||||||||
|
Interest expense
|
325
|
|
326
|
|
959
|
|
316
|
|
633
|
|
317
|
|
|||||||||||
|
Other expense/(income), net
|
13
|
|
(71
|
)
|
(196
|
)
|
(35
|
)
|
(125
|
)
|
(90
|
)
|
|||||||||||
|
Income/(loss) before income taxes
|
(14,474
|
)
|
819
|
|
3,153
|
|
1,061
|
|
2,334
|
|
1,273
|
|
|||||||||||
|
Provision for/(benefit from) income taxes
|
(1,846
|
)
|
201
|
|
779
|
|
308
|
|
578
|
|
270
|
|
|||||||||||
|
Net income/(loss)
|
(12,628
|
)
|
618
|
|
2,374
|
|
753
|
|
1,756
|
|
1,003
|
|
|||||||||||
|
Net income/(loss) attributable to noncontrolling interest
|
(60
|
)
|
(1
|
)
|
(2
|
)
|
(1
|
)
|
(1
|
)
|
—
|
|
|||||||||||
|
Net income/(loss) attributable to Kraft Heinz
|
(12,568
|
)
|
619
|
|
2,376
|
|
754
|
|
1,757
|
|
1,003
|
|
|||||||||||
|
Preferred dividends
|
—
|
|
—
|
|
—
|
|
—
|
|
—
|
|
—
|
|
|||||||||||
|
Net income/(loss) attributable to common shareholders
|
$
|
(12,568
|
)
|
$
|
619
|
|
$
|
2,376
|
|
$
|
754
|
|
$
|
1,757
|
|
$
|
1,003
|
|
|||||
|
Per share data applicable to common shareholders:
|
|||||||||||||||||||||||
|
Basic earnings/(loss)
|
$
|
(10.30
|
)
|
$
|
0.51
|
|
$
|
1.95
|
|
$
|
0.62
|
|
$
|
1.44
|
|
$
|
0.82
|
|
|||||
|
Diluted earnings/(loss)
|
(10.30
|
)
|
0.50
|
|
1.94
|
|
0.62
|
|
1.43
|
|
0.82
|
|
|||||||||||
136
The Kraft Heinz Company
Condensed Consolidated Statements of Income
(in millions, except per share data)
|
As Restated & Recast
|
|||||||||||||||||||||||
|
December 30, 2017
|
September 30,
2017
|
July 1,
2017 |
April 1,
2017 |
||||||||||||||||||||
|
Three Months Ended
|
Three Months Ended
|
Nine Months Ended
|
Three Months Ended
|
Six Months Ended
|
Three Months Ended
|
||||||||||||||||||
|
Net sales
|
$
|
6,841
|
|
$
|
6,279
|
|
$
|
19,235
|
|
$
|
6,634
|
|
$
|
12,956
|
|
$
|
6,322
|
|
|||||
|
Cost of products sold
|
4,554
|
|
4,123
|
|
12,489
|
|
4,227
|
|
8,366
|
|
4,139
|
|
|||||||||||
|
Gross profit
|
2,287
|
|
2,156
|
|
6,746
|
|
2,407
|
|
4,590
|
|
2,183
|
|
|||||||||||
|
Selling, general and administrative expenses, excluding impairment losses
|
778
|
|
664
|
|
2,149
|
|
720
|
|
1,485
|
|
765
|
|
|||||||||||
|
Goodwill impairment losses
|
—
|
|
—
|
|
—
|
|
—
|
|
—
|
|
—
|
|
|||||||||||
|
Intangible asset impairment losses
|
—
|
|
1
|
|
49
|
|
48
|
|
48
|
|
—
|
|
|||||||||||
|
Selling, general and administrative expenses
|
778
|
|
665
|
|
2,198
|
|
768
|
|
1,533
|
|
765
|
|
|||||||||||
|
Operating income/(loss)
|
1,509
|
|
1,491
|
|
4,548
|
|
1,639
|
|
3,057
|
|
1,418
|
|
|||||||||||
|
Interest expense
|
308
|
|
306
|
|
926
|
|
307
|
|
620
|
|
313
|
|
|||||||||||
|
Other expense/(income), net
|
(116
|
)
|
(127
|
)
|
(511
|
)
|
(254
|
)
|
(384
|
)
|
(130
|
)
|
|||||||||||
|
Income/(loss) before income taxes
|
1,317
|
|
1,312
|
|
4,133
|
|
1,586
|
|
2,821
|
|
1,235
|
|
|||||||||||
|
Provision for/(benefit from) income taxes
|
(6,665
|
)
|
400
|
|
1,183
|
|
429
|
|
783
|
|
354
|
|
|||||||||||
|
Net income/(loss)
|
7,982
|
|
912
|
|
2,950
|
|
1,157
|
|
2,038
|
|
881
|
|
|||||||||||
|
Net income/(loss) attributable to noncontrolling interest
|
(7
|
)
|
(1
|
)
|
(2
|
)
|
1
|
|
(1
|
)
|
(2
|
)
|
|||||||||||
|
Net income/(loss) attributable to Kraft Heinz
|
7,989
|
|
913
|
|
2,952
|
|
1,156
|
|
2,039
|
|
883
|
|
|||||||||||
|
Preferred dividends
|
—
|
|
—
|
|
—
|
|
—
|
|
—
|
|
—
|
|
|||||||||||
|
Net income/(loss) attributable to common shareholders
|
$
|
7,989
|
|
$
|
913
|
|
$
|
2,952
|
|
$
|
1,156
|
|
$
|
2,039
|
|
$
|
883
|
|
|||||
|
Per share data applicable to common shareholders:
|
|||||||||||||||||||||||
|
Basic earnings/(loss)
|
$
|
6.55
|
|
$
|
0.75
|
|
$
|
2.42
|
|
$
|
0.95
|
|
$
|
1.67
|
|
$
|
0.73
|
|
|||||
|
Diluted earnings/(loss)
|
6.50
|
|
0.74
|
|
2.40
|
|
0.94
|
|
1.66
|
|
0.72
|
|
|||||||||||
137
The Kraft Heinz Company
Condensed Consolidated Statements of Comprehensive Income
(in millions)
|
As Restated
|
|||||||||||||||||||||||
|
December 29,
2018
|
September 29,
2018
|
June 30,
2018 |
March 31, 2018
|
||||||||||||||||||||
|
Three Months Ended
|
Three Months Ended
|
Nine Months Ended
|
Three Months Ended
|
Six Months Ended
|
Three Months Ended
|
||||||||||||||||||
|
Net income/(loss)
|
$
|
(12,628
|
)
|
$
|
618
|
|
$
|
2,374
|
|
$
|
753
|
|
$
|
1,756
|
|
$
|
1,003
|
|
|||||
|
Other comprehensive income/(loss), net of tax:
|
|||||||||||||||||||||||
|
Foreign currency translation adjustments
|
(378
|
)
|
(144
|
)
|
(809
|
)
|
(862
|
)
|
(665
|
)
|
197
|
|
|||||||||||
|
Net deferred gains/(losses) on net investment hedges
|
126
|
|
13
|
|
158
|
|
219
|
|
145
|
|
(74
|
)
|
|||||||||||
|
Amounts excluded from the effectiveness assessment of net investment hedges
|
4
|
|
3
|
|
3
|
|
—
|
|
—
|
|
—
|
|
|||||||||||
|
Net deferred losses/(gains) on net investment hedges reclassified to net income/(loss)
|
(5
|
)
|
(2
|
)
|
(2
|
)
|
—
|
|
—
|
|
—
|
|
|||||||||||
|
Net deferred gains/(losses) on cash flow hedges
|
59
|
|
(16
|
)
|
40
|
|
34
|
|
56
|
|
22
|
|
|||||||||||
|
Amounts excluded from the effectiveness assessment of cash flow hedges
|
2
|
|
—
|
|
—
|
|
—
|
|
—
|
|
—
|
|
|||||||||||
|
Net deferred losses/(gains) on cash flow hedges reclassified to net income/(loss)
|
(34
|
)
|
12
|
|
(10
|
)
|
(9
|
)
|
(22
|
)
|
(13
|
)
|
|||||||||||
|
Net actuarial gains/(losses) arising during the period
|
(12
|
)
|
17
|
|
70
|
|
53
|
|
53
|
|
—
|
|
|||||||||||
|
Prior service credits/(costs) arising during the period
|
3
|
|
—
|
|
—
|
|
—
|
|
—
|
|
—
|
|
|||||||||||
|
Net postemployment benefit losses/(gains) reclassified to net income/(loss)
|
15
|
|
(58
|
)
|
(133
|
)
|
(17
|
)
|
(75
|
)
|
(58
|
)
|
|||||||||||
|
Total other comprehensive income/(loss)
|
(220
|
)
|
(175
|
)
|
(683
|
)
|
(582
|
)
|
(508
|
)
|
74
|
|
|||||||||||
|
Total comprehensive income/(loss)
|
(12,848
|
)
|
443
|
|
1,691
|
|
171
|
|
1,248
|
|
1,077
|
|
|||||||||||
|
Comprehensive income/(loss) attributable to noncontrolling interest
|
(61
|
)
|
(3
|
)
|
(15
|
)
|
(7
|
)
|
(12
|
)
|
(5
|
)
|
|||||||||||
|
Comprehensive income/(loss) attributable to Kraft Heinz
|
$
|
(12,787
|
)
|
$
|
446
|
|
$
|
1,706
|
|
$
|
178
|
|
$
|
1,260
|
|
$
|
1,082
|
|
|||||
138
The Kraft Heinz Company
Condensed Consolidated Statements of Comprehensive Income
(in millions)
|
As Restated
|
|||||||||||||||||||||||
|
December 30,
2017
|
September 30,
2017
|
July 1,
2017 |
April 1,
2017 |
||||||||||||||||||||
|
Three Months Ended
|
Three Months Ended
|
Nine Months Ended
|
Three Months Ended
|
Six Months Ended
|
Three Months Ended
|
||||||||||||||||||
|
Net income/(loss)
|
$
|
7,982
|
|
$
|
912
|
|
$
|
2,950
|
|
$
|
1,157
|
|
$
|
2,038
|
|
$
|
881
|
|
|||||
|
Other comprehensive income/(loss), net of tax:
|
|||||||||||||||||||||||
|
Foreign currency translation adjustments
|
7
|
|
419
|
|
1,178
|
|
455
|
|
759
|
|
304
|
|
|||||||||||
|
Net deferred gains/(losses) on net investment hedges
|
(26
|
)
|
(124
|
)
|
(327
|
)
|
(152
|
)
|
(203
|
)
|
(51
|
)
|
|||||||||||
|
Amounts excluded from the effectiveness assessment of net investment hedges
|
—
|
|
—
|
|
—
|
|
—
|
|
—
|
|
—
|
|
|||||||||||
|
Net deferred losses/(gains) on net investment hedges reclassified to net income/(loss)
|
—
|
|
—
|
|
—
|
|
—
|
|
—
|
|
—
|
|
|||||||||||
|
Net deferred gains/(losses) on cash flow hedges
|
23
|
|
(70
|
)
|
(136
|
)
|
(32
|
)
|
(66
|
)
|
(34
|
)
|
|||||||||||
|
Amounts excluded from the effectiveness assessment of cash flow hedges
|
—
|
|
—
|
|
—
|
|
—
|
|
—
|
|
—
|
|
|||||||||||
|
Net deferred losses/(gains) on cash flow hedges reclassified to net income/(loss)
|
(12
|
)
|
51
|
|
97
|
|
26
|
|
46
|
|
20
|
|
|||||||||||
|
Net actuarial gains/(losses) arising during the period
|
82
|
|
(4
|
)
|
(13
|
)
|
1
|
|
(9
|
)
|
(10
|
)
|
|||||||||||
|
Prior service credits/(costs) arising during the period
|
16
|
|
—
|
|
1
|
|
1
|
|
1
|
|
—
|
|
|||||||||||
|
Net postemployment benefit losses/(gains) reclassified to net income/(loss)
|
(49
|
)
|
(51
|
)
|
(260
|
)
|
(154
|
)
|
(209
|
)
|
(55
|
)
|
|||||||||||
|
Total other comprehensive income/(loss)
|
41
|
|
221
|
|
540
|
|
145
|
|
319
|
|
174
|
|
|||||||||||
|
Total comprehensive income/(loss)
|
8,023
|
|
1,133
|
|
3,490
|
|
1,302
|
|
2,357
|
|
1,055
|
|
|||||||||||
|
Comprehensive income/(loss) attributable to noncontrolling interest
|
1
|
|
(1
|
)
|
(4
|
)
|
1
|
|
(3
|
)
|
(4
|
)
|
|||||||||||
|
Comprehensive income/(loss) attributable to Kraft Heinz
|
$
|
8,022
|
|
$
|
1,134
|
|
$
|
3,494
|
|
$
|
1,301
|
|
$
|
2,360
|
|
$
|
1,059
|
|
|||||
139
The Kraft Heinz Company
Condensed Consolidated Balance Sheets
(in millions, except per share data)
|
As Restated
|
|||||||||||
|
|
September 29,
2018
|
June 30,
2018
|
March 31,
2018
|
||||||||
|
ASSETS
|
|||||||||||
|
Cash and cash equivalents
|
$
|
1,366
|
|
$
|
3,369
|
|
$
|
1,794
|
|
||
|
Trade receivables (net of allowances of $24 at September 29, 2018, $24 at June 30, 2018, and $24 at March 31, 2018)
|
2,032
|
|
1,950
|
|
1,044
|
|
|||||
|
Sold receivables
|
—
|
|
37
|
|
530
|
|
|||||
|
Income taxes receivable
|
203
|
|
211
|
|
121
|
|
|||||
|
Inventories
|
3,214
|
|
3,094
|
|
3,089
|
|
|||||
|
Prepaid expenses
|
389
|
|
388
|
|
367
|
|
|||||
|
Other current assets
|
352
|
|
431
|
|
426
|
|
|||||
|
Assets held for sale
|
—
|
|
—
|
|
—
|
|
|||||
|
Total current assets
|
7,556
|
|
9,480
|
|
7,371
|
|
|||||
|
Property, plant and equipment, net
|
7,074
|
|
7,117
|
|
7,145
|
|
|||||
|
Goodwill
|
44,339
|
|
44,302
|
|
44,844
|
|
|||||
|
Intangible assets, net
|
58,727
|
|
59,084
|
|
59,583
|
|
|||||
|
Other non-current assets
|
1,879
|
|
1,766
|
|
1,640
|
|
|||||
|
TOTAL ASSETS
|
$
|
119,575
|
|
$
|
121,749
|
|
$
|
120,583
|
|
||
|
LIABILITIES AND EQUITY
|
|||||||||||
|
Commercial paper and other short-term debt
|
$
|
973
|
|
$
|
34
|
|
$
|
1,003
|
|
||
|
Current portion of long-term debt
|
371
|
|
2,723
|
|
2,715
|
|
|||||
|
Trade payables
|
4,238
|
|
4,236
|
|
4,148
|
|
|||||
|
Accrued marketing
|
494
|
|
480
|
|
576
|
|
|||||
|
Interest payable
|
315
|
|
404
|
|
345
|
|
|||||
|
Other current liabilities
|
1,231
|
|
1,236
|
|
1,500
|
|
|||||
|
Liabilities held for sale
|
—
|
|
—
|
|
—
|
|
|||||
|
Total current liabilities
|
7,622
|
|
9,113
|
|
10,287
|
|
|||||
|
Long-term debt
|
30,887
|
|
31,269
|
|
28,465
|
|
|||||
|
Deferred income taxes
|
14,224
|
|
14,260
|
|
14,106
|
|
|||||
|
Accrued postemployment costs
|
394
|
|
394
|
|
400
|
|
|||||
|
Other non-current liabilities
|
1,035
|
|
998
|
|
1,023
|
|
|||||
|
TOTAL LIABILITIES
|
54,162
|
|
56,034
|
|
54,281
|
|
|||||
|
Commitments and Contingencies
|
|
|
|
||||||||
|
Redeemable noncontrolling interest
|
6
|
|
7
|
|
8
|
|
|||||
|
Equity:
|
|||||||||||
|
Common stock, $0.01 par value (5,000 shares authorized; 1,222 shares issued and 1,219
shares outstanding at September 29, 2018, 1,222 shares issued and 1,219
shares outstanding at June 30, 2018, and 1,222 shares issued and 1,219
shares outstanding at March 31, 2018)
|
12
|
|
12
|
|
12
|
|
|||||
|
Additional paid-in capital
|
58,716
|
|
58,689
|
|
58,656
|
|
|||||
|
Retained earnings/(deficit)
|
8,479
|
|
8,624
|
|
8,634
|
|
|||||
|
Accumulated other comprehensive income/(losses)
|
(1,724
|
)
|
(1,551
|
)
|
(975
|
)
|
|||||
|
Treasury stock, at cost (3 shares at September 29, 2018, 3 shares at June 30, 2018, and 3 shares at March 31, 2018)
|
(264
|
)
|
(254
|
)
|
(240
|
)
|
|||||
|
Total shareholders' equity
|
65,219
|
|
65,520
|
|
66,087
|
|
|||||
|
Noncontrolling interest
|
188
|
|
188
|
|
207
|
|
|||||
|
TOTAL EQUITY
|
65,407
|
|
65,708
|
|
66,294
|
|
|||||
|
TOTAL LIABILITIES AND EQUITY
|
$
|
119,575
|
|
$
|
121,749
|
|
$
|
120,583
|
|
||
140
The Kraft Heinz Company
Condensed Consolidated Balance Sheets
(in millions, except per share data)
|
As Restated
|
|||||||||||
|
|
September 30,
2017
|
July 1,
2017
|
April 1,
2017
|
||||||||
|
ASSETS
|
|||||||||||
|
Cash and cash equivalents
|
$
|
1,441
|
|
$
|
1,445
|
|
$
|
3,242
|
|
||
|
Trade receivables (net of allowances of $29 at September 30, 2017, $28 at July 1, 2017, and $30 at April 1, 2017)
|
938
|
|
973
|
|
936
|
|
|||||
|
Sold receivables
|
427
|
|
461
|
|
538
|
|
|||||
|
Income taxes receivable
|
290
|
|
237
|
|
269
|
|
|||||
|
Inventories
|
3,136
|
|
3,012
|
|
3,094
|
|
|||||
|
Prepaid expenses
|
368
|
|
359
|
|
349
|
|
|||||
|
Other current assets
|
527
|
|
547
|
|
611
|
|
|||||
|
Assets held for sale
|
—
|
|
—
|
|
—
|
|
|||||
|
Total current assets
|
7,127
|
|
7,034
|
|
9,039
|
|
|||||
|
Property, plant and equipment, net
|
6,902
|
|
6,804
|
|
6,689
|
|
|||||
|
Goodwill
|
44,859
|
|
44,566
|
|
44,301
|
|
|||||
|
Intangible assets, net
|
59,483
|
|
59,383
|
|
59,313
|
|
|||||
|
Other non-current assets
|
1,531
|
|
1,535
|
|
1,604
|
|
|||||
|
TOTAL ASSETS
|
$
|
119,902
|
|
$
|
119,322
|
|
$
|
120,946
|
|
||
|
LIABILITIES AND EQUITY
|
|||||||||||
|
Commercial paper and other short-term debt
|
$
|
457
|
|
$
|
1,090
|
|
$
|
909
|
|
||
|
Current portion of long-term debt
|
2,747
|
|
19
|
|
2,022
|
|
|||||
|
Trade payables
|
3,873
|
|
3,805
|
|
3,858
|
|
|||||
|
Accrued marketing
|
500
|
|
499
|
|
601
|
|
|||||
|
Interest payable
|
295
|
|
406
|
|
346
|
|
|||||
|
Other current liabilities
|
1,578
|
|
1,589
|
|
1,905
|
|
|||||
|
Liabilities held for sale
|
—
|
|
—
|
|
—
|
|
|||||
|
Total current liabilities
|
9,450
|
|
7,408
|
|
9,641
|
|
|||||
|
Long-term debt
|
28,276
|
|
29,978
|
|
29,747
|
|
|||||
|
Deferred income taxes
|
20,841
|
|
20,840
|
|
20,873
|
|
|||||
|
Accrued postemployment costs
|
1,808
|
|
1,975
|
|
2,016
|
|
|||||
|
Other non-current liabilities
|
715
|
|
701
|
|
851
|
|
|||||
|
TOTAL LIABILITIES
|
61,090
|
|
60,902
|
|
63,128
|
|
|||||
|
Commitments and Contingencies
|
|
|
|
||||||||
|
Redeemable noncontrolling interest
|
—
|
|
—
|
|
—
|
|
|||||
|
Equity:
|
|||||||||||
|
Common stock, $0.01 par value (5,000 shares authorized; 1,221 shares issued and 1,218 shares outstanding at September 30, 2017; 1,221 shares issued and 1,218 shares outstanding at July 1, 2017; 1,220 shares issued and 1,218 shares outstanding at April 1, 2017)
|
12
|
|
12
|
|
12
|
|
|||||
|
Additional paid-in capital
|
58,618
|
|
58,597
|
|
58,565
|
|
|||||
|
Retained earnings/(deficit)
|
1,280
|
|
1,129
|
|
705
|
|
|||||
|
Accumulated other comprehensive income/(losses)
|
(1,087
|
)
|
(1,308
|
)
|
(1,453
|
)
|
|||||
|
Treasury stock, at cost (3 shares at September 30, 2017, 3 shares at July 1, 2017, and 2 shares at April 1, 2017)
|
(223
|
)
|
(223
|
)
|
(223
|
)
|
|||||
|
Total shareholders' equity
|
58,600
|
|
58,207
|
|
57,606
|
|
|||||
|
Noncontrolling interest
|
212
|
|
213
|
|
212
|
|
|||||
|
TOTAL EQUITY
|
58,812
|
|
58,420
|
|
57,818
|
|
|||||
|
TOTAL LIABILITIES AND EQUITY
|
$
|
119,902
|
|
$
|
119,322
|
|
$
|
120,946
|
|
||
141
The Kraft Heinz Company
Condensed Consolidated Statements of Equity
(in millions, except per share data)
|
As Restated
|
|||||||||||||||||||||||||||
|
For the Nine Months Ended September 29, 2018
|
|||||||||||||||||||||||||||
|
Common Stock
|
Additional Paid-in Capital
|
Retained Earnings/(Deficit)
|
Accumulated Other Comprehensive Income/(Losses)
|
Treasury Stock, at Cost
|
Noncontrolling Interest
|
Total Equity
|
|||||||||||||||||||||
|
Balance at December 30, 2017
|
$
|
12
|
|
$
|
58,634
|
|
$
|
8,495
|
|
$
|
(1,054
|
)
|
$
|
(224
|
)
|
$
|
207
|
|
$
|
66,070
|
|
||||||
|
Net income/(loss) excluding redeemable noncontrolling interest
|
—
|
|
—
|
|
2,376
|
|
—
|
|
—
|
|
7
|
|
2,383
|
|
|||||||||||||
|
Other comprehensive income/(loss) excluding redeemable noncontrolling interest
|
—
|
|
—
|
|
—
|
|
(670
|
)
|
—
|
|
(13
|
)
|
(683
|
)
|
|||||||||||||
|
Dividends declared-common stock ($1.875 per share)
|
—
|
|
—
|
|
(2,286
|
)
|
—
|
|
—
|
|
—
|
|
(2,286
|
)
|
|||||||||||||
|
Cumulative effect of accounting standards adopted in the period
|
—
|
|
—
|
|
(97
|
)
|
—
|
|
—
|
|
—
|
|
(97
|
)
|
|||||||||||||
|
Exercise of stock options, issuance of other stock awards, and other
|
—
|
|
82
|
|
(9
|
)
|
—
|
|
(40
|
)
|
(13
|
)
|
20
|
|
|||||||||||||
|
Balance at September 29, 2018
|
$
|
12
|
|
$
|
58,716
|
|
$
|
8,479
|
|
$
|
(1,724
|
)
|
$
|
(264
|
)
|
$
|
188
|
|
$
|
65,407
|
|
||||||
|
As Restated
|
|||||||||||||||||||||||||||
|
For the Six Months Ended June 30, 2018
|
|||||||||||||||||||||||||||
|
Common Stock
|
Additional Paid-in Capital
|
Retained Earnings/(Deficit)
|
Accumulated Other Comprehensive Income/(Losses)
|
Treasury Stock, at Cost
|
Noncontrolling Interest
|
Total Equity
|
|||||||||||||||||||||
|
Balance at December 30, 2017
|
$
|
12
|
|
$
|
58,634
|
|
$
|
8,495
|
|
$
|
(1,054
|
)
|
$
|
(224
|
)
|
$
|
207
|
|
$
|
66,070
|
|
||||||
|
Net income/(loss) excluding redeemable noncontrolling interest
|
—
|
|
—
|
|
1,757
|
|
—
|
|
—
|
|
5
|
|
1,762
|
|
|||||||||||||
|
Other comprehensive income/(loss) excluding redeemable noncontrolling interest
|
—
|
|
—
|
|
—
|
|
(497
|
)
|
—
|
|
(11
|
)
|
(508
|
)
|
|||||||||||||
|
Dividends declared-common stock ($1.25 per share)
|
—
|
|
—
|
|
(1,524
|
)
|
—
|
|
—
|
|
—
|
|
(1,524
|
)
|
|||||||||||||
|
Cumulative effect of accounting standards adopted in the period
|
—
|
|
—
|
|
(95
|
)
|
—
|
|
—
|
|
—
|
|
(95
|
)
|
|||||||||||||
|
Exercise of stock options, issuance of other stock awards, and other
|
—
|
|
55
|
|
(9
|
)
|
—
|
|
(30
|
)
|
(13
|
)
|
3
|
|
|||||||||||||
|
Balance at June 30, 2018
|
$
|
12
|
|
$
|
58,689
|
|
$
|
8,624
|
|
$
|
(1,551
|
)
|
$
|
(254
|
)
|
$
|
188
|
|
$
|
65,708
|
|
||||||
|
As Restated
|
|||||||||||||||||||||||||||
|
For the Three Months Ended March 31, 2018
|
|||||||||||||||||||||||||||
|
Common Stock
|
Additional Paid-in Capital
|
Retained Earnings/(Deficit)
|
Accumulated Other Comprehensive Income/(Losses)
|
Treasury Stock, at Cost
|
Noncontrolling Interest
|
Total Equity
|
|||||||||||||||||||||
|
Balance at December 30, 2017
|
$
|
12
|
|
$
|
58,634
|
|
$
|
8,495
|
|
$
|
(1,054
|
)
|
$
|
(224
|
)
|
$
|
207
|
|
$
|
66,070
|
|
||||||
|
Net income/(loss) excluding redeemable noncontrolling interest
|
—
|
|
—
|
|
1,003
|
|
—
|
|
—
|
|
5
|
|
1,008
|
|
|||||||||||||
|
Other comprehensive income/(loss) excluding redeemable noncontrolling interest
|
—
|
|
—
|
|
—
|
|
79
|
|
—
|
|
(5
|
)
|
74
|
|
|||||||||||||
|
Dividends declared-common stock ($0.625 per share)
|
—
|
|
—
|
|
(762
|
)
|
—
|
|
—
|
|
—
|
|
(762
|
)
|
|||||||||||||
|
Cumulative effect of accounting standards adopted in the period
|
—
|
|
—
|
|
(95
|
)
|
—
|
|
—
|
|
—
|
|
(95
|
)
|
|||||||||||||
|
Exercise of stock options, issuance of other stock awards, and other
|
—
|
|
22
|
|
(7
|
)
|
—
|
|
(16
|
)
|
—
|
|
(1
|
)
|
|||||||||||||
|
Balance at March 31, 2018
|
$
|
12
|
|
$
|
58,656
|
|
$
|
8,634
|
|
$
|
(975
|
)
|
$
|
(240
|
)
|
$
|
207
|
|
$
|
66,294
|
|
||||||
142
The Kraft Heinz Company
Condensed Consolidated Statements of Equity
(in millions, except per share data)
|
As Restated
|
|||||||||||||||||||||||||||
|
For the Nine Months Ended September 30, 2017
|
|||||||||||||||||||||||||||
|
Common Stock
|
Additional Paid-in Capital
|
Retained Earnings/(Deficit)
|
Accumulated Other Comprehensive Income/(Losses)
|
Treasury Stock, at Cost
|
Noncontrolling Interest
|
Total Equity
|
|||||||||||||||||||||
|
Balance at December 31, 2016
|
$
|
12
|
|
$
|
58,516
|
|
$
|
552
|
|
$
|
(1,629
|
)
|
$
|
(207
|
)
|
$
|
216
|
|
$
|
57,460
|
|
||||||
|
Net income/(loss)
|
—
|
|
—
|
|
2,952
|
|
—
|
|
—
|
|
(2
|
)
|
2,950
|
|
|||||||||||||
|
Other comprehensive income/(loss)
|
—
|
|
—
|
|
—
|
|
542
|
|
—
|
|
(2
|
)
|
540
|
|
|||||||||||||
|
Dividends declared-common stock ($1.825 per share)
|
—
|
|
—
|
|
(2,225
|
)
|
—
|
|
—
|
|
—
|
|
(2,225
|
)
|
|||||||||||||
|
Exercise of stock options, issuance of other stock awards, and other
|
—
|
|
102
|
|
1
|
|
—
|
|
(16
|
)
|
—
|
|
87
|
|
|||||||||||||
|
Balance at September 30, 2017
|
$
|
12
|
|
$
|
58,618
|
|
$
|
1,280
|
|
$
|
(1,087
|
)
|
$
|
(223
|
)
|
$
|
212
|
|
$
|
58,812
|
|
||||||
|
As Restated
|
|||||||||||||||||||||||||||
|
For the Six Months Ended July 1, 2017
|
|||||||||||||||||||||||||||
|
Common Stock
|
Additional Paid-in Capital
|
Retained Earnings/(Deficit)
|
Accumulated Other Comprehensive Income/(Losses)
|
Treasury Stock, at Cost
|
Noncontrolling Interest
|
Total Equity
|
|||||||||||||||||||||
|
Balance at December 31, 2016
|
$
|
12
|
|
$
|
58,516
|
|
$
|
552
|
|
$
|
(1,629
|
)
|
$
|
(207
|
)
|
$
|
216
|
|
$
|
57,460
|
|
||||||
|
Net income/(loss)
|
—
|
|
—
|
|
2,039
|
|
—
|
|
—
|
|
(1
|
)
|
2,038
|
|
|||||||||||||
|
Other comprehensive income/(loss)
|
—
|
|
—
|
|
—
|
|
321
|
|
—
|
|
(2
|
)
|
319
|
|
|||||||||||||
|
Dividends declared-common stock ($1.20 per share)
|
—
|
|
—
|
|
(1,463
|
)
|
—
|
|
—
|
|
—
|
|
(1,463
|
)
|
|||||||||||||
|
Exercise of stock options, issuance of other stock awards, and other
|
—
|
|
81
|
|
1
|
|
—
|
|
(16
|
)
|
—
|
|
66
|
|
|||||||||||||
|
Balance at July 1, 2017
|
$
|
12
|
|
$
|
58,597
|
|
$
|
1,129
|
|
$
|
(1,308
|
)
|
$
|
(223
|
)
|
$
|
213
|
|
$
|
58,420
|
|
||||||
|
As Restated
|
|||||||||||||||||||||||||||
|
For the Three Months Ended April 1, 2017
|
|||||||||||||||||||||||||||
|
Common Stock
|
Additional Paid-in Capital
|
Retained Earnings/(Deficit)
|
Accumulated Other Comprehensive Income/(Losses)
|
Treasury Stock, at Cost
|
Noncontrolling Interest
|
Total Equity
|
|||||||||||||||||||||
|
Balance at December 31, 2016
|
$
|
12
|
|
$
|
58,516
|
|
$
|
552
|
|
$
|
(1,629
|
)
|
$
|
(207
|
)
|
$
|
216
|
|
$
|
57,460
|
|
||||||
|
Net income/(loss)
|
—
|
|
—
|
|
883
|
|
—
|
|
—
|
|
(2
|
)
|
881
|
|
|||||||||||||
|
Other comprehensive income/(loss)
|
—
|
|
—
|
|
—
|
|
176
|
|
—
|
|
(2
|
)
|
174
|
|
|||||||||||||
|
Dividends declared-common stock ($0.60 per share)
|
—
|
|
—
|
|
(731
|
)
|
—
|
|
—
|
|
—
|
|
(731
|
)
|
|||||||||||||
|
Exercise of stock options, issuance of other stock awards, and other
|
—
|
|
49
|
|
1
|
|
—
|
|
(16
|
)
|
—
|
|
34
|
|
|||||||||||||
|
Balance at April 1, 2017
|
$
|
12
|
|
$
|
58,565
|
|
$
|
705
|
|
$
|
(1,453
|
)
|
$
|
(223
|
)
|
$
|
212
|
|
$
|
57,818
|
|
||||||
143
The Kraft Heinz Company
Consolidated Statements of Cash Flows
(in millions)
|
As Restated
|
|||||||||||
|
September 29, 2018
|
June 30,
2018
|
March 31,
2018
|
|||||||||
|
Nine Months Ended
|
Six Months Ended
|
Three Months Ended
|
|||||||||
|
CASH FLOWS FROM OPERATING ACTIVITIES:
|
|||||||||||
|
Net income/(loss)
|
$
|
2,374
|
|
$
|
1,756
|
|
$
|
1,003
|
|
||
|
Adjustments to reconcile net income/(loss) to operating cash flows:
|
|
|
|
|
|
|
|||||
|
Depreciation and amortization
|
712
|
|
462
|
|
227
|
|
|||||
|
Amortization of postretirement benefit plans prior service costs/(credits)
|
(261
|
)
|
(183
|
)
|
(106
|
)
|
|||||
|
Equity award compensation expense
|
44
|
|
27
|
|
7
|
|
|||||
|
Deferred income tax provision/(benefit)
|
104
|
|
79
|
|
(46
|
)
|
|||||
|
Postemployment benefit plan contributions
|
(64
|
)
|
(60
|
)
|
(22
|
)
|
|||||
|
Goodwill and intangible asset impairment losses
|
451
|
|
234
|
|
—
|
|
|||||
|
Nonmonetary currency devaluation
|
131
|
|
67
|
|
47
|
|
|||||
|
Other items, net
|
35
|
|
27
|
|
(22
|
)
|
|||||
|
Changes in current assets and liabilities:
|
|||||||||||
|
Trade receivables
|
(2,154
|
)
|
(2,001
|
)
|
(712
|
)
|
|||||
|
Inventories
|
(645
|
)
|
(428
|
)
|
(312
|
)
|
|||||
|
Accounts payable
|
130
|
|
127
|
|
(85
|
)
|
|||||
|
Other current assets
|
(103
|
)
|
(44
|
)
|
26
|
|
|||||
|
Other current liabilities
|
124
|
|
153
|
|
403
|
|
|||||
|
Net cash provided by/(used for) operating activities
|
878
|
|
216
|
|
408
|
|
|||||
|
CASH FLOWS FROM INVESTING ACTIVITIES:
|
|||||||||||
|
Cash receipts on sold receivables
|
1,296
|
|
1,221
|
|
436
|
|
|||||
|
Capital expenditures
|
(594
|
)
|
(438
|
)
|
(223
|
)
|
|||||
|
Payments to acquire business, net of cash acquired
|
(248
|
)
|
(215
|
)
|
(215
|
)
|
|||||
|
Other investing activities, net
|
31
|
|
11
|
|
6
|
|
|||||
|
Net cash provided by/(used for) investing activities
|
485
|
|
579
|
|
4
|
|
|||||
|
CASH FLOWS FROM FINANCING ACTIVITIES:
|
|||||||||||
|
Repayments of long-term debt
|
(2,706
|
)
|
(12
|
)
|
(6
|
)
|
|||||
|
Proceeds from issuance of long-term debt
|
2,990
|
|
2,990
|
|
—
|
|
|||||
|
Proceeds from issuance of commercial paper
|
2,485
|
|
1,525
|
|
1,524
|
|
|||||
|
Repayments of commercial paper
|
(1,950
|
)
|
(1,950
|
)
|
(1,006
|
)
|
|||||
|
Dividends paid - Series A Preferred Stock
|
—
|
|
—
|
|
—
|
|
|||||
|
Dividends paid - common stock
|
(2,421
|
)
|
(1,659
|
)
|
(897
|
)
|
|||||
|
Redemption of Series A Preferred Stock
|
—
|
|
—
|
|
—
|
|
|||||
|
Other financing activities, net
|
(35
|
)
|
(3
|
)
|
14
|
|
|||||
|
Net cash provided by/(used for) financing activities
|
(1,637
|
)
|
891
|
|
(371
|
)
|
|||||
|
Effect of exchange rate changes on cash, cash equivalents, and restricted cash
|
(128
|
)
|
(80
|
)
|
(10
|
)
|
|||||
|
Cash, cash equivalents, and restricted cash
|
|||||||||||
|
Net increase/(decrease)
|
(402
|
)
|
1,606
|
|
31
|
|
|||||
|
Balance at beginning of period
|
1,769
|
|
1,769
|
|
1,769
|
|
|||||
|
Balance at end of period
|
$
|
1,367
|
|
$
|
3,375
|
|
$
|
1,800
|
|
||
|
NON-CASH INVESTING ACTIVITIES:
|
|||||||||||
|
Beneficial interest obtained in exchange for securitized trade receivables
|
$
|
938
|
|
$
|
899
|
|
$
|
613
|
|
||
144
The Kraft Heinz Company
Consolidated Statements of Cash Flows
(in millions)
|
As Restated
|
|||||||||||
|
September 30, 2017
|
July 1,
2017
|
April 1,
2017
|
|||||||||
|
Nine Months Ended
|
Six Months Ended
|
Three Months Ended
|
|||||||||
|
CASH FLOWS FROM OPERATING ACTIVITIES:
|
|||||||||||
|
Net income/(loss)
|
$
|
2,950
|
|
$
|
2,038
|
|
$
|
881
|
|
||
|
Adjustments to reconcile net income/(loss) to operating cash flows:
|
|
|
|
|
|
|
|||||
|
Depreciation and amortization
|
789
|
|
517
|
|
262
|
|
|||||
|
Amortization of postretirement benefit plans prior service costs/(credits)
|
(247
|
)
|
(171
|
)
|
(82
|
)
|
|||||
|
Equity award compensation expense
|
36
|
|
24
|
|
11
|
|
|||||
|
Deferred income tax provision/(benefit)
|
432
|
|
223
|
|
68
|
|
|||||
|
Postemployment benefit plan contributions
|
(283
|
)
|
(90
|
)
|
(38
|
)
|
|||||
|
Goodwill and intangible asset impairment losses
|
49
|
|
48
|
|
—
|
|
|||||
|
Nonmonetary currency devaluation
|
36
|
|
33
|
|
8
|
|
|||||
|
Other items, net
|
(62
|
)
|
(48
|
)
|
40
|
|
|||||
|
Changes in current assets and liabilities:
|
|||||||||||
|
Trade receivables
|
(2,061
|
)
|
(1,598
|
)
|
(1,040
|
)
|
|||||
|
Inventories
|
(567
|
)
|
(418
|
)
|
(475
|
)
|
|||||
|
Accounts payable
|
123
|
|
84
|
|
62
|
|
|||||
|
Other current assets
|
(90
|
)
|
(103
|
)
|
(72
|
)
|
|||||
|
Other current liabilities
|
(1,090
|
)
|
(717
|
)
|
(240
|
)
|
|||||
|
Net cash provided by/(used for) operating activities
|
15
|
|
(178
|
)
|
(615
|
)
|
|||||
|
CASH FLOWS FROM INVESTING ACTIVITIES:
|
|||||||||||
|
Cash receipts on sold receivables
|
1,633
|
|
1,069
|
|
464
|
|
|||||
|
Capital expenditures
|
(956
|
)
|
(690
|
)
|
(368
|
)
|
|||||
|
Payments to acquire business, net of cash acquired
|
—
|
|
—
|
|
—
|
|
|||||
|
Other investing activities, net
|
45
|
|
44
|
|
38
|
|
|||||
|
Net cash provided by/(used for) investing activities
|
722
|
|
423
|
|
134
|
|
|||||
|
CASH FLOWS FROM FINANCING ACTIVITIES:
|
|||||||||||
|
Repayments of long-term debt
|
(2,635
|
)
|
(2,032
|
)
|
(27
|
)
|
|||||
|
Proceeds from issuance of long-term debt
|
1,496
|
|
4
|
|
2
|
|
|||||
|
Proceeds from issuance of commercial paper
|
5,495
|
|
4,213
|
|
2,324
|
|
|||||
|
Repayments of commercial paper
|
(5,709
|
)
|
(3,777
|
)
|
(2,068
|
)
|
|||||
|
Dividends paid - Series A Preferred Stock
|
—
|
|
—
|
|
—
|
|
|||||
|
Dividends paid - common stock
|
(2,161
|
)
|
(1,434
|
)
|
(736
|
)
|
|||||
|
Redemption of Series A Preferred Stock
|
—
|
|
—
|
|
—
|
|
|||||
|
Other financing activities, net
|
28
|
|
15
|
|
—
|
|
|||||
|
Net cash provided by/(used for) financing activities
|
(3,486
|
)
|
(3,011
|
)
|
(505
|
)
|
|||||
|
Effect of exchange rate changes on cash, cash equivalents, and restricted cash
|
43
|
|
29
|
|
13
|
|
|||||
|
Cash, cash equivalents, and restricted cash
|
|||||||||||
|
Net increase/(decrease)
|
(2,706
|
)
|
(2,737
|
)
|
(973
|
)
|
|||||
|
Balance at beginning of period
|
4,255
|
|
4,255
|
|
4,255
|
|
|||||
|
Balance at end of period
|
$
|
1,549
|
|
$
|
1,518
|
|
$
|
3,282
|
|
||
|
NON-CASH INVESTING ACTIVITIES:
|
|||||||||||
|
Beneficial interest obtained in exchange for securitized trade receivables
|
$
|
1,936
|
|
$
|
1,407
|
|
$
|
880
|
|
||
145
The Kraft Heinz Company
Condensed Consolidated Statement of Income
(in millions, except per share data)
|
For the Three Months Ended September 29, 2018
|
|||||||||||||
|
As Previously Reported
|
Restatement Impacts
|
Restatement Reference
|
As Restated
|
||||||||||
|
Net sales
|
$
|
6,378
|
|
$
|
5
|
|
(g)
|
$
|
6,383
|
|
|||
|
Cost of products sold
|
4,271
|
|
18
|
|
(a)(b)(g)
|
4,289
|
|
||||||
|
Gross profit
|
2,107
|
|
(13
|
)
|
2,094
|
|
|||||||
|
Selling, general and administrative expenses, excluding impairment losses
|
803
|
|
—
|
|
(g)
|
803
|
|
||||||
|
Goodwill impairment losses
|
—
|
|
—
|
|
—
|
|
|||||||
|
Intangible asset impairment losses
|
234
|
|
(17
|
)
|
(f)
|
217
|
|
||||||
|
Selling, general and administrative expenses
|
1,037
|
|
(17
|
)
|
1,020
|
|
|||||||
|
Operating income/(loss)
|
1,070
|
|
4
|
|
1,074
|
|
|||||||
|
Interest expense
|
327
|
|
(1
|
)
|
(b)(g)
|
326
|
|
||||||
|
Other expense/(income), net
|
(71
|
)
|
—
|
|
(71
|
)
|
|||||||
|
Income/(loss) before income taxes
|
814
|
|
5
|
|
819
|
|
|||||||
|
Provision for/(benefit from) income taxes
|
186
|
|
15
|
|
(a)(b)(e)(f)(g)
|
201
|
|
||||||
|
Net income/(loss)
|
628
|
|
(10
|
)
|
618
|
|
|||||||
|
Net income/(loss) attributable to noncontrolling interest
|
(2
|
)
|
1
|
|
(g)
|
(1
|
)
|
||||||
|
Net income/(loss) attributable to Kraft Heinz
|
630
|
|
(11
|
)
|
619
|
|
|||||||
|
Preferred dividends
|
—
|
|
—
|
|
—
|
|
|||||||
|
Net income/(loss) attributable to common shareholders
|
$
|
630
|
|
$
|
(11
|
)
|
$
|
619
|
|
||||
|
Per share data applicable to common shareholders:
|
|||||||||||||
|
Basic earnings/(loss)
|
$
|
0.52
|
|
$
|
(0.01
|
)
|
$
|
0.51
|
|
||||
|
Diluted earnings/(loss)
|
0.51
|
|
(0.01
|
)
|
0.50
|
|
|||||||
(a) Supplier Rebates—The correction of these misstatements resulted in an increase to cost of products sold of
$13 million
and a decrease to provision for income taxes of
$2 million
for the three months ended September 29, 2018.
(b) Capital Leases—The correction of these misstatements resulted in an increase to cost of products sold of less than
$1 million
, a decrease to interest expense of
$1 million
, and an increase to provision for income taxes of less than
$1 million
for the three months ended September 29, 2018.
(c) Customer Incentive Program Expense Misclassifications—None.
(d) Balance Sheet Misclassifications—None.
(e) Income Taxes—The correction of these misstatements resulted in an increase to provision for income taxes of
$14 million
for the three months ended September 29, 2018.
(f) Impairments—The correction of these misstatements resulted in a decrease to SG&A of
$17 million
and an increase to provision for income taxes of
$4 million
for the three months ended September 29, 2018.
(g) Other—The correction of these misstatements resulted in an increase to net sales of
$5 million
, an increase to cost of products sold of
$5 million
, an increase to SG&A of less than
$1 million
, a decrease to interest expense of less than
$1 million
, a decrease to provision for income taxes of
$1 million
, and a decrease to net loss attributable to noncontrolling interest of
$1 million
for the three months ended September 29, 2018.
See Note 2,
Restatement of Previously Issued Consolidated Financial Statements
, for a description of the misstatements in each category of restatements referenced by (a) through (g).
146
The Kraft Heinz Company
Condensed Consolidated Statement of Income
(in millions, except per share data)
|
For the Nine Months Ended September 29, 2018
|
|||||||||||||
|
As Previously Reported
|
Restatement Impacts
|
Restatement Reference
|
As Restated
|
||||||||||
|
Net sales
|
$
|
19,368
|
|
$
|
9
|
|
(g)
|
$
|
19,377
|
|
|||
|
Cost of products sold
|
12,651
|
|
21
|
|
(a)(b)(g)
|
12,672
|
|
||||||
|
Gross profit
|
6,717
|
|
(12
|
)
|
6,705
|
|
|||||||
|
Selling, general and administrative expenses, excluding impairment losses
|
2,338
|
|
—
|
|
(g)
|
2,338
|
|
||||||
|
Goodwill impairment losses
|
164
|
|
(31
|
)
|
(f)
|
133
|
|
||||||
|
Intangible asset impairment losses
|
335
|
|
(17
|
)
|
(f)
|
318
|
|
||||||
|
Selling, general and administrative expenses
|
2,837
|
|
(48
|
)
|
2,789
|
|
|||||||
|
Operating income/(loss)
|
3,880
|
|
36
|
|
3,916
|
|
|||||||
|
Interest expense
|
962
|
|
(3
|
)
|
(b)(g)
|
959
|
|
||||||
|
Other expense/(income), net
|
(196
|
)
|
—
|
|
(196
|
)
|
|||||||
|
Income/(loss) before income taxes
|
3,114
|
|
39
|
|
3,153
|
|
|||||||
|
Provision for/(benefit from) income taxes
|
738
|
|
41
|
|
(a)(b)(e)(f)(g)
|
779
|
|
||||||
|
Net income/(loss)
|
2,376
|
|
(2
|
)
|
2,374
|
|
|||||||
|
Net income/(loss) attributable to noncontrolling interest
|
(3
|
)
|
1
|
|
(g)
|
(2
|
)
|
||||||
|
Net income/(loss) attributable to Kraft Heinz
|
2,379
|
|
(3
|
)
|
2,376
|
|
|||||||
|
Preferred dividends
|
—
|
|
—
|
|
—
|
|
|||||||
|
Net income/(loss) attributable to common shareholders
|
$
|
2,379
|
|
$
|
(3
|
)
|
$
|
2,376
|
|
||||
|
Per share data applicable to common shareholders:
|
|||||||||||||
|
Basic earnings/(loss)
|
$
|
1.95
|
|
$
|
—
|
|
$
|
1.95
|
|
||||
|
Diluted earnings/(loss)
|
1.94
|
|
—
|
|
1.94
|
|
|||||||
(a) Supplier Rebates—The correction of these misstatements resulted in an increase to cost of products sold of
$22 million
and a decrease to provision for income taxes of
$3 million
for the nine months ended September 29, 2018.
(b) Capital Leases—The correction of these misstatements resulted in an increase to cost of products sold of
$1 million
, a decrease to interest expense of
$3 million
, and an increase to provision for income taxes of less than
$1 million
for the nine months ended September 29, 2018.
(c) Customer Incentive Program Expense Misclassifications—None.
(d) Balance Sheet Misclassifications—None.
(e) Income Taxes—The correction of these misstatements resulted in an increase to provision for income taxes of
$40 million
for the nine months ended September 29, 2018.
(f) Impairments—The correction of these misstatements resulted in a decrease to SG&A of
$48 million
and an increase to provision for income taxes of
$4 million
for the nine months ended September 29, 2018.
(g) Other—The correction of these misstatements resulted in an increase to net sales of
$9 million
, a decrease to cost of products sold of
$2 million
, an increase to SG&A of less than
$1 million
, a decrease to interest expense of less than
$1 million
, an increase to provision for income taxes of less than
$1 million
, and a decrease to net loss attributable to noncontrolling interest of
$1 million
for the nine months ended September 29, 2018.
See Note 2,
Restatement of Previously Issued Consolidated Financial Statements
, for a description of the misstatements in each category of restatements referenced by (a) through (g).
147
The Kraft Heinz Company
Condensed Consolidated Statement of Income
(in millions, except per share data)
|
For the Three Months Ended June 30, 2018
|
|||||||||||||
|
As Previously Reported
|
Restatement Impacts
|
Restatement Reference
|
As Restated
|
||||||||||
|
Net sales
|
$
|
6,686
|
|
$
|
4
|
|
(g)
|
$
|
6,690
|
|
|||
|
Cost of products sold
|
4,321
|
|
22
|
|
(a)(b)(g)
|
4,343
|
|
||||||
|
Gross profit
|
2,365
|
|
(18
|
)
|
2,347
|
|
|||||||
|
Selling, general and administrative expenses, excluding impairment losses
|
771
|
|
—
|
|
771
|
|
|||||||
|
Goodwill impairment losses
|
164
|
|
(31
|
)
|
(f)
|
133
|
|
||||||
|
Intangible asset impairment losses
|
101
|
|
—
|
|
101
|
|
|||||||
|
Selling, general and administrative expenses
|
1,036
|
|
(31
|
)
|
1,005
|
|
|||||||
|
Operating income/(loss)
|
1,329
|
|
13
|
|
1,342
|
|
|||||||
|
Interest expense
|
318
|
|
(2
|
)
|
(b)(g)
|
316
|
|
||||||
|
Other expense/(income), net
|
(35
|
)
|
—
|
|
(35
|
)
|
|||||||
|
Income/(loss) before income taxes
|
1,046
|
|
15
|
|
1,061
|
|
|||||||
|
Provision for/(benefit from) income taxes
|
291
|
|
17
|
|
(a)(b)(e)(f)(g)
|
308
|
|
||||||
|
Net income/(loss)
|
755
|
|
(2
|
)
|
753
|
|
|||||||
|
Net income/(loss) attributable to noncontrolling interest
|
(1
|
)
|
—
|
|
(1
|
)
|
|||||||
|
Net income/(loss) attributable to Kraft Heinz
|
756
|
|
(2
|
)
|
754
|
|
|||||||
|
Preferred dividends
|
—
|
|
—
|
|
—
|
|
|||||||
|
Net income/(loss) attributable to common shareholders
|
$
|
756
|
|
$
|
(2
|
)
|
$
|
754
|
|
||||
|
Per share data applicable to common shareholders:
|
|||||||||||||
|
Basic earnings/(loss)
|
$
|
0.62
|
|
$
|
—
|
|
$
|
0.62
|
|
||||
|
Diluted earnings/(loss)
|
0.62
|
|
—
|
|
0.62
|
|
|||||||
(a) Supplier Rebates—The correction of these misstatements resulted in an increase to cost of products sold of
$13 million
and a decrease to provision for income taxes of
$2 million
for the three months ended June 30, 2018.
(b) Capital Leases—The correction of these misstatements resulted in an increase to cost of products sold of
$1 million
, a decrease to interest expense of
$2 million
, and an increase to provision for income taxes of less than
$1 million
for the three months ended June 30, 2018.
(c) Customer Incentive Program Expense Misclassifications—None.
(d) Balance Sheet Misclassifications—None.
(e) Income Taxes—The correction of these misstatements resulted in an increase to provision for income taxes of
$21 million
for the three months ended June 30, 2018.
(f) Impairments—The correction of these misstatements resulted in a decrease to SG&A of
$31 million
and an increase to provision for income taxes of less than
$1 million
for the three months ended June 30, 2018.
(g) Other—The correction of these misstatements resulted in an increase to net sales of
$4 million
, an increase to cost of products sold of
$8 million
, a decrease to interest expense of less than
$1 million
, and a decrease to provision for income taxes of
$2 million
for the three months ended June 30, 2018.
See Note 2,
Restatement of Previously Issued Consolidated Financial Statements
, for a description of the misstatements in each category of restatements referenced by (a) through (g).
148
The Kraft Heinz Company
Condensed Consolidated Statement of Income
(in millions, except per share data)
|
For the Six Months Ended June 30, 2018
|
|||||||||||||
|
As Previously Reported
|
Restatement Impacts
|
Restatement Reference
|
As Restated
|
||||||||||
|
Net sales
|
$
|
12,990
|
|
$
|
4
|
|
(g)
|
$
|
12,994
|
|
|||
|
Cost of products sold
|
8,380
|
|
3
|
|
(a)(b)(g)
|
8,383
|
|
||||||
|
Gross profit
|
4,610
|
|
1
|
|
4,611
|
|
|||||||
|
Selling, general and administrative expenses, excluding impairment losses
|
1,535
|
|
—
|
|
1,535
|
|
|||||||
|
Goodwill impairment losses
|
164
|
|
(31
|
)
|
(f)
|
133
|
|
||||||
|
Intangible asset impairment losses
|
101
|
|
—
|
|
101
|
|
|||||||
|
Selling, general and administrative expenses
|
1,800
|
|
(31
|
)
|
1,769
|
|
|||||||
|
Operating income/(loss)
|
2,810
|
|
32
|
|
2,842
|
|
|||||||
|
Interest expense
|
635
|
|
(2
|
)
|
(b)(g)
|
633
|
|
||||||
|
Other expense/(income), net
|
(125
|
)
|
—
|
|
(125
|
)
|
|||||||
|
Income/(loss) before income taxes
|
2,300
|
|
34
|
|
2,334
|
|
|||||||
|
Provision for/(benefit from) income taxes
|
552
|
|
26
|
|
(a)(b)(e)(f)(g)
|
578
|
|
||||||
|
Net income/(loss)
|
1,748
|
|
8
|
|
1,756
|
|
|||||||
|
Net income/(loss) attributable to noncontrolling interest
|
(1
|
)
|
—
|
|
(1
|
)
|
|||||||
|
Net income/(loss) attributable to Kraft Heinz
|
1,749
|
|
8
|
|
1,757
|
|
|||||||
|
Preferred dividends
|
—
|
|
—
|
|
—
|
|
|||||||
|
Net income/(loss) attributable to common shareholders
|
$
|
1,749
|
|
$
|
8
|
|
$
|
1,757
|
|
||||
|
Per share data applicable to common shareholders:
|
|||||||||||||
|
Basic earnings/(loss)
|
$
|
1.43
|
|
$
|
0.01
|
|
$
|
1.44
|
|
||||
|
Diluted earnings/(loss)
|
1.43
|
|
—
|
|
1.43
|
|
|||||||
(a) Supplier Rebates—The correction of these misstatements resulted in an increase to cost of products sold of
$9 million
and a decrease to provision for income taxes of
$1 million
for the six months ended June 30, 2018.
(b) Capital Leases—The correction of these misstatements resulted in an increase to cost of products sold of
$1 million
, a decrease to interest expense of
$2 million
, and an increase to provision for income taxes of less than
$1 million
for the six months ended June 30, 2018.
(c) Customer Incentive Program Expense Misclassifications—None.
(d) Balance Sheet Misclassifications—None.
(e) Income Taxes—The correction of these misstatements resulted in an increase to provision for income taxes of
$26 million
for the six months ended June 30, 2018.
(f) Impairments—The correction of these misstatements resulted in a decrease to SG&A of
$31 million
and an increase to provision for income taxes of less than
$1 million
for the six months ended June 30, 2018.
(g) Other—The correction of these misstatements resulted in an increase to net sales of
$4 million
, a decrease to cost of products sold of
$7 million
, a decrease to interest expense of less than
$1 million
, and an increase to provision for income taxes of
$1 million
for the six months ended June 30, 2018.
See Note 2,
Restatement of Previously Issued Consolidated Financial Statements
, for a description of the misstatements in each category of restatements referenced by (a) through (g).
149
The Kraft Heinz Company
Condensed Consolidated Statement of Income
(in millions, except per share data)
|
For the Three Months Ended March 31, 2018
|
|||||||||||||
|
As Previously Reported
|
Restatement Impacts
|
Restatement Reference
|
As Restated
|
||||||||||
|
Net sales
|
$
|
6,304
|
|
$
|
—
|
|
$
|
6,304
|
|
||||
|
Cost of products sold
|
4,059
|
|
(19
|
)
|
(a)(b)(g)
|
4,040
|
|
||||||
|
Gross profit
|
2,245
|
|
19
|
|
2,264
|
|
|||||||
|
Selling, general and administrative expenses, excluding impairment losses
|
764
|
|
—
|
|
764
|
|
|||||||
|
Goodwill impairment losses
|
—
|
|
—
|
|
—
|
|
|||||||
|
Intangible asset impairment losses
|
—
|
|
—
|
|
(f)
|
—
|
|
||||||
|
Selling, general and administrative expenses
|
764
|
|
—
|
|
764
|
|
|||||||
|
Operating income/(loss)
|
1,481
|
|
19
|
|
1,500
|
|
|||||||
|
Interest expense
|
317
|
|
—
|
|
(b)(g)
|
317
|
|
||||||
|
Other expense/(income), net
|
(90
|
)
|
—
|
|
(90
|
)
|
|||||||
|
Income/(loss) before income taxes
|
1,254
|
|
19
|
|
1,273
|
|
|||||||
|
Provision for/(benefit from) income taxes
|
261
|
|
9
|
|
(a)(b)(e)(f)(g)
|
270
|
|
||||||
|
Net income/(loss)
|
993
|
|
10
|
|
1,003
|
|
|||||||
|
Net income/(loss) attributable to noncontrolling interest
|
—
|
|
—
|
|
—
|
|
|||||||
|
Net income/(loss) attributable to Kraft Heinz
|
993
|
|
10
|
|
1,003
|
|
|||||||
|
Preferred dividends
|
—
|
|
—
|
|
—
|
|
|||||||
|
Net income/(loss) attributable to common shareholders
|
$
|
993
|
|
$
|
10
|
|
$
|
1,003
|
|
||||
|
Per share data applicable to common shareholders:
|
|||||||||||||
|
Basic earnings/(loss)
|
$
|
0.81
|
|
$
|
0.01
|
|
$
|
0.82
|
|
||||
|
Diluted earnings/(loss)
|
0.81
|
|
0.01
|
|
0.82
|
|
|||||||
(a) Supplier Rebates—The correction of these misstatements resulted in a decrease to cost of products sold of
$4 million
and an increase to provision for income taxes of
$1 million
for the three months ended March 31, 2018.
(b) Capital Leases—The correction of these misstatements resulted in a decrease to cost of products sold of less than
$1 million
, a decrease to interest expense of less than
$1 million
, and an increase to provision for income taxes of less than
$1 million
for the three months ended March 31, 2018.
(c) Customer Incentive Program Expense Misclassifications—None.
(d) Balance Sheet Misclassifications—None.
(e) Income Taxes—The correction of these misstatements resulted in an increase to provision for income taxes of
$5 million
for the three months ended March 31, 2018.
(f) Impairments—The correction of these misstatements resulted in a decrease to SG&A of less than
$1 million
and an increase to provision for income taxes of less than
$1 million
for the three months ended March 31, 2018.
(g) Other—The correction of these misstatements resulted in a decrease to cost of products sold of
$15 million
, a decrease to interest expense of less than
$1 million
, and an increase to provision for income taxes of
$3 million
for the three months ended March 31, 2018.
See Note 2,
Restatement of Previously Issued Consolidated Financial Statements
, for a description of the misstatements in each category of restatements referenced by (a) through (g).
150
The Kraft Heinz Company
Condensed Consolidated Statement of Income
(in millions, except per share data)
|
For the Three Months Ended December 30, 2017
|
|||||||||||||||||||||
|
As Previously Reported
|
Restatement Impacts
|
Restatement Reference
|
As Restated
|
ASU Adoption Impacts
|
As Restated & Recast
|
||||||||||||||||
|
Net sales
|
$
|
6,877
|
|
$
|
(36
|
)
|
(c)(g)
|
$
|
6,841
|
|
$
|
—
|
|
$
|
6,841
|
|
|||||
|
Cost of products sold
|
4,470
|
|
(18
|
)
|
(a)(b)(c)(g)
|
4,452
|
|
102
|
|
4,554
|
|
||||||||||
|
Gross profit
|
2,407
|
|
(18
|
)
|
2,389
|
|
(102
|
)
|
2,287
|
|
|||||||||||
|
Selling, general and administrative expenses, excluding impairment losses
|
767
|
|
(4
|
)
|
(c)(g)
|
763
|
|
15
|
|
778
|
|
||||||||||
|
Goodwill impairment losses
|
—
|
|
—
|
|
—
|
|
—
|
|
—
|
|
|||||||||||
|
Intangible asset impairment losses
|
—
|
|
—
|
|
(f)
|
—
|
|
—
|
|
—
|
|
||||||||||
|
Selling, general and administrative expenses
|
767
|
|
(4
|
)
|
763
|
|
15
|
|
778
|
|
|||||||||||
|
Operating income/(loss)
|
1,640
|
|
(14
|
)
|
1,626
|
|
(117
|
)
|
1,509
|
|
|||||||||||
|
Interest expense
|
308
|
|
—
|
|
(g)
|
308
|
|
—
|
|
308
|
|
||||||||||
|
Other expense/(income), net
|
1
|
|
—
|
|
1
|
|
(117
|
)
|
(116
|
)
|
|||||||||||
|
Income/(loss) before income taxes
|
1,331
|
|
(14
|
)
|
1,317
|
|
—
|
|
1,317
|
|
|||||||||||
|
Provision for/(benefit from) income taxes
|
(6,665
|
)
|
—
|
|
(a)(b)(e)(f)(g)
|
(6,665
|
)
|
—
|
|
(6,665
|
)
|
||||||||||
|
Net income/(loss)
|
7,996
|
|
(14
|
)
|
7,982
|
|
—
|
|
7,982
|
|
|||||||||||
|
Net income/(loss) attributable to noncontrolling interest
|
(7
|
)
|
—
|
|
(7
|
)
|
—
|
|
(7
|
)
|
|||||||||||
|
Net income/(loss) attributable to Kraft Heinz
|
8,003
|
|
(14
|
)
|
7,989
|
|
—
|
|
7,989
|
|
|||||||||||
|
Preferred dividends
|
—
|
|
—
|
|
—
|
|
—
|
|
—
|
|
|||||||||||
|
Net income/(loss) attributable to common shareholders
|
$
|
8,003
|
|
$
|
(14
|
)
|
$
|
7,989
|
|
$
|
—
|
|
$
|
7,989
|
|
||||||
|
Per share data applicable to common shareholders:
|
|||||||||||||||||||||
|
Basic earnings/(loss)
|
$
|
6.57
|
|
$
|
(0.02
|
)
|
$
|
6.55
|
|
$
|
—
|
|
$
|
6.55
|
|
||||||
|
Diluted earnings/(loss)
|
6.52
|
|
(0.02
|
)
|
6.50
|
|
—
|
|
6.50
|
|
|||||||||||
(a) Supplier Rebates—The correction of these misstatements resulted in an increase to cost of products sold of
$21 million
and a decrease to benefit from income taxes of
$8 million
for the three months ended December 30, 2017.
(b) Capital Leases—The correction of these misstatements resulted in a decrease to cost of products sold of less than
$1 million
, a decrease to interest expense of less than
$1 million
, and a decrease to benefit from income taxes of less than
$1 million
for the three months ended December 30, 2017.
(c) Customer Incentive Program Expense Misclassifications—As previously disclosed in March 2018, the correction of these misstatements resulted in a decrease to net sales of
$33 million
, a decrease to cost of products sold of
$31 million
, and a decrease to SG&A of
$2 million
for the three months ended December 30, 2017.
(d) Balance Sheet Misclassifications—None.
(e) Income Taxes—The correction of these misstatements resulted in an increase to benefit from income taxes of
$12 million
for the three months ended December 30, 2017.
(f) Impairments—The correction of these misstatements resulted in a decrease to SG&A of less than
$1 million
and a decrease to benefit from income taxes of less than
$1 million
for the three months ended December 30, 2017.
(g) Other—The correction of these misstatements resulted in a decrease to net sales of
$3 million
, a decrease to cost of products sold of
$8 million
, a decrease to SG&A of
$2 million
, a decrease to interest expense of less than
$1 million
, and a decrease to benefit from income taxes of
$4 million
for the three months ended December 30, 2017.
The values as previously reported for the three months ended December 30, 2017 were derived from our Annual Report on Form 10-K for the year ended December 30, 2017 filed on February 16, 2018.
151
See Note 2,
Restatement of Previously Issued Consolidated Financial Statements
, for a description of the misstatements in each category of restatements referenced by (a) through (g).
152
The Kraft Heinz Company
Condensed Consolidated Statement of Income
(in millions, except per share data)
|
For the Three Months Ended September 30, 2017
|
|||||||||||||||||||||
|
As Previously Reported
|
Restatement Impacts
|
Restatement Reference
|
As Restated
|
ASU Adoption Impacts
|
As Restated & Recast
|
||||||||||||||||
|
Net sales
|
$
|
6,314
|
|
$
|
(35
|
)
|
(c)(g)
|
$
|
6,279
|
|
$
|
—
|
|
$
|
6,279
|
|
|||||
|
Cost of products sold
|
4,000
|
|
14
|
|
(a)(c)(g)
|
4,014
|
|
109
|
|
4,123
|
|
||||||||||
|
Gross profit
|
2,314
|
|
(49
|
)
|
2,265
|
|
(109
|
)
|
2,156
|
|
|||||||||||
|
Selling, general and administrative expenses, excluding impairment losses
|
652
|
|
(2
|
)
|
(c)
|
650
|
|
14
|
|
664
|
|
||||||||||
|
Goodwill impairment losses
|
—
|
|
—
|
|
—
|
|
—
|
|
—
|
|
|||||||||||
|
Intangible asset impairment losses
|
1
|
|
—
|
|
(f)
|
1
|
|
—
|
|
1
|
|
||||||||||
|
Selling, general and administrative expenses
|
653
|
|
(2
|
)
|
651
|
|
14
|
|
665
|
|
|||||||||||
|
Operating income/(loss)
|
1,661
|
|
(47
|
)
|
1,614
|
|
(123
|
)
|
1,491
|
|
|||||||||||
|
Interest expense
|
306
|
|
—
|
|
(g)
|
306
|
|
—
|
|
306
|
|
||||||||||
|
Other expense/(income), net
|
(4
|
)
|
—
|
|
(4
|
)
|
(123
|
)
|
(127
|
)
|
|||||||||||
|
Income/(loss) before income taxes
|
1,359
|
|
(47
|
)
|
1,312
|
|
—
|
|
1,312
|
|
|||||||||||
|
Provision for/(benefit from) income taxes
|
416
|
|
(16
|
)
|
(a)(e)(f)(g)
|
400
|
|
—
|
|
400
|
|
||||||||||
|
Net income/(loss)
|
943
|
|
(31
|
)
|
912
|
|
—
|
|
912
|
|
|||||||||||
|
Net income/(loss) attributable to noncontrolling interest
|
(1
|
)
|
—
|
|
(1
|
)
|
—
|
|
(1
|
)
|
|||||||||||
|
Net income/(loss) attributable to Kraft Heinz
|
944
|
|
(31
|
)
|
913
|
|
—
|
|
913
|
|
|||||||||||
|
Preferred dividends
|
—
|
|
—
|
|
—
|
|
—
|
|
—
|
|
|||||||||||
|
Net income/(loss) attributable to common shareholders
|
$
|
944
|
|
$
|
(31
|
)
|
$
|
913
|
|
$
|
—
|
|
$
|
913
|
|
||||||
|
Per share data applicable to common shareholders:
|
|||||||||||||||||||||
|
Basic earnings/(loss)
|
$
|
0.78
|
|
$
|
(0.03
|
)
|
$
|
0.75
|
|
$
|
—
|
|
$
|
0.75
|
|
||||||
|
Diluted earnings/(loss)
|
0.77
|
|
(0.03
|
)
|
0.74
|
|
—
|
|
0.74
|
|
|||||||||||
(a) Supplier Rebates—The correction of these misstatements resulted in an increase to cost of products sold of
$36 million
and a decrease to provision for income taxes of
$13 million
for the three months ended September 30, 2017.
(b) Capital Leases—None.
(c) Customer Incentive Program Expense Misclassifications—As previously disclosed in March 2018, the correction of these misstatements resulted in a decrease to net sales of
$34 million
, a decrease to cost of products sold of
$32 million
, and a decrease to SG&A of
$2 million
for the three months ended September 30, 2017.
(d) Balance Sheet Misclassifications—None.
(e) Income Taxes—The correction of these misstatements resulted in an increase to provision for income taxes of less than
$1 million
for the three months ended September 30, 2017.
(f) Impairments—The correction of these misstatements resulted in a decrease to SG&A of less than
$1 million
and an increase to provision for income taxes of less than
$1 million
for the three months ended September 30, 2017.
(g) Other—The correction of these misstatements resulted in a decrease to net sales of
$1 million
, an increase to cost of products sold of
$10 million
, a decrease to interest expense of less than
$1 million
, and a decrease to provision for income taxes of
$3 million
for the three months ended September 30, 2017.
The values as previously reported for the three months ended September 30, 2017 were derived from our Quarterly Report on Form 10-Q for the quarter ended September 30, 2017 filed on November 7, 2017.
See Note 2,
Restatement of Previously Issued Consolidated Financial Statements
, for a description of the misstatements in each category of restatements referenced by (a) through (g).
153
The Kraft Heinz Company
Condensed Consolidated Statement of Income
(in millions, except per share data)
|
For the Nine Months Ended September 30, 2017
|
|||||||||||||||||||||
|
As Previously Reported
|
Restatement Impacts
|
Restatement Reference
|
As Restated
|
ASU Adoption Impacts
|
As Restated & Recast
|
||||||||||||||||
|
Net sales
|
$
|
19,355
|
|
$
|
(120
|
)
|
(c)(g)
|
$
|
19,235
|
|
$
|
—
|
|
$
|
19,235
|
|
|||||
|
Cost of products sold
|
12,059
|
|
(26
|
)
|
(a)(c)(g)
|
12,033
|
|
456
|
|
12,489
|
|
||||||||||
|
Gross profit
|
7,296
|
|
(94
|
)
|
7,202
|
|
(456
|
)
|
6,746
|
|
|||||||||||
|
Selling, general and administrative expenses, excluding impairment losses
|
2,114
|
|
(28
|
)
|
(c)(g)
|
2,086
|
|
63
|
|
2,149
|
|
||||||||||
|
Goodwill impairment losses
|
—
|
|
—
|
|
—
|
|
—
|
|
—
|
|
|||||||||||
|
Intangible asset impairment losses
|
49
|
|
—
|
|
(f)
|
49
|
|
—
|
|
49
|
|
||||||||||
|
Selling, general and administrative expenses
|
2,163
|
|
(28
|
)
|
2,135
|
|
63
|
|
2,198
|
|
|||||||||||
|
Operating income/(loss)
|
5,133
|
|
(66
|
)
|
5,067
|
|
(519
|
)
|
4,548
|
|
|||||||||||
|
Interest expense
|
926
|
|
—
|
|
(g)
|
926
|
|
—
|
|
926
|
|
||||||||||
|
Other expense/(income), net
|
8
|
|
—
|
|
8
|
|
(519
|
)
|
(511
|
)
|
|||||||||||
|
Income/(loss) before income taxes
|
4,199
|
|
(66
|
)
|
4,133
|
|
—
|
|
4,133
|
|
|||||||||||
|
Provision for/(benefit from) income taxes
|
1,205
|
|
(22
|
)
|
(a)(e)(f)(g)
|
1,183
|
|
—
|
|
1,183
|
|
||||||||||
|
Net income/(loss)
|
2,994
|
|
(44
|
)
|
2,950
|
|
—
|
|
2,950
|
|
|||||||||||
|
Net income/(loss) attributable to noncontrolling interest
|
(2
|
)
|
—
|
|
(2
|
)
|
—
|
|
(2
|
)
|
|||||||||||
|
Net income/(loss) attributable to Kraft Heinz
|
2,996
|
|
(44
|
)
|
2,952
|
|
—
|
|
2,952
|
|
|||||||||||
|
Preferred dividends
|
—
|
|
—
|
|
—
|
|
—
|
|
—
|
|
|||||||||||
|
Net income/(loss) attributable to common shareholders
|
$
|
2,996
|
|
$
|
(44
|
)
|
$
|
2,952
|
|
$
|
—
|
|
$
|
2,952
|
|
||||||
|
Per share data applicable to common shareholders:
|
|||||||||||||||||||||
|
Basic earnings/(loss)
|
$
|
2.46
|
|
$
|
(0.04
|
)
|
$
|
2.42
|
|
$
|
—
|
|
$
|
2.42
|
|
||||||
|
Diluted earnings/(loss)
|
2.44
|
|
(0.04
|
)
|
2.40
|
|
—
|
|
2.40
|
|
|||||||||||
(a) Supplier Rebates—The correction of these misstatements resulted in an increase to cost of products sold of
$72 million
and a decrease to provision for income taxes of
$26 million
for the nine months ended September 30, 2017.
(b) Capital Leases—None.
(c) Customer Incentive Program Expense Misclassifications—As previously disclosed in March 2018, the correction of these misstatements resulted in a decrease to net sales of
$114 million
, a decrease to cost of products sold of
$108 million
, and a decrease to SG&A of
$6 million
for the nine months ended September 30, 2017.
(d) Balance Sheet Misclassifications—None.
(e) Income Taxes—The correction of these misstatements resulted in an increase to provision for income taxes of less than
$1 million
for the nine months ended September 30, 2017.
(f) Impairments—The correction of these misstatements resulted in a decrease to SG&A of less than
$1 million
and an increase to provision for income taxes of less than
$1 million
for the nine months ended September 30, 2017.
(g) Other—The correction of these misstatements resulted in a decrease to net sales of
$6 million
, an increase to cost of products sold of
$10 million
, a decrease to SG&A of
$22 million
, a decrease to interest expense of less than
$1 million
, and an increase to provision for income taxes of
$4 million
for the nine months ended September 30, 2017.
The values as previously reported for the nine months ended September 30, 2017 were derived from our Quarterly Report on Form 10-Q for the quarter ended September 30, 2017 filed on November 7, 2017.
See Note 2,
Restatement of Previously Issued Consolidated Financial Statements
, for a description of the misstatements in each category of restatements referenced by (a) through (g).
154
The Kraft Heinz Company
Condensed Consolidated Statement of Income
(in millions, except per share data)
|
For the Three Months Ended July 1, 2017
|
|||||||||||||||||||||
|
As Previously Reported
|
Restatement Impacts
|
Restatement Reference
|
As Restated
|
ASU Adoption Impacts
|
As Restated & Recast
|
||||||||||||||||
|
Net sales
|
$
|
6,677
|
|
$
|
(43
|
)
|
(c)(g)
|
$
|
6,634
|
|
$
|
—
|
|
$
|
6,634
|
|
|||||
|
Cost of products sold
|
3,996
|
|
(15
|
)
|
(a)(c)(g)
|
3,981
|
|
246
|
|
4,227
|
|
||||||||||
|
Gross profit
|
2,681
|
|
(28
|
)
|
2,653
|
|
(246
|
)
|
2,407
|
|
|||||||||||
|
Selling, general and administrative expenses, excluding impairment losses
|
712
|
|
(24
|
)
|
(c)(g)
|
688
|
|
32
|
|
720
|
|
||||||||||
|
Goodwill impairment losses
|
—
|
|
—
|
|
—
|
|
—
|
|
—
|
|
|||||||||||
|
Intangible asset impairment losses
|
48
|
|
—
|
|
(f)
|
48
|
|
—
|
|
48
|
|
||||||||||
|
Selling, general and administrative expenses
|
760
|
|
(24
|
)
|
736
|
|
32
|
|
768
|
|
|||||||||||
|
Operating income/(loss)
|
1,921
|
|
(4
|
)
|
1,917
|
|
(278
|
)
|
1,639
|
|
|||||||||||
|
Interest expense
|
307
|
|
—
|
|
(g)
|
307
|
|
—
|
|
307
|
|
||||||||||
|
Other expense/(income), net
|
24
|
|
—
|
|
24
|
|
(278
|
)
|
(254
|
)
|
|||||||||||
|
Income/(loss) before income taxes
|
1,590
|
|
(4
|
)
|
1,586
|
|
—
|
|
1,586
|
|
|||||||||||
|
Provision for/(benefit from) income taxes
|
430
|
|
(1
|
)
|
(a)(e)(f)(g)
|
429
|
|
—
|
|
429
|
|
||||||||||
|
Net income/(loss)
|
1,160
|
|
(3
|
)
|
1,157
|
|
—
|
|
1,157
|
|
|||||||||||
|
Net income/(loss) attributable to noncontrolling interest
|
1
|
|
—
|
|
1
|
|
—
|
|
1
|
|
|||||||||||
|
Net income/(loss) attributable to Kraft Heinz
|
1,159
|
|
(3
|
)
|
1,156
|
|
—
|
|
1,156
|
|
|||||||||||
|
Preferred dividends
|
—
|
|
—
|
|
—
|
|
—
|
|
—
|
|
|||||||||||
|
Net income/(loss) attributable to common shareholders
|
$
|
1,159
|
|
$
|
(3
|
)
|
$
|
1,156
|
|
$
|
—
|
|
$
|
1,156
|
|
||||||
|
Per share data applicable to common shareholders:
|
|||||||||||||||||||||
|
Basic earnings/(loss)
|
$
|
0.95
|
|
$
|
—
|
|
$
|
0.95
|
|
$
|
—
|
|
$
|
0.95
|
|
||||||
|
Diluted earnings/(loss)
|
0.94
|
|
—
|
|
0.94
|
|
—
|
|
0.94
|
|
|||||||||||
(a) Supplier Rebates—The correction of these misstatements resulted in an increase to cost of products sold of
$23 million
and a decrease to provision for income taxes of
$8 million
for the three months ended July 1, 2017.
(b) Capital Leases—None.
(c) Customer Incentive Program Expense Misclassifications—As previously disclosed in March 2018, the correction of these misstatements resulted in a decrease to net sales of
$40 million
, a decrease to cost of products sold of
$38 million
, and a decrease to SG&A of
$2 million
for the three months ended July 1, 2017.
(d) Balance Sheet Misclassifications—None.
(e) Income Taxes—The correction of these misstatements resulted in a decrease to provision for income taxes of less than
$1 million
for the three months ended July 1, 2017.
(f) Impairments—The correction of these misstatements resulted in a decrease to SG&A of less than
$1 million
and an increase to provision for income taxes of less than
$1 million
for the three months ended July 1, 2017.
(g) Other—The correction of these misstatements resulted in a decrease to net sales of
$3 million
, an increase to cost of products sold of less than
$1 million
, a decrease to SG&A of
$22 million
, a decrease to interest expense of less than
$1 million
, and an increase to provision for income taxes of
$7 million
for the three months ended July 1, 2017.
The values as previously reported for the three months ended July 1, 2017 were derived from our Quarterly Report on Form 10-Q/A for the quarter ended July 1, 2017 filed on November 7, 2017.
See Note 2,
Restatement of Previously Issued Consolidated Financial Statements
, for a description of the misstatements in each category of restatements referenced by (a) through (g).
155
The Kraft Heinz Company
Condensed Consolidated Statement of Income
(in millions, except per share data)
|
For the Six Months Ended July 1, 2017
|
|||||||||||||||||||||
|
As Previously Reported
|
Restatement Impacts
|
Restatement Reference
|
As Restated
|
ASU Adoption Impacts
|
As Restated & Recast
|
||||||||||||||||
|
Net sales
|
$
|
13,041
|
|
$
|
(85
|
)
|
(c)(g)
|
$
|
12,956
|
|
$
|
—
|
|
$
|
12,956
|
|
|||||
|
Cost of products sold
|
8,059
|
|
(40
|
)
|
(a)(c)(g)
|
8,019
|
|
347
|
|
8,366
|
|
||||||||||
|
Gross profit
|
4,982
|
|
(45
|
)
|
4,937
|
|
(347
|
)
|
4,590
|
|
|||||||||||
|
Selling, general and administrative expenses, excluding impairment losses
|
1,462
|
|
(26
|
)
|
(c)(g)
|
1,436
|
|
49
|
|
1,485
|
|
||||||||||
|
Goodwill impairment losses
|
—
|
|
—
|
|
—
|
|
—
|
|
—
|
|
|||||||||||
|
Intangible asset impairment losses
|
48
|
|
—
|
|
(f)
|
48
|
|
—
|
|
48
|
|
||||||||||
|
Selling, general and administrative expenses
|
1,510
|
|
(26
|
)
|
1,484
|
|
49
|
|
1,533
|
|
|||||||||||
|
Operating income/(loss)
|
3,472
|
|
(19
|
)
|
3,453
|
|
(396
|
)
|
3,057
|
|
|||||||||||
|
Interest expense
|
620
|
|
—
|
|
(g)
|
620
|
|
—
|
|
620
|
|
||||||||||
|
Other expense/(income), net
|
12
|
|
—
|
|
12
|
|
(396
|
)
|
(384
|
)
|
|||||||||||
|
Income/(loss) before income taxes
|
2,840
|
|
(19
|
)
|
2,821
|
|
—
|
|
2,821
|
|
|||||||||||
|
Provision for/(benefit from) income taxes
|
789
|
|
(6
|
)
|
(a)(e)(f)(g)
|
783
|
|
—
|
|
783
|
|
||||||||||
|
Net income/(loss)
|
2,051
|
|
(13
|
)
|
2,038
|
|
—
|
|
2,038
|
|
|||||||||||
|
Net income/(loss) attributable to noncontrolling interest
|
(1
|
)
|
—
|
|
(1
|
)
|
—
|
|
(1
|
)
|
|||||||||||
|
Net income/(loss) attributable to Kraft Heinz
|
2,052
|
|
(13
|
)
|
2,039
|
|
—
|
|
2,039
|
|
|||||||||||
|
Preferred dividends
|
—
|
|
—
|
|
—
|
|
—
|
|
—
|
|
|||||||||||
|
Net income/(loss) attributable to common shareholders
|
$
|
2,052
|
|
$
|
(13
|
)
|
$
|
2,039
|
|
$
|
—
|
|
$
|
2,039
|
|
||||||
|
Per share data applicable to common shareholders:
|
|||||||||||||||||||||
|
Basic earnings/(loss)
|
$
|
1.69
|
|
$
|
(0.02
|
)
|
$
|
1.67
|
|
$
|
—
|
|
$
|
1.67
|
|
||||||
|
Diluted earnings/(loss)
|
1.67
|
|
(0.01
|
)
|
1.66
|
|
—
|
|
1.66
|
|
|||||||||||
(a) Supplier Rebates—The correction of these misstatements resulted in an increase to cost of products sold of
$36 million
and a decrease to provision for income taxes of
$13 million
for the six months ended July 1, 2017.
(b) Capital Leases—None.
(c) Customer Incentive Program Expense Misclassifications—As previously disclosed in March 2018, the correction of these misstatements resulted in a decrease to net sales of
$80 million
, a decrease to cost of products sold of
$76 million
, and a decrease to SG&A of
$4 million
for the six months ended July 1, 2017.
(d) Balance Sheet Misclassifications—None.
(e) Income Taxes—The correction of these misstatements resulted in an increase to provision for income taxes of less than
$1 million
for the six months ended July 1, 2017.
(f) Impairments—The correction of these misstatements resulted in a decrease to SG&A of less than
$1 million
and an increase to provision for income taxes of less than
$1 million
for the six months ended July 1, 2017.
(g) Other—The correction of these misstatements resulted in a decrease to net sales of
$5 million
, an increase to cost of products sold of less than
$1 million
, a decrease to SG&A of
$22 million
, a decrease to interest expense of less than
$1 million
, and an increase to provision for income taxes of
$7 million
for the six months ended July 1, 2017.
The values as previously reported for the six months ended July 1, 2017 were derived from our Quarterly Report on Form 10-Q/A for the quarter ended July 1, 2017 filed on November 7, 2017.
See Note 2,
Restatement of Previously Issued Consolidated Financial Statements
, for a description of the misstatements in each category of restatements referenced by (a) through (g).
156
The Kraft Heinz Company
Condensed Consolidated Statements of Income
(in millions, except per share data)
|
For the Three Months Ended April 1, 2017
|
|||||||||||||||||||||
|
As Previously Reported
|
Restatement Impacts
|
Restatement Reference
|
As Restated
|
ASU Adoption Impacts
|
As Restated & Recast
|
||||||||||||||||
|
Net sales
|
$
|
6,364
|
|
$
|
(42
|
)
|
(c)(g)
|
$
|
6,322
|
|
$
|
—
|
|
$
|
6,322
|
|
|||||
|
Cost of products sold
|
4,063
|
|
(25
|
)
|
(a)(c)(g)
|
4,038
|
|
101
|
|
4,139
|
|
||||||||||
|
Gross profit
|
2,301
|
|
(17
|
)
|
2,284
|
|
(101
|
)
|
2,183
|
|
|||||||||||
|
Selling, general and administrative expenses, excluding impairment losses
|
750
|
|
(2
|
)
|
(c)
|
748
|
|
17
|
|
765
|
|
||||||||||
|
Goodwill impairment losses
|
—
|
|
—
|
|
—
|
|
—
|
|
—
|
|
|||||||||||
|
Intangible asset impairment losses
|
—
|
|
—
|
|
(f)
|
—
|
|
—
|
|
—
|
|
||||||||||
|
Selling, general and administrative expenses
|
750
|
|
(2
|
)
|
748
|
|
17
|
|
765
|
|
|||||||||||
|
Operating income/(loss)
|
1,551
|
|
(15
|
)
|
1,536
|
|
(118
|
)
|
1,418
|
|
|||||||||||
|
Interest expense
|
313
|
|
—
|
|
(g)
|
313
|
|
—
|
|
313
|
|
||||||||||
|
Other expense/(income), net
|
(12
|
)
|
—
|
|
(12
|
)
|
(118
|
)
|
(130
|
)
|
|||||||||||
|
Income/(loss) before income taxes
|
1,250
|
|
(15
|
)
|
1,235
|
|
—
|
|
1,235
|
|
|||||||||||
|
Provision for/(benefit from) income taxes
|
359
|
|
(5
|
)
|
(a)(e)(f)(g)
|
354
|
|
—
|
|
354
|
|
||||||||||
|
Net income/(loss)
|
891
|
|
(10
|
)
|
881
|
|
—
|
|
881
|
|
|||||||||||
|
Net income/(loss) attributable to noncontrolling interest
|
(2
|
)
|
—
|
|
(2
|
)
|
—
|
|
(2
|
)
|
|||||||||||
|
Net income/(loss) attributable to Kraft Heinz
|
893
|
|
(10
|
)
|
883
|
|
—
|
|
883
|
|
|||||||||||
|
Preferred dividends
|
—
|
|
—
|
|
—
|
|
—
|
|
—
|
|
|||||||||||
|
Net income/(loss) attributable to common shareholders
|
$
|
893
|
|
$
|
(10
|
)
|
$
|
883
|
|
$
|
—
|
|
$
|
883
|
|
||||||
|
Per share data applicable to common shareholders:
|
|||||||||||||||||||||
|
Basic earnings/(loss)
|
$
|
0.73
|
|
$
|
—
|
|
$
|
0.73
|
|
$
|
—
|
|
$
|
0.73
|
|
||||||
|
Diluted earnings/(loss)
|
0.73
|
|
(0.01
|
)
|
0.72
|
|
—
|
|
0.72
|
|
|||||||||||
(a) Supplier Rebates—The correction of these misstatements resulted in an increase to cost of products sold of
$13 million
and a decrease to provision for income taxes of
$5 million
for the three months ended April 1, 2017.
(b) Capital Leases—None.
(c) Customer Incentive Program Expense Misclassifications—As previously disclosed in March 2018, the correction of these misstatements resulted in a decrease to net sales of
$40 million
, a decrease to cost of products sold of
$38 million
, and a decrease to SG&A of
$2 million
for the three months ended April 1, 2017.
(d) Balance Sheet Misclassifications—None.
(e) Income Taxes—The correction of these misstatements resulted in an increase to provision for income taxes of less than
$1 million
for the three months ended April 1, 2017.
(f) Impairments—The correction of these misstatements resulted in a decrease to SG&A of less than
$1 million
and an increase to provision for income taxes of less than
$1 million
for the three months ended April 1, 2017.
(g) Other—The correction of these misstatements resulted in a decrease to net sales of
$2 million
, an increase to cost of products sold of less than
$1 million
, a decrease to interest expense of less than
$1 million
, and a decrease to provision for income taxes of less than
$1 million
for the three months ended April 1, 2017.
The values as previously reported for the three months ended April 1, 2017 were derived from our Quarterly Report on Form 10-Q/A for the quarter ended April 1, 2017 filed on November 7, 2017.
See Note 2,
Restatement of Previously Issued Consolidated Financial Statements
, for a description of the misstatements in each category of restatements referenced by (a) through (g).
157
The Kraft Heinz Company
Condensed Consolidated Statement of Comprehensive Income
(in millions)
|
For the Three Months Ended September 29, 2018
|
|||||||||||||
|
As Previously Reported
|
Restatement Impacts
|
Restatement Reference
|
As Restated
|
||||||||||
|
Net income/(loss)
|
$
|
628
|
|
$
|
(10
|
)
|
(a)(b)(e)(f)(g)
|
$
|
618
|
|
|||
|
Other comprehensive income/(loss), net of tax:
|
|||||||||||||
|
Foreign currency translation adjustments
|
(146
|
)
|
2
|
|
(b)(e)(f)
|
(144
|
)
|
||||||
|
Net deferred gains/(losses) on net investment hedges
|
13
|
|
—
|
|
13
|
|
|||||||
|
Amounts excluded from the effectiveness assessment of net investment hedges
|
3
|
|
—
|
|
3
|
|
|||||||
|
Net deferred losses/(gains) on net investment hedges reclassified to net income/(loss)
|
(2
|
)
|
—
|
|
(2
|
)
|
|||||||
|
Net deferred gains/(losses) on cash flow hedges
|
(16
|
)
|
—
|
|
(16
|
)
|
|||||||
|
Amounts excluded from the effectiveness assessment of cash flow hedges
|
—
|
|
—
|
|
—
|
|
|||||||
|
Net deferred losses/(gains) on cash flow hedges reclassified to net income/(loss)
|
12
|
|
—
|
|
12
|
|
|||||||
|
Net actuarial gains/(losses) arising during the period
|
17
|
|
—
|
|
17
|
|
|||||||
|
Prior service credits/(costs) arising during the period
|
—
|
|
—
|
|
—
|
|
|||||||
|
Net postemployment benefit losses/(gains) reclassified to net income/(loss)
|
(58
|
)
|
—
|
|
(58
|
)
|
|||||||
|
Total other comprehensive income/(loss)
|
(177
|
)
|
2
|
|
(175
|
)
|
|||||||
|
Total comprehensive income/(loss)
|
451
|
|
(8
|
)
|
443
|
|
|||||||
|
Comprehensive income/(loss) attributable to noncontrolling interest
|
(4
|
)
|
1
|
|
(g)
|
(3
|
)
|
||||||
|
Comprehensive income/(loss) attributable to Kraft Heinz
|
$
|
455
|
|
$
|
(9
|
)
|
$
|
446
|
|
||||
The
$10 million
decrease to net income was primarily driven by misstatements in the income taxes and supplier rebates categories, partially offset by misstatements in the impairments, capital leases, and other categories. See additional descriptions of the net income impacts in the consolidated statement of income for the three months ended September 29, 2018 section above.
The
$2 million
increase to foreign currency translation adjustments is the result of misstatements in the income taxes, capital leases, and impairments categories.
See Note 2,
Restatement of Previously Issued Consolidated Financial Statements
, for a description of the misstatements in each category of restatements referenced by (a) through (g).
158
The Kraft Heinz Company
Condensed Consolidated Statement of Comprehensive Income
(in millions)
|
For the Nine Months Ended September 29, 2018
|
|||||||||||||
|
As Previously Reported
|
Restatement Impacts
|
Restatement Reference
|
As Restated
|
||||||||||
|
Net income/(loss)
|
$
|
2,376
|
|
$
|
(2
|
)
|
(a)(b)(e)(f)(g)
|
$
|
2,374
|
|
|||
|
Other comprehensive income/(loss), net of tax:
|
|||||||||||||
|
Foreign currency translation adjustments
|
(817
|
)
|
8
|
|
(b)(e)(f)
|
(809
|
)
|
||||||
|
Net deferred gains/(losses) on net investment hedges
|
158
|
|
—
|
|
158
|
|
|||||||
|
Amounts excluded from the effectiveness assessment of net investment hedges
|
3
|
|
—
|
|
3
|
|
|||||||
|
Net deferred losses/(gains) on net investment hedges reclassified to net income/(loss)
|
(2
|
)
|
—
|
|
(2
|
)
|
|||||||
|
Net deferred gains/(losses) on cash flow hedges
|
40
|
|
—
|
|
40
|
|
|||||||
|
Amounts excluded from the effectiveness assessment of cash flow hedges
|
—
|
|
—
|
|
—
|
|
|||||||
|
Net deferred losses/(gains) on cash flow hedges reclassified to net income/(loss)
|
(10
|
)
|
—
|
|
(10
|
)
|
|||||||
|
Net actuarial gains/(losses) arising during the period
|
70
|
|
—
|
|
70
|
|
|||||||
|
Prior service credits/(costs) arising during the period
|
—
|
|
—
|
|
—
|
|
|||||||
|
Net postemployment benefit losses/(gains) reclassified to net income/(loss)
|
(133
|
)
|
—
|
|
(133
|
)
|
|||||||
|
Total other comprehensive income/(loss)
|
(691
|
)
|
8
|
|
(683
|
)
|
|||||||
|
Total comprehensive income/(loss)
|
1,685
|
|
6
|
|
1,691
|
|
|||||||
|
Comprehensive income/(loss) attributable to noncontrolling interest
|
(16
|
)
|
1
|
|
(g)
|
(15
|
)
|
||||||
|
Comprehensive income/(loss) attributable to Kraft Heinz
|
$
|
1,701
|
|
$
|
5
|
|
$
|
1,706
|
|
||||
The
$2 million
decrease to net income was primarily driven by misstatements in the income taxes and supplier rebates categories, partially offset by misstatements in the impairments, other, and capital leases categories. See additional descriptions of the net income impacts in the consolidated statement of income for the nine months ended September 29, 2018 section above.
The
$8 million
increase to foreign currency translation adjustments is the result of misstatements in the income taxes, capital leases, and impairments categories.
See Note 2,
Restatement of Previously Issued Consolidated Financial Statements
, for a description of the misstatements in each category of restatements referenced by (a) through (g).
159
The Kraft Heinz Company
Condensed Consolidated Statement of Comprehensive Income
(in millions)
|
For the Three Months Ended June 30, 2018
|
|||||||||||||
|
As Previously Reported
|
Restatement Impacts
|
Restatement Reference
|
As Restated
|
||||||||||
|
Net income/(loss)
|
$
|
755
|
|
$
|
(2
|
)
|
(a)(b)(e)(f)(g)
|
$
|
753
|
|
|||
|
Other comprehensive income/(loss), net of tax:
|
|||||||||||||
|
Foreign currency translation adjustments
|
(868
|
)
|
6
|
|
(b)(e)(f)
|
(862
|
)
|
||||||
|
Net deferred gains/(losses) on net investment hedges
|
219
|
|
—
|
|
219
|
|
|||||||
|
Amounts excluded from the effectiveness assessment of net investment hedges
|
—
|
|
—
|
|
—
|
|
|||||||
|
Net deferred losses/(gains) on net investment hedges reclassified to net income/(loss)
|
—
|
|
—
|
|
—
|
|
|||||||
|
Net deferred gains/(losses) on cash flow hedges
|
34
|
|
—
|
|
34
|
|
|||||||
|
Amounts excluded from the effectiveness assessment of cash flow hedges
|
—
|
|
—
|
|
—
|
|
|||||||
|
Net deferred losses/(gains) on cash flow hedges reclassified to net income/(loss)
|
(9
|
)
|
—
|
|
(9
|
)
|
|||||||
|
Net actuarial gains/(losses) arising during the period
|
53
|
|
—
|
|
53
|
|
|||||||
|
Prior service credits/(costs) arising during the period
|
—
|
|
—
|
|
—
|
|
|||||||
|
Net postemployment benefit losses/(gains) reclassified to net income/(loss)
|
(17
|
)
|
—
|
|
(17
|
)
|
|||||||
|
Total other comprehensive income/(loss)
|
(588
|
)
|
6
|
|
(582
|
)
|
|||||||
|
Total comprehensive income/(loss)
|
167
|
|
4
|
|
171
|
|
|||||||
|
Comprehensive income/(loss) attributable to noncontrolling interest
|
(7
|
)
|
—
|
|
(7
|
)
|
|||||||
|
Comprehensive income/(loss) attributable to Kraft Heinz
|
$
|
174
|
|
$
|
4
|
|
$
|
178
|
|
||||
The
$2 million
decrease to net income was primarily driven by misstatements in the income taxes, supplier rebates, and other categories, partially offset by misstatements in the impairments and capital leases categories. See additional descriptions of the net income impacts in the consolidated statement of income for the three months ended June 30, 2018 section above.
The
$6 million
increase to foreign currency translation adjustments is the result of misstatements in the income taxes, capital leases, and impairments categories.
See Note 2,
Restatement of Previously Issued Consolidated Financial Statements
, for a description of the misstatements in each category of restatements referenced by (a) through (g).
160
The Kraft Heinz Company
Condensed Consolidated Statement of Comprehensive Income
(in millions)
|
For the Six Months Ended June 30, 2018
|
|||||||||||||
|
As Previously Reported
|
Restatement Impacts
|
Restatement Reference
|
As Restated
|
||||||||||
|
Net income/(loss)
|
$
|
1,748
|
|
$
|
8
|
|
(a)(b)(e)(f)(g)
|
$
|
1,756
|
|
|||
|
Other comprehensive income/(loss), net of tax:
|
|||||||||||||
|
Foreign currency translation adjustments
|
(671
|
)
|
6
|
|
(b)(e)(f)
|
(665
|
)
|
||||||
|
Net deferred gains/(losses) on net investment hedges
|
145
|
|
—
|
|
145
|
|
|||||||
|
Amounts excluded from the effectiveness assessment of net investment hedges
|
—
|
|
—
|
|
—
|
|
|||||||
|
Net deferred losses/(gains) on net investment hedges reclassified to net income/(loss)
|
—
|
|
—
|
|
—
|
|
|||||||
|
Net deferred gains/(losses) on cash flow hedges
|
56
|
|
—
|
|
56
|
|
|||||||
|
Amounts excluded from the effectiveness assessment of cash flow hedges
|
—
|
|
—
|
|
—
|
|
|||||||
|
Net deferred losses/(gains) on cash flow hedges reclassified to net income/(loss)
|
(22
|
)
|
—
|
|
(22
|
)
|
|||||||
|
Net actuarial gains/(losses) arising during the period
|
53
|
|
—
|
|
53
|
|
|||||||
|
Prior service credits/(costs) arising during the period
|
—
|
|
—
|
|
—
|
|
|||||||
|
Net postemployment benefit losses/(gains) reclassified to net income/(loss)
|
(75
|
)
|
—
|
|
(75
|
)
|
|||||||
|
Total other comprehensive income/(loss)
|
(514
|
)
|
6
|
|
(508
|
)
|
|||||||
|
Total comprehensive income/(loss)
|
1,234
|
|
14
|
|
1,248
|
|
|||||||
|
Comprehensive income/(loss) attributable to noncontrolling interest
|
(12
|
)
|
—
|
|
(12
|
)
|
|||||||
|
Comprehensive income/(loss) attributable to Kraft Heinz
|
$
|
1,246
|
|
$
|
14
|
|
$
|
1,260
|
|
||||
The
$8 million
increase to net income was primarily driven by misstatements in the impairments, other, and capital leases categories, partially offset by misstatements in the income taxes and supplier rebates categories. See additional descriptions of the net income impacts in the consolidated statement of income for the six months ended June 30, 2018 section above.
The
$6 million
increase to foreign currency translation adjustments is the result of misstatements in the income taxes, capital leases, and impairments categories.
See Note 2,
Restatement of Previously Issued Consolidated Financial Statements
, for a description of the misstatements in each category of restatements referenced by (a) through (g).
161
The Kraft Heinz Company
Condensed Consolidated Statement of Comprehensive Income
(in millions)
|
For the Three Months Ended March 31, 2018
|
|||||||||||||
|
As Previously Reported
|
Restatement Impacts
|
Restatement Reference
|
As Restated
|
||||||||||
|
Net income/(loss)
|
$
|
993
|
|
$
|
10
|
|
(a)(b)(e)(f)(g)
|
$
|
1,003
|
|
|||
|
Other comprehensive income/(loss), net of tax:
|
|||||||||||||
|
Foreign currency translation adjustments
|
197
|
|
—
|
|
(b)(e)
|
197
|
|
||||||
|
Net deferred gains/(losses) on net investment hedges
|
(74
|
)
|
—
|
|
(74
|
)
|
|||||||
|
Amounts excluded from the effectiveness assessment of net investment hedges
|
—
|
|
—
|
|
—
|
|
|||||||
|
Net deferred losses/(gains) on net investment hedges reclassified to net income/(loss)
|
—
|
|
—
|
|
—
|
|
|||||||
|
Net deferred gains/(losses) on cash flow hedges
|
22
|
|
—
|
|
22
|
|
|||||||
|
Amounts excluded from the effectiveness assessment of cash flow hedges
|
—
|
|
—
|
|
—
|
|
|||||||
|
Net deferred losses/(gains) on cash flow hedges reclassified to net income/(loss)
|
(13
|
)
|
—
|
|
(13
|
)
|
|||||||
|
Net actuarial gains/(losses) arising during the period
|
—
|
|
—
|
|
—
|
|
|||||||
|
Prior service credits/(costs) arising during the period
|
—
|
|
—
|
|
—
|
|
|||||||
|
Net postemployment benefit losses/(gains) reclassified to net income/(loss)
|
(58
|
)
|
—
|
|
(58
|
)
|
|||||||
|
Total other comprehensive income/(loss)
|
74
|
|
—
|
|
74
|
|
|||||||
|
Total comprehensive income/(loss)
|
1,067
|
|
10
|
|
1,077
|
|
|||||||
|
Comprehensive income/(loss) attributable to noncontrolling interest
|
(5
|
)
|
—
|
|
(5
|
)
|
|||||||
|
Comprehensive income/(loss) attributable to Kraft Heinz
|
$
|
1,072
|
|
$
|
10
|
|
$
|
1,082
|
|
||||
The
$10 million
increase to net income was primarily driven by misstatements in the other, supplier rebates, capital leases, and impairments categories, partially offset by misstatements in the income taxes category. See additional descriptions of the net income impacts in the consolidated statement of income for the three months ended March 31, 2018 section above.
The less than
$1 million
decrease to foreign currency translation adjustments is the result of misstatements in the income taxes and capital leases categories.
See Note 2,
Restatement of Previously Issued Consolidated Financial Statements
, for a description of the misstatements in each category of restatements referenced by (a) through (g).
162
The Kraft Heinz Company
Condensed Consolidated Statement of Comprehensive Income
(in millions)
|
For the Three Months Ended December 30, 2017
|
|||||||||||||
|
As Previously Reported
|
Restatement Impacts
|
Restatement Reference
|
As Restated
|
||||||||||
|
Net income/(loss)
|
$
|
7,996
|
|
$
|
(14
|
)
|
(a)(b)(e)(f)(g)
|
$
|
7,982
|
|
|||
|
Other comprehensive income/(loss), net of tax:
|
|||||||||||||
|
Foreign currency translation adjustments
|
5
|
|
2
|
|
(b)(e)
|
7
|
|
||||||
|
Net deferred gains/(losses) on net investment hedges
|
(26
|
)
|
—
|
|
(26
|
)
|
|||||||
|
Amounts excluded from the effectiveness assessment of net investment hedges
|
—
|
|
—
|
|
—
|
|
|||||||
|
Net deferred losses/(gains) on net investment hedges reclassified to net income/(loss)
|
—
|
|
—
|
|
—
|
|
|||||||
|
Net deferred gains/(losses) on cash flow hedges
|
23
|
|
—
|
|
23
|
|
|||||||
|
Amounts excluded from the effectiveness assessment of cash flow hedges
|
—
|
|
—
|
|
—
|
|
|||||||
|
Net deferred losses/(gains) on cash flow hedges reclassified to net income/(loss)
|
(12
|
)
|
—
|
|
(12
|
)
|
|||||||
|
Net actuarial gains/(losses) arising during the period
|
82
|
|
—
|
|
82
|
|
|||||||
|
Prior service credits/(costs) arising during the period
|
16
|
|
—
|
|
16
|
|
|||||||
|
Net postemployment benefit losses/(gains) reclassified to net income/(loss)
|
(49
|
)
|
—
|
|
(49
|
)
|
|||||||
|
Total other comprehensive income/(loss)
|
39
|
|
2
|
|
41
|
|
|||||||
|
Total comprehensive income/(loss)
|
8,035
|
|
(12
|
)
|
8,023
|
|
|||||||
|
Comprehensive income/(loss) attributable to noncontrolling interest
|
1
|
|
—
|
|
1
|
|
|||||||
|
Comprehensive income/(loss) attributable to Kraft Heinz
|
$
|
8,034
|
|
$
|
(12
|
)
|
$
|
8,022
|
|
||||
The
$14 million
decrease to net income was primarily driven by misstatements in the supplier rebates category, partially offset by misstatements in the income taxes, other, capital leases, and impairments categories. See additional descriptions of the net income impacts in the consolidated statement of income for the three months ended December 30, 2017 section above.
The
$2 million
decrease to foreign currency translation adjustments is the result of misstatements in the income taxes and capital leases categories.
See Note 2,
Restatement of Previously Issued Consolidated Financial Statements
, for a description of the misstatements in each category of restatements referenced by (a) through (g).
163
The Kraft Heinz Company
Condensed Consolidated Statement of Comprehensive Income
(in millions)
|
For the Three Months Ended September 30, 2017
|
|||||||||||||
|
As Previously Reported
|
Restatement Impacts
|
Restatement Reference
|
As Restated
|
||||||||||
|
Net income/(loss)
|
$
|
943
|
|
$
|
(31
|
)
|
(a)(e)(f)(g)
|
$
|
912
|
|
|||
|
Other comprehensive income/(loss), net of tax:
|
|||||||||||||
|
Foreign currency translation adjustments
|
421
|
|
(2
|
)
|
(e)
|
419
|
|
||||||
|
Net deferred gains/(losses) on net investment hedges
|
(124
|
)
|
—
|
|
(124
|
)
|
|||||||
|
Amounts excluded from the effectiveness assessment of net investment hedges
|
—
|
|
—
|
|
—
|
|
|||||||
|
Net deferred losses/(gains) on net investment hedges reclassified to net income/(loss)
|
—
|
|
—
|
|
—
|
|
|||||||
|
Net deferred gains/(losses) on cash flow hedges
|
(70
|
)
|
—
|
|
(70
|
)
|
|||||||
|
Amounts excluded from the effectiveness assessment of cash flow hedges
|
—
|
|
—
|
|
—
|
|
|||||||
|
Net deferred losses/(gains) on cash flow hedges reclassified to net income/(loss)
|
51
|
|
—
|
|
51
|
|
|||||||
|
Net actuarial gains/(losses) arising during the period
|
(4
|
)
|
—
|
|
(4
|
)
|
|||||||
|
Prior service credits/(costs) arising during the period
|
—
|
|
—
|
|
—
|
|
|||||||
|
Net postemployment benefit losses/(gains) reclassified to net income/(loss)
|
(51
|
)
|
—
|
|
(51
|
)
|
|||||||
|
Total other comprehensive income/(loss)
|
223
|
|
(2
|
)
|
221
|
|
|||||||
|
Total comprehensive income/(loss)
|
1,166
|
|
(33
|
)
|
1,133
|
|
|||||||
|
Comprehensive income/(loss) attributable to noncontrolling interest
|
(1
|
)
|
—
|
|
(1
|
)
|
|||||||
|
Comprehensive income/(loss) attributable to Kraft Heinz
|
$
|
1,167
|
|
$
|
(33
|
)
|
$
|
1,134
|
|
||||
The
$31 million
decrease to net income was primarily driven by misstatements in the supplier rebates, other, and income taxes categories, partially offset by misstatements in the impairments category. See additional descriptions of the net income impacts in the consolidated statement of income for the three months ended September 30, 2017 section above.
The
$2 million
decrease to foreign currency translation adjustments is the result of misstatements in the income taxes category.
See Note 2,
Restatement of Previously Issued Consolidated Financial Statements
, for a description of the misstatements in each category of restatements referenced by (a) through (g).
164
The Kraft Heinz Company
Condensed Consolidated Statement of Comprehensive Income
(in millions)
|
For the Nine Months Ended September 30, 2017
|
|||||||||||||
|
As Previously Reported
|
Restatement Impacts
|
Restatement Reference
|
As Restated
|
||||||||||
|
Net income/(loss)
|
$
|
2,994
|
|
$
|
(44
|
)
|
(a)(e)(f)(g)
|
$
|
2,950
|
|
|||
|
Other comprehensive income/(loss), net of tax:
|
|||||||||||||
|
Foreign currency translation adjustments
|
1,179
|
|
(1
|
)
|
(e)
|
1,178
|
|
||||||
|
Net deferred gains/(losses) on net investment hedges
|
(327
|
)
|
—
|
|
(327
|
)
|
|||||||
|
Amounts excluded from the effectiveness assessment of net investment hedges
|
—
|
|
—
|
|
—
|
|
|||||||
|
Net deferred losses/(gains) on net investment hedges reclassified to net income/(loss)
|
—
|
|
—
|
|
—
|
|
|||||||
|
Net deferred gains/(losses) on cash flow hedges
|
(136
|
)
|
—
|
|
(136
|
)
|
|||||||
|
Amounts excluded from the effectiveness assessment of cash flow hedges
|
—
|
|
—
|
|
—
|
|
|||||||
|
Net deferred losses/(gains) on cash flow hedges reclassified to net income/(loss)
|
97
|
|
—
|
|
97
|
|
|||||||
|
Net actuarial gains/(losses) arising during the period
|
(13
|
)
|
—
|
|
(13
|
)
|
|||||||
|
Prior service credits/(costs) arising during the period
|
1
|
|
—
|
|
1
|
|
|||||||
|
Net postemployment benefit losses/(gains) reclassified to net income/(loss)
|
(260
|
)
|
—
|
|
(260
|
)
|
|||||||
|
Total other comprehensive income/(loss)
|
541
|
|
(1
|
)
|
540
|
|
|||||||
|
Total comprehensive income/(loss)
|
3,535
|
|
(45
|
)
|
3,490
|
|
|||||||
|
Comprehensive income/(loss) attributable to noncontrolling interest
|
(4
|
)
|
—
|
|
(4
|
)
|
|||||||
|
Comprehensive income/(loss) attributable to Kraft Heinz
|
$
|
3,539
|
|
$
|
(45
|
)
|
$
|
3,494
|
|
||||
The
$44 million
decrease to net income was primarily driven by misstatements in the supplier rebates and income taxes categories, partially offset by misstatements in the other and impairments categories. See additional descriptions of the net income impacts in the consolidated statement of income for the nine months ended September 30, 2017 section above.
The
$1 million
decrease to foreign currency translation adjustments is the result of misstatements in the income taxes category.
See Note 2,
Restatement of Previously Issued Consolidated Financial Statements
, for a description of the misstatements in each category of restatements referenced by (a) through (g).
165
The Kraft Heinz Company
Condensed Consolidated Statement of Comprehensive Income
(in millions)
|
For the Three Months Ended July 1, 2017
|
|||||||||||||
|
As Previously Reported
|
Restatement Impacts
|
Restatement Reference
|
As Restated
|
||||||||||
|
Net income/(loss)
|
$
|
1,160
|
|
$
|
(3
|
)
|
(a)(e)(f)(g)
|
$
|
1,157
|
|
|||
|
Other comprehensive income/(loss), net of tax:
|
|||||||||||||
|
Foreign currency translation adjustments
|
451
|
|
4
|
|
(e)
|
455
|
|
||||||
|
Net deferred gains/(losses) on net investment hedges
|
(152
|
)
|
—
|
|
(152
|
)
|
|||||||
|
Amounts excluded from the effectiveness assessment of net investment hedges
|
—
|
|
—
|
|
—
|
|
|||||||
|
Net deferred losses/(gains) on net investment hedges reclassified to net income/(loss)
|
—
|
|
—
|
|
—
|
|
|||||||
|
Net deferred gains/(losses) on cash flow hedges
|
(32
|
)
|
—
|
|
(32
|
)
|
|||||||
|
Amounts excluded from the effectiveness assessment of cash flow hedges
|
—
|
|
—
|
|
—
|
|
|||||||
|
Net deferred losses/(gains) on cash flow hedges reclassified to net income/(loss)
|
26
|
|
—
|
|
26
|
|
|||||||
|
Net actuarial gains/(losses) arising during the period
|
1
|
|
—
|
|
1
|
|
|||||||
|
Prior service credits/(costs) arising during the period
|
1
|
|
—
|
|
1
|
|
|||||||
|
Net postemployment benefit losses/(gains) reclassified to net income/(loss)
|
(154
|
)
|
—
|
|
(154
|
)
|
|||||||
|
Total other comprehensive income/(loss)
|
141
|
|
4
|
|
145
|
|
|||||||
|
Total comprehensive income/(loss)
|
1,301
|
|
1
|
|
1,302
|
|
|||||||
|
Comprehensive income/(loss) attributable to noncontrolling interest
|
1
|
|
—
|
|
1
|
|
|||||||
|
Comprehensive income/(loss) attributable to Kraft Heinz
|
$
|
1,300
|
|
$
|
1
|
|
$
|
1,301
|
|
||||
The
$3 million
decrease to net income was primarily driven by misstatements in the supplier rebates category, partially offset by misstatements in the other, income taxes, and impairments categories. See additional descriptions of the net income impacts in the consolidated statement of income for the three months ended July 1, 2017 section above.
The
$4 million
increase to foreign currency translation adjustments is the result of misstatements in the income taxes category.
See Note 2,
Restatement of Previously Issued Consolidated Financial Statements
, for a description of the misstatements in each category of restatements referenced by (a) through (g).
166
The Kraft Heinz Company
Condensed Consolidated Statements of Comprehensive Income
(in millions)
|
For the Six Months Ended July 1, 2017
|
|||||||||||||
|
As Previously Reported
|
Restatement Impacts
|
Restatement Reference
|
As Restated
|
||||||||||
|
Net income/(loss)
|
$
|
2,051
|
|
$
|
(13
|
)
|
(a)(e)(f)(g)
|
$
|
2,038
|
|
|||
|
Other comprehensive income/(loss), net of tax:
|
|||||||||||||
|
Foreign currency translation adjustments
|
758
|
|
1
|
|
(e)
|
759
|
|
||||||
|
Net deferred gains/(losses) on net investment hedges
|
(203
|
)
|
—
|
|
(203
|
)
|
|||||||
|
Amounts excluded from the effectiveness assessment of net investment hedges
|
—
|
|
—
|
|
—
|
|
|||||||
|
Net deferred losses/(gains) on net investment hedges reclassified to net income/(loss)
|
—
|
|
—
|
|
—
|
|
|||||||
|
Net deferred gains/(losses) on cash flow hedges
|
(66
|
)
|
—
|
|
(66
|
)
|
|||||||
|
Amounts excluded from the effectiveness assessment of cash flow hedges
|
—
|
|
—
|
|
—
|
|
|||||||
|
Net deferred losses/(gains) on cash flow hedges reclassified to net income/(loss)
|
46
|
|
—
|
|
46
|
|
|||||||
|
Net actuarial gains/(losses) arising during the period
|
(9
|
)
|
—
|
|
(9
|
)
|
|||||||
|
Prior service credits/(costs) arising during the period
|
1
|
|
—
|
|
1
|
|
|||||||
|
Net postemployment benefit losses/(gains) reclassified to net income/(loss)
|
(209
|
)
|
—
|
|
(209
|
)
|
|||||||
|
Total other comprehensive income/(loss)
|
318
|
|
1
|
|
319
|
|
|||||||
|
Total comprehensive income/(loss)
|
2,369
|
|
(12
|
)
|
2,357
|
|
|||||||
|
Comprehensive income/(loss) attributable to noncontrolling interest
|
(3
|
)
|
—
|
|
(3
|
)
|
|||||||
|
Comprehensive income/(loss) attributable to Kraft Heinz
|
$
|
2,372
|
|
$
|
(12
|
)
|
$
|
2,360
|
|
||||
The
$13 million
decrease to net income was primarily driven by misstatements in the supplier rebates and income taxes categories, partially offset by misstatements in the other and impairments categories. See additional descriptions of the net income impacts in the consolidated statement of income for the three months ended July 1, 2017 section above.
The
$1 million
increase to foreign currency translation adjustments is the result of misstatements in the income taxes category.
See Note 2,
Restatement of Previously Issued Consolidated Financial Statements
, for a description of the misstatements in each category of restatements referenced by (a) through (g).
167
The Kraft Heinz Company
Condensed Consolidated Statements of Comprehensive Income
(in millions)
|
For the Three Months Ended April 1, 2017
|
|||||||||||||
|
As Previously Reported
|
Restatement Impacts
|
Restatement Reference
|
As Restated
|
||||||||||
|
Net income/(loss)
|
$
|
891
|
|
$
|
(10
|
)
|
(a)(e)(f)(g)
|
$
|
881
|
|
|||
|
Other comprehensive income/(loss), net of tax:
|
|||||||||||||
|
Foreign currency translation adjustments
|
307
|
|
(3
|
)
|
(e)
|
304
|
|
||||||
|
Net deferred gains/(losses) on net investment hedges
|
(51
|
)
|
—
|
|
(51
|
)
|
|||||||
|
Amounts excluded from the effectiveness assessment of net investment hedges
|
—
|
|
—
|
|
—
|
|
|||||||
|
Net deferred losses/(gains) on net investment hedges reclassified to net income/(loss)
|
—
|
|
—
|
|
—
|
|
|||||||
|
Net deferred gains/(losses) on cash flow hedges
|
(34
|
)
|
—
|
|
(34
|
)
|
|||||||
|
Amounts excluded from the effectiveness assessment of cash flow hedges
|
—
|
|
—
|
|
—
|
|
|||||||
|
Net deferred losses/(gains) on cash flow hedges reclassified to net income/(loss)
|
20
|
|
—
|
|
20
|
|
|||||||
|
Net actuarial gains/(losses) arising during the period
|
(10
|
)
|
—
|
|
(10
|
)
|
|||||||
|
Prior service credits/(costs) arising during the period
|
—
|
|
—
|
|
—
|
|
|||||||
|
Net postemployment benefit losses/(gains) reclassified to net income/(loss)
|
(55
|
)
|
—
|
|
(55
|
)
|
|||||||
|
Total other comprehensive income/(loss)
|
177
|
|
(3
|
)
|
174
|
|
|||||||
|
Total comprehensive income/(loss)
|
1,068
|
|
(13
|
)
|
1,055
|
|
|||||||
|
Comprehensive income/(loss) attributable to noncontrolling interest
|
(4
|
)
|
—
|
|
(4
|
)
|
|||||||
|
Comprehensive income/(loss) attributable to Kraft Heinz
|
$
|
1,072
|
|
$
|
(13
|
)
|
$
|
1,059
|
|
||||
The
$10 million
decrease to net income was primarily driven by misstatements in the supplier rebates, other, and income taxes categories, partially offset by misstatements in the impairments category. See additional descriptions of the net income impacts in the consolidated statement of income for the three months ended April 1, 2017 section above.
The
$3 million
decrease to foreign currency translation adjustments is the result of misstatements in the income taxes category.
See Note 2,
Restatement of Previously Issued Consolidated Financial Statements
, for a description of the misstatements in each category of restatements referenced by (a) through (g).
168
The Kraft Heinz Company
Condensed Consolidated Balance Sheet
(in millions, except per share data)
|
September 29, 2018
|
|||||||||||||
|
|
As Previously Reported
|
Restatement Impacts
|
Restatement Reference
|
As Restated
|
|||||||||
|
ASSETS
|
|||||||||||||
|
Cash and cash equivalents
|
$
|
1,366
|
|
$
|
—
|
|
$
|
1,366
|
|
||||
|
Trade receivables (net of allowances of $24 at September 29, 2018)
|
2,032
|
|
—
|
|
2,032
|
|
|||||||
|
Sold receivables
|
—
|
|
—
|
|
—
|
|
|||||||
|
Income taxes receivable
|
195
|
|
8
|
|
(a)(b)(e)(g)
|
203
|
|
||||||
|
Inventories
|
3,287
|
|
(73
|
)
|
(d)(g)
|
3,214
|
|
||||||
|
Prepaid expenses
|
389
|
|
—
|
|
389
|
|
|||||||
|
Other current assets
|
321
|
|
31
|
|
(a)(d)
|
352
|
|
||||||
|
Assets held for sale
|
—
|
|
—
|
|
—
|
|
|||||||
|
Total current assets
|
7,590
|
|
(34
|
)
|
7,556
|
|
|||||||
|
Property, plant and equipment, net
|
7,216
|
|
(142
|
)
|
(b)(g)
|
7,074
|
|
||||||
|
Goodwill
|
44,308
|
|
31
|
|
(f)(g)
|
44,339
|
|
||||||
|
Intangible assets, net
|
58,727
|
|
—
|
|
58,727
|
|
|||||||
|
Other non-current assets
|
1,889
|
|
(10
|
)
|
(e)
|
1,879
|
|
||||||
|
TOTAL ASSETS
|
$
|
119,730
|
|
$
|
(155
|
)
|
$
|
119,575
|
|
||||
|
LIABILITIES AND EQUITY
|
|||||||||||||
|
Commercial paper and other short-term debt
|
$
|
973
|
|
$
|
—
|
|
$
|
973
|
|
||||
|
Current portion of long-term debt
|
405
|
|
(34
|
)
|
(b)(g)
|
371
|
|
||||||
|
Trade payables
|
4,312
|
|
(74
|
)
|
(g)
|
4,238
|
|
||||||
|
Accrued marketing
|
494
|
|
—
|
|
494
|
|
|||||||
|
Interest payable
|
315
|
|
—
|
|
315
|
|
|||||||
|
Other current liabilities
|
1,082
|
|
149
|
|
(a)(g)
|
1,231
|
|
||||||
|
Liabilities held for sale
|
—
|
|
—
|
|
—
|
|
|||||||
|
Total current liabilities
|
7,581
|
|
41
|
|
7,622
|
|
|||||||
|
Long-term debt
|
30,998
|
|
(111
|
)
|
(b)(g)
|
30,887
|
|
||||||
|
Deferred income taxes
|
14,215
|
|
9
|
|
(a)(e)(g)
|
14,224
|
|
||||||
|
Accrued postemployment costs
|
394
|
|
—
|
|
394
|
|
|||||||
|
Other non-current liabilities
|
964
|
|
71
|
|
(a)
|
1,035
|
|
||||||
|
TOTAL LIABILITIES
|
54,152
|
|
10
|
|
54,162
|
|
|||||||
|
Commitments and Contingencies
|
|
|
|
||||||||||
|
Redeemable noncontrolling interest
|
6
|
|
—
|
|
6
|
|
|||||||
|
Equity:
|
|||||||||||||
|
Common stock, $0.01 par value (5,000 shares authorized; 1,222 shares issued and 1,219 shares outstanding at September 29, 2018)
|
12
|
|
—
|
|
12
|
|
|||||||
|
Additional paid-in capital
|
58,793
|
|
(77
|
)
|
(d)
|
58,716
|
|
||||||
|
Retained earnings/(deficit)
|
8,576
|
|
(97
|
)
|
(a)(b)(d)(e)(f)(g)
|
8,479
|
|
||||||
|
Accumulated other comprehensive income/(losses)
|
(1,732
|
)
|
8
|
|
(b)(e)(f)
|
(1,724
|
)
|
||||||
|
Treasury stock, at cost (3 shares at September 29, 2018)
|
(264
|
)
|
—
|
|
(264
|
)
|
|||||||
|
Total shareholders' equity
|
65,385
|
|
(166
|
)
|
65,219
|
|
|||||||
|
Noncontrolling interest
|
187
|
|
1
|
|
(g)
|
188
|
|
||||||
|
TOTAL EQUITY
|
65,572
|
|
(165
|
)
|
65,407
|
|
|||||||
|
TOTAL LIABILITIES AND EQUITY
|
$
|
119,730
|
|
$
|
(155
|
)
|
$
|
119,575
|
|
||||
169
(a) Supplier Rebates—The correction of these misstatements resulted in an increase to income taxes receivable of
$1 million
, a decrease to other current assets of
$36 million
, an increase to other current liabilities of
$66 million
, a decrease to deferred income taxes of
$40 million
, an increase to other non-current liabilities of
$71 million
, and a decrease to retained earnings of
$132 million
at September 29, 2018.
(b) Capital Leases—The correction of these misstatements resulted in a decrease to income taxes receivable of less than
$1 million
, a decrease to property, plant and equipment, net, of
$141 million
, a decrease to current portion of long-term debt of
$32 million
, a decrease to long-term debt of
$111 million
, an increase to retained earnings of
$2 million
, and a decrease to accumulated other comprehensive losses of less than
$1 million
at September 29, 2018.
(c) Customer Incentive Program Expense Misclassifications—None.
(d) Balance Sheet Misclassifications—The correction of these misstatements resulted in a decrease to inventories of
$67 million
, an increase to other current assets of
$67 million
, a decrease to additional paid-in capital of
$77 million
, and an increase to retained earnings of
$77 million
at September 29, 2018.
(e) Income Taxes—The correction of these misstatements resulted in an increase to income taxes receivable of
$3 million
, a decrease to other non-current assets of
$10 million
, an increase to deferred income taxes of
$50 million
, a decrease to retained earnings of
$66 million
, and a decrease to accumulated other comprehensive losses of
$9 million
at September 29, 2018.
(f) Impairments—The correction of these misstatements resulted in an increase to goodwill of
$30 million
, an increase to retained earnings of
$31 million
, and an increase to accumulated other comprehensive losses of
$1 million
at September 29, 2018.
(g) Other—The correction of these misstatements resulted in an increase to income taxes receivable of
$4 million
, a decrease to inventories of
$6 million
, a decrease to property, plant and equipment, net, of
$1 million
, an increase to goodwill of
$1 million
, a decrease to current portion of long-term debt of
$2 million
, a decrease to trade payables of
$74 million
, an increase to other current liabilities of
$83 million
, an increase to long-term debt of less than
$1 million
, a decrease to deferred income taxes of
$1 million
, a decrease to retained earnings of
$9 million
, and an increase to noncontrolling interest of
$1 million
at September 29, 2018.
See Note 2,
Restatement of Previously Issued Consolidated Financial Statements
, for a description of the misstatements in each category of restatements referenced by (a) through (g).
170
The Kraft Heinz Company
Condensed Consolidated Balance Sheet
(in millions, except per share data)
|
June 30, 2018
|
|||||||||||||
|
|
As Previously Reported
|
Restatement Impacts
|
Restatement Reference
|
As Restated
|
|||||||||
|
ASSETS
|
|||||||||||||
|
Cash and cash equivalents
|
$
|
3,369
|
|
$
|
—
|
|
$
|
3,369
|
|
||||
|
Trade receivables (net of allowances of $24 at June 30, 2018)
|
1,950
|
|
—
|
|
1,950
|
|
|||||||
|
Sold receivables
|
37
|
|
—
|
|
37
|
|
|||||||
|
Income taxes receivable
|
177
|
|
34
|
|
(a)(b)(e)(g)
|
211
|
|
||||||
|
Inventories
|
3,161
|
|
(67
|
)
|
(d)(g)
|
3,094
|
|
||||||
|
Prepaid expenses
|
388
|
|
—
|
|
388
|
|
|||||||
|
Other current assets
|
419
|
|
12
|
|
(a)(d)(g)
|
431
|
|
||||||
|
Assets held for sale
|
—
|
|
—
|
|
—
|
|
|||||||
|
Total current assets
|
9,501
|
|
(21
|
)
|
9,480
|
|
|||||||
|
Property, plant and equipment, net
|
7,258
|
|
(141
|
)
|
(b)(g)
|
7,117
|
|
||||||
|
Goodwill
|
44,270
|
|
32
|
|
(f)(g)
|
44,302
|
|
||||||
|
Intangible assets, net
|
59,101
|
|
(17
|
)
|
(f)
|
59,084
|
|
||||||
|
Other non-current assets
|
1,766
|
|
—
|
|
1,766
|
|
|||||||
|
TOTAL ASSETS
|
$
|
121,896
|
|
$
|
(147
|
)
|
$
|
121,749
|
|
||||
|
LIABILITIES AND EQUITY
|
|||||||||||||
|
Commercial paper and other short-term debt
|
$
|
34
|
|
$
|
—
|
|
$
|
34
|
|
||||
|
Current portion of long-term debt
|
2,754
|
|
(31
|
)
|
(b)(g)
|
2,723
|
|
||||||
|
Trade payables
|
4,326
|
|
(90
|
)
|
(g)
|
4,236
|
|
||||||
|
Accrued marketing
|
474
|
|
6
|
|
(g)
|
480
|
|
||||||
|
Interest payable
|
404
|
|
—
|
|
404
|
|
|||||||
|
Other current liabilities
|
1,099
|
|
137
|
|
(a)(g)
|
1,236
|
|
||||||
|
Liabilities held for sale
|
—
|
|
—
|
|
—
|
|
|||||||
|
Total current liabilities
|
9,091
|
|
22
|
|
9,113
|
|
|||||||
|
Long-term debt
|
31,380
|
|
(111
|
)
|
(b)(g)
|
31,269
|
|
||||||
|
Deferred income taxes
|
14,230
|
|
30
|
|
(a)(e)(f)(g)
|
14,260
|
|
||||||
|
Accrued postemployment costs
|
394
|
|
—
|
|
394
|
|
|||||||
|
Other non-current liabilities
|
929
|
|
69
|
|
(a)
|
998
|
|
||||||
|
TOTAL LIABILITIES
|
56,024
|
|
10
|
|
56,034
|
|
|||||||
|
Commitments and Contingencies
|
|
|
|
||||||||||
|
Redeemable noncontrolling interest
|
7
|
|
—
|
|
7
|
|
|||||||
|
Equity:
|
|||||||||||||
|
Common stock, $0.01 par value (5,000 shares authorized; 1,222 shares issued and 1,219 shares outstanding at June 30, 2018)
|
12
|
|
—
|
|
12
|
|
|||||||
|
Additional paid-in capital
|
58,766
|
|
(77
|
)
|
(d)
|
58,689
|
|
||||||
|
Retained earnings/(deficit)
|
8,710
|
|
(86
|
)
|
(a)(b)(d)(e)(f)(g)
|
8,624
|
|
||||||
|
Accumulated other comprehensive income/(losses)
|
(1,557
|
)
|
6
|
|
(b)(e)(f)
|
(1,551
|
)
|
||||||
|
Treasury stock, at cost (3 shares at June 30, 2018)
|
(254
|
)
|
—
|
|
(254
|
)
|
|||||||
|
Total shareholders' equity
|
65,677
|
|
(157
|
)
|
65,520
|
|
|||||||
|
Noncontrolling interest
|
188
|
|
—
|
|
188
|
|
|||||||
|
TOTAL EQUITY
|
65,865
|
|
(157
|
)
|
65,708
|
|
|||||||
|
TOTAL LIABILITIES AND EQUITY
|
$
|
121,896
|
|
$
|
(147
|
)
|
$
|
121,749
|
|
||||
171
(a) Supplier Rebates—The correction of these misstatements resulted in an increase to income taxes receivable of
$1 million
, a decrease to other current assets of
$25 million
, an increase to other current liabilities of
$67 million
, a decrease to deferred income taxes of
$38 million
, an increase to other non-current liabilities of
$69 million
, and a decrease to retained earnings of
$122 million
at June 30, 2018.
(b) Capital Leases—The correction of these misstatements resulted in a decrease to income taxes receivable of less than
$1 million
, a decrease to property, plant and equipment, net, of
$139 million
, a decrease to current portion of long-term debt of
$29 million
, a decrease to long-term debt of
$111 million
, an increase to retained earnings of
$1 million
, and an increase to accumulated other comprehensive losses of less than
$1 million
at June 30, 2018.
(c) Customer Incentive Program Expense Misclassifications—None.
(d) Balance Sheet Misclassifications—The correction of these misstatements resulted in a decrease to inventories of
$65 million
, an increase to other current assets of
$65 million
, a decrease to additional paid-in capital of
$77 million
, and an increase to retained earnings of
$77 million
at June 30, 2018.
(e) Income Taxes—The correction of these misstatements resulted in an increase to income taxes receivable of
$29 million
, an increase to deferred income taxes of
$73 million
, a decrease to retained earnings of
$51 million
, and a decrease to accumulated other comprehensive losses of
$7 million
at June 30, 2018.
(f) Impairments—The correction of these misstatements resulted in an increase to goodwill of
$31 million
, a decrease to intangible assets, net of
$17 million
, a decrease to deferred income taxes of
$4 million
, an increase to retained earnings of
$19 million
, and an increase to accumulated other comprehensive losses of
$1 million
at June 30, 2018.
(g) Other—The correction of these misstatements resulted in an increase to income taxes receivable of
$4 million
, a decrease to inventories of
$2 million
, a decrease to other current assets of
$28 million
, a decrease to property, plant and equipment, net of
$2 million
, an increase to goodwill of
$1 million
, a decrease to current portion of long-term debt of
$2 million
, a decrease to trade payables of
$90 million
, an increase to accrued marketing of
$6 million
, an increase to other current liabilities of
$70 million
, an increase to long-term debt of less than
$1 million
, a decrease to deferred income taxes of
$1 million
, and a decrease to retained earnings of
$10 million
at June 30, 2018.
See Note 2,
Restatement of Previously Issued Consolidated Financial Statements
, for a description of the misstatements in each category of restatements referenced by (a) through (g).
172
The Kraft Heinz Company
Condensed Consolidated Balance Sheet
(in millions, except per share data)
|
March 31, 2018
|
|||||||||||||
|
|
As Previously Reported
|
Restatement Impacts
|
Restatement Reference
|
As Restated
|
|||||||||
|
ASSETS
|
|||||||||||||
|
Cash and cash equivalents
|
$
|
1,794
|
|
$
|
—
|
|
$
|
1,794
|
|
||||
|
Trade receivables (net of allowances of $24 at March 31, 2018)
|
1,044
|
|
—
|
|
1,044
|
|
|||||||
|
Sold receivables
|
530
|
|
—
|
|
530
|
|
|||||||
|
Income taxes receivable
|
150
|
|
(29
|
)
|
(a)(b)(d)(e)(g)
|
121
|
|
||||||
|
Inventories
|
3,144
|
|
(55
|
)
|
(d)(g)
|
3,089
|
|
||||||
|
Prepaid expenses
|
367
|
|
—
|
|
367
|
|
|||||||
|
Other current assets
|
408
|
|
18
|
|
(a)(d)(g)
|
426
|
|
||||||
|
Assets held for sale
|
—
|
|
—
|
|
—
|
|
|||||||
|
Total current assets
|
7,437
|
|
(66
|
)
|
7,371
|
|
|||||||
|
Property, plant and equipment, net
|
7,267
|
|
(122
|
)
|
(b)(g)
|
7,145
|
|
||||||
|
Goodwill
|
44,843
|
|
1
|
|
(g)
|
44,844
|
|
||||||
|
Intangible assets, net
|
59,600
|
|
(17
|
)
|
(f)
|
59,583
|
|
||||||
|
Other non-current assets
|
1,640
|
|
—
|
|
1,640
|
|
|||||||
|
TOTAL ASSETS
|
$
|
120,787
|
|
$
|
(204
|
)
|
$
|
120,583
|
|
||||
|
LIABILITIES AND EQUITY
|
|||||||||||||
|
Commercial paper and other short-term debt
|
$
|
1,001
|
|
$
|
2
|
|
(g)
|
$
|
1,003
|
|
|||
|
Current portion of long-term debt
|
2,742
|
|
(27
|
)
|
(b)(g)
|
2,715
|
|
||||||
|
Trade payables
|
4,241
|
|
(93
|
)
|
(g)
|
4,148
|
|
||||||
|
Accrued marketing
|
567
|
|
9
|
|
(g)
|
576
|
|
||||||
|
Interest payable
|
345
|
|
—
|
|
345
|
|
|||||||
|
Other current liabilities
|
1,433
|
|
67
|
|
(a)(d)(e)(g)
|
1,500
|
|
||||||
|
Liabilities held for sale
|
—
|
|
—
|
|
—
|
|
|||||||
|
Total current liabilities
|
10,329
|
|
(42
|
)
|
10,287
|
|
|||||||
|
Long-term debt
|
28,561
|
|
(96
|
)
|
(b)(g)
|
28,465
|
|
||||||
|
Deferred income taxes
|
14,085
|
|
21
|
|
(a)(e)(f)(g)
|
14,106
|
|
||||||
|
Accrued postemployment costs
|
400
|
|
—
|
|
400
|
|
|||||||
|
Other non-current liabilities
|
949
|
|
74
|
|
(a)
|
1,023
|
|
||||||
|
TOTAL LIABILITIES
|
54,324
|
|
(43
|
)
|
54,281
|
|
|||||||
|
Commitments and Contingencies
|
|
|
|
||||||||||
|
Redeemable noncontrolling interest
|
8
|
|
—
|
|
8
|
|
|||||||
|
Equity:
|
|||||||||||||
|
Common stock, $0.01 par value (5,000 shares authorized; 1,222 shares issued and 1,219 shares outstanding at March 31, 2018)
|
12
|
|
—
|
|
12
|
|
|||||||
|
Additional paid-in capital
|
58,733
|
|
(77
|
)
|
(d)
|
58,656
|
|
||||||
|
Retained earnings/(deficit)
|
8,718
|
|
(84
|
)
|
(a)(b)(d)(e)(f)(g)
|
8,634
|
|
||||||
|
Accumulated other comprehensive income/(losses)
|
(975
|
)
|
—
|
|
(b)(e)
|
(975
|
)
|
||||||
|
Treasury stock, at cost (3 shares at March 31, 2018)
|
(240
|
)
|
—
|
|
(240
|
)
|
|||||||
|
Total shareholders' equity
|
66,248
|
|
(161
|
)
|
66,087
|
|
|||||||
|
Noncontrolling interest
|
207
|
|
—
|
|
207
|
|
|||||||
|
TOTAL EQUITY
|
66,455
|
|
(161
|
)
|
66,294
|
|
|||||||
|
TOTAL LIABILITIES AND EQUITY
|
$
|
120,787
|
|
$
|
(204
|
)
|
$
|
120,583
|
|
||||
173
(a) Supplier Rebates—The correction of these misstatements resulted in a decrease to income taxes receivable of
$1 million
, a decrease to other current assets of
$8 million
, an increase to other current liabilities of
$63 million
, a decrease to deferred income taxes of
$35 million
, an increase to other non-current liabilities of
$74 million
, and a decrease to retained earnings of
$111 million
at March 31, 2018.
(b) Capital Leases—The correction of these misstatements resulted in a decrease to income taxes receivable of less than
$1 million
, a decrease to property, plant and equipment, net, of
$120 million
, a decrease to current portion of long-term debt of
$25 million
, a decrease to long-term debt of
$96 million
, an increase to retained earnings of
$1 million
, and a decrease to accumulated other comprehensive losses of less than
$1 million
at March 31, 2018.
(c) Customer Incentive Program Expense Misclassifications—None.
(d) Balance Sheet Misclassifications—The correction of these misstatements resulted in a decrease to income taxes receivable of
$28 million
, a decrease to inventories of
$53 million
, an increase other current assets of
$53 million
, a decrease to other current liabilities of
$28 million
, a decrease to additional paid-in capital of
$77 million
and an increase to retained earnings of
$77 million
at March 31, 2018.
(e) Income Taxes—The correction of these misstatements resulted in a decrease to income taxes receivable of less than
$1 million
, a decrease to other current liabilities of
$29 million
, an increase to deferred income taxes of
$59 million
, a decrease to retained earnings of
$30 million
, and a decrease to accumulated other comprehensive losses of less than
$1 million
at March 31, 2018.
(f) Impairments—The correction of these misstatements resulted in a decrease to intangible assets, net of
$17 million
, a decrease to deferred income taxes of
$4 million
, and a decrease to retained earnings of
$13 million
at March 31, 2018.
(g) Other—The correction of these misstatements resulted in an increase to income taxes receivable of less than
$1 million
, a decrease to inventories of
$2 million
, a decrease to other current assets of
$27 million
, a decrease to property, plant and equipment, net of
$2 million
, an increase to goodwill of
$1 million
, an increase to commercial paper and other short term debt of
$2 million
, a decrease to current portion of long-term debt of
$2 million
, a decrease to trade payables of
$93 million
, an increase to accrued marketing of
$9 million
, an increase to other current liabilities of
$61 million
, an increase to long-term debt of less than
$1 million
, an increase to deferred income taxes of
$1 million
, and a decrease to retained earnings of
$8 million
at March 31, 2018.
See Note 2,
Restatement of Previously Issued Consolidated Financial Statements
, for a description of the misstatements in each category of restatements referenced by (a) through (g).
174
The Kraft Heinz Company
Condensed Consolidated Balance Sheet
(in millions, except per share data)
|
September 30, 2017
|
|||||||||||||
|
|
As Previously Reported
|
Restatement Impacts
|
Restatement Reference
|
As Restated
|
|||||||||
|
ASSETS
|
|||||||||||||
|
Cash and cash equivalents
|
$
|
1,441
|
|
$
|
—
|
|
$
|
1,441
|
|
||||
|
Trade receivables (net of allowances of $29 at September 30, 2017)
|
938
|
|
—
|
|
938
|
|
|||||||
|
Sold receivables
|
427
|
|
—
|
|
427
|
|
|||||||
|
Income taxes receivable
|
328
|
|
(38
|
)
|
(a)(e)(g)
|
290
|
|
||||||
|
Inventories
|
3,188
|
|
(52
|
)
|
(d)
|
3,136
|
|
||||||
|
Prepaid expenses
|
368
|
|
—
|
|
368
|
|
|||||||
|
Other current assets
|
538
|
|
(11
|
)
|
(a)(d)
|
527
|
|
||||||
|
Assets held for sale
|
—
|
|
—
|
|
—
|
|
|||||||
|
Total current assets
|
7,228
|
|
(101
|
)
|
7,127
|
|
|||||||
|
Property, plant and equipment, net
|
6,934
|
|
(32
|
)
|
(b)(g)
|
6,902
|
|
||||||
|
Goodwill
|
44,858
|
|
1
|
|
(g)
|
44,859
|
|
||||||
|
Intangible assets, net
|
59,500
|
|
(17
|
)
|
(f)
|
59,483
|
|
||||||
|
Other non-current assets
|
1,531
|
|
—
|
|
1,531
|
|
|||||||
|
TOTAL ASSETS
|
$
|
120,051
|
|
$
|
(149
|
)
|
$
|
119,902
|
|
||||
|
LIABILITIES AND EQUITY
|
|||||||||||||
|
Commercial paper and other short-term debt
|
$
|
455
|
|
$
|
2
|
|
(g)
|
$
|
457
|
|
|||
|
Current portion of long-term debt
|
2,755
|
|
(8
|
)
|
(b)(g)
|
2,747
|
|
||||||
|
Trade payables
|
3,947
|
|
(74
|
)
|
(g)
|
3,873
|
|
||||||
|
Accrued marketing
|
493
|
|
7
|
|
(g)
|
500
|
|
||||||
|
Interest payable
|
295
|
|
—
|
|
295
|
|
|||||||
|
Other current liabilities
|
1,442
|
|
136
|
|
(a)(e)(g)
|
1,578
|
|
||||||
|
Liabilities held for sale
|
—
|
|
—
|
|
—
|
|
|||||||
|
Total current liabilities
|
9,387
|
|
63
|
|
9,450
|
|
|||||||
|
Long-term debt
|
28,299
|
|
(23
|
)
|
(b)(g)
|
28,276
|
|
||||||
|
Deferred income taxes
|
20,898
|
|
(57
|
)
|
(a)(e)(f)
|
20,841
|
|
||||||
|
Accrued postemployment costs
|
1,808
|
|
—
|
|
1,808
|
|
|||||||
|
Other non-current liabilities
|
688
|
|
27
|
|
(a)
|
715
|
|
||||||
|
TOTAL LIABILITIES
|
61,080
|
|
10
|
|
61,090
|
|
|||||||
|
Commitments and Contingencies
|
|
|
|
||||||||||
|
Redeemable noncontrolling interest
|
—
|
|
—
|
|
—
|
|
|||||||
|
Equity:
|
|||||||||||||
|
Common stock, $0.01 par value (5,000 shares authorized; 1,221 shares issued and 1,218 shares outstanding at September 30, 2017)
|
12
|
|
—
|
|
12
|
|
|||||||
|
Additional paid-in capital
|
58,695
|
|
(77
|
)
|
(d)
|
58,618
|
|
||||||
|
Retained earnings/(deficit)
|
1,360
|
|
(80
|
)
|
(a)(d)(e)(f)(g)
|
1,280
|
|
||||||
|
Accumulated other comprehensive income/(losses)
|
(1,085
|
)
|
(2
|
)
|
(e)
|
(1,087
|
)
|
||||||
|
Treasury stock, at cost (3 shares at September 30, 2017)
|
(223
|
)
|
—
|
|
(223
|
)
|
|||||||
|
Total shareholders' equity
|
58,759
|
|
(159
|
)
|
58,600
|
|
|||||||
|
Noncontrolling interest
|
212
|
|
—
|
|
212
|
|
|||||||
|
TOTAL EQUITY
|
58,971
|
|
(159
|
)
|
58,812
|
|
|||||||
|
TOTAL LIABILITIES AND EQUITY
|
$
|
120,051
|
|
$
|
(149
|
)
|
$
|
119,902
|
|
||||
175
(a) Supplier Rebates—The correction of these misstatements resulted in an increase to income taxes receivable of
$1 million
, a decrease to other current assets of
$63 million
, an increase to other current liabilities of
$39 million
, a decrease to deferred income taxes of
$45 million
, an increase to other non-current liabilities of
$27 million
, and a decrease to retained earnings of
$83 million
at September 30, 2017.
(b) Capital Leases—The correction of these misstatements resulted in a decrease to property, plant and equipment, net, of
$29 million
, a decrease to current portion of long-term debt of
$7 million
, and a decrease to long-term debt of
$22 million
at September 30, 2017.
(c) Customer Incentive Program Expense Misclassifications—None.
(d) Balance Sheet Misclassifications—The correction of these misstatements resulted in a decrease to inventories of
$52 million
, an increase other current assets of
$52 million
, a decrease to additional paid-in capital of
$77 million
, and an increase to retained earnings of
$77 million
at September 30, 2017.
(e) Income Taxes—The correction of these misstatements resulted in a decrease to income taxes receivable of
$48 million
, a decrease in other current liabilities of less than
$1 million
, a decrease to deferred income taxes of
$8 million
, a decrease to retained earnings of
$38 million
, and an increase to accumulated other comprehensive losses of
$2 million
at September 30, 2017.
(f) Impairments—The correction of these misstatements resulted in a decrease to intangible assets, net of
$17 million
, a decrease to deferred income taxes of
$4 million
, and a decrease to retained earnings of
$13 million
at September 30, 2017.
(g) Other—The correction of these misstatements resulted in an increase to income taxes receivable of
$9 million
, a decrease to property, plant and equipment, net of
$3 million
, an increase to goodwill of
$1 million
, an increase to commercial paper and other short term debt of
$2 million
, a decrease to current portion of long-term debt of
$1 million
, a decrease to trade payables of
$74 million
, an increase to accrued marketing of
$7 million
, an increase to other current liabilities of
$97 million
, a decrease to long-term debt of
$1 million
, and a decrease to retained earnings of
$23 million
at September 30, 2017.
See Note 2,
Restatement of Previously Issued Consolidated Financial Statements
, for a description of the misstatements in each category of restatements referenced by (a) through (g).
176
The Kraft Heinz Company
Condensed Consolidated Balance Sheet
(in millions, except per share data)
|
July 1, 2017
|
|||||||||||||
|
|
As Previously Reported
|
Restatement Impacts
|
Restatement Reference
|
As Restated
|
|||||||||
|
ASSETS
|
|||||||||||||
|
Cash and cash equivalents
|
$
|
1,445
|
|
$
|
—
|
|
$
|
1,445
|
|
||||
|
Trade receivables (net of allowances of $28 at July 1, 2017)
|
913
|
|
60
|
|
(d)
|
973
|
|
||||||
|
Sold receivables
|
521
|
|
(60
|
)
|
(d)
|
461
|
|
||||||
|
Income taxes receivable
|
277
|
|
(40
|
)
|
(a)(e)(g)
|
237
|
|
||||||
|
Inventories
|
3,065
|
|
(53
|
)
|
(d)
|
3,012
|
|
||||||
|
Prepaid expenses
|
359
|
|
—
|
|
359
|
|
|||||||
|
Other current assets
|
528
|
|
19
|
|
(a)(d)
|
547
|
|
||||||
|
Assets held for sale
|
—
|
|
—
|
|
—
|
|
|||||||
|
Total current assets
|
7,108
|
|
(74
|
)
|
7,034
|
|
|||||||
|
Property, plant and equipment, net
|
6,808
|
|
(4
|
)
|
(g)
|
6,804
|
|
||||||
|
Goodwill
|
44,565
|
|
1
|
|
(g)
|
44,566
|
|
||||||
|
Intangible assets, net
|
59,400
|
|
(17
|
)
|
(f)
|
59,383
|
|
||||||
|
Other non-current assets
|
1,535
|
|
—
|
|
1,535
|
|
|||||||
|
TOTAL ASSETS
|
$
|
119,416
|
|
$
|
(94
|
)
|
$
|
119,322
|
|
||||
|
LIABILITIES AND EQUITY
|
|||||||||||||
|
Commercial paper and other short-term debt
|
$
|
1,090
|
|
$
|
—
|
|
$
|
1,090
|
|
||||
|
Current portion of long-term debt
|
19
|
|
—
|
|
(g)
|
19
|
|
||||||
|
Trade payables
|
3,888
|
|
(83
|
)
|
(g)
|
3,805
|
|
||||||
|
Accrued marketing
|
494
|
|
5
|
|
(g)
|
499
|
|
||||||
|
Interest payable
|
406
|
|
—
|
|
406
|
|
|||||||
|
Other current liabilities
|
1,459
|
|
130
|
|
(a)(e)(g)
|
1,589
|
|
||||||
|
Liabilities held for sale
|
—
|
|
—
|
|
—
|
|
|||||||
|
Total current liabilities
|
7,356
|
|
52
|
|
7,408
|
|
|||||||
|
Long-term debt
|
29,979
|
|
(1
|
)
|
(g)
|
29,978
|
|
||||||
|
Deferred income taxes
|
20,887
|
|
(47
|
)
|
(a)(e)(f)
|
20,840
|
|
||||||
|
Accrued postemployment costs
|
1,975
|
|
—
|
|
1,975
|
|
|||||||
|
Other non-current liabilities
|
673
|
|
28
|
|
(a)
|
701
|
|
||||||
|
TOTAL LIABILITIES
|
60,870
|
|
32
|
|
60,902
|
|
|||||||
|
Commitments and Contingencies
|
|
|
|
||||||||||
|
Redeemable noncontrolling interest
|
—
|
|
—
|
|
—
|
|
|||||||
|
Equity:
|
|||||||||||||
|
Common stock, $0.01 par value (5,000 shares authorized; 1,221 shares issued and 1,218 shares outstanding at July 1, 2017)
|
12
|
|
—
|
|
12
|
|
|||||||
|
Additional paid-in capital
|
58,674
|
|
(77
|
)
|
(d)
|
58,597
|
|
||||||
|
Retained earnings/(deficit)
|
1,178
|
|
(49
|
)
|
(a)(d)(e)(f)(g)
|
1,129
|
|
||||||
|
Accumulated other comprehensive income/(losses)
|
(1,308
|
)
|
—
|
|
(e)
|
(1,308
|
)
|
||||||
|
Treasury stock, at cost (3 shares at July 1, 2017)
|
(223
|
)
|
—
|
|
(223
|
)
|
|||||||
|
Total shareholders' equity
|
58,333
|
|
(126
|
)
|
58,207
|
|
|||||||
|
Noncontrolling interest
|
213
|
|
—
|
|
213
|
|
|||||||
|
TOTAL EQUITY
|
58,546
|
|
(126
|
)
|
58,420
|
|
|||||||
|
TOTAL LIABILITIES AND EQUITY
|
$
|
119,416
|
|
$
|
(94
|
)
|
$
|
119,322
|
|
||||
177
(a) Supplier Rebates—The correction of these misstatements resulted in an increase to income taxes receivable of
$1 million
, a decrease to other current assets of
$34 million
, an increase to other current liabilities of
$31 million
, a decrease to deferred income taxes of
$33 million
, an increase to other non-current liabilities of
$28 million
, and a decrease to retained earnings of
$59 million
at July 1, 2017.
(b) Capital Leases—None.
(c) Customer Incentive Program Expense Misclassifications—None.
(d) Balance Sheet Misclassifications—The correction of these misstatements resulted in an increase to trade receivables, net of
$60 million
, a decrease to sold receivables of
$60 million
, a decrease to inventories of
$53 million
, an increase other current assets of
$53 million
, a decrease to additional paid-in capital of
$77 million
, and an increase to retained earnings of
$77 million
at July 1, 2017.
(e) Income Taxes—The correction of these misstatements resulted in a decrease to income taxes receivable of
$48 million
, an increase in other current liabilities of less than
$1 million
, a decrease to deferred income taxes of
$10 million
, a decrease to retained earnings of
$38 million
, and an increase to accumulated other comprehensive losses of less than
$1 million
at July 1, 2017.
(f) Impairments—The correction of these misstatements resulted in a decrease to intangible assets, net of
$17 million
, a decrease to deferred income taxes of
$4 million
, and a decrease to retained earnings of
$13 million
at July 1, 2017.
(g) Other—The correction of these misstatements resulted in an increase to income taxes receivable of
$7 million
, a decrease to property, plant and equipment, net of
$4 million
, an increase to goodwill of
$1 million
, a decrease to current portion of long-term debt of less than
$1 million
, a decrease to trade payables of
$83 million
, an increase to accrued marketing of
$5 million
, an increase to other current liabilities of
$99 million
, a decrease to long-term debt of
$1 million
, and a decrease to retained earnings of
$16 million
at July 1, 2017.
See Note 2,
Restatement of Previously Issued Consolidated Financial Statements
, for a description of the misstatements in each category of restatements referenced by (a) through (g).
178
The Kraft Heinz Company
Condensed Consolidated Balance Sheet
(in millions, except per share data)
|
April 1, 2017
|
|||||||||||||
|
|
As Previously Reported
|
Restatement Impacts
|
Restatement Reference
|
As Restated
|
|||||||||
|
ASSETS
|
|||||||||||||
|
Cash and cash equivalents
|
$
|
3,242
|
|
$
|
—
|
|
$
|
3,242
|
|
||||
|
Trade receivables (net of allowances of $30 at April 1, 2017)
|
886
|
|
50
|
|
(d)
|
936
|
|
||||||
|
Sold receivables
|
588
|
|
(50
|
)
|
(d)
|
538
|
|
||||||
|
Income taxes receivable
|
270
|
|
(1
|
)
|
(a)(e)(g)
|
269
|
|
||||||
|
Inventories
|
3,151
|
|
(57
|
)
|
(d)
|
3,094
|
|
||||||
|
Prepaid expenses
|
349
|
|
—
|
|
349
|
|
|||||||
|
Other current assets
|
389
|
|
222
|
|
(a)(d)(g)
|
611
|
|
||||||
|
Assets held for sale
|
—
|
|
—
|
|
—
|
|
|||||||
|
Total current assets
|
8,875
|
|
164
|
|
9,039
|
|
|||||||
|
Property, plant and equipment, net
|
6,693
|
|
(4
|
)
|
(g)
|
6,689
|
|
||||||
|
Goodwill
|
44,300
|
|
1
|
|
(g)
|
44,301
|
|
||||||
|
Intangible assets, net
|
59,330
|
|
(17
|
)
|
(f)
|
59,313
|
|
||||||
|
Other non-current assets
|
1,604
|
|
—
|
|
1,604
|
|
|||||||
|
TOTAL ASSETS
|
$
|
120,802
|
|
$
|
144
|
|
$
|
120,946
|
|
||||
|
LIABILITIES AND EQUITY
|
|||||||||||||
|
Commercial paper and other short-term debt
|
$
|
909
|
|
$
|
—
|
|
$
|
909
|
|
||||
|
Current portion of long-term debt
|
2,023
|
|
(1
|
)
|
(g)
|
2,022
|
|
||||||
|
Trade payables
|
3,936
|
|
(78
|
)
|
(g)
|
3,858
|
|
||||||
|
Accrued marketing
|
599
|
|
2
|
|
(g)
|
601
|
|
||||||
|
Interest payable
|
346
|
|
—
|
|
346
|
|
|||||||
|
Other current liabilities
|
1,570
|
|
335
|
|
(a)(e)(g)
|
1,905
|
|
||||||
|
Liabilities held for sale
|
—
|
|
—
|
|
—
|
|
|||||||
|
Total current liabilities
|
9,383
|
|
258
|
|
9,641
|
|
|||||||
|
Long-term debt
|
29,748
|
|
(1
|
)
|
(g)
|
29,747
|
|
||||||
|
Deferred income taxes
|
20,910
|
|
(37
|
)
|
(a)(e)(f)
|
20,873
|
|
||||||
|
Accrued postemployment costs
|
2,016
|
|
—
|
|
2,016
|
|
|||||||
|
Other non-current liabilities
|
801
|
|
50
|
|
(a)(g)
|
851
|
|
||||||
|
TOTAL LIABILITIES
|
62,858
|
|
270
|
|
63,128
|
|
|||||||
|
Commitments and Contingencies
|
|
|
|
||||||||||
|
Redeemable noncontrolling interest
|
—
|
|
—
|
|
—
|
|
|||||||
|
Equity:
|
|||||||||||||
|
Common stock, $0.01 par value (5,000 shares authorized; 1,220 shares issued and 1,218 shares outstanding at April 1, 2017)
|
12
|
|
—
|
|
12
|
|
|||||||
|
Additional paid-in capital
|
58,642
|
|
(77
|
)
|
(d)
|
58,565
|
|
||||||
|
Retained earnings/(deficit)
|
750
|
|
(45
|
)
|
(a)(d)(e)(f)(g)
|
705
|
|
||||||
|
Accumulated other comprehensive income/(losses)
|
(1,449
|
)
|
(4
|
)
|
(e)
|
(1,453
|
)
|
||||||
|
Treasury stock, at cost (2 shares at April 1, 2017)
|
(223
|
)
|
—
|
|
(223
|
)
|
|||||||
|
Total shareholders' equity
|
57,732
|
|
(126
|
)
|
57,606
|
|
|||||||
|
Noncontrolling interest
|
212
|
|
—
|
|
212
|
|
|||||||
|
TOTAL EQUITY
|
57,944
|
|
(126
|
)
|
57,818
|
|
|||||||
|
TOTAL LIABILITIES AND EQUITY
|
$
|
120,802
|
|
$
|
144
|
|
$
|
120,946
|
|
||||
179
(a) Supplier Rebates—The correction of these misstatements resulted in a decrease to income taxes receivable of
$1 million
, a decrease to other current assets of
$15 million
, an increase to other current liabilities of
$26 million
, a decrease to deferred income taxes of
$26 million
, an increase to other non-current liabilities of
$28 million
, and a decrease to retained earnings of
$44 million
at April 1, 2017.
(b) Capital Leases—None.
(c) Customer Incentive Program Expense Misclassifications—None.
(d) Balance Sheet Misclassifications—The correction of these misstatements resulted in an increase to trade receivables, net of
$50 million
, a decrease to sold receivables of
$50 million
, a decrease to inventories of
$57 million
, an increase to other current assets of
$57 million
, a decrease to additional paid-in capital of
$77 million
, and an increase to retained earnings of
$77 million
at April 1, 2017.
(e) Income Taxes—The correction of these misstatements resulted in a decrease to income taxes receivable of less than
$1 million
, an increase in other current liabilities of
$49 million
, a decrease to deferred income taxes of
$7 million
, a decrease to retained earnings of
$38 million
, and an increase to accumulated other comprehensive losses of
$4 million
at April 1, 2017.
(f) Impairments—The correction of these misstatements resulted in a decrease to intangible assets, net of
$17 million
, a decrease to deferred income taxes of
$4 million
, and a decrease to retained earnings of
$13 million
at April 1, 2017.
(g) Other—The correction of these misstatements resulted in an increase to income taxes receivable of less than
$1 million
, an increase to other current assets of
$180 million
, a decrease to property, plant and equipment, net of
$4 million
, an increase to goodwill of
$1 million
, a decrease to current portion of long-term debt of
$1 million
, a decrease to trade payables of
$78 million
, an increase to accrued marketing of
$2 million
, an increase to other current liabilities of
$260 million
, a decrease to long-term debt of
$1 million
, an increase to other non-current liabilities of
$22 million
, and a decrease to retained earnings of
$27 million
at April 1, 2017.
See Note 2,
Restatement of Previously Issued Consolidated Financial Statements
, for a description of the misstatements in each category of restatements referenced by (a) through (g).
180
The Kraft Heinz Company
Condensed Consolidated Statement of Equity
For the Nine Months Ended September 29, 2018
(in millions, except per share data)
|
Restatement Reference
|
Common Stock
|
Additional Paid-in Capital
|
Retained Earnings/(Deficit)
|
Accumulated Other Comprehensive Income/(Losses)
|
Treasury Stock, at Cost
|
Noncontrolling Interest
|
Total Equity
|
||||||||||||||||||||||
|
As Previously Reported
|
|||||||||||||||||||||||||||||
|
Balance at December 30, 2017
|
$
|
12
|
|
$
|
58,711
|
|
$
|
8,589
|
|
$
|
(1,054
|
)
|
$
|
(224
|
)
|
$
|
207
|
|
$
|
66,241
|
|
||||||||
|
Net income/(loss) excluding redeemable noncontrolling interest
|
—
|
|
—
|
|
2,379
|
|
—
|
|
—
|
|
6
|
|
2,385
|
|
|||||||||||||||
|
Other comprehensive income/(loss) excluding redeemable noncontrolling interest
|
—
|
|
—
|
|
—
|
|
(678
|
)
|
—
|
|
(13
|
)
|
(691
|
)
|
|||||||||||||||
|
Dividends declared-common stock ($1.875 per share)
|
—
|
|
—
|
|
(2,286
|
)
|
—
|
|
—
|
|
—
|
|
(2,286
|
)
|
|||||||||||||||
|
Cumulative effect of accounting standards adopted in the period
|
—
|
|
—
|
|
(97
|
)
|
—
|
|
—
|
|
—
|
|
(97
|
)
|
|||||||||||||||
|
Exercise of stock options, issuance of other stock awards, and other
|
—
|
|
82
|
|
(9
|
)
|
—
|
|
(40
|
)
|
(13
|
)
|
20
|
|
|||||||||||||||
|
Balance at September 29, 2018
|
$
|
12
|
|
$
|
58,793
|
|
$
|
8,576
|
|
$
|
(1,732
|
)
|
$
|
(264
|
)
|
$
|
187
|
|
$
|
65,572
|
|
||||||||
|
Restatement Impacts
|
|||||||||||||||||||||||||||||
|
Balance at December 30, 2017
|
$
|
—
|
|
$
|
(77
|
)
|
$
|
(94
|
)
|
$
|
—
|
|
$
|
—
|
|
$
|
—
|
|
$
|
(171
|
)
|
||||||||
|
Net income/(loss) excluding redeemable noncontrolling interest
|
(a)(b)(e)(f)(g)
|
—
|
|
—
|
|
(3
|
)
|
—
|
|
—
|
|
1
|
|
(2
|
)
|
||||||||||||||
|
Other comprehensive income/(loss) excluding redeemable noncontrolling interest
|
(b)(e)(f)
|
—
|
|
—
|
|
—
|
|
8
|
|
—
|
|
—
|
|
8
|
|
||||||||||||||
|
Dividends declared-common stock ($1.875 per share)
|
—
|
|
—
|
|
—
|
|
—
|
|
—
|
|
—
|
|
—
|
|
|||||||||||||||
|
Cumulative effect of accounting standards adopted in the period
|
—
|
|
—
|
|
—
|
|
—
|
|
—
|
|
—
|
|
—
|
|
|||||||||||||||
|
Exercise of stock options, issuance of other stock awards, and other
|
—
|
|
—
|
|
—
|
|
—
|
|
—
|
|
—
|
|
—
|
|
|||||||||||||||
|
Balance at September 29, 2018
|
$
|
—
|
|
$
|
(77
|
)
|
$
|
(97
|
)
|
$
|
8
|
|
$
|
—
|
|
$
|
1
|
|
$
|
(165
|
)
|
||||||||
|
As Restated
|
|||||||||||||||||||||||||||||
|
Balance at December 30, 2017
|
$
|
12
|
|
$
|
58,634
|
|
$
|
8,495
|
|
$
|
(1,054
|
)
|
$
|
(224
|
)
|
$
|
207
|
|
$
|
66,070
|
|
||||||||
|
Net income/(loss) excluding redeemable noncontrolling interest
|
—
|
|
—
|
|
2,376
|
|
—
|
|
—
|
|
7
|
|
2,383
|
|
|||||||||||||||
|
Other comprehensive income/(loss) excluding redeemable noncontrolling interest
|
—
|
|
—
|
|
—
|
|
(670
|
)
|
—
|
|
(13
|
)
|
(683
|
)
|
|||||||||||||||
|
Dividends declared-common stock ($1.875 per share)
|
—
|
|
—
|
|
(2,286
|
)
|
—
|
|
—
|
|
—
|
|
(2,286
|
)
|
|||||||||||||||
|
Cumulative effect of accounting standards adopted in the period
|
—
|
|
—
|
|
(97
|
)
|
—
|
|
—
|
|
—
|
|
(97
|
)
|
|||||||||||||||
|
Exercise of stock options, issuance of other stock awards, and other
|
—
|
|
82
|
|
(9
|
)
|
—
|
|
(40
|
)
|
(13
|
)
|
20
|
|
|||||||||||||||
|
Balance at September 29, 2018
|
$
|
12
|
|
$
|
58,716
|
|
$
|
8,479
|
|
$
|
(1,724
|
)
|
$
|
(264
|
)
|
$
|
188
|
|
$
|
65,407
|
|
||||||||
See descriptions of the net income and other comprehensive income impacts in the consolidated statement of income and consolidated statement of comprehensive income for the nine months ended September 29, 2018 sections above.
See Note 2,
Restatement of Previously Issued Consolidated Financial Statements
, for a description of the misstatements in each category of restatements referenced by (a) through (g).
181
The Kraft Heinz Company
Condensed Consolidated Statement of Equity
For the Six Months Ended June 30, 2018
(in millions, except per share data)
|
Restatement Reference
|
Common Stock
|
Additional Paid-in Capital
|
Retained Earnings/(Deficit)
|
Accumulated Other Comprehensive Income/(Losses)
|
Treasury Stock, at Cost
|
Noncontrolling Interest
|
Total Equity
|
||||||||||||||||||||||
|
As Previously Reported
|
|||||||||||||||||||||||||||||
|
Balance at December 30, 2017
|
$
|
12
|
|
$
|
58,711
|
|
$
|
8,589
|
|
$
|
(1,054
|
)
|
$
|
(224
|
)
|
$
|
207
|
|
$
|
66,241
|
|
||||||||
|
Net income/(loss) excluding redeemable noncontrolling interest
|
—
|
|
—
|
|
1,749
|
|
—
|
|
—
|
|
5
|
|
1,754
|
|
|||||||||||||||
|
Other comprehensive income/(loss) excluding redeemable noncontrolling interest
|
—
|
|
—
|
|
—
|
|
(503
|
)
|
—
|
|
(11
|
)
|
(514
|
)
|
|||||||||||||||
|
Dividends declared-common stock ($1.25 per share)
|
—
|
|
—
|
|
(1,524
|
)
|
—
|
|
—
|
|
—
|
|
(1,524
|
)
|
|||||||||||||||
|
Cumulative effect of accounting standards adopted in the period
|
—
|
|
—
|
|
(95
|
)
|
—
|
|
—
|
|
—
|
|
(95
|
)
|
|||||||||||||||
|
Exercise of stock options, issuance of other stock awards, and other
|
—
|
|
55
|
|
(9
|
)
|
—
|
|
(30
|
)
|
(13
|
)
|
3
|
|
|||||||||||||||
|
Balance at June 30, 2018
|
$
|
12
|
|
$
|
58,766
|
|
$
|
8,710
|
|
$
|
(1,557
|
)
|
$
|
(254
|
)
|
$
|
188
|
|
$
|
65,865
|
|
||||||||
|
Restatement Impacts
|
|||||||||||||||||||||||||||||
|
Balance at December 30, 2017
|
$
|
—
|
|
$
|
(77
|
)
|
$
|
(94
|
)
|
$
|
—
|
|
$
|
—
|
|
$
|
—
|
|
$
|
(171
|
)
|
||||||||
|
Net income/(loss) excluding redeemable noncontrolling interest
|
(a)(b)(e)(f)(g)
|
—
|
|
—
|
|
8
|
|
—
|
|
—
|
|
—
|
|
8
|
|
||||||||||||||
|
Other comprehensive income/(loss) excluding redeemable noncontrolling interest
|
(b)(e)(f)
|
—
|
|
—
|
|
—
|
|
6
|
|
—
|
|
—
|
|
6
|
|
||||||||||||||
|
Dividends declared-common stock ($1.25 per share)
|
—
|
|
—
|
|
—
|
|
—
|
|
—
|
|
—
|
|
—
|
|
|||||||||||||||
|
Cumulative effect of accounting standards adopted in the period
|
—
|
|
—
|
|
—
|
|
—
|
|
—
|
|
—
|
|
—
|
|
|||||||||||||||
|
Exercise of stock options, issuance of other stock awards, and other
|
—
|
|
—
|
|
—
|
|
—
|
|
—
|
|
—
|
|
—
|
|
|||||||||||||||
|
Balance at June 30, 2018
|
$
|
—
|
|
$
|
(77
|
)
|
$
|
(86
|
)
|
$
|
6
|
|
$
|
—
|
|
$
|
—
|
|
$
|
(157
|
)
|
||||||||
|
As Restated
|
|||||||||||||||||||||||||||||
|
Balance at December 30, 2017
|
$
|
12
|
|
$
|
58,634
|
|
$
|
8,495
|
|
$
|
(1,054
|
)
|
$
|
(224
|
)
|
$
|
207
|
|
$
|
66,070
|
|
||||||||
|
Net income/(loss) excluding redeemable noncontrolling interest
|
—
|
|
—
|
|
1,757
|
|
—
|
|
—
|
|
5
|
|
1,762
|
|
|||||||||||||||
|
Other comprehensive income/(loss) excluding redeemable noncontrolling interest
|
—
|
|
—
|
|
—
|
|
(497
|
)
|
—
|
|
(11
|
)
|
(508
|
)
|
|||||||||||||||
|
Dividends declared-common stock ($1.25 per share)
|
—
|
|
—
|
|
(1,524
|
)
|
—
|
|
—
|
|
—
|
|
(1,524
|
)
|
|||||||||||||||
|
Cumulative effect of accounting standards adopted in the period
|
—
|
|
—
|
|
(95
|
)
|
—
|
|
—
|
|
—
|
|
(95
|
)
|
|||||||||||||||
|
Exercise of stock options, issuance of other stock awards, and other
|
—
|
|
55
|
|
(9
|
)
|
—
|
|
(30
|
)
|
(13
|
)
|
3
|
|
|||||||||||||||
|
Balance at June 30, 2018
|
$
|
12
|
|
$
|
58,689
|
|
$
|
8,624
|
|
$
|
(1,551
|
)
|
$
|
(254
|
)
|
$
|
188
|
|
$
|
65,708
|
|
||||||||
See descriptions of the net income and other comprehensive income impacts in the consolidated statement of income and consolidated statement of comprehensive income for the six months ended June 30, 2018 sections above.
See Note 2,
Restatement of Previously Issued Consolidated Financial Statements
, for a description of the misstatements in each category of restatements referenced by (a) through (g).
182
The Kraft Heinz Company
Condensed Consolidated Statement of Equity
For the Three Months Ended March 31, 2018
(in millions, except per share data)
|
Restatement Reference
|
Common Stock
|
Additional Paid-in Capital
|
Retained Earnings/(Deficit)
|
Accumulated Other Comprehensive Income/(Losses)
|
Treasury Stock, at Cost
|
Noncontrolling Interest
|
Total Equity
|
||||||||||||||||||||||
|
As Previously Reported
|
|||||||||||||||||||||||||||||
|
Balance at December 30, 2017
|
$
|
12
|
|
$
|
58,711
|
|
$
|
8,589
|
|
$
|
(1,054
|
)
|
$
|
(224
|
)
|
$
|
207
|
|
$
|
66,241
|
|
||||||||
|
Net income/(loss) excluding redeemable noncontrolling interest
|
—
|
|
—
|
|
993
|
|
—
|
|
—
|
|
5
|
|
998
|
|
|||||||||||||||
|
Other comprehensive income/(loss) excluding redeemable noncontrolling interest
|
—
|
|
—
|
|
—
|
|
79
|
|
—
|
|
(5
|
)
|
74
|
|
|||||||||||||||
|
Dividends declared-common stock ($0.625 per share)
|
—
|
|
—
|
|
(762
|
)
|
—
|
|
—
|
|
—
|
|
(762
|
)
|
|||||||||||||||
|
Cumulative effect of accounting standards adopted in the period
|
—
|
|
—
|
|
(95
|
)
|
—
|
|
—
|
|
—
|
|
(95
|
)
|
|||||||||||||||
|
Exercise of stock options, issuance of other stock awards, and other
|
—
|
|
22
|
|
(7
|
)
|
—
|
|
(16
|
)
|
—
|
|
(1
|
)
|
|||||||||||||||
|
Balance at March 31, 2018
|
$
|
12
|
|
$
|
58,733
|
|
$
|
8,718
|
|
$
|
(975
|
)
|
$
|
(240
|
)
|
$
|
207
|
|
$
|
66,455
|
|
||||||||
|
Restatement Impacts
|
|||||||||||||||||||||||||||||
|
Balance at December 30, 2017
|
$
|
—
|
|
$
|
(77
|
)
|
$
|
(94
|
)
|
$
|
—
|
|
$
|
—
|
|
$
|
—
|
|
$
|
(171
|
)
|
||||||||
|
Net income/(loss) excluding redeemable noncontrolling interest
|
(a)(b)(e)(f)(g)
|
—
|
|
—
|
|
10
|
|
—
|
|
—
|
|
—
|
|
10
|
|
||||||||||||||
|
Other comprehensive income/(loss) excluding redeemable noncontrolling interest
|
(b)(e)
|
—
|
|
—
|
|
—
|
|
—
|
|
—
|
|
—
|
|
—
|
|
||||||||||||||
|
Dividends declared-common stock ($0.625 per share)
|
—
|
|
—
|
|
—
|
|
—
|
|
—
|
|
—
|
|
—
|
|
|||||||||||||||
|
Cumulative effect of accounting standards adopted in the period
|
—
|
|
—
|
|
—
|
|
—
|
|
—
|
|
—
|
|
—
|
|
|||||||||||||||
|
Exercise of stock options, issuance of other stock awards, and other
|
—
|
|
—
|
|
—
|
|
—
|
|
—
|
|
—
|
|
—
|
|
|||||||||||||||
|
Balance at March 31, 2018
|
$
|
—
|
|
$
|
(77
|
)
|
$
|
(84
|
)
|
$
|
—
|
|
$
|
—
|
|
$
|
—
|
|
$
|
(161
|
)
|
||||||||
|
As Restated
|
|||||||||||||||||||||||||||||
|
Balance at December 30, 2017
|
$
|
12
|
|
$
|
58,634
|
|
$
|
8,495
|
|
$
|
(1,054
|
)
|
$
|
(224
|
)
|
$
|
207
|
|
$
|
66,070
|
|
||||||||
|
Net income/(loss) excluding redeemable noncontrolling interest
|
—
|
|
—
|
|
1,003
|
|
—
|
|
—
|
|
5
|
|
1,008
|
|
|||||||||||||||
|
Other comprehensive income/(loss) excluding redeemable noncontrolling interest
|
—
|
|
—
|
|
—
|
|
79
|
|
—
|
|
(5
|
)
|
74
|
|
|||||||||||||||
|
Dividends declared-common stock ($0.625 per share)
|
—
|
|
—
|
|
(762
|
)
|
—
|
|
—
|
|
—
|
|
(762
|
)
|
|||||||||||||||
|
Cumulative effect of accounting standards adopted in the period
|
—
|
|
—
|
|
(95
|
)
|
—
|
|
—
|
|
—
|
|
(95
|
)
|
|||||||||||||||
|
Exercise of stock options, issuance of other stock awards, and other
|
—
|
|
22
|
|
(7
|
)
|
—
|
|
(16
|
)
|
—
|
|
(1
|
)
|
|||||||||||||||
|
Balance at March 31, 2018
|
$
|
12
|
|
$
|
58,656
|
|
$
|
8,634
|
|
$
|
(975
|
)
|
$
|
(240
|
)
|
$
|
207
|
|
$
|
66,294
|
|
||||||||
See descriptions of the net income and other comprehensive income impacts in the consolidated statement of income and consolidated statement of comprehensive income for the three months ended March 31, 2018 sections above.
See Note 2,
Restatement of Previously Issued Consolidated Financial Statements
, for a description of the misstatements in each category of restatements referenced by (a) through (g).
183
The Kraft Heinz Company
Condensed Consolidated Statement of Equity
For the Nine Months Ended September 30, 2017
(in millions, except per share data)
|
Restatement Reference
|
Common Stock
|
Additional Paid-in Capital
|
Retained Earnings/(Deficit)
|
Accumulated Other Comprehensive Income/(Losses)
|
Treasury Stock, at Cost
|
Noncontrolling Interest
|
Total Equity
|
||||||||||||||||||||||
|
As Previously Reported
|
|||||||||||||||||||||||||||||
|
Balance at December 31, 2016
|
$
|
12
|
|
$
|
58,593
|
|
$
|
588
|
|
$
|
(1,628
|
)
|
$
|
(207
|
)
|
$
|
216
|
|
$
|
57,574
|
|
||||||||
|
Net income/(loss)
|
—
|
|
—
|
|
2,996
|
|
—
|
|
—
|
|
(2
|
)
|
2,994
|
|
|||||||||||||||
|
Other comprehensive income/(loss)
|
—
|
|
—
|
|
—
|
|
543
|
|
—
|
|
(2
|
)
|
541
|
|
|||||||||||||||
|
Dividends declared-common stock ($1.825 per share)
|
—
|
|
—
|
|
(2,225
|
)
|
—
|
|
—
|
|
—
|
|
(2,225
|
)
|
|||||||||||||||
|
Exercise of stock options, issuance of other stock awards, and other
|
—
|
|
102
|
|
1
|
|
—
|
|
(16
|
)
|
—
|
|
87
|
|
|||||||||||||||
|
Balance at September 30, 2017
|
$
|
12
|
|
$
|
58,695
|
|
$
|
1,360
|
|
$
|
(1,085
|
)
|
$
|
(223
|
)
|
$
|
212
|
|
$
|
58,971
|
|
||||||||
|
Restatement Impacts
|
|||||||||||||||||||||||||||||
|
Balance at December 31, 2016
|
$
|
—
|
|
$
|
(77
|
)
|
$
|
(36
|
)
|
$
|
(1
|
)
|
$
|
—
|
|
$
|
—
|
|
$
|
(114
|
)
|
||||||||
|
Net income/(loss)
|
(a)(e)(f)(g)
|
—
|
|
—
|
|
(44
|
)
|
—
|
|
—
|
|
—
|
|
(44
|
)
|
||||||||||||||
|
Other comprehensive income/(loss)
|
(e)
|
—
|
|
—
|
|
—
|
|
(1
|
)
|
—
|
|
—
|
|
(1
|
)
|
||||||||||||||
|
Dividends declared-common stock ($1.825 per share)
|
—
|
|
—
|
|
—
|
|
—
|
|
—
|
|
—
|
|
—
|
|
|||||||||||||||
|
Exercise of stock options, issuance of other stock awards, and other
|
—
|
|
—
|
|
—
|
|
—
|
|
—
|
|
—
|
|
—
|
|
|||||||||||||||
|
Balance at September 30, 2017
|
$
|
—
|
|
$
|
(77
|
)
|
$
|
(80
|
)
|
$
|
(2
|
)
|
$
|
—
|
|
$
|
—
|
|
$
|
(159
|
)
|
||||||||
|
As Restated
|
|||||||||||||||||||||||||||||
|
Balance at December 31, 2016
|
$
|
12
|
|
$
|
58,516
|
|
$
|
552
|
|
$
|
(1,629
|
)
|
$
|
(207
|
)
|
$
|
216
|
|
$
|
57,460
|
|
||||||||
|
Net income/(loss)
|
—
|
|
—
|
|
2,952
|
|
—
|
|
—
|
|
(2
|
)
|
2,950
|
|
|||||||||||||||
|
Other comprehensive income/(loss)
|
—
|
|
—
|
|
—
|
|
542
|
|
—
|
|
(2
|
)
|
540
|
|
|||||||||||||||
|
Dividends declared-common stock ($1.825 per share)
|
—
|
|
—
|
|
(2,225
|
)
|
—
|
|
—
|
|
—
|
|
(2,225
|
)
|
|||||||||||||||
|
Exercise of stock options, issuance of other stock awards, and other
|
—
|
|
102
|
|
1
|
|
—
|
|
(16
|
)
|
—
|
|
87
|
|
|||||||||||||||
|
Balance at September 30, 2017
|
$
|
12
|
|
$
|
58,618
|
|
$
|
1,280
|
|
$
|
(1,087
|
)
|
$
|
(223
|
)
|
$
|
212
|
|
$
|
58,812
|
|
||||||||
See descriptions of the net income and other comprehensive income impacts in the consolidated statement of income and consolidated statement of comprehensive income for the nine months ended September 30, 2017 sections above.
See Note 2,
Restatement of Previously Issued Consolidated Financial Statements
, for a description of the misstatements in each category of restatements referenced by (a) through (g).
184
The Kraft Heinz Company
Condensed Consolidated Statement of Equity
For the Six Months Ended July 1, 2017
(in millions, except per share data)
|
Restatement Reference
|
Common Stock
|
Additional Paid-in Capital
|
Retained Earnings/(Deficit)
|
Accumulated Other Comprehensive Income/(Losses)
|
Treasury Stock, at Cost
|
Noncontrolling Interest
|
Total Equity
|
||||||||||||||||||||||
|
As Previously Reported
|
|||||||||||||||||||||||||||||
|
Balance at December 31, 2016
|
$
|
12
|
|
$
|
58,593
|
|
$
|
588
|
|
$
|
(1,628
|
)
|
$
|
(207
|
)
|
$
|
216
|
|
$
|
57,574
|
|
||||||||
|
Net income/(loss)
|
—
|
|
—
|
|
2,052
|
|
—
|
|
—
|
|
(1
|
)
|
2,051
|
|
|||||||||||||||
|
Other comprehensive income/(loss)
|
—
|
|
—
|
|
—
|
|
320
|
|
—
|
|
(2
|
)
|
318
|
|
|||||||||||||||
|
Dividends declared-common stock ($1.20 per share)
|
—
|
|
—
|
|
(1,463
|
)
|
—
|
|
—
|
|
—
|
|
(1,463
|
)
|
|||||||||||||||
|
Exercise of stock options, issuance of other stock awards, and other
|
—
|
|
81
|
|
1
|
|
—
|
|
(16
|
)
|
—
|
|
66
|
|
|||||||||||||||
|
Balance at July 1, 2017
|
$
|
12
|
|
$
|
58,674
|
|
$
|
1,178
|
|
$
|
(1,308
|
)
|
$
|
(223
|
)
|
$
|
213
|
|
$
|
58,546
|
|
||||||||
|
Restatement Impacts
|
|||||||||||||||||||||||||||||
|
Balance at December 31, 2016
|
$
|
—
|
|
$
|
(77
|
)
|
$
|
(36
|
)
|
$
|
(1
|
)
|
$
|
—
|
|
$
|
—
|
|
$
|
(114
|
)
|
||||||||
|
Net income/(loss)
|
(a)(e)(f)(g)
|
—
|
|
—
|
|
(13
|
)
|
—
|
|
—
|
|
—
|
|
(13
|
)
|
||||||||||||||
|
Other comprehensive income/(loss)
|
(e)
|
—
|
|
—
|
|
—
|
|
1
|
|
—
|
|
—
|
|
1
|
|
||||||||||||||
|
Dividends declared-common stock ($1.20 per share)
|
—
|
|
—
|
|
—
|
|
—
|
|
—
|
|
—
|
|
—
|
|
|||||||||||||||
|
Exercise of stock options, issuance of other stock awards, and other
|
—
|
|
—
|
|
—
|
|
—
|
|
—
|
|
—
|
|
—
|
|
|||||||||||||||
|
Balance at July 1, 2017
|
$
|
—
|
|
$
|
(77
|
)
|
$
|
(49
|
)
|
$
|
—
|
|
$
|
—
|
|
$
|
—
|
|
$
|
(126
|
)
|
||||||||
|
As Restated
|
|||||||||||||||||||||||||||||
|
Balance at December 31, 2016
|
$
|
12
|
|
$
|
58,516
|
|
$
|
552
|
|
$
|
(1,629
|
)
|
$
|
(207
|
)
|
$
|
216
|
|
$
|
57,460
|
|
||||||||
|
Net income/(loss)
|
—
|
|
—
|
|
2,039
|
|
—
|
|
—
|
|
(1
|
)
|
2,038
|
|
|||||||||||||||
|
Other comprehensive income/(loss)
|
—
|
|
—
|
|
—
|
|
321
|
|
—
|
|
(2
|
)
|
319
|
|
|||||||||||||||
|
Dividends declared-common stock ($1.20 per share)
|
—
|
|
—
|
|
(1,463
|
)
|
—
|
|
—
|
|
—
|
|
(1,463
|
)
|
|||||||||||||||
|
Exercise of stock options, issuance of other stock awards, and other
|
—
|
|
81
|
|
1
|
|
—
|
|
(16
|
)
|
—
|
|
66
|
|
|||||||||||||||
|
Balance at July 1, 2017
|
$
|
12
|
|
$
|
58,597
|
|
$
|
1,129
|
|
$
|
(1,308
|
)
|
$
|
(223
|
)
|
$
|
213
|
|
$
|
58,420
|
|
||||||||
See descriptions of the net income and other comprehensive income impacts in the consolidated statement of income and consolidated statement of comprehensive income for the six months ended July 1, 2017 sections above.
See Note 2,
Restatement of Previously Issued Consolidated Financial Statements
, for a description of the misstatements in each category of restatements referenced by (a) through (g).
185
The Kraft Heinz Company
Condensed Consolidated Statement of Equity
For the Three Months Ended April 1, 2017
(in millions, except per share data)
|
Restatement Reference
|
Common Stock
|
Additional Paid-in Capital
|
Retained Earnings/(Deficit)
|
Accumulated Other Comprehensive Income/(Losses)
|
Treasury Stock, at Cost
|
Noncontrolling Interest
|
Total Equity
|
||||||||||||||||||||||
|
As Previously Reported
|
|||||||||||||||||||||||||||||
|
Balance at December 31, 2016
|
$
|
12
|
|
$
|
58,593
|
|
$
|
588
|
|
$
|
(1,628
|
)
|
$
|
(207
|
)
|
$
|
216
|
|
$
|
57,574
|
|
||||||||
|
Net income/(loss)
|
—
|
|
—
|
|
893
|
|
—
|
|
—
|
|
(2
|
)
|
891
|
|
|||||||||||||||
|
Other comprehensive income/(loss)
|
—
|
|
—
|
|
—
|
|
179
|
|
—
|
|
(2
|
)
|
177
|
|
|||||||||||||||
|
Dividends declared-common stock ($0.60 per share)
|
—
|
|
—
|
|
(731
|
)
|
—
|
|
—
|
|
—
|
|
(731
|
)
|
|||||||||||||||
|
Exercise of stock options, issuance of other stock awards, and other
|
—
|
|
49
|
|
—
|
|
—
|
|
(16
|
)
|
—
|
|
33
|
|
|||||||||||||||
|
Balance at April 1, 2017
|
$
|
12
|
|
$
|
58,642
|
|
$
|
750
|
|
$
|
(1,449
|
)
|
$
|
(223
|
)
|
$
|
212
|
|
$
|
57,944
|
|
||||||||
|
Restatement Impacts
|
|||||||||||||||||||||||||||||
|
Balance at December 31, 2016
|
$
|
—
|
|
$
|
(77
|
)
|
$
|
(36
|
)
|
$
|
(1
|
)
|
$
|
—
|
|
$
|
—
|
|
$
|
(114
|
)
|
||||||||
|
Net income/(loss)
|
(a)(e)(f)(g)
|
—
|
|
—
|
|
(10
|
)
|
—
|
|
—
|
|
—
|
|
(10
|
)
|
||||||||||||||
|
Other comprehensive income/(loss)
|
(e)
|
—
|
|
—
|
|
—
|
|
(3
|
)
|
—
|
|
—
|
|
(3
|
)
|
||||||||||||||
|
Dividends declared-common stock ($0.60 per share)
|
—
|
|
—
|
|
—
|
|
—
|
|
—
|
|
—
|
|
—
|
|
|||||||||||||||
|
Exercise of stock options, issuance of other stock awards, and other
|
(g)
|
—
|
|
—
|
|
1
|
|
—
|
|
—
|
|
—
|
|
1
|
|
||||||||||||||
|
Balance at April 1, 2017
|
$
|
—
|
|
$
|
(77
|
)
|
$
|
(45
|
)
|
$
|
(4
|
)
|
$
|
—
|
|
$
|
—
|
|
$
|
(126
|
)
|
||||||||
|
As Restated
|
|||||||||||||||||||||||||||||
|
Balance at December 31, 2016
|
$
|
12
|
|
$
|
58,516
|
|
$
|
552
|
|
$
|
(1,629
|
)
|
$
|
(207
|
)
|
$
|
216
|
|
$
|
57,460
|
|
||||||||
|
Net income/(loss)
|
—
|
|
—
|
|
883
|
|
—
|
|
—
|
|
(2
|
)
|
881
|
|
|||||||||||||||
|
Other comprehensive income/(loss)
|
—
|
|
—
|
|
—
|
|
176
|
|
—
|
|
(2
|
)
|
174
|
|
|||||||||||||||
|
Dividends declared-common stock ($0.60 per share)
|
—
|
|
—
|
|
(731
|
)
|
—
|
|
—
|
|
—
|
|
(731
|
)
|
|||||||||||||||
|
Exercise of stock options, issuance of other stock awards, and other
|
—
|
|
49
|
|
1
|
|
—
|
|
(16
|
)
|
—
|
|
34
|
|
|||||||||||||||
|
Balance at April 1, 2017
|
$
|
12
|
|
$
|
58,565
|
|
$
|
705
|
|
$
|
(1,453
|
)
|
$
|
(223
|
)
|
$
|
212
|
|
$
|
57,818
|
|
||||||||
See descriptions of the net income and other comprehensive income impacts in the consolidated statement of income and consolidated statement of comprehensive income for the three months ended April 1, 2017 sections above.
See Note 2,
Restatement of Previously Issued Consolidated Financial Statements
, for a description of the misstatements in each category of restatements referenced by (a) through (g).
186
The Kraft Heinz Company
Consolidated Statement of Cash Flows
(in millions)
|
For the Nine Months Ended September 29, 2018
|
|||||||||||||
|
As Previously Reported
|
Restatement Impacts
|
Restatement Reference
|
As Restated
|
||||||||||
|
CASH FLOWS FROM OPERATING ACTIVITIES:
|
|||||||||||||
|
Net income/(loss)
|
$
|
2,376
|
|
$
|
(2
|
)
|
(a)(b)(e)(f)(g)
|
$
|
2,374
|
|
|||
|
Adjustments to reconcile net income/(loss) to operating cash flows:
|
|
|
|
|
|||||||||
|
Depreciation and amortization
|
736
|
|
(24
|
)
|
(b)(g)
|
712
|
|
||||||
|
Amortization of postretirement benefit plans prior service costs/(credits)
|
(261
|
)
|
—
|
|
(261
|
)
|
|||||||
|
Equity award compensation expense
|
44
|
|
—
|
|
44
|
|
|||||||
|
Deferred income tax provision/(benefit)
|
96
|
|
8
|
|
(a)(e)(f)(g)
|
104
|
|
||||||
|
Postemployment benefit plan contributions
|
(64
|
)
|
—
|
|
(64
|
)
|
|||||||
|
Goodwill and intangible asset impairment losses
|
499
|
|
(48
|
)
|
(f)
|
451
|
|
||||||
|
Nonmonetary currency devaluation
|
131
|
|
—
|
|
131
|
|
|||||||
|
Other items, net
|
36
|
|
(1
|
)
|
(a)(g)
|
35
|
|
||||||
|
Changes in current assets and liabilities:
|
|||||||||||||
|
Trade receivables
|
(2,154
|
)
|
—
|
|
(2,154
|
)
|
|||||||
|
Inventories
|
(663
|
)
|
18
|
|
(d)(g)
|
(645
|
)
|
||||||
|
Accounts payable
|
145
|
|
(15
|
)
|
(g)
|
130
|
|
||||||
|
Other current assets
|
(105
|
)
|
2
|
|
(a)(d)
|
(103
|
)
|
||||||
|
Other current liabilities
|
83
|
|
41
|
|
(a)(b)(e)(g)
|
124
|
|
||||||
|
Net cash provided by/(used for) operating activities
|
899
|
|
(21
|
)
|
878
|
|
|||||||
|
CASH FLOWS FROM INVESTING ACTIVITIES:
|
|||||||||||||
|
Cash receipts on sold receivables
|
1,296
|
|
—
|
|
1,296
|
|
|||||||
|
Capital expenditures
|
(594
|
)
|
—
|
|
(594
|
)
|
|||||||
|
Payments to acquire business, net of cash acquired
|
(248
|
)
|
—
|
|
(248
|
)
|
|||||||
|
Other investing activities, net
|
31
|
|
—
|
|
31
|
|
|||||||
|
Net cash provided by/(used for) investing activities
|
485
|
|
—
|
|
485
|
|
|||||||
|
CASH FLOWS FROM FINANCING ACTIVITIES:
|
|||||||||||||
|
Repayments of long-term debt
|
(2,727
|
)
|
21
|
|
(b)(g)
|
(2,706
|
)
|
||||||
|
Proceeds from issuance of long-term debt
|
2,990
|
|
—
|
|
2,990
|
|
|||||||
|
Proceeds from issuance of commercial paper
|
2,485
|
|
—
|
|
2,485
|
|
|||||||
|
Repayments of commercial paper
|
(1,950
|
)
|
—
|
|
(1,950
|
)
|
|||||||
|
Dividends paid - Series A Preferred Stock
|
—
|
|
—
|
|
—
|
|
|||||||
|
Dividends paid - common stock
|
(2,421
|
)
|
—
|
|
(2,421
|
)
|
|||||||
|
Redemption of Series A Preferred Stock
|
—
|
|
—
|
|
—
|
|
|||||||
|
Other financing activities, net
|
(35
|
)
|
—
|
|
(35
|
)
|
|||||||
|
Net cash provided by/(used for) financing activities
|
(1,658
|
)
|
21
|
|
(1,637
|
)
|
|||||||
|
Effect of exchange rate changes on cash, cash equivalents, and restricted cash
|
(128
|
)
|
—
|
|
(128
|
)
|
|||||||
|
Cash, cash equivalents, and restricted cash
|
|||||||||||||
|
Net increase/(decrease)
|
(402
|
)
|
—
|
|
(402
|
)
|
|||||||
|
Balance at beginning of period
|
1,769
|
|
—
|
|
1,769
|
|
|||||||
|
Balance at end of period
|
$
|
1,367
|
|
$
|
—
|
|
$
|
1,367
|
|
||||
|
NON-CASH INVESTING ACTIVITIES:
|
|||||||||||||
|
Beneficial interest obtained in exchange for securitized trade receivables
|
$
|
938
|
|
$
|
—
|
|
$
|
938
|
|
||||
See descriptions of the net income impacts in the condensed consolidated statement of income for the nine months ended September 29, 2018 section above.
187
The misstatements in the capital leases misclassifications category resulted in a decrease to net cash flows provided by operating activities of
$21 million
and a decrease to net cash flows used for financing activities of
$21 million
for the nine months ended September 29, 2018.
The misstatements in the other misclassifications category resulted in a decrease to net cash flows provided by operating activities of less than
$1 million
and a decrease to net cash flows used for financing activities of less than
$1 million
for the nine months ended September 29, 2018.
No other misstatements impacted the classifications between net operating, net investing, or net financing cash flow activities for the nine months ended September 29, 2018.
See Note 2,
Restatement of Previously Issued Consolidated Financial Statements
, for a description of the misstatements in each category of restatements referenced by (a) through (g).
188
The Kraft Heinz Company
Consolidated Statement of Cash Flows
(in millions)
|
For the Six Months Ended June 30, 2018
|
|||||||||||||
|
As Previously Reported
|
Restatement Impacts
|
Restatement Reference
|
As Restated
|
||||||||||
|
CASH FLOWS FROM OPERATING ACTIVITIES:
|
|||||||||||||
|
Net income/(loss)
|
$
|
1,748
|
|
$
|
8
|
|
(a)(b)(e)(f)(g)
|
$
|
1,756
|
|
|||
|
Adjustments to reconcile net income/(loss) to operating cash flows:
|
|
|
|
|
|||||||||
|
Depreciation and amortization
|
476
|
|
(14
|
)
|
(b)(g)
|
462
|
|
||||||
|
Amortization of postretirement benefit plans prior service costs/(credits)
|
(183
|
)
|
—
|
|
(183
|
)
|
|||||||
|
Equity award compensation expense
|
27
|
|
—
|
|
27
|
|
|||||||
|
Deferred income tax provision/(benefit)
|
58
|
|
21
|
|
(a)(e)(f)(g)
|
79
|
|
||||||
|
Postemployment benefit plan contributions
|
(60
|
)
|
—
|
|
(60
|
)
|
|||||||
|
Goodwill and intangible asset impairment losses
|
265
|
|
(31
|
)
|
(f)
|
234
|
|
||||||
|
Nonmonetary currency devaluation
|
67
|
|
—
|
|
67
|
|
|||||||
|
Other items, net
|
59
|
|
(32
|
)
|
(a)(g)
|
27
|
|
||||||
|
Changes in current assets and liabilities:
|
|||||||||||||
|
Trade receivables
|
(2,001
|
)
|
—
|
|
(2,001
|
)
|
|||||||
|
Inventories
|
(440
|
)
|
12
|
|
(d)(g)
|
(428
|
)
|
||||||
|
Accounts payable
|
143
|
|
(16
|
)
|
(g)
|
127
|
|
||||||
|
Other current assets
|
(66
|
)
|
22
|
|
(a)(d)(g)
|
(44
|
)
|
||||||
|
Other current liabilities
|
136
|
|
17
|
|
(a)(b)(e)(g)
|
153
|
|
||||||
|
Net cash provided by/(used for) operating activities
|
229
|
|
(13
|
)
|
216
|
|
|||||||
|
CASH FLOWS FROM INVESTING ACTIVITIES:
|
|||||||||||||
|
Cash receipts on sold receivables
|
1,221
|
|
—
|
|
1,221
|
|
|||||||
|
Capital expenditures
|
(438
|
)
|
—
|
|
(438
|
)
|
|||||||
|
Payments to acquire business, net of cash acquired
|
(215
|
)
|
—
|
|
(215
|
)
|
|||||||
|
Other investing activities, net
|
11
|
|
—
|
|
11
|
|
|||||||
|
Net cash provided by/(used for) investing activities
|
579
|
|
—
|
|
579
|
|
|||||||
|
CASH FLOWS FROM FINANCING ACTIVITIES:
|
|||||||||||||
|
Repayments of long-term debt
|
(25
|
)
|
13
|
|
(b)(g)
|
(12
|
)
|
||||||
|
Proceeds from issuance of long-term debt
|
2,990
|
|
—
|
|
2,990
|
|
|||||||
|
Proceeds from issuance of commercial paper
|
1,525
|
|
—
|
|
1,525
|
|
|||||||
|
Repayments of commercial paper
|
(1,950
|
)
|
—
|
|
(1,950
|
)
|
|||||||
|
Dividends paid - Series A Preferred Stock
|
—
|
|
—
|
|
—
|
|
|||||||
|
Dividends paid - common stock
|
(1,659
|
)
|
—
|
|
(1,659
|
)
|
|||||||
|
Redemption of Series A Preferred Stock
|
—
|
|
—
|
|
—
|
|
|||||||
|
Other financing activities, net
|
(3
|
)
|
—
|
|
(3
|
)
|
|||||||
|
Net cash provided by/(used for) financing activities
|
878
|
|
13
|
|
891
|
|
|||||||
|
Effect of exchange rate changes on cash, cash equivalents, and restricted cash
|
(80
|
)
|
—
|
|
(80
|
)
|
|||||||
|
Cash, cash equivalents, and restricted cash
|
|||||||||||||
|
Net increase/(decrease)
|
1,606
|
|
—
|
|
1,606
|
|
|||||||
|
Balance at beginning of period
|
1,769
|
|
—
|
|
1,769
|
|
|||||||
|
Balance at end of period
|
$
|
3,375
|
|
$
|
—
|
|
$
|
3,375
|
|
||||
|
NON-CASH INVESTING ACTIVITIES:
|
|||||||||||||
|
Beneficial interest obtained in exchange for securitized trade receivables
|
$
|
899
|
|
$
|
—
|
|
$
|
899
|
|
||||
See descriptions of the net income impacts in the condensed consolidated statement of income for the six months ended June 30, 2018 section above.
189
The misstatements in the capital leases misclassifications category resulted in a decrease to net cash flows provided by operating activities of
$13 million
and an increase to net cash flows provided by financing activities of
$13 million
for the six months ended June 30, 2018.
The misstatements in the other misclassifications category resulted in a decrease to net cash flows provided by operating activities of less than
$1 million
and an increase to net cash flows provided by financing activities of less than
$1 million
for the six months ended June 30, 2018.
No other misstatements impacted the classifications between net operating, net investing, or net financing cash flow activities for the six months ended June 30, 2018.
See Note 2,
Restatement of Previously Issued Consolidated Financial Statements
, for a description of the misstatements in each category of restatements referenced by (a) through (g).
190
The Kraft Heinz Company
Consolidated Statement of Cash Flows
(in millions)
|
For the Three Months Ended March 31, 2018
|
|||||||||||||
|
As Previously Reported
|
Restatement Impacts
|
Restatement Reference
|
As Restated
|
||||||||||
|
CASH FLOWS FROM OPERATING ACTIVITIES:
|
|||||||||||||
|
Net income/(loss)
|
$
|
993
|
|
$
|
10
|
|
(a)(b)(e)(f)(g)
|
$
|
1,003
|
|
|||
|
Adjustments to reconcile net income/(loss) to operating cash flows:
|
|
|
|
|
|||||||||
|
Depreciation and amortization
|
234
|
|
(7
|
)
|
(b)(g)
|
227
|
|
||||||
|
Amortization of postretirement benefit plans prior service costs/(credits)
|
(106
|
)
|
—
|
|
(106
|
)
|
|||||||
|
Equity award compensation expense
|
7
|
|
—
|
|
7
|
|
|||||||
|
Deferred income tax provision/(benefit)
|
(47
|
)
|
1
|
|
(a)(e)(f)
|
(46
|
)
|
||||||
|
Postemployment benefit plan contributions
|
(22
|
)
|
—
|
|
(22
|
)
|
|||||||
|
Goodwill and intangible asset impairment losses
|
—
|
|
—
|
|
(f)
|
—
|
|
||||||
|
Nonmonetary currency devaluation
|
47
|
|
—
|
|
47
|
|
|||||||
|
Other items, net
|
5
|
|
(27
|
)
|
(a)(g)
|
(22
|
)
|
||||||
|
Changes in current assets and liabilities:
|
|||||||||||||
|
Trade receivables
|
(712
|
)
|
—
|
|
(712
|
)
|
|||||||
|
Inventories
|
(312
|
)
|
—
|
|
(d)(g)
|
(312
|
)
|
||||||
|
Accounts payable
|
(69
|
)
|
(16
|
)
|
(g)
|
(85
|
)
|
||||||
|
Other current assets
|
9
|
|
17
|
|
(a)(d)(g)
|
26
|
|
||||||
|
Other current liabilities
|
386
|
|
17
|
|
(a)(b)(e)(g)
|
403
|
|
||||||
|
Net cash provided by/(used for) operating activities
|
413
|
|
(5
|
)
|
408
|
|
|||||||
|
CASH FLOWS FROM INVESTING ACTIVITIES:
|
|||||||||||||
|
Cash receipts on sold receivables
|
436
|
|
—
|
|
436
|
|
|||||||
|
Capital expenditures
|
(223
|
)
|
—
|
|
(223
|
)
|
|||||||
|
Payments to acquire business, net of cash acquired
|
(215
|
)
|
—
|
|
(215
|
)
|
|||||||
|
Other investing activities, net
|
6
|
|
—
|
|
6
|
|
|||||||
|
Net cash provided by/(used for) investing activities
|
4
|
|
—
|
|
4
|
|
|||||||
|
CASH FLOWS FROM FINANCING ACTIVITIES:
|
|||||||||||||
|
Repayments of long-term debt
|
(11
|
)
|
5
|
|
(b)(g)
|
(6
|
)
|
||||||
|
Proceeds from issuance of long-term debt
|
—
|
|
—
|
|
—
|
|
|||||||
|
Proceeds from issuance of commercial paper
|
1,524
|
|
—
|
|
1,524
|
|
|||||||
|
Repayments of commercial paper
|
(1,006
|
)
|
—
|
|
(1,006
|
)
|
|||||||
|
Dividends paid - Series A Preferred Stock
|
—
|
|
—
|
|
—
|
|
|||||||
|
Dividends paid - common stock
|
(897
|
)
|
—
|
|
(897
|
)
|
|||||||
|
Redemption of Series A Preferred Stock
|
—
|
|
—
|
|
—
|
|
|||||||
|
Other financing activities, net
|
14
|
|
—
|
|
14
|
|
|||||||
|
Net cash provided by/(used for) financing activities
|
(376
|
)
|
5
|
|
(371
|
)
|
|||||||
|
Effect of exchange rate changes on cash, cash equivalents, and restricted cash
|
(10
|
)
|
—
|
|
(10
|
)
|
|||||||
|
Cash, cash equivalents, and restricted cash
|
|||||||||||||
|
Net increase/(decrease)
|
31
|
|
—
|
|
31
|
|
|||||||
|
Balance at beginning of period
|
1,769
|
|
—
|
|
1,769
|
|
|||||||
|
Balance at end of period
|
$
|
1,800
|
|
$
|
—
|
|
$
|
1,800
|
|
||||
|
NON-CASH INVESTING ACTIVITIES:
|
|||||||||||||
|
Beneficial interest obtained in exchange for securitized trade receivables
|
$
|
613
|
|
$
|
—
|
|
$
|
613
|
|
||||
See descriptions of the net income impacts in the condensed consolidated statement of income for the three months ended March 31, 2018 section above.
191
The misstatements in the capital leases misclassifications category resulted in a decrease to net cash flows provided by operating activities of
$5 million
and a decrease to net cash flows used for financing activities of
$5 million
for the three months ended March 31, 2018.
The misstatements in the other misclassifications category resulted in a decrease to net cash flows provided by operating activities of less than
$1 million
and a decrease to net cash flows used for financing activities of less than
$1 million
for the three months ended March 31, 2018.
No other misstatements impacted the classifications between net operating, net investing, or net financing cash flow activities for the three months ended March 31, 2018.
See Note 2,
Restatement of Previously Issued Consolidated Financial Statements
, for a description of the misstatements in each category of restatements referenced by (a) through (g).
192
The Kraft Heinz Company
Consolidated Statement of Cash Flows
(in millions)
|
For the Nine Months Ended September 30, 2017
|
|||||||||||||
|
As Previously Reported
|
Restatement Impacts
|
Restatement Reference
|
As Restated
|
||||||||||
|
CASH FLOWS FROM OPERATING ACTIVITIES:
|
|||||||||||||
|
Net income/(loss)
|
$
|
2,994
|
|
$
|
(44
|
)
|
(a)(e)(f)(g)
|
$
|
2,950
|
|
|||
|
Adjustments to reconcile net income/(loss) to operating cash flows:
|
|
|
|
|
|||||||||
|
Depreciation and amortization
|
790
|
|
(1
|
)
|
(g)
|
789
|
|
||||||
|
Amortization of postretirement benefit plans prior service costs/(credits)
|
(247
|
)
|
—
|
|
(247
|
)
|
|||||||
|
Equity award compensation expense
|
36
|
|
—
|
|
36
|
|
|||||||
|
Deferred income tax provision/(benefit)
|
492
|
|
(60
|
)
|
(a)(e)(f)
|
432
|
|
||||||
|
Postemployment benefit plan contributions
|
(283
|
)
|
—
|
|
(283
|
)
|
|||||||
|
Goodwill and intangible asset impairment losses
|
49
|
|
—
|
|
(f)
|
49
|
|
||||||
|
Nonmonetary currency devaluation
|
36
|
|
—
|
|
36
|
|
|||||||
|
Other items, net
|
(52
|
)
|
(10
|
)
|
(a)(g)
|
(62
|
)
|
||||||
|
Changes in current assets and liabilities:
|
|||||||||||||
|
Trade receivables
|
(2,061
|
)
|
—
|
|
(2,061
|
)
|
|||||||
|
Inventories
|
(580
|
)
|
13
|
|
(d)
|
(567
|
)
|
||||||
|
Accounts payable
|
123
|
|
—
|
|
123
|
|
|||||||
|
Other current assets
|
(137
|
)
|
47
|
|
(a)(d)
|
(90
|
)
|
||||||
|
Other current liabilities
|
(1,144
|
)
|
54
|
|
(a)(g)(e)
|
(1,090
|
)
|
||||||
|
Net cash provided by/(used for) operating activities
|
16
|
|
(1
|
)
|
15
|
|
|||||||
|
CASH FLOWS FROM INVESTING ACTIVITIES:
|
|||||||||||||
|
Cash receipts on sold receivables
|
1,633
|
|
—
|
|
1,633
|
|
|||||||
|
Capital expenditures
|
(956
|
)
|
—
|
|
(956
|
)
|
|||||||
|
Payments to acquire business, net of cash acquired
|
—
|
|
—
|
|
—
|
|
|||||||
|
Other investing activities, net
|
47
|
|
(2
|
)
|
(g)
|
45
|
|
||||||
|
Net cash provided by/(used for) investing activities
|
724
|
|
(2
|
)
|
722
|
|
|||||||
|
CASH FLOWS FROM FINANCING ACTIVITIES:
|
|||||||||||||
|
Repayments of long-term debt
|
(2,636
|
)
|
1
|
|
(g)
|
(2,635
|
)
|
||||||
|
Proceeds from issuance of long-term debt
|
1,496
|
|
—
|
|
1,496
|
|
|||||||
|
Proceeds from issuance of commercial paper
|
5,495
|
|
—
|
|
5,495
|
|
|||||||
|
Repayments of commercial paper
|
(5,709
|
)
|
—
|
|
(5,709
|
)
|
|||||||
|
Dividends paid - Series A Preferred Stock
|
—
|
|
—
|
|
—
|
|
|||||||
|
Dividends paid - common stock
|
(2,161
|
)
|
—
|
|
(2,161
|
)
|
|||||||
|
Redemption of Series A Preferred Stock
|
—
|
|
—
|
|
—
|
|
|||||||
|
Other financing activities, net
|
26
|
|
2
|
|
(g)
|
28
|
|
||||||
|
Net cash provided by/(used for) financing activities
|
(3,489
|
)
|
3
|
|
(3,486
|
)
|
|||||||
|
Effect of exchange rate changes on cash, cash equivalents, and restricted cash
|
43
|
|
—
|
|
43
|
|
|||||||
|
Cash, cash equivalents, and restricted cash
|
|||||||||||||
|
Net increase/(decrease)
|
(2,706
|
)
|
—
|
|
(2,706
|
)
|
|||||||
|
Balance at beginning of period
|
4,255
|
|
—
|
|
4,255
|
|
|||||||
|
Balance at end of period
|
$
|
1,549
|
|
$
|
—
|
|
$
|
1,549
|
|
||||
|
NON-CASH INVESTING ACTIVITIES:
|
|||||||||||||
|
Beneficial interest obtained in exchange for securitized trade receivables
|
$
|
1,936
|
|
$
|
—
|
|
$
|
1,936
|
|
||||
See descriptions of the net income impacts in the condensed consolidated statement of income for the nine months ended September 30, 2017 section above.
193
The misstatements in the other misclassification category resulted in a decrease to net cash flows provided by operating activities of
$1 million
, a decrease to net cash flows provided by investing activities of
$2 million
, and a decrease to net cash flows used for financing activities of
$3 million
for the nine months ended September 30, 2017.
See Note 2,
Restatement of Previously Issued Consolidated Financial Statements
, for a description of the misstatements in each category of restatements referenced by (a) through (g).
194
The Kraft Heinz Company
Consolidated Statement of Cash Flows
(in millions)
|
For the Six Months Ended July 1, 2017
|
|||||||||||||
|
As Previously Reported
|
Restatement Impacts
|
Restatement Reference
|
As Restated
|
||||||||||
|
CASH FLOWS FROM OPERATING ACTIVITIES:
|
|||||||||||||
|
Net income/(loss)
|
$
|
2,051
|
|
$
|
(13
|
)
|
(a)(e)(f)(g)
|
$
|
2,038
|
|
|||
|
Adjustments to reconcile net income/(loss) to operating cash flows:
|
|
|
|
|
|||||||||
|
Depreciation and amortization
|
517
|
|
—
|
|
(g)
|
517
|
|
||||||
|
Amortization of postretirement benefit plans prior service costs/(credits)
|
(171
|
)
|
—
|
|
(171
|
)
|
|||||||
|
Equity award compensation expense
|
24
|
|
—
|
|
24
|
|
|||||||
|
Deferred income tax provision/(benefit)
|
269
|
|
(46
|
)
|
(a)(e)(f)
|
223
|
|
||||||
|
Postemployment benefit plan contributions
|
(90
|
)
|
—
|
|
(90
|
)
|
|||||||
|
Goodwill and intangible asset impairment losses
|
48
|
|
—
|
|
(f)
|
48
|
|
||||||
|
Nonmonetary currency devaluation
|
33
|
|
—
|
|
33
|
|
|||||||
|
Other items, net
|
(31
|
)
|
(17
|
)
|
(a)(g)
|
(48
|
)
|
||||||
|
Changes in current assets and liabilities:
|
|||||||||||||
|
Trade receivables
|
(1,598
|
)
|
—
|
|
(1,598
|
)
|
|||||||
|
Inventories
|
(431
|
)
|
13
|
|
(d)
|
(418
|
)
|
||||||
|
Accounts payable
|
84
|
|
—
|
|
84
|
|
|||||||
|
Other current assets
|
(121
|
)
|
18
|
|
(a)(d)
|
(103
|
)
|
||||||
|
Other current liabilities
|
(762
|
)
|
45
|
|
(a)(g)(e)
|
(717
|
)
|
||||||
|
Net cash provided by/(used for) operating activities
|
(178
|
)
|
—
|
|
(178
|
)
|
|||||||
|
CASH FLOWS FROM INVESTING ACTIVITIES:
|
|||||||||||||
|
Cash receipts on sold receivables
|
1,069
|
|
—
|
|
1,069
|
|
|||||||
|
Capital expenditures
|
(690
|
)
|
—
|
|
(690
|
)
|
|||||||
|
Payments to acquire business, net of cash acquired
|
—
|
|
—
|
|
—
|
|
|||||||
|
Other investing activities, net
|
44
|
|
—
|
|
44
|
|
|||||||
|
Net cash provided by/(used for) investing activities
|
423
|
|
—
|
|
423
|
|
|||||||
|
CASH FLOWS FROM FINANCING ACTIVITIES:
|
|||||||||||||
|
Repayments of long-term debt
|
(2,032
|
)
|
—
|
|
(g)
|
(2,032
|
)
|
||||||
|
Proceeds from issuance of long-term debt
|
4
|
|
—
|
|
4
|
|
|||||||
|
Proceeds from issuance of commercial paper
|
4,213
|
|
—
|
|
4,213
|
|
|||||||
|
Repayments of commercial paper
|
(3,777
|
)
|
—
|
|
(3,777
|
)
|
|||||||
|
Dividends paid - Series A Preferred Stock
|
—
|
|
—
|
|
—
|
|
|||||||
|
Dividends paid - common stock
|
(1,434
|
)
|
—
|
|
(1,434
|
)
|
|||||||
|
Redemption of Series A Preferred Stock
|
—
|
|
—
|
|
—
|
|
|||||||
|
Other financing activities, net
|
15
|
|
—
|
|
15
|
|
|||||||
|
Net cash provided by/(used for) financing activities
|
(3,011
|
)
|
—
|
|
(3,011
|
)
|
|||||||
|
Effect of exchange rate changes on cash, cash equivalents, and restricted cash
|
29
|
|
—
|
|
29
|
|
|||||||
|
Cash, cash equivalents, and restricted cash
|
|||||||||||||
|
Net increase/(decrease)
|
(2,737
|
)
|
—
|
|
(2,737
|
)
|
|||||||
|
Balance at beginning of period
|
4,255
|
|
—
|
|
4,255
|
|
|||||||
|
Balance at end of period
|
$
|
1,518
|
|
$
|
—
|
|
$
|
1,518
|
|
||||
|
NON-CASH INVESTING ACTIVITIES:
|
|||||||||||||
|
Beneficial interest obtained in exchange for securitized trade receivables
|
$
|
1,407
|
|
$
|
—
|
|
$
|
1,407
|
|
||||
See descriptions of the net income impacts in the condensed consolidated statement of income for the six months ended July 1, 2017 section above.
195
No misstatements impacted the classifications between net operating, net investing, or net financing cash flow activities for the six months ended July 1, 2017.
See Note 2,
Restatement of Previously Issued Consolidated Financial Statements
, for a description of the misstatements in each category of restatements referenced by (a) through (g).
196
The Kraft Heinz Company
Consolidated Statement of Cash Flows
(in millions)
|
For the Three Months Ended April 1, 2017
|
|||||||||||||
|
As Previously Reported
|
Restatement Impacts
|
Restatement Reference
|
As Restated
|
||||||||||
|
CASH FLOWS FROM OPERATING ACTIVITIES:
|
|||||||||||||
|
Net income/(loss)
|
$
|
891
|
|
$
|
(10
|
)
|
(a)(e)(f)(g)
|
$
|
881
|
|
|||
|
Adjustments to reconcile net income/(loss) to operating cash flows:
|
|
|
|
|
|||||||||
|
Depreciation and amortization
|
262
|
|
—
|
|
(g)
|
262
|
|
||||||
|
Amortization of postretirement benefit plans prior service costs/(credits)
|
(82
|
)
|
—
|
|
(82
|
)
|
|||||||
|
Equity award compensation expense
|
11
|
|
—
|
|
11
|
|
|||||||
|
Deferred income tax provision/(benefit)
|
105
|
|
(37
|
)
|
(a)(e)(f)
|
68
|
|
||||||
|
Postemployment benefit plan contributions
|
(38
|
)
|
—
|
|
(38
|
)
|
|||||||
|
Goodwill and intangible asset impairment losses
|
—
|
|
—
|
|
(f)
|
—
|
|
||||||
|
Nonmonetary currency devaluation
|
8
|
|
—
|
|
8
|
|
|||||||
|
Other items, net
|
35
|
|
5
|
|
(a)
|
40
|
|
||||||
|
Changes in current assets and liabilities:
|
|||||||||||||
|
Trade receivables
|
(1,040
|
)
|
—
|
|
(1,040
|
)
|
|||||||
|
Inventories
|
(492
|
)
|
17
|
|
(d)
|
(475
|
)
|
||||||
|
Accounts payable
|
62
|
|
—
|
|
62
|
|
|||||||
|
Other current assets
|
(67
|
)
|
(5
|
)
|
(a)(d)
|
(72
|
)
|
||||||
|
Other current liabilities
|
(270
|
)
|
30
|
|
(a)(g)(e)
|
(240
|
)
|
||||||
|
Net cash provided by/(used for) operating activities
|
(615
|
)
|
—
|
|
(615
|
)
|
|||||||
|
CASH FLOWS FROM INVESTING ACTIVITIES:
|
|||||||||||||
|
Cash receipts on sold receivables
|
464
|
|
—
|
|
464
|
|
|||||||
|
Capital expenditures
|
(368
|
)
|
—
|
|
(368
|
)
|
|||||||
|
Payments to acquire business, net of cash acquired
|
—
|
|
—
|
|
—
|
|
|||||||
|
Other investing activities, net
|
38
|
|
—
|
|
38
|
|
|||||||
|
Net cash provided by/(used for) investing activities
|
134
|
|
—
|
|
134
|
|
|||||||
|
CASH FLOWS FROM FINANCING ACTIVITIES:
|
|||||||||||||
|
Repayments of long-term debt
|
(27
|
)
|
—
|
|
(g)
|
(27
|
)
|
||||||
|
Proceeds from issuance of long-term debt
|
2
|
|
—
|
|
2
|
|
|||||||
|
Proceeds from issuance of commercial paper
|
2,324
|
|
—
|
|
2,324
|
|
|||||||
|
Repayments of commercial paper
|
(2,068
|
)
|
—
|
|
(2,068
|
)
|
|||||||
|
Dividends paid - Series A Preferred Stock
|
—
|
|
—
|
|
—
|
|
|||||||
|
Dividends paid - common stock
|
(736
|
)
|
—
|
|
(736
|
)
|
|||||||
|
Redemption of Series A Preferred Stock
|
—
|
|
—
|
|
—
|
|
|||||||
|
Other financing activities, net
|
—
|
|
—
|
|
—
|
|
|||||||
|
Net cash provided by/(used for) financing activities
|
(505
|
)
|
—
|
|
(505
|
)
|
|||||||
|
Effect of exchange rate changes on cash, cash equivalents, and restricted cash
|
13
|
|
—
|
|
13
|
|
|||||||
|
Cash, cash equivalents, and restricted cash
|
|||||||||||||
|
Net increase/(decrease)
|
(973
|
)
|
—
|
|
(973
|
)
|
|||||||
|
Balance at beginning of period
|
4,255
|
|
—
|
|
4,255
|
|
|||||||
|
Balance at end of period
|
$
|
3,282
|
|
$
|
—
|
|
$
|
3,282
|
|
||||
|
NON-CASH INVESTING ACTIVITIES:
|
|||||||||||||
|
Beneficial interest obtained in exchange for securitized trade receivables
|
$
|
880
|
|
$
|
—
|
|
$
|
880
|
|
||||
See descriptions of the net income impacts in the condensed consolidated statement of income for the three months ended April 1, 2017 section above.
197
No misstatements impacted the classifications between net operating, net investing, or net financing cash flow activities for the three months ended April 1, 2017.
See Note 2,
Restatement of Previously Issued Consolidated Financial Statements
, for a description of the misstatements in each category of restatements referenced by (a) through (g).
198
The following tables represent restated Segment Adjusted EBITDA for the interim periods within fiscal years 2018 and 2017. Management uses Segment Adjusted EBITDA to evaluate segment performance and allocate resources. See Note 22,
Segment Reporting
, for the definition of Segment Adjusted EBITDA.
|
As Restated
|
|||||||||||||||||||||||
|
December 29, 2018
|
September 29,
2018 |
June 30,
2018 |
March 31,
2018 |
||||||||||||||||||||
|
Three Months Ended
|
Three Months Ended
|
Nine Months Ended
|
Three Months Ended
|
Six Months Ended
|
Three Months Ended
|
||||||||||||||||||
|
(in millions)
|
|||||||||||||||||||||||
|
Segment Adjusted EBITDA:
|
|||||||||||||||||||||||
|
United States
|
$
|
1,249
|
|
$
|
1,176
|
|
$
|
3,969
|
|
$
|
1,401
|
|
$
|
2,793
|
|
$
|
1,392
|
|
|||||
|
Canada
|
157
|
|
144
|
|
451
|
|
173
|
|
307
|
|
134
|
|
|||||||||||
|
EMEA
|
171
|
|
165
|
|
553
|
|
206
|
|
388
|
|
182
|
|
|||||||||||
|
Rest of World
|
130
|
|
148
|
|
505
|
|
213
|
|
357
|
|
144
|
|
|||||||||||
|
General corporate expenses
|
(33
|
)
|
(39
|
)
|
(128
|
)
|
(44
|
)
|
(89
|
)
|
(45
|
)
|
|||||||||||
|
Depreciation and amortization (excluding integration and restructuring expenses)
|
(240
|
)
|
(245
|
)
|
(679
|
)
|
(235
|
)
|
(434
|
)
|
(199
|
)
|
|||||||||||
|
Integration and restructuring expenses
|
(82
|
)
|
(32
|
)
|
(215
|
)
|
(93
|
)
|
(183
|
)
|
(90
|
)
|
|||||||||||
|
Deal costs
|
(4
|
)
|
(3
|
)
|
(19
|
)
|
(7
|
)
|
(16
|
)
|
(9
|
)
|
|||||||||||
|
Unrealized gains/(losses) on commodity hedges
|
(10
|
)
|
(6
|
)
|
(11
|
)
|
(3
|
)
|
(5
|
)
|
(2
|
)
|
|||||||||||
|
Impairment losses
|
(15,485
|
)
|
(217
|
)
|
(451
|
)
|
(234
|
)
|
(234
|
)
|
—
|
|
|||||||||||
|
Gains/(losses) on sale of business
|
—
|
|
—
|
|
(15
|
)
|
(15
|
)
|
(15
|
)
|
—
|
|
|||||||||||
|
Equity award compensation expense (excluding integration and restructuring expenses)
|
11
|
|
(17
|
)
|
(44
|
)
|
(20
|
)
|
(27
|
)
|
(7
|
)
|
|||||||||||
|
Operating income/(loss)
|
(14,136
|
)
|
1,074
|
|
3,916
|
|
1,342
|
|
2,842
|
|
1,500
|
|
|||||||||||
|
Interest expense
|
325
|
|
326
|
|
959
|
|
316
|
|
633
|
|
317
|
|
|||||||||||
|
Other expense/(income), net
|
13
|
|
(71
|
)
|
(196
|
)
|
(35
|
)
|
(125
|
)
|
(90
|
)
|
|||||||||||
|
Income/(loss) before income taxes
|
$
|
(14,474
|
)
|
$
|
819
|
|
$
|
3,153
|
|
$
|
1,061
|
|
$
|
2,334
|
|
$
|
1,273
|
|
|||||
199
|
As Restated & Recast
|
|||||||||||||||||||||||
|
December 30, 2017
|
September 30,
2017 |
July 1,
2017 |
April 1,
2017 |
||||||||||||||||||||
|
Three Months Ended
|
Three Months Ended
|
Nine Months Ended
|
Three Months Ended
|
Six Months Ended
|
Three Months Ended
|
||||||||||||||||||
|
(in millions)
|
|||||||||||||||||||||||
|
Segment Adjusted EBITDA:
|
|||||||||||||||||||||||
|
United States
|
$
|
1,486
|
|
$
|
1,407
|
|
$
|
4,387
|
|
$
|
1,534
|
|
$
|
2,980
|
|
$
|
1,446
|
|
|||||
|
Canada
|
159
|
|
159
|
|
477
|
|
189
|
|
318
|
|
129
|
|
|||||||||||
|
EMEA
|
174
|
|
179
|
|
499
|
|
182
|
|
320
|
|
138
|
|
|||||||||||
|
Rest of World
|
142
|
|
134
|
|
448
|
|
170
|
|
314
|
|
144
|
|
|||||||||||
|
General corporate expenses
|
(14
|
)
|
(29
|
)
|
(94
|
)
|
(36
|
)
|
(65
|
)
|
(29
|
)
|
|||||||||||
|
Depreciation and amortization (excluding integration and restructuring expenses)
|
(224
|
)
|
(243
|
)
|
(683
|
)
|
(219
|
)
|
(440
|
)
|
(221
|
)
|
|||||||||||
|
Integration and restructuring expenses
|
(208
|
)
|
(108
|
)
|
(375
|
)
|
(132
|
)
|
(267
|
)
|
(135
|
)
|
|||||||||||
|
Unrealized gains/(losses) on commodity hedges
|
5
|
|
5
|
|
(24
|
)
|
13
|
|
(29
|
)
|
(42
|
)
|
|||||||||||
|
Impairment losses
|
—
|
|
(1
|
)
|
(49
|
)
|
(48
|
)
|
(48
|
)
|
—
|
|
|||||||||||
|
Equity award compensation expense (excluding integration and restructuring expenses)
|
(11
|
)
|
(12
|
)
|
(38
|
)
|
(14
|
)
|
(26
|
)
|
(12
|
)
|
|||||||||||
|
Operating income/(loss)
|
1,509
|
|
1,491
|
|
4,548
|
|
1,639
|
|
3,057
|
|
1,418
|
|
|||||||||||
|
Interest expense
|
308
|
|
306
|
|
926
|
|
307
|
|
620
|
|
313
|
|
|||||||||||
|
Other expense/(income), net
|
(116
|
)
|
(127
|
)
|
(511
|
)
|
(254
|
)
|
(384
|
)
|
(130
|
)
|
|||||||||||
|
Income/(loss) before income taxes
|
$
|
1,317
|
|
$
|
1,312
|
|
$
|
4,133
|
|
$
|
1,586
|
|
$
|
2,821
|
|
$
|
1,235
|
|
|||||
Note 24. Supplemental Guarantor Information
Restatement of Previously Issued Condensed Consolidating Financial Statements
We have restated herein our previously issued condensed consolidating financial statements for fiscal years 2017 and 2016. Following the restated condensed consolidating financial statement tables, we have presented our condensed consolidating financial statements as previously reported for fiscal years 2017 and 2016, which were derived from our Annual Report on Form 10-K for the fiscal year ended December 30, 2017 filed on February 16, 2018. See Note 2,
Restatement of Previously Issued Consolidated Financial Statements
, for additional information, including a description of the misstatements.
In addition, the statements of income for fiscal years 2017 and 2016, as previously reported, did not originally reflect the adoption of ASU 2017-07 related to the presentation of net periodic benefit cost (pension and postretirement cost). This ASU was adopted in the first quarter of 2018 and was applied retrospectively for statement of income presentation of service cost components and other net periodic benefit cost components. The condensed consolidating statements of income for fiscal years 2017 and 2016 have been recast accordingly. See Note 4,
New Accounting Standards
, for additional information related to our adoption of ASU 2017-07.
Supplemental Guarantor Information
Kraft Heinz fully and unconditionally guarantees the notes issued by our 100% owned operating subsidiary, KHFC, including the New Notes. See Note 19,
Debt
, for additional descriptions of these guarantees. None of our other subsidiaries guarantee these notes.
Set forth below are the condensed consolidating financial statements presenting the results of operations, financial position, and cash flows of Kraft Heinz (as parent guarantor), KHFC (as subsidiary issuer of the notes), and the non-guarantor subsidiaries on a combined basis and eliminations necessary to arrive at the total reported information on a consolidated basis. This condensed consolidating financial information has been prepared and presented pursuant to the Securities and Exchange Commission Regulation S-X Rule 3-10, “Financial Statements of Guarantors and Issuers of Guaranteed Securities Registered or being Registered.” This information is not intended to present the financial position, results of operations, and cash flows of the individual companies or groups of companies in accordance with U.S. GAAP. Eliminations represent adjustments to eliminate investments in subsidiaries and intercompany balances and transactions between or among the parent guarantor, subsidiary issuer, and the non-guarantor subsidiaries.
200
The Kraft Heinz Company
Condensed Consolidating Statements of Income
For the
Year
Ended
December 29, 2018
(in millions)
|
Parent Guarantor
|
Subsidiary Issuer
|
Non-Guarantor Subsidiaries
|
Eliminations
|
Consolidated
|
|||||||||||||||
|
Net sales
|
$
|
—
|
|
$
|
17,317
|
|
$
|
9,481
|
|
$
|
(530
|
)
|
$
|
26,268
|
|
||||
|
Cost of products sold
|
—
|
|
11,290
|
|
6,587
|
|
(530
|
)
|
17,347
|
|
|||||||||
|
Gross profit
|
—
|
|
6,027
|
|
2,894
|
|
—
|
|
8,921
|
|
|||||||||
|
Selling, general and administrative expenses, excluding impairment losses
|
—
|
|
803
|
|
2,402
|
|
—
|
|
3,205
|
|
|||||||||
|
Goodwill impairment losses
|
—
|
|
—
|
|
7,008
|
|
—
|
|
7,008
|
|
|||||||||
|
Intangible asset impairment losses
|
—
|
|
—
|
|
8,928
|
|
—
|
|
8,928
|
|
|||||||||
|
Selling, general and administrative expenses
|
—
|
|
803
|
|
18,338
|
|
—
|
|
19,141
|
|
|||||||||
|
Intercompany service fees and other recharges
|
—
|
|
3,865
|
|
(3,865
|
)
|
—
|
|
—
|
|
|||||||||
|
Operating income/(loss)
|
—
|
|
1,359
|
|
(11,579
|
)
|
—
|
|
(10,220
|
)
|
|||||||||
|
Interest expense
|
—
|
|
1,212
|
|
72
|
|
—
|
|
1,284
|
|
|||||||||
|
Other expense/(income), net
|
—
|
|
(359
|
)
|
176
|
|
—
|
|
(183
|
)
|
|||||||||
|
Income/(loss) before income taxes
|
—
|
|
506
|
|
(11,827
|
)
|
—
|
|
(11,321
|
)
|
|||||||||
|
Provision for/(benefit from) income taxes
|
—
|
|
112
|
|
(1,179
|
)
|
—
|
|
(1,067
|
)
|
|||||||||
|
Equity in earnings/(losses) of subsidiaries
|
(10,192
|
)
|
(10,586
|
)
|
—
|
|
20,778
|
|
—
|
|
|||||||||
|
Net income/(loss)
|
(10,192
|
)
|
(10,192
|
)
|
(10,648
|
)
|
20,778
|
|
(10,254
|
)
|
|||||||||
|
Net income/(loss) attributable to noncontrolling interest
|
—
|
|
—
|
|
(62
|
)
|
—
|
|
(62
|
)
|
|||||||||
|
Net income/(loss) excluding noncontrolling interest
|
$
|
(10,192
|
)
|
$
|
(10,192
|
)
|
$
|
(10,586
|
)
|
$
|
20,778
|
|
$
|
(10,192
|
)
|
||||
|
Comprehensive income/(loss) excluding noncontrolling interest
|
$
|
(11,081
|
)
|
$
|
(11,081
|
)
|
$
|
(11,550
|
)
|
$
|
22,631
|
|
$
|
(11,081
|
)
|
||||
201
The Kraft Heinz Company
Condensed Consolidating Statements of Income
For the
Year
Ended
December 30, 2017
(in millions)
|
As Restated & Recast
|
|||||||||||||||||||
|
Parent Guarantor
|
Subsidiary Issuer
|
Non-Guarantor Subsidiaries
|
Eliminations
|
Consolidated
|
|||||||||||||||
|
Net sales
|
$
|
—
|
|
$
|
17,397
|
|
$
|
9,247
|
|
$
|
(568
|
)
|
$
|
26,076
|
|
||||
|
Cost of products sold
|
—
|
|
11,147
|
|
6,464
|
|
(568
|
)
|
17,043
|
|
|||||||||
|
Gross profit
|
—
|
|
6,250
|
|
2,783
|
|
—
|
|
9,033
|
|
|||||||||
|
Selling, general and administrative expenses, excluding impairment losses
|
—
|
|
695
|
|
2,232
|
|
—
|
|
2,927
|
|
|||||||||
|
Goodwill impairment losses
|
—
|
|
—
|
|
—
|
|
—
|
|
—
|
|
|||||||||
|
Intangible asset impairment losses
|
—
|
|
—
|
|
49
|
|
—
|
|
49
|
|
|||||||||
|
Selling, general and administrative expenses
|
—
|
|
695
|
|
2,281
|
|
—
|
|
2,976
|
|
|||||||||
|
Intercompany service fees and other recharges
|
—
|
|
4,307
|
|
(4,307
|
)
|
—
|
|
—
|
|
|||||||||
|
Operating income/(loss)
|
—
|
|
1,248
|
|
4,809
|
|
—
|
|
6,057
|
|
|||||||||
|
Interest expense
|
—
|
|
1,189
|
|
45
|
|
—
|
|
1,234
|
|
|||||||||
|
Other expense/(income), net
|
—
|
|
(535
|
)
|
(92
|
)
|
—
|
|
(627
|
)
|
|||||||||
|
Income/(loss) before income taxes
|
—
|
|
594
|
|
4,856
|
|
—
|
|
5,450
|
|
|||||||||
|
Provision for/(benefit from) income taxes
|
—
|
|
(243
|
)
|
(5,239
|
)
|
—
|
|
(5,482
|
)
|
|||||||||
|
Equity in earnings/(losses) of subsidiaries
|
10,941
|
|
10,104
|
|
—
|
|
(21,045
|
)
|
—
|
|
|||||||||
|
Net income/(loss)
|
10,941
|
|
10,941
|
|
10,095
|
|
(21,045
|
)
|
10,932
|
|
|||||||||
|
Net income/(loss) attributable to noncontrolling interest
|
—
|
|
—
|
|
(9
|
)
|
—
|
|
(9
|
)
|
|||||||||
|
Net income/(loss) excluding noncontrolling interest
|
$
|
10,941
|
|
$
|
10,941
|
|
$
|
10,104
|
|
$
|
(21,045
|
)
|
$
|
10,941
|
|
||||
|
Comprehensive income/(loss) excluding noncontrolling interest
|
$
|
11,516
|
|
$
|
11,516
|
|
$
|
7,711
|
|
$
|
(19,227
|
)
|
$
|
11,516
|
|
||||
202
The Kraft Heinz Company
Condensed Consolidating Statements of Income
For the
Year
Ended
December 30, 2017
(in millions)
|
As Previously Reported
|
|||||||||||||||||||
|
Parent Guarantor
|
Subsidiary Issuer
|
Non-Guarantor Subsidiaries
|
Eliminations
|
Consolidated
|
|||||||||||||||
|
Net sales
|
$
|
—
|
|
$
|
17,507
|
|
$
|
9,293
|
|
$
|
(568
|
)
|
$
|
26,232
|
|
||||
|
Cost of products sold
|
—
|
|
10,710
|
|
6,387
|
|
(568
|
)
|
16,529
|
|
|||||||||
|
Gross profit
|
—
|
|
6,797
|
|
2,906
|
|
—
|
|
9,703
|
|
|||||||||
|
Selling, general and administrative expenses, excluding impairment losses
|
—
|
|
652
|
|
2,229
|
|
—
|
|
2,881
|
|
|||||||||
|
Goodwill impairment losses
|
—
|
|
—
|
|
—
|
|
—
|
|
—
|
|
|||||||||
|
Intangible asset impairment losses
|
—
|
|
—
|
|
49
|
|
—
|
|
49
|
|
|||||||||
|
Selling, general and administrative expenses
|
—
|
|
652
|
|
2,278
|
|
—
|
|
2,930
|
|
|||||||||
|
Intercompany service fees and other recharges
|
—
|
|
4,308
|
|
(4,308
|
)
|
—
|
|
—
|
|
|||||||||
|
Operating income/(loss)
|
—
|
|
1,837
|
|
4,936
|
|
—
|
|
6,773
|
|
|||||||||
|
Interest expense
|
—
|
|
1,190
|
|
44
|
|
—
|
|
1,234
|
|
|||||||||
|
Other expense/(income), net
|
—
|
|
(10
|
)
|
19
|
|
—
|
|
9
|
|
|||||||||
|
Income/(loss) before income taxes
|
—
|
|
657
|
|
4,873
|
|
—
|
|
5,530
|
|
|||||||||
|
Provision for/(benefit from) income taxes
|
—
|
|
(221
|
)
|
(5,239
|
)
|
—
|
|
(5,460
|
)
|
|||||||||
|
Equity in earnings/(losses) of subsidiaries
|
10,999
|
|
10,121
|
|
—
|
|
(21,120
|
)
|
—
|
|
|||||||||
|
Net income/(loss)
|
10,999
|
|
10,999
|
|
10,112
|
|
(21,120
|
)
|
10,990
|
|
|||||||||
|
Net income/(loss) attributable to noncontrolling interest
|
—
|
|
—
|
|
(9
|
)
|
—
|
|
(9
|
)
|
|||||||||
|
Net income/(loss) excluding noncontrolling interest
|
$
|
10,999
|
|
$
|
10,999
|
|
$
|
10,121
|
|
$
|
(21,120
|
)
|
$
|
10,999
|
|
||||
|
Comprehensive income/(loss) excluding noncontrolling interest
|
$
|
11,573
|
|
$
|
11,573
|
|
$
|
7,726
|
|
$
|
(19,299
|
)
|
$
|
11,573
|
|
||||
203
The Kraft Heinz Company
Condensed Consolidating Statements of Income
For the
Year
Ended
December 31, 2016
(in millions)
|
As Restated & Recast
|
|||||||||||||||||||
|
Parent Guarantor
|
Subsidiary Issuer
|
Non-Guarantor Subsidiaries
|
Eliminations
|
Consolidated
|
|||||||||||||||
|
Net sales
|
$
|
—
|
|
$
|
17,652
|
|
$
|
9,281
|
|
$
|
(633
|
)
|
$
|
26,300
|
|
||||
|
Cost of products sold
|
—
|
|
11,359
|
|
6,428
|
|
(633
|
)
|
17,154
|
|
|||||||||
|
Gross profit
|
—
|
|
6,293
|
|
2,853
|
|
—
|
|
9,146
|
|
|||||||||
|
Selling, general and administrative expenses, excluding impairment losses
|
—
|
|
1,053
|
|
2,474
|
|
—
|
|
3,527
|
|
|||||||||
|
Goodwill impairment losses
|
—
|
|
—
|
|
—
|
|
—
|
|
—
|
|
|||||||||
|
Intangible asset impairment losses
|
—
|
|
—
|
|
18
|
|
—
|
|
18
|
|
|||||||||
|
Selling, general and administrative expenses
|
—
|
|
1,053
|
|
2,492
|
|
—
|
|
3,545
|
|
|||||||||
|
Intercompany service fees and other recharges
|
—
|
|
4,624
|
|
(4,624
|
)
|
—
|
|
—
|
|
|||||||||
|
Operating income/(loss)
|
—
|
|
616
|
|
4,985
|
|
—
|
|
5,601
|
|
|||||||||
|
Interest expense
|
—
|
|
1,076
|
|
58
|
|
—
|
|
1,134
|
|
|||||||||
|
Other expense/(income), net
|
—
|
|
(230
|
)
|
(242
|
)
|
—
|
|
(472
|
)
|
|||||||||
|
Income/(loss) before income taxes
|
—
|
|
(230
|
)
|
5,169
|
|
—
|
|
4,939
|
|
|||||||||
|
Provision for/(benefit from) income taxes
|
—
|
|
(414
|
)
|
1,747
|
|
—
|
|
1,333
|
|
|||||||||
|
Equity in earnings/(losses) of subsidiaries
|
3,596
|
|
3,412
|
|
—
|
|
(7,008
|
)
|
—
|
|
|||||||||
|
Net income/(loss)
|
3,596
|
|
3,596
|
|
3,422
|
|
(7,008
|
)
|
3,606
|
|
|||||||||
|
Net income/(loss) attributable to noncontrolling interest
|
—
|
|
—
|
|
10
|
|
—
|
|
10
|
|
|||||||||
|
Net income/(loss) excluding noncontrolling interest
|
$
|
3,596
|
|
$
|
3,596
|
|
$
|
3,412
|
|
$
|
(7,008
|
)
|
$
|
3,596
|
|
||||
|
Comprehensive income/(loss) excluding noncontrolling interest
|
$
|
2,583
|
|
$
|
2,583
|
|
$
|
5,712
|
|
$
|
(8,295
|
)
|
$
|
2,583
|
|
||||
204
The Kraft Heinz Company
Condensed Consolidating Statements of Income
For the
Year
Ended
December 31, 2016
(in millions)
|
As Previously Reported
|
|||||||||||||||||||
|
Parent Guarantor
|
Subsidiary Issuer
|
Non-Guarantor Subsidiaries
|
Eliminations
|
Consolidated
|
|||||||||||||||
|
Net sales
|
$
|
—
|
|
$
|
17,809
|
|
$
|
9,310
|
|
$
|
(632
|
)
|
$
|
26,487
|
|
||||
|
Cost of products sold
|
—
|
|
11,156
|
|
6,377
|
|
(632
|
)
|
16,901
|
|
|||||||||
|
Gross profit
|
—
|
|
6,653
|
|
2,933
|
|
—
|
|
9,586
|
|
|||||||||
|
Selling, general and administrative expenses, excluding impairment losses
|
—
|
|
970
|
|
2,474
|
|
—
|
|
3,444
|
|
|||||||||
|
Goodwill impairment losses
|
—
|
|
—
|
|
—
|
|
—
|
|
—
|
|
|||||||||
|
Intangible asset impairment losses
|
—
|
|
—
|
|
—
|
|
—
|
|
—
|
|
|||||||||
|
Selling, general and administrative expenses
|
—
|
|
970
|
|
2,474
|
|
—
|
|
3,444
|
|
|||||||||
|
Intercompany service fees and other recharges
|
—
|
|
4,624
|
|
(4,624
|
)
|
—
|
|
—
|
|
|||||||||
|
Operating income/(loss)
|
—
|
|
1,059
|
|
5,083
|
|
—
|
|
6,142
|
|
|||||||||
|
Interest expense
|
—
|
|
1,076
|
|
58
|
|
—
|
|
1,134
|
|
|||||||||
|
Other expense/(income), net
|
—
|
|
144
|
|
(159
|
)
|
—
|
|
(15
|
)
|
|||||||||
|
Income/(loss) before income taxes
|
—
|
|
(161
|
)
|
5,184
|
|
—
|
|
5,023
|
|
|||||||||
|
Provision for/(benefit from) income taxes
|
—
|
|
(372
|
)
|
1,753
|
|
—
|
|
1,381
|
|
|||||||||
|
Equity in earnings/(losses) of subsidiaries
|
3,632
|
|
3,421
|
|
—
|
|
(7,053
|
)
|
—
|
|
|||||||||
|
Net income/(loss)
|
3,632
|
|
3,632
|
|
3,431
|
|
(7,053
|
)
|
3,642
|
|
|||||||||
|
Net income/(loss) attributable to noncontrolling interest
|
—
|
|
—
|
|
10
|
|
—
|
|
10
|
|
|||||||||
|
Net income/(loss) excluding noncontrolling interest
|
$
|
3,632
|
|
$
|
3,632
|
|
$
|
3,421
|
|
$
|
(7,053
|
)
|
$
|
3,632
|
|
||||
|
Comprehensive income/(loss) excluding noncontrolling interest
|
$
|
2,675
|
|
$
|
2,675
|
|
$
|
5,717
|
|
$
|
(8,392
|
)
|
$
|
2,675
|
|
||||
205
The Kraft Heinz Company
Condensed Consolidating Balance Sheets
As of
December 29, 2018
(in millions)
|
Parent Guarantor
|
Subsidiary Issuer
|
Non-Guarantor Subsidiaries
|
Eliminations
|
Consolidated
|
|||||||||||||||
|
ASSETS
|
|||||||||||||||||||
|
Cash and cash equivalents
|
$
|
—
|
|
$
|
202
|
|
$
|
928
|
|
$
|
—
|
|
$
|
1,130
|
|
||||
|
Trade receivables, net
|
—
|
|
933
|
|
1,196
|
|
—
|
|
2,129
|
|
|||||||||
|
Receivables due from affiliates
|
—
|
|
870
|
|
341
|
|
(1,211
|
)
|
—
|
|
|||||||||
|
Income taxes receivable
|
—
|
|
701
|
|
9
|
|
(558
|
)
|
152
|
|
|||||||||
|
Inventories
|
—
|
|
1,783
|
|
884
|
|
—
|
|
2,667
|
|
|||||||||
|
Short-term lending due from affiliates
|
—
|
|
1,787
|
|
3,753
|
|
(5,540
|
)
|
—
|
|
|||||||||
|
Prepaid expenses
|
—
|
|
198
|
|
202
|
|
—
|
|
400
|
|
|||||||||
|
Other current assets
|
—
|
|
776
|
|
445
|
|
—
|
|
1,221
|
|
|||||||||
|
Assets held for sale
|
—
|
|
75
|
|
1,301
|
|
—
|
|
1,376
|
|
|||||||||
|
Total current assets
|
—
|
|
7,325
|
|
9,059
|
|
(7,309
|
)
|
9,075
|
|
|||||||||
|
Property, plant and equipment, net
|
—
|
|
4,524
|
|
2,554
|
|
—
|
|
7,078
|
|
|||||||||
|
Goodwill
|
—
|
|
11,067
|
|
25,436
|
|
—
|
|
36,503
|
|
|||||||||
|
Investments in subsidiaries
|
51,657
|
|
67,867
|
|
—
|
|
(119,524
|
)
|
—
|
|
|||||||||
|
Intangible assets, net
|
—
|
|
3,010
|
|
46,458
|
|
—
|
|
49,468
|
|
|||||||||
|
Long-term lending due from affiliates
|
—
|
|
—
|
|
2,000
|
|
(2,000
|
)
|
—
|
|
|||||||||
|
Other non-current assets
|
—
|
|
316
|
|
1,021
|
|
—
|
|
1,337
|
|
|||||||||
|
TOTAL ASSETS
|
$
|
51,657
|
|
$
|
94,109
|
|
$
|
86,528
|
|
$
|
(128,833
|
)
|
$
|
103,461
|
|
||||
|
LIABILITIES AND EQUITY
|
|||||||||||||||||||
|
Commercial paper and other short-term debt
|
$
|
—
|
|
$
|
—
|
|
$
|
21
|
|
$
|
—
|
|
$
|
21
|
|
||||
|
Current portion of long-term debt
|
—
|
|
363
|
|
14
|
|
—
|
|
377
|
|
|||||||||
|
Short-term lending due to affiliates
|
—
|
|
3,753
|
|
1,787
|
|
(5,540
|
)
|
—
|
|
|||||||||
|
Trade payables
|
—
|
|
2,563
|
|
1,590
|
|
—
|
|
4,153
|
|
|||||||||
|
Payables due to affiliates
|
—
|
|
341
|
|
870
|
|
(1,211
|
)
|
—
|
|
|||||||||
|
Accrued marketing
|
—
|
|
282
|
|
440
|
|
—
|
|
722
|
|
|||||||||
|
Interest payable
|
—
|
|
394
|
|
14
|
|
—
|
|
408
|
|
|||||||||
|
Other current liabilities
|
—
|
|
888
|
|
1,437
|
|
(558
|
)
|
1,767
|
|
|||||||||
|
Liabilities held for sale
|
—
|
|
—
|
|
55
|
|
—
|
|
55
|
|
|||||||||
|
Total current liabilities
|
—
|
|
8,584
|
|
6,228
|
|
(7,309
|
)
|
7,503
|
|
|||||||||
|
Long-term debt
|
—
|
|
29,872
|
|
898
|
|
—
|
|
30,770
|
|
|||||||||
|
Long-term borrowings due to affiliates
|
—
|
|
2,000
|
|
12
|
|
(2,012
|
)
|
—
|
|
|||||||||
|
Deferred income taxes
|
—
|
|
1,314
|
|
10,888
|
|
—
|
|
12,202
|
|
|||||||||
|
Accrued postemployment costs
|
—
|
|
89
|
|
217
|
|
—
|
|
306
|
|
|||||||||
|
Other non-current liabilities
|
—
|
|
593
|
|
309
|
|
—
|
|
902
|
|
|||||||||
|
TOTAL LIABILITIES
|
—
|
|
42,452
|
|
18,552
|
|
(9,321
|
)
|
51,683
|
|
|||||||||
|
Redeemable noncontrolling interest
|
—
|
|
—
|
|
3
|
|
—
|
|
3
|
|
|||||||||
|
Total shareholders’ equity
|
51,657
|
|
51,657
|
|
67,855
|
|
(119,512
|
)
|
51,657
|
|
|||||||||
|
Noncontrolling interest
|
—
|
|
—
|
|
118
|
|
—
|
|
118
|
|
|||||||||
|
TOTAL EQUITY
|
51,657
|
|
51,657
|
|
67,973
|
|
(119,512
|
)
|
51,775
|
|
|||||||||
|
TOTAL LIABILITIES AND EQUITY
|
$
|
51,657
|
|
$
|
94,109
|
|
$
|
86,528
|
|
$
|
(128,833
|
)
|
$
|
103,461
|
|
||||
206
The Kraft Heinz Company
Condensed Consolidating Balance Sheets
As of
December 30, 2017
(in millions)
|
As Restated
|
|||||||||||||||||||
|
Parent Guarantor
|
Subsidiary Issuer
|
Non-Guarantor Subsidiaries
|
Eliminations
|
Consolidated
|
|||||||||||||||
|
ASSETS
|
|||||||||||||||||||
|
Cash and cash equivalents
|
$
|
—
|
|
$
|
509
|
|
$
|
1,120
|
|
$
|
—
|
|
$
|
1,629
|
|
||||
|
Trade receivables, net
|
—
|
|
91
|
|
830
|
|
—
|
|
921
|
|
|||||||||
|
Receivables due from affiliates
|
—
|
|
716
|
|
240
|
|
(956
|
)
|
—
|
|
|||||||||
|
Dividends due from affiliates
|
135
|
|
—
|
|
—
|
|
(135
|
)
|
—
|
|
|||||||||
|
Sold receivables
|
—
|
|
—
|
|
353
|
|
—
|
|
353
|
|
|||||||||
|
Income taxes receivable
|
—
|
|
1,890
|
|
97
|
|
(1,449
|
)
|
538
|
|
|||||||||
|
Inventories
|
—
|
|
1,790
|
|
970
|
|
—
|
|
2,760
|
|
|||||||||
|
Short-term lending due from affiliates
|
—
|
|
1,598
|
|
3,816
|
|
(5,414
|
)
|
—
|
|
|||||||||
|
Prepaid expenses
|
—
|
|
168
|
|
177
|
|
—
|
|
345
|
|
|||||||||
|
Other current assets
|
—
|
|
359
|
|
296
|
|
—
|
|
655
|
|
|||||||||
|
Total current assets
|
135
|
|
7,121
|
|
7,899
|
|
(7,954
|
)
|
7,201
|
|
|||||||||
|
Property, plant and equipment, net
|
—
|
|
4,591
|
|
2,470
|
|
—
|
|
7,061
|
|
|||||||||
|
Goodwill
|
—
|
|
11,068
|
|
33,757
|
|
—
|
|
44,825
|
|
|||||||||
|
Investments in subsidiaries
|
65,863
|
|
80,345
|
|
—
|
|
(146,208
|
)
|
—
|
|
|||||||||
|
Intangible assets, net
|
—
|
|
3,222
|
|
56,210
|
|
—
|
|
59,432
|
|
|||||||||
|
Long-term lending due from affiliates
|
—
|
|
1,700
|
|
2,029
|
|
(3,729
|
)
|
—
|
|
|||||||||
|
Other non-current assets
|
—
|
|
515
|
|
1,058
|
|
—
|
|
1,573
|
|
|||||||||
|
TOTAL ASSETS
|
$
|
65,998
|
|
$
|
108,562
|
|
$
|
103,423
|
|
$
|
(157,891
|
)
|
$
|
120,092
|
|
||||
|
LIABILITIES AND EQUITY
|
|||||||||||||||||||
|
Commercial paper and other short-term debt
|
$
|
—
|
|
$
|
450
|
|
$
|
12
|
|
$
|
—
|
|
$
|
462
|
|
||||
|
Current portion of long-term debt
|
—
|
|
2,568
|
|
165
|
|
—
|
|
2,733
|
|
|||||||||
|
Short-term lending due to affiliates
|
—
|
|
3,816
|
|
1,598
|
|
(5,414
|
)
|
—
|
|
|||||||||
|
Trade payables
|
—
|
|
2,681
|
|
1,681
|
|
—
|
|
4,362
|
|
|||||||||
|
Payables due to affiliates
|
—
|
|
240
|
|
716
|
|
(956
|
)
|
—
|
|
|||||||||
|
Accrued marketing
|
—
|
|
236
|
|
453
|
|
—
|
|
689
|
|
|||||||||
|
Interest payable
|
—
|
|
404
|
|
15
|
|
—
|
|
419
|
|
|||||||||
|
Dividends due to affiliates
|
—
|
|
135
|
|
—
|
|
(135
|
)
|
—
|
|
|||||||||
|
Other current liabilities
|
135
|
|
565
|
|
2,238
|
|
(1,449
|
)
|
1,489
|
|
|||||||||
|
Total current liabilities
|
135
|
|
11,095
|
|
6,878
|
|
(7,954
|
)
|
10,154
|
|
|||||||||
|
Long-term debt
|
—
|
|
27,422
|
|
886
|
|
—
|
|
28,308
|
|
|||||||||
|
Long-term borrowings due to affiliates
|
—
|
|
2,029
|
|
1,919
|
|
(3,948
|
)
|
—
|
|
|||||||||
|
Deferred income taxes
|
—
|
|
1,182
|
|
12,857
|
|
—
|
|
14,039
|
|
|||||||||
|
Accrued postemployment costs
|
—
|
|
184
|
|
243
|
|
—
|
|
427
|
|
|||||||||
|
Other non-current liabilities
|
—
|
|
787
|
|
301
|
|
—
|
|
1,088
|
|
|||||||||
|
TOTAL LIABILITIES
|
135
|
|
42,699
|
|
23,084
|
|
(11,902
|
)
|
54,016
|
|
|||||||||
|
Redeemable noncontrolling interest
|
—
|
|
—
|
|
6
|
|
—
|
|
6
|
|
|||||||||
|
Total shareholders’ equity
|
65,863
|
|
65,863
|
|
80,126
|
|
(145,989
|
)
|
65,863
|
|
|||||||||
|
Noncontrolling interest
|
—
|
|
—
|
|
207
|
|
—
|
|
207
|
|
|||||||||
|
TOTAL EQUITY
|
65,863
|
|
65,863
|
|
80,333
|
|
(145,989
|
)
|
66,070
|
|
|||||||||
|
TOTAL LIABILITIES AND EQUITY
|
$
|
65,998
|
|
$
|
108,562
|
|
$
|
103,423
|
|
$
|
(157,891
|
)
|
$
|
120,092
|
|
||||
207
The Kraft Heinz Company
Condensed Consolidating Balance Sheets
As of
December 30, 2017
(in millions)
|
As Previously Reported
|
|||||||||||||||||||
|
Parent Guarantor
|
Subsidiary Issuer
|
Non-Guarantor Subsidiaries
|
Eliminations
|
Consolidated
|
|||||||||||||||
|
ASSETS
|
|||||||||||||||||||
|
Cash and cash equivalents
|
$
|
—
|
|
$
|
509
|
|
$
|
1,120
|
|
$
|
—
|
|
$
|
1,629
|
|
||||
|
Trade receivables, net
|
—
|
|
91
|
|
830
|
|
—
|
|
921
|
|
|||||||||
|
Receivables due from affiliates
|
—
|
|
716
|
|
207
|
|
(923
|
)
|
—
|
|
|||||||||
|
Dividends due from affiliates
|
135
|
|
—
|
|
—
|
|
(135
|
)
|
—
|
|
|||||||||
|
Sold receivables
|
—
|
|
—
|
|
353
|
|
—
|
|
353
|
|
|||||||||
|
Income taxes receivable
|
—
|
|
1,904
|
|
97
|
|
(1,419
|
)
|
582
|
|
|||||||||
|
Inventories
|
—
|
|
1,846
|
|
969
|
|
—
|
|
2,815
|
|
|||||||||
|
Short-term lending due from affiliates
|
—
|
|
1,598
|
|
3,816
|
|
(5,414
|
)
|
—
|
|
|||||||||
|
Prepaid expenses
|
—
|
|
168
|
|
177
|
|
—
|
|
345
|
|
|||||||||
|
Other current assets
|
—
|
|
325
|
|
296
|
|
—
|
|
621
|
|
|||||||||
|
Total current assets
|
135
|
|
7,157
|
|
7,865
|
|
(7,891
|
)
|
7,266
|
|
|||||||||
|
Property, plant and equipment, net
|
—
|
|
4,577
|
|
2,543
|
|
—
|
|
7,120
|
|
|||||||||
|
Goodwill
|
—
|
|
11,067
|
|
33,757
|
|
—
|
|
44,824
|
|
|||||||||
|
Investments in subsidiaries
|
66,034
|
|
80,426
|
|
—
|
|
(146,460
|
)
|
—
|
|
|||||||||
|
Intangible assets, net
|
—
|
|
3,222
|
|
56,227
|
|
—
|
|
59,449
|
|
|||||||||
|
Long-term lending due from affiliates
|
—
|
|
1,700
|
|
2,029
|
|
(3,729
|
)
|
—
|
|
|||||||||
|
Other non-current assets
|
—
|
|
515
|
|
1,058
|
|
—
|
|
1,573
|
|
|||||||||
|
TOTAL ASSETS
|
$
|
66,169
|
|
$
|
108,664
|
|
$
|
103,479
|
|
$
|
(158,080
|
)
|
$
|
120,232
|
|
||||
|
LIABILITIES AND EQUITY
|
|||||||||||||||||||
|
Commercial paper and other short-term debt
|
$
|
—
|
|
$
|
448
|
|
$
|
12
|
|
$
|
—
|
|
$
|
460
|
|
||||
|
Current portion of long-term debt
|
—
|
|
2,577
|
|
166
|
|
—
|
|
2,743
|
|
|||||||||
|
Short-term lending due to affiliates
|
—
|
|
3,816
|
|
1,598
|
|
(5,414
|
)
|
—
|
|
|||||||||
|
Trade payables
|
—
|
|
2,718
|
|
1,731
|
|
—
|
|
4,449
|
|
|||||||||
|
Payables due to affiliates
|
—
|
|
207
|
|
716
|
|
(923
|
)
|
—
|
|
|||||||||
|
Accrued marketing
|
—
|
|
236
|
|
444
|
|
—
|
|
680
|
|
|||||||||
|
Interest payable
|
—
|
|
404
|
|
15
|
|
—
|
|
419
|
|
|||||||||
|
Dividends due to affiliates
|
—
|
|
135
|
|
—
|
|
(135
|
)
|
—
|
|
|||||||||
|
Other current liabilities
|
135
|
|
473
|
|
2,192
|
|
(1,419
|
)
|
1,381
|
|
|||||||||
|
Total current liabilities
|
135
|
|
11,014
|
|
6,874
|
|
(7,891
|
)
|
10,132
|
|
|||||||||
|
Long-term debt
|
—
|
|
27,442
|
|
891
|
|
—
|
|
28,333
|
|
|||||||||
|
Long-term borrowings due to affiliates
|
—
|
|
2,029
|
|
1,919
|
|
(3,948
|
)
|
—
|
|
|||||||||
|
Deferred income taxes
|
—
|
|
1,245
|
|
12,831
|
|
—
|
|
14,076
|
|
|||||||||
|
Accrued postemployment costs
|
—
|
|
184
|
|
243
|
|
—
|
|
427
|
|
|||||||||
|
Other non-current liabilities
|
—
|
|
716
|
|
301
|
|
—
|
|
1,017
|
|
|||||||||
|
TOTAL LIABILITIES
|
135
|
|
42,630
|
|
23,059
|
|
(11,839
|
)
|
53,985
|
|
|||||||||
|
Redeemable noncontrolling interest
|
—
|
|
—
|
|
6
|
|
—
|
|
6
|
|
|||||||||
|
Total shareholders’ equity
|
66,034
|
|
66,034
|
|
80,207
|
|
(146,241
|
)
|
66,034
|
|
|||||||||
|
Noncontrolling interest
|
—
|
|
—
|
|
207
|
|
—
|
|
207
|
|
|||||||||
|
TOTAL EQUITY
|
66,034
|
|
66,034
|
|
80,414
|
|
(146,241
|
)
|
66,241
|
|
|||||||||
|
TOTAL LIABILITIES AND EQUITY
|
$
|
66,169
|
|
$
|
108,664
|
|
$
|
103,479
|
|
$
|
(158,080
|
)
|
$
|
120,232
|
|
||||
208
The Kraft Heinz Company
Condensed Consolidating Statements of Cash Flows
For the
Year
Ended
December 29, 2018
(in millions)
|
Parent Guarantor
|
Subsidiary Issuer
|
Non-Guarantor Subsidiaries
|
Eliminations
|
Consolidated
|
|||||||||||||||
|
CASH FLOWS FROM OPERATING ACTIVITIES
|
|||||||||||||||||||
|
Net cash provided by/(used for) operating activities
|
$
|
3,183
|
|
$
|
1,928
|
|
$
|
656
|
|
$
|
(3,193
|
)
|
$
|
2,574
|
|
||||
|
CASH FLOWS FROM INVESTING ACTIVITIES
|
|||||||||||||||||||
|
Cash receipts on sold receivables
|
—
|
|
—
|
|
1,296
|
|
—
|
|
1,296
|
|
|||||||||
|
Capital expenditures
|
—
|
|
(339
|
)
|
(487
|
)
|
—
|
|
(826
|
)
|
|||||||||
|
Payments to acquire business, net of cash acquired
|
—
|
|
(245
|
)
|
(3
|
)
|
—
|
|
(248
|
)
|
|||||||||
|
Net proceeds from/(payments on) intercompany lending activities
|
—
|
|
1,626
|
|
206
|
|
(1,832
|
)
|
—
|
|
|||||||||
|
Additional investments in subsidiaries
|
|
|
(41
|
)
|
|
|
41
|
|
—
|
|
|||||||||
|
Return of capital
|
7
|
|
—
|
|
—
|
|
(7
|
)
|
—
|
|
|||||||||
|
Other investing activities, net
|
—
|
|
31
|
|
35
|
|
—
|
|
66
|
|
|||||||||
|
Net cash provided by/(used for) investing activities
|
7
|
|
1,032
|
|
1,047
|
|
(1,798
|
)
|
288
|
|
|||||||||
|
CASH FLOWS FROM FINANCING ACTIVITIES
|
|||||||||||||||||||
|
Repayments of long-term debt
|
—
|
|
(2,550
|
)
|
(163
|
)
|
—
|
|
(2,713
|
)
|
|||||||||
|
Proceeds from issuance of long-term debt
|
—
|
|
2,990
|
|
—
|
|
—
|
|
2,990
|
|
|||||||||
|
Proceeds from issuance of commercial paper
|
—
|
|
2,784
|
|
—
|
|
—
|
|
2,784
|
|
|||||||||
|
Repayments of commercial paper
|
—
|
|
(3,213
|
)
|
—
|
|
—
|
|
(3,213
|
)
|
|||||||||
|
Net proceeds from/(payments on) intercompany borrowing activities
|
—
|
|
(206
|
)
|
(1,626
|
)
|
1,832
|
|
—
|
|
|||||||||
|
Dividends paid-common stock
|
(3,183
|
)
|
(3,183
|
)
|
(10
|
)
|
3,193
|
|
(3,183
|
)
|
|||||||||
|
Other intercompany capital stock transactions
|
—
|
|
(7
|
)
|
41
|
|
(34
|
)
|
—
|
|
|||||||||
|
Other financing activities, net
|
(7
|
)
|
(17
|
)
|
(4
|
)
|
—
|
|
(28
|
)
|
|||||||||
|
Net cash provided by/(used for) financing activities
|
(3,190
|
)
|
(3,402
|
)
|
(1,762
|
)
|
4,991
|
|
(3,363
|
)
|
|||||||||
|
Effect of exchange rate changes on cash, cash equivalents, and restricted cash
|
—
|
|
—
|
|
(132
|
)
|
—
|
|
(132
|
)
|
|||||||||
|
Cash, cash equivalents, and restricted cash:
|
|||||||||||||||||||
|
Net increase/(decrease)
|
—
|
|
(442
|
)
|
(191
|
)
|
—
|
|
(633
|
)
|
|||||||||
|
Balance at beginning of period
|
—
|
|
644
|
|
1,125
|
|
—
|
|
1,769
|
|
|||||||||
|
Balance at end of period
|
$
|
—
|
|
$
|
202
|
|
$
|
934
|
|
$
|
—
|
|
$
|
1,136
|
|
||||
209
The Kraft Heinz Company
Condensed Consolidating Statements of Cash Flows
For the
Year
Ended
December 30, 2017
(in millions)
|
As Restated
|
|||||||||||||||||||
|
Parent Guarantor
|
Subsidiary Issuer
|
Non-Guarantor Subsidiaries
|
Eliminations
|
Consolidated
|
|||||||||||||||
|
CASH FLOWS FROM OPERATING ACTIVITIES
|
|||||||||||||||||||
|
Net cash provided by/(used for) operating activities
|
$
|
2,888
|
|
$
|
1,497
|
|
$
|
(996
|
)
|
$
|
(2,888
|
)
|
$
|
501
|
|
||||
|
CASH FLOWS FROM INVESTING ACTIVITIES
|
|||||||||||||||||||
|
Cash receipts on sold receivables
|
—
|
|
—
|
|
2,286
|
|
—
|
|
2,286
|
|
|||||||||
|
Capital expenditures
|
—
|
|
(757
|
)
|
(437
|
)
|
—
|
|
(1,194
|
)
|
|||||||||
|
Net proceeds from/(payments on) intercompany lending activities
|
—
|
|
641
|
|
(542
|
)
|
(99
|
)
|
—
|
|
|||||||||
|
Additional investments in subsidiaries
|
(21
|
)
|
—
|
|
—
|
|
21
|
|
—
|
|
|||||||||
|
Other investing activities, net
|
—
|
|
62
|
|
23
|
|
—
|
|
85
|
|
|||||||||
|
Net cash provided by/(used for) investing activities
|
(21
|
)
|
(54
|
)
|
1,330
|
|
(78
|
)
|
1,177
|
|
|||||||||
|
CASH FLOWS FROM FINANCING ACTIVITIES
|
|||||||||||||||||||
|
Repayments of long-term debt
|
—
|
|
(2,628
|
)
|
(13
|
)
|
—
|
|
(2,641
|
)
|
|||||||||
|
Proceeds from issuance of long-term debt
|
—
|
|
1,496
|
|
—
|
|
—
|
|
1,496
|
|
|||||||||
|
Proceeds from issuance of commercial paper
|
—
|
|
6,043
|
|
—
|
|
—
|
|
6,043
|
|
|||||||||
|
Repayments of commercial paper
|
—
|
|
(6,249
|
)
|
—
|
|
—
|
|
(6,249
|
)
|
|||||||||
|
Net proceeds from/(payments on) intercompany borrowing activities
|
—
|
|
542
|
|
(641
|
)
|
99
|
|
—
|
|
|||||||||
|
Dividends paid-common stock
|
(2,888
|
)
|
(2,888
|
)
|
—
|
|
2,888
|
|
(2,888
|
)
|
|||||||||
|
Other intercompany capital stock transactions
|
—
|
|
21
|
|
—
|
|
(21
|
)
|
—
|
|
|||||||||
|
Other financing activities, net
|
21
|
|
(5
|
)
|
2
|
|
—
|
|
18
|
|
|||||||||
|
Net cash provided by/(used for) financing activities
|
(2,867
|
)
|
(3,668
|
)
|
(652
|
)
|
2,966
|
|
(4,221
|
)
|
|||||||||
|
Effect of exchange rate changes on cash, cash equivalents, and restricted cash
|
—
|
|
—
|
|
57
|
|
—
|
|
57
|
|
|||||||||
|
Cash, cash equivalents, and restricted cash:
|
|||||||||||||||||||
|
Net increase/(decrease)
|
—
|
|
(2,225
|
)
|
(261
|
)
|
—
|
|
(2,486
|
)
|
|||||||||
|
Balance at beginning of period
|
—
|
|
2,869
|
|
1,386
|
|
—
|
|
4,255
|
|
|||||||||
|
Balance at end of period
|
$
|
—
|
|
$
|
644
|
|
$
|
1,125
|
|
$
|
—
|
|
$
|
1,769
|
|
||||
210
The Kraft Heinz Company
Condensed Consolidating Statements of Cash Flows
For the
Year
Ended
December 30, 2017
(in millions)
|
As Previously Reported
|
|||||||||||||||||||
|
Parent Guarantor
|
Subsidiary Issuer
|
Non-Guarantor Subsidiaries
|
Eliminations
|
Consolidated
|
|||||||||||||||
|
CASH FLOWS FROM OPERATING ACTIVITIES
|
|||||||||||||||||||
|
Net cash provided by/(used for) operating activities
|
$
|
2,888
|
|
$
|
1,499
|
|
$
|
(972
|
)
|
$
|
(2,888
|
)
|
$
|
527
|
|
||||
|
CASH FLOWS FROM INVESTING ACTIVITIES
|
|||||||||||||||||||
|
Cash receipts on sold receivables
|
—
|
|
—
|
|
2,286
|
|
—
|
|
2,286
|
|
|||||||||
|
Capital expenditures
|
—
|
|
(757
|
)
|
(460
|
)
|
—
|
|
(1,217
|
)
|
|||||||||
|
Net proceeds from/(payments on) intercompany lending activities
|
—
|
|
641
|
|
(542
|
)
|
(99
|
)
|
—
|
|
|||||||||
|
Additional investments in subsidiaries
|
(22
|
)
|
—
|
|
—
|
|
22
|
|
—
|
|
|||||||||
|
Other investing activities, net
|
—
|
|
64
|
|
23
|
|
—
|
|
87
|
|
|||||||||
|
Net cash provided by/(used for) investing activities
|
(22
|
)
|
(52
|
)
|
1,307
|
|
(77
|
)
|
1,156
|
|
|||||||||
|
CASH FLOWS FROM FINANCING ACTIVITIES
|
|||||||||||||||||||
|
Repayments of long-term debt
|
—
|
|
(2,632
|
)
|
(12
|
)
|
—
|
|
(2,644
|
)
|
|||||||||
|
Proceeds from issuance of long-term debt
|
—
|
|
1,496
|
|
—
|
|
—
|
|
1,496
|
|
|||||||||
|
Net proceeds from/(payments on) intercompany borrowing activities
|
—
|
|
542
|
|
(641
|
)
|
99
|
|
—
|
|
|||||||||
|
Proceeds from issuance of commercial paper
|
—
|
|
6,043
|
|
—
|
|
—
|
|
6,043
|
|
|||||||||
|
Repayments of commercial paper
|
—
|
|
(6,249
|
)
|
—
|
|
—
|
|
(6,249
|
)
|
|||||||||
|
Dividends paid-common stock
|
(2,888
|
)
|
(2,888
|
)
|
—
|
|
2,888
|
|
(2,888
|
)
|
|||||||||
|
Other intercompany capital stock transactions
|
—
|
|
22
|
|
—
|
|
(22
|
)
|
—
|
|
|||||||||
|
Other financing activities, net
|
22
|
|
(6
|
)
|
—
|
|
—
|
|
16
|
|
|||||||||
|
Net cash provided by/(used for) financing activities
|
(2,866
|
)
|
(3,672
|
)
|
(653
|
)
|
2,965
|
|
(4,226
|
)
|
|||||||||
|
Effect of exchange rate changes on cash, cash equivalents, and restricted cash
|
—
|
|
—
|
|
57
|
|
—
|
|
57
|
|
|||||||||
|
Cash, cash equivalents, and restricted cash:
|
|||||||||||||||||||
|
Net increase/(decrease)
|
—
|
|
(2,225
|
)
|
(261
|
)
|
—
|
|
(2,486
|
)
|
|||||||||
|
Balance at beginning of period
|
—
|
|
2,869
|
|
1,386
|
|
—
|
|
4,255
|
|
|||||||||
|
Balance at end of period
|
$
|
—
|
|
$
|
644
|
|
$
|
1,125
|
|
$
|
—
|
|
$
|
1,769
|
|
||||
211
The Kraft Heinz Company
Condensed Consolidating Statements of Cash Flows
For the
Year
Ended
December 31, 2016
(in millions)
|
As Restated
|
|||||||||||||||||||
|
Parent Guarantor
|
Subsidiary Issuer
|
Non-Guarantor Subsidiaries
|
Eliminations
|
Consolidated
|
|||||||||||||||
|
CASH FLOWS FROM OPERATING ACTIVITIES
|
|||||||||||||||||||
|
Net cash provided by/(used for) operating activities
|
$
|
3,096
|
|
$
|
4,368
|
|
$
|
(1,704
|
)
|
$
|
(3,112
|
)
|
$
|
2,648
|
|
||||
|
CASH FLOWS FROM INVESTING ACTIVITIES
|
|||||||||||||||||||
|
Cash receipts on sold receivables
|
—
|
|
—
|
|
2,589
|
|
—
|
|
2,589
|
|
|||||||||
|
Capital expenditures
|
—
|
|
(923
|
)
|
(324
|
)
|
—
|
|
(1,247
|
)
|
|||||||||
|
Net proceeds from/(payments on) intercompany lending activities
|
—
|
|
690
|
|
37
|
|
(727
|
)
|
—
|
|
|||||||||
|
Additional investments in subsidiaries
|
—
|
|
(10
|
)
|
—
|
|
10
|
|
—
|
|
|||||||||
|
Return of capital
|
9,042
|
|
—
|
|
—
|
|
(9,042
|
)
|
—
|
|
|||||||||
|
Other investing activities, net
|
—
|
|
129
|
|
(19
|
)
|
—
|
|
110
|
|
|||||||||
|
Net cash provided by/(used for) investing activities
|
9,042
|
|
(114
|
)
|
2,283
|
|
(9,759
|
)
|
1,452
|
|
|||||||||
|
CASH FLOWS FROM FINANCING ACTIVITIES
|
|||||||||||||||||||
|
Repayments of long-term debt
|
—
|
|
(72
|
)
|
(13
|
)
|
—
|
|
(85
|
)
|
|||||||||
|
Proceeds from issuance of long-term debt
|
—
|
|
6,978
|
|
3
|
|
—
|
|
6,981
|
|
|||||||||
|
Proceeds from issuance of commercial paper
|
—
|
|
6,680
|
|
—
|
|
—
|
|
6,680
|
|
|||||||||
|
Repayments of commercial paper
|
—
|
|
(6,043
|
)
|
—
|
|
—
|
|
(6,043
|
)
|
|||||||||
|
Net proceeds from/(payments on) intercompany borrowing activities
|
—
|
|
(37
|
)
|
(690
|
)
|
727
|
|
—
|
|
|||||||||
|
Dividends paid-Series A Preferred Stock
|
(180
|
)
|
—
|
|
—
|
|
—
|
|
(180
|
)
|
|||||||||
|
Dividends paid-common stock
|
(3,584
|
)
|
(3,764
|
)
|
(16
|
)
|
3,780
|
|
(3,584
|
)
|
|||||||||
|
Redemption of Series A Preferred Stock
|
(8,320
|
)
|
—
|
|
—
|
|
—
|
|
(8,320
|
)
|
|||||||||
|
Other intercompany capital stock transactions
|
—
|
|
(8,374
|
)
|
10
|
|
8,364
|
|
—
|
|
|||||||||
|
Other financing activities, net
|
(54
|
)
|
(5
|
)
|
(10
|
)
|
—
|
|
(69
|
)
|
|||||||||
|
Net cash provided by/(used for) financing activities
|
(12,138
|
)
|
(4,637
|
)
|
(716
|
)
|
12,871
|
|
(4,620
|
)
|
|||||||||
|
Effect of exchange rate changes on cash, cash equivalents, and restricted cash
|
—
|
|
—
|
|
(137
|
)
|
—
|
|
(137
|
)
|
|||||||||
|
Cash, cash equivalents, and restricted cash:
|
|||||||||||||||||||
|
Net increase/(decrease)
|
—
|
|
(383
|
)
|
(274
|
)
|
—
|
|
(657
|
)
|
|||||||||
|
Balance at beginning of period
|
—
|
|
3,252
|
|
1,660
|
|
—
|
|
4,912
|
|
|||||||||
|
Balance at end of period
|
$
|
—
|
|
$
|
2,869
|
|
$
|
1,386
|
|
$
|
—
|
|
$
|
4,255
|
|
||||
212
The Kraft Heinz Company
Condensed Consolidating Statements of Cash Flows
For the
Year
Ended
December 31, 2016
(in millions)
|
As Previously Reported
|
|||||||||||||||||||
|
Parent Guarantor
|
Subsidiary Issuer
|
Non-Guarantor Subsidiaries
|
Eliminations
|
Consolidated
|
|||||||||||||||
|
CASH FLOWS FROM OPERATING ACTIVITIES
|
|||||||||||||||||||
|
Net cash provided by/(used for) operating activities
|
$
|
3,097
|
|
$
|
4,369
|
|
$
|
(1,705
|
)
|
$
|
(3,112
|
)
|
$
|
2,649
|
|
||||
|
CASH FLOWS FROM INVESTING ACTIVITIES
|
|||||||||||||||||||
|
Cash receipts on sold receivables
|
—
|
|
—
|
|
2,589
|
|
—
|
|
2,589
|
|
|||||||||
|
Capital expenditures
|
—
|
|
(923
|
)
|
(324
|
)
|
—
|
|
(1,247
|
)
|
|||||||||
|
Net proceeds from/(payments on) intercompany lending activities
|
—
|
|
690
|
|
37
|
|
(727
|
)
|
—
|
|
|||||||||
|
Additional investments in subsidiaries
|
55
|
|
(10
|
)
|
—
|
|
(45
|
)
|
—
|
|
|||||||||
|
Return of capital
|
8,987
|
|
—
|
|
—
|
|
(8,987
|
)
|
—
|
|
|||||||||
|
Other investing activities, net
|
—
|
|
129
|
|
(19
|
)
|
—
|
|
110
|
|
|||||||||
|
Net cash provided by/(used for) investing activities
|
9,042
|
|
(114
|
)
|
2,283
|
|
(9,759
|
)
|
1,452
|
|
|||||||||
|
CASH FLOWS FROM FINANCING ACTIVITIES
|
|||||||||||||||||||
|
Repayments of long-term debt
|
—
|
|
(72
|
)
|
(14
|
)
|
—
|
|
(86
|
)
|
|||||||||
|
Proceeds from issuance of long-term debt
|
—
|
|
6,978
|
|
3
|
|
—
|
|
6,981
|
|
|||||||||
|
Net proceeds from/(payments on) intercompany borrowing activities
|
—
|
|
(37
|
)
|
(690
|
)
|
727
|
|
—
|
|
|||||||||
|
Proceeds from issuance of commercial paper
|
—
|
|
6,680
|
|
—
|
|
—
|
|
6,680
|
|
|||||||||
|
Repayments of commercial paper
|
—
|
|
(6,043
|
)
|
—
|
|
—
|
|
(6,043
|
)
|
|||||||||
|
Dividends paid-Series A Preferred Stock
|
(180
|
)
|
—
|
|
—
|
|
—
|
|
(180
|
)
|
|||||||||
|
Dividends paid-common stock
|
(3,584
|
)
|
(3,764
|
)
|
(16
|
)
|
3,780
|
|
(3,584
|
)
|
|||||||||
|
Redemption of Series A Preferred Stock
|
(8,320
|
)
|
—
|
|
—
|
|
—
|
|
(8,320
|
)
|
|||||||||
|
Other intercompany capital stock transactions
|
—
|
|
(8,374
|
)
|
10
|
|
8,364
|
|
—
|
|
|||||||||
|
Other financing activities, net
|
(55
|
)
|
(6
|
)
|
(8
|
)
|
—
|
|
(69
|
)
|
|||||||||
|
Net cash provided by/(used for) financing activities
|
(12,139
|
)
|
(4,638
|
)
|
(715
|
)
|
12,871
|
|
(4,621
|
)
|
|||||||||
|
Effect of exchange rate changes on cash, cash equivalents, and restricted cash
|
—
|
|
—
|
|
(137
|
)
|
—
|
|
(137
|
)
|
|||||||||
|
Cash, cash equivalents, and restricted cash:
|
|||||||||||||||||||
|
Net increase/(decrease)
|
—
|
|
(383
|
)
|
(274
|
)
|
—
|
|
(657
|
)
|
|||||||||
|
Balance at beginning of period
|
—
|
|
3,252
|
|
1,660
|
|
—
|
|
4,912
|
|
|||||||||
|
Balance at end of period
|
$
|
—
|
|
$
|
2,869
|
|
$
|
1,386
|
|
$
|
—
|
|
$
|
4,255
|
|
||||
213
The following tables provide a reconciliation of cash and cash equivalents, as reported on our condensed consolidating balance sheets, to cash, cash equivalents, and restricted cash, as reported on our condensed consolidating statements of cash flows (in millions):
|
December 29, 2018
|
|||||||||||||||||||
|
Parent Guarantor
|
Subsidiary Issuer
|
Non-Guarantor Subsidiaries
|
Eliminations
|
Consolidated
|
|||||||||||||||
|
Cash and cash equivalents
|
$
|
—
|
|
$
|
202
|
|
$
|
928
|
|
$
|
—
|
|
$
|
1,130
|
|
||||
|
Restricted cash included in other current assets
|
—
|
|
—
|
|
1
|
|
—
|
|
1
|
|
|||||||||
|
Restricted cash included in other non-current assets
|
—
|
|
—
|
|
5
|
|
—
|
|
5
|
|
|||||||||
|
Cash, cash equivalents, and restricted cash
|
$
|
—
|
|
$
|
202
|
|
$
|
934
|
|
$
|
—
|
|
$
|
1,136
|
|
||||
|
December 30, 2017
|
|||||||||||||||||||
|
Parent Guarantor
|
Subsidiary Issuer
|
Non-Guarantor Subsidiaries
|
Eliminations
|
Consolidated
|
|||||||||||||||
|
Cash and cash equivalents
|
$
|
—
|
|
$
|
509
|
|
$
|
1,120
|
|
$
|
—
|
|
$
|
1,629
|
|
||||
|
Restricted cash included in other current assets
|
—
|
|
135
|
|
5
|
|
—
|
|
140
|
|
|||||||||
|
Cash, cash equivalents, and restricted cash
|
$
|
—
|
|
$
|
644
|
|
$
|
1,125
|
|
$
|
—
|
|
$
|
1,769
|
|
||||
214
Item 9. Changes in and Disagreements With Accountants on Accounting and Financial Disclosure.
None.
Item 9A. Controls and Procedures.
Evaluation of Disclosure Controls and Procedures
Our management, with the participation of our Chief Executive Officer and Chief Financial Officer, has evaluated the effectiveness of our disclosure controls and procedures (as defined in Rules 13a-15(e) and 15d-15(e) under the Exchange Act) as of December 29, 2018. Based on that evaluation, our Chief Executive Officer and Chief Financial Officer have concluded that as of December 29, 2018, due to the existence of the material weaknesses in our internal control over financial reporting described below, our disclosure controls and procedures were not effective to provide reasonable assurance that the information required to be disclosed in the reports that we file or submit under the Exchange Act is recorded, processed, summarized, and reported within the time periods specified in the SEC’s rules and forms, and that such information is accumulated and communicated to management as appropriate to allow timely decisions regarding required disclosure.
Management’s Report on Internal Control Over Financial Reporting
Management is responsible for establishing and maintaining adequate internal control over financial reporting as defined in Rule 13a-15(f) under the Exchange Act. Our internal control over financial reporting is a process designed to provide reasonable assurance regarding the reliability of financial reporting and the preparation of financial statements for external purposes in accordance with generally accepted accounting principles. Our internal control over financial reporting includes those written policies and procedures that:
|
•
|
pertain to the maintenance of records that, in reasonable detail, accurately and fairly reflect the transactions and dispositions of assets;
|
|
•
|
provide reasonable assurance that transactions are recorded as necessary to permit preparation of financial statements in accordance with generally accepted accounting principles;
|
|
•
|
provide reasonable assurance that receipts and expenditures are being made only in accordance with management and director authorization; and
|
|
•
|
provide reasonable assurance regarding prevention or timely detection of unauthorized acquisition, use, or disposition of assets that could have a material effect on the consolidated financial statements.
|
Because of its inherent limitations, internal control over financial reporting may not prevent or detect misstatements. Also, projections of any evaluation of effectiveness to future periods are subject to the risk that controls may become inadequate because of changes in conditions, or that the degree of compliance with the policies or procedures may deteriorate.
Under the supervision and with the participation of management, including our Chief Executive Officer and Chief Financial Officer, we conducted an evaluation of the effectiveness of our internal control over financial reporting as of December 29, 2018 based on the framework described in
Internal Control - Integrated Framework
(2013)
issued by the Committee of Sponsoring Organizations of the Treadway Commission (COSO). Based on this evaluation, our management concluded that we did not maintain effective internal control over financial reporting as of December 29, 2018 due to the material weaknesses described below.
A material weakness is a deficiency, or combination of deficiencies, in internal control over financial reporting, such that there is a reasonable possibility that a material misstatement of our annual or interim financial statements will not be prevented or detected on a timely basis.
We identified a material weakness in the risk assessment component of internal control as we did not appropriately design controls in response to the risk of misstatement due to changes in our business environment. This material weakness in risk assessment gave rise to the specific control deficiencies described below, which we also determined to be material weaknesses:
|
•
|
Supplier Contracts and Related Arrangements
: We did not design and maintain effective controls over the accounting for supplier contracts and related arrangements. Specifically, certain employees in our procurement organization engaged in misconduct and circumvented controls that included withholding information or directing others to withhold information related to supplier contracts that affected the accounting for certain supplier rebates, incentives, and pricing arrangements, in an attempt to influence the achievement of internal financial targets that became or were perceived to have become increasingly difficult to attain due to changes in our business environment. Additionally, in certain instances, we did not have a sufficient understanding or maintain sufficient documentation of the transaction to determine the appropriate accounting for certain cost and rebate elements and embedded leases. This material weakness resulted in misstatements that were corrected in the restatement included in this Annual Report on Form 10-K.
|
215
|
•
|
Goodwill and Indefinite-lived Intangible Asset Impairment Testing
: We did not design and maintain effective controls to reassess the level of precision used to review the impairment assessments related to goodwill and indefinite-lived intangible assets as changes in our business environment occurred. Specifically, we did not design and maintain effective controls to reassess the level of precision used in the review of the allocation of cash flow projections to certain brands used as a basis for performing our fourth quarter 2018 interim impairment assessments in response to the significant reduction in, and in certain instances elimination of, the excess fair value over carrying amount of certain brands that resulted from changes in our business environment. This material weakness did not result in a misstatement of any previously issued consolidated financial statements.
|
Additionally, the material weaknesses described above could result in a misstatement of the aforementioned account balances or disclosures that would result in a material misstatement of the annual or interim consolidated financial statements that would not be prevented or detected.
PricewaterhouseCoopers LLP, an independent registered public accounting firm that audited the consolidated financial statements included in this Annual Report on Form 10-K, has also audited the effectiveness of our internal control over financial reporting as of December 29, 2018, as stated in their report which appears herein under Item 8,
Financial Statements and Supplementary Data
.
Remediation of Material Weaknesses
We are evaluating the material weaknesses and developing a plan of remediation to strengthen our internal controls related to our risk assessment component of internal control over financial reporting, supplier contracts and related arrangements, and the level of precision applied to the goodwill and indefinite-lived intangible asset impairment testing process. The remediation efforts summarized below, which are in the process of being implemented, are intended to address the identified material weaknesses and enhance our overall internal control environment.
|
•
|
Personnel Actions—A comprehensive disciplinary plan is in the process of being implemented for all employees found to have engaged in misconduct, including termination, written warnings, and appropriate training depending on the severity of the misconduct.
|
|
•
|
Performance Targets—We have identified and will be implementing several performance-based target enhancements as follows: (i) implementing checkpoints to evaluate significant changes in the environment that could adversely impact the attainability of management goals and targets; (ii) reassessing and adjusting the overall balance of performance measures provided to employees to help drive challenging but attainable targets; and (iii) enhancing our training and overall communication specific to the Management by Objective (“MBO”) process, including a focus on the process to request relief from previously established MBOs, to help ensure all eligible employees are aware of and understand the overall MBO waiver and relief process; (iv) reinforcing the importance of adherence to established internal controls and company policies and procedures through other formal communications, town hall meetings, and other employee trainings; and (v) reassessing certain employees’ key performance indicators.
|
|
•
|
Organizational Enhancements—We have identified and are in the process of implementing organizational enhancements as follows: (i) augmenting our procurement finance teams with additional professionals with the appropriate levels of accounting and controls knowledge, experience, and training in the area of supplier contracts and related arrangements; and (ii) realigning reporting lines whereby procurement finance now report directly to the finance organization.
|
|
•
|
Procurement Practices—We have evaluated our procurement practices and are in the process of implementing improvements to those practices, including: (i) developing more comprehensive contract approval policies and processes; (ii) enhancing required communication protocols among all functions involved in the procurement process (e.g., procurement, legal, accounting, and finance) to ensure all relevant parties are involved in the contract review process; (iii) standardizing contract documentation and analyses; and (iv) developing a more comprehensive accounting review process and monitoring controls over supplier contracts and related arrangements to ensure transactions are recorded in accordance with generally accepted accounting principles.
|
|
•
|
Training Practices—We are in the process of developing a comprehensive global procurement training program that will cover supplier contracts and related arrangements, including potential accounting implications. As part of this effort, we have held mandatory training for our global procurement function, which focused on our policies and procedures related to procurement, including the proper accounting for the contract terms that contributed to the material weakness.
|
|
•
|
Procurement Management Software—We have started to evaluate potential solutions to implement or upgrade the existing procurement management software to enhance the identification, tracking, and monitoring of supplier contracts and related arrangements.
|
|
•
|
Level of Precision Applied to Impairment Testing—We are in the process of implementing a plan to enhance the level of precision at which our internal controls over financial reporting relating to goodwill and indefinite-lived intangible asset impairment assessments are performed. Specifically, we will be implementing and executing additional procedures to (i)
|
216
enhance our analysis of forecasted cash flows used in the impairment assessment and (ii) test the accuracy of forecasted cash flow allocations to specific brands.
We believe the measures described above will remediate the material weaknesses we have identified and strengthen our internal control over financial reporting. We are committed to continuing to improve our internal control processes and have begun to implement some of the steps described above. We will also continue to review, optimize, and enhance our financial reporting controls and procedures. As we continue to evaluate and work to improve our internal control over financial reporting, we may take additional measures to address control deficiencies or we may modify certain of the remediation measures described above. These material weaknesses will not be considered remediated until the applicable remediated controls operate for a sufficient period of time and management has concluded, through testing, that these controls are operating effectively.
Changes in Internal Control Over Financial Reporting
Our Chief Executive Officer and Chief Financial Officer, with other members of management, evaluated the changes in our internal control over financial reporting during the three months ended December 29, 2018. We determined that there were no changes in our internal control over financial reporting during the three months ended December 29, 2018 that have materially affected, or are reasonably likely to materially affect, our internal control over financial reporting.
Item 9B. Other Information.
Not applicable.
PART III
Item 10. Directors, Executive Officers and Corporate Governance.
EXECUTIVE OFFICERS
Information regarding executive officers is included in Part I of this Annual Report on Form 10-K under the caption “Information about our Executive Officers.”
BOARD OF DIRECTORS
Directors and Director Nominees
The table below provides summary information about each director and each person nominated by the Kraft Heinz Board of Directors (the “Board”) for election at our 2019 Annual Meeting of Stockholders (the “Annual Meeting”) as of June 5, 2019.
|
Name
|
Age
|
Director
Since
|
Independent
|
Audit Committee
|
Compensation Committee
|
Governance Committee
|
Operations & Strategy Committee
|
|||||||
|
Gregory E. Abel
|
57
|
2013
|
Yes
|
X
|
||||||||||
|
Alexandre Behring (Chairman)
|
52
|
2013
|
Yes
|
X
|
Chair
|
X
|
||||||||
|
Joao M. Castro-Neves*
|
52
|
2019
|
Yes
|
Chair
|
X
|
X
|
||||||||
|
Tracy Britt Cool
|
34
|
2013
|
Yes
|
X
|
||||||||||
|
John T. Cahill (Vice Chairman)
|
62
|
2015
|
No
|
Chair
|
||||||||||
|
Feroz Dewan
|
42
|
2016
|
Yes
|
X
|
||||||||||
|
Jeanne P. Jackson
|
67
|
2015
|
Yes
|
X
|
X
|
X
|
||||||||
|
Jorge Paulo Lemann
|
79
|
2013
|
Yes
|
X
|
X
|
|||||||||
|
John C. Pope
|
70
|
2015
|
Yes
|
Chair
|
X
|
X
|
||||||||
|
Alexandre Van Damme**
|
57
|
2018
|
Yes
|
X
|
||||||||||
|
George Zoghbi
|
52
|
2018
|
No
|
|||||||||||
|
*
|
As previously disclosed, Marcel Hermann Telles decided to retire from the Board. His retirement will become effective on June 12, 2019. The Board elected Mr. Castro-Neves, effective June 12, 2019, and appointed him to the Compensation Committee, the Nominating and Corporate Governance Committee (the “Governance Committee”), and the Operations and Strategy Committee, effective June 12, 2019.
|
|
**
|
The board appointed Mr. Van Damme to the Governance Committee, effective June 12, 2019.
|
217
Gregory E. Abel
, age 56, has served on our Board since July 2015 and previously served on the Heinz board from June 2013 to July 2015. In January 2018, Mr. Abel was elected to the Board of Directors of Berkshire Hathaway Inc., a diversified holding company, and appointed as its Vice Chairman, Non-Insurance Business Operations. In connection with this election in January 2018, Mr. Abel became Executive Chairman of the Board of Directors of Berkshire Hathaway Energy Company and resigned as the company’s Chief Executive Officer and President, roles that he had held since 2008 and 1998, respectively. He had previously served as Chairman of Berkshire Hathaway Energy Company since 2011. Berkshire Hathaway Energy Company is a diversified global holding company that owns subsidiaries principally engaged in energy businesses in the United States, Canada, Great Britain, and the Philippines.
Until January 2018, Mr. Abel also served as Chairman, Chief Executive Officer, and Director of PacifiCorp, an electric power company, as Chairman, President, Chief Executive Officer and Director of CE Casecnan Ltd., a water and energy company, as Chairman and Director of Northern Natural Gas Company, a natural gas company, Northern Powergrid Holdings Company, an electric power company, and NV Energy, Inc., a public utility company, as Director of AltaLink Management Ltd., an electricity transmission company, as Director and Vice Chairman of Edison Electric Institute, an association of U.S. investor-owned electric companies, and as Director of Nuclear Electric Insurance Limited, a mutual insurance company of nuclear power facilities.
Mr. Abel serves as Director of HomeServices of America, Inc., a residential real estate brokerage firm, and as Director and Vice Chairman of Associated Electric & Gas Insurance Services, Inc., a managing general agent for a mutual insurance company.
Mr. Abel has experience as chief executive officer and director of multiple energy companies. Due to his service as a director in a highly-regulated industry and his management experience, he provides the Board with strong regulatory and operational skills, including international experience.
Alexandre Behring
, age 52, has served on our Board as Chairman since July 2015 and previously served as Chairman of the Heinz board from June 2013 to July 2015. Mr. Behring is a Founding Partner and has been Managing Partner and a board member of 3G Capital, a global investment firm, since 2004. He also has served as the Executive Chairman of the Board of Directors of Restaurant Brands International Inc. (“RBI”), the parent company of Burger King, Popeyes, and Tim Hortons, quick service restaurant companies, since December 2014. Previously, he had served on the Board of Directors of Burger King Worldwide, Inc. and its predecessor as Chairman from October 2010 until December 2014. Mr. Behring also served as a Director of AB InBev, a multinational drink and brewing holdings company, from April 2014 to April 2019.
Previously, Mr. Behring spent 10 years at GP Investments, including eight years as a partner and member of the firm’s Investment Committee. He served for seven years, from 1998 through 2004, as Chief Executive Officer of ALL, one of Latin America’s largest railroad and logistics companies. He served as a Director of ALL until December 2011. From July 2008 to May 2011, Mr. Behring served as a Director of CSX Corporation, a U.S. rail-based transportation company.
Mr. Behring’s extensive leadership experience in developing and operating both public and private companies brings an important perspective and ability to lead and motivate. Mr. Behring’s qualifications and operational, financial, logistics, and strategic skills strengthen the Board’s collective knowledge and capacities.
Joao M. Castro-Neves
, age 52, has served on our Board since June 2019. He has been a partner with 3G Capital since July 2018. Previously, Mr. Castro-Neves served as Chief Executive Officer of Anheuser-Busch, AB InBev’s North American unit, and Zone President, North America of AB InBev, from January 2015 until December 2017. Mr. Castro-Neves joined Companhia de Bebidas das Americas S.A. (“AMBEV”), a predecessor of AB InBev, in 1996 and served in positions of increasing responsibility, including Chief Financial Officer from January 2005 until December 2006 and Chief Executive Officer from January 2009 until December 2014. He has also served as Chief Executive Officer of Quilmes Industrial S.A., a subsidiary of AMBEV based in Argentina, from January 2007 until December 2008. Mr. Castro-Neves is also a director of RBI.
The Board has elected Mr. Castro-Neves because of his extensive experience in the consumer goods industry in his various positions with AB InBev as well as his public company directorship experience at RBI. In addition, when electing him, the Board considered his knowledge of strategy, finance, operations, mergers and acquisitions, and business development.
Tracy Britt Cool
, age 34, has served on our Board since July 2015 and previously served on the Heinz board from June 2013 to July 2015. Ms. Cool has served as Chief Executive Officer of The Pampered Chef, a direct seller of high-quality cooking tools, since November 2014. Ms. Cool has been with Berkshire Hathaway, The Pampered Chef’s parent company, since she joined in December 2009 as Financial Assistant to the Chairman. Ms. Cool is currently the Chairman of Benjamin Moore & Co., a leading manufacturer and retailer of paints and architectural coatings, Chairman of Larson-Juhl, a manufacturer and distributor of wood and metal framing products, and Chairman of Oriental Trading Company, a direct merchant of party suppliers, arts and crafts, toys, and novelties. Ms. Cool is also a director of Blue Apron Holdings, Inc., an ingredient-and-recipe meal kit service.
218
Ms. Cool’s background as a senior leader of several consumer product companies provides her with a strong fundamental understanding related to our business. She also brings important insight into financial, marketing, product development, and other complex subjects.
John T. Cahill
, age 62, has served on our Board as Vice Chairman since July 2015, prior to which he had served as Chairman and Chief Executive Officer of Kraft since December 2014. Mr. Cahill previously served as Kraft’s non-executive Chairman from March 2014 to December 2014. Prior to that, he served as Kraft’s Executive Chairman since October 2012. Mr. Cahill joined Mondelēz International, a food and beverage company and Kraft’s former parent, in January 2012 as the Executive Chairman Designate, North American Grocery, and served in that capacity until the spin-off of Kraft from Mondelēz International in October 2012. Prior to that, he served as an Industrial Partner at Ripplewood Holdings LLC, a private equity firm, from 2008 to 2011. Mr. Cahill spent nine years with The Pepsi Bottling Group, Inc., a beverage manufacturing company, most recently as Chairman and Chief Executive Officer from 2003 to 2006 and Executive Chairman until 2007. Mr. Cahill previously spent nine years with PepsiCo, Inc., a food and beverage company, in a variety of leadership positions. He currently serves as Lead Independent Director of American Airlines Group and is also a director at Colgate-Palmolive Company and a former director of Kraft and Legg Mason, Inc.
Mr. Cahill has extensive experience in the food and beverage industry, having served as Chairman and Chief Executive Officer of Kraft and in various key roles at other food and beverage companies. Mr. Cahill brings global leadership, operating, marketing, and product development experience, as well as insight into corporate governance, accounting, and financial subjects.
Feroz Dewan
, age 42, has served on our Board since October 2016. Mr. Dewan is CEO of Arena Holdings Management LLC, an investment holding company. Previously, Mr. Dewan has served in several positions with Tiger Global Management, an investment firm with approximately $20 billion under management across public and private equity funds, from 2003 to 2015, including most recently as Head of Public Equities. He also served as a Private Equity Associate at Silver Lake Partners, a private equity firm focused on leveraged buyout and growth capital investments in technology, technology-enabled, and related industries, from 2002 to 2003. Mr. Dewan has served as a Director of Fortive Corporation, a diversified industrial growth company, since July 2016.
Mr. Dewan has experience with technology and technology-related companies, including extensive experience in valuation, investments, financial reporting, capital allocation, operational oversight, and corporate governance.
Jeanne P. Jackson
, age 67, has served on our Board since July 2015 and previously served on the Kraft Board of Directors from October 2012 to July 2015. Ms. Jackson served as President and Strategic Advisor, of NIKE, Inc., a designer, marketer, and distributor of athletic footwear, equipment, and accessories from June 2016 to August 2017, President, Product and Merchandising from July 2013 until April 2016, and President, Direct to Consumer from 2009 until July 2013. Prior to that, she founded and served as the Chief Executive Officer of MSP Capital, a private investment company, from 2002 to 2009, a role she returned to after retiring from NIKE, Inc. Before MSP, she served as Chief Executive Officer of Walmart.com, a private eCommerce enterprise, from 2000 to 2002. Ms. Jackson previously served in various leadership positions at Gap Inc., Victoria’s Secret, Saks Fifth Avenue, and Federated Department Stores, Inc., all clothing retailers, and Walt Disney Attractions, Inc., the theme parks and vacation resorts division of The Walt Disney Company, a mass media company. Ms. Jackson currently serves as a director of Delta Airlines, Inc. and McDonald’s Corporation and was formerly a director of Kraft.
As a former senior executive with several major consumer retailers and service as audit committee member of several public companies, Ms. Jackson brings knowledge of accounting and financial subjects as well as leadership, operating, and marketing experience.
Jorge Paulo Lemann
, age 79, has served on our Board since July 2015 and previously served on the Heinz board from June 2013 to July 2015. Mr. Lemann is a Founding Partner and has been a board member of 3G Capital since 2004. Mr. Lemann founded and was Senior Partner of Banco de Investimentos Garantia S.A. in Brazil from 1971 through June 1998. He was also Chairman of the Latin American Advisory Committee of the New York Stock Exchange and formerly a Director of AB InBev. Mr. Lemann has been a member of JP Morgan International Council since 2012.
Mr. Lemann has experience as a director of a consumer products company and has strong international experience in the beverage industry. He also has broad knowledge of strategy, financial, investing, and business development.
219
John C. Pope
, age 70, has served on our Board since July 2015 and previously served on the Kraft Board of Directors from August 2012 to July 2015. Mr. Pope has served as Chairman of PFI Group, LLC, a financial management firm, since 1994. Mr. Pope also serves as Chairman of the board of R.R. Donnelley and Sons Co., a marketing and business communication company, since May 2014, and from November 2004 to December 2011, he served as Chairman of the board of Waste Management, Inc., a provider of comprehensive waste management services. Mr. Pope also served as Chairman of the board of MotivePower Industries, Inc., a manufacturer and remanufacturer of locomotives and locomotive components, from December 1995 to November 1999. Prior to joining MotivePower Industries, Inc., Mr. Pope served in various capacities at United Airlines, a U.S.-based airline, and its parent, UAL Corporation, including as Director, Vice Chairman, President, Chief Operating Officer, Chief Financial Officer, and Executive Vice President, Marketing and Finance. Mr. Pope is currently Chairman of the board of R.R. Donnelley and Sons Co. and a director of Talgo S.A., a railcar manufacturer, and Waste Management, Inc. Mr. Pope was formerly a director of Con-way, Inc., Dollar Thrifty Automotive Group, Inc., Kraft, Mondelēz International, and Navistar International Corporation.
Mr. Pope has served as Chairman of a financial management firm and in several key leadership roles at global companies, including as Chief Financial Officer. Combined with his experience as an audit committee member of several public companies, Mr. Pope brings accounting and financial expertise, as well as leadership, operating, marketing, and international experience.
Alexandre Van Damme
, age 57, has served on our Board since April 2018 and has served as a member of the board of RBI since December 2014. He previously served on the board of Burger King Worldwide, Inc. and its predecessor from December 2011 to December 2014. Mr. Van Damme has served as a member of the Board of Directors of AB InBev since 1992. He held various operational positions within Interbrew, a large Belgian-based brewing company until 1991. Mr. Van Damme was also a board member of Jacobs Douwe Egberts B.V., a global coffee and tea company, and its subsidiary Keurig Green Mountain through May 2018. He is also a director of DKMS, the largest bone marrow donor center in the world.
Mr. Van Damme’s long-term leadership at a large brewing company that is a major consumer brand gives him valuable expertise in business development, supply chain management, marketing, finance, risk assessment, and strategy.
George Zoghbi
, age 52, has served on our Board since April 2018 and currently serves as a Special Advisor at Kraft Heinz, a role to which he transitioned in October 2017 after having served as our Chief Operating Officer of the U.S. Commercial business since the 2015 Merger. Mr. Zoghbi previously held key leadership roles at Kraft, including Chief Operating Officer from February 2015 until the 2015 Merger and, before that, as Vice Chairman, Operations, R&D, Sales and Strategy from June 2014 until February 2015, Executive Vice President and President, Cheese & Dairy and Exports from February 2013 until June 2014, and Executive Vice President and President, Cheese and Dairy from October 2012 to February 2013. Prior to that, he served as President, Cheese and Dairy at Mondelēz International. Prior to joining Kraft in 2007, Mr. Zoghbi held a number of roles with Fonterra Cooperative, a multinational dairy cooperative, and Associated British Foods, a multinational food processor and retailer. Mr. Zoghbi currently serves as a director of Brambles Limited, a global supply chain logistics company.
Mr. Zoghbi has a comprehensive understanding of, and a unique perspective on, the Kraft Heinz business and the food and beverage markets from his distinguished career at Kraft Heinz and Kraft. He served a key leadership role during the integration of Kraft and Heinz and has extensive experience of delivering on innovation, renovation, and new consumer trends.
CORPORATE GOVERNANCE AND BOARD MATTERS
Corporate Governance Guidelines
The Guidelines articulate our governance philosophy, practices, and policies in a range of areas, including: the Board’s role and responsibilities; the composition and structure of the Board; the establishment and responsibilities of the committees of the Board; executive and director performance evaluations; and succession planning. The Governance Committee reviews the Guidelines annually and recommends any changes to the Board.
Code of Business Conduct and Ethics for Non-Employee Directors and Code of Conduct for Employees
We have a written Code of Business Conduct and Ethics for Non-Employee Directors (the “Directors Ethics Code”) that is designed to deter wrongdoing and to promote:
|
•
|
honest and ethical conduct;
|
|
•
|
due care, diligence, and loyalty;
|
|
•
|
confidentiality of our proprietary information;
|
|
•
|
compliance with applicable laws, rules, and regulations, including insider trading compliance; and
|
|
•
|
accountability for adherence to the Directors Ethics Code and prompt internal reporting of violations.
|
220
Annually, each non-employee director acknowledges in writing that he or she has received, reviewed, and understands the Directors Ethics Code.
We also have a written Code of Conduct for employees (the “Code of Conduct”). The Code of Conduct includes a set of employee policies that cover ethical and legal practices for nearly every aspect of our business. The Code of Conduct reflects our values and contains important rules our employees must follow when conducting business to promote compliance and integrity. The Code of Conduct is part of our global compliance and integrity program that provides support and training throughout our Company and encourages reporting of wrongdoing by offering anonymous reporting options and a non-retaliation policy. We will disclose in the Corporate Governance section of our Web site (described below) any amendments to our Directors Ethics Code or Code of Conduct and any waiver granted to an executive officer or director under these codes.
Corporate Governance Materials Available on Our Web Site
Our Web site contains the Guidelines, our Board committee charters, the Code of Conduct, and the Directors Ethics Code. To view these documents, go to
http://ir.kraftheinzcompany.com
and click on “Corporate Governance.” We will promptly deliver free of charge, upon request, a copy of the Guidelines, the Board committee charters, the Code of Conduct, or the Directors Ethics Code to any stockholder requesting a copy. Requests should be directed to our Corporate Secretary at The Kraft Heinz Company, 200 East Randolph Street, Suite 7600, Chicago, IL 60601.
The information on our Web site is not, and will not be deemed to be, a part of this Annual Report on Form 10-K or incorporated by reference into any of our other filings with the SEC.
Delinquent Section 16(a) Reports
Section 16(a) of the Exchange Act requires our executive officers and directors, and persons who own more than 10% of our common stock (collectively, the “Reporting Persons”), to file reports of ownership and changes in ownership with the SEC. Based solely upon a review of Forms 3, 4 and 5 and amendments thereto filed electronically with the SEC by the Reporting Persons with respect to the fiscal year ended December 29, 2018, we believe that all filing requirements were complied with in a timely manner, except in two instances where Form 4s were inadvertently filed late on behalf of two directors to report certain transactions as follows: (i) in April 2018, to report three purchases of shares that were executed by the broker of one of our former directors, Mackey McDonald, on Mr. McDonald’s behalf without his knowledge or direction; and (ii) in June 2019, to report one transaction relating to the transfer of certain shares held in a trust for the benefit of Mr. Pope’s three adult children as a result of their election to exercise control over such shares in accordance with the terms of the trust that held these shares.
BOARD COMMITTEES AND MEMBERSHIP—AUDIT COMMITTEE
The Board established the Audit Committee in accordance with Section 3(a)(58)(A) and Rule 10A-3 under the Exchange Act. The Audit Committee consists entirely of independent directors, and each director meets the independence requirements set forth in the listing standards of Nasdaq, Rule 10A-3 under the Exchange Act and the Audit Committee charter. The Board has determined that each Audit Committee member is able to read and understand fundamental financial statements. In addition, the Board has determined that Ms. Jackson and Mr. Pope are
“
audit committee financial experts” within the meaning of SEC regulations. No Audit Committee member received any payments in 2018 from us other than compensation for service as a director.
BOARD COMMITTEES AND MEMBERSHIP—OPERATIONS AND STRATEGY COMMITTEE
Effective June 5, 2019, the Board established the Operations and Strategy Committee to assist it in overseeing and facilitating the development and implementation of our ongoing operations and corporate strategy. The Operations and Strategy Committee is led by John Cahill, Vice Chairman of the Board, and meets with management regularly to discuss, review and evaluate the development and implementation of our operational objectives and corporate strategy. The Operations and Strategy Committee is comprised of five directors appointed by the Board, based on nominations recommended to the Board by our Nominating and Corporate Governance Committee. Based on its review, the committee shares with management the Board’s expectations for the operations of the company and strategic planning process, makes recommendations to management on areas of improvement, and provides other feedback and guidance to management on behalf of the Board. The Operations and Strategy Committee’s responsibilities also include, among others, reviewing and making recommendations to the Board regarding:
|
•
|
our corporate strategy, performance, and annual capital plan, as well as certain individual capital projects;
|
|
•
|
the impact of external developments and factors, such as any changes in economic and market conditions, competition in the industry, environmental and safety regulations, federal, state and local regulations and technology, on our corporate strategy and its execution;
|
|
•
|
identification of prospects and opportunities for corporate developments and growth initiatives, including acquisitions, divestitures, joint ventures and strategic alliances; and
|
221
|
•
|
implementation of our corporate strategy through corporate developments and growth initiatives, including acquisitions, divestitures, joint ventures and strategic alliances.
|
Item 11. Executive Compensation.
BOARD COMMITTEES AND MEMBERSHIP—COMPENSATION COMMITTEE
Compensation Committee Interlocks and Insider Participation
The Board has determined that all of the directors who served on the Compensation Committee during fiscal year 2018 are independent within the meaning of the Nasdaq listing standards. No member of the Compensation Committee is a current, or during fiscal year 2018 was, a former, officer, or employee of Heinz, Kraft, Kraft Heinz, or any of their subsidiaries. During fiscal year 2018, no member of the Compensation Committee had a relationship that must be described under the SEC rules relating to disclosure of “related person transactions” (for a description of our policy on “related person transactions,” see “Independence and Related Person Transactions”
in Item 13,
Certain Relationships and Related Transactions, and Director Independence
). During fiscal year 2018, none of our executive officers served on the board of directors or compensation committee of any entity that had one or more of its executive officers serving on the Board or the Compensation Committee.
Analysis of Risk in the Compensation Architecture
Annually, the Compensation Committee evaluates the risk profile of our executive and broad-based employee compensation programs. In its evaluation for fiscal year 2018, the Compensation Committee reviewed our executive compensation structure as well as our overarching compensation systems to determine whether our compensation policies and practices encourage our executive officers or other employees to take unnecessary or excessive risks and whether these policies and practices properly mitigate risk. In addition, Willis Towers Watson advised management with respect to the risk assessment of our Performance Bonus Plan.
As described under “Compensation Discussion and Analysis,” our compensation structure is designed to incentivize executives and employees to achieve Kraft Heinz financial and strategic goals as well as individual performance goals that promote long-term stockholder returns. However, certain employees within our procurement organization engaged in misconduct and circumvented controls that included withholding information or directing others to withhold information related to supplier contracts that affected the accounting for certain supplier rebates, incentives, and pricing arrangements, in an attempt to influence the achievement of internal financial targets that became or were perceived to have become increasingly difficult to attain due to changes in our business environment. We are undertaking various remedial efforts outlined in Item 9A,
Controls and Procedures
, and expect to revise the Performance Bonus Plan for 2019 to explicitly state applicable penalties such as score and/or percentage reductions and losses, up to and including ineligibility for and forfeiture of payments under the Performance Bonus Plan for misconduct. We also expect to revise the Performance Bonus Plan for 2019 to require that if the aforementioned misconduct is discovered after the payout under the Performance Bonus Plan, we would be entitled to seek equitable relief to recoup the amounts paid, including without limitation disgorgement, in addition to any other remedies under the law.
Compensation Committee Report
The Compensation Committee oversees our compensation programs on behalf of the Board. In fulfilling its oversight responsibilities, the Compensation Committee reviewed and discussed with management the Compensation Discussion and Analysis included in this Annual Report on Form 10-K. In reliance on that review and discussion, the Compensation Committee recommended to the Board that the Compensation Discussion and Analysis be included in this Annual Report on Form 10-K.
Compensation Committee:
Alexandre Behring, Chair
Jorge Paulo Lemann
Marcel Herrmann Telles
222
COMPENSATION OF NON-EMPLOYEE DIRECTORS
Following the 2015 Merger, the Board approved our non-employee director compensation program, which was designed to be similar to the program in place at Kraft prior to the 2015 Merger. The table below summarizes the annual cash and equity compensation elements in place for our non-employee directors.
|
Compensation Element
(1)
|
Fee
($)
|
||
|
Board Retainer
|
110,000
|
|
|
|
Chairman Retainer
|
250,000
|
|
|
|
Audit Committee Chair Retainer
|
20,000
|
|
|
|
Compensation Committee Chair Retainer
|
20,000
|
|
|
|
Governance Committee Chair Retainer
|
10,000
|
|
|
|
Operations and Strategy Committee Chair Retainer
(2)
|
20,000
|
|
|
|
Stock Grant Value
(3)
|
125,000
|
|
|
|
(1)
|
If a director serves as Chair of multiple committees, he or she receives fees for only one committee. Therefore, Mr. Behring does not receive a retainer for service as Chair of the Governance Committee.
|
|
(2)
|
Effective June 5, 2019, the Board established the Operations and Strategy Committee to assist it in overseeing and facilitating the development and implementation of our ongoing operations and corporate strategy. The Operations and Strategy Committee is led by John Cahill, Vice Chairman of the Board.
|
|
(3)
|
Non-employee directors are awarded Kraft Heinz deferred shares. Although the deferred shares are vested as of the award date, the shares are not distributed until six months following the date the non-employee director ceases to serve on our Board. When dividends are paid on our common stock, we accrue the value of the dividend paid and issue shares equal to the accrued value six months after the director’s departure.
|
Non-employee directors receive an annual stock award that is granted effective immediately following our annual meeting of stockholders. We also pay the non-employee directors cash retainers on a quarterly basis. Non-employee directors also have the option to (i) defer up to 100% of their cash retainers in 25% increments into accounts that mirror certain funds in the Kraft Heinz 401(k) Plan pursuant to the Deferred Compensation Plan for Non-Management Directors or (ii) receive deferred shares annually in lieu of their cash retainer payable in arrears.
Our stock ownership guidelines require non-employee directors who elect to receive compensation for service as directors to hold shares of our common stock in an amount equal to five times the annual Board retainer (equivalent to $550,000) within five years. As all of our current directors have served following the 2015 Merger for less than five years, they are not yet required to meet the stock ownership requirement. We feel strongly that our director compensation program significantly aligns our non-employee directors’ and stockholders’ interests.
For as long as Mr. Zoghbi continues to serve as a Special Advisor at Kraft Heinz, it is anticipated that he will not receive compensation for his services as a director. For a discussion of Mr. Zoghbi’s compensation arrangement, please see “Compensation Arrangement” in Item 13,
Certain Relationships and Related Transactions, and Director Independence
.
The table below presents information regarding the compensation and stock awards that we have paid or granted to our non-employee directors.
2018 Non-Employee Director Compensation Table
|
Name
(1)
|
Fees Earned or
Paid in Cash
(2)
($)
|
Stock Awards
(3)
($)
|
All Other
Compensation
($)
|
Total
($)
|
||||||||
|
Gregory E. Abel
|
110,054
|
|
125,050
|
|
—
|
|
235,104
|
|
||||
|
Alexandre Behring
|
270,000
|
|
125,050
|
|
—
|
|
395,050
|
|
||||
|
John T. Cahill
(4)
|
110,000
|
|
125,050
|
|
500,000
|
|
735,050
|
|
||||
|
Tracy Britt Cool
|
110,054
|
|
125,050
|
|
—
|
|
235,104
|
|
||||
|
Feroz Dewan
|
110,054
|
|
125,050
|
|
—
|
|
235,104
|
|
||||
|
Jeanne P. Jackson
|
110,000
|
|
125,050
|
|
—
|
|
235,050
|
|
||||
|
Jorge Paulo Lemann
|
110,054
|
|
125,050
|
|
—
|
|
235,104
|
|
||||
|
Mackey J. McDonald
|
34,451
|
|
—
|
|
—
|
|
34,451
|
|
||||
|
John C. Pope
|
130,000
|
|
125,050
|
|
—
|
|
255,050
|
|
||||
|
Marcel Herrmann Telles
|
110,000
|
|
125,050
|
|
—
|
|
235,050
|
|
||||
|
Alexandre Van Damme
|
82,500
|
|
125,050
|
|
—
|
|
207,550
|
|
||||
223
|
(1)
|
As noted above, Mr. Zoghbi is an employee of Kraft Heinz. For as long as Mr. Zoghbi continues to serve as a Special Advisor at Kraft Heinz, it is anticipated that he will not receive compensation for his services as a director. For a discussion of Mr. Zoghbi’s compensation arrangement, please see “Compensation Arrangement” in Item 13,
Certain Relationships and Related Transactions, and Director Independence
.
|
|
(2)
|
Includes all retainer fees paid or deferred in exchange for shares pursuant to the Kraft Heinz Deferred Compensation Plan for Non-Management Directors. Non-employee directors do not receive meeting fees. In addition, Mr. Buffett elected to receive no compensation for his service as a director through the end of his term at the 2018 Annual Meeting.
|
|
(3)
|
The amounts shown in this column represent the full grant date fair value of the deferred stock awards granted in 2018, excluding any retainer fees deferred in exchange for shares, as computed in accordance with Financial Accounting Standards Board (“FASB”) Accounting Standards Codification (“ASC”) Topic 718 based on the closing price of Kraft Heinz shares on the grant date ($57.68 on April 23, 2018). The following table shows the aggregate number of stock options held by non-employee directors as of December 29, 2018:
|
|
Name
|
Vested Stock Options
|
|||
|
Gregory E. Abel
|
22,166
|
|
||
|
Alexandre Behring
|
44,333
|
|
||
|
John T. Cahill
|
633,017
|
|
||
|
Tracy Britt Cool
|
22,166
|
|
||
|
Jorge Paulo Lemann
|
22,166
|
|
||
|
Marcel Herrmann Telles
|
22,166
|
|
||
|
(4)
|
Mr. Cahill provides advisory and consulting services to Kraft Heinz related to current and historical finances, relationships with licensors, customers, and vendors, employee matters, product development, marketing and distribution, government affairs, and strategic opportunities. These services are provided pursuant to a consulting agreement entered into between Mr. Cahill and the Company in November 2017. Previously, these services were provided pursuant to an arrangement entered into following the 2015 Merger. Mr. Cahill’s services under the consulting agreement are distinct and separate from his duties as a director. Payments to Mr. Cahill under the consulting agreement are disclosed in the “All Other Compensation” column. For a discussion of the advisory and consulting services provided by Mr. Cahill to Kraft Heinz, please see “Consulting Agreement” in Item 13,
Certain Relationships and Related Transactions, and Director Independence
.
|
COMPENSATION DISCUSSION AND ANALYSIS
Compensation Discussion and Analysis
This Compensation Discussion and Analysis, which we refer to as the “CD&A”, outlines the compensation philosophy and objectives of Kraft Heinz and describes our executive pay programs for fiscal year 2018 and, specifically, for the following Named Executive Officers (also referred to as “NEOs”):
|
Name
|
Title
|
|
|
Bernardo Hees
|
Chief Executive Officer
|
|
|
David Knopf
|
Executive Vice President and Chief Financial Officer
|
|
|
Paulo Basilio
|
Zone President of U.S.
|
|
|
Rafael Oliveira
|
Zone President of EMEA
|
|
|
Rashida La Lande
|
Senior Vice President, Global General Counsel and Head of CSR and Government Affairs; Corporate Secretary
|
|
Executive Summary
The Compensation Committee (the “Committee”) oversees our executive compensation plans and programs. Our programs are designed to complement each other to provide a clear link between what we pay our NEOs and Kraft Heinz’s performance over both short- and long-term periods. The overall program has been designed to accomplish each of the following goals:
|
•
|
Rewarding superior financial and operational performance;
|
|
•
|
Placing a significant portion of compensation at risk if performance goals are not achieved;
|
|
•
|
Aligning the interests of the NEOs with those of our stockholders; and
|
|
•
|
Enabling us to attract, retain, and motivate top talent.
|
Consistent with these goals and as described in further detail below, our compensation program has been designed with a view toward linking a significant portion of each NEO’s compensation to Company and individual performance and the growth in the value of Kraft Heinz.
224
Elements of Compensation Program
As noted above, our compensation program is based on a pay-for-performance philosophy. This section of the CD&A provides an overview of each element of our compensation program and describes both the process for determining such compensation and how such compensation relates to Kraft Heinz’s pay-for-performance philosophy and meritocratic principles. The following table summarizes the primary elements and objectives of our 2018 compensation program for executive officers, including our NEOs.
|
Element
|
Description
|
Primary Objectives
|
||
|
Base Salary
|
Ongoing cash compensation based on the executive officer’s role and responsibilities, individual job performance, and experience.
|
•
Recruitment and retention
|
||
|
Annual Cash Incentive (Performance Bonus Plan)
|
Annual incentive with target award amounts for each executive officer. Actual cash payouts are linked to achievement of annual Company goals and individual performance. For fiscal year 2018, payouts could range from 0%-130% of target depending on the relevant metric.
|
•
Drive top-tier performance
•
Incentivize and reward
|
||
|
Stock Options
|
Stock option awards that cliff vest after five years.
|
•
Drive top-tier performance
•
Align with stockholders’ interests
•
Link realized value entirely to stock price appreciation
•
Retention
|
||
|
Restricted Stock Units (“RSUs”)
|
RSUs that cliff vest after five years may be awarded pursuant to our annual Bonus Swap Program or individual agreements or separate grants with additional conditions.
|
•
Drive top-tier performance
•
Align with stockholders’ interests
•
Retention
|
||
|
Performance Share Units (“PSUs”)
|
Awards that are linked to achievement of multi-year profitability goals. The PSUs pay out in Kraft Heinz common stock after five years, depending on the achievement of the performance objectives and subject to the satisfaction of certain conditions.
|
•
Drive top-tier performance
•
Align with stockholders’ interests
•
Long-term value creation
•
Retention
|
||
Base Salary
Base salary is the principal “fixed” element of executive compensation at Kraft Heinz and for our NEOs. The Committee believes that it is important that each NEO receive a competitive marketplace base salary to provide an appropriate balance between fixed and variable compensation. The initial base salary of each NEO is established in connection with the hiring of such NEO. In establishing base salaries, Kraft Heinz reviews market-based survey data published by the Hay Group and select country-specific surveys, in each case, for informational purposes only. We do not formally benchmark compensation or target compensation levels at any particular percentile of the survey data. The Committee reviews salaries on an annual basis and generally makes any annual changes effective January 1
st
. On occasion, Kraft Heinz may review and adjust an executive’s base salary during the course of the year to account for increased responsibilities, roles, and other factors. The Committee has sole responsibility for the review of Mr. Hees’s compensation. Mr. Hees has primary responsibility for the review of the compensation of his direct reports, including the other NEOs, and provides salary recommendations to the Committee.
The table below shows the annualized 2018 base salary for each NEO.
|
Name
|
Base Salary
($)
|
||
|
Mr. Hees
|
1,000,000
|
|
|
|
Mr. Knopf
|
500,000
|
|
|
|
Mr. Basilio
|
750,000
|
|
|
|
Mr. Oliveira
(1)
|
560,101
|
|
|
|
Ms. La Lande
(2)
|
650,000
|
|
|
|
(1)
|
Mr. Oliveira’s base salary is paid in British pounds. The amount shown in the table above is based on the following 12-month average exchange rate of 0.7499 USD/GBP. Mr. Oliveira’s base salary was increased effective January 1, 2018 in connection with the Committee’s annual base salary review process.
|
|
(2)
|
Ms. La Lande was hired on January 22, 2018.
|
We believe that the base salary review process serves our pay-for-performance philosophy, because base pay increases are generally merit-based and dependent on the NEO’s success and achievement in his or her role. In addition, each NEO’s target annual incentive award opportunity, as described below, is based on a percentage of his or her base salary. Therefore, as NEOs earn merit-based salary increases, their annual incentive award opportunities also increase proportionately.
225
Annual Cash
Performance Bonus Plan
The Performance Bonus Plan (the “PBP”) is designed to motivate and reward employees who contribute positively toward our business strategy and achieve their individual performance objectives. For 2018, the formula for determining a PBP participant’s annual bonus payout was as follows (each item being described in more detail below):
Base Salary x Target Award x Financial Multiplier x Individual Rating = PBP Payout
Due to the difficult operating environment in 2018 and the Company’s financial performance, Messrs. Hees, Knopf, and Basilio asked to forfeit their rights to the amounts payable pursuant to the PBP with respect to fiscal year 2018, and the Committee approved their forfeitures.
Base Salary
For a description of our NEOs’ base salaries, please see “Base Salary” above. Because Ms. La Lande was hired on January 22, 2018, the base salary used for her PBP calculation was prorated to reflect her service for 11 months.
Target Award
Each NEO is granted a target award opportunity prior to the beginning of each year, which is set as a percentage of the NEO’s annual base salary: 300% for Mr. Hees, 175% for Mr. Knopf, 250% for Mr. Basilio, 175% for Mr. Oliveira, and 150% for Ms. La Lande. Due to the nature of Mr. Hees’s role and responsibilities and the significant nature of Mr. Basilio’s role as President of our largest business, their respective Target Award Opportunities were greater than the other NEOs, although, as noted above, due to the difficult operating environment in 2018 and the Company’s financial performance, Messrs. Hees, Knopf, and Basilio asked to forfeit their rights to the amounts payable pursuant to the PBP with respect to fiscal year 2018, and the Committee approved their forfeitures.
Financial Multiplier
Another component of a participant’s PBP calculation is the Company’s (or the relevant Zone’s or business unit’s) financial performance (“Financial Multiplier”). For 2018, the Financial Multiplier was initially designed to be based on Adjusted EBITDA performance and could have ranged from 0% to 150%, with performance between threshold and maximum levels resulting in a payout between 50% and 150%, and with performance below threshold resulting in no payout. In June 2018, our management team established a revised business plan for the second half of the 2018 fiscal year (the “2H Plan”). The 2H Plan was intended to drive net sales (“NSV”) growth by regaining distribution and building velocity to position the Company for long-term financial health and success. In June 2018, in order to (i) capture overall commercial, operational, and financial performance of the Company and (ii) incentivize management to deliver the 2H Plan to position the Company for long-term financial health and success, the Committee exercised its discretion under the PBP to include NSV and Adjusted Net Income as elements of the Financial Multiplier as described below. A participant’s final Financial Multiplier was calculated based on the metrics aligned to the 2H Plan. As described above, Messrs. Hees, Knopf, and Basilio forfeited their respective rights to the amounts payable pursuant to the PBP for 2018. For Mr. Oliveira and Ms. La Lande, the amounts payable calculated pursuant to the metrics aligned to the 2H Plan were greater than if they had been calculated using the metrics as initially designed.
For 2018, for participants evaluated based on global performance, including Messrs. Hees and Knopf and Ms. La Lande, the Financial Multiplier was calculated based on global change in Adjusted Net Income. If performance resulted between the threshold and maximum levels for Adjusted Net Income, the component multiplier would have ranged from 60% to 100%. If the threshold had not been met, the component multiplier would be 0%.
For participants evaluated based on Zone (operating segment) or business unit performance, including Messrs. Basilio and Oliveira, who were evaluated based on U.S. and EMEA Zone performance, respectively, the Financial Multiplier was calculated based 30% on global change in Adjusted Net Income and 70% based on their respective Zone or business unit financial performances. Zone and business unit financial performance was based 75% on change in NSV and 25% on change in Segment Adjusted EBITDA. If performance resulted between the threshold and target levels for NSV, the component multiplier would have ranged from 60% to 100%, depending on the Zone. If performance resulted between the threshold and maximum levels for Segment Adjusted EBITDA, the component multiplier would have ranged from 60% to 130%. For all cases, if the threshold had not been met, the relevant component multiplier would be 0%.
226
|
Performance Metric
*
|
Threshold
|
Target
|
Maximum
|
Actual
|
% of Target
|
||||||||||
|
Global Adjusted Net Income Performance
(1)
|
(3.5
|
)%
|
3.4
|
%
|
10.2
|
%
|
(3.0
|
)%
|
62
|
%
|
|||||
|
U.S. Segment Adjusted EBITDA Performance
|
(6.4
|
)%
|
(3.0
|
)%
|
0.4
|
%
|
(11.5
|
)%
|
—
|
%
|
|||||
|
U.S. NSV Performance
|
(0.9
|
)%
|
0.2
|
%
|
N/A
|
|
(0.6
|
)%
|
75
|
%
|
|||||
|
EMEA Segment Adjusted EBITDA Performance
(2)
|
8.1
|
%
|
12.3
|
%
|
16.4
|
%
|
2.2
|
%
|
60
|
%
|
|||||
|
EMEA NSV Performance
|
1.1
|
%
|
3.3
|
%
|
N/A
|
|
2.6
|
%
|
90
|
%
|
|||||
*Growth rates reflect budget foreign exchange rates and exclude the impacts of (i) our Venezuelan subsidiary, due to the highly inflationary environment, (ii) our 50.1% interest in our South African subsidiary, which was sold in May 2018, and (iii) with respect to NSV, fluctuations for dairy commodities that impact pricing terms under related contracts. Adjusted Net Income is defined as net income/(loss) excluding, when they occur, the impacts of integration and restructuring expenses, deal costs, unrealized losses/(gains) on commodity hedges, impairment losses, losses/(gains) on the sale of a business, other losses/(gains) related to acquisitions and divestitures (e.g., tax and hedging impacts), nonmonetary currency devaluation (e.g., remeasurement gains and losses), and U.S. Tax Reform discrete income tax expense/(benefit), and including, when they occur, adjustments to reflect preferred stock dividend payments on an accrual basis. Segment Adjusted EBITDA is defined as net income/(loss) from continuing operations before interest expense, other expense/(income), net, provision for/(benefit from) income taxes, and depreciation and amortization (excluding integration and restructuring expenses); in addition to these adjustments, we exclude, when they occur, the impacts of integration and restructuring expenses, deal costs, unrealized gains/(losses) on commodity hedges (the unrealized gains and losses are recorded in general corporate expenses until realized; once realized, the gains and losses are recorded in the applicable segment’s operating results), impairment losses, gains/(losses) on the sale of a business, other gains/(losses) related to acquisitions and divestitures (e.g., tax and hedging impacts), nonmonetary currency devaluation (e.g., remeasurement gains and losses), and equity award compensation expense (excluding integration and restructuring expenses).
|
(1)
|
When the Committee certified the achievement of performance with respect to Adjusted Net Income performance, fiscal year 2018 consolidated financial statements were still being prepared. Given the immateriality of any anticipated adjustments, the Committee certified and approved performance at a maximum level of 64%, subject to downward adjustment in management’s discretion based on the preparation of the 2018 consolidated financial statements.
|
|
(2)
|
When the Committee certified performance with respect to EMEA Segment Adjusted EBITDA performance, the Committee certified and approved performance at an amount excluding the impact of the Middle East and Africa (“MEA”) due to one-off inventory amounts related to previous years when MEA was a part of a different operating segment than EMEA.
|
In 2018, all NEOs exceeded threshold on their Individual Rating and Financial Multiplier components of the PBP calculation. The Committee granted certain members of management discretion to increase or decrease the final PBP payouts of the other NEOs with up to a 20% variance compared to the amounts as calculated based on the Base Salaries, Target Awards, Individual Ratings, and Financial Multipliers described above. Had they not forfeited their rights to the payment, Mr. Hees would have earned a PBP payout of $1,060,000, Mr. Knopf would have earned a PBP payout of $500,000, and Mr. Basilio would have earned a PBP payout of $1,023,000. Mr. Oliveira received a PBP payout of $733,854, and Ms. La Lande received a PBP payout of $543,000. Mr. Hees would have received a decreased discretionary payout related to the longer-term business initiatives reflected in his MBOs. Messrs. Knopf and Basilio would have received, and Mr. Oliveira and Ms. La Lande did receive, an increased discretionary payout related to top line growth results and/or strong leadership of important initiatives in his or her respective area.
Individual Rating
The foundation of each participant’s Individual Rating is our MBO process. At the beginning of each year, the Committee establishes a series of performance goals, or MBOs, that are established based on the Company’s corporate strategy, and performance goals are then “cascaded” throughout the organization. First, the Committee establishes MBOs for Mr. Hees. Then, in consultation with the Committee, Mr. Hees establishes corresponding MBOs for each of his direct reports, including the other NEOs. His direct reports, in turn, establish MBOs for their direct reports. This cascading process allows the Company to drive initiatives that are aligned throughout the organization.
Each NEO has an MBO comprised of multiple goals or objectives. For each goal, there are one or more “Key Performance Indicators,” or KPIs. KPIs are the quantitative or qualitative metrics used to track achievement of the goals. We have set forth below a summary of the 2018 MBO goals for each of the NEOs and the overall performance ascribed by the Committee for each NEO based on his or her performance. None of the individual KPIs are material to understanding how the PBP operated in 2018.
Bernardo Hees: Mr. Hees had three MBO goals. These were: (i) “Deliver Kraft Heinz Financial Results”, which was evaluated based on Kraft Heinz’s financial performance in NSV and Adjusted Net Income, (ii) “Strengthen Innovation and Develop Digital Strategy/Go-to-Market”, which was evaluated based on the innovation pipeline for 2019 and 2020 and E-commerce and digital innovation, and (iii) “Deliver New Projects to Sustain the Business”, which was evaluated based on the supply chain planning system and business expansion. Based on Mr. Hees’s performance, he was given an overall performance score of 66%.
David Knopf: Mr. Knopf had three MBO goals. These were (i) “Deliver Kraft Heinz Financial Results”, which was evaluated based on Kraft Heinz’s financial performance in Adjusted Net Income and operating free cash flow, (ii) “Increase KHC Financial Efficiency”, which was evaluated based on tax performance compared to budget and project-specific goals, and (iii) “Deliver New Projects to Sustain the Business”, which was evaluated based on business expansion and project-specific goals. Based on Mr. Knopf's performance, he was given an overall performance score of 82%.
227
Paulo Basilio: Mr. Basilio had three MBO goals. These were (i) “Deliver Kraft Heinz Results”, which was evaluated based on case fill rates and U.S. financial performance in contribution margin and NSV, (ii) “Ensure Successful Marketing and Robust R&D Pipeline,” which was evaluated based on market share and the innovation pipeline for 2019 in the U.S. Zone, and (iii) “Deliver New Projects to Foster the Business”, which was evaluated based on initiatives relating to Kraft Heinz’s Springboard platform. Based on Mr. Basilio’s performance, he was given an overall performance score of 84%.
Rafael Oliveira: Mr. Oliveira had three MBO goals. These were (i) “Deliver Kraft Heinz EMEA Financial Results,” which was evaluated based on EMEA financial performance in contribution margin and NSV, (ii) “Ensure Successful Marketing and Robust R&D Pipeline,” which was evaluated based on market share and the innovation pipeline for 2019 in the EMEA Zone, and (iii) “Deliver New Projects to Foster the Business,” which was evaluated based on foodservice growth in EMEA and NSV growth in MEA. Based on Mr. Oliveira’s performance, he was given an overall performance score of 84%.
Rashida La Lande: Ms. La Lande had three MBO goals. These were (i) “Deliver Effective and Efficient Legal Services,” which was evaluated based on project-specific goals and legal victories, financial and EBITDA partnerships with the business, and legal victories from ongoing litigation, (ii) “Protect and Promote our Innovations and Brands,” which was evaluated based on Board projects and crisis management design and preparation for the U.S. and Canada, and (iii) “Ethics and Compliance” which was evaluated based on the Company’s ethics and compliance initiatives worldwide. Based on Ms. La Lande’s performance, she was given an overall performance score of 95%.
Annual Bonus Swap Program - Restricted Stock Units
As part of its commitment to fostering an ownership mentality, Kraft Heinz permits certain employees to participate in an annual bonus swap program (the “Bonus Swap Program”). Under the Bonus Swap Program, eligible employees can elect to invest a portion of their annual PBP payout in our common stock (we refer to these purchased shares as “Investment Shares”) and leverage that investment through the issuance of matching RSUs (we refer to these RSUs as “Matching RSUs”). The Matching RSUs cliff vest on the fifth anniversary of the date of grant subject to continued employment and the retention of the Investment Shares as described below. To participate in the Bonus Swap Program, eligible employees can elect to use 0%, 25% or 50% of their calculated net bonus (after deducting an amount based on a normalized tax rate depending on country of residence) to purchase Investment Shares. The number of Investment Shares purchased is calculated as the product of the calculated net bonus and the swap election percentage, divided by the closing price reported on the Nasdaq on the date of purchase:
|
Calculated Net Bonus
|
x
|
Swap Election %
|
=
|
# of Investment Shares
|
||
|
Nasdaq Closing Price
|
||||||
The number of Matching RSUs a participant received in 2018 was based on (1) the participant’s gross bonus payout in 2018 relating to the 2017 fiscal year (before-tax) and (2) a discretionary multiplier associated with the participant’s level in the organization and his or her investment election percentage.
In 2018, only Mr. Oliveira participated in the Bonus Swap Program, as he was the only NEO to receive a PBP bonus payment related to 2017. The following table sets forth, for Mr. Oliveira, the portion of his fiscal 2017 bonus used to purchase Investment Shares (the “Conversion Amount”), the number of Investment Shares purchased, and the number of Matching RSUs granted to him (which Matching RSUs were granted in 2018):
|
Name
|
Conversion Amount
($)
|
Investment Shares
(#)
|
2017 Bonus Matching
RSUs granted in 2018
(#)
|
|||
|
Mr. Oliveira
|
121,807
|
1,821
|
6,622
|
|||
Under our Bonus Swap Program, so long as the Matching RSUs remain unvested, if an employee transfers any of the related Investment Shares, he or she immediately forfeits a proportional amount of the corresponding Matching RSUs. The Committee believes that the Bonus Swap Program as a whole and the forfeitability of the Matching RSUs in particular, strongly motivates eligible employees to hold Kraft Heinz common stock for the long-term, further emphasizing a long-term view in creating stockholder value. Prior to 2016, the Company issued matching stock options rather than Matching RSUs in the Bonus Swap Program.
228
Discretionary Equity Awards
From time to time, we may make discretionary equity awards to employees. Historically, these discretionary awards have been made in the form of stock options. These stock options are granted with an exercise price based on the fair market value of a Kraft Heinz share on the grant date and cliff vest after a five-year period. In 2018, the Committee approved discretionary option awards of 44,850 stock options to Mr. Knopf and 52,325 stock options to Ms. La Lande in order to continue to align a portion of their long-term incentive compensation directly with stockholders’ interests. The options have an exercise price of $66.89 and will cliff vest on March 1, 2023, subject to continued employment through that date.
In March 2018, the Company issued additional PSUs to a limited number of employees deemed key to achievement of our long-term goals, including all of our NEOs, in order to place a significant portion of their compensation at risk if performance goals are not achieved. These PSUs could be earned over a three-year performance period based on Kraft Heinz’s achievement of financial performance metrics based on Adjusted EBITDA for the period beginning in January 2018 and ending at the end of December 2020. Once earned, to promote retention of key talent, the PSUs will remain subject to a continued service requirement through March 1, 2023.
As of December 29, 2018, due to the performance of our business, the expected payout of the PSUs was determined to be zero.
In March 2018, in order to further retain and motivate top talent and align the interests of management with those of the Company’s stockholders, the Company also issued RSUs, separately from the Bonus Swap Program, to a limited number of employees deemed key to achievement of our long-term goals, including all of our NEOs. These RSUs will cliff vest on March 1, 2023, subject to continued employment.
Additional information about the stock option, PSU, and RSU awards is provided in the 2018 Grants of Plan Based Awards Table and the 2018 Outstanding Equity Awards at Fiscal Year-End Table below.
Benefits and Perquisites
In addition to base salary, our PBP, and long-term equity grants, we provided and continue to provide certain executive benefit programs to our NEOs. Kraft Heinz maintains defined contribution retirement plans to allow employees to save for retirement in a tax-efficient manner. These plans are broadly available to eligible employees and do not discriminate in favor of the NEOs or other members of senior management. None of the NEOs participate in any defined benefit pension plans, non-qualified deferred compensation plans, or supplemental retirement or executive savings plans.
Kraft Heinz also provides health and welfare insurance benefits to employees, including the NEOs. These benefits include life, disability, and health insurance benefit plans that are broadly available to eligible employees and do not discriminate in favor of the NEOs or other members of senior management.
From time to time, Kraft Heinz provides limited perquisite benefits. For example, we provide limited tax advisory services, immigration benefits, and reimbursement of certain relocation expenses for business reasons. Kraft Heinz provides other limited perquisite benefits, which are detailed in the 2018 Summary Compensation Table.
Minimum Stock Ownership Guidelines
Our compensation programs promote a strong alignment of the interests of our executives with those of our stockholders. For example, in order to participate in our Bonus Swap Program, each participant must use a significant portion of his or her bonus to purchase our common stock. In 2016, we adopted minimum stock ownership guidelines, which require our NEOs to attain levels of beneficial stock ownership measured based on a multiple of his or her annual base salary, as set forth below:
|
Role
|
Minimum Ownership
|
|
|
CEO
|
5x Base Salary
|
|
|
Other Named Executive Officers
|
3x Base Salary
|
|
The stock ownership guidelines require NEOs to attain levels of beneficial stock ownership within five years from the later of December 8, 2016 and the date of the NEO’s appointment to a position subject to the guidelines. For more details on the stock ownership of our NEOs, please refer to “Ownership of Equity Securities.”
229
Clawback, Anti-Hedging and Anti-Pledging Policies
Our stock option, PSU, and RSU award agreements provide that, in certain circumstances, the award and any proceeds or other benefits a participant may receive may be subject to forfeiture and/or repayment to Kraft Heinz to the extent required to comply with any requirements imposed under applicable laws and/or the rules. Further, if a participant receives any amount in excess of what he or she should have received under the terms of the award for any reason (including without limitation by reason of a financial restatement, mistake in calculations, or administrative error), all as determined by the Committee, then he or she will be required to promptly repay any such excess amount to Kraft Heinz. Our insider trading policy also limits the timing and types of transactions in Kraft Heinz securities by executive officers, including our NEOs. Among other restrictions, the policy prohibits holding Kraft Heinz securities in a margin account or pledging Kraft Heinz securities as collateral for a loan without advance written notice to the Corporate Secretary. In addition, the policy prohibits short-selling Kraft Heinz securities, transacting in puts, calls, or other derivatives on Kraft Heinz securities, or hedging transactions on Kraft Heinz securities without prior approval from the Corporate Secretary.
Impact of Tax and Accounting Policies
When determining total direct compensation packages, the Committee considers all factors that may have an impact on our financial performance, including tax and accounting rules and regulations under Section 162(m) of the Code. Section 162(m) of the Code generally limits our ability to deduct compensation paid to “covered employees” (as defined in the Code) to the extent such compensation exceeds $1 million to such employee in any fiscal year. For taxable years beginning prior to January 1, 2018, there was a performance-based exception to this rule that permitted us to deduct compensation that met certain qualifying performance-based criteria. This performance-based exception no longer applies for taxable years beginning after December 31, 2017, such that compensation paid to our “covered employees” in excess of $1 million will not be deductible unless it qualifies for limited transition relief applicable to certain arrangements in place as of November 2, 2017.
Despite the Committee’s intentions to structure the Company’s incentive programs for taxable years commencing prior to January 1, 2018 in a manner intended to be exempt from the deduction limitations of Section 162(m), there can be no assurance that we will be able to take advantage of the limited transition relief and satisfy the requirements for such exemption. Further, the Committee reserves the right to modify compensation that was initially intended to be exempt from Section 162(m) if it determines that such modifications are consistent with the Company’s business needs.
230
EXECUTIVE COMPENSATION TABLES
Summary Compensation Table
|
Name and
Principal Position
|
Year
|
Salary
($)
|
Bonus
($)
|
Stock Awards
(2)(3)
($)
|
Option Awards
(4)
($)
|
Non-Equity Incentive Plan Compensation
(5)
($)
|
Change in Pension Value and Non-qualified Deferred Compensation Earnings
($)
|
All Other Compensation
(6)
($) |
Total Compensation
($)
|
Total Compensation as Adjusted from SEC Rules
(7)
($)
|
|||||||||||||||||||
|
Bernardo Hees,
Chief Executive Officer
(1)
|
2018
|
1,000,000
|
|
—
|
|
25,483,713
|
|
—
|
|
1,060,000
|
|
—
|
|
149,136
|
|
27,692,849
|
|
1,149,136
|
|
||||||||||
|
2017
|
1,000,000
|
|
—
|
|
2,730,557
|
|
—
|
|
—
|
|
—
|
|
463,622
|
|
4,194,179
|
|
4,194,196
|
|
|||||||||||
|
2016
|
1,000,000
|
|
—
|
|
1,449,990
|
|
—
|
|
2,730,574
|
|
—
|
|
92,027
|
|
5,272,591
|
|
2,542,027
|
|
|||||||||||
|
David Knopf,
EVP and Chief Financial Officer
|
2018
|
500,000
|
|
—
|
|
5,946,213
|
|
497,835
|
|
500,000
|
|
—
|
|
28,177
|
|
7,472,225
|
|
528,176
|
|
||||||||||
|
2017
|
288,461
|
|
—
|
|
2,833,532
|
|
327,515
|
|
—
|
|
—
|
|
27,714
|
|
3,477,222
|
|
562,066
|
|
|||||||||||
|
Paulo Basilio,
Zone President of U.S.
|
2018
|
750,000
|
|
—
|
|
16,989,123
|
|
—
|
|
1,023,000
|
|
—
|
|
83,699
|
|
18,845,822
|
|
833,699
|
|
||||||||||
|
2017
|
623,077
|
|
—
|
|
1,499,909
|
|
—
|
|
—
|
|
79,840
|
|
2,202,826
|
|
2,202,917
|
|
|||||||||||||
|
2016
|
600,000
|
|
—
|
|
599,924
|
|
—
|
|
1,500,000
|
|
—
|
|
48,656
|
|
2,748,580
|
|
1,248,656
|
|
|||||||||||
|
Rafael Oliveira,
Zone President of EMEA
(8)
|
2018
|
560,101
|
|
—
|
|
8,937,536
|
|
733,854
|
|
—
|
|
101,918
|
|
10,333,408
|
|
1,074,047
|
|
||||||||||||
|
2017
|
450,657
|
|
—
|
|
303,273
|
|
409,397
|
|
412,029
|
|
—
|
|
166,835
|
|
1,742,191
|
|
919,726
|
|
|||||||||||
|
Rashida La Lande, SVP, Global General Counsel & Head of CSR and Government Affairs; Corporate Secretary
|
2018
|
612,500
|
|
1,000,000
|
|
2,973,163
|
|
580,808
|
|
543,000
|
|
—
|
|
86,910
|
|
5,796,381
|
|
1,699,410
|
|
||||||||||
|
(1)
|
On April 22, 2019, we announced that Mr. Hees would leave Kraft Heinz in 2019. Mr. Hees forfeited the PSU and RSU awards granted in 2018 (aggregate grant date fair value of $25,483,713) due to the performance of the business and his decision to leave the company, respectively. Therefore, the Total Compensation as Adjusted from SEC Rules paid to Mr. Hees in 2018 was $1,149,136.
|
|
(2)
|
The amounts shown in this column include the aggregate grant date fair value, computed in accordance with FASB ASC Topic 718, of (i) Matching RSUs, (ii) PSUs, and (iii) RSUs granted to the NEOs.
As of December 29, 2018, due to the performance of our business, the expected payout of the PSUs was determined to be zero.
For a discussion of the assumptions made in the valuation of the awards in this column, see Note 12,
Employees’ Stock Incentive Plans
, in Item 8,
Financial Statements and Supplementary Data
. Under our Bonus Swap Program, the Matching RSUs for the NEOs were calculated as the product of the calculated gross bonus and the swap election percentage, divided by the closing price reported on the Nasdaq on the date of purchase. For a discussion of the terms applicable to the Matching RSUs, PSUs, and RSUs as well as vesting, forfeiture, and other terms, see “Elements of Compensation Program” in the CD&A.
|
|
(3)
|
As of December 29, 2018, due to the performance of our business, the expected payout of the PSUs was determined to be zero.
For Mr. Hees, the grant date fair value of the PSU award on March 1, 2018 was $17,838,582. For Mr. Knopf, the grant date fair value of the PSU award on March 1, 2018 was $4,162,349. For Mr. Basilio, the grant date fair value of the PSU award on March 1, 2018 was $11,892,369. For Mr. Oliveira, the grant date fair value of the PSU award on March 1, 2018 was $5,946,213. For Ms. La Lande, the grant date fair value of the PSU award on March 1, 2018 was $1,486,582. The grant date fair value for the PSU award granted on March 1, 2018 was $56.82.
|
For Mr. Hees, the grant date value of the RSU award on March 1, 2018 was $7,645,131. On April 22, 2019, we announced that Mr. Hees would leave Kraft Heinz in 2019. As a result of his departure, Mr. Hees will forfeit the RSU award granted in 2018. For Mr. Knopf, the grant date value of the RSU award on March 1, 2018 was $1,783,864. For Mr. Basilio, the grant date value of the RSU award on March 1, 2018 was $5,096,754. For Mr. Oliveira, the grant date value of the RSU award on March 1, 2018 was $2,548,377. For Ms. La Lande, the grant date value of the RSU award on March 1, 2018 was $1,486,582. The grant date fair value for the RSU awards was $66.89 for award granted on March 1, 2018 under the bonus swap program and was $56.82 for non-dividend eligible award granted on March 1, 2018.
|
(4)
|
Amounts shown in this column represent the aggregate grant date fair value of discretionary option awards granted to the NEOs. The values of the stock option awards are equal to their grant date fair value as computed in accordance with FASB ASC Topic 718. For a discussion of the assumptions made in the valuation of the stock option awards in this column, see Note 12,
Employees’ Stock Incentive Plans
, in Item 8,
Financial Statements and Supplementary Data
.
|
231
|
(5)
|
Amounts reported in this column reflect compensation earned for 2018 performance under our PBP. As discussed in the CD&A and consistent with our pay for performance philosophy, due to the difficult operating environment in 2018 and the Company’s financial performance, Messrs. Hees, Knopf, and Basilio asked to forfeit their rights to the amounts payable pursuant to the PBP with respect to fiscal year 2018 and the Committee approved their forfeitures. The bonuses were paid in cash to each other NEO after the end of 2018.
|
|
(6)
|
For Mr. Hees, represents dividend equivalents that accrued on Matching RSUs ($128,176), a matching contribution to the Kraft Heinz 401(k), and basic life insurance coverage. For Mr. Knopf, represents a matching contribution to the Kraft Heinz 401(k), dividend equivalents that accrued on Matching RSUs, and basic life insurance coverage. For Mr. Basilio, represents dividend equivalents that accrued on Matching RSUs ($63,609), a matching contribution to the Kraft Heinz 401(k), and basic life insurance coverage. For Mr. Oliveira, represents dividend equivalents that accrued on Matching RSUs ($42,298), tax support, and a matching contribution to the UK contribution scheme. For Ms. La Lande, represents payment for relocation expenses ($66,664), a matching contribution to the Kraft Heinz 401(k), and basic life insurance coverage.
|
|
(7)
|
To supplement the SEC-required disclosure in the other columns of the 2018 Summary Compensation Table, we have included this additional column, which shows “Total Compensation as Adjusted from SEC Rules” representing the portion of the “Total Compensation” available to each NEO in each of the years shown. We are presenting this supplemental column to show how the Committee views the NEOs’ compensation for each of the years shown. The “Total Compensation” column as calculated under SEC rules includes several items that are not necessarily reflective of compensation available to the NEOs in a particular year. Amounts reported in the “Total Compensation as Adjusted from SEC Rules” column differ substantially from the amounts determined under SEC rules as reported in the “Total Compensation” column. “Total Compensation as Adjusted from SEC Rules” is not a substitute for “Total Compensation.” “Total Compensation as Adjusted from SEC Rules” represents: (1) “Total Compensation,” as calculated under applicable SEC rules, minus (2) the aggregate grant date fair value of equity awards (as reflected in the “Stock Awards” and “Option Awards” columns), and plus (3) the value realized from any exercise of stock options and the vesting of RSUs or PSUs before payment of any applicable withholding taxes and brokerage commissions (as reflected in the Option Exercises and Stock Vested tables of the proxy statements for the respective years), including the value realized from the payment of any dividend equivalents. In addition, “Total Compensation as Adjusted from SEC Rules” reflects any bonus paid in each of the years shown, whereas the “Total Compensation” column calculated pursuant to the SEC rules reflects any bonus earned for the applicable years (regardless of when paid and not taking into account any subsequent forfeitures thereof).
|
|
(8)
|
Foreign currency conversion based on daily average for calendar year 2018. Mr. Oliveira’s base salary is paid in British pounds. The amounts shown in the table above are based on the following 12-month average exchange rate: British pounds (.7499 USD/GBP).
|
232
Grants of Plan-Based Awards Table
The following table sets forth information regarding the grant of plan-based awards for each of the NEOs in 2018. As described in the CD&A, due to the difficult operating environment in 2018 and the Company’s financial performance, Messrs. Hees, Knopf, and Basilio have forfeited their rights to the amounts payable pursuant to the PBP with respect to fiscal year 2018.
|
Estimated Future Payouts Under
Non-Equity Incentive Plan Awards |
Estimated Future Payouts Under Equity Incentive Plan Awards
(4)
|
All Other Stock Awards: Number of Shares of Stock or Units
(#)
|
All Other Option Awards: Number of Securities Under lying Options
(#)
|
Exercise Price of Option Awards
($/Share)
|
Grant Date Fair Value of Stock and Option Awards
($)
|
|||||||||||||||||||||||||||||
|
Name
|
Grant Date
(3)
|
Grant
Type
|
Threshold
($)
|
Target
($)
|
Maximum
($)
|
Threshold
(#)
|
Target
(#)
|
Maximum
(#)
|
||||||||||||||||||||||||||
|
Mr. Hees
|
PBP
(1)
|
900,000
|
|
2,700,000
|
|
3,000,000
|
|
|||||||||||||||||||||||||||
|
3/1/18
|
RSUs
(2)
|
134,550
|
|
7,645,131
|
|
|||||||||||||||||||||||||||||
|
3/1/18
|
PSUs
(5)
|
251,159
|
|
313,949
|
|
376,739
|
|
17,838,582
|
|
|||||||||||||||||||||||||
|
Mr. Knopf
|
PBP
(1)
|
262,500
|
|
787,500
|
|
875,000
|
|
|||||||||||||||||||||||||||
|
3/1/18
|
RSUs
|
31,395
|
|
1,783,864
|
|
|||||||||||||||||||||||||||||
|
3/1/18
|
PSUs
(5)
|
58,604
|
|
73,255
|
|
87,906
|
|
4,162,349
|
|
|||||||||||||||||||||||||
|
3/1/18
|
Options
|
44,850
|
|
66.89
|
|
497,835
|
|
|||||||||||||||||||||||||||
|
Mr. Basilio
|
PBP
(3)
|
562,500
|
|
1,687,500
|
|
1,875,000
|
|
|||||||||||||||||||||||||||
|
3/1/18
|
RSUs
|
89,700
|
|
5,096,754
|
|
|||||||||||||||||||||||||||||
|
3/1/18
|
PSUs
(5)
|
167,439
|
|
209,299
|
|
251,159
|
|
11,892,369
|
|
|||||||||||||||||||||||||
|
Mr. Oliveira
|
PBP
(4)
|
319,783
|
|
950,772
|
|
1,031,636
|
|
|||||||||||||||||||||||||||
|
3/1/18
|
Matching
RSUs
|
6,622
|
|
442,946
|
|
|||||||||||||||||||||||||||||
|
3/1/18
|
RSUs
|
44,850
|
|
2,548,377
|
|
|||||||||||||||||||||||||||||
|
3/1/18
|
PSUs
(5)
|
83,720
|
|
104,650
|
|
125,580
|
|
5,946,213
|
|
|||||||||||||||||||||||||
|
Ms. La Lande
|
PBP
(1)
|
275,625
|
|
826,875
|
|
918,750
|
|
|||||||||||||||||||||||||||
|
3/1/18
|
RSUs
|
26,163
|
|
1,486,582
|
|
|||||||||||||||||||||||||||||
|
3/1/18
|
PSUs
(5)
|
20,930
|
|
26,163
|
|
31,396
|
|
1,486,582
|
|
|||||||||||||||||||||||||
|
3/1/18
|
Options
|
52,325
|
|
66.89
|
|
580,808
|
|
|||||||||||||||||||||||||||
|
(1)
|
For Messrs. Hees and Knopf and Ms. La Lande, the PBP is based on global change in Adjusted Net Income and has a Threshold assumption of 60% and Maximum assumption of 100%. Threshold amounts also assume a minimum individual MBO Score of 50%, while Target and Maximum amounts assume an individual MBO Score of 100%. The actual payment would be based on achievement of individual and financial performance goals. Annual incentive award payments, to the extent not forfeited, were made in cash to each NEO after the end of 2018 based on actual results achieved. Actual amounts earned are reflected in the Summary Compensation Table under Non-Equity Incentive Plan Compensation.
|
|
(2)
|
On April 22, 2019, we announced that Mr. Hees would leave Kraft Heinz in 2019. As a result of his departure, Mr. Hees will forfeit the RSU award granted in 2018.
|
|
(3)
|
For Mr. Basilio, the US Zone PBP is based 75% on change in U.S. NSV and 25% on change in U.S. Segment Adjusted EBITDA and has a Threshold assumption of 60%, and Maximum assumption of 90% for NSV change and 130% for Segment Adjusted EBITDA change. Threshold amounts also assume an individual MBO Score of 50%, while Target and Maximum amounts assume an individual MBO Score of 100%. Mr. Basilio’s actual payment is based on achievement of individual goals and would receive a weighting on financial performance split by 70% of the US Zone metrics plus 30% of the global metrics. Annual incentive award payments, to the extent not forfeited, were made in cash to each NEO after the end of 2018 based on actual results achieved. Actual amounts earned are reflected in the Summary Compensation Table under Non-Equity Incentive Plan Compensation.
|
|
(4)
|
For Mr. Oliveira, the EMEA Zone PBP is based 75% on change in EMEA NSV and 25% on change in EMEA Segment Adjusted EBITDA and has a Threshold assumption of 70% for NSV change and 60% for Segment Adjusted EBITDA change, and Maximum assumption of 100% for NSV change and 130% for Segment Adjusted EBITDA change. Threshold amounts also assume an individual MBO Score of 50%, while Target and Maximum amounts assume an individual MBO Score of 100%. Mr. Oliveira’s actual payment is based on achievement of individual goals and will receive a weighting on financial performance split by 70% of the EMEA Zone metrics plus 30% of the global metrics. Annual incentive award payments, to the extent not forfeited, were made in cash to each NEO after the end of 2018 based on actual results achieved. Actual amounts earned are reflected in the Summary Compensation Table under Non-Equity Incentive Plan Compensation.
|
233
|
(5)
|
The PSUs granted on March 1, 2018 were granted under the 2016 Omnibus Incentive Plan. The target number of shares shown in the table reflects the number of shares of common stock that will be earned if each of the performance metrics are achieved at target levels by the end of 2020. If 80% of the performance metrics are not achieved by the end of 2020, the target and threshold opportunities roll over to 2021 with a 20 percentage point payout penalty. Actual shares awarded will vest on March 1, 2023 provided the awardee also meets certain requirements. Dividends are not earned on the PSUs.
As of December 29, 2018, due to the performance of our business, the expected payout of the PSUs was determined to be zero.
|
Outstanding Equity Awards at Fiscal Year-End Table
The following table sets forth each NEO’s outstanding equity awards, as of the end of 2018.
|
Option Awards
|
Stock Awards
|
|||||||||||||||||||||
|
Name
|
Grant Date
|
Grant Type
|
Number
of Securities
Underlying
Unexercised
Options
Exercisable
(#)
|
Number
of Securities
Underlying
Unexercised
Options
Unexercisable
(#)
|
Option
Exercise
Price
($)
|
Option
Expiration
Date
|
Number of
Shares
or
Units of
Stock
That
Have
Not
Vested
(#)
|
Market
Value
of
Shares
or
Units of
Stock
That
Have
Not
Vested
(2)
($)
|
Equity
Incentive
Plan
Awards:
Number of
Unearned
Shares,
Units or
Other
Rights
That
Have Not
Vested
(#)
|
Equity Incentive
Plan Awards:
Market or
Payout
Value of Unearned Shares,
Units or Other
Rights That Have Not Vested
(2)
($)
|
||||||||||||
|
Mr. Hees
|
3/1/18
|
RSUs
|
134,550
|
(12)
|
5,862,344
|
(14)
|
||||||||||||||||
|
3/1/18
|
PSUs
|
251,159
|
(13)
|
10,943,006
|
(13)
|
|||||||||||||||||
|
3/1/17
|
RSU-match
|
32,118
|
(1)
|
1,399,381
|
||||||||||||||||||
|
3/1/16
|
RSU-match
|
20,638
|
(1)
|
899,198
|
||||||||||||||||||
|
8/20/15
|
Stock Options
|
202,021
|
|
(3)
|
74.25
|
8/20/25
|
||||||||||||||||
|
2/12/15
|
Option-match
|
71,819
|
|
(4)
|
30.46
|
2/12/25
|
||||||||||||||||
|
2/14/14
|
Option-match
|
|
|
98,951
|
|
(5)
|
22.56
|
2/14/24
|
||||||||||||||
|
7/1/13
|
Stock Options
|
1,329,996
|
(6)
|
22.56
|
7/1/23
|
|||||||||||||||||
|
Mr. Knopf
|
3/1/18
|
RSUs
|
31,395
|
(12)
|
1,367,880
|
|||||||||||||||||
|
3/1/18
|
PSUs
|
58,604
|
(13)
|
2,553,376
|
||||||||||||||||||
|
3/1/18
|
Stock Options
|
44,850
|
|
(11)
|
66.89
|
3/1/28
|
||||||||||||||||
|
3/1/17
|
RSU-match
|
2,530
|
(1)
|
110,232
|
||||||||||||||||||
|
3/1/17
|
Stock Options
|
21,875
|
|
(7)
|
91.43
|
3/1/27
|
||||||||||||||||
|
3/1/17
|
PSUs
|
19,687
|
(8)
|
857,771
|
||||||||||||||||||
|
3/1/16
|
RSU-match
|
967
|
(1)
|
42,132
|
||||||||||||||||||
|
8/20/15
|
Stock Options
|
67,341
|
|
(3)
|
74.25
|
8/20/25
|
||||||||||||||||
|
Mr. Basilio
|
3/1/18
|
RSUs
|
89,700
|
(12)
|
3,908,229
|
|||||||||||||||||
|
3/1/18
|
PSUs
|
167,439
|
(13)
|
7,295,326
|
||||||||||||||||||
|
3/1/17
|
RSU-match
|
17,643
|
(1)
|
768,706
|
||||||||||||||||||
|
3/1/16
|
RSU-match
|
8,539
|
(1)
|
372,044
|
||||||||||||||||||
|
8/20/15
|
Stock Options
|
134,681
|
|
(3)
|
74.25
|
8/20/25
|
||||||||||||||||
|
2/12/15
|
Option-match
|
41,377
|
|
(4)
|
30.46
|
2/12/25
|
||||||||||||||||
|
2/14/14
|
Option-match
|
|
|
38,257
|
|
(5)
|
22.56
|
2/14/24
|
||||||||||||||
|
7/1/13
|
Stock Options
|
531,998
|
(6)
|
22.56
|
7/1/23
|
|||||||||||||||||
234
|
Mr. Oliveira
|
3/1/18
|
RSUs
|
44,850
|
(12)
|
1,954,115
|
|||||||||||||||||
|
3/1/18
|
PSUs
|
83,720
|
(13)
|
3,647,680
|
||||||||||||||||||
|
3/1/18
|
RSU-match
|
6,920
|
(1)
|
301,504
|
||||||||||||||||||
|
3/1/17
|
RSU-match
|
3,567
|
(1)
|
155,414
|
||||||||||||||||||
|
3/1/17
|
Stock Options
|
27,344
|
|
(7)
|
91.43
|
3/1/27
|
||||||||||||||||
|
3/1/16
|
RSU-match
|
6,923
|
(1)
|
301,635
|
||||||||||||||||||
|
3/1/16
|
Stock Options
|
32,192
|
|
(9)
|
77.66
|
3/1/26
|
||||||||||||||||
|
2/12/15
|
Option-match
|
4,492
|
|
(4)
|
30.46
|
2/12/25
|
||||||||||||||||
|
2/12/15
|
Stock Options
|
16,419
|
|
(4)
|
30.46
|
2/12/25
|
||||||||||||||||
|
5/21/14
|
Stock Options
|
110,833
|
|
(10)
|
22.56
|
5/21/24
|
||||||||||||||||
|
Ms. La Lande
|
3/1/18
|
RSUs
|
26,163
|
(12)
|
1,139,922
|
|||||||||||||||||
|
3/1/18
|
PSUs
|
20,930
|
(13)
|
911,938
|
||||||||||||||||||
|
3/1/18
|
Stock Options
|
52,325
|
|
(11)
|
66.89
|
3/1/28
|
||||||||||||||||
|
(1)
|
For all Matching RSUs, this total includes dividends that are reinvested at the dividend payment date in additional RSUs that are subject to the same restrictions as the original grant. The Matching RSUs granted on March 1, 2016, March 1, 2017, and March 1, 2018 are scheduled to vest on the fifth anniversary of the grant date.
|
|
(2)
|
The market value of the shares that have not vested is based on the closing price of $43.57 for Kraft Heinz common stock on December 28, 2018, the last trading day of our fiscal year, as reported on Nasdaq.
|
|
(3)
|
100% of these awards are scheduled to vest on August 20, 2020.
|
|
(4)
|
100% of these awards are scheduled to vest on February 12, 2020. Options and exercise price reflect the conversion in connection with the 2015 Merger.
|
|
(5)
|
100% of these awards vested on February 14, 2019, and they are scheduled to expire on February 14, 2024. Options and exercise price reflect the conversion in connection with the 2015 Merger.
|
|
(6)
|
100% of these awards vested on July 1, 2018, and they are scheduled to expire on July 1, 2023. Options and exercise price reflect the conversion in connection with the 2015 Merger.
|
|
(7)
|
100% of the award is scheduled to vest on March 1, 2022.
|
|
(8)
|
As of December 29, 2018, due to the performance of our business, the expected payout of the PSUs was determined to be zero.
The shares reported in this row represent potentially issuable shares under the PSU award granted on March 1, 2017, which cliff vest on March 1, 2022. The PSUs represent the right to receive a variable number of Kraft Heinz shares based on Kraft Heinz’s actual performance during a define performance period. If 80% of the performance target is achieved in 2019, the participant will receive 70% of the underlying shares. If 80% of the performance target is achieved in 2020, participant will receive 65% of the underlying shares and if 80% of the performance target is achieved in 2021, the participant will receive 60% of the underlying shares. The number of shares reported in this row is based on threshold performance. Dividend equivalents do not accrue on the PSUs. If the participant is terminated prior to March 1, 2020, he or she will forfeit the entire award. The PSUs will vest as earned on March 1, 2022.
|
|
(9)
|
100% of the award is scheduled to vest on March 1, 2021.
|
|
(10)
|
100% of the award is scheduled to vest on May 21, 2019. Options and exercise price reflect the conversion in connection with the 2015 Merger.
|
|
(11)
|
100% of these awards are scheduled to vest on March 1, 2023.
|
|
(12)
|
100% of these awards are scheduled to vest on March 1, 2023, and the RSU awards are not dividend eligible.
|
|
(13)
|
As of December 29, 2018, due to the performance of our business, the expected payout of the PSUs was determined to be zero.
The shares reported in these rows represent potentially issuable shares under the PSU award granted on March 1, 2018, which cliff vest on March 1, 2023. The PSUs represent the right, to the extent not forfeited, to receive a variable number of Kraft Heinz shares based on Kraft Heinz’s actual performance during a defined performance period. If the threshold of the performance target is achieved by the end of 2020, the participant will receive 80% of the underlying shares. If the threshold for the performance target is not achieved by the end of 2020, the target and threshold opportunities roll over to 2021 with a 20 percentage point payout penalty. The number of shares reported in these rows is based on threshold performance. Dividend equivalents do not accrue on the PSUs. If the participant is terminated prior to March 1, 2021, he or she will forfeit the entire award. The PSUs will vest as earned on March 1, 2023 provided the awardee also meets certain requirements.
|
|
(14)
|
On April 22, 2019, we announced that Mr. Hees would leave Kraft Heinz in 2019. As a result of his departure, Mr. Hees will forfeit the RSU award granted in 2018.
|
235
Option Exercises and Stock Vested Table
There were no stock options exercised nor did any RSUs vest for any NEO in 2018.
|
Option Awards
|
Stock Awards
|
|||||||
|
Number of Shares Acquired on Exercise
|
Value Realized on Exercise
|
Number of Shares Acquired on Vesting
|
Value Realized on Vesting
|
|||||
|
Name
|
(#)
|
($)
|
(#)
|
($)
|
||||
|
Mr. Hees
|
—
|
—
|
—
|
—
|
||||
|
Mr. Knopf
|
—
|
|
—
|
|
—
|
|
—
|
|
|
Mr. Basilio
|
—
|
—
|
—
|
—
|
||||
|
Mr. Oliveira
|
—
|
|
—
|
|
—
|
|
—
|
|
|
Ms. La Lande
|
—
|
—
|
—
|
—
|
||||
Pension Benefits Table
None of our NEOs participate in any defined benefit pension arrangements.
Nonqualified Deferred Compensation Table
None of our NEOs participate in any nonqualified deferred compensation arrangements.
236
Potential Payments Upon Termination or Change in Control Table
The table, footnotes, and narratives below reflect the assumption that a hypothetical termination of employment or change in control occurred on the last day of 2018.
|
Name
|
Element
|
Involuntary Termination Without
Cause
(1)
or Termination Upon Change in Control
($)
|
Other Types of
Separations
(2)
($)
|
|||||
|
Mr. Hees
(3)
|
||||||||
|
Salary
|
1,000,000
|
|
—
|
|
||||
|
Bonus
(5)
|
—
|
|
1,060,000
|
|
||||
|
Intrinsic Value of Accelerated Equity
(3)
|
2,587,776
|
|
2,587,776
|
|
||||
|
Health & Welfare Benefits
(4)
|
14,586
|
|
—
|
|
||||
|
Outplacement
|
3,200
|
|
—
|
|
||||
|
Total
|
3,605,562
|
|
3,647,776
|
|
||||
|
Mr. Knopf
|
||||||||
|
Salary
|
500,000
|
|
—
|
|
||||
|
Bonus
|
—
|
|
500,000
|
|
||||
|
Intrinsic Value of Accelerated Equity
(3)
|
16,853
|
|
16,853
|
|
||||
|
Health & Welfare Benefits
(4)
|
14,258
|
|
—
|
|
||||
|
Outplacement
|
3,200
|
|
—
|
|
||||
|
Total
|
534,311
|
|
516,853
|
|
||||
|
Mr. Basilio
|
||||||||
|
Salary
|
750,000
|
|
—
|
|
||||
|
Bonus
|
—
|
|
1,023,000
|
|
||||
|
Intrinsic Value of Accelerated Equity
(3)
|
1,117,313
|
|
1,117,313
|
|
||||
|
Health & Welfare Benefits
(4)
|
14,586
|
|
—
|
|
||||
|
Outplacement
|
3,200
|
|
—
|
|
||||
|
Total
|
1,885,099
|
|
2,140,313
|
|
||||
|
Mr. Oliveira
|
||||||||
|
Salary
|
560,101
|
|
—
|
|
||||
|
Bonus
|
—
|
|
733,854
|
|
||||
|
Intrinsic Value of Accelerated Equity
(3)
|
2,148,021
|
|
2,148,021
|
|
||||
|
Health & Welfare Benefits
(4)
|
2,556
|
|
—
|
|
||||
|
Outplacement
|
3,193
|
|
—
|
|
||||
|
Total
|
2,713,871
|
|
2,881,875
|
|
||||
|
Ms. La Lande
|
||||||||
|
Salary
|
650,000
|
|
—
|
|
||||
|
Bonus
|
—
|
|
543,000
|
|
||||
|
Intrinsic Value of Accelerated Equity
(3)
|
—
|
|
—
|
|
||||
|
Health & Welfare Benefits
(4)
|
14,586
|
|
—
|
|
||||
|
Outplacement
|
3,200
|
|
—
|
|
||||
|
Total
|
667,786
|
|
543,000
|
|
||||
|
(1)
|
No enhanced severance is provided on a termination in connection with a change in control. Kraft Heinz does not have a specified Change in Control Plan for executives, and treatment is determined by the plan agreements and local regulations applicable to each employee. Our Severance Pay Plan generally provides for 12 months of base salary with a signed release of claims. The Severance Pay Plan would also include Company-paid COBRA for U.S.-based employees for the severance period and outplacement services.
|
|
(2)
|
Relates to termination due to death, disability, or normal retirement.
|
|
(3)
|
As of the last day of 2018, in the event of a termination without cause or due to retirement, death, or disability, stock options vest as if 20% of the options vested on each annual anniversary date of the specific grant. Amounts reflect the intrinsic value of shares underlying options that would vest, calculated as the difference between $43.57, the closing price of Kraft Heinz common stock on December 28, 2018 (the last trading day of our fiscal year, as reported on Nasdaq), and the exercise price of the options. Amounts also include the vesting of Matching RSUs granted in 2016 at a pro rata rate of 20% of the RSUs as if they vested on each annual anniversary date of the grant. The 2017 Matching RSUs and 2018 RSUs and Matching RSUs are not presented in this table because no pro rata vesting would occur if such event occurs prior to the second anniversary of the grant.
|
|
(4)
|
Amount reflects 12 months of medical and dental benefit coverage continuation under COBRA, less the executive premium contribution. As noted in the CD&A, due to the difficult operating environment in 2018 and the Company’s financial performance, Messrs. Hees, Knopf, and Basilio asked to forfeit their rights to the amounts payable pursuant to the PBP with respect to fiscal year 2018 and the Committee approved their forfeitures.
|
237
|
(5)
|
The Committee and Board approved a bonus to Mr. Hees in connection with his separation from the Company, $1,084,000, which represents his pro rata portion of his 2019 bonus based on an 85% performance rating and 85% Individual Rating.
|
Severance Pay Plan
Generally, Kraft Heinz provides for severance benefits to U.S.-based salaried employees, including our U.S.-based NEOs, pursuant to the terms of the U.S. Severance Pay Plan. The severance benefits for non-U.S.-based salaried employees are made pursuant to the local laws and regulations governing the jurisdiction in which they work, subject to adjustment at the discretion of Kraft Heinz for employees at certain organizational levels (such benefits, together with the U.S. Severance Pay Plan, are referred to as the “Severance Pay Plan”).
NEOs are eligible for severance benefits under the Severance Pay Plan upon an involuntary termination of employment, such as job elimination, location closing, or reduction in the workforce. NEOs must be willing to provide satisfactory transitional assistance in order to be eligible for severance benefits.
Pursuant to the U.S. Severance Pay Plan, Messrs. Hees, Basilio, and Knopf and Ms. La Lande would generally be eligible to receive a severance payment equal to 12 months of base salary upon the execution of a release of claims against Kraft Heinz. In addition, the Committee may, in its sole discretion, authorize payment of additional severance in respect of a participant’s annual bonus opportunity. Although Mr. Oliveira is not based in the U.S. and not otherwise covered by the U.S. Severance Pay Plan, the Company has determined that he is eligible to receive the same benefits as the other NEOs. Severance payments are generally made in a cash lump-sum, but may occasionally be made in periodic payments at Kraft Heinz’s discretion as soon as administratively feasible after the termination of employment and after the former NEO’s executed release has become irrevocable.
On April 22, 2019, Kraft Heinz announced that Mr. Hees would leave Kraft Heinz in 2019. On June 5, 2019, the Committee approved the following severance terms for Mr. Hees, which will become payable following Mr. Hees’s termination of employment and subject to his execution of a release of claims against Kraft Heinz: (1) a severance payment equal to 12 months of base salary, and (2) a pro-rata payment of his annual bonus under the PBP assuming performance at 85%, both with respect to the metrics related to Kraft Heinz’s financial performance (i.e., the “Financial Multiplier”) and Mr. Hees’s MBOs (i.e., the “Individual Rating”). Mr. Hees’ outstanding equity awards will be treated in accordance with the terms set forth in the governing agreements as described below.
No enhanced severance is provided on a termination in connection with a change in control of Kraft Heinz, and Kraft Heinz does not maintain any individual change in control severance or other similar agreements with any of the NEOs. None of the NEOs are entitled to receive a gross-up for golden parachute taxes that may become payable pursuant to Section 280G of the Code in connection with a change in control of Kraft Heinz.
Equity Awards
Generally, as of the last day of 2018, in the event of involuntary termination without cause, retirement, death, and disability, the stock options granted to the NEOs would vest as if 20% of the shares vested on each annual anniversary date of the specific grant, and for all other terminations and for voluntary resignations, the unvested stock options would be forfeited. In addition, as of the last day of 2018, beginning on the termination date, the exercise period was 90 days for termination without cause and one year for retirement, death, and disability. In April 2019, the Committee modified award agreements for outstanding equity awards (options, PSUs, Matching RSUs, and RSUs) with respect to the treatment upon a termination due to death, disability, or retirement. Such terminations, for option awards on or after the first anniversary of the specific grant date, and for RSU and Matching RSU awards on or after the anniversary deadlines outlined in the award agreements, would result in such awards being fully vested and exercisable, in the case of PSUs, to the extent the performance conditions had been satisfied. In addition, the Committee modified award agreements for outstanding options such that the exercise period for a termination without cause would be one year.
PAY RATIO DISCLOSURE
In accordance with Item 402(u) of Regulation S-K, promulgated by the Dodd-Frank Wall Street Reform Act and Consumer Protection Act of 2010, we determined the ratio of the annual total compensation of Mr. Hees relative to the annual total compensation of our median employee.
For purposes of reporting annual total compensation and the ratio of annual total compensation of the CEO to the median employee, both the CEO and median employee’s annual total compensation were calculated consistent with the disclosure requirements of executive compensation under the Summary Compensation Table.
238
Pursuant to Item 402(u) of Regulation S-K and the instructions thereto, because there has been no significant change in our employee population or employee compensation arrangements that we reasonably believe would result in a significant change to our pay ratio disclosure, we are utilizing the same median-compensated employee in our pay ratio calculation as was used in 2017. Our median-compensated employee is a full-time hourly non-U.S. factory employee.
To identify our median employee last year, we determined the annual total compensation by examining the 2017 annualized base salaries plus target incentive bonus for all individuals, excluding our Chief Executive Officer, who were employed by us as of December 1, 2017. In accordance with Item 402(u) and instructions thereto, we included all full-time, part-time, temporary, and seasonal employees worldwide. We believe the use of base salaries plus target incentive bonus for all employees is a consistently applied compensation measure, because we do not widely distribute annual equity awards to employees and because we believe that this measure reasonably reflects the total annual compensation of our employees.
After applying the methodology described above, our median employee compensation using the Summary Compensation Table requirements was $47,612. Our CEO’s compensation in the Summary Compensation Table was $29,047,768. Therefore, our CEO to median employee pay ratio (“CEO pay ratio”), a reasonable estimate calculated in a manner consistent with Item 402(u), is 610:1. The CEO’s total compensation of $29,047,768 included $1,060,000 payable pursuant to the PBP for 2018, as well as $17,838,582 related to the grant date fair value of PSUs. As noted above, Mr. Hees has decided to forfeit the PBP for 2018, and as of December 29, 2018, the expected payout of those PSUs was determined to be zero based on the probability of future achievement of performance metrics. If we had excluded the PBP payout for 2018 and the March 2018 PSUs from total CEO compensation, the CEO pay ratio would have been 213:1.
Item 12. Security Ownership of Certain Beneficial Owners and Management and Related Stockholder Matters.
SECURITIES AUTHORIZED FOR ISSUANCE UNDER EQUITY COMPENSATION PLANS
The number of shares to be issued upon exercise or vesting of awards issued under, and the number of shares remaining available for future issuance under our equity compensation plans at December 29, 2018 were:
|
Number of securities to be issued upon exercise of outstanding options, warrants and rights
(1)
|
Weighted average exercise price per share of outstanding options, warrants and rights
|
Number of securities remaining available for future issuance under equity compensation plans (excluding securities reflected in column (a))
|
|||||||
|
Plan Category
|
(a)
|
(b)
|
(c)
|
||||||
|
Equity compensation plans approved by security holders
|
23,858,121
|
|
$
|
44.64
|
|
43,920,379
|
|
||
|
Equity compensation plans not approved by security holders
|
—
|
|
—
|
|
—
|
|
|||
|
Total
|
23,858,121
|
|
43,920,379
|
|
|||||
|
(1)
|
Includes the vesting of RSUs.
|
OWNERSHIP OF EQUITY SECURITIES
The following table shows the number of shares of our common stock beneficially owned as of June 5, 2019, unless otherwise noted, by each current director, director nominee, and Named Executive Officer, as well as the number of shares beneficially owned by all of our current directors and executive officers as a group. None of our common stock owned by these individuals is subject to any pledge. Unless otherwise indicated, each of the named individuals has, to Kraft Heinz’s knowledge, sole voting and investment power with respect to the shares shown.
239
|
Name of Beneficial Owner
|
Beneficially
Owned Shares
(1) (2)
|
Deferred
Stock
(3)
|
Total
|
||||||
|
Directors and Director Nominees:
|
|||||||||
|
Gregory E. Abel
|
22,166
|
|
20,878
|
|
43,044
|
|
|||
|
Alexandre Behring
|
44,333
|
|
30,479
|
|
74,812
|
|
|||
|
John T. Cahill
(4)
|
781,338
|
|
8,799
|
|
790,137
|
|
|||
|
Joao M. Castro-Neves
|
—
|
|
—
|
|
—
|
|
|||
|
Tracy Britt Cool
|
22,166
|
|
22,261
|
|
44,427
|
|
|||
|
Feroz Dewan
|
—
|
|
6,902
|
|
6,902
|
|
|||
|
Jeanne P. Jackson
|
4,280
|
|
17,049
|
|
21,329
|
|
|||
|
Jorge Paulo Lemann
|
22,166
|
|
20,878
|
|
43,044
|
|
|||
|
John C. Pope
|
10,098
|
|
18,409
|
|
28,507
|
|
|||
|
Marcel Hermann Telles
|
22,166
|
|
18,494
|
|
40,660
|
|
|||
|
Alexandre Van Damme
|
6,000
|
|
2,269
|
|
8,269
|
|
|||
|
George Zoghbi
|
240,161
|
|
—
|
|
240,161
|
|
|||
|
Named Executive Officers:
|
—
|
|
|||||||
|
Bernardo Hees
|
1,486,199
|
|
—
|
|
1,486,199
|
|
|||
|
David Knopf
|
1,106
|
|
—
|
|
1,106
|
|
|||
|
Paulo Basilio
|
597,401
|
|
—
|
|
597,401
|
|
|||
|
Rafael Oliveira
|
117,330
|
|
—
|
|
117,330
|
|
|||
|
Rashida La Lande
|
—
|
|
—
|
|
—
|
|
|||
|
All directors and executive officers as a group (19 persons)
(5)
|
3,406,501
|
|
166,418
|
|
3,572,919
|
|
|||
|
(1)
|
Individual directors and executive officers as well as all directors and executive officers as a group beneficially own less than 1% of our issued and outstanding common stock as of June 5, 2019.
|
|
(2)
|
Includes the number of Kraft Heinz stock options that are exercisable, or will become exercisable, within 60 days after June 5, 2019 as follows: Mr. Abel-22,166; Mr. Behring-44,333; Ms. Cool-22,166; Mr. Cahill-633,017; Mr. Lemann-22,166; Mr. Zoghbi-180,799; and all of our current executive officers as a group-2,130,954.
|
|
(3)
|
Includes RSUs and deferred shares held in the stock deferral plan under the Kraft Heinz Deferred Compensation Plan for Non-Management Directors. These shares accumulate dividends, which are reinvested in common stock. For a description of these deferred shares, see “Compensation of Non-Employee Directors” above.
|
|
(4)
|
Mr. Cahill’s holdings include 148,321 shares of common stock held in grantor retained annuity trusts.
|
|
(5)
|
This group includes, in addition to the individuals named in the table, Pedro Drevon, Rodrigo Wickbold, and Nina Barton, who collectively have 29,591 beneficially owned shares and exercisable stock options.
|
The following table displays information about persons we know were the beneficial owners of more than 5% of our outstanding common stock as of June 5, 2019.
|
Name and Address of Beneficial Owner
|
Amount and
Nature of
Beneficial
Ownership
|
Percent
of
Common
Stock
(1)
|
||
|
3G Funds
(2)
c/o 3G Capital, Inc.
600 Third Avenue 37th Floor
New York, New York 10016
|
270,097,373
|
22.1%
|
||
|
Warren E. Buffett
(3)
Berkshire Hathaway
3555 Farnam Street
Omaha, Nebraska 68131
|
325,442,152
|
26.7%
|
||
|
(1)
|
Calculated based on
1,219,938,804
shares of our outstanding common stock as of June 5, 2019.
|
|
(2)
|
Based on the Schedule 13G/A filed on January 18, 2019 by (i) 3G Global Food Holdings, a Cayman Islands limited partnership, (ii) 3G Global Food Holdings GP LP, a Cayman Islands limited partnership (“3G Global Food Holdings GP”), (iii) 3G Capital Partners II LP, a Cayman Islands limited partnership (“3G Capital Partners II”), (iv) 3G Capital Partners Ltd., a Cayman Islands exempted company (“3G Capital Partners Ltd”), and (v) 3G Capital Partners LP, a Cayman Islands limited partnership (“3G Capital Partners LP” and, together with 3G Global Food Holdings, 3G Global Food Holdings GP, 3G Capital Partners II and 3G Capital Partners Ltd, the “3G Funds”). According to the Schedule 13G/A filing, the 3G Funds own dispositive power over an aggregate of 270,097,373 shares of Kraft Heinz common stock. As a result of the relationships described above under “Independence and Related Person Transactions” in Item 13,
Certain Relationships and Related Transactions, and Director Independence
, Berkshire Hathaway, Mr. Buffett and the 3G Funds may be deemed to be a group for purposes of Section 13(d) of the Exchange Act and therefore may be deemed to hold 595,539,525 shares of Kraft Heinz common stock.
|
240
|
(3)
|
Based on the Schedule 13G/A filed on February 15, 2017 by Warren E. Buffett and Berkshire Hathaway. As a result of the relationships described above under “Independence and Related Person Transactions” in Item 13,
Certain Relationships and Related Transactions, and Director Independence
, Berkshire Hathaway, Mr. Buffett and the 3G Funds may be deemed to be a group for purposes of Section 13(d) of the Exchange Act and therefore may be deemed to hold 616,169,839 shares of Kraft Heinz common stock.
|
Item 13. Certain Relationships and Related Transactions, and Director Independence.
INDEPENDENCE AND RELATED PERSON TRANSACTIONS
Independence Determinations
The Guidelines require that a majority of the directors meet Nasdaq listing standards’ “independence” requirements. For a director to be considered independent, the Board must affirmatively determine, after reviewing all relevant information, that a director has no direct or indirect material relationship with Kraft Heinz that would interfere with his or her exercise of independent judgment in carrying out his or her responsibilities as a director. The Board determined that, under the Nasdaq listing standards, the following director nominees are independent: Mr. Abel, Mr. Behring, Ms. Cool, Mr. Dewan, Ms. Jackson, Mr. Lemann, Mr. Pope, Mr. Castro-Neves, and Mr. Van Damme. Warren Buffett and Mackey McDonald, who retired from Board service in 2018, and Marcel Herrmann Telles, who decided to retire from the Board, effective on June 12, 2019, were also determined to be independent during the periods they served. Mr. Cahill, the former Chief Executive Officer of Kraft and a current consultant to Kraft Heinz, and George Zoghbi, our former Chief Operating Officer of the U.S. Commercial business and Special Advisor at Kraft Heinz, are not independent.
In conducting its evaluations of Mr. Abel, Mr. Buffett, and Ms. Cool, the Board considered each individual’s affiliation with Berkshire Hathaway, which held approximately
27%
of our outstanding common stock as of June 5, 2019, and its subsidiaries. Similarly, in conducting its evaluations of Mr. Behring, Mr. Lemann, Mr. Castro-Neves, and Mr. Telles, the Board considered each individual’s affiliation with 3G Capital, which held approximately
22%
of our outstanding common stock as of June 5, 2019, and its subsidiaries. The Board also considered the service of Messrs. Behring, Castro-Neves, and Van Damme on the Board of Directors of RBI, a company in which 3G Capital invests and the parent company of Burger King and Tim Hortons, quick service restaurant companies that purchase certain of our products and conduct certain brand sponsorship and marketing activities for us, in conducting its evaluations of them.
Review of Transactions with Related Persons
The Board has adopted a written policy regarding the review, approval, or ratification of “related person transactions.” A “related person transaction” is one in which Kraft Heinz is a participant, the amount involved exceeds $120,000, and any “related person” had, has, or will have a direct or indirect material interest. In general, “related persons” include our directors, executive officers, and 5% stockholders and their immediate family members. In accordance with this policy, the Governance Committee reviews transactions that might qualify as “related person transactions.” If the Governance Committee determines that a transaction qualifies as a “related person transaction,” then the Governance Committee reviews, and approves, disapproves, or ratifies the “related person transaction.” The Governance Committee approves or ratifies only those “related person transactions” that are fair and reasonable to Kraft Heinz and in our and our stockholders’ best interests. Any member of the Governance Committee who is a “related person” with respect to a transaction under review may not participate in the deliberations or decisions regarding the transaction. The chair of the Governance Committee (or the Chair of the Audit Committee if the chair of the Governance Committee is a “related person” with respect to the transaction under review) will review and approve or ratify potential “related person transactions” when it is not practicable or desirable to delay review of a transaction until a Governance Committee meeting, and will report to the Governance Committee any transaction so approved or ratified. The Governance Committee, in the course of its review and approval or ratification of a related person transaction under this policy, considers, among other things:
|
•
|
the commercial reasonableness of the transaction;
|
|
•
|
the materiality of the related person’s direct or indirect interest in the transaction;
|
|
•
|
whether the transaction may involve an actual, or the appearance of a, conflict of interest;
|
|
•
|
the impact of the transaction on the related person’s independence (as defined in the Guidelines and the Nasdaq listing standards); and
|
|
•
|
whether the transaction would violate any provision of our Directors Ethics Code or Code of Conduct.
|
241
Registration Rights Agreement
In connection with the 2015 Merger, we entered into a registration rights agreement with 3G Global Food Holdings and Berkshire Hathaway. Pursuant to the registration rights agreement, we granted 3G Global Food Holdings and Berkshire Hathaway registration rights with respect to the shares of Kraft Heinz common stock held by 3G Global Food Holdings and Berkshire Hathaway as of the date of the closing of the 2015 Merger, representing shares of Kraft Heinz common stock acquired from Heinz in connection with the 2015 Merger and/or immediately prior to the 2015 Merger pursuant to a warrant. The registration rights only apply to registrable shares and not shares of Kraft Heinz common stock subsequently acquired by either party. These rights include demand registration rights, shelf registration rights, and “piggyback” registration rights, as well as customary indemnification. The rights are subject to certain holdback and suspension periods. We generally will bear all fees, costs, and expenses related to registrations, other than underwriting discounts and commissions attributable to the sale of shares of Kraft Heinz common stock by 3G Global Food Holdings and Berkshire Hathaway, as applicable.
Demand Registration Rights
The registration rights agreement grants each of 3G Global Food Holdings and Berkshire Hathaway demand registration rights. We will be required, upon the written request of 3G Global Food Holdings or Berkshire Hathaway, to file a registration statement pursuant to its demand rights under the registration rights agreement, as promptly as practicable and to use our reasonable best efforts to effect registration of shares of Kraft Heinz common stock requested to be registered by 3G Global Food Holdings or Berkshire Hathaway, subject to certain exceptions. Each of 3G Global Food Holdings and Berkshire Hathaway may request up to three demand registrations in the aggregate.
Shelf Registration Rights
The registration rights agreement also grants each of 3G Global Food Holdings and Berkshire Hathaway shelf registration rights. Subject to our eligibility to use a Registration Statement on Form S-3, each of 3G Global Food Holdings and Berkshire Hathaway may request that we file a shelf registration statement with respect to some or all of its shares of Kraft Heinz common stock, and, upon such request, we are required to file such registration statement promptly as practicable, subject to certain exceptions.
“Piggyback” Registration Rights
The registration rights agreement grants each of 3G Global Food Holdings and Berkshire Hathaway “piggyback” registration rights. If we register any of our shares of common stock, either for our own account or for the account of other stockholders, each of 3G Global Food Holdings and Berkshire Hathaway will be entitled, subject to certain exceptions, to include its shares of common stock in the registration.
Holdback Periods
Notwithstanding the registration rights described above, if there is an offering of shares of Kraft Heinz and the managing underwriters for the offering advise us that a public sale or distribution of shares outside the offering would adversely affect the offering, then, if requested, each of 3G Global Food Holdings and Berkshire Hathaway will not dispose of, or request the registration of, any registrable shares for a certain period, which we refer to as a holdback period. The holdback period will begin on the 10th day before the pricing date of the offering and extend for either (i) 120 days or (ii) an earlier date, if designated by the managing underwriters.
Suspension Periods
In addition, we may delay or suspend the filing, effectiveness, or use of a registration statement for a certain period, which we refer to as a suspension period, if we determine that (i) proceeding with the use or effectiveness of the registration statement would require us to disclose material non-public information and the disclosure of that information at that time would not be in our best interests or (ii) the registration or offering to be delayed or suspended would, if not delayed or suspended, materially adversely affect us or delay or otherwise materially adversely affect the success of any pending or proposed material transaction, including any debt or equity financing, any acquisition or disposition, any recapitalization or reorganization or any other material transaction, whether due to commercial reasons, a desire to avoid premature disclosure of information, or any other reason. During any calendar year, there will not be more than two suspension periods and the aggregate number of days included in all suspension periods in that year will not exceed 119 days.
242
Shareholders’ Agreement
In connection with the 2015 Merger, 3G Global Food Holdings and Berkshire Hathaway entered into a shareholders’ agreement that governs how each party and their affiliates will vote the shares of Kraft Heinz common stock held by them as of the date of closing of the 2015 Merger, with respect to supporting certain directors who are designated by either 3G Global Food Holdings or Berkshire Hathaway. Pursuant to the shareholders’ agreement, 3G Global Food Holdings agrees that for so long as Berkshire Hathaway and its affiliates control shares representing at least 66% of the voting power in election of directors of shares owned by Berkshire Hathaway as of the consummation of the 2015 Merger, 3G Global Food Holdings and its affiliates will vote their shares of Kraft Heinz common stock in favor of the three Kraft Heinz Board nominees designated by Berkshire Hathaway and not take any action to remove such designees without Berkshire Hathaway’s consent. Similarly, Berkshire Hathaway agrees that for so long as 3G Global Food Holdings and its affiliates control shares representing at least 66% of the voting power in elections of directors of shares owned by 3G Global Food Holdings as of the consummation of the 2015 Merger, Berkshire Hathaway and its affiliates will vote their shares of Kraft Heinz common stock in favor of the three Kraft Heinz Board nominees designated by 3G Global Food Holdings and not take any action to remove such designees without 3G Global Food Holdings’ consent. The shareholders’ agreement provides that each party’s foregoing rights and obligations will step down upon specified reductions in ownership below the 66% threshold described above by either 3G Global Food Holdings or Berkshire Hathaway and their respective affiliates, as applicable.
Consulting Agreement
On November 2, 2017, we entered into a consulting agreement with Mr. Cahill pursuant to which he provides advisory and consulting services to us related to current and historical finances, relationships with licensors, customers and vendors, employee matters, product development, marketing and distribution, government affairs and strategic opportunities. Mr. Cahill is paid $500,000 annually under this new consulting agreement, which was approved by the disinterested members of the Board. Mr. Cahill’s services under the consulting agreement are distinct from his duties as a director. Previously, Mr. Cahill had provided similar services under a consulting agreement entered into following the 2015 Merger, which had expired in July 2017.
Compensation Arrangement
Effective January 1, 2017, the Company entered into an offer letter (the “Offer Letter”) with Mr. Zoghbi in order to incent Mr. Zoghbi to extend his service with the Company past January 1, 2017, after a retention bonus pursuant to a prior offer letter entered into upon the closing of the 2015 Merger had been earned. Under the Offer Letter, Mr. Zoghbi: (i) continued his current base salary of $850,000; (ii) agreed to a 2017 target annual incentive award opportunity of 200% (with a maximum bonus multiplier of 130%); and (iii) was granted a long-term equity incentive award. The long-term equity incentive award was composed of (i) RSUs, which cliff vest after three years, and (ii) PSUs, which cliff vest after three years based on the achievement of U.S. sales growth targets and U.S. Adjusted EBITDA growth targets. The Offer Letter also eliminated the Section 280G gross-up rights that Mr. Zoghbi had been granted by Kraft compensation plans prior to the 2015 Merger. In October 2017, Mr. Zoghbi transitioned from his role as President of the U.S. Commercial business to his role as Special Advisor. As previously disclosed, Mr. Zoghbi was not eligible under the Offer Letter for an annual incentive award in 2018 based on 2017 performance. For as long as Mr. Zoghbi continues to serve as a Special Advisor at Kraft Heinz, it is anticipated that he will not receive compensation for his services as a director.
Item 14. Principal Accounting Fees and Services.
Independent Auditors’ Fees
Aggregate fees for professional services rendered by our independent auditors, PricewaterhouseCoopers LLP, are set forth in the table below (in thousands). All fees below include out-of-pocket expenses.
|
For the Year Ended
|
|||||||
|
December 29, 2018
|
December 30, 2017
|
||||||
|
Audit Fees
(1)
|
$
|
19,234
|
|
$
|
9,353
|
|
|
|
Audit-Related Fees
(2)
|
442
|
|
401
|
|
|||
|
Tax Fees
(3)
|
1,171
|
|
1,009
|
|
|||
|
All Other Fees
(4)
|
46
|
|
5
|
|
|||
|
Total
|
$
|
20,893
|
|
$
|
10,768
|
|
|
|
(1)
|
Include (a) the audit of our consolidated financial statements, including statutory audits of the financial statements of certain of our affiliates, and (b) the reviews of our unaudited condensed consolidated interim financial statements (quarterly financial statements). The increase from 2017 to 2018 primarily related to audit overruns associated with the procurement investigation, restatement, and impairment of goodwill and intangible assets.
|
|
(2)
|
Include professional services in connection with accounting consultations and procedures related to various other audit and special reports.
|
243
|
(3)
|
Include professional services in connection with tax compliance and advice.
|
|
(4)
|
Consist principally of software license fees related to research and benchmarking.
|
Pre-Approval Policy
The Audit Committee’s policy is to pre-approve all audit and non-audit services provided by the independent auditors. These services may include audit services, audit-related services, tax services, and other permissible non-audit services. The pre-approval authority details the particular service or category of service that the independent auditors will perform. The Audit Committee’s policy also requires management to report at Audit Committee meetings throughout the year on the actual fees charged by the independent auditors for each category of service. The Audit Committee reviews this policy annually.
During the year, circumstances may arise when it may be necessary to engage the independent auditors for additional services not contemplated in the original pre-approval authority. In those instances, the Audit Committee approves the services before we engage the independent auditors. If pre-approval is needed before a scheduled Audit Committee meeting, the Audit Committee delegated pre-approval authority to its chair. The chair must report on such pre-approval decisions at the committee’s next regular meeting.
During fiscal year 2018, the Audit Committee pre-approved all audit and non-audit services provided by the independent auditors.
PART IV
Item 15. Exhibits, Financial Statement Schedules.
(a) Index to Consolidated Financial Statements and Schedules
|
Page No.
|
|
Schedules other than those listed above have been omitted either because such schedules are not required or are not applicable.
(b) The following exhibits are filed as part of, or incorporated by reference into, this Annual Report:
|
Exhibit No.
|
Descriptions
|
|
|
2.1
|
||
|
2.2
|
||
|
2.3
|
||
|
2.4
|
||
244
|
2.5
|
||
|
2.6
|
||
|
2.7
|
||
|
2.8
|
||
|
2.9
|
||
|
3.1
|
||
|
3.2
|
||
|
3.3
|
||
|
4.1
|
||
|
4.2
|
||
|
4.3
|
||
|
4.4
|
||
|
4.5
|
||
|
4.6
|
||
|
4.7
|
||
|
4.8
|
||
245
|
4.9
|
||
|
4.10
|
||
|
4.11
|
||
|
4.12
|
||
|
4.13
|
||
|
4.14
|
||
|
4.15
|
||
|
4.16
|
||
|
4.17
|
||
|
4.18
|
||
|
4.19
|
||
|
4.20
|
||
|
4.21
|
||
|
4.22
|
||
|
4.23
|
||
|
4.24
|
||
246
|
4.25
|
||
|
4.26
|
||
|
4.27
|
||
|
4.28
|
||
|
4.29
|
||
|
4.30
|
||
|
4.31
|
||
|
4.32
|
||
|
10.1
|
||
|
10.2
|
||
|
10.3
|
||
|
10.4
|
||
|
10.5
|
||
|
10.6
|
||
|
10.7
|
||
|
10.8
|
||
|
10.9
|
||
|
10.10
|
||
|
10.11
|
||
247
|
10.12
|
||
|
10.13
|
||
|
10.14
|
||
|
10.15
|
||
|
10.16
|
||
|
10.17
|
||
|
10.18
|
||
|
10.19
|
||
|
10.20
|
||
|
10.21
|
||
|
10.22
|
||
|
10.23
|
||
|
21.1
|
||
|
24.1
|
||
|
31.1
|
||
|
31.2
|
||
|
32.1
|
||
|
32.2
|
||
|
101.1
|
The following materials from The Kraft Heinz Company’s Annual Report on Form 10-K for the period ended December 29, 2018 formatted in XBRL (eXtensible Business Reporting Language): (i) the Consolidated Statements of Income, (ii) the Consolidated Statements of Comprehensive Income, (iii) the Consolidated Statements of Equity, (iv) the Consolidated Balance Sheets, (v) the Consolidated Statements of Cash Flows, (vi) Notes to Consolidated Financial Statements, and (vii) document and entity information.
|
|
|
+
|
The Company agrees to furnish supplementally a copy of any omitted attachment to the SEC on a confidential basis upon request.
|
|
|
++
|
Indicates a management contract or compensatory plan or arrangement.
|
|
248
Item 16. Form 10-K Summary.
None.
249
SIGNATURES
Pursuant to the requirements of Section 13 or 15(d) of the Securities Exchange Act of 1934, the registrant has duly caused this report to be signed on its behalf by the undersigned, thereunto duly authorized.
|
The Kraft Heinz Company
|
|||
|
Date:
|
June 7, 2019
|
||
|
By:
|
/s/ David H. Knopf
|
||
|
David H. Knopf
|
|||
|
Executive Vice President and Chief Financial Officer
|
|||
|
(Principal Financial Officer)
|
|||
Pursuant to the requirements of the Securities Exchange Act of 1934, this report has been signed below by the following persons on behalf of the registrant and in the capacities and on the date indicated:
|
Signature
|
Title
|
Date
|
||
|
/s/ Bernardo Hees
|
Chief Executive Officer
|
June 7, 2019
|
||
|
Bernardo Hees
|
(Principal Executive Officer)
|
|||
|
/s/ David H. Knopf
|
Executive Vice President and Chief Financial Officer
|
June 7, 2019
|
||
|
David H. Knopf
|
(Principal Financial Officer)
|
|||
|
/s/ Vince Garlati
|
Vice President, Global Controller
|
June 7, 2019
|
||
|
Vince Garlati
|
(Principal Accounting Officer)
|
|||
|
Alexandre Behring*
|
Chairman of the Board
|
|
|
John T. Cahill*
|
Vice Chairman of the Board
|
|
|
Gregory E. Abel*
|
Director
|
|
|
Tracy Britt Cool*
|
Director
|
|
|
Feroz Dewan*
|
Director
|
|
|
Jeanne P. Jackson*
|
Director
|
|
|
Jorge Paulo Lemann*
|
Director
|
|
|
John C. Pope*
|
Director
|
|
|
Marcel Hermann Telles*
|
Director
|
|
|
Alexandre Van Damme*
|
Director
|
|
|
George Zoghbi*
|
Director
|
|
|
*By:
|
/s/ David H. Knopf
|
|
David H. Knopf
|
|
|
Attorney-In-Fact
|
|
|
June 7, 2019
|
|
250
The Kraft Heinz Company
Valuation and Qualifying Accounts
For the Years Ended
December 29, 2018
,
December 30, 2017
and
December 31, 2016
(in millions)
|
Additions
|
Deductions
|
||||||||||||||||||
|
Description
|
Balance at Beginning of Period
|
Charged to Costs and Expenses
|
Charged to Other Accounts
(a)
|
Write-offs and Reclassifications
|
Balance at End of Period
|
||||||||||||||
|
Year ended
December 29, 2018
|
|||||||||||||||||||
|
Allowances related to trade accounts receivable
|
$
|
23
|
|
$
|
8
|
|
$
|
—
|
|
$
|
(7
|
)
|
$
|
24
|
|
||||
|
Allowances related to deferred taxes
|
80
|
|
1
|
|
—
|
|
—
|
|
81
|
|
|||||||||
|
$
|
103
|
|
$
|
9
|
|
$
|
—
|
|
$
|
(7
|
)
|
$
|
105
|
|
|||||
|
Year ended December 30, 2017
|
|||||||||||||||||||
|
Allowances related to trade accounts receivable
|
$
|
20
|
|
$
|
8
|
|
$
|
1
|
|
$
|
(6
|
)
|
$
|
23
|
|
||||
|
Allowances related to deferred taxes
|
89
|
|
(9
|
)
|
—
|
|
—
|
|
80
|
|
|||||||||
|
$
|
109
|
|
$
|
(1
|
)
|
$
|
1
|
|
$
|
(6
|
)
|
$
|
103
|
|
|||||
|
Year ended December 31, 2016
|
|||||||||||||||||||
|
Allowances related to trade accounts receivable
|
$
|
32
|
|
$
|
6
|
|
$
|
(4
|
)
|
$
|
(14
|
)
|
$
|
20
|
|
||||
|
Allowances related to deferred taxes
|
83
|
|
6
|
|
—
|
|
—
|
|
89
|
|
|||||||||
|
$
|
115
|
|
$
|
12
|
|
$
|
(4
|
)
|
$
|
(14
|
)
|
$
|
109
|
|
|||||
|
(a)
|
Primarily relates to acquisitions and currency translation.
|
S-1
TABLE OF CONTENTS
Part IItem 1. BusinessItem 1A. Risk FactorsItem 1B. Unresolved Staff CommentsItem 2. PropertiesItem 3. Legal ProceedingsItem 4. Mine Safety DisclosuresPart IIItem 5. Market For Registrant's Common Equity, Related Stockholder Matters and Issuer Purchases Of Equity SecuritiesItem 6. Selected Financial DataItem 7. Management S Discussion and Analysis Of Financial Condition and Results Of OperationsItem 7A. Quantitative and Qualitative Disclosures About Market RiskItem 8. Financial Statements and Supplementary DataNote 1. Basis Of PresentationNote 2. Restatement Of Previously Issued Consolidated Financial StatementsNote 3. Significant Accounting PoliciesNote 4. New Accounting StandardsNote 5. Acquisitions and DivestituresNote 6. Integration and Restructuring ExpensesNote 7. Restricted CashNote 8. InventoriesNote 9. Property, Plant and EquipmentNote 10. Goodwill and Intangible AssetsNote 11. Income TaxesNote 12. Employees Stock Incentive PlansNote 13. Postemployment BenefitsNote 14. Financial InstrumentsNote 15. Accumulated Other Comprehensive Income/(losses)Note 16. Venezuela - Foreign Currency and InflationNote 17. Financing ArrangementsNote 18. Commitments and ContingenciesNote 19. DebtNote 20. Capital StockNote 21. Earnings Per ShareNote 22. Segment ReportingNote 23. Quarterly Financial Data (unaudited)Note 24. Supplemental Guarantor InformationItem 9. Changes in and Disagreements with Accountants on Accounting and Financial DisclosureItem 9A. Controls and ProceduresItem 9B. Other InformationPart IIIItem 10. Directors, Executive Officers and Corporate GovernanceItem 11. Executive CompensationItem 12. Security Ownership Of Certain Beneficial Owners and Management and Related Stockholder MattersItem 13. Certain Relationships and Related Transactions, and Director IndependenceItem 14. Principal Accounting Fees and ServicesPart IVItem 15. Exhibits, Financial Statement SchedulesItem 16. Form 10-k Summary