|
|
|
|
|
|
|
|
|
|
|
|
|
|
|
|
|
|
|
|
|
|
|
|
|
|
|
|
|
|
|
|
|
|
|
|
|
|
|
|
|
|
|
|
|
|
|
|
|
|
|
|
|
|
|
|
|
|
|
UNITED STATES
SECURITIES AND EXCHANGE COMMISSION
Washington, D.C. 20549
FORM 10-K
|
☑ |
ANNUAL REPORT PURSUANT TO SECTION 13 OR 15(d) OF THE SECURITIES EXCHANGE ACT OF 1934 |
For the fiscal year ended December 31, 20 16
OR
|
☐ |
TRANSITION REPORT PURSUANT TO SECTION 13 OR 15(d) OF THE SECURITIES EXCHANGE ACT OF 1934 |
For the transition period from __________ to __________
Commission file number 1-10899
Kimco Realty Corporation
(Exact name of registrant as specified in its charter)
|
Maryland |
13-2744380 |
|
|
(State or other jurisdiction of incorporation or organization) |
(I.R.S. Employer Identification No.) |
3333 New Hyde Park Road, New Hyde Park, NY 11042-0020
(Address of principal executive offices) (Zip Code)
(516) 869-9000
(Registrant’s telephone number, including area code)
Securities registered pursuant to Section 12(b) of the Act:
|
Title of each class |
Name of each exchange on |
|
|
which registered |
||
|
Common Stock, par value $.01 per share. |
|
New York Stock Exchange |
|
Depositary Shares, each representing one-thousandth of a share of 6.00% Class I Cumulative Redeemable
|
|
New York Stock Exchange |
|
Depositary Shares, each representing one-thousandth of a share of 5.50% Class J Cumulative Redeemable
|
New York Stock Exchange |
|
|
Depositary Shares, each representing one-thousandth of a share of 5.625% Class K Cumulative Redeemable
|
|
New York Stock Exchange |
Securities registered pursuant to section 12(g) of the Act: None
Indicate by check mark if the registrant is a well-known seasoned issuer, as defined in Rule 405 of the Securities Act. Yes ☑ No ☐
Indicate by check mark if the registrant is not required to file reports pursuant to Section 13 or Section 15(d) of the Act. Yes ☐ No ☑
Indicate by check mark whether the registrant (1) has filed all reports required to be filed by Section 13 or 15(d) of the Securities Exchange Act of 1934 during the preceding 12 months (or for such shorter period that the registrant was required to file such reports), and (2) has been subject to such filing requirements for the past 90 days. Yes ☑ No ☐
Indicate by check mark whether the registrant has submitted electronically and posted on its corporate Web site, if any, every Interactive Data File required to be submitted and posted pursuant to Rule 405 of Regulation S-T (§ 232.405 of this chapter) during the preceding 12 months (or for such shorter period that the registrant was required to submit and post such files). Yes ☑ No ☐
Indicate by check mark if disclosure of delinquent filers pursuant to Item 405 of Regulation S-K (§ 229.405 of this chapter) is not contained herein, and will not be contained, to the best of registrant's knowledge, in definitive proxy or information statements incorporated by reference in Part III of this Form 10-K or any amendment to this Form 10-K. ☑
Indicate by check mark whether the registrant is a large accelerated filer, an accelerated filer, a non-accelerated filer, or a smaller reporting company. See the definitions of “large accelerated filer,” “accelerated filer” and “smaller reporting company” in Rule 12b-2 of the Exchange Act.
|
Large accelerated filer |
☑ |
Accelerated filer |
☐ |
|
Non-accelerated filer |
☐ |
Smaller reporting company |
☐ |
|
(Do not check if a smaller reporting company.) |
|||
Indicate by check mark whether the registrant is a shell company (as defined in Rule 12b-2 of the Act). Yes ☐ No ☑
The aggregate market value of the voting and non-voting common equity held by non-affiliates of the registrant was approximately $12.8 billion based upon the closing price on the New York Stock Exchange for such equity on June 30, 2016.
(APPLICABLE ONLY TO CORPORATE REGISTRANTS)
Indicate the number of shares outstanding of each of the registrant's classes of common stock, as of the latest practicable date.
As of February 22, 2017, the registrant had 425,629,020 shares of common stock outstanding.
DOCUMENTS INCORPORATED BY REFERENCE
Part III incorporates certain information by reference to the Registrant's definitive proxy statement to be filed with respect to the Annual Meeting of Stockholders expected to be held on April 25, 2017.
Index to Exhibits begins on page 36.
TABLE OF CONTENTS
|
Item No . |
Form 10-K
|
|
|
PART I |
||
|
1. |
3 |
|
|
1A. |
6 |
|
|
1B. |
12 |
|
|
2. |
12 |
|
|
3. |
13 |
|
|
4. |
13 |
|
|
PART II |
||
|
5. |
14 |
|
|
6. |
16 |
|
|
7. |
Management’s Discussion and Analysis of Financial Condition and Results of Operations |
17 |
|
7A. |
33 |
|
|
8. |
33 |
|
|
9. |
Changes in and Disagreements With Accountants on Accounting and Financial Disclosure |
33 |
|
9A. |
33 |
|
|
9B. |
34 |
|
|
PART III |
||
|
10. |
34 |
|
|
11. |
34 |
|
|
12. |
Security Ownership of Certain Beneficial Owners and Management and Related Stockholder Matters |
34 |
|
13. |
Certain Relationships and Related Transactions, and Director Independence |
34 |
|
14. |
34 |
|
|
PART IV |
||
|
15. |
35 |
|
|
16. |
35 |
FORWARD-LOOKING STATEMENTS
This annual report on Form 10-K (“Form 10-K”), together with other statements and information publicly disseminated by Kimco Realty Corporation (the “Company”) contains certain forward-looking statements within the meaning of Section 27A of the Securities Act of 1933, as amended, and Section 21E of the Securities Exchange Act of 1934, as amended. The Company intends such forward-looking statements to be covered by the safe harbor provisions for forward-looking statements contained in the Private Securities Litigation Reform Act of 1995 and includes this statement for purposes of complying with the safe harbor provisions. Forward-looking statements, which are based on certain assumptions and describe the Company’s future plans, strategies and expectations, are generally identifiable by use of the words “believe,” “expect,” “intend,” “anticipate,” “estimate,” “project,” “will,” “target,” “forecast” or similar expressions. You should not rely on forward-looking statements since they involve known and unknown risks, uncertainties and other factors which are, in some cases, beyond the Company’s control and could materially affect actual results, performances or achievements. Factors which may cause actual results to differ materially from current expectations include, but are not limited to (i) general adverse economic and local real estate conditions, (ii) the inability of major tenants to continue paying their rent obligations due to bankruptcy, insolvency or a general downturn in their business, (iii) financing risks, such as the inability to obtain equity, debt or other sources of financing or refinancing on favorable terms to the Company, (iv) the Company’s ability to raise capital by selling its assets, (v) changes in governmental laws and regulations, (vi) the level and volatility of interest rates and foreign currency exchange rates and managements’ ability to estimate the impact thereof, (vii) risks related to the Company’s international operations, (viii) the availability of suitable acquisition, disposition, development and redevelopment opportunities, and risks related to acquisitions not performing in accordance with our expectations, (ix) valuation and risks related to the Company’s joint venture and preferred equity investments, (x) valuation of marketable securities and other investments, (xi) increases in operating costs, (xii) changes in the dividend policy for the Company’s common stock, (xiii) the reduction in the Company’s income in the event of multiple lease terminations by tenants or a failure by multiple tenants to occupy their premises in a shopping center, (xiv) impairment charges, (xv) unanticipated changes in the Company’s intention or ability to prepay certain debt prior to maturity and/or hold certain securities until maturity and (xvi) the risks and uncertainties identified under Item 1A, “Risk Factors” and elsewhere in this Form 10-K and in the Company’s other filings with the Securities and Exchange Commission (“SEC”). Accordingly, there is no assurance that the Company’s expectations will be realized. The Company disclaims any intention or obligation to update the forward-looking statements, whether as a result of new information, future events or otherwise. You are advised to refer to any further disclosures the Company makes or related subjects in the Company’s quarterly reports on Form 10-Q and current reports on Form 8-K that the Company files with the SEC.
Item 1. Business
Background
Kimco Realty Corporation, a Maryland corporation, is one of the nation's largest owners and operators of open-air shopping centers. The terms "Kimco," the "Company," "we," "our" and "us" each refer to Kimco Realty Corporation and our subsidiaries, unless the context indicates otherwise. The Company is a self-administered real estate investment trust ("REIT") and has owned and operated open-air shopping centers for more than 50 years. The Company has not engaged, nor does it expect to retain, any REIT advisors in connection with the operation of its properties. As of December 31, 2016, the Company had interests in 525 shopping center properties (the “Combined Shopping Center Portfolio”), aggregating 85.4 million square feet of gross leasable area (“GLA”), located in 34 states, Puerto Rico and Canada. In addition, the Company had 384 other property interests, primarily through the Company’s preferred equity investments and other real estate investments, totaling 6.3 million square feet of GLA. The Company’s ownership interests in real estate consist of its consolidated portfolio and portfolios where the Company owns an economic interest, such as properties in the Company’s investment real estate management programs, where the Company partners with institutional investors and also retains management.
The Company's executive offices are located at 3333 New Hyde Park Road, New Hyde Park, New York 11042-0020 and its telephone number is (516) 869-9000. Nearly all operating functions, including leasing, legal, construction, data processing, maintenance, finance and accounting are administered by the Company from its executive offices in New Hyde Park, New York and supported by the Company’s regional offices. As of December 31, 2016, a total of 551 persons were employed by the Company.
The Company’s Web site is located at http://www.kimcorealty.com . The information contained on our Web site does not constitute part of this Form 10-K. On the Company’s Web site you can obtain, free of charge, a copy of this Form 10-K, quarterly reports on Form 10-Q, current reports on Form 8-K and amendments to those reports filed or furnished pursuant to Section 13(a) or 15(d) of the Exchange Act of 1934, as amended, as soon as reasonably practicable, after we file such material electronically with, or furnish it to, the SEC. The public may read and copy any materials we file with the SEC at the SEC's Public Reference Room at 100 F Street, NE, Washington, DC 20549. The public may obtain information on the operation of the Public Reference Room by calling the SEC at 1-800-SEC-0330. The SEC also maintains an Internet site that contains reports, proxy and information statements, and other information regarding issuers that file electronically with the SEC at http://www.sec.gov .
The Company began operations through its predecessor, The Kimco Corporation, which was organized in 1966 upon the contribution of several shopping center properties owned by its principal stockholders. In 1973, these principals formed the Company as a Delaware corporation, and, in 1985, the operations of The Kimco Corporation were merged into the Company. The Company completed its initial public stock offering (the "IPO") in November 1991, and, commencing with its taxable year which began January 1, 1992, elected to qualify as a REIT in accordance with Sections 856 through 860 of the Internal Revenue Code of 1986, as amended (the "Code"). If, as the Company believes, it is organized and operates in such a manner so as to qualify and remain qualified as a REIT under the Code, the Company generally will not be subject to federal income tax, provided that distributions to its stockholders equal at least the amount of its REIT taxable income, as defined under the Code. In 1994, the Company reorganized as a Maryland corporation. In March 2006, the Company was added to the S & P 500 Index, an index containing the stock of 500 Large Cap companies, most of which are U.S. corporations. The Company's common stock, Class I Depositary Shares, Class J Depositary Shares and Class K Depositary Shares are traded on the New York Stock Exchange (“NYSE”) under the trading symbols “KIM”, “KIMprI”, “KIMprJ” and “KIMprK”, respectively.
The Company’s initial growth resulted primarily from real estate under development and the construction of shopping centers. Subsequently, the Company revised its growth strategy to focus on the acquisition of existing shopping centers and continued its expansion across the nation. The Company implemented its investment real estate management format through the establishment of various institutional joint venture programs, in which the Company has noncontrolling interests. The Company earns management fees, acquisition fees, disposition fees as well as promoted interests based on achieving certain performance metrics. The Company continued its geographic expansion with investments in Canada, Puerto Rico, Mexico, Chile, Brazil and Peru; however, during 2013, based upon a perceived change in market conditions, the Company began its efforts to exit its investments in Mexico and South America. During 2015, the Company began its efforts to exit its investments in Canada. As of December 31, 2016, the Company had essentially sold all of its operating properties in Canada, substantially liquidated its investments in Mexico and had completely exited South America by liquidating its investments in Chile, Brazil and Peru. The Company’s revenues and equity in income (including gains on sales and impairment losses) from its foreign investments in U.S. dollar equivalents and their respective local currencies are as follows (in millions):
|
2016 |
2015 |
2014 |
||||||||||
|
Revenues (consolidated in USD): |
||||||||||||
|
Mexico |
$ | 0.6 | $ | 1.9 | $ | 29.4 | ||||||
|
Peru |
$ | - | $ | - | $ | 0.1 | ||||||
|
Chile |
$ | - | $ | 6.7 | $ | 8.1 | ||||||
|
Revenues (consolidated in local currencies): |
||||||||||||
|
Mexico (Mexican Pesos “MXN”) |
11.3 | 28.2 | 382.3 | |||||||||
|
Peru (Peruvian Nuevo Sol) |
- | - | 0.4 | |||||||||
|
Chile (Chilean Pesos “CLP”) |
- | 4,264.9 | 4,485.9 | |||||||||
|
Equity in income (unconsolidated joint ventures, including preferred equity investments in USD): |
||||||||||||
|
Canada (1) |
$ | 152.6 | $ | 409.1 | $ | 49.3 | ||||||
|
Mexico (2) (3) |
$ | (3.6 | ) | $ | (1.6 | ) | $ | (3.7 | ) | |||
|
Chile (4) |
$ | - | $ | 0.9 | $ | (0.1 | ) | |||||
|
Equity in income (unconsolidated joint ventures, including preferred equity investments in local currencies): |
||||||||||||
| Canada (Canadian dollars “CAD”) (1) | 199.5 | 540.1 | 54.6 | |||||||||
|
Mexico (MXN) |
29.2 | (24.0 | ) | 550.8 | ||||||||
|
Chile (CLP) |
- | - | (55.3 | ) | ||||||||
|
(1) |
Includes gains of $141.9 million (CAD 185.9 million) and $373.8 million (CAD 439.9 million) on disposition of equity interests for the years ended December 31, 2016 and 2015, respectively. |
|
(2) |
Includes equity losses of $5.2 million, equity losses of $0.8 million, and equity income of $0.4 million for the years ended December 31, 2016, 2015 and 2014, respectively, related to foreign investments for which the reporting currency is denominated in USD and not subject to foreign translation exposure. |
|
(3) |
Included in the year ended December 31, 2014 is the release of cumulative foreign currency translation adjustment (“CTA”) of $47.3 million in equity losses. |
|
(4) |
Included in the year ended December 31, 2015 is the release of CTA of $0.8 million in equity income. |
The Company maintains certain subsidiaries which made joint elections with the Company to be treated as taxable REIT subsidiaries (“TRSs”), which permit the Company to engage in certain business activities which the REIT may not conduct directly. These activities have included (i) ground-up real estate under development of open-air shopping centers and the subsequent sale thereof upon completion, (ii) retail real estate management and disposition services, which primarily focused on leasing and disposition strategies for real estate property interests of both healthy and distressed retailers and (iii) the Company’s investment in AB Acquisition, LLC, which consists of grocers Safeway, Albertsons, Vons and other banners (collectively “Albertsons”). A TRS is subject to federal and state income taxes on its income, and the Company includes a provision for taxes in its consolidated financial statements. Effective August 1, 2016, the Company merged Kimco Realty Services Inc. ("KRS"), a TRS, into a wholly-owned Limited Liability Company (“LLC”) of the Company (the “Merger”) and no longer operates KRS as a TRS. The Company analyzed the individual assets of KRS and determined that substantially all of KRS’s assets constitute real estate assets and investments that can be directly owned by the Company without adversely affecting the Company’s status as a REIT, including its investment in Albertsons. Any non-REIT qualifying assets or activities were transferred to a newly formed TRS.
In addition, the Company has capitalized on its established expertise in retail real estate by establishing other ventures in which the Company owns a smaller equity interest and provides management, leasing and operational support for those properties. The Company has also provided preferred equity capital in the past to real estate entrepreneurs and, from time to time, provides real estate capital and management services to both healthy and distressed retailers. The Company has also made selective investments in secondary market opportunities where a security or other investment is, in management’s judgment, priced below the value of the underlying assets, however these investments are subject to volatility within the equity and debt markets.
Operati n g and Investment Strategy
The Company’s strategy is to be the premier owner and operator of open-air shopping centers through investments primarily in the U.S. To achieve this strategy the Company is (i) continuing to transform the quality of its portfolio by disposing of lesser quality assets and acquiring larger higher quality properties in key markets identified by the Company, for which substantial progress has been achieved as of the end of 2016, (ii) simplifying its business by: (a) reducing the number of joint venture investments and (b) exiting Mexico, South America and Canada, for which the exit of South America has been completed, Mexico has been substantially completed and the Company essentially sold all operating properties in Canada, (iii) pursuing redevelopment opportunities within its portfolio to increase overall value and (iv) selectively acquiring land parcels in our key markets for real estate development projects for long-term investment. As part of the Company’s strategy each property is evaluated for its highest and best use, which may include residential and mixed-use components. In addition, the Company may consider other opportunistic investments related to retailer controlled real estate such as, repositioning underperforming retail locations, retail real estate financing and bankruptcy transaction support. The Company has an active capital recycling program which provides for the disposition of certain U.S. properties. If the Company accepts sales prices for any of these assets that are less than their net carrying values, the Company would be required to take impairment charges and such amounts could be material. In order to execute the Company’s strategy, the Company intends to continue to strengthen its balance sheet by pursuing deleveraging efforts over time, providing it the necessary flexibility to invest opportunistically and selectively, primarily focusing on U.S. open-air shopping centers.
The Company's investment objective is to increase cash flow, current income and, consequently, the value of its existing portfolio of properties and to seek continued growth in desirable demographic areas with successful retailers through (i) the retail re-tenanting, renovation and expansion of its existing centers and (ii) the selective acquisition of established income-producing real estate properties and properties requiring significant re-tenanting and redevelopment, primarily in open-air shopping centers in geographic regions in which the Company presently operates. The Company may consider investments in other real estate sectors and in geographic markets where it does not presently operate should suitable opportunities arise.
The Company's open-air shopping center properties are designed to attract local area customers and are typically anchored by a national or regional discount department store, grocery store or drugstore tenant offering day-to-day necessities rather than high-priced luxury items. The Company may either purchase or lease income-producing properties in the future and may also participate with other entities in property ownership through partnerships, joint ventures or similar types of co-ownership. Equity investments may be subject to existing mortgage financing and/or other indebtedness. Financing or other indebtedness may be incurred simultaneously or subsequently in connection with such investments. Any such financing or indebtedness would have priority over the Company’s equity interest in such property. The Company may make loans to joint ventures in which it may or may not participate.
The Company seeks to reduce its operating and leasing risks through diversification achieved by the geographic distribution of its properties and a large tenant base. As of December 31, 2016, no single open-air shopping center accounted for more than 1.9% of the Company's annualized base rental revenues, including the proportionate share of base rental revenues from properties in which the Company has less than a 100% economic interest, or more than 1.5% of the Company’s total shopping center GLA. At December 31, 2016, the Company’s five largest tenants were TJX Companies, The Home Depot, Ahold Delhaize, Bed Bath & Beyond and Albertsons which represented 3.4%, 2.4%, 2.1%, 2.0% and 1.8%, respectively, of the Company’s annualized base rental revenues, including the proportionate share of base rental revenues from properties in which the Company has less than a 100% economic interest.
As one of the original participants in the growth of the shopping center industry and one of the nation's largest owners and operators of open-air shopping centers, the Company has established close relationships with a large number of major national and regional retailers and maintains a broad network of industry contacts. Management is associated with and/or actively participates in many shopping center and REIT industry organizations. Notwithstanding these relationships, there are numerous regional and local commercial developers, real estate companies, financial institutions and other investors who compete with the Company for the acquisition of properties and other investment opportunities and in seeking tenants who will lease space in the Company’s properties.
Item 1A. Risk Factors
We are subject to certain business and legal risks including, but not limited to, the following:
Loss of our tax status as a REIT or changes in federal tax laws, regulations, administrative interpretations or court decisions relating to REITs could have significant adverse consequences to us and the value of our securities.
We have elected to be taxed as a REIT for federal income tax purposes under the Code. We believe that we are organized and operate in a manner that has allowed us to qualify and will allow us to remain qualified as a REIT under the Code. However, there can be no assurance that we have qualified or will continue to qualify as a REIT for federal income tax purposes.
Qualification as a REIT involves the application of highly technical and complex Code provisions, for which there are only limited judicial and administrative interpretations. The determination of various factual matters and circumstances not entirely within our control may affect our ability to qualify as a REIT. The rules dealing with federal income taxation are constantly under review by persons involved in the legislative process and by the IRS and U.S. Department of the Treasury. We cannot predict how changes in the tax laws might affect our investors or us. New legislation, regulations, administrative interpretations or court decisions could significantly and negatively change the tax laws with respect to qualification as a REIT, the federal income tax consequences of such qualification or the desirability of an investment in a REIT relative to other investments.
In order to qualify as a REIT, we must satisfy a number of requirements, including requirements regarding the composition of our assets and a requirement that at least 95% of our gross income in any year be derived from qualifying sources, such as “rents from real property.” Also, we must make distributions to stockholders aggregating annually at least 90% of our REIT taxable income, excluding net capital gains. Furthermore, we own a direct or indirect interest in certain subsidiary REITs which elected to be taxed as REITs for federal income tax purposes under the Code. Provided that each subsidiary REIT qualifies as a REIT, our interest in such subsidiary REIT will be treated as a qualifying real estate asset for purposes of the REIT asset tests. To qualify as a REIT, the subsidiary REIT must independently satisfy all of the REIT qualification requirements. The failure of a subsidiary REIT to qualify as a REIT could have an adverse effect on our ability to comply with the REIT income and asset tests, and thus our ability to qualify as a REIT.
If we lose our REIT status, we will face serious tax consequences that will substantially reduce the funds available to pay dividends to stockholders for each of the years involved because:
|
● |
we would not be allowed a deduction for dividends to stockholders in computing our taxable income and we would be subject to federal income tax at regular corporate rates; |
|
● |
we could be subject to the federal alternative minimum tax and possibly increased state and local taxes; |
|
● |
unless we were entitled to relief under statutory provisions, we could not elect to be taxed as a REIT for four taxable years following the year during which we were disqualified; and |
|
● |
we would not be required to make distributions to stockholders. |
As a result of all these factors, our failure to qualify as a REIT or new legislation changes in federal tax laws with respect to qualification as a REIT or the tax consequences of such qualification could also impair our ability to expand our business or raise capital and materially adversely affect the value of our securities.
To maintain our REIT status, we may be forced to borrow funds during unfavorable market conditions , and the unavailability of such capital on favorable terms at the desired times, or at all, may cause us to curtail our inves tment activities and/or to dispose of assets at inopportune times, which could adversely affect our financial condition, results of operations, cash flow and per share trading price of our common stock .
To qualify as a REIT, we generally must distribute to our stockholders at least 90% of our net taxable income each year, excluding net capital gains, and we will be subject to regular corporate income taxes on the amount we distribute that is less than 100% of our net taxable income each year, including capital gains. In addition, we will be subject to a 4% nondeductible excise tax on the amount, if any, by which distributions paid by us in any calendar year are less than the sum of 85% of our ordinary income, 95% of our capital gain net income and 100% of our undistributed income from prior years. While we have historically satisfied these distribution requirements by making cash distributions to our stockholders, a REIT is permitted to satisfy these requirements by making distributions of cash or other property, including, in limited circumstances, its own stock. Assuming we continue to satisfy these distribution requirements with cash, we may need to borrow funds to meet the REIT distribution requirements and avoid the payment of income and excise taxes even if the then prevailing market conditions are not favorable for these borrowings. These borrowing needs could result from differences in timing between the actual receipt of cash and inclusion of income for federal income tax purposes, or the effect of non-deductible capital expenditures, the creation of cash reserves or required debt or amortization payments. These sources, however, may not be available on favorable terms or at all. Our access to third-party sources of capital depends on a number of factors, including the market's perception of our growth potential, our current debt levels, the market price of our common stock, and our current and potential future earnings. We cannot assure you that we will have access to such capital on favorable terms at the desired times, or at all, which may cause us to curtail our investment activities and/or to dispose of assets at inopportune times, and could adversely affect our financial condition, results of operations, cash flow and per share trading price of our common stock.
The tax imposed on REITs engaging in “prohibited transactions” may limit our ability to engage in transactions which would be treated as sales for federal income tax purposes.
A REIT's net income from prohibited transactions is subject to a 100% penalty tax. In general, prohibited transactions are sales or other dispositions of property, other than foreclosure property, held primarily for sale to customers in the ordinary course of business. Although we do not intend to hold any properties that would be characterized as held for sale to customers in the ordinary course of our business, unless a sale or disposition qualifies under certain statutory safe harbors, such characterization is a factual determination and no guarantee can be given that the IRS would agree with our characterization of our properties or that we will always be able to make use of the available safe harbors.
Adverse global market and economic conditions may impede our ability to generate sufficient income and maintain our properties.
The economic performance and value of our properties is subject to all of the risks associated with owning and operating real estate, including but not limited to:
|
● |
changes in the national, regional and local economic climate; |
|
● |
local conditions, including an oversupply of, or a reduction in demand for, space in properties like those that we own; |
|
● |
trends toward smaller store sizes as retailers reduce inventory and new prototypes; |
|
● |
increasing use by customers of e-commerce and online store sites; |
|
● |
the attractiveness of our properties to tenants; |
|
● |
the ability of tenants to pay rent, particularly anchor tenants with leases in multiple locations; |
|
● |
tenants who may declare bankruptcy and/or close stores; |
|
● |
competition from other available properties to attract and retain tenants; |
|
● |
changes in market rental rates; |
|
● |
the need to periodically pay for costs to repair, renovate and re-let space; |
|
● |
changes in operating costs, including costs for maintenance, insurance and real estate taxes; |
|
● |
the expenses of owning and operating properties, which are not necessarily reduced when circumstances such as market factors and competition cause a reduction in income from the properties; |
|
● |
changes in laws and governmental regulations, including those governing usage, zoning, the environment and taxes; |
|
● |
acts of terrorism and war, acts of God and physical and weather-related damage to our properties; and |
|
● |
the potential risk of functional obsolescence of properties over time. |
Competition may limit our ability to purchase new properties or generate sufficient income from tenants and may decrease the occupancy and rental rates for our properties.
Our properties consist primarily of open-air shopping centers and other retail properties. Our performance, therefore, is generally linked to economic conditions in the market for retail space. In the future, the market for retail space could be adversely affected by:
|
● |
weakness in the national, regional and local economies; |
|
● |
the adverse financial condition of some large retailing companies; |
|
● |
the impact of internet sales on the demand for retail space; |
|
● |
ongoing consolidation in the retail sector; and |
|
● |
the excess amount of retail space in a number of markets. |
In addition, numerous commercial developers and real estate companies compete with us in seeking tenants for our existing properties and properties for acquisition. New regional malls, open-air lifestyle centers or other retail shopping centers with more convenient locations or better rents may attract tenants or cause them to seek more favorable lease terms at or prior to renewal. Retailers at our properties may face increasing competition from other retailers, e-commerce, outlet malls, discount shopping clubs, direct mail, telemarketing or home shopping networks, all of which could (i) reduce rents payable to us; (ii) reduce our ability to attract and retain tenants at our properties; or (iii) lead to increased vacancy rates at our properties. We may fail to anticipate the effects of changes in consumer buying practices, particularly of growing online sales and the resulting retailing practices and space needs of our tenants or a general downturn in our tenants’ businesses, which may cause tenants to close stores or default in payment of rent.
Our performance depends on our ability to collect rent from tenants, including anchor tenants, our tenants’ financial condition and our tenants maintaining leases for our properties.
At any time, our tenants may experience a downturn in their business that may significantly weaken their financial condition. As a result, our tenants may delay a number of lease commencements, decline to extend or renew leases upon expiration, fail to make rental payments when due, close stores or declare bankruptcy. Any of these actions could result in the termination of tenants’ leases and the loss of rental income attributable to these tenants’ leases. In the event of a default by a tenant, we may experience delays and costs in enforcing our rights as landlord under the terms of the leases.
In addition, multiple lease terminations by tenants, including anchor tenants, or a failure by multiple tenants to occupy their premises in a shopping center could result in lease terminations or significant reductions in rent by other tenants in the same shopping centers under the terms of some leases. In that event, we may be unable to re-lease the vacated space at attractive rents or at all, and our rental payments from our continuing tenants could significantly decrease. The occurrence of any of the situations described above, particularly if it involves a substantial tenant with leases in multiple locations, could have a material adverse effect on our financial condition, results of operations and cash flows.
A tenant that files for bankruptcy protection may not continue to pay us rent. A bankruptcy filing by, or relating to, one of our tenants or a lease guarantor would bar all efforts by us to collect pre-bankruptcy debts from the tenant or the lease guarantor, or their property, unless the bankruptcy court permits us to do so. A tenant bankruptcy could delay our efforts to collect past due balances under the relevant leases and could ultimately preclude collection of these sums. If a lease is rejected by a tenant in bankruptcy, we would have only a general unsecured claim for damages. As a result, it is likely that we would recover substantially less than the full value of any unsecured claims we hold, if at all.
We may be unable to sell our real estate property investments when appropriate or on terms favorable to us .
Real estate property investments are illiquid and generally cannot be disposed of quickly. In addition, the Code restricts a REIT’s ability to dispose of properties that are not applicable to other types of real estate companies. Therefore, we may not be able to vary our portfolio in response to economic or other conditions promptly or on terms favorable to us within a timeframe that we would need.
We may acquire or develop properties or acquire other real estate related companies, and this may create risks.
We may acquire or develop properties or acquire other real estate related companies when we believe that an acquisition or development is consistent with our business strategies. We may not succeed in consummating desired acquisitions or in completing developments on time or within budget. When we do pursue a project or acquisition, we may not succeed in leasing newly developed or acquired properties at rents sufficient to cover the costs of acquisition or development and operations. Difficulties in integrating acquisitions may prove costly or time-consuming and could divert management’s attention from other activities. Acquisitions or developments in new markets or industries where we do not have the same level of market knowledge may result in poorer than anticipated performance. We may also abandon acquisition or development opportunities that management has begun pursuing and consequently fail to recover expenses already incurred and will have devoted management’s time to a matter not consummated. Furthermore, our acquisitions of new properties or companies will expose us to the liabilities of those properties or companies, some of which we may not be aware of at the time of the acquisition. In addition, development of our existing properties presents similar risks.
Newly acquired or re-developed properties may have characteristics or deficiencies currently unknown to us that affect their value or revenue potential. It is also possible that the operating performance of these properties may decline under our management. As we acquire additional properties, we will be subject to risks associated with managing new properties, including lease-up and tenant retention. In addition, our ability to manage our growth effectively will require us to successfully integrate our new acquisitions into our existing management structure. We may not succeed with this integration or effectively manage additional properties, particularly in secondary markets. Also, newly acquired properties may not perform as expected.
Unsuccessful real estate under development activities or a slowdown in real estate under development activities could have a direct impact on our growth, results of operations and cash flows.
Real estate under development is a component of our operating and investment strategy. We intend to continue pursuing select real estate under development opportunities for long-term investment and construction of retail and/or mixed use properties as opportunities arise. We expect to phase in construction until sufficient preleasing is reached. Our real estate under development and construction activities include the following risks:
|
● |
we may abandon real estate under development opportunities after expending resources and could lose all or part of our investment in such opportunities, including loss of deposits or failure to recover expenses already incurred; |
|
● |
development, construction or operating costs, including increased interest rates and higher materials, transportation, labor, leasing or other costs, may exceed our original estimates; |
|
● |
occupancy rates and rents at a newly completed property may not meet our expectations and may not be sufficient to make the property profitable; |
|
● |
construction or permanent financing may not be available to us on favorable terms or at all; |
|
● |
we may not complete construction and lease-up on schedule due to a variety of factors including construction delays or contractor changes, resulting in increased expenses and construction costs or tenants or operators with the right to terminate pre-construction leases; and |
|
● |
we may not be able to obtain, or may experience delays in obtaining, necessary zoning, land use, building, occupancy and other required governmental permits and authorizations. |
Additionally, new real estate under development activities typically require substantial time and attention from management, and the time frame required for development, construction and lease-up of these properties could require several years to realize any significant cash return. The foregoing risks could cause the development of properties to hinder the Company’s growth and have an adverse effect on its results of operations and cash flows.
Construction and development projects are subject to risks that materially increase the costs of completion.
In the event that we decide to develop and construct new properties or redevelop existing properties, we will be subject to risks and uncertainties associated with construction and development. These risks include, but are not limited to, risks related to obtaining all necessary zoning, land-use, building occupancy and other governmental permits and authorizations, risks related to the environmental concerns of government entities or community groups, risks related to changes in economic and market conditions between development commencement and stabilization, risks related to construction labor disruptions, adverse weather, acts of God or shortages of materials which could cause construction delays and risks related to increases in the cost of labor and materials which could cause construction costs to be greater than projected and adversely impact the amount of our development fees or our results of operations or financial condition.
We face competition in pursuing acquisition or development opportunities that could increase our costs.
We face competition in the acquisition, development, operation and sale of real property from others engaged in real estate investment that could increase our costs associated with purchasing and maintaining assets. Some of these competitors may have greater financial resources than we do. This could result in competition for the acquisition of properties for tenants who lease or consider leasing space in our existing and subsequently acquired properties and for other real estate investment opportunities.
We do not have exclusive control over our joint venture and preferred equity investments, such that we are unable to ensure that our objectives will be pursued.
We have invested in some properties as a co-venturer or partner, instead of owning directly. In these investments, we do not have exclusive control over the development, financing, leasing, management and other aspects of these investments. As a result, the co-venturer or partner might have interests or goals that are inconsistent with ours, take action contrary to our interests or otherwise impede our objectives. These investments involve risks and uncertainties. The co-venturer or partner may fail to provide capital or fulfill its obligations, which may result in certain liabilities to us for guarantees and other commitment. Conflicts arising between us and our partners may be difficult to manage and/or resolve and it could be difficult to manage or otherwise monitor the existing business arrangements. The co-venturer or partner also might become insolvent or bankrupt, which may result in significant losses to us.
In addition, joint venture arrangements may decrease our ability to manage risk and implicate additional risks, such as:
|
● |
potentially inferior financial capacity, diverging business goals and strategies and the need for our venture partner’s continued cooperation; |
|
● |
our inability to take actions with respect to the joint venture activities that we believe are favorable to us if our joint venture partner does not agree; |
|
● |
our inability to control the legal entity that has title to the real estate associated with the joint venture; |
|
● |
our lenders may not be easily able to sell our joint venture assets and investments or may view them less favorably as collateral, which could negatively affect our liquidity and capital resources; |
|
● |
our joint venture partners can take actions that we may not be able to anticipate or prevent, which could result in negative impacts on our debt and equity; and |
|
● |
our joint venture partners’ business decisions or other actions or omissions may result in harm to our reputation or adversely affect the value of our investments. |
Our joint venture and preferred equity investments generally own real estate properties for which the economic performance and value is subject to all the risks associated with owning and operating real estate as described above.
We intend to continue to sell our non-strategic assets and may not be able to recover our investments, which may result in significant losses to us.
There can be no assurance that we will be able to recover the current carrying amount of all of our non-strategic properties and investments and those of our unconsolidated joint ventures in the future. Our failure to do so would require us to recognize impairment charges for the period in which we reached that conclusion, which could materially and adversely affect our business, financial condition, operating results and cash flows.
We have completed, or have nearly completed, our efforts to exit our investments in Mexico, South America and Canada, however, we cannot predict the impact of laws and regulations affecting these international operations, including the United States Foreign Corrupt Practices Act, or the potential that we may face regulatory sanctions.
Our international operations have included properties in Canada, Mexico, Chile, Brazil and Peru and are subject to a variety of United States and foreign laws and regulations, including the United States Foreign Corrupt Practices Act (“FCPA”) and foreign tax laws and regulations. Although we have completely, or have nearly completed, our efforts to exit our investments in Mexico, South America and Canada, we cannot assure you that our past or any current international operations will continue to be found to be in compliance with such laws or regulations. In addition, we cannot predict the manner in which such laws or regulations might be administered or interpreted, or when, or the potential that we may face regulatory sanctions or tax audits as a result of our international operations.
We have received a subpoena from the Enforcement Division of the SEC in connection with the SEC’s investigation, In the Matter of Wal-Mart Stores, Inc. (FW-3678), that the SEC Staff is currently conducting with respect to possible violations of the FCPA. We have cooperated, and will continue to cooperate, with the SEC and the U.S. Department of Justice (“DOJ”), which is conducting a parallel investigation. At this point, we are unable to predict the duration, scope or result of the SEC or DOJ investigations. See “Item 3. Legal Proceedings,” below. The DOJ and the SEC have a broad range of civil and criminal sanctions under the FCPA and other laws and regulations, which they may seek to impose against corporations and individuals in appropriate circumstances including, but not limited to, injunctive relief, disgorgement, fines, penalties and modifications to business practices and compliance programs. Any of these remedial measures, if applicable to us, could have a material adverse impact on our business, results of operations, financial condition and liquidity.
We face risks relating to cybersecurity attacks, loss of confidential information and other business disruptions.
Our business is at risk from and may be impacted by cybersecurity attacks, including attempts to gain unauthorized access to our confidential data and other electronic security breaches. Such cyber-attacks can range from individual attempts to gain unauthorized access to our information technology systems to more sophisticated security threats. There is no guarantee that the measures we employ to prevent, detect and mitigate these threats will be successful in preventing a cyber-attack. Cybersecurity incidents could compromise the confidential information of our tenants, employees and third party vendors and disrupt and effect the efficiency of our business operations.
We may be unable to obtain financing through the debt and equities market, which would have a material adverse effect on our growth strategy, our results of operations and our financial condition.
W e cannot assure you that we will be able to access the credit and/or equity markets to obtain additional debt or equity financing or that we will be able to obtain financing on terms favorable to us. The inability to obtain financing on a timely basis could have negative effects on our business, such as:
|
● |
we could have great difficulty acquiring or developing properties, which would materially adversely affect our business strategy; |
|
● |
our liquidity could be adversely affected; |
|
● |
we may be unable to repay or refinance our indebtedness; |
|
● |
we may need to make higher interest and principal payments or sell some of our assets on terms unfavorable to us to fund our indebtedness; or |
|
● |
we may need to issue additional capital stock, which could further dilute the ownership of our existing shareholders. |
Adverse changes in our credit ratings could impair our ability to obtain additional debt and equity financing on terms favorable to us, if at all, and could significantly reduce the market price of our publicly traded securities.
We are subject to f inancial covenants that may restrict our operating and acquisition activities.
Our revolving credit facility, term loan and the indentures under which our senior unsecured debt is issued contain certain financial and operating covenants, including, among other things, certain coverage ratios and limitations on our ability to incur debt, make dividend payments, sell all or substantially all of our assets and engage in mergers and consolidations and certain acquisitions. These covenants may restrict our ability to pursue certain business initiatives or certain acquisition transactions that might otherwise be advantageous. In addition, failure to meet any of the financial covenants could cause an event of default under our revolving credit facility, term loan and the indentures and/or accelerate some or all of our indebtedness, which would have a material adverse effect on us.
Changes in market conditions could adversely affect the market price of our publicly traded securities.
The market price of our publicly traded securities depends on various market conditions, which may change from time-to-time. Among the market conditions that may affect the market price of our publicly traded securities are the following:
|
● |
the extent of institutional investor interest in us; |
|
● |
the reputation of REITs generally and the reputation of REITs with portfolios similar to ours; |
|
● |
the attractiveness of the securities of REITs in comparison to securities issued by other entities, including securities issued by other real estate companies; |
|
● |
our financial condition and performance; |
|
● |
the market’s perception of our growth potential, potential future cash dividends and risk profile; |
|
● |
an increase in market interest rates, which may lead prospective investors to demand a higher distribution rate in relation to the price paid for our shares; and |
|
● |
general economic and financial market conditions. |
We may change the dividend policy for our common stock in the future.
The decision to declare and pay dividends on our common stock in the future, as well as the timing, amount and composition of any such future dividends, will be at the sole discretion of our Board of Directors and will depend on our earnings, operating cash flows, liquidity, financial condition, capital requirements, contractual prohibitions or other limitations under our indebtedness including preferred stock, the annual distribution requirements under the REIT provisions of the Code, state law and such other factors as our Board of Directors deems relevant or are requirements under the Code or state or federal laws. Any negative change in our dividend policy could have a material adverse effect on the market price of our common stock.
We may not be able to recover our investments in mortgage receivables or other investments , which may result in significant losses to us.
In the event of a default by a borrower, it may be necessary for us to foreclose our mortgage or engage in costly negotiations. Delays in liquidating defaulted mortgage loans and repossessing and selling the underlying properties could reduce our investment returns. Furthermore, in the event of default, the actual value of the property securing the mortgage may decrease. A decline in real estate values will adversely affect the value of our loans and the value of the mortgages securing our loans.
Our mortgage receivables may be or become subordinated to mechanics' or materialmen's liens or property tax liens. In these instances, we may need to protect a particular investment by making payments to maintain the current status of a prior lien or discharge it entirely. Where that occurs, the total amount we recover may be less than our total investment, resulting in a loss. In the event of a major loan default or several loan defaults resulting in losses, our investments in mortgage receivables would be materially and adversely affected.
The economic performance and value of our other investments which we do not control and are in retail operations, are subject to risks associated with owning and operating retail businesses, including:
|
● |
changes in the national, regional and local economic climate; |
|
● |
the adverse financial condition of some large retailing companies; |
|
● |
increasing use by customers of e-commerce and online store sites; and |
|
● |
ongoing consolidation in the retail sector, |
A decline in the value of our other investments may require us to recognize an other-than-temporary impairment (“OTTI”) against such assets. When the fair value of an investment is determined to be less than its amortized cost at the balance sheet date, we assess whether the decline is temporary or other-than-temporary. If we intend to sell an impaired asset, or it is more likely than not that we will be required to sell the impaired asset before any anticipated recovery, then we must recognize an OTTI through charges to earnings equal to the entire difference between the assets amortized cost and its fair value at the balance sheet date. When an OTTI is recognized through earnings, a new cost basis is established for the asset and the new cost basis may not be adjusted through earnings for subsequent recoveries in fair value.
We may be subject to liability under environmental laws, ordinances and regulations.
Under various federal, state, and local laws, ordinances and regulations, we may be considered an owner or operator of real property and may be responsible for paying for the disposal or treatment of hazardous or toxic substances released on or in our property, as well as certain other potential costs relating to hazardous or toxic substances (including governmental fines and injuries to persons and property). This liability may be imposed whether or not we knew about, or were responsible for, the presence of hazardous or toxic substances.
Item 1B. Unresolved Staff Comments
None
Item 2. Properties
Real Estate Portfolio . As of December 31, 2016, the Company had interests in 525 shopping center properties aggregating 85.4 million square feet of GLA located in 34 states, Puerto Rico and Canada. In addition, the Company had 384 other property interests, primarily through the Company’s preferred equity investments and other real estate investments, totaling 6.3 million square feet of GLA. The Company’s portfolio includes noncontrolling interests. Open-air shopping centers comprise the primary focus of the Company's current portfolio. As of December 31, 2016, the Company’s Combined Shopping Center Portfolio was 95.4% leased.
The Company's open-air shopping center properties, which are generally owned and operated through subsidiaries or joint ventures, had an average size of 162,618 square feet as of December 31, 2016. The Company generally retains its shopping centers for long-term investment and consequently pursues a program of regular physical maintenance together with major renovations and refurbishing to preserve and increase the value of its properties. This includes renovating existing facades, installing uniform signage, resurfacing parking lots and enhancing parking lot lighting. During 2016, the Company expended $143.5 million in connection with these property improvements and expensed to operations $34.3 million.
The Company's management believes its experience in the real estate industry and its relationships with numerous national and regional tenants gives it an advantage in an industry where ownership is fragmented among a large number of property owners. The Company's open-air shopping centers are usually "anchored" by a national or regional discount department store, grocery store or drugstore. As one of the original participants in the growth of the shopping center industry and one of the nation's largest owners and operators of shopping centers, the Company has established close relationships with a large number of major national and regional retailers. Some of the major national and regional companies that are tenants in the Company's shopping center properties include TJX Companies, The Home Depot, Ahold Delhaize, Bed Bath & Beyond, Albertsons, Ross Stores, Petsmart, Kohl’s, Wal-Mart and Whole Foods.
A substantial portion of the Company's income consists of rent received under long-term leases. Most of the leases provide for the payment of fixed-base rentals monthly in advance and for the payment by tenants of an allocable share of the real estate taxes, insurance, utilities and common area maintenance expenses incurred in operating the shopping centers. Although many of the leases require the Company to make roof and structural repairs as needed, a number of tenant leases place that responsibility on the tenant, and the Company's standard small store lease provides for roof repairs to be reimbursed by the tenant as part of common area maintenance.
Minimum base rental revenues and operating expense reimbursements accounted for 98% and other revenues, including percentage rents, accounted for 2% of the Company's total revenues from rental properties for the year ended December 31, 2016. The Company's management believes that the base rent per leased square foot for many of the Company's existing leases is generally lower than the prevailing market-rate base rents in the geographic regions where the Company operates, reflecting the potential for future growth.
Approximately 29.8% of the Company's leases of consolidated properties also contain provisions requiring the payment of additional rent calculated as a percentage of tenants’ gross sales above predetermined thresholds. Percentage rents accounted for less than 1% of the Company's revenues from rental properties for the year ended December 31, 2016. Additionally, a majority of the Company’s leases have provisions requiring contractual rent increases. The Company’s leases may also include escalation clauses, which provide for increases based upon changes in the consumer price index or similar inflation indices.
As of December 31, 2016, the Company’s consolidated operating portfolio, comprised of 59.2 million square feet of GLA, was 95.2% leased. The consolidated operating portfolio consists entirely of properties located in the U.S., inclusive of Puerto Rico. For the period January 1, 2016 to December 31, 2016, the Company increased the average base rent per leased square foot, which includes the impact of tenant concessions, in its U.S. consolidated portfolio of open-air shopping centers from $14.36 to $14.99, an increase of $0.63. This increase primarily consists of (i) a $0.10 increase relating to acquisitions, (ii) a $0.19 increase relating to dispositions, and (iii) a $0.34 increase relating to new leases signed net of leases vacated and rent step-ups within the portfolio.
The Company has a total of 6,120 leases in the U.S. consolidated operating portfolio. The following table sets forth the aggregate lease expirations for each of the next ten years, assuming no renewal options are exercised. For purposes of the table, the Total Annual Base Rent Expiring represents annualized rental revenue, excluding the impact of straight-line rent, for each lease that expires during the respective year. Amounts in thousands except for number of lease data:
|
Year Ending December 31, |
Number of Leases Expiring |
Square Feet Expiring |
Total Annual Base Rent Expiring |
% of Gross Annual Rent |
|||||||||||||
| (1) | 168 | 484 | $ | 9,892 | 1.2 |
% |
|||||||||||
|
2017 |
717 | 4,075 | $ | 68,822 | 8.2 |
% |
|||||||||||
|
2018 |
894 | 6,309 | $ | 98,788 | 11.7 |
% |
|||||||||||
|
2019 |
903 | 6,653 | $ | 100,430 | 11.9 |
% |
|||||||||||
|
2020 |
819 | 6,101 | $ | 94,589 | 11.2 |
% |
|||||||||||
|
2021 |
793 | 6,745 | $ | 98,678 | 11.7 |
% |
|||||||||||
|
2022 |
518 | 5,280 | $ | 74,069 | 8.8 |
% |
|||||||||||
|
2023 |
273 | 3,425 | $ | 47,962 | 5.7 |
% |
|||||||||||
|
2024 |
237 | 2,954 | $ | 47,138 | 5.6 |
% |
|||||||||||
|
2025 |
225 | 2,168 | $ | 35,144 | 4.2 |
% |
|||||||||||
|
2026 |
234 | 3,735 | $ | 49,768 | 5.9 |
% |
|||||||||||
|
2027 |
156 | 3,033 | $ | 40,761 | 4.8 |
% |
|||||||||||
|
(1) |
Leases currently under month to month lease or in process of renewal |
During 2016, the Company executed 935 leases totaling over 6.8 million square feet in the Company’s consolidated operating portfolio comprised of 344 new leases and 591 renewals and options. The leasing costs associated with these leases are estimated to aggregate $58.4 million or $29.81 per square foot. These costs include $46.4 million of tenant improvements and $12.0 million of leasing commissions. The average rent per square foot on new leases was $18.85 and on renewals and options was $14.97. The Company will seek to obtain rents that are higher than amounts within its expiring leases, however, there are many variables and uncertainties which can significantly affect the leasing market at any time; as such, the Company cannot guarantee that future leases will continue to be signed for rents that are equal to or higher than current amounts.
Ground-Leased Properties . The Company has interests in 44 consolidated shopping center properties that are subject to long-term ground leases where a third party owns and has leased the underlying land to the Company to construct and/or operate a shopping center. The Company pays rent for the use of the land and generally is responsible for all costs and expenses associated with the building and improvements. At the end of these long-term leases, unless extended, the land together with all improvements reverts to the landowner.
More specific information with respect to each of the Company's property interests is set forth in Exhibit 99.1, which is incorporated herein by reference.
Item 3. Legal Proceedings
The Company is not presently involved in any litigation nor, to its knowledge, is any litigation threatened against the Company or its subsidiaries that, in management's opinion, would result in any material adverse effect on the Company's ownership, management or operation of its properties taken as a whole, or which is not covered by the Company's liability insurance.
On January 28, 2013, the Company received a subpoena from the Enforcement Division of the SEC in connection with an investigation, In the Matter of Wal-Mart Stores, Inc. (FW-3678), that the SEC Staff is currently conducting with respect to possible violations of the Foreign Corrupt Practices Act. The Company has cooperated, and will continue to cooperate, with the SEC and the U.S. Department of Justice (“DOJ”), which is conducting a parallel investigation. At this point, we are unable to predict the duration, scope or result of the SEC or DOJ investigations.
Item 4. Mine Safety Disclosures
Not applicable.
Item 5. Market for the Registrant's Common Equity, Related Stockholder Matters and Issuer Purchases of Equity Securities
Market Information :
The table below sets forth, for the quarterly periods indicated, the high and low sales prices per share reported on the NYSE Composite Tape and declared dividends per share for the Company’s common stock. The Company’s common stock is traded on the NYSE under the trading symbol "KIM".
|
Stock Price |
|||||||||||||
|
Period |
High |
Low |
Dividends |
||||||||||
|
2015: |
|||||||||||||
|
First Quarter |
$ | 28.54 | $ | 25.20 | $ | 0.24 | |||||||
|
Second Quarter |
$ | 27.06 | $ | 22.48 | $ | 0.24 | |||||||
|
Third Quarter |
$ | 25.70 | $ | 22.07 | $ | 0.24 | |||||||
|
Fourth Quarter |
$ | 27.33 | $ | 23.98 | $ | 0.255 | (a) | ||||||
|
201 6 : |
|||||||||||||
|
First Quarter |
$ | 29.11 | $ | 24.75 | $ | 0.255 | |||||||
|
Second Quarter |
$ | 31.38 | $ | 26.79 | $ | 0.255 | |||||||
|
Third Quarter |
$ | 32.24 | $ | 28.34 | $ | 0.255 | |||||||
|
Fourth Quarter |
$ | 29.23 | $ | 24.35 | $ | 0.27 | (b) | ||||||
|
(a) |
Paid on January 15, 2016 to stockholders of record on January 4, 2016. |
|
(b) |
Paid on January 15, 2017 to stockholders of record on January 3, 2017. |
Holders : The number of holders of record of the Company's common stock, par value $0.01 per share, was 2,292 as of January 31, 2017.
Dividends : Since the IPO, the Company has paid regular quarterly cash dividends to its stockholders. While the Company intends to continue paying regular quarterly cash dividends, future dividend declarations will be paid at the discretion of the Board of Directors and will depend on the actual cash flows of the Company, its financial condition, capital requirements, the annual distribution requirements under the REIT provisions of the Code and such other factors as the Board of Directors deems relevant. The Company’s Board of Directors will continue to evaluate the Company’s dividend policy on a quarterly basis as they monitor sources of capital and evaluate operating fundamentals. The Company is required by the Code to distribute at least 90% of its REIT taxable income. The actual cash flow available to pay dividends will be affected by a number of factors, including the revenues received from rental properties, the operating expenses of the Company, the interest expense on its borrowings, the ability of lessees to meet their obligations to the Company, the ability to refinance near-term debt maturities and any unanticipated capital expenditures.
The Company has determined that the $1.02 dividend per common share paid during 2016 consisted of 62% ordinary income, an 8% return of capital and 30% capital gain to its stockholders. The $0.96 dividend per common share paid during 2015 consisted of 100% capital gain to its stockholders.
In addition to its common stock offerings, the Company has capitalized the growth in its business through the issuance of unsecured fixed and floating-rate medium-term notes, underwritten bonds, unsecured bank debt, mortgage debt and construction loans, convertible preferred stock and perpetual preferred stock. Borrowings under the Company's revolving credit facility have also been an interim source of funds to both finance the purchase of properties and other investments and meet any short-term working capital requirements. The various instruments governing the Company's issuance of its unsecured public debt, bank debt, mortgage debt and preferred stock impose certain restrictions on the Company with regard to dividends, voting, liquidation and other preferential rights available to the holders of such instruments. See "Management's Discussion and Analysis of Financial Condition and Results of Operations" and Footnotes 13, 14 and 17 of the Notes to Consolidated Financial Statements included in this Form 10-K.
The Company does not believe that the preferential rights available to the holders of its Class I Preferred Stock, Class J Preferred Stock and Class K Preferred Stock, the financial covenants contained in its public bond indentures, as amended, its term loan, or its revolving credit agreements will have an adverse impact on the Company's ability to pay dividends in the normal course to its common stockholders or to distribute amounts necessary to maintain its qualification as a REIT.
The Company maintains a dividend reinvestment and direct stock purchase plan (the "Plan") pursuant to which common and preferred stockholders and other interested investors may elect to automatically reinvest their dividends to purchase shares of the Company’s common stock or, through optional cash payments, purchase shares of the Company’s common stock. The Company may, from time-to-time, either (i) purchase shares of its common stock in the open market or (ii) issue new shares of its common stock for the purpose of fulfilling its obligations under the Plan.
Recent Sales of Unregister Securities:
None.
Issuer Purchases of Equity Securities : During the year ended December 31, 2016, the Company repurchased 257,477 shares in connection with common shares surrendered or deemed surrendered to the Company to satisfy statutory minimum tax withholding obligations in connection with the vesting of restricted stock awards under the Company’s equity-based compensation plans. The Company expended approximately $6.9 million to repurchase these shares.
|
Period |
Total Number of Shares Purchased |
Average Price Paid per Share |
Total Number of Shares Purchased as Part of Publicly Announced Plans or Programs |
Approximate Dollar Value of Shares that May Yet Be Purchased Under the Plans or Programs (in millions) |
||||||||||||||
|
January 1, 2016 |
– | January 31, 2016 | 35,768 | $ | 26.46 | - | $ | - | ||||||||||
|
February 1, 2016 |
– | February 29, 2016 | 186,476 | $ | 26.37 | - | - | |||||||||||
|
March 1, 2016 |
– | March 31, 2016 | 621 | $ | 27.78 | - | - | |||||||||||
|
April 1, 2016 |
– | April 30, 2016 | - | $ | - | - | - | |||||||||||
|
May 1, 2016 |
– | May 31, 2016 | 16,069 | $ | 28.61 | - | - | |||||||||||
|
June 1, 2016 |
– | June 30, 2016 | 1,110 | $ | 29.66 | - | - | |||||||||||
|
July 1, 2016 |
– | July 31, 2016 | - | $ | - | - | - | |||||||||||
|
August 1, 2016 |
– | August 31, 2016 | 11,858 | $ | 31.27 | - | - | |||||||||||
|
September 1, 2016 |
– | September 30, 2016 | 2,056 | $ | 28.64 | - | - | |||||||||||
|
October 1, 2016 |
– | October 31, 2016 | 3,519 | $ | 27.71 | - | - | |||||||||||
|
November 1, 2016 |
– | November 30, 2016 | - | $ | - | - | - | |||||||||||
|
December 1, 2016 |
– | December 31, 2016 | - | $ | - | - | - | |||||||||||
|
Total |
257,477 | $ | 26.80 | - | $ | - | ||||||||||||
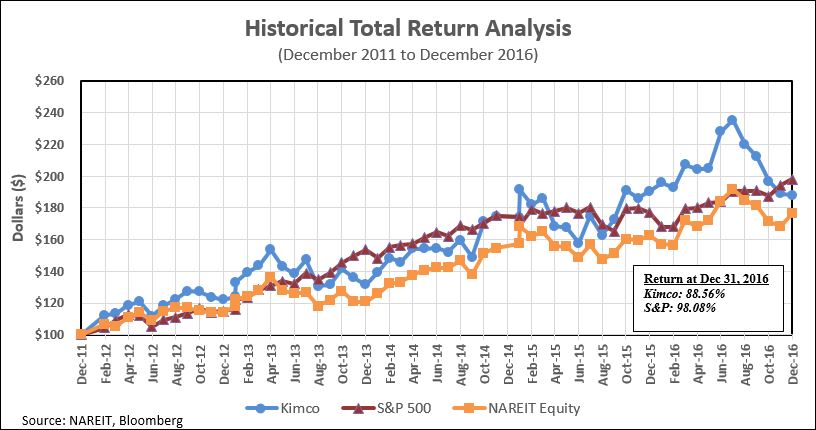
Total Stockholder Return Performance : The following performance chart compares, over the five years ended December 31, 2016, the cumulative total stockholder return on the Company’s common stock with the cumulative total return of the S&P 500 Index and the cumulative total return of the NAREIT Equity REIT Total Return Index (the "NAREIT Equity Index") prepared and published by the National Association of Real Estate Investment Trusts ("NAREIT"). Equity real estate investment trusts are defined as those which derive more than 75% of their income from equity investments in real estate assets. The NAREIT Equity Index includes all tax qualified equity real estate investment trusts listed on the New York Stock Exchange, American Stock Exchange or the NASDAQ National Market System. Stockholder return performance, presented quarterly for the five years ended December 31, 2016, is not necessarily indicative of future results. All stockholder return performance assumes the reinvestment of dividends. The information in this paragraph and the following performance chart are deemed to be furnished, not filed.
|
Item 6. Selected Financial Data
The following table sets forth selected, historical, consolidated financial data for the Company and should be read in conjunction with the Consolidated Financial Statements of the Company and Notes thereto and Management’s Discussion and Analysis of Financial Condition and Results of Operations included in this Form 10-K.
The Company believes that the book value of its real estate assets, which reflects the historical costs of such real estate assets less accumulated depreciation, is not indicative of the current market value of its properties. Historical operating results are not necessarily indicative of future operating performance.
| Year ended December 31, | ||||||||||||||||||||
| 201 6 | 201 5 | 201 4 | 201 3 | 2012(2) | ||||||||||||||||
| (in thousands, except per share information) | ||||||||||||||||||||
|
Operating Data: |
||||||||||||||||||||
|
Revenues from rental properties (1) |
$ | 1,152,401 | $ | 1,144,474 | $ | 958,888 | $ | 825,210 | $ | 755,851 | ||||||||||
|
Interest expense (2) |
$ | 192,549 | $ | 218,891 | $ | 203,759 | $ | 212,240 | $ | 223,736 | ||||||||||
|
Early extinguishment of debt charges |
$ | 45,674 | $ | - | $ | - | $ | - | $ | - | ||||||||||
|
Depreciation and amortization (2) |
$ | 355,320 | $ | 344,527 | $ | 258,074 | $ | 224,713 | $ | 214,827 | ||||||||||
|
Gain on sale of operating properties, net (2) |
$ | 92,823 | $ | 132,908 | $ | 618 | $ | 2,798 | $ | 8,475 | ||||||||||
|
Provision for income taxes, net (3) |
$ | 78,583 | $ | 67,325 | $ | 22,438 | $ | 32,654 | $ | 15,603 | ||||||||||
|
Impairment charges (4) |
$ | 93,266 | $ | 45,383 | $ | 39,808 | $ | 32,247 | $ | 10,289 | ||||||||||
|
Income from continuing operations (5) |
$ | 378,850 | $ | 894,190 | $ | 375,133 | $ | 276,884 | $ | 172,760 | ||||||||||
|
Income per common share, from continuing operations: |
||||||||||||||||||||
|
Basic |
$ | 0.79 | $ | 2.01 | $ | 0.77 | $ | 0.53 | $ | 0.19 | ||||||||||
|
Diluted |
$ | 0.79 | $ | 2.00 | $ | 0.77 | $ | 0.53 | $ | 0.19 | ||||||||||
|
Weighted average number of shares of common stock: |
||||||||||||||||||||
|
Basic |
418,402 | 411,319 | 409,088 | 407,631 | 405,997 | |||||||||||||||
|
Diluted |
419,709 | 412,851 | 411,038 | 408,614 | 406,689 | |||||||||||||||
|
Cash dividends declared per common share |
$ | 1.035 | $ | 0.975 | $ | 0.915 | $ | 0.855 | $ | 0.78 | ||||||||||
|
December 31, |
||||||||||||||||||||
|
201 6 |
201 5 |
201 4 |
201 3 |
201 2 |
||||||||||||||||
|
(in thousands) |
||||||||||||||||||||
|
Balance Sheet Data: |
||||||||||||||||||||
|
Real estate, before accumulated depreciation |
$ | 12,008,075 | $ | 11,568,809 | $ | 10,018,226 | $ | 9,123,344 | $ | 8,947,287 | ||||||||||
|
Total assets |
$ | 11,230,600 | $ | 11,344,171 | $ | 10,261,400 | $ | 9,644,247 | $ | 9,731,928 | ||||||||||
|
Total debt |
$ | 5,066,368 | $ | 5,376,310 | $ | 4,595,970 | $ | 4,202,018 | $ | 4,176,011 | ||||||||||
|
Total stockholders' equity |
$ | 5,256,139 | $ | 5,046,300 | $ | 4,774,785 | $ | 4,632,417 | $ | 4,765,160 | ||||||||||
|
Cash flow provided by operations |
$ | 592,096 | $ | 493,701 | $ | 629,343 | $ | 570,035 | $ | 479,054 | ||||||||||
|
Cash flow provided by/(used for) investing activities |
$ | 165,383 | $ | 21,365 | $ | 126,705 | $ | 72,235 | $ | (51,000 | ) | |||||||||
|
Cash flow used for financing activities |
$ | (804,527 | ) | $ | (512,854 | ) | $ | (717,494 | ) | $ | (635,377 | ) | $ | (399,061 | ) | |||||
(1) Does not include revenues (i) from rental properties relating to unconsolidated joint ventures and (ii) from properties included in discontinued operations.
(2) Does not include amounts reflected in discontinued operations.
(3) Does not include amounts reflected in discontinued operations. Amounts include income taxes related to gain on sale of operating properties.
(4) Amounts exclude noncontrolling interests and amounts reflected in discontinued operations.
(5) Amounts include gain on sale of operating properties, net of tax and net of income attributable to noncontrolling interests.
Item 7. Management's Discussion and Analysis of Financial Condition and Results of Operations
The following discussion should be read in conjunction with the Consolidated Financial Statements and Notes thereto included in this Form 10-K. Historical results and percentage relationships set forth in the Consolidated Statements of Income contained in the Consolidated Financial Statements, including trends, should not be taken as indicative of future operations.
Executive Summary
Kimco Realty Corporation is one of the nation’s largest publicly-traded owners and operators of open-air shopping centers. As of December 31, 2016, the Company had interests in 525 shopping center properties aggregating 85.4 million square feet of GLA located in 34 states, Puerto Rico and Canada. In addition, the Company had 384 other property interests, primarily through the Company’s preferred equity investments and other real estate investments, totaling 6.3 million square feet of GLA.
The executive officers are engaged in the day-to-day management and operation of real estate exclusively with the Company, with nearly all operating functions, including leasing, asset management, maintenance, construction, legal, finance and accounting, administered by the Company.
The Company’s strategy is to be the premier owner and operator of open-air shopping centers through investments primarily in the U.S. To achieve this strategy the Company is (i) continuing to transform the quality of its portfolio by disposing of lesser quality assets and acquiring larger higher quality properties in key markets identified by the Company, for which substantial progress has been achieved as of the end of 2016, (ii) simplifying its business by: (a) reducing the number of joint venture investments and (b) exiting Mexico, South America and Canada, for which the exit of South America has been completed, Mexico has been substantially completed and the Company essentially sold all operating properties in Canada, (iii) pursuing redevelopment opportunities within its portfolio to increase overall value and (iv) selectively acquiring land parcels in our key markets for real estate development projects for long-term investment. As part of the Company’s strategy each property is evaluated for its highest and best use, which may include residential and mixed-use components. In addition, the Company may consider other opportunistic investments related to retailer controlled real estate such as, repositioning underperforming retail locations, retail real estate financing and bankruptcy transaction support. The Company has an active capital recycling program which provides for the disposition of certain U.S. properties. If the Company accepts sales prices for any of these assets that are less than their net carrying values, the Company would be required to take impairment charges and such amounts could be material. In order to execute the Company’s strategy, the Company intends to continue to strengthen its balance sheet by pursuing deleveraging efforts over time, providing it the necessary flexibility to invest opportunistically and selectively, primarily focusing on U.S. open-air shopping centers.
The following highlights the Company’s significant transactions, events and results that occurred during the year ended December 31, 2016:
Financial and Portfolio Information :
|
● |
Net income available to common shareholders was $332.6 million, or $0.79 per diluted share for the year ended December 31, 2016, as compared to $831.2 million, or $2.00 per diluted share for the corresponding period in 2015. This change was primarily attributable to lower gains on sales of operating properties (including joint ventures) of $378.9 million, net of tax and $49.9 million of higher impairments attributable to the sale or pending disposition of operating properties in 2016 (see “Results of Operations” for additional detail). |
|
● |
Funds from operations (“FFO”) decreased to $555.7 million or $1.32 per diluted share for the year ended December 31, 2016 from $643.2 million or $1.56 per diluted share for the year ended December 31, 2015, (see additional disclosure on FFO beginning on page 30). |
|
● |
FFO as adjusted increased to $629.4 million or $1.50 per diluted share for the year ended December 31, 2016 from $603.4 million or $1.46 per diluted share for the year ended December 31, 2015, (see additional disclosure on FFO beginning on page 30). |
|
● |
U.S. same property net operating income (“U.S. same property NOI”) increased 2.8% for the year ended December 31, 2016, as compared to the corresponding period in 2015 (see additional disclosure on U.S. same property NOI beginning on page 32). |
|
● |
Executed 935 new leases, renewals and options totaling approximately 6.8 million square feet in the Consolidated Operating Portfolio. |
|
● |
The Company’s consolidated operating portfolio occupancy at December 31, 2016 was 95.2%. |
Acquisition Activity (see Footnotes 3, 4 and 8 of the Notes to Consolidated Financial Statements included in this Form 10-K):
|
● |
Acquired 12 consolidated operating properties and two out-parcels comprising an aggregate 2.7 million square feet of GLA, for an aggregate purchase price of $645.6 million including the assumption of $284.7 million of non-recourse mortgage debt encumbering 10 of the properties. The Company acquired nine of these properties for an aggregate purchase price of $505.9 million from joint ventures in which the Company previously held noncontrolling ownership interests and recognized an aggregate gain on change in control of interests of $57.4 million from the fair value adjustment. |
|
● |
The Company acquired from its partner the remaining ownership interest in a development project that was held in a joint venture for a gross purchase price of $84.2 million. Additionally, during the year ended December 31, 2016, the Company acquired additional land parcels related to two existing development projects for $13.8 million. |
Disposition Activity (see Footnote 5 of the Notes to Consolidated Financial Statements included in this Form 10-K):
|
● |
During 2016, the Company disposed of 30 consolidated operating properties and two out-parcels, in separate transactions, for an aggregate sales price of $378.7 million. These transactions resulted in (i) an aggregate gain of $86.8 million, after income tax expense, and (ii) aggregate impairment charges of $37.2 million, which were taken prior to sale, before income tax benefit of $10.0 million. |
Capital Activity (for additional details see Liquidity and Capital Resources below):
|
|
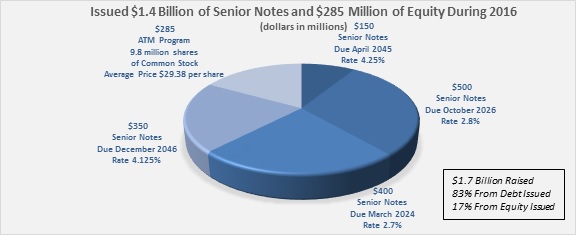
During the years ended December 31, 2016 and 2015, the Company repaid the following notes (dollars in millions):
|
Type |
Date Paid |
Maturity Date |
Amount Repaid (USD) |
Interest Rate |
|||||||||
|
Canadian Notes Payable |
Aug-16 |
Apr-18 |
- | Aug-20 | $ | 270.9 | 3.855% | - | 5.99% | ||||
|
Senior Unsecured Note |
Aug-16 |
|
May-17 | $ | 290.9 | 5.70% | |||||||
|
Medium Term Notes |
Mar-16 |
|
Mar-16 | $ | 300.0 | 5.783% | |||||||
Also during 2016, the Company (i) repaid $400.0 million of the Company’s $650.0 million unsecured term loan, (ii) assumed $289.0 million of individual non-recourse mortgage debt relating to the acquisition of 10 properties, including $4.3 million associated with fair value debt adjustments, (iii) paid off $703.0 million of mortgage debt (including fair value of debt adjustment of $2.1 million) that encumbered 47 operating properties and (iv) disposed of an encumbered property through foreclosure with debt of $25.6 million (including fair value of debt adjustment of $0.4 million) .
As a result of the above activity the Company was able to extend its debt maturity profile, including extension options, as of December 31, 2016 as follows:
|
|
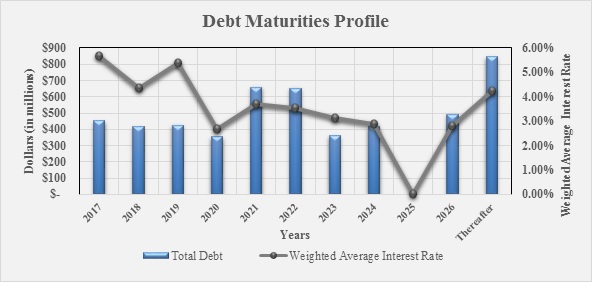
Critical Accounting Policies
The Consolidated Financial Statements of the Company include the accounts of the Company, its wholly-owned subsidiaries and all entities in which the Company has a controlling interest, including where the Company has been determined to be a primary beneficiary of a variable interest entity in accordance with the consolidation guidance of the FASB Accounting Standards Codification (“ASC”). The Company applies these provisions to each of its joint venture investments to determine whether the cost, equity or consolidation method of accounting is appropriate. The preparation of financial statements in conformity with accounting principles generally accepted in the United States requires management to make estimates and assumptions in certain circumstances that affect amounts reported in the accompanying Consolidated Financial Statements and related notes. In preparing these financial statements, management has made its best estimates and assumptions that affect the reported amounts of assets and liabilities. These estimates are based on, but not limited to, historical results, industry standards and current economic conditions, giving due consideration to materiality. The most significant assumptions and estimates relate to revenue recognition and the recoverability of trade accounts receivable, depreciable lives, valuation of real estate and intangible assets and liabilities, valuation of joint venture investments and other investments, realizability of deferred tax assets and uncertain tax positions. Application of these assumptions requires the exercise of judgment as to future uncertainties, and, as a result, actual results could materially differ from these estimates.
The Company is required to make subjective assessments as to whether there are impairments in the value of its real estate properties, investments in joint ventures, marketable securities and other investments. The Company’s reported net earnings are directly affected by management’s estimate of impairments and/or valuation allowances.
Revenue Recognition and Accounts Receivable
Base rental revenues from rental properties are recognized on a straight-line basis over the terms of the related leases. Certain of these leases also provide for percentage rents based upon the level of sales achieved by the lessee. These percentage rents are recorded once the required sales level is achieved. Operating expense reimbursements are recognized as earned. Rental income may also include payments received in connection with lease termination agreements. In addition, leases typically provide for reimbursement to the Company of common area maintenance, real estate taxes and other operating expenses.
The Company makes estimates of the uncollectability of its accounts receivable related to base rents, straight-line rent, expense reimbursements and other revenues. The Company analyzes accounts receivable and historical bad debt levels, customer credit-worthiness and current economic trends when evaluating the adequacy of the allowance for doubtful accounts. In addition, tenants in bankruptcy are analyzed and estimates are made in connection with the expected recovery of pre-petition and post-petition claims. The Company’s reported net earnings are directly affected by management’s estimate of the collectability of accounts receivable.
Real Estate
The Company’s investments in real estate properties are stated at cost, less accumulated depreciation and amortization. Expenditures for maintenance and repairs are charged to operations as incurred. Significant renovations and replacements, which improve and extend the life of the asset, are capitalized.
Upon acquisition of real estate operating properties, the Company estimates the fair value of acquired tangible assets (consisting of land, building, building improvements and tenant improvements) and identified intangible assets and liabilities (consisting of above and below-market leases, in-place leases and tenant relationships, where applicable), assumed debt and redeemable units issued at the date of acquisition, based on evaluation of information and estimates available at that date. Fair value is determined based on an exit price approach, which contemplates the price that would be received to sell an asset or paid to transfer a liability in an orderly transaction between market participants at the measurement date. If, up to one year from the acquisition date, information regarding fair value of the assets acquired and liabilities assumed is received and estimates are refined, appropriate adjustments are recognized in the reporting period in which the adjustment is identified. The Company expenses transaction costs associated with business combinations in the period incurred. The Company has elected to early adopt ASU 2017-01, Business Combinations (Topic 805): Clarifying the Definition of a Business at the beginning of its fiscal year ended December 31, 2017, including its interim periods within the year, and will appropriately apply the guidance to its prospective asset acquisitions of operating properties, which includes the capitalization of acquisition costs.
Depreciation and amortization are provided on the straight-line method over the estimated useful lives of the assets, as follows:
|
Buildings and building improvements (in years) |
15 to 50 |
|
|
Fixtures, leasehold and tenant improvements |
Terms of leases or useful |
|
|
(including certain identified intangible assets) |
lives, whichever is shorter |
The Company is required to make subjective assessments as to the useful lives of its properties for purposes of determining the amount of depreciation to reflect on an annual basis with respect to those properties. These assessments have a direct impact on the Company’s net earnings.
On a continuous basis, management assesses whether there are any indicators, including property operating performance, changes in anticipated holding period and general market conditions, that the value of the real estate properties (including any related amortizable intangible assets or liabilities) may be impaired. A property value is considered impaired only if management’s estimate of current and projected operating cash flows (undiscounted and unleveraged) of the property over its anticipated hold period is less than the net carrying value of the property. Such cash flow projections consider factors such as expected future operating income, trends and prospects, as well as the effects of demand, competition and other factors. To the extent impairment has occurred, the carrying value of the property would be adjusted to reflect the estimated fair value of the property.
When a real estate asset is identified by management as held-for-sale, the Company ceases depreciation of the asset and estimates the sales price of such asset net of selling costs. If, in management’s opinion, the net sales price of the asset is less than the net book value of such asset, an adjustment to the carrying value would be recorded to reflect the estimated fair value of the property.
Investments in Unconsolidated Joint Ventures
The Company accounts for its investments in unconsolidated joint ventures under the equity method of accounting as the Company exercises significant influence, but does not control, these entities. These investments are recorded initially at cost and are subsequently adjusted for cash contributions and distributions. Earnings for each investment are recognized in accordance with each respective investment agreement and, where applicable, are based upon an allocation of the investment’s net assets at book value as if the investment was hypothetically liquidated at the end of each reporting period.
The Company’s joint ventures and other real estate investments primarily consist of co-investments with institutional and other joint venture partners in open-air shopping center properties, consistent with its core business. These joint ventures typically obtain non-recourse third-party financing on their property investments, thus contractually limiting the Company’s exposure to losses to the amount of its equity investment, and, due to the lender’s exposure to losses, a lender typically will require a minimum level of equity in order to mitigate its risk. From time to time the joint ventures will obtain unsecured debt, which may be guaranteed by the joint venture. The Company’s exposure to losses associated with its unconsolidated joint ventures is primarily limited to its carrying value in these investments.
On a continuous basis, management assesses whether there are any indicators, including property operating performance and general market conditions, that the value of the Company’s investments in unconsolidated joint ventures may be impaired. An investment’s value is impaired only if management’s estimate of the fair value of the investment is less than the carrying value of the investment and such difference is deemed to be other-than-temporary. To the extent impairment has occurred, the loss shall be measured as the excess of the carrying amount of the investment over the estimated fair value of the investment.
The Company’s estimated fair values are based upon a discounted cash flow model for each joint venture that includes all estimated cash inflows and outflows over a specified holding period and, where applicable, any estimated debt premiums. Capitalization rates, discount rates and credit spreads utilized in these models are based upon rates that the Company believes to be within a reasonable range of current market rates.
Realizability of Deferred Tax Assets and Uncertain Tax Positions
The Company is subject to federal, state and local income taxes on the income from its activities relating to its TRS activities and subject to local taxes on certain non-U.S. investments. The Company accounts for income taxes using the asset and liability method, which requires that deferred tax assets and liabilities be recognized based on future tax consequences of temporary differences between the financial statement carrying amounts of existing assets and liabilities and their respective tax basis. Deferred tax assets and liabilities are measured using enacted tax rates expected to apply in the years in which temporary differences are expected to be recovered or settled. The effect on deferred tax assets and liabilities of a change in tax rates is recognized in earnings in the period when the changes are enacted.
A reduction of the carrying amounts of deferred tax assets by a valuation allowance is required, if based on the evidence available, it is more likely than not (a likelihood of more than 50 percent) that some portion or all of the deferred tax assets will not be realized. The valuation allowance should be sufficient to reduce the deferred tax asset to the amount that is more likely than not to be realized.
The Company considers all available evidence, both positive and negative, to determine whether, based on the weight of that evidence, a valuation allowance is needed. Information about an enterprise's current financial position and its results of operations for the current and preceding years is supplemented by all currently available information about future years. The Company must use judgment in considering the relative impact of negative and positive evidence. The Company’s reported net earnings are directly affected by management’s judgement in determining a valuation allowance.
The Company recognizes and measures benefits for uncertain tax positions, which requires significant judgment from management. Although the Company believes it has adequately reserved for any uncertain tax positions, no assurance can be given that the final tax outcome of these matters will not be different. The Company adjusts these reserves in light of changing facts and circumstances, such as the closing of a tax audit or the refinement of an estimate. Changes in the recognition or measurement of uncertain tax positions could result in material increases or decreases in the Company’s income tax expense in the period in which a change is made, which could have a material impact on operating results (see Footnote 22 of the Notes to Consolidated Financial Statements included in this Form 10-K).
Results of Operations
Comparison 201 6 to 201 5
|
201 6 |
201 5 |
Change |
% change |
|||||||||||||
|
(amounts in millions) |
||||||||||||||||
|
Revenues from rental properties (1) |
$ | 1,152.4 | $ | 1,144.5 | $ | 7.9 | 0.7% | |||||||||
|
Rental property expenses: (2) |
||||||||||||||||
|
Rent |
$ | 11.0 | $ | 12.3 | $ | (1.3 | ) | (10.6%) | ||||||||
|
Real estate taxes |
146.6 | 147.2 | (0.6 | ) | (0.4%) | |||||||||||
|
Operating and maintenance |
140.9 | 145.0 | (4.1 | ) | (2.8%) | |||||||||||
| $ | 298.5 | $ | 304.5 | $ | (6.0 | ) | (2.0%) | |||||||||
|
Depreciation and amortization (3) |
$ | 355.3 | $ | 344.5 | $ | 10.8 | 3.1% | |||||||||
|
(1) |
Revenues from rental properties increased primarily from the combined effect of (i) the acquisition of operating properties during 2016 and 2015, providing incremental revenues for the year ended December 31, 2016, of $57.4 million, as compared to the corresponding period in 2015 and (ii) the completion of certain redevelopment projects, tenant buyouts and net growth in the current portfolio, providing incremental revenues for the year ended December 31, 2016, of $17.4 million, as compared to the corresponding period in 2015, partially offset by (iii) a decrease in revenues of $66.9 million from properties sold during 2016 and 2015. |
|
(2) |
Rental property expenses include (i) rent expense relating to ground lease payments for which the Company is the lessee, (ii) real estate tax expense for consolidated properties for which the Company has a controlling ownership interest and (iii) operating and maintenance expense, which consists of property related costs including repairs and maintenance costs, roof repair, landscaping, parking lot repair, snow removal, utilities, property insurance costs, security and various other property related expenses. Rental property expenses decreased $6.0 million for the year ended December 31, 2016, as compared to the corresponding period in 2015, primarily due to the disposition of properties during 2016 and 2015, partially offset by the acquisition of properties during 2016 and 2015. |
|
(3) |
Depreciation and amortization increased for the year ended December 31, 2016, as compared to the corresponding period in 2015, primarily due to operating property acquisitions during 2016 and 2015 and write-offs relating to the Company’s redevelopment projects in 2016, partially offset by property dispositions. |
Management and other fee income decreased $3.9 million to $18.4 million for the year ended December 31, 2016, as compared to $22.3 million for the corresponding period in 2015. This decrease is primarily attributable to (i) the sale of properties within various joint venture investments and the acquisition of partnership interests in joint ventures by the Company during 2016 and 2015, and (ii) the recognition of enhancement fee income related to the Company’s prior investment in InTown Suites of $1.2 million during 2015.
General and administrative costs include employee-related expenses (salaries, bonuses, equity awards, benefits, severance costs and payroll taxes), professional fees, office rent, travel expense and other company-specific expenses. General and administrative expenses decreased $5.4 million for the year ended December 31, 2016, as compared to the corresponding period in 2015, primarily due to a decrease in severance costs and a reduction in professional fees.
During the year ended December 31, 2016, the Company recognized impairment charges related solely to adjustments to property carrying values of $93.3 million for which the Company’s estimated fair value was primarily based on third party appraisals and third party offers through signed contracts, letters of intent or discounted cash flow models. During the year ended December 31, 2015, the Company recognized impairment charges of $45.5 million, before noncontrolling interests and income taxes, of which $0.1 million is included in discontinued operations. The 2015 impairment charges consisted of (i) $30.3 million related to adjustments to property carrying values, (ii) $9.0 million relating to a cost method investment, (iii) $5.3 million related to certain investments in other real estate investments and (iv) $0.8 million related to marketable debt securities investments. The adjustments to property carrying values for 2016 and 2015 were recognized in connection with the Company’s efforts to market for sale certain properties and management’s assessment as to the likelihood and timing of such potential transactions and the anticipated hold period for such properties. Certain of the calculations to determine fair value utilized unobservable inputs and as such are classified as Level 3 of the fair value hierarchy. For additional disclosure, see Footnote 16 of the Notes to Consolidated Financial Statements included in this Form 10-K.
Interest, dividends and other investment income decreased $37.6 million to $1.5 million for the year ended December 31, 2016, as compared to $39.1 million for the corresponding period in 2015. This decrease is primarily due to the sale of certain marketable securities during the year ended December 31, 2015, which resulted in an aggregate gain of $39.9 million.
Interest expense decreased $26.4 million to $192.5 million for the year ended December 31, 2016, as compared to $218.9 million for the corresponding period in 2015. This decrease is primarily the result of lower levels of borrowings and lower interest rates on borrowings during 2016, as compared to 2015.
During the year ended December 31, 2016, the Company incurred early extinguishment of debt charges aggregating $45.7 million in connection with the optional make-whole provisions of unsecured notes that were repaid prior to maturity and prepayment penalties on a mortgage encumbering 10 operating properties, which the Company also paid prior to the scheduled maturity date. See “Liquidity and Capital Resources” for additional details.
Provision for income taxes, net increased $12.3 million to $72.5 million for the year ended December 31, 2016, as compared to $60.2 million for the corresponding period in 2015. This increase is primarily due to (i) an increase in the Company’s valuation allowance of $63.5 million as a result of the Company’s merger of its taxable REIT subsidiary into a wholly owned LLC of the Company, partially offset by (ii) a decrease in foreign tax expense of $26.1 million primarily relating to fewer sales of unconsolidated properties within the Company’s Canadian portfolio which were subject to foreign taxes at a consolidated reporting entity level during 2016, as compared to 2015, (iii) an increase in tax benefit of $13.4 million related to impairment charges recognized during 2016, as compared to 2015, (iv) a decrease of $4.5 million in tax expense related to gains recognized during 2015, as compared to 2016, (v) a decrease of $3.0 million in tax expense on operations due to fewer properties in the taxable REIT subsidiary as a result of the TRS Merger, (vi) a decrease of $2.0 million resulting from the favorable settlement of a tax audit during 2016 and (vii) a decrease in tax expense of $2.0 million relating to equity income recognized in connection with the Company’s Albertsons investment during 2015.
Equity in income of joint ventures, net decreased $261.7 million to $218.7 million for the year ended December 31, 2016, as compared to $480.4 million for the corresponding period in 2015. This decrease is primarily due to (i) a decrease in gains of $248.1 million resulting from fewer sales of properties and interests within various joint venture investments, including the Company’s Canadian Portfolio, during 2016, as compared to 2015 and (ii) lower equity in income of $26.0 million resulting from the sales of properties within various joint venture investments and the acquisition of partnership interests in joint ventures by the Company during 2016 and 2015, partially offset by (iii) a decrease in impairment charges of $7.2 million recognized during 2016, as compared to 2015.
During 2016, the Company acquired nine operating properties and one development project from joint ventures in which the Company had a noncontrolling interest. The Company recorded a gain on change in control of interests of $57.4 million related to the fair value adjustment associated with its previously held equity interest in the operating properties.
During 2015, the Company acquired 43 properties from joint ventures in which the Company had noncontrolling interests. The Company recorded a net gain on change in control of interests of $149.2 million related to the fair value adjustment associated with its previously held equity interests in these properties.
Equity in income from other real estate investments, net decreased $8.3 million to $27.8 million for the year ended December 31, 2016, as compared to $36.1 million for the corresponding period in 2015. This decrease is primarily due to (i) a decrease in equity in income of $4.9 million resulting from a cash distribution received in excess of the Company’s carrying basis in 2015, (ii) a decrease in income resulting from the sale of the Company’s leveraged lease portfolio of $3.8 million during 2015 and (iii) a decrease of $2.8 million in earnings from the Company’s Preferred Equity Program during the year ended December 31, 2016, primarily resulting from the sale of the Company’s interests in certain preferred equity investments during 2016 and 2015, partially offset by (iv) an increase of $3.3 million in profit participation from the Company’s Preferred Equity Program from capital transactions during the year ended December 31, 2016, as compared to the corresponding period in 2015.
During 2016, the Company disposed of 30 consolidated operating properties and two out-parcels, in separate transactions, for an aggregate sales price of $378.7 million. These transactions resulted in an aggregate gain of $86.8 million, after income tax expense, and aggregate impairment charges of $37.2 million which were taken prior to sale, before income tax benefit of $10.0 million.
During 2015, the Company disposed of 89 consolidated operating properties and eight out-parcels, in separate transactions, for an aggregate sales price of $492.5 million. These transactions resulted in an aggregate gain of $143.6 million, after income tax expense, and aggregate impairment charges of $10.2 million, before income tax expense of $2.3 million. Additionally, during 2015, the Company disposed of its remaining operating property in Chile for a sales price of $51.3 million. This transaction resulted in the release of a cumulative foreign currency translation loss of $19.6 million due to the Company’s liquidation of its investment in Chile, partially offset by a gain on sale of $1.8 million, after income tax expense.
Net income attributable to the Company was $378.9 million for the year ended December 31, 2016, as compared to $894.1 million for the year ended December 31, 2015. On a diluted per share basis, net income available to the Company for the year ended December 31, 2016 was $0.79 as compared to $2.00 for the year ended December 31, 2015. These changes are primarily attributable to (i) a decrease in equity in income of joint ventures, net, resulting from gains on sales of properties within various joint venture investments during 2015, (ii) a decrease in gain on change in control of interests, net related to the fair value adjustment associated with the Company’s previously held equity interests in properties acquired from various joint ventures during 2016 and 2015, (iii) an increase in impairments of operating properties during 2016, (iv) an increase in early extinguishment of debt charges resulting from the prepayment of secured and unsecured debt by the Company, (v) a decrease in gains on sale of operating properties, (vi) a decrease in gain on sale of marketable securities during 2016, as compared to the corresponding period in 2015, (vii) an increase in provision for income taxes due to a valuation allowance on net deferred tax assets resulting from the merger of KRS into a wholly-owned LLC of the Company and (viii) a decrease in gains through the Company’s preferred equity program and other investments, partially offset by (ix) a decrease in interest expense and (x) incremental earnings due to the acquisition of operating properties during 2016 and 2015 and increased profitability from the Company’s operating properties.
Results of Operations
Comparison 20 15 to 20 14
|
2015 |
2014 |
Change |
% change |
|||||||||||||
|
(amounts in millions) |
||||||||||||||||
|
Revenues from rental properties (1) |
$ | 1,144.5 | $ | 958.9 | $ | 185.6 | 19.4% | |||||||||
|
Rental property expenses: (2) |
||||||||||||||||
|
Rent |
$ | 12.3 | $ | 14.3 | $ | (2.0 | ) | (14.0%) | ||||||||
|
Real estate taxes |
147.2 | 124.7 | 22.5 | 18.0% | ||||||||||||
|
Operating and maintenance |
145.0 | 119.7 | 25.3 | 21.1% | ||||||||||||
| $ | 304.5 | $ | 258.7 | $ | 45.8 | 17.7% | ||||||||||
|
Depreciation and amortization (3) |
$ | 344.5 | $ | 258.1 | $ | 86.4 | 33.5% | |||||||||
|
(1) |
Revenues from rental properties increased primarily from the combined effect of (i) the acquisition of operating properties during 2015 and 2014, providing incremental revenues for the year ended December 31, 2015, of $179.9 million, as compared to the corresponding period in 2014 and (ii) the completion of certain redevelopment projects, tenant buyouts and net growth in the current portfolio, providing incremental revenues for the year ended December 31, 2015, of $23.5 million, as compared to the corresponding period in 2014, partially offset by (iii) a decrease in revenues of $17.8 million from properties sold during 2015 and 2014. |
|
(2) |
Rental property expenses include (i) rent expense relating to ground lease payments for which the Company is the lessee, (ii) real estate tax expense for consolidated properties for which the Company has a controlling ownership interest and (iii) operating and maintenance expense, which consists of property related costs including repairs and maintenance costs, roof repair, landscaping, parking lot repair, snow removal, utilities, property insurance costs, security and various other property related expenses. Rental property expenses increased for the year ended December 31, 2015, as compared to the corresponding period in 2014, primarily due to the acquisitions of properties during 2015 and 2014, partially offset by the disposition of properties in 2015, which resulted in (i) a net increase in real estate taxes of $22.5 million, (ii) a net increase in repairs and maintenance costs of $9.7 million, (iii) a net increase in property services of $4.8 million, (iv) a net increase in snow removal costs of $3.6 million, (v) a net increase in professional fees of $2.4 million and (vi) a net increase in insurance expense of $3.1 million, due to an increase in insurance claims. |
|
(3) |
Depreciation and amortization increased for the year ended December 31, 2015, as compared to the corresponding period in 2014, primarily due to operating property acquisitions during 2015 and 2014 and amounts relating to the Company’s redevelopment projects in 2015, partially offset by property dispositions. |
Management and other fee income decreased $12.7 million to $22.3 million for the year ended December 31, 2015, as compared to $35.0 million for the corresponding period in 2014. This decrease is primarily attributable to (i) the sale of properties within various joint venture investments and the acquisition of partnership interests in joint ventures by the Company during 2015 and 2014 and (ii) a decrease in enhancement fee income related to InTown Suites of $4.1 million for the year ended December 31, 2015, as compared to the corresponding period in 2014, resulting from the repayment of debt that was previously guaranteed by the Company.
During the year ended December 31, 2015, the Company recognized impairment charges of $45.5 million, before noncontrolling interests and income taxes, of which $0.1 million is included in discontinued operations. These impairment charges consist of (i) $30.3 million related to adjustments to property carrying values, (ii) $9.0 million relating to a cost method investment, (iii) $5.3 million related to certain investments in other real estate investments and (iv) $0.8 million related to marketable debt securities investments. During the year ended December 31, 2014, the Company recognized impairment charges of $217.8 million, of which $178.0 million, before income tax benefits of $1.7 million, is included in discontinued operations. These impairment charges consist of (i) $118.4 million related to adjustments to property carrying values, (ii) the release of a cumulative foreign currency translation loss of $92.9 million relating to the substantial liquidation of the Company’s investment in Mexico, (iii) $4.8 million related to a cost method investment and (iv) $1.6 million related to a preferred equity investment. The adjustments to property carrying values were recognized in connection with the Company’s efforts to market certain properties and management’s assessment as to the likelihood and timing of such potential transactions and the anticipated hold period for such properties. Certain of the calculations to determine fair value utilized unobservable inputs and as such are classified as Level 3 of the fair value hierarchy. For additional disclosure, see Footnote 16 of the Notes to Consolidated Financial Statements included in this Form 10-K.
Interest, dividends and other investment income increased $38.1 million to $39.1 million for the year ended December 31, 2015, as compared to $1.0 million for the corresponding period in 2014. This increase is primarily due to the sale of certain marketable securities during 2015, which resulted in an aggregate gain of $39.9 million.
Other income/(expense), net changed $10.7 million to income of $2.2 million for the year ended December 31, 2015, as compared to an expense of $8.5 million for the corresponding period in 2014. This change is primarily due to (i) the release of contingent liabilities related to potential earn-out payments, for which the Company ultimately was not required to pay of $5.8 million, (ii) a decrease in acquisition related costs of $2.3 million and (iii) an increase in gains on land sales of $0.8 million.
Interest expense increased $15.1 million to $218.9 million for the year ended December 31, 2015, as compared to $203.8 million for the corresponding period in 2014. This increase is primarily the result of higher levels of borrowings during 2015, as compared to 2014, primarily relating to the acquisition of operating properties during 2015 and 2014.
Provision for income taxes, net increased $37.8 million to $60.2 million for the year ended December 31, 2015, as compared to $22.4 million for the corresponding period in 2014. This increase is primarily due to (i) an increase in foreign tax expense of $33.6 million primarily resulting from the sale of certain Canadian investments during 2015, as compared to 2014 and (ii) an increase in tax expense of $4.3 million relating to equity in income recognized in connection with the Company’s Albertsons investment during 2015, as compared to 2014.
Equity in income of joint ventures, net increased $320.8 million to $480.4 million for the year ended December 31, 2015, as compared to $159.6 million for the corresponding period in 2014. This increase is primarily due to (i) an increase in gains of $316.1 million resulting from the sale of properties and sale of interests within various joint venture investments during the year ended December 31, 2015, as compared to the corresponding period in 2014 and (ii) the release of cumulative foreign currency translation loss of $47.3 million relating to the substantial liquidation of the Company’s investment in Mexico during 2014, partially offset by (iii) a decrease in equity in income of $15.6 million resulting from a cash distribution received in excess of the Company’s carrying basis in 2014, (iv) an increase in impairment charges of $14.9 million recognized during the year ended December 31, 2015, as compared to the corresponding period in 2014 and (v) lower equity in income resulting from the sales of properties within various joint venture investments and the acquisition of partnership interests in joint ventures by the Company during 2015 and 2014.
During 2015, the Company acquired 43 properties from joint ventures in which the Company had noncontrolling interests. The Company recorded a net gain on change in control of interests of $149.2 million related to the fair value adjustment associated with its previously held equity interests in these properties.
During 2014, the Company acquired 34 properties from joint ventures in which the Company had noncontrolling interests. The Company recorded an aggregate net gain on change in control of interests of $107.2 million related to the fair value adjustment associated with its original ownership of these properties.
During 2015, the Company disposed of 89 consolidated operating properties and eight out-parcels, in separate transactions, for an aggregate sales price of $492.5 million. These transactions resulted in an aggregate gain of $143.6 million, after income tax expense, and aggregate impairment charges of $10.2 million, before income tax expense of $2.3 million. Additionally, during 2015, the Company disposed of its remaining operating property in Chile for a sales price of $51.3 million. This transaction resulted in the release of a cumulative foreign currency translation loss of $19.6 million due to the Company’s liquidation of its investment in Chile, partially offset by a gain on sale of $1.8 million, after income tax expense.
During 2014, the Company disposed of 90 consolidated operating properties, in separate transactions, for an aggregate sales price of $833.5 million, including 27 operating properties in Latin America. These transactions, which are included in Discontinued Operations on the Company’s Consolidated Statements of Income, resulted in (i) an aggregate gain of $203.3 million, before income taxes of $12.0 million, (ii) the release of a cumulative foreign currency translation loss of $92.9 million relating to the substantial liquidation of the Company’s investment in Mexico and (iii) aggregate impairment charges of $85.1 million before income tax benefits of $1.7 million.
Net income attributable to the Company was $894.1 million for the year ended December 31, 2015. Net income attributable to the Company was $424.0 million for the year ended December 31, 2014. On a diluted per share basis, net income attributable to the Company was $2.00 for the year ended December 31, 2015, as compared to $0.89 for the year ended December 31, 2014. These changes are primarily attributable to (i) incremental earnings due to the acquisition of operating properties during 2015 and 2014 and increased profitability from the Company’s operating properties, (ii) an increase in equity in income of joint ventures, net, primarily from gains on sale of Canadian assets, (iii) an increase in gains on sale of marketable securities and (iv) an increase in gain on change in control of interests, net, partially offset by (v) an increase in depreciation and amortization, (vi) the disposition of operating properties during 2015 and 2014 and (vii) an increase in provision for income taxes, net.
Liquidity and Capital Resources
The Company’s capital resources include accessing the public debt and equity capital markets, mortgage and construction loan financing, borrowings under term loans and immediate access to an unsecured revolving credit facility with bank commitments of $1.75 billion at December 31, 2016, which were subsequently increased to $2.25 billion during February 2017.
The Company’s cash flow activities are summarized as follows (in millions):
|
Year Ended December 31, |
||||||||||||
|
2016 |
2015 |
2014 |
||||||||||
|
Net cash flow provided by operating activities |
$ | 592.1 | $ | 493.7 | $ | 629.3 | ||||||
|
Net cash flow provided by investing activities |
$ | 165.4 | $ | 21.4 | $ | 126.7 | ||||||
|
Net cash flow used for financing activities |
$ | (804.5 | ) | $ | (512.9 | ) | $ | (717.5 | ) | |||
Operating Activities
The Company anticipates that cash on hand, borrowings under its revolving credit facility, issuance of equity and public debt, as well as other debt and equity alternatives, will provide the necessary capital required by the Company. Cash flows provided by operating activities for the year ended December 31, 2016, were $592.1 million, as compared to $493.7 million for the comparable period in 2015. The increase of $98.4 million is primarily attributable to (i) the acquisition of operating properties during 2016 and 2015, (ii) new leasing, expansion and re-tenanting of core portfolio properties and (iii) changes in operating assets and liabilities due to timing of receipts and payments, partially offset by (iv) a decrease in operational distributions from the Company’s joint venture programs due to the sale of certain joint venture properties during 2016 and 2015.
Investing Activities
Cash flows provided by investing activities for the year ended December 31, 2016, was $165.4 million, as compared to $21.4 million for the comparable period in 2015. This increase of $144.0 million resulted primarily from (i) a decrease in acquisition of operating real estate and other related net assets of $458.2 million, (ii) a decrease in investment in other investments of $190.3 million related to the Company’s KRS AB Acquisition, LLC joint venture investment in Safeway Inc. during 2015, (iii) an increase in return of investment from liquidation of real estate joint ventures of $103.2 million primarily due to the liquidation of certain Canadian joint ventures in 2016, as compared to the corresponding period in 2015, and (iv) a decrease in improvements to operating real estate of $23.2 million, partially offset by (v) a decrease in distributions from liquidation of real estate joint ventures of $235.4 million, (vi) a decrease in proceeds from the sale of operating properties of $132.4 million, (vii) a decrease in proceeds from sale/repayments of marketable securities of $74.2 million, (viii) an increase in improvements to real estate under development of $55.9 million, (ix) a decrease in collection of mortgage loan receivables of $54.2 million, (x) a decrease in reimbursements of investments and advances to real estate joint ventures and other real estate investments of $51.9 million and (xi) an increase in acquisition of real estate under development of $35.2 million.
Acquisitions of Operating Real Estate and Other Related Net Assets
During the years ended December 31, 2016 and 2015, the Company expended $203.2 million and $661.4 million, respectively, towards the acquisition of operating real estate properties. The Company continues to transform its operating portfolio through its capital recycling program by acquiring what the Company believes are high quality U.S. retail properties and disposing of lesser quality assets. The Company anticipates acquiring approximately $300.0 million to $400.0 million of operating properties during 2017. The Company intends to fund these acquisitions with proceeds from property dispositions, cash flow from operating activities, assumption of mortgage debt, if applicable, and availability under the Company’s revolving line of credit.
Improvements to Operating Real Estate
During the years ended December 31, 2016 and 2015, the Company expended $143.5 million and $166.7 million, respectively, towards improvements to operating real estate. These amounts consist of the following (in thousands):
|
Year Ended December 31, |
||||||||
|
2016 |
2015 |
|||||||
|
Redevelopment/renovations |
$ | 96,319 | $ | 125,994 | ||||
|
Tenant improvements/tenant allowances |
39,016 | 30,127 | ||||||
|
Other |
8,154 | 10,549 | ||||||
|
Total (1) |
$ | 143,489 | $ | 166,670 | ||||
|
(1) |
During the years ended December 31, 2016 and 2015, the Company capitalized interest of $2.4 million and $3.0 million, respectively, and capitalized payroll of $2.1 million and $3.0 million, respectively, in connection with the Company’s improvements to operating real estate. |
During the years ended December 31, 2016 and 2015, the Company capitalized personnel costs of $15.4 million and $13.9 million, respectively, relating to deferred leasing costs.
The Company has an ongoing program to redevelop and re-tenant its properties to maintain or enhance its competitive position in the marketplace. The Company is actively pursuing redevelopment opportunities within its operating portfolio which it believes will increase the overall value by bringing in new tenants and improving the assets’ value. The Company has identified three categories of redevelopment, (i) large scale redevelopment, which involves demolishing and building new square footage, (ii) value creation redevelopment, which includes the subdivision of large anchor spaces into multiple tenant layouts, and (iii) creation of out-parcels and pads which are located in the front of the shopping center properties. The Company anticipates its capital commitment toward these redevelopment projects and re-tenanting efforts during 2017 will be approximately $250.0 million to $300.0 million. The funding of these capital requirements will be provided by cash flow from operating activities and availability under the Company’s revolving line of credit.
Real Estate Under Development
The Company is engaged in select real estate development projects, which are expected to be held as long-term investments by the Company. As of December 31, 2016, the Company had in progress a total of six consolidated real estate development projects located in the U.S. The Company anticipates its capital commitment toward these development projects during 2017 will be approximately $150.0 million to $200.0 million. The funding of these capital requirements will be provided by cash flow from operating activities and availability under the Company’s revolving line of credit. The Company anticipates remaining costs to complete for these projects to be approximately $225.0 million to $275.0 million. Additionally, during the year ended December 31, 2016, the Company capitalized interest of $6.9 million, real estate taxes and insurance of $4.3 million and payroll of $1.8 million, in connection with these real estate development projects.
Financing Activities
Cash flow used for financing activities for the year ended December 31, 2016, was $804.5 million, as compared to $512.9 million for the comparable period in 2015. This change of $291.6 million resulted primarily from (i) an increase in repayments under unsecured term loan/notes of $511.9 million, (ii) an increase in principal payments of $135.6 million, (iii) a decrease in contributions from noncontrolling interests, net of $106.2 million, primarily relating to the joint venture investment in Safeway, (iv) a decrease in proceeds from issuance of unsecured term loan/notes of $100.0 million, (v) an increase in early extinguishment of debt charges of $45.7 million and (vi) an increase in dividends paid of $18.2 million, partially offset by (vii) an increase in proceeds from issuance of stock of $288.7 million, (viii) a decrease in redemption of preferred stock of $175.0 million, (ix) an increase in proceeds from unsecured revolving credit facility, net of $126.4 million and (x) a decrease in redemption of noncontrolling interests of $43.2 million.
The Company continually evaluates its debt maturities, and, based on management’s current assessment, believes it has viable financing and refinancing alternatives that will not materially adversely impact its expected financial results. The Company continues to pursue borrowing opportunities with large commercial U.S. and global banks, select life insurance companies and certain regional and local banks. The Company has noticed a continuing trend that, although pricing remains dependent on specific deal terms, generally spreads for non-recourse mortgage financing had been widening due to global economic issues, but have recently stabilized. However, the unsecured debt markets are functioning well and credit spreads are at manageable levels.
Debt maturities for 2017 consist of: $451.6 million of consolidated debt; $358.2 million of unconsolidated joint venture debt; and $59.3 million of debt on properties included in the Company’s Preferred Equity Program, assuming the utilization of extension options where available. Subsequent to December 31, 2016, the Company paid off the remaining $250.0 million outstanding balance on the Company’s unsecured term loan. The 2017 consolidated debt maturities are anticipated to be repaid with operating cash flows, borrowings from the Company’s revolving credit facility (which at December 31, 2016, had $1.725 billion available and was subsequently increased to $2.25 billion) and debt refinancing where applicable. The 2017 debt maturities on properties in the Company’s unconsolidated joint ventures and Preferred Equity Program are anticipated to be repaid through debt refinancing, unsecured credit facilities and partner capital contributions, as deemed appropriate.
The Company intends to maintain strong debt service coverage and fixed charge coverage ratios as part of its commitment to maintain its investment-grade debt ratings. The Company may, from time-to-time, seek to obtain funds through additional common and preferred equity offerings, unsecured debt financings and/or mortgage/construction loan financings and other capital alternatives.
Since the completion of the Company’s IPO in 1991, the Company has utilized the public debt and equity markets as its principal source of capital for its expansion needs. Since the IPO, the Company has completed additional offerings of its public unsecured debt and equity, raising in the aggregate over $12.2 billion. Proceeds from public capital market activities have been used for the purposes of, among other things, repaying indebtedness, acquiring interests in open-air shopping centers, funding real estate under development projects, expanding and improving properties in the portfolio and other investments.
During February 2015, the Company filed a shelf registration statement on Form S-3, which is effective for a term of three years, for the future unlimited offerings, from time-to-time, of debt securities, preferred stock, depositary shares, common stock and common stock warrants. The Company, pursuant to this shelf registration statement may, from time-to-time, offer for sale its senior unsecured debt for any general corporate purposes, including (i) funding specific liquidity requirements in its business, including property acquisitions, development and redevelopment costs and (ii) managing the Company’s debt maturities. (See Footnote 13 of the Notes to Consolidated Financial Statements included in this Form 10-K.)
At the Market Continuous Offering Program (“ATM program”)
During February 2015, the Company established an ATM program, pursuant to which the Company may offer and sell shares of its common stock, par value $0.01 per share, with an aggregate gross sales price of up to $500.0 million through a consortium of banks acting as sales agents. Sales of the shares of common stock may be made, as needed, from time to time in “at the market” offerings as defined in Rule 415 of the Securities Act of 1933, including by means of ordinary brokers’ transactions on the NYSE or otherwise (i) at market prices prevailing at the time of sale, (ii) at prices related to prevailing market prices or (iii) as otherwise agreed to with the applicable sales agent. During the year ended December 31, 2016, the Company issued 9,806,377 shares and received proceeds of $285.2 million, net of commissions and fees of $2.9 million. As of December 31, 2016, the Company had $211.9 million available under this ATM program.
Medium Term Notes (“MTN”) and Senior Notes
The Company’s supplemental indenture governing its MTN and senior notes contains the following covenants, all of which the Company is compliant with:
|
Covenant |
Must Be |
As of 12/31/1 6 |
||||
|
Consolidated Indebtedness to Total Assets |
<65% |
38% | ||||
|
Consolidated Secured Indebtedness to Total Assets |
<40% |
8% | ||||
|
Consolidated Income Available for Debt Service to Maximum Annual Service Charge |
>1.50x |
6.0x |
||||
|
Unencumbered Total Asset Value to Consolidated Unsecured Indebtedness |
>1.50x |
2.8x |
||||
For a full description of the various indenture covenants refer to the Indenture dated September 1, 1993; the First Supplemental Indenture dated August 4, 1994; the Second Supplemental Indenture dated April 7, 1995; the Third Supplemental Indenture dated June 2, 2006; the Fourth Supplemental Indenture dated April 26, 2007; the Fifth Supplemental Indenture dated as of September 24, 2009; the Sixth Supplemental Indenture dated as of May 23, 2013; and the Seventh Supplemental Indenture dated as of April 24, 2014, each as filed with the SEC. See the Exhibits Index for specific filing information.
During the year ended December 31, 2016, the Company issued the following Senior Unsecured Notes (dollars in millions):
|
Date Issued |
Maturity Date |
Amount Issued |
Interest Rate |
||
|
Nov-16 |
Mar-24 |
$ |
400.0 |
2.7% |
|
|
Nov-16 |
Dec-46 |
$ |
350.0 |
4.125% |
|
|
Aug-16 |
Oct-26 |
$ |
500.0 |
2.8% |
|
|
May-16 |
Apr-45 |
$ |
150.0 |
4.25% |
Interest on these senior unsecured notes is payable semi-annually in arrears. The Company used the net proceeds from these issuances, after the underwriting discounts and related offering costs, for general corporate purposes, including to pre-fund near-term debt maturities or to reduce borrowings under the Company’s revolving credit facility.
During the year ended December 31, 2016, the Company repaid (i) its $300.0 million 5.783% medium term notes, which matured in March 2016 and (ii) its $290.9 million 5.70% senior unsecured notes, which were scheduled to mature in May 2017. The Company recorded an early extinguishment of debt charge of $10.2 million resulting from the early repayment of its $290.9 million 5.70% notes.
Canadian Notes Payable
During August 2016, Kimco North Trust III, a wholly-owned subsidiary of the Company, repaid (i) its CAD $150.0 million (USD $116.1 million) 5.99% notes, which were scheduled to mature in April 2018 and (ii) its CAD $200.0 million (USD $154.8 million) 3.855% notes, which were scheduled to mature in August 2020. The Company recorded aggregate early extinguishment of debt charges of CAD $34.1 million (USD $26.3 million) resulting from the early repayment of these notes.
Credit Facility
The Company had a $1.75 billion unsecured revolving credit facility (the “Credit Facility”) with a group of banks, which was scheduled to expire in March 2018 with two additional six month options to extend the maturity date, at the Company’s discretion, to March 2019. The Credit Facility, which could be increased to $2.25 billion through an accordion feature, accrued interest at a rate of LIBOR plus 92.5 basis points (1.67% as of December 31, 2016) on drawn funds. In addition, the Credit Facility included a $500 million sub-limit which provided the Company the opportunity to borrow in alternative currencies including Canadian Dollars, British Pounds Sterling, Japanese Yen or Euros. Pursuant to the terms of the Credit Facility, the Company, among other things, was subject to covenants requiring the maintenance of (i) maximum leverage ratios on both unsecured and secured debt and (ii) minimum interest and fixed coverage ratios. As of December 31, 2016, the Credit Facility had a balance of $25.0 million outstanding and $0.7 million appropriated for letters of credit.
In February 2017, the Company closed on a new $2.25 billion unsecured revolving credit facility (the “New Credit Facility”) with a group of banks, which is scheduled to expire in March 2021 with two additional six month options to extend the maturity date, at the Company’s discretion, to March 2022. The New Credit Facility could be increased to $2.75 billion through an accordion feature. The New Credit Facility replaces the Company’s Credit Facility discussed above, that was scheduled to mature in March 2018. The New Credit Facility accrues interest at a rate of LIBOR plus 87.5 basis points on drawn funds. In addition, there is a $500.0 million sub-limit which provides the company the opportunity to borrow in alternative currencies including Canadian Dollars, British Pounds Sterling, Japanese Yen or Euros. Pursuant to the terms of the New Credit Facility, the Company continues to be subject to the covenants under the Credit Facility. For a full description of the New Credit Facility’s covenants refer to the Amended and Restated Credit Agreement dated as of February 1, 2017, filed as Exhibit 10.1 to the Company’s Current Report on Form 8-K dated January 30, 2017.
Pursuant to the terms of the Credit Facility, the Company, among other things, is subject to maintenance of various covenants. The Company is currently in compliance with these covenants. The financial covenants for the Credit Facility are as follows:
|
Covenant |
Must Be |
As of 12/31/1 6 |
||
|
Total Indebtedness to Gross Asset Value (“GAV”) |
<60% |
41% |
||
|
Total Priority Indebtedness to GAV |
<35% |
8% |
||
|
Unencumbered Asset Net Operating Income to Total Unsecured Interest Expense |
>1.75x |
4.90x |
||
|
Fixed Charge Total Adjusted EBITDA to Total Debt Service |
>1.50x |
2.84x |
For a full description of the Credit Facility’s covenants refer to the Credit Agreement dated as of March 17, 2014, filed as Exhibit 10.1 to the Company’s Current Report on Form 8-K dated March 20, 2014.
Term Loan
The Company had a $650.0 million unsecured term loan (“Term Loan’) which was scheduled to mature in January 2017, with three one-year extension options at the Company’s discretion, and accrued interest at a spread (95 basis points at December 31, 2016) to LIBOR or at the Company’s option at a base rate as defined per the agreement (1.60% at December 31, 2016). During November 2016, the Company repaid $400.0 million of borrowings under the Company’s Term Loan. As of December 31, 2016, the Term Loan had a balance of $250.0 million. Pursuant to the terms of the credit agreement for the Term Loan, the Company, among other things, is subject to covenants requiring the maintenance of (i) maximum indebtedness ratios and (ii) minimum interest and fixed charge coverage ratios. The Term Loan covenants are similar to the Credit Facility covenants described above. During January 2017, the Company repaid the remaining $250.0 million balance on the Term Loan and terminated the agreement.
Mortgage s Payable
During 2016, the Company (i) assumed $289.0 million of individual non-recourse mortgage debt relating to the acquisition of 10 properties, including $4.3 million associated with fair value debt adjustments and (ii) paid off $703.0 million of mortgage debt (including fair market value adjustment of $2.1 million) that encumbered 47 operating properties. In connection with the early prepayment of certain of these mortgages, the Company recorded an early extinguishment of debt charge of $9.2 million.
Additionally, during 2016, the Company disposed of an encumbered property through foreclosure. This transaction resulted in a net decrease in mortgage debt of $25.6 million (including fair market value adjustment of $0.4 million) and a gain on forgiveness of debt of $3.1 million, which is included in Other income/(expense), net in the Company’s Consolidated Statements of Income.
In addition to the public equity and debt markets as capital sources, the Company may, from time-to-time, obtain mortgage financing on selected properties and construction loans to partially fund the capital needs of its real estate under development projects. As of December 31, 2016, the Company had over 360 unencumbered property interests in its portfolio.
Dividends
In connection with its intention to continue to qualify as a REIT for federal income tax purposes, the Company expects to continue paying regular dividends to its stockholders. These dividends will be paid from operating cash flows. The Company’s Board of Directors will continue to evaluate the Company’s dividend policy on a quarterly basis as the Board of Directors monitors sources of capital and evaluates the impact of the economy and capital markets availability on operating fundamentals. Since cash used to pay dividends reduces amounts available for capital investment, the Company generally intends to maintain a conservative dividend payout ratio, reserving such amounts as it considers necessary for the expansion and renovation of shopping centers in its portfolio, debt reduction, the acquisition of interests in new properties and other investments as suitable opportunities arise and such other factors as the Board of Directors considers appropriate. Cash dividends paid were $474.0 million in 2016, $455.8 million in 2015 and $427.9 million in 2014.
Although the Company receives substantially all of its rental payments on a monthly basis, it generally intends to continue paying dividends quarterly. Amounts accumulated in advance of each quarterly distribution will be invested by the Company in short-term money market or other suitable instruments. On October 25, 2016, the Company’s Board of Directors declared an increased quarterly cash dividend of $0.27 per common share, an annualized increase of 5.9%, payable to shareholders of record on January 3, 2017, which was paid on January 15, 2017. Additionally, on February 2, 2017, the Company’s Board of Directors declared a quarterly cash dividend of $0.27 per common share payable to shareholders of record on April 5, 2017, which is scheduled to be paid on April 17, 2017.
The Board of Directors also declared quarterly dividends with respect to the Company’s various series of cumulative redeemable preferred shares (Class I, Class J and Class K). All dividends on the preferred shares are scheduled to be paid on April 17, 2017, to shareholders of record on April 4, 2017, with an ex-dividend date of March 31, 2017.
Other
The Company is subject to taxes on its activities in Canada, Puerto Rico and Mexico. In general, under local country law applicable to the structures the Company has in place and applicable treaties, the repatriation of cash to the Company from its subsidiaries and joint ventures in Canada, Puerto Rico and Mexico generally are not subject to withholding tax. The Company is subject to and also includes in its tax provision non-U.S. income taxes on certain investments located in jurisdictions outside the U.S. These investments are held by the Company at the REIT level and not in the Company’s taxable REIT subsidiary. Accordingly, the Company does not expect a U.S. income tax impact associated with the repatriation of undistributed earnings from the Company’s foreign subsidiaries.
Contractual Obligations and Other Commitments
The Company has debt obligations relating to its revolving credit facility, Term Loan, MTNs, senior notes and mortgages with maturities ranging from less than one year to 30 years. As of December 31, 2016, the Company’s total debt had a weighted average term to maturity of 8.7 years. In addition, the Company has non-cancelable operating leases pertaining to its shopping center portfolio. As of December 31, 2016, the Company had 44 consolidated shopping center properties that are subject to long-term ground leases where a third party owns and has leased the underlying land to the Company to construct and/or operate a shopping center. The following table summarizes the Company’s debt maturities (excluding extension options, unamortized debt issuance costs of $50.8 million and fair market value of debt adjustments aggregating $27.7 million) and obligations under non-cancelable operating leases as of December 31, 2016 (in millions):
|
Payments due by period |
||||||||||||||||||||||||||||
|
Contractual Obligations: |
201 7 |
201 8 |
201 9 |
20 20 |
20 21 |
Thereafter |
Total |
|||||||||||||||||||||
|
Long-Term Debt- Principal (1) |
$ | 712.4 | $ | 449.4 | $ | 415.9 | $ | 101.2 | $ | 645.4 | $ | 2,765.2 | $ | 5,089.5 | ||||||||||||||
|
Long-Term Debt- Interest (2) |
$ | 181.3 | $ | 152.4 | $ | 140.5 | $ | 122.7 | $ | 107.3 | $ | 979.7 | $ | 1,683.9 | ||||||||||||||
|
Operating Leases: |
||||||||||||||||||||||||||||
|
Ground Leases (3) |
$ | 8.7 | $ | 8.7 | $ | 8.8 | $ | 8.3 | $ | 8.3 | $ | 143.0 | $ | 185.8 | ||||||||||||||
|
(1) |
Maturities utilized do not reflect extension options, which range from one to three years. |
|
(2) |
For loans which have interest at floating rates, future interest expense was calculated using the rate as of December 31, 2016. |
|
(3) |
For leases which have inflationary increases, future ground rent expense was calculated using the rent as of December 31, 2016. |
The Company had a $250.0 million unsecured term loan and $462.4 million of secured debt scheduled to mature in 2017. Subsequent to December 31, 2016, the Company paid off the $250.0 million unsecured term loan. The Company anticipates satisfying the remaining maturities with a combination of operating cash flows, its unsecured revolving credit facility, exercise of extension options, where available, and new debt issuances.
The Company has issued letters of credit in connection with completion and repayment guarantees for loans encumbering certain of the Company’s development and redevelopment projects and guarantee of payment related to the Company’s insurance program. As of December 31, 2016, these letters of credit aggregated $40.8 million.
In connection with the construction of its development/redevelopment projects and related infrastructure, certain public agencies require posting of performance and surety bonds to guarantee that the Company’s obligations are satisfied. These bonds expire upon the completion of the improvements and infrastructure. As of December 31, 2016, the Company had $30.1 million in performance and surety bonds outstanding.
The Company has accrued $5.0 million of non-current uncertain tax positions and related interest under the provisions of the authoritative guidance that addresses accounting for income taxes, which are included in Other liabilities on the Company’s Consolidated Balance Sheets at December 31, 2016. These amounts are not included in the table above because a reasonably reliable estimate regarding the timing of settlements with the relevant tax authorities, if any, cannot be made.
Off-Balance Sheet Arrangements
Unconsolidated Real Estate Joint Ventures
The Company has investments in various unconsolidated real estate joint ventures with varying structures. These joint ventures primarily operate shopping center properties. Such arrangements are generally with third-party institutional investors and individuals. The properties owned by the joint ventures are primarily financed with individual non-recourse mortgage loans, however, the Company, on a selective basis, has obtained unsecured financing for certain joint ventures. As of December 31, 2016, the Company did not guarantee any joint venture unsecured debt. Non-recourse mortgage debt is generally defined as debt whereby the lenders’ sole recourse with respect to borrower defaults is limited to the value of the property collateralized by the mortgage. The lender generally does not have recourse against any other assets owned by the borrower or any of the constituent members of the borrower, except for certain specified exceptions listed in the particular loan documents (see Footnote 8 of the Notes to Consolidated Financial Statements included in this Form 10-K). As of December 31, 2016, these investments include the following joint ventures:
|
Venture |
Kimco Ownership Interest |
Number of Properties |
Non- Recourse Mortgages Payable (in millions) |
Number of Encumbered Properties |
Weighted Average Interest Rate |
Weighted Average Term (months) * |
||||||||||||||||||
|
KimPru and KimPru II (a) |
15.0% | 48 | $ | 448.6 | 16 | 3.31% | 73.0 | |||||||||||||||||
|
KIR (b) |
48.6% | 45 | $ | 730.7 | 38 | 4.69% | 55.4 | |||||||||||||||||
|
CPP (c) |
55.0% | 5 | $ | 84.8 | 1 | 2.17% | 16.0 | |||||||||||||||||
* Average remaining term includes extensions
|
(a) |
Represents the Company’s joint ventures with Prudential Global Investment Management. As of December 31, 2016, KimPru also has an unsecured term loan with an outstanding balance of $200.0 million, which is scheduled to mature in August 2019, with two one-year extension options at the joint venture’s discretion, and bears interest at a rate equal to LIBOR plus 1.75% (2.52% at December 31, 2016). |
|
(b) |
Represents the Company’s joint ventures with certain institutional investors. As of December 31, 2016, KIR has an unsecured revolving credit facility with an outstanding balance of $16.0 million, which is scheduled to mature in June 2018, with two one-year extension options at the joint venture’s discretion, and bears interest at a rate equal to LIBOR plus 1.75% (2.52% at December 31, 2016). |
|
(c) |
Represents the Company’s joint ventures with Canada Pension Plan Investment Board (CPPIB). |
The Company has various other unconsolidated real estate joint ventures with varying structures. As of December 31, 2016, these other unconsolidated joint ventures had individual non-recourse mortgage loans aggregating $584.3 million. The aggregate debt as of December 31, 2016, of all of the Company’s unconsolidated real estate joint ventures is $2.1 billion. As of December 31, 2016, these loans had scheduled maturities ranging from one month to 10 years and bore interest at rates ranging from 2.01% to 7.25%. Approximately $358.2 million of the aggregate outstanding loan balance matures in 2017. These maturing loans are anticipated to be repaid with operating cash flows, debt refinancing and partner capital contributions, as deemed appropriate (see Footnote 8 of the Notes to Consolidated Financial Statements included in this Form 10-K).
Other Real Estate Investments
The Company previously provided capital to owners and developers of real estate properties through its Preferred Equity Program. As of December 31, 2016, the Company’s net investment under the Preferred Equity Program was $193.7 million relating to 365 properties, including 346 net leased properties. As of December 31, 2016, these preferred equity investment properties had individual non-recourse mortgage loans aggregating $427.4 million. These loans have scheduled maturities ranging from one month to eight years and bear interest at rates ranging from 4.19% to 10.47%. Due to the Company’s preferred position in these investments, the Company’s share of each investment is subject to fluctuation and is dependent upon property cash flows. The Company’s maximum exposure to losses associated with its preferred equity investments is limited to its invested capital.
Funds F rom Operations
Funds From Operations (“FFO”) is a supplemental non-GAAP measure utilized to evaluate the operating performance of real estate companies. The National Association of Real Estate Investment Trusts (“NAREIT”) defines FFO as net income/(loss) attributable to common shareholders computed in accordance with generally accepted accounting principles in the United States (“GAAP”), excluding (i) gains or losses from sales of operating real estate assets and change in control of interests, plus (ii) depreciation and amortization of operating properties and (iii) impairment of depreciable real estate and in substance real estate equity investments and (iv) after adjustments for unconsolidated partnerships and joint ventures calculated to reflect funds from operations on the same basis.
The Company presents FFO as it considers it an important supplemental measure of our operating performance and believes it is frequently used by securities analysts, investors and other interested parties in the evaluation of REITs, many of which present FFO when reporting results. Comparison of our presentation of FFO to similarly titled measures for other REITs may not necessarily be meaningful due to possible differences in the application of the NAREIT definition used by such REITs.
The Company also presents FFO as adjusted as an additional supplemental measure as it believes it is more reflective of the Company’s core operating performance. The Company believes FFO as adjusted provides investors and analysts an additional measure in comparing the Company’s performance across reporting periods on a consistent basis by excluding items that we do not believe are indicative of our core operating performance. FFO as adjusted is generally calculated by the Company as FFO excluding certain transactional income and expenses and non-operating impairments which management believes are not reflective of the results within the Company’s operating real estate portfolio.
FFO is a supplemental non-GAAP financial measure of real estate companies’ operating performances, which does not represent cash generated from operating activities in accordance with GAAP and therefore should not be considered an alternative for net income as a measure of liquidity. Our method of calculating FFO and FFO as adjusted may be different from methods used by other REITs and, accordingly, may not be comparable to such other REITs.
The Company’s reconciliation of net income available to common shareholders to FFO and FFO as adjusted for the three months and years ended December 31, 2016 and 2015 is as follows (in thousands, except per share data):
|
Three Months Ended December 31, |
Year Ended December 31, |
|||||||||||||||
|
201 6 |
201 5 |
201 6 |
201 5 |
|||||||||||||
|
Net income available to common shareholders |
$ | 66,718 | $ | 360,020 | $ | 332,630 | $ | 831,215 | ||||||||
|
Gain on disposition of operating property |
(10,950 | ) | (43,347 | ) (4) | (92,824 | ) | (131,844 | ) (4) | ||||||||
|
Gain on disposition of joint venture operating properties and change in control of interests |
(14,880 | ) | (327,933 | ) (4) | (217,819 | ) | (557,744 | ) (4) | ||||||||
|
Depreciation and amortization - real estate related |
89,476 | 82,732 | 347,315 | 333,840 | ||||||||||||
|
Depreciation and amortization - real estate joint ventures |
9,477 | 14,552 | 45,098 | 68,556 | ||||||||||||
|
Impairment of operating properties |
24,125 | 8,545 | 101,928 | 52,021 | ||||||||||||
|
(Benefit)/provision for income taxes (2) |
(1,227 | ) | 51,849 | 39,570 | 53,792 | |||||||||||
|
Noncontrolling interests (2) |
245 | (3,239 | ) | (182 | ) | (6,591 | ) | |||||||||
|
FFO |
162,984 | 143,179 | 555,716 | 643,245 | ||||||||||||
|
Transactional (income)/expense: |
||||||||||||||||
|
Profit participation from other real estate investments |
(830 | ) | (48 | ) | (10,883 | ) | (11,399 | ) | ||||||||
|
Transactional losses from other real estate investments |
- | - | 461 | - | ||||||||||||
|
Gains from land sales |
(1,255 | ) | (798 | ) | (3,607 | ) | (7,621 | ) | ||||||||
|
Acquisition costs |
1,133 | 2,546 | 5,023 | 4,430 | ||||||||||||
|
Prepayment penalties |
- | - | 45,674 | - | ||||||||||||
|
Severance costs – Canada |
- | 1,974 | - | 1,974 | ||||||||||||
|
Gain on forgiveness of debt |
(7,357 | ) | - | (7,357 | ) | - | ||||||||||
|
Distributions in excess of Company’s investment basis |
- | (303 | ) | (845 | ) | (5,553 | ) | |||||||||
|
Gain on sale of marketable securities |
- | (1,365 | ) | - | (39,853 | ) | ||||||||||
|
Impairments on other investments |
5,300 | 9,012 | 6,358 | 17,860 | ||||||||||||
|
Preferred stock redemption charge |
- | 5,816 | - | 5,816 | ||||||||||||
|
Other expense/(income), net |
62 | (5,101 | ) | 22 | (5,505 | ) | ||||||||||
|
Provision/(benefit) for income taxes (3) |
257 | (1,841 | ) | 38,433 | (227 | ) | ||||||||||
|
Noncontrolling interests (3) |
125 | - | 410 | 270 | ||||||||||||
|
Total transactional (income)/expense, net |
(2,565 | ) | 9,892 | 73,689 | (39,808 | ) | ||||||||||
|
FFO as adjusted |
$ | 160,419 | $ | 153,071 | $ | 629,405 | $ | 603,437 | ||||||||
|
Weighted average shares outstanding for FFO calculations: |
||||||||||||||||
|
Basic |
423,087 | 411,667 | 418,402 | 411,319 | ||||||||||||
|
Units |
841 | 860 | 853 | 791 | ||||||||||||
|
Dilutive effect of equity awards |
1,162 | 1,481 | 1,307 | 1,414 | ||||||||||||
|
Diluted |
425,090 | (1) | 414,008 | (1) | 420,562 | (1) | 413,524 | (1) | ||||||||
|
FFO per common share – basic |
$ | 0.39 | $ | 0.35 | $ | 1.33 | $ | 1.56 | ||||||||
|
FFO per common share – diluted |
$ | 0.38 | (1) | $ | 0.35 | (1) | $ | 1.32 | (1) | $ | 1.56 | (1) | ||||
|
FFO as adjusted per common share – basic |
$ | 0.38 | $ | 0.37 | $ | 1.50 | $ | 1.47 | ||||||||
|
FFO as adjusted per common share – diluted |
$ | 0.38 | (1) | $ | 0.37 | (1) | $ | 1.50 | (1) | $ | 1.46 | (1) | ||||
|
(1) |
Reflects the potential impact if certain units were converted to common stock at the beginning of the period, which would have a dilutive effect on FFO. FFO would be increased by $229 and $217 for the three months ended December 31, 2016 and 2015, respectively, and $881 and $781 for the years ended December 31, 2016 and 2015, respectively. The effect of other certain convertible units would have an anti-dilutive effect upon the calculation of Income from continuing operations per share. Accordingly, the impact of such conversion has not been included in the determination of diluted earnings per share calculations. |
|
(2) |
Related to gains, impairment and deprecation on operating properties, where applicable. |
|
(3) |
Related to transaction (income)/expense, where applicable. |
|
(4) |
Includes cumulative foreign currency translation net loss of $18.8 million due to the liquidation of the Company's Chilean Portfolio as follows: (i) $19.6 million of loss in Gain on disposition of operating property, net, partially offset by (ii) $0.8 million of gain in Gain on disposition of joint venture operating properties and change in control of interests. |
U.S. Same Property Net Operating Income (“U.S. same property NOI”)
U.S. same property NOI is a supplemental non-GAAP financial measure of real estate companies’ operating performance and should not be considered an alternative to net income in accordance with GAAP or as a measure of liquidity. U.S. same property NOI is considered by management to be an important performance measure of the Company’s operations and management believes that it is frequently used by securities analysts and investors as a measure of the Company’s operating performance because it includes only the net operating income of U.S. properties that have been owned for the entire current and prior year reporting periods including those properties under redevelopment and excludes properties under development and pending stabilization. Properties are deemed stabilized at the earlier of (i) reaching 90% leased or (ii) one year following a project’s inclusion in operating real estate. U.S. same property NOI assists in eliminating disparities in net income due to the development, acquisition or disposition of properties during the particular period presented, and thus provides a more consistent performance measure for the comparison of the Company's properties.
U.S. same property NOI is calculated using revenues from rental properties (excluding straight-line rent adjustments, lease termination fees, amortization of above/below market rents and includes charges for bad debt) less operating and maintenance expense, real estate taxes and rent expense plus the Company’s proportionate share of U.S. same property NOI from U.S. unconsolidated real estate joint ventures, calculated on the same basis. The Company’s method of calculating U.S. same property NOI may differ from methods used by other REITs and, accordingly, may not be comparable to such other REITs.
The following is a reconciliation of the Company’s Income from continuing operations to U.S. same property NOI (in thousands):
|
Three Months Ended December 31, |
Year Ende
d
|
|||||||||||||||
|
201 6 |
201 5 |
201 6 |
201 5 |
|||||||||||||
|
Income from continuing operations |
$ | 69,836 | $ | 339,117 | $ | 299,353 | $ | 774,405 | ||||||||
|
Adjustments: |
||||||||||||||||
|
Management and other fee income |
(4,117 | ) | (4,369 | ) | (18,391 | ) | (22,295 | ) | ||||||||
|
General and administrative expenses |
27,462 | 33,413 | 117,302 | 122,735 | ||||||||||||
|
Impairment charges |
25,140 | 17,475 | 93,266 | 45,383 | ||||||||||||
|
Depreciation and amortization |
90,884 | 86,095 | 355,320 | 344,527 | ||||||||||||
|
Interest and other expense, net |
40,818 | 52,525 | 232,798 | 174,656 | ||||||||||||
|
(Benefit)/provision for income taxes, net |
(747 | ) | 48,297 | 72,545 | 60,230 | |||||||||||
|
Gain on change in control of interests, net |
(4,290 | ) | (3,091 | ) | (57,386 | ) | (149,234 | ) | ||||||||
|
Equity in income of other real estate investments, net |
(5,241 | ) | (4,854 | ) | (27,773 | ) | (36,090 | ) | ||||||||
|
Non same property net operating income |
(16,194 | ) | (41,218 | ) | (88,070 | ) | (173,189 | ) | ||||||||
|
Non-operational expense/(income) from joint ventures, net |
8,474 | (297,488 | ) | (58,563 | ) | (245,380 | ) | |||||||||
|
U.S. same property NOI |
$ | 232,025 | $ | 225,902 | $ | 920,401 | $ | 895,748 | ||||||||
U.S. same property NOI increased by $6.1 million or 2.7% for the three months ended December 31, 2016, as compared to the corresponding period in 2015. This increase is primarily the result of an increase of $4.5 million related to lease-up and rent commencements in the portfolio and an increase of $1.6 million in other property income, net of property expenses.
U.S. same property NOI increased by $24.7 million or 2.8% for the year ended December 31, 2016, as compared to the corresponding period in 2015. This increase is primarily the result of an increase of $13.1 million related to lease-up and rent commencements in the portfolio and an increase of $11.6 million in other property income, net of property expenses.
Effects of Inflation
Many of the Company's leases contain provisions designed to mitigate the adverse impact of inflation. Such provisions include clauses enabling the Company to receive payment of additional rent calculated as a percentage of tenants' gross sales above pre-determined thresholds, which generally increase as prices rise, and/or escalation clauses, which generally increase rental rates during the terms of the leases. Such escalation clauses often include increases based upon changes in the consumer price index or similar inflation indices. In addition, many of the Company's leases are for terms of less than 10 years, which permits the Company to seek to increase rents to market rates upon renewal. Most of the Company's leases require the tenant to pay an allocable share of operating expenses, including common area maintenance costs, real estate taxes and insurance, thereby reducing the Company's exposure to increases in costs and operating expenses resulting from inflation. The Company periodically evaluates its exposure to short-term interest rates and foreign currency exchange rates and will, from time-to-time, enter into interest rate protection agreements and/or foreign currency hedge agreements which mitigate, but do not eliminate, the effect of changes in interest rates on its floating-rate debt and fluctuations in foreign currency exchange rates.
New Accounting Pronouncements
See Footnote 1 of the Notes to Consolidated Financial Statements included in this Form 10-K.
Item 7A. Quantitative and Qualitative Disclosures About Market Risk
The Company’s primary market risk exposures are interest rate risk and foreign currency exchange rate risk. The following table presents the Company’s aggregate fixed rate and variable rate debt obligations outstanding, including fair market value adjustments and unamortized deferred financing costs, as of December 31, 2016, with corresponding weighted-average interest rates sorted by maturity date. The table does not include extension options where available. The instruments’ actual cash flow amounts are in millions.
|
2017 |
2018 |
2019 |
2020 |
2021 |
Thereafter |
Total |
Fair Value |
|||||||||||||||||||||||||
|
Secured Debt |
||||||||||||||||||||||||||||||||
|
Fixed Rate |
$ | 451.5 | $ | 96.2 | $ | 2.7 | $ | 103.9 | $ | 161.3 | $ | 204.1 | $ | 1,019.7 | $ | 1,022.2 | ||||||||||||||||
|
Average Interest Rate |
5.68 | % | 4.72 | % | 5.29 | % | 5.39 | % | 5.39 | % | 4.46 | % | 5.27 | % | ||||||||||||||||||
|
Variable Rate |
$ | - | $ | 19.4 | $ | 100.0 | $ | - | $ | - | $ | - | $ | 119.4 | $ | 118.8 | ||||||||||||||||
|
Average Interest Rate |
- | 3.37 | % | 1.91 | % | - | - | - | 2.15 | % | ||||||||||||||||||||||
|
Unsecured Debt |
||||||||||||||||||||||||||||||||
|
Fixed Rate |
$ | - | $ | 299.5 | $ | 299.2 | $ | - | $ | 496.8 | $ | 2,559.1 | $ | 3,654.6 | $ | 3,618.3 | ||||||||||||||||
|
Average Interest Rate |
- | 4.30 | % | 6.88 | % | - | 3.20 | % | 3.40 | % | 3.73 | % | ||||||||||||||||||||
|
Variable Rate |
$ | 250.0 | $ | 22.7 | $ | - | $ | - | $ | - | $ | - | $ | 272.7 | $ | 272.5 | ||||||||||||||||
|
Average Interest Rate |
1.60 | % | 1.67 | % | - | - | - | - | 1.61 | % | ||||||||||||||||||||||
Based on the Company’s variable-rate debt balances, interest expense would have increased by $3.9 million for the year ended December 31, 2016, if short-term interest rates were 1.0% higher.
The following table presents the Company’s foreign investments and respective cumulated translation adjustments (“CTA”) as of December 31, 2016. Investment amounts are shown in their respective local currencies and the U.S. dollar equivalents, CTA balances are shown in U.S. dollars:
|
Foreign Investment (in millions) |
||||||||||||
|
Country |
Local Currency |
U . S . Dollars |
CTA Gain |
|||||||||
|
Mexican real estate investments (MXN) |
181.4 | $ | 14.3 | $ | - | |||||||
|
Canadian real estate investments (CAD) |
47.5 | $ | 35.3 | $ | 6.3 | |||||||
The Company has not, and does not plan to, enter into any derivative financial instruments for trading or speculative purposes.
Currency fluctuations between local currency and the U.S. dollar, for investments for which the Company has determined that the local currency is the functional currency, for the period in which the Company held its investment result in a CTA. This CTA is recorded as a component of Accumulated other comprehensive income (“AOCI”) on the Company’s Consolidated Balance Sheets. The CTA amounts are subject to future changes resulting from ongoing fluctuations in the respective foreign currency exchange rates. Changes in exchange rates are impacted by many factors that cannot be forecasted with reliable accuracy. Any change could have a favorable or unfavorable impact on the Company’s CTA balance. The Company’s aggregate CTA gain balance at December 31, 2016, is $6.3 million.
Under GAAP, the Company is required to release CTA balances into earnings when the Company has substantially liquidated its investment in a foreign entity. The Company may, in the near term, substantially liquidate its remaining investment in Canada, which will require the then unrealized gain on foreign currency translation to be recognized as earnings.
Item 8. Financial Statements and Supplementary Data
The response to this Item 8 is included in our audited Consolidated Financial Statements and Notes to Consolidated Financial Statements, which are contained in Part IV Item 15 of this Form 10-K.
Item 9. Changes in and Disagreements With Accountants on Accounting and Financial Disclosure
None.
Item 9A. Controls and Procedures
Evaluation of Disclosure Controls and Procedures
The Company’s management, with the participation of the Company’s Chief Executive Officer and Chief Financial Officer, has evaluated the effectiveness of the Company’s disclosure controls and procedures (as such term is defined in Rules 13a-15(e) and 15d-15(e) under the Securities Exchange Act of 1934, as amended (the "Exchange Act")) as of the end of the period covered by this report. Based on such evaluation, the Company’s Chief Executive Officer and Chief Financial Officer have concluded that, as of the end of such period, the Company’s disclosure controls and procedures are effective.
Changes in Internal Control Over Financial Reporting
There have not been any changes in the Company’s internal control over financial reporting (as such term is defined in Rules 13a-15(f) and 15d-15(f) under the Exchange Act) during the fourth fiscal quarter ended December 31, 2016, that have materially affected, or are reasonably likely to materially affect, the Company’s internal control over financial reporting.
Management’s Report on Internal Control Over Financial Reporting
Our management is responsible for establishing and maintaining adequate internal control over financial reporting, as such term is defined in Exchange Act Rule 13a-15(f) and 15d-15(f). Under the supervision and with the participation of our management, including our Chief Executive Officer and Chief Financial Officer, we conducted an evaluation of the effectiveness of our internal control over financial reporting based on the framework in the I nternal Control - Integrated Framework ( 2013) issued by the Committee of Sponsoring Organizations of the Treadway Commission. Based on our evaluation under the framework in Internal Control - Integrated Framework (2013) , our management concluded that our internal control over financial reporting was effective as of December 31, 2016.
The effectiveness of our internal control over financial reporting as of December 31, 2016, has been audited by PricewaterhouseCoopers LLP, an independent registered public accounting firm, as stated in their report which is included herein.
Item 9B. Other Information
None.
Item 10. Directors, Executive Officers and Corporate Governance
The information required by this item is incorporated by reference to “Proposal 1—Election of Directors,” “Corporate Governance,” “Committees of the Board of Directors,” “Executive Officers” and “Other Matters” in our definitive proxy statement to be filed with respect to the Annual Meeting of Stockholders expected to be held on April 25, 2017 (“Proxy Statement”).
We have adopted a Code of Business Conduct and Ethics that applies to all employees (the “Code of Ethics”). The Code of Ethics is available at the Investors/Governance/Governance Documents section of our website at www.kimcorealty.com. A copy of the Code of Ethics is available in print, free of charge, to stockholders upon request to us at the address set forth in Item 1 of this Annual Report on Form 10-K under the section “Business - Background.” We intend to satisfy the disclosure requirements under the Securities and Exchange Act of 1934, as amended, regarding an amendment to or waiver from a provision of our Code of Ethics by posting such information on our web site.
Item 11. Executive Compensation
The information required by this item is incorporated by reference to “Compensation Discussion and Analysis,” “Executive Compensation Committee Report,” “Compensation Tables,” “Compensation of Directors” and “Other Matters” in our Proxy Statement.
Item 12. Security Ownership of Certain Beneficial Owners and Management and Related Stockholder Matters
The information required by this item is incorporated by reference to “Security Ownership of Certain Beneficial Owners and Management” and “Compensation Tables” in our Proxy Statement.
Item 13. Certain Relationships and Related Transactions, and Director Independence
The information required by this item is incorporated by reference to “Certain Relationships and Related Transactions” and “Corporate Governance” in our Proxy Statement.
Item 14. Principal Accounting Fees and Services
The information required by this item is incorporated by reference to “Independent Registered Public Accountants” in our Proxy Statement.
Item 15. Exhibits, Financial Statement Schedules
|
Form 10-K
Report Page |
|||
|
(a) 1. |
Financial Statements – The following consolidated financial information is included as a separate section of this annual report on Form 10-K. |
|
|
|
40 |
|||
|
Consolidated Financial Statements |
|||
|
Consolidated Balance Sheets as of December 31, 2016 and 2015 |
41 |
||
|
Consolidated Statements of Income for the years ended December 31, 2016, 2015 and 2014 |
42 |
||
|
Consolidated Statements of Comprehensive Income for the years ended December 31, 2016, 2015 and 2014 |
43 |
||
|
Consolidated Statements of Changes in Equity for the years ended December 31, 2016, 2015 and 2014 |
44 |
||
|
Consolidated Statements of Cash Flows for the years ended December 31, 2016, 2015 and 2014 |
45 |
||
|
46 |
|||
|
2 |
. Financial Statement Schedules - |
||
|
Valuation and Qualifying Accounts |
87 |
||
|
Real Estate and Accumulated Depreciation |
88 |
||
|
Mortgage Loans on Real Estate |
90 |
||
|
All other schedules are omitted since the required information is not present or is not present in amounts sufficient to require submission of the schedule. |
|||
|
3. |
Exhibits - |
||
|
The exhibits listed on the accompanying Index to Exhibits are filed as part of this report. |
36 |
||
Item 16. Form 10-K Summary
None
INDEX TO EXHIBITS
|
Incorporated by Reference |
|||||||||||||||
|
Exhibit Number |
Exhibit Description |
Form |
File No. |
Date of Filing |
Exhibit Number |
Filed / Furnished Herewith |
Page Number |
||||||||
|
3.1(a) |
Articles of Restatement of Kimco Realty Corporation, dated January 14, 2011 |
10-K |
1-10899 |
02/28/11 |
3.1(a) |
||||||||||
|
3.1(b) |
Amendment to Articles of Restatement of Kimco Realty Corporation, dated May 8, 2014 |
* |
91 |
||||||||||||
|
3.1(c) |
Articles Supplementary of Kimco Realty Corporation, dated November 8, 2010 |
10-K |
1-10899 |
02/28/11 |
3.1(b) |
||||||||||
|
3.1(d) |
Articles Supplementary of Kimco Realty Corporation, dated March 12, 2012 |
8-A12B |
1-10899 |
03/13/12 |
3.2 |
||||||||||
|
3.1(e) |
Articles Supplementary of Kimco Realty Corporation, dated July 17, 2012 |
8-A12B |
1-10899 |
07/18/12 |
3.2 |
||||||||||
|
3.1(f) |
Articles Supplementary of Kimco Realty Corporation, dated November 30, 2012 |
8-A12B |
1-10899 |
12/03/12 |
3.2 |
||||||||||
|
3.2 |
Amended and Restated Bylaws of Kimco Realty Corporation, dated February 25, 2009 |
10-K |
1-10899 |
02/27/09 |
3.2 |
||||||||||
|
4.1 |
Agreement of Kimco Realty Corporation pursuant to Item 601(b)(4)(iii)(A) of Regulation S-K |
S-11 |
333-42588 |
09/11/91 |
4.1 |
||||||||||
|
4.2 |
Form of Certificate of Designations for the Preferred Stock |
S-3 |
333-67552 |
09/10/93 |
4(d) |
||||||||||
|
4.3 |
Indenture dated September 1, 1993, between Kimco Realty Corporation and Bank of New York (as successor to IBJ Schroder Bank and Trust Company) |
S-3 |
333-67552 |
09/10/93 |
4(a) |
||||||||||
|
4.4 |
First Supplemental Indenture, dated August 4, 1994, between Kimco Realty Corporation and Bank of New York (as successor to IBJ Schroder Bank and Trust Company) |
10-K |
1-10899 |
03/28/96 |
4.6 |
||||||||||
|
4.5 |
Second Supplemental Indenture, dated April 7, 1995, between Kimco Realty Corporation and Bank of New York (as successor to IBJ Schroder Bank and Trust Company) |
8-K |
1-10899 |
04/07/95 |
4(a) |
||||||||||
|
4.6 |
Third Supplemental Indenture, dated June 2, 2006, between Kimco Realty Corporation and The Bank of New York, as trustee |
8-K |
1-10899 |
06/05/06 |
4.1 |
||||||||||
|
4.7 |
Fourth Supplemental Indenture, dated April 26, 2007, between Kimco Realty Corporation and The Bank of New York, as trustee |
8-K |
1-10899 |
04/26/07 |
1.3 |
||||||||||
|
4.8 |
Fifth Supplemental Indenture, dated September 24, 2009, between Kimco Realty Corporation and The Bank of New York Mellon, as trustee |
8-K |
1-10899 |
09/24/09 |
4.1 |
||||||||||
|
4.9 |
Sixth Supplemental Indenture, dated May 23, 2013, between Kimco Realty Corporation and The Bank of New York Mellon, as trustee |
8-K |
1-10899 |
05/23/13 |
4.1 |
||||||||||
|
4.10 |
Seventh Supplemental Indenture, dated April 24, 2014, between Kimco Realty Corporation and The Bank of New York Mellon, as trustee |
8-K |
1-10899 |
04/24/14 |
4.1 |
||||||||||
|
10.1 |
Amended and Restated Stock Option Plan |
10-K |
1-10899 |
03/28/95 |
10.3 |
||||||||||
|
10.2 |
Second Amended and Restated 1998 Equity Participation Plan of Kimco Realty Corporation (restated February 25, 2009) |
10-K |
1-10899 |
02/27/09 |
10.9 |
||||||||||
|
10.3 |
Form of Indemnification Agreement |
10-K |
1-10899 |
02/27/09 |
99.1 |
||||||||||
| 10.4 | Agency Agreement, dated July 17, 2013, by and among Kimco North Trust III, Kimco Realty Corporation and Scotia Capital Inc., RBC Dominion Securities Inc., CIBC World Markets Inc. and National Bank Financial Inc. | 10-Q | 1-10899 | 08/02/13 | 99.1 | ||||||||||
| 10.5 | Kimco Realty Corporation Executive Severance Plan, dated March 15, 2010 | 8-K | 1-10899 | 03/19/10 | 10.5 | ||||||||||
| 10.6 | Restated Kimco Realty Corporation 2010 Equity Participation Plan | - | - | - | - | * | 93 | ||||||||
| 10.7 | Form of Performance Share Award Grant Notice and Performance Share Award Agreement | 8-K | 1-10899 | 03/19/10 | 10.8 | ||||||||||
| 10.8 | First Amendment to the Kimco Realty Corporation Executive Severance Plan, dated March 20, 2012 | 10-Q | 1-10899 | 05/10/12 | 10.3 | ||||||||||
| Incorporated by Reference | |||||||
|
Exhibit Number |
Exhibit Description | Form | File No. |
Date of Filing |
Exhibit Number |
Filed / Furnished Herewith |
Page Number |
|
10.9 |
$1.75 Billion Amended and Restated Credit Agreement, dated March 17, 2014, among Kimco Realty Corporation, the subsidiaries of Kimco party thereto, the lenders party thereto, and JPMorgan Chase Bank, N.A., as administrative agent |
8-K |
1-10899 |
03/20/14 |
10.1 |
||
|
10.10 |
$2.25 Billion Amended and Restated Credit Agreement, dated February 1, 2017, among Kimco Realty Corporation, the subsidiaries of Kimco party thereto, the lenders party thereto, and JPMorgan Chase Bank, N.A., as administrative agent |
8-K |
1-10899 |
02/02/17 |
10.1 |
||
|
10.11 |
Credit Agreement, dated January 30, 2015, among Kimco Realty Corporation and each of the parties named therein |
8-K |
1-10899 |
02/05/15 |
10.1 |
||
|
10.12 |
Consulting Agreement, dated June 11, 2015, between Kimco Realty Corporation and David B. Henry |
8-K |
1-10899 |
06/12/15 |
10.1 |
||
|
12.1 |
Computation of Ratio of Earnings to Fixed Charges |
— |
— |
— |
— |
* |
116 |
|
12.2 |
Computation of Ratio of Earnings to Combined Fixed Charges and Preferred Stock Dividends |
— |
— |
— |
— |
* |
117 |
|
21.1 |
Significant Subsidiaries of the Company |
— |
— |
— |
— |
* |
118 |
|
23.1 |
Consent of PricewaterhouseCoopers LLP |
— |
— |
— |
— |
* |
119 |
|
31.1 |
Certification of the Company’s Chief Executive Officer, Conor C. Flynn, pursuant to Section 302 of the Sarbanes-Oxley Act of 2002 |
— |
— |
— |
— |
* |
120 |
|
31.2 |
Certification of the Company’s Chief Financial Officer, Glenn G. Cohen, pursuant to Section 302 of the Sarbanes-Oxley Act of 2002 |
— |
— |
— |
— |
* |
121 |
|
32.1 |
Certification of the Company’s Chief Executive Officer, Conor C. Flynn, and the Company’s Chief Financial Officer, Glenn G. Cohen, pursuant to Section 906 of the Sarbanes-Oxley Act of 2002 |
— |
— |
— |
— |
** |
122 |
|
99.1 |
Property Chart |
— |
— |
— |
— |
* |
123 |
|
101.INS |
XBRL Instance Document |
— |
— |
— |
— |
* |
|
|
101.SCH |
XBRL Taxonomy Extension Schema |
— |
— |
— |
— |
* |
|
|
101.CAL |
XBRL Taxonomy Extension Calculation Linkbase |
— |
— |
— |
— |
* |
|
|
101.DEF |
XBRL Taxonomy Extension Definition Linkbase |
— |
— |
— |
— |
* |
|
|
101.LAB |
XBRL Taxonomy Extension Label Linkbase |
— |
— |
— |
— |
* |
|
|
101.PRE |
XBRL Taxonomy Extension Presentation Linkbase |
— |
— |
— |
— |
* |
|
* Filed herewith
** Furnished herewith
SIGNATURES
Pursuant to the requirements of Section 13 or 15(d) of the Securities Exchange Act of 1934, the registrant has duly caused this report to be signed on its behalf by the undersigned, thereunto duly authorized.
|
|
KIMCO REALTY CORPORATION |
|
|
|
|
|
|
|
|
|
|
|
|
|
|
By: |
/s/ Conor C. Flynn |
|
|
|
Conor C. Flynn |
|
|
|
|
Chief Executive Officer |
|
|
Dated: February 24, 2017
Pursuant to the requirements of the Securities Exchange Act of 1934, this report has been signed below by the following persons on behalf of the registrant and in the capacities and on the dates indicated.
|
Signature |
Title |
Date |
|
|
/s/ Milton Cooper |
Executive Chairman of the Board of Directors |
February 24, 2017 |
|
|
Milton Cooper |
|||
|
/s/ Conor C. Flynn |
President - Chief Executive Officer |
February 24, 2017 |
|
|
Conor C. Flynn |
and Director |
||
|
/s/ Richard G. Dooley |
Director |
February 24, 2017 |
|
|
Richard G. Dooley |
|||
|
/s/ Joe Grills |
Director |
February 24, 2017 |
|
|
Joe Grills |
|||
|
/s/ Frank Lourenso |
Director |
February 24, 2017 |
|
|
Frank Lourenso |
|||
|
/s/ Richard Saltzman |
Director |
February 24, 2017 |
|
|
Richard Saltzman |
|||
|
/s/ Philip Coviello |
Director |
February 24, 2017 |
|
|
Philip Coviello |
|||
|
/s/ Colombe Nicholas |
Director |
February 24, 2017 |
|
|
Colombe Nicholas |
|||
|
/s/ Mary Hogan Preusse |
Director |
February 24, 2017 |
|
|
Mary Hogan Preusse |
|||
|
/s/ Glenn G. Cohen |
Executive Vice President - |
February 24, 2017 |
|
|
Glenn G. Cohen |
Chief Financial Officer and |
||
|
Treasurer |
|||
|
/s/ Paul Westbrook |
Vice President - |
February 24, 2017 |
|
|
Paul Westbrook |
Chief Accounting Officer |
ANNUAL REPORT ON FORM 10-K
INDEX TO FINANCIAL STATEMENTS
AND
FINANCIAL STATEMENT SCHEDULES
|
Form 10-K
|
||
|
KIMCO REALTY CORPORATION AND SUBSIDIARIES |
||
|
40 |
||
|
Consolidated Financial Statements and Financial Statement Schedules: |
||
|
Consolidated Balance Sheets as of December 31, 2016 and 2015 |
41 |
|
|
Consolidated Statements of Income for the years ended December 31, 2016, 2015 and 2014 |
42 |
|
|
Consolidated Statements of Comprehensive Income for the years ended December 31, 2016, 2015 and 2014 |
43 |
|
|
Consolidated Statements of Changes in Equity for the years ended December 31, 2016, 2015 and 2014 |
44 |
|
|
|
||
|
Consolidated Statements of Cash Flows for the years ended December 31, 2016, 2015 and 2014 |
45 |
|
|
46 |
||
|
Financial Statement Schedules: |
||
|
II. |
87 |
|
|
III. |
88 |
|
|
IV. |
90 |
|
Report of Independent Registered Public Accounting Firm
To the Board of Directors and Stockholders
of Kimco Realty Corporation:
In our opinion, the consolidated financial statements listed in the index appearing under Item 15(a)(1) present fairly, in all material respects, the financial position of Kimco Realty Corporation and its subsidiaries at December 31, 2016 and 2015, and the results of their operations and their cash flows for each of the three years in the period ended December 31, 2016 in conformity with accounting principles generally accepted in the United States of America. In addition, in our opinion, the financial statement schedules listed in the index appearing under Item 15(a)(2) present fairly, in all material respects, the information set forth therein when read in conjunction with the related consolidated financial statements. Also in our opinion, the Company maintained, in all material respects, effective internal control over financial reporting as of December 31, 2016, based on criteria established in Internal Control - Integrated Framework (2013) issued by the Committee of Sponsoring Organizations of the Treadway Commission (COSO). The Company's management is responsible for these financial statements and financial statement schedules, for maintaining effective internal control over financial reporting and for its assessment of the effectiveness of internal control over financial reporting, included in Management's Report on Internal Control over Financial Reporting appearing under Item 9A. Our responsibility is to express opinions on these financial statements, on the financial statement schedules, and on the Company's internal control over financial reporting based on our integrated audits. We conducted our audits in accordance with the standards of the Public Company Accounting Oversight Board (United States). Those standards require that we plan and perform the audits to obtain reasonable assurance about whether the financial statements are free of material misstatement and whether effective internal control over financial reporting was maintained in all material respects. Our audits of the financial statements included examining, on a test basis, evidence supporting the amounts and disclosures in the financial statements, assessing the accounting principles used and significant estimates made by management, and evaluating the overall financial statement presentation. Our audit of internal control over financial reporting included obtaining an understanding of internal control over financial reporting, assessing the risk that a material weakness exists, and testing and evaluating the design and operating effectiveness of internal control based on the assessed risk. Our audits also included performing such other procedures as we considered necessary in the circumstances. We believe that our audits provide a reasonable basis for our opinions.
A company’s internal control over financial reporting is a process designed to provide reasonable assurance regarding the reliability of financial reporting and the preparation of financial statements for external purposes in accordance with generally accepted accounting principles. A company’s internal control over financial reporting includes those policies and procedures that (i) pertain to the maintenance of records that, in reasonable detail, accurately and fairly reflect the transactions and dispositions of the assets of the company; (ii) provide reasonable assurance that transactions are recorded as necessary to permit preparation of financial statements in accordance with generally accepted accounting principles, and that receipts and expenditures of the company are being made only in accordance with authorizations of management and directors of the company; and (iii) provide reasonable assurance regarding prevention or timely detection of unauthorized acquisition, use, or disposition of the company’s assets that could have a material effect on the financial statements.
Because of its inherent limitations, internal control over financial reporting may not prevent or detect misstatements. Also, projections of any evaluation of effectiveness to future periods are subject to the risk that controls may become inadequate because of changes in conditions, or that the degree of compliance with the policies or procedures may deteriorate.
/s/ PricewaterhouseCoopers LLP
New York, New York
February 24, 2017
KIMCO REALTY CORPORATION AND SUBSIDIARIES
(in thousands, except share information)
|
December 31, 2016 |
December 31, 2015 |
|||||||
|
Assets: |
||||||||
|
Real Estate |
||||||||
|
Rental property |
||||||||
|
Land |
$ | 2,845,186 | $ | 2,728,257 | ||||
|
Building and improvements |
8,827,861 | 8,661,362 | ||||||
| 11,673,047 | 11,389,619 | |||||||
|
Less: accumulated depreciation and amortization |
(2,278,292 | ) | (2,115,320 | ) | ||||
| 9,394,755 | 9,274,299 | |||||||
|
Real estate under development |
335,028 | 179,190 | ||||||
|
Real estate, net |
9,729,783 | 9,453,489 | ||||||
|
Investments and advances in real estate joint ventures |
504,209 | 742,559 | ||||||
|
Other real estate investments |
209,146 | 215,836 | ||||||
|
Mortgages and other financing receivables |
23,197 | 23,824 | ||||||
|
Cash and cash equivalents |
142,486 | 189,534 | ||||||
|
Marketable securities |
8,101 | 7,565 | ||||||
|
Accounts and notes receivable, net |
181,823 | 175,252 | ||||||
|
Deferred charges and prepaid expenses |
147,694 | 152,349 | ||||||
|
Other assets |
284,161 | 383,763 | ||||||
|
Total assets |
$ | 11,230,600 | $ | 11,344,171 | ||||
|
Liabilities: |
||||||||
|
Notes payable |
$ | 3,927,251 | $ | 3,761,328 | ||||
|
Mortgages payable |
1,139,117 | 1,614,982 | ||||||
|
Accounts payable and accrued expenses |
145,751 | 150,059 | ||||||
|
Dividends payable |
124,517 | 115,182 | ||||||
|
Other liabilities |
404,137 | 433,960 | ||||||
|
Total liabilities |
5,740,773 | 6,075,511 | ||||||
|
Redeemable noncontrolling interests |
86,953 | 86,709 | ||||||
|
Commitments and Contingencies |
||||||||
|
Stockholders' equity: |
||||||||
|
Preferred stock, $1.00 par value, authorized 6,029,100 shares, 32,000 shares issued and outstanding (in series) |
||||||||
|
Aggregate liquidation preference $800,000 |
32 | 32 | ||||||
|
Common stock, $.01 par value, authorized 750,000,000 shares issued and outstanding 425,034,113 and 413,430,756 shares, respectively |
4,250 | 4,134 | ||||||
|
Paid-in capital |
5,922,958 | 5,608,881 | ||||||
|
Cumulative distributions in excess of net income |
(676,867 | ) | (572,335 | ) | ||||
|
Accumulated other comprehensive income |
5,766 | 5,588 | ||||||
|
Total stockholders' equity |
5,256,139 | 5,046,300 | ||||||
|
Noncontrolling interests |
146,735 | 135,651 | ||||||
|
Total equity |
5,402,874 | 5,181,951 | ||||||
|
Total liabilities and equity |
$ | 11,230,600 | $ | 11,344,171 | ||||
The accompanying notes are an integral part of these consolidated financial statements.
KIMCO REALTY CORPORATION AND SUBSIDIARIES
(in thousands, except share information)
|
Year Ended December 31, |
||||||||||||
|
2016 |
2015 |
2014 |
||||||||||
|
Revenues |
||||||||||||
|
Revenues from rental properties |
$ | 1,152,401 | $ | 1,144,474 | $ | 958,888 | ||||||
|
Management and other fee income |
18,391 | 22,295 | 35,009 | |||||||||
|
Total revenues |
1,170,792 | 1,166,769 | 993,897 | |||||||||
|
Operating expenses |
||||||||||||
|
Rent |
10,993 | 12,347 | 14,250 | |||||||||
|
Real estate taxes |
146,615 | 147,150 | 124,670 | |||||||||
|
Operating and maintenance |
140,910 | 144,980 | 119,697 | |||||||||
|
General and administrative expenses |
117,302 | 122,735 | 122,201 | |||||||||
|
Provision for doubtful accounts |
5,563 | 6,075 | 4,882 | |||||||||
|
Impairment charges |
93,266 | 45,383 | 39,808 | |||||||||
|
Depreciation and amortization |
355,320 | 344,527 | 258,074 | |||||||||
|
Total operating expenses |
869,969 | 823,197 | 683,582 | |||||||||
|
Operating income |
300,823 | 343,572 | 310,315 | |||||||||
|
Other income/(expense) |
||||||||||||
|
Mortgage financing income |
1,634 | 2,940 | 3,129 | |||||||||
|
Interest, dividends and other investment income |
1,478 | 39,061 | 966 | |||||||||
|
Other income/(expense), net |
2,313 | 2,234 | (8,544 | ) | ||||||||
|
Interest expense |
(192,549 | ) | (218,891 | ) | (203,759 | ) | ||||||
|
Early extinguishment of debt charges |
(45,674 | ) | - | - | ||||||||
|
Income from continuing operations before income taxes, equity in income of joint ventures, gain on change in control of interests and equity in income from other real estate investments |
68,025 | 168,916 | 102,107 | |||||||||
|
Provision for income taxes, net |
(72,545 | ) | (60,230 | ) | (22,438 | ) | ||||||
|
Equity in income of joint ventures, net |
218,714 | 480,395 | 159,560 | |||||||||
|
Gain on change in control of interests, net |
57,386 | 149,234 | 107,235 | |||||||||
|
Equity in income of other real estate investments, net |
27,773 | 36,090 | 38,042 | |||||||||
|
Income from continuing operations |
299,353 | 774,405 | 384,506 | |||||||||
|
Discontinued operations |
||||||||||||
|
(Loss)/income from discontinued operating properties, net of tax |
- | (15 | ) | 36,780 | ||||||||
|
Impairment/loss on operating properties, net of tax |
- | (60 | ) | (176,315 | ) | |||||||
|
Gain on disposition of operating properties, net of tax |
- | - | 190,520 | |||||||||
|
(Loss)/income from discontinued operations |
- | (75 | ) | 50,985 | ||||||||
|
Gain on sale of operating properties, net, net of tax |
86,785 | 125,813 | 389 | |||||||||
|
Net income |
386,138 | 900,143 | 435,880 | |||||||||
|
Net income attributable to noncontrolling interests |
(7,288 | ) | (6,028 | ) | (11,879 | ) | ||||||
|
Net income attributable to the Company |
378,850 | 894,115 | 424,001 | |||||||||
|
Preferred stock redemption charges |
- | (5,816 | ) | - | ||||||||
|
Preferred dividends |
(46,220 | ) | (57,084 | ) | (58,294 | ) | ||||||
|
Net income available to the Company's common shareholders |
$ | 332,630 | $ | 831,215 | $ | 365,707 | ||||||
|
Per common share: |
||||||||||||
|
Income from continuing operations: |
||||||||||||
|
-Basic |
$ | 0.79 | $ | 2.01 | $ | 0.77 | ||||||
|
-Diluted |
$ | 0.79 | $ | 2.00 | $ | 0.77 | ||||||
|
Net income available to the Company: |
||||||||||||
|
-Basic |
$ | 0.79 | $ | 2.01 | $ | 0.89 | ||||||
|
-Diluted |
$ | 0.79 | $ | 2.00 | $ | 0.89 | ||||||
|
Weighted average shares: |
||||||||||||
|
-Basic |
418,402 | 411,319 | 409,088 | |||||||||
|
-Diluted |
419,709 | 412,851 | 411,038 | |||||||||
|
Amounts available to the Company's common shareholders: |
||||||||||||
|
Income from continuing operations |
$ | 332,630 | $ | 831,290 | $ | 316,839 | ||||||
|
(Loss)/income from discontinued operations |
- | (75 | ) | 48,868 | ||||||||
|
Net income |
$ | 332,630 | $ | 831,215 | $ | 365,707 | ||||||
The accompanying notes are an integral part of these consolidated financial statements.
KIMCO REALTY CORPORATION AND SUBSIDIARIES
CONSOLIDATED STATEMENTS OF COMPREHENSIVE INCOME
(in thousands)
|
Year Ended December 31, |
||||||||||||
|
2016 |
2015 |
2014 |
||||||||||
|
Net income |
$ | 386,138 | $ | 900,143 | $ | 435,880 | ||||||
|
Other comprehensive income: |
||||||||||||
|
Change in unrealized gain on marketable securities |
8 | (45,799 | ) | 20,202 | ||||||||
|
Change in unrealized loss on interest rate swaps |
451 | (22 | ) | (1,404 | ) | |||||||
|
Change in foreign currency translation adjustment |
(281 | ) | 6,287 | 96,895 | ||||||||
|
Other comprehensive income/(loss) |
178 | (39,534 | ) | 115,693 | ||||||||
|
Comprehensive income |
386,316 | 860,609 | 551,573 | |||||||||
|
Comprehensive income attributable to noncontrolling interests |
(7,288 | ) | (6,028 | ) | (17,468 | ) | ||||||
|
Comprehensive income attributable to the Company |
$ | 379,028 | $ | 854,581 | $ | 534,105 | ||||||
The accompanying notes are an integral part of these consolidated financial statements.
KIMCO REALTY CORPORATION AND SUBSIDIARIES
CONSOLIDATED STATEMENTS OF CHANGES IN EQUITY
For the Years Ended December 31, 2016, 2015 and 2014
(in thousands)
|
Cumulative |
Accumulated |
|
||||||||||||||||||||||||||||||||||||||
|
Distributions in Excess |
Other Comprehensive |
Preferred Stock |
Common Stock |
|
Total |
|
|
|||||||||||||||||||||||||||||||||
|
of Net Income |
Income |
Issued |
Amount |
Issued |
Amount |
Paid-in Capital |
Stockholders' Equity |
Noncontrolling Interests |
Total Eq uity |
|||||||||||||||||||||||||||||||
|
Balance, January 1, 2014 |
$ | (996,058 | ) | $ | (64,982 | ) | 102 | $ | 102 | 409,731 | $ | 4,097 | $ | 5,689,258 | $ | 4,632,417 | $ | 137,109 | $ | 4,769,526 | ||||||||||||||||||||
|
Contributions from noncontrolling interests |
- | - | - | - | - | - | - | - | 6,259 | 6,259 | ||||||||||||||||||||||||||||||
|
Comprehensive income: |
||||||||||||||||||||||||||||||||||||||||
|
Net income |
424,001 | - | - | - | - | - | - | 424,001 | 11,879 | 435,880 | ||||||||||||||||||||||||||||||
|
Other comprehensive income, net of tax: |
||||||||||||||||||||||||||||||||||||||||
|
Change in unrealized gain on marketable securities |
- | 20,202 | - | - | - | - | - | 20,202 | - | 20,202 | ||||||||||||||||||||||||||||||
|
Change in unrealized loss on interest rate swaps |
- | (1,404 | ) | - | - | - | - | - | (1,404 | ) | - | (1,404 | ) | |||||||||||||||||||||||||||
|
Change in foreign currency translation adjustment |
- | 91,306 | - | - | - | - | - | 91,306 | 5,589 | 96,895 | ||||||||||||||||||||||||||||||
|
Redeemable noncontrolling interests income |
- | - | - | - | - | - | - | - | (6,335 | ) | (6,335 | ) | ||||||||||||||||||||||||||||
|
Dividends ($0.915 per common share; $1.725 per |
||||||||||||||||||||||||||||||||||||||||
|
Class H Depositary Share, $1.5000 per |
||||||||||||||||||||||||||||||||||||||||
|
Class I Depositary Share, $1.3750 per |
||||||||||||||||||||||||||||||||||||||||
|
Class J Depositary Share, and $1.40625 per |
||||||||||||||||||||||||||||||||||||||||
|
Class K Depositary Share, respectively) |
(434,521 | ) | - | - | - | - | - | - | (434,521 | ) | - | (434,521 | ) | |||||||||||||||||||||||||||
|
Distributions to noncontrolling interests |
- | - | - | - | - | - | - | - | (26,755 | ) | (26,755 | ) | ||||||||||||||||||||||||||||
|
Issuance of common stock |
- | - | - | - | 805 | 8 | 14,039 | 14,047 | - | 14,047 | ||||||||||||||||||||||||||||||
|
Surrender of restricted stock |
- | - | - | - | (190 | ) | (2 | ) | (4,049 | ) | (4,051 | ) | - | (4,051 | ) | |||||||||||||||||||||||||
|
Exercise of common stock options |
- | - | - | - | 1,474 | 15 | 23,859 | 23,874 | - | 23,874 | ||||||||||||||||||||||||||||||
|
Acquisition of noncontrolling interests |
- | - | - | - | - | - | (294 | ) | (294 | ) | (766 | ) | (1,060 | ) | ||||||||||||||||||||||||||
|
Amortization of equity awards |
- | - | - | - | - | - | 9,208 | 9,208 | - | 9,208 | ||||||||||||||||||||||||||||||
|
Balance, December 31, 2014 |
(1,006,578 | ) | 45,122 | 102 | 102 | 411,820 | 4,118 | 5,732,021 | 4,774,785 | 126,980 | 4,901,765 | |||||||||||||||||||||||||||||
|
Contributions from noncontrolling interests |
- | - | - | - | - | - | - | - | 66,163 | 66,163 | ||||||||||||||||||||||||||||||
|
Comprehensive income: |
||||||||||||||||||||||||||||||||||||||||
|
Net income |
894,115 | - | - | - | - | - | - | 894,115 | 6,028 | 900,143 | ||||||||||||||||||||||||||||||
|
Other comprehensive income, net of tax: |
||||||||||||||||||||||||||||||||||||||||
|
Change in unrealized gain on marketable securities |
- | (45,799 | ) | - | - | - | - | - | (45,799 | ) | - | (45,799 | ) | |||||||||||||||||||||||||||
|
Change in unrealized loss on interest rate swaps |
- | (22 | ) | - | - | - | - | - | (22 | ) | - | (22 | ) | |||||||||||||||||||||||||||
|
Change in foreign currency translation adjustment |
- | 6,287 | - | - | - | - | - | 6,287 | - | 6,287 | ||||||||||||||||||||||||||||||
|
Redeemable noncontrolling interests income |
- | - | - | - | - | - | - | - | (7,061 | ) | (7,061 | ) | ||||||||||||||||||||||||||||
|
Dividends ($0.975 per common share; $1.485 per |
||||||||||||||||||||||||||||||||||||||||
|
Class H Depositary Share, $1.5000 per |
||||||||||||||||||||||||||||||||||||||||
|
Class I Depositary Share, $1.3750 per |
||||||||||||||||||||||||||||||||||||||||
|
Class J Depositary Share, and $1.40625 per |
||||||||||||||||||||||||||||||||||||||||
|
Class K Depositary Share, respectively) |
(459,872 | ) | - | - | - | - | - | - | (459,872 | ) | - | (459,872 | ) | |||||||||||||||||||||||||||
|
Distributions to noncontrolling interests |
- | - | - | - | - | - | - | - | (8,539 | ) | (8,539 | ) | ||||||||||||||||||||||||||||
|
Issuance of common stock |
- | - | - | - | 824 | 8 | 485 | 493 | - | 493 | ||||||||||||||||||||||||||||||
|
Surrender of restricted stock |
- | - | - | - | (232 | ) | (2 | ) | (5,680 | ) | (5,682 | ) | - | (5,682 | ) | |||||||||||||||||||||||||
|
Exercise of common stock options |
- | - | - | - | 1,019 | 10 | 18,698 | 18,708 | - | 18,708 | ||||||||||||||||||||||||||||||
|
Sale of interests in investments, net of tax of $16.0 million |
- | - | - | - | - | - | 23,993 | 23,993 | - | 23,993 | ||||||||||||||||||||||||||||||
|
Acquisition of noncontrolling interests |
- | - | - | - | - | - | 262 | 262 | (47,920 | ) | (47,658 | ) | ||||||||||||||||||||||||||||
|
Amortization of equity awards |
- | - | - | - | - | - | 14,032 | 14,032 | - | 14,032 | ||||||||||||||||||||||||||||||
|
Redemption of preferred stock |
- | - | (70 | ) | (70 | ) | - | - | (174,930 | ) | (175,000 | ) | - | (175,000 | ) | |||||||||||||||||||||||||
|
Balance, December 31, 2015 |
(572,335 | ) | 5,588 | 32 | 32 | 413,431 | 4,134 | 5,608,881 | 5,046,300 | 135,651 | 5,181,951 | |||||||||||||||||||||||||||||
|
Contributions from noncontrolling interests |
- | - | - | - | - | - | - | - | 16,667 | 16,667 | ||||||||||||||||||||||||||||||
|
Comprehensive income: |
||||||||||||||||||||||||||||||||||||||||
|
Net income |
378,850 | - | - | - | - | - | - | 378,850 | 7,288 | 386,138 | ||||||||||||||||||||||||||||||
|
Other comprehensive income, net of tax: |
||||||||||||||||||||||||||||||||||||||||
|
Change in unrealized gain on marketable securities |
- | 8 | - | - | - | - | - | 8 | - | 8 | ||||||||||||||||||||||||||||||
|
Change in unrealized loss on interest rate swaps |
- | 451 | - | - | - | - | - | 451 | - | 451 | ||||||||||||||||||||||||||||||
|
Change in foreign currency translation adjustment |
- | (281 | ) | - | - | - | - | - | (281 | ) | - | (281 | ) | |||||||||||||||||||||||||||
|
Redeemable noncontrolling interests income |
- | - | - | - | - | - | - | - | (4,349 | ) | (4,349 | ) | ||||||||||||||||||||||||||||
|
Dividends ($1.035 per common share; $1.5000 per |
||||||||||||||||||||||||||||||||||||||||
|
Class I Depositary Share, $1.3750 per |
||||||||||||||||||||||||||||||||||||||||
|
Class J Depositary Share, and $1.40625 per |
||||||||||||||||||||||||||||||||||||||||
|
Class K Depositary Share, respectively) |
(483,382 | ) | - | - | - | - | - | - | (483,382 | ) | - | (483,382 | ) | |||||||||||||||||||||||||||
|
Distributions to noncontrolling interests |
- | - | - | - | - | - | - | - | (8,522 | ) | (8,522 | ) | ||||||||||||||||||||||||||||
|
Issuance of common stock |
- | - | - | - | 10,711 | 107 | 286,314 | 286,421 | - | 286,421 | ||||||||||||||||||||||||||||||
|
Surrender of restricted stock |
- | - | - | - | (276 | ) | (3 | ) | (7,005 | ) | (7,008 | ) | - | (7,008 | ) | |||||||||||||||||||||||||
|
Exercise of common stock options |
- | - | - | - | 1,168 | 12 | 21,048 | 21,060 | - | 21,060 | ||||||||||||||||||||||||||||||
|
Amortization of equity awards |
- | - | - | - | - | - | 13,720 | 13,720 | - | 13,720 | ||||||||||||||||||||||||||||||
|
Balance, December 31, 2016 |
$ | (676,867 | ) | $ | 5,766 | 32 | $ | 32 | 425,034 | $ | 4,250 | $ | 5,922,958 | $ | 5,256,139 | $ | 146,735 | $ | 5,402,874 | |||||||||||||||||||||
The accompanying notes are an integral part of these consolidated financial statements.
KIMCO REALTY CORPORATION AND SUBSIDIARIES
(in thousands)
|
Year Ended December 31, |
||||||||||||
|
2016 |
2015 |
2014 |
||||||||||
|
Cash flow from operating activities: |
||||||||||||
|
Net income |
$ | 386,138 | $ | 900,143 | $ | 435,880 | ||||||
|
Adjustments to reconcile net income to net cash provided by operating activities: |
||||||||||||
|
Depreciation and amortization |
355,320 | 344,527 | 273,093 | |||||||||
|
Impairment charges |
93,266 | 45,464 | 217,858 | |||||||||
|
Deferred taxes |
55,068 | 4,498 | 15,128 | |||||||||
|
Early extinguishment of debt charges |
45,674 | - | - | |||||||||
|
Equity award expense |
19,071 | 18,465 | 17,879 | |||||||||
|
Gain on sale of operating properties |
(92,823 | ) | (132,907 | ) | (203,889 | ) | ||||||
|
Gain on sale of marketable securities |
- | (39,852 | ) | - | ||||||||
|
Gain on change in control of interests, net |
(57,386 | ) | (149,234 | ) | (107,235 | ) | ||||||
|
Equity in income of joint ventures, net |
(218,714 | ) | (480,395 | ) | (159,560 | ) | ||||||
|
Equity in income from other real estate investments, net |
(27,773 | ) | (36,090 | ) | (38,042 | ) | ||||||
|
Distributions from joint ventures and other real estate investments |
90,589 | 126,263 | 255,532 | |||||||||
|
Change in accounts and notes receivable |
(6,571 | ) | (2,867 | ) | (8,060 | ) | ||||||
|
Change in accounts payable and accrued expenses |
(7,886 | ) | 164 | (1,095 | ) | |||||||
|
Change in Canadian withholding tax receivable |
23,571 | (37,040 | ) | - | ||||||||
|
Change in other operating assets and liabilities |
(65,448 | ) | (67,438 | ) | (68,146 | ) | ||||||
|
Net cash flow provided by operating activities |
592,096 | 493,701 | 629,343 | |||||||||
|
Cash flow from investing activities: |
||||||||||||
|
Acquisition of operating real estate and other related net assets |
(203,190 | ) | (661,423 | ) | (384,828 | ) | ||||||
|
Improvements to operating real estate |
(143,489 | ) | (166,670 | ) | (131,795 | ) | ||||||
|
Acquisition of real estate under development |
(51,588 | ) | (16,355 | ) | (65,724 | ) | ||||||
|
Improvements to real estate under development |
(72,759 | ) | (16,861 | ) | (418 | ) | ||||||
|
Investment in marketable securities |
(2,466 | ) | (257 | ) | (11,445 | ) | ||||||
|
Proceeds from sale/repayments of marketable securities |
1,937 | 76,170 | 3,780 | |||||||||
|
Investments and advances to real estate joint ventures |
(86,453 | ) | (91,609 | ) | (93,845 | ) | ||||||
|
Reimbursements of investments and advances to real estate joint ventures |
71,656 | 94,053 | 222,590 | |||||||||
|
Distributions from liquidation of real estate joint ventures |
138,475 | 373,833 | - | |||||||||
|
Return of investment from liquidation of real estate joint ventures |
191,902 | 88,672 | - | |||||||||
|
Investment in other real estate investments |
(233 | ) | (641 | ) | (4,338 | ) | ||||||
|
Reimbursements of investments and advances to other real estate investments |
11,019 | 40,556 | 16,312 | |||||||||
|
Investment in mortgage loans receivable |
- | - | (50,000 | ) | ||||||||
|
Collection of mortgage loans receivable |
921 | 55,145 | 8,302 | |||||||||
|
Investment in other investments |
- | (190,278 | ) | - | ||||||||
|
Reimbursements of other investments |
500 | - | - | |||||||||
|
Proceeds from sale of operating properties |
304,600 | 437,030 | 612,748 | |||||||||
|
Proceeds from sale of development properties |
4,551 | - | 5,366 | |||||||||
|
Net cash flow provided by investing activities |
165,383 | 21,365 | 126,705 | |||||||||
|
Cash flow from financing activities: |
||||||||||||
|
Principal payments on debt, excluding normal amortization |
(700,853 | ) | (555,627 | ) | (327,963 | ) | ||||||
|
Principal payments on rental property debt |
(19,039 | ) | (28,632 | ) | (22,841 | ) | ||||||
|
Proceeds from mortgage loan financings |
- | - | 15,700 | |||||||||
|
Proceeds/(repayments) under the unsecured revolving credit facility, net |
26,445 | (100,000 | ) | (94,354 | ) | |||||||
|
Proceeds from issuance of unsecured term loan/notes |
1,400,000 | 1,500,030 | 500,000 | |||||||||
|
Repayments under unsecured term loan/notes |
(1,261,850 | ) | (750,000 | ) | (370,842 | ) | ||||||
|
Financing origination costs |
(25,679 | ) | (19,017 | ) | (11,911 | ) | ||||||
|
Payment of early extinguishment of debt charges |
(45,674 | ) | - | - | ||||||||
|
Change in tenants' security deposits |
1,367 | 2,116 | - | |||||||||
|
Contributions from noncontrolling interests |
- | 106,154 | 1,917 | |||||||||
|
Conversion/distribution of noncontrolling interests |
(12,594 | ) | (55,753 | ) | (3,201 | ) | ||||||
|
Dividends paid |
(474,045 | ) | (455,833 | ) | (427,873 | ) | ||||||
|
Proceeds from issuance of stock |
307,395 | 18,708 | 23,874 | |||||||||
|
Redemption of preferred stock |
- | (175,000 | ) | - | ||||||||
|
Net cash flow used for financing activities |
(804,527 | ) | (512,854 | ) | (717,494 | ) | ||||||
|
Change in cash and cash equivalents |
(47,048 | ) | 2,212 | 38,554 | ||||||||
|
Cash and cash equivalents, beginning of year |
189,534 | 187,322 | 148,768 | |||||||||
|
Cash and cash equivalents, end of year |
$ | 142,486 | $ | 189,534 | $ | 187,322 | ||||||
|
Interest paid during the year including payment of early extinguishment of debt charges of $45,674, $0 and $0, respectively (net of capitalized interest of $9,247, $5,618 and $2,383, respectively) |
$ | 252,482 | $ | 232,950 | $ | 207,632 | ||||||
|
Income taxes paid during the year (net of refunds received of $113,934, $0 and $0, respectively) |
$ | 6,090 | $ | 100,366 | $ | 23,292 | ||||||
The accompanying notes are an integral part of these consolidated financial statements.
KIMCO REALTY CORPORATION AND SUBSIDIARIES
NOTES TO CONSOLIDATED FINANCIAL STATEMENTS
Amounts relating to the number of buildings, square footage, tenant and occupancy data, joint venture debt average interest rates and terms and estimated project costs are unaudited.
|
1. |
Summary of Significant Accounting Policies: |
Business
Kimco Realty Corporation and subsidiaries (the "Company" or "Kimco"), affiliates and related real estate joint ventures are engaged principally in the ownership, management, development and operation of open-air shopping centers, which are anchored generally by discount department stores, grocery stores or drugstores. Additionally, the Company provides complementary services that capitalize on the Company’s established retail real estate expertise. The Company evaluates performance on a property specific or transactional basis and does not distinguish its principal business or group its operations on a geographical basis for purposes of measuring performance. Accordingly, the Company believes it has a single reportable segment for disclosure purposes in accordance with accounting principles generally accepted in the United States of America ("GAAP").
The Company elected status as a Real Estate Investment Trust (“REIT”) for federal income tax purposes beginning in its taxable year January 1, 1992 and operates in a manner that enables the Company to maintain its status as a REIT. Additionally, in connection with the Tax Relief Extension Act of 1999 (the "RMA"), which became effective January 1, 2001, the Company is permitted to participate in activities which it was precluded from previously in order to maintain its qualification as a REIT, so long as these activities are conducted in entities which elect to be treated as taxable subsidiaries under the Internal Revenue Code, as amended (the "Code"), subject to certain limitations. As such, the Company, through its wholly-owned taxable REIT subsidiaries (“TRS”), has been engaged in various retail real estate related opportunities including retail real estate management and disposition services which primarily focuses on leasing and disposition strategies of retail real estate controlled by both healthy and distressed and/or bankrupt retailers. The Company may consider other investments through its TRS should suitable opportunities arise.
Effective August 1, 2016, the Company merged Kimco Realty Services Inc. ("KRS"), a TRS, into a wholly-owned Limited Liability Company (“LLC”) of the Company (the “Merger”) and no longer operates KRS as a TRS. The Company analyzed the individual assets of KRS and determined that substantially all of KRS’s assets constitute real estate assets and investments that can be directly owned by the Company without adversely affecting the Company’s status as a REIT. Any non-REIT qualifying assets or activities were transferred to a newly formed TRS (see Footnote 22 of the Notes to Consolidated Financial Statements).
Principles of Consolidation and Estimates
The accompanying Consolidated Financial Statements include the accounts of the Company. The Company’s subsidiaries include subsidiaries which are wholly-owned and all entities in which the Company has a controlling interest, including where the Company has been determined to be a primary beneficiary of a variable interest entity (“VIE”) in accordance with the Consolidation guidance of the Financial Accounting Standards Board (“FASB”) Accounting Standards Codification (“ASC”). All inter-company balances and transactions have been eliminated in consolidation.
GAAP requires the Company's management to make estimates and assumptions that affect the reported amounts of assets and liabilities, the disclosure of contingent assets and liabilities and the reported amounts of revenues and expenses during a reporting period. The most significant assumptions and estimates relate to the valuation of real estate and related intangible assets and liabilities, equity method investments, other investments, including the assessment of impairments, as well as, depreciable lives, revenue recognition, the collectability of trade accounts receivable, realizability of deferred tax assets and the assessment of uncertain tax positions. Application of these assumptions requires the exercise of judgment as to future uncertainties, and, as a result, actual results could differ from these estimates.
Subsequent Events
The Company has evaluated subsequent events and transactions for potential recognition or disclosure in its consolidated financial statements (see Footnote 13 of the Notes to Consolidated Financial Statements).
KIMCO REALTY CORPORATION AND SUBSIDIARIES
NOTES TO CONSOLIDATED FINANCIAL STATEMENTS, continued
Real Estate
Real estate assets are stated at cost, less accumulated depreciation and amortization. Upon acquisition of real estate operating properties, the Company estimates the fair value of acquired tangible assets (consisting of land, building, building improvements and tenant improvements) and identified intangible assets and liabilities (consisting of above-market and below-market leases, in-place leases and tenant relationships, where applicable), assumed debt and redeemable units issued at the date of acquisition, based on evaluation of information and estimates available at that date. Fair value is determined based on an exit price approach, which contemplates the price that would be received to sell an asset or paid to transfer a liability in an orderly transaction between market participants at the measurement date. If, up to one year from the acquisition date for an acquisition qualifying as a business combination, information regarding fair value of the assets acquired and liabilities assumed is received and estimates are refined, appropriate adjustments are recognized in the reporting period in which the adjustment is identified. The Company expenses transaction costs associated with business combinations in the period incurred. The Company has elected to early adopt ASU 2017-01, Business Combinations (Topic 805): Clarifying the Definition of a Business at the beginning of its fiscal year ended December 31, 2017, including its interim periods within the year, and will appropriately apply the guidance to its prospective asset acquisitions of operating properties, which includes the capitalization of acquisition costs.
In allocating the purchase price to identified intangible assets and liabilities of an acquired property, the value of above-market and below-market leases is estimated based on the present value of the difference between the contractual amounts, including fixed rate below-market lease renewal options, to be paid pursuant to the leases and management’s estimate of the market lease rates and other lease provisions (i.e., expense recapture, base rental changes, etc.) measured over a period equal to the estimated remaining term of the lease. The capitalized above-market or below-market intangible is amortized to rental income over the estimated remaining term of the respective leases, which includes the expected renewal option period for below-market leases. Mortgage debt discounts or premiums are amortized into interest expense over the remaining term of the related debt instrument.
In determining the value of in-place leases, management considers current market conditions and costs to execute similar leases in arriving at an estimate of the carrying costs during the expected lease-up period from vacant to existing occupancy. In estimating carrying costs, management includes real estate taxes, insurance, other operating expenses, estimates of lost rental revenue during the expected lease-up periods and costs to execute similar leases including leasing commissions, legal and other related costs based on current market demand. The value assigned to in-place leases and tenant relationships is amortized over the estimated remaining term of the leases. If a lease were to be terminated prior to its scheduled expiration, all unamortized costs relating to that lease would be written off.
Depreciation and amortization are provided on the straight-line method over the estimated useful lives of the assets, as follows:
|
Buildings and building improvements (in years) |
15 | to | 50 | |||
|
Fixtures, leasehold and tenant improvements (including certain identified intangible assets) |
Terms of leases or useful lives, whichever is shorter | |||||
The Company periodically assesses the useful lives of its depreciable real estate assets, including those expected to be redeveloped in future periods, and accounts for any revisions prospectively. Expenditures for maintenance, repairs and demolition costs are charged to operations as incurred. Significant renovations and replacements, which improve or extend the life of the asset, are capitalized. The useful lives of amortizable intangible assets are evaluated each reporting period with any changes in estimated useful lives being accounted for over the revised remaining useful life.
When a real estate asset is identified by management as held-for-sale, the Company ceases depreciation of the asset and estimates the fair value. If the fair value of the asset is less than the net book value of the asset, an adjustment to the carrying value would be recorded to reflect the estimated fair value of the property, less estimated costs of sale and the asset is classified as other assets.
On a continuous basis, management assesses whether there are any indicators, including property operating performance, changes in anticipated holding period and general market conditions, that the value of the real estate properties (including any related amortizable intangible assets or liabilities) may be impaired. A property value is considered impaired only if management’s estimate of current and projected operating cash flows (undiscounted and unleveraged) of the property over its remaining hold period is less than the net carrying value of the property. Such cash flow projections consider factors such as expected future operating income, trends and prospects, as well as the effects of demand, competition and other factors. To the extent impairment has occurred, the carrying value of the property would be adjusted to an amount to reflect the estimated fair value of the property.
KIMCO REALTY CORPORATION AND SUBSIDIARIES
NOTES TO CONSOLIDATED FINANCIAL STATEMENTS, continued
Real Estate Under Development
Real estate under development represents the development of open-air shopping center projects which the Company plans to hold as long-term investments. These properties are carried at cost. The cost of land and buildings under development includes specifically identifiable costs. The capitalized costs include pre-construction costs essential to the development of the property, development costs, construction costs, interest costs, real estate taxes, salaries and related costs of personnel directly involved and other costs incurred during the period of development. The Company ceases cost capitalization when the property is held available for occupancy and placed into service. This usually occurs upon substantial completion of all costs necessary to bring the property to the condition needed for its intended use, but no later than one year from the completion of major construction activity. However, the Company may continue to capitalize costs even though a project is substantially completed if construction is still ongoing at the site. If, in management’s opinion, the current and projected undiscounted cash flows of these assets to be held as long-term investments is less than the net carrying value plus estimated costs to complete the development, the carrying value would be adjusted to an amount that reflects the estimated fair value of the property.
Investments in Unconsolidated Joint Ventures
The Company accounts for its investments in unconsolidated joint ventures under the equity method of accounting as the Company exercises significant influence, but does not control these entities. These investments are recorded initially at cost and subsequently adjusted for cash contributions, distributions and our share of earnings and losses. Earnings or losses for each investment are recognized in accordance with each respective investment agreement and where applicable, based upon an allocation of the investment’s net assets at book value as if the investment was hypothetically liquidated at the end of each reporting period.
The Company’s joint ventures and other real estate investments primarily consist of co-investments with institutional and other joint venture partners in open-air shopping center properties, consistent with its core business. These joint ventures typically obtain non-recourse third-party financing on their property investments, thus contractually limiting the Company’s exposure to losses primarily to the amount of its equity investment; and due to the lender’s exposure to losses, a lender typically will require a minimum level of equity in order to mitigate its risk. The Company, on a limited selective basis, has obtained unsecured financing for certain joint ventures. These unsecured financings may be guaranteed by the Company with guarantees from the joint venture partners for their proportionate amounts of any guaranty payment the Company is obligated to make. As of December 31, 2016, the Company did not guaranty any unsecured joint venture debt.
To recognize the character of distributions from equity investees within its consolidated statements of cash flows, all distributions received are presumed to be returns on investment and classified as cash inflows from operating activities unless the Company’s cumulative distributions received less distributions received in prior periods that were determined to be returns of investment exceed its cumulative equity in earnings recognized by the investor (as adjusted for amortization of basis differences). When such an excess occurs, the current-period distribution up to this excess is considered a return of investment and classified as cash inflows from investing.
On a continuous basis, management assesses whether there are any indicators, including the underlying investment property operating performance and general market conditions, that the value of the Company’s investments in unconsolidated joint ventures may be impaired. An investment’s value is impaired only if management’s estimate of the fair value of the investment is less than the carrying value of the investment and such difference is deemed to be other-than-temporary. To the extent impairment has occurred, the loss shall be measured as the excess of the carrying amount of the investment over the estimated fair value of the investment.
The Company’s estimated fair values are based upon a discounted cash flow model for each joint venture that includes all estimated cash inflows and outflows over a specified holding period. Capitalization rates, discount rates and credit spreads utilized in these models are based upon rates that the Company believes to be within a reasonable range of current market rates.
KIMCO REALTY CORPORATION AND SUBSIDIARIES
NOTES TO CONSOLIDATED FINANCIAL STATEMENTS, continued
Other Real Estate Investments
Other real estate investments primarily consist of preferred equity investments for which the Company provides capital to owners and developers of real estate. The Company typically accounts for its preferred equity investments on the equity method of accounting, whereby earnings for each investment are recognized in accordance with each respective investment agreement and based upon an allocation of the investment’s net assets at book value as if the investment was hypothetically liquidated at the end of each reporting period.
On a continuous basis, management assesses whether there are any indicators, including the underlying investment property operating performance and general market conditions, that the value of the Company’s Other real estate investments may be impaired. An investment’s value is impaired only if management’s estimate of the fair value of the investment is less than the carrying value of the investment and such difference is deemed to be other-than-temporary. To the extent impairment has occurred, the loss shall be measured as the excess of the carrying amount of the investment over the estimated fair value of the investment.
The Company’s estimated fair values are based upon a discounted cash flow model for each investment that includes all estimated cash inflows and outflows over a specified holding period and, where applicable, any estimated debt premiums. Capitalization rates, discount rates and credit spreads utilized in these models are based upon rates that the Company believes to be within a reasonable range of current market rates.
Mortgages and Other Financing Receivables
Mortgages and other financing receivables consist of loans acquired and loans originated by the Company. Borrowers of these loans are primarily experienced owners, operators or developers of commercial real estate. The Company’s loans are primarily mortgage loans that are collateralized by real estate. Mortgages and other financing receivables are recorded at stated principal amounts, net of any discount or premium or deferred loan origination costs or fees. The related discounts or premiums on mortgages and other loans purchased are amortized or accreted over the life of the related loan receivable. The Company defers certain loan origination and commitment fees, net of certain origination costs and amortizes them as an adjustment of the loan’s yield over the term of the related loan. On a quarterly basis, the Company reviews credit quality indicators such as (i) payment status to identify performing versus non-performing loans, (ii) changes affecting the underlying real estate collateral and (iii) national and regional economic factors.
Interest income on performing loans is accrued as earned. A non-performing loan is placed on non-accrual status when it is probable that the borrower may be unable to meet interest payments as they become due. Generally, loans 90 days or more past due are placed on non-accrual status unless there is sufficient collateral to assure collectability of principal and interest. Upon the designation of non-accrual status, all unpaid accrued interest is reserved and charged against current income. Interest income on non-performing loans is generally recognized on a cash basis. Recognition of interest income on non-performing loans on an accrual basis is resumed when it is probable that the Company will be able to collect amounts due according to the contractual terms.
The Company has determined that it has one portfolio segment, primarily represented by loans collateralized by real estate, whereby it determines, as needed, reserves for loan losses on an asset-specific basis. The reserve for loan losses reflects management's estimate of loan losses as of the balance sheet date. The reserve is increased through loan loss expense and is decreased by charge-offs when losses are confirmed through the receipt of assets such as cash or via ownership control of the underlying collateral in full satisfaction of the loan upon foreclosure or when significant collection efforts have ceased.
The Company considers a loan to be impaired when, based upon current information and events, it is probable that the Company will be unable to collect all amounts due under the existing contractual terms. A reserve allowance is established for an impaired loan when the estimated fair value of the underlying collateral (for collateralized loans) or the present value of expected future cash flows is lower than the carrying value of the loan. An internal valuation is performed generally using the income approach to estimate the fair value of the collateral at the time a loan is determined to be impaired. The model is updated if circumstances indicate a significant change in value has occurred. The Company does not provide for an additional allowance for loan losses based on the grouping of loans as the Company believes the characteristics of the loans are not sufficiently similar to allow an evaluation of these loans as a group for a possible loan loss allowance. As such, all of the Company’s loans are evaluated individually for impairment purposes.
KIMCO REALTY CORPORATION AND SUBSIDIARIES
NOTES TO CONSOLIDATED FINANCIAL STATEMENTS, continued
Cash and Cash Equivalents
Cash and cash equivalents include demand deposits in banks, commercial paper and certificates of deposit with original maturities of three months or less. Cash and cash equivalent balances may, at a limited number of banks and financial institutions, exceed insurable amounts. The Company believes it mitigates risk by investing in or through major financial institutions and primarily in funds that are currently U.S. federal government insured up to applicable account limits. Recoverability of investments is dependent upon the performance of the issuers.
Marketable Securities
The Company classifies its marketable equity securities as available-for-sale in accordance with the FASB’s Investments-Debt and Equity Securities guidance. These securities are carried at fair market value with unrealized gains and losses reported in stockholders’ equity as a component of Accumulated other comprehensive income ("AOCI"). Gains or losses on securities sold are based on the specific identification method and are recognized in Interest, dividends and other investment income on the Company’s Consolidated Statements of Income.
All debt securities are generally classified as held-to-maturity because the Company has the positive intent and ability to hold the securities to maturity. It is more likely than not that the Company will not be required to sell the debt security before its anticipated recovery and the Company expects to recover the security’s entire amortized cost basis even if the entity does not intend to sell. Held-to-maturity securities are stated at amortized cost, adjusted for amortization of premiums and accretion of discounts to maturity. Debt securities which contain conversion features generally are classified as available-for-sale.
On a continuous basis, management assesses whether there are any indicators that the value of the Company’s marketable securities may be impaired, which includes reviewing the underlying cause of any decline in value and the estimated recovery period, as well as the severity and duration of the decline. In the Company’s evaluation, the Company considers its ability and intent to hold these investments for a reasonable period of time sufficient for the Company to recover its cost basis. A marketable security is impaired if the fair value of the security is less than the carrying value of the security and such difference is deemed to be other-than-temporary. To the extent impairment has occurred, the loss shall be measured as the excess of the carrying amount of the security over the estimated fair value in the security.
Deferred Leasing Costs
Costs incurred in obtaining tenant leases, included in deferred charges and prepaid expenses in the accompanying Consolidated Balance Sheets, are amortized on a straight-line basis, over the terms of the related leases, as applicable. Such capitalized costs include salaries, lease incentives and related costs of personnel directly involved in successful leasing efforts.
Software Development Costs
Expenditures for major software purchases and software developed for internal use are capitalized and amortized on a straight-line basis generally over a three to five-year period. The Company’s policy provides for the capitalization of external direct costs of materials and services associated with developing or obtaining internal use computer software. In addition, the Company also capitalizes certain payroll and payroll-related costs for employees who are directly associated with internal use computer software projects. The amount of payroll costs that can be capitalized with respect to these employees is limited to the time directly spent on such projects. Costs associated with preliminary project stage activities, training, maintenance and all other post-implementation stage activities are expensed as incurred. As of December 31, 2016 and 2015, the Company had unamortized software development costs of $10.2 million and $16.1 million, respectively, which is included in Other assets on the Company’s Consolidated Balance Sheets. The Company expensed $8.0 million, $10.7 million and $9.2 million in amortization of software development costs during the years ended December 31, 2016, 2015 and 2014, respectively.
Deferred Financing Costs
Costs incurred in obtaining long-term financing, included in Notes Payable and Mortgages Payable in the accompanying Consolidated Balance Sheets, are amortized on a straight-line basis, which approximates the effective interest method, over the terms of the related debt agreements, as applicable.
KIMCO REALTY CORPORATION AND SUBSIDIARIES
NOTES TO CONSOLIDATED FINANCIAL STATEMENTS, continued
Revenue , Gain Recognition and Accounts Receivable
Base rental revenues from rental properties are recognized on a straight-line basis over the terms of the related leases. Certain of these leases also provide for percentage rents based upon the level of sales achieved by the lessee. These percentage rents are recognized once the required sales level is achieved. Rental income may also include payments received in connection with lease termination agreements. In addition, leases typically provide for reimbursement to the Company of common area maintenance costs, real estate taxes and other operating expenses. Operating expense reimbursements are recognized as earned.
Management and other fee income consists of property management fees, leasing fees, property acquisition and disposition fees, development fees and asset management fees. These fees arise from contractual agreements with third parties or with entities in which the Company has a noncontrolling interest. Management and other fee income, including acquisition and disposition fees, are recognized as earned under the respective agreements. Management and other fee income related to partially owned entities are recognized to the extent attributable to the unaffiliated interest.
Gains and losses from the sale of depreciated operating property and real estate under development projects are recognized using the full accrual method in accordance with the FASB’s real estate sales guidance, provided that various criteria relating to the terms of sale and subsequent involvement by the Company with the properties are met.
Gains and losses on transfers of operating properties result from the sale of a partial interest in properties to unconsolidated joint ventures and are recognized using the partial sale provisions of the FASB’s real estate sales guidance.
The Company makes estimates of the uncollectable accounts receivables related to base rents, straight-line rent, expense reimbursements and other revenues. The Company analyzes accounts receivable and historical bad debt levels, customer credit worthiness and current economic trends when evaluating the adequacy of the allowance for doubtful accounts. In addition, tenants in bankruptcy are analyzed and estimates are made in connection with the expected recovery of pre-petition and post-petition claims. The Company’s reported net earnings are directly affected by management’s estimate of the collectability of accounts receivable.
Accounts and notes receivable in the accompanying Consolidated Balance Sheets are net of estimated unrecoverable amounts of $12.3 million and $13.9 million of billed accounts receivable at December 31, 2016 and 2015, respectively. Additionally, Accounts and notes receivable in the accompanying Consolidated Balance Sheets are net of estimated unrecoverable amounts of $11.9 million and $17.9 million of straight-line rent receivable at December 31, 2016 and 2015, respectively.
Income Taxes
The Company has made an election to qualify, and believes it is operating so as to qualify, as a REIT for federal income tax purposes. Accordingly, the Company generally will not be subject to federal income tax, provided that distributions to its stockholders equal at least the amount of its REIT taxable income as defined under Section 856 through 860 of the Code. Most states, where the Company holds investments in real estate, conform to the federal rules recognizing REITs.
In connection with the RMA, which became effective January 1, 2001, the Company is permitted to participate in certain activities which it was previously precluded from in order to maintain its qualification as a REIT, so long as these activities are conducted by entities which elect to be treated as taxable REIT subsidiaries (“TRSs”) under the Code. Certain subsidiaries of the Company have made a joint election with the Company to be treated as TRSs. A TRS is subject to federal and state income taxes on its income, and the Company includes a provision for taxes in its consolidated financial statements. The Company is subject to and also includes in its tax provision non-U.S. income taxes on certain investments located in jurisdictions outside the U.S. These investments are held by the Company at the REIT level and not in the Company’s taxable REIT subsidiaries. Accordingly, the Company does not expect a U.S. income tax impact associated with the repatriation of undistributed earnings from the Company’s foreign subsidiaries.
Income taxes are accounted for under the asset and liability method. Deferred tax assets and liabilities are recognized for the estimated future tax consequences attributable to differences between the financial statement carrying amounts of existing assets and liabilities and their respective tax bases and operating loss and tax credit carry-forwards. Deferred tax assets and liabilities are measured using enacted tax rates in effect for the year in which those temporary differences are expected to be recovered or settled. The Company provides a valuation allowance for deferred tax assets for which it does not consider realization of such assets to be more likely than not.
KIMCO REALTY CORPORATION AND SUBSIDIARIES
NOTES TO CONSOLIDATED FINANCIAL STATEMENTS, continued
The Company reviews the need to establish a valuation allowance against deferred tax assets on a quarterly basis. The review includes an analysis of various factors, such as future reversals of existing taxable temporary differences, the capacity for the carryback or carryforward of any losses, the expected occurrence of future income or loss and available tax planning strategies.
The Company applies the FASB’s guidance relating to uncertainty in income taxes recognized in a Company’s financial statements. Under this guidance the Company may recognize the tax benefit from an uncertain tax position only if it is more likely than not that the tax position will be sustained on examination by taxing authorities, based on the technical merits of the position. The tax benefits recognized in the financial statements from such a position are measured based on the largest benefit that has a greater than fifty percent likelihood of being realized upon ultimate settlement. The guidance on accounting for uncertainty in income taxes also provides guidance on de-recognition, classification, interest and penalties on income taxes, and accounting in interim periods.
Foreign Currency Translation and Transactions
Assets and liabilities of the Company’s foreign operations are translated using year-end exchange rates, and revenues and expenses are translated using exchange rates as determined throughout the year. Gains or losses resulting from translation are included in AOCI, as a separate component of the Company’s stockholders’ equity. Gains or losses resulting from foreign currency transactions are translated to local currency at the rates of exchange prevailing at the dates of the transactions. The effect of the transaction’s gain or loss is included in the caption Other income/(expense), net in the Consolidated Statements of Income. The Company is required to release cumulative translation adjustment (“CTA”) balances into earnings when the Company has substantially liquidated its investment in a foreign entity.
Derivative/Financial Instruments
The Company is exposed to certain risks arising from both its business operations and economic conditions. The Company principally manages its exposures to a wide variety of business and operational risk through management of its core business activities. The Company manages economic risks, including interest rate, liquidity, and credit risk primarily by managing the amount, sources, and duration of its debt funding and the use of derivative financial instruments. Specifically, the Company may use derivatives to manage exposures that arise from changes in interest rates, foreign currency exchange rate fluctuations and market value fluctuations of equity securities. The Company limits these risks by following established risk management policies and procedures including the use of derivatives.
The Company measures its derivative instruments at fair value and records them in the Consolidated Balance Sheet as an asset or liability, depending on the Company’s rights or obligations under the applicable derivative contract. The accounting for changes in the fair value of the derivatives depends on the intended use of the derivative, whether the Company has elected to designate a derivative in a hedging relationship and apply hedge accounting and whether the hedging relationship has satisfied the criteria necessary to apply hedge accounting. Derivatives designated and qualifying as a hedge of the exposure to changes in the fair value of an asset, liability, or firm commitment attributable to a particular risk, such as interest rate risk, are considered fair value hedges. Derivatives designated and qualifying as a hedge of the exposure to variability in expected future cash flows, or other types of forecasted transactions, are considered cash flow hedges. Derivatives may also be designated as hedges of the foreign currency exposure of a net investment in a foreign operation. Hedge accounting generally provides for the matching of the timing of gain or loss recognition on the hedging instrument with the recognition of the changes in the fair value of the hedged asset or liability that are attributable to the hedged risk in a fair value hedge or the earnings effect of the hedged forecasted transactions in a cash flow hedge. The Company may enter into derivative contracts that are intended to economically hedge certain of its risk, even though hedge accounting does not apply or the Company elects not to apply hedge accounting under the Derivatives and Hedging guidance issued by the FASB.
The effective portion of the changes in fair value of derivatives designated and that qualify as cash flow hedges is recorded in AOCI and is subsequently reclassified into earnings in the period that the hedged forecasted transaction affects earnings. Any ineffective portion of the change in fair value of the derivatives is recognized directly in earnings. During 2016, 2015 and 2014, the Company had no hedge ineffectiveness.
KIMCO REALTY CORPORATION AND SUBSIDIARIES
NOTES TO CONSOLIDATED FINANCIAL STATEMENTS, continued
Noncontrolling Interests
The Company accounts for noncontrolling interests in accordance with the Consolidation guidance and the Distinguishing Liabilities from Equity guidance issued by the FASB. Noncontrolling interests represent the portion of equity that the Company does not own in those entities it consolidates. The Company identifies its noncontrolling interests separately within the equity section on the Company’s Consolidated Balance Sheets. The amounts of consolidated net earnings attributable to the Company and to the noncontrolling interests are presented separately on the Company’s Consolidated Statements of Income.
Noncontrolling interests also includes amounts related to partnership units issued by consolidated subsidiaries of the Company in connection with certain property acquisitions. These units have a stated redemption value or a defined redemption amount based upon the trading price of the Company’s common stock and provides the unit holders various rates of return during the holding period. The unit holders generally have the right to redeem their units for cash at any time after one year from issuance. For convertible units, the Company typically has the option to settle redemption amounts in cash or common stock.
The Company evaluates the terms of the partnership units issued in accordance with the FASB’s Distinguishing Liabilities from Equity guidance. Units which embody an unconditional obligation requiring the Company to redeem the units for cash after a specified or determinable date (or dates) or upon the occurrence of an event that is not solely within the control of the issuer are determined to be contingently redeemable under this guidance and are included as Redeemable noncontrolling interest and classified within the mezzanine section between Total liabilities and Stockholders’ equity on the Company’s Consolidated Balance Sheets. Convertible units for which the Company has the option to settle redemption amounts in cash or Common Stock are included in the caption Noncontrolling interest within the equity section on the Company’s Consolidated Balance Sheets.
Earnings Per Share
The following table sets forth the reconciliation of earnings and the weighted-average number of shares used in the calculation of basic and diluted earnings per share (amounts presented in thousands, except per share data):
|
For the year ended December 31, |
||||||||||||
|
201 6 |
201 5 |
201 4 |
||||||||||
|
Computation of Basic Earnings Per Share: |
||||||||||||
|
Income from continuing operations |
$ | 299,353 | $ | 774,405 | $ | 384,506 | ||||||
|
Gain on sale of operating properties, net, net of tax |
86,785 | 125,813 | 389 | |||||||||
|
Net income attributable to noncontrolling interests |
(7,288 | ) | (6,028 | ) | (11,879 | ) | ||||||
|
Discontinued operations attributable to noncontrolling interests |
- | - | 2,117 | |||||||||
|
Preferred stock redemption charges |
- | (5,816 | ) | - | ||||||||
|
Preferred stock dividends |
(46,220 | ) | (57,084 | ) | (58,294 | ) | ||||||
|
Income from continuing operations available to the common Shareholders |
332,630 | 831,290 | 316,839 | |||||||||
|
Earnings attributable to participating securities |
(2,018 | ) | (4,134 | ) | (1,749 | ) | ||||||
|
Income from continuing operations available to common Shareholders |
330,612 | 827,156 | 315,090 | |||||||||
|
(Loss)/income from discontinued operations attributable to the Company |
- | (75 | ) | 48,868 | ||||||||
|
Net income available to the Company’s common shareholders for basic earnings per share |
$ | 330,612 | $ | 827,081 | $ | 363,958 | ||||||
|
Weighted average common shares outstanding – basic |
418,402 | 411,319 | 409,088 | |||||||||
|
Basic Earnings Per Share Available to the Company’s Common Shareholders: |
||||||||||||
|
Income from continuing operations |
$ | 0.79 | $ | 2.01 | $ | 0.77 | ||||||
|
Income from discontinued operations |
- | - | 0.12 | |||||||||
|
Net income |
$ | 0.79 | $ | 2.01 | $ | 0.89 | ||||||
|
Computation of Diluted Earnings Per Share: |
||||||||||||
|
Income from continuing operations available to common shareholders |
$ | 330,612 | $ | 827,156 | $ | 315,090 | ||||||
|
(Loss)/income from discontinued operations attributable to the Company |
- | (75 | ) | 48,868 | ||||||||
|
Distributions on convertible units |
- | 192 | 529 | |||||||||
|
Net income available to the Company’s common shareholders for diluted earnings per share |
$ | 330,612 | $ | 827,273 | $ | 364,487 | ||||||
|
Weighted average common shares outstanding – basic |
418,402 | 411,319 | 409,088 | |||||||||
|
Effect of dilutive securities (a): Equity awards |
1,307 | 1,414 | 1,227 | |||||||||
|
Assumed conversion of convertible units |
- | 118 | 723 | |||||||||
|
Shares for diluted earnings per common share |
419,709 | 412,851 | 411,038 | |||||||||
|
Diluted Earnings Per Share Available to the Company’s Common Shareholders: |
||||||||||||
|
Income from continuing operations |
$ | 0.79 | $ | 2.00 | $ | 0.77 | ||||||
|
Income from discontinued operations |
- | - | 0.12 | |||||||||
|
Net income |
$ | 0.79 | $ | 2.00 | $ | 0.89 | ||||||
|
(a) |
The effect of the assumed conversion of certain convertible units had an anti-dilutive effect upon the calculation of Income from continuing operations per share. Accordingly, the impact of such conversions has not been included in the determination of diluted earnings per share calculations. Additionally, there were 3,490,400, 5,300,680 and 7,137,120 stock options that were not dilutive as of December 31, 2016, 2015 and 2014, respectively. |
KIMCO REALTY CORPORATION AND SUBSIDIARIES
NOTES TO CONSOLIDATED FINANCIAL STATEMENTS, continued
The Company's unvested restricted share awards contain non-forfeitable rights to distributions or distribution equivalents. The impact of the unvested restricted share awards on earnings per share has been calculated using the two-class method whereby earnings are allocated to the unvested restricted share awards based on dividends declared and the unvested restricted shares' participation rights in undistributed earnings.
Stock Compensation
The Company maintains two equity participation plans, the Second Amended and Restated 1998 Equity Participation Plan (the “Prior Plan”) and the 2010 Equity Participation Plan (the “2010 Plan”) (collectively, the “Plans”). The Prior Plan provides for a maximum of 47,000,000 shares of the Company’s common stock to be issued for qualified and non-qualified stock options and restricted stock grants. Effective May 1, 2012, the 2010 Plan provides for a maximum of 10,000,000 shares of the Company’s common stock to be issued for qualified and non-qualified stock options and other awards, plus the number of shares of common stock which are or become available for issuance under the Prior Plan and which are not thereafter issued under the Prior Plan, subject to certain conditions. Unless otherwise determined by the Board of Directors at its sole discretion, stock options granted under the Plans generally vest ratably over a range of three to five years, expire ten years from the date of grant and are exercisable at the market price on the date of grant. Restricted stock grants generally vest (i) 100% on the fourth or fifth anniversary of the grant, (ii) ratably over three, four and five years or (iii) over ten years at 20% per year commencing after the fifth year. Performance share awards, which vest over a period of one to three years, may provide a right to receive shares of the Company’s common stock or restricted stock based on the Company’s performance relative to its peers, as defined, or based on other performance criteria as determined by the Board of Directors. In addition, the Plans provide for the granting of certain stock options and restricted stock to each of the Company’s non-employee directors (the “Independent Directors”) and permit such Independent Directors to elect to receive deferred stock awards in lieu of directors’ fees.
The Company accounts for equity awards in accordance with the FASB’s Stock Compensation guidance which requires that all share based payments to employees, be recognized in the Statement of Income over the service period based on their fair values. Fair value is determined, depending on the type of award, using either the Black-Scholes option pricing formula or the Monte Carlo method, both of which are intended to estimate the fair value of the awards at the grant date (see Footnote 21 of the Notes to Consolidated Financial Statements for additional disclosure on the assumptions and methodology).
KIMCO REALTY CORPORATION AND SUBSIDIARIES
NOTES TO CONSOLIDATED FINANCIAL STATEMENTS, continued
New Accounting Pronouncements
In January 2017, the FASB issued ASU 2017-01, Business Combinations (Topic 805): Clarifying the Definition of a Business (“ASU 2017-01”). The update clarifies the definition of a business with the objective of adding guidance to assist entities with evaluating whether transactions should be accounted for as acquisitions (or disposals) of assets or businesses. The definition of a business affects many areas of accounting including acquisitions, disposals, goodwill, and consolidation. The standard is effective for annual reporting periods beginning after December 15, 2017, including interim periods within those fiscal years, with early application of the guidance permitted. The Company has elected to early adopt ASU 2017-01 at the beginning of its fiscal year ended December 31, 2017, including its interim periods within the year, and appropriately apply the guidance to its prospective asset acquisitions of operating properties. Under this amendment, the Company’s prospective operating property acquisitions will qualify for asset acquisition treatment under ASC 360, Property, Plant, and Equipment, rather than business combination treatment under ASC 805 Business Combinations, and will result in capitalization of asset acquisition costs instead of directly expensing these costs.
In August 2016, the FASB issued ASU 2016-15, Statement of Cash Flows (Topic 230): Classification of Certain Cash Receipts and Cash Payments, a consensus of the FASB’s Emerging Issues Task Force (“ASU 2016-15”). The new guidance addresses eight specific cash flow issues with the objective of reducing the existing diversity in practice. One identified cash flow issue relates to distributions received from equity method investees whereby the reporting entity should make an accounting policy election to classify distributions received from equity method investees using either the cumulative earnings approach or the nature of the distribution approach. Another issue relates to the classification of cash payments for debt prepayment or debt extinguishment costs. The standard is retrospectively effective for public companies on January 1, 2018, with early adoption permitted. The Company elected to early adopt ASU 2016-15 beginning in its quarter ended September 30, 2016. In connection with the adoption of ASU 2016-15, the Company made a policy election to classify distributions received from equity method investees using the cumulative earnings approach. This election did not have a material impact on the presentation in the Company’s Consolidated Statements of Cash Flows. During the quarter ended September 30, 2016, the Company incurred early extinguishment of debt charges and in accordance with the adoption of ASU 2016-15 has included these charges in cash flows used for financing activities on the Company’s Consolidated Statements of Cash Flows. The adoption of the remaining cash flow issues addressed in ASU 2016-15 did not have a material impact on the Company’s Consolidated Statements of Cash Flows.
In June 2016, the FASB issued ASU 2016-13, Financial Instruments – Credit Losses (Topic 326): Measurement of Credit Losses on Financial Instruments (“ASU 2016-13”). The new guidance introduces a new model for estimating credit losses for certain types of financial instruments, including loans receivable, held-to-maturity debt securities, and net investments in direct financing leases, amongst other financial instruments. ASU 2016-13 also modifies the impairment model for available-for-sale debt securities and expands the disclosure requirements regarding an entity’s assumptions, models, and methods for estimating the allowance for losses. The standard is effective for annual reporting periods beginning after December 15, 2019, including interim periods within those fiscal years, with early application of the guidance permitted. The adoption of ASU 2016-13 is not expected to have a material effect on the Company’s financial position and/or results of operations.
In March 2016, the FASB issued ASU 2016-09, Compensation – Stock Compensation (Topic 718): Improvements to Employee Share-Based Payment Accounting ("ASU 2016-09"). The update simplifies several aspects of accounting for employee share-based payment transactions for both public and nonpublic entities, including the accounting for income taxes, forfeitures, and statutory tax withholding requirements, as well as classification in the statement of cash flows. The ASU is effective for annual reporting periods beginning after December 15, 2016, including interim periods within those annual reporting periods. Early adoption is permitted. The adoption of ASU 2016-09 is not expected to have a material effect on the Company’s financial position and/or results of operations.
KIMCO REALTY CORPORATION AND SUBSIDIARIES
NOTES TO CONSOLIDATED FINANCIAL STATEMENTS, continued
In February 2016, the FASB issued ASU 2016-02, Leases (Topic 842) (“ASU 2016-02”), which sets out the principles for the recognition, measurement, presentation and disclosure of leases for both parties to a contract (i.e. lessees and lessors). The new standard requires lessees to apply a dual approach, classifying leases as either finance or operating leases based on the principle of whether or not the lease is effectively a financed purchase by the lessee. This classification will determine whether lease expense is recognized based on an effective interest method or on a straight-line basis over the term of the lease. A lessee is also required to record a right-of-use asset and a lease liability for all leases with a term of greater than 12 months regardless of their classification. Leases with a term of 12 months or less will be accounted for similar to existing guidance for operating leases today. The new standard requires lessors to account for leases using an approach that is substantially equivalent to existing guidance for sales-type leases, direct financing leases and operating leases. ASU 2016-02 supersedes the previous leases standard, Leases (Topic 840). The standard is effective for the Company on January 1, 2019, with early adoption permitted. The Company continues to evaluate the effect the adoption of ASU 2016-02 will have on the Company’s financial position and/or results of operations. However, the Company currently believes that the adoption of ASU 2016-02 will not have a material impact for operating leases where it is a lessor and will continue to record revenues from rental properties for its operating leases on a straight-line basis. However, for leases where the Company is a lessee, primarily for the Company’s ground leases and administrative office leases, the Company will be required to record a lease liability and a right of use asset on its Consolidated Balance Sheets at fair value upon adoption. In addition, direct internal leasing overhead costs will continue to be capitalized, however, indirect internal leasing overhead costs previously capitalized will be expensed under the ASU 2016-02.
In February 2015, the FASB issued ASU 2015-02, Consolidation (Topic 810): Amendments to the Consolidation Analysis (“ASU 2015-02”). ASU 2015-02 focuses to minimize situations under previously existing guidance in which a reporting entity was required to consolidate another legal entity in which that reporting entity did not have: (1) the ability through contractual rights to act primarily on its own behalf; (2) ownership of the majority of the legal entity's voting rights; or (3) the exposure to a majority of the legal entity's economic benefits. ASU 2015-02 affects reporting entities that are required to evaluate whether they should consolidate certain legal entities. Legal entities are subject to reevaluation under the revised consolidation model. ASU 2015-02 is effective for periods beginning after December 15, 2015. The adoption of ASU 2015-02 did not have a material effect on the Company’s financial position or results of operations.
In August 2014, the FASB issued ASU 2014-15, Presentation of Financial Statements - Going Concern (Subtopic 205-40): Disclosure of Uncertainties about an Entity’s Ability to Continue as a Going Concern (“ASU 2014-15”), which requires management to evaluate, at each annual and interim reporting period, whether there are conditions or events that raise substantial doubt about the entity’s ability to continue as a going concern within one year after the date the financial statements are issued and provide related disclosures. ASU 2014-15 is effective for annual periods ending after December 15, 2016 and interim periods thereafter, early adoption is permitted. The adoption of ASU 2014-15 did not have a material effect on the Company’s consolidated financial statements.
In May 2014, the FASB issued ASU 2014-09, Revenue from Contracts with Customers (Topic 606) ("ASU 2014-09"). ASU 2014-09 is a comprehensive new revenue recognition model requiring a company to recognize revenue to depict the transfer of goods or services to a customer at an amount reflecting the consideration it expects to receive in exchange for those goods or services. In adopting ASU 2014-09, companies may use either a full retrospective or a modified retrospective approach. ASU 2014-09 was anticipated to be effective for the first interim period within annual reporting periods beginning after December 15, 2016, and early adoption was not permitted. In August 2015, the FASB issued ASU 2015-14, Revenue from Contracts with Customers (Topic 606): Deferral of the Effective Date (“ASU 2015-14”), which delayed the effective date of ASU 2014-09 by one year making it effective for the first interim period within annual reporting periods beginning after December 15, 2017. Subsequently, in March 2016, the FASB issued ASU 2016-08, “Revenue from Contracts with Customers (Topic 606): Principal versus Agent Considerations,” which further clarifies the implementation guidance on principal versus agent considerations, and in April 2016, the FASB issued ASU 2016-10, “Revenue from Contracts with Customers (Topic 606): Identifying performance obligations and licensing,” an update on identifying performance obligations and accounting for licenses of intellectual property. Additionally, in May 2016, the FASB issued ASU 2016-12, “Revenue from Contracts with Customers (Topic 606): Narrow-scope improvements and practical expedients,” which includes amendments for enhanced clarification of the guidance. Early adoption is permitted as of the original effective date. The Company’s revenue-producing contracts are primarily leases that are not within the scope of this standard. As a result, the Company does not expect the adoption of ASU 2014-09 to have a material impact on the Company’s rental income. The Company continues to evaluate the effect the adoption of ASU 2014-09 will have on the Company’s other sources of revenue. These include management and other fee income and reimbursement amounts the Company receives from tenants for operating expenses such as real estate taxes, insurance and other common area maintenance. However, the Company currently does not believe the adoption of ASU 2014-09 will significantly affect the timing of the recognition of the Company’s management and other fee income and reimbursement revenue.
KIMCO REALTY CORPORATION AND SUBSIDIARIES
NOTES TO CONSOLIDATED FINANCIAL STATEMENTS, continued
2. Real Estate:
The Company’s components of Rental property consist of the following (in thousands):
|
December 31, |
||||||||
|
201 6 |
201 5 |
|||||||
|
Land |
$ | 2,786,255 | $ | 2,660,722 | ||||
|
Undeveloped land |
58,931 | 67,535 | ||||||
|
Buildings and improvements: |
||||||||
|
Buildings |
5,790,681 | 5,643,629 | ||||||
|
Building improvements |
1,562,439 | 1,559,652 | ||||||
|
Tenant improvements |
733,993 | 727,036 | ||||||
|
Fixtures and leasehold improvements |
47,199 | 47,055 | ||||||
|
Above-market leases |
150,207 | 155,451 | ||||||
|
In-place leases and tenant relationships |
543,342 | 528,539 | ||||||
| 11,673,047 | 11,389,619 | |||||||
|
Accumulated depreciation and amortization (1) |
(2,278,292 | ) | (2,115,320 | ) | ||||
|
Total |
$ | 9,394,755 | $ | 9,274,299 | ||||
|
(1) |
At December 31, 2016 and 2015, the Company had accumulated amortization relating to in-place leases, tenant relationships and above-market leases aggregating $409,062 and $357,581, respectively. |
In addition, at December 31, 2016 and 2015, the Company had intangible liabilities relating to below-market leases from property acquisitions of $292.6 million and $291.7 million, respectively, net of accumulated amortization of $193.9 million and $193.7 million, respectively. These amounts are included in the caption Other liabilities on the Company’s Consolidated Balance Sheets.
The Company’s amortization associated with above-market and below-market leases for the years ended December 31, 2016, 2015 and 2014, resulted in net increases to revenue of $21.4 million, $18.5 million and $13.5 million, respectively. The Company’s amortization expense associated with leases in place and tenant relationships, which is included in depreciation and amortization, for the years ended December 31, 2016, 2015 and 2014 was $66.6 million, $68.3 million and $41.2 million, respectively.
The estimated net amortization income/(expense) associated with the Company’s above-market and below-market leases, tenant relationships and leases in place for the next five years are as follows (in millions):
|
2017 |
2018 |
2019 |
2020 |
202 1 |
||||||||||||||||
|
Above-market and below-market leases amortization, net |
$ | 10.7 | $ | 10.8 | $ | 11.3 | $ | 11.5 | $ | 11.5 | ||||||||||
|
In-place leases and tenant relationships amortization |
$ | (46.5 | ) | $ | (34.1 | ) | $ | (26.3 | ) | $ | (19.3 | ) | $ | (15.4 | ) | |||||
3. Property Acquisitions, Developments and Other Investments:
Acquisition of Operating Properties
During the year ended December 31, 2016, the Company acquired the following operating properties, in separate transactions (in thousands):
|
Purchase Price |
||||||||||||||||||||||
|
Property Name |
Location |
Month Acquired |
Cash* |
Debt Assumed |
Other** |
Total |
GLA*** |
|||||||||||||||
|
Jericho Atrium |
Jericho, NY |
Apr-16 |
$ | 29,750 | $ | - | $ | - | $ | 29,750 | 147 | |||||||||||
|
Oakwood Plaza |
Hollywood, FL (1) |
Apr-16 |
53,412 | 100,000 | 61,588 | 215,000 | 899 | |||||||||||||||
|
Webster Square North |
Nashua, NH |
Jul-16 |
8,200 | - | - | 8,200 | 21 | |||||||||||||||
|
Gateway Plaza |
Mill Creek, WA (1) |
Jul-16 |
493 | 17,500 | - | 17,993 | 97 | |||||||||||||||
|
Kentlands Market Square |
Gaithersburg, MD |
Aug-16 |
61,826 | 33,174 | - | 95,000 | 221 | |||||||||||||||
|
GEPT Portfolio (4 properties) |
Various (1) |
Sep-16 |
79,974 | 76,989 | 10,882 | 167,845 | 681 | |||||||||||||||
|
Coulter Avenue (2 parcels) |
Ardmore, PA |
Various |
6,750 | - | - | 6,750 | 20 | |||||||||||||||
|
KimPru Portfolio (2 properties) |
Various (1) |
Oct-16 |
15,505 | 35,700 | 3,218 | 54,423 | 234 | |||||||||||||||
|
Hamden Mart |
Hamden, CT (1) |
Nov-16 |
- | 21,369 | 29,294 | 50,663 | 345 | |||||||||||||||
| $ | 255,910 | $ | 284,732 | $ | 104,982 | $ | 645,624 | 2,665 | ||||||||||||||
* The Company utilized $66.0 million associated with Internal Revenue Code §1031 sales proceeds.
** Includes the Company’s previously held equity interest investment.
*** Gross leasable area ("GLA")
|
(1) |
The Company acquired from its partners their ownership interest in properties that were held in joint ventures in which the Company had noncontrolling interests. The Company evaluated these transactions pursuant to the FASB’s Consolidation guidance and as a result, recognized gains on change in control of interests resulting from the fair value adjustments associated with the Company’s previously held equity interests, which are included in the purchase price above in Other. The Company’s previous ownership interests and gains on change in control of interests recognized as a result of these transactions are as follows (in millions): |
KIMCO REALTY CORPORATION AND SUBSIDIARIES
NOTES TO CONSOLIDATED FINANCIAL STATEMENTS, continued
|
Property Name |
Previous Ownership Interest |
Gain on change in control of interests, net | ||||||||||
|
Oakwood Plaza |
55.0 | % | $ | 46.5 | ||||||||
|
Gateway Plaza |
15.0 | % | - | |||||||||
|
GEPT Portfolio (4 properties) |
15.0 | % | 6.6 | |||||||||
|
KimPru Portfolio (2 properties) |
15.0 | % | 0.8 | |||||||||
|
Hamden Mart |
47.95 | % | 3.5 | |||||||||
| $ | 57.4 | |||||||||||
During the year ended December 31, 2015, the Company acquired the following properties, in separate transactions (in thousands):
| Purchase Price | ||||||||||||||||||||||
| Property Name | Location |
Month Acquired |
Cash* |
Debt Assumed |
Other ** | Total | GLA** * | |||||||||||||||
|
Elmont Plaza |
Elmont, NY (1) |
Jan-15 |
$ | 2,400 | $ | - | $ | 3,358 | $ | 5,758 | 13 | |||||||||||
|
Garden State Pavilion Parcel |
Cherry Hill, NJ |
Jan-15 |
16,300 | - | - | 16,300 | 111 | |||||||||||||||
|
Kimstone Portfolio (39 properties) |
Various (1) |
Feb-15 |
513,513 | 637,976 | 236,011 | 1,387,500 | 5,631 | |||||||||||||||
|
Copperfield Village |
Houston, TX |
Feb-15 |
18,700 | 20,800 | - | 39,500 | 165 | |||||||||||||||
|
Snowden Square Parcel |
Columbia, MD |
Mar-15 |
4,868 | - | - | 4,868 | 25 | |||||||||||||||
|
Dulles Town Crossing Parcel |
Sterling, VA |
Mar-15 |
4,830 | - | - | 4,830 | 9 | |||||||||||||||
|
Flagler Park S.C. |
Miami, FL |
Mar-15 |
1,875 | - | - | 1,875 | 5 | |||||||||||||||
|
West Farms Parcel |
New Britain, CT |
Apr-15 |
6,200 | - | - | 6,200 | 24 | |||||||||||||||
|
Milleridge Inn |
Jericho, NY |
Apr-15 |
7,500 | - | - | 7,500 | - | |||||||||||||||
|
Woodgrove Festival (2 Parcels) |
Woodridge, IL |
Jun-15 |
5,611 | - | - | 5,611 | 12 | |||||||||||||||
|
Montgomery Plaza |
Fort Worth, TX (1) |
Jul-15 |
34,522 | 29,311 | 9,044 | 72,877 | 291 | |||||||||||||||
|
125 Coulter Avenue Parcel |
Ardmore, PA |
Sep-15 |
1,925 | - | - | 1,925 | 6 | |||||||||||||||
|
Conroe Marketplace |
Conroe, TX (1) |
Oct-15 |
18,546 | 42,350 | 3,104 | 64,000 | 289 | |||||||||||||||
|
Laurel Plaza |
Laurel, MD |
Oct-15 |
1,200 | - | - | 1,200 | 4 | |||||||||||||||
|
District Heights |
District Heights, MD (1) |
Nov-15 |
13,140 | 13,255 | 950 | 27,345 | 91 | |||||||||||||||
|
Village on the Park |
Aurora, CO |
Nov-15 |
824 | - | - | 824 | 10 | |||||||||||||||
|
Christown Mall |
Phoenix, AZ |
Nov-15 |
51,351 | 63,899 | - | 115,250 | 833 | |||||||||||||||
|
Washington St. Plaza Parcels |
Brighton, MA |
Dec-15 |
8,750 | - | - | 8,750 | - | |||||||||||||||
| $ | 712,055 | $ | 807,591 | $ | 252,467 | $ | 1,772,113 | 7,519 | ||||||||||||||
* The Company utilized $89.5 million associated with Internal Revenue Code §1031 sales proceeds.
** Includes the Company’s previously held equity interest investment.
*** Gross leasable area ("GLA")
|
(1) |
The Company acquired from its partners their ownership interest in properties that were held in joint ventures in which the Company had noncontrolling interests. The Company evaluated these transactions pursuant to the FASB’s Consolidation guidance and as a result, recognized gains on change in control of interests resulting from the fair value adjustments associated with the Company’s previously held equity interests, which are included in the purchase price above in Other. The Company’s previous ownership interests and gains on change in control of interests recognized as a result of these transactions are as follows (in millions): |
|
Property Name |
Previous Ownership Interest |
Gain on change in control of interests, net |
||||||
|
Elmont Plaza |
50.0 | % | $ | (0.2 | ) | |||
|
Kimstone Portfolio (39 properties) |
33.3 | % | 140.0 | |||||
|
Montgomery Plaza |
20.0 | % | 6.3 | |||||
|
Conroe Marketplace |
15.0 | % | 2.4 | |||||
|
District Heights |
15.0 | % | 0.7 | |||||
| $ | 149.2 | |||||||
KIMCO REALTY CORPORATION AND SUBSIDIARIES
NOTES TO CONSOLIDATED FINANCIAL STATEMENTS, continued
Included in the Company’s Consolidated Statements of Income are $23.8 million, $112.2 million and $75.3 million in revenues from rental properties from the date of acquisition through December 31, 2016, 2015 and 2014, respectively, for operating properties acquired during each of the respective years.
Purchase Price Allocations
The purchase price for acquisitions is preliminarily allocated to real estate and related intangible assets acquired and liabilities assumed, as applicable, in accordance with our accounting policies for business combinations. The purchase price allocations and related accounting is finalized upon completion of the Company’s valuation studies. Accordingly, the fair values allocated to these assets and liabilities are subject to revision. The Company records allocation adjustments, where applicable, when purchase price allocations are finalized.
The preliminary allocations, allocation adjustments and revised allocations for properties acquired during the year ended December 31, 2016, are as follows (in thousands):
|
Preliminary Allocation |
Allocation Adjustments |
Revised Allocation as of December 31, 2016 |
Weighted-Average Amortization Period (in Years) |
|||||||||||||
|
Land |
$ | 179,150 | $ | (13,352 | ) | $ | 165,798 | - | ||||||||
|
Buildings |
309,493 | 69,581 | 379,074 | 50.0 | ||||||||||||
|
Above-market leases |
11,982 | (4,304 | ) | 7,678 | 8.1 | |||||||||||
|
Below-market leases |
(31,903 | ) | (4,327 | ) | (36,230 | ) | 19.1 | |||||||||
|
In-place leases |
44,094 | (4,162 | ) | 39,932 | 6.4 | |||||||||||
|
Building improvements |
124,105 | (40,194 | ) | 83,911 | 45.0 | |||||||||||
|
Tenant improvements |
12,788 | (2,548 | ) | 10,240 | 7.1 | |||||||||||
|
Mortgage fair value adjustment |
(4,292 | ) | (694 | ) | (4,986 | ) | 4.1 | |||||||||
|
Other assets |
234 | - | 234 | - | ||||||||||||
|
Other liabilities |
(27 | ) | - | (27 | ) | - | ||||||||||
|
Net assets acquired |
$ | 645,624 | $ | - | $ | 645,624 | ||||||||||
The allocation adjustments and revised allocations for properties acquired during the year ended December 31, 2015, are as follows (in thousands):
|
Allocation as of December 31, 2015 |
Allocation Adjustments |
Revised Allocation as of December 31, 2016 |
Weighted-Average Amortization Period (in Years) |
|||||||||||||
|
Land |
$ | 444,626 | $ | 33,918 | $ | 478,544 | - | |||||||||
|
Buildings |
1,063,124 | (7,980 | ) | 1,055,144 | 50.0 | |||||||||||
|
Above-market leases |
34,182 | (2,133 | ) | 32,049 | 7.2 | |||||||||||
|
Below-market leases |
(74,997 | ) | (6,306 | ) | (81,303 | ) | 17.7 | |||||||||
|
In-place leases |
125,993 | 1,425 | 127,418 | 4.7 | ||||||||||||
|
Building improvements |
169,116 | (20,724 | ) | 148,392 | 45.0 | |||||||||||
|
Tenant improvements |
34,814 | 1,800 | 36,614 | 6.1 | ||||||||||||
|
Mortgage fair value adjustment |
(27,615 | ) | - | (27,615 | ) | 3.0 | ||||||||||
|
Other assets |
3,058 | - | 3,058 | - | ||||||||||||
|
Other liabilities |
(188 | ) | - | (188 | ) | - | ||||||||||
|
Net assets acquired |
$ | 1,772,113 | $ | - | $ | 1,772,113 | ||||||||||
Other Investments
During the year ended December 31, 2015, the Company entered into an agreement to acquire the remaining 50.0% interest in a property previously held in a joint venture in which the Company had a noncontrolling interest for a gross purchase price of $23.0 million. Upon signing this contract, which closed in January 2016, the Company effectively gained control of the entity and is entitled to all economics and risk of loss and as such, the Company consolidated this property pursuant to the FASB’s Consolidation guidance. Additionally, as the Company was required to purchase the partners interest at a fixed and determinable price in January 2016, the Company recognized $11.5 million within Other liabilities in the Company’s Consolidated Balance Sheets at December 31, 2015. Based upon the Company’s intent to redevelop a portion of the property, the Company allocated $8.4 million of the gross purchase price to Real estate under development on the Company’s Consolidated Balance Sheets and the remaining $14.6 million was allocated to Operating real estate on the Company’s Consolidated Balance Sheets.
KIMCO REALTY CORPORATION AND SUBSIDIARIES
NOTES TO CONSOLIDATED FINANCIAL STATEMENTS, continued
During the year ended December 31, 2015, the Company acquired three land parcels, in separate transactions, for an aggregate purchase price of $30.0 million.
Pro Forma Financial Information (Unaudited)
As discussed above, the Company and certain of its subsidiaries acquired interests in certain operating properties during 2016 and 2015. The pro forma financial information set forth below is based upon the Company's historical Consolidated Statements of Income for the years ended December 31, 2016 and 2015, adjusted to give effect to properties acquired during the years ended December 31, 2016 and 2015, as if they were acquired at the beginning of 2014 and 2013. The pro forma financial information is presented for informational purposes only and may not be indicative of what actual results of income would have been, nor does it purport to represent the results of income for future periods. (Amounts presented in millions, except per share figures).
|
Year ended December 31, |
||||||||||||
|
201 6 |
201 5 |
201 4 |
||||||||||
|
Revenues from rental properties |
$ | 1,174.9 | $ | 1,198.6 | $ | 1,097.8 | ||||||
|
Net income |
$ | 397.7 | $ | 921.6 | $ | 521.9 | ||||||
|
Net income available to the Company |
$ | 344.2 | $ | 852.6 | $ | 451.7 | ||||||
|
Net income available to the Company per common share: |
||||||||||||
|
Basic |
$ | 0.82 | $ | 2.07 | $ | 1.10 | ||||||
|
Diluted |
$ | 0.82 | $ | 2.07 | $ | 1.10 | ||||||
4. Real Estate Under Development :
The Company is engaged in various real estate under development projects, which will be held as long-term investments by the Company. As of December 31, 2016, the Company had in progress a total of six real estate under development projects located in the U.S. These projects will be developed into open-air shopping centers aggregating 2.2 million square feet of GLA with a total estimated aggregate project cost of $514.0 million.
The costs incurred to date for these real estate under development projects are as follows (in thousands):
|
December 31, |
||||||||||
|
Property Name |
Location |
2016 |
2015 |
|||||||
|
Grand Parkway Marketplace |
Spring, TX |
$ | 94,841 | $ | 42,032 | |||||
|
Dania Pointe (1) |
Dania Beach, FL |
107,113 | - | |||||||
|
Promenade at Christiana |
New Castle, DE |
25,521 | 16,063 | |||||||
|
Owings Mills |
Owings Mills, MD |
25,119 | 8,640 | |||||||
|
Avenues Walk |
Jacksonville, FL |
73,048 | 77,544 | |||||||
|
Staten Island Plaza (2) |
Staten Island, NY |
9,386 | - | |||||||
|
Shoppes at Wynnewood (3) |
Lower Merion, PA |
- | 34,911 | |||||||
| $ | 335,028 | $ | 179,190 | |||||||
|
(1) |
During the year ended December 31, 2016, the Company acquired from its partner the remaining ownership interest in a property that was held in a joint venture in which the Company has a 55.0% noncontrolling interest for a gross purchase price of $84.2 million. The Company evaluated this transaction pursuant to the FASB’s Consolidation guidance and as a result, no gain on change in control of interest was recognized as there was no fair value adjustment associated with the Company’s previously held equity interest. Based upon the Company’s intent to develop the property, the Company allocated the gross purchase price to Real estate under development on the Company’s Consolidated Balance Sheets. |
|
(2) |
Land held for future development. |
|
(3) |
During the year ended December 31, 2016, this development project, aggregating $38.0 million, was completed and reclassified into Land and Building and improvements on the Company’s Consolidated Balance Sheets. |
During 2016 and 2015, the Company acquired, in separate transactions, three additional land parcels adjacent to two existing development projects and two additional land parcels adjacent to existing development projects for an aggregate purchase price of $13.8 million and $20.7 million, respectively.
KIMCO REALTY CORPORATION AND SUBSIDIARIES
NOTES TO CONSOLIDATED FINANCIAL STATEMENTS, continued
5. Dispositions of Real Estate and Assets Held - for - Sale :
Operating Real Estate
During 2016, the Company disposed of 30 consolidated operating properties and two out-parcels, in separate transactions, for an aggregate sales price of $378.7 million. These transactions resulted in an aggregate gain of $86.8 million, after income tax expense, and aggregate impairment charges of $37.2 million, which were taken prior to sale, before income tax benefit of $10.0 million.
During 2015, the Company disposed of 89 consolidated operating properties and eight out-parcels, in separate transactions, for an aggregate sales price of $492.5 million. These transactions resulted in an aggregate gain of $143.6 million, after income tax expense, and aggregate impairment charges of $10.2 million, before income tax benefit of $2.3 million.
Additionally, during 2015, the Company disposed of its remaining operating property in Chile for a sales price of $51.3 million. This transaction resulted in the release of a cumulative foreign currency translation loss of $19.6 million due to the Company’s liquidation of its investment in Chile offset by a gain on sale of $1.8 million, after income tax expense.
During 2014, the Company disposed of 90 consolidated operating properties, in separate transactions, for an aggregate sales price of $833.5 million, including 27 operating properties in Latin America. These transactions, which are included in Discontinued operations on the Company’s Consolidated Statements of Income, resulted in an aggregate gain of $203.3 million, before income taxes and noncontrolling interests and aggregate impairment charges of $178.0 million, before income taxes and noncontrolling interests, including $92.9 million related to the release of a cumulative foreign currency translation loss due to the Company’s substantial liquidation of its investment in Mexico. The Company provided financing aggregating $52.7 million on three of these transactions which bore interest at rates ranging from LIBOR plus 250 basis points to 7% per annum, which matured and were repaid in full during 2015. The Company evaluated these transactions pursuant to the FASB’s real estate guidance to determine sale and gain recognition.
Land Sales
During 2016, 2015 and 2014, the Company sold six, 13 and three land parcels, respectively, for an aggregate sales price of $3.9 million, $31.5 million and $5.1 million, respectively. These transactions resulted in an aggregate gain of $1.9 million, $4.3 million and $3.5 million, before income taxes expense and noncontrolling interest for the years ended December 31, 2016, 2015 and 2014, respectively. The gains from these transactions are recorded as other income, which is included in Other income/(expense), net, in the Company’s Consolidated Statements of Income.
Held-for-Sale
At December 31, 2016, the Company had two consolidated property interests in Mexico classified as held-for-sale at an aggregate carrying amount of Mexican peso (“MXN”) 121.9 million (USD $9.2 million), net of accumulated depreciation of MXN 51.1 million (USD $3.5 million), which are included in Other assets on the Company’s Consolidated Balance Sheets. The Company’s determination of the fair value of the properties was based upon executed contracts of sale with third parties. The book value of one of these properties exceeded its estimated fair value, less costs to sell, and as such an impairment charge of MXN 25.8 million (USD $1.3 million) was recognized.
6. Discontinued Operations:
The components of Income from discontinued operations for the years ended December 31, 2015 and 2014 are shown below. These include the results of income through the date of each respective sale for properties sold during 2014, and the operations for the applicable periods for those assets classified as held-for-sale as of December 31, 2014 (in thousands):
|
201 5 |
201 4 |
|||||||
|
Discontinued operations: |
||||||||
|
Revenues from rental properties |
$ | 124 | $ | 71,906 | ||||
|
Rental property expenses |
(49 | ) | (16,657 | ) | ||||
|
Depreciation and amortization |
- | (15,019 | ) | |||||
|
Provision for doubtful accounts |
(57 | ) | (719 | ) | ||||
|
Interest expense |
- | (1,823 | ) | |||||
|
Income from other real estate investments |
- | 680 | ||||||
|
Other expense, net |
(12 | ) | (756 | ) | ||||
|
Income from discontinued operating properties, before income taxes |
6 | 37,612 | ||||||
|
Impairment of property carrying value, before income taxes (1) |
(82 | ) | (178,048 | ) | ||||
|
Gain on disposition of operating properties, before income taxes |
- | 203,271 | ||||||
|
Benefit/(provision) for income taxes |
1 | (11,850 | ) | |||||
|
(Loss)/income from discontinued operating properties |
(75 | ) | 50,985 | |||||
|
Net income attributable to noncontrolling interests |
- | (2,117 | ) | |||||
|
(Loss)/income from discontinued operations attributable to the Company |
$ | (75 | ) | $ | 48,868 | |||
(1) The year ended December 31, 2014, includes $92.9 million related to the release of a cumulative foreign currency translation loss due to the Company’s substantial liquidation of its investment in Mexico.
KIMCO REALTY CORPORATION AND SUBSIDIARIES
NOTES TO CONSOLIDATED FINANCIAL STATEMENTS, continued
7 . Impairments:
Management assesses on a continuous basis whether there are any indicators, including property operating performance, changes in anticipated holding period and general market conditions, that the value of the Company’s assets (including any related amortizable intangible assets or liabilities) may be impaired. To the extent impairment has occurred, the carrying value of the asset would be adjusted to an amount to reflect the estimated fair value of the asset.
During 2014, the Company implemented a plan to accelerate the disposition of certain U.S. properties and substantially liquidated its investment in Mexico, which resulted in the release of a cumulative foreign currency translation loss. These disposition plans effectively shortened the Company’s anticipated hold period for these properties and as a result the Company recognized impairment charges on various consolidated operating properties (see Footnote 16 of the Notes to Consolidated Financial Statements for fair value disclosure).
The Company’s efforts to market certain assets and management’s assessment as to the likelihood and timing of such potential transactions and/or the property hold period resulted in the Company recognizing impairment charges for the years ended December 31, 2016, 2015 and 2014 as follows (in millions):
|
201 6 |
201 5 |
201 4 |
||||||||||
|
Impairment of property carrying values* (1) (2) (3) |
$ | 93.3 | $ | 30.3 | $ | 33.3 | ||||||
|
Impairment of investments in other real estate investments* (4) |
- | 5.3 | 1.7 | |||||||||
|
Impairment of marketable securities and other investments* (5) |
- | 9.8 | 4.8 | |||||||||
|
Total Impairment charges included in operating expenses |
93.3 | 45.4 | 39.8 | |||||||||
|
Cumulative foreign currency translation loss included in discontinued operations (6) |
- | - | 92.9 | |||||||||
|
Impairment of property carrying values included in discontinued operations** |
- | 0.1 | 85.1 | |||||||||
|
Total gross impairment charges |
93.3 | 45.5 | 217.8 | |||||||||
|
Noncontrolling interests |
(0.4 | ) | (5.6 | ) | (0.4 | ) | ||||||
|
Income tax benefit included in discontinued operations |
- | - | (1.7 | ) | ||||||||
|
Income tax benefit |
(21.1 | ) | (9.0 | ) | (6.1 | ) | ||||||
|
Total net impairment charges |
$ | 71.8 | $ | 30.9 | $ | 209.6 | ||||||
* See Footnote 16 of the Notes to Consolidated Financial Statements for additional disclosure on fair value
**See Footnotes 5 & 6 of the Notes to Consolidated Financial Statements above for additional disclosure
|
(1) |
During 2016, the Company recognized aggregate impairment charges of $93.3 million, before an income tax benefit of $21.1 million and noncontrolling interests of $0.4 million, primarily related to sale of certain operating properties, certain properties maintained in the Company’s TRS for which the hold period was re-evaluated in connection with the Merger (see Footnote 22 of the Notes to Consolidated Financial Statements for additional disclosure) and adjustments to property carrying values in connection with the Company’s efforts to market certain properties and management’s assessment as to the likelihood and timing of such potential transactions and the anticipated hold period for such properties. |
|
(2) |
During 2015, the Company recognized aggregate impairment charges of $30.3 million, before an income tax benefit of $5.4 million and noncontrolling interests of $5.6 million. |
|
(3) |
During 2014, the Company recognized aggregate impairment charges of $33.3 million, before an income tax benefit of $6.1 million and noncontrolling interests of $0.3 million. |
|
(4) |
Impairment charges primarily based upon review of residual values, sales prices and debt maturity status and the likelihood of foreclosure of certain underlying properties within the Company’s preferred equity investments, during 2015 and 2014. The Company believes it will not recover its investment in certain preferred equity investments and as such recorded full impairments on these investments. |
|
(5) |
During 2015 and 2014, the Company reviewed the underlying cause of the decline in value of certain cost method investments, as well as the severity and the duration of the decline and determined that the decline was other-than-temporary. Impairment charges were recognized based upon the calculation of the investments’ estimated fair value. |
|
(6) |
Due to the substantial liquidation of its investment in Mexico, the Company recognized a loss from foreign currency translation related to consolidated properties in the amount of $92.9 million, before noncontrolling interest of $5.8 million. |
KIMCO REALTY CORPORATION AND SUBSIDIARIES
NOTES TO CONSOLIDATED FINANCIAL STATEMENTS, continued
In addition to the impairment charges above, the Company recognized pretax impairment charges during 2016, 2015 and 2014 of $15.0 million, $22.2 million, and $54.5 million (including $47.3 million in cumulative foreign currency translation loss relating to the Company’s substantial liquidation of its investment in Mexico), respectively, relating to certain properties held by various unconsolidated joint ventures in which the Company holds noncontrolling interests. These impairment charges are included in Equity in income of joint ventures, net in the Company’s Consolidated Statements of Income (see Footnote 8 of the Notes to Consolidated Financial Statements).
The Company will continue to assess the value of its assets on an on-going basis. Based on these assessments, the Company may determine that one or more of its assets may be impaired and would therefore write-down its carrying basis accordingly.
8. Investment and Advances in Real Estate Joint Ventures:
The Company and its subsidiaries have investments and advances in various real estate joint ventures. These joint ventures are engaged primarily in the operation of shopping centers which are either owned or held under long-term operating leases. The Company and the joint venture partners have joint approval rights for major decisions, including those regarding property operations. As such, the Company holds noncontrolling interests in these joint ventures and accounts for them under the equity method of accounting.
As of December 31, 2016 and 2015, the Company’s had interests in 135 and 191 shopping center properties, respectively, aggregating 26.2 million and 35.4 million square feet of GLA, respectively, held in joint venture investments. The table below presents joint venture investments for which the Company held an ownership interest at December 31, 2016 and 2015 (in millions, except number of properties):
|
As of December 31 , 2016 |
As of December 31 , 2015 |
|||||||||||||||||||||||
|
Venture |
Ownership Interest |
Number of Properties |
The Company's Investment |
Ownership Interest |
Number of Properties |
The Company's Investment |
||||||||||||||||||
|
Prudential Investment Program (“KimPru” and “KimPru II”) (1) (2) |
15.0% | 48 | $ | 182.5 | 15.0% | 53 | $ | 175.5 | ||||||||||||||||
|
Kimco Income Opportunity Portfolio (“KIR”) (2) |
48.6% | 45 | 145.2 | 48.6% | 47 | 131.0 | ||||||||||||||||||
|
Canada Pension Plan Investment Board (“CPP”) (2) (3) |
55.0% | 5 | 111.8 | 55.0% | 7 | 195.6 | ||||||||||||||||||
|
Other Institutional Programs (2) |
|
Various | 2 | 0.4 | Various | 9 | 5.2 | |||||||||||||||||
|
Other Joint Venture Programs (4) |
Various | 34 | 60.4 |
|
Various | 40 | 64.0 | |||||||||||||||||
|
Canadian Properties |
50.0% | 1 | 3.9 |
|
Various | 35 | 171.3 | |||||||||||||||||
|
Total |
135 | $ | 504.2 | 191 | $ | 742.6 | ||||||||||||||||||
|
(1) |
Represents four separate joint ventures, with four separate accounts managed by Prudential Global Investment Management (“PGIM”), three of these ventures are collectively referred to as KimPru and the remaining venture is referred to as KimPru II. |
|
(2) |
The Company manages these joint venture investments and, where applicable, earns acquisition fees, leasing commissions, property management fees, asset management fees and construction management fees. |
|
(3) |
During the year ended December 31, 2016, the CPP joint venture acquired a property interest adjacent to an existing operating property in Temecula, CA for a gross purchase price of $27.5 million. |
|
(4) |
Includes five land parcels located in Mexico. |
KIMCO REALTY CORPORATION AND SUBSIDIARIES
NOTES TO CONSOLIDATED FINANCIAL STATEMENTS, continued
The table below presents the Company’s share of net income for these investments which is included in the Company’s Consolidated Statements of Income under Equity in income of joint ventures, net for the years ended December 31, 2016, 2015 and 2014 (in millions):
|
Year Ended December 31, |
||||||||||||
|
2016 |
2015 |
2014 |
||||||||||
|
KimPru and KimPru II |
$ | 16.4 | $ | 7.1 | $ | 8.1 | ||||||
|
KIR |
44.0 | 41.0 | 26.5 | |||||||||
|
CPP |
7.7 | 9.6 | 7.1 | |||||||||
|
Other Institutional Programs |
1.1 | 4.7 | 28.8 | |||||||||
|
Other Joint Venture Programs |
3.9 | 14.2 | 49.7 | |||||||||
|
Canadian Properties |
145.6 | 403.8 | 39.4 | |||||||||
|
Total |
$ | 218.7 | $ | 480.4 | $ | 159.6 | ||||||
During 2016, the Company’s real estate joint ventures disposed of or transferred interest to joint venture partners 45 operating properties and one land parcel, in separate transactions, for an aggregate sales price of $1.1 billion. These transactions resulted in an aggregate net gain to the Company of $151.2 million, before income taxes, for the year ended December 31, 2016. In addition, during 2016, the Company acquired the remaining interest in nine operating properties and one development project from various joint ventures, in separate transactions, for a gross purchase price of $590.1 million. See Footnotes 3 and 4 of the Notes to Consolidated Financial Statements for the operating properties and development projects acquired by the Company.
During 2015, the Company’s real estate joint ventures disposed of or transferred interest to joint venture partners 98 operating properties and 11 land parcels, in separate transactions, for an aggregate sales price of $1.8 billion. These transactions resulted in an aggregate net gain to the Company of $380.6 million, before income taxes, for the year ended December 31, 2015. In addition, during 2015, the Company acquired the remaining interest in 43 operating properties from various joint ventures, in separate transactions for a gross purchase price of $1.6 billion. See Footnote 3 of the Notes to Consolidated Financial Statements for the operating properties acquired by the Company.
During 2014, the Company’s real estate joint ventures disposed of or transferred interest to joint venture partners 37 operating properties, in separate transactions, for an aggregate sales price of $811.7 million. These transactions resulted in an aggregate net gain to the Company of $96.0 million, before income taxes, for the year ended December 31, 2014. In addition, during 2014, the Company acquired the remaining interest in 34 operating properties from various joint ventures, in separate transactions for a gross purchase price of $1.0 billion.
The table below presents debt balances within the Company’s joint venture investments for which the Company held noncontrolling ownership interests at December 31, 2016 and 2015 (dollars in millions):
|
As of December 31 , 2016 |
As of December 31, 2015 |
||||||||||||||||||||||||
|
Venture |
Mortgages and Notes Payable |
Weighted Average Interest Rate |
Weighted Average Remaining Term (months)* |
Mortgages and Notes Payable |
Weighted Average Interest Rate |
Weighted Average Remaining Term (months)* |
|||||||||||||||||||
|
KimPru and KimPru II |
$ | 647.4 | 3.07 |
% |
67.5 | $ | 777.1 | 5.54 | % | 12.6 | |||||||||||||||
|
KIR |
746.5 | 4.64 |
% |
54.9 | 811.6 | 4.64 | % | 62.3 | |||||||||||||||||
|
CPP |
84.8 | 2.17 |
% |
16.0 | 109.9 | 5.25 | % | 3.5 | |||||||||||||||||
|
Other Institutional Programs |
94.7 | 4.09 |
% |
19.0 | 218.5 | 4.92 | % | 20.5 | |||||||||||||||||
|
Other Joint Venture Programs |
482.1 | 5.67 |
% |
24.5 | 540.7 | 5.61 | % | 36.1 | |||||||||||||||||
|
Canadian Properties |
7.5 | 4.70 |
% |
9.1 | 341.3 | 4.64 | % | 56.4 | |||||||||||||||||
|
Total |
$ | 2,063.0 | $ | 2,799.1 | |||||||||||||||||||||
* Average remaining term includes extensions
KIMCO REALTY CORPORATION AND SUBSIDIARIES
NOTES TO CONSOLIDATED FINANCIAL STATEMENTS, continued
Summarized financial information for the Company’s investment and advances in real estate joint ventures is as follows (in millions):
|
December 31, |
||||||||
|
201 6 |
2015 |
|||||||
|
Assets: |
||||||||
|
Real estate, net |
$ | 3,741.9 | $ | 4,855.5 | ||||
|
Other assets |
224.6 | 279.3 | ||||||
| $ | 3,966.5 | $ | 5,134.8 | |||||
|
Liabilities and Partners’/Members’ Capital: |
||||||||
|
Notes payable |
$ | 214.5 | $ | 29.7 | ||||
|
Mortgages payable and construction loans |
1,848.5 | 2,769.4 | ||||||
|
Other liabilities |
82.3 | 119.6 | ||||||
|
Noncontrolling interests |
15.9 | 16.2 | ||||||
|
Partners’/Members’ capital |
1,805.3 | 2,199.9 | ||||||
| $ | 3,966.5 | $ | 5,134.8 | |||||
|
Year Ended December 31, |
||||||||||||
|
201 6 |
2015 |
2014 |
||||||||||
|
Revenues from rental properties |
$ | 597.5 | $ | 842.5 | $ | 1,059.9 | ||||||
|
Operating expenses |
(178.1 | ) | (265.9 | ) | (333.5 | ) | ||||||
|
Interest expense |
(117.3 | ) | (202.8 | ) | (247.3 | ) | ||||||
|
Depreciation and amortization |
(138.1 | ) | (191.9 | ) | (260.0 | ) | ||||||
|
Impairment charges |
(38.6 | ) | (63.4 | ) | (23.1 | ) | ||||||
|
Other income/(expense), net |
20.1 |
4.4 | (14.4 | ) | ||||||||
| (452.0 | ) | (719.6 | ) | (878.3 | ) | |||||||
|
Income from continuing operations |
145.5 | 122.9 | 181.6 | |||||||||
|
Discontinued Operations: |
||||||||||||
|
Income from discontinued operations |
- | - | 2.8 | |||||||||
|
Impairment on dispositions of properties |
- | - | (3.8 | ) | ||||||||
|
Gain on dispositions of properties |
- | - | 471.1 | |||||||||
| - | - | 470.1 | ||||||||||
|
Gain on sale of operating properties |
296.2 | 1,166.7 | - | |||||||||
|
Net income |
$ | 441.7 | $ | 1,289.6 | $ | 651.7 | ||||||
Other liabilities included in the Company’s accompanying Consolidated Balance Sheets include accounts with certain real estate joint ventures totaling $11.0 million and $12.6 million at December 31, 2016 and 2015, respectively. The Company and its subsidiaries have varying equity interests in these real estate joint ventures, which may differ from their proportionate share of net income or loss recognized in accordance with GAAP.
The Company’s maximum exposure to losses associated with its unconsolidated joint ventures is primarily limited to its carrying value in these investments. Generally, such investments contain operating properties and the Company has determined these entities do not contain the characteristics of a VIE. As of December 31, 2016 and 2015, the Company’s carrying value in these investments is $504.2 million and $742.6 million, respectively.
9. Other Real Estate Investments:
Preferred Equity Capital –
The Company previously provided capital to owners and developers of real estate properties through its Preferred Equity program. The Company’s maximum exposure to losses associated with its preferred equity investments is primarily limited to its net investment. As of December 31, 2016, the Company’s net investment under the Preferred Equity program was $193.7 million relating to 365 properties, including 346 net leased properties which are accounted for as direct financing leases. For the year ended December 31, 2016, the Company earned $27.5 million from its preferred equity investments, including $10.5 million in profit participation earned from five capital transactions. As of December 31, 2015, the Company’s net investment under the Preferred Equity program was $199.9 million relating to 421 properties, including 385 net leased properties. For the year ended December 31, 2015, the Company earned $27.0 million from its preferred equity investments, including $9.3 million in profit participation earned from nine capital transactions.
As of December 31, 2016, these preferred equity investment properties had non-recourse mortgage loans aggregating $427.4 million. These loans have scheduled maturities ranging from one month to eight years and bear interest at rates ranging from 4.19% to 10.47%. Due to the Company’s preferred position in these investments, the Company’s share of each investment is subject to fluctuation and is dependent upon property cash flows. The Company’s maximum exposure to losses associated with its preferred equity investments is limited to its invested capital.
KIMCO REALTY CORPORATION AND SUBSIDIARIES
NOTES TO CONSOLIDATED FINANCIAL STATEMENTS, continued
Summarized financial information relating to the Company’s preferred equity investments is as follows (in millions):
|
December 31, |
||||||||
|
201 6 |
2015 |
|||||||
|
Assets: |
||||||||
|
Real estate, net |
$ | 187.0 | $ | 258.0 | ||||
|
Other assets |
587.1 | 628.3 | ||||||
| $ | 774.1 | $ | 886.3 | |||||
|
Liabilities and Partners’/Members’ Capital: |
||||||||
|
Notes and mortgages payable |
$ | 454.7 | $ | 563.7 | ||||
|
Other liabilities |
8.3 | 12.9 | ||||||
|
Partners’/Members’ capital |
311.1 | 309.7 | ||||||
| $ | 774.1 | $ | 886.3 | |||||
|
Year Ended December 31, |
||||||||||||
|
201 6 |
2015 |
2014 |
||||||||||
|
Revenues from rental properties |
$ | 102.6 | $ | 122.1 | $ | 146.0 | ||||||
|
Operating expenses |
(27.4 | ) | (35.6 | ) | (47.0 | ) | ||||||
|
Interest expense |
(26.7 | ) | (35.7 | ) | (47.1 | ) | ||||||
|
Depreciation and amortization |
(6.7 | ) | (11.4 | ) | (19.2 | ) | ||||||
|
Other expense, net |
(11.5 | ) | (9.2 | ) | (7.2 | ) | ||||||
|
Income from continuing operations |
30.3 | 30.2 | 25.5 | |||||||||
|
Discontinued Operations: |
||||||||||||
|
Gain on disposition of properties |
- | - | 31.5 | |||||||||
| - | - | 31.5 | ||||||||||
|
Gain on sale of operating properties |
5.3 | 6.0 | - | |||||||||
|
Net income |
$ | 35.6 | $ | 36.2 | $ | 57.0 | ||||||
Kimsouth –
Kimsouth Realty Inc. (“Kimsouth”) is a wholly-owned subsidiary of the Company. KRS AB Acquisition, LLC (the “ABS Venture”) is a subsidiary of Kimsouth that has a noncontrolling interest in AB Acquisition, LLC (“AB Acquisition”), a joint venture which owns Albertsons Inc. (“Albertsons”) and NAI Group Holdings Inc. (“NAI”). The Company holds a controlling interest in the ABS Venture and consolidates this entity.
During January 2015, two new noncontrolling members were admitted into the ABS Venture, including Colony Capital, Inc. and affiliates (“Colony”), after which the Company contributed $85.3 million and the two noncontrolling members contributed an aggregate $105.0 million, of which Colony contributed $100.0 million, to the ABS Venture, which was subsequently contributed to AB Acquisition to facilitate the acquisition of all of the outstanding shares of Safeway Inc. (“Safeway”). In January 2017, Colony Capital, Inc. merged with NorthStar Asset Management Group Inc. and NorthStar Realty Finance Corp. to form Colony NorthStar, Inc. (“Colony NorthStar”). As a result, the ABS Venture now holds a combined 14.35% interest in AB Acquisition, of which the Company holds a combined 9.8% ownership interest and Colony NorthStar holds a 4.3% ownership interest. Richard B. Saltzman, a member of the Board of Directors of the Company, is the chief executive officer and president of Colony NorthStar. The combined company of Albertsons, NAI and Safeway operates over 2,200 grocery stores across 33 states. The Company continues to consolidate the ABS Venture as there was no change in control following the admission of the members described above. As such, the Company recorded (i) the gross investment in Safeway of $190.3 million in Other assets on the Company’s Consolidated Balance Sheets and accounts for this investment under the cost method of accounting (ii) a noncontrolling interest of $65.0 million and (iii) an increase in Paid-in capital of $24.0 million, net of a deferred tax effect of $16.0 million, representing the amount contributed by the newly admitted members in excess of their proportionate share of the historic book value of the net assets of ABS Venture.
KIMCO REALTY CORPORATION AND SUBSIDIARIES
NOTES TO CONSOLIDATED FINANCIAL STATEMENTS, continued
10. Variable Interest Entities :
Consolidated Operating Properties
Included within the Company’s consolidated operating properties at December 31, 2016, are 21 consolidated entities that are VIEs, for which the Company is the primary beneficiary. These entities have been established to own and operate real estate property. The Company’s involvement with these entities is through its majority ownership and management of the properties. The entities were deemed VIEs primarily based on the fact that the unrelated investors do not have substantial kick-out rights to remove the general or managing partner by a vote of a simple majority or less and they do not have participating rights. The Company determined that it was the primary beneficiary of these VIEs as a result of its controlling financial interest.
At December 31, 2016, total assets of these VIEs were $902.0 million and total liabilities were $174.2 million. The classification of these assets are primarily within operating real estate, cash and cash equivalents and accounts and notes receivable and the classification of these liabilities are primarily within other liabilities and mortgages payable on the Company’s Consolidated Balance Sheets.
The majority of the operations of these VIEs are funded with cash flows generated from the properties. The Company has not provided financial support to any of these VIEs that it was not previously contractually required to provide, which consists primarily of funding any capital expenditures, including tenant improvements, which are deemed necessary to continue to operate the entity and any operating cash shortfalls that the entity may experience.
Consolidated Real Estate Under Development Projects
Included within the Company’s real estate under development projects at December 31, 2016, are two consolidated entities that are VIEs, for which the Company is the primary beneficiary. These entities have been established to develop real estate properties to hold as long-term investments. The Company’s involvement with these entities is through its majority ownership and management of the properties. These entities were deemed VIEs primarily based on the fact that the equity investments at risk are not sufficient to permit the entities to finance their activities without additional financial support. The initial equity contributed to these entities was not sufficient to fully finance the real estate construction as development costs are funded by the partners throughout the construction period. The Company determined that it was the primary beneficiary of these VIEs as a result of its controlling financial interest.
At December 31, 2016, total assets of these real estate under development VIEs were $183.1 million and total liabilities were $2.3 million. The classification of these assets is primarily within Real estate under development in the Company’s Consolidated Balance Sheets and the classification of these liabilities are primarily within Accounts payable and accrued expenses on the Company’s Consolidated Balance Sheets.
Substantially all of the projected development costs to be funded for these development projects, aggregating $68.7 million, will be funded with capital contributions from the Company, when contractually obligated. The Company has not provided financial support to these VIEs that it was not previously contractually required to provide.
Unconsolidated Redevelopment Investment
Included in the Company’s joint venture investments at December 31, 2016, is an unconsolidated joint venture, which is a VIE for which the Company is not the primary beneficiary. This joint venture was primarily established to develop real estate property for long-term investment and was deemed a VIE primarily based on the fact that the equity investment at risk was not sufficient to permit the entity to finance its activities without additional financial support. The initial equity contributed to this entity was not sufficient to fully finance the real estate construction as development costs are funded by the partners throughout the construction period. The Company determined that it was not the primary beneficiary of this VIE based on the fact that the Company has shared control of this entity along with the entity’s partners and therefore does not have a controlling financial interest.
KIMCO REALTY CORPORATION AND SUBSIDIARIES
NOTES TO CONSOLIDATED FINANCIAL STATEMENTS, continued
As of December 31, 2016, the Company’s investment in this VIE was a negative $7.4 million, due to the fact that the Company had a remaining capital commitment obligation, which is included in Other liabilities on the Company’s Consolidated Balance Sheets. The Company’s maximum exposure to loss as a result of its involvement with this VIE is estimated to be $7.4 million, which is the remaining capital commitment obligation. The Company has not provided financial support to this VIE that it was not previously contractually required to provide. All future costs of redevelopment will be funded with capital contributions from the Company and the outside partner in accordance with their respective ownership percentages.
11. Mortgages and Other Financing Receivables:
The Company has various mortgages and other financing receivables which consist of loans acquired and loans originated by the Company. For a complete listing of the Company’s mortgages and other financing receivables at December 31, 2016, see Financial Statement Schedule IV included in this annual report on Form 10-K.
The following table reconciles mortgage loans and other financing receivables from January 1, 2014 to December 31, 2016 (in thousands):
|
201 6 |
2015 |
2014 |
||||||||||
|
Balance at January 1, |
$ | 23,824 | $ | 74,013 | $ | 30,243 | ||||||
|
Additions: |
||||||||||||
|
New mortgage loans |
- | 5,730 | 52,728 | |||||||||
|
Write-off of loan discounts |
- | - | 286 | |||||||||
|
Foreign currency translation |
397 | - | - | |||||||||
|
Amortization of loan discounts |
112 | 112 | 126 | |||||||||
|
Deductions: |
||||||||||||
|
Loan repayments |
- | (53,646 | ) | (7,330 | ) | |||||||
|
Charge off/foreign currency translation |
(213 | ) | (884 | ) | (1,066 | ) | ||||||
|
Collections of principal |
(921 | ) | (1,499 | ) | (972 | ) | ||||||
|
Amortization of loan costs |
(2 | ) | (2 | ) | (2 | ) | ||||||
|
Balance at December 31, |
$ | 23,197 | $ | 23,824 | $ | 74,013 | ||||||
The Company reviews payment status to identify performing versus non-performing loans. As of December 31, 2016, the Company had a total of 12 loans, all of which were identified as performing loans.
12. Marketable Securities:
The amortized cost and gross unrealized gains/(losses) of securities available-for-sale and held-to-maturity at December 31, 2016 and 2015, are as follows (in thousands):
|
December 31, 201 6 |
||||||||||||
|
Amortized Cost |
Gross Unrealized Gains |
Total |
||||||||||
|
Available-for-sale: |
||||||||||||
|
Equity securities |
$ | 6,096 | $ | 406 | $ | 6,502 | ||||||
|
Held-to-maturity: |
||||||||||||
|
Debt securities |
1,599 | - | 1,599 | |||||||||
|
Total marketable securities |
$ | 7,695 | $ | 406 | $ | 8,101 | ||||||
|
December 31, 201 5 |
||||||||||||
|
Amortized Cost |
Gross Unrealized Gains/ ( Losses ) |
Total |
||||||||||
|
Available-for-sale: |
||||||||||||
|
Equity securities |
$ | 5,511 | $ | 398 | $ | 5,909 | ||||||
|
Held-to-maturity: |
||||||||||||
|
Debt securities |
1,656 | (1 | ) | 1,655 | ||||||||
|
Total marketable securities |
$ | 7,167 | $ | 397 | $ | 7,564 | ||||||
During 2015, the Company received $76.2 million in proceeds from the sale or redemption of certain marketable securities. In connection with these transactions, the Company recognized $39.9 million of realizable gains.
KIMCO REALTY CORPORATION AND SUBSIDIARIES
NOTES TO CONSOLIDATED FINANCIAL STATEMENTS, continued
As of December 31, 2016, the contractual maturities of debt securities classified as held-to-maturity are within the next five years. Actual maturities may differ from contractual maturities as issuers may have the right to prepay debt obligations with or without prepayment penalties.
13. Notes Payable:
As of December 31, 2016 and 2015 the Company’s Notes payable consisted of the following (dollars in millions):
|
Balance at 12/31/1 6 |
Interest Rate Range (Low) |
Interest Rate Range (High) |
Maturity Date Range (Low) |
Maturity Date Range (High) |
||||||||||||||||
|
Senior Unsecured Notes |
$ | 3,400.0 | 2.70% | 6.88% | Oct-2019 | Dec-2046 | ||||||||||||||
|
Medium Term Notes (“MTN”) |
300.0 | 4.30% | 4.30% | Feb-2018 | Feb-2018 | |||||||||||||||
|
Term Loan (a) |
250.0 | (a) | (a) | Jan-2017 | Jan-2017 | |||||||||||||||
|
Credit Facility (b) |
25.0 | (b) | (b) | Mar-2018 (b) | Mar-2018 (b) | |||||||||||||||
|
Deferred financing costs, net |
(47.7 | ) | - | - | - | - | ||||||||||||||
| $ | 3,927.3 | |||||||||||||||||||
|
Balance at 12/31/1 5 |
Interest Rate Range (Low) |
Interest Rate Range (High) |
Maturity Date Range (Low) |
Maturity Date Range (High) |
|||||||||||||||||
|
Senior Unsecured Notes |
$ | 2,290.9 | 3.13% | 6.88% | May-2017 | Apr-2045 | |||||||||||||||
|
MTN |
600.0 | 4.30% | 5.78% | Mar-2016 | Feb-2018 | ||||||||||||||||
|
Term Loan (a) |
650.0 | (a) | (a) | Jan-2017 | Jan-2017 | ||||||||||||||||
|
Canadian Notes Payable |
251.8 | 3.86% | 5.99% | Apr-2018 | Aug-2020 | ||||||||||||||||
|
Credit Facility (b) |
- | (b) | (b) | Mar-2018 (b) | Mar-2018 (b) | ||||||||||||||||
|
Deferred financing costs, net |
(31.4 | ) | - | - | - | - | |||||||||||||||
| $ | 3,761.3 | ||||||||||||||||||||
|
(a) |
Interest rate is equal to LIBOR + 0.95% (1.60% and 1.37% at December 31, 2016 and 2015, respectively). During January 2017, the Company repaid the $250.0 million outstanding balance on the Term Loan and terminated the agreement. |
|
(b) |
Interest rate is equal to LIBOR + 0.925% (1.67% and 1.35% at December 31, 2016 and 2015, respectively). During February 2017, the Company repaid the outstanding balance on the Credit Facility and terminated the agreement. The Company closed on a new $2.25 billion unsecured revolving credit facility which is scheduled to mature March 2021 with two six-month extension options at an interest rate of LIBOR plus 87.5 basis points. |
The weighted-average interest rate for all unsecured notes payable is 3.58% as of December 31, 2016. The scheduled maturities of all unsecured notes payable excluding unamortized debt issuance costs of $47.7 million, as of December 31, 2016, were as follows (in millions): 2017, $250.0; 2018, $325.0; 2019, $300.0; 2020, $0.0; 2021, $500.0 and thereafter, $2,600.0.
During the years ended December 31, 2016 and 2015, the Company repaid the following notes (dollars in millions):
|
Type |
Date Paid |
Maturity Date |
Amount Repaid (USD) |
Interest Rate |
|||||||||
|
Canadian Notes Payable (1) |
Aug-16 |
(1) | $ | 270.9 | (1) | ||||||||
|
Senior Unsecured Note (2) |
Aug-16 |
May-17 |
$ | 290.9 | 5.70% | ||||||||
|
MTN |
Mar-16 |
Mar-16 |
$ | 300.0 | 5.783% | ||||||||
|
MTN |
Nov-15 |
Nov-15 |
$ | 150.0 | 5.584% | ||||||||
|
Senior Unsecured Note |
Sep-15 |
Sep-15 |
$ | 100.0 | 5.25% | ||||||||
|
MTN |
Feb-15 |
Feb-15 |
$ | 100.0 | 4.904% | ||||||||
|
(1) |
On August 26, 2016, the redemption date, the Company repaid (i) its Canadian denominated (“CAD”) $150.0 million 5.99% notes, which were scheduled to mature in April 2018 and (ii) its CAD $200.0 million 3.855% notes, which were scheduled to mature in August 2020. The Company recorded aggregate early extinguishment of debt charges of CAD $34.1 million (USD $26.3 million) resulting from the early repayment of these notes. |
|
(2) |
The Company recorded an early extinguishment of debt charge of $10.2 million resulting from the early repayment of this note. |
KIMCO REALTY CORPORATION AND SUBSIDIARIES
NOTES TO CONSOLIDATED FINANCIAL STATEMENTS, continued
Senior Unsecured Notes / MTN –
The Company’s supplemental indentures governing its MTN and Senior Unsecured Notes contain covenants whereby the Company is subject to maintaining (a) certain maximum leverage ratios on both unsecured senior corporate and secured debt, minimum debt service coverage ratios and minimum equity levels, (b) certain debt service ratios and (c) certain asset to debt ratios. In addition, the Company is restricted from paying dividends in amounts that exceed by more than $26.0 million the funds from operations, as defined, generated through the end of the calendar quarter most recently completed prior to the declaration of such dividend; however, this dividend limitation does not apply to any distributions necessary to maintain the Company's qualification as a REIT providing the Company is in compliance with its total leverage limitations. The Company was in compliance with all of the covenants as of December 31, 2016.
Interest on the Company’s fixed-rate senior unsecured notes and medium term notes is payable semi-annually in arrears. Proceeds from these issuances were primarily used for the acquisition of shopping centers, the expansion and improvement of properties in the Company’s portfolio and the repayment of certain debt obligations of the Company.
The Company had a MTN program pursuant to which it offered for sale its senior unsecured debt for any general corporate purposes, including (i) funding specific liquidity requirements in its business, including property acquisitions, development and redevelopment costs and (ii) managing the Company's debt maturities.
During the years ended December 31, 2016 and 2015, the Company issued the following Senior Unsecured Notes (dollars in millions):
|
Date Issued |
Maturity Date |
Amount Issued |
Interest Rate |
||||||
|
Nov-16 |
Mar-24 |
$ | 400.0 | 2.7% | |||||
|
Nov-16 |
Dec-46 |
$ | 350.0 | 4.125% | |||||
|
Aug-16 |
Oct-26 |
$ | 500.0 | 2.8% | |||||
|
May-16 |
Apr-45 |
$ | 150.0 | 4.25% | |||||
|
Oct-15 |
Nov-22 |
$ | 500.0 | 3.40% | |||||
|
Mar-15 |
Apr-45 |
$ | 350.0 | 4.25% | |||||
The Company used the net proceeds from these issuances, after the underwriting discounts and related offering costs, for general corporate purposes, including to pre-fund near-term debt maturities or to reduce borrowings under the Company’s revolving credit facility.
Credit Facility –
The Company had a $1.75 billion unsecured revolving credit facility (the “Credit Facility”) with a group of banks, which was scheduled to expire in March 2018 with two additional six month options to extend the maturity date, at the Company’s discretion, to March 2019. The Credit Facility, which could be increased to $2.25 billion through an accordion feature, accrued interest at a rate of LIBOR plus 92.5 basis points (1.67% as of December 31, 2016) on drawn funds. In addition, the Credit Facility included a $500 million sub-limit which provided the Company the opportunity to borrow in alternative currencies including Canadian Dollars, British Pounds Sterling, Japanese Yen or Euros. Pursuant to the terms of the Credit Facility, the Company, among other things, was subject to covenants requiring the maintenance of (i) maximum leverage ratios on both unsecured and secured debt and (ii) minimum interest and fixed coverage ratios. The Company was in compliance with all of the covenants as of December 31, 2016. As of December 31, 2016, the Credit Facility had a balance of $25.0 million outstanding and $0.7 million appropriated for letters of credit.
In February 2017, the Company closed on a new $2.25 billion unsecured revolving credit facility with a group of banks, which is scheduled to expire in March 2021, with two additional six month options to extend the maturity date, at the Company’s discretion, to March 2022. This new credit facility, which accrues interest at a rate of LIBOR plus 87.5 basis points, could be increased to $2.75 billion through an accordion feature. The new credit facility replaces the Company’s $1.75 billion Credit Facility that was scheduled to mature in March 2018. In addition, the facility includes a $500.0 million sub-limit which provides the company the opportunity to borrow in alternative currencies including Canadian Dollars, British Pounds Sterling, Japanese Yen or Euros. Under this new credit facility, the Company continues to be subject to certain covenants as in the Credit Facility described above.
KIMCO REALTY CORPORATION AND SUBSIDIARIES
NOTES TO CONSOLIDATED FINANCIAL STATEMENTS, continued
Term Loan -
During January 2015, the Company entered into a $650.0 million unsecured term loan (“Term Loan”) which had an initial maturity date in January 2017 (with three one-year extension options at the Company’s discretion) and accrued interest at a spread (95 basis points at December 31, 2016) to LIBOR or at the Company’s option at a base rate as defined per the agreement (1.60% at December 31, 2016). The proceeds from the Term Loan were used to repay the Company’s $400.0 million term loan, which was scheduled to mature in April 2015 (with two additional one-year extension options) and bore interest at LIBOR plus 105 basis points, and for general corporate purposes. During November 2016, the Company repaid $400.0 million of borrowings under the Company’s Term Loan. As of December 31, 2016, the Term Loan had a balance of $250.0 million. Pursuant to the terms of the credit agreement for the Term Loan, the Company, among other things, was subject to covenants requiring the maintenance of (i) maximum indebtedness ratios and (ii) minimum interest and fixed charge coverage ratios. The Company was in compliance with all of the covenants as of December 31, 2016. During January 2017, the Company paid the remaining $250.0 million outstanding balance on the Company’s Term Loan and terminated the agreement.
14. Mortgages Payable:
During 2016, the Company (i) assumed $289.0 million of individual non-recourse mortgage debt relating to the acquisition of 10 properties, including $4.3 million associated with fair value debt adjustments and (ii) paid off $703.0 million of mortgage debt (including fair market value adjustment of $2.1 million) that encumbered 47 operating properties. In connection with the early prepayment of certain of these mortgage debts, the Company recorded an early extinguishment of debt charge of $9.2 million.
Additionally, during 2016, the Company disposed of an encumbered property through foreclosure. This transaction resulted in a net decrease in mortgage debt of $25.6 million (including fair market value adjustment of $0.4 million) and a gain on forgiveness of debt of $3.1 million, which is included in Other income/(expense), net in the Company’s Consolidated Statements of Income.
During 2015, the Company (i) assumed $835.2 million of individual non-recourse mortgage debt relating to the acquisition of 38 operating properties, including an increase of $27.6 million associated with fair value debt adjustments and (ii) repaid $557.0 million of mortgage debt (including fair market value adjustment of $1.4 million) that encumbered 27 operating properties.
Mortgages payable, collateralized by certain shopping center properties (see Financial Statement Schedule III included in this annual report on Form 10-K) and related tenants' leases, are generally due in monthly installments of principal and/or interest, which mature at various dates through 2031. Interest rates range from LIBOR plus 135 basis points (1.91% as of December 31, 2016) to 9.75% (weighted-average interest rate of 4.94% as of December 31, 2016). The scheduled principal payments (excluding any extension options available to the Company) of all mortgages payable, excluding unamortized fair value debt adjustments of $27.7 million and unamortized debt issuance costs of $3.0 million, as of December 31, 2016, were as follows (in millions): 2017, $462.4; 2018, $124.4; 2019, $115.9; 2020, $101.2; 2021, $145.4 and thereafter, $165.1.
15. Noncontrolling Interests:
Noncontrolling interests represent the portion of equity that the Company does not own in those entities it consolidates as a result of having a controlling interest or determined that the Company was the primary beneficiary of a VIE in accordance with the provisions of the FASB’s Consolidation guidance.
The Company accounts and reports for noncontrolling interests in accordance with the Consolidation guidance and the Distinguishing Liabilities from Equity guidance issued by the FASB. The Company identifies its noncontrolling interests separately within the equity section on the Company’s Consolidated Balance Sheets. Units that are determined to be contingently redeemable are classified as Redeemable noncontrolling interests and presented in the mezzanine section between Total liabilities and Stockholder’s equity on the Company’s Consolidated Balance Sheets. The amounts of consolidated net income attributable to the Company and to the noncontrolling interests are presented separately on the Company’s Consolidated Statements of Income.
KIMCO REALTY CORPORATION AND SUBSIDIARIES
NOTES TO CONSOLIDATED FINANCIAL STATEMENTS, continued
The Company owns seven shopping center properties located throughout Puerto Rico. These properties were acquired partially through the issuance of $158.6 million of non-convertible units and $45.8 million of convertible units. Noncontrolling interests related to these acquisitions totaled $233.0 million of units, including premiums of $13.5 million and a fair market value adjustment of $15.1 million (collectively, the "Units"). Noncontrolling interests relating to the remaining units was $86.2 million and $88.9 million as of December 31, 2016 and 2015, respectively. The Units, related annual cash distribution rates and related conversion features consisted of the following as of December 31, 2016 and 2015:
|
Type |
Par Value Per Unit |
Number of Units Remaining |
Return Per Annum |
||||||||||
|
Preferred A Units (1) |
$ | 1.00 | 79,642,697 | 5.0% | |||||||||
|
Class B-1 Preferred Units (2) |
$ | 10,000 | 189 | 7.0% | |||||||||
|
Class B-2 Preferred Units (1) |
$ | 10,000 | 42 | 7.0% | |||||||||
|
Class C DownReit Units (2) |
$ | 30.52 | 52,797 | Equal to the Company’s common stock dividend | |||||||||
|
(1) |
These units are redeemable for cash by the holder or callable by the Company and are included in Redeemable noncontrolling interests on the Company’s Consolidated Balance Sheets. |
|
(2) |
These units are redeemable for cash by the holder or at the Company’s option, shares of the Company’s common stock, based upon the conversion calculation as defined in the agreement. These units are included in Noncontrolling interests on the Company’s Consolidated Balance Sheets. |
The Company owns a shopping center located in Bay Shore, NY, which was acquired in 2006 with the issuance of 647,758 redeemable Class B Units at a par value of $37.24 per unit. The units accrue a return equal to the Company’s common stock dividend and are redeemable for cash by the holder or at the Company’s option, shares of the Company’s common stock at a ratio of 1:1. These units are callable by the Company any time after April 3, 2026, and are included in Noncontrolling interests on the Company’s Consolidated Balance Sheets. During 2007, 30,000 units, or $1.1 million par value, of the Class B Units were redeemed and at the Company’s option settled in cash. As of both December 31, 2016 and 2015, noncontrolling interest relating to the remaining Class B Units was $26.5 million.
Noncontrolling interests also includes 138,015 convertible units issued during 2006 by the Company, which were valued at $5.3 million, including a fair market value adjustment of $0.3 million, related to an interest acquired in an office building located in Albany, NY. These units are currently redeemable at the option of the holder for cash or at the option of the Company for the Company’s common stock at a ratio of 1:1. The holder is entitled to a distribution equal to the dividend rate of the Company’s common stock. The Company is restricted from disposing of these assets, other than through a tax free transaction, through January 2017.
The following table presents the change in the redemption value of the Redeemable noncontrolling interests for the years ended December 31, 2016 and 2015 (in thousands):
|
201 6 |
201 5 |
|||||||
|
Balance at January 1, |
$ | 86,709 | $ | 91,480 | ||||
|
Income (1) |
4,349 | 7,061 | ||||||
|
Distribution |
(4,105 | ) | (5,922 | ) | ||||
|
Conversion of redeemable units |
- | (5,910 | ) | |||||
|
Balance at December 31, |
$ | 86,953 | $ | 86,709 | ||||
|
(1) |
Includes $1.0 million in fair market value remeasurement for the year ended December 31, 2015. |
During the year ended December 31, 2015, the Company acquired its partner’s interest in three previously consolidated joint ventures for $31.6 million. The Company continues to consolidate these entities as there was no change in control from these transactions. The purchase of the remaining interests resulted in an aggregate decrease in noncontrolling interest of $25.2 million for the year ended December 31, 2015, and a net decrease of $6.4 million to the Company’s Paid-in capital, during 2015.
KIMCO REALTY CORPORATION AND SUBSIDIARIES
NOTES TO CONSOLIDATED FINANCIAL STATEMENTS, continued
16. Fair Value Disclosure of Financial Instruments:
All financial instruments of the Company are reflected in the accompanying Consolidated Balance Sheets at amounts which, in management’s estimation, based upon an interpretation of available market information and valuation methodologies, reasonably approximate their fair values except those listed below, for which fair values are disclosed. The valuation method used to estimate fair value for fixed-rate and variable-rate debt is based on discounted cash flow analyses, with assumptions that include credit spreads, market yield curves, trading activity, loan amounts and debt maturities. The fair values for marketable securities are based on published values, securities dealers’ estimated market values or comparable market sales. Such fair value estimates are not necessarily indicative of the amounts that would be realized upon disposition.
As a basis for considering market participant assumptions in fair value measurements, the FASB’s Fair Value Measurements and Disclosures guidance establishes a fair value hierarchy that distinguishes between market participant assumptions based on market data obtained from sources independent of the reporting entity (observable inputs that are classified within Levels 1 and 2 of the hierarchy) and the reporting entity’s own assumptions about market participant assumptions (unobservable inputs classified within Level 3 of the hierarchy).
The following are financial instruments for which the Company’s estimate of fair value differs from the carrying amounts (in thousands):
|
December 31, |
||||||||||||||||
|
201 6 |
201 5 |
|||||||||||||||
|
Carrying Amounts |
Estimated Fair Value |
Carrying Amounts |
Estimated Fair Value |
|||||||||||||
|
Marketable securities (1) |
$ | 8,101 | $ | 8,101 | $ | 7,565 | $ | 7,564 | ||||||||
|
Notes payable (2) |
$ | 3,927,251 | $ | 3,890,797 | $ | 3,761,328 | $ | 3,820,205 | ||||||||
|
Mortgages payable (3) |
$ | 1,139,117 | $ | 1,141,047 | $ | 1,614,982 | $ | 1,629,760 | ||||||||
|
(1) |
As of December 31, 2016 and 2015, the Company determined that $6.5 million and $5.9 million, respectively, of the Marketable securities estimated fair value were classified within Level 1 of the fair value hierarchy and the remaining $1.6 million and $1.7 million, respectively, were classified within Level 3 of the fair value hierarchy. |
|
(2) |
The Company determined that its valuation of the Senior Unsecured Notes and MTNs were classified within Level 2 of the fair value hierarchy and the Term Loan and Credit Facility were classified within Level 3 of the fair value hierarchy. |
|
(3) |
The Company determined that its valuation of these Mortgages payable was classified within Level 3 of the fair value hierarchy. |
The Company has certain financial instruments that must be measured under the FASB’s Fair Value Measurements and Disclosures guidance, including available for sale securities. The Company currently does not have non-financial assets and non-financial liabilities that are required to be measured at fair value on a recurring basis.
In instances where the determination of the fair value measurement is based on inputs from different levels of the fair value hierarchy, the level in the fair value hierarchy within which the entire fair value measurement falls is based on the lowest level input that is significant to the fair value measurement in its entirety. The Company’s assessment of the significance of a particular input to the fair value measurement in its entirety requires judgment, and considers factors specific to the asset or liability.
The Company from time to time has used interest rate swaps to manage its interest rate risk. The fair values of interest rate swaps are determined using the market standard methodology of netting the discounted future fixed cash receipts (or payments) and the discounted expected variable cash payments (or receipts). The variable cash payments (or receipts) are based on an expectation of future interest rates (forward curves) derived from observable market interest rate curves. Based on these inputs, the Company has determined that interest rate swap valuations are classified within Level 2 of the fair value hierarchy.
The tables below present the Company’s financial assets and liabilities measured at fair value on a recurring basis as of December 31, 2016 and 2015, aggregated by the level in the fair value hierarchy within which those measurements fall (in thousands):
|
Balance at December 31, 201 6 |
Level 1 |
Level 2 |
Level 3 |
|||||||||||||
|
Assets: |
||||||||||||||||
|
Marketable equity securities |
$ | 6,502 | $ | 6,502 | $ | - | $ | - | ||||||||
|
Liabilities: |
||||||||||||||||
|
Interest rate swaps |
$ | 975 | $ | - | $ | 975 | $ | - | ||||||||
KIMCO REALTY CORPORATION AND SUBSIDIARIES
NOTES TO CONSOLIDATED FINANCIAL STATEMENTS, continued
|
Balance at December 31, 201 5 |
Level 1 |
Level 2 |
Level 3 |
|||||||||||||
|
Assets: |
||||||||||||||||
|
Marketable equity securities |
$ | 5,909 | $ | 5,909 | $ | - | $ | - | ||||||||
|
Liabilities: |
||||||||||||||||
|
Interest rate swaps |
$ | 1,426 | $ | - | $ | 1,426 | $ | - | ||||||||
Assets measured at fair value on a non-recurring basis at December 31, 2016 and 2015 are as follows (in thousands):
|
Balance at December 31, 201 6 |
Level 1 |
Level 2 |
Level 3 |
|||||||||||||
|
Real estate |
$ | 117,930 | $ | - | $ | - | $ | 117,930 | ||||||||
|
Balance at December 31, 201 5 |
Level 1 |
Level 2 |
Level 3 |
|||||||||||||
|
Real estate |
$ | 52,439 | $ | - | $ | - | $ | 52,439 | ||||||||
During the year ended December 31, 2016, the Company recognized impairment charges related solely to adjustments to property carrying values of $93.3 million. The Company’s estimated fair values were primarily based upon estimated sales prices from third party offers that were based on signed contracts, appraisals or letters of intent for which the Company does not have access to the unobservable inputs used to determine these estimated fair values. For the appraisals, the capitalization rates primarily range from 7.75% to 9.00% and discount rates primarily range from 9.25% to 12.17% which were utilized in the models based upon unobservable rates that the Company believes to be within a reasonable range of current market rates for each respective investment. Based on these inputs the Company determined that its valuation of these investments was classified within Level 3 of the fair value hierarchy.
During the year ended December 31, 2015, the Company recognized impairment charges of $45.5 million, of which $0.1 million, before noncontrolling interests and income taxes, is included in discontinued operations. These impairment charges consist of (i) $20.2 million related to adjustments to property carrying values, (ii) $10.2 million related to the sale of operating properties, (iii) $9.0 million related to a cost method investment, (iv) $5.3 million related to certain investments in other real estate investments and (v) $0.8 million related to marketable debt securities investments.
The Company’s estimated fair values for the year ended December 31, 2015, as it relates to property carrying values were primarily based upon (i) estimated sales prices from third party offers based on signed contracts or letters of intent (this method was used to determine $5.7 million of the $20.2 million in impairments recognized during the year ended December 31, 2015), for which the Company does not have access to the unobservable inputs used to determine these estimated fair values, (ii) third party appraisals (this method was used to determine $8.9 million of the $20.2 million in impairments recognized during the year ended December 31, 2015) and (iii) discounted cash flow models (this method was used to determine $5.6 million of the $20.2 million in impairments recognized during the year ended December 31, 2015). The discounted cash flow models include all estimated cash inflows and outflows over a specified holding period. These cash flows were comprised of unobservable inputs which include forecasted revenues and expenses based upon market conditions and expectations for growth. The capitalization rates primarily ranging from 8.25% to 8.5% and discount rates primarily ranging from 9.25% to 9.75% which were utilized in the models were based upon observable rates that the Company believes to be within a reasonable range of current market rates for each respective investment.
Based on these inputs the Company determined that its valuation of these investments was classified within Level 3 of the fair value hierarchy. The property carrying value impairment charges resulted from the Company’s efforts to market certain assets and management’s assessment as to the likelihood and timing of such potential transactions.
KIMCO REALTY CORPORATION AND SUBSIDIARIES
NOTES TO CONSOLIDATED FINANCIAL STATEMENTS, continued
17. Preferred Stock, Common Stock and Convertible Unit Transactions :
Preferred Stock
The Company’s outstanding Preferred Stock is detailed below (in thousands, except share information and par values):
|
As of December 31, 2016 and 201 5 |
||||||||||||||||||||||||
|
Series of Preferred Stock |
Shares Authorized |
Shares Issued and Outstanding |
Liquidation Preference |
Dividend Rate |
Annual Dividend per Depositary Share |
Par Value |
||||||||||||||||||
|
Series I |
18,400 | 16,000 | $ | 400,000 | 6.00 | % | $ | 1.50000 | $ | 1.00 | ||||||||||||||
|
Series J |
9,000 | 9,000 | 225,000 | 5.50 | % | $ | 1.37500 | $ | 1.00 | |||||||||||||||
|
Series K |
8,050 | 7,000 | 175,000 | 5.625 | % | $ | 1.40625 | $ | 1.00 | |||||||||||||||
| 35,450 | 32,000 | $ | 800,000 | |||||||||||||||||||||
|
Series of Preferred Stock |
Date Issued |
Depositary Shares Issued |
Fractional Interest per Share |
Net Proceeds, After Expenses (in millions) |
Offering/ Redemption Price |
Optional Redemption Date |
||||||||||
|
Series I |
3/20/2012 |
16,000,000 |
1/1000 |
$ | 387.2 | $ | 25.00 |
3/20/2017 |
||||||||
|
Series J |
7/25/2012 |
9,000,000 |
1/1000 |
$ | 217.8 | $ | 25.00 |
7/25/2017 |
||||||||
|
Series K |
12/7/2012 |
7,000,000 |
1/1000 |
$ | 169.1 | $ | 25.00 |
12/7/2017 |
||||||||
The following Preferred Stock series was redeemed during the year ended December 31, 2015:
|
Series of Preferred Stock |
Date Issued |
Depositary Shares Issued |
Redemption Amount (in millions) |
Offering/ Redemption Price |
Optional Redemption Date |
|
Actual Redemption Date |
||||||||||
|
Series H (1) |
8/30/2010 |
7,000,000 | $ | 175.0 | $ | 25.00 |
8/30/2015 |
11/25/2015 | |||||||||
|
(1) |
In connection with this redemption the Company recorded a non-cash charge of $5.8 million resulting from the difference between the redemption amount and the carrying amount of the Class H Preferred Stock on the Company’s Consolidated Balance Sheets in accordance with the FASB’s guidance on Distinguishing Liabilities from Equity. The $5.8 million was subtracted from net income to arrive at net income available to common shareholders and is used in the calculation of earnings per share for the year ended December 31, 2015. |
The Company’s Preferred Stock Depositary Shares for all series are not convertible or exchangeable for any other property or securities of the Company.
Voting Rights - The Class I Preferred Stock, Class J Preferred Stock and Class K Preferred Stock rank pari passu as to voting rights, priority for receiving dividends and liquidation preference as set forth below.
As to any matter on which the Class I, J, or K Preferred Stock may vote, including any actions by written consent, each share of the Class I, J or K Preferred Stock shall be entitled to 1,000 votes, each of which 1,000 votes may be directed separately by the holder thereof. With respect to each share of Class I, J or K Preferred Stock, the holder thereof may designate up to 1,000 proxies, with each such proxy having the right to vote a whole number of votes (totaling 1,000 votes per share of Class I, J or K Preferred Stock). As a result, each Class I, J or K Depositary Share is entitled to one vote.
Liquidation Rights
In the event of any liquidation, dissolution or winding up of the affairs of the Company, preferred stock holders are entitled to be paid, out of the assets of the Company legally available for distribution to its stockholders, a liquidation preference of $25,000.00 Class I Preferred Stock per share, $25,000.00 Class J Preferred Stock per share and $25,000.00 Class K Preferred Stock per share ($25.00 per each Class I, Class J and Class K Depositary Share), plus an amount equal to any accrued and unpaid dividends to the date of payment, before any distribution of assets is made to holders of the Company’s common stock or any other capital stock that ranks junior to the preferred stock as to liquidation rights.
KIMCO REALTY CORPORATION AND SUBSIDIARIES
NOTES TO CONSOLIDATED FINANCIAL STATEMENTS, continued
Common Stock
During February 2015, the Company established an at the market continuous offering program (the “ATM program”), pursuant to which the Company may offer and sell shares of its common stock, par value $0.01 per share, with an aggregate gross sales price of up to $500.0 million through a consortium of banks acting as sales agents. Sales of the shares of common stock may be made, as needed, from time to time in “at the market” offerings as defined in Rule 415 of the Securities Act of 1933, including by means of ordinary brokers’ transactions on the New York Stock Exchange (the “NYSE”) or otherwise (i) at market prices prevailing at the time of sale, (ii) at prices related to prevailing market prices or (iii) as otherwise agreed to with the applicable sales agent. During the year ended December 31, 2016, the Company issued 9,806,377 shares and received proceeds of $285.2 million, net of commissions and fees of $2.9 million. As of December 31, 2016 the Company had $211.9 million available under this ATM program.
The Company, from time to time, repurchases shares of its common stock in amounts that offset new issuances of common shares in connection with the exercise of stock options or the issuance of restricted stock awards. These share repurchases may occur in open market purchases, privately negotiated transactions or otherwise subject to prevailing market conditions, the Company’s liquidity requirements, contractual restrictions and other factors. During 2016, 2015 and 2014, the Company repurchased 257,477 shares, 179,696 shares and 128,147 shares, respectively, in connection with common shares surrendered to the Company to satisfy statutory minimum tax withholding obligations in connection with the vesting of restricted stock awards under the Company’s equity-based compensation plans.
Convertible Units
The Company has various types of convertible units that were issued in connection with the purchase of operating properties (see Footnote 15 of the Notes to Consolidated Financial Statements). The amount of consideration that would be paid to unaffiliated holders of units issued from the Company’s consolidated subsidiaries which are not mandatorily redeemable, as if the termination of these consolidated subsidiaries occurred on December 31, 2016, is $24.1 million. The Company has the option to settle such redemption in cash or shares of the Company’s common stock. If the Company exercised its right to settle in Common Stock, the unit holders would receive 0.9 million shares of Common Stock.
18. Supplemental Schedule of Non-Cash Investing/Financing Activities:
The following schedule summarizes the non-cash investing and financing activities of the Company for the years ended December 31, 2016, 2015 and 2014 (in thousands):
|
201 6 |
201 5 |
201 4 |
||||||||||
|
Acquisition of real estate interests by assumption of mortgage debt |
$ | 33,174 | $ | 84,699 | $ | 210,232 | ||||||
|
Acquisition of real estate interests by issuance of redeemable units |
$ | - | $ | - | $ | 8,219 | ||||||
|
Acquisition of real estate interests through proceeds held in escrow |
$ | 66,044 | $ | 89,504 | $ | 179,387 | ||||||
|
Proceeds held in escrow through sale of real estate interests |
$ | 66,044 | $ | 71,623 | $ | 197,270 | ||||||
|
Disposition of real estate interests by assignment of debt |
$ | - | $ | 47,742 | $ | - | ||||||
|
Disposition of real estate interests through the issuance of mortgage receivable |
$ | - | $ | 5,730 | $ | 2,728 | ||||||
|
Disposition of real estate interests by foreclosure of debt |
$ | 22,080 | $ | - | $ | - | ||||||
|
Forgiveness of debt due to foreclosure |
$ | 26,000 | $ | - | $ | - | ||||||
|
Investment in real estate joint venture through contribution of real estate |
$ | - | $ | - | $ | 35,080 | ||||||
|
Decrease of noncontrolling interests through sale of real estate |
$ | - | $ | - | $ | 17,650 | ||||||
|
Increase in capital expenditures accrual |
$ | 15,078 | $ | 8,581 | $ | 12,622 | ||||||
|
Issuance of common stock |
$ | 85 | $ | 493 | $ | 14,047 | ||||||
|
Surrender of common stock |
$ | (7,008 | ) | $ | (5,682 | ) | $ | (4,051 | ) | |||
|
Declaration of dividends paid in succeeding period |
$ | 124,517 | $ | 115,182 | $ | 111,143 | ||||||
|
Consolidation of Joint Ventures: |
||||||||||||
|
Increase in real estate and other assets |
$ | 407,813 | $ | 1,039,335 | $ | 687,538 | ||||||
|
Increase in mortgages payable, other liabilities and noncontrolling interests |
$ | 268,194 | $ | 750,135 | $ | 492,318 | ||||||
19. Transactions with Related Parties:
The Company provides management services for shopping centers owned principally by affiliated entities and various real estate joint ventures in which certain stockholders of the Company have economic interests. Such services are performed pursuant to management agreements which provide for fees based upon a percentage of gross revenues from the properties and other direct costs incurred in connection with management of the centers. Substantially all of the Management and other fee income on the Company’s Consolidated Statements of Income constitute fees earned from affiliated entities. Reference is made to Footnotes 3, 8 and 9 of the Notes to Consolidated Financial Statements for additional information regarding transactions with related parties.
KIMCO REALTY CORPORATION AND SUBSIDIARIES
NOTES TO CONSOLIDATED FINANCIAL STATEMENTS, continued
Ripco Real Estate Corp. (“Ripco”) business activities include serving as a leasing agent and representative for national and regional retailers including Target, Best Buy, Kohl’s and many others, providing real estate brokerage services and principal real estate investing. Mr. Todd Cooper, an officer and 50% shareholder of Ripco, is a son of Mr. Milton Cooper, Executive Chairman of the Board of Directors of the Company. During 2016, 2015 and 2014, the Company paid brokerage commissions of $0.2 million, $0.6 million and $0.3 million, respectively, to Ripco for services rendered primarily as leasing agent for various national tenants in shopping center properties owned by the Company.
ProHEALTH is a multi-specialty physician group practice offering one-stop health care. ProHEALTH’s CEO, Dr. David Cooper, M.D. is a son of Milton Cooper, Executive Chairman of the Company. ProHEALTH and/or its affiliates (“ProHEALTH”) have leasing arrangements with the Company whereby two consolidated property locations are currently under lease. Total annual base rent for these properties leased to ProHEALTH for the years ended December 31, 2016, 2015 and 2014 aggregated to $0.4 million, $0.4 million and $0.1 million, respectively.
During January 2015, Colony contributed $100.0 million, to the ABS Venture, which was subsequently contributed to AB Acquisition to facilitate the acquisition of all of the outstanding shares of Safeway. The ABS Venture now holds a combined 14.35% interest in AB Acquisition, of which the Company holds a combined 9.8% ownership interest, Colony NorthStar holds a 4.3% ownership interest and an unrelated third party holds a 0.25% ownership interest. Richard B. Saltzman, a member of the Board of Directors of the Company, is the chief executive officer and president of Colony NorthStar. (see Footnote 9 of the Notes to Consolidated Financial Statements).
20. Commitments and Contingencies:
Operations
The Company and its subsidiaries are primarily engaged in the operation of shopping centers that are either owned or held under long-term leases that expire at various dates through 2115. The Company and its subsidiaries, in turn, lease premises in these centers to tenants pursuant to lease agreements which provide for terms ranging generally from 5 to 25 years and for annual minimum rentals plus incremental rents based on operating expense levels and tenants' sales volumes. Annual minimum rentals plus incremental rents based on operating expense levels and percentage rents comprised 98% of total revenues from rental properties for each of the three years ended December 31, 2016, 2015 and 2014.
The minimum revenues from rental properties under the terms of all non-cancelable tenant leases for future years, assuming no new or renegotiated leases are executed for such premises, are as follows (in millions): 2017, $834.6; 2018, $755.9; 2019, $664.1; 2020, $567.7; 2021, $471.5 and thereafter; $1,971.7.
Base rental revenues from rental properties are recognized on a straight-line basis over the terms of the related leases. The difference between the amount of rental income contracted through leases and rental income recognized on a straight-line basis before allowances for the years ended December 31, 2016, 2015 and 2014 was $16.5 million, $14.8 million and $8.4 million, respectively.
Minimum rental payments to be made by the Company under the terms of all non-cancelable operating ground leases for future years are as follows (in millions): 2017, $10.3; 2018, $9.9; 2019, $9.2; 2020, $8.6; 2021, $8.3 and thereafter, $143.0.
Letters of Credit
The Company has issued letters of credit in connection with the completion and repayment guarantees for loans encumbering certain of the Company’s development and redevelopment projects and guaranty of payment related to the Company’s insurance program. At December 31, 2016, these letters of credit aggregated $40.8 million.
KIMCO REALTY CORPORATION AND SUBSIDIARIES
NOTES TO CONSOLIDATED FINANCIAL STATEMENTS, continued
Other
In connection with the construction of its development and redevelopment projects and related infrastructure, certain public agencies require posting of performance and surety bonds to guarantee that the Company’s obligations are satisfied. These bonds expire upon the completion of the improvements and infrastructure. As of December 31, 2016, there were $30.1 million in performance and surety bonds outstanding.
On January 28, 2013, the Company received a subpoena from the Enforcement Division of the SEC in connection with an investigation, In the Matter of Wal-Mart Stores, Inc. (FW-3678), that the SEC Staff is currently conducting with respect to possible violations of the Foreign Corrupt Practices Act. The Company has cooperated, and will continue to cooperate, with the SEC and the U.S. Department of Justice (“DOJ”), which is conducting a parallel investigation. At this point, we are unable to predict the duration, scope or result of the SEC or DOJ investigations.
The Company is subject to various other legal proceedings and claims that arise in the ordinary course of business. Management believes that the final outcome of such matters will not have a material adverse effect on the financial position, results of operations or liquidity of the Company as of December 31, 2016.
21. Incentive Plans:
The Company accounts for equity awards in accordance with FASB’s Compensation – Stock Compensation guidance which requires that all share based payments to employees, including grants of employee stock options, restricted stock and performance shares, be recognized in the Statement of Income over the service period based on their fair values. Fair value is determined, depending on the type of award, using either the Black-Scholes option pricing formula or the Monte Carlo method for performance shares, both of which are intended to estimate the fair value of the awards at the grant date. Fair value of restricted shares is calculated based on the price on the date of grant.
The Company recognized expense associated with its equity awards of $19.1 million, $18.5 million and $17.9 million, for the years ended December 31, 2016, 2015 and 2014, respectively. As of December 31, 2016, the Company had $31.1 million of total unrecognized compensation cost related to unvested stock compensation granted under the Plans. That cost is expected to be recognized over a weighted average period of 3.3 years. The Company had 10,015,040, 9,095,416 and 9,251,021, shares of the Company’s common stock available for issuance under the Plans at December 31, 2016, 2015 and 2014, respectively.
Stock Options
During 2016, 2015 and 2014, the Company did not grant any stock options. Information with respect to stock options outstanding under the Plan for the years ended December 31, 2016, 2015 and 2014 are as follows:
|
Shares |
Weighted-Average Exercise Price Per Share |
Aggregate Intrinsic Value (in millions) |
||||||||||
|
Options outstanding, January 1, 2014 |
15,374,145 | $ | 28.79 | $ | 13.1 | |||||||
|
Exercised |
(1,474,432 | ) | $ | 16.19 | $ | 9.4 | ||||||
|
Forfeited |
(2,005,952 | ) | $ | 28.68 | ||||||||
|
Options outstanding, December 31, 2014 |
11,893,761 | $ | 30.23 | $ | 29.8 | |||||||
|
Exercised |
(1,019,240 | ) | $ | 18.36 | $ | 7.4 | ||||||
|
Forfeited |
(1,862,080 | ) | $ | 32.55 | ||||||||
|
Options outstanding, December 31, 2015 |
9,012,441 | $ | 31.09 | $ | 27.4 | |||||||
|
Exercised |
(1,167,819 | ) | $ | 18.03 | $ | 12.4 | ||||||
|
Forfeited |
(1,830,893 | ) | $ | 39.69 | ||||||||
|
Options outstanding, December 31, 2016 |
6,013,729 | $ | 32.09 | $ | 12.1 | |||||||
|
Options exercisable (fully vested) - |
||||||||||||
|
December 31, 2014 |
10,159,570 | $ | 31.96 | $ | 19.9 | |||||||
|
December 31, 2015 |
7,617,882 | $ | 32.90 | $ | 20.0 | |||||||
|
December 31, 2016 |
5,144,416 | $ | 32.56 | $ | 11.3 | |||||||
KIMCO REALTY CORPORATION AND SUBSIDIARIES
NOTES TO CONSOLIDATED FINANCIAL STATEMENTS, continued
The exercise prices for options outstanding as of December 31, 2016, range from $11.54 to $53.14 per share. The Company estimates forfeitures based on historical data. The weighted-average remaining contractual life for options outstanding as of December 31, 2016 was 2.4 years. The weighted-average remaining contractual term of options currently exercisable as of December 31, 2016, was 2.3 years. The weighted-average remaining contractual term of options expected to vest as of December 31, 2016, was 6.2 years. As of December 31, 2016, the Company had 225,695 options expected to vest, with a weighted-average exercise price per share of $21.54 and an aggregate intrinsic value of $0.8 million. Cash received from options exercised under the Plan was $21.1 million, $18.7 million and $23.9 million for the years ended December 31, 2016, 2015 and 2014, respectively.
Restricted Stock
Information with respect to restricted stock under the Plan for the years ended December 31, 2016, 2015 and 2014 are as follows:
|
201 6 |
201 5 |
2014 |
||||||||||
|
Restricted stock outstanding as of January 1, |
1,712,534 | 1,911,145 | 1,591,082 | |||||||||
|
Granted |
756,530 | 729,160 | 804,465 | |||||||||
|
Vested |
(520,539 | ) | (875,202 | ) | (418,309 | ) | ||||||
|
Forfeited |
(17,793 | ) | (52,569 | ) | (66,093 | ) | ||||||
|
Restricted stock outstanding as of December 31, |
1,930,732 | 1,712,534 | 1,911,145 | |||||||||
Restricted shares have the same voting rights as the Company’s common stock and are entitled to a cash dividend per share equal to the Company’s common dividend which is taxable as ordinary income to the holder. The dividends paid on restricted shares were $2.2 million, $1.8 million, and $1.5 million for the years ended December 31, 2016, 2015 and 2014, respectively. The weighted-average grant date fair value for restricted stock issued during the years ended December 31, 2016, 2015 and 2014 were $26.15, $25.98 and $21.60, respectively.
Performance Shares
As of December 31, 2016, 2015 and 2014, the Company had performance share awards outstanding of 197,249, 202,754 and 171,400, respectively. The weighted-average grant date fair value for performance shares issued during the years ended December 31, 2016, 2015 and 2014 were $28.60, $27.87 and $22.65, respectively. The more significant assumptions underlying the determination of fair values for these awards granted during 2016, 2015 and 2014 were as follows:
|
201 6 |
201 5 |
201 4 |
||||||||||||||
|
Stock price |
$ | 26.29 | $ | 26.83 | $ | 21.49 | ||||||||||
|
Dividend yield (1) |
0 | % | 0 | % | 0 | % | ||||||||||
|
Risk-free rate |
0.87 | % | 0.98 | % | 0.65 | % | ||||||||||
|
Volatility |
18.80 | % | 16.81 | % | 25.93 | % | ||||||||||
|
Term of the award (years) |
2.88 | 1.88, | 2.88 | 0.88, | 1.88, | 2.88 | ||||||||||
|
(1) |
Total Shareholder Returns, as used in the performance share awards computation, are measured based on cumulative dividend stock prices, as such a zero percent dividend yield is utilized. |
Other
The Company maintains a 401(k) retirement plan covering substantially all officers and employees, which permits participants to defer up to the maximum allowable amount determined by the Internal Revenue Service of their eligible compensation. This deferred compensation, together with Company matching contributions, which generally equal employee deferrals up to a maximum of 5% of their eligible compensation, is fully vested and funded as of December 31, 2016. The Company’s contributions to the plan were $2.0 million, $2.1 million and $2.2 million for the years ended December 31, 2016, 2015 and 2014, respectively.
The Company recognized severance costs associated with employee terminations during the years ended December 31, 2016, 2015 and 2014, of $1.7 million, $4.8 million and $6.3 million, respectively.
KIMCO REALTY CORPORATION AND SUBSIDIARIES
NOTES TO CONSOLIDATED FINANCIAL STATEMENTS, continued
22. Income Taxes:
The Company elected to qualify as a REIT in accordance with the Code commencing with its taxable year which began January 1, 1992. To qualify as a REIT, the Company must meet several organizational and operational requirements, including a requirement that it currently distribute at least 90% of its REIT taxable income to its stockholders. Management intends to adhere to these requirements and maintain the Company’s REIT status. As a REIT, the Company generally will not be subject to corporate federal income tax, provided that dividends to its stockholders equal at least the amount of its REIT taxable income. If the Company failed to qualify as a REIT in any taxable year, it would be subject to federal income taxes at regular corporate rates (including any applicable alternative minimum tax) and may not be permitted to elect REIT status for four subsequent taxable years. Even if the Company qualifies for taxation as a REIT, the Company is subject to certain state and local taxes on its income and property, and federal income and excise taxes on its undistributed taxable income. In addition, taxable income from non-REIT activities managed through TRSs is subject to federal, state and local income taxes. The Company is also subject to local taxes on certain Non-U.S. investments.
Reconciliation between GAAP Net Income and Federal Taxable Income
The following table reconciles GAAP net income to taxable income for the years ended December 31, 2016, 2015 and 2014 (in thousands):
|
201 6 |
201 5 |
201 4 |
||||||||||
|
(Estimated) |
(Actual) |
(Actual) |
||||||||||
|
GAAP net income attributable to the Company |
$ | 378,850 | $ | 894,115 | $ | 424,001 | ||||||
|
GAAP net loss/(income) of taxable REIT Subsidiaries |
2,414 | (6,073 | ) | (13,110 | ) | |||||||
|
GAAP net income from REIT operations (a) |
381,264 | 888,042 | 410,891 | |||||||||
|
Net book depreciation in excess of tax depreciation |
73,409 | 21,515 | 24,890 | |||||||||
|
Capitalized leasing/legal commissions |
(11,894 | ) | (14,246 | ) | (13,576 | ) | ||||||
|
Deferred/prepaid/above-market and below-market rents, net |
(35,230 | ) | (32,848 | ) | (17,967 | ) | ||||||
|
Fair market value debt amortization |
(15,953 | ) | (19,723 | ) | (6,236 | ) | ||||||
|
Restricted stock |
(4,490 | ) | (3,094 | ) | (1,078 | ) | ||||||
|
Book/tax differences from non-qualified stock options |
(11,301 | ) | (4,786 | ) | (5,144 | ) | ||||||
|
Book/tax differences from investments in real estate joint ventures |
(4,205 | ) | (294 | ) | 8,614 | |||||||
|
Book/tax difference on sale of properties |
(75,445 | ) | (64,270 | ) | (146,173 | ) | ||||||
|
Foreign income tax from capital gains |
- | 5,873 | - | |||||||||
|
Cumulative foreign currency translation adjustment & deferred tax adjustment |
3,267 | - | 139,976 | |||||||||
|
Book adjustment to property carrying values and marketable equity securities |
29,042 | 4,484 | 62,817 | |||||||||
|
Taxable currency exchange loss, net |
(6,775 | ) | (47,297 | ) | (100,602 | ) | ||||||
|
Tangible property regulations deduction (b) |
(58,000 | ) | (126,957 | ) | - | |||||||
|
Dividends from taxable REIT subsidiaries |
- | 647 | 67,590 | |||||||||
|
GAAP change in control gain |
(57,386 | ) | (149,407 | ) | (107,235 | ) | ||||||
|
Valuation allowance against net deferred tax assets (see discussion below) |
40,097 | - | - | |||||||||
|
Other book/tax differences, net |
(9,505 | ) | (3,618 | ) | (16,100 | ) | ||||||
|
Adjusted REIT taxable income |
$ | 236,895 | $ | 454,021 | $ | 300,667 | ||||||
Certain amounts in the prior periods have been reclassified to conform to the current year presentation, in the table above.
|
(a) |
All adjustments to "GAAP net income from REIT operations" are net of amounts attributable to noncontrolling interest and taxable REIT subsidiaries. |
|
(b) |
In September 2013, the Internal Revenue Service released final Regulations governing when taxpayers must capitalize and depreciate costs for acquiring, maintaining, repairing and replacing tangible property and when taxpayers must deduct such costs as repairs. Pursuant to these Regulations the Company deducted certain expenditures that would previously have been capitalized for tax purposes. The Regulations also allowed the Company to make an election to immediately deduct certain amounts that were capitalized in previous years but qualify as repairs under the new Regulations. The Company made such election in 2015 and deducted approximately $85.9 million. |
KIMCO REALTY CORPORATION AND SUBSIDIARIES
NOTES TO CONSOLIDATED FINANCIAL STATEMENTS, continued
Characterization of Distributions
The following characterizes distributions paid for tax purposes for the years ended December 31, 2016, 2015 and 2014, (in thousands):
|
201 6 |
2015 |
2014 |
||||||||||||||||||||||
|
Preferred H Dividends |
||||||||||||||||||||||||
|
Ordinary income |
$ | - | - | $ | - | - | $ | 6,762 | 56 | % | ||||||||||||||
|
Capital gain |
- | - | 13,417 | 100 | % | 5,313 | 44 | % | ||||||||||||||||
| $ | - | - | $ | 13,417 | 100 | % | $ | 12,075 | 100 | % | ||||||||||||||
|
Preferred I Dividends |
||||||||||||||||||||||||
|
Ordinary income |
$ | 16,320 | 68 | % | $ | - | - | $ | 13,440 | 56 | % | |||||||||||||
|
Capital gain |
7,680 | 32 | % | 24,000 | 100 | % | 10,560 | 44 | % | |||||||||||||||
| $ | 24,000 | 100 | % | $ | 24,000 | 100 | % | $ | 24,000 | 100 | % | |||||||||||||
|
Preferred J Dividends |
||||||||||||||||||||||||
|
Ordinary income |
$ | 8,415 | 68 | % | $ | - | - | $ | 6,930 | 56 | % | |||||||||||||
|
Capital gain |
3,960 | 32 | % | 12,375 | 100 | % | 5,445 | 44 | % | |||||||||||||||
| $ | 12,375 | 100 | % | $ | 12,375 | 100 | % | $ | 12,375 | 100 | % | |||||||||||||
|
Preferred K Dividends |
||||||||||||||||||||||||
|
Ordinary income |
$ | 6,694 | 68 | % | $ | - | - | $ | 5,513 | 56 | % | |||||||||||||
|
Capital gain |
3,150 | 32 | % | 9,844 | 100 | % | 4,331 | 44 | % | |||||||||||||||
| $ | 9,844 | 100 | % | $ | 9,844 | 100 | % | $ | 9,844 | 100 | % | |||||||||||||
|
Common Dividends |
||||||||||||||||||||||||
|
Ordinary income |
$ | 263,892 | 62 | % | $ | - | - | $ | 132,498 | 36 | % | |||||||||||||
|
Capital gain |
127,689 | 30 | % | 394,400 | 100 | % | 103,054 | 28 | % | |||||||||||||||
|
Return of capital |
34,050 | 8 | % | - | - | 132,498 | 36 | % | ||||||||||||||||
| $ | 425,631 | 100 | % | $ | 394,400 | 100 | % | $ | 368,050 | 100 | % | |||||||||||||
|
Total dividends distributed for tax purposes |
$ | 471,850 | $ | 454,036 | $ | 426,344 | ||||||||||||||||||
For the years ended December 31, 2016, 2015 and 2014 cash dividends paid for tax purposes were equivalent to, or in excess of, the dividends paid deduction.
Taxable REIT Subsidiaries and Taxable Entities
The Company is subject to federal, state and local income taxes on income reported through its TRS activities, which include wholly-owned subsidiaries of the Company. The Company’s TRSs included KRS, FNC Realty Corporation, Kimco Insurance Company (collectively “KRS Consolidated”) and the consolidated entity, Blue Ridge Real Estate Company/Big Boulder Corporation. As part of the Company’s overall strategy to simplify its business model, the Company merged KRS, a TRS holding REIT-qualifying real estate and the Company’s investment in Albertsons, into a wholly-owned LLC and KRS was dissolved effective August 1, 2016. Any non-REIT-qualifying assets or activities received by the Company in the Merger were transferred to a newly formed TRS, Kimco Realty Services II, Inc.
The Company is also subject to local non-U.S. taxes on certain investments located outside the U.S. In general, under local country law applicable to the entity ownership structures the Company has in place and applicable tax treaties, the repatriation of cash to the Company from its subsidiaries and joint ventures in Canada, Puerto Rico and Mexico generally is not subject to withholding tax. The Company is subject to and includes in its tax provision non-U.S. income taxes on certain investments located in jurisdictions outside the U.S. These investments are held by the Company at the REIT level and not in the Company’s taxable REIT subsidiary. Accordingly, the Company does not expect a U.S. income tax impact associated with the repatriation of undistributed earnings from the Company’s foreign subsidiaries.
Income taxes have been provided for on the asset and liability method as required by the FASB’s Income Tax guidance. Under the asset and liability method, deferred income taxes are recognized for the temporary differences between the financial reporting basis and the tax basis of taxable assets and liabilities.
KIMCO REALTY CORPORATION AND SUBSIDIARIES
NOTES TO CONSOLIDATED FINANCIAL STATEMENTS, continued
The Company’s pre-tax book (loss)/income and benefit/(provision) for income taxes relating to the Company’s TRS and taxable entities which have been consolidated for accounting reporting purposes, for the years ended December 31, 2016, 2015 and 2014, are summarized as follows (in thousands):
|
201 6 |
201 5 |
201 4 |
||||||||||
|
(Loss)/income before income taxes – U.S. |
$ | (23,810 | ) | $ | 23,729 | $ | 22,176 | |||||
|
Benefit/(provision) for income taxes, net: |
||||||||||||
|
Federal: |
||||||||||||
|
Current |
2,199 | (638 | ) | (522 | ) | |||||||
|
Deferred |
(45,097 | ) | (7,355 | ) | (7,156 | ) | ||||||
|
Federal tax provision |
(42,898 | ) | (7,993 | ) | (7,678 | ) | ||||||
|
State and local: |
||||||||||||
|
Current |
1,057 | (2,535 | ) | (165 | ) | |||||||
|
Deferred |
(8,812 | ) | (1,474 | ) | (1,223 | ) | ||||||
|
State tax provision |
(7,755 | ) | (4,009 | ) | (1,388 | ) | ||||||
|
Total tax provision – U.S. |
(50,653 | ) | (12,002 | ) | (9,066 | ) | ||||||
|
Net (loss)/income from U.S. taxable REIT subsidiaries |
$ | (74,463 | ) | $ | 11,727 | $ | 13,110 | |||||
|
Income before taxes – Non-U.S. |
$ | 138,253 | $ | 381,999 | $ | 116,184 | ||||||
|
(Provision)/benefit for Non-U.S. income taxes: |
||||||||||||
|
Current (1) |
$ | (24,393 | ) | $ | (58,365 | ) | $ | (18,131 | ) | |||
|
Deferred |
(3,537 | ) | 4,331 | (6,749 | ) | |||||||
|
Non-U.S. tax provision |
$ | (27,930 | ) | $ | (54,034 | ) | $ | (24,880 | ) | |||
|
(1) |
For the years ended December 31, 2016 and 2015 includes $24.9 million and $53.5 million, respectively, in expense related to the sale of interests in properties located in Canada. |
(Provision)/ benefit differ from the amounts computed by applying the statutory federal income tax rate to taxable income before income taxes as follows (in thousands):
|
201 6 |
201 5 |
201 4 |
||||||||||
|
Federal provision at statutory tax rate (35%) (1) |
$ | (47,155 | ) | $ | (8,304 | ) | $ | (7,762 | ) | |||
|
State and local provision, net of federal benefit (2) |
(3,498 | ) | (3,698 | ) | (1,304 | ) | ||||||
|
Total tax provision – U.S. |
$ | (50,653 | ) | $ | (12,002 | ) | $ | (9,066 | ) | |||
(1) For the year ended December 31, 2016, includes a $55.6 million charge related to the recording of a deferred tax valuation allowance.
(2) For the year ended December 31, 2016, includes a $7.9 million charge related to the recording of a deferred tax valuation allowance.
Deferred Tax Assets, Liabilities and Valuation Allowances
The Company’s deferred tax assets and liabilities at December 31, 2016 and 2015, were as follows (in thousands):
|
201 6 |
201 5 |
|||||||
|
Deferred tax assets: |
||||||||
|
Tax/GAAP basis differences |
$ | 63,167 | $ | 49,601 | ||||
|
Net operating losses (1) |
44,833 | 40,100 | ||||||
|
Related party deferred losses |
952 | 1,549 | ||||||
|
Tax credit carryforwards (2) |
5,368 | 5,304 | ||||||
|
Capital loss carryforwards |
3,659 | 4,593 | ||||||
|
Charitable contribution carryforwards |
35 | 22 | ||||||
|
Non-U.S. tax/GAAP basis differences |
513 | 4,555 | ||||||
|
Valuation allowance – U.S. |
(95,126 | ) | (25,045 | ) | ||||
|
Valuation allowance – Non-U.S. |
- | (2,860 | ) | |||||
|
Total deferred tax assets |
23,401 | 77,819 | ||||||
|
Deferred tax liabilities – U.S. |
(19,599 | ) | (19,326 | ) | ||||
|
Deferred tax liabilities – Non-U.S. |
(559 | ) | (3,493 | ) | ||||
|
Net deferred tax assets |
$ | 3,243 | $ | 55,000 | ||||
|
(1) |
Expiration dates ranging from 2021 to 2033. |
|
(2) |
Expiration dates ranging from 2027 to 2034 and includes alternative minimum tax credit carryovers of $3.1 million that do not expire. |
KIMCO REALTY CORPORATION AND SUBSIDIARIES
NOTES TO CONSOLIDATED FINANCIAL STATEMENTS, continued
The major differences between the GAAP basis of accounting and the basis of accounting used for federal and state income tax reporting consist of impairment charges recorded for GAAP purposes, but not recognized for tax purposes, depreciation and amortization, rental revenue recognized on the straight line method for GAAP, reserves for doubtful accounts, differences in GAAP and tax basis of assets sold, and the period in which certain gains were recognized for tax purposes, but not yet recognized under GAAP.
Deferred tax assets and deferred tax liabilities are included in the captions Other assets and Other liabilities on the accompanying Consolidated Balance Sheets at December 31, 2016 and 2015. Operating losses and the valuation allowance are related primarily to the Company’s consolidation of its taxable REIT subsidiaries for accounting and reporting purposes. For the tax year ended August 1, 2016, KRS Consolidated produced $20.6 million of taxable income and utilized $20.6 million of its $44.0 million of available net operating loss carryovers. For the year ended December 31, 2015, KRS Consolidated produced $19.7 million of taxable income and utilized $19.7 million of its $70.3 million of available net operating loss carryovers.
Under GAAP a reduction of the carrying amounts of deferred tax assets by a valuation allowance is required, if, based on the evidence available, it is more likely than not (a likelihood of more than 50 percent) that some portion or all of the deferred tax assets will not be realized. The valuation allowance should be sufficient to reduce the deferred tax asset to the amount that is more likely than not to be realized. As a result of the Merger, the Company determined that the realization of $63.5 million of its net deferred tax assets was not deemed more likely than not and as such, the Company recorded a full valuation allowance against these net deferred tax assets that existed at the time of the Merger.
The Company prepared an analysis of the tax basis built-in tax gain or built-in loss inherent in each asset acquired from KRS in the Merger. Assets of a TRS that become REIT assets in a merger transaction of the type entered into by the Company and KRS are subject to corporate tax on the aggregate net built-in gain (built-in gains in excess of built-in losses) during a recognition period. Accordingly, the Company is subject to corporate-level taxation on the aggregate net built-in gain from the sale of KRS assets within 60 months from the Merger date (the recognition period). The maximum taxable amount with respect to all merged assets disposed within 60 months of the Merger is limited to the aggregate net built-in gain at the Merger date. The Company compared fair value to tax basis for each property or asset to determine its built-in gain (value over basis) or built-in loss (basis over value) which could be subject to corporate level taxes if the Company disposed of the asset previously held by KRS during the 60 months following the Merger date. In the event that sales of KRS assets during the recognition period result in corporate level tax, the unrecognized tax benefits reported as deferred tax assets from KRS will be utilized to reduce the corporate level tax for GAAP purposes.
Uncertain Tax Positions
The Company is subject to income tax in certain jurisdictions outside the U.S., principally Canada and Mexico. The statute of limitations on assessment of tax varies from three to seven years depending on the jurisdiction and tax issue. Tax returns filed in each jurisdiction are subject to examination by local tax authorities. The Company is currently under audit by the Canadian Revenue Agency and Mexican Tax Authority. The resolution of these audits are not expected to have a material effect on the Company’s financial statements. The Company does not believe that the total amount of unrecognized tax benefits as of December 31, 2016, will significantly increase or decrease within the next 12 months.
The liability for uncertain tax benefits principally consists of estimated foreign, federal and state income tax liabilities in years for which the statute of limitations is open. Open years range from 2010 through 2016 and vary by jurisdiction and issue. The aggregate changes in the balance of unrecognized tax benefits for the years ended December 31, 2016 and 2015 were as follows (in thousands):
|
201 6 |
201 5 |
|||||||
|
Balance at January 1, |
$ | 4,263 | $ | 4,649 | ||||
|
Increases for tax positions related to current year |
41 | 1,084 | ||||||
|
Increase for tax position due to ASU 2013-11 |
4,930 | - | ||||||
|
Decreases relating to settlements with taxing authorities |
(2,000 | ) | - | |||||
|
Reductions due to lapsed statute of limitations |
(2,272 | ) | (1,470 | ) | ||||
|
Balance at December 31, |
$ | 4,962 | $ | 4,263 | ||||
KIMCO REALTY CORPORATION AND SUBSIDIARIES
NOTES TO CONSOLIDATED FINANCIAL STATEMENTS, continued
The Company previously had unrecognized tax benefits reported as deferred tax assets primarily related to book to tax timing differences for depreciation expense on its Canadian real estate operating properties. With respect to the Company’s uncertain tax positions in Canada and in accordance with ASU 2013-11 " Income Taxes (Topic 740): Presentation of an Unrecognized Tax Benefit When a Net Operating Loss Carryforward, a Similar Tax Loss, or a Tax Credit Carryforward Exists ," (“ASU 2013-11”), the uncertain tax position liabilities in Canada were netted against these deferred tax assets. As of December 31, 2016, the Company, due to the sale of certain operating real estate properties in Canada, no longer had these related deferred tax assets to net against the related deferred tax liability and thus, the amount of its liability increased for uncertain tax positions associated with its Canadian operations. As of December 31, 2016, the Company’s Canadian uncertain tax positions aggregated $4.9 million.
The Company and its subsidiaries had been under audit by the U.S. Internal Revenue Service (“IRS”) with respect to taxable years 2004-2009. The IRS proposed, pursuant to Section 482 of the Code, to disallow a capital loss claimed by KRS on the disposition of common shares of Valad Property Ltd., an Australian publicly listed company, and to assert a 100 percent “penalty” tax on the Company pursuant to Section 857(b)(7) of the Code in the amount of $40.9 million with respect to its 2009 taxable year. In 2016, the Company and its subsidiaries favorably settled all matters relating to the audit, agreeing to a net refund of $0.1 million. In connection with this favorable settlement, the Company released its uncertain tax position liability of $2.0 million.
In August 2016, the Mexican Tax Authority issued tax assessments for various wholly-owned entities of the Company that had previously held interests in operating properties in Mexico. These assessments relate to certain interest expense and withholding tax items subject to the United States-Mexico Income Tax Convention (the “Treaty”). The assessments are for the 2010 tax year and include amounts for taxes aggregating $33.7 million, interest aggregating $16.5 million and penalties aggregating $11.4 million. The Company believes that it has operated in accordance with the Treaty provisions and has therefore concluded that no amounts are payable with respect to this matter. The Company has submitted appeals for these assessments and the U.S. Competent Authority (Department of Treasury) is representing the Company regarding this matter with the Mexican Competent Authority. The Company intends to vigorously defend its position and believes it will prevail, however this outcome cannot be assured.
23. Accumulated Other Comprehensive Income:
The following table displays the change in the components of AOCI for the years ended December 31, 2016 and 2015:
|
Foreign Currency Translation Adjustments |
Unrealized Gains on Available-for- Sale Investments |
Unrealized Gain/(Loss) on Interest Rate Swaps |
Total |
|||||||||||||
|
Balance as of January 1, 2016 |
$ | 6,616 | $ | 398 | $ | (1,426 | ) | $ | 5,588 | |||||||
|
Other comprehensive income before reclassifications |
(281 | ) | 8 | 451 | 178 | |||||||||||
|
Amounts reclassified from AOCI |
- | - | - | - | ||||||||||||
|
Net current-period other comprehensive income |
(281 | ) | 8 | 451 | 178 | |||||||||||
|
Balance as of December 31, 2016 |
$ | 6,335 | $ | 406 | $ | (975 | ) | $ | 5,766 | |||||||
|
Foreign Currency Translation Adjustments |
Unrealized Gains on Available-for- Sale Investments |
Unrealized Gain/(Loss) on Interest Rate Swaps |
Total |
|||||||||||||
|
Balance as of January 1, 2015 |
$ | 329 | $ | 46,197 | $ | (1,404 | ) | $ | 45,122 | |||||||
|
Other comprehensive income before reclassifications |
(12,493 | ) | (5,946 | ) | (22 | ) | (18,461 | ) | ||||||||
|
Amounts reclassified from AOCI |
18,780 | (1) | (39,853 | )(2) | - | (21,073 | ) | |||||||||
|
Net current-period other comprehensive income |
6,287 | (45,799 | ) | (22 | ) | (39,534 | ) | |||||||||
|
Balance as of December 31, 2015 |
$ | 6,616 | $ | 398 | $ | (1,426 | ) | $ | 5,588 | |||||||
|
(1) |
During 2015, the Company recognized a cumulative foreign currency translation loss as a result of the liquidation of the Company’s investment in Chile. Amounts were reclassified on the Company’s Consolidated Statements of Income as follows (i) $19.6 million of loss was reclassified to Gain on sale of operating properties, net of tax, offset by (ii) $0.8 million of gain was reclassified to Equity in income of joint ventures, net. |
|
(2) |
Amounts reclassified to Interest, dividends and other investment income on the Company’s Consolidated Statements of Income. |
KIMCO REALTY CORPORATION AND SUBSIDIARIES
NOTES TO CONSOLIDATED FINANCIAL STATEMENTS, continued
At December 31, 2016, the Company had a net $6.3 million of unrealized cumulative foreign currency translation adjustment (“CTA”) gains relating to its foreign entity investments in Canada. CTA results from currency fluctuations between local currency and the U.S. dollar during the period in which the Company held its investment. CTA amounts are subject to future changes resulting from ongoing fluctuations in the respective foreign currency exchange rates. Under U.S. GAAP, the Company is required to release CTA balances into earnings when the Company has substantially liquidated its investment in a foreign entity. During 2015, the Company began selling properties within its Canadian portfolio and as such, the Company may, in the near term, substantially liquidate its remaining investment in Canada, which will require the then unrealized gain on foreign currency translation to be recognized as a benefit to earnings.
24. Supplemental Financial Information:
The following represents the quarterly results of income, expressed in thousands except per share amounts, for each quarter during the years 2016 and 2015:
|
201 6 (Unaudited) |
||||||||||||||||
|
Mar. 31 |
Jun . 30 |
Sept. 30 |
Dec. 31 |
|||||||||||||
|
Revenues from rental properties |
$ | 293,091 | $ | 287,115 | $ | 279,286 | $ | 292,909 | ||||||||
|
Net income/(loss) attributable to the Company |
$ | 140,713 | $ | 203,409 | $ | (43,545 | ) | $ | 78,273 | |||||||
|
Net income/(loss) per common share: |
||||||||||||||||
|
Basic |
$ | 0.31 | $ | 0.46 | $ | (0.13 | ) | $ | 0.16 | |||||||
|
Diluted |
$ | 0.31 | $ | 0.46 | $ | (0.13 | ) | $ | 0.16 | |||||||
|
201 5 (Unaudited) |
||||||||||||||||
|
Mar. 31 |
Jun . 30 |
Sept. 30 |
Dec. 31 |
|||||||||||||
|
Revenues from rental properties |
$ | 275,506 | $ | 289,080 | $ | 283,387 | $ | 296,501 | ||||||||
|
Net income attributable to the Company |
$ | 310,342 | $ | 127,000 | $ | 77,572 | $ | 379,201 | ||||||||
|
Net income per common share: |
||||||||||||||||
|
Basic |
$ | 0.72 | $ | 0.27 | $ | 0.15 | $ | 0.87 | ||||||||
|
Diluted |
$ | 0.71 | $ | 0.27 | $ | 0.15 | $ | 0.87 | ||||||||
25. Captive Insurance Company :
In October 2007, the Company formed a wholly-owned captive insurance company, KIC, which provides general liability insurance coverage for all losses below the deductible under the Company’s third-party liability insurance policy. The Company created KIC as part of its overall risk management program and to stabilize its insurance costs, manage exposure and recoup expenses through the functions of the captive program. The Company capitalized KIC in accordance with the applicable regulatory requirements. KIC established annual premiums based on projections derived from the past loss experience of the Company’s properties. KIC has engaged an independent third party to perform an actuarial estimate of future projected claims, related deductibles and projected expenses necessary to fund associated risk management programs. Premiums paid to KIC may be adjusted based on this estimate. Like premiums paid to third-party insurance companies, premiums paid to KIC may be reimbursed by tenants pursuant to specific lease terms.
KIC assumes occurrence basis general liability coverage for the Company and its affiliates under the terms of a reinsurance agreement entered into by KIC and the reinsurance provider.
KIMCO REALTY CORPORATION AND SUBSIDIARIES
NOTES TO CONSOLIDATED FINANCIAL STATEMENTS, continued
From October 1, 2007 through October 1, 2017, KIC assumes 100% of the first $250,000 per occurrence risk layer. This coverage is subject to annual aggregates ranging between $7.8 million and $11.5 million per policy year. The annual aggregate is adjustable based on the amount of audited square footage of the insureds’ locations and can be adjusted for subsequent program years. Defense costs erode the stated policy limits. KIC is required to pay the reinsurance provider for unallocated loss adjustment expenses an amount ranging between 9.5% and 12.2% of incurred losses for the policy periods ending September 30, 2008 through September 30, 2017. These amounts do not erode the Company’s per occurrence or aggregate limits.
As of December 31, 2016 and 2015, the Company maintained a letter of credit in the amount of $23.0 million issued in favor of the reinsurance provider to provide security for the Company’s obligations under its agreement with the reinsurance provider. The letter of credit maintained as of December 31, 2016, has an expiration date of February 15, 2018, with automatic renewals for one year.
Activity in the liability for unpaid losses and loss adjustment expenses for the years ended December 31, 2016 and 2015, is summarized as follows (in thousands):
|
201 6 |
201 5 |
|||||||
|
Balance at the beginning of the year |
$ | 20,046 | $ | 18,078 | ||||
|
Incurred related to: |
||||||||
|
Current year |
6,247 | 7,469 | ||||||
|
Prior years |
(67 | ) | 652 | |||||
|
Total incurred |
6,180 | 8,121 | ||||||
|
Paid related to: |
||||||||
|
Current year |
(962 | ) | (1,214 | ) | ||||
|
Prior years |
(5,749 | ) | (4,939 | ) | ||||
|
Total paid |
(6,711 | ) | (6,153 | ) | ||||
|
Balance at the end of the year |
$ | 19,515 | $ | 20,046 | ||||
For the years ended December 31, 2016 and 2015, the changes in estimates in insured events in the prior years, incurred losses and loss adjustment expenses resulted in a decrease of $0.1 million and an increase of $0.7 million, respectively, which was primarily due to continued regular favorable loss development on the general liability coverage assumed.
KIMCO REALTY CORPORATION AND SUBSIDIARIES
SCHEDULE II – VALUATION AND QUALIFYING ACCOUNTS
For Years Ended December 31, 2016, 2015 and 2014
(in thousands)
|
Balance at beginning of period |
Charged to expenses |
Adjustments to valuation accounts |
Deductions |
Balance at end of period |
||||||||||||||||
|
Year Ended December 31, 2016 |
||||||||||||||||||||
|
Allowance for uncollectable accounts |
$ | 13,918 | $ | 5,249 | $ | - | $ | (6,894 | ) | $ | 12,273 | |||||||||
|
Allowance for deferred tax asset |
$ | 27,905 | $ | - | $ | 67,221 | $ | - | $ | 95,126 | ||||||||||
|
Year Ended December 31, 2015 |
||||||||||||||||||||
|
Allowance for uncollectable accounts |
$ | 10,368 | $ | 7,333 | $ | - | $ | (3,783 | ) | $ | 13,918 | |||||||||
|
Allowance for deferred tax asset |
$ | 34,302 | $ | - | $ | (6,397 | ) | $ | - | $ | 27,905 | |||||||||
|
Year Ended December 31, 2014 |
||||||||||||||||||||
|
Allowance for uncollectable accounts |
$ | 10,771 | $ | 3,886 | $ | - | $ | (4,289 | ) | $ | 10,368 | |||||||||
|
Allowance for deferred tax asset |
$ | 63,712 | $ | - | $ | (29,410 | ) | $ | - | $ | 34,302 | |||||||||
KIMCO REALTY CORPORATION AND SUBSIDIARIES
SCHEDULE III - REAL ESTATE AND ACCUMULATED DEPRECIATION
December 31, 2016
|
INITIAL COST |
TOTAL COST, |
||||||||||
|
BUILDING |
SUBSEQUENT |
BUILDING |
ACCUMULATED |
NET OF ACCUMULATED |
DATE OF |
DATE OF |
|||||
|
LAND |
& IMPROVEMENT |
TO ACQUISITION |
LAND |
& IMPROVEMENT |
TOTAL |
DEPRECIATION |
DEPRECIATION |
ENCUMBRANCES |
ACQUISITION(A) |
CONSTRUCTION(C) |
|
|
KEY BANK BUILDING |
1,500,000 |
40,486,755 |
(12,256,024) |
672,719 |
29,058,012 |
29,730,731 |
18,250,563 |
11,480,168 |
- |
2006 |
|
|
THE GROVE |
18,951,763 |
6,403,809 |
2,321,874 |
6,793,454 |
20,883,992 |
27,677,446 |
6,572,921 |
21,104,525 |
- |
2007 |
|
|
EL MIRAGE |
6,786,441 |
503,987 |
130,064 |
6,786,441 |
634,051 |
7,420,492 |
73,155 |
7,347,337 |
- |
2008 |
|
|
TALAVI TOWN CENTER |
8,046,677 |
17,291,542 |
394,536 |
8,046,677 |
17,686,078 |
25,732,755 |
10,390,068 |
15,342,687 |
- |
2007 |
|
|
MESA PAVILIONS NORTH |
6,060,018 |
35,955,005 |
24,517 |
6,060,018 |
35,979,522 |
42,039,540 |
7,909,208 |
34,130,332 |
- |
2009 |
|
|
MESA RIVERVIEW |
15,000,000 |
- |
139,963,982 |
307,992 |
154,655,990 |
154,963,982 |
48,059,971 |
106,904,011 |
- |
2005 |
|
|
MESA PAVILLIONS - SOUTH |
- |
148,508 |
99,649 |
- |
248,157 |
248,157 |
96,454 |
151,703 |
- |
2011 |
|
|
METRO SQUARE |
4,101,017 |
16,410,632 |
1,249,341 |
4,101,017 |
17,659,973 |
21,760,990 |
8,377,898 |
13,383,092 |
- |
1998 |
|
|
HAYDEN PLAZA NORTH |
2,015,726 |
4,126,509 |
5,114,019 |
2,015,726 |
9,240,528 |
11,256,254 |
4,030,084 |
7,226,170 |
- |
1998 |
|
|
PLAZA DEL SOL |
5,324,502 |
21,269,943 |
2,164,169 |
4,577,870 |
24,180,744 |
28,758,614 |
8,268,728 |
20,489,886 |
- |
1998 |
|
|
PLAZA @ MOUNTAINSIDE |
2,450,341 |
9,802,046 |
1,809,711 |
2,450,341 |
11,611,757 |
14,062,098 |
5,707,659 |
8,354,439 |
- |
1997 |
|
|
VILLAGE CROSSROADS |
5,662,554 |
24,981,223 |
607,424 |
5,662,554 |
25,588,647 |
31,251,201 |
4,248,058 |
27,003,143 |
- |
2011 |
|
|
NORTH VALLEY |
6,861,564 |
18,200,901 |
6,140,408 |
3,861,272 |
27,341,601 |
31,202,873 |
4,277,047 |
26,925,826 |
- |
2011 |
|
|
CHRISTOWN SPECTRUM |
33,831,349 |
91,004,070 |
12,655,279 |
76,638,512 |
60,852,186 |
137,490,698 |
5,027,963 |
132,462,735 |
63,919,515 |
2015 |
|
|
ASANTE RETAIL CENTER |
8,702,635 |
3,405,683 |
2,866,807 |
11,039,471 |
3,935,654 |
14,975,125 |
422,495 |
14,552,630 |
- |
2004 |
|
|
SURPRISE SPECTRUM |
4,138,760 |
94,572 |
1,035 |
4,138,760 |
95,607 |
4,234,367 |
11,331 |
4,223,036 |
- |
2008 |
|
|
BELL CAMINO CENTER |
2,427,465 |
6,439,065 |
209,620 |
2,427,465 |
6,648,685 |
9,076,150 |
1,662,105 |
7,414,045 |
- |
2012 |
|
|
COLLEGE PARK SHOPPING CENTER |
3,276,952 |
7,741,323 |
937,255 |
3,276,952 |
8,678,578 |
11,955,530 |
2,032,716 |
9,922,814 |
- |
2011 |
|
|
COSTCO PLAZA - 541 |
4,995,639 |
19,982,557 |
454,041 |
4,995,639 |
20,436,598 |
25,432,237 |
9,919,333 |
15,512,904 |
- |
1998 |
|
|
BROOKHURST CENTER |
10,492,714 |
31,357,513 |
- |
10,492,715 |
31,357,512 |
41,850,227 |
170,330 |
41,679,897 |
- |
2016 |
|
|
LAKEWOOD PLAZA |
1,294,176 |
3,669,266 |
(90,654) |
- |
4,872,788 |
4,872,788 |
1,253,991 |
3,618,797 |
- |
2014 |
|
|
MADISON PLAZA |
5,874,396 |
23,476,190 |
2,639,269 |
5,874,395 |
26,115,460 |
31,989,855 |
11,883,068 |
20,106,787 |
- |
1998 |
|
|
BROADWAY PLAZA - 544 |
6,460,743 |
25,863,153 |
12,015,147 |
6,460,743 |
37,878,300 |
44,339,043 |
15,834,816 |
28,504,227 |
- |
1998 |
|
|
CORONA HILLS PLAZA |
13,360,965 |
53,373,453 |
7,747,951 |
13,360,965 |
61,121,404 |
74,482,369 |
30,140,783 |
44,341,586 |
- |
1998 |
|
|
280 METRO CENTER |
38,734,566 |
94,903,404 |
978,329 |
38,734,567 |
95,881,732 |
134,616,299 |
8,594,553 |
126,021,746 |
- |
2015 |
|
|
LABAND VILLAGE SHOPPING CENTER |
5,600,000 |
13,289,347 |
161,263 |
5,607,237 |
13,443,373 |
19,050,610 |
7,224,966 |
11,825,644 |
8,089,040 |
2008 |
|
|
CUPERTINO VILLAGE |
19,886,099 |
46,534,919 |
21,651,908 |
19,886,099 |
68,186,827 |
88,072,926 |
18,539,471 |
69,533,455 |
- |
2006 |
|
|
NORTH COUNTY PLAZA |
10,205,305 |
28,934,219 |
(1,428,787) |
20,894,811 |
16,815,926 |
37,710,737 |
2,511,204 |
35,199,533 |
- |
2014 |
|
|
CHICO CROSSROADS |
9,975,810 |
30,534,524 |
1,278,945 |
9,985,651 |
31,803,628 |
41,789,279 |
8,872,060 |
32,917,219 |
- |
2008 |
|
|
CHICO EAST & ESPLANADE(RALEYS) |
2,508,716 |
12,886,184 |
(1,312,384) |
2,284,856 |
11,797,660 |
14,082,516 |
687,471 |
13,395,045 |
3,994,238 |
2015 |
|
|
CORONA HILLS MARKETPLACE |
9,727,446 |
24,778,390 |
667,593 |
9,727,446 |
25,445,983 |
35,173,429 |
8,199,536 |
26,973,893 |
- |
2007 |
|
|
RIVER PARK CROSSING |
4,324,000 |
18,018,653 |
1,136,480 |
4,324,000 |
19,155,133 |
23,479,133 |
3,859,696 |
19,619,437 |
- |
2009 |
|
|
CREEKSIDE CENTER |
3,870,823 |
11,562,580 |
- |
3,870,823 |
11,562,580 |
15,433,403 |
62,601 |
15,370,802 |
- |
2016 |
|
|
GOLD COUNTRY CENTER |
3,272,212 |
7,864,878 |
29,687 |
3,278,290 |
7,888,487 |
11,166,777 |
3,425,408 |
7,741,369 |
- |
2008 |
|
|
LA MIRADA THEATRE CENTER |
8,816,741 |
35,259,965 |
(3,469,732) |
6,888,680 |
33,718,294 |
40,606,974 |
14,838,975 |
25,767,999 |
- |
1998 |
|
|
KENNETH HAHN PLAZA |
4,114,863 |
7,660,855 |
880,557 |
4,114,863 |
8,541,412 |
12,656,275 |
3,046,335 |
9,609,940 |
- |
2010 |
|
|
LA VERNE TOWN CENTER |
8,414,328 |
23,856,418 |
10,840,420 |
16,362,169 |
26,748,997 |
43,111,166 |
2,401,901 |
40,709,265 |
- |
2014 |
|
|
LINCOLN HILLS TOWN CENTER |
8,228,587 |
26,127,322 |
28,378 |
8,228,586 |
26,155,701 |
34,384,287 |
2,281,415 |
32,102,872 |
24,416,451 |
2015 |
|
|
NOVATO FAIR S.C. |
9,259,778 |
15,599,790 |
723,259 |
9,259,778 |
16,323,049 |
25,582,827 |
5,779,281 |
19,803,546 |
- |
2009 |
|
|
SOUTH NAPA MARKET PLACE |
1,100,000 |
22,159,086 |
20,615,121 |
23,119,071 |
20,755,136 |
43,874,207 |
9,867,595 |
34,006,612 |
- |
2006 |
|
|
PLAZA DI NORTHRIDGE |
12,900,000 |
40,574,842 |
892,428 |
12,900,000 |
41,467,270 |
54,367,270 |
14,601,761 |
39,765,509 |
- |
2005 |
|
|
LINDA MAR SHPPING CENTER |
16,548,592 |
37,521,194 |
1,418,767 |
16,548,592 |
38,939,961 |
55,488,553 |
5,972,288 |
49,516,265 |
- |
2014 |
|
|
POWAY CITY CENTRE |
5,854,585 |
13,792,470 |
8,378,985 |
7,247,813 |
20,778,227 |
28,026,040 |
8,030,783 |
19,995,257 |
- |
2005 |
|
|
REDWOOD CITY PLAZA |
2,552,000 |
6,215,168 |
5,900,877 |
2,552,000 |
12,116,045 |
14,668,045 |
1,083,976 |
13,584,069 |
- |
2009 |
|
|
STANFORD RANCH |
10,583,764 |
30,007,231 |
(1,670,000) |
9,982,626 |
28,938,369 |
38,920,995 |
2,938,618 |
35,982,377 |
14,751,853 |
2014 |
|
|
TYLER STREET PLAZA |
3,020,883 |
7,811,339 |
(12,456) |
3,200,516 |
7,619,250 |
10,819,766 |
2,612,860 |
8,206,906 |
- |
2008 |
|
|
CROCKER RANCH |
7,526,146 |
24,877,611 |
16,984 |
7,526,146 |
24,894,595 |
32,420,741 |
1,545,850 |
30,874,891 |
11,237,112 |
2015 |
|
|
HOME DEPOT PLAZA |
4,592,364 |
18,345,258 |
- |
4,592,365 |
18,345,257 |
22,937,622 |
8,870,544 |
14,067,078 |
- |
1998 |
|
|
SANTEE TROLLEY SQUARE |
40,208,683 |
62,963,757 |
535,614 |
40,208,683 |
63,499,371 |
103,708,054 |
13,018,268 |
90,689,786 |
- |
2015 |
|
|
SAN/DIEGO CARMEL MOUNTAIN |
5,322,600 |
8,873,991 |
88,334 |
5,322,600 |
8,962,325 |
14,284,925 |
2,125,865 |
12,159,060 |
- |
2009 |
|
|
FULTON MARKET PLACE |
2,966,018 |
6,920,710 |
1,237,558 |
2,966,018 |
8,158,268 |
11,124,286 |
2,988,086 |
8,136,200 |
- |
2005 |
|
|
MARIGOLD SHOPPING CENTER |
15,300,000 |
25,563,978 |
4,183,111 |
15,300,000 |
29,747,089 |
45,047,089 |
14,620,807 |
30,426,282 |
- |
2005 |
|
|
CANYON SQUARE PLAZA |
2,648,112 |
13,876,095 |
978,581 |
2,648,112 |
14,854,676 |
17,502,788 |
2,484,006 |
15,018,782 |
- |
2013 |
|
|
BLACK MOUNTAIN VILLAGE |
4,678,015 |
11,913,344 |
684,763 |
4,678,014 |
12,598,108 |
17,276,122 |
4,228,513 |
13,047,609 |
- |
2007 |
|
|
RANCHO PENASQUITOS TOWNE CTR I |
14,851,595 |
20,342,165 |
304,024 |
14,851,595 |
20,646,189 |
35,497,784 |
1,745,657 |
33,752,127 |
14,384,811 |
2015 |
|
|
RANCHO PENASQUITOS TWN CTR. II |
12,944,972 |
20,323,961 |
177,977 |
12,944,972 |
20,501,938 |
33,446,910 |
1,794,662 |
31,652,248 |
11,038,466 |
2015 |
|
|
CITY HEIGHTS |
10,687,472 |
28,324,896 |
(752,643) |
13,908,563 |
24,351,162 |
38,259,725 |
2,778,412 |
35,481,313 |
- |
2012 |
|
|
TRUCKEE CROSSROADS |
2,140,000 |
8,255,753 |
1,146,729 |
2,140,000 |
9,402,482 |
11,542,482 |
5,382,067 |
6,160,415 |
2,340,536 |
2006 |
|
|
GATEWAY AT DONNER PASS |
4,515,688 |
8,318,667 |
226,813 |
4,515,688 |
8,545,480 |
13,061,168 |
997,166 |
12,064,002 |
2,719,649 |
2015 |
|
|
WESTLAKE SHOPPING CENTER |
16,174,307 |
64,818,562 |
99,467,618 |
16,174,307 |
164,286,180 |
180,460,487 |
48,298,485 |
132,162,002 |
- |
2002 |
|
|
LAKEWOOD VILLAGE |
8,597,100 |
24,374,615 |
(1,241,442) |
11,683,364 |
20,046,909 |
31,730,273 |
2,648,966 |
29,081,307 |
- |
2014 |
|
|
SAVI RANCH |
7,295,646 |
29,752,511 |
126,568 |
7,295,646 |
29,879,079 |
37,174,725 |
4,753,605 |
32,421,120 |
- |
2012 |
|
|
VILLAGE ON THE PARK |
2,194,463 |
8,885,987 |
9,224,144 |
3,018,391 |
17,286,203 |
20,304,594 |
5,791,482 |
14,513,112 |
- |
1998 |
|
|
QUINCY PLACE S.C. |
1,148,317 |
4,608,249 |
1,611,804 |
1,148,318 |
6,220,052 |
7,368,370 |
2,869,681 |
4,498,689 |
- |
1998 |
|
|
EAST BANK S.C. |
1,500,568 |
6,180,103 |
1,873,781 |
1,500,568 |
8,053,884 |
9,554,452 |
3,620,475 |
5,933,977 |
- |
1998 |
|
|
NORTHRIDGE SHOPPING CENTER |
4,932,690 |
16,496,176 |
1,722,954 |
8,934,385 |
14,217,435 |
23,151,820 |
1,758,919 |
21,392,901 |
- |
2013 |
|
|
SPRING CREEK S.C. |
1,423,260 |
5,718,813 |
(1,654,650) |
603,270 |
4,884,153 |
5,487,423 |
3,549,720 |
1,937,703 |
- |
1998 |
|
|
DENVER WEST 38TH STREET |
161,167 |
646,983 |
69 |
161,167 |
647,052 |
808,219 |
313,795 |
494,424 |
- |
1998 |
|
|
ENGLEWOOD PLAZA |
805,837 |
3,232,650 |
442,081 |
805,836 |
3,674,732 |
4,480,568 |
1,798,011 |
2,682,557 |
- |
1998 |
|
|
FORT COLLINS S.C. |
1,253,497 |
7,625,278 |
1,599,607 |
1,253,496 |
9,224,886 |
10,478,382 |
3,647,392 |
6,830,990 |
- |
2000 |
|
|
GREELEY COMMONS |
3,313,095 |
20,069,559 |
104,137 |
3,313,095 |
20,173,696 |
23,486,791 |
3,605,618 |
19,881,173 |
- |
2012 |
|
|
HIGHLANDS RANCH VILLAGE S.C. |
8,135,427 |
21,579,936 |
(659,420) |
5,337,081 |
23,718,862 |
29,055,943 |
3,641,248 |
25,414,695 |
- |
2011 |
|
|
VILLAGE CENTER WEST |
2,010,519 |
8,361,085 |
60,687 |
2,010,520 |
8,421,771 |
10,432,291 |
1,248,737 |
9,183,554 |
5,503,328 |
2011 |
|
|
HIGHLANDS RANCH II |
3,514,837 |
11,755,916 |
204,961 |
3,514,837 |
11,960,877 |
15,475,714 |
2,272,093 |
13,203,621 |
- |
2013 |
|
|
HIGHLANDS RANCH PARCEL |
1,140,000 |
2,660,000 |
64,239 |
1,140,000 |
2,724,239 |
3,864,239 |
120,726 |
3,743,513 |
- |
2014 |
|
|
HERITAGE WEST S.C. |
1,526,576 |
6,124,074 |
1,126,064 |
1,526,576 |
7,250,138 |
8,776,714 |
3,320,154 |
5,456,560 |
- |
1998 |
|
|
MARKET AT SOUTHPARK |
9,782,769 |
20,779,522 |
264,140 |
9,782,769 |
21,043,662 |
30,826,431 |
3,881,881 |
26,944,550 |
- |
2011 |
|
|
NEWTOWN S.C. |
- |
15,635,442 |
- |
- |
15,635,442 |
15,635,442 |
1,421,090 |
14,214,352 |
8,502,201 |
2014 |
|
|
WEST FARM SHOPPING CENTER |
5,805,969 |
23,348,024 |
14,403,752 |
7,585,116 |
35,972,629 |
43,557,745 |
13,063,627 |
30,494,118 |
- |
1998 |
|
|
HAMDEN MART |
13,668,167 |
40,890,166 |
- |
13,668,167 |
40,890,166 |
54,558,333 |
221,050 |
54,337,283 |
22,404,073 |
2016 |
|
|
HOME DEPOT PLAZA |
7,704,968 |
30,797,640 |
2,712,557 |
7,704,968 |
33,510,197 |
41,215,165 |
13,564,341 |
27,650,824 |
- |
1998 |
|
|
WILTON RIVER PARK SHOPPING CTR |
7,154,585 |
27,509,279 |
(224,537) |
7,154,585 |
27,284,742 |
34,439,327 |
3,581,639 |
30,857,688 |
- |
2012 |
|
|
BRIGHT HORIZONS |
1,211,748 |
4,610,610 |
9,499 |
1,211,748 |
4,620,109 |
5,831,857 |
684,714 |
5,147,143 |
- |
2012 |
|
|
WILTON CAMPUS |
10,168,872 |
31,893,016 |
254,233 |
10,168,872 |
32,147,249 |
42,316,121 |
6,500,963 |
35,815,158 |
- |
2013 |
|
|
CAMDEN SQUARE |
122,741 |
66,738 |
4,309,722 |
3,024,375 |
1,474,826 |
4,499,201 |
155,208 |
4,343,993 |
- |
2003 |
|
|
PROMENADE AT CHRISTIANA |
14,371,686 |
- |
11,148,877 |
25,520,563 |
- |
25,520,563 |
- |
25,520,563 |
- |
2014 |
|
|
BRANDYWINE COMMONS |
- |
36,057,487 |
(505,731) |
- |
35,551,756 |
35,551,756 |
3,276,507 |
32,275,249 |
- |
2014 |
|
|
CAMINO SQUARE |
573,875 |
2,295,501 |
2,665,024 |
733,875 |
4,800,525 |
5,534,400 |
3,636,784 |
1,897,616 |
- |
1992 |
|
|
BONITA GRANDE CROSSINGS |
3,370,941 |
8,179,481 |
52,500 |
3,370,941 |
8,231,981 |
11,602,922 |
668,033 |
10,934,889 |
- |
2015 |
|
|
HOLLYWOOD VIDEO BONITA GRANDE |
341,958 |
771,935 |
- |
341,958 |
771,935 |
1,113,893 |
68,673 |
1,045,220 |
- |
2015 |
|
|
CORAL SQUARE PROMENADE |
710,000 |
2,842,907 |
3,993,496 |
710,000 |
6,836,403 |
7,546,403 |
3,565,857 |
3,980,546 |
- |
1994 |
|
|
MAPLEWOOD PLAZA |
1,649,000 |
6,626,301 |
1,161,119 |
1,649,000 |
7,787,420 |
9,436,420 |
3,541,619 |
5,894,801 |
- |
1997 |
|
|
CURLEW CROSSING SHOPPING CTR |
5,315,955 |
12,529,467 |
2,107,472 |
5,315,954 |
14,636,940 |
19,952,894 |
5,461,751 |
14,491,143 |
- |
2005 |
|
|
SHOPS AT SANTA BARBARA PHASE 1 |
743,463 |
5,373,994 |
- |
743,463 |
5,373,994 |
6,117,457 |
462,609 |
5,654,848 |
- |
2015 |
|
|
SHOPS AT SANTA BARBARA PHASE 2 |
331,692 |
2,488,832 |
- |
331,692 |
2,488,832 |
2,820,524 |
200,524 |
2,620,000 |
- |
2015 |
|
|
SHOPS AT SANTA BARBARA PHASE 3 |
329,726 |
2,358,700 |
(12,082) |
329,726 |
2,346,618 |
2,676,344 |
217,112 |
2,459,232 |
- |
2015 |
|
|
CORAL POINTE S.C. |
2,411,608 |
20,507,735 |
(25,164) |
2,411,608 |
20,482,571 |
22,894,179 |
1,580,664 |
21,313,515 |
- |
2015 |
|
|
PUBLIX AT ADDISON |
3,211,156 |
6,747,895 |
- |
3,211,156 |
6,747,895 |
9,959,051 |
350,697 |
9,608,354 |
- |
2015 |
|
|
ADDISON CENTER PROF.BUILDING |
802,789 |
1,310,012 |
(45,779) |
802,789 |
1,264,233 |
2,067,022 |
75,322 |
1,991,700 |
- |
2015 |
|
|
DANIA POINTE |
105,113,024 |
- |
2,000,000 |
107,113,024 |
- |
107,113,024 |
- |
107,113,024 |
- |
2016 |
|
|
FT.LAUDERDALE/CYPRESS CREEK |
14,258,760 |
28,042,390 |
2,415,038 |
14,258,760 |
30,457,428 |
44,716,188 |
9,171,140 |
35,545,048 |
- |
2009 |
|
|
HOMESTEAD-WACHTEL LAND LEASE |
150,000 |
- |
- |
150,000 |
- |
150,000 |
- |
150,000 |
- |
2013 |
|
|
OAKWOOD PLAZA NORTH |
35,300,961 |
141,731,019 |
- |
35,300,961 |
141,731,019 |
177,031,980 |
4,333,815 |
172,698,165 |
100,000,000 |
2016 |
|
|
OAKWOOD PLAZA SOUTH |
11,126,610 |
40,592,103 |
- |
11,126,610 |
40,592,103 |
51,718,713 |
1,487,871 |
50,230,842 |
- |
2016 |
|
|
OAKWOOD BUSINESS CTR-BLDG 1 |
6,792,500 |
18,662,565 |
3,027,668 |
6,792,500 |
21,690,233 |
28,482,733 |
5,592,134 |
22,890,599 |
- |
2009 |
|
|
AMELIA CONCOURSE |
7,600,000 |
- |
2,508,435 |
676,791 |
9,431,644 |
10,108,435 |
2,819,327 |
7,289,108 |
- |
2003 |
|
|
KIMCO AVENUES WALK, LLC |
26,984,546 |
- |
47,260,955 |
29,784,056 |
44,461,445 |
74,245,501 |
63,344 |
74,182,157 |
- |
2005 |
|
|
DUVAL STATION S.C. |
1,807,792 |
11,863,692 |
114,840 |
1,807,792 |
11,978,532 |
13,786,324 |
828,285 |
12,958,039 |
- |
2015 |
|
|
RIVERPLACE SHOPPING CTR. |
7,503,282 |
31,011,027 |
1,375,379 |
7,200,050 |
32,689,638 |
39,889,688 |
8,655,946 |
31,233,742 |
- |
2010 |
|
|
MERCHANTS WALK |
2,580,816 |
10,366,090 |
6,496,524 |
2,580,816 |
16,862,614 |
19,443,430 |
7,283,589 |
12,159,841 |
- |
2001 |
|
|
WAL-MART PLAZA |
293,686 |
792,119 |
1,726,636 |
293,686 |
2,518,755 |
2,812,441 |
2,210,865 |
601,576 |
- |
1968 |
|
|
LEESBURG SHOPS |
- |
171,636 |
193,651 |
- |
365,287 |
365,287 |
365,287 |
- |
- |
1969 |
|
|
TRI-CITY PLAZA |
2,832,296 |
11,329,185 |
19,606,325 |
2,832,296 |
30,935,510 |
33,767,806 |
2,730,210 |
31,037,596 |
- |
1992 |
|
|
FT LAUDERDALE #1, FL |
1,002,733 |
2,602,415 |
12,831,516 |
1,774,443 |
14,662,221 |
16,436,664 |
9,613,856 |
6,822,808 |
- |
1974 |
|
|
LAKE WALES S.C. |
601,052 |
- |
- |
601,052 |
- |
601,052 |
- |
601,052 |
- |
2009 |
|
|
NASA PLAZA |
- |
1,754,000 |
2,653,265 |
- |
4,407,265 |
4,407,265 |
3,243,997 |
1,163,268 |
- |
1968 |
|
|
GROVE GATE S.C. |
365,893 |
1,049,172 |
1,207,100 |
365,893 |
2,256,272 |
2,622,165 |
1,959,640 |
662,525 |
- |
1968 |
|
|
CHEVRON OUTPARCEL |
530,570 |
1,253,410 |
- |
530,570 |
1,253,410 |
1,783,980 |
334,762 |
1,449,218 |
- |
2010 |
|
|
IVES DAIRY CROSSING |
732,914 |
4,080,460 |
11,065,138 |
732,914 |
15,145,598 |
15,878,512 |
9,101,199 |
6,777,313 |
- |
1985 |
|
|
MILLER ROAD S.C. |
1,138,082 |
4,552,327 |
4,535,416 |
1,138,082 |
9,087,743 |
10,225,825 |
5,760,824 |
4,465,001 |
- |
1986 |
|
|
TRI-CITIES SHOPPING PLAZA |
1,011,000 |
4,062,890 |
3,190,909 |
1,011,000 |
7,253,799 |
8,264,799 |
596,772 |
7,668,027 |
- |
1997 |
|
|
KENDALE LAKES PLAZA |
18,491,461 |
28,496,001 |
(2,055,786) |
15,362,227 |
29,569,449 |
44,931,676 |
6,605,625 |
38,326,051 |
- |
2009 |
|
|
PLANTATION CROSSING |
7,524,800 |
- |
(5,003,280) |
2,008,617 |
512,903 |
2,521,520 |
91,054 |
2,430,466 |
- |
2005 |
|
|
CENTRE OF MERRITT |
1,806,275 |
9,592,435 |
- |
1,806,275 |
9,592,435 |
11,398,710 |
623,343 |
10,775,367 |
- |
2015 |
|
|
MILLER WEST PLAZA |
6,725,660 |
10,661,420 |
- |
6,725,660 |
10,661,420 |
17,387,080 |
774,598 |
16,612,482 |
- |
2015 |
|
|
CORSICA SQUARE S.C. |
7,225,100 |
10,757,386 |
112,000 |
7,225,100 |
10,869,386 |
18,094,486 |
918,110 |
17,176,376 |
10,840,743 |
2015 |
|
|
MILTON, FL |
1,275,593 |
- |
- |
1,275,593 |
- |
1,275,593 |
- |
1,275,593 |
- |
2007 |
|
|
FLAGLER PARK |
26,162,980 |
80,737,041 |
3,482,952 |
26,725,480 |
83,657,493 |
110,382,973 |
20,442,791 |
89,940,182 |
- |
2007 |
|
|
PARK HILL PLAZA |
10,763,612 |
19,264,248 |
187,262 |
10,763,612 |
19,451,510 |
30,215,122 |
3,784,223 |
26,430,899 |
- |
2011 |
|
|
WINN DIXIE-MIAMI |
2,989,640 |
9,410,360 |
(51,872) |
3,544,297 |
8,803,831 |
12,348,128 |
677,157 |
11,670,971 |
- |
2013 |
|
|
MARATHON SHOPPING CENTER |
2,412,929 |
8,069,450 |
1,013,493 |
1,514,731 |
9,981,141 |
11,495,872 |
1,112,710 |
10,383,162 |
- |
2013 |
|
|
SODO S.C. |
- |
68,139,271 |
8,283,273 |
142,195 |
76,280,349 |
76,422,544 |
16,306,907 |
60,115,637 |
- |
2008 |
|
|
RENAISSANCE CENTER |
9,104,379 |
36,540,873 |
14,913,118 |
9,122,758 |
51,435,612 |
60,558,370 |
17,171,361 |
43,387,009 |
- |
1998 |
|
|
MILLENIA PLAZA PHASE II |
7,711,000 |
20,702,992 |
1,650,193 |
7,698,200 |
22,365,985 |
30,064,185 |
7,880,425 |
22,183,760 |
- |
2009 |
|
|
RIVERSIDE LANDINGS S.C. |
3,512,202 |
14,439,668 |
96,924 |
3,512,202 |
14,536,592 |
18,048,794 |
1,012,519 |
17,036,275 |
- |
2015 |
|
|
GRAND OAKS VILLAGE |
7,409,319 |
19,653,869 |
(627,365) |
5,846,339 |
20,589,484 |
26,435,823 |
3,451,536 |
22,984,287 |
- |
2011 |
|
|
LOWES S.C. |
1,620,203 |
- |
40,689 |
954,876 |
706,016 |
1,660,892 |
125,514 |
1,535,378 |
- |
2007 |
|
|
POMPANO POINTE S.C. |
10,516,500 |
10,469,592 |
530,900 |
10,516,500 |
11,000,492 |
21,516,992 |
456,268 |
21,060,724 |
- |
2012 |
|
|
UNIVERSITY TOWN CENTER |
5,515,265 |
13,041,400 |
426,693 |
5,515,265 |
13,468,093 |
18,983,358 |
2,378,907 |
16,604,451 |
- |
2011 |
|
|
PALM BEACH GARDENS |
2,764,953 |
11,059,812 |
668,875 |
2,764,953 |
11,728,687 |
14,493,640 |
1,551,717 |
12,941,923 |
- |
2009 |
|
|
OAK TREE PLAZA |
- |
917,360 |
1,562,941 |
- |
2,480,301 |
2,480,301 |
1,264,152 |
1,216,149 |
- |
1968 |
|
|
TUTTLEBEE PLAZA |
254,961 |
828,465 |
2,142,270 |
254,961 |
2,970,735 |
3,225,696 |
2,193,861 |
1,031,835 |
- |
2008 |
|
|
SOUTH MIAMI S.C. |
1,280,440 |
5,133,825 |
3,121,059 |
1,280,440 |
8,254,884 |
9,535,324 |
4,254,038 |
5,281,286 |
- |
1995 |
|
|
CARROLLWOOD COMMONS |
5,220,445 |
16,884,228 |
2,339,166 |
5,220,445 |
19,223,394 |
24,443,839 |
8,996,615 |
15,447,224 |
- |
1997 |
|
|
VILLAGE COMMONS SHOPPING CENT. |
2,192,331 |
8,774,158 |
2,760,666 |
2,192,331 |
11,534,824 |
13,727,155 |
5,417,404 |
8,309,751 |
- |
1998 |
|
|
MISSION BELL SHOPPING CENTER |
5,056,426 |
11,843,119 |
8,634,466 |
5,067,033 |
20,466,978 |
25,534,011 |
6,509,898 |
19,024,113 |
- |
2004 |
|
|
VILLAGE COMMONS S.C. |
2,026,423 |
5,106,476 |
1,923,704 |
2,026,423 |
7,030,180 |
9,056,603 |
1,236,632 |
7,819,971 |
- |
2013 |
|
|
BELMART PLAZA |
1,656,097 |
3,394,420 |
5,585,602 |
1,656,097 |
8,980,022 |
10,636,119 |
403,154 |
10,232,965 |
- |
2014 |
|
|
AUGUSTA SQUARE |
1,482,564 |
5,928,122 |
2,007,334 |
1,482,564 |
7,935,456 |
9,418,020 |
4,260,861 |
5,157,159 |
- |
1995 |
|
|
MARKET AT HAYNES BRIDGE |
4,880,659 |
21,549,424 |
1,238,043 |
4,889,863 |
22,778,263 |
27,668,126 |
6,751,969 |
20,916,157 |
- |
2008 |
|
|
EMBRY VILLAGE |
18,147,054 |
33,009,514 |
908,584 |
18,160,525 |
33,904,627 |
52,065,152 |
17,260,605 |
34,804,547 |
- |
2008 |
|
|
PERIMETER EXPO PROPERTY |
14,770,275 |
44,295,457 |
- |
14,770,275 |
44,295,457 |
59,065,732 |
477,748 |
58,587,984 |
40,983,821 |
2016 |
|
|
RIVERWALK MARKETPLACE |
3,512,202 |
18,862,571 |
- |
3,512,202 |
18,862,571 |
22,374,773 |
995,324 |
21,379,449 |
- |
2015 |
|
|
VILLAGE SHOPPES-FLOWERY BRANCH |
4,444,148 |
10,510,657 |
303,983 |
4,444,148 |
10,814,640 |
15,258,788 |
2,395,174 |
12,863,614 |
- |
2011 |
|
|
LAWRENCEVILLE MARKET |
8,878,266 |
29,691,191 |
(44,182) |
9,060,436 |
29,464,839 |
38,525,275 |
4,125,715 |
34,399,560 |
- |
2013 |
|
|
FIVE FORKS CROSSING |
2,363,848 |
7,906,257 |
372,465 |
2,363,848 |
8,278,722 |
10,642,570 |
1,646,665 |
8,995,905 |
- |
2013 |
|
|
BRAELINN VILLAGE |
7,314,719 |
20,738,792 |
1,149,049 |
6,342,926 |
22,859,634 |
29,202,560 |
2,185,264 |
27,017,296 |
- |
2014 |
|
|
SAVANNAH CENTER |
2,052,270 |
8,232,978 |
3,599,399 |
2,052,270 |
11,832,377 |
13,884,647 |
6,520,291 |
7,364,356 |
- |
1993 |
|
|
CHATHAM PLAZA |
13,390,238 |
35,115,882 |
2,092,634 |
13,403,262 |
37,195,492 |
50,598,754 |
12,496,124 |
38,102,630 |
- |
2008 |
|
|
CLIVE PLAZA |
500,525 |
2,002,101 |
- |
500,525 |
2,002,101 |
2,502,626 |
1,073,777 |
1,428,849 |
- |
1996 |
|
|
DUBUQUE CENTER |
- |
2,152,476 |
239,217 |
- |
2,391,693 |
2,391,693 |
1,516,782 |
874,911 |
- |
1997 |
|
|
TREASURE VALLEY |
6,501,240 |
- |
(4,284,637) |
1,110,530 |
1,106,073 |
2,216,603 |
127,733 |
2,088,870 |
- |
2005 |
|
|
BLOOMINGTON COMMONS |
805,521 |
2,222,353 |
4,494,864 |
805,521 |
6,717,217 |
7,522,738 |
4,816,390 |
2,706,348 |
- |
1972 |
|
|
87TH STREET CENTER |
- |
2,687,046 |
8,092,727 |
6,992,648 |
3,787,125 |
10,779,773 |
2,284,313 |
8,495,460 |
- |
1997 |
|
|
ELSTON CHICAGO |
1,010,374 |
5,692,212 |
498,828 |
1,010,374 |
6,191,040 |
7,201,414 |
2,763,188 |
4,438,226 |
- |
1997 |
|
|
DOWNERS PARK PLAZA |
2,510,455 |
10,164,494 |
1,967,032 |
2,510,455 |
12,131,526 |
14,641,981 |
5,418,098 |
9,223,883 |
- |
1999 |
|
|
DOWNERS PARK PLAZA |
811,778 |
4,322,956 |
3,348,460 |
811,778 |
7,671,416 |
8,483,194 |
3,600,499 |
4,882,695 |
- |
1997 |
|
|
TOWN & COUNTRY S.C. |
842,555 |
2,108,674 |
2,767,311 |
500,927 |
5,217,613 |
5,718,540 |
3,320,591 |
2,397,949 |
- |
1972 |
|
|
FAIRVIEW CITY CENTRE |
- |
11,866,880 |
12,943,654 |
1,900,000 |
22,910,534 |
24,810,534 |
1,853,323 |
22,957,211 |
- |
1998 |
|
|
SHOPS AT KILDEER |
5,259,542 |
28,141,501 |
2,486,761 |
5,259,542 |
30,628,262 |
35,887,804 |
4,422,498 |
31,465,306 |
- |
2013 |
|
|
MOUNT PROSPECT CENTER |
1,017,345 |
6,572,176 |
4,047,329 |
1,017,345 |
10,619,505 |
11,636,850 |
5,762,647 |
5,874,203 |
- |
1997 |
|
|
MUNDELEIN SHOPPING CENTER |
1,127,720 |
5,826,129 |
136,968 |
1,129,634 |
5,961,183 |
7,090,817 |
2,800,456 |
4,290,361 |
- |
1998 |
|
|
MARKETPLACE OF OAKLAWN |
- |
678,668 |
108,483 |
- |
787,151 |
787,151 |
714,718 |
72,433 |
- |
1998 |
|
|
OAK LAWN CENTER |
1,530,111 |
8,776,631 |
666,590 |
1,530,111 |
9,443,221 |
10,973,332 |
4,656,435 |
6,316,897 |
- |
1997 |
|
|
22ND STREET PLAZA |
1,527,188 |
8,679,108 |
4,081,004 |
1,527,188 |
12,760,112 |
14,287,300 |
5,611,968 |
8,675,332 |
- |
1997 |
|
|
ROCKFORD CROSSINGS |
4,575,990 |
11,654,022 |
(2,628,093) |
3,816,080 |
9,785,839 |
13,601,919 |
3,208,253 |
10,393,666 |
- |
2008 |
|
|
SKOKIE POINTE |
- |
2,276,360 |
9,487,443 |
2,628,440 |
9,135,363 |
11,763,803 |
3,686,787 |
8,077,016 |
- |
1997 |
|
|
HAWTHORN HILLS SQUARE |
6,783,928 |
33,033,624 |
4,028,883 |
6,783,928 |
37,062,507 |
43,846,435 |
6,266,665 |
37,579,770 |
19,375,231 |
2012 |
|
|
WOODGROVE FESTIVAL |
5,049,149 |
20,822,993 |
5,130,768 |
4,805,866 |
26,197,044 |
31,002,910 |
12,562,704 |
18,440,206 |
- |
1998 |
|
|
GROVE PARCEL |
907,291 |
2,240,810 |
- |
907,291 |
2,240,810 |
3,148,101 |
216,402 |
2,931,699 |
- |
2016 |
|
|
WOODRIDGE PAD |
702,757 |
1,746,223 |
- |
702,757 |
1,746,223 |
2,448,980 |
81,704 |
2,367,276 |
- |
2016 |
|
|
GREENWOOD S.C. |
423,371 |
1,883,421 |
10,388,475 |
1,801,822 |
10,893,445 |
12,695,267 |
4,145,861 |
8,549,406 |
- |
1970 |
|
|
SOUTH PARK S.C. |
1,675,031 |
6,848,209 |
6,362,777 |
1,551,079 |
13,334,938 |
14,886,017 |
7,913,763 |
6,972,254 |
- |
1993 |
|
|
CENTRE AT WESTBANK |
9,554,230 |
24,401,082 |
1,070,226 |
9,329,880 |
25,695,658 |
35,025,538 |
8,296,073 |
26,729,465 |
18,533,743 |
2008 |
|
|
AMBASSADOR PLAZA |
1,803,672 |
4,260,966 |
251,561 |
1,796,972 |
4,519,227 |
6,316,199 |
1,186,224 |
5,129,975 |
4,374,638 |
2010 |
|
|
EAST SIDE PLAZA |
3,295,799 |
7,785,942 |
180,773 |
3,295,635 |
7,966,879 |
11,262,514 |
2,197,127 |
9,065,387 |
- |
2010 |
|
|
ABINGTON PLAZA |
10,457,183 |
494,652 |
- |
10,457,183 |
494,652 |
10,951,835 |
89,429 |
10,862,406 |
4,387,721 |
2014 |
|
|
WASHINGTON ST.PLAZA |
11,007,593 |
5,652,368 |
8,851,085 |
12,957,593 |
12,553,453 |
25,511,046 |
878,925 |
24,632,121 |
5,914,448 |
2014 |
|
|
MEMORIAL PLAZA |
16,411,388 |
27,553,908 |
323,380 |
16,411,388 |
27,877,288 |
44,288,676 |
2,467,356 |
41,821,320 |
16,309,360 |
2014 |
|
|
MAIN ST. PLAZA |
555,898 |
2,139,494 |
- |
555,898 |
2,139,494 |
2,695,392 |
215,377 |
2,480,015 |
1,375,084 |
2014 |
|
|
MORRISSEY PLAZA |
4,097,251 |
3,751,068 |
- |
4,097,251 |
3,751,068 |
7,848,319 |
505,455 |
7,342,864 |
3,150,546 |
2014 |
|
|
GLENDALE SQUARE |
4,698,891 |
7,141,090 |
133,070 |
4,698,891 |
7,274,160 |
11,973,051 |
920,547 |
11,052,504 |
5,647,196 |
2014 |
|
|
FALMOUTH PLAZA |
2,361,071 |
13,065,817 |
334,684 |
2,361,071 |
13,400,501 |
15,761,572 |
1,276,155 |
14,485,417 |
7,946,761 |
2014 |
|
|
WAVERLY PLAZA |
1,215,005 |
3,622,911 |
5,426 |
1,203,205 |
3,640,137 |
4,843,342 |
443,908 |
4,399,434 |
2,317,720 |
2014 |
|
|
BARRINGTON PLAZA S.C. |
642,170 |
2,547,830 |
7,667,513 |
751,124 |
10,106,389 |
10,857,513 |
4,923,540 |
5,933,973 |
- |
1994 |
|
|
FESTIVAL OF HYANNIS S.C. |
15,038,197 |
40,682,853 |
948,247 |
15,038,197 |
41,631,100 |
56,669,297 |
5,524,945 |
51,144,352 |
- |
2014 |
|
|
FELLSWAY PLAZA |
5,300,388 |
11,013,543 |
92,558 |
5,300,388 |
11,106,101 |
16,406,489 |
1,145,971 |
15,260,518 |
6,742,131 |
2014 |
|
|
DEL ALBA PLAZA |
3,163,033 |
8,967,874 |
19,995 |
3,163,033 |
8,987,869 |
12,150,902 |
665,099 |
11,485,803 |
7,942,609 |
2014 |
|
|
NORTH QUINCY PLAZA |
6,332,542 |
17,954,110 |
(782,383) |
3,894,436 |
19,609,833 |
23,504,269 |
1,591,805 |
21,912,464 |
- |
2014 |
|
|
ADAMS PLAZA |
2,089,363 |
3,226,648 |
248,359 |
2,089,363 |
3,475,007 |
5,564,370 |
307,934 |
5,256,436 |
1,870,765 |
2014 |
|
|
BROADWAY PLAZA |
6,485,065 |
343,422 |
- |
6,485,065 |
343,422 |
6,828,487 |
67,420 |
6,761,067 |
2,870,966 |
2014 |
|
|
SHREWSBURY S.C. |
1,284,168 |
5,284,853 |
5,466,855 |
1,284,168 |
10,751,708 |
12,035,876 |
4,277,257 |
7,758,619 |
- |
2000 |
|
|
VINNIN SQUARE PLAZA |
5,545,425 |
16,324,060 |
(214,252) |
5,545,425 |
16,109,808 |
21,655,233 |
2,032,293 |
19,622,940 |
9,173,706 |
2014 |
|
|
PARADISE PLAZA |
4,183,038 |
12,194,885 |
536,224 |
4,183,038 |
12,731,109 |
16,914,147 |
1,470,800 |
15,443,347 |
8,865,650 |
2014 |
|
|
BELMONT PLAZA |
11,104,983 |
848,844 |
- |
11,104,983 |
848,844 |
11,953,827 |
112,244 |
11,841,583 |
5,237,954 |
2014 |
|
|
VINNIN SQUARE IN-LINE |
582,228 |
2,094,560 |
(109,616) |
582,228 |
1,984,944 |
2,567,172 |
196,341 |
2,370,831 |
- |
2014 |
|
|
LINDEN PLAZA |
4,628,215 |
3,535,431 |
437,334 |
4,628,215 |
3,972,765 |
8,600,980 |
555,369 |
8,045,611 |
3,527,131 |
2014 |
|
|
NORTH AVE. PLAZA |
1,163,875 |
1,194,673 |
15,933 |
1,163,875 |
1,210,606 |
2,374,481 |
149,740 |
2,224,741 |
897,489 |
2014 |
|
|
WASHINGTON ST. S.C. |
7,380,918 |
9,987,119 |
391,907 |
7,380,918 |
10,379,026 |
17,759,944 |
887,059 |
16,872,885 |
6,286,514 |
2014 |
|
|
MILL ST. PLAZA |
4,195,024 |
6,203,410 |
205,071 |
4,195,024 |
6,408,481 |
10,603,505 |
821,636 |
9,781,869 |
4,110,675 |
2014 |
|
|
FULLERTON PLAZA |
14,237,901 |
6,743,980 |
(352,777) |
14,237,901 |
6,391,203 |
20,629,104 |
855,593 |
19,773,511 |
12,551,399 |
2014 |
|
|
GREENBRIER S.C. |
8,891,468 |
30,304,760 |
(48,812) |
8,891,468 |
30,255,948 |
39,147,416 |
2,842,793 |
36,304,623 |
12,488,817 |
2014 |
|
|
INGLESIDE S.C. |
10,416,726 |
17,889,235 |
(156,601) |
10,416,726 |
17,732,634 |
28,149,360 |
2,186,844 |
25,962,516 |
19,320,814 |
2014 |
|
|
ROLLING ROAD PLAZA |
2,510,395 |
11,930,217 |
(82,994) |
2,508,715 |
11,848,903 |
14,357,618 |
904,646 |
13,452,972 |
- |
2015 |
|
|
SECURITY SQUARE SHOPPING CTR. |
5,342,463 |
15,147,024 |
(3,355,446) |
4,572,639 |
12,561,402 |
17,134,041 |
1,269,556 |
15,864,485 |
16,221,870 |
2014 |
|
|
WILKENS BELTWAY PLAZA |
9,948,235 |
22,125,942 |
147,794 |
9,948,235 |
22,273,736 |
32,221,971 |
2,730,525 |
29,491,446 |
- |
2014 |
|
|
YORK ROAD PLAZA |
4,276,715 |
37,205,757 |
29,473 |
4,276,715 |
37,235,230 |
41,511,945 |
3,247,427 |
38,264,518 |
- |
2014 |
|
|
PUTTY HILL PLAZA |
4,192,152 |
11,112,111 |
456,319 |
4,192,152 |
11,568,430 |
15,760,582 |
2,153,516 |
13,607,066 |
- |
2013 |
|
|
SNOWDEN SQUARE S.C. |
1,929,402 |
4,557,934 |
5,155,349 |
3,326,422 |
8,316,263 |
11,642,685 |
1,213,234 |
10,429,451 |
- |
2012 |
|
|
COLUMBIA CROSSING |
3,612,550 |
34,344,509 |
159,554 |
3,612,550 |
34,504,063 |
38,116,613 |
2,323,495 |
35,793,118 |
- |
2015 |
|
|
DORSEY'S SEARCH VILLAGE CENTER |
6,321,963 |
27,996,087 |
(33,532) |
6,321,963 |
27,962,555 |
34,284,518 |
1,673,230 |
32,611,288 |
- |
2015 |
|
|
HICKORY RIDGE |
7,183,646 |
26,947,776 |
469,483 |
7,183,646 |
27,417,259 |
34,600,905 |
2,333,408 |
32,267,497 |
- |
2015 |
|
|
HICKORY RIDGE (SUNOCO) |
543,197 |
2,122,234 |
- |
543,197 |
2,122,234 |
2,665,431 |
174,802 |
2,490,629 |
- |
2015 |
|
|
KINGS CONTRIVANCE |
9,308,349 |
31,759,940 |
289,751 |
9,308,349 |
32,049,691 |
41,358,040 |
2,880,736 |
38,477,304 |
23,036,820 |
2014 |
|
|
HARPER'S CHOICE |
8,429,284 |
18,373,994 |
246,478 |
8,429,284 |
18,620,472 |
27,049,756 |
1,475,298 |
25,574,458 |
- |
2015 |
|
|
WILDE LAKE |
1,468,038 |
5,869,862 |
22,579,270 |
2,577,073 |
27,340,097 |
29,917,170 |
8,351,586 |
21,565,584 |
- |
2002 |
|
|
RIVERHILL VILLAGE CENTER |
16,825,496 |
23,282,222 |
156,233 |
16,825,496 |
23,438,455 |
40,263,951 |
2,955,172 |
37,308,779 |
22,686,843 |
2014 |
|
|
OLD BRANCH PLAZA |
39,779 |
130,716 |
2,026,165 |
121,747 |
2,074,913 |
2,196,660 |
246,706 |
1,949,954 |
- |
2003 |
|
|
COLUMBIA CROSSING OUTPARCELS |
1,279,200 |
2,870,800 |
13,977,613 |
4,597,200 |
13,530,413 |
18,127,613 |
1,993,683 |
16,133,930 |
- |
2011 |
|
|
COLUMBIA CROSSING II SHOP.CTR. |
3,137,628 |
19,868,075 |
2,625,989 |
3,137,628 |
22,494,064 |
25,631,692 |
3,667,910 |
21,963,782 |
- |
2013 |
|
|
SHOPS AT DISTRICT HEIGHTS |
8,165,638 |
21,970,661 |
(1,396,775) |
7,298,215 |
21,441,309 |
28,739,524 |
754,538 |
27,984,986 |
14,005,190 |
2015 |
|
|
ENCHANTED FOREST S.C. |
20,123,946 |
34,345,102 |
145,118 |
20,123,946 |
34,490,220 |
54,614,166 |
4,157,739 |
50,456,427 |
- |
2014 |
|
|
SHOPPES AT EASTON |
6,523,713 |
16,402,204 |
93,697 |
6,523,713 |
16,495,901 |
23,019,614 |
1,549,799 |
21,469,815 |
- |
2014 |
|
|
VILLAGES AT URBANA |
3,190,074 |
6,067 |
13,493,944 |
4,828,774 |
11,861,311 |
16,690,085 |
1,531,750 |
15,158,335 |
- |
2003 |
|
|
GAITHERSBURG S.C. |
244,890 |
6,787,534 |
384,231 |
244,890 |
7,171,765 |
7,416,655 |
3,110,363 |
4,306,292 |
- |
1999 |
|
|
KENTLANDS MARKET SQUARE |
20,167,048 |
84,615,052 |
- |
20,167,048 |
84,615,052 |
104,782,100 |
1,569,436 |
103,212,664 |
34,521,793 |
2016 |
|
|
SHAWAN PLAZA |
4,466,000 |
20,222,367 |
(1,451,885) |
4,466,000 |
18,770,482 |
23,236,482 |
10,346,400 |
12,890,082 |
4,270,079 |
2008 |
|
|
LAUREL PLAZA |
349,562 |
1,398,250 |
3,704,961 |
1,571,288 |
3,881,485 |
5,452,773 |
1,731,567 |
3,721,206 |
- |
1995 |
|
|
LAUREL PLAZA |
274,580 |
1,100,968 |
173,969 |
274,580 |
1,274,937 |
1,549,517 |
1,156,349 |
393,168 |
- |
1972 |
|
|
NORTH EAST STATION |
8,219,613 |
9,536,990 |
(4,446,037) |
5,593,160 |
7,717,406 |
13,310,566 |
1,127,040 |
12,183,526 |
8,276,083 |
2014 |
|
|
OWINGS MILLS THEATER/RSTRNTS |
23,378,543 |
1,089,760 |
16,500,314 |
39,856,836 |
1,111,781 |
40,968,617 |
67,754 |
40,900,863 |
- |
2015 |
|
|
CENTRE COURT-RETAIL/BANK |
1,035,359 |
7,785,830 |
(76,204) |
1,035,359 |
7,709,626 |
8,744,985 |
1,175,696 |
7,569,289 |
1,907,905 |
2011 |
|
|
CENTRE COURT-GIANT |
3,854,099 |
12,769,628 |
- |
3,854,099 |
12,769,628 |
16,623,727 |
2,045,590 |
14,578,137 |
6,208,957 |
2011 |
|
|
CENTRE COURT-OLD COURT/COURTYD |
2,279,177 |
5,284,577 |
(177) |
2,279,177 |
5,284,400 |
7,563,577 |
913,182 |
6,650,395 |
- |
2011 |
|
|
RADCLIFFE CENTER |
12,042,713 |
21,187,946 |
- |
12,042,713 |
21,187,946 |
33,230,659 |
2,067,536 |
31,163,123 |
- |
2014 |
|
|
TIMONIUM CROSSING |
2,525,377 |
14,862,817 |
339,960 |
2,525,377 |
15,202,777 |
17,728,154 |
1,626,614 |
16,101,540 |
14,623,506 |
2014 |
|
|
TIMONIUM SQUARE |
6,000,000 |
24,282,998 |
14,483,175 |
7,331,195 |
37,434,978 |
44,766,173 |
15,649,683 |
29,116,490 |
- |
2003 |
|
|
TOWSON PLACE |
43,886,876 |
101,764,931 |
613,012 |
43,270,792 |
102,994,027 |
146,264,819 |
16,147,159 |
130,117,660 |
- |
2012 |
|
|
MALLSIDE PLAZA |
6,930,996 |
18,148,727 |
(1,781,449) |
5,956,485 |
17,341,789 |
23,298,274 |
6,672,789 |
16,625,485 |
- |
2008 |
|
|
WHITE LAKE COMMONS |
2,300,050 |
9,249,607 |
3,264,058 |
2,300,050 |
12,513,665 |
14,813,715 |
6,292,985 |
8,520,730 |
- |
1996 |
|
|
DOWNTOWN FARMINGTON CENTER |
1,098,426 |
4,525,723 |
4,277,242 |
1,098,426 |
8,802,965 |
9,901,391 |
3,010,957 |
6,890,434 |
- |
1993 |
|
|
FLINT - VACANT LAND |
101,424 |
- |
- |
101,424 |
- |
101,424 |
- |
101,424 |
- |
2012 |
|
|
CENTURY PLAZA |
178,785 |
925,818 |
1,224,093 |
178,785 |
2,149,911 |
2,328,696 |
1,593,653 |
735,043 |
- |
1968 |
|
|
CROSS CREEK S.C. |
1,451,397 |
5,806,263 |
647,769 |
1,451,397 |
6,454,032 |
7,905,429 |
3,662,287 |
4,243,142 |
- |
1993 |
|
|
GREEN ORCHARD SHOPPING CENTER |
3,682,478 |
14,730,060 |
5,711,459 |
3,682,478 |
20,441,519 |
24,123,997 |
9,908,388 |
14,215,609 |
- |
1993 |
|
|
THE FOUNTAINS AT ARBOR LAKES |
28,585,296 |
66,699,024 |
13,287,679 |
29,485,296 |
79,086,703 |
108,571,999 |
24,480,182 |
84,091,817 |
- |
2006 |
|
|
ROSEVILLE PLAZA |
132,842 |
957,340 |
9,736,267 |
1,675,667 |
9,150,782 |
10,826,449 |
1,457,654 |
9,368,795 |
- |
2005 |
|
|
CREVE COUER SHOPPING CENTER |
1,044,598 |
5,475,623 |
896,084 |
960,814 |
6,455,491 |
7,416,305 |
2,959,637 |
4,456,668 |
- |
1998 |
|
|
NORTH POINT SHOPPING CENTER |
1,935,380 |
7,800,746 |
933,471 |
1,935,380 |
8,734,217 |
10,669,597 |
4,077,420 |
6,592,177 |
- |
1998 |
|
|
KIRKWOOD CROSSING |
- |
9,704,005 |
14,512,599 |
- |
24,216,604 |
24,216,604 |
14,603,879 |
9,612,725 |
- |
1998 |
|
|
LEMAY S.C. |
125,879 |
503,510 |
3,846,838 |
451,155 |
4,025,072 |
4,476,227 |
1,662,327 |
2,813,900 |
- |
1974 |
|
|
GRAVOIS PLAZA |
1,032,416 |
4,455,514 |
11,033,266 |
1,032,413 |
15,488,783 |
16,521,196 |
9,021,664 |
7,499,532 |
- |
2008 |
|
|
HOME DEPOT PLAZA |
431,960 |
- |
758,855 |
431,960 |
758,855 |
1,190,815 |
307,406 |
883,409 |
- |
1998 |
|
|
PRIMROSE MARKET PLACE |
2,745,595 |
10,985,778 |
8,433,741 |
2,904,022 |
19,261,092 |
22,165,114 |
10,101,312 |
12,063,802 |
- |
1994 |
|
|
PRIMROSE MARKETPLACE |
905,674 |
3,666,386 |
5,261,809 |
905,674 |
8,928,195 |
9,833,869 |
3,206,994 |
6,626,875 |
127,225 |
2002 |
|
|
CENTER POINT S.C. |
- |
550,204 |
- |
- |
550,204 |
550,204 |
357,716 |
192,488 |
- |
1998 |
|
|
KINGS HIGHWAY S.C. |
809,087 |
4,430,514 |
2,781,299 |
809,087 |
7,211,813 |
8,020,900 |
3,372,037 |
4,648,863 |
- |
1998 |
|
|
OVERLAND CROSSING |
- |
4,928,677 |
759,896 |
- |
5,688,573 |
5,688,573 |
3,156,042 |
2,532,531 |
- |
1997 |
|
|
CAVE SPRINGS S.C. |
1,182,194 |
7,423,459 |
7,110,186 |
1,563,694 |
14,152,145 |
15,715,839 |
10,167,687 |
5,548,152 |
- |
1997 |
|
|
SPRINGFIELD S.C. |
- |
608,793 |
11,012,797 |
8,800,000 |
2,821,590 |
11,621,590 |
1,260,636 |
10,360,954 |
- |
1998 |
|
|
OVERLOOK VILLAGE |
8,276,500 |
17,249,587 |
212,226 |
8,276,500 |
17,461,813 |
25,738,313 |
3,204,115 |
22,534,198 |
- |
2012 |
|
|
WOODLAWN MARKETPLACE |
919,251 |
3,570,981 |
2,621,647 |
919,251 |
6,192,628 |
7,111,879 |
3,174,870 |
3,937,009 |
- |
2008 |
|
|
TYVOLA SQUARE |
- |
4,736,345 |
6,968,268 |
- |
11,704,613 |
11,704,613 |
8,870,713 |
2,833,900 |
- |
1986 |
|
|
CROSSROADS PLAZA |
767,864 |
3,098,881 |
1,233,350 |
767,864 |
4,332,231 |
5,100,095 |
1,574,024 |
3,526,071 |
- |
2000 |
|
|
JETTON VILLAGE SHOPPES |
3,875,224 |
10,292,231 |
263,116 |
2,143,695 |
12,286,876 |
14,430,571 |
1,761,917 |
12,668,654 |
- |
2011 |
|
|
MOUNTAIN ISLAND MARKETPLACE |
3,318,587 |
7,331,413 |
736,014 |
3,818,587 |
7,567,427 |
11,386,014 |
1,291,311 |
10,094,703 |
- |
2012 |
|
|
WOODLAWN SHOPPING CENTER |
2,010,725 |
5,833,626 |
1,550,109 |
2,010,725 |
7,383,735 |
9,394,460 |
946,605 |
8,447,855 |
- |
2012 |
|
|
CROSSROADS PLAZA |
13,405,529 |
86,455,763 |
(540,910) |
13,405,529 |
85,914,853 |
99,320,382 |
11,613,154 |
87,707,228 |
70,739,527 |
2014 |
|
|
QUAIL CORNERS |
7,318,321 |
26,675,644 |
1,326,080 |
7,318,321 |
28,001,724 |
35,320,045 |
2,468,557 |
32,851,488 |
16,975,639 |
2014 |
|
|
OAKCREEK VILLAGE |
1,882,800 |
7,551,576 |
2,333,493 |
1,882,800 |
9,885,069 |
11,767,869 |
5,331,393 |
6,436,476 |
- |
1996 |
|
|
DAVIDSON COMMONS |
2,978,533 |
12,859,867 |
194,020 |
2,978,533 |
13,053,887 |
16,032,420 |
1,849,478 |
14,182,942 |
- |
2012 |
|
|
SENATE/HILLSBOROUGH CROSSI |
519,395 |
- |
- |
519,395 |
- |
519,395 |
- |
519,395 |
- |
2003 |
|
|
PARK PLACE SC |
5,461,478 |
16,163,494 |
320,144 |
5,469,809 |
16,475,307 |
21,945,116 |
6,841,674 |
15,103,442 |
- |
2008 |
|
|
MOORESVILLE CROSSING |
12,013,727 |
30,604,173 |
109,598 |
11,625,801 |
31,101,697 |
42,727,498 |
10,220,209 |
32,507,289 |
- |
2007 |
|
|
PLEASANT VALLEY PROMENADE |
5,208,885 |
20,885,792 |
13,796,952 |
5,208,885 |
34,682,744 |
39,891,629 |
19,390,497 |
20,501,132 |
- |
1993 |
|
|
WAKEFIELD COMMONS III |
6,506,450 |
- |
(5,120,646) |
1,843,341 |
(457,537) |
1,385,804 |
221,296 |
1,164,508 |
- |
2001 |
|
|
WAKEFIELD CROSSINGS |
3,413,932 |
- |
(3,017,959) |
336,236 |
59,737 |
395,973 |
6,960 |
389,013 |
- |
2001 |
|
|
BRENNAN STATION |
7,749,751 |
20,556,891 |
(700,646) |
6,321,923 |
21,284,073 |
27,605,996 |
4,474,520 |
23,131,476 |
- |
2011 |
|
|
BRENNAN STATION OUTPARCEL |
627,906 |
1,665,576 |
(93,482) |
450,232 |
1,749,768 |
2,200,000 |
347,904 |
1,852,096 |
- |
2011 |
|
|
CLOVERDALE PLAZA |
540,667 |
719,655 |
6,879,635 |
540,667 |
7,599,290 |
8,139,957 |
3,978,961 |
4,160,996 |
- |
1969 |
|
|
WEBSTER SQUARE |
11,683,145 |
41,708,383 |
5,174,840 |
11,683,145 |
46,883,223 |
58,566,368 |
5,143,811 |
53,422,557 |
- |
2014 |
|
|
WEBSTER SQUARE NORTH |
2,163,138 |
6,511,424 |
- |
2,163,138 |
6,511,424 |
8,674,562 |
199,146 |
8,475,416 |
- |
2016 |
|
|
ROCKINGHAM PLAZA-SHAWS PARCEL |
2,660,915 |
10,643,660 |
14,302,905 |
3,148,715 |
24,458,765 |
27,607,480 |
11,447,997 |
16,159,483 |
- |
2008 |
|
|
SHOP RITE PLAZA |
2,417,583 |
6,364,094 |
1,599,403 |
2,417,583 |
7,963,497 |
10,381,080 |
7,151,851 |
3,229,229 |
- |
1985 |
|
|
MARLTON PLAZA |
- |
4,318,534 |
114,215 |
- |
4,432,749 |
4,432,749 |
2,269,505 |
2,163,244 |
- |
1996 |
|
|
HILLVIEW SHOPPING CENTER |
16,007,647 |
32,607,423 |
(1,517,229) |
16,007,647 |
31,090,194 |
47,097,841 |
3,404,107 |
43,693,734 |
25,096,230 |
2014 |
|
|
GARDEN STATE PAVILIONS |
7,530,709 |
10,801,949 |
20,360,667 |
12,203,841 |
26,489,484 |
38,693,325 |
5,290,027 |
33,403,298 |
- |
2011 |
|
|
CLARK SHOPRITE 70 CENTRAL AVE |
3,496,673 |
11,693,769 |
994,829 |
13,959,593 |
2,225,678 |
16,185,271 |
515,706 |
15,669,565 |
- |
2013 |
|
|
COMMERCE CENTER WEST |
385,760 |
1,290,080 |
160,534 |
793,595 |
1,042,779 |
1,836,374 |
218,405 |
1,617,969 |
- |
2013 |
|
|
COMMERCE CENTER EAST |
1,518,930 |
5,079,690 |
1,753,865 |
7,235,196 |
1,117,289 |
8,352,485 |
270,427 |
8,082,058 |
- |
2013 |
|
|
CENTRAL PLAZA |
3,170,465 |
10,602,845 |
(186,938) |
5,145,167 |
8,441,205 |
13,586,372 |
1,389,217 |
12,197,155 |
- |
2013 |
|
|
EAST WINDSOR VILLAGE |
9,335,011 |
23,777,978 |
(728,416) |
9,335,011 |
23,049,562 |
32,384,573 |
5,463,964 |
26,920,609 |
- |
2008 |
|
|
HOLMDEL TOWNE CENTER |
10,824,624 |
43,301,494 |
7,797,435 |
10,824,624 |
51,098,929 |
61,923,553 |
18,456,550 |
43,467,003 |
- |
2002 |
|
|
COMMONS AT HOLMDEL |
16,537,556 |
38,759,952 |
3,395,971 |
16,537,556 |
42,155,923 |
58,693,479 |
16,134,863 |
42,558,616 |
- |
2004 |
|
|
PLAZA AT HILLSDALE |
7,601,596 |
6,994,196 |
544,603 |
7,601,596 |
7,538,799 |
15,140,395 |
782,960 |
14,357,435 |
6,021,151 |
2014 |
|
|
MAPLE SHADE |
- |
9,957,611 |
(845,234) |
- |
9,112,377 |
9,112,377 |
916,239 |
8,196,138 |
- |
2009 |
|
|
PLAZA AT SHORT HILLS |
20,155,471 |
11,061,984 |
36,110 |
20,155,471 |
11,098,094 |
31,253,565 |
1,615,234 |
29,638,331 |
9,721,798 |
2014 |
|
|
NORTH BRUNSWICK PLAZA |
3,204,978 |
12,819,912 |
27,813,346 |
3,204,978 |
40,633,258 |
43,838,236 |
17,565,395 |
26,272,841 |
- |
1994 |
|
|
PISCATAWAY TOWN CENTER |
3,851,839 |
15,410,851 |
1,216,192 |
3,851,839 |
16,627,043 |
20,478,882 |
7,981,590 |
12,497,292 |
- |
1998 |
|
|
RIDGEWOOD S.C. |
450,000 |
2,106,566 |
1,068,571 |
450,000 |
3,175,137 |
3,625,137 |
1,651,823 |
1,973,314 |
- |
1993 |
|
|
UNION CRESCENT III-BEST BUY |
7,895,483 |
3,010,640 |
28,918,367 |
8,696,579 |
31,127,911 |
39,824,490 |
12,610,403 |
27,214,087 |
- |
2007 |
|
|
WESTMONT PLAZA |
601,655 |
2,404,604 |
11,025,881 |
601,655 |
13,430,485 |
14,032,140 |
6,132,664 |
7,899,476 |
- |
1994 |
|
|
WILLOWBROOK PLAZA |
15,320,436 |
40,996,874 |
3,368,891 |
15,320,436 |
44,365,765 |
59,686,201 |
5,917,315 |
53,768,886 |
- |
2009 |
|
|
DEL MONTE PLAZA |
2,489,429 |
5,590,415 |
561,061 |
2,210,000 |
6,430,905 |
8,640,905 |
3,033,951 |
5,606,954 |
2,598,997 |
2006 |
|
|
REDFIELD PROMENADE |
4,415,339 |
32,035,192 |
81,095 |
4,415,339 |
32,116,287 |
36,531,626 |
3,116,035 |
33,415,591 |
- |
2015 |
|
|
MCQUEEN CROSSINGS |
5,017,431 |
20,779,024 |
193,820 |
5,017,431 |
20,972,844 |
25,990,275 |
2,026,006 |
23,964,269 |
- |
2015 |
|
|
GALENA JUNCTION |
8,931,027 |
17,503,387 |
(14,107) |
8,931,027 |
17,489,280 |
26,420,307 |
1,715,262 |
24,705,045 |
19,862,619 |
2015 |
|
|
D'ANDREA MARKETPLACE |
11,556,067 |
29,435,364 |
183,997 |
11,556,067 |
29,619,361 |
41,175,428 |
7,252,367 |
33,923,061 |
11,828,709 |
2007 |
|
|
SPARKS MERCANTILE |
6,221,614 |
17,069,172 |
35,957 |
6,221,614 |
17,105,129 |
23,326,743 |
1,639,300 |
21,687,443 |
19,162,216 |
2015 |
|
|
BRIDGEHAMPTON COMMONS-W&E SIDE |
1,811,752 |
3,107,232 |
27,119,033 |
1,858,188 |
30,179,829 |
32,038,017 |
19,471,600 |
12,566,417 |
- |
1972 |
|
|
OCEAN PLAZA |
564,097 |
2,268,768 |
8,468 |
564,097 |
2,277,236 |
2,841,333 |
802,290 |
2,039,043 |
- |
2003 |
|
|
KINGS HIGHWAY |
2,743,820 |
6,811,268 |
1,841,513 |
2,743,820 |
8,652,781 |
11,396,601 |
3,199,221 |
8,197,380 |
- |
2004 |
|
|
RALPH AVENUE PLAZA |
4,414,466 |
11,339,857 |
3,567,551 |
4,414,467 |
14,907,407 |
19,321,874 |
4,905,187 |
14,416,687 |
- |
2004 |
|
|
BELLMORE S.C. |
1,272,269 |
3,183,547 |
1,590,605 |
1,272,269 |
4,774,152 |
6,046,421 |
1,531,268 |
4,515,153 |
- |
2004 |
|
|
MARKET AT BAY SHORE |
12,359,621 |
30,707,802 |
2,883,868 |
12,359,621 |
33,591,670 |
45,951,291 |
11,418,553 |
34,532,738 |
11,899,751 |
2006 |
|
|
KEY FOOD - ATLANTIC AVE |
2,272,500 |
5,624,589 |
509,260 |
4,808,822 |
3,597,527 |
8,406,349 |
471,685 |
7,934,664 |
- |
2012 |
|
|
KING KULLEN PLAZA |
5,968,082 |
23,243,404 |
6,064,033 |
5,980,130 |
29,295,389 |
35,275,519 |
13,498,533 |
21,776,986 |
- |
1998 |
|
|
BIRCHWOOD PLAZA COMMACK |
3,630,000 |
4,774,791 |
1,073,476 |
3,630,000 |
5,848,267 |
9,478,267 |
1,743,532 |
7,734,735 |
- |
2007 |
|
|
ELMONT S.C. |
3,011,658 |
7,606,066 |
2,770,293 |
3,011,658 |
10,376,359 |
13,388,017 |
3,327,198 |
10,060,819 |
- |
2004 |
|
|
NORTHPORT LAND PARCEL |
- |
14,460 |
- |
- |
14,460 |
14,460 |
- |
14,460 |
- |
2012 |
|
|
ELMONT PLAZA |
- |
5,119,714 |
- |
- |
5,119,714 |
5,119,714 |
371,728 |
4,747,986 |
- |
2015 |
|
|
ELMSFORD CENTER 1 |
4,134,273 |
1,193,084 |
- |
4,134,273 |
1,193,084 |
5,327,357 |
118,420 |
5,208,937 |
- |
2013 |
|
|
ELMSFORD CENTER 2 |
4,076,403 |
15,598,504 |
949,902 |
4,076,403 |
16,548,406 |
20,624,809 |
1,872,113 |
18,752,696 |
- |
2013 |
|
|
FRANKLIN SQUARE S.C. |
1,078,541 |
2,516,581 |
3,937,137 |
1,078,541 |
6,453,718 |
7,532,259 |
2,216,400 |
5,315,859 |
- |
2004 |
|
|
AIRPORT PLAZA |
22,711,189 |
107,011,500 |
3,764,964 |
22,711,189 |
110,776,464 |
133,487,653 |
10,317,734 |
123,169,919 |
- |
2015 |
|
|
KISSENA BOULEVARD SHOPPING CTR |
11,610,000 |
2,933,487 |
147,329 |
11,610,000 |
3,080,816 |
14,690,816 |
1,012,304 |
13,678,512 |
- |
2007 |
|
|
HAMPTON BAYS PLAZA |
1,495,105 |
5,979,320 |
3,533,406 |
1,495,105 |
9,512,726 |
11,007,831 |
6,950,371 |
4,057,460 |
- |
1989 |
|
|
HICKSVILLE PLAZA |
3,542,739 |
8,266,375 |
3,095,524 |
3,542,739 |
11,361,899 |
14,904,638 |
3,700,135 |
11,204,503 |
- |
2004 |
|
|
WOODBURY CENTRE |
4,314,991 |
32,585,508 |
1,661,793 |
4,314,991 |
34,247,301 |
38,562,292 |
2,699,939 |
35,862,353 |
- |
2015 |
|
|
TURNPIKE PLAZA |
2,471,832 |
5,839,416 |
583,236 |
2,471,832 |
6,422,652 |
8,894,484 |
1,669,509 |
7,224,975 |
- |
2011 |
|
|
JERICHO COMMONS SOUTH |
12,368,330 |
33,071,495 |
721,082 |
12,368,330 |
33,792,577 |
46,160,907 |
9,612,581 |
36,548,326 |
9,006,205 |
2007 |
|
|
501 NORTH BROADWAY |
- |
1,175,543 |
197,738 |
- |
1,373,281 |
1,373,281 |
672,031 |
701,250 |
- |
2007 |
|
|
MERRY LANE (PARKING LOT) |
1,485,531 |
1,749 |
(1,749) |
1,485,531 |
- |
1,485,531 |
- |
1,485,531 |
- |
2007 |
|
|
MILLERIDGE INN |
7,500,330 |
481,316 |
69,437 |
7,500,000 |
551,083 |
8,051,083 |
14,430 |
8,036,653 |
- |
2015 |
|
|
JERICHO ATRIUM |
10,624,099 |
20,065,496 |
- |
10,624,099 |
20,065,496 |
30,689,595 |
1,816,983 |
28,872,612 |
- |
2016 |
|
|
FAMILY DOLLAR UNION TURNPIKE |
909,000 |
2,249,775 |
258,033 |
1,056,709 |
2,360,099 |
3,416,808 |
413,009 |
3,003,799 |
- |
2012 |
|
|
LITTLE NECK PLAZA |
3,277,254 |
13,161,218 |
5,837,212 |
3,277,253 |
18,998,431 |
22,275,684 |
6,285,079 |
15,990,605 |
- |
2003 |
|
|
KEY FOOD - 21ST STREET |
1,090,800 |
2,699,730 |
(159,449) |
1,669,153 |
1,961,928 |
3,631,081 |
210,207 |
3,420,874 |
- |
2012 |
|
|
MANHASSET CENTER |
4,567,003 |
19,165,808 |
29,214,394 |
3,471,939 |
49,475,266 |
52,947,205 |
21,514,253 |
31,432,952 |
- |
1999 |
|
|
MANHASSET CENTER(residential) |
950,000 |
- |
- |
950,000 |
- |
950,000 |
- |
950,000 |
- |
2012 |
|
|
MASPETH QUEENS-DUANE READE |
1,872,013 |
4,827,940 |
1,036,886 |
1,872,013 |
5,864,826 |
7,736,839 |
1,957,523 |
5,779,316 |
1,677,019 |
2004 |
|
|
NORTH MASSAPEQUA S.C. |
1,880,816 |
4,388,549 |
699,203 |
1,623,601 |
5,344,967 |
6,968,568 |
2,000,668 |
4,967,900 |
- |
2004 |
|
|
MINEOLA CROSSINGS |
4,150,000 |
7,520,692 |
224,517 |
4,150,000 |
7,745,209 |
11,895,209 |
1,943,416 |
9,951,793 |
- |
2007 |
|
|
BIRCHWOOD PARK |
3,507,162 |
4,126 |
(1,510,445) |
2,000,000 |
843 |
2,000,843 |
843 |
2,000,000 |
- |
2007 |
|
|
SMITHTOWN PLAZA |
3,528,000 |
7,364,098 |
414,233 |
3,528,000 |
7,778,331 |
11,306,331 |
2,258,789 |
9,047,542 |
- |
2009 |
|
|
MANETTO HILL PLAZA |
263,693 |
584,031 |
10,227,903 |
263,693 |
10,811,934 |
11,075,627 |
6,176,092 |
4,899,535 |
- |
1969 |
|
|
SYOSSET S.C. |
106,655 |
76,197 |
1,781,201 |
106,655 |
1,857,398 |
1,964,053 |
1,047,980 |
916,073 |
- |
1990 |
|
|
RICHMOND S.C. |
2,280,000 |
9,027,951 |
12,459,766 |
2,280,000 |
21,487,717 |
23,767,717 |
12,038,465 |
11,729,252 |
- |
1989 |
|
|
GREENRIDGE - OUT PARCEL |
2,940,000 |
11,811,964 |
6,268,972 |
3,148,424 |
17,872,512 |
21,020,936 |
6,833,007 |
14,187,929 |
- |
1997 |
|
|
STATEN ISLAND PLAZA |
5,600,744 |
6,788,460 |
(3,003,049) |
9,386,155 |
- |
9,386,155 |
- |
9,386,155 |
- |
2005 |
|
|
HYLAN PLAZA |
28,723,536 |
38,232,267 |
36,986,741 |
28,723,536 |
75,219,008 |
103,942,544 |
38,896,894 |
65,045,650 |
- |
2006 |
|
|
FOREST AVENUE PLAZA |
4,558,592 |
10,441,408 |
155,848 |
4,558,592 |
10,597,256 |
15,155,848 |
3,701,092 |
11,454,756 |
- |
2005 |
|
|
INDEPENDENCE PLAZA |
12,279,093 |
34,813,852 |
215,399 |
16,131,632 |
31,176,712 |
47,308,344 |
5,877,127 |
41,431,217 |
31,490,535 |
2014 |
|
|
KEY FOOD - CENTRAL AVE. |
2,787,600 |
6,899,310 |
(394,910) |
2,603,321 |
6,688,679 |
9,292,000 |
749,341 |
8,542,659 |
- |
2012 |
|
|
WHITE PLAINS S.C. |
1,777,775 |
4,453,894 |
2,471,597 |
1,777,775 |
6,925,491 |
8,703,266 |
2,246,846 |
6,456,420 |
- |
2004 |
|
|
CHAMPION FOOD SUPERMARKET |
757,500 |
1,874,813 |
(24,388) |
2,241,118 |
366,807 |
2,607,925 |
107,809 |
2,500,116 |
- |
2012 |
|
|
SHOPRITE S.C. |
871,977 |
3,487,909 |
- |
871,977 |
3,487,909 |
4,359,886 |
2,144,278 |
2,215,608 |
- |
1998 |
|
|
ROMAINE PLAZA |
782,459 |
1,825,737 |
588,133 |
782,459 |
2,413,870 |
3,196,329 |
616,916 |
2,579,413 |
- |
2005 |
|
|
KENT CENTER |
2,261,530 |
- |
(1,826,497) |
435,033 |
- |
435,033 |
- |
435,033 |
- |
1995 |
|
|
HIGH PARK CTR RETAIL |
3,783,875 |
- |
(2,778,460) |
921,704 |
83,711 |
1,005,415 |
24,910 |
980,505 |
- |
2001 |
|
|
OREGON TRAIL CENTER |
5,802,422 |
12,622,879 |
590,069 |
5,802,422 |
13,212,948 |
19,015,370 |
4,770,972 |
14,244,398 |
- |
2009 |
|
|
POWELL VALLEY JUNCTION |
5,062,500 |
3,152,982 |
(2,508,712) |
2,035,125 |
3,671,645 |
5,706,770 |
1,406,074 |
4,300,696 |
- |
2009 |
|
|
HOSPITAL GARAGE & MED. OFFICE |
- |
30,061,177 |
59,094 |
- |
30,120,271 |
30,120,271 |
8,509,839 |
21,610,432 |
- |
2004 |
|
|
SUBURBAN SQUARE |
70,679,871 |
166,351,381 |
10,146,149 |
71,279,871 |
175,897,530 |
247,177,401 |
44,800,084 |
202,377,317 |
- |
2007 |
|
|
COULTER AVE. PARCEL |
577,630 |
1,348,019 |
6,720,666 |
8,645,796 |
519 |
8,646,315 |
- |
8,646,315 |
- |
2015 |
|
|
CHIPPEWA PLAZA |
2,881,525 |
11,526,101 |
153,290 |
2,881,525 |
11,679,391 |
14,560,916 |
5,133,586 |
9,427,330 |
1,931,697 |
2000 |
|
|
CARNEGIE PLAZA |
- |
3,298,908 |
17,747 |
- |
3,316,655 |
3,316,655 |
1,445,722 |
1,870,933 |
- |
1999 |
|
|
CENTER SQUARE SHOPPING CENTER |
731,888 |
2,927,551 |
1,342,103 |
731,888 |
4,269,654 |
5,001,542 |
2,661,695 |
2,339,847 |
- |
1996 |
|
|
WAYNE PLAZA |
6,127,623 |
15,605,012 |
400,438 |
6,135,670 |
15,997,403 |
22,133,073 |
3,985,695 |
18,147,378 |
- |
2008 |
|
|
DEVON VILLAGE |
4,856,379 |
25,846,910 |
3,995,839 |
4,856,379 |
29,842,749 |
34,699,128 |
5,029,943 |
29,669,185 |
- |
2012 |
|
|
POCONO PLAZA |
1,050,000 |
2,372,628 |
1,431,729 |
1,050,000 |
3,804,357 |
4,854,357 |
3,174,132 |
1,680,225 |
- |
1973 |
|
|
RIDGE PIKE PLAZA |
1,525,337 |
4,251,732 |
(2,602,946) |
914,299 |
2,259,824 |
3,174,123 |
938,226 |
2,235,897 |
- |
2008 |
|
|
WHITELAND - HOBBY LOBBY |
176,666 |
4,895,360 |
1,447,703 |
176,666 |
6,343,063 |
6,519,729 |
2,192,866 |
4,326,863 |
- |
1999 |
|
|
WHITELAND TOWN CENTER |
731,888 |
2,927,551 |
- |
731,888 |
2,927,551 |
3,659,439 |
1,526,331 |
2,133,108 |
- |
1996 |
|
|
EASTWICK WELLNESS CENTER |
889,001 |
2,762,888 |
3,074,728 |
889,001 |
5,837,616 |
6,726,617 |
2,869,745 |
3,856,872 |
- |
1997 |
|
|
HARRISBURG EAST SHOPPING CTR. |
452,888 |
6,665,238 |
6,889,185 |
3,002,888 |
11,004,423 |
14,007,311 |
6,690,361 |
7,316,950 |
- |
2002 |
|
|
TOWNSHIP LINE S.C. |
731,888 |
2,927,551 |
- |
731,888 |
2,927,551 |
3,659,439 |
1,526,331 |
2,133,108 |
- |
1996 |
|
|
HORSHAM POINT |
3,813,247 |
18,189,450 |
45,820 |
3,813,247 |
18,235,270 |
22,048,517 |
1,141,314 |
20,907,203 |
- |
2015 |
|
|
HOLIDAY CENTER |
7,726,844 |
20,014,243 |
50,582 |
7,726,844 |
20,064,825 |
27,791,669 |
2,002,263 |
25,789,406 |
- |
2015 |
|
|
NORRITON SQUARE |
686,134 |
2,664,535 |
3,817,458 |
774,084 |
6,394,043 |
7,168,127 |
4,679,752 |
2,488,375 |
- |
1984 |
|
|
NEW KENSINGTON S.C |
521,945 |
2,548,322 |
862,730 |
521,945 |
3,411,052 |
3,932,997 |
3,125,467 |
807,530 |
- |
1986 |
|
|
SEARS HARDWARE |
10,000 |
- |
- |
10,000 |
- |
10,000 |
- |
10,000 |
- |
2015 |
|
|
FRANKFORD AVENUE S.C. |
731,888 |
2,927,551 |
- |
731,888 |
2,927,551 |
3,659,439 |
1,526,331 |
2,133,108 |
- |
1996 |
|
|
WEXFORD PLAZA |
6,413,635 |
9,774,600 |
9,955,083 |
6,299,299 |
19,844,019 |
26,143,318 |
3,657,982 |
22,485,336 |
- |
2010 |
|
|
CRANBERRY TOWNSHIP-PARCEL 1&2 |
10,270,846 |
30,769,592 |
- |
10,270,846 |
30,769,592 |
41,040,438 |
333,570 |
40,706,868 |
21,636,092 |
2016 |
|
|
CROSSROADS PLAZA |
788,761 |
3,155,044 |
12,759,977 |
976,439 |
15,727,343 |
16,703,782 |
9,633,622 |
7,070,160 |
- |
1986 |
|
|
SPRINGFIELD S.C. |
919,998 |
4,981,589 |
12,704,250 |
920,000 |
17,685,837 |
18,605,837 |
9,073,040 |
9,532,797 |
- |
1983 |
|
|
SHREWSBURY SQUARE S.C. |
8,066,107 |
16,997,997 |
(1,648,173) |
6,534,966 |
16,880,965 |
23,415,931 |
1,804,686 |
21,611,245 |
- |
2014 |
|
|
WHITEHALL MALL |
- |
5,195,577 |
- |
- |
5,195,577 |
5,195,577 |
2,708,806 |
2,486,771 |
- |
1996 |
|
|
WHOLE FOODS AT WYNNEWOOD |
15,042,165 |
- |
11,598,520 |
13,772,394 |
12,868,291 |
26,640,685 |
66,430 |
26,574,255 |
- |
2014 |
|
|
SHOPPES AT WYNNEWOOD |
7,478,907 |
- |
3,768,083 |
7,478,907 |
3,768,083 |
11,246,990 |
62,308 |
11,184,682 |
- |
2015 |
|
|
WEST MARKET ST. PLAZA |
188,562 |
1,158,307 |
41,712 |
188,562 |
1,200,019 |
1,388,581 |
1,169,083 |
219,498 |
- |
1986 |
|
|
REXVILLE TOWN CENTER |
24,872,981 |
48,688,161 |
8,014,056 |
25,678,064 |
55,897,134 |
81,575,198 |
32,302,168 |
49,273,030 |
- |
2006 |
|
|
PLAZA CENTRO - COSTCO |
3,627,973 |
10,752,212 |
1,535,656 |
3,866,206 |
12,049,635 |
15,915,841 |
6,391,287 |
9,524,554 |
- |
2006 |
|
|
PLAZA CENTRO - MALL |
19,873,263 |
58,719,179 |
7,545,697 |
19,408,112 |
66,730,027 |
86,138,139 |
35,105,932 |
51,032,207 |
- |
2006 |
|
|
PLAZA CENTRO - RETAIL |
5,935,566 |
16,509,748 |
2,695,750 |
6,026,070 |
19,114,994 |
25,141,064 |
9,984,894 |
15,156,170 |
- |
2006 |
|
|
PLAZA CENTRO - SAM'S CLUB |
6,643,224 |
20,224,758 |
2,321,593 |
6,520,090 |
22,669,485 |
29,189,575 |
21,610,984 |
7,578,591 |
- |
2006 |
|
|
LOS COLOBOS - BUILDERS SQUARE |
4,404,593 |
9,627,903 |
1,361,338 |
4,461,145 |
10,932,689 |
15,393,834 |
9,024,387 |
6,369,447 |
- |
2006 |
|
|
LOS COLOBOS - KMART |
4,594,944 |
10,120,147 |
726,279 |
4,402,338 |
11,039,032 |
15,441,370 |
9,386,129 |
6,055,241 |
- |
2006 |
|
|
LOS COLOBOS I |
12,890,882 |
26,046,669 |
3,697,161 |
13,613,375 |
29,021,337 |
42,634,712 |
15,652,923 |
26,981,789 |
- |
2006 |
|
|
LOS COLOBOS II |
14,893,698 |
30,680,556 |
5,857,364 |
15,142,300 |
36,289,318 |
51,431,618 |
18,829,986 |
32,601,632 |
- |
2006 |
|
|
WESTERN PLAZA - MAYAQUEZ ONE |
10,857,773 |
12,252,522 |
1,347,575 |
11,241,993 |
13,215,877 |
24,457,870 |
8,562,000 |
15,895,870 |
- |
2006 |
|
|
WESTERN PLAZA - MAYAGUEZ TWO |
16,874,345 |
19,911,045 |
1,964,632 |
16,872,647 |
21,877,375 |
38,750,022 |
14,087,431 |
24,662,591 |
- |
2006 |
|
|
MANATI VILLA MARIA SC |
2,781,447 |
5,673,119 |
1,699,755 |
2,606,588 |
7,547,733 |
10,154,321 |
3,953,428 |
6,200,893 |
- |
2006 |
|
|
PONCE TOWN CENTER |
14,432,778 |
28,448,754 |
4,875,507 |
14,903,024 |
32,854,015 |
47,757,039 |
15,091,421 |
32,665,618 |
- |
2006 |
|
|
TRUJILLO ALTO PLAZA |
12,053,673 |
24,445,858 |
3,942,389 |
12,289,288 |
28,152,632 |
40,441,920 |
16,021,971 |
24,419,949 |
- |
2006 |
|
|
MARSHALL PLAZA |
1,886,600 |
7,575,302 |
1,797,067 |
1,886,600 |
9,372,369 |
11,258,969 |
4,569,037 |
6,689,932 |
- |
1998 |
|
|
ST. ANDREWS CENTER |
730,164 |
3,132,092 |
19,122,683 |
730,164 |
22,254,775 |
22,984,939 |
9,949,662 |
13,035,277 |
- |
1978 |
|
|
WESTWOOD PLAZA |
1,744,430 |
6,986,094 |
6,970,136 |
1,726,833 |
13,973,827 |
15,700,660 |
4,352,208 |
11,348,452 |
- |
1995 |
|
|
CHERRYDALE POINT |
5,801,948 |
32,055,019 |
1,885,250 |
5,801,948 |
33,940,269 |
39,742,217 |
7,869,993 |
31,872,224 |
- |
2009 |
|
|
WOODRUFF SHOPPING CENTER |
3,110,439 |
15,501,117 |
1,146,035 |
3,465,199 |
16,292,392 |
19,757,591 |
2,847,116 |
16,910,475 |
- |
2010 |
|
|
FOREST PARK |
1,920,241 |
9,544,875 |
186,314 |
1,920,241 |
9,731,189 |
11,651,430 |
1,398,248 |
10,253,182 |
- |
2012 |
|
|
OLD TOWNE VILLAGE |
- |
4,133,904 |
4,003,667 |
- |
8,137,571 |
8,137,571 |
5,935,218 |
2,202,353 |
- |
1978 |
|
|
HICKORY RIDGE COMMONS |
596,347 |
2,545,033 |
(2,457,560) |
683,820 |
- |
683,820 |
- |
683,820 |
- |
2000 |
|
|
CENTER OF THE HILLS |
2,923,585 |
11,706,145 |
1,186,149 |
2,923,585 |
12,892,294 |
15,815,879 |
6,288,060 |
9,527,819 |
- |
2008 |
|
|
DOWLEN TOWN CENTER-II |
2,244,581 |
- |
(722,251) |
484,828 |
1,037,502 |
1,522,330 |
173,357 |
1,348,973 |
- |
2002 |
|
|
GATEWAY STATION |
1,373,692 |
28,145,158 |
137,320 |
1,374,880 |
28,281,290 |
29,656,170 |
3,653,199 |
26,002,971 |
- |
2011 |
|
|
BAYTOWN VILLAGE S.C. |
500,422 |
2,431,651 |
818,249 |
500,422 |
3,249,900 |
3,750,322 |
1,433,566 |
2,316,756 |
- |
1996 |
|
|
LAS TIENDAS PLAZA |
8,678,107 |
- |
27,525,578 |
7,943,925 |
28,259,760 |
36,203,685 |
5,068,574 |
31,135,111 |
- |
2005 |
|
|
ISLAND GATE PLAZA |
- |
944,562 |
1,864,189 |
- |
2,808,751 |
2,808,751 |
976,939 |
1,831,812 |
- |
1997 |
|
|
ISLAND GATE PLAZA |
4,343,000 |
4,723,215 |
3,434,004 |
4,292,636 |
8,207,583 |
12,500,219 |
2,159,227 |
10,340,992 |
- |
2011 |
|
|
CONROE MARKETPLACE |
18,869,087 |
50,756,554 |
(3,309,577) |
10,841,611 |
55,474,453 |
66,316,064 |
4,351,300 |
61,964,764 |
- |
2015 |
|
|
MONTGOMERY PLAZA |
10,739,067 |
63,065,333 |
(281,830) |
10,738,796 |
62,783,774 |
73,522,570 |
6,158,788 |
67,363,782 |
28,821,667 |
2015 |
|
|
PRESTON LEBANON CROSSING |
13,552,180 |
- |
26,717,900 |
12,163,694 |
28,106,386 |
40,270,080 |
5,930,870 |
34,339,210 |
- |
2006 |
|
|
LAKE PRAIRIE TOWN CROSSING |
7,897,491 |
- |
28,539,296 |
6,783,464 |
29,653,323 |
36,436,787 |
5,059,248 |
31,377,539 |
- |
2006 |
|
|
CENTER AT BAYBROOK |
6,941,017 |
27,727,491 |
8,890,735 |
6,928,120 |
36,631,123 |
43,559,243 |
15,483,311 |
28,075,932 |
- |
1998 |
|
|
CYPRESS TOWNE CENTER |
6,033,932 |
- |
1,636,605 |
2,251,666 |
5,418,871 |
7,670,537 |
882,419 |
6,788,118 |
- |
2003 |
|
|
CYPRESS TOWNE CENTER |
12,329,195 |
36,836,381 |
- |
12,329,195 |
36,836,381 |
49,165,576 |
398,790 |
48,766,786 |
- |
2016 |
|
|
CYPRESS TOWNE CENTER(PHASE II) |
2,061,477 |
6,157,862 |
- |
2,061,477 |
6,157,862 |
8,219,339 |
66,679 |
8,152,660 |
- |
2016 |
|
|
THE CENTRE AT COPPERFIELD |
6,723,267 |
22,524,551 |
147,681 |
6,723,357 |
22,672,142 |
29,395,499 |
1,765,721 |
27,629,778 |
- |
2015 |
|
|
COPPERWOOD VILLAGE |
13,848,109 |
84,183,731 |
488,670 |
13,848,109 |
84,672,401 |
98,520,510 |
8,574,685 |
89,945,825 |
- |
2015 |
|
|
ATASCOCITA COMMONS SHOP.CTR. |
16,322,636 |
54,587,066 |
640,629 |
16,099,004 |
55,451,327 |
71,550,331 |
6,426,983 |
65,123,348 |
28,723,371 |
2013 |
|
|
TOMBALL CROSSINGS |
8,517,427 |
28,484,450 |
(22,511) |
7,964,894 |
29,014,472 |
36,979,366 |
3,597,691 |
33,381,675 |
- |
2013 |
|
|
COPPERFIELD VILLAGE SHOP.CTR. |
7,827,639 |
34,864,441 |
140,205 |
7,827,639 |
35,004,646 |
42,832,285 |
2,785,358 |
40,046,927 |
- |
2015 |
|
|
SHOPS AT VISTA RIDGE |
3,257,199 |
13,029,416 |
2,198,969 |
3,257,199 |
15,228,385 |
18,485,584 |
6,908,102 |
11,577,482 |
- |
1998 |
|
|
VISTA RIDGE PLAZA |
2,926,495 |
11,716,483 |
2,584,098 |
2,926,495 |
14,300,581 |
17,227,076 |
6,722,152 |
10,504,924 |
- |
1998 |
|
|
VISTA RIDGE PLAZA |
2,276,575 |
9,106,300 |
1,355,098 |
2,276,575 |
10,461,398 |
12,737,973 |
4,969,800 |
7,768,173 |
- |
1998 |
|
|
KROGER PLAZA |
520,340 |
2,081,356 |
1,359,284 |
520,340 |
3,440,640 |
3,960,980 |
1,790,106 |
2,170,874 |
- |
1995 |
|
|
ACCENT PLAZA |
500,414 |
2,830,835 |
- |
500,414 |
2,830,835 |
3,331,249 |
1,464,554 |
1,866,695 |
- |
1996 |
|
|
SOUTHLAKE OAKS PHASE II-480 W. |
3,011,260 |
7,703,844 |
103,968 |
3,016,617 |
7,802,455 |
10,819,072 |
2,611,864 |
8,207,208 |
- |
2008 |
|
|
WOODBRIDGE SHOPPING CENTER |
2,568,705 |
6,813,716 |
60,806 |
2,568,705 |
6,874,522 |
9,443,227 |
1,137,926 |
8,305,301 |
- |
2012 |
|
|
GRAND PARKWAY MARKETPLACE |
25,363,548 |
- |
49,662,448 |
75,025,996 |
- |
75,025,996 |
- |
75,025,996 |
- |
2014 |
|
|
GRAND PARKWAY MARKET PLACE II |
13,436,447 |
- |
6,378,376 |
19,814,823 |
- |
19,814,823 |
- |
19,814,823 |
- |
2015 |
|
|
TEMPLE TOWNE CENTER |
609,317 |
2,983,262 |
1 |
609,317 |
2,983,263 |
3,592,580 |
258,770 |
3,333,810 |
- |
2015 |
|
|
TEMPLE TOWNE CENTER |
4,909,857 |
25,882,414 |
24,910 |
4,909,857 |
25,907,324 |
30,817,181 |
3,096,902 |
27,720,279 |
- |
2015 |
|
|
BURKE TOWN PLAZA |
- |
43,240,068 |
(77,919) |
- |
43,162,149 |
43,162,149 |
4,705,503 |
38,456,646 |
- |
2014 |
|
|
OLD TOWN PLAZA |
4,500,000 |
41,569,735 |
(13,561,193) |
3,087,520 |
29,421,022 |
32,508,542 |
5,331,198 |
27,177,344 |
- |
2007 |
|
|
SKYLINE VILLAGE |
10,145,283 |
28,764,045 |
119,265 |
10,573,875 |
28,454,718 |
39,028,593 |
2,408,808 |
36,619,785 |
28,540,865 |
2014 |
|
|
SUDLEY TOWNE PLAZA |
4,114,293 |
15,988,465 |
(2,870) |
4,114,293 |
15,985,595 |
20,099,888 |
1,223,448 |
18,876,440 |
- |
2015 |
|
|
BURLINGTON COAT CENTER |
670,500 |
2,751,375 |
1,666,127 |
670,500 |
4,417,502 |
5,088,002 |
1,555,483 |
3,532,519 |
- |
1995 |
|
|
TOWNE SQUARE |
8,499,373 |
24,302,141 |
1,558,230 |
8,858,432 |
25,501,312 |
34,359,744 |
2,148,027 |
32,211,717 |
24,915,548 |
2014 |
|
|
POTOMAC RUN PLAZA |
27,369,515 |
48,451,209 |
(1,609,051) |
27,369,515 |
46,842,158 |
74,211,673 |
12,954,070 |
61,257,603 |
- |
2008 |
|
|
DULLES TOWN CROSSING |
53,285,116 |
104,175,738 |
(400,522) |
53,285,116 |
103,775,216 |
157,060,332 |
11,215,337 |
145,844,995 |
- |
2015 |
|
|
DOCSTONE COMMONS |
3,839,249 |
11,468,264 |
- |
3,839,249 |
11,468,264 |
15,307,513 |
124,181 |
15,183,332 |
11,123,972 |
2016 |
|
|
DOCSTONE O/P - STAPLES |
1,425,307 |
4,317,552 |
- |
1,425,307 |
4,317,552 |
5,742,859 |
46,102 |
5,696,757 |
- |
2016 |
|
|
STAFFORD MARKETPLACE |
26,893,429 |
86,449,614 |
71,698 |
26,893,429 |
86,521,312 |
113,414,741 |
6,751,401 |
106,663,340 |
- |
2015 |
|
|
AUBURN NORTH |
7,785,841 |
18,157,625 |
1,466,041 |
7,785,841 |
19,623,666 |
27,409,507 |
6,662,844 |
20,746,663 |
- |
2007 |
|
|
THE MARKETPLACE AT FACTORIA |
60,502,358 |
92,696,231 |
2,554,967 |
60,502,358 |
95,251,198 |
155,753,556 |
15,307,136 |
140,446,420 |
56,633,213 |
2013 |
|
|
FRONTIER VILLAGE SHOPPING CTR. |
10,750,863 |
35,649,111 |
96,299 |
10,750,863 |
35,745,410 |
46,496,273 |
5,383,855 |
41,112,418 |
- |
2012 |
|
|
GATEWAY SHOPPING CENTER |
6,937,929 |
11,270,322 |
- |
6,937,929 |
11,270,322 |
18,208,251 |
241,160 |
17,967,091 |
- |
2016 |
|
|
OLYMPIA WEST OUTPARCEL |
360,000 |
799,640 |
100,360 |
360,000 |
900,000 |
1,260,000 |
102,255 |
1,157,745 |
- |
2012 |
|
|
FRANKLIN PARK COMMONS |
5,418,825 |
11,988,657 |
977,979 |
5,418,825 |
12,966,636 |
18,385,461 |
1,277,370 |
17,108,091 |
- |
2015 |
|
|
SILVERDALE PLAZA |
3,875,013 |
32,272,736 |
86,050 |
3,755,613 |
32,478,186 |
36,233,799 |
4,689,699 |
31,544,100 |
- |
2012 |
|
|
BLUE RIDGE |
12,346,900 |
71,529,796 |
(35,751,174) |
6,158,426 |
41,967,096 |
48,125,522 |
19,367,363 |
28,758,159 |
6,870,989 |
2005 |
|
|
MICROPROPERTIES |
24,206,390 |
56,481,576 |
(74,328,657) |
2,038,463 |
4,320,846 |
6,359,309 |
904,208 |
5,455,101 |
- |
2012 |
|
|
KRC NORTH LOAN IV, INC. |
23,516,663 |
- |
(5,308,827) |
18,207,836 |
- |
18,207,836 |
- |
18,207,836 |
- |
2013 |
|
|
BALANCE OF PORTFOLIO |
1,907,178 |
65,127,203 |
6,458,145 |
13,419,726 |
60,072,800 |
73,492,526 |
37,230,123 |
36,262,403 |
11,608,413 |
||
|
TOTALS |
2,988,153,342 |
7,590,553,397 |
1,429,368,409 |
3,130,217,410 |
8,877,857,738 |
12,008,075,148 |
2,278,291,645 |
9,729,783,503 |
1,139,117,399 |
||
|
KIMCO REALTY CORPORATION AND SUBSIDIARIES |
|
SCHEDULE III - REAL ESTATE AND ACCUMULATED DEPRECIATION |
|
December 31, 2016 |
Depreciation and amortization are provided on the straight-line method over the estimated useful lives of the assets, as follows:
|
Buildings and building improvements (in years) |
15 | to | 50 | |||
|
Fixtures, building and leasehold improvements |
Terms of leases or useful lives, whichever is shorter | |||||
|
(including certain identified intangible assets) |
||||||
The aggregate cost for Federal income tax purposes was approximately $9.6 billion at December 31, 2016.
The changes in total real estate assets for the years ended December 31, 2016, 2015, and 2014 are as follows:
|
2016 |
2015 |
2014 |
||||||||||
|
Balance, beginning of period |
$ | 11,568,809,126 | $ | 10,018,225,775 | $ | 9,123,343,869 | ||||||
|
Acquisitions |
181,719,189 | 278,401,182 | 548,553,619 | |||||||||
|
Improvements |
217,668,292 | 191,662,698 | 134,921,993 | |||||||||
|
Transfers from (to) unconsolidated joint ventures |
615,511,560 | 1,673,542,610 | 1,065,330,540 | |||||||||
|
Sales |
(391,758,149 | ) | (507,185,370 | ) | (781,200,981 | ) | ||||||
|
Assets held for sale |
(12,608,829 | ) | (587,007 | ) | - | |||||||
|
Adjustment of fully depreciated asset |
(80,660,536 | ) | (56,774,522 | ) | (8,628,954 | ) | ||||||
|
Adjustment of property carrying values |
(91,204,249 | ) | (18,432,226 | ) | (32,935,408 | ) | ||||||
|
Change in exchange rate |
598,744 | (10,044,014 | ) | (31,158,903 | ) | |||||||
|
Balance, end of period |
$ | 12,008,075,148 | $ | 11,568,809,126 | $ | 10,018,225,775 | ||||||
The changes in accumulated depreciation for the years ended December 31, 2016, 2015, and 2014 are as follows:
|
2016 |
2015 |
2014 |
||||||||||
|
Balance, beginning of period |
$ | 2,115,319,888 | $ | 1,955,405,720 | $ | 1,878,680,836 | ||||||
|
Depreciation for year |
344,179,201 | 333,948,605 | 256,088,382 | |||||||||
|
Transfers from (to) unconsolidated joint ventures |
- | - | - | |||||||||
|
Sales |
(97,063,934 | ) | (116,864,875 | ) | (167,458,882 | ) | ||||||
|
Adjustment of fully depreciated asset |
(80,660,536 | ) | (56,774,522 | ) | (8,628,954 | ) | ||||||
|
Assets held for sale |
(3,482,974 | ) | - | - | ||||||||
|
Change in exchange rate |
- | (395,040 | ) | (3,275,662 | ) | |||||||
|
Balance, end of period |
$ | 2,278,291,645 | $ | 2,115,319,888 | $ | 1,955,405,720 | ||||||
KIMCO REALTY CORPORATION AND SUBSIDIARIES
Schedule IV - Mortgage Loans on Real Estate
As of December 31, 2016
(in thousands)
|
Type of Loan/Borrower |
Description |
Location (c) |
Interest Accrual Rates |
Interest Payment Rates |
Final Maturity Date |
Periodic Payment Terms (a) |
Prior Liens |
Face Amount of Mortgages or Maximum Available Credit (b) |
Carrying Amount of Mortgages (b) (c) |
||||||||||||||||
|
Mortgage Loans: |
|||||||||||||||||||||||||
|
Borrower A |
Retail |
Toronto, ON |
5.00% | 5.00% |
7/31/2017 |
P& I |
- | $ | 5,730 | $ | 5,314 | ||||||||||||||
|
Borrower B |
Retail |
Westport, CT |
6.50% | 6.50% |
3/4/2033 |
I |
- | $ | 5,014 | $ | 5,014 | ||||||||||||||
|
Borrower C |
Retail |
Las Vegas, NV |
12.00% | 12.00% |
5/14/2033 |
I |
- | $ | 3,075 | $ | 3,075 | ||||||||||||||
|
Borrower D |
Retail |
Miami, FL |
7.57% | 7.57% |
6/1/2019 |
P& I |
- | $ | 3,966 | $ | 2,078 | ||||||||||||||
|
Borrower E |
Retail |
Miami, FL |
7.57% | 7.57% |
6/1/2019 |
P& I |
- | $ | 4,201 | $ | 2,037 | ||||||||||||||
|
Borrower F |
Retail |
Miami, FL |
7.57% | 7.57% |
6/1/2019 |
P& I |
- | $ | 3,678 | $ | 1,923 | ||||||||||||||
|
Borrower G |
Nonretail |
Oakbrook Terrace, IL |
6.00% | 6.00% |
12/9/2024 |
I |
- | $ | 1,950 | $ | 1,950 | ||||||||||||||
| - | |||||||||||||||||||||||||
|
Individually < 3% |
(d) | (e) | (e) | (f) | - | 2,922 | 1,393 | ||||||||||||||||||
| 30,536 | 22,784 | ||||||||||||||||||||||||
|
Other: |
|||||||||||||||||||||||||
|
Individually < 3% |
Nonretail |
2.28% | 2.28% |
4/1/2027 |
600 | 407 | |||||||||||||||||||
|
Capitalized loan costs |
- | 6 | |||||||||||||||||||||||
|
Total |
$ | 31,136 | $ | 23,197 | |||||||||||||||||||||
(a) I = Interest only; P&I = Principal & Interest
(b) The instruments actual cash flows are denominated in U.S. dollars and Canadian dollars as indicated by the geographic location above
(c) The aggregate cost for Federal income tax purposes is $23.2 million
(d) Comprised of four separate loans with original loan amounts ranging between $0.2 million and $0.4 million
(e) Interest rates range from 6.88% to 9.00%
(f) Maturity dates range from October 19, 2019 to December 1, 2030
For a reconciliation of mortgage and other financing receivables from January 1, 2014 to December 31, 2016 see Footnote 11 of the Notes to Consolidated Financial Statements included in this Form 10-K.
The Company feels it is not practicable to estimate the fair value of each receivable as quoted market prices are not available.
The cost of obtaining an independent valuation on these assets is deemed excessive considering the materiality of the total receivables.
90