|
|
|
|
|
|
|
|
|
|
|
|
|
|
|
|
|
|
|
|
|
|
|
|
|
|
|
|
|
|
|
|
|
|
|
|
|
|
|
|
|
|
|
|
|
|
|
|
|
|
|
|
|
|
|
|
|
|
|
UNITED STATES
SECURITIES AND EXCHANGE COMMISSION
Washington, D.C. 20549
FORM
For the fiscal year ended
OR
For the transition period from __________ to __________
Commission file number
Commission file number
(Exact name of registrant as specified in its charter)
|
|
|
|
|
(State or other jurisdiction of incorporation or organization) |
(I.R.S. Employer Identification No.) |
(Address of principal executive offices) (Zip Code)
(
(Registrant’s telephone number, including area code)
Securities registered pursuant to Section 12(b) of the Act:
Kimco Realty Corporation
|
Title of each class |
Trading Symbol(s) |
Name of each exchange on which registered |
|
|
|
|
|
|
|
|
|
|
|
|
|
|
|
Kimco Realty OP, LLC
|
Title of each class |
Trading Symbol(s) |
Name of each exchange on which registered |
|
|
None |
N/A |
N/A |
Securities registered pursuant to section 12(g) of the Act: None
Indicate by check mark if the registrant is a well-known seasoned issuer, as defined in Rule 405 of the Securities Act.
Kimco Realty Corporation
Indicate by check mark if the registrant is not required to file reports pursuant to Section 13 or Section 15(d) of the Act.
Kimco Realty Corporation
Yes ☐
Indicate by check mark whether the registrant (1) has filed all reports required to be filed by Section 13 or 15(d) of the Securities Exchange Act of 1934 during the preceding 12 months (or for such shorter period that the registrant was required to file such reports), and (2) has been subject to such filing requirements for the past 90 days.
Kimco Realty Corporation
Indicate by check mark whether the registrant has submitted electronically every Interactive Data File required to be submitted pursuant to Rule 405 of Regulation S-T (§ 232.405 of this chapter) during the preceding 12 months (or for such shorter period that the registrant was required to submit such files).
Kimco Realty Corporation
Indicate by check mark whether the registrant is a large accelerated filer, an accelerated filer, a non-accelerated filer, a smaller reporting company, or an emerging growth company. See the definitions of “large accelerated filer,” “accelerated filer,” “smaller reporting company,” and “emerging growth company” in Rule 12b-2 of the Exchange Act.
Kimco Realty Corporation:
|
|
Accelerated filer ☐ | Non-accelerated filer ☐ |
Smaller reporting company
|
Emerging growth company
|
Kimco Realty OP, LLC:
| Large accelerated filer ☐ | Accelerated filer ☐ |
|
Smaller reporting company
|
Emerging growth company
|
If an emerging growth company, indicate by check mark if the registrant has elected not to use the extended transition period for complying with any new or revised financial accounting standards provided pursuant to Section 13(a) of the Exchange Act.
Kimco Realty Corporation ☐ Kimco Realty OP, LLC ☐
Indicate by check mark whether the registrant has filed a report on and attestation to its management’s assessment of the effectiveness of its internal control over financial reporting under Section 404(b) of the Sarbanes-Oxley Act (15 U.S.C. 7262(b)) by the registered public accounting firm that prepared or issued its audit report.
Kimco Realty Corporation
Indicate by check mark whether the registrant is a shell company (as defined in Rule 12b-2 of the Act).
Kimco Realty Corporation
Yes
The aggregate market value of the voting and non-voting common equity held by non-affiliates of Kimco Realty Corporation was approximately $
(APPLICABLE ONLY TO CORPORATE REGISTRANTS)
Indicate the number of shares outstanding of each of the registrant's classes of common stock, as of the latest practicable date.
As of February 10, 2023, Kimco Realty Corporation had
DOCUMENTS INCORPORATED BY REFERENCE
Part III incorporates certain information by reference to the Kimco Realty Corporation's definitive proxy statement to be filed with respect to the Annual Meeting of Stockholders expected to be held on April 25, 2023.
Index to Exhibits begins on page 46.
KIMCO REALTY CORPORATION
KIMCO REALTY OP, LLC
ANNUAL REPORT ON FORM 10-K
FISCAL YEAR ENDED DECEMBER 31, 2022
EXPLANATORY NOTE
Prior to January 1, 2023, the business of Kimco Realty Corporation (the “Company”) was conducted through a predecessor entity also known as Kimco Realty Corporation (the “Predecessor”). On December 14, 2022, the Predecessor’s Board of Directors approved the entry into an Agreement and Plan of Merger (the “UPREIT Merger”) with the company formerly known as New KRC Corp., which was a Maryland corporation and wholly owned subsidiary of the Predecessor (the “Parent Company”), and KRC Merger Sub Corp., which was a Maryland corporation and wholly owned subsidiary of the Parent Company (“Merger Sub”), to effect the reorganization (the “Reorganization”) of the Predecessor’s business into an umbrella partnership real estate investment trust, or “UPREIT”.
On January 1, 2023, pursuant to the UPREIT Merger, Merger Sub merged with and into the Predecessor, with the Predecessor continuing as the surviving entity and a wholly-owned subsidiary of the Parent Company, and each outstanding share of capital stock of the Predecessor was converted into one equivalent share of capital stock of the Parent Company (each of which has continued to trade under their respective existing ticker symbol with the same rights, powers and limitations that existed immediately prior to the Reorganization).
In connection with the Reorganization, the Parent Company changed its name to Kimco Realty Corporation, and replaced the Predecessor as the New York Stock Exchange-listed public company. Effective as of January 3, 2023, the Predecessor converted into a limited liability company, organized in the State of Delaware, known as Kimco Realty OP, LLC, the entity we refer to herein as “Kimco OP”.
Following the Reorganization, substantially all of the Company’s assets are held by, and substantially all of the Company’s operations are conducted through, Kimco OP (either directly or through its subsidiaries), as the Company’s operating company, and the Company is the managing member of Kimco OP. The officers and directors of the Company are the same as the officers and directors of the Predecessor immediately prior to the Reorganization.
This Annual Report on Form 10-K (“Form 10-K” or “Annual Report”) pertains to the business and results of operations of the Predecessor for its fiscal year ended December 31, 2022. The Company and Kimco OP have elected to co-file such Annual Report of the Predecessor to ensure continuity of information to investors.
For additional information on our Reorganization, please see our Current Reports on Form 8-K filed with the SEC on January 3, 2023 and January 4, 2023.
Throughout this Annual Report, unless the context requires otherwise:
|
● |
the “Company,” “we,” “our,” “us” or refer to: | |
| ○ for the period prior to January 1, 2023 (the period preceding the UPREIT Merger), the Predecessor and its business and operations conducted through its directly or indirectly owned subsidiaries; | ||
| ○ for the period on or after January 1, 2023, (the period from and following the UPREIT Merger), the Parent Company and its business and operations conducted through its directly or indirectly owned subsidiaries, including Kimco OP; and | ||
| ○ in statements regarding qualification as a real estate investment trust (“REIT”), such terms refer solely to the Predecessor or Parent Company, as applicable. |
|
● |
“Kimco OP” refers to Kimco Realty OP, LLC, our operating company following the UPREIT Merger. |
|
● |
References to “shares” and “shareholders” refer to the shares and stockholders of the Predecessor prior to January 1, 2023 and of the Parent Company on or after January 1, 2023, and not the limited liability company interests of Kimco OP. |
|
Item No . |
Form 10-K
|
FORWARD-LOOKING STATEMENTS
This annual report on Form 10-K (“Form 10-K”), together with other statements and information publicly disseminated by the Company contains certain forward-looking statements within the meaning of Section 27A of the Securities Act of 1933, as amended (the “Securities Act”), and Section 21E of the Securities Exchange Act of 1934, as amended (the “Exchange Act”). The Company intends such forward-looking statements to be covered by the safe harbor provisions for forward-looking statements contained in the Private Securities Litigation Reform Act of 1995 and includes this statement for purposes of complying with the safe harbor provisions. Forward-looking statements, which are based on certain assumptions and describe the Company’s future plans, strategies and expectations, are generally identifiable by use of the words “believe,” “expect,” “intend,” “commit,” “anticipate,” “estimate,” “project,” “will,” “target,” “forecast” or similar expressions. You should not rely on forward-looking statements since they involve known and unknown risks, uncertainties and other factors which, in some cases, are beyond the Company’s control and could materially affect actual results, performances or achievements. Factors which may cause actual results to differ materially from current expectations include, but are not limited to, (i) general adverse economic and local real estate conditions, (ii) the impact of competition, including the availability of acquisition or development opportunities and the costs associated with purchasing and maintaining assets; (iii) the inability of major tenants to continue paying their rent obligations due to bankruptcy, insolvency or a general downturn in their business, (iv) the reduction in the Company’s income in the event of multiple lease terminations by tenants or a failure of multiple tenants to occupy their premises in a shopping center, (v) the potential impact of e-commerce and other changes in consumer buying practices, and changing trends in the retail industry and perceptions by retailers or shoppers, including safety and convenience, (vi) the availability of suitable acquisition, disposition, development and redevelopment opportunities, and risks related to acquisitions not performing in accordance with our expectations, (vii) the Company’s ability to raise capital by selling its assets, (viii) disruptions and increases in operating costs due to inflation and supply chain issues, (ix) risks associated with the development of mixed-use commercial properties, including risks associated with the development and ownership of non-retail real estate, (x) changes in governmental laws and regulations, including, but not limited to, changes in data privacy, environmental (including climate change), safety and health laws, and management’s ability to estimate the impact of such changes, (xi) valuation and risks related to the Company’s joint venture and preferred equity investments and other investments, (xii) valuation of marketable securities and other investments, including the shares of Albertsons Companies, Inc. common stock held by the Company, (xiii) impairment charges, (xiv) criminal cybersecurity attacks disruption, data loss or other security incidents and breaches, (xv) impact of natural disasters and weather and climate-related events, (xvi) pandemics or other health crises, such as coronavirus disease 2019 (“COVID-19”), (xvii) our ability to attract, retain and motivate key personnel, (xviii) financing risks, such as the inability to obtain equity, debt or other sources of financing or refinancing on favorable terms to the Company, (xix) the level and volatility of interest rates and management’s ability to estimate the impact thereof, (xx) changes in the dividend policy for the Company’s common and preferred stock and the Company’s ability to pay dividends at current levels, (xxi) unanticipated changes in the Company’s intention or ability to prepay certain debt prior to maturity and/or hold certain securities until maturity, and (xxii) the Company’s ability to continue to maintain its status as a REIT for federal income tax purposes and potential risks and uncertainties in connection with its UPREIT structure, and (xxiii) the other risks and uncertainties identified under Item 1A, “Risk Factors” and elsewhere in this Form 10-K and in the Company’s other filings with the Securities and Exchange Commission (“SEC”). Accordingly, there is no assurance that the Company’s expectations will be realized. The Company disclaims any intention or obligation to update the forward-looking statements, whether as a result of new information, future events or otherwise. You are advised to refer to any further disclosures the Company makes or related subjects in the Company’s quarterly reports on Form 10-Q and current reports on Form 8-K that the Company files with the SEC.
Overview
The Company is North America’s largest publicly traded owner and operator of open-air, grocery-anchored shopping centers, and a growing portfolio of mixed-use assets. The Company’s mission is to create destinations for everyday living that inspire a sense of community and deliver value to our many stakeholders.
The Company began operations through its predecessor, The Kimco Corporation, which was organized in 1966 upon the contribution of several shopping center properties owned by its principal stockholders. In 1973, these principals formed the Company as a Delaware corporation, and, in 1985, the operations of The Kimco Corporation were merged into the Company. The Company completed its initial public stock offering (the “IPO”) in November 1991, and, commencing with its taxable year which began January 1, 1992, elected to qualify as a REIT in accordance with Sections 856 through 860 of the Internal Revenue Code of 1986, as amended (the “Code”). To qualify as a REIT, the Company must meet several organizational and operational requirements, and is required to annually distribute at least 90% of its net taxable income, determined without regard to the dividends paid deduction and excluding any net capital gain. In addition, the Company will be subject to federal income tax at regular corporate rates to the extent that it distributes less than 100% of its net taxable income, including any net capital gains. In January of 2023, the Company consummated the Reorganization into an UPREIT structure as described in the Explanatory Note at the beginning of this Annual Report. If, as the Company believes, it is organized and operates in such a manner so as to qualify and remain qualified as a REIT under the Code, the Company, generally will not be subject to U.S. federal income tax, provided that distributions to its stockholders equal at least the amount of its REIT taxable income, as defined in the Code. The Company maintains certain subsidiaries that made joint elections with the Company to be treated as taxable REIT subsidiaries (“TRSs”), that permit the Company to engage through such TRSs in certain business activities that the REIT may not conduct directly. A TRS is subject to federal and state taxes on its income, and the Company includes a provision for taxes in its consolidated financial statements. In 1994, the Predecessor reorganized as a Maryland corporation. In March 2006, the Predecessor was added to the S&P 500 Index, an index containing the stock of 500 Large Cap companies, most of which are U.S. corporations. The Company's common stock, Class L Depositary Shares and Class M Depositary Shares are traded on the New York Stock Exchange (“NYSE”) under the trading symbols “KIM”, “KIMprL”, and “KIMprM”, respectively.
The Company is a self-administered REIT and has not engaged, nor does it expect to retain, any REIT advisors in connection with the operation of its properties. The Company’s ownership interests in real estate consist of its consolidated portfolio and portfolios where the Company owns an economic interest, such as properties in the Company’s investment real estate management programs, where the Company partners with institutional investors and also retains management.
The Company began to expand its operations through the development of real estate and the construction of shopping centers but revised its growth strategy to focus on the acquisition and redevelopment of existing shopping centers that include a grocery component. The Company also expanded internationally within Canada, Mexico, Chile, Brazil and Peru, but has since exited all international investments. Additionally, the Company developed various residential and mixed-use operating properties and continues to obtain entitlements to embark on additional projects of this nature through re-development opportunities. In August 2021, the Company expanded through a merger with Weingarten Realty Investors (“Weingarten”), whereby Weingarten merged with and into the Predecessor, with the Predecessor continuing as the surviving public company (the “Merger”), pursuant to the definitive merger agreement (the “Merger Agreement”) between the Predecessor and Weingarten which was entered into on April 15, 2021. The Merger brought together two industry-leading retail real estate platforms with highly complementary portfolios and created the preeminent open-air shopping center and mixed-use real estate owner in the country. The Merger further enhanced the Company’s portfolio in coastal and sun belt regions.
The Company has implemented its investment real estate management format through the establishment of various institutional joint venture programs, in which the Company has noncontrolling interests. The Company earns management fees, acquisition fees, disposition fees as well as promoted interests based on achieving certain performance metrics.
In addition, the Company has capitalized on its established expertise in retail real estate by establishing other ventures in which the Company owns a smaller equity interest and provides management, leasing and operational support for those properties. The Company has also provided preferred equity capital to real estate professionals and, from time to time, provides real estate capital and management services to both healthy and distressed retailers. The Company has also made selective investments in secondary market opportunities where a security or other investment is, in management’s judgment, priced below the value of the underlying assets, however these investments are subject to volatility within the equity and debt markets.
As described in greater detail in the Explanatory Note to this Form 10-K, (i) on January 1, 2023, as a result of the Reorganization, the Parent Company, a Maryland corporation, became the successor issuer to the Predecessor, and (ii) on January 3, 2023 the Predecessor converted into Kimco OP, a limited liability company, organized in the State of Delaware. Parent Company is the managing member of Kimco OP and owns 100% of the limited liability company interests, and exercises exclusive control over Kimco OP.
As of December 31, 2022, the Company had interests in 532 shopping center properties (the “Combined Shopping Center Portfolio”), aggregating 90.8 million square feet of gross leasable area (“GLA”), located in 28 states. In addition, the Company had 23 other property interests, primarily through the Company’s preferred equity investments and other investments, totaling 5.7 million square feet of GLA.
Economic Conditions
The economy continues to face several issues including the lack of qualified employees, inflation risk, supply chain issues and new COVID-19 variants, which could impact the Company and its tenants. In response to the rising rate of inflation the Federal Reserve has steadily increased interest rates, and may continue to increase interest rates, until the rate of inflation begins to decrease. These increases in interest rates could adversely impact the business and financial results of the Company and its tenants. In addition, slower economic growth and the potential for a recession could have an adverse effect on the Company and its tenants. This could negatively affect the overall demand for retail space, including the demand for leasable space in the Company’s properties. As a result, the Company could feel pricing pressure on rents that it is able to charge to new or renewing tenants, such that future rents and rent spreads could be negatively impacted. Any of these events could materially adversely impact the Company’s business, financial condition, results of operations or stock price. The Company continues to monitor economic, financial, and social conditions and will assess its asset portfolio for any impairment indicators. If the Company determines that any of its assets are impaired, the Company would be required to take impairment charges, and such amounts could be material.
Business Objective and Strategies
The Company has developed a strong nationally diversified portfolio of open-air, shopping centers located in drivable first-ring suburbs primarily within 19 major metropolitan sun belt and coastal markets, which are supported by strong demographics, significant projected population growth, and where the Company perceives significant barriers to entry. As of December 31, 2022, the Company derived 85% of its annualized base rent from these top major metro markets. The Company’s shopping centers provide essential, necessity-based goods and services to the local communities and are primarily anchored by grocers, home improvement, and pharmacy.
The Company’s focus on high-quality locations has led to significant opportunities for value creation through the reinvestment in its assets to add density, replace outdated shopping center concepts, and better meet changing consumer demands. In order to add density to existing properties, the Company has obtained multi-family entitlements for 8,818 units of which 2,218 units have been constructed as of December 31, 2022. The Company continues to place strategic emphasis on live/work/play environments and in reinvesting in its existing assets, while building shareholder value. This philosophy is exemplified by the Company’s Signature Series TM properties which include key value creation projects in our portfolio that exemplify our transformation and highlight our focus on quality, concentration around core MSAs, and growth through redevelopment and development opportunities. Signature Series properties also include fully entitled, shovel-ready mixed-use projects, and opportunities that we continue to identify and entitle as we seek to achieve the highest and best use of our real estate, enhance our communities, and create value for our stakeholders for years to come.
The strength and security of the Company’s balance sheet remains central to its strategy. The Company’s strong balance sheet and liquidity position are evidenced by its investment grade unsecured debt ratings (Baa1/BBB+) by two major ratings agencies. The Company maintains one of the longest weighted average debt maturity profiles in the REIT industry, now at 9.5 years. The Company expects to continue to take steps to reduce leverage, unencumber assets and improve its debt coverage metrics as mixed-use projects and redevelopments continue to come online and contribute additional cash flow growth.
Business Objective
The Company’s primary business objective is to be the premier owner and operator of open-air, grocery-anchored shopping centers, and a growing portfolio of mixed-use assets, in the U.S. The Company believes it can achieve this objective by:
|
● |
increasing the value of its existing portfolio of properties and generating higher levels of portfolio growth; |
|
● |
increasing cash flows for reinvestment and/or for distribution to shareholders while maintaining conservative payout ratios; |
|
● |
improving debt metrics and upgraded unsecured debt ratings |
|
● |
continuing growth in desirable demographic areas with successful retailers, primarily focused on grocery anchors; and |
|
● |
increasing the number of entitlements for residential use. |
Business Strategies
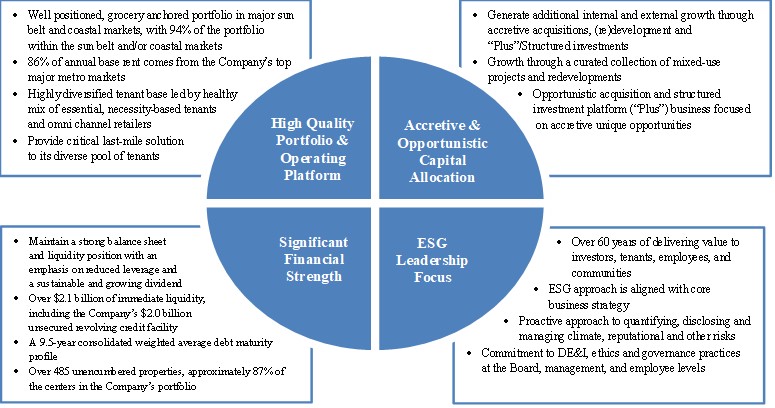
The Company believes with its strong core portfolio and its recent acquisitions, it will continue to achieve higher occupancy levels, increased rental rates and rental growth in the future. To effectively execute the Company’s strategy and achieve its strategic goals the Company identified the following growth components to focus on:
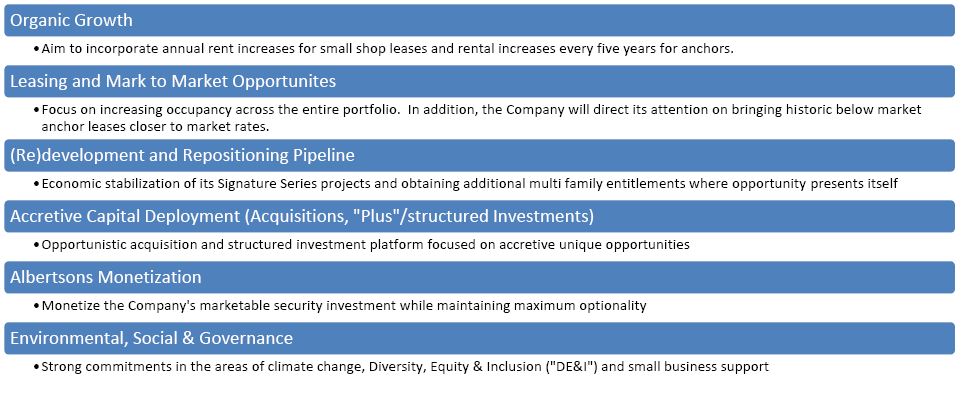
The Company believes it is well positioned for sustainable growth with its high-quality portfolio, accretive and opportunistic capital allocation, financial strength and environmental, social and governance leadership.
The Company has identified the following areas where it is well positioned for sustainable growth in the future.
The Company reduces its operating and leasing risks through diversification achieved by the geographic distribution of its properties and a large tenant base. As of December 31, 2022, no single open-air shopping center accounted for more than 1.3% of the Company's annualized base rental revenues, including the proportionate share of base rental revenues from properties in which the Company has less than a 100% economic interest, or more than 1.4% of the Company’s total shopping center GLA. Furthermore, at December 31, 2022, the Company’s single largest tenant represented only 3.7%, and the Company’s five largest tenants aggregated less than 11.4%, of the Company’s annualized base rental revenues, including the proportionate share of base rental revenues from properties in which the Company has less than a 100% economic interest.
As one of the original participants in the growth of the shopping center industry and the nation's largest owners and operators of open-air shopping centers, the Company has established close relationships with major national and regional retailers and maintains a broad network of industry contacts. Management is associated with and/or actively participates in many shopping center and REIT industry organizations. Notwithstanding these relationships, there are numerous regional and local commercial developers, real estate companies, financial institutions and other investors who compete with the Company for the acquisition of properties and other investment opportunities and in seeking tenants who will lease space in the Company’s properties.
Government Regulation
Compliance with various governmental regulations has an impact on our business, including our capital expenditures, earnings and competitive position, which can be material. We incur costs to monitor and take actions to comply with governmental regulations that are applicable to our business, which include, among others, federal securities laws and regulations, applicable stock exchange requirements, REIT and other tax laws and regulations, environmental and health and safety laws and regulations, local zoning, usage and other regulations relating to real property and the Americans with Disabilities Act of 1990.
In addition, see Item 1A. Risk Factors for a discussion of material risks to us, including, to the extent material, to our competitive position, relating to governmental regulations, and see “Item 7. Management’s Discussion and Analysis of Financial Condition and Results of Operations” together with our audited consolidated financial statements and the related notes thereto for a discussion of material information relevant to an assessment of our financial condition and results of operations, including, to the extent material, the effects that compliance with governmental regulations may have upon our capital expenditures and earnings.
Human Capital Resources
The Company believes that our associates are one of our strongest resources and that a variety of perspectives and experiences found in a diverse workforce spark innovation and enrich company culture. The Company is committed to diversity, equity and inclusion best practices in all phases of the associate life cycle, including recruitment, training and development and promotion. By cultivating high levels of associate satisfaction and improving the diversity of our team, management’s goal is to ensure the Company will remain a significant driving force in commercial real estate well into the future.
The Company has been and will continue to be an equal opportunity employer committed to hiring, developing, and supporting a diverse, equitable, and inclusive workplace. To ensure full implementation of this equal employment policy, we take steps to ensure that persons are recruited, hired, assigned and promoted without regard to race, creed, national origin, ancestry, citizenship status, religion, age, color, sex, gender (including pregnancy, childbirth and related medical conditions), gender identity and expression, sexual orientation, marital status, disability, genetic information, protected veteran status, or any other characteristic protected by local, state, or federal laws, rules, or regulations. All of our employees must adhere to a Code of Business Conduct and Ethics that sets standards for appropriate behavior and includes required, regular internal training on preventing, identifying, reporting and stopping any type of discrimination and/or retaliation.
To attract and retain high performing individuals, we are committed to partnering with our associates to provide opportunities for their professional development and promote their health and well-being. We offer a broad range of benefits, and we believe our compensation package and benefits are competitive with others in our industry. Our benefits programs include a robust offering of medical, dental, vision, life, disability and a number of exciting ancillary benefits, all of which require very low associate contributions or are offered at no cost to associates. The Company also provides a Safe Harbor 401(k) program with both pretax and Roth offering including a robust, fully vested matching contribution.
The Company has been recognized as a Great Place to Work® for five consecutive years as well as a One of the 2022 Best Workplaces in Real Estate™, both of which are based on anonymous third-party surveys and feedback collected from our associates. Additionally, the Company was designated a Best Place to Work for LGBTQ+ Equality and has achieved a perfect score on the Human Rights Campaign Foundation’s 2022 Corporate Equality Index, a nationally recognized benchmarking survey and report measuring corporate policies and practices related to LGBTQ+ workplace equality.
The Company operates under a hybrid work model, which balances associates’ need for valuable face-to-face interactions with individual preferences for ideal work conditions. By continuing to focus on communication, collaboration, and innovation, and by encouraging associates to protect their personal time and be deliberate in where and how they choose to work, management is confident that the model results in a happier, engaged, and more efficient workforce.
The Company’s executive and management team promotes a true “open door” environment in which all feedback and suggestions are welcome. Whether it be through regular all employee calls, department meetings, frequent training sessions, Coffee Connections with the executive team, use of our BRAVO recognition program, awarding of iPads for Ideas, or participation in our LABS (Leaders Advancing Business Strategy) program, associates are encouraged to be inquisitive and share ideas. Those ideas have resulted in a number of programs and benefit enhancements.
The Company promotes physical health, including access to a national gym membership program for associates and their family members as well as host to regular wellness and nutrition seminars and health screenings. The Company also feels it is important that our associates are engaged and active in the community. Across our numerous offices, associates host volunteer and social activities. Whether we’re participating in walks, runs, food or toy drives, the Company promotes and supports associate volunteerism with two volunteer days off per year and a company matching program in support of each associates charitable endeavors. The Company also encourages associates to directly drive strategy around the Company’s environmental, social and governance initiatives through participation in five associate-driven KIMunity Councils focused in the areas of diversity, equity and inclusion, giving, wellness, sustainability, and tenant engagement.
The Company recognizes the importance of advanced education. Each year, the Company funds $100,000 in college scholarships to benefit the children of our associates. In addition, the Company recently announced, in partnership with ICSC, it is providing $100,000 in scholarships to students wishing to pursue careers in real estate, of which no less than 50% will be awarded to students of under-represented groups. Both programs are managed by independent third parties who consider an equal balance of academics and financial need as determining factors.
The Company's executive offices are located at 500 North Broadway, Suite 201, Jericho, NY 11753, a mixed-use property that is wholly owned by the Company, and its telephone number is (516) 869-9000 or 1-800-764-7114. Nearly all corporate functions, including legal, data processing, finance and accounting are administered by the Company from its executive offices in Jericho, New York and supported by the Company’s regional offices. As of December 31, 2022, a total of 639 persons were employed by the Company, of which 31% were located in our corporate office with the remainder located in 28 offices throughout the United States. The average tenure of our employees was 9.0 years.
Cybersecurity
The Company’s Audit Committee receives quarterly briefings from the Company’s Chief Information Officer regarding the emerging cybersecurity threat and risk landscape as well as the Company’s security program and related readiness, resiliency, and response efforts.
The Company has a Cyber Risk Committee (“Cyber Committee”) which reviews and reports on technology-based security issues. The Cyber Committee is comprised of senior management from various business units within the Company and meets quarterly to review the status of the Company’s overall security program as well as controls and procedures and to stay up-to-date of relevant legislative, regulatory and technical developments.
The Company utilizes a variety of administrative, technical and physical safeguards that take into account the nature of our IT environment, information assets and cyber risks posed by both internal and external threats. The Company has incorporated cybersecurity coverage in its insurance policies. The Company’s goal is to keep its data and systems, as well as its employees safe from cybersecurity threats.
The Company conducts employee security awareness training and internal phishing exercises. When security issues arise, the Company conducts a prompt investigation and initiates response protocols and other measures to protect the Company and its valued employees and key stakeholders.
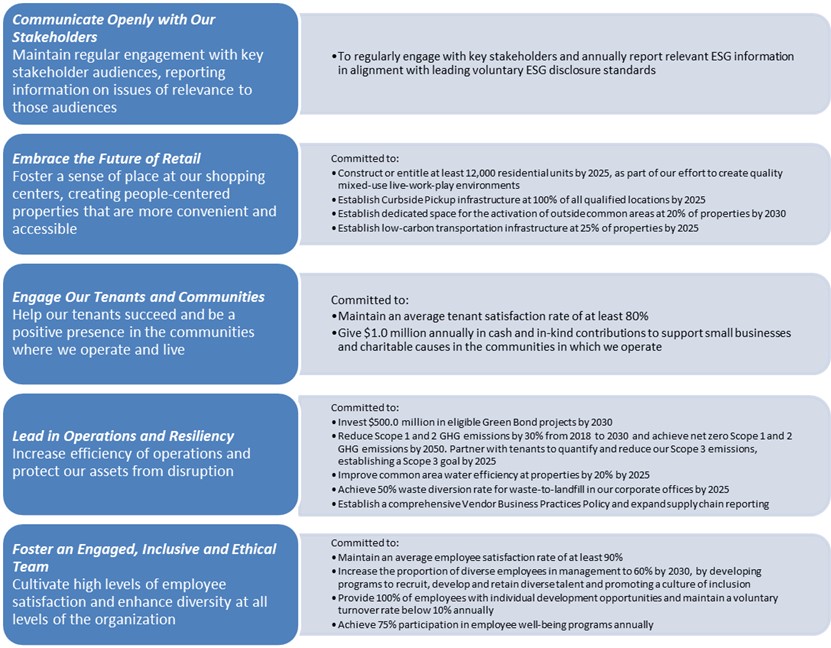
Environmental, Social and Governance ( “ ESG ” ) Programs
The Company strives to build a thriving and viable business, one that succeeds by delivering long-term value for its stakeholders. We believe that the Company’s ESG programs are aligned with its core business strategy of creating destinations for everyday living that inspire a sense of community and deliver value to its many stakeholders.
The Company has identified the following five pillars that outline the Company’s current strategic priorities within our ESG program. The Company has defined 16 ESG goals that expand upon the Company’s commitment with clear targets in each pillar:
The Company has aligned its annual reporting with standards from the Global Reporting Initiative (“GRI”), Sustainability Accounting Standards Board (“SASB”) and Task Force on Climate-related Financial Disclosures (“TCFD”). The Company also discloses aggregate-level EEO-1 workforce diversity data that can be found on the Company’s website, which data and website contents are not incorporated by reference hereto. Additional ESG information of relevance to stakeholders can be found on the Company’s website, the contents of which are not incorporated by reference and do not form a part of this Form 10-K.
The Company’s Board of Directors sets the Company’s overall ESG program objectives and oversees enterprise risk management. The Nominating and Corporate Governance Committee of the Board of Directors is responsible for overseeing the Company's efforts with regard to the Company's ESG matters.
The Company recognizes that climate change is one of the most significant stakeholder issues of our times, threatening the viability of economic and environmental systems globally. The scientific community has studied climate change and a consensus exists that warming is occurring outside the boundaries of historical planetary trends due in significant part, to human activity. As a real estate portfolio owner, the Company monitors physical and transition risks as well as opportunities posed to its business by climate change and quantifies and discloses the climate impacts of its activities. The Company’s science-based GHG emissions reduction goals are aligned with the Paris Climate Accord and while there can be no guarantees, we believe they could put the Company on pace to achieve Scope 1 and Scope 2 net zero GHG emissions by 2050.
Climate risks and opportunities are generally evaluated at both the corporate and individual asset level. The following table summarizes relevant climate risks identified as a part of the Company’s ongoing risk assessment process. The Company may be subject to other climate risks not included below.
|
Climate Risk |
Description |
|
|
Physical |
||
|
Windstorms |
Increased frequency and intensity of windstorms, such as hurricanes, could lead to property damage, loss of property value and interruptions to business operations |
|
|
Sea Level Rise |
Rising sea levels could lead to storm surge and other potential impacts for low-lying coastal properties leading to damage, loss of property value and interruptions to business operations |
|
|
Flooding |
Change in rainfall conditions leading to increased frequency and severity of flooding could lead to property damage, loss of property value and interruptions to business operations |
|
|
Wildfires |
Change in fire potential could lead to permanent loss of property, stress on human health (air quality) and stress on ecosystem services |
|
|
Heat and Water Stress |
Increases in temperature could lead to droughts and decreased available water supply could lead to higher utility usage, supply interruptions and reputational issues in local communities |
|
|
Transition |
||
|
Regulation |
Regulations at the federal, state and local levels could impose additional operating and capital costs associated with utilities, energy efficiency, building materials and building design |
|
|
Reputation |
Increased interest among retail tenants in building efficiency, sustainable design criteria and "green leases", which incorporate provisions intended to promote sustainability at the property, could result in decreased demand for outdated space |
|
The Company’s approach in mitigating these risks include but are not limited to (i) carrying additional insurance coverage relating to flooding and windstorms, (ii) maintaining a geographically diversified portfolio, which limits exposure to event driven risks and (iii) creating a form “green lease” for its tenants which incorporates varied criteria that align landlord and tenant sustainability priorities as well as establishing green construction criteria.
In 2020, the Company issued $500.0 million in 2.70% notes due 2030 in its inaugural green bond offering. The net proceeds from this offering are allocated to finance or refinance, in whole or in part, recently completed, existing or future eligible green projects, with projects are to be aligned with the four core components of the Green Bond Principles, 2018 as administered by the International Capital Market Association. Additionally, the Company’s $2.0 billion Credit Facility (as defined below) is a green credit facility which incorporates rate adjustments associated with attainment (or nonattainment) of Scope 1 and 2 greenhouse gas emissions reductions.
Information About Our Executive Officers
The following table sets forth information with respect to the executive officers of the Company as of December 31, 2022:
|
Name |
Age |
Position |
Joined Kimco |
|
Milton Cooper |
93 |
Executive Chairman of the Board of Directors |
Co-Founder |
|
Conor C. Flynn |
42 |
Chief Executive Officer |
2003 |
|
Ross Cooper |
40 |
President and Chief Investment Officer |
2006 |
|
Glenn G. Cohen |
58 |
Executive Vice President,
|
1995 |
|
David Jamieson |
42 |
Executive Vice President,
|
2007 |
Available Information
The Company’s website is located at http://www.kimcorealty.com . The information contained on our website does not constitute part of this Form 10-K. On the Company’s website you can obtain, free of charge, a copy of this Form 10-K, quarterly reports on Form 10-Q, current reports on Form 8-K and amendments to those reports filed or furnished pursuant to Section 13(a) or 15(d) of the Exchange Act, as soon as reasonably practicable, after we file such material electronically with, or furnish it to, the SEC. The public may read and obtain a copy of any materials we file electronically with the SEC at http://www.sec.gov .
We are subject to certain business and legal risks including, but not limited to, the following:
Risks Related to Our Business and Operations
Adverse global market and economic conditions may impede our ability to generate sufficient income and maintain our properties.
Our properties consist primarily of open-air shopping centers, including mixed-use assets, and other retail properties. Our performance, therefore, is generally linked to economic conditions in the market for retail space. The economic performance and value of our properties is subject to all of the risks associated with owning and operating real estate, including but not limited to:
|
● |
changes in the national, regional and local economic climate; |
|
● |
local conditions, including an oversupply of, or a reduction in demand for, space in properties like those that we own or operate; |
|
● |
trends toward smaller store sizes as retailers reduce inventory and develop new prototypes; |
|
● |
increasing use by customers of e-commerce and online store sites; |
|
● |
the attractiveness of our properties to tenants; |
|
● |
market disruptions due to global pandemics; |
|
● |
the ability of tenants to pay rent, particularly anchor tenants with leases in multiple locations; |
|
● |
tenants who may declare bankruptcy and/or close stores; |
|
● |
competition from other available properties to attract and retain tenants; |
|
● |
changes in market rental rates; |
|
● |
the need to periodically pay for costs to repair, renovate and re-let space; |
|
● |
ongoing consolidation in the retail sector; |
|
● |
the excess amount of retail space in a number of markets; |
|
● |
changes in operating costs, including costs for maintenance, insurance and real estate taxes; |
|
● |
the expenses of owning and operating properties, which are not necessarily reduced when circumstances such as market factors and competition cause a reduction in income from the properties; |
|
● |
changes in laws and governmental regulations, including those governing usage, zoning, the environment and taxes; |
|
● |
acts of terrorism and war and acts of God, including physical and weather-related damage to our properties; |
|
● |
the continued service and availability of key personnel; and |
|
● |
the risk of functional obsolescence of properties over time. |
Competition may limit our ability to purchase new properties or generate sufficient income from tenants and may decrease the occupancy and rental rates for our properties.
Numerous commercial developers and real estate companies compete with us in seeking tenants for our existing properties and properties for acquisition. Open-air shopping centers, including mixed-use assets, or other retail shopping centers with more convenient locations or better rents may attract tenants or cause them to seek more favorable lease terms at or prior to renewal. Retailers at our properties may face increasing competition from other retailers, e-commerce, outlet malls, discount shopping clubs, telemarketing or home shopping networks, all of which could (i) reduce rents payable to us; (ii) reduce our ability to attract and retain tenants at our properties; or (iii) lead to increased vacancy rates at our properties. We may fail to anticipate the effects of changes in consumer buying practices, particularly of growing online sales and the resulting retailing practices and space needs of our tenants or a general downturn in our tenants’ businesses, which may cause tenants to close stores or default in payment of rent.
We face competition in the acquisition or development of real property from others engaged in real estate investment that could increase our costs associated with purchasing and maintaining assets. Some of these competitors may have greater financial resources than we do. This could result in competition for the acquisition of properties for tenants who lease or consider leasing space in our existing and subsequently acquired properties and for other investment or development opportunities.
Our performance depends on our ability to collect rent from tenants, including anchor tenants, our tenants ’ financial condition and our tenants maintaining leases for our properties.
At any time, our tenants may experience a downturn in their business that may significantly weaken their financial condition. As a result, our tenants may delay a number of lease commencements, decline to extend or renew leases upon expiration, fail to make rental payments when due, close stores or declare bankruptcy. Any of these actions could result in the termination of tenants’ leases and the loss of rental income attributable to these tenants’ leases. In the event of a default by a tenant, we may experience delays and costs in enforcing our rights as landlord under the terms of the leases.
In addition, multiple lease terminations by tenants, including anchor tenants, or a failure by multiple tenants to occupy their premises in a shopping center could result in lease terminations or significant reductions in rent by other tenants in the same shopping centers under the terms of some leases. In that event, we may be unable to re-lease the vacated space at attractive rents or at all, and our rental payments from our continuing tenants could significantly decrease. The occurrence of any of the situations described above, particularly involving a substantial tenant with leases in multiple locations, could have a material adverse effect on our financial condition, results of operations and cash flows.
A tenant that files for bankruptcy protection may not continue to pay us rent. A bankruptcy filing by, or relating to, one of our tenants or a lease guarantor would bar all efforts by us to collect pre-bankruptcy debts from the tenant or the lease guarantor, or their property, unless the bankruptcy court permits us to do so. A tenant bankruptcy could delay our efforts to collect past due balances under the relevant leases and could ultimately preclude collection of these sums. If a lease is rejected by a tenant in bankruptcy, we would have only a general unsecured claim for damages. As a result, it is likely that we would recover substantially less than the full value of any unsecured claims we hold, if at all.
E-commerce and other changes in consumer buying practices present challenges for many of our tenants and may require us to modify our properties, diversify our tenant composition and adapt our leasing practices to remain competitive.
Many of our tenants face increasing competition from e-commerce and other sources that could cause them to reduce their size, limit the number of locations and/or suffer a general downturn in their businesses and ability to pay rent. We may also fail to anticipate the effects of changes in consumer buying practices, particularly of growing online sales and the resulting change in retailing practices and space needs of our tenants, which could have an adverse effect on our results of operations and cash flows. We are focused on anchoring and diversifying our properties with tenants that are more resistant to competition from e-commerce (e.g., groceries, essential retailers, restaurants and service providers), but there can be no assurance that we will be successful in modifying our properties, diversifying our tenant composition and/or adapting our leasing practices.
Our expenses may remain constant or increase, even if income from our Combined Shopping Center Portfolio decreases, which could adversely affect our financial condition, results of operations and cash flows.
Costs associated with our business, such as common area expenses, utilities, insurance, real estate taxes, mortgage payments, and corporate expenses are relatively inflexible and generally do not decrease in the event that a property is not fully occupied, rental rates decrease, a tenant fails to pay rent or other circumstances cause our revenues to decrease. In addition, inflation could result in higher operating costs. If we are unable to lower our operating costs when revenues decline and/or are unable to pass along cost increases to our tenants, our financial condition, results of operations and cash flows could be adversely impacted.
We may be unable to sell our real estate property investments when appropriate or on terms favorable to us.
Real estate property investments are illiquid and generally cannot be disposed of quickly. The capitalization rates at which properties may be sold could be higher than historic rates, thereby reducing our potential proceeds from sale. In addition, the Code includes certain restrictions on a REIT’s ability to dispose of properties that are not applicable to other types of real estate companies. Therefore, we may not be able to vary our portfolio in response to economic or other conditions promptly or on terms favorable to us within a time frame that we would need. All of these factors reduce our ability to respond to changes in the performance of our investments and could adversely affect our business, financial condition and results of operations.
Certain properties we own have a low tax basis, which may result in a taxable gain on sale. We may utilize like-kind exchanges qualifying under Section 1031 of the Code (“1031 Exchanges”) to mitigate taxable income; however, there can be no assurance that we will identify properties that meet our investment objectives for acquisitions. In the event that we do not utilize 1031 Exchanges, we may be required to distribute the gain proceeds to shareholders or pay income tax, which may reduce our cash flow available to fund our commitments.
We may acquire or develop properties or acquire other real estate related companies, and this may create risks.
We may acquire or develop properties or acquire other real estate related companies when we believe that an acquisition or development is consistent with our business strategies. We may not succeed in consummating desired acquisitions or in completing developments on time or within budget. When we do pursue a project or acquisition, we may not succeed in leasing newly developed or acquired properties at rents sufficient to cover the costs of acquisition or development and operations. Difficulties in integrating acquisitions may prove costly or time-consuming and could divert management’s attention from other activities. Acquisitions or developments in new markets or industries where we do not have the same level of market knowledge may result in poorer than anticipated performance. We may also abandon acquisition or development opportunities that management has begun pursuing and consequently fail to recover expenses already incurred and will have devoted management’s time to a matter not consummated. Furthermore, our acquisitions of new properties or companies will expose us to the liabilities of those properties or companies, some of which we may not be aware of at the time of the acquisition. In addition, development of our existing properties presents similar risks.
Newly acquired or re-developed properties may have characteristics or deficiencies currently unknown to us that affect their value or revenue potential. It is also possible that the operating performance of these properties may decline under our management. As we acquire additional properties, we will be subject to risks associated with managing new properties, including lease-up and tenant retention. In addition, our ability to manage our growth effectively will require us to successfully integrate our new acquisitions into our existing management structure. We may not succeed with this integration or effectively manage additional properties, particularly in secondary markets. Also, newly acquired properties may not perform as expected.
We face risks associated with the development of mixed-use commercial properties.
We operate, are currently developing, and may in the future develop, properties either alone or through joint ventures with other persons that are known as “mixed-use” developments. This means that in addition to the development of retail space, the project may also include space for residential, office, hotel or other commercial purposes. We have less experience in developing and managing non-retail real estate than we do with retail real estate. As a result, if a development project includes a non-retail use, we may seek to develop that component ourselves, sell the rights to that component to a third-party developer with experience developing properties for such use or partner with such a developer. If we do not sell the rights or partner with such a developer, or if we choose to develop the other component ourselves, we would be exposed not only to those risks typically associated with the development of commercial real estate generally, but also to specific risks associated with the development and ownership of non-retail real estate. In addition, even if we sell the rights to develop the other component or elect to participate in the development through a joint venture, we may be exposed to the risks associated with the failure of the other party to complete the development as expected. These include the risk that the other party would default on its obligations necessitating that we complete the other component ourselves, including providing any necessary financing. In the case of residential properties, these risks include competition for prospective residents from other operators whose properties may be perceived to offer a better location or better amenities or whose rent may be perceived as a better value given the quality, location and amenities that the resident seeks. We will also compete against condominiums and single-family homes that are for sale or rent. In the case of office properties, the risks also include changes in space utilization by tenants due to technology, economic conditions and business culture, declines in financial condition of these tenants and competition for credit worthy office tenants. In the case of hotel properties, the risks also include increases in inflation and utilities that may not be offset by increases in room rates. We are also dependent on business and commercial travelers and tourism. Because we have less experience with residential, office and hotel properties than with retail properties, we expect to retain third parties to manage our residential and other non-retail components as deemed warranted. If we decide to not sell or participate in a joint venture and instead hire a third-party manager, we would be dependent on them and their key personnel who provide services to us, and we may not find a suitable replacement if the management agreement is terminated, or if key personnel leave or otherwise become unavailable to us.
Construction projects are subject to risks that materially increase the costs of completion.
In the event that we decide to redevelop existing properties, we will be subject to risks and uncertainties associated with construction and development. These risks include, but are not limited to, risks related to obtaining all necessary zoning, land-use, building occupancy and other governmental permits and authorizations, risks related to the environmental concerns of government entities or community groups, risks related to changes in economic and market conditions between development commencement and stabilization, risks related to construction labor disruptions, adverse weather, acts of God or shortages of materials and labor which could cause construction delays and risks related to increases in the cost of labor and materials which could cause construction costs to be greater than projected and adversely impact the amount of our development fees or our financial condition, results of operations and cash flows.
Supply chain disruptions and unexpected construction expenses and delays could impact our ability to timely deliver spaces to tenants and/or our ability to achieve the expected value of a construction project or lease, thereby adversely affecting our profitability.
The construction and building industry, similar to many other industries, are experiencing worldwide supply chain disruptions due to a multitude of factors that are beyond our control. Materials, parts and labor have also increased in cost over the past year or more, sometimes significantly and over a short period of time. We may incur costs for a property renovation or tenant buildout that exceeds our original estimates due to increased costs for materials or labor or other costs that are unexpected. We also may be unable to complete renovation of a property or tenant space on schedule due to supply chain disruptions or labor shortages, which could result in increased debt service expense or construction costs. Additionally, some tenants may have the right to terminate their leases if a renovation project is not completed on time. The time frame required to recoup our renovation and construction costs and to realize a return on such costs can often be significant and materially adversely affect our profitability.
The Americans with Disabilities Act of 1990 could require us to take remedial steps with respect to existing or newly acquired properties.
Our existing properties, as well as properties we may acquire, as commercial facilities, are required to comply with Title III of the Americans with Disabilities Act of 1990 (the “ADA”). Investigation of a property may reveal non-compliance with the ADA. The requirements of the ADA, or of other federal, state or local laws or regulations, also may change in the future and restrict further renovations of our properties with respect to access for disabled persons. Future compliance with the ADA may require expensive changes to the properties.
We do not have exclusive control over our joint venture and preferred equity investments, such that we are unable to ensure that our objectives will be pursued.
We have invested in some properties as a co-venturer or a partner, instead of owning directly. In these investments, we do not have exclusive control over the development, financing, leasing, management and other aspects of these investments. As a result, the co-venturer or partner might have interests or goals that are inconsistent with ours, take action contrary to our interests or otherwise impede our objectives. These investments involve risks and uncertainties. The co-venturer or partner may fail to provide capital or fulfill its obligations, which may result in certain liabilities to us for guarantees and other commitments. Conflicts arising between us and our partners may be difficult to manage and/or resolve and it could be difficult to manage or otherwise monitor the existing business arrangements. The co-venturer or partner also might become insolvent or bankrupt, which may result in significant losses to us.
In addition, joint venture arrangements may decrease our ability to manage risk and implicate additional risks, such as:
|
● |
our joint venture partner having potentially inferior financial capacity, diverging business goals and strategies and the need for their continued cooperation; |
|
● |
our inability to take actions with respect to the joint venture activities that we believe are favorable to us if our joint venture partner does not agree; |
|
● |
our inability to control the legal entity that has title to the real estate associated with the joint venture; |
|
● |
our lenders may not be easily able to sell our joint venture assets and investments or may view them less favorably as collateral, which could negatively affect our liquidity and capital resources; |
|
● |
our joint venture partners can take actions that we may not be able to anticipate or prevent, which could result in negative impacts on our debt and equity; and |
|
● |
our joint venture partners’ business decisions or other actions or omissions may result in harm to our reputation or adversely affect the value of our investments. |
Our joint venture and preferred equity investments generally own real estate properties for which the economic performance and value is subject to all the risks associated with owning and operating real estate as described above.
We may not be able to recover our investments in marketable securities, mortgage receivables or other investments, which may result in significant losses to us.
Our investments in marketable securities are subject to specific risks relating to the particular issuer of the securities, including the financial condition and business outlook of the issuer, which may result in significant losses to us. Marketable securities are generally unsecured and may also be subordinated to other obligations of the issuer. As a result, investments in marketable securities are subject to risks of:
|
● |
limited liquidity in the secondary trading market; |
|
● |
substantial market price volatility, resulting from changes in prevailing interest rates; |
|
● |
subordination to the prior claims of banks and other senior lenders to the issuer; |
|
● |
the possibility that earnings of the issuer may be insufficient to meet its debt service and distribution obligations; and |
|
● |
the declining creditworthiness and potential for insolvency of the issuer during periods of rising interest rates and economic downturn. |
These risks may adversely affect the value of outstanding marketable securities and the ability of the issuers to make distribution payments.
See “Management’s Discussion and Analysis of Financial Condition and Results of Operations” and Footnote 9 of the Notes to the Consolidated Financial Statements included in this Form 10-K for additional discussion regarding the shares held by the Company of Albertsons Companies, Inc. (“ACI”).
Our investments in mortgage receivables are subject to specific risks relating to the borrower and the underlying property. In the event of a default by a borrower, it may be necessary for us to foreclose our mortgage or engage in costly negotiations. Delays in liquidating defaulted mortgage loans and repossessing and selling the underlying properties could reduce our investment returns. Furthermore, in the event of default, the actual value of the property collateralizing the mortgage may decrease. A decline in real estate values will adversely affect the value of our loans and the value of the properties collateralizing our loans.
Our mortgage receivables may be or become subordinated to mechanics' or materialmen's liens or property tax liens. In these instances, we may need to protect a particular investment by making payments to maintain the current status of a prior lien or discharge it entirely. Where that occurs, the total amount we recover may be less than our total investment, resulting in a loss. In the event of a major loan default or several loan defaults resulting in losses, our investments in mortgage receivables would be materially and adversely affected.
The economic performance and value of our other investments, which we do not control and are in retail operations, are subject to risks associated with owning and operating retail businesses, including:
|
● |
changes in the national, regional and local economic climate; |
|
● |
the adverse financial condition of some large retailing companies; |
|
● |
increasing use by customers of e-commerce and online store sites; and |
|
● |
ongoing consolidation in the retail sector. |
A decline in the value of our other investments may require us to recognize an other-than-temporary impairment (“OTTI”) against such assets. When the fair value of an investment is determined to be less than its amortized cost at the balance sheet date, we assess whether the decline is temporary or other-than-temporary. If we intend to sell an impaired asset, or it is more likely than not that we will be required to sell the impaired asset before any anticipated recovery, then we must recognize an OTTI through charges to earnings equal to the entire difference between the asset’s amortized cost and its fair value at the balance sheet date. When an OTTI is recognized through earnings, a new cost basis is established for the asset, and the new cost basis may not be adjusted through earnings for subsequent recoveries in fair value.
Our real estate assets may be subject to impairment charges.
We periodically assess whether there are any indicators that the value of our real estate assets and other investments may be impaired. A property’s value is considered to be impaired only if the estimated aggregate future undiscounted property cash flows are less than the carrying value of the property. In our estimate of cash flows, we consider factors such as trends and prospects and the effects of demand and competition on expected future operating income. If we are evaluating the potential sale of an asset or redevelopment alternatives, the undiscounted future cash flows consider the most likely course of action as of the balance sheet date based on current plans, intended holding periods and available market information. We are required to make subjective assessments as to whether there are impairments in the value of our real estate assets and other investments. Impairment charges have an immediate direct impact on our earnings. There can be no assurance that we will not take additional charges in the future related to the impairment of our assets. Any future impairment could have a material adverse effect on our results of operations in the period in which the charge is taken.
We intend to continue to sell our lesser quality assets and may not be able to recover our investments, which may result in significant losses to us.
There can be no assurance that we will be able to recover the current carrying amount of all of our lesser quality properties and investments and those of our unconsolidated joint ventures in the future. Our failure to do so would require us to recognize impairment charges for the period in which we reached that conclusion, which could materially and adversely affect our financial condition, results of operations and cash flows.
We have completed our efforts to exit Mexico, Chile, Brazil, Peru and Canada, however, we cannot predict the impact of laws and regulations affecting these international operations, including the United States Foreign Corrupt Practices Act, or the potential that we may face regulatory sanctions.
Our international operations have included properties in Mexico, Chile, Brazil, Peru and Canada and are subject to a variety of United States and foreign laws and regulations, including the United States Foreign Corrupt Practices Act and foreign tax laws and regulations. Although we have completed our efforts to exit our investments in Mexico, South America and Canada, we cannot assure you that our past practices will continue to be found to be in compliance with such laws or regulations. In addition, we cannot predict the manner in which such laws or regulations might be administered or interpreted, or when, or the potential that we may face regulatory sanctions or tax audits as a result of our international operations.
We have experienced cybersecurity attacks and could in the future be subject to significant disruption, data loss or other security incidents or breaches.
Our information technology (“IT”) networks and related systems are essential to the operation of our business and our ability to perform day-to-day operations and, in some cases, may be critical to the operations of certain of our tenants. While we maintain some of our own critical IT networks and related systems, we also depend on third parties to provide important software, technologies, tools and a broad array of services and operational functions, including payroll, human resources, electronic communications and finance functions. In the ordinary course of our business, we and our third-party service providers collect, process, transmit and store sensitive information and data, including intellectual property, our proprietary business information and that of our customers, suppliers and business partners, as well as personally identifiable information.
We, and our third-party service providers like all businesses, are subject to cyberattacks and security incidents, which threaten the confidentiality, integrity, and availability of our systems and information resources. Those attacks and incidents may be due to intentional or unintentional acts by employees, customers, contractors or third parties, who seek to gain unauthorized access to our or our service providers’ systems to disrupt operations, corrupt data, or steal confidential or personal information through malware, computer viruses, ransomware, software or hardware vulnerabilities, social engineering (e.g., phishing attachments to e-mails) or other vectors.
The risk of a cybersecurity attack, breach or operational disruption, particularly through a cyber incident, including by computer hackers, foreign governments or cyber terrorists, has generally increased. Although we make efforts to maintain the security and integrity of IT networks and related systems on which we rely, and we have implemented various measures to manage the risk of a cyberattack, security breach or security related disruption, there can be no assurance that our efforts and measures or those of our third-party services providers will be effective or that attempted security breaches or disruptions would not be successful or damaging.
Attack methodologies change frequently or are not recognized until launched, and we may be unable to investigate or remediate incidents because attackers increasingly use techniques and tools designed to circumvent controls, to avoid detection, and to remove or obfuscate forensic evidence.
We have in the past experienced adverse events that have not resulted, and are not expected to result, in a material impact on the Company’s business operations or financial results. For example, in February 2023, the Company experienced a criminal ransomware attack affecting data contained on legacy servers of Weingarten Realty Investors (“WRI”). The Company acquired WRI in August 2021. The affected servers and exfiltrated data were on the WRI network. The WRI network is separate and is not connected to the Company’s network. The Company promptly initiated an investigation and its response protocols, including deploying containment measures such as taking affected systems offline, implementing enhanced monitoring technology and data recovery processes. The Company also notified federal law enforcement, engaged the services of cybersecurity and forensics professionals, and restored affected systems. The WRI network data is historical and stored for archival purposes.
A cyber incident could:
|
● |
disrupt the proper functioning of our networks and systems and therefore our operations and/or those of certain of our tenants; |
|
● |
result in misstated financial reports, violations of loan covenants and/or missed reporting deadlines; |
|
● |
result in our inability to properly monitor our compliance with the rules and regulations regarding our qualification as a REIT; |
|
● |
result in the unauthorized access to, and destruction, loss, theft, misappropriation or release of proprietary, confidential, sensitive or otherwise valuable information of ours or others, which others could use to compete against us or for disruptive, destructive or otherwise harmful purposes and outcomes; |
|
● |
result in our inability to maintain the building systems relied upon by our tenants for the efficient use of their leased space; |
|
● |
require significant management attention and resources to remediate systems, fulfill compliance requirements and/or to remedy any damages that result; |
|
● |
subject us to regulatory enforcement, including investigative costs and fines or penalties, as the White House, SEC and other regulators have increased their focus on companies’ cybersecurity vulnerabilities and risks; |
|
● |
subject us to litigation claims for negligence, breach of contract or other agreements or other causes of action, potentially resulting in remedies such as damages, credits, penalties or termination of leases or other agreements; or |
|
● |
damage our reputation among our tenants, investors and associates. |
The occurrence or perception of a cyberattack or security incident could result in operational interruption, damage to our relationship with our tenants, and confidential data exposure. In addition, federal and state governments and agencies have enacted, and continue to develop, broad data protection legislation, regulations, and guidance that require companies to increasingly implement, monitor and enforce reasonable cybersecurity measures. These governmental entities and agencies are aggressively investigating and enforcing such legislation, regulations and guidance across industry sectors and companies. We may be required to expend significant capital and other resources to address an attack or incident, including those as a result of the February 2023 incident involving the WRI legacy servers, and our insurance may not cover some or all of our losses resulting from an attack or incident. These losses may include payments for investigations, forensic analyses, legal advice, public relations advice, system repair or replacement, or other services, in addition to any remedies or relief that may result from legal proceedings. The incurrence of these losses, costs or business interruptions may adversely affect our reputation as well as our financial condition, results of operations and cash flows.
We may be subject to liability under environmental laws, ordinances and regulations.
Under various federal, state, and local laws, ordinances and regulations, we may be considered an owner or operator of real property and may be responsible for paying for the disposal or treatment of hazardous or toxic substances released on or in our property, as well as certain other potential costs relating to hazardous or toxic substances (including governmental fines and injuries to persons and property). This liability may be imposed whether or not we knew about, or were responsible for, the presence of hazardous or toxic substances. The Company has environmental insurance coverage on certain of its properties, however this coverage may not be sufficient to cover any or all expenses associated with the aforementioned risks.
Natural disasters, severe weather conditions and the effects of climate change could have an adverse impact on our financial condition, results of operations and cash flows.
Our operations are located in areas that are subject to natural disasters and severe weather conditions such as hurricanes, tornados, earthquakes, snowstorms, floods and fires, and the frequency of these natural disasters and severe weather conditions may increase due to climate change. The occurrence of natural disasters, severe weather conditions and the effects of climate change, including extreme temperatures and ambient temperature increases, can delay new development or redevelopment projects, decrease the attractiveness of locations, increase investment costs to repair or replace damaged properties (or make repair or replacement impossible), increase operation costs, including the cost of energy at our properties, increase costs for future property insurance, negatively impact the tenant demand for lease space and cause substantial damages or losses to our properties which could exceed any applicable insurance coverage. The incurrence of any of these losses, costs or business interruptions may adversely affect our financial condition, results of operations and cash flows.
We anticipate the potential effects of climate change will increasingly impact the decisions and analysis we make with respect to our properties, since climate change considerations can impact the relative desirability of locations and the cost of operating and insuring real estate properties. In addition, changes in government legislation and regulation on climate change could result in increased capital expenditures to improve the energy efficiency of our existing properties and could also require us to spend more on our development or redevelopment projects without a corresponding increase in revenues, which may adversely affect our financial condition, results of operations and cash flows. Transition impacts of climate change may subject us to increased regulations, reporting requirements (such as the SEC’s proposed climate change disclosure rule), standards, or expectations regarding the environmental impacts of our or our tenants’ business. Failure to disclose accurate information in a timely manner may also adversely affect our reputation, business, or financial performance.
Pandemics or other health crises may adversely affect our tenants ’ financial condition and the profitability of our properties.
Our business and the businesses of our tenants could be materially and adversely affected by the risks, or the public perception of the risks, related to a pandemic or other health crisis, such as the outbreak of novel coronavirus (COVID-19).
Such events could result in the complete or partial closure of one or more of our tenants’ manufacturing facilities or distribution centers, temporary or long-term disruption in our tenants’ supply chains from local and international suppliers, and /or delays in the delivery of our tenants’ inventory.
The profitability of our properties depends, in part, on the willingness of customers to visit our tenants’ businesses. The risk, or public perception of the risk, of a pandemic or media coverage of infectious diseases could cause employees or customers to avoid our properties, which could adversely affect foot traffic to our tenants’ businesses and our tenants’ ability to adequately staff their businesses. Such events could adversely impact tenants’ sales and/or cause the temporary closure of our tenants’ businesses, which could severely disrupt their operations and have a material adverse effect on our business, financial condition and results of operations.
Financial disruption or a prolonged economic downturn could materially and adversely affect the Company ’ s business.
Worldwide financial markets have recently experienced periods of extraordinary disruption and volatility, resulting in heightened credit risk, reduced valuation of investments and decreased economic activity. Moreover, many companies have experienced reduced liquidity and uncertainty as to their ability to raise capital during such periods of market disruption and volatility. In the event that these conditions recur or result in a prolonged economic downturn, our results of operations, financial position or liquidity could be materially and adversely affected. These market conditions may affect the Company's ability to access debt and equity capital markets. In addition, as a result of recent financial events, we may face increased regulation.
Corporate responsibility, specifically related to ESG factors and commitments, imposes additional costs and expose us to new risks.
Sustainability evaluations is becoming more broadly accepted or expected by investors and shareholders. Certain organizations that provide corporate governance and other corporate risk information to investors and shareholders have developed scores and ratings to evaluate companies and investment funds based upon ESG or “sustainability” metrics. Many investment funds focus on positive ESG business practices and sustainability scores when making investments and may consider a company’s sustainability score as a reputational or other factor in making an investment decision. In addition, investors, particularly institutional investors, use these scores to benchmark companies against their peers and if a company is perceived as lagging, these investors may engage with companies to require improved ESG disclosure or performance. We may face reputational damage or additional costs in the event our corporate responsibility procedures or standards do not meet the standards set by various constituencies. In addition, the criteria by which companies are rated may change, which could cause us to receive lower scores than previous years. A low sustainability score could result in a negative perception of the Company, or exclusion of our common stock from consideration by certain investors who may elect to invest with our competition instead. In addition, as part of our corporate responsibility, we have adopted certain ESG goals, including greenhouse gas emissions reduction targets and other sustainability initiatives. If we cannot not meet these goals fully or on time, we may face reputational damage.
Moreover, while we may create and publish voluntary disclosures regarding ESG matters from time to time, many of the statements in those voluntary disclosures are based on hypothetical expectations and assumptions that may or may not be representative of current or actual risks or events or forecasts of expected risks or events, including the costs associated therewith. Such expectations and assumptions are necessarily uncertain and may be prone to error or subject to misinterpretation given the long timelines involved and the lack of an established single approach to identifying, measuring and reporting on many ESG matters. Such disclosures may also be at least partially reliant on third-party information that we have not independently verified or cannot be independently verified. In addition, we expect there will likely be increasing levels of regulation, disclosure-related and otherwise, with respect to ESG matters, and increased regulation will likely lead to increased compliance costs as well as scrutiny that could heighten all of the risks identified in this risk factor. Such ESG matters may also impact our suppliers or customers, which may adversely impact our business, financial condition, or results of operations.
Our success depends largely on the continued service and availability of key personnel.
We depend on the deep industry knowledge and efforts of key personnel, including our executive officers, to manage our day-to-day operations and strategic business direction. Our ability to attract, retain and motivate key personnel may significantly impact our future performance, and if any of our executive officers or other key personnel depart the Company, for any reason, we may not be able to easily replace such individual. The loss of the services of our executive officers and other key personnel could have a material adverse effect on our financial condition, results of operations and cash flows.
Retail operating conditions may adversely affect our results of operations.
A retail property’s revenues and value may be adversely affected by a number of factors, many of which apply to real estate investment generally, but which also include trends in the retail industry and perceptions by retailers or shoppers of the safety, convenience and attractiveness of the retail property. Our retail properties are public locations, and any incidents of crime or violence, including acts of terrorism, could result in a reduction of business traffic to tenant stores in our properties. Any such incidents may also expose us to civil liability or harm our reputation. In addition, to the extent that the investing public has a negative perception of the retail sector, the value of our retail properties may be negatively impacted.
Our Umbrella Partnership Real Estate Investment Trust ( “ UPREIT ” ) structure may result in potential conflicts of interest with members of Kimco OP whose interests may not be aligned with those of our stockholders.
Our directors and officers have duties to our corporation and our stockholders under Maryland law in connection with their management of the corporation. At the same time, we, as managing member of Kimco OP, our operating company, have fiduciary duties under Delaware law to our operating company and to its members in connection with the management of our operating company. If we admit outside members to our operating company, our duties as managing member of our operating company and to its members may come into conflict with the duties of our directors and officers to the corporation and our stockholders. While the operating agreement contains provisions limiting the fiduciary duties of the managing member to the operating company and its members, the provisions of Delaware law that allow for such limitations have not been fully tested in a court of law.
Risks Related to Our Debt and Equity Securities
We may be unable to obtain financing through the debt and equity markets, which would have a material adverse effect on our growth strategy, our financial condition and our results of operations.
We cannot assure you that we will be able to access the credit and/or equity markets to obtain additional debt or equity financing or that we will be able to obtain financing on terms favorable to us. The inability to obtain financing on a timely basis could have negative effects on our business, such as:
|
● |
we could have great difficulty acquiring or developing properties, which would materially adversely affect our investment strategy; |
|
● |
our liquidity could be adversely affected; |
|
● |
we may be unable to repay or refinance our indebtedness; |
|
● |
we may need to make higher interest and principal payments or sell some of our assets on terms unfavorable to us to fund our indebtedness; or |
|
● |
we may need to issue additional capital stock, which could further dilute the ownership of our existing stakeholders. |
Adverse changes in our credit ratings could impair our ability to obtain additional debt and equity financing on terms favorable to us, if at all, and could significantly reduce the market price of our publicly traded securities.
We are subject to financial covenants that may restrict our operating and acquisition activities.
Our Credit Facility and the indentures under which our senior unsecured debt is issued contain certain financial and operating covenants, including, among other things, certain coverage ratios and limitations on our ability to incur debt, make dividend payments, sell all or substantially all of our assets and engage in mergers and consolidations and certain acquisitions. These covenants may restrict our ability to pursue certain business initiatives or certain acquisition transactions that might otherwise be advantageous. In addition, failure to meet any of the financial covenants could cause an event of default under our Credit Facility and the indentures and/or accelerate some or all of our indebtedness, which would have a material adverse effect on us.
We have a substantial amount of indebtedness and may need to incur more in the future.
We have substantial indebtedness. The level of indebtedness could have adverse consequences on our business, such as:
|
● |
requiring the Company to use a substantial portion of our cash flow from operations to service our indebtedness, which would reduce the available cash flow to fund working capital, capital expenditures, development projects, and other general corporate purposes and reduce cash for distributions; |
|
● |
limiting our ability to obtain additional financing to fund our working capital needs, acquisitions, capital expenditures, or other debt service requirements or for other purposes; |
|
● |
increasing our costs of incurring additional debt; |
|
● |
subjecting us to floating interest rates; |
|
● |
limiting our ability to compete with other companies that are not as highly leveraged, as we may be less capable of responding to adverse economic and industry conditions; |
|
● |
restricting the Company from making strategic acquisitions, developing properties, or exploiting business opportunities; |
|
● |
restricting the way in which we conduct our business because of financial and operating covenants in the agreements governing our existing and future indebtedness; |
|
● |
exposing the Company to potential events of default (if not cured or waived) under covenants contained in our debt instruments that could have a material adverse effect on our business, financial condition, and operating results; |
|
● |
increasing our vulnerability to a downturn in general economic conditions; and |
|
● |
limiting our ability to react to changing market conditions in its industry. |
The impact of any of these potential adverse consequences could have a material adverse effect on our results of operations, financial condition, and liquidity.
Changes in market conditions could adversely affect the market price of our publicly traded securities.
The market price of our publicly traded securities depends on various market conditions, which may change from time-to-time. Among the market conditions that may affect the market price of our publicly traded securities are the following:
|
● |
the extent of institutional investor interest in us; |
|
● |
the reputation of REITs generally and the reputation of REITs with portfolios similar to ours; |
|
● |
the attractiveness of the securities of REITs in comparison to securities issued by other entities, including securities issued by other real estate companies; |
|
● |
our financial condition and performance; |
|
● |
the market’s perception of our growth potential, potential future cash dividends and risk profile; |
|
● |
an increase in market interest rates, which may lead prospective investors to demand a higher distribution rate in relation to the price paid for our shares; and |
|
● |
general economic and financial market conditions. |
We may change the dividend policy for our common stock in the future.
The decision to declare and pay dividends on our common stock in the future, as well as the timing, amount and composition of any such future dividends, will be at the sole discretion of our Board of Directors and will depend on our earnings, operating cash flows, liquidity, financial condition, capital requirements, contractual prohibitions or other limitations under our indebtedness including preferred stock, the annual distribution requirements under the REIT provisions of the Code, state law and such other factors as our Board of Directors deems relevant or are requirements under the Code or state or federal laws. Any negative change in our dividend policy could have a material adverse effect on the market price of our common stock.
Our charter and bylaws and Maryland law contain provisions that may delay, defer or prevent a change of control transaction, even if such a change in control may be in our best interest, and as a result may depress the market price of our securities.
Our charter contains certain ownership limits. Our charter contains various provisions that are intended to preserve our qualification as a REIT and, subject to certain exceptions, authorize our directors to take such actions as are necessary or appropriate to preserve our qualification as a REIT . For example, our charter prohibits the actual, beneficial or constructive ownership by any person of more than 9.8% in value or number of shares, whichever is more restrictive, of the outstanding shares of our common stock, and more than 9.8% in value of the aggregate outstanding shares of all classes and series of our stock. Our Board of Directors, in its sole and absolute discretion, may exempt a person, prospectively or retroactively, from these ownership limits if certain conditions are satisfied. The restrictions on ownership and transfer of our stock may:
|
● |
discourage a tender offer or other transactions or a change in management or of control that might involve a premium price for our common stock or that our stockholders otherwise believe to be in their best interests; or |
|
● |
result in the transfer of shares acquired in excess of the restrictions to a trust for the benefit of a charitable beneficiary and, as a result, the forfeiture by the acquirer of the benefits of owning the additional shares. |
Risks Related to Our Status as a REIT and Related U.S. Federal Income Tax Matters
Loss of our tax status as a REIT or changes in U.S. federal income tax laws, regulations, administrative interpretations or court decisions relating to REITs could have significant adverse consequences to us and the value of our securities.
We have elected to be taxed as a REIT for U.S. federal income tax purposes under the Code. We believe that we are organized and operate in a manner that has allowed us to qualify and will allow us to remain qualified as a REIT under the Code. However, there can be no assurance that we have qualified or will continue to qualify as a REIT for U.S. federal income tax purposes.
Qualification as a REIT involves the application of highly technical and complex Code provisions, for which there are only limited judicial and administrative interpretations. The determination of various factual matters and circumstances not entirely within our control may affect our ability to qualify as a REIT. The rules dealing with U.S. federal income taxation are constantly under review by persons involved in the legislative process and by the U.S. Internal Revenue Service (the “IRS”) and U.S. Department of the Treasury. We cannot predict how changes in the tax laws might affect our investors or us. New legislation, regulations, administrative interpretations or court decisions could significantly and negatively change the tax laws with respect to qualification as a REIT, the U.S. federal income tax consequences of such qualification or the desirability of an investment in a REIT relative to other investments.
In order to qualify as a REIT, we must satisfy a number of requirements, including requirements regarding the ownership of our stock, the composition of our assets and the sources of our gross income. Also, we must make distributions to stockholders aggregating annually at least 90% of our REIT taxable income, excluding net capital gains. Furthermore, we own a direct or indirect interest in certain subsidiary REITs which have elected to be taxed as REITs for U.S. federal income tax purposes under the Code. Provided that each subsidiary REIT qualifies as a REIT, our interest in such subsidiary REIT will be treated as a qualifying real estate asset for purposes of the REIT asset tests. To qualify as a REIT, the subsidiary REIT must independently satisfy all of the REIT qualification requirements. The failure of a subsidiary REIT to qualify as a REIT could have an adverse effect on our ability to comply with the REIT income and asset tests, and thus our ability to qualify as a REIT.
If we were to lose our REIT status, we would face serious tax consequences that would substantially reduce the funds available to pay distributions to stockholders for each of the years involved because:
|
● |
we would not be allowed a deduction for dividends to stockholders in computing our taxable income, and we would be subject to the regular U.S. federal corporate income tax; |
|
● |
we could possibly be subject to a federal alternative minimum tax or increased state and local taxes; |
|
● |
unless we were entitled to relief under statutory provisions, we could not elect to be taxed as a REIT for four taxable years following the year during which we were disqualified; and |
|
● |
we would not be required to make distributions to stockholders. |
Our failure to qualify as a REIT or new legislation or changes in U.S. federal income tax laws including with respect to qualification as a REIT or the tax consequences of such qualification, could also impair our ability to expand our business or raise capital and have a materially adverse effect on the value of our securities.
To maintain our REIT status, we may be forced to borrow funds during unfavorable market conditions, and the unavailability of such capital on favorable terms at the desired times, or at all, may cause us to curtail our investment activities and/or to dispose of assets at inopportune times, which could adversely affect our financial condition, results of operations, cash flows and per share trading price of our common stock.
To qualify as a REIT, we generally must distribute to our stockholders at least 90% of our REIT taxable income each year, excluding net capital gains, and we will be subject to regular U.S. federal corporate income taxes on the amount we distribute that is less than 100% of our net taxable income each year, including capital gains. In addition, we will be subject to a 4% nondeductible excise tax on the amount, if any, by which distributions paid by us in any calendar year are less than the sum of 85% of our ordinary income, 95% of our capital gain net income and 100% of our undistributed income from prior years. While we have historically satisfied these distribution requirements by making cash distributions to our stockholders, a REIT is permitted to satisfy these requirements by making distributions of cash or other property, including, in limited circumstances, its own stock. Assuming we continue to satisfy these distribution requirements with cash, we may need to borrow funds to meet the REIT distribution requirements and avoid the payment of income and excise taxes even if the then prevailing market conditions are not favorable for these borrowings. These borrowing needs could result from differences in timing between the actual receipt of cash and inclusion of income for U.S. federal income tax purposes, or the effect of non-deductible capital expenditures, the creation of cash reserves or required debt or amortization payments. These sources, however, may not be available on favorable terms or at all. Our access to third-party sources of capital depends on a number of factors, including the market's perception of our growth potential, our current debt levels, the market price of our common stock, and our current and potential future earnings. We cannot assure you that we will have access to such capital on favorable terms at the desired times, or at all, which may cause us to curtail our investment activities and/or to dispose of assets at inopportune times, and could adversely affect our financial condition, results of operations, cash flows and per share trading price of our common stock.
The tax imposed on REITs engaging in “ prohibited transactions ” may limit our ability to engage in transactions which would be treated as sales for U.S. federal income tax purposes.
A REIT's net income from prohibited transactions is subject to a 100% penalty tax. In general, prohibited transactions are sales or other dispositions of property, other than foreclosure property, held primarily for sale to customers in the ordinary course of business. Although we do not intend to hold any properties that would be characterized as held for sale to customers in the ordinary course of our business, unless a sale or disposition qualifies under certain statutory safe harbors, or is held through a taxable REIT subsidiary, such characterization is a factual determination and no guarantee can be given that the IRS would agree with our characterization of our properties or that we will always be able to make use of the available safe harbors.
Dividends payable by REITs do not qualify for the reduced tax rates available for some dividends.
The maximum tax rate applicable to “qualified dividend income” payable to U.S. stockholders that are individuals, trusts and estates is 20%. Dividends payable by REITs, however, generally are not eligible for these reduced rates. U.S. stockholders that are individuals, trusts and estates generally may deduct up to 20% of the ordinary dividends (i.e., dividends not designated as capital gain dividends or qualified dividend income) received from a REIT for taxable years beginning before January 1, 2026. Although this deduction reduces the effective tax rate applicable to certain dividends paid by REITs (generally to 29.6% assuming the shareholder is subject to the 37% maximum rate), such tax rate is still higher than the tax rate applicable to corporate dividends that constitute qualified dividend income. Accordingly, investors who are individuals, trusts and estates may perceive investments in REITs to be relatively less attractive than investments in the stocks of non-REIT corporations that pay dividends treated as qualified dividend income, which could materially and adversely affect the value of the shares of REITs, including the per share trading price of our common stock.
Item 1B. Unresolved Staff Comments
None.
Real Estate Portfolio.
As of December 31, 2022, the Company had interests in 532 shopping center properties aggregating 90.8 million square feet of GLA located in 28 states. In addition, the Company had 23 other property interests, primarily through the Company’s preferred equity investments and other investments, totaling 5.7 million square feet of GLA. Open-air shopping centers comprise the primary focus of the Company's current portfolio. As of December 31, 2022, the Company’s Combined Shopping Center Portfolio, including noncontrolling interests, was 95.7% leased.
The Company's open-air shopping center properties, which are generally owned and operated through subsidiaries or joint ventures, had an average size of 170,754 square feet as of December 31, 2022. The Company generally retains its shopping centers for long-term investment and consequently pursues a program of regular physical maintenance together with redevelopment, major renovations and refurbishing to preserve and increase the value of its properties. This includes renovating existing facades, installing uniform signage, resurfacing parking lots and enhancing parking lot lighting. During 2022, the Company expended $113.9 million in connection with property redevelopments and $79.8 million related to improvements.
The Company's management believes its experience in the real estate industry and its relationships with numerous national and regional tenants gives it an advantage in an industry where ownership is fragmented among a large number of property owners. The Company's open-air shopping centers are usually "anchored" by a grocery store, home improvement centers, off-price retailer, discounter or service-oriented tenant. As one of the original participants in the growth of the shopping center industry and the nation's largest owner and operator of shopping centers, the Company has established close relationships with a large number of major national and regional retailers. Some of the major national and regional companies that are tenants in the Company's shopping center properties include TJX Companies, The Home Depot, Albertsons Companies, Ross Stores, Amazon/Whole Foods Market, PetSmart, Ahold Delhaize, Kroger, Burlington Stores and Walmart.
The Company reduces its operating and leasing risks through diversification achieved by the geographic distribution of its properties and a large tenant base. As of December 31, 2022, no single open-air shopping center accounted for more than 1.3% of the Company's annualized base rental revenues, including the proportionate share of base rental revenues from properties in which the Company has less than a 100% economic interest, or more than 1.4% of the Company’s total shopping center GLA. At December 31, 2022, the Company’s five largest tenants were TJX Companies, The Home Depot, Ross Stores, Albertsons Companies and Amazon/Whole Foods Market, which represented 3.7%, 2.1%, 1.9%, 1.9% and 1.8%, respectively, of the Company’s annualized base rental revenues, including the proportionate share of base rental revenues from properties in which the Company has less than a 100% economic interest.
A substantial portion of the Company's income consists of rent received under long-term leases. Most of the leases provide for the payment of fixed-base rentals monthly in advance and for the payment by tenants of an allocable share of the real estate taxes, insurance, utilities and common area maintenance expenses incurred in operating the shopping centers (certain of the leases provide for the payment of a fixed-rate reimbursement of these such expenses). Although many of the leases require the Company to make roof and structural repairs as needed, a number of tenant leases place that responsibility on the tenant, and the Company's standard small store lease provides for reimbursements by the tenant as part of common area maintenance. Additionally, many of the leases provide for reimbursements by the tenant of capital expenditures.
Minimum base rental revenues and operating expense reimbursements accounted for 97% and other revenues, including percentage rents, accounted for 3% of the Company's total revenues from rental properties for the year ended December 31, 2022. The Company's management believes that the base rent per leased square foot for many of the Company's existing leases is generally lower than the prevailing market-rate base rents in the geographic regions where the Company operates, reflecting the potential for future growth. Additionally, a majority of the Company’s leases have provisions requiring contractual rent increases. The Company’s leases may also include escalation clauses, which provide for increases based upon changes in the consumer price index or similar inflation indices.
As of December 31, 2022, the Company’s consolidated operating portfolio, comprised of 428 shopping center properties aggregating 70.6 million square feet of GLA, was 95.5% leased. The consolidated operating portfolio consists entirely of properties located in the U.S., inclusive of Puerto Rico. For the period of January 1, 2022 to December 31, 2022, the Company increased the average base rent per leased square foot, which includes the impact of tenant concessions, in its consolidated portfolio of open-air shopping centers from $19.05 to $19.60, an increase of $0.55. This increase primarily consists of (i) a $0.28 increase relating to rent step-ups within the portfolio and new leases signed, net of leases vacated, (ii) a $0.17 increase relating to acquisitions and (iii) a $0.10 increase relating to dispositions.
The Company has a total of 8,292 leases in the consolidated operating portfolio. The following table sets forth the aggregate lease expirations for each of the next ten years, assuming no renewal options are exercised. For purposes of the table, the Total Annual Base Rent Expiring represents annualized rental revenue, excluding the impact of straight-line rent, for each lease that expires during the respective year. Amounts in thousands, except for number of leases data:
|
Year Ending December 31, |
Number of Leases Expiring |
Square Feet Expiring |
Total Annual Base Rent Expiring |
% of Gross Annual Rent |
||||||||||
|
(1) |
167 |
469 |
$ |
11,527 |
0.9 |
% |
||||||||
|
2023 |
867 |
4,771 |
$ |
89,735 |
7.2 |
% |
||||||||
|
2024 |
1,185 |
7,648 |
$ |
146,985 |
11.8 |
% |
||||||||
|
2025 |
1,149 |
8,134 |
$ |
152,931 |
12.3 |
% |
||||||||
|
2026 |
1,071 |
9,563 |
$ |
158,673 |
12.7 |
% |
||||||||
|
2027 |
1,138 |
9,726 |
$ |
175,091 |
14.0 |
% |
||||||||
|
2028 |
790 |
7,860 |
$ |
141,934 |
11.4 |
% |
||||||||
|
2029 |
432 |
3,915 |
$ |
73,695 |
5.9 |
% |
||||||||
|
2030 |
321 |
2,612 |
$ |
58,702 |
4.7 |
% |
||||||||
|
2031 |
338 |
2,385 |
$ |
54,674 |
4.4 |
% |
||||||||
|
2032 |
402 |
2,901 |
$ |
56,550 |
4.5 |
% |
||||||||
|
(1) |
Leases currently under a month-to-month lease or in process of renewal. |
During 2022, the Company executed 1,696 leases totaling 10.7 million square feet in the Company’s consolidated operating portfolio comprised of 525 new leases and 1,171 renewals and options. The leasing costs associated with these new leases are estimated to aggregate $107.4 million or $39.40 per square foot. These costs include $84.3 million of tenant improvements and $23.1 million of external leasing commissions. The average rent per square foot for (i) new leases was $21.76 and (ii) renewals and options was $18.20. The Company will seek to obtain rents that are higher than amounts within its expiring leases, however, there are many variables and uncertainties which can significantly affect the leasing market at any time; as such, the Company cannot guarantee that future leases will continue to be signed for rents that are equal to or higher than current amounts.
Ground-Leased Properties .
The Company has interests in 40 consolidated shopping center properties that are subject to long-term ground leases where a third party owns and has leased the underlying land to the Company to construct and/or operate a shopping center. The Company pays rent for the use of the land and generally is responsible for all costs and expenses associated with the building and improvements. At the end of these long-term leases, unless extended, the land together with all improvements reverts to the landowner.
More specific information with respect to each of the Company's property interests is set forth in Exhibit 99.1, which is incorporated herein by reference.
The Company is not presently involved in any litigation nor, to its knowledge, is any litigation threatened against the Company or its subsidiaries that, in management's opinion, would result in any material effect on the Company's ownership, management or operation of its properties taken as a whole, or which is not covered by the Company's insurance.
Item 4. Mine Safety Disclosures
Not applicable.
Item 5. Market for the Registrant's Common Equity, Related Stockholder Matters and Issuer Purchases of Equity Securities
Market Information: The Company’s common stock is traded on the NYSE under the trading symbol "KIM".
Holders: The number of holders of record of the Company's common stock, par value $0.01 per share, was 2,767 as of January 31, 2023.
Dividends: Since the IPO, the Company has paid regular quarterly cash dividends to its stockholders. While the Company intends to continue paying regular quarterly cash dividends, future dividend declarations will be paid at the discretion of the Board of Directors and will depend on the actual cash flows of the Company, its financial condition, capital requirements, the annual distribution requirements under the REIT provisions of the Code and such other factors as the Board of Directors deems relevant. The Company’s Board of Directors will continue to evaluate the Company’s dividend policy on a quarterly basis as they monitor sources of capital and evaluate operating fundamentals. The Company is required by the Code to distribute at least 90% of its REIT taxable income determined without regard to the dividends paid deduction and excluding any net capital gain. In addition, the Company will be subject to federal income tax at regular corporate rates to the extent that it distributes less than 100% of its net taxable income, including any net capital gains. The actual cash flow available to pay dividends will be affected by a number of factors, including the revenues received from operating properties, the operating expenses of the Company, the interest expense on its borrowings, the ability of lessees to meet their obligations to the Company, the ability to refinance near-term debt maturities and any unanticipated capital expenditures. The following table reflects the income tax status of distributions per share paid to holders of shares of our common stock:
|
Year Ended December 31, |
||||||||
|
2022 |
2021 |
|||||||
|
Dividend paid per share |
$ | 0.84 | $ | 0.68 | ||||
|
Ordinary income |
81 | % | 77 | % | ||||
|
Capital gains |
16 | % | 3 | % | ||||
|
Return of capital |
3 | % | 20 | % | ||||
In addition to common stock offerings, the Company has capitalized on the growth in its business through the issuance of unsecured fixed rate medium-term notes, underwritten bonds, unsecured bank debt, mortgage debt and perpetual preferred stock. Borrowings under the Company's unsecured revolving credit facility have also been an interim source of funds to both finance the purchase of properties and other investments and meet any short-term working capital requirements. The various instruments governing the Company's issuance of its unsecured public debt, bank debt, mortgage debt and preferred stock impose certain restrictions on the Company regarding dividends, voting, liquidation and other preferential rights available to the holders of such instruments. See "Management's Discussion and Analysis of Financial Condition and Results of Operations" and Footnotes 13, 14 and 19 of the Notes to Consolidated Financial Statements included in this Form 10-K.
The Company does not believe that the preferential rights available to the holders of its Class L Preferred Stock and Class M Preferred Stock, the financial covenants contained in its public bond indentures, as amended, or the credit agreement for its Credit Facility will have an adverse impact on the Company's ability to pay dividends in the normal course to its common stockholders or to distribute amounts necessary to maintain its qualification as a REIT.
The Company maintains a dividend reinvestment and direct stock purchase plan (the "Plan") pursuant to which common and preferred stockholders and other interested investors may elect to automatically reinvest their dividends to purchase shares of the Company’s common stock or, through optional cash payments, purchase shares of the Company’s common stock. The Company may, from time-to-time, either (i) purchase shares of its common stock in the open market or (ii) issue new shares of its common stock for the purpose of fulfilling its obligations under the Plan.
Recent Sales of Unregistered Securities: None.
Issuer Purchases of Equity Securities:
The Company’s Board of Directors had authorized the repurchase of up to 900,000 depositary shares of Class L preferred stock and 1,058,000 depositary shares of Class M preferred stock through December 31, 2022, which represented up to an aggregate of 1,958 shares of the Company’s preferred stock, par value $1.00 per share. During the year ended December 31, 2022, the Company repurchased 54,508 depositary shares of Class L preferred stock and 90,760 depositary shares of Class M preferred stock for a purchase price of $1.3 million and $2.1 million, respectively.
During February 2018, the Company’s Board of Directors authorized a share repurchase program, which is scheduled to expire February 29, 2024. Under this program, the Company may repurchase shares of its common stock, par value $0.01 per share, with an aggregate gross purchase price of up to $300.0 million. The Company did not repurchase any shares under the share repurchase program during the year ended December 31, 2022. As of December 31, 2022, the Company had $224.9 million available under this common share repurchase program.
During the year ended December 31, 2022, the Company repurchased 567,450 shares of the Company’s common stock for an aggregate purchase price of $13.7 million (weighted average price of $24.11 per share) in connection with common shares surrendered or deemed surrendered to the Company to satisfy statutory minimum tax withholding obligations in connection with equity-based compensation plans.
The following table presents information regarding the shares of common stock repurchased by the Company during the three months ended December 31, 2022.
|
Period |
Total Number of Shares Purchased |
Average Price Paid per Share |
Total Number of Shares Purchased as Part of Publicly Announced Plans or Programs |
Approximate Dollar Value of Shares that May Yet Be Purchased Under the Plans or Programs (in millions) |
||||||||||||
|
October 1, 2022 – October 31, 2022 |
1,791 | $ | 18.63 | - | $ | 224.9 | ||||||||||
|
November 1, 2022 – November 30, 2022 |
- | - | - | $ | 224.9 | |||||||||||
|
December 1, 2022 – December 31, 2022 |
4,472 | 21.49 | - | $ | 224.9 | |||||||||||
|
Total |
6,263 | $ | 20.67 | - | ||||||||||||
Total Stockholder Return Performance: The following performance chart compares, over the five years ended December 31, 2022, the cumulative total stockholder return on the Company’s common stock with the cumulative total return of the S&P 500 Index and the cumulative total return of the NAREIT Equity REITs Index (the “NAREIT Equity REITs”) prepared and published by the National Association of Real Estate Investment Trusts (“NAREIT”). The NAREIT Equity REITs Index is a free-float adjusted, market capitalization-weighted index of U.S. equity REITs. Constituents of the index include all tax-qualified REITs with more than 50% of total assets in qualifying real estate assets other than mortgages secured by real property.
Stockholder return performance, presented annually for the five years ended December 31, 2022, is not necessarily indicative of future results. All stockholder return performance assumes the reinvestment of dividends. The information in this paragraph and the following performance chart are deemed to be furnished, not filed.
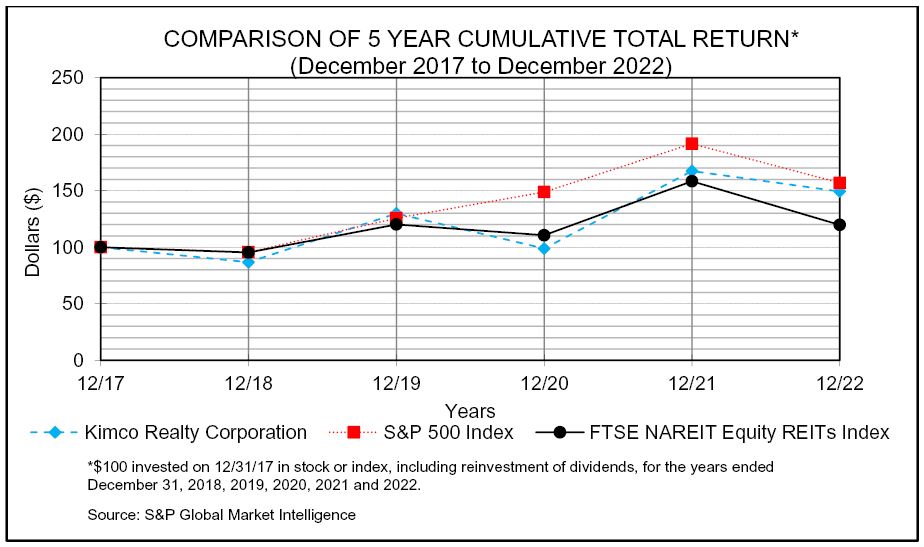
|
Comparison of 5 year cumulative total return data points |
||||||||||||||||||||||||
|
Dec-17 |
Dec-18 |
Dec-19 |
Dec-20 |
Dec-21 |
Dec-22 |
|||||||||||||||||||
|
Kimco Realty Corporation |
$ | 100 | $ | 87 | $ | 130 | $ | 99 | $ | 167 | $ | 149 | ||||||||||||
|
S&P 500 |
$ | 100 | $ | 96 | $ | 126 | $ | 149 | $ | 192 | $ | 157 | ||||||||||||
|
NAREIT Equity REITs |
$ | 100 | $ | 95 | $ | 120 | $ | 111 | $ | 158 | $ | 120 | ||||||||||||
Item 7. Management's Discussion and Analysis of Financial Condition and Results of Operations
The following discussion should be read in conjunction with the Consolidated Financial Statements and Notes thereto included in this Form 10-K. Historical results and percentage relationships set forth in the Consolidated Statements of Income contained in the Consolidated Financial Statements, including trends, should not be taken as indicative of future operations.
The Consolidated Financial Statements of the Company include the accounts of the Company, its wholly owned subsidiaries and all entities in which the Company has a controlling interest, including where the Company has been determined to be a primary beneficiary of a variable interest entity in accordance with the consolidation guidance of the FASB Accounting Standards Codification. The Company applies these provisions to each of its joint venture investments to determine whether the cost, equity or consolidation method of accounting is appropriate. The Company evaluates performance on a property specific or transactional basis and does not distinguish its principal business or group its operations on a geographical basis for purposes of measuring performance. Accordingly, the Company believes it has a single reportable segment for disclosure purposes in accordance with accounting principles generally accepted in the United States of America (“GAAP”).
Critical Accounting Estimates
The preparation of financial statements in conformity with GAAP requires management to make estimates and assumptions in certain circumstances that affect amounts reported in the accompanying Consolidated Financial Statements and related notes. In preparing these financial statements, management has made its best estimates and assumptions that affect the reported amounts of assets and liabilities. These estimates are based on, but not limited to, historical results, industry standards and current economic conditions, giving due consideration to materiality. The Company’s significant accounting policies are more fully described in Footnote 1 to the Consolidated Financial Statements. The Company is required to make subjective assessments, of which, the most significant assumptions and estimates relate to the recoverability of trade accounts receivable, depreciable lives, valuation of real estate and intangible assets and liabilities, and valuation of joint venture investments and other investments. The Company’s reported net earnings are directly affected by management’s estimate of impairments. Application of these assumptions requires the exercise of judgment as to future uncertainties, and, as a result, actual results could materially differ from these estimates.
Trade Accounts Receivable
The Company reviews its trade accounts receivable, related to base rents, straight-line rent, expense reimbursements and other revenues for collectability. The Company evaluates the probability of the collection of the lessee’s total accounts receivable, including the corresponding straight-line rent receivable balance on a lease-by-lease basis. Determining the probability of collection of substantially all lease payments during a lease term requires significant judgment. The Company’s analysis of its accounts receivable included (i) customer credit worthiness, (ii) assessment of risk associated with the tenant, and (iii) current economic trends. In addition, tenants in bankruptcy are analyzed and considerations are made in connection with the expected recovery of pre-petition and post-petition bankruptcy claims. The Company includes provision for doubtful accounts in Revenues from rental properties, net. If a lessee’s accounts receivable balance is considered uncollectible, the Company will write-off the receivable balances associated with the lease and will only recognize lease income on a cash basis. In addition to the lease-specific collectability assessment, the analysis also recognizes a general reserve, as a reduction to Revenues from rental properties, for its portfolio of operating lease receivables which are not expected to be fully collectible based on the Company’s historical and current collection experience and the potential for settlement of arrears. Although the Company estimates uncollectible receivables and provides for them through charges against Revenues from rental properties, actual results may differ from those estimates. For example, in the event that the Company’s collectability determinations are not accurate, and we are required to write off additional receivables equaling 1% of the outstanding accounts receivable balance at December 31, 2022, the Company’s rental income and net income would decrease by $3.0 million for the year ended December 31, 2022. If the Company subsequently determines that it is probable it will collect the remaining lessee’s lease payments under the lease term, any outstanding lease receivables (including straight-line rent receivables) are reinstated with a corresponding increase to rental income.
Real Estate
Valuation of Real Estate, and Intangible Assets and Liabilities
The Company’s investments in real estate properties are stated at cost, less accumulated depreciation and amortization. Expenditures for maintenance and repairs are charged to operations as incurred. Significant renovations and replacements, which improve and extend the life of the asset, are capitalized.
Transaction costs related to acquisitions that qualify as asset acquisitions are capitalized as part of the cost basis of the acquired assets, while transaction costs for acquisitions that are deemed to be business combinations are expensed as incurred. Also, upon acquisition of real estate operating properties in either an asset acquisition or business combination, the Company estimates the fair value of acquired tangible assets (consisting of land, building, building improvements and tenant improvements) and identified intangible assets and liabilities (consisting of above and below-market leases, in-place leases, and tenant relationships, where applicable), assumed debt and redeemable units issued at the date of acquisition, based on evaluation of information and estimates available at that date. Fair value is determined based on a market approach, which contemplates the price that would be received to sell an asset or paid to transfer a liability in an orderly transaction between market participants at the measurement date.
Depreciation and amortization are provided on the straight-line method over the estimated useful lives of the assets, as follows:
|
Buildings and building improvements (in years) |
5 to 50 |
|
|
Fixtures, leasehold and tenant improvements (including certain identified intangible assets) |
Terms of leases or useful lives, whichever is shorter |
The Company is required to make subjective assessments as to the useful lives of its properties for purposes of determining the amount of depreciation to reflect on an annual basis with respect to those properties. These assessments have a direct impact on the Company’s net earnings.
During 2022, the Company acquired properties for a total purchase price of $524.9 million. $8.4 million, or less than 1.6% of the total purchase price, was allocated to above-market leases and $24.1 million, or 4.6% was allocated to below-market leases. If the amounts allocated in 2022 to above-market and below-market leases were each reduced by 1% of the total purchase price, the net annual market lease amortization through rental income would decrease by $0.9 million (using the weighted average life of above-market and below-market leases at each respective acquired property).
On a continuous basis, management assesses whether there are any indicators, including property operating performance, changes in anticipated holding period, general market conditions and delays of development, that the value of the real estate properties (including any related amortizable intangible assets or liabilities) may be impaired. A property value is considered impaired only if management’s estimate of current and projected operating cash flows, net of anticipated construction and leasing costs (undiscounted and unleveraged), of the property over its anticipated hold period is less than the net carrying value of the property. Such cash flow projections consider factors such as expected future costs of materials and labor, operating income, trends and prospects, as well as the effects of demand, competition and other factors. To the extent impairment has occurred, the carrying value of the property would be adjusted to reflect the estimated fair value of the property. The Company’s estimated fair values are primarily based upon estimated sales prices from signed contracts or letters of intent from third parties, discounted cash flow models or third-party appraisals. Estimated fair values that are based on discounted cash flow models include all estimated cash inflows and outflows over a specified holding period. Capitalization rates and discount rates utilized in these models are based upon unobservable rates that the Company believes to be within a reasonable range of current market rates.
See Footnote 3, 4 and 6 of the Notes to Consolidated Financial Statements for further discussion.
Valuation of Joint Venture Investments and Other Investments
On a continuous basis, management assesses whether there are any indicators, including property operating performance and general market conditions, that the value of the Company’s investments in unconsolidated joint ventures may be impaired. An investment’s value is impaired only if management’s estimate of the fair value of the investment is less than the carrying value of the investment and such difference is deemed to be other-than-temporary. To the extent impairment has occurred, the loss will be measured as the excess of the carrying amount of the investment over the estimated fair value of the investment. Estimated fair values which are based on discounted cash flow models include all estimated cash inflows and outflows over a specified holding period, capitalization rates and discount rates utilized in these models are based upon unobservable rates that the Company believes to be within a reasonable range of current market rates.
See Footnote 1 of the Notes to Consolidated Financial Statements for further discussion of the Company’s accounting policies and estimates.
Executive Overview
Kimco Realty Corporation is North America’s largest publicly traded owner and operator of open-air, grocery-anchored shopping centers, and a growing portfolio of mixed-use assets. The executive officers are engaged in the day-to-day management and operation of real estate exclusively with the Company, with nearly all operating functions, including leasing, asset management, maintenance, construction, legal, finance and accounting, administered by the Company.
Weingarten Merger
On August 3, 2021, Weingarten merged with and into the Company, with the Company continuing as the surviving public company, pursuant to the Merger Agreement between the Company and Weingarten which was entered into on April 15, 2021. The total purchase price of the Merger was $4.1 billion, which consists primarily of 179.9 million shares of the Company’s common stock issued in exchange for Weingarten common shares, plus $281.1 million of cash consideration. The Merger brought together two industry-leading retail real estate platforms with highly complementary portfolios and created the preeminent open-air shopping center and mixed-use real estate owner in the country. As a result of the Merger, the Company acquired 149 properties, including 30 held through joint venture programs. The increased scale in targeted growth markets, coupled with a broader pipeline of redevelopment opportunities, has positioned the combined company to create significant value for its shareholders. See Footnote 2 of the Notes to the Consolidated Financial Statements for additional discussion regarding the Merger.
Corporate UPREIT Reorganization
In January of 2023, the Company completed the Reorganization into an UPREIT structure as described in the Explanatory Note at the beginning of this Annual Report. Prior to the Reorganization, the Company’s business was conducted through the Predecessor. This Annual Report pertains to the business and results of operations of the Predecessor for its fiscal year ended December 31, 2022. As a result of the Reorganization, the Company became the successor issuer to the Predecessor under the Exchange Act. The Company and Kimco OP have elected to co-file this Annual Report of the Predecessor to ensure continuity of information to investors. For additional information about the Reorganization, please see the Company’s Current Reports on Form 8-K filed with the SEC on January 3, 2023 and January 4, 2023.
Financial Highlights
The following highlights the Company’s significant transactions, events and results that occurred during the year ended December 31, 2022:
Financial and Portfolio Information:
|
● |
Net income available to the Company’s common shareholders was $100.8 million, or $0.16 per diluted share, for the year ended December 31, 2022 as compared to $818.6 million, or $1.60 per diluted share, for the year ended December 31, 2021. |
|
● |
FFO available to the Company's common shareholders was $976.4 million, or $1.58 per diluted share, for the year ended December 31, 2022, as compared to $706.8 million, or $1.38 per diluted share, for the corresponding period in 2021 (see additional disclosure on FFO beginning on page 40). |
|
● |
Same property net operating income (“Same property NOI”) was $1.3 billion for the year ended December 31, 2022, as compared to $1.2 billion for the corresponding period in 2021, an increase of 4.4% (see additional disclosure on Same property NOI beginning on page 40). |
|
● |
Executed 1,696 new leases, renewals and options totaling approximately 10.7 million square feet in the consolidated operating portfolio during the year ended December 31, 2022. |
|
● |
Consolidated operating portfolio occupancy at December 31, 2022 was 95.5% as compared to 94.2% at December 31, 2021. |
Acquisitions, Dispositions and Other Activity (see Footnotes 4, 5 and 9 of the Notes to Consolidated Financial Statements included in this Form 10-K):
|
● |
Acquired 10 operating properties and eight parcels, in separate transactions, for $524.9 million |
|
● |
Disposed of nine operating properties and 13 parcels, in separate transactions, for an aggregate sales price of $191.1 million, which resulted in aggregate gains of $15.2 million, before noncontrolling interests and taxes. |
|
● |
Monetized 11.5 million of shares of ACI held by the Company, generating net proceeds of $301.1 million and a book gain of $15.2 million. For tax purposes, the Company recognized a long-term capital gain of $251.5 million. The Company has elected to retain the proceeds from this stock sale for general corporate purposes and pay corporate income tax of $57.2 million on the taxable gain. The Company held 28.3 million shares of ACI as of December 31, 2022. |
Capital Activity (for additional details see Liquidity and Capital Resources below):
|
● |
Issued $650.0 million of 4.60% notes maturing February 2033 and $600.0 million of 3.20% notes maturing in April 2032. |
|
● |
Repaid $1.4 billion of notes bearing interest rates from 3.13% to 3.50% with maturity dates ranging from October 2022 to June 2023. |
|
● |
Assumed $79.4 million of mortgage debt (including fair market value adjustment of $9.4 million) encumbering six operating properties acquired in 2022 and obtained a $19.0 million mortgage relating to a consolidated joint venture operating property. |
|
● |
Repaid $158.4 million of mortgage debt that encumbered 11 operating properties. |
|
● |
As of December 31, 2022, had $2.1 billion in immediate liquidity, including $149.8 million in cash. |
As a result of the above debt activity, the Company’s consolidated debt maturity profile, including extension options as of December 31, 2022, is as follows:

|
● |
As of December 31, 2022, the weighted average interest rate was 3.49% and the weighted average maturity profile was 9.5 years related to the Company’s consolidated debt. |
The Company faces external factors which may influence its future results from operations. There remains significant uncertainty in the current macro-economic environment, driven by inflationary pressures, as well as ongoing supply chain issues. These factors have impacted, and are expected to continue to impact, consumer discretionary spending and many of our tenants. The convenience and availability of e-commerce has continued to impact the retail sector, which could affect our ability to increase or maintain rental rates and our ability to renew expiring leases and/or lease available space. To better position itself, the Company’s strategy has been to attract local area customers to its properties by providing a diverse and robust tenant base across a variety of retailers, including grocery stores, off-price retailers, discounters and service-oriented tenants, which offer buy online and pick up in store, off-price merchandise and day-to-day necessities rather than high-priced luxury items.
The Company’s portfolio is focused on first ring suburbs around major metropolitan-area U.S. markets, predominantly on the east and west coasts and in the sun belt region, which are supported by strong demographics, significant projected population growth, and where the Company perceives significant barriers to entry. The Company owns a predominantly grocery-anchored portfolio clustered in the nation’s top markets. The Company believes it can continue to increase its occupancy levels, rental rates and overall rental growth. In addition, the Company, on a selective basis, has developed or redeveloped projects which include residential and mixed-use components.
As part of the Company’s investment strategy, each property is evaluated for its highest and best use, which may include residential and mixed-use components. In addition, the Company may consider other opportunistic investments related to retailer controlled real estate, such as, repositioning underperforming retail locations, retail real estate financing and bankruptcy transaction support. The Company may continue to dispose of certain properties. If the estimated fair value for any of these assets is less than their net carrying values, the Company would be required to take impairment charges and such amounts could be material. For a further discussion of these and other factors that could impact our future results, performance or transactions, see Item 1A. Risk Factors.
Results of Operations
Comparison of the years ended December 31, 2022 and 2021
Results from operations for the year ended December 31, 2021 include the combined operations for five months as a result of the Company’s Merger with Weingarten which occurred on August 3, 2021. The following table presents the comparative results from the Company’s Consolidated Statements of Income for the year ended December 31, 2022, as compared to the corresponding period in 2021 (in thousands, except per share data):
|
Year Ended December 31, |
||||||||||||
|
2022 |
2021 |
Change |
||||||||||
|
Revenues |
||||||||||||
|
Revenues from rental properties, net |
$ | 1,710,848 | $ | 1,349,702 | $ | 361,146 | ||||||
|
Management and other fee income |
16,836 | 14,883 | 1,953 | |||||||||
|
Operating expenses |
||||||||||||
|
Rent (1) |
(15,811 | ) | (13,773 | ) | (2,038 | ) | ||||||
|
Real estate taxes |
(224,729 | ) | (181,256 | ) | (43,473 | ) | ||||||
|
Operating and maintenance (2) |
(290,367 | ) | (222,882 | ) | (67,485 | ) | ||||||
|
General and administrative (3) |
(119,534 | ) | (104,121 | ) | (15,413 | ) | ||||||
|
Impairment charges |
(21,958 | ) | (3,597 | ) | (18,361 | ) | ||||||
|
Merger charges |
- | (50,191 | ) | 50,191 | ||||||||
|
Depreciation and amortization |
(505,000 | ) | (395,320 | ) | (109,680 | ) | ||||||
|
Gain on sale of properties |
15,179 | 30,841 | (15,662 | ) | ||||||||
|
Other income/(expense) |
||||||||||||
|
Other income, net |
28,829 | 19,810 | 9,019 | |||||||||
|
(Loss)/gain on marketable securities, net |
(315,508 | ) | 505,163 | (820,671 | ) | |||||||
|
Interest expense |
(226,823 | ) | (204,133 | ) | (22,690 | ) | ||||||
|
Early extinguishment of debt charges |
(7,658 | ) | - | (7,658 | ) | |||||||
|
Provision for income taxes, net |
(56,654 | ) | (3,380 | ) | (53,274 | ) | ||||||
|
Equity in income of joint ventures, net |
109,481 | 84,778 | 24,703 | |||||||||
|
Equity in income of other investments, net |
17,403 | 23,172 | (5,769 | ) | ||||||||
|
Net loss/(income) attributable to noncontrolling interests |
11,442 | (5,637 | ) | 17,079 | ||||||||
|
Preferred dividends |
(25,218 | ) | (25,416 | ) | 198 | |||||||
|
Net income available to the Company's common shareholders |
$ | 100,758 | $ | 818,643 | $ | (717,885 | ) | |||||
|
Net income available to the Company's common shareholders: |
||||||||||||
|
Diluted per share |
$ | 0.16 | $ | 1.60 | $ | (1.44 | ) | |||||
|
(1) |
Rent expense relates to ground lease payments for which the Company is the lessee. |
|
(2) |
Operating and maintenance expense consists of property related costs including repairs and maintenance costs, roof repair, landscaping, parking lot repair, snow removal, utilities, property insurance costs, security and various other property related expenses. |
|
(3) |
General and administrative expense includes employee-related expenses (including salaries, bonuses, equity awards, benefits, severance costs and payroll taxes), professional fees, office rent, travel and entertainment costs and other company-specific expenses. |
Net income available to the Company’s common shareholders was $100.8 million for the year ended December 31, 2022, as compared to $818.6 million for the comparable period in 2021. On a diluted per share basis, net income available to the Company’s common shareholders for the year ended December 31, 2022, was $0.16 as compared to $1.60 for the comparable period in 2021. For additional disclosure, see Footnote 28 of the Notes to Consolidated Financial Statements included in this Form 10-K.
The following describes the changes of certain line items included on the Company’s Consolidated Statements of Income, that the Company believes changed significantly and affected Net income available to the Company’s common shareholders during the year ended December 31, 2022, as compared to the corresponding period in 2021:
Revenue from rental properties, net –
The increase in Revenues from rental properties, net of $361.1 million is primarily from (i) an increase in revenues of $332.6 million due to properties acquired during 2022 and 2021, including the results of the Merger, and (ii) an increase in revenues from tenants of $53.7 million primarily due to an increase in leasing activity and net growth in the current portfolio, partially offset by (iii) a net decrease of $19.6 million due to changes in credit losses from tenants, (iv) a decrease in revenues of $3.1 million due to dispositions in 2022 and 2021 and (v) a decrease in lease termination fee income of $2.5 million.
Real estate taxes –
The increase in Real estate taxes of $43.5 million is primarily due to properties acquired during 2022 and 2021, including the impact of the Merger.
Operating and maintenance –
The increase in Operating and maintenance expense of $67.5 million is primarily due to (i) properties acquired during 2022 and 2021, including the impact of the Merger, and (ii) increases in repairs and maintenance, utilities and other operating costs throughout the Company’s operating properties.
General and administrative –
The increase in General and administrative expense of $15.4 million is primarily due to (i) an increase in employee-related expenses of $10.5 million resulting from additional employees hired in connection with the Merger and (ii) an increase in professional fees and corporate expenses of $6.6 million, including costs related to the Company’s UPREIT Reorganization, partially offset by (iii) a decrease of $1.7 million primarily due to the fluctuations in value of various directors’ deferred stock.
Impairment charges –
During the years ended December 31, 2022 and 2021, the Company recognized impairment charges of $22.0 million and $3.6 million, respectively, primarily related to adjustments to property carrying values for which the Company’s estimated fair values were primarily based upon signed contracts or letters of intent from third-party offers. These adjustments to property carrying values were recognized in connection with the Company’s efforts to market certain properties and management’s assessment as to the likelihood and timing of such potential transactions. Certain of the calculations to determine fair values utilized unobservable inputs and, as such, were classified as Level 3 of the FASB’s fair value hierarchy. For additional disclosure, see Footnotes 6 and 18 of the Notes to Consolidated Financial Statements included in this Form 10-K.
Merger charges –
During the year ended December 31, 2021, the Company incurred costs of $50.2 million associated with the Merger. These charges are primarily comprised of severance costs and professional and legal fees.
Depreciation and amortization –
The increase in Depreciation and amortization of $109.7 million is primarily due to (i) an increase of $166.7 million resulting from properties acquired during 2022 and 2021, including the impact of the Merger, and (ii) an increase of $1.4 million due to depreciation commencing on certain redevelopment projects that were placed into service during 2022 and 2021, partially offset by (iii) a net decrease of $58.4 million primarily from fully depreciated assets and write-offs due to tenant vacates and dispositions during 2022 and 2021.
Gain on sale of properties –
During 2022, the Company disposed of nine operating properties and 13 parcels, in separate transactions, for an aggregate sales price of $191.1 million, which resulted in aggregate gains of $15.2 million. During 2021, the Company disposed of 13 operating properties and 10 parcels (including the deconsolidation of six operating properties), in separate transactions, for an aggregate sales price of $612.4 million, which resulted in aggregate gains of $30.8 million.
Other income, net –
The increase in Other income, net of $9.0 million is primarily due to (i) a net increase in mortgage and other financing income of $9.4 million, including profit participation of $4.0 million relating to the repayment of a loan, and (ii) an increase in dividend, interest and other income of $3.2 million, partially offset by (iii) a decrease in net periodic benefit income of $3.6 million relating to the Company’s defined benefit plan.
(Loss)/gain on marketable securities, net –
The change in (Loss)/gain on marketable securities, net of $820.7 million is primarily the result of mark-to-market fluctuations of the shares of ACI common stock held by the Company.
Interest expense –
The increase in Interest expense of $22.7 million is primarily due to (i) increased levels of borrowings resulting from the assumption of senior unsecured notes and mortgages in connection with the Merger and public debt offerings, partially offset by (ii) the repayment of senior unsecured notes and mortgages during 2022 and 2021 and (iii) an increase in fair market value amortization, primarily related to the assumption of debt in connection with the Merger and acceleration due to the repayment of senior unsecured notes in 2022.
Early extinguishment of debt charges –
The increase in Early extinguishment of debt charges of $7.7 million is primarily due to the Company’s repayment of its $500.0 million 3.40% senior unsecured notes, which were scheduled to mature in November 2022. As a result, the Company incurred a prepayment charge of $6.5 million and $0.7 million from the write-off of deferred financing costs during 2022.
Provision for income taxes, net –
The increase in Provision for income taxes, net of $53.3 million is primarily due to the sale of 11.5 million of the shares of ACI held by the Company, which generated a taxable long-term capital gain. The Company elected to retain the proceeds from the sale and as a result incurred federal corporate and state income tax aggregating $57.2 million on such gain.
Equity in income of joint ventures, net –
The increase in Equity in income of joint ventures, net of $24.7 million is primarily due to (i) an increase in net gains of $21.9 million resulting from the sale of properties within various joint venture investments during 2022, as compared to 2021, and (ii) an increase in equity in income of $4.5 million from ownership interests acquired in unconsolidated joint ventures in connection with the Merger, partially offset by (iii) an increase in impairment charges of $1.7 million recognized during 2022, as compared to 2021.
Equity in income of other investments, net –
The decrease in Equity in income of other investments, net of $5.8 million is primarily due to the sale of properties within the Company’s Preferred Equity Program during 2022 and 2021.
Net loss/(income) attributable to noncontrolling interests –
The change in Net loss/(income) attributable to noncontrolling interests of $17.1 million is primarily due to (i) impairment charges relating to properties within consolidated joint ventures recognized during 2022, partially offset by (ii) an increase in net income attributable to noncontrolling interests primarily related to consolidated joint ventures acquired in the Merger.
Comparison of the years ended December 31, 2021 and 2020
Information pertaining to fiscal year 2020 was included in the Company’s Annual Report on Form 10-K for the year ended December 31, 2021 under Part II, Item 7, “Management’s Discussion and Analysis of Financial Condition and Results of Operations,” which was filed with the SEC on March 1, 2022.
Liquidity and Capital Resources
The Company’s capital resources include accessing the public debt and equity capital markets, unsecured term loans, mortgages and construction loan financing, marketable securities (including 28.3 million shares of ACI common stock held by the Company, which had a value of $587.7 million at December 31, 2022 and are subject to certain contractual lock-up provisions that expire in May 2023) and immediate access to an unsecured revolving credit facility (the “Credit Facility”) with bank commitments of $2.0 billion which can be increased to $2.75 billion through an accordion feature.
The Company’s cash flow activities are summarized as follows (in thousands):
|
Year Ended December 31, |
||||||||
|
2022 |
2021 |
|||||||
|
Cash, cash equivalents and restricted cash, beginning of year |
$ | 334,663 | $ | 293,188 | ||||
|
Net cash flow provided by operating activities |
861,114 | 618,875 | ||||||
|
Net cash flow used for investing activities |
(63,217 | ) | (476,259 | ) | ||||
|
Net cash flow used for financing activities |
(982,731 | ) | (101,141 | ) | ||||
|
Net change in cash, cash equivalents and restricted cash |
(184,834 | ) | 41,475 | |||||
|
Cash, cash equivalents and restricted cash, end of year |
$ | 149,829 | $ | 334,663 | ||||
Operating Activities
The Company anticipates that cash on hand, net cash flow provided by operating activities, borrowings under its Credit Facility and the issuance of equity, public debt, as well as other debt and equity alternatives, and the sale of marketable equity securities, will provide the necessary capital required by the Company. The Company will continue to evaluate its capital requirements for both its short-term and long-term liquidity needs, which could be affected by various risks and uncertainties, including, but not limited to, the effects of the current inflationary environment, rising interest rates, and other risks detailed in Part I, Item 1A. Risk Factors
Net cash flows provided by operating activities for the year ended December 31, 2022, was $861.1. million, as compared to $618.9 million for the comparable period in 2021. The increase of $242.2 million is primarily attributable to:
|
● |
additional operating cash flow generated by operating properties acquired during 2022 and 2021, including those acquired from the Merger; |
|
● |
new leasing, expansion and re-tenanting of core portfolio properties; |
|
● |
changes in accounts payable and accrued expenses due to timing of receipts and payments; and |
|
● |
nonrecurring costs incurred in connection with the Merger during 2021, partially offset by |
|
● |
changes in operating assets and liabilities due to timing of receipts and payments; |
|
● |
a decrease in distributions from the Company’s joint ventures programs due to the sale of properties within the ventures; and |
|
● |
the disposition of operating properties in 2022 and 2021. |
Investing Activities
Net cash flows used for investing activities was $63.2 million for 2022, as compared to $476.3 million for 2021.
Investing activities during 2022 consisted primarily of:
Cash inflows:
|
● |
$302.5 million in proceeds from the sale of marketable securities, primarily due to the sale of 11.5 million shares of ACI; |
|
● |
$184.3 million in proceeds from the sale of nine consolidated properties and 13 parcels; |
|
● |
$68.4 million in reimbursements of investments in and advances to real estate joint ventures and other investments primarily due to the sale of properties within the investments; |
|
● |
$60.3 million in collection of mortgage and other financing receivables; and |
|
| ● | $4.0 million for principal payments from securities held to maturity. |
Cash outflows:
|
● |
$300.8 million for the acquisition of 10 consolidated operating properties and eight parcels; |
|
● |
$193.7 million for improvements to operating real estate primarily related to the Company’s active redevelopment pipeline; |
|
● |
$104.7 million for investments in and advances to real estate joint ventures, primarily related to partner buyouts and a redevelopment project within the Company’s joint venture portfolio, and investments in other investments, primarily related to funding commitments for certain investments; |
|
● |
$75.1 million for investment in mortgage and other financing receivables; |
|
● |
$4.5 million for investment in cost method investments; and |
|
● |
$4.0 million for investment in marketable securities. |
Investing activities during 2021 consisted primarily of:
Cash inflows:
|
● |
$302.8 million in proceeds from the sale of 13 consolidated properties and 10 parcels (including the deconsolidation of 6 operating properties); |
|
● |
$111.9 million in reimbursements of investments in and advances to real estate joint ventures and other investments primarily due to the sale of properties within the investments; and |
|
● |
$13.8 million in collection of mortgage and other financing receivables. |
Cash outflows:
|
● |
$356.0 million for the acquisition of 11 consolidated operating properties and one parcel; |
|
● |
$264.0 million net cash consideration paid in conjunction with the Merger; |
|
● |
$163.7 million for improvements to operating real estate primarily related to the Company’s active redevelopment pipeline; |
|
● |
$67.1 million for investments in and advances to other investments, primarily related to a preferred equity investment located in San Antonio, TX; |
|
● |
$41.9 million for investment in other financing receivables; and |
|
● |
$12.6 million for investments in and advances to real estate joint ventures, primarily related to a redevelopment project within the Company’s joint venture portfolio. |
Acquisitions of Operating Real Estate and Other Related Net Assets
During the years ended December 31, 2022 and 2021, the Company expended $300.8 million and $619.9 million, respectively, towards the acquisition of operating real estate properties, including the Merger in 2021. The Company anticipates spending approximately $125.0 million to $250.0 million towards the acquisition of operating properties during 2023. The Company intends to fund these acquisitions with cash on hand, net cash flow provided by operating activities, proceeds from property dispositions, proceeds from the sale of marketable securities and/or availability under its Credit Facility.
Improvements to Operating Real Estate
During the years ended December 31, 2022 and 2021, the Company expended $193.7 million and $163.7 million, respectively, towards improvements to operating real estate. These amounts consist of the following (in thousands):
|
Year Ended December 31, |
||||||||
|
2022 |
2021 |
|||||||
|
Redevelopment and renovations |
$ | 113,928 | $ | 100,784 | ||||
|
Tenant improvements and tenant allowances |
79,782 | 62,915 | ||||||
|
Total improvements |
$ | 193,710 | $ | 163,699 | ||||
The Company has an ongoing program to redevelop and re-tenant its properties to maintain or enhance its competitive position in the marketplace. The Company is actively pursuing redevelopment opportunities within its operating portfolio which it believes will increase the overall value by bringing in new tenants and improving the assets’ value. The Company anticipates its capital commitment toward these redevelopment projects and re-tenanting efforts for 2023 will be approximately $175.0 million to $225.0 million. The funding of these capital requirements will be provided by cash on hand, proceeds from property dispositions, proceeds from the sale of marketable securities, net cash flow provided by operating activities and/or availability under the Company’s Credit Facility.
Financing Activities
Net cash flows used for financing activities was $982.7 million for 2022, as compared to $101.1 million for 2021.
Financing activities during 2022 primarily consisted of the following:
Cash inflows:
|
● |
$1.25 billion in proceeds from issuance of the Company’s $600.0 million 3.20% senior unsecured notes due 2032 and $650.0 million 4.60% senior unsecured notes due 2033; |
|
● |
$19.0 million in proceeds from a mortgage loan financing; |
|
● |
$15.5 million in proceeds from the issuance of common stock; and |
|
● |
$5.3 million from changes in tenants’ security deposits. |
Cash outflows:
|
● |
$1.4 billion for repayment of four separate senior unsecured notes, which had maturity dates ranging from November 2022 to June 2023; |
|
● |
$544.7 million of dividends paid; |
|
● |
$167.7 million in principal payment on debt, including normal amortization of rental property debt; |
|
● |
$67.5 million in redemption/distribution of noncontrolling interests; |
|
● |
$20.3 million in financing origination costs, in connection with the issuance of senior unsecured notes; |
|
● |
$13.7 million in shares repurchased for employee tax withholding on equity awards; |
|
● |
$7.0 million for payment of early extinguishment of debt charges; and |
|
● |
$3.4 million for repurchase of preferred stock. |
Financing activities during 2021 primarily consisted of the following:
Cash inflows:
|
● |
$500.0 million in proceeds from issuance of 2.25% senior unsecured notes due in 2031; and |
|
● |
$83.0 million in proceeds from issuance of common stock, primarily related to the Company’s at-the-market continuous offering program and the exercise of employee stock options. |
Cash outflows:
|
● |
$382.1 million of dividends paid; |
|
● |
$239.9 million in principal payment on debt, including normal amortization of rental property debt; |
|
● |
$34.6 million in redemption/distribution of noncontrolling interests; |
|
● |
$20.8 million in shares repurchased for employee tax withholding on equity awards; and |
|
● |
$8.2 million in financing origination costs, primarily in connection with the Company’s issuance of $500.0 million of senior unsecured notes. |
The Company continually evaluates its debt maturities, and, based on management’s current assessment, believes it has viable financing and refinancing alternatives that will not materially adversely impact its expected financial results. As of December 31, 2022, the Company had consolidated floating rate debt totaling $18.4 million, excluding deferred financing costs of $0.1 million. The Company continues to pursue borrowing opportunities with large commercial U.S. and global banks, select life insurance companies and certain regional and local banks.
Debt maturities for 2023 consist of: $12.0 million of consolidated debt, $38.1 million of unconsolidated joint venture debt and $32.3 million of debt included in the Company's preferred equity program, assuming the utilization of extension options where available. The 2023 consolidated debt maturities are anticipated to be repaid with operating cash flows or debt refinancing, as deemed appropriate. The 2023 debt maturities on properties in the Company’s unconsolidated joint ventures are anticipated to be repaid through operating cash flows, debt refinancing, unsecured credit facilities, proceeds from sales within the respective entities, and partner capital contributions, as deemed appropriate.
The Company intends to maintain strong debt service coverage and fixed charge coverage ratios as part of its commitment to maintain or improve its unsecured debt ratings. The Company may, from time to time, seek to obtain funds through additional common and preferred equity offerings, unsecured debt financings and/or mortgage/construction loan financings and other capital alternatives.
Since the completion of the Company’s IPO in 1991, the Company has utilized the public debt and equity markets as its principal source of capital for its expansion needs. Since the IPO, the Company has completed additional offerings of its public unsecured debt and equity, raising in the aggregate over $17.4 billion. Proceeds from public capital market activities have been used for the purposes of, among other things, repaying indebtedness, acquiring interests in open-air, grocery anchored shopping centers and mixed-use assets, expanding and improving properties in the portfolio and other investments.
During January 2023, the Company filed a shelf registration statement on Form S-3, which is effective for a term of three years, for future unlimited offerings, from time to time, of debt securities, preferred stock, depositary shares, common stock and common stock warrants. The Company, pursuant to this shelf registration statement may, from time to time, offer for sale its senior unsecured debt securities for any general corporate purposes, including (i) funding specific liquidity requirements in its business, including property acquisitions, development and redevelopment costs and (ii) managing the Company’s debt maturities.
During January 2023, the Company filed a registration statement on Form S-8 for its 2020 Equity Participation Plan (the “2020 Plan”), which was previously approved by the Company’s stockholders and is a successor to the Restated Kimco Realty Corporation 2010 Equity Participation Plan that expired in March 2020. The 2020 Plan provides for a maximum of 10,000,000 shares of the Company’s common stock to be reserved for the issuance of stock options, stock appreciation rights, restricted stock, restricted stock units, performance awards, dividend equivalents, stock payments and deferred stock awards. At December 31, 2022, the Company had 6.9 million shares of common stock available for issuance under the 2020 Plan. (see Footnote 23 of the Notes to Consolidated Financial Statements included in this Form 10-K).
Preferred Stock –
The Company’s Board of Director’s authorized the repurchase of up to 900,000 depositary shares of Class L preferred stock and 1,058,000 depositary shares of Class M preferred stock representing up to 1,958 shares the Company’s preferred stock, par value $1.00 per share through December 31, 2022. During the year ended December 31, 2022, the Company repurchased the following preferred stock:
|
Class of Preferred Stock |
Depositary Shares Repurchased |
Purchase Price (in millions) |
||||||
|
Class L |
54,508 | $ | 1.3 | |||||
|
Class M |
90,760 | $ | 2.1 | |||||
Common Stock –
During August 2021, the Company established an at-the-market continuous offering program (the “ATM program”) pursuant to which the Company may offer and sell from time-to-time shares of its common stock, par value $0.01 per share, with an aggregate gross sales price of up to $500.0 million through a consortium of banks acting as sales agents. Sales of the shares of common stock may be made, as needed, from time to time in “at the market” offerings as defined in Rule 415 of the Securities Act of 1933, including by means of ordinary brokers’ transactions on the New York Stock Exchange or otherwise (i) at market prices prevailing at the time of sale, (ii) at prices related to prevailing market prices or (iii) as otherwise agreed to with the applicable sales agent. In addition, the Company may from time to time enter into separate forward sale agreements with one or more banks. During 2022, the Company issued 450,000 shares and received net proceeds after commissions of $11.3 million. During 2021, the Company issued 3.5 million shares and received net proceeds after commissions of $76.9 million. As of December 31, 2022, the Company had $411.0 million available under this ATM program.
The Company has a share repurchase program, which is scheduled to expire on February 29, 2024. Under this program, the Company may repurchase shares of its common stock, par value $0.01 per share, with an aggregate gross purchase price of up to $300.0 million. The Company did not repurchase any shares under the share repurchase program during 2022 and 2021. As of December 31, 2022, the Company had $224.9 million available under this common share repurchase program.
Senior Notes –
During the year ended December 31, 2022, the Company issued the following senior unsecured notes (dollars in millions):
|
Date Issued |
Amount Issued |
Interest Rate |
Maturity Date |
|||||||||
|
Aug-22 |
$ | 650.0 | 4.600% |
Feb-33 |
||||||||
|
Feb-22 |
$ | 600.0 | 3.200% |
Apr-32 |
||||||||
During the year ended December 31, 2022, the Company fully repaid the following senior unsecured notes (dollars in millions):
|
Date Paid |
Amount Repaid |
Interest Rate |
Maturity Date |
|||||||||
|
Sep-22 (1) |
$ | 299.7 | 3.500% |
Apr-23 |
||||||||
|
Sep-22 (1) (2) |
$ | 350.0 | 3.125% |
Jun-23 |
||||||||
|
Sep-22 (1) (2) |
$ | 299.4 | 3.375% |
Oct-22 |
||||||||
|
Mar-22 (3) |
$ | 500.0 | 3.400% |
Nov-22 |
||||||||
|
(1) |
There were no prepayment charges associated with this early repayment. |
|
(2) |
Includes partial repayments during May and June 2022. |
|
(3) |
The Company incurred a prepayment charge of $6.5 million and $0.7 million in write-off of deferred financing costs resulting from this early repayment, which are included in Early extinguishment of debt charges on the Company’s Consolidated Statements of Income. |
The Company’s supplemental indenture governing its senior notes contains the following covenants, all of which the Company is compliant with:
|
Covenant |
Must Be |
As of December 31, 2022 |
||
|
Consolidated Indebtedness to Total Assets |
<60% |
37% |
||
|
Consolidated Secured Indebtedness to Total Assets |
<40% |
2% |
||
|
Consolidated Income Available for Debt Service to Maximum Annual Service Charge |
>1.50x |
3.9x |
||
|
Unencumbered Total Asset Value to Consolidated Unsecured Indebtedness |
>1.50x |
2.5x |
For a full description of the various indenture covenants refer to the Indenture dated September 1, 1993; the First Supplemental Indenture dated August 4, 1994; the Second Supplemental Indenture dated April 7, 1995; the Third Supplemental Indenture dated June 2, 2006; the Fourth Supplemental Indenture dated April 26, 2007; the Fifth Supplemental Indenture dated as of September 24, 2009; the Sixth Supplemental Indenture dated as of May 23, 2013; Seventh Supplemental Indenture dated as of April 24, 2014; and the Eighth Supplemental Indenture dated as of January 3, 2023 each as filed with the SEC. See the Index to Exhibits included in this Form 10-K for specific filing information.
In addition, for a full description of the various indenture covenants for senior unsecured notes assumed during the Merger, refer to the Indenture dated May 1, 1995 included as an exhibit to Weingarten’s Registration Statement on Form S-3, filed with the Securities and Exchange Commission on May 1, 1995; First Supplemental Indenture, dated as of August 2, 2006, included as an exhibit to Weingarten’s Current Report on Form 8-K dated August 2, 2006, Second Supplemental Indenture, dated as of October 9, 2012 filed with Weingarten’s Current Report on Form 8-K dated October 9, 2012. See the Exhibits Index in this Form 10-K for specific filing information.
In connection with the Reorganization, Kimco OP became the issuer of the senior notes and the Parent Company has provided a full and unconditional guarantee of Kimco OP’s obligations under each series of senior notes previously issued and outstanding.
Credit Facility –
The Company had a $2.0 billion Credit Facility with a group of banks which was scheduled to expire in March 2024, with two additional six-month options to extend the maturity date, at the Company’s discretion, to March 2025. The Credit Facility was a green credit facility tied to sustainability metric targets, as described in the agreement. In July 2022, the Company amended the Credit Facility to (i) replace LIBOR borrowings with Secured Overnight Financing Rate (“SOFR”) borrowings, (ii) supplement the sustainability grid with an additional one basis point reduction of applicable margin if certain criteria as defined in the Credit Facility are met, (iii) add a leverage metric test which, if met, reduces the applicable margin by five basis points and (iv) obtain pre-approval of a possible organizational conversion to an UPREIT structure. The Company achieved such sustainability metric targets, which effectively reduced the rate on the Credit Facility by two basis points. The Credit Facility, which accrued interest at a rate of Adjusted Term SOFR, as defined in the terms of the Credit Facility, plus 75.5 basis points (5.21% as of December 31, 2022), and can be increased to $2.75 billion through an accordion feature. Pursuant to the terms of the Credit Facility, the Company, among other things, was subject to covenants requiring the maintenance of (i) maximum indebtedness ratios and (ii) minimum interest and fixed charge coverage ratios. As of December 31, 2022, the Credit Facility had no outstanding balance and appropriations for letters of credit of $1.2 million.
In February 2023, the Company closed on a new $2.0 billion unsecured revolving credit facility (the “New Credit Facility”) with a group of banks, which is scheduled to expire in March 2027 with two additional six-month options to extend the maturity date, at the Company’s discretion, to March 2028. The New Credit Facility can be increased to $2.75 billion through an accordion feature. The New Credit Facility is a green credit facility tied to sustainability metric targets, as described in the agreement. The New Credit Facility replaces the Company’s Credit Facility discussed above, that was scheduled to mature in March 2024. The New Credit Facility accrues interest at a rate of Adjusted Term SOFR, as defined in the terms of the New Credit Facility, plus 77.5 basis points and fluctuates in accordance with the Company's credit ratings, which can be further adjusted upward or downward by four basis points based on the sustainability metric targets, as defined in the agreement. The Company achieved certain sustainability metric targets, which effectively reduced the rate on the New Credit Facility by two basis points. Pursuant to the terms of the New Credit Facility, the Company continues to be subject to the same covenants under the Credit Facility.
Pursuant to the terms of the Credit Facility, the Company, among other things, is subject to maintenance of various covenants. The Company is currently in compliance with these covenants. The financial covenants for the Credit Facility are as follows:
|
Covenant |
Must Be |
As of December 31, 2022 |
||
|
Total Indebtedness to Gross Asset Value (“GAV”) |
<60% |
38% |
||
|
Total Priority Indebtedness to GAV |
<35% |
2% |
||
|
Unencumbered Asset Net Operating Income to Total Unsecured Interest Expense |
>1.75x |
4.6x |
||
|
Fixed Charge Total Adjusted EBITDA to Total Debt Service |
>1.50x |
4.1x |
For a full description of the Credit Facility’s covenants, refer to Amendment No. 2, dated July 12, 2022, to the Amended and Restated Credit Agreement, dated February 27, 2020, filed as Exhibit 10.1 to the Company’s Quarterly Report on Form 10-Q for the quarterly period ended June 30, 2022, file with the SEC on July 29, 2022. See the Index to Exhibits included in this Form 10-K for specific filing information.
Mortgages Payable –
During 2022, the Company (i) assumed $79.4 million of mortgage debt (including fair market value adjustment of $9.4 million) encumbering six operating properties acquired in 2022, (ii) obtained a $19.0 million mortgage relating to a consolidated joint venture operating property and (iii) repaid $158.4 million of mortgage debt (including fair market value adjustment of $0.5 million) that encumbered 11 operating properties.
In addition to the public equity and debt markets as capital sources, the Company may, from time to time, obtain mortgage financing on selected properties to partially fund the capital needs of its real estate re-development and re-tenanting projects. As of December 31, 2022, the Company had over 485 unencumbered property interests in its portfolio.
Albertsons Companies, Inc. –
In October 2022, the Company sold 11.5 million shares of ACI held by the Company, generating net proceeds of $301.1 million. For tax purposes, the Company recognized a long-term capital gain of $251.5 million. The Company elected to retain the proceeds from this stock sale for general corporate purposes and pay corporate income tax of $57.2 million on the taxable gain. This undistributed long-term capital gain is allocated to, and reportable by, each shareholder, and each shareholder is also entitled to claim a federal income tax credit for its allocable share of the federal income tax paid by the Company for 2022. The allocable share of the long-term capital gain and the federal tax credit will be reported to direct holders of Kimco common shares, on Form 2439, and to others in year-end reporting documents issued by brokerage firms if Kimco shares are held in a brokerage account. As of December 31, 2022, the Company holds 28.3 million shares of ACI, which had a value of $587.7 million, which are subject to certain contractual lock-up provisions that expire in May 2023.
On October 13, 2022, The Kroger Co. (“Kroger”) and ACI entered into a definitive merger agreement (“ACI Merger”), with Kroger continuing as the surviving public company. The ACI Merger is subject to numerous regulatory approvals and customary closing conditions. Separate from the ACI Merger, on October 13, 2022, ACI declared a special cash dividend of $6.85 per share to ACI shareholders of record as of the close of business on October 24, 2022 and was scheduled to be paid on November 7, 2022.
On November 3, 2022, the Superior Court of King County in the State of Washington issued an order temporarily restraining the payment of the special dividend in the case State of Washington v. Albertsons Companies, Inc. et al., until a hearing on a motion for a preliminary injunction could be held. On December 9, 2022, the Superior Court denied the motion for a preliminary injunction but extended the temporary restraining order for the Attorney General for the State of Washington to appeal to the Supreme Court of the State of Washington. Due to the contingency resulting from this unresolved litigation at December 31, 2022, the Company did not recognize its share of the special dividend for the year ended December 31, 2022.
On January 17, 2023, the Supreme Court of the State of Washington denied a motion by the Attorney General of the State of Washington to hear an appeal from the Superior Court’s denial to enjoin ACI from paying the special dividend. As a result of the decision by the Supreme Court of the State of Washington, the temporary restraining order preventing payment of the special dividend was lifted. On January 20, 2023, ACI distributed the special dividend to holders of record as of October 24, 2022. The Company received its share of the special dividend payment of $194.1 million during January 2023, and will recognize this income during the three months ending March 31, 2023.
Dividends –
In connection with its intention to continue to qualify as a REIT for U.S. federal income tax purposes, the Company expects to continue paying regular dividends to its stockholders. These dividends will be paid from operating cash flows. The Company’s Board of Directors will continue to evaluate the Company’s dividend policy on a quarterly basis as it monitors sources of capital and evaluates the impact of the economy and capital markets availability on operating fundamentals. Since cash used to pay dividends reduces amounts available for capital investment, the Company generally intends to maintain a dividend payout ratio which reserves such amounts as it considers necessary for the expansion and renovation of shopping centers in its portfolio, debt reduction, the acquisition of interests in new properties and other investments as suitable opportunities arise and such other factors as the Board of Directors considers appropriate. Cash dividends paid were $544.7 million, $382.1 million and $379.9 million in 2022, 2021 and 2020, respectively.
Although the Company receives substantially all of its rental payments on a monthly basis, it generally intends to continue paying dividends quarterly. Amounts accumulated in advance of each quarterly distribution will be invested by the Company in short-term money market or other suitable instruments. The Company’s objective is to establish a dividend level that maintains compliance with the Company’s REIT taxable income distribution requirements. On October 25, 2022, the Company’s Board of Directors declared a quarterly dividend with respect to the Company’s classes of cumulative redeemable preferred shares (Classes L and M) which were paid on January 17, 2023, to shareholders of record on December 30, 2022. In addition, the Company’s Board of Directors declared a quarterly cash dividend of $0.23 per common share, which was paid on December 23, 2022, to shareholders of record on December 9, 2022.
On February 8, 2023, the Company’s Board of Directors declared quarterly dividends with respect to the Company’s classes of cumulative redeemable preferred shares (Classes L and M), which are scheduled to be paid on April 17, 2023, to shareholders of record on April 3, 2023. Additionally, on February 8, 2023, the Company’s Board of Directors declared a quarterly cash dividend of $0.23 per common share payable on March 23, 2023 to shareholders of record on March 9, 2023.
Contractual Obligations and Other Commitments
Contractual Obligations
The Company has debt obligations relating to its Credit Facility (no outstanding balance as of December 31, 2022), unsecured senior notes and mortgages with maturities ranging from four months to 27 years. As of December 31, 2022, the Company’s consolidated total debt had a weighted average term to maturity of 9.5 years. In addition, the Company has non-cancelable leases pertaining to its shopping center portfolio. As of December 31, 2022, the Company had 40 consolidated shopping center properties that are subject to long-term ground leases where a third party owns and has leased the underlying land or a portion of the underlying land to the Company to construct and/or operate a shopping center. Amounts due in 2023 in connection with these leases aggregate $12.4 million. The following table summarizes the Company’s consolidated debt maturities (excluding extension options, unamortized debt issuance costs of $68.1 million and fair market value of debt adjustments aggregating $43.7 million) and obligations under non-cancelable operating leases as of December 31, 2022:
|
Payments due by period (in millions) |
||||||||||||||||||||||||||||
|
2023 |
2024 |
2025 |
2026 |
2027 |
Thereafter |
Total |
||||||||||||||||||||||
|
Long-Term Debt: |
||||||||||||||||||||||||||||
|
Principal (1) |
$ | 23.4 | $ | 667.7 | $ | 813.5 | $ | 780.4 | $ | 472.7 | $ | 4,424.6 | $ | 7,182.3 | ||||||||||||||
|
Interest (2) |
$ | 250.3 | $ | 229.6 | $ | 204.1 | $ | 191.0 | $ | 161.4 | $ | 1,553.5 | $ | 2,589.9 | ||||||||||||||
|
Non-cancelable Leases: |
||||||||||||||||||||||||||||
|
Operating leases (3) |
$ | 12.4 | $ | 11.6 | $ | 11.1 | $ | 10.4 | $ | 10.1 | $ | 188.9 | $ | 244.5 | ||||||||||||||
|
Financing leases |
$ | 23.0 | $ | - | $ | - | $ | - | $ | - | $ | - | $ | 23.0 | ||||||||||||||
|
(1) |
Maturities utilized do not reflect extension options, which range from two to five years. |
|
(2) |
For loans which have interest at floating rates, future interest expense was calculated using the rate as of December 31, 2022. |
|
(3) |
For leases which have inflationary increases, future ground and office rent expense was calculated using the rent based upon initial lease payment. |
The Company has $12.0 million of consolidated secured debt scheduled to mature in 2023. The Company anticipates satisfying the remaining future maturities with operating cash flows or debt refinancing.
Commitments
The Company has issued letters of credit in connection with the completion and repayment guarantees, primarily on certain of the Company’s redevelopment projects and guaranty of payment related to the Company’s insurance program. At December 31, 2022, these letters of credit aggregated $43.3 million.
The Company has investments with funding commitments of $30.4 million, of which $16.5 million has been funded as of December 31, 2022.
In connection with the construction of its development/redevelopment projects and related infrastructure, certain public agencies require posting of performance and surety bonds to guarantee that the Company’s obligations are satisfied. These bonds expire upon the completion of the improvements and infrastructure. As of December 31, 2022, the Company had $18.4 million in performance and surety bonds outstanding.
The Company provides a guaranty for the payment of any debt service shortfalls on Series A bonds issued by the Sheridan Redevelopment Agency which are tax increment revenue bonds issued in connection with a property owned by the Company in Sheridan, Colorado. These tax increment revenue bonds have a balance of $45.5 million outstanding at December 31, 2022. The bonds are to be repaid with incremental sales and property taxes and a public improvement fee ("PIF") to be assessed on current and future retail sales and, to the extent necessary, any amounts we may have to provide under a guaranty. The revenue generated from incremental sales, property taxes and PIF have satisfied the debt service requirements to date. The incremental taxes and PIF are to remain intact until the earlier of the payment of the bond liability in full or 2040.
Off-Balance Sheet Arrangements
Unconsolidated Real Estate Joint Ventures
The Company has investments in various unconsolidated real estate joint ventures with varying structures. These joint ventures primarily operate shopping center properties. The properties owned by the joint ventures are primarily financed with individual non-recourse mortgage loans, however, the Company, on a selective basis, has obtained unsecured financing for certain joint ventures. As of December 31, 2022, the Company did not guarantee any joint venture unsecured debt. Non-recourse mortgage debt is generally defined as debt whereby the lenders’ sole recourse with respect to borrower defaults is limited to the value of the property collateralized by the mortgage. The lender generally does not have recourse against any other assets owned by the borrower or any of the constituent members of the borrower, except for certain specified exceptions listed in the particular loan documents (see Footnote 7 of the Notes to Consolidated Financial Statements included in this Form 10-K).
Debt balances within the Company’s unconsolidated joint venture investments for which the Company held noncontrolling ownership interests at December 31, 2022, aggregated $1.4 billion. As of December 31, 2022, these loans had scheduled maturities ranging from three months to 8.5 years and bore interest at rates ranging from 2.95% to LIBOR plus 200 basis points (6.39% as of December 31, 2022). Approximately $38.1 million of the aggregate outstanding loan balance matures in 2023. These maturing loans are anticipated to be repaid with operating cash flows, debt refinancing, unsecured credit facilities, proceeds from sales of properties within the ventures, and partner capital contributions, as deemed appropriate (see Footnote 7 of the Notes to Consolidated Financial Statements included in this Form 10-K).
Other Investments
The Company has provided capital to owners and developers of real estate properties and loans through its Preferred Equity Program. As of December 31, 2022, the Company’s net investment under the Preferred Equity Program was $69.4 million relating to 12 properties As of December 31, 2022, these preferred equity investment properties had non-recourse mortgage loans aggregating $232.8 million. These loans have scheduled maturities ranging from less than one year to 1.5 years and bear interest at rates ranging from 4.19% to SOFR plus 265 basis points (6.78% as of December 31, 2022). Due to the Company’s preferred position in these investments, the Company’s share of each investment is subject to fluctuation and is dependent upon property cash flows. The Company’s maximum exposure to losses associated with its preferred equity investments is limited to its invested capital.
Effects of Inflation
Many of the Company's long-term leases contain provisions designed to mitigate the adverse impact of inflation. Such provisions include clauses enabling the Company to receive payment of additional rent calculated as a percentage of tenants' gross sales above pre-determined thresholds, which generally increase as prices rise, and/or as a result of escalation clauses, which generally increase rental rates during the terms of the leases. Such escalation clauses often include increases based upon changes in the consumer price index or similar inflation indices. In addition, many of the Company's leases are for terms of less than 10 years, which permits the Company to seek to increase rents to market rates upon renewal. To assist in partially mitigating the Company's exposure to increases in costs and operating expenses, including common area maintenance costs, real estate taxes and insurance, resulting from inflation the Company’s leases include provisions that either (i) require the tenant to pay an allocable share of these operating expenses or (ii) contain fixed contractual amounts, which include escalation clauses, to reimburse these operating expenses.
Funds From Operations
FFO is a supplemental non-GAAP financial measure utilized to evaluate the operating performance of real estate companies. NAREIT defines FFO as net income/(loss) available to the Company’s common shareholders computed in accordance with GAAP, excluding (i) depreciation and amortization related to real estate, (ii) gains or losses from sales of certain real estate assets, (iii) gains and losses from change in control, (iv) impairment write-downs of certain real estate assets and investments in entities when the impairment is directly attributable to decreases in the value of depreciable real estate held by the entity and (v) after adjustments for unconsolidated partnerships and joint ventures calculated to reflect FFO on the same basis. The Company also made an election, per the NAREIT Funds From Operations White Paper-2018 Restatement, to exclude from its calculation of FFO (i) gains and losses on the sale of assets and impairments of assets incidental to its main business and (ii) mark-to-market changes in the value of its equity securities. As such, the Company does not include gains/impairments on land parcels, mark-to-market gains/losses from marketable securities, allowance for credit losses on mortgage receivables or gains/impairments on other investments in NAREIT defined FFO.
The Company presents FFO available to the Company’s common shareholders as it considers it an important supplemental measure of our operating performance and believes it is frequently used by securities analysts, investors and other interested parties in the evaluation of REITs, many of which present FFO available to the Company’s common shareholders when reporting results. Comparison of our presentation of FFO available to the Company’s common shareholders to similarly titled measures for other REITs may not necessarily be meaningful due to possible differences in the application of the NAREIT definition used by such REITs.
FFO is a supplemental non-GAAP financial measure of real estate companies’ operating performances, which does not represent cash generated from operating activities in accordance with GAAP and, therefore, should not be considered an alternative for net income or cash flows from operations as a measure of liquidity.
The Company’s reconciliation of Net (loss)/income available to the Company’s common shareholders to FFO available to the Company’s common shareholders is reflected in the table below (in thousands, except per share data).
|
Three Months Ended December 31, |
Year Ended December 31, |
|||||||||||||||
|
2022 |
2021 |
2022 |
2021 |
|||||||||||||
|
Net (loss)/income available to the Company’s common shareholders |
$ | (56,086 | ) | $ | 75,327 | $ | 100,758 | $ | 818,643 | |||||||
|
Gain on sale of properties |
(4,221 | ) | - | (15,179 | ) | (30,841 | ) | |||||||||
|
Gain on sale of joint venture properties |
(643 | ) | (11,596 | ) | (38,825 | ) | (16,879 | ) | ||||||||
|
Depreciation and amortization - real estate related |
123,663 | 132,797 | 501,274 | 392,095 | ||||||||||||
|
Depreciation and amortization - real estate joint ventures |
16,158 | 15,949 | 66,326 | 51,555 | ||||||||||||
|
Impairment charges (including real estate joint ventures) |
1,585 | 3,932 | 27,254 | 7,145 | ||||||||||||
|
Profit participation from other investments, net |
(4,584 | ) | (9,824 | ) | (15,593 | ) | (8,595 | ) | ||||||||
|
Loss/(gain) on marketable securities, net |
100,314 | 37,347 | 315,508 | (505,163 | ) | |||||||||||
|
Provision/(benefit) for income taxes (1) |
58,608 | (25 | ) | 58,373 | 2,152 | |||||||||||
|
Noncontrolling interests (1) |
63 | (3,835 | ) | (23,540 | ) | (3,285 | ) | |||||||||
|
FFO available to the Company’s common shareholders (3) |
$ | 234,857 | $ | 240,072 | $ | 976,356 | $ | 706,827 | ||||||||
|
Weighted average shares outstanding for FFO calculations: |
||||||||||||||||
|
Basic |
615,856 | 614,150 | 615,528 | 506,248 | ||||||||||||
|
Units |
2,559 | 3,878 | 2,492 | 2,627 | ||||||||||||
|
Dilutive effect of equity awards |
2,114 | 2,410 | 2,283 | 2,422 | ||||||||||||
|
Diluted (2) |
620,529 | 620,438 | 620,303 | 511,297 | ||||||||||||
|
FFO per common share – basic |
$ | 0.38 | $ | 0.39 | $ | 1.59 | $ | 1.40 | ||||||||
|
FFO per common share – diluted (2) |
$ | 0.38 | $ | 0.39 | $ | 1.58 | $ | 1.38 | ||||||||
|
(1) |
Related to gains, impairment, depreciation on properties, and gains/(losses) on sales of marketable securities, where applicable. |
|
(2) |
Reflects the potential impact if certain units were converted to common stock at the beginning of the period, which would have a dilutive effect on FFO available to the Company’s common shareholders. FFO available to the Company’s common shareholders would be increased by $584 and $856 for the three months ended December 31, 2022 and 2021, respectively, and $2,041 and $1,053 for the years ended December 31, 2022 and 2021, respectively. The effect of other certain convertible units would have an anti-dilutive effect upon the calculation of FFO available to the Company’s common shareholders per share. Accordingly, the impact of such conversion has not been included in the determination of diluted earnings per share calculations. |
|
(3) |
Includes Merger charges of $50.2 million recognized during the year ended December 31, 2021, in connection with the Merger. In addition, the three months and year ended December 31, 2021, includes a pension valuation adjustment of $3.0 million of income included in Other income, net on the Company’s Consolidated Statements of Income. Includes Early extinguishment of debt charges of $7.7 million recognized during the year ended December 31, 2022. |
Same Property Net Operating Income
Same property NOI is a supplemental non-GAAP financial measure of real estate companies’ operating performance and should not be considered an alternative to net income in accordance with GAAP or cash flows from operations as a measure of liquidity. The Company considers Same property NOI as an important operating performance measure because it is frequently used by securities analysts and investors to measure only the net operating income of properties that have been owned by the Company for the entire current and prior year reporting periods. It excludes properties under redevelopment, development and pending stabilization; properties are deemed stabilized at the earlier of (i) reaching 90% leased or (ii) one year following a project’s inclusion in operating real estate. Same property NOI assists in eliminating disparities in net income due to the development, acquisition or disposition of properties during the particular period presented, and thus provides a more consistent performance measure for the comparison of the Company's properties.
For the three months and years ended December 31, 2022 and 2021, the Company included Same property NOI from the Weingarten properties acquired through the Merger. The amount included in the table below, for "Weingarten Same property NOI", for the year ended December 31, 2021, represents the Same property NOI from Weingarten properties prior to the Merger, which is not included in the Company's Net (loss)/income available to the Company’s common shareholders.
Same property NOI is calculated using revenues from rental properties (excluding straight-line rent adjustments, lease termination fees, TIFs and amortization of above/below-market rents) less charges for credit losses, operating and maintenance expense, real estate taxes and rent expense plus the Company’s proportionate share of Same property NOI from unconsolidated real estate joint ventures, calculated on the same basis. The Company’s method of calculating Same property NOI available to the Company’s common shareholders may differ from methods used by other REITs and, accordingly, may not be comparable to such other REITs.
The following is a reconciliation of Net (loss)/income available to the Company’s common shareholders to Same property NOI (in thousands):
|
Three Months Ended December 31, |
Year Ended
|
|||||||||||||||
|
2022 |
2021 |
2022 |
2021 |
|||||||||||||
|
Net (loss)/income available to the Company’s common shareholders |
$ | (56,086 | ) | $ | 75,327 | $ | 100,758 | $ | 818,643 | |||||||
|
Adjustments: |
||||||||||||||||
|
Management and other fee income |
(3,955 | ) | (4,249 | ) | (16,836 | ) | (14,883 | ) | ||||||||
|
General and administrative |
31,928 | 28,985 | 119,534 | 104,121 | ||||||||||||
|
Impairment charges |
200 | 2,643 | 21,958 | 3,597 | ||||||||||||
|
Merger charges |
- | - | - | 50,191 | ||||||||||||
|
Depreciation and amortization |
124,676 | 133,633 | 505,000 | 395,320 | ||||||||||||
|
Gain on sale of properties |
(4,221 | ) | - | (15,179 | ) | (30,841 | ) | |||||||||
|
Interest and other expense, net |
50,969 | 49,503 | 205,652 | 184,323 | ||||||||||||
|
Loss/(gain) on marketable securities, net |
100,314 | 37,347 | 315,508 | (505,163 | ) | |||||||||||
|
Provision for income taxes, net |
57,750 | 483 | 56,654 | 3,380 | ||||||||||||
|
Equity in income of other investments, net |
(1,912 | ) | (12,807 | ) | (17,403 | ) | (23,172 | ) | ||||||||
|
Net income/(loss) attributable to noncontrolling interests |
2,710 | 268 | (11,442 | ) | 5,637 | |||||||||||
|
Preferred dividends |
6,307 | 6,354 | 25,218 | 25,416 | ||||||||||||
|
Weingarten same property NOI (1) |
- | - | - | 252,651 | ||||||||||||
|
Non same property net operating income |
(14,942 | ) | (15,661 | ) | (80,504 | ) | (113,794 | ) | ||||||||
|
Non-operational expense from joint ventures, net |
23,934 | 9,987 | 55,514 | 55,213 | ||||||||||||
|
Same property NOI |
$ | 317,672 | $ | 311,813 | $ | 1,264,432 | $ | 1,210,639 | ||||||||
|
(1) |
Amount for the year ended December 31, 2021, represents the Same property NOI from Weingarten properties, not included in the Company's Net income available to the Company's common shareholders pre-Merger. |
Same property NOI increased by $5.9 million, or 1.9%, for the three months ended December 31, 2022, as compared to the corresponding period in 2021. This increase is primarily the result of (i) an increase of $15.4 million primarily related to an increase in rental revenue driven by strong leasing activity and a decrease in tenant rent abatements and vacancies as a result of the diminishing effects of the COVID-19 pandemic, partially offset by (ii) a change in credit loss from tenants of $9.5 million.
Same property NOI increased by $53.8 million, or 4.4%, for the year ended December 31, 2022, as compared to the corresponding period in 2021. This increase is primarily the result of (i) an increase of $81.0 million primarily related to an increase in rental revenue driven by strong leasing activity and a decrease in tenant rent abatements and vacancies as a result of the diminishing effects of the COVID-19 pandemic, partially offset by (ii) a change in credit loss from tenants of $27.2 million.
New Accounting Pronouncements
See Footnote 1 of the Notes to Consolidated Financial Statements included in this Form 10-K.
Item 7A. Quantitative and Qualitative Disclosures About Market Risk
The Company’s primary market risk exposure is interest rate risk. The Company periodically evaluates its exposure to short-term interest rates and will, from time-to-time, enter into interest rate protection agreements which mitigate, but do not eliminate, the effect of changes in interest rates on its floating-rate debt. The Company has not entered, and does not plan to enter, into any derivative financial instruments for trading or speculative purposes. The following table presents the Company’s aggregate fixed rate and variable rate debt obligations outstanding, including fair market value adjustments and unamortized deferred financing costs, as of December 31, 2022, with corresponding weighted-average interest rates sorted by maturity date. The table does not include extension options where available (amounts in millions).
|
2023 |
2024 |
2025 |
2026 |
2027 |
Thereafter |
Total |
Fair Value |
|||||||||||||||||||||||||
|
Secured Debt |
||||||||||||||||||||||||||||||||
|
Fixed Rate |
$ | 12.0 | $ | 14.9 | $ | 53.0 | $ | - | $ | 34.3 | $ | 244.4 | $ | 358.6 | $ | 293.8 | ||||||||||||||||
|
Average Interest Rate |
3.23 |
% |
4.87 |
% |
3.50 |
% |
- | 4.01 |
% |
4.23 |
% |
4.10 |
% |
|||||||||||||||||||
|
Variable Rate |
$ | - | $ | - | $ | 18.3 | $ | - | $ | - | $ | - | $ | 18.3 | $ | 17.9 | ||||||||||||||||
|
Average Interest Rate |
- | - | 5.43 |
% |
- | - | - | 5.43 |
% |
|||||||||||||||||||||||
|
Unsecured Debt |
||||||||||||||||||||||||||||||||
|
Fixed Rate |
$ | - | $ | 654.3 | $ | 752.9 | $ | 785.4 | $ | 436.8 | $ | 4,151.6 | $ | 6,781.0 | $ | 5,837.4 | ||||||||||||||||
|
Average Interest Rate |
- | 3.37 |
% |
3.48 |
% |
3.06 |
% |
4.03 |
% |
3.47 |
% |
3.45 |
% |
|||||||||||||||||||
Based on the Company’s variable-rate debt balances, interest expense would have increased by $0.2 million for the year ended December 31, 2022, if short-term interest rates were 1.0% higher.
Item 8. Financial Statements and Supplementary Data
The response to this Item 8 is included in our audited Consolidated Financial Statements and Notes to Consolidated Financial Statements, which are contained in Part IV, Item 15 of this Form 10-K.
Item 9. Changes in and Disagreements With Accountants on Accounting and Financial Disclosure
None.
Item 9A. Controls and Procedures
Evaluation of Disclosure Controls and Procedures
The Company’s management, with the participation of the Company’s Chief Executive Officer and Chief Financial Officer, has evaluated the effectiveness of the Company’s disclosure controls and procedures (as such term is defined in Rules 13a-15(e) and 15d-15(e) under the Exchange Act) as of the end of the period covered by this report. Based on such evaluation, the Company’s Chief Executive Officer and Chief Financial Officer have concluded that the Company’s disclosure controls and procedures are effective as of December 31, 2022.
Changes in Internal Control Over Financial Reporting
There have not been any changes in the Company’s internal control over financial reporting (as such term is defined in Rules 13a-15(f) and 15d-15(f) under the Exchange Act) during the fourth fiscal quarter ended December 31, 2022, that have materially affected, or are reasonably likely to materially affect, the Company’s internal control over financial reporting.
Management ’ s Report on Internal Control Over Financial Reporting
Our management is responsible for establishing and maintaining adequate internal control over financial reporting, as such term is defined in Exchange Act Rule 13a-15(f) and 15d-15(f). Under the supervision and with the participation of our management, including our Chief Executive Officer and Chief Financial Officer, we conducted an evaluation of the effectiveness of our internal control over financial reporting based on the framework in the Internal Control - Integrated Framework ( 2013) issued by the Committee of Sponsoring Organizations of the Treadway Commission. Based on our evaluation under the framework in Internal Control - Integrated Framework (2013) , our management concluded that our internal control over financial reporting was effective as of December 31, 2022.
The effectiveness of our internal control over financial reporting as of December 31, 2022 has been audited by PricewaterhouseCoopers LLP, an independent registered public accounting firm, as stated in their report which appears under Item 8.
Director and Officer Indemnification Agreements
On or about February 23, 2023, the Company entered into, or will enter into, new indemnification agreements with each of its directors and executive officers (each, an “Indemnitee”). The indemnification agreements provide that the Company will indemnify the Indemnitee, in each case, against certain expenses and costs arising out of claims to which he or she becomes subject in connection with his or her service to the Company. The indemnification agreements contain customary terms and conditions and establish certain customary procedures and presumptions.
The above description of the indemnification agreements does not purport to be complete and is qualified in its entirety by reference to the Form of Indemnification Agreement filed as Exhibit 10.19 hereto and incorporated herein by reference.
Item 9C. Disclosure Regarding Foreign Jurisdictions that Prevent Inspections
Not applicable.
Item 10. Directors, Executive Officers and Corporate Governance
The information required by this item is incorporated by reference to “Proposal 1—Election of Directors,” “Governance at Kimco,” “Officers,” “Other Matters” and if required, “Delinquent Section 16(a) Reports” in our definitive proxy statement to be filed with respect to the Annual Meeting of Stockholders expected to be held on April 25, 2023 (“Proxy Statement”).
We have adopted a Code of Conduct that applies to all directors, officers and employees, including our principal executive officer, principal financial officer and principal accounting officer. The Code of Conduct is available at the Investors/Governance/Governance Documents section of our website at www.kimcorealty.com. A copy of the Code of Conduct is available in print, free of charge, to stockholders upon request to us at the address set forth in Item 1 of this Form 10-K under the section “Business - Overview.” We intend to satisfy the disclosure requirements under the Exchange Act, as amended, regarding an amendment to or waiver from a provision of our Code of Conduct by posting such information on our website.
Item 11. Executive Compensation
The information required by this item is incorporated by reference to “Compensation Discussion and Analysis,” “Executive Compensation Committee Report,” “ Executive Compensation Tables,” “Governance at Kimco” and “Other Matters” in our Proxy Statement.
Item 12. Security Ownership of Certain Beneficial Owners and Management and Related Stockholder Matters
The information required by this item is incorporated by reference to “Beneficial Ownership” and “Executive Compensation” in our Proxy Statement.
Item 13. Certain Relationships and Related Transactions, and Director Independence
The information required by this item is incorporated by reference to “Certain Relationships and Related Transactions” and “Governance at Kimco” in our Proxy Statement.
Item 14. Principal Accountant Fees and Services
The information required by this item is incorporated by reference to “Proposal 4 Ratification of Independent Accountants” in our Proxy Statement.
Item 15. Exhibits and Financial Statement Schedules
None.
|
Incorporated by Reference |
|||||||
|
Exhibit Number |
Exhibit Description |
Form |
File No. |
Date of Filing |
Exhibit Number |
Filed/ Furnished Herewith |
Page Number |
|
2.1 |
8-K |
1-10899 |
04/15/21 |
2.1 |
|||
|
2.2 |
Agreement and Plan of Merger, dated December 15, 2022, by and among Kimco, New Kimco and Merger Sub. |
8-K |
1-10899 |
12/15/22 |
2.1 |
||
|
3.1 |
Articles of Amendment and Restatement of K imco Realty Corporation |
8-K12B |
1-10899 |
01/03/23 |
3.1 |
||
|
3.2 |
Amended and Restated Bylaws of Kimco Realty Corporation, dated January 31, 2023 |
8-K12B |
1-10899 |
02/02/23 |
3.1 |
||
|
3.3 |
8-K12B |
1-10899 |
01/03/23 |
3.3 |
|||
|
3.4 |
8-K12B |
1-10899 |
01/03/23 |
3.4 |
|||
|
3.5 |
Limited Liability Company Agreement of Kimco Realty OP, LLC, dated as of January 3, 2023 |
8-K12B |
1-10899 |
01/03/23 |
3.5 |
||
|
4.1 |
Indenture dated September 1, 1993, between Kimco Realty Corporation and Bank of New York (as successor to IBJ Schroder Bank and Trust Company) |
S-3 |
333-67552 |
09/10/93 |
4(a) |
||
|
4.2 |
First Supplemental Indenture, dated August 4, 1994, between Kimco Realty Corporation and Bank of New York (as successor to IBJ Schroder Bank and Trust Company) |
10-K |
1-10899 |
03/28/96 |
4.6 |
||
|
4.3 |
Second Supplemental Indenture, dated April 7, 1995, between Kimco Realty Corporation and Bank of New York (as successor to IBJ Schroder Bank and Trust Company) |
8-K |
1-10899 |
04/07/95 |
4(a) |
||
|
4.4 |
8-K |
1-10899 |
06/05/06 |
4.1 |
|||
|
4.5 |
8-K |
1-10899 |
04/26/07 |
1.3 |
|||
|
4.6 |
8-K12B |
1-10899 |
01/03/23 |
4.2 |
|||
|
4.7 |
8-K |
1-10899 |
09/24/09 |
4.1 |
|||
|
4.8 |
8-K |
1-10899 |
05/23/13 |
4.1 |
|||
|
4.9 |
8-K |
1-10899 |
04/24/14 |
4.1 |
|||
|
Incorporated by Reference |
|||||||
|
Exhibit Number |
Exhibit Description |
Form |
File No. |
Date of Filing |
Exhibit Number |
Filed/ Furnished Herewith |
Page Number |
|
4.10 |
8-K12B |
1-10899 |
01/03/23 |
4.1 |
|||
|
4.11 |
S-3ASR |
333-269102 |
01/03/23 |
4(j) |
|||
|
4.12 |
10-K |
1-10899 |
02/25/20 |
4.10 |
|||
|
4.13 |
S-3 |
33-57659 |
02/10/95 |
4(a) |
|||
| 4.14 | First Supplemental Indenture, dated August 2, 2006, between Weingarten Realty Investors and The Bank of New York Mellon Trust Company, N.A. (successor to J.P. Morgan Trust Company, National Association, successor to Texas Commerce Bank National Association). | 8-K | 1-09876 | 08/02/06 | 4.1 | ||
|
4.15 |
8-K |
1-09876 |
10/09/12 |
4.1 |
|||
| 4.16 | Third Supplemental Indenture, dated August 3, 2021, between Kimco Realty Corporation, Weingarten Realty Investors and The Bank of New York Mellon Trust Company, N.A. (successor to J.P. Morgan Trust Company, National Association, successor to Texas Commerce Bank National Association). | — | — | — | — | * | |
| 4.17 | Fourth Supplemental Indenture, dated January 3, 2023, between Kimco Realty Corporation (successor in interest to Weingarten Realty Investors) and The Bank of New York Mellon Trust Company, N.A. (successor to J.P. Morgan Trust Company, National Association, successor to Texas Commerce Bank National Association). | 8-K12B | 1-10899 | 01/03/23 | 4.2 | ||
|
10.1 |
Amended and Restated Stock Option Plan |
10-K |
1-10899 |
03/28/95 |
10.3 |
||
|
10.2 |
10-K |
1-10899 |
02/27/09 |
10.9 |
|||
|
10.3 |
Kimco Realty Corporation Executive Severance Plan, dated March 15, 2010 |
8-K |
1-10899 |
03/19/10 |
10.5 |
||
|
10.4 |
Restated Kimco Realty Corporation 2010 Equity Participation Plan |
10-K |
1-10899 |
02/27/17 |
10.6 |
||
|
10.5 |
Amendment No. 1 to the Kimco Realty Corporation 2010 Equity Participation Plan |
10-K |
1-10899 |
02/23/18 |
10.7 |
||
|
10.6 |
Amendment No. 2 to the Kimco Realty Corporation 2010 Equity Participation Plan |
8-K12B |
1-10899 |
01/03/23 |
10.7 |
||
|
10.7 |
Form of Performance Share Award Grant Notice and Performance Share Award Agreement |
8-K |
1-10899 |
03/19/10 |
10.8 |
||
|
10.8 |
First Amendment to the Kimco Realty Corporation Executive Severance Plan, dated March 20, 2012 |
10-Q |
1-10899 |
05/10/12 |
10.3 |
||
|
10.9 |
8-K |
1-10899 |
03/02/20 |
10.1 |
|||
|
10.10 |
DEF 14A |
1-10899 |
03/18/20 |
Annex B |
|||
|
10.11 |
Kimco Realty Corporation Amended and Restated 2020 Equity P articipation Plan |
8-K12B |
1-10899 |
01/03/23 |
10.8 |
||
|
10.12 |
10-Q |
1-10899 |
08/07/20 |
10.1 |
|||
|
10.13 |
10-Q |
1-10899 |
08/07/20 |
10.2 |
|||
|
10.14 |
10-Q |
1-10899 |
08/07/20 |
10.3 |
|||
|
10.15 |
8-K12B |
1-10899 |
01/03/23 |
10.1 |
|||
|
10.16 |
10-Q |
1-10899 |
08/07/20 |
10.4 |
|||
|
Incorporated by Reference |
|||||||
|
Exhibit Number |
Exhibit Description |
Form |
File No. |
Date of Filing |
Exhibit Number |
Filed/ Furnished Herewith |
Page Number |
|
10.17 |
10-Q |
1-10899 |
08/07/20 |
10.5 |
|||
|
10.18 |
P arent Guarantee, dated as of January 1, 2023, by Kimco Realty Corporation |
8-K12B |
1-10899 |
01/03/23 |
10.2 |
||
| 10.19 | Form of Indemnification Agreement | — | — | — | — | * | |
| 10.20 | Amended and Restated Credit Agreement, dated as of February 23, 2023, among Kimco Realty OP, LLC and each of the parties named therein. | — | — | — | — | * | |
|
21.1 |
Significant Subsidiaries of Kimco Realty Corporation and Kimco Realty OP, LLC |
— |
— |
— |
— |
* |
|
|
23.1 |
— |
— |
— |
— |
* |
||
|
31.1 |
— |
— |
— |
— |
* |
||
|
31.2 |
— |
— |
— |
— |
* |
||
|
31.3 |
— |
— |
— |
— |
* |
||
|
31.4 |
— |
— |
— |
— |
* |
||
|
32.1 |
— |
— |
— |
— |
** |
||
|
32.2 |
— |
— |
— |
— |
** |
||
|
32.3 |
— |
— |
— |
— |
** |
||
|
32.4 |
— |
— |
— |
— |
** |
||
|
99.1 |
— |
— |
— |
— |
* |
||
|
101.INS |
XBRL Instance Document - the instance document does not appear in the Interactive Data File because its XBRL tags are embedded within the Inline XBRL document |
— |
— |
— |
— |
* |
|
|
101.SCH |
Inline XBRL Taxonomy Extension Schema |
— |
— |
— |
— |
* |
|
|
101.CAL |
Inline XBRL Taxonomy Extension Calculation Linkbase |
— |
— |
— |
— |
* |
|
|
101.DEF |
Inline XBRL Taxonomy Extension Definition Linkbase |
— |
— |
— |
— |
* |
|
|
101.LAB |
Inline XBRL Taxonomy Extension Label Linkbase |
— |
— |
— |
— |
* |
|
|
101.PRE |
Inline XBRL Taxonomy Extension Presentation Linkbase |
— |
— |
— |
— |
* |
|
|
104 |
Cover Page Interactive Data File (formatted as Inline XBRL and contained in Exhibit 101) |
* |
|||||
* Filed herewith
** Furnished herewith
SIGNATURES
Pursuant to the requirements of Section 13 or 15(d) of the Securities Exchange Act of 1934, the registrant has duly caused this report to be signed on its behalf by the undersigned, thereunto duly authorized.
|
|
KIMCO REALTY CORPORATION |
|
|
|
|
|
|
|
|
|
|
|
|
|
|
By: |
/s/ Conor C. Flynn |
|
|
|
Conor C. Flynn |
|
|
|
|
|
Chief Executive Officer |
|
Dated: February 24, 2023
Pursuant to the requirements of the Securities Exchange Act of 1934, this report has been signed below by the following persons on behalf of the registrant and in the capacities and on the dates indicated.
|
Signature |
Title |
Date |
|
|
/s/ Milton Cooper |
Executive Chairman of the Board of Directors |
February 24, 2023 |
|
|
Milton Cooper |
|||
|
/s/ Conor C. Flynn |
Chief Executive Officer and Director |
February 24, 2023 |
|
|
Conor C. Flynn |
|||
|
/s/ Frank Lourenso |
Director |
February 24, 2023 |
|
|
Frank Lourenso |
|||
|
/s/ Richard Saltzman |
Director |
February 24, 2023 |
|
|
Richard Saltzman |
|||
|
/s/ Philip Coviello |
Director |
February 24, 2023 |
|
|
Philip Coviello |
|||
|
/s/ Mary Hogan Preusse |
Director |
February 24, 2023 |
|
|
Mary Hogan Preusse |
|||
|
/s/ Valerie Richardson |
Director |
February 24, 2023 |
|
|
Valerie Richardson |
|||
|
/s/ Henry Moniz |
Director |
February 24, 2023 |
|
|
Henry Moniz |
|||
|
/s/ Glenn G. Cohen |
Executive Vice President - |
February 24, 2023 |
|
|
Glenn G. Cohen |
Chief Financial Officer and Treasurer |
||
|
/s/ Paul Westbrook |
Vice President - |
February 24, 2023 |
|
|
Paul Westbrook |
Chief Accounting Officer |
SIGNATURES
|
KIMCO REALTY OP, LLC
|
|||
| BY: | KIMCO REALTY CORPORATION, managing member | ||
| By: | /s/ Conor C. Flynn | ||
| Conor C. Flynn | |||
| Chief Executive Officer | |||
Pursuant to the requirements of the Securities Exchange Act of 1934, this report has been signed below by the following directors and officers of Kimco Realty Corporation, the managing member of the registrant, and in the capacities and on the dates indicated.
| Signature | Title | Date | |
| /s/ Milton Cooper | Executive Chairman of the Board of Directors | February 24, 2023 | |
| Milton Cooper | |||
| /s/ Conor C. Flynn | Chief Executive Officer and Director | February 24, 2023 | |
| Conor C. Flynn | |||
| /s/ Frank Lourenso | Director | February 24, 2023 | |
| Frank Lourenso | |||
| /s/ Richard Saltzman | Director | February 24, 2023 | |
| Richard Saltzman | |||
| /s/ Philip Coviello | Director | February 24, 2023 | |
| Philip Coviello | |||
| /s/ Mary Hogan Preusse | Director | February 24, 2023 | |
| Mary Hogan Preusse | |||
| /s/ Valerie Richardson | Director | February 24, 2023 | |
| Valerie Richardson | |||
| /s/ Henry Moniz | Director | February 24, 2023 | |
| Henry Moniz | |||
| /s/ Glenn G. Cohen | Executive Vice President - | February 24, 2023 | |
| Glenn G. Cohen | Chief Financial Officer and Treasurer | ||
| /s/ Paul Westbrook | Vice President - | February 24, 2023 | |
| Paul Westbrook | Chief Accounting Officer |
ANNUAL REPORT ON FORM 10-K
ITEM 8, ITEM 15 (a) (1) and (2)
INDEX TO FINANCIAL STATEMENTS
AND
FINANCIAL STATEMENT SCHEDULES
|
Form 10-K
|
||
|
KIMCO REALTY CORPORATION AND SUBSIDIARIES |
||
|
Report of Independent Registered Public Accounting Firm (PCAOB ID
|
||
|
Consolidated Financial Statements and Financial Statement Schedules: |
||
|
Consolidated Balance Sheets as of December 31, 2022 and 2021 |
||
|
Consolidated Statements of Income for the years ended December 31, 2022, 2021 and 2020 |
||
|
Consolidated Statements of Comprehensive Income for the years ended December 31, 2022, 2021 and 2020 |
||
|
Consolidated Statements of Changes in Equity for the years ended December 31, 2022, 2021 and 2020 |
||
|
|
||
|
Consolidated Statements of Cash Flows for the years ended December 31, 2022, 2021 and 2020 |
||
|
Financial Statement Schedules: |
||
|
II. |
Valuation and Qualifying Accounts for the years ended December 31, 2022, 2021 and 2020 |
|
|
III. |
Real Estate and Accumulated Depreciation as of December 31, 2022 |
|
|
IV. |
||
Report of Independent Registered Public Accounting Firm
To the Board of Directors and Stockholders of Kimco Realty Corporation
Opinions on the Financial Statements and Internal Control over Financial Reporting
We have audited the consolidated financial statements, including the related notes, as listed in the index appearing under Item 15(a)(1), and the financial statement schedules listed in the index appearing under Item 15(a)(2), of Kimco Realty Corporation and its subsidiaries (the “Company”) (collectively referred to as the “consolidated financial statements”). We also have audited the Company's internal control over financial reporting as of December 31, 2022, based on criteria established in Internal Control - Integrated Framework (2013) issued by the Committee of Sponsoring Organizations of the Treadway Commission (COSO).
In our opinion, the consolidated financial statements referred to above present fairly, in all material respects, the financial position of the Company as of December 31, 2022 and 2021, and the results of its operations and its cash flows for each of the three years in the period ended December 31, 2022 in conformity with accounting principles generally accepted in the United States of America. Also in our opinion, the Company maintained, in all material respects, effective internal control over financial reporting as of December 31, 2022, based on criteria established in Internal Control - Integrated Framework (2013) issued by the COSO.
Basis for Opinions
The Company's management is responsible for these consolidated financial statements, for maintaining effective internal control over financial reporting, and for its assessment of the effectiveness of internal control over financial reporting, included in Management’s Report on Internal Control Over Financial Reporting appearing under Item 9A. Our responsibility is to express opinions on the Company’s consolidated financial statements and on the Company's internal control over financial reporting based on our audits. We are a public accounting firm registered with the Public Company Accounting Oversight Board (United States) (PCAOB) and are required to be independent with respect to the Company in accordance with the U.S. federal securities laws and the applicable rules and regulations of the Securities and Exchange Commission and the PCAOB.
We conducted our audits in accordance with the standards of the PCAOB. Those standards require that we plan and perform the audits to obtain reasonable assurance about whether the consolidated financial statements are free of material misstatement, whether due to error or fraud, and whether effective internal control over financial reporting was maintained in all material respects.
Our audits of the consolidated financial statements included performing procedures to assess the risks of material misstatement of the consolidated financial statements, whether due to error or fraud, and performing procedures that respond to those risks. Such procedures included examining, on a test basis, evidence regarding the amounts and disclosures in the consolidated financial statements. Our audits also included evaluating the accounting principles used and significant estimates made by management, as well as evaluating the overall presentation of the consolidated financial statements. Our audit of internal control over financial reporting included obtaining an understanding of internal control over financial reporting, assessing the risk that a material weakness exists, and testing and evaluating the design and operating effectiveness of internal control based on the assessed risk. Our audits also included performing such other procedures as we considered necessary in the circumstances. We believe that our audits provide a reasonable basis for our opinions.
Definition and Limitations of Internal Control over Financial Reporting
A company’s internal control over financial reporting is a process designed to provide reasonable assurance regarding the reliability of financial reporting and the preparation of financial statements for external purposes in accordance with generally accepted accounting principles. A company’s internal control over financial reporting includes those policies and procedures that (i) pertain to the maintenance of records that, in reasonable detail, accurately and fairly reflect the transactions and dispositions of the assets of the company; (ii) provide reasonable assurance that transactions are recorded as necessary to permit preparation of financial statements in accordance with generally accepted accounting principles, and that receipts and expenditures of the company are being made only in accordance with authorizations of management and directors of the company; and (iii) provide reasonable assurance regarding prevention or timely detection of unauthorized acquisition, use, or disposition of the company’s assets that could have a material effect on the financial statements.
Because of its inherent limitations, internal control over financial reporting may not prevent or detect misstatements. Also, projections of any evaluation of effectiveness to future periods are subject to the risk that controls may become inadequate because of changes in conditions, or that the degree of compliance with the policies or procedures may deteriorate.
Critical Audit Matters
The critical audit matter communicated below is a matter arising from the current period audit of the consolidated financial statements that was communicated or required to be communicated to the audit committee and that (i) relates to accounts or disclosures that are material to the consolidated financial statements and (ii) involved our especially challenging, subjective, or complex judgments. The communication of critical audit matters does not alter in any way our opinion on the consolidated financial statements, taken as a whole, and we are not, by communicating the critical audit matter below, providing a separate opinion on the critical audit matter or on the accounts or disclosures to which it relates.
Analysis of Real Estate Properties for Indicators of Impairment
As described in Notes 1 and 6 to the consolidated financial statements, the net carrying value of the Company’s real estate net was $15.0 billion. On a continuous basis, management assesses whether there are indicators, including property operating performance, changes in anticipated holding period, and general market conditions, that the value of the Company’s real estate properties may be impaired. An impairment is recognized on properties held for use when the expected undiscounted cash flows for a property are less than its carrying amount, at which time, the property is written-down to its estimated fair value.
The principal considerations for our determination that performing procedures relating to the analysis of real estate properties for indicators of impairment of property carrying values is a critical audit matter are (i) the significant judgment by management to identify indicators of impairment related to property operating performance, changes in anticipated holding period, and general market conditions which led to (ii) a high degree of auditor judgment, subjectivity, and effort in performing procedures and evaluating audit evidence related to management’s determination of impairment indicators related to property operating performance, changes in anticipated holding period, and general market conditions.
Addressing the matter involved performing procedures and evaluating audit evidence in connection with forming our overall opinion on the consolidated financial statements. These procedures included testing the effectiveness of controls relating to management’s analysis of real estate properties for indicators of impairment. These procedures also included, among others (i) testing management’s process for identifying real estate properties for indicators of impairment, (ii) evaluating the appropriateness of management’s undiscounted cash flow analysis, (iii) testing the underlying data used in the analysis, and (iv) evaluating the reasonableness of management’s determination of impairment indicators related to property operating performance, changes in anticipated holding period, and general market conditions. Evaluating the reasonableness of management’s determination of impairment indicators included (i) evaluating property operating performance and management’s intent with respect to holding or disposing of properties, (ii) evaluating the consistency of the sales prices utilized by management with external market and industry data, and (iii) assessing management’s considerations of general market conditions.
/s/
February 24, 2023
We have served as the Company’s auditor since at least 1991.We have not been able to determine the specific year we began serving as auditor of the Company.
KIMCO REALTY CORPORATION AND SUBSIDIARIES
CONSOLIDATED BALANCE SHEETS
(in thousands, except share data)
|
December 31, 2022 |
December 31, 2021 |
|||||||
|
Assets: |
||||||||
|
Real estate: |
||||||||
|
Land |
$ |
|
$ |
|
||||
|
Building and improvements |
|
|
||||||
|
Real estate |
|
|
||||||
|
Less: accumulated depreciation and amortization |
(
|
) |
(
|
) | ||||
|
Total real estate, net |
|
|
||||||
|
Investments in and advances to real estate joint ventures |
|
|
||||||
|
Other investments |
|
|
||||||
|
Cash and cash equivalents |
|
|
||||||
|
Marketable securities |
|
|
||||||
|
Accounts and notes receivable, net |
|
|
||||||
|
Deferred charges and prepaid expenses |
|
|
||||||
|
Operating lease right-of-use assets, net |
|
|
||||||
|
Other assets |
|
|
||||||
|
Total assets (1) |
$ |
|
$ |
|
||||
|
Liabilities: |
||||||||
|
Notes payable, net |
$ |
|
$ |
|
||||
|
Mortgages payable, net |
|
|
||||||
|
Accounts payable and accrued expenses |
|
|
||||||
|
Dividends payable |
|
|
||||||
|
Operating lease liabilities |
|
|
||||||
|
Other liabilities |
|
|
||||||
|
Total liabilities (2) |
|
|
||||||
|
Redeemable noncontrolling interests |
|
|
||||||
|
Commitments and contingencies (Footnote 22) |
||||||||
|
Stockholders' equity: |
||||||||
|
Preferred stock, $ par value, authorized shares; issued and outstanding (in series) and shares, respectively; aggregate liquidation preference $ and $ , respectively |
|
|
||||||
|
Common stock, $ par value, authorized shares; issued and outstanding and shares, respectively |
|
|
||||||
|
Paid-in capital |
|
|
||||||
|
(Cumulative distributions in excess of net income)/retained earnings |
(
|
) |
|
|||||
|
Accumulated other comprehensive income |
|
|
||||||
|
Total stockholders' equity |
|
|
||||||
|
Noncontrolling interests |
|
|
||||||
|
Total equity |
|
|
||||||
|
Total liabilities and equity |
$ |
|
$ |
|
||||
|
(1) |
Includes restricted assets of consolidated variable interest entities (“VIEs”) at December 31, 2022 and December 31, 2021 of $436,605 and $227,858, respectively. See Footnote 17 of the Notes to Consolidated Financial Statements. |
|
(2) |
Includes non-recourse liabilities of consolidated VIEs at December 31, 2022 and December 31, 2021 of $199,132 and $153,924, respectively. See Footnote 17 of the Notes to Consolidated Financial Statements. |
The accompanying notes are an integral part of these consolidated financial statements.
KIMCO REALTY CORPORATION AND SUBSIDIARIES
CONSOLIDATED STATEMENTS OF INCOME
(in thousands, except per share data)
|
Year Ended December 31, |
||||||||||||
|
2022 |
2021 |
2020 |
||||||||||
|
Revenues |
||||||||||||
|
Revenues from rental properties, net |
$ |
|
$ |
|
$ |
|
||||||
|
Management and other fee income |
|
|
|
|||||||||
|
Total revenues |
|
|
|
|||||||||
|
Operating expenses |
||||||||||||
|
Rent |
(
|
) |
(
|
) |
(
|
) | ||||||
|
Real estate taxes |
(
|
) |
(
|
) |
(
|
) | ||||||
|
Operating and maintenance |
(
|
) |
(
|
) |
(
|
) | ||||||
|
General and administrative |
(
|
) |
(
|
) |
(
|
) | ||||||
|
Impairment charges |
(
|
) |
(
|
) |
(
|
) | ||||||
|
Merger charges |
|
(
|
) |
|
||||||||
|
Depreciation and amortization |
(
|
) |
(
|
) |
(
|
) | ||||||
|
Total operating expenses |
(
|
) |
(
|
) |
(
|
) | ||||||
|
Gain on sale of properties |
|
|
|
|||||||||
|
Operating income |
|
|
|
|||||||||
|
Other income/(expense) |
||||||||||||
|
Other income, net |
|
|
|
|||||||||
|
(Loss)/gain on marketable securities, net |
(
|
) |
|
|
||||||||
|
Gain on sale of cost method investment |
|
|
|
|||||||||
|
Interest expense |
(
|
) |
(
|
) |
(
|
) | ||||||
|
Early extinguishment of debt charges |
(
|
) |
|
(
|
) | |||||||
|
Income before income taxes, net, equity in income of joint ventures, net, and equity in income from other investments, net |
|
|
|
|||||||||
|
Provision for income taxes, net |
(
|
) |
(
|
) |
(
|
) | ||||||
|
Equity in income of joint ventures, net |
|
|
|
|||||||||
|
Equity in income of other investments, net |
|
|
|
|||||||||
|
Net income |
|
|
|
|||||||||
|
Net loss/(income) attributable to noncontrolling interests |
|
(
|
) |
(
|
) | |||||||
|
Net income attributable to the Company |
|
|
|
|||||||||
|
Preferred dividends |
(
|
) |
(
|
) |
(
|
) | ||||||
|
Net income available to the Company's common shareholders |
$ |
|
$ |
|
$ |
|
||||||
|
Per common share: |
||||||||||||
| Net income available to the Company's common shareholders: | ||||||||||||
|
-Basic |
$ |
|
$ |
|
$ |
|
||||||
|
-Diluted |
$ |
|
$ |
|
$ |
|
||||||
|
Weighted average shares: |
||||||||||||
|
-Basic |
|
|
|
|||||||||
|
-Diluted |
|
|
|
|||||||||
The accompanying notes are an integral part of these consolidated financial statements.
KIMCO REALTY CORPORATION AND SUBSIDIARIES
CONSOLIDATED STATEMENTS OF COMPREHENSIVE INCOME
(in thousands)
|
Year Ended December 31, |
||||||||||||
|
2022 |
2021 |
2020 |
||||||||||
|
Net income |
$ |
|
$ |
|
$ |
|
||||||
|
Other comprehensive income: |
||||||||||||
|
Change in unrealized gains related to defined benefit plan |
|
|
|
|||||||||
|
Other comprehensive income |
|
|
|
|||||||||
|
Comprehensive income |
|
|
|
|||||||||
|
Comprehensive loss/(income) attributable to noncontrolling interests |
|
(
|
) |
(
|
) | |||||||
|
Comprehensive income attributable to the Company |
$ |
|
$ |
|
$ |
|
||||||
The accompanying notes are an integral part of these consolidated financial statements.
KIMCO REALTY CORPORATION AND SUBSIDIARIES
CONSOLIDATED STATEMENTS OF CHANGES IN EQUITY
For the Years Ended December 31, 2022, 2021 and 2020
(in thousands)
|
(Cumulative Distributions in Excess of Net Income)/ Retained |
Accumulated Other Comprehensive |
Preferred Stock |
Common Stock |
Paid-in |
Total Stockholders' |
Noncontrolling |
Total |
|||||||||||||||||||||||||||||||||
|
Earnings |
Income |
Issued |
Amount |
Issued |
Amount |
Capital |
Equity |
Interests |
Equity |
|||||||||||||||||||||||||||||||
|
Balance, January 1, 2020 |
$ |
(
|
) | $ |
|
|
$ |
|
|
$ |
|
$ |
|
$ |
|
$ |
|
$ |
|
|||||||||||||||||||||
|
Contributions from noncontrolling interests |
|
|
- |
|
- |
|
|
|
|
|
||||||||||||||||||||||||||||||
|
Net income |
|
|
- |
|
- |
|
|
|
|
|
||||||||||||||||||||||||||||||
|
Redeemable noncontrolling interests income |
|
|
- |
|
- |
|
|
|
(
|
) |
(
|
) | ||||||||||||||||||||||||||||
|
Dividends declared to common and preferred shares |
(
|
) |
|
- |
|
- |
|
|
(
|
) |
|
(
|
) | |||||||||||||||||||||||||||
|
Distributions to noncontrolling interests |
|
|
- |
|
- |
|
|
|
(
|
) |
(
|
) | ||||||||||||||||||||||||||||
|
Issuance of common stock |
|
|
|
|
|
|
(
|
) |
|
|
|
|||||||||||||||||||||||||||||
|
Surrender of restricted common stock |
|
|
|
|
(
|
) |
(
|
) |
(
|
) |
(
|
) |
|
(
|
) | |||||||||||||||||||||||||
|
Exercise of common stock options |
|
|
|
|
|
|
|
|
|
|
||||||||||||||||||||||||||||||
|
Amortization of equity awards |
|
|
- |
|
- |
|
|
|
|
|
||||||||||||||||||||||||||||||
|
Acquisition of noncontrolling interests |
|
|
- |
|
- |
|
(
|
) |
(
|
) |
(
|
) |
(
|
) | ||||||||||||||||||||||||||
|
Adjustment of redeemable noncontrolling interests to estimated fair value |
|
|
- |
|
- |
|
|
|
|
|
||||||||||||||||||||||||||||||
|
Balance, December 31, 2020 |
(
|
) |
|
|
|
|
|
|
|
|
|
|||||||||||||||||||||||||||||
|
Comprehensive income: |
||||||||||||||||||||||||||||||||||||||||
|
Net income |
|
|
- |
|
- |
|
|
|
|
|
||||||||||||||||||||||||||||||
|
Other comprehensive income: |
||||||||||||||||||||||||||||||||||||||||
|
Change in unrealized gains related to defined benefit plan |
|
|
- |
|
- |
|
|
|
|
|
||||||||||||||||||||||||||||||
|
Redeemable noncontrolling interests income |
|
|
- |
|
- |
|
|
|
(
|
) |
(
|
) | ||||||||||||||||||||||||||||
|
Dividends declared to common and preferred shares |
(
|
) |
|
- |
|
- |
|
|
(
|
) |
|
(
|
) | |||||||||||||||||||||||||||
|
Distributions to noncontrolling interests |
|
|
- |
|
- |
|
|
|
(
|
) |
(
|
) | ||||||||||||||||||||||||||||
|
Issuance of common stock, net of issuance costs |
|
|
|
|
|
|
|
|
|
|
||||||||||||||||||||||||||||||
|
Issuance of common stock for merger (1) |
|
|
|
|
|
|
|
|
|
|
||||||||||||||||||||||||||||||
|
Surrender of common stock for taxes |
|
|
|
|
(
|
) |
(
|
) |
(
|
) |
(
|
) |
|
(
|
) | |||||||||||||||||||||||||
|
Exercise of common stock options |
|
|
|
|
|
|
|
|
|
|
||||||||||||||||||||||||||||||
|
Amortization of equity awards |
|
|
- |
|
- |
|
|
|
|
|
||||||||||||||||||||||||||||||
|
Noncontrolling interests assumed from the merger (1) |
|
|
- |
|
- |
|
|
|
|
|
||||||||||||||||||||||||||||||
|
Redemption/conversion of noncontrolling interests |
|
|
|
|
|
|
|
|
(
|
) |
(
|
) | ||||||||||||||||||||||||||||
|
Adjustment of redeemable noncontrolling interests to estimated fair value |
|
|
- |
|
- |
|
|
|
|
|
||||||||||||||||||||||||||||||
|
Balance at December 31, 2021 |
|
|
|
|
|
|
|
|
|
|
||||||||||||||||||||||||||||||
|
Contributions from noncontrolling interest |
|
|
- |
|
- |
|
|
|
|
|
||||||||||||||||||||||||||||||
|
Net income/(loss) |
|
|
- |
|
- |
|
|
|
(
|
) |
|
|||||||||||||||||||||||||||||
|
Other comprehensive income: |
||||||||||||||||||||||||||||||||||||||||
|
Change in unrealized gains related to defined benefit plan |
|
|
- |
|
- |
|
|
|
|
|
||||||||||||||||||||||||||||||
|
Redeemable noncontrolling interests income |
|
|
- |
|
- |
|
|
|
(
|
) |
(
|
) | ||||||||||||||||||||||||||||
|
Dividends declared to common and preferred shares |
(
|
) |
|
- |
|
- |
|
|
(
|
) |
|
(
|
) | |||||||||||||||||||||||||||
|
Repurchase of preferred stock |
|
|
(
|
) |
(
|
) |
|
|
(
|
) |
(
|
) |
|
(
|
) | |||||||||||||||||||||||||
|
Distributions to noncontrolling interests |
|
|
- |
|
- |
|
|
|
(
|
) |
(
|
) | ||||||||||||||||||||||||||||
|
Issuance of common stock, net of issuance costs |
|
|
|
|
|
|
|
|
|
|
||||||||||||||||||||||||||||||
|
Surrender of restricted common stock |
|
|
|
|
(
|
) |
(
|
) |
(
|
) |
(
|
) |
|
(
|
) | |||||||||||||||||||||||||
|
Exercise of common stock options |
|
|
|
|
|
|
|
|
|
|
||||||||||||||||||||||||||||||
|
Amortization of equity awards |
|
|
- |
|
- |
|
|
|
|
|
||||||||||||||||||||||||||||||
|
Redemption/conversion of noncontrolling interests |
|
|
- |
|
73 |
|
|
|
(
|
) |
(
|
) | ||||||||||||||||||||||||||||
|
Balance at December 31, 2022 |
$ |
(
|
) | $ |
|
|
$ |
|
|
$ |
|
$ |
|
$ |
|
$ |
|
$ |
|
|||||||||||||||||||||
|
(1) |
See Footnotes 1 and 2 of the Notes to Consolidated Financial Statements for further details. |
The accompanying notes are an integral part of these consolidated financial statements.
KIMCO REALTY CORPORATION AND SUBSIDIARIES
CONSOLIDATED STATEMENTS OF CASH FLOWS
(in thousands)
|
Year Ended December 31, |
||||||||||||
|
2022 |
2021 |
2020 |
||||||||||
|
Cash flow from operating activities: |
||||||||||||
|
Net income |
$ |
|
$ |
|
$ |
|
||||||
|
Adjustments to reconcile net income to net cash provided by operating activities: |
||||||||||||
|
Depreciation and amortization |
|
|
|
|||||||||
|
Impairment charges |
|
|
|
|||||||||
|
Straight-line rental income adjustments, net |
(
|
) |
(
|
) |
|
|||||||
|
Amortization of above-market and below-market leases, net |
(
|
) |
(
|
) |
(
|
) | ||||||
|
Amortization of deferred financing costs and fair value debt adjustments, net |
(
|
) |
(
|
) |
|
|||||||
|
Early extinguishment of debt charges |
|
|
|
|||||||||
|
Equity award expense |
|
|
|
|||||||||
|
Gain on sale of properties |
(
|
) |
(
|
) |
(
|
) | ||||||
|
Loss/(gain) on marketable securities, net |
|
(
|
) |
(
|
) | |||||||
|
Gain on sale of cost method investment |
|
|
(
|
) | ||||||||
|
Equity in income of joint ventures, net |
(
|
) |
(
|
) |
(
|
) | ||||||
|
Equity in income from other investments, net |
(
|
) |
(
|
) |
(
|
) | ||||||
|
Distributions from joint ventures and other investments |
|
|
|
|||||||||
|
Change in accounts and notes receivable, net |
(
|
) |
|
(
|
) | |||||||
|
Change in accounts payable and accrued expenses |
|
(
|
) |
|
||||||||
|
Change in other operating assets and liabilities, net |
(
|
) |
|
(
|
) | |||||||
|
Net cash flow provided by operating activities |
|
|
|
|||||||||
|
Cash flow from investing activities: |
||||||||||||
|
Acquisition of operating real estate and other related net assets |
(
|
) |
(
|
) |
(
|
) | ||||||
|
Improvements to operating real estate |
(
|
) |
(
|
) |
(
|
) | ||||||
|
Improvements to real estate under development |
|
|
(
|
) | ||||||||
|
Acquisition of Weingarten Realty Investors, net of cash acquired of $56,451 |
|
(
|
) |
|
||||||||
|
Investment in marketable securities |
(
|
) |
|
|
||||||||
|
Proceeds from sale of marketable securities |
|
|
|
|||||||||
|
Investment in cost method investments |
(
|
) |
|
|
||||||||
|
Proceeds from sale of cost method investment |
|
|
|
|||||||||
|
Investments in and advances to real estate joint ventures |
(
|
) |
(
|
) |
(
|
) | ||||||
|
Reimbursements of investments in and advances to real estate joint ventures |
|
|
|
|||||||||
|
Investments in and advances to other investments |
(
|
) |
(
|
) |
(
|
) | ||||||
|
Reimbursements of investments in and advances to other investments |
|
|
|
|||||||||
|
Investment in mortgage and other financing receivables |
(
|
) |
(
|
) |
(
|
) | ||||||
|
Collection of mortgage and other financing receivables |
|
|
|
|||||||||
|
Proceeds from sale of properties |
|
|
|
|||||||||
|
Proceeds from insurance casualty claims |
|
|
|
|||||||||
| Principal payments from securities held-to-maturity |
|
|
|
|||||||||
|
Net cash flow used for investing activities |
(
|
) |
(
|
) |
(
|
) | ||||||
|
Cash flow from financing activities: |
||||||||||||
|
Principal payments on debt, excluding normal amortization of rental property debt |
(
|
) |
(
|
) |
(
|
) | ||||||
|
Principal payments on rental property debt |
(
|
) |
(
|
) |
(
|
) | ||||||
|
Proceeds from mortgage loan financings |
|
|
|
|||||||||
|
Proceeds from issuance of unsecured term loan |
|
|
|
|||||||||
|
Proceeds from issuance of unsecured notes |
|
|
|
|||||||||
|
Repayments from the unsecured revolving credit facility, net |
|
|
(
|
) | ||||||||
|
Repayments of unsecured term loan |
|
|
(
|
) | ||||||||
|
Repayments of unsecured notes |
(
|
) |
|
(
|
) | |||||||
|
Financing origination costs |
(
|
) |
(
|
) |
(
|
) | ||||||
|
Payment of early extinguishment of debt charges |
(
|
) |
|
(
|
) | |||||||
|
Contributions from noncontrolling interests |
|
|
|
|||||||||
|
Redemption/distribution of noncontrolling interests |
(
|
) |
(
|
) |
(
|
) | ||||||
|
Dividends paid |
(
|
) |
(
|
) |
(
|
) | ||||||
|
Proceeds from issuance of stock, net |
|
|
|
|||||||||
|
Repurchase of preferred stock |
(
|
) |
|
|
||||||||
|
Shares repurchased for employee tax withholding on equity awards |
(
|
) |
(
|
) |
(
|
) | ||||||
|
Change in tenants' security deposits |
|
|
(
|
) | ||||||||
|
Net cash flow used for financing activities |
(
|
) |
(
|
) |
(
|
) | ||||||
|
Net change in cash, cash equivalents and restricted cash |
(
|
) |
|
|
||||||||
|
Cash, cash equivalents and restricted cash, beginning of year |
|
|
|
|||||||||
|
Cash, cash equivalents and restricted cash, end of year |
$ |
|
$ |
|
$ |
|
||||||
|
Interest paid during the year including payment of early extinguishment of debt charges of $ , $ and $ , respectively (net of capitalized interest of $ , $ and $ , respectively) |
$ |
|
$ |
|
$ |
|
||||||
|
Income taxes paid during the year (net of refunds received of $ , $ and $ , respectively) |
$ |
|
$ |
|
$ |
|
||||||
The accompanying notes are an integral part of these consolidated financial statements.
KIMCO REALTY CORPORATION AND SUBSIDIARIES
NOTES TO CONSOLIDATED FINANCIAL STATEMENTS
Amounts relating to the number of buildings, square footage, tenant and occupancy data, joint venture debt and average interest rates and terms on joint venture debt are unaudited.
The terms “Kimco,” the “Company” and “our” each refer to Kimco Realty Corporation and its subsidiaries, unless the context indicates otherwise. In statements regarding qualification as a REIT, such terms refer solely to Kimco Realty Corporation.
1. Summary of Significant Accounting Policies:
Business and Organization
The Company operates as a Real Estate Investment Trust (“REIT”) and is engaged principally in the ownership, management, development and operation of open-air shopping centers, which are anchored primarily by grocery stores, off-price retailers, discounters or service-oriented tenants. Additionally, the Company provides complementary services that capitalize on the Company’s established retail real estate expertise. The Company evaluates performance on a property specific or transactional basis and does not distinguish its principal business or group its operations on a geographical basis for purposes of measuring performance. Accordingly, the Company believes it has a single reportable segment for disclosure purposes in accordance with accounting principles generally accepted in the United States of America ("GAAP").
The Company has elected to be taxed as a REIT for federal income tax purposes under the Internal Revenue Code of 1986, as amended (the "Code"). The Company is organized and operates in a manner that enables it to qualify as a REIT under the Code.
In January 2023, the Company completed its reorganization into an umbrella partnership real estate investment trust “UPREIT”. See Footnote 29 of the Company’s Consolidated Financial Statements for further discussion.
Weingarten Merger
On
August 3, 2021,
Weingarten Realty Investors (“Weingarten”) merged with and into the Company, with the Company continuing as the surviving public company (the “Merger”), pursuant to the definitive merger agreement (the “Merger Agreement”) between the Company and Weingarten entered into on
April 15, 2021.
Under the terms of the Merger Agreement, each Weingarten common share was entitled to
Economic Conditions
The economy continues to face several issues including the lack of qualified employees, inflation risk, supply chain issues and new COVID- 19 variants, which could impact the Company and its tenants. In response to the rising rate of inflation, the Federal Reserve has steadily increased interest rates, and may continue to increase interest rates, until the rate of inflation begins to decrease. These increases in interest rates could adversely impact the business and financial results of the Company and its tenants. In addition, slower economic growth and the potential for a recession could have an adverse effect on the Company and its tenants. This could negatively affect the overall demand for retail space, including the demand for leasable space in the Company’s properties. As a result, the Company could feel pricing pressure on rents that it is able to charge to new or renewing tenants, such that future rents and rent spreads could be negatively impacted. The Company continues to monitor economic, financial, and social conditions and will assess its asset portfolio for any impairment indicators.
Basis of Presentation
The accompanying Consolidated Financial Statements include the accounts of the Company. The Company’s subsidiaries include subsidiaries which are wholly owned or which the Company has a controlling interest, including where the Company has been determined to be a primary beneficiary of a variable interest entity (“VIE”) in accordance with the consolidation guidance of the Financial Accounting Standards Board (“FASB”) Accounting Standards Codification (“ASC”). All inter-company balances and transactions have been eliminated in consolidation.
Use of Estimates
GAAP requires the Company's management to make estimates and assumptions that affect the reported amounts of assets and liabilities, the disclosure of contingent assets and liabilities and the reported amounts of revenues and expenses during a reporting period. The most significant assumptions and estimates relate to the valuation of real estate and related intangible assets and liabilities, equity method investments, other investments, including the assessment of impairments, as well as, depreciable lives, revenue recognition, and the collectability of trade accounts receivable. Application of these assumptions requires the exercise of judgment as to future uncertainties, and, as a result, actual results could differ from these estimates.
Subsequent Events
The Company has evaluated subsequent events and transactions for potential recognition or disclosure in its consolidated financial statements (see Footnote 29 of the Notes to Consolidated Financial Statements).
Real Estate
Real estate assets are stated at cost, less accumulated depreciation and amortization. The Company periodically assesses the useful lives of its depreciable real estate assets, including those expected to be redeveloped in future periods, and accounts for any revisions prospectively. Expenditures for maintenance, repairs and demolition costs are charged to operations as incurred. Significant renovations and replacements, which improve or extend the life of the asset, are capitalized.
The Company evaluates each acquisition transaction to determine whether the acquired asset meets the definition of a business and therefore accounted for as a business combination or if the acquisition transaction should be accounted for as an asset acquisition. Under Business Combinations (Topic 805 ) , an acquisition does not qualify as a business when (i) substantially all of the fair value is concentrated in a single identifiable asset or group of similar identifiable assets or (ii) the acquisition does not include a substantive process in the form of an acquired workforce or (iii) an acquired contract that cannot be replaced without significant cost, effort or delay. Transaction costs related to acquisitions that qualify as asset acquisitions are capitalized as part of the cost basis of the acquired assets, while transaction costs for acquisitions that are deemed to be acquisitions of a business are expensed as incurred.
When substantially all of the fair value is not concentrated in a group of similar identifiable assets, the set of assets will generally be considered a business and the Company applies the acquisition method of accounting for business combinations, where all tangible and identifiable intangible assets acquired, and all liabilities assumed are recorded at fair value. In a business combination, the difference, if any, between the purchase price and the fair value of identifiable net assets acquired is either recorded as goodwill or as a bargain purchase gain.
In both a business combination and an asset acquisition, the Company allocates the purchase price of acquired properties to tangible and identifiable intangible assets or liabilities based on their respective fair values. The fair value of any tangible real estate assets acquired is determined by valuing the building as if it were vacant, and the fair value is then allocated to land, buildings, and improvements based on available information including replacement cost, appraisal or using net operating income capitalization rates, discounted cash flow analysis or similar fair value models. Fair value estimates are also made using significant assumptions such as capitalization rates, discount rates, fair market lease rates, land values per square foot and other market data. Estimates of future cash flows are based on a number of factors including the historical operating results, known and anticipated trends, and market and economic conditions. Tangible assets may include land, land improvements, buildings, building improvements and tenant improvements. Intangible assets may include the value of in-place leases and above and below-market leases and other identifiable assets or liabilities based on lease or property specific characteristics.
In allocating the purchase price to identified intangible assets and liabilities of acquired properties, the value of above-market and below-market leases is estimated based on the present value of the difference between the contractual amounts, including fixed rate below-market lease renewal options, to be paid pursuant to the leases and management’s estimate of the market lease rates and other lease provisions (e.g., expense recapture, base rental changes) measured over a period equal to the estimated remaining term of the lease. The capitalized above-market or below-market intangible is amortized to rental income over the estimated remaining term of the respective leases, which includes the expected renewal option period for below-market leases. Mortgage debt discounts or premiums are amortized into interest expense over the remaining term of the related debt instrument.
In determining the value of in-place leases, management considers current market conditions and costs to execute similar leases in arriving at an estimate of the carrying costs during the expected lease-up period from vacant to existing occupancy. In estimating carrying costs, management includes real estate taxes, insurance, other operating expenses, estimates of lost rental revenue during the expected lease-up periods and costs to execute similar leases including leasing commissions, legal and other related costs based on current market demand. The value assigned to in-place leases and tenant relationships is amortized over the estimated remaining term of the leases. If a lease were to be terminated prior to its scheduled expiration, all unamortized costs relating to that lease would be written off.
The useful lives of amortizable intangible assets are evaluated each reporting period with any changes in estimated useful lives being accounted for over the revised remaining useful life.
Depreciation and amortization are provided on the straight-line method over the estimated useful lives of the assets, as follows:
|
Buildings and building improvements (in years) |
|
to |
|
|||
|
Fixtures, leasehold and tenant improvements (including certain identified intangible assets) |
|
Terms of leases or useful lives, whichever is shorter | ||||
The difference between the fair value and the face value of debt assumed, if any, in connection with an acquisition is recorded as a premium or discount and is amortized on a straight-line basis, which approximates the effective interest method, over the terms of the related debt agreements. The fair value of debt is estimated based upon contractual future cash flows discounted using borrowing spreads and market interest rates that would have been available for debt with similar terms and maturities.
Real estate under development represents the development of open-air shopping center projects, which may include residential and mixed-use components, that the Company plans to hold as long-term investments. These properties are carried at cost. The cost of land and buildings under development includes specifically identifiable costs. Capitalized costs include pre-construction costs essential to the development of the property, construction costs, interest costs, real estate taxes, insurance, legal costs, salaries and related costs of personnel directly involved and other costs incurred during the period of development. The Company ceases cost capitalization when the property is held available for occupancy and placed into service. This usually occurs upon substantial completion of all development activity necessary to bring the property to the condition needed for its intended use, but no later than year from the completion of major construction activity. However, the Company may continue to capitalize costs even though a project is substantially completed if construction is still ongoing at the site. If, in management’s opinion, the current and projected undiscounted cash flows of these assets to be held as long-term investments is less than the net carrying value plus estimated costs to complete the development, the carrying value would be adjusted to an amount that reflects the estimated fair value of the property.
The Company's policy is to classify real estate assets as held-for-sale if the (i) asset is under contract, (ii) the buyer’s deposit is non-refundable, (iii) due diligence has expired and (iv) management believes it is probable that the disposition will occur within one year. When a real estate asset is identified by management as held-for-sale, the Company ceases depreciation of the asset and estimates the fair value. If the fair value of the asset, less cost to sell, is less than the net book value of the asset, an adjustment to the carrying value would be recorded to reflect the estimated fair value of the property, and the asset is included within Other assets on the Company's Consolidated Balance Sheets.
On a continuous basis, management assesses whether there are any indicators, including property operating performance, changes in anticipated holding period and general market conditions, that the value of the real estate properties (including any related amortizable intangible assets or liabilities) may be impaired. A property value is considered impaired only if management’s estimated fair value is less than the net carrying value of the property. The Company’s estimated fair value is primarily based upon (i) estimated sales prices from signed contracts or letters of intent from third -party offers or (ii) discounted cash flow models of the property over its remaining hold period. An impairment is recognized on properties held for use when the expected undiscounted cash flows for a property are less than its carrying amount, at which time, the property is written-down to its estimated fair value. Estimated fair values which are based on discounted cash flow models include all estimated cash inflows and outflows over a specified holding period. Capitalization rates and discount rates utilized in these models are based upon unobservable rates that the Company believes to be within a reasonable range of current market rates. In addition, such cash flow models consider factors such as expected future operating income, trends and prospects, as well as the effects of demand, competition and other factors. To the extent impairment has occurred, the carrying value of the property would be adjusted to an amount to reflect the estimated fair value of the property. The Company does not have access to the unobservable inputs used to determine the estimated fair values of third -party offers.
Investments in Unconsolidated Joint Ventures
The Company accounts for its investments in unconsolidated joint ventures under the equity method of accounting as the Company exercises significant influence, but does not control, these entities. These investments are recorded initially at cost and are subsequently adjusted for cash contributions and distributions. Earnings for each investment are recognized in accordance with each respective investment agreement and where applicable, are based upon an allocation of the investment’s net assets at book value as if the investment was hypothetically liquidated at the end of each reporting period.
The Company’s joint ventures primarily consist of co-investments with institutional and other joint venture partners in open-air shopping center properties, consistent with its core business. These joint ventures typically obtain non-recourse third -party financing on their property investments, thus contractually limiting the Company’s exposure to losses primarily to the amount of its equity investment; and due to the lender’s exposure to losses, a lender typically will require a minimum level of equity in order to mitigate its risk. The Company, on a limited selective basis, has obtained unsecured financing for certain joint ventures. These unsecured financings may be guaranteed by the Company with guarantees from the joint venture partners for their proportionate amounts of any guaranty payment the Company is obligated to make. As of December 31, 2022, the Company did not guaranty any unsecured joint venture debt.
To recognize the character of distributions from equity investees within its Consolidated Statements of Cash Flows, all distributions received are presumed to be returns on investment and classified as cash inflows from operating activities unless the Company’s cumulative distributions received less distributions received in prior periods that were determined to be returns of investment exceed its cumulative equity in earnings recognized by the investor (as adjusted for amortization of basis differences). When such an excess occurs, the current-period distribution up to this excess is considered a return of investment and classified as cash inflows from investing.
In a business combination, the fair value of the Company’s investment in an unconsolidated joint venture is calculated using the fair value of the real estate held by the joint venture, which are valued using similar methods as described in the Company’s Real Estate policy above, offset by the fair value of the debt on the property which is then multiplied by the Company’s equity ownership percentage.
On a continuous basis, management assesses whether there are any indicators, including the underlying investment property operating performance and general market conditions, that the value of the Company’s investments in unconsolidated joint ventures may be impaired. An investment’s value is impaired only if management’s estimate of the fair value of the investment is less than the carrying value of the investment and such difference is deemed to be other-than-temporary. To the extent impairment has occurred, the loss will be measured as the excess of the carrying amount of the investment over the estimated fair value of the investment. Estimated fair values which are based on discounted cash flow models include all estimated cash inflows and outflows over a specified holding period, and, where applicable, any estimated debt premiums. Capitalization rates and discount rates utilized in these models are based upon unobservable rates that the Company believes to be within a reasonable range of current market rates.
Other Investments
Other investments primarily consist of preferred equity investments for which the Company provides capital to owners and developers of real estate. The Company typically accounts for its preferred equity investments on the equity method of accounting, whereby earnings for each investment are recognized in accordance with each respective investment agreement and based upon an allocation of the investment’s net assets at book value as if the investment was hypothetically liquidated at the end of each reporting period.
On a continuous basis, management assesses whether there are any indicators, including the underlying investment property operating performance and general market conditions, that the value of the Company’s Other investments may be impaired. An investment’s value is impaired only if management’s estimate of the fair value of the investment is less than the carrying value of the investment and such difference is deemed to be other-than-temporary. To the extent impairment has occurred, the loss shall be measured as the excess of the carrying amount of the investment over the estimated fair value of the investment.
The Company’s estimated fair values are based upon a discounted cash flow model for each investment that includes all estimated cash inflows and outflows over a specified holding period and, where applicable, any estimated debt premiums. Capitalization rates, discount rates and credit spreads utilized in these models are based upon rates that the Company believes to be within a reasonable range of current market rates.
Cash, Cash Equivalents and Restricted Cash
Cash and cash equivalents include demand deposits in banks, commercial paper and certificates of deposit with original maturities of three months or less. Cash and cash equivalent balances may, at a limited number of banks and financial institutions, exceed insurable amounts. The Company believes it mitigates risk by investing in or through major financial institutions and primarily in funds that are currently U.S. federal government insured up to applicable account limits. Recoverability of investments is dependent upon the performance of the issuers.
Restricted cash is deposits held or restricted for a specific use. The Company had restricted cash totaling $
Marketable Securities
The Company classifies its marketable equity securities as available-for-sale in accordance with the FASB’s Investments-Debt and Equity Securities guidance. In accordance with ASC Topic 825 Financial Instruments: the Company recognizes changes in the fair value of equity investments with readily determinable fair values in net income.
Other Assets
Mortgage and Other Financing Receivables
Mortgages and other financing receivables consist of loans acquired and loans originated by the Company, which are included within Other assets on the Company’s Consolidated Balance Sheets. Borrowers of these loans are primarily experienced owners, operators or developers of commercial real estate. The Company’s loans are primarily mortgage loans that are collateralized by real estate. Mortgages and other financing receivables are recorded at stated principal amounts, net of any discount or premium or deferred loan origination costs or fees. The related discounts or premiums on mortgages and other loans purchased are amortized or accreted over the life of the related loan receivable. The Company defers certain loan origination and commitment fees, net of certain origination costs and amortizes them as an adjustment of the loan’s yield over the term of the related loan.
The Company applies Accounting Standards Update (“ASU”) 2016 - 13 Financial Instruments – Credit Losses (Topic 326 ): Measurement of Credit Losses on Financial Instruments , which replaces the incurred loss methodology with an expected loss methodology that is referred to as the current expected credit loss (CECL) methodology. The measurement of expected credit losses under the CECL methodology is applicable to financial assets measured at amortized cost, including loan receivables and held-to-maturity debt securities. The Company adopted this standard using the modified retrospective method for all financial assets measured at amortized cost.
On a quarterly basis, the Company reviews credit quality indicators such as (i) payment status to identify performing versus non-performing loans, (ii) changes affecting the underlying real estate collateral and (iii) national and regional economic factors. The Company has determined that it has one portfolio segment, primarily represented by loans collateralized by real estate, whereby it determines, as needed, reserves for loan losses on an asset-specific basis. The reserve for loan losses reflects management's estimate of loan losses as of the balance sheet date and are included in Other income, net on the Company’s Consolidated Statements of Income. The reserve is increased through loan loss expense and is decreased by charge-offs when losses are confirmed through the receipt of assets such as cash or via ownership control of the underlying collateral in full satisfaction of the loan upon foreclosure or when significant collection efforts have ceased.
Interest income on performing loans is accrued as earned. A non-performing loan is placed on non-accrual status when it is probable that the borrower may be unable to meet interest payments as they become due. Generally, loans 90 days or more past due are placed on non-accrual status unless there is sufficient collateral to assure collectability of principal and interest. Upon the designation of non-accrual status, all unpaid accrued interest is reserved and charged against current income. Interest income on non-performing loans is generally recognized on a cash basis. Recognition of interest income on non-performing loans on an accrual basis is resumed when it is probable that the Company will be able to collect amounts due according to the contractual terms.
Tax Incremental Revenue Bonds
Other assets include Series B tax increment revenue bonds issued by the Sheridan Redevelopment Agency in connection with the development of a project in Sheridan, Colorado which were acquired in connection with the Merger, which mature on December 15, 2039. These Series B bonds have been classified as held to maturity and were recorded at estimated fair value upon the date of the Merger. The fair value estimates of the Company’s held to maturity tax increment revenue bonds are based on discounted cash flow analysis, which are based on the expected future sales tax revenues of the project. This analysis reflects the contractual terms of the bonds, including the period to maturity, and uses observable market-based inputs, such as market discount rates and unobservable market-based inputs, such as future growth and inflation rates. Interest on these bonds is recorded at an effective interest rate while cash payments are received at the contractual interest rate.
The held to maturity bonds are evaluated for credit losses based on discounted estimated future cash flows. Any future receipts in excess of the amortized basis will be recognized as revenue when received. The credit risk associated with the amortized value of these bonds is deemed as low risk as the bonds are earmarked for repayments from a government entity which are funded through sales and property taxes.
Deferred Leasing Costs
Initial direct leasing costs include commissions paid to third parties, including brokers, leasing and referral agents and internal leasing commissions paid to employees for successful execution of lease agreements. These initial direct leasing costs are capitalized and generally amortized over the term of the related leases using the straight-line method. These direct leasing costs are included in Other assets, on the Company’s Consolidated Balance Sheets and are classified as operating activities on the Company’s Consolidated Statements of Cash Flows.
Internal employee compensation, payroll-related benefits and certain external legal fees are considered indirect costs associated with the execution of lease agreements. These indirect leasing costs are expensed in accordance with ASU 2016 - 02, Leases (Topic 842 ) (“ASU 2016 - 02” ) and included in General and administrative expense on the Company’s Consolidated Statements of Income.
Software Development Costs
Expenditures for major software purchases and software developed for internal use are capitalized and amortized on a straight-line basis generally over a period of to years. The Company’s policy provides for the capitalization of external direct costs of materials and services associated with developing or obtaining internal use computer software. In addition, the Company also capitalizes certain payroll and payroll-related costs for employees who are directly associated with internal use computer software projects. The amount of payroll costs that can be capitalized with respect to these employees is limited to the time directly spent on such projects. Costs associated with preliminary project stage activities, training, maintenance and all other post-implementation stage activities are expensed as incurred. These software development costs are included in Other assets on the Company’s Consolidated Balance Sheets.
Deferred Financing Costs
Costs incurred in obtaining long-term financing, included in Notes payable, net and Mortgages payable, net in the accompanying Consolidated Balance Sheets, are amortized on a straight-line basis, which approximates the effective interest method, over the terms of the related debt agreements, as applicable.
Revenue, Trade Accounts Receivable and Gain Recognition
The Company determines the proper amount of revenue to be recognized in accordance with ASU 2014 - 09, Revenue from Contracts with Customers (Topic 606 ) , (“Topic 606” ), by performing the following steps: (i) identify the contract with the customer, (ii) identify the performance obligations within the contract, (iii) determine the transaction price, (iv) allocate the transaction price to the performance obligations and (v) recognize revenue when (or as) a performance obligation is satisfied. As of December 31, 2022 and 2021, the Company had no outstanding contract assets or contract liabilities.
The Company’s primary source of revenues are derived from lease agreements which fall under the scope of ASU 2016 - 02, Leases (Topic 842 ), (“Topic 842” ), which includes rental income and expense reimbursement income. The Company also has revenues which are accounted for under Topic 606, which include fees for services performed at various unconsolidated joint ventures for which the Company is the manager. These fees primarily include property and asset management fees, leasing fees, development fees and property acquisition/disposition fees. Also affected by Topic 606 are gains on sales of properties and tax increment financing (“TIF”) contracts. The Company presents its revenue streams on the Company’s Consolidated Statements of Income as Revenues from rental properties, net and Management and other fee income.
Revenues from rental properties, net
Revenues from rental properties, net are comprised of minimum base rent, percentage rent, lease termination fee income, amortization of above-market and below-market rent adjustments and straight-line rent adjustments. The Company accounts for lease and non-lease components as combined components under Topic 842. Non-lease components include reimbursements paid to the Company from tenants for common area maintenance costs and other operating expenses. The combined components are included in Revenues from rental properties, net on the Company’s Consolidated Statements of Income.
Base rental revenues from rental properties are recognized on a straight-line basis over the terms of the related leases. Certain of these leases also provide for percentage rents based upon the level of sales achieved by the lessee. These percentage rents are recognized once the required sales level is achieved. Rental income may also include payments received in connection with lease termination agreements. Lease termination fee income is recognized when the lessee provides consideration in order to terminate an existing lease agreement and has vacated the leased space. If the lessee continues to occupy the leased space for a period of time after the lease termination is agreed upon, the termination fee is accounted for as a lease modification based on the modified lease term. Upon acquisition of real estate operating properties, the Company estimates the fair value of identified intangible assets and liabilities (including above-market and below-market leases, where applicable). The capitalized above-market or below-market intangible asset or liability is amortized to rental income over the estimated remaining term of the respective leases, which includes the expected renewal option period for below-market leases.
Also included in Revenues from rental properties, net are ancillary income and TIF income. Ancillary income is derived through various agreements relating to parking lots, clothing bins, temporary storage, vending machines, ATMs, trash bins and trash collections, seasonal leases, etc. The majority of the revenue derived from these sources is through lease agreements/arrangements and is recognized in accordance with the lease terms described in the lease. The Company has TIF agreements with certain municipalities and receives payments in accordance with the agreements. TIF reimbursement income is recognized on a cash basis when received.
Management and other fee income
Property management fees, property acquisition and disposition fees, construction management fees, leasing fees and asset management fees all fall within the scope of Topic 606. These fees arise from contractual agreements with third parties or with entities in which the Company has a noncontrolling interest. Management and other fee income related to partially owned entities are recognized to the extent attributable to the unaffiliated interest. Property and asset management fee income is recognized as a single performance obligation (managing the property) comprised of a series of distinct services (maintaining property, handling tenant inquiries, etc.). The Company believes that the overall service of property management is substantially the same each day and has the same pattern of performance over the term of the agreement. As a result, each day of service represents a performance obligation satisfied at that point in time. The time-based output method is used to measure progress over time, as this is representative of the transfer of the services. These fees are recognized at the end of each period for services performed during that period, primarily billed to the customer monthly with payment due upon receipt.
Leasing fee income is recognized as a single performance obligation primarily upon the rent commencement date. The Company believes the leasing services it provides are similar for each available space leased and none of the individual activities necessary to facilitate the execution of each lease are distinct. These fees are billed to the customer monthly with payment due upon receipt.
Property acquisition and disposition fees are recognized when the Company satisfies a performance obligation by acquiring a property or transferring control of a property. These fees are billed subsequent to the acquisition or sale of the property and payment is due upon receipt.
Construction management fees are recognized as a single performance obligation (managing the construction of the project) composed of a series of distinct services. The Company believes that the overall service of construction management is substantially the same each day and has the same pattern of performance over the term of the agreement. As a result, each day of service represents a performance obligation satisfied at that point in time. These fees are based on the amount spent on the construction at the end of each period for services performed during that period, primarily billed to the customer monthly with payment due upon receipt.
Trade Accounts Receivable
The Company reviews its trade accounts receivable, related to base rents, straight-line rent, expense reimbursements and other revenues for collectability. The Company evaluates the probability of the collection of the lessee’s total accounts receivable, including the corresponding straight-line rent receivable balance on a lease-by-lease basis. The Company’s analysis of its accounts receivable included (i) customer credit worthiness, (ii) assessment of risk associated with the tenant, and (iii) current economic trends. In addition, tenants in bankruptcy are analyzed and considerations are made in connection with the expected recovery of pre-petition and post-petition bankruptcy claims. If a lessee’s accounts receivable balance is considered uncollectible, the Company will write-off the uncollectible receivable balances associated with the lease and will only recognize lease income on a cash basis. The Company includes provision for doubtful accounts in Revenues from rental properties, net, in accordance with Topic 842. Lease income will then be limited to the lesser of (i) the straight-line rental income or (ii) the lease payments that have been collected from the lessee. In addition to the lease-specific collectability assessment performed under Topic 842, the analysis also recognizes a general reserve under ASC Topic 450 Contingencies , as a reduction to Revenues from rental properties, for its portfolio of operating lease receivables which are not expected to be fully collectible based on the Company’s historical and current collection experience and the potential for settlement of arrears. Although the Company estimates uncollectible receivables and provides for them through charges against revenues from rental properties, actual results may differ from those estimates. If the Company subsequently determines that it is probable it will collect the remaining lessee’s lease payments under the lease term, the Company will then reinstate the straight-line balance.
Gains/losses on sale of properties
Gains and losses from the sale and/or transfer of nonfinancial assets, such as real estate property, are to be recognized when control of the asset transfers to the buyer, which will occur when the buyer has the ability to direct the use of or obtain substantially all of the remaining benefits from the asset. This generally occurs when the transaction closes and consideration is exchanged for control of the property.
Lessee Leases
The Company accounts for its leases in accordance with Topic 842. The Company has right-of-use (“ROU”) assets and lease liabilities on its balance sheet for those leases classified as operating and financing leases where the Company is a lessee. The Company’s leases where it is the lessee primarily consist of ground leases and administrative office leases. The Company classifies leases based on whether the arrangement is effectively a purchase of the underlying asset. Leases that transfer control of the underlying asset to a lessee are classified as finance leases and all other leases as operating leases. ROU assets represent the Company’s right to use an underlying asset for the lease term and lease liabilities represent the Company’s obligation to make lease payments arising from the lease. In connection with the Merger, the Company acquired two properties under finance leasing arrangements that consists of variable lease payments with a bargain purchase option which are included in Other assets, on the Company’s Consolidated Balance Sheets.
ROU assets and lease liabilities are recognized at the commencement date of the lease and liabilities are determined based on the estimated present value of the Company’s minimum lease payments under its lease agreements. Variable lease payments are excluded from the lease liabilities and corresponding ROU assets, as they are recognized in the period in which the obligation for those payments is incurred. Certain of the Company’s leases have renewal options for which the Company assesses whether it is reasonably certain the Company will exercise these renewal options. Lease payments associated with renewal options that the Company is reasonably certain will be exercised are included in the measurement of the lease liabilities and corresponding ROU assets. The discount rate used to determine the lease liabilities is based on the estimated incremental borrowing rate on a lease-by-lease basis. When calculating the incremental borrowing rates, the Company utilized data from (i) its recent debt issuances, (ii) publicly available data for instruments with similar characteristics, (iii) observable mortgage rates and (iv) unlevered property yields and discount rates. The Company then applied adjustments to account for considerations related to term and security that may not be fully incorporated by the data sets. Rental expense for lease payments is recognized on a straight-line basis over the lease term. See Footnote 11 to the Company’s Consolidated Financial Statements for further details.
Income Taxes
The Company elected to qualify as a REIT for federal income tax purposes commencing with its taxable year January 1, 1992 and operates in a manner that enables the Company to qualify and maintain its status as a REIT. Accordingly, the Company generally will not be subject to federal income tax, provided that distributions to its stockholders equal at least the amount of its REIT taxable income as defined under Sections 856 through 860 of the Code. The Company will be subject to federal income tax at regular corporate rates to the extent that it distributes less than 100% of its net taxable income, including any net capital gains. Most states, in which the Company holds investments in real estate, conform to the federal rules recognizing REITs.
The Company maintains certain subsidiaries which made joint elections with the Company to be treated as taxable REIT subsidiaries (“TRSs”), which permit the Company to engage through such TRSs in certain business activities that the REIT may not conduct directly. A TRS is subject to federal and state income taxes on its income, and the Company includes a provision for taxes in its consolidated financial statements. As such, the Company, through its wholly owned TRSs, has been engaged in various retail real estate related opportunities including retail real estate management and disposition services which primarily focus on leasing and disposition strategies of retail real estate controlled by both healthy and distressed and/or bankrupt retailers. The Company may consider other investments through its TRSs should suitable opportunities arise.
Income taxes are accounted for under the asset and liability method. Deferred tax assets and liabilities are recognized for the estimated future tax consequences attributable to differences between the financial statement carrying amounts of existing assets and liabilities and their respective tax bases and operating loss and tax credit carryforwards. Deferred tax assets and liabilities are measured using enacted tax rates in effect for the year in which those temporary differences are expected to be recovered or settled. The Company provides a valuation allowance for deferred tax assets for which it does not consider realization of such assets to be more likely than not.
The Company reviews the need to establish a valuation allowance against deferred tax assets on a quarterly basis. The review includes an analysis of various factors, such as future reversals of existing taxable temporary differences, the capacity for the carryback or carryforward of any losses, the expected occurrence of future income or loss and available tax planning strategies.
The Company applies the FASB’s guidance relating to uncertainty in income taxes recognized in a Company’s financial statements. Under this guidance the Company may recognize the tax benefit from an uncertain tax position only if it is more likely than not that the tax position will be sustained on examination by taxing authorities, based on the technical merits of the position. The tax benefits recognized in the financial statements from such a position are measured based on the largest benefit that has a greater than fifty percent likelihood of being realized upon ultimate settlement. The guidance on accounting for uncertainty in income taxes also provides guidance on de-recognition, classification, interest and penalties on income taxes, and accounting in interim periods.
Noncontrolling Interests
The Company accounts for noncontrolling interests in accordance with the Consolidation guidance and the Distinguishing Liabilities from Equity guidance issued by the FASB. Noncontrolling interests represent the portion of equity that the Company does not own in those entities it consolidates. The Company identifies its noncontrolling interests separately within the equity section on the Company’s Consolidated Balance Sheets. The amounts of consolidated net earnings attributable to the Company and to the noncontrolling interests are presented separately on the Company’s Consolidated Statements of Income.
Noncontrolling interests also include amounts related to partnership units issued by consolidated subsidiaries of the Company in connection with certain property acquisitions. These units have a stated redemption value or a defined redemption amount based upon the trading price of the Company’s common stock and provides the unit holders various rates of return during the holding period. The unit holders generally have the right to redeem their units for cash at any time after one year from issuance. For convertible units, the Company typically has the option to settle redemption amounts in cash or common stock.
The Company evaluates the terms of the partnership units issued in accordance with the FASB’s Distinguishing Liabilities from Equity guidance. Convertible units for which the Company has the option to settle redemption amounts in cash or common stock are included in the caption Noncontrolling interests within the equity section on the Company’s Consolidated Balance Sheets. Units which embody a conditional obligation requiring the Company to redeem the units for cash after a specified or determinable date (or dates) or upon the occurrence of an event that is not solely within the control of the issuer are determined to be contingently redeemable under this guidance and are included as Redeemable noncontrolling interests and classified within the mezzanine section between Total liabilities and Stockholders’ equity on the Company’s Consolidated Balance Sheets.
In a business combination, the fair value of the noncontrolling interest in a consolidated joint venture is calculated using the fair value of the real estate held by the joint venture, which are valued using similar methods as described in the Company’s Real Estate policy above, offset by the fair value of the debt on the property which is then multiplied by the partners’ noncontrolling share.
Contingently redeemable noncontrolling interests are recorded at fair value upon issuance. Any change in the fair value or redemption value of these noncontrolling interests is subsequently recognized through Paid-in capital on the Company’s Consolidated Balance Sheets and is included in the Company’s computation of earnings per share (see Footnote 28 of the Notes to the Consolidated Financial Statements).
Stock Compensation
In
May 2020,
the Company’s stockholders approved the
2020
Equity Participation Plan (the
“2020
Plan”), which is a successor to the Restated Kimco Realty Corporation
2010
Equity Participation Plan that expired in
March 2020.
The
2020
Plan provides for a maximum of
The Company accounts for equity awards in accordance with the FASB’s Stock Compensation guidance which requires that all share-based payments to employees be recognized in the Statements of Income over the service period based on their fair values. Fair value of performance awards is determined using the Monte Carlo method, which is intended to estimate the fair value of the awards at the grant date (see Footnote 23 of the Notes to Consolidated Financial Statements for additional disclosure on the assumptions and methodology).
Reclassifications
Certain amounts in the prior period have been reclassified in order to conform to the current period’s presentation. For comparative purposes, the Company reclassified $
|
2021 |
2020 |
|||||||
| Operating activities: | ||||||||
|
Straight-line rental income adjustments, net |
$ |
(
|
) | $ |
|
|||
|
Amortization of amortization of above-market and below-market leases, net |
$ |
(
|
) | $ |
(
|
) | ||
|
Amortization of deferred financing costs and fair value debt adjustments, net |
$ |
(
|
) | $ |
|
|||
|
Change in accounts and notes receivable, net |
$ |
|
$ |
(
|
) | |||
|
Change in other operating assets and liabilities, net |
$ |
|
$ |
|
||||
| Financing activities: | ||||||||
|
Change in other financing liabilities |
$ |
|
$ |
|
||||
|
Shares repurchased for employee tax withholdings on equity awards |
$ |
|
$ |
(
|
) | |||
|
Change in tenant’s security deposits |
$ |
|
$ |
(
|
) | |||
New Accounting Pronouncements
The following table represents ASUs to the FASB’s ASCs that, as of December 31, 2022, are not yet effective for the Company and for which the Company has not elected early adoption, where permitted:
|
ASU |
Description |
Effective Date |
Effect on the financial statements or other significant matters |
|
ASU 2022 - 03, Fair Value Measurement (Topic 820 ): Fair Value Measurement of Equity Securities Subject to Contractual Sale Restrictions |
This ASU clarifies the guidance in Topic 820, Fair Value Measurement, when measuring the fair value of an equity security subject to contractual restrictions that prohibit the sale of an equity security and provides new disclosure requirements for equity securities subject to contractual sale restrictions that are measured at fair value in accordance with Topic 820. |
January 1, 2024; Early adoption permitted |
The Company is assessing the impact this ASU will have on the Company’s financial position and/or results of operations. |
|
ASU 2021 - 08, Business Combinations (Topic 805 ): Accounting for Contract Assets and Contract Liabilities from Contracts with Customers |
The amendments in this ASU require acquiring entities to apply Topic 606 to recognize and measure contract assets and contract liabilities in a business combination rather than at fair value on the acquisition date required by Topic 805. |
January 1, 2023; Early adoption permitted
|
The adoption of this ASU is not expected to have a material impact on the Company’s financial position and/or results of operations. |
The following ASUs to the FASB’s ASCs have been adopted by the Company as of the date listed:
|
ASU |
Description |
Adoption Date |
Effect on the financial statements or other significant matters |
|
ASU 2021 - 05, Lessors – Certain Leases with Variable Lease Payments (Topic 842 ) |
This ASU amends the lessor lease classification in ASC 842 for leases that include variable lease payments that are not based on an index or rate. Under the amended guidance, lessors will classify a lease with variable payments that do not depend on an index or rate as an operating lease if the lease would have been classified as a sales-type lease or a direct financing lease under the previous ASU 842 classification criteria and sales-type or direct financing lease classification would result in a Day 1 loss. |
January 1, 2022 |
The adoption of this ASU did not impact the Company’s financial position and/or results of operations. |
|
ASU
2020
-
04,
Reference Rate Reform (Topic
848
): Facilitation of the Effects of Reference Rate Reform on Financial Reporting
ASU 2022 - 06, Deferral of the Sunset Date of Topic 848 |
In
March 2020,
the FASB issued ASU
2020
-
04,
Reference Rate Reform (Topic
848
) ("ASU
2020
-
04"
). ASU
2020
-
04
contains practical expedients for reference rate reform related activities that impact debt, leases, derivatives, and other contracts. The guidance in ASU
2020
-
04
is optional and
may
be elected over time as reference rate reform activities occur.
In December 2022, the FASB issued ASU 2022 - 06, Deferral of the Sunset Date of Topic 848 (“ASU 2022 - 06” ) which defers the sunset date of ASU 2020 - 04 to December 31, 2024. ASU 2022 - 06 is effective immediately for all companies. |
March 2020
through
December 31, 2024
|
ASU
2020
-
04
did
not
have a material impact on the Company’s financial position and/or results of operations.
ASU 2022 - 06 had no impact on the Company's consolidated financial statements for the year ended December 31, 2022. |
2. Weingarten Merger
Overview
On
August 3, 2021,
the Company completed the Merger with Weingarten, under which Weingarten merged with and into the Company, with the Company continuing as the surviving public company. The total purchase price of the Merger was $
|
Weingarten common shares outstanding as of August 3, 2021 |
|
|||
|
Exchange ratio |
|
|||
|
Kimco common stock issued |
|
The following table presents the purchase price and the total value of stock consideration paid by Kimco at the close of the Merger (in thousands except share price of Kimco common stock):
|
Price of Kimco Common Stock |
Equity Consideration Given (Kimco Shares Issued) |
Calculated Value of Weingarten Consideration |
Cash Consideration * |
Total Value of Consideration |
||||||||||||||||
|
As of August 3, 2021 |
$ |
|
|
$ |
|
$ |
|
$ |
|
|||||||||||
* Amount includes additional consideration of $
As a result of the Merger, Kimco acquired
Purchase Price Allocation
In accordance with ASC
805
-
10,
Business Combinations, the Company accounted for the Merger as a business combination using the acquisition method of accounting. Based on the value of the common shares issued and cash consideration paid, the total fair value of the assets acquired and liabilities assumed in the Merger was $
The fair value of the real estate assets acquired were determined using either (i) a direct capitalization method, (ii) a discounted cash flow analysis or (iii) estimated sales prices from signed contracts or letters of intent from
third
party offers. Market data and comparable sales information were used in estimating the fair value of the land acquired. The Company determined that these valuation methodologies are classified within Level
3
of the fair value hierarchy. The assumptions and estimates included in these methodologies include stabilized net operating income, future income growth, capitalization rates, discount rates, capital expenditures, and cash flow projections at the respective properties. Under the direct capitalization method, the Company derived a normalized net operating income and applied a current market capitalization rate for each property. The estimates of normalized net operating income are based on a number of factors, including historical operating results, known trends, fair market lease rates and market/economic conditions. Capitalization rates utilized to derive these fair values ranged from
The discounted cash flow analyses were based on estimated future cash flow projections that utilize discount rates, terminal capitalization rates and planned capital expenditures. These estimates approximate the inputs the Company believes would be utilized by market participants in assessing fair value. The estimates of future cash flow projections are based on a number of factors, including historical operating results, estimated growth rates, known and anticipated trends, fair market lease rates and market/economic conditions. Capitalization and discount rates utilized to derive the fair values ranged from
The Company allocated the purchase price of the acquired properties to tangible and identifiable intangible assets or liabilities based on their respective fair values. The fair value of any tangible real estate assets acquired is determined by valuing the building as if it were vacant, and the fair value is then allocated to land, buildings and improvements. The Company values above and below-market lease intangibles based on estimates of market rent compared to contractual rents over expected lease terms using an appropriate discount rate. In-place leases are valued based on the costs to obtain new leases and an estimate of lost revenues and expenses over an anticipated lease up term. The Company determined that this valuation methodology is classified within Level 2 and Level 3 of the fair value hierarchy.
The Company determined the fair value of unsecured debt assumed using current market-based pricing and interest rate yields for similar debt instruments. The Company determined the fair value of secured debt assumed by calculating the net present value of the scheduled debt service payments using current market-based terms for interest rates for debt with similar terms that the Company believes it could obtain on similar structures and maturities. For the fair value of secured debt assumed, weighted average credit spreads utilized were
The following table summarizes the final purchase price allocation, including the acquisition date fair value of the tangible and intangible assets acquired and liabilities assumed (in thousands):
|
Purchase Price Allocation |
||||
|
Land |
$ |
|
||
|
Building and improvements |
|
|||
|
In-place leases |
|
|||
|
Above-market leases |
|
|||
|
Real estate assets |
|
|||
|
Investments in and advances to real estate joint ventures |
|
|||
|
Cash, accounts receivable and other assets |
|
|||
|
Total assets acquired |
|
|||
|
Notes payable |
(
|
) | ||
|
Mortgages payable |
(
|
) | ||
|
Accounts payable and other liabilities |
(
|
) | ||
|
Below-market leases |
(
|
) | ||
|
Noncontrolling interests |
(
|
) | ||
|
Total liabilities assumed |
(
|
) | ||
|
Total purchase price |
$ |
|
||
The following table details the weighted average amortization periods, in years, of the purchase price allocated to real estate and related intangible assets and liabilities acquired arising from the Merger:
|
Weighted Average
(in Years) |
||||
|
Land |
n/a | |||
|
Building |
|
|||
|
Building improvements |
|
|||
|
Tenant improvements |
|
|||
|
Fixtures and leasehold improvements |
|
|||
|
In-place leases |
|
|||
|
Above-market leases |
|
|||
|
Below-market leases |
|
|||
|
Right-of-use intangible assets |
|
|||
|
Fair market value of debt adjustment |
|
|||
Revenues from rental properties, net and Net income available to the Company’s common shareholders in the Company’s Consolidated Statements of Income includes revenues of $
Pro forma Information (Unaudited)
The pro forma financial information set forth below is based upon the Company’s historical Consolidated Statements of Income for the years ended December 31, 2021 and 2020, adjusted to give effect as if the Merger occurred as of January 1, 2020. The pro forma financial information is presented for informational purposes only and may not be indicative of what actual results of income would have been, nor does it purport to represent the results of income for future periods. (Amounts presented in millions).
|
Year Ended December 31, |
||||||||
|
2021 |
2020 |
|||||||
|
Revenues from rental properties, net |
$ |
|
$ |
|
||||
|
Net income (1) |
$ |
|
$ | |||||
|
Net income available to the Company’s common shareholders (1) |
$ |
|
$ | |||||
|
( 1 ) |
The pro forma earnings for the year ended
December 31, 2021
were adjusted to exclude $
|
3. Real Estate:
The Company’s components of Real estate, net consist of the following (in thousands):
|
December 31, |
||||||||
|
2022 |
2021 |
|||||||
|
Land: |
||||||||
|
Developed land |
$ |
|
$ |
|
||||
|
Undeveloped land |
|
|
||||||
|
Land held for development |
|
|
||||||
|
Total land |
|
|
||||||
|
Buildings and improvements: |
||||||||
|
Buildings |
|
|
||||||
|
Building improvements |
|
|
||||||
|
Tenant improvements |
|
|
||||||
|
Fixtures and leasehold improvements |
|
|
||||||
|
Above-market leases |
|
|
||||||
|
In-place leases |
|
|
||||||
|
Total buildings and improvements |
|
|
||||||
|
Real estate |
|
|
||||||
|
Accumulated depreciation and amortization (1) |
(
|
) |
(
|
) | ||||
|
Total real estate, net |
$ |
|
$ |
|
||||
|
( 1 ) |
At
December 31, 2022
and
2021,
the Company had accumulated amortization relating to in-place leases and above-market leases aggregating $
|
In addition, at
December 31, 2022
and
2021,
the Company had intangible liabilities relating to below-market leases from property acquisitions of $
The Company’s amortization associated with above-market and below-market leases for the years ended
December 31, 2022,
2021
and
2020
resulted in net increases to revenue of $
The estimated net amortization income/(expense) associated with the Company’s above-market and below-market leases and in-place leases for the next five years are as follows (in millions):
|
2023 |
2024 |
2025 |
2026 |
2027 |
||||||||||||||||
|
Above-market and below-market leases amortization, net |
$ |
|
$ |
|
$ |
|
$ |
|
$ |
|
||||||||||
|
In-place leases amortization |
$ |
(
|
) | $ |
(
|
) | $ |
(
|
) | $ |
(
|
) | $ |
(
|
) | |||||
4. Property Acquisitions:
Acquisition/Consolidation of Operating Properties
During the year ended December 31, 2022, the Company acquired the following operating properties, through direct asset purchases (in thousands):
|
Purchase Price |
||||||||||||||||||||||||||||
|
Property Name |
Location |
Month Acquired |
Cash |
Debt |
Other |
Total |
GLA* |
|||||||||||||||||||||
|
Rancho San Marcos Parcel |
San Marcos, CA |
Jan-22 |
$ |
|
$ |
|
$ |
|
$ |
|
|
|||||||||||||||||
|
Columbia Crossing Parcel |
Columbia, MD |
Feb-22 |
|
|
|
|
|
|||||||||||||||||||||
|
Oak Forest Parcel |
Houston, TX |
Jun-22 |
|
|
|
|
|
|||||||||||||||||||||
|
Devon Village (1) |
Devon, PA |
Jun-22 |
|
|
|
|
|
|||||||||||||||||||||
|
Fishtown Crossing |
Philadelphia, PA |
Jul-22 |
|
|
|
|
|
|||||||||||||||||||||
|
Carman’s Plaza |
Massapequa, NY |
Jul-22 |
|
|
|
|
|
|||||||||||||||||||||
|
Pike Center (1) |
Rockville, MD |
Jul-22 |
|
|
|
|
|
|||||||||||||||||||||
|
Baybrook Gateway (1) |
Webster, TX |
Oct-22 |
|
|
|
|
|
|||||||||||||||||||||
|
Portfolio (8 Properties) (2) |
Long Island, NY |
Nov-22 |
|
|
|
|
|
|||||||||||||||||||||
|
Gordon Plaza (1) |
Woodbridge, VA |
Nov-22 |
|
|
|
|
|
|||||||||||||||||||||
|
The Gardens at Great Neck (1) |
Great Neck, NY |
Dec-22 |
|
|
|
|
|
|||||||||||||||||||||
| $ |
|
$ |
|
$ |
|
$ |
|
|
||||||||||||||||||||
* Gross leasable area ("GLA")
|
( 1 ) |
Land parcel |
|
( 2 ) |
Other consists of redeemable noncontrolling interest of $
|
During the year ended December 31, 2021, in addition to the properties acquired in the Merger (see Footnote 2 of the Notes to Consolidated Financial Statements), the Company acquired the following operating properties, through direct asset purchases or consolidation due to change in control resulting from the purchase of additional interests or obtaining control through the modification of a joint venture investment (in thousands):
|
Purchase Price |
||||||||||||||||||||||||||||
|
Property Name |
Location |
Month Acquired/ Consolidated |
Cash |
Debt |
Other |
Total |
GLA |
|||||||||||||||||||||
|
Distribution Center #1 (1) |
Lancaster, CA |
Jan-21 |
$ |
|
$ |
|
$ |
|
$ |
|
|
|||||||||||||||||
|
Distribution Center #2 (1) |
Woodland, CA |
Jan-21 |
|
|
|
|
|
|||||||||||||||||||||
|
Jamestown Portfolio (6 properties) (2) |
Various |
Oct-21 |
|
|
|
|
|
|||||||||||||||||||||
|
KimPru Portfolio (2 properties) (2) |
Various |
Oct-21 |
|
|
|
|
|
|||||||||||||||||||||
|
Columbia Crossing Parcel |
Columbia, MD |
Oct-21 |
|
|
|
|
|
|||||||||||||||||||||
|
Centro Arlington (2) |
Arlington, VA |
Nov-21 |
|
|
|
|
|
|||||||||||||||||||||
| $ |
|
$ |
|
$ |
|
$ |
|
|
||||||||||||||||||||
|
( 1 ) |
Other consists of the fair value of the assets acquired which exceeded the purchase price upon closing. The transaction was a sale-leaseback with the seller which resulted in the recognition of a prepayment of rent of $
|
|
( 2 ) |
Other includes the Company’s previously held equity investments and net gains on change in control. The Company evaluated these transactions pursuant to the FASB’s Consolidation guidance and as a result, recognized net gains on change in control of interests of $
|
Included in the Company’s Consolidated Statements of Income are $
Purchase Price Allocations
The purchase price for these acquisitions is allocated to real estate and related intangible assets acquired and liabilities assumed, as applicable, in accordance with our accounting policies for asset acquisitions. The purchase price allocations for properties acquired/consolidated during the years ended December 31, 2022 and 2021, are as follows (in thousands):
|
Allocation as of December 31, 2022 |
Weighted- Average Useful Life (in Years) |
Allocation as of December 31, 2021 |
Weighted- Average Useful Life (in Years) |
|||||||||||||
|
Land |
$ |
|
n/a | $ |
|
n/a | ||||||||||
|
Buildings |
|
|
|
|
||||||||||||
|
Building improvements |
|
|
|
|
||||||||||||
|
Tenant improvements |
|
|
|
|
||||||||||||
|
Solar panels |
|
|
|
n/a | ||||||||||||
|
In-place leases |
|
|
|
|
||||||||||||
|
Above-market leases |
|
|
|
|
||||||||||||
|
Below-market leases |
(
|
) |
|
(
|
) |
|
||||||||||
|
Mortgage fair value adjustment |
|
|
|
n/a | ||||||||||||
|
Other assets |
|
n/a |
|
n/a | ||||||||||||
|
Other liabilities |
n/a |
(
|
) | n/a | ||||||||||||
|
Net assets acquired/consolidated |
$ |
|
$ |
|
||||||||||||
5. Dispositions of Real Estate :
The table below summarizes the Company’s disposition activity relating to operating properties and parcels, in separate transactions (dollars in millions):
|
Year Ended December 31, |
||||||||||||
|
2022 |
2021 |
2020 |
||||||||||
|
Aggregate sales price/gross fair value (1) |
$ |
|
$ |
|
$ |
|
||||||
|
Gain on sale of properties (1) (2) |
$ |
|
$ |
|
$ |
|
||||||
|
Number of operating properties sold/deconsolidated (1) |
|
|
|
|||||||||
|
Number of parcels sold |
|
|
|
|||||||||
|
( 1 ) |
During
2021,
the Company purchased its partner’s
|
|
( 2 ) |
For the years ended
December 31, 2022
and
2021
amounts are before noncontrolling interests of $
|
6. Impairments :
Management assesses on a continuous basis whether there are any indicators, including property operating performance, changes in anticipated holding period, general market conditions and delays of or change in plans for development, that the value of the Company’s assets (including any related amortizable intangible assets or liabilities) may be impaired. To the extent impairment has occurred, the carrying value of the asset would be adjusted to an amount to reflect the estimated fair value of the asset.
The Company has a capital recycling program which provides for the disposition of certain properties, typically of lesser quality assets in less desirable locations. The Company adjusted the anticipated hold period for these properties and as a result the Company recognized impairment charges on certain operating properties (see Footnote 18 of the Notes to Consolidated Financial Statements for fair value disclosure).
The Company’s efforts to market certain assets and management’s assessment as to the likelihood and timing of such potential transactions and/or the property hold period resulted in the Company recognizing impairment charges for the years ended December 31, 2022, 2021 and 2020 as follows (in millions):
|
2022 |
2021 |
2020 |
||||||||||
|
Properties marketed for sale (1) |
$ |
|
$ |
|
$ |
|
||||||
|
Properties disposed/deeded in lieu/foreclosed |
|
|
|
|||||||||
|
Other impairments |
|
|
|
|||||||||
|
Total impairment charges |
$ |
|
$ |
|
$ |
|
||||||
|
( 1 ) |
Amounts relate to adjustments to property carrying values for properties which the Company has marketed for sale and as such has adjusted the anticipated hold periods for such properties. During
2022,
the Company recognized impairment charges of $
|
The Company also recognized its share of impairment charges related to certain properties within various unconsolidated joint ventures in which the Company holds noncontrolling interests. The Company’s share of these impairment charges were $
7. Investment in and Advances to Real Estate Joint Ventures :
The Company has investments in and advances to various real estate joint ventures. These joint ventures are engaged primarily in the operation of shopping centers which are either owned or held under long-term operating leases. The Company and the joint venture partners have joint approval rights for major decisions, including those regarding property operations. As such, the Company holds noncontrolling interests in these joint ventures and accounts for them under the equity method of accounting. The Company manages certain of these joint venture investments and, where applicable, earns acquisition fees, leasing commissions, property management fees, asset management fees and construction management fees. The table below presents unconsolidated joint venture investments for which the Company held an ownership interest at December 31, 2022 and 2021 (in millions, except number of properties):
|
Noncontrolling |
The Company's Investment |
|||||||||||
|
Ownership Interest |
As of December 31, |
|||||||||||
|
Joint Venture |
As of December 31, 2022 |
2022 |
2021 |
|||||||||
|
Prudential Investment Program |
|
$ |
|
$ |
|
|||||||
|
Kimco Income Opportunity Portfolio (“KIR”) (1) |
|
|
|
|||||||||
|
Canada Pension Plan Investment Board (“CPP”) |
|
|
|
|||||||||
|
Other Institutional Joint Ventures (2) |
|
Various |
|
|
||||||||
|
Other Joint Venture Programs |
|
Various |
|
|
||||||||
|
Total* |
$ |
|
$ |
|
||||||||
* Representing
|
( 1 ) |
During
2022,
the Company purchased additional ownership interests for $
|
|
( 2 ) |
During
2021,
the Company entered into a new joint venture with BREIT in which it contributed
|
The table below presents the Company’s share of net income for these investments which is included in Equity in income of joint ventures, net on the Company’s Consolidated Statements of Income (in millions):
|
Year Ended December 31, |
||||||||||||
|
2022 |
2021 |
2020 |
||||||||||
|
Prudential Investment Program (1) |
$ |
|
$ |
|
$ |
|
||||||
|
KIR |
|
|
|
|||||||||
|
CPP |
|
|
|
|||||||||
|
Other Institutional Joint Ventures |
|
|
|
|||||||||
|
Other Joint Venture Programs |
|
|
|
|||||||||
|
Total |
$ |
|
$ |
|
$ |
|
||||||
|
( 1 ) |
During
2022,
the Prudential Investment Program recognized an impairment charge on a property of $
|
During
2022,
certain of the Company’s real estate joint ventures disposed of
nine
properties and
parcels, in separate transactions, for an aggregate sales price of $
During
2021,
certain of the Company’s real estate joint ventures disposed of
In connection with the Merger, the Company acquired ownership in
In addition, during
2021,
the Company acquired a controlling interest in
The table below presents debt balances within the Company’s unconsolidated joint venture investments for which the Company held noncontrolling ownership interests at December 31, 2022 and 2021 (dollars in millions):
|
December 31, 2022 |
December 31, 2021 |
|||||||||||||||||||||||
|
Joint Venture |
Mortgages and Notes Payable, Net |
Weighted Average Interest Rate |
Weighted Average Remaining Term (months)* |
Mortgages and Notes Payable, Net |
Weighted Average Interest Rate |
Weighted Average Remaining Term (months)* |
||||||||||||||||||
|
Prudential Investment Program |
$ |
|
|
% |
|
$ |
|
|
% |
|
||||||||||||||
|
KIR |
|
|
% |
|
|
|
% |
|
||||||||||||||||
|
CPP |
|
|
% |
|
|
|
% |
|
||||||||||||||||
|
Other Institutional Joint Ventures |
|
|
% |
|
|
|
% |
|
||||||||||||||||
|
Other Joint Venture Programs |
|
|
% |
|
|
|
% |
|
||||||||||||||||
|
Total |
$ |
|
$ |
|
||||||||||||||||||||
* Average remaining term includes extensions
As of the date of the Merger, the Company acquired ownership in
unconsolidated joint ventures, which had an aggregate of $
Unconsolidated Significant Subsidiaries
In accordance with Rules 3 - 09 and 4 - 08 (g) of Regulation S- X, the Company must determine which of its unconsolidated investments, if any, are considered “significant subsidiaries.” In evaluating these investments, there are three tests utilized to determine if any unconsolidated subsidiaries are considered significant subsidiaries: the investment test, the asset test and the income test. Rule 3 - 09 of Regulation S- X requires the Company to include separate audited financial statements of any unconsolidated majority-owned subsidiary (unconsolidated subsidiaries in which the Company owns greater than 50% of the voting securities) in an annual report if any of the three tests exceed 20%. Rule 4 - 08 (g) of Regulation S- X requires summarized financial information of unconsolidated subsidiaries in an annual report if any of the three tests exceeds 10%, and summarized financial information in a quarterly report if any of the three tests exceeds 20% pursuant to Rule 10 - 01 (b)( 1 ) of Regulation S- X.
As of
December
31,
2022,
the Company held an unconsolidated investment in KIR which the Company determined was significant under the income test and requires summarized financial information under Rule
4
-
08
(g) of Regulation S-
X.
The Company holds a
|
December 31, |
||||||||
|
2022 |
2021 |
|||||||
|
Assets: |
||||||||
|
Real estate, net |
$ |
|
$ |
|
||||
|
Other assets, net |
|
|
||||||
|
Total Assets |
$ |
|
$ |
|
||||
|
Liabilities and Members’ Capital: |
||||||||
|
Notes payable, net |
$ |
|
$ |
|
||||
|
Mortgages payable, net |
|
|
||||||
|
Other liabilities |
|
|
||||||
|
Members’ capital |
|
|
||||||
|
Total Liabilities and Members’ Capital |
$ |
|
$ |
|
||||
|
Year Ended December 31, |
||||||||||||
|
2022 |
2021 |
2020 |
||||||||||
|
Revenues, net |
$ |
|
$ |
|
$ |
|
||||||
|
Operating expenses |
(
|
) |
(
|
) |
(
|
) | ||||||
|
Depreciation and amortization |
(
|
) |
(
|
) |
(
|
) | ||||||
|
Gain on sale of properties |
|
|
|
|||||||||
|
Interest expense |
(
|
) |
(
|
) |
(
|
) | ||||||
|
Other expense, net |
(
|
) |
(
|
) |
(
|
) | ||||||
|
Net income |
$ |
|
$ |
|
$ |
|
||||||
Summarized financial information for the Company’s investment in and advances to all other real estate joint ventures is as follows (in millions):
|
December 31, |
||||||||
|
2022 |
2021 |
|||||||
|
Assets: |
||||||||
|
Real estate, net |
$ |
|
$ |
|
||||
|
Other assets, net |
|
|
||||||
|
Total Assets |
$ |
|
$ |
|
||||
|
Liabilities and Members’ Capital: |
||||||||
|
Notes payable, net |
$ |
|
$ |
|
||||
|
Mortgages payable, net |
|
|
||||||
|
Other liabilities |
|
|
||||||
|
Noncontrolling interests |
|
|
||||||
|
Members’ capital |
|
|
||||||
|
Total Liabilities and Members’ Capital |
$ |
|
$ |
|
||||
|
Year Ended December 31, |
||||||||||||
|
2022 |
2021 |
2020 |
||||||||||
|
Revenues, net |
$ |
|
$ |
|
$ |
|
||||||
|
Operating expenses |
(
|
) |
(
|
) |
(
|
) | ||||||
|
Impairment charges |
(
|
) |
(
|
) |
(
|
) | ||||||
|
Depreciation and amortization |
(
|
) |
(
|
) |
(
|
) | ||||||
|
Gain on sale of properties |
|
|
|
|||||||||
|
Interest expense |
(
|
) |
(
|
) |
(
|
) | ||||||
|
Other expense, net |
(
|
) |
(
|
) |
(
|
) | ||||||
|
Net income |
$ |
|
$ |
|
$ |
|
||||||
Other liabilities included in the Company’s accompanying Consolidated Balance Sheets include investments in certain real estate joint ventures totaling $
The Company’s maximum exposure to losses associated with its unconsolidated joint ventures is primarily limited to its carrying value in these investments. Generally, such investments contain operating properties and the Company has determined these entities do
not
contain the characteristics of a VIE. As of
December 31, 2022
and
2021,
the Company’s carrying value in these investments was $
8. Other Investments:
The Company has provided capital to owners and developers of real estate properties and loans through its Preferred Equity program. The Company’s maximum exposure to losses associated with its preferred equity investments is primarily limited to its net investment. As of
December 31, 2022,
the Company’s net investment under the Preferred Equity program was $
During
2021,
the Company invested $
As of
December 31, 2022,
these preferred equity investment properties had non-recourse mortgage loans aggregating $
9. Marketable Securities :
The amortized cost and unrealized gains, net of marketable securities as of December 31, 2022 and 2021, are as follows (in thousands):
|
As of December 31, 2022 |
As of December 31, 2021 |
|||||||
|
Marketable securities: |
||||||||
|
Amortized cost |
$ |
|
$ |
|
||||
|
Unrealized gains, net |
|
|
||||||
|
Total fair value |
$ |
|
$ |
|
||||
The Company’s net gains/(losses) on marketable securities and dividend income for the years ended December 31, 2022, 2021 and 2020, is as follows (in thousands):
|
Year Ended December 31, |
||||||||||||
|
2022 |
2021 |
2020 |
||||||||||
|
(Loss)/gain on marketable securities, net |
$ |
(
|
) | $ |
|
$ |
|
|||||
|
Dividend income (included in Other income, net) |
|
|
|
|||||||||
Albertsons Companies, Inc. ( “ ACI ” ) –
In
October 2022,
the Company sold
On
October 13, 2022,
The Kroger Co. (“Kroger”) and ACI entered into a definitive merger agreement (“ACI Merger”), with Kroger continuing as the surviving public company. The ACI Merger is subject to numerous regulatory approvals and customary closing conditions. Separate from the ACI Merger, on
October 13, 2022,
ACI declared a special cash dividend of $
On November 3, 2022, the Superior Court of King County in the State of Washington issued an order temporarily restraining the payment of the special dividend in the case State of Washington v. Albertsons Companies, Inc. et al. , until a hearing on a motion for a preliminary injunction could be held. On December 9, 2022, the Superior Court denied the motion for a preliminary injunction but extended the temporary restraining order for the Attorney General for the State of Washington to appeal to the Supreme Court of the State of Washington. Due to the contingency resulting from this unresolved litigation at December 31, 2022, the Company did not recognize its share of the special dividend for the year ended December 31, 2022.
On
January 17, 2023,
the Supreme Court of the State of Washington denied a motion by the Attorney General of the State of Washington to hear an appeal from the Superior Court’s denial to enjoin the Company from paying the Special Dividend. As a result of the decision by the Supreme Court of the State of Washington, the temporary restraining order preventing payment of the special dividend had also been lifted. On
January 20, 2023,
ACI distributed the special dividend to holders of record as of
October 24, 2022.
The Company received its share of the special dividend payment of $
10. Accounts and Notes Receivable
The components of Accounts and notes receivable, net of potentially uncollectible amounts as of December 31, 2022 and 2021, are as follows (in thousands):
|
As of December 31, 2022 |
As of December 31, 2021 |
|||||||
|
Billed tenant receivables |
$ |
|
$ |
|
||||
|
Unbilled common area maintenance, insurance and tax reimbursements |
|
|
||||||
|
Deferred rent receivables |
|
|
||||||
| Defined benefit plan receivable |
|
|
||||||
|
Other receivables |
|
|
||||||
|
Straight-line rent receivables |
|
|
||||||
|
Total accounts and notes receivable, net |
$ |
|
$ |
|
||||
11. Leases
Lessor Leases
The Company’s primary source of revenues is derived from lease agreements, which includes rental income and expense reimbursement. The Company’s lease income is comprised of minimum base rent, expense reimbursements, percentage rent, lease termination fee income, ancillary income, amortization of above-market and below-market rent adjustments and straight-line rent adjustments.
The disaggregation of the Company’s lease income, which is included in Revenue from rental properties, net on the Company’s Consolidated Statements of Income, as either fixed or variable lease income based on the criteria specified in ASC 842, for the years ended December 31, 2022, 2021 and 2020, is as follows (in thousands):
|
Year Ended December 31, |
||||||||||||
|
2022 |
2021 |
2020 |
||||||||||
|
Lease income: |
||||||||||||
|
Fixed lease income (1) |
$ |
|
$ |
|
$ |
|
||||||
|
Variable lease income (2) |
|
|
|
|||||||||
|
Above-market and below-market leases amortization, net |
|
|
|
|||||||||
|
Adjustments for potentially uncollectible revenues and disputed amounts (3) |
|
|
(
|
) | ||||||||
|
Total lease income |
$ |
|
$ |
|
$ |
|
||||||
|
( 1 ) |
Includes minimum base rents, expense reimbursements, ancillary income and straight-line rent adjustments. |
|
( 2 ) |
Includes minimum base rents, expense reimbursements, percentage rent, lease termination fee income and ancillary income. |
|
( 3 ) |
The amounts represent adjustments associated with potentially uncollectible revenues and disputed amounts. |
Base rental revenues and fixed-rate expense reimbursements from rental properties are recognized on a straight-line basis over the terms of the related leases. The difference between the amount of rental income contracted through leases and rental income recognized on a straight-line basis for the years ended
December 31, 2022,
2021
and
2020
was $
The Company is primarily engaged in the operation of shopping centers that are either owned or held under long-term leases that expire at various dates through
2121.
The Company, in turn, leases premises in these centers to tenants pursuant to lease agreements which provide for terms ranging generally from
to
The minimum revenues expected to be received by the Company from rental properties under the terms of all non-cancelable tenant leases for future years, assuming no new or renegotiated leases are executed for such premises, are as follows (in millions):
|
2023 |
2024 |
2025 |
2026 |
2027 |
Thereafter |
|||||||||||||||||||
|
Minimum revenues |
$ |
|
$ |
|
$ |
|
$ |
|
$ |
|
$ |
|
||||||||||||
Lessee Leases
The Company currently leases real estate space under non-cancelable operating lease agreements for ground leases and administrative office leases. The Company’s operating leases have remaining lease terms ranging from
to
In connection with the Merger, the Company obtained $
The weighted-average remaining non-cancelable lease term and weighted-average discount rates for the Company’s operating and finance leases as of December 31, 2022 were as follows:
|
Operating Leases |
Finance Leases |
|||||||
|
Weighted-average remaining lease term (in years) |
|
|
||||||
|
Weighted-average discount rate |
|
% |
|
% | ||||
The components of the Company’s lease expense, which are included in interest expense, rent expense and general and administrative expense on the Company’s Consolidated Statements of Income for the years ended December 31, 2022, 2021 and 2020, were as follows (in thousands):
|
Year Ended December 31, |
||||||||||||
|
2022 |
2021 |
2020 |
||||||||||
|
Lease cost: |
||||||||||||
|
Finance lease cost |
$ |
|
$ |
|
$ |
|
||||||
|
Operating lease cost |
|
|
|
|||||||||
|
Variable lease cost |
|
|
|
|||||||||
|
Total lease cost |
$ |
|
$ |
|
$ |
|
||||||
The table below reconciles the undiscounted cash flows for each of the first five years and total of the remaining years to the operating and financing lease liabilities (in thousands):
|
Year Ending December 31, |
||||||||
|
Operating Leases |
Financing Leases (1) |
|||||||
|
2023 |
$ |
|
$ |
|
||||
|
2024 |
|
|
||||||
|
2025 |
|
|
||||||
|
2026 |
|
|
||||||
|
2027 |
|
|
||||||
|
Thereafter |
|
|
||||||
|
Total minimum lease payments |
$ |
|
$ |
|
||||
|
Less imputed interest |
(
|
) |
(
|
) | ||||
|
Total lease liabilities (2) |
$ |
|
$ |
|
||||
|
( 1 ) |
Includes bargain purchase options exercisable in 2023 related to two properties. |
|
( 2 ) |
Operating lease liabilities are included in Operating lease liabilities and financing lease liabilities are included in Other liabilities on the Company’s Consolidated Balance Sheets. |
12. Other Assets :
Assets Held-For-Sale
At
December 31, 2022,
the Company had
Mortgages and Other Financing Receivables
The Company has various mortgages and other financing receivables which consist of loans acquired and loans originated by the Company. For a complete listing of the Company’s mortgages and other financing receivables at December 31, 2022, see Financial Statement Schedule IV included in this annual report on Form 10 -K.
The following table reconciles mortgage loans and other financing receivables from January 1, 2020 to December 31, 2022 ( in thousands):
|
2022 |
2021 |
2020 |
||||||||||
|
Balance at January 1, |
$ |
|
$ |
|
$ |
|
||||||
|
Additions: |
||||||||||||
|
New mortgage and other loans (1) |
|
|
|
|||||||||
|
Deductions: |
||||||||||||
|
Loan repayments (2) |
(
|
) |
(
|
) |
(
|
) | ||||||
|
Collections of principal |
(
|
) |
(
|
) |
(
|
) | ||||||
|
Allowance for credit losses |
(
|
) |
(
|
) |
(
|
) | ||||||
|
Other adjustments |
|
(
|
) |
|
||||||||
|
Balance at December 31, |
$ |
|
$ |
|
$ |
|
||||||
|
( 1 ) |
During
2021,
the Company acquired $
|
|
( 2 ) |
During
2022,
the Company recognized $
|
The Company reviews payment status to identify performing versus non-performing loans. As of
December 31, 2022,
the Company had a total of
Software Development Costs
As of
December 31, 2022
and
2021,
the Company had unamortized software development costs of $
13. Notes Payable :
As of December 31, 2022 and 2021 the Company’s Notes payable, net consisted of the following (dollars in millions):
|
Carrying Amount at December 31, |
Interest Rate at December 31, |
Maturity Date at |
||||||||||||||||||||||
|
2022 |
2021 |
2022 |
2021 |
December 31, 2022 | ||||||||||||||||||||
|
Senior unsecured notes |
$ |
|
$ |
|
|
- |
|
|
- |
|
|
Jan-2024 – Oct-2049 | ||||||||||||
|
Credit facility (1) |
|
|
n/a | n/a |
|
Mar-2024 | ||||||||||||||||||
|
Fair value debt adjustments, net |
|
|
n/a | n/a | n/a | |||||||||||||||||||
|
Deferred financing costs, net (2) |
(
|
) |
(
|
) | n/a | n/a | n/a | |||||||||||||||||
| $ |
|
$ |
|
|||||||||||||||||||||
* Weighted-average interest rate
|
( 1 ) |
Accrues interest at a rate of Adjusted Term Secured Overnight Financing Rate (“Adjusted Term SOFR”), as defined, plus
|
|
( 2 ) |
As of
December 31, 2022
and
2021,
the Company had $
|
During the years ended December 31, 2022 and 2021, the Company issued the following senior unsecured notes (dollars in millions):
|
Date Issued |
Amount Issued |
Interest Rate |
Maturity Date |
|||||||||
|
Aug-22 |
$ |
|
|
Feb-33 |
||||||||
|
Feb-22 |
$ |
|
|
Apr-32 |
||||||||
|
Sept-21 |
$ |
|
|
Dec-31 |
||||||||
During the year ended December 31, 2022, the Company repaid the following senior unsecured notes (dollars in millions):
|
Date Paid |
Amount Repaid |
Interest Rate |
Maturity Date |
|||||||||
|
Sep-22 (1) |
$ |
|
|
Apr-23 |
||||||||
|
Sep-22 (1) (2) |
$ |
|
|
Jun-23 |
||||||||
|
Sep-22 (1) (2) |
$ |
|
|
Oct-22 |
||||||||
|
Mar-22 (3) |
$ |
|
|
Nov-22 |
||||||||
|
( 1 ) |
There was
|
|
( 2 ) |
Includes partial repayments during May and June 2022. |
|
( 3 ) |
The Company incurred a prepayment charge of $
|
In connection with the Merger, the Company assumed senior unsecured notes aggregating $
The scheduled maturities of all notes payable, excluding unamortized fair value debt adjustments of $
|
2023 |
2024 |
2025 |
2026 |
2027 |
Thereafter |
Total |
||||||||||||||||||||||
|
Principal payments |
$ |
|
$ |
|
$ |
|
$ |
|
$ |
|
$ |
|
$ |
|
||||||||||||||
The Company’s supplemental indentures governing its Senior Unsecured Notes contain covenants whereby the Company is subject to maintaining (a) certain maximum leverage ratios on both unsecured senior corporate and secured debt, minimum debt service coverage ratios and minimum equity levels, (b) certain debt service ratios and (c) certain asset to debt ratios. In addition, the Company is restricted from paying dividends in amounts that exceed by more than $
Interest on the Company’s fixed-rate Senior Unsecured Notes is payable semi-annually in arrears. Proceeds from these issuances were primarily used for the acquisition of shopping centers, the expansion and improvement of properties in the Company’s portfolio and the repayment of certain debt obligations of the Company.
Credit Facility
The Company had a $
In
February 2023,
the Company closed on a new $
14. Mortgages Payable :
Mortgages, collateralized by certain shopping center properties (see Financial Statement Schedule III included in this annual report on Form 10 -K), are generally due in monthly installments of principal and/or interest.
As of December 31, 2022 and 2021, the Company’s Mortgages payable, net consisted of the following (dollars in millions):
|
Carrying Amount at December 31, |
Interest Rate at December 31, |
Maturity Date at |
||||||||||||||||||||||
|
2022 |
2021 |
2022 |
2021 |
December 31, 2022 | ||||||||||||||||||||
|
Mortgages payable |
$ |
|
$ |
|
|
- |
|
|
- |
|
|
May-2023 – Jun-2031 | ||||||||||||
|
Fair value debt adjustments, net |
(
|
) |
|
n/a | n/a | n/a | ||||||||||||||||||
|
Deferred financing costs, net |
(
|
) |
(
|
) | n/a | n/a | n/a | |||||||||||||||||
| $ |
|
$ |
|
|||||||||||||||||||||
* Weighted-average interest rate
During
2022,
the Company (i) assumed $
During
2021,
the Company (i) assumed $
In addition, in connection with the Merger, the Company assumed mortgage debt of $
The scheduled principal payments (excluding any extension options available to the Company) of all mortgages payable, excluding unamortized fair value debt adjustments of $
|
2023 |
2024 |
2025 |
2026 |
2027 |
Thereafter |
Total |
||||||||||||||||||||||
|
Principal payments |
$ |
|
$ |
|
$ |
|
$ |
|
$ |
|
$ |
|
$ |
|
||||||||||||||
15. Other Liabilities
Embedded Derivative Liability
The Company evaluates its financial instruments, including equity-linked financial instruments, to determine if such instruments are derivatives or contain features that qualify as embedded derivatives in accordance with FASB ASC Topic 815, “Derivatives and Hedging” (“ASC 815” ). For derivative financial instruments that are classified as liabilities, the derivative instrument is initially recognized at fair value with subsequent changes in fair value recognized in each reporting period as a component of “Other income/(loss), net” on our accompanying Consolidated Statements of Income. The classification of freestanding derivative instruments, including whether such instruments should be classified as liabilities or as equity, is evaluated at the end of each reporting period.
During the year ended
December 31, 2022,
the Company entered into an agreement to purchase a portfolio of
properties for a sales price of $
The transaction includes a call option for the Company to purchase the Outside Partner’s Unit interests
This arrangement included an embedded derivative which required separate accounting. The initial value of the embedded derivative was a liability of $
16. Noncontrolling Interests and Redeemable Noncontrolling Interests :
Noncontrolling interests represent the portion of equity that the Company does not own in those entities it consolidates as a result of having a controlling interest or having determined that the Company was the primary beneficiary of a VIE in accordance with the provisions of the FASB’s Consolidation guidance. The Company accounts and reports for noncontrolling interests in accordance with the Consolidation guidance and the Distinguishing Liabilities from Equity guidance issued by the FASB. The Company identifies its noncontrolling interests separately within the equity section on the Company’s Consolidated Balance Sheets. The amounts of consolidated net income attributable to the Company and to the noncontrolling interests are presented separately on the Company’s Consolidated Statements of Income.
Noncontrolling interests
The Company owns
shopping center properties located throughout Puerto Rico. These properties were acquired in
2006
partially through the issuance of $
|
Type |
Par Value Per Unit |
Number of Units Remaining |
Return Per Annum |
|||||||||
|
Class B-1 Preferred Units (1) |
$ |
|
|
|
||||||||
|
Class B-2 Preferred Units (2) |
$ |
|
|
|
||||||||
|
Class C DownREIT Units (1) |
$ |
|
|
Equal to the Company’s common stock dividend |
||||||||
|
( 1 ) |
These units are redeemable for cash by the holder or at the Company’s option, shares of the Company’s common stock, based upon the conversion calculation as defined in the agreement. These units are included in Noncontrolling interests on the Company’s Consolidated Balance Sheets. |
|
( 2 ) |
These units are redeemable for cash by the holder or callable by the Company and are included in Redeemable noncontrolling interests on the Company’s Consolidated Balance Sheets. |
The Company owns a shopping center located in Bay Shore, NY, which was acquired in
2006
with the issuance of
Noncontrolling interests also includes
In connection with the Merger, the Company acquired
consolidated joint ventures structured as DownREIT partnerships. As of the date of the Merger, the Raleigh Limited Partnership had
In addition, the Company acquired ownership interests in
consolidated joint ventures in connection with the Merger, which had noncontrolling interests of $
During the year ended
December 31, 2022,
a consolidated joint venture (acquired with the Merger), in which the Company had a
Redeemable noncontrolling interests
Included within noncontrolling interests are units that were determined to be contingently redeemable that are classified as Redeemable noncontrolling interests and presented in the mezzanine section between Total liabilities and Stockholder’s equity on the Company’s Consolidated Balance Sheets.
The Company owns
shopping center properties located in Long Island, NY, which were acquired partially through the issuance of $
|
Type |
Par Value Per Unit |
Number of Units Remaining |
Return Per Annum |
|
||||||||||||
|
Preferred Outside Partner Units |
$ |
|
|
|
||||||||||||
|
Common Outside Partner Units |
$ |
|
|
Equal to the Company’s common stock dividend |
||||||||||||
The following table presents the change in the redemption value of the Redeemable noncontrolling interests for the years ended December 31, 2022 and 2021 (in thousands):
|
2022 |
2021 |
|||||||
|
Balance at January 1, |
$ |
|
$ |
|
||||
|
Fair value allocation to unitholders/partnership interest (1) (2) |
|
|
||||||
|
Income |
|
|
||||||
|
Distributions (1) |
(
|
) |
(
|
) | ||||
|
Redemption/conversion of noncontrolling interests |
(
|
) |
|
|||||
|
Adjustment to estimated redemption value (3) |
|
(
|
) | |||||
|
Balance at December 31, |
$ |
|
$ |
|
||||
| ( 1 ) | Relates to Outside Partner Units issued during 2022 described above. | |
|
( 2 ) |
During
January 2021,
KIM RDC, LLC (“KIM RDC”), a wholly owned subsidiary of the Company, and KP Lancewood LLC (“KPR Member”) entered into a joint venture agreement wherein KIM RDC has a
|
|
( 3 ) |
During
2021,
the Company recorded an adjustment to the estimated redemption fair market value of a noncontrolling interest in accordance with the provisions of the respective joint venture agreement and ASC
480,
Accounting for Redeemable Equity Instruments
. The Company assesses the fair market value of this noncontrolling interest on a recurring basis and determined that its valuation was classified within Level
3
of the fair value hierarchy. The estimated fair market value of this noncontrolling interest was based upon a discounted cash flow model, for which a capitalization rate of
|
17. Variable Interest Entities ( “ VIE ” ) :
Included within the Company’s operating properties at
December 31, 2022
and
2021,
are
The majority of the operations of these VIEs are funded with cash flows generated from the properties. The Company has not provided financial support to any of these VIEs that it was not previously contractually required to provide, which consists primarily of funding any capital expenditures, including tenant improvements, which are deemed necessary to continue to operate the entity and any operating cash shortfalls that the entity may experience.
All liabilities of these consolidated VIEs are non-recourse to the Company (“VIE Liabilities”). The assets of the unencumbered VIEs are not restricted for use to settle only the obligations of these VIEs. The remaining VIE assets are encumbered by third -party non-recourse mortgage debt. The assets associated with these encumbered VIEs (“Restricted Assets”) are collateral under the respective mortgages and are therefore restricted and can only be used to settle the corresponding liabilities of the VIE. The table below summarizes the consolidated VIEs and the classification of the Restricted Assets and VIE Liabilities on the Company’s Consolidated Balance Sheets are as follows (dollars in millions):
|
December 31, 2022 |
December 31, 2021 |
|||||||
|
Number of unencumbered VIEs |
|
|
||||||
|
Number of encumbered VIEs |
|
|
||||||
|
Total number of consolidated VIEs |
|
|
||||||
|
Restricted Assets: |
||||||||
|
Real estate, net |
$ |
|
$ |
|
||||
|
Cash and cash equivalents |
|
|
||||||
|
Accounts and notes receivable, net |
|
|
||||||
|
Other assets |
|
|
||||||
|
Total Restricted Assets |
$ |
|
$ |
|
||||
|
VIE Liabilities: |
||||||||
|
Mortgages payable, net |
$ |
|
$ |
|
||||
|
Accounts payable and accrued expenses |
|
|
||||||
|
Operating lease liabilities |
|
|
||||||
|
Other liabilities |
|
|
||||||
|
Total VIE Liabilities |
$ |
|
$ |
|
||||
18. Fair Value Disclosure of Financial Instruments :
All financial instruments of the Company are reflected in the accompanying Consolidated Balance Sheets at amounts which, in management’s estimation, based upon an interpretation of available market information and valuation methodologies, reasonably approximate their fair values except those listed below, for which fair values are disclosed. The valuation method used to estimate fair value for fixed-rate and variable-rate debt is based on discounted cash flow analyses, with assumptions that include credit spreads, market yield curves, trading activity, loan amounts and debt maturities. The fair values for marketable securities are based on published values, securities dealers’ estimated market values or comparable market sales. The fair value for embedded derivative liability is based on using the "with-and-without" method. Such fair value estimates are not necessarily indicative of the amounts that would be realized upon disposition.
As a basis for considering market participant assumptions in fair value measurements, the FASB’s Fair Value Measurements and Disclosures guidance establishes a fair value hierarchy that distinguishes between market participant assumptions based on market data obtained from sources independent of the reporting entity (observable inputs that are classified within Levels 1 and 2 of the hierarchy) and the reporting entity’s own assumptions about market participant assumptions (unobservable inputs classified within Level 3 of the hierarchy).
The following are financial instruments for which the Company’s estimate of fair value differs from the carrying amounts (in thousands):
|
December 31, |
||||||||||||||||
|
2022 |
2021 |
|||||||||||||||
|
Carrying Amounts |
Estimated Fair Value |
Carrying Amounts |
Estimated Fair Value |
|||||||||||||
|
Notes payable, net (1) |
$ |
|
$ |
|
$ |
|
$ |
|
||||||||
|
Mortgages payable, net (2) |
$ |
|
$ |
|
$ |
|
$ |
|
||||||||
|
( 1 ) |
The Company determined that the valuation of its senior unsecured notes were classified within Level
2
of the fair value hierarchy. The estimated fair value amounts classified as Level
2
as of
December 31, 2022
and
2021,
were $
|
|
( 2 ) |
The Company determined that its valuation of these mortgages payable was classified within Level 3 of the fair value hierarchy. |
The Company has certain financial instruments that must be measured under the FASB’s Fair Value Measurements and Disclosures guidance, including available for sale securities and embedded derivative liabilities. The Company currently does not have non-financial assets and non-financial liabilities that are required to be measured at fair value on a recurring basis.
In instances where the determination of the fair value measurement is based on inputs from different levels of the fair value hierarchy, the level of the fair value hierarchy within which the entire fair value measurement falls is based on the lowest level input that is significant to the fair value measurement in its entirety. The Company’s assessment of the significance of a particular input to the fair value measurement in its entirety requires judgment and considers factors specific to the asset or liability.
The tables below present the Company’s financial assets and liabilities measured at fair value on a recurring basis as of December 31, 2022 and 2021, aggregated by the level of the fair value hierarchy within which those measurements fall (in thousands):
|
Balance at December 31, 2022 |
Level 1 |
Level 2 |
Level 3 |
|||||||||||||
|
Assets: |
||||||||||||||||
|
Marketable equity securities |
$ |
|
$ |
|
$ |
|
$ |
|
||||||||
|
Liabilities: |
||||||||||||||||
|
Embedded derivative liability |
$ |
|
$ |
|
$ |
|
$ |
|
||||||||
|
Balance at December 31, 2021 |
Level 1 |
Level 2 |
Level 3 |
|||||||||||||
|
Assets: |
||||||||||||||||
|
Marketable equity securities |
$ |
|
$ |
|
$ |
|
$ |
|
||||||||
The significant unobservable input (Level 3 inputs) used in measuring the Company's embedded derivative liability, which is categorized with Level 3 of the fair value hierarchy as of December 31, 2022, is the discount rate of 8.00%.
Assets measured at fair value on a non-recurring basis at December 31, 2021 are as follows (in thousands):
|
Balance at December 31, 2021 |
Level 1 |
Level 2 |
Level 3 |
|||||||||||||
|
Other investments |
$ |
|
$ |
|
$ |
|
$ |
|
||||||||
19. Preferred Stock, Common Stock and Convertible Unit Transactions :
Preferred Stock
The Company’s Board of Directors had authorized the repurchase of up to
|
Class of Preferred Stock |
Depositary Shares Repurchased |
Purchase Price (in millions) |
||||||
|
Class L |
|
$ |
|
|||||
|
Class M |
|
$ |
|
|||||
The Company’s outstanding Preferred Stock is detailed below (in thousands, except share data and par values):
|
As of December 31, 2022 |
||||||||||||||||||||||||||||
|
Class of Preferred Stock |
Shares Authorized |
Shares Issued and Outstanding |
Liquidation Preference (in thousands) |
Dividend Rate |
Annual Dividend per Depositary Share |
Par Value |
Optional Redemption Date |
|||||||||||||||||||||
|
Class L |
|
|
$ |
|
|
% | $ |
|
$ |
|
8/16/2022 |
|||||||||||||||||
|
Class M |
|
|
|
|
% | $ |
|
$ |
|
12/20/2022 |
||||||||||||||||||
|
|
$ |
|
||||||||||||||||||||||||||
|
As of December 31, 2021 |
||||||||||||||||||||||||||||
|
Class of Preferred Stock |
Shares Authorized |
Shares Issued and Outstanding |
Liquidation Preference (in thousands) |
Dividend Rate |
Annual Dividend per Depositary Share |
Par Value |
Optional Redemption Date |
|||||||||||||||||||||
|
Class L |
|
|
$ |
|
|
% | $ |
|
$ |
|
8/16/2022 |
|||||||||||||||||
|
Class M |
|
|
|
|
% | $ |
|
$ |
|
12/20/2022 |
||||||||||||||||||
|
|
$ |
|
||||||||||||||||||||||||||
The Company’s Preferred Stock Depositary Shares for all classes are not convertible or exchangeable for any other property or securities of the Company.
Voting Rights
The Class L and M Preferred Stock rank pari passu as to voting rights, priority for receiving dividends and liquidation preference as set forth below.
As to any matter on which the Class L or M Preferred Stock
may
vote, including any actions by written consent, each share of the Class L or M Preferred Stock shall be entitled to
Liquidation Rights
In the event of any liquidation, dissolution or winding up of the affairs of the Company, preferred stock holders are entitled to be paid, out of the assets of the Company legally available for distribution to its stockholders, a liquidation preference of $
Common Stock
The Company has a share repurchase program, which is scheduled to expire
February
29,
2024.
Under this program, the Company
may
repurchase shares of its common stock, par value $
During
August 2021,
the Company established an at-the-market continuous offering program (the “ATM program”) pursuant to which the Company
may
offer and sell from time-to-time shares of its common stock, par value $
In connection with the Merger, each Weingarten common share, issued and outstanding immediately prior to the effective time of the Merger, was converted into
The Company, from time to time, repurchases shares of its common stock in amounts that offset new issuances of common stock relating to the exercise of stock options or the issuance of restricted stock awards. These repurchases
may
occur in open market purchases, privately negotiated transactions or otherwise subject to prevailing market conditions, the Company’s liquidity requirements, contractual restrictions and other factors. During
2022,
2021
and
2020,
the Company repurchased
Convertible Units
The Company has various types of convertible units that were issued in connection with the purchase of operating properties (see Footnote
16
of the Notes to Consolidated Financial Statements). The amount of consideration that would be paid to unaffiliated holders of units issued from the Company’s consolidated subsidiaries which are
not
mandatorily redeemable, as if the termination of these consolidated subsidiaries occurred on
December 31, 2022,
is $
Dividends Declared
The following table provides a summary of the dividends declared per share:
| Year Ended December 31, | ||||||||||||
|
2022 |
2021 |
2020 |
||||||||||
|
Common Stock |
$ |
|
$ |
|
$ |
|
||||||
|
Class L Depositary Shares |
$ |
|
$ |
|
$ |
|
||||||
|
Class M Depositary Shares |
$ |
|
$ |
|
$ |
|
||||||
20. Supplemental Schedule of Non-Cash Investing/Financing Activities :
The following schedule summarizes the non-cash investing and financing activities of the Company for the years ended December 31, 2022, 2021 and 2020 (in thousands):
|
2022 |
2021 |
2020 |
||||||||||
|
Acquisition of real estate interests: |
||||||||||||
|
Mortgages debt |
$ |
|
$ |
|
$ |
|
||||||
|
Other liabilities |
$ |
|
$ |
|
$ |
|
||||||
|
Redeemable noncontrolling interests |
$ |
|
$ |
|
$ |
|
||||||
|
Capital expenditures accrual |
$ |
|
$ |
|
$ |
|
||||||
|
Surrender of common stock |
$ |
|
$ |
|
$ |
|
||||||
|
Declaration of dividends paid in succeeding period |
$ |
|
$ |
|
$ |
|
||||||
|
Decrease in redeemable noncontrolling interests’ carrying amount |
$ |
|
$ |
(
|
) | $ |
(
|
) | ||||
|
Lease liabilities arising from obtaining operating right-of-use assets |
$ |
|
$ |
|
$ |
|
||||||
|
Allocation of fair value to noncontrolling interests |
$ |
|
$ |
|
$ |
|
||||||
|
Purchase price fair value adjustment to prepaid rent |
$ |
|
$ |
|
$ |
|
||||||
|
Decrease in noncontrolling interests from redemption of units for common stock |
$ |
|
$ |
|
$ |
|
||||||
|
Weingarten Merger: |
||||||||||||
|
Real estate assets |
$ |
|
$ |
|
$ |
|
||||||
|
Investments in and advances to real estate joint ventures |
$ |
|
$ |
|
$ |
|
||||||
|
Notes payable |
$ |
|
$ |
(
|
) | $ |
|
|||||
|
Mortgages payable |
$ |
|
$ |
(
|
) | $ |
|
|||||
|
Below-market leases |
$ |
|
$ |
(
|
) | $ |
|
|||||
|
Noncontrolling interests |
$ |
|
$ |
(
|
) | $ |
|
|||||
|
Other assets and liabilities, net |
$ |
|
$ |
(
|
) | $ |
|
|||||
|
Lease liabilities arising from obtaining operating right-of-use assets |
$ |
|
$ |
|
$ |
|
||||||
|
Lease liabilities arising from obtaining financing right-of-use assets |
$ |
|
$ |
|
$ |
|
||||||
|
Common stock issued in exchange for Weingarten common shares |
$ |
|
$ |
(
|
) | $ |
|
|||||
|
Consolidation of Joint Ventures: |
||||||||||||
|
Increase in real estate and other assets, net |
$ |
|
$ |
|
$ |
|
||||||
|
Increase in mortgages payable, other liabilities and noncontrolling interests |
$ |
|
$ |
|
$ |
|
||||||
|
Deconsolidation of Joint Venture: |
||||||||||||
|
Decrease in real estate and other assets, net |
$ |
|
$ |
|
$ |
|
||||||
|
Decrease in mortgages payable and other liabilities |
$ |
|
$ |
|
$ |
|
||||||
The following table provides a reconciliation of cash, cash equivalents and restricted cash recorded on the Company’s Consolidated Balance Sheets to the Company’s Consolidated Statements of Cash Flows (in thousands):
|
As of December 31, 2022 |
As of December 31, 2021 |
|||||||
|
Cash and cash equivalents |
$ |
|
$ |
|
||||
|
Restricted cash |
|
|
||||||
|
Total cash, cash equivalents and restricted cash |
$ |
|
$ |
|
||||
21. Transactions with Related Parties :
Joint Ventures
The Company provides management services for shopping centers owned principally by affiliated entities and various real estate joint ventures in which certain stockholders of the Company have economic interests. Such services are performed pursuant to management agreements which provide for fees based upon a percentage of gross revenues from the properties and other direct costs incurred in connection with management of the centers. Substantially all of the Management and other fee income on the Company’s Consolidated Statements of Income constitute fees earned from affiliated entities. Reference is made to Footnote 7 of the Notes to Consolidated Financial Statements for additional information regarding transactions with related parties.
During
2022,
the Company purchased the General Partner’s ownership interest in the KIR joint venture from Milton Cooper, Executive Chairman of the Board of Directors of the Company, for $
Ripco
Ripco Real Estate Corp. (“Ripco”) business activities include serving as a leasing agent and representative for national and regional retailers including Target, Best Buy, Kohl’s and many others, providing real estate brokerage services and principal real estate investing. Todd Cooper, an officer and
Fifth Wall
During
October 2021,
Mary Hogan Preusse, a member of the Company’s Board of Directors, joined Fifth Wall as a Senior Advisor. The Company holds an investment in the Fifth Wall’s Climate Technology Fund with a commitment of up to $
22. Commitments and Contingencies :
Letters of Credit
The Company has issued letters of credit in connection with the completion and repayment guarantees primarily on certain of the Company’s redevelopment projects and guaranty of payment related to the Company’s insurance program. At
December 31, 2022,
these letters of credit aggregated $
Funding Commitments
The Company has investments, including Fifth Wall discussed above, with funding commitments of $
Other
In connection with the construction of its development and redevelopment projects and related infrastructure, certain public agencies require posting of performance and surety bonds to guarantee that the Company’s obligations are satisfied. These bonds expire upon the completion of the improvements and infrastructure. As of
December 31, 2022,
there were $
In connection with the Merger, the Company now provides a guaranty for the payment of any debt service shortfalls on the Sheridan Redevelopment Agency issued Series A bonds which are tax increment revenue bonds issued in connection with a development project in Sheridan, Colorado. These tax increment revenue bonds have a balance of $
The Company is subject to various other legal proceedings and claims that arise in the ordinary course of business. Management believes that the final outcome of such matters will not have a material adverse effect on the financial position, results of operations or liquidity of the Company taken as a whole as of December 31, 2022.
23. Incentive Plans :
In
May 2020,
the Company’s stockholders approved the
2020
Equity Participation Plan (the
“2020
Plan”), which is a successor to the Restated Kimco Realty Corporation
2010
Equity Participation Plan (the
“2010
Plan” and together with the
2020
Plan, the “Plan”) that expired in
March 2020.
The
2020
Plan provides for a maximum of
The Company accounts for equity awards in accordance with FASB’s Compensation – Stock Compensation guidance which requires that all share-based payments to employees, including grants of employee stock options, restricted stock and performance shares, be recognized in the Consolidated Statements of Income over the service period based on their fair values. Fair value of performance awards is determined using the Monte Carlo method, which is intended to estimate the fair value of the awards at the grant date. Fair value of restricted shares is based on the price on the date of grant.
The Company recognized expense associated with its equity awards of $
Stock Options
During 2022, 2021 and 2020, the Company did grant any stock options. Information with respect to stock options outstanding under the 2010 Plan for the years ended December 31, 2022, 2021 and 2020 are as follows:
|
Shares |
Weighted-Average Exercise Price Per Share |
Aggregate Intrinsic Value (in millions) |
||||||||||
|
Options outstanding, January 1, 2020 |
|
$ |
|
$ |
|
|||||||
|
Exercised |
(
|
) | $ |
|
$ |
|
||||||
|
Forfeited |
(
|
) | $ |
|
||||||||
|
Options outstanding, December 31, 2020 |
|
$ |
|
$ |
|
|||||||
|
Exercised |
(
|
) | $ |
|
$ |
|
||||||
|
Forfeited |
(
|
) | $ |
|
||||||||
|
Options outstanding, December 31, 2021 |
|
$ |
|
$ |
|
|||||||
|
Exercised |
(
|
) | $ |
|
$ |
|
||||||
|
Forfeited |
(
|
) | $ |
|
||||||||
|
Options outstanding, December 31, 2022 |
|
$ |
|
$ |
|
|||||||
|
Options exercisable (fully vested) |
||||||||||||
|
December 31, 2020 |
|
$ |
|
$ |
|
|||||||
|
December 31, 2021 |
|
$ |
|
$ |
|
|||||||
|
December 31, 2022 |
|
$ |
|
$ |
|
|||||||
The exercise price per share for options outstanding as of
December 31, 2022
ranges from $
Restricted Stock
Information with respect to restricted stock under the Plan for the years ended December 31, 2022, 2021 and 2020 are as follows:
|
2022 |
2021 |
2020 |
||||||||||
|
Restricted stock outstanding as of January 1, |
|
|
|
|||||||||
|
Granted (1) |
|
|
|
|||||||||
|
Vested |
(
|
) |
(
|
) |
(
|
) | ||||||
|
Forfeited |
(
|
) |
(
|
) |
(
|
) | ||||||
|
Restricted stock outstanding as of December 31, |
|
|
|
|||||||||
|
( 1 ) |
The weighted-average grant date fair value for restricted stock issued during the years ended
December 31, 2022,
2021
and
2020
were $
|
Restricted shares have the same voting rights as the Company’s common stock and are entitled to a cash dividend per share equal to the Company’s common dividend which is taxable as ordinary income to the holder. For the years ended
December 31, 2022,
2021
and
2020,
the dividends paid on unvested restricted shares were $
Performance Shares
Information with respect to performance share awards under the Plan for the years ended December 31, 2022, 2021 and 2020 are as follows:
|
2022 |
2021 |
2020 |
||||||||||
|
Performance share awards outstanding as of January 1, |
|
|
|
|||||||||
|
Granted (1) |
|
|
|
|||||||||
|
Vested (2) |
(
|
) |
(
|
) |
(
|
) | ||||||
|
Performance share awards outstanding as of December 31, |
|
|
|
|||||||||
|
( 1 ) |
The weighted-average grant date fair value for performance shares issued during the years ended
December 31, 2022,
2021
and
2020
were $
|
|
( 2 ) |
For the years ended
December 31, 2022,
2021
and
2020,
the corresponding common stock equivalent of these vested awards were
|
The more significant assumptions underlying the determination of fair values for these performance awards granted during 2022, 2021 and 2020 were as follows:
|
2022 |
2021 |
2020 |
||||||||||
|
Stock price |
$ |
|
$ |
|
$ |
|
||||||
|
Dividend yield (1) |
|
% |
|
% |
|
% | ||||||
|
Risk-free rate |
|
% |
|
% |
|
% | ||||||
|
Volatility (2) |
|
% |
|
% |
|
% | ||||||
|
Term of the award (years) |
|
|
|
|||||||||
|
( 1 ) |
Total Shareholder Returns, as used in the performance share awards computation, are measured based on cumulative dividend stock prices, as such a percent dividend yield is utilized. |
|
( 2 ) |
Volatility is based on the annualized standard deviation of the daily logarithmic returns on dividend-adjusted closing prices over the look-back period based on the term of the award. |
Other
The Company maintains a
401
(k)-retirement plan covering substantially all officers and employees, which permits participants to defer up to the maximum allowable amount determined by the Internal Revenue Service of their eligible compensation. This deferred compensation, together with Company matching contributions, which generally equal employee deferrals up to a maximum of
The Company recognized severance costs associated with employee retirements and terminations during the years ended
December 31, 2022,
2021
and
2020,
of $
24. Defined Benefit Plan:
As part of the Merger, the Company assumed sponsorship of Weingarten’s noncontributory qualified cash balance retirement plan (“the Benefit Plan”). At the date of the Merger, the Benefit Plan was frozen and as a result
no
new benefits will be offered to employees who were
not
already part of the Benefit Plan on the Merger date. The Benefit Plan was terminated as of
December 31, 2021.
In connection with the termination, the Benefit Plan maintains a separate account for each participant. Annual additions to each participant’s account includes an interest credit of
The following table summarizes the measurement changes in the Benefit Plan’s projected benefit obligation, plan assets and funded status, as well as the components of net periodic benefit costs, including key assumptions, from January 1, 2022 through December 31, 2022 ( in thousands):
| 2022 | 2021* | |||||||
|
Change in Projected Benefit Obligation: |
||||||||
|
Benefit obligation at beginning of period |
$ |
|
$ |
|
||||
|
Interest cost |
|
|
||||||
|
Settlement payments |
|
(
|
) | |||||
|
Actuarial gain |
(
|
) |
(
|
) | ||||
|
Benefit payments |
(
|
) |
(
|
) | ||||
|
Benefit obligation at end of period |
$ |
|
$ |
|
||||
|
Change in Plan Assets: |
||||||||
|
Fair value of plan assets at beginning of period |
$ |
|
$ |
|
||||
|
Actual return on plan assets |
(
|
) |
|
|||||
|
Settlement payments |
|
(
|
) | |||||
|
Benefit payments |
(
|
) |
(
|
) | ||||
|
Fair value of plan assets at end of period |
$ |
|
$ |
|
||||
|
Funded status at end of period (included in Accounts and notes receivable) |
$ |
|
$ |
|
||||
|
Accumulated benefit obligation |
$ |
|
$ |
|
||||
|
Net gain recognized in Accumulated other comprehensive income |
$ |
|
$ |
|
||||
* For the year ended December 31, 2021, the measurement changes are from the date of Merger.
The components of net periodic benefit income/(cost), included in Other income, net in the Company’s Consolidated Statements of Income for the years ended December 31, 2022 and 2021 are as follows (in thousands):
|
2022 |
2021 |
|||||||
|
Interest cost |
$ |
(
|
) | $ |
(
|
) | ||
|
Expected return on plan assets |
|
|
||||||
|
Amortization of net gain |
|
|
||||||
|
Settlement gain |
|
|
||||||
|
Total |
$ |
(
|
) | $ |
|
|||
The weighted-average assumptions used to determine the benefit obligation as of December 31, 2022 and 2021 are as follows:
|
2022 |
2021 |
|||||||
|
Discount rate |
|
% |
|
% | ||||
|
Salary scale increases |
N/A | N/A | ||||||
|
Interest credit rate for cash balance plan |
|
% |
|
% | ||||
The selection of the discount rate is made after comparison to yields based on cash investments. The long-term rate of return is a composite rate for the Benefit Plan. It is derived as the sum of the percentages invested in each principal asset class included in the portfolio multiplied by their respective expected rates of return. The Company considered the historical returns and the future expectations for returns for each asset class, as well as the target asset allocation of the Benefit Plan portfolio. This analysis resulted in the selection of
|
2023 |
2024 |
2025 |
2026 |
2027 |
2028 - 2032 | |||||||||||||||||||
|
Benefit payments |
$ |
|
$ |
|
$ |
|
$ |
|
$ |
|
$ |
|
||||||||||||
Since termination of the Benefit Plan as of December 31, 2021, the Benefit Plan’s investment policy has changed to address the short-term capital needs for liquidation of the plan assets, as well as consider the market volatility risks by investing in and holding liquid assets, such as cash and short-term investments on hand, in order to satisfy the projected benefit obligation. The fair value of plan assets was determined based on publicly quoted market prices for identical assets, which are all classified as Level 1 observable inputs. The fair value and allocation of the plan assets as of December 31, 2022 and 2021 were as follows (in thousands):
|
2022 |
2021 |
|||||||||||||||
|
Fair Value |
Asset Allocation |
Fair Value |
Asset Allocation |
|||||||||||||
|
Cash and short-term investments |
$ |
|
|
% | $ |
|
|
% | ||||||||
|
Large company funds |
|
|
|
|
% | |||||||||||
|
Mid company funds |
|
|
|
|
% | |||||||||||
|
Small company funds |
|
|
|
|
% | |||||||||||
|
International funds |
|
|
|
|
% | |||||||||||
|
Fixed income funds |
|
|
|
|
% | |||||||||||
|
Growth funds |
|
|
|
|
% | |||||||||||
|
Total |
$ |
|
|
% | $ |
|
|
% | ||||||||
25. Income Taxes :
The Company elected to qualify as a REIT in accordance with the Code commencing with its taxable year which began
January 1, 1992.
To qualify as a REIT, the Company must meet several organizational and operational requirements, and is required to annually distribute at least
Reconciliation between GAAP Net Income and Federal Taxable Income
The following table reconciles GAAP net income to taxable income for the years ended December 31, 2022, 2021 and 2020 (in thousands):
|
2022 |
2021 |
2020 |
||||||||||
|
(Estimated) |
(Actual) |
(Actual) |
||||||||||
|
GAAP net income attributable to the Company |
$ |
|
$ |
|
$ |
|
||||||
|
GAAP net (income)/loss attributable to TRSs |
(
|
) |
(
|
) |
(
|
) | ||||||
|
GAAP net income from REIT operations (1) |
|
|
|
|||||||||
|
Federal income taxes |
|
|
|
|||||||||
|
Net book depreciation in excess of tax depreciation |
|
|
(
|
) | ||||||||
|
Deferred/prepaid/above-market and below-market rents, net |
(
|
) |
(
|
) |
(
|
) | ||||||
|
Fair market value debt amortization |
(
|
) |
(
|
) |
(
|
) | ||||||
|
Book/tax differences from executive compensation |
|
|
|
|||||||||
|
Book/tax differences from equity awards |
(
|
) |
(
|
) |
|
|||||||
|
Book/tax differences from defined benefit plan |
|
(
|
) |
|
||||||||
|
Book/tax differences from investments in and advances to real estate joint ventures |
|
|
|
|||||||||
|
Book/tax differences from sale of properties |
|
(
|
) |
(
|
) | |||||||
|
Book/tax differences from accounts receivable |
(
|
) |
(
|
) |
|
|||||||
|
Book adjustment to property carrying values and marketable equity securities |
|
(
|
) |
(
|
) | |||||||
|
Taxable currency exchange gain/(loss), net |
|
|
(
|
) | ||||||||
|
Tangible property regulation deduction |
(
|
) |
|
(
|
) | |||||||
|
GAAP change in ownership of joint venture interests |
|
(
|
) |
|
||||||||
|
Dividends from TRSs |
|
|
|
|||||||||
|
Severance accrual |
(
|
) |
(
|
) |
|
|||||||
|
Other book/tax differences, net (2) |
(
|
) |
(
|
) |
(
|
) | ||||||
|
Adjusted REIT taxable income |
$ |
|
$ |
|
$ |
|
||||||
Certain amounts in the prior periods have been reclassified to conform to the current year presentation in the table above.
|
( 1 ) |
All adjustments to "GAAP net income from REIT operations" are net of amounts attributable to noncontrolling interests and TRSs. |
|
( 2 ) |
Includes Merger related costs of $
|
Characterization of Distributions
The following characterizes distributions paid for tax purposes for the years ended December 31, 2022, 2021 and 2020, (amounts in thousands):
|
2022 |
2021 |
2020 |
||||||||||||||||||||||
|
Preferred L Dividends |
||||||||||||||||||||||||
|
Ordinary income |
$ |
|
|
% | $ |
|
|
% | $ |
|
|
% | ||||||||||||
|
Capital gain |
|
|
% |
|
|
% |
|
|
% | |||||||||||||||
| $ |
|
|
% | $ |
|
|
% | $ |
|
|
% | |||||||||||||
|
Preferred M Dividends |
||||||||||||||||||||||||
|
Ordinary income |
$ |
|
|
% | $ |
|
|
% | $ |
|
|
% | ||||||||||||
|
Capital gain |
|
|
% |
|
|
% |
|
|
% | |||||||||||||||
| $ |
|
|
% | $ |
|
|
% | $ |
|
|
% | |||||||||||||
|
Common Dividends |
||||||||||||||||||||||||
|
Ordinary income |
$ |
|
|
% | $ |
|
|
% | $ |
|
|
% | ||||||||||||
|
Capital gain |
|
|
% |
|
|
% |
|
|
% | |||||||||||||||
|
Return of capital |
|
|
% |
|
|
% |
|
|
% | |||||||||||||||
| $ |
|
|
% | $ |
|
|
% | $ |
|
|
% | |||||||||||||
|
Total dividends distributed for tax purposes |
$ |
|
$ |
|
$ |
|
||||||||||||||||||
For the year ended December 31, 2022, the Company elected to retain the proceeds from the sale of ACI stock for general corporate purposes in lieu of distributing to its shareholders. This undistributed long-term capital gain is allocated to, and reportable by, each shareholder, and each shareholder is also entitled to claim a federal income tax credit for its allocable share of the federal income tax paid by the Company for 2022. The allocable share of the long-term capital gain and the federal tax credit will be reported to direct holders of Kimco common shares, on Form 2439, and to others in year-end reporting documents issued by brokerage firms if Kimco shares are held in a brokerage account. For the years ended December 31, 2021 and 2020 cash dividends paid for tax purposes were equivalent to, or in excess of, taxable income.
Taxable REIT Subsidiaries and Taxable Entities
The Company is subject to federal, state and local income taxes on income reported through its TRS activities, which include wholly owned subsidiaries of the Company. The Company’s TRSs include Kimco Realty Services II, Inc. (“KRS”), FNC Realty Corporation, Kimco Insurance Company (collectively “KRS Consolidated”) and the consolidated entity, Blue Ridge Real Estate Company/Big Boulder Corporation. In connection with the Merger, the Company acquired Weingarten/Investments Inc. (“WII”), a TRS of Weingarten.
The Company is subject to local non-U.S. taxes on certain investments located outside the U.S. In general, under local country law applicable to the entity ownership structures the Company has in place and applicable tax treaties, the repatriation of cash to the Company from its subsidiaries and joint ventures in Canada are generally subject to withholding tax, but entities in Puerto Rico and Mexico generally are not subject to withholding tax. The Company is subject to and includes in its tax provision non-U.S. income taxes on certain investments located in jurisdictions outside the U.S. These investments are primarily held by the Company at the REIT level and not in the Company’s TRSs. Accordingly, the Company does not expect a U.S. income tax impact associated with the repatriation of undistributed earnings from the Company’s foreign subsidiaries.
Income taxes are accounted for under the asset and liability method. Deferred income taxes are recognized for the temporary differences between the financial reporting basis and the tax basis of taxable assets and liabilities. The Company’s (provision)/benefit for income taxes relating to the Company for the years ended December 31, 2022, 2021 and 2020, are summarized as follows (in thousands):
|
2022 |
2021 |
2020 |
||||||||||
|
TRSs and taxable entities |
$ |
|
$ |
(
|
) | $ |
|
|||||
|
REIT (1) |
(
|
) |
|
(
|
) | |||||||
|
Total tax provision |
$ |
(
|
) | $ |
(
|
) | $ |
(
|
) | |||
|
( 1 ) |
During
2022,
the Company sold shares of ACI and recognized a long-term capital gain for tax purposes of $
|
Deferred Tax Assets, Liabilities and Valuation Allowances
The Company’s deferred tax assets and liabilities at December 31, 2022 and 2021, were as follows (in thousands):
|
2022 |
2021 |
|||||||
|
Deferred tax assets: |
||||||||
|
Tax/GAAP basis differences |
$ |
|
$ |
|
||||
|
Net operating losses (1) |
|
|
||||||
|
Tax credit carryforwards (2) |
|
|
||||||
|
Valuation allowance |
|
(
|
) | |||||
|
Total deferred tax assets |
|
|
||||||
|
Deferred tax liabilities |
(
|
) |
(
|
) | ||||
|
Net deferred tax liabilities |
$ |
(
|
) | $ |
(
|
) | ||
|
( 1 ) |
Net operating losses do not expire. |
|
( 2 ) |
Expiration dates ranging from 2027 to 2035. |
The major differences between the GAAP basis of accounting and the basis of accounting used for federal and state income tax reporting consist of impairment charges recorded for GAAP purposes, but not recognized for tax purposes, depreciation and amortization, rental revenue recognized on the straight-line method for GAAP, reserves for doubtful accounts, above-market and below-market lease amortization, differences in GAAP and tax basis of assets sold, and the period in which certain gains were recognized for tax purposes, but not yet recognized under GAAP.
Deferred tax assets and deferred tax liabilities are included in the captions Other assets and Other liabilities on the Company’s Consolidated Balance Sheets at December 31, 2022 and 2021.
Under GAAP a reduction of the carrying amounts of deferred tax assets by a valuation allowance is required, if, based on the evidence available, it is more likely than not (a likelihood of more than 50% ) that some portion or all of the deferred tax assets will not be realized. The valuation allowance should be sufficient to reduce the deferred tax asset to the amount that is more likely than not to be realized. Effective August 1, 2016, the Company merged Kimco Realty Services, Inc. (“KRSI”), a TRS holding REIT qualifying real estate, into a wholly owned LLC (the “TRS Merger”) and KRSI was dissolved. As a result of the TRS Merger, the Company determined that the realization of its then net deferred tax assets was not deemed more likely than not and as such, the Company recorded a full valuation allowance against these net deferred tax assets that existed at the time of the Merger. During the year ended December 31, 2022, the Company was able to utilize the deferred tax assets to reduce the tax liability on the undistributed long term capital gain.
Uncertain Tax Positions
The Company is subject to income tax in certain jurisdictions outside the U.S., principally Canada and Mexico. The statute of limitations on assessment of tax varies from
three
to
seven
years depending on the jurisdiction and tax issue. Tax returns filed in each jurisdiction are subject to examination by local tax authorities. The Company concluded audits by the Canadian Revenue Agency, which resulted in
no
adjustments or assessments. The Company had accrued $
26. Captive Insurance Company:
In October 2007, the Company formed a wholly owned captive insurance company, KIC, which provides general liability insurance coverage for all losses below the deductible under the Company’s third party liability insurance policy. The Company created KIC as part of its overall risk management program and to stabilize its insurance costs, manage exposure and recoup expenses through the functions of the captive program. The Company capitalized KIC in accordance with the applicable regulatory requirements. KIC established annual premiums based on projections derived from the past loss experience of the Company’s properties. KIC has engaged an independent third party to perform an actuarial estimate of future projected claims, related deductibles and projected expenses necessary to fund associated risk management programs. Premiums paid to KIC may be adjusted based on this estimate. Like premiums paid to third -party insurance companies, premiums paid to KIC may be reimbursed by tenants pursuant to specific lease terms. KIC assumes occurrence basis general liability coverage ( not including casualty loss or business interruption) for the Company and its affiliates under the terms of a reinsurance agreement entered into by KIC and the reinsurance provider.
From
October 1, 2007
through
December 31, 2022,
KIC assumes
In connection with the Merger, the Company acquired U.S. Fire & Indemnity Company (“US Fire”), a captive insurance company which was wholly owned by Weingarten. US Fire began providing direct coverage to Weingarten with limits of $
As of
December 31, 2022,
the Company maintained letters of credit in the amount of $
Activity in the liability for unpaid losses and loss adjustment expenses for the years ended December 31, 2022 and 2021, is summarized as follows (in thousands):
|
2022 |
2021 |
|||||||
|
Balance at the beginning of the year |
$ |
|
$ |
|
||||
|
Incurred related to: |
||||||||
|
Current year |
|
|
||||||
|
Prior years (1) |
|
|
||||||
|
Total incurred |
|
|
||||||
|
Paid related to: |
||||||||
|
Current year |
(
|
) |
(
|
) | ||||
|
Prior years |
(
|
) |
(
|
) | ||||
|
Total paid |
(
|
) |
(
|
) | ||||
|
Balance at the end of the year |
$ |
|
$ |
|
||||
|
( 1 ) |
Relates to changes in estimates in insured events in the prior years, incurred losses and loss adjustment expenses. For the year ended
December 31, 2021,
includes $
|
27. Accumulated Other Comprehensive Income ( “ AOCI ” ):
The following table displays the change in the components of AOCI for the years ended December 31, 2021 and 2022:
|
Unrealized Gains Related to Defined Benefit Plan |
||||
|
Balance as of January 1, 2021 |
$ |
|
||
|
Other comprehensive income before reclassifications |
|
|||
|
Amounts reclassified from AOCI |
|
|||
|
Net current-period other comprehensive income |
|
|||
|
Balance as of December 31, 2021 |
|
|||
|
Other comprehensive income before reclassifications |
|
|||
|
Amounts reclassified from AOCI |
|
|||
|
Net current-period other comprehensive income |
|
|||
|
Balance as of December 31, 2022 |
$ |
|
||
28. Earnings Per Share:
The following table sets forth the reconciliation of earnings and the weighted-average number of shares used in the calculation of basic and diluted earnings per share (amounts presented in thousands, except per share data):
|
For the Year Ended December 31, |
||||||||||||
|
2022 |
2021 |
2020 |
||||||||||
|
Computation of Basic and Diluted Earnings Per Share: |
||||||||||||
|
Net income available to the Company's common shareholders |
$ |
|
$ |
|
$ |
|
||||||
|
Change in estimated redemption value of redeemable noncontrolling interests |
|
|
|
|||||||||
|
Earnings attributable to participating securities |
(
|
) |
(
|
) |
(
|
) | ||||||
|
Net income available to the Company’s common shareholders for basic earnings per share |
|
|
|
|||||||||
|
Distributions on convertible units |
|
|
|
|||||||||
|
Net income available to the Company’s common shareholders for diluted earnings per share |
$ |
|
$ |
|
$ |
|
||||||
|
Weighted average common shares outstanding – basic |
|
|
|
|||||||||
|
Effect of dilutive securities (1): |
||||||||||||
|
Equity awards |
|
|
|
|||||||||
|
Assumed conversion of convertible units |
|
|
|
|||||||||
|
Weighted average common shares outstanding – diluted |
|
|
|
|||||||||
|
Net income available to the Company's common shareholders: |
||||||||||||
|
Basic earnings per share |
$ |
|
$ |
|
$ |
|
||||||
|
Diluted earnings per share |
$ |
|
$ |
|
$ |
|
||||||
|
( 1 ) |
The effect of the assumed conversion of certain convertible units had an anti-dilutive effect upon the calculation of Net income available to the Company's common shareholders per share. Accordingly, the impact of such conversions has
not
been included in the determination of diluted earnings per share calculations. Additionally, there were
|
The Company's unvested restricted share awards contain non-forfeitable rights to distributions or distribution equivalents. The impact of the unvested restricted share awards on earnings per share has been calculated using the two -class method whereby earnings are allocated to the unvested restricted share awards based on dividends declared and the unvested restricted shares' participation rights in undistributed earnings.
29. Subsequent Events:
Prior to January 1, 2023, the business of Kimco Realty Corporation (the “Company”) was conducted through a predecessor entity also known as Kimco Realty Corporation (the “Predecessor”). On December 14, 2022, the Predecessor’s Board of Directors approved the reorganization (the “Reorganization”) of the Predecessor’s business into an umbrella partnership real estate investment trust, or “UPREIT”. On January 1, 2023, to effect the Reorganization, the Company completed a merger (the “UPREIT Merger”) with KRC Merger Sub Corp. (“Merger Sub”), which was a Maryland corporation and wholly-owned subsidiary of the Company (formerly known as New KRC Corp.) (the “Parent Company”), which was a Maryland corporation and wholly-owned subsidiary of the Predecessor. Pursuant to the UPREIT Merger, Merger Sub merged with and into the Predecessor, with the Predecessor continuing as the surviving entity and a wholly-owned subsidiary of the Parent Company, and each outstanding share of capital stock of the Predecessor was converted into one equivalent share of capital stock of the Parent Company (each of which has continued to trade under their respective existing ticker symbol with the same rights, powers and limitations that existed immediately prior to the Reorganization). Effective as of January 3, 2023, the Predecessor converted into a limited liability company, organized in the State of Delaware, known as Kimco Realty OP, LLC (“Kimco OP”). In connection with the Reorganization, the Parent Company changed its name to Kimco Realty Corporation, and replaced the Predecessor as the New York Stock Exchange-listed public company.
Following the Reorganization, substantially all of the Company’s assets are held by, and substantially all of the Company’s operations are conducted through, Kimco OP (either directly or through its subsidiaries), as the Company’s operating company, and the Company is the managing member of Kimco OP. The officers and directors of the Company are the same as the officers and directors of the Predecessor as immediately prior to the Reorganization.
See Footnote 9 of the Company’s Consolidated Financial Statements for discussion of the ACI special dividend.
KIMCO REALTY CORPORATION AND SUBSIDIARIES
SCHEDULE II – VALUATION AND QUALIFYING ACCOUNTS
For the Years Ended
December 31, 2022,
2021
and
2020
(in thousands)
|
Balance at beginning of period |
Charged to expenses |
Adjustments to valuation accounts |
Deductions |
Balance at end of period |
||||||||||||||||
|
Year Ended December 31, 2022 |
||||||||||||||||||||
|
Allowance for uncollectable accounts (1) |
$ |
|
$ |
|
$ |
|
$ |
(
|
) | $ |
|
|||||||||
|
Allowance for deferred tax asset |
$ |
|
$ |
|
$ |
(
|
) | $ |
|
$ |
|
|||||||||
|
Year Ended December 31, 2021 |
||||||||||||||||||||
|
Allowance for uncollectable accounts (1) |
$ |
|
$ |
|
$ |
|
$ |
(
|
) | $ |
|
|||||||||
|
Allowance for deferred tax asset |
$ |
|
$ |
|
$ |
(
|
) | $ |
|
$ |
|
|||||||||
|
Year Ended December 31, 2020 |
||||||||||||||||||||
|
Allowance for uncollectable accounts (1) |
$ |
|
$ |
|
$ |
|
$ |
|
$ |
|
||||||||||
|
Allowance for deferred tax asset |
$ |
|
$ |
|
$ |
(
|
) | $ |
|
$ |
|
|||||||||
|
( 1 ) |
Includes allowances on accounts receivable and straight-line rents. |
|
SCHEDULE III - REAL ESTATE AND ACCUMULATED DEPRECIATION |
||||||||||||||||||||||||||||||||||||||||||||
|
December 31, 2022 |
||||||||||||||||||||||||||||||||||||||||||||
|
(in thousands) |
||||||||||||||||||||||||||||||||||||||||||||
|
INITIAL COST |
COST CAPITALIZED SUBSEQUENT TO |
BUILDING |
TOTAL COST, NET OF |
DATE OF |
||||||||||||||||||||||||||||||||||
|
BUILDING AND |
ACQUISITION |
AND |
ACCUMULATED |
ACCUMULATED |
ENCUMBRANCES |
ACQUISITION(A) |
||||||||||||||||||||||||||||||||
|
DESCRIPTION |
State |
LAND |
IMPROVEMENTS |
(1) |
LAND |
IMPROVEMENTS |
TOTAL |
DEPRECIATION |
DEPRECIATION |
(2) |
CONSTRUCTION(C) |
|||||||||||||||||||||||||||
|
SHOPPING CENTERS |
||||||||||||||||||||||||||||||||||||||
|
ARCADIA BILTMORE PLAZA |
AZ |
$ |
|
$ |
|
$ |
|
$ |
|
$ |
|
$ |
|
$ |
|
$ |
|
$ |
|
2021(A) |
||||||||||||||||||
|
BELL CAMINO CENTER |
AZ |
|
|
|
|
|
|
|
|
|
2012(A) |
|||||||||||||||||||||||||||
|
BELL CAMINO-SAFEWAY PARCEL |
AZ |
|
|
|
|
|
|
|
|
|
2019(A) |
|||||||||||||||||||||||||||
|
BROADWAY MARKETPLACE |
AZ |
|
|
|
|
|
|
|
|
|
2021(A) |
|||||||||||||||||||||||||||
|
CAMELBACK MILLER PLAZA |
AZ |
|
|
|
|
|
|
|
|
|
2021(A) |
|||||||||||||||||||||||||||
|
CAMELBACK VILLAGE SQUARE |
AZ |
|
|
|
|
|
|
|
|
|
2021(A) |
|||||||||||||||||||||||||||
|
CHRISTOWN SPECTRUM |
AZ |
|
|
|
|
|
|
|
|
|
2015(A) |
|||||||||||||||||||||||||||
|
COLLEGE PARK SHOPPING CENTER |
AZ |
|
|
|
|
|
|
|
|
|
2011(A) |
|||||||||||||||||||||||||||
|
DESERT VILLAGE |
AZ |
|
|
(
|
) |
|
|
|
|
|
|
2021(A) |
||||||||||||||||||||||||||
|
ENTRADA DE ORO PLAZA |
AZ |
|
|
|
|
|
|
|
|
|
2021(A) |
|||||||||||||||||||||||||||
|
FOUNTAIN PLAZA |
AZ |
|
|
|
|
|
|
|
|
|
2021(A) |
|||||||||||||||||||||||||||
|
MADERA VILLAGE |
AZ |
|
|
|
|
|
|
|
|
|
2021(A) |
|||||||||||||||||||||||||||
|
MADISON VILLAGE MARKETPLACE |
AZ |
|
|
|
|
|
|
|
|
|
2021(A) |
|||||||||||||||||||||||||||
|
MESA RIVERVIEW |
AZ |
|
|
|
|
|
|
|
|
|
2005(C) |
|||||||||||||||||||||||||||
|
METRO SQUARE |
AZ |
|
|
|
|
|
|
|
|
|
1998(A) |
|||||||||||||||||||||||||||
|
MONTE VISTA VILLAGE CENTER |
AZ |
|
|
|
|
|
|
|
|
|
2021(A) |
|||||||||||||||||||||||||||
|
NORTH VALLEY |
AZ |
|
|
|
|
|
|
|
|
|
2011(A) |
|||||||||||||||||||||||||||
|
PLAZA AT MOUNTAINSIDE |
AZ |
|
|
|
|
|
|
|
|
|
1997(A) |
|||||||||||||||||||||||||||
|
PLAZA DEL SOL |
AZ |
|
|
|
|
|
|
|
|
|
1998(A) |
|||||||||||||||||||||||||||
|
PUEBLO ANOZIRA |
AZ |
|
|
|
|
|
|
|
|
|
2021(A) |
|||||||||||||||||||||||||||
|
RAINTREE RANCH CENTER |
AZ |
|
|
(
|
) |
|
|
|
|
|
|
2021(A) |
||||||||||||||||||||||||||
|
RED MOUNTAIN GATEWAY |
AZ |
|
|
|
|
|
|
|
|
|
2021(A) |
|||||||||||||||||||||||||||
|
SCOTTSDALE HORIZON |
AZ |
|
|
|
|
|
|
|
|
|
2021(A) |
|||||||||||||||||||||||||||
|
SCOTTSDALE WATERFRONT |
AZ |
|
|
(
|
) |
|
|
|
|
|
|
2021(A) |
||||||||||||||||||||||||||
|
SHOPPES AT BEARS PATH |
AZ |
|
|
|
|
|
|
|
|
|
2021(A) |
|||||||||||||||||||||||||||
|
SQUAW PEAK PLAZA |
AZ |
|
|
|
|
|
|
|
|
|
2021(A) |
|||||||||||||||||||||||||||
|
VILLAGE CROSSROADS |
AZ |
|
|
|
|
|
|
|
|
|
2011(A) |
|||||||||||||||||||||||||||
|
280 METRO CENTER |
CA |
|
|
|
|
|
|
|
|
|
2015(A) |
|||||||||||||||||||||||||||
|
580 MARKET PLACE |
CA |
|
|
|
|
|
|
|
|
|
2021(A) |
|||||||||||||||||||||||||||
|
8000 SUNSET STRIP S.C. |
CA |
|
|
|
|
|
|
|
|
|
2021(A) |
|||||||||||||||||||||||||||
|
AAA BUILDING AT STEVENS CREEK |
CA |
|
|
|
|
|
|
|
|
|
2021(A) |
|||||||||||||||||||||||||||
|
ANAHEIM PLAZA |
CA |
|
|
|
|
|
|
|
|
|
2021(A) |
|||||||||||||||||||||||||||
|
BLACK MOUNTAIN VILLAGE |
CA |
|
|
|
|
|
|
|
|
|
2007(A) |
|||||||||||||||||||||||||||
|
BROOKHURST CENTER |
CA |
|
|
|
|
|
|
|
|
|
2016(A) |
|||||||||||||||||||||||||||
|
BROOKVALE SHOPPING CENTER |
CA |
|
|
|
|
|
|
|
|
|
2021(A) |
|||||||||||||||||||||||||||
|
CAMBRIAN PARK PLAZA |
CA |
|
|
|
|
|
|
|
|
|
2021(A) |
|||||||||||||||||||||||||||
|
CENTERWOOD PLAZA |
CA |
|
|
|
|
|
|
|
|
|
2021(A) |
|||||||||||||||||||||||||||
|
CHICO CROSSROADS |
CA |
|
|
(
|
) |
|
|
|
|
|
|
2008(A) |
||||||||||||||||||||||||||
|
CHINO HILLS MARKETPLACE |
CA |
|
|
|
|
|
|
|
|
|
2021(A) |
|||||||||||||||||||||||||||
|
CITY HEIGHTS |
CA |
|
|
(
|
) |
|
|
|
|
|
|
2012(A) |
||||||||||||||||||||||||||
|
CORONA HILLS PLAZA |
CA |
|
|
|
|
|
|
|
|
|
1998(A) |
|||||||||||||||||||||||||||
|
COSTCO PLAZA - 541 |
CA |
|
|
|
|
|
|
|
|
|
1998(A) |
|||||||||||||||||||||||||||
|
CREEKSIDE CENTER |
CA |
|
|
|
|
|
|
|
|
|
2016(A) |
|||||||||||||||||||||||||||
|
CROCKER RANCH |
CA |
|
|
|
|
|
|
|
|
|
2015(A) |
|||||||||||||||||||||||||||
|
CUPERTINO VILLAGE |
CA |
|
|
|
|
|
|
|
|
|
2006(A) |
|||||||||||||||||||||||||||
|
EL CAMINO PROMENADE |
CA |
|
|
|
|
|
|
|
|
|
2021(A) |
|||||||||||||||||||||||||||
|
FREEDOM CENTRE |
CA |
|
|
|
|
|
|
|
|
|
2021(A) |
|||||||||||||||||||||||||||
|
FULTON MARKET PLACE |
CA |
|
|
|
|
|
|
|
|
|
2005(A) |
|||||||||||||||||||||||||||
|
GATEWAY AT DONNER PASS |
CA |
|
|
|
|
|
|
|
|
|
2015(A) |
|||||||||||||||||||||||||||
|
GATEWAY PLAZA |
CA |
|
|
|
|
|
|
|
|
|
2021(A) |
|||||||||||||||||||||||||||
|
GREENHOUSE MARKETPLACE |
CA |
|
|
(
|
) |
|
|
|
|
|
|
2021(A) |
||||||||||||||||||||||||||
|
GREENHOUSE MARKETPLACE II |
CA |
|
|
(
|
) |
|
|
|
|
|
|
2021(A) |
||||||||||||||||||||||||||
|
HOME DEPOT PLAZA |
CA |
|
|
|
|
|
|
|
|
|
1998(A) |
|||||||||||||||||||||||||||
|
KENNETH HAHN PLAZA |
CA |
|
|
(
|
) |
|
|
|
|
|
|
2010(A) |
||||||||||||||||||||||||||
|
LA MIRADA THEATRE CENTER |
CA |
|
|
(
|
) |
|
|
|
|
|
|
1998(A) |
||||||||||||||||||||||||||
|
LA VERNE TOWN CENTER |
CA |
|
|
|
|
|
|
|
|
|
2014(A) |
|||||||||||||||||||||||||||
|
LABAND VILLAGE SHOPPING CENTER |
CA |
|
|
(
|
) |
|
|
|
|
|
|
2008(A) |
||||||||||||||||||||||||||
|
LAKEWOOD PLAZA |
CA |
|
|
(
|
) |
|
|
|
|
|
|
2014(A) |
||||||||||||||||||||||||||
|
LAKEWOOD VILLAGE |
CA |
|
|
(
|
) |
|
|
|
|
|
|
2014(A) |
||||||||||||||||||||||||||
|
LINCOLN HILLS TOWN CENTER |
CA |
|
|
|
|
|
|
|
|
|
2015(A) |
|||||||||||||||||||||||||||
|
LINDA MAR SHOPPING CENTER |
CA |
|
|
|
|
|
|
|
|
|
2014(A) |
|||||||||||||||||||||||||||
|
MADISON PLAZA |
CA |
|
|
|
|
|
|
|
|
|
1998(A) |
|||||||||||||||||||||||||||
|
NORTH COUNTY PLAZA |
CA |
|
|
|
|
|
|
|
|
|
2014(A) |
|||||||||||||||||||||||||||
|
NOVATO FAIR S.C. |
CA |
|
|
|
|
|
|
|
|
|
2009(A) |
|||||||||||||||||||||||||||
|
ON THE CORNER AT STEVENS CREEK |
CA |
|
|
|
|
|
|
|
|
|
2021(A) |
|||||||||||||||||||||||||||
|
PLAZA DI NORTHRIDGE |
CA |
|
|
|
|
|
|
|
|
|
2005(A) |
|||||||||||||||||||||||||||
|
POWAY CITY CENTRE |
CA |
|
|
|
|
|
|
|
|
|
2005(A) |
|||||||||||||||||||||||||||
|
RANCHO PENASQUITOS TOWNE CTR I |
CA |
|
|
|
|
|
|
|
|
|
2015(A) |
|||||||||||||||||||||||||||
|
RANCHO PENASQUITOS TWN CTR II |
CA |
|
|
|
|
|
|
|
|
|
2015(A) |
|||||||||||||||||||||||||||
|
RANCHO PENASQUITOS-VONS PROP. |
CA |
|
|
|
|
|
|
|
|
|
2019(A) |
|||||||||||||||||||||||||||
|
RANCHO SAN MARCOS VILLAGE |
CA |
|
|
|
|
|
|
|
|
|
2021(A) |
|||||||||||||||||||||||||||
|
REDWOOD CITY PLAZA |
CA |
|
|
|
|
|
|
|
|
|
2009(A) |
|||||||||||||||||||||||||||
|
SAN DIEGO CARMEL MOUNTAIN |
CA |
|
|
(
|
) |
|
|
|
|
|
|
2009(A) |
||||||||||||||||||||||||||
|
SAN MARCOS PLAZA |
CA |
|
|
|
|
|
|
|
|
|
2021(A) |
|||||||||||||||||||||||||||
|
SANTEE TROLLEY SQUARE |
CA |
|
|
|
|
|
|
|
|
|
2015(A) |
|||||||||||||||||||||||||||
|
SILVER CREEK PLAZA |
CA |
|
|
|
|
|
|
|
|
|
2021(A) |
|||||||||||||||||||||||||||
|
SOUTH NAPA MARKET PLACE |
CA |
|
|
|
|
|
|
|
|
|
2006(A) |
|||||||||||||||||||||||||||
|
SOUTHAMPTON CENTER |
CA |
|
|
(
|
) |
|
|
|
|
|
|
2021(A) |
||||||||||||||||||||||||||
|
STANFORD RANCH |
CA |
|
|
|
|
|
|
|
|
|
2014(A) |
|||||||||||||||||||||||||||
|
STEVENS CREEK CENTRAL S.C. |
CA |
|
|
|
|
|
|
|
|
|
2021(A) |
|||||||||||||||||||||||||||
|
STONY POINT PLAZA |
CA |
|
|
(
|
) |
|
|
|
|
|
|
2021(A) |
||||||||||||||||||||||||||
|
TRUCKEE CROSSROADS |
CA |
|
|
(
|
) |
|
|
|
|
|
|
2006(A) |
||||||||||||||||||||||||||
|
WESTLAKE SHOPPING CENTER |
CA |
|
|
|
|
|
|
|
|
|
2002(A) |
|||||||||||||||||||||||||||
|
WESTMINSTER CENTER |
CA |
|
|
|
|
|
|
|
|
|
2021(A) |
|||||||||||||||||||||||||||
|
WHITTWOOD TOWN CENTER |
CA |
|
|
|
|
|
|
|
|
|
2017(A) |
|
CROSSING AT STONEGATE |
CO |
|
|
|
|
|
|
|
|
|
2021(A) |
|||||||||||||||||||||||||||
|
DENVER WEST 38TH STREET |
CO |
|
|
|
|
|
|
|
|
|
1998(A) |
|||||||||||||||||||||||||||
|
EAST BANK S.C. |
CO |
|
|
|
|
|
|
|
|
|
1998(A) |
|||||||||||||||||||||||||||
|
EDGEWATER MARKETPLACE |
CO |
|
|
|
|
|
|
|
|
|
2021(A) |
|||||||||||||||||||||||||||
|
ENGLEWOOD PLAZA |
CO |
|
|
|
|
|
|
|
|
|
1998(A) |
|||||||||||||||||||||||||||
|
GREELEY COMMONS |
CO |
|
|
|
|
|
|
|
|
|
2012(A) |
|||||||||||||||||||||||||||
|
HERITAGE WEST S.C. |
CO |
|
|
|
|
|
|
|
|
|
1998(A) |
|||||||||||||||||||||||||||
|
HIGHLANDS RANCH II |
CO |
|
|
|
|
|
|
|
|
|
2013(A) |
|||||||||||||||||||||||||||
|
HIGHLANDS RANCH VILLAGE S.C. |
CO |
|
|
|
|
|
|
|
|
|
2011(A) |
|||||||||||||||||||||||||||
|
LOWRY TOWN CENTER |
CO |
|
|
|
|
|
|
|
|
|
2021(A) |
|||||||||||||||||||||||||||
|
MARKET AT SOUTHPARK |
CO |
|
|
|
|
|
|
|
|
|
2011(A) |
|||||||||||||||||||||||||||
|
NORTHRIDGE SHOPPING CENTER |
CO |
|
|
|
|
|
|
|
|
|
2013(A) |
|||||||||||||||||||||||||||
|
QUINCY PLACE S.C. |
CO |
|
|
|
|
|
|
|
|
|
1998(A) |
|||||||||||||||||||||||||||
|
RIVER POINT AT SHERIDAN |
CO |
|
|
|
|
|
|
|
|
|
2021(A) |
|||||||||||||||||||||||||||
|
RIVER POINT AT SHERIDAN II |
CO |
|
|
|
|
|
|
|
|
|
2021(A) |
|||||||||||||||||||||||||||
|
VILLAGE CENTER - HIGHLAND RANCH |
CO |
|
|
|
|
|
|
|
|
|
2014(A) |
|||||||||||||||||||||||||||
|
VILLAGE CENTER WEST |
CO |
|
|
|
|
|
|
|
|
|
2011(A) |
|||||||||||||||||||||||||||
|
VILLAGE ON THE PARK |
CO |
|
|
|
|
|
|
|
|
|
1998(A) |
|||||||||||||||||||||||||||
|
BRIGHT HORIZONS |
CT |
|
|
|
|
|
|
|
|
|
2012(A) |
|||||||||||||||||||||||||||
|
HAMDEN MART |
CT |
|
|
|
|
|
|
|
|
|
2016(A) |
|||||||||||||||||||||||||||
|
HOME DEPOT PLAZA |
CT |
|
|
|
|
|
|
|
|
|
1998(A) |
|||||||||||||||||||||||||||
|
NEWTOWN S.C. |
CT |
|
|
|
|
|
|
|
|
|
2014(A) |
|||||||||||||||||||||||||||
|
WEST FARM SHOPPING CENTER |
CT |
|
|
|
|
|
|
|
|
|
1998(A) |
|||||||||||||||||||||||||||
|
WILTON CAMPUS |
CT |
|
|
|
|
|
|
|
|
|
2013(A) |
|||||||||||||||||||||||||||
|
WILTON RIVER PARK SHOPPING CTR |
CT |
|
|
|
|
|
|
|
|
|
2012(A) |
|||||||||||||||||||||||||||
|
BRANDYWINE COMMONS |
DE |
|
|
(
|
) |
|
|
|
|
|
|
2014(A) |
||||||||||||||||||||||||||
|
CAMDEN SQUARE |
DE |
|
|
|
|
|
|
|
|
|
2003(A) |
|||||||||||||||||||||||||||
|
PROMENADE AT CHRISTIANA |
DE |
|
|
|
|
|
|
|
|
|
2014(C) |
|
ARGYLE VILLAGE |
FL |
|
|
|
|
|
|
|
|
|
2021(A) |
|||||||||||||||||||||||||||
|
BELMART PLAZA |
FL |
|
|
|
|
|
|
|
|
|
2014(A) |
|||||||||||||||||||||||||||
|
BOCA LYONS PLAZA |
FL |
|
|
|
|
|
|
|
|
|
2021(A) |
|||||||||||||||||||||||||||
|
CAMINO SQUARE |
FL |
|
|
(
|
) |
|
|
|
|
|
|
1992(A) |
||||||||||||||||||||||||||
|
CARROLLWOOD COMMONS |
FL |
|
|
|
|
|
|
|
|
|
1997(A) |
|||||||||||||||||||||||||||
|
CENTER AT MISSOURI AVENUE |
FL |
|
|
|
|
|
|
|
|
|
1968(C) |
|||||||||||||||||||||||||||
|
CHEVRON OUTPARCEL |
FL |
|
|
|
|
|
|
|
|
|
2010(A) |
|||||||||||||||||||||||||||
|
COLONIAL PLAZA |
FL |
|
|
|
|
|
|
|
|
|
2021(A) |
|||||||||||||||||||||||||||
|
CORAL POINTE S.C. |
FL |
|
|
|
|
|
|
|
|
|
2015(A) |
|||||||||||||||||||||||||||
|
CORAL SQUARE PROMENADE |
FL |
|
|
|
|
|
|
|
|
|
1994(A) |
|||||||||||||||||||||||||||
|
CORSICA SQUARE S.C. |
FL |
|
|
|
|
|
|
|
|
|
2015(A) |
|||||||||||||||||||||||||||
|
COUNTRYSIDE CENTRE |
FL |
|
|
|
|
|
|
|
|
|
2021(A) |
|||||||||||||||||||||||||||
|
CURLEW CROSSING SHOPPING CTR |
FL |
|
|
|
|
|
|
|
|
|
2005(A) |
|||||||||||||||||||||||||||
|
DANIA POINTE |
FL |
|
|
|
|
|
|
|
|
|
2016(C) |
|||||||||||||||||||||||||||
|
DANIA POINTE - PHASE II (3) |
FL |
|
|
|
|
|
|
|
|
|
2016(C) |
|||||||||||||||||||||||||||
|
EMBASSY LAKES |
FL |
|
|
|
|
|
|
|
|
|
2021(A) |
|||||||||||||||||||||||||||
|
FLAGLER PARK |
FL |
|
|
|
|
|
|
|
|
|
2007(A) |
|||||||||||||||||||||||||||
|
FT LAUDERDALE #1, FL |
FL |
|
|
|
|
|
|
|
|
|
1974(C) |
|||||||||||||||||||||||||||
|
FT. LAUDERDALE/CYPRESS CREEK |
FL |
|
|
|
|
|
|
|
|
|
2009(A) |
|||||||||||||||||||||||||||
|
GRAND OAKS VILLAGE |
FL |
|
|
|
|
|
|
|
|
|
2011(A) |
|||||||||||||||||||||||||||
|
GROVE GATE S.C. |
FL |
|
|
|
|
|
|
|
|
|
1968(C) |
|||||||||||||||||||||||||||
|
IVES DAIRY CROSSING |
FL |
|
|
|
|
|
|
|
|
|
1985(A) |
|||||||||||||||||||||||||||
|
KENDALE LAKES PLAZA |
FL |
|
|
(
|
) |
|
|
|
|
|
|
2009(A) |
||||||||||||||||||||||||||
|
LARGO PLAZA |
FL |
|
|
|
|
|
|
|
|
|
2021(A) |
|||||||||||||||||||||||||||
|
MAPLEWOOD PLAZA |
FL |
|
|
|
|
|
|
|
|
|
1997(A) |
|||||||||||||||||||||||||||
|
MARATHON SHOPPING CENTER |
FL |
|
|
|
|
|
|
|
|
|
2013(A) |
|||||||||||||||||||||||||||
|
MERCHANTS WALK |
FL |
|
|
|
|
|
|
|
|
|
2001(A) |
|||||||||||||||||||||||||||
|
MILLENIA PLAZA PHASE II |
FL |
|
|
|
|
|
|
|
|
|
2009(A) |
|||||||||||||||||||||||||||
|
MILLER ROAD S.C. |
FL |
|
|
|
|
|
|
|
|
|
1986(A) |
|||||||||||||||||||||||||||
|
MILLER WEST PLAZA |
FL |
|
|
|
|
|
|
|
|
|
2015(A) |
|||||||||||||||||||||||||||
|
MISSION BELL SHOPPING CENTER |
FL |
|
|
|
|
|
|
|
|
|
2004(A) |
|||||||||||||||||||||||||||
|
NASA PLAZA |
FL |
|
|
|
|
|
|
|
|
|
1968(C) |
|||||||||||||||||||||||||||
|
OAK TREE PLAZA |
FL |
|
|
|
|
|
|
|
|
|
1968(C) |
|||||||||||||||||||||||||||
|
OAKWOOD BUSINESS CTR-BLDG 1 |
FL |
|
|
|
|
|
|
|
|
|
2009(A) |
|||||||||||||||||||||||||||
|
OAKWOOD PLAZA NORTH |
FL |
|
|
|
|
|
|
|
|
|
2016(A) |
|||||||||||||||||||||||||||
|
OAKWOOD PLAZA SOUTH |
FL |
|
|
(
|
) |
|
|
|
|
|
|
2016(A) |
||||||||||||||||||||||||||
|
PALMS AT TOWN & COUNTRY |
FL |
|
|
(
|
) |
|
|
|
|
|
|
2021(A) |
||||||||||||||||||||||||||
|
PALMS AT TOWN & COUNTRY LIFESTYLE |
FL |
|
|
|
|
|
|
|
|
|
2021(A) |
|||||||||||||||||||||||||||
|
PARK HILL PLAZA |
FL |
|
|
|
|
|
|
|
|
|
2011(A) |
|||||||||||||||||||||||||||
|
PHILLIPS CROSSING |
FL |
|
|
|
|
|
|
|
|
|
2021(A) |
|||||||||||||||||||||||||||
|
PLANTATION CROSSING |
FL |
|
|
|
|
|
|
|
|
|
2017(A) |
|||||||||||||||||||||||||||
|
POMPANO POINTE S.C. |
FL |
|
|
|
|
|
|
|
|
|
2012(A) |
|||||||||||||||||||||||||||
|
RENAISSANCE CENTER |
FL |
|
|
|
|
|
|
|
|
|
1998(A) |
|||||||||||||||||||||||||||
|
RIVERPLACE SHOPPING CTR. |
FL |
|
|
|
|
|
|
|
|
|
2010(A) |
|||||||||||||||||||||||||||
|
RIVERSIDE LANDINGS S.C. |
FL |
|
|
|
|
|
|
|
|
|
2015(A) |
|||||||||||||||||||||||||||
|
SEA RANCH CENTRE |
FL |
|
|
|
|
|
|
|
|
|
2021(A) |
|||||||||||||||||||||||||||
|
SHOPPES AT DEERFIELD |
FL |
|
|
(
|
) |
|
|
|
|
|
|
2021(A) |
||||||||||||||||||||||||||
|
SHOPPES AT DEERFIELD II |
FL |
|
|
|
|
|
|
|
|
|
2021(A) |
|||||||||||||||||||||||||||
|
SHOPS AT SANTA BARBARA PHASE 1 |
FL |
|
|
|
|
|
|
|
|
|
2015(A) |
|||||||||||||||||||||||||||
|
SHOPS AT SANTA BARBARA PHASE 2 |
FL |
|
|
|
|
|
|
|
|
|
2015(A) |
|||||||||||||||||||||||||||
|
SHOPS AT SANTA BARBARA PHASE 3 |
FL |
|
|
|
|
|
|
|
|
|
2015(A) |
|||||||||||||||||||||||||||
|
SODO S.C. |
FL |
|
|
|
|
|
|
|
|
|
2008(A) |
|||||||||||||||||||||||||||
|
SOUTH MIAMI S.C. |
FL |
|
|
|
|
|
|
|
|
|
1995(A) |
|||||||||||||||||||||||||||
|
SUNSET 19 S.C. |
FL |
|
|
|
|
|
|
|
|
|
2021(A) |
|||||||||||||||||||||||||||
|
TJ MAXX PLAZA |
FL |
|
|
|
|
|
|
|
|
|
2021(A) |
|||||||||||||||||||||||||||
|
TRI-CITY PLAZA |
FL |
|
|
|
|
|
|
|
|
|
1992(A) |
|||||||||||||||||||||||||||
|
TUTTLEBEE PLAZA |
FL |
|
|
|
|
|
|
|
|
|
2008(A) |
|||||||||||||||||||||||||||
|
UNIVERSITY TOWN CENTER |
FL |
|
|
|
|
|
|
|
|
|
2011(A) |
|||||||||||||||||||||||||||
|
VILLAGE COMMONS S.C. |
FL |
|
|
|
|
|
|
|
|
|
2013(A) |
|||||||||||||||||||||||||||
|
VILLAGE COMMONS SHOPPING CENTER |
FL |
|
|
|
|
|
|
|
|
|
1998(A) |
|||||||||||||||||||||||||||
|
VILLAGE GREEN CENTER |
FL |
|
|
|
|
|
|
|
|
|
2021(A) |
|||||||||||||||||||||||||||
|
VIZCAYA SQUARE |
FL |
|
|
|
|
|
|
|
|
|
2021(A) |
|||||||||||||||||||||||||||
|
WELLINGTON GREEN COMMONS |
FL |
|
|
|
|
|
|
|
|
|
2021(A) |
|||||||||||||||||||||||||||
|
WELLINGTON GREEN PAD SITES |
FL |
|
|
|
|
|
|
|
|
|
2021(A) |
|||||||||||||||||||||||||||
|
WINN DIXIE-MIAMI |
FL |
|
|
(
|
) |
|
|
|
|
|
|
2013(A) |
||||||||||||||||||||||||||
|
WINTER PARK CORNERS |
FL |
|
|
(
|
) |
|
|
|
|
|
|
2021(A) |
|
BRAELINN VILLAGE |
GA |
|
|
|
|
|
|
|
|
|
2014(A) |
|||||||||||||||||||||||||||
|
BROWNSVILLE COMMONS |
GA |
|
|
(
|
) |
|
|
|
|
|
|
2021(A) |
||||||||||||||||||||||||||
|
CAMP CREEK MARKETPLACE II |
GA |
|
|
|
|
|
|
|
|
|
2021(A) |
|||||||||||||||||||||||||||
|
EMBRY VILLAGE |
GA |
|
|
|
|
|
|
|
|
|
2008(A) |
|||||||||||||||||||||||||||
|
GRAYSON COMMONS |
GA |
|
|
(
|
) |
|
|
|
|
|
|
2021(A) |
||||||||||||||||||||||||||
|
LAKESIDE MARKETPLACE |
GA |
|
|
|
|
|
|
|
|
|
2021(A) |
|||||||||||||||||||||||||||
|
LAWRENCEVILLE MARKET |
GA |
|
|
|
|
|
|
|
|
|
2013(A) |
|||||||||||||||||||||||||||
|
MARKET AT HAYNES BRIDGE |
GA |
|
|
|
|
|
|
|
|
|
2008(A) |
|||||||||||||||||||||||||||
|
PERIMETER EXPO PROPERTY |
GA |
|
|
|
|
|
|
|
|
|
2016(A) |
|||||||||||||||||||||||||||
|
PERIMETER VILLAGE |
GA |
|
|
(
|
) |
|
|
|
|
|
|
2021(A) |
||||||||||||||||||||||||||
|
RIVERWALK MARKETPLACE |
GA |
|
|
|
|
|
|
|
|
|
2015(A) |
|||||||||||||||||||||||||||
|
ROSWELL CORNERS |
GA |
|
|
(
|
) |
|
|
|
|
|
|
2021(A) |
||||||||||||||||||||||||||
|
ROSWELL CROSSING |
GA |
|
|
|
|
|
|
|
|
|
2021(A) |
|||||||||||||||||||||||||||
|
THOMPSON BRIDGE COMMONS |
GA |
|
|
|
|
|
|
|
|
|
2021(A) |
|||||||||||||||||||||||||||
|
CLIVE PLAZA |
IA |
|
|
|
|
|
|
|
|
|
1996(A) |
|||||||||||||||||||||||||||
|
HAWTHORN HILLS SQUARE |
IL |
|
|
|
|
|
|
|
|
|
2012(A) |
|||||||||||||||||||||||||||
|
PLAZA DEL PRADO |
IL |
|
|
|
|
|
|
|
|
|
2017(A) |
|||||||||||||||||||||||||||
|
SKOKIE POINTE |
IL |
|
|
|
|
|
|
|
|
|
1997(A) |
|||||||||||||||||||||||||||
|
GREENWOOD S.C. |
IN |
|
|
|
|
|
|
|
|
|
1970(C) |
|||||||||||||||||||||||||||
|
FESTIVAL ON JEFFERSON COURT |
KY |
|
|
|
|
|
|
|
|
|
2021(A) |
|||||||||||||||||||||||||||
|
ADAMS PLAZA |
MA |
|
|
|
|
|
|
|
|
|
2014(A) |
|||||||||||||||||||||||||||
|
BROADWAY PLAZA |
MA |
|
|
|
|
|
|
|
|
|
2014(A) |
|||||||||||||||||||||||||||
|
FALMOUTH PLAZA |
MA |
|
|
|
|
|
|
|
|
|
2014(A) |
|||||||||||||||||||||||||||
|
FELLSWAY PLAZA |
MA |
|
|
|
|
|
|
|
|
|
2014(A) |
|||||||||||||||||||||||||||
|
FESTIVAL OF HYANNIS S.C. |
MA |
|
|
|
|
|
|
|
|
|
2014(A) |
|||||||||||||||||||||||||||
|
GLENDALE SQUARE |
MA |
|
|
|
|
|
|
|
|
|
2014(A) |
|||||||||||||||||||||||||||
|
LINDEN PLAZA |
MA |
|
|
|
|
|
|
|
|
|
2014(A) |
|||||||||||||||||||||||||||
|
MAIN ST. PLAZA |
MA |
|
|
(
|
) |
|
|
|
|
|
|
2014(A) |
||||||||||||||||||||||||||
|
MEMORIAL PLAZA |
MA |
|
|
|
|
|
|
|
|
|
2014(A) |
|||||||||||||||||||||||||||
|
MILL ST. PLAZA |
MA |
|
|
|
|
|
|
|
|
|
2014(A) |
|||||||||||||||||||||||||||
|
MORRISSEY PLAZA |
MA |
|
|
|
|
|
|
|
|
|
2014(A) |
|||||||||||||||||||||||||||
|
NORTH AVE. PLAZA |
MA |
|
|
|
|
|
|
|
|
|
2014(A) |
|||||||||||||||||||||||||||
|
NORTH QUINCY PLAZA |
MA |
|
|
|
|
|
|
|
|
|
2014(A) |
|||||||||||||||||||||||||||
|
PARADISE PLAZA |
MA |
|
|
|
|
|
|
|
|
|
2014(A) |
|||||||||||||||||||||||||||
|
VINNIN SQUARE IN-LINE |
MA |
|
|
|
|
|
|
|
|
|
2014(A) |
|||||||||||||||||||||||||||
|
VINNIN SQUARE PLAZA |
MA |
|
|
|
|
|
|
|
|
|
2014(A) |
|||||||||||||||||||||||||||
|
WASHINGTON ST. PLAZA |
MA |
|
|
|
|
|
|
|
|
|
2014(A) |
|||||||||||||||||||||||||||
|
WASHINGTON ST. S.C. |
MA |
|
|
|
|
|
|
|
|
|
2014(A) |
|||||||||||||||||||||||||||
|
WAVERLY PLAZA |
MA |
|
|
|
|
|
|
|
|
|
2014(A) |
|
CENTRE COURT-GIANT |
MD |
3,854 | 12,770 | 127 | 3,854 | 12,897 | 16,751 | 4,204 | 12,547 | 3,500 |
2011(A) |
|||||||||||||||||||||||||||
|
CENTRE COURT-OLD COURT/COURTYD |
MD |
|
|
|
|
|
|
|
|
|
2011(A) |
|||||||||||||||||||||||||||
|
CENTRE COURT-RETAIL/BANK |
MD |
|
|
|
|
|
|
|
|
|
2011(A) |
|||||||||||||||||||||||||||
|
COLUMBIA CROSSING |
MD |
|
|
|
|
|
|
|
|
|
2015(A) |
|||||||||||||||||||||||||||
|
COLUMBIA CROSSING II SHOP.CTR. |
MD |
|
|
|
|
|
|
|
|
|
2013(A) |
|||||||||||||||||||||||||||
|
COLUMBIA CROSSING OUTPARCELS |
MD |
|
|
|
|
|
|
|
|
|
2011(A) |
|||||||||||||||||||||||||||
|
DORSEY'S SEARCH VILLAGE CENTER |
MD |
|
|
|
|
|
|
|
|
|
2015(A) |
|||||||||||||||||||||||||||
|
ENCHANTED FOREST S.C. |
MD |
|
|
|
|
|
|
|
|
|
2014(A) |
|||||||||||||||||||||||||||
|
FULLERTON PLAZA |
MD |
|
|
|
|
|
|
|
|
|
2014(A) |
|||||||||||||||||||||||||||
|
GAITHERSBURG S.C. |
MD |
|
|
|
|
|
|
|
|
|
1999(A) |
|||||||||||||||||||||||||||
|
GREENBRIER S.C. |
MD |
|
|
|
|
|
|
|
|
|
2014(A) |
|||||||||||||||||||||||||||
|
HARPER'S CHOICE |
MD |
|
|
|
|
|
|
|
|
|
2015(A) |
|||||||||||||||||||||||||||
|
HICKORY RIDGE |
MD |
|
|
|
|
|
|
|
|
|
2015(A) |
|||||||||||||||||||||||||||
|
HICKORY RIDGE (SUNOCO) |
MD |
|
|
|
|
|
|
|
|
|
2015(A) |
|||||||||||||||||||||||||||
|
INGLESIDE S.C. |
MD |
|
|
|
|
|
|
|
|
|
2014(A) |
|||||||||||||||||||||||||||
|
KENTLANDS MARKET SQUARE |
MD |
|
|
|
|
|
|
|
|
|
2016(A) |
|||||||||||||||||||||||||||
|
KINGS CONTRIVANCE |
MD |
|
|
|
|
|
|
|
|
|
2014(A) |
|||||||||||||||||||||||||||
|
LAUREL PLAZA |
MD |
|
|
|
|
|
|
|
|
|
1995(A) |
|||||||||||||||||||||||||||
|
LAUREL PLAZA |
MD |
|
|
|
|
|
|
|
|
|
1972(C) |
|||||||||||||||||||||||||||
|
MILL STATION DEVELOPMENT |
MD |
|
|
|
|
|
|
|
|
|
2015(C) |
|||||||||||||||||||||||||||
|
MILL STATION THEATER/RSTRNTS |
MD |
|
|
(
|
) |
|
|
|
|
|
|
2016(C) |
||||||||||||||||||||||||||
|
PIKE CENTER |
MD |
|
|
|
|
|
|
|
|
|
2021(A) |
|||||||||||||||||||||||||||
|
PUTTY HILL PLAZA |
MD |
|
|
|
|
|
|
|
|
|
2013(A) |
|||||||||||||||||||||||||||
|
RADCLIFFE CENTER |
MD |
|
|
(
|
) |
|
|
|
|
|
|
2014(A) |
||||||||||||||||||||||||||
|
RIVERHILL VILLAGE CENTER |
MD |
|
|
|
|
|
|
|
|
|
2014(A) |
|||||||||||||||||||||||||||
|
SHAWAN PLAZA |
MD |
|
|
(
|
) |
|
|
|
|
|
|
2008(A) |
||||||||||||||||||||||||||
|
SHOPS AT DISTRICT HEIGHTS |
MD |
|
|
(
|
) |
|
|
|
|
|
|
2015(A) |
||||||||||||||||||||||||||
|
SNOWDEN SQUARE S.C. |
MD |
|
|
|
|
|
|
|
|
|
2012(A) |
|||||||||||||||||||||||||||
|
TIMONIUM CROSSING |
MD |
|
|
|
|
|
|
|
|
|
2014(A) |
|||||||||||||||||||||||||||
|
TIMONIUM SQUARE |
MD |
|
|
|
|
|
|
|
|
|
2003(A) |
|||||||||||||||||||||||||||
|
TOWSON PLACE |
MD |
|
|
|
|
|
|
|
|
|
2012(A) |
|||||||||||||||||||||||||||
|
VILLAGES AT URBANA |
MD |
|
|
|
|
|
|
|
|
|
2003(A) |
|||||||||||||||||||||||||||
|
WILDE LAKE |
MD |
|
|
|
|
|
|
|
|
|
2002(A) |
|||||||||||||||||||||||||||
|
WILKENS BELTWAY PLAZA |
MD |
|
|
|
|
|
|
|
|
|
2014(A) |
|||||||||||||||||||||||||||
|
YORK ROAD PLAZA |
MD |
|
|
|
|
|
|
|
|
|
2014(A) |
|
THE FOUNTAINS AT ARBOR LAKES |
MN |
|
|
|
|
|
|
|
|
|
2006(A) |
|||||||||||||||||||||||||||
|
CENTER POINT S.C. |
MO |
|
|
|
|
|
|
|
|
|
1998(A) |
|||||||||||||||||||||||||||
|
BRENNAN STATION |
NC |
|
|
|
|
|
|
|
|
|
2011(A) |
|||||||||||||||||||||||||||
|
BRENNAN STATION OUTPARCEL |
NC |
|
|
(
|
) |
|
|
|
|
|
|
2011(A) |
||||||||||||||||||||||||||
|
CAPITAL SQUARE |
NC |
|
|
|
|
|
|
|
|
|
2021(A) |
|||||||||||||||||||||||||||
|
CLOVERDALE PLAZA |
NC |
|
|
|
|
|
|
|
|
|
1969(C) |
|||||||||||||||||||||||||||
|
CROSSROADS PLAZA |
NC |
|
|
|
|
|
|
|
|
|
2000(A) |
|||||||||||||||||||||||||||
|
CROSSROADS PLAZA |
NC |
|
|
|
|
|
|
|
|
|
2014(A) |
|||||||||||||||||||||||||||
|
DAVIDSON COMMONS |
NC |
|
|
|
|
|
|
|
|
|
2012(A) |
|||||||||||||||||||||||||||
|
FALLS POINTE |
NC |
|
|
|
|
|
|
|
|
|
2021(A) |
|||||||||||||||||||||||||||
|
HIGH HOUSE CROSSING |
NC |
|
|
|
|
|
|
|
|
|
2021(A) |
|||||||||||||||||||||||||||
|
HOPE VALLEY COMMONS |
NC |
|
|
|
|
|
|
|
|
|
2021(A) |
|||||||||||||||||||||||||||
|
JETTON VILLAGE SHOPPES |
NC |
|
|
|
|
|
|
|
|
|
2011(A) |
|||||||||||||||||||||||||||
|
LEESVILLE TOWNE CENTRE |
NC |
|
|
|
|
|
|
|
|
|
2021(A) |
|||||||||||||||||||||||||||
|
MOORESVILLE CROSSING |
NC |
|
|
|
|
|
|
|
|
|
2007(A) |
|||||||||||||||||||||||||||
|
NORTHWOODS S.C. |
NC |
|
|
|
|
|
|
|
|
|
2021(A) |
|||||||||||||||||||||||||||
|
PARK PLACE SC |
NC |
|
|
|
|
|
|
|
|
|
2008(A) |
|||||||||||||||||||||||||||
|
PLEASANT VALLEY PROMENADE |
NC |
|
|
|
|
|
|
|
|
|
1993(A) |
|||||||||||||||||||||||||||
|
QUAIL CORNERS |
NC |
|
|
|
|
|
|
|
|
|
2014(A) |
|||||||||||||||||||||||||||
|
SIX FORKS S.C. |
NC |
|
|
|
|
|
|
|
|
|
2021(A) |
|||||||||||||||||||||||||||
|
STONEHENGE MARKET |
NC |
|
|
(
|
) |
|
|
|
|
|
|
2021(A) |
||||||||||||||||||||||||||
|
TYVOLA SQUARE |
NC |
|
|
|
|
|
|
|
|
|
1986(A) |
|||||||||||||||||||||||||||
|
WOODLAWN MARKETPLACE |
NC |
|
|
|
|
|
|
|
|
|
2008(A) |
|||||||||||||||||||||||||||
|
WOODLAWN SHOPPING CENTER |
NC |
|
|
|
|
|
|
|
|
|
2012(A) |
|||||||||||||||||||||||||||
|
ROCKINGHAM PLAZA |
NH |
|
|
|
|
|
|
|
|
|
2008(A) |
|||||||||||||||||||||||||||
|
WEBSTER SQUARE |
NH |
|
|
|
|
|
|
|
|
|
2014(A) |
|||||||||||||||||||||||||||
|
WEBSTER SQUARE - DSW |
NH |
|
|
|
|
|
|
|
|
|
2017(A) |
|||||||||||||||||||||||||||
|
WEBSTER SQUARE NORTH |
NH |
|
|
|
|
|
|
|
|
|
2016(A) |
|||||||||||||||||||||||||||
|
CENTRAL PLAZA |
NJ |
|
|
|
|
|
|
|
|
|
2013(A) |
|||||||||||||||||||||||||||
|
CLARK SHOPRITE 70 CENTRAL AVE |
NJ |
|
|
|
|
|
|
|
|
|
2013(A) |
|||||||||||||||||||||||||||
|
COMMERCE CENTER EAST |
NJ |
|
|
|
|
|
|
|
|
|
2013(A) |
|||||||||||||||||||||||||||
|
COMMERCE CENTER WEST |
NJ |
|
|
|
|
|
|
|
|
|
2013(A) |
|||||||||||||||||||||||||||
|
COMMONS AT HOLMDEL |
NJ |
|
|
|
|
|
|
|
|
|
2004(A) |
|||||||||||||||||||||||||||
|
EAST WINDSOR VILLAGE |
NJ |
|
|
|
|
|
|
|
|
|
2008(A) |
|||||||||||||||||||||||||||
|
GARDEN STATE PAVILIONS |
NJ |
|
|
|
|
|
|
|
|
|
2011(A) |
|||||||||||||||||||||||||||
|
HILLVIEW SHOPPING CENTER |
NJ |
|
|
|
|
|
|
|
|
|
2014(A) |
|||||||||||||||||||||||||||
|
HOLMDEL TOWNE CENTER |
NJ |
|
|
|
|
|
|
|
|
|
2002(A) |
|||||||||||||||||||||||||||
|
MAPLE SHADE |
NJ |
|
|
|
|
|
|
|
|
|
2009(A) |
|||||||||||||||||||||||||||
|
MARLTON PLAZA |
NJ |
|
|
|
|
|
|
|
|
|
1996(A) |
|||||||||||||||||||||||||||
|
NORTH BRUNSWICK PLAZA |
NJ |
|
|
|
|
|
|
|
|
|
1994(A) |
|||||||||||||||||||||||||||
|
PISCATAWAY TOWN CENTER |
NJ |
|
|
|
|
|
|
|
|
|
1998(A) |
|||||||||||||||||||||||||||
|
PLAZA AT HILLSDALE |
NJ |
|
|
|
|
|
|
|
|
|
2014(A) |
|||||||||||||||||||||||||||
|
PLAZA AT SHORT HILLS |
NJ |
|
|
|
|
|
|
|
|
|
2014(A) |
|||||||||||||||||||||||||||
|
RIDGEWOOD S.C. |
NJ |
|
|
|
|
|
|
|
|
|
1993(A) |
|||||||||||||||||||||||||||
|
SHOP RITE PLAZA |
NJ |
|
|
|
|
|
|
|
|
|
1985(C) |
|||||||||||||||||||||||||||
|
UNION CRESCENT III |
NJ |
|
|
|
|
|
|
|
|
|
2007(A) |
|||||||||||||||||||||||||||
|
WESTMONT PLAZA |
NJ |
|
|
|
|
|
|
|
|
|
1994(A) |
|||||||||||||||||||||||||||
|
WILLOWBROOK PLAZA |
NJ |
|
|
|
|
|
|
|
|
|
2009(A) |
|||||||||||||||||||||||||||
|
NORTH TOWNE PLAZA - ALBUQUERQUE |
NM |
|
|
|
|
|
|
|
|
|
2021(A) |
|||||||||||||||||||||||||||
|
CHARLESTON COMMONS |
NV |
|
|
|
|
|
|
|
|
|
2021(A) |
|||||||||||||||||||||||||||
|
COLLEGE PARK S.C.-N LAS VEGAS |
NV |
|
|
(
|
) |
|
|
|
|
|
|
2021(A) |
||||||||||||||||||||||||||
|
D'ANDREA MARKETPLACE |
NV |
|
|
|
|
|
|
|
|
|
2007(A) |
|||||||||||||||||||||||||||
|
DEL MONTE PLAZA |
NV |
|
|
|
|
|
|
|
|
|
2006(A) |
|||||||||||||||||||||||||||
|
DEL MONTE PLAZA ANCHOR PARCEL |
NV |
|
|
|
|
|
|
|
|
|
2017(A) |
|||||||||||||||||||||||||||
|
FRANCISCO CENTER |
NV |
|
|
(
|
) |
|
|
|
|
|
|
2021(A) |
||||||||||||||||||||||||||
|
GALENA JUNCTION |
NV |
|
|
|
|
|
|
|
|
|
2015(A) |
|||||||||||||||||||||||||||
|
MCQUEEN CROSSINGS |
NV |
|
|
|
|
|
|
|
|
|
2015(A) |
|||||||||||||||||||||||||||
|
RANCHO TOWNE & COUNTRY |
NV |
|
|
(
|
) |
|
|
|
|
|
|
2021(A) |
||||||||||||||||||||||||||
|
REDFIELD PROMENADE |
NV |
|
|
|
|
|
|
|
|
|
2015(A) |
|||||||||||||||||||||||||||
|
SPARKS MERCANTILE |
NV |
|
|
|
|
|
|
|
|
|
2015(A) |
|
501 NORTH BROADWAY |
NY |
|
|
(
|
) |
|
|
|
|
|
|
2007(A) |
||||||||||||||||||||||||||
|
AIRPORT PLAZA |
NY |
|
|
|
|
|
|
|
|
|
2015(A) |
|||||||||||||||||||||||||||
|
BELLMORE S.C. |
NY |
|
|
|
|
|
|
|
|
|
2004(A) |
|||||||||||||||||||||||||||
|
BIRCHWOOD PLAZA COMMACK |
NY |
|
|
|
|
|
|
|
|
|
2007(A) |
|||||||||||||||||||||||||||
|
BRIDGEHAMPTON COMMONS-W&E SIDE |
NY |
|
|
|
|
|
|
|
|
|
1972(C) |
|||||||||||||||||||||||||||
|
CARMAN'S PLAZA |
NY |
|
|
|
|
|
|
|
|
|
2022(A) |
|||||||||||||||||||||||||||
|
CHAMPION FOOD SUPERMARKET |
NY |
|
|
(
|
) |
|
|
|
|
|
|
2012(A) |
||||||||||||||||||||||||||
|
ELMONT S.C. |
NY |
|
|
|
|
|
|
|
|
|
2004(A) |
|||||||||||||||||||||||||||
|
ELMSFORD CENTER 1 |
NY |
|
|
|
|
|
|
|
|
|
2013(A) |
|||||||||||||||||||||||||||
|
ELMSFORD CENTER 2 |
NY |
|
|
|
|
|
|
|
|
|
2013(A) |
|||||||||||||||||||||||||||
|
FAMILY DOLLAR UNION TURNPIKE |
NY |
|
|
|
|
|
|
|
|
|
2012(A) |
|||||||||||||||||||||||||||
|
FOREST AVENUE PLAZA |
NY |
|
|
|
|
|
|
|
|
|
2005(A) |
|||||||||||||||||||||||||||
|
FRANKLIN SQUARE S.C. |
NY |
|
|
|
|
|
|
|
|
|
2004(A) |
|||||||||||||||||||||||||||
|
GREAT NECK OUTPARCEL |
NY |
|
|
|
|
|
|
|
|
|
2022(A) |
|||||||||||||||||||||||||||
|
GREENRIDGE PLAZA |
NY |
|
|
|
|
|
|
|
|
|
1997(A) |
|||||||||||||||||||||||||||
|
HAMPTON BAYS PLAZA |
NY |
|
|
|
|
|
|
|
|
|
1989(A) |
|||||||||||||||||||||||||||
|
HICKSVILLE PLAZA |
NY |
|
|
|
|
|
|
|
|
|
2004(A) |
|||||||||||||||||||||||||||
|
INDEPENDENCE PLAZA |
NY |
|
|
|
|
|
|
|
|
|
2014(A) |
|||||||||||||||||||||||||||
|
JERICHO COMMONS SOUTH |
NY |
|
|
|
|
|
|
|
|
|
2007(A) |
|||||||||||||||||||||||||||
|
KEY FOOD - 21ST STREET |
NY |
|
|
(
|
) |
|
|
|
|
|
|
2012(A) |
||||||||||||||||||||||||||
|
KEY FOOD - ATLANTIC AVE |
NY |
|
|
|
|
|
|
|
|
|
2012(A) |
|||||||||||||||||||||||||||
|
KEY FOOD - CENTRAL AVE. |
NY |
|
|
(
|
) |
|
|
|
|
|
|
2012(A) |
||||||||||||||||||||||||||
|
KINGS HIGHWAY |
NY |
|
|
|
|
|
|
|
|
|
2004(A) |
|||||||||||||||||||||||||||
|
KISSENA BOULEVARD SHOPPING CTR |
NY |
|
|
|
|
|
|
|
|
|
2007(A) |
|||||||||||||||||||||||||||
|
LITTLE NECK PLAZA |
NY |
|
|
|
|
|
|
|
|
|
2003(A) |
|||||||||||||||||||||||||||
|
MANETTO HILL PLAZA |
NY |
|
|
|
|
|
|
|
|
|
1969(C) |
|||||||||||||||||||||||||||
|
MANHASSET CENTER |
NY |
|
|
|
|
|
|
|
|
|
1999(A) |
|||||||||||||||||||||||||||
|
MARKET AT BAY SHORE |
NY |
|
|
|
|
|
|
|
|
|
2006(A) |
|||||||||||||||||||||||||||
|
MASPETH QUEENS-DUANE READE |
NY |
|
|
|
|
|
|
|
|
|
2004(A) |
|||||||||||||||||||||||||||
|
MILLERIDGE INN |
NY |
|
|
(
|
) |
|
|
|
|
|
|
2015(A) |
||||||||||||||||||||||||||
|
MINEOLA CROSSINGS |
NY |
|
|
|
|
|
|
|
|
|
2007(A) |
|||||||||||||||||||||||||||
|
NORTH MASSAPEQUA S.C. |
NY |
|
|
(
|
) |
|
|
|
|
|
|
2004(A) |
||||||||||||||||||||||||||
|
OCEAN PLAZA |
NY |
|
|
|
|
|
|
|
|
|
2003(A) |
|||||||||||||||||||||||||||
|
RALPH AVENUE PLAZA |
NY |
|
|
|
|
|
|
|
|
|
2004(A) |
|||||||||||||||||||||||||||
|
RICHMOND S.C. |
NY |
|
|
|
|
|
|
|
|
|
1989(A) |
|||||||||||||||||||||||||||
|
ROMAINE PLAZA |
NY |
|
|
|
|
|
|
|
|
|
2005(A) |
|||||||||||||||||||||||||||
|
SEQUAMS SHOPPING CENTER |
NY |
|
|
|
|
|
|
|
|
|
2022(A) |
|||||||||||||||||||||||||||
|
SHOPRITE S.C. |
NY |
|
|
|
|
|
|
|
|
|
1998(A) |
|||||||||||||||||||||||||||
|
STOP & SHOP |
NY |
|
|
|
|
|
|
|
|
|
2022(A) |
|||||||||||||||||||||||||||
|
SMITHTOWN PLAZA |
NY |
|
|
|
|
|
|
|
|
|
2009(A) |
|||||||||||||||||||||||||||
|
SOUTHGATE SHOPPING CENTER |
NY |
|
|
|
|
|
|
|
|
|
2022(A) |
|||||||||||||||||||||||||||
|
SYOSSET CORNERS |
NY |
|
|
|
|
|
|
|
|
|
2022(A) |
|||||||||||||||||||||||||||
|
SYOSSET S.C. |
NY |
|
|
|
|
|
|
|
|
|
1990(C) |
|||||||||||||||||||||||||||
|
THE BOULEVARD |
NY |
|
|
|
|
|
|
|
|
|
2006(A) |
|||||||||||||||||||||||||||
|
THE GARDENS AT GREAT NECK |
NY |
|
|
|
|
|
|
|
|
|
2022(A) |
|||||||||||||||||||||||||||
|
THE GREEN COVE PLAZA |
NY |
|
|
|
|
|
|
|
|
|
2022(A) |
|||||||||||||||||||||||||||
|
THE MARKETPLACE |
NY |
|
|
|
|
|
|
|
|
|
2022(A) |
|||||||||||||||||||||||||||
|
TOWNPATH CORNER |
NY |
|
|
|
|
|
|
|
|
|
2022(A) |
|||||||||||||||||||||||||||
|
TURNPIKE PLAZA |
NY |
|
|
|
|
|
|
|
|
|
2011(A) |
|||||||||||||||||||||||||||
|
VETERANS MEMORIAL PLAZA |
NY |
|
|
|
|
|
|
|
|
|
1998(A) |
|||||||||||||||||||||||||||
|
WHITE PLAINS S.C. |
NY |
|
|
|
|
|
|
|
|
|
2004(A) |
|||||||||||||||||||||||||||
|
WOODBURY COMMON |
NY |
|
|
|
|
|
|
|
|
|
2022(A) |
|
JANTZEN BEACH CENTER |
OR |
|
|
|
|
|
|
|
|
|
2017(A) |
|||||||||||||||||||||||||||
|
CENTER SQUARE SHOPPING CENTER |
PA |
|
|
|
|
|
|
|
|
|
1996(A) |
|||||||||||||||||||||||||||
|
CRANBERRY TOWNSHIP-PARCEL 1&2 |
PA |
|
|
|
|
|
|
|
|
|
2016(A) |
|||||||||||||||||||||||||||
|
CROSSROADS PLAZA |
PA |
|
|
|
|
|
|
|
|
|
1986(A) |
|||||||||||||||||||||||||||
|
DEVON VILLAGE |
PA |
|
|
|
|
|
|
|
|
|
2012(A) |
|||||||||||||||||||||||||||
|
FISHTOWN CROSSING |
PA |
|
|
|
|
|
|
|
|
|
2022(A) |
|||||||||||||||||||||||||||
|
FRANKFORD AVENUE S.C. |
PA |
|
|
|
|
|
|
|
|
|
1996(A) |
|||||||||||||||||||||||||||
|
HARRISBURG EAST SHOPPING CTR. |
PA |
|
|
|
|
|
|
|
|
|
2002(A) |
|||||||||||||||||||||||||||
|
HORSHAM POINT |
PA |
|
|
|
|
|
|
|
|
|
2015(A) |
|||||||||||||||||||||||||||
|
LINCOLN SQUARE |
PA |
|
|
|
|
|
|
|
|
|
2017(C) |
|||||||||||||||||||||||||||
|
NORRITON SQUARE |
PA |
|
|
|
|
|
|
|
|
|
1984(A) |
|||||||||||||||||||||||||||
|
POCONO PLAZA |
PA |
|
|
|
|
|
|
|
|
|
1973(C) |
|||||||||||||||||||||||||||
|
SHOPPES AT WYNNEWOOD |
PA |
|
|
|
|
|
|
|
|
|
2015(C) |
|||||||||||||||||||||||||||
|
SHREWSBURY SQUARE S.C. |
PA |
|
|
(
|
) |
|
|
|
|
|
|
2014(A) |
||||||||||||||||||||||||||
|
SPRINGFIELD S.C. |
PA |
|
|
|
|
|
|
|
|
|
1983(A) |
|||||||||||||||||||||||||||
|
SUBURBAN SQUARE |
PA |
|
|
|
|
|
|
|
|
|
2007(A) |
|||||||||||||||||||||||||||
|
TOWNSHIP LINE S.C. |
PA |
|
|
|
|
|
|
|
|
|
1996(A) |
|||||||||||||||||||||||||||
|
WAYNE PLAZA |
PA |
|
|
|
|
|
|
|
|
|
2008(A) |
|||||||||||||||||||||||||||
|
WEXFORD PLAZA |
PA |
|
|
|
|
|
|
|
|
|
2010(A) |
|||||||||||||||||||||||||||
|
WHITEHALL MALL |
PA |
|
|
|
|
|
|
|
|
|
1996(A) |
|||||||||||||||||||||||||||
|
WHITELAND TOWN CENTER |
PA |
|
|
|
|
|
|
|
|
|
1996(A) |
|||||||||||||||||||||||||||
|
WHOLE FOODS AT WYNNEWOOD |
PA |
|
|
|
|
|
|
|
|
|
2014(C) |
|||||||||||||||||||||||||||
|
LOS COLOBOS - BUILDERS SQUARE |
PR |
|
|
(
|
) |
|
|
|
|
|
|
2006(A) |
||||||||||||||||||||||||||
|
LOS COLOBOS - KMART |
PR |
|
|
(
|
) |
|
|
|
|
|
|
2006(A) |
||||||||||||||||||||||||||
|
LOS COLOBOS I |
PR |
|
|
|
|
|
|
|
|
|
2006(A) |
|||||||||||||||||||||||||||
|
LOS COLOBOS II |
PR |
|
|
|
|
|
|
|
|
|
2006(A) |
|||||||||||||||||||||||||||
|
MANATI VILLA MARIA SC |
PR |
|
|
|
|
|
|
|
|
|
2006(A) |
|||||||||||||||||||||||||||
|
PLAZA CENTRO - COSTCO |
PR |
|
|
(
|
) |
|
|
|
|
|
|
2006(A) |
||||||||||||||||||||||||||
|
PLAZA CENTRO - MALL |
PR |
|
|
|
|
|
|
|
|
|
2006(A) |
|||||||||||||||||||||||||||
|
PLAZA CENTRO - RETAIL |
PR |
|
|
|
|
|
|
|
|
|
2006(A) |
|||||||||||||||||||||||||||
|
PLAZA CENTRO - SAM'S CLUB |
PR |
|
|
(
|
) |
|
|
|
|
|
|
2006(A) |
||||||||||||||||||||||||||
|
PONCE TOWNE CENTER |
PR |
|
|
|
|
|
|
|
|
|
2006(A) |
|||||||||||||||||||||||||||
|
REXVILLE TOWN CENTER |
PR |
|
|
|
|
|
|
|
|
|
2006(A) |
|||||||||||||||||||||||||||
|
TRUJILLO ALTO PLAZA |
PR |
|
|
|
|
|
|
|
|
|
2006(A) |
|||||||||||||||||||||||||||
|
WESTERN PLAZA - MAYAGUEZ ONE |
PR |
|
|
|
|
|
|
|
|
|
2006(A) |
|||||||||||||||||||||||||||
|
WESTERN PLAZA - MAYAGUEZ TWO |
PR |
|
|
|
|
|
|
|
|
|
2006(A) |
|||||||||||||||||||||||||||
|
FOREST PARK |
SC |
|
|
|
|
|
|
|
|
|
2012(A) |
|||||||||||||||||||||||||||
|
ST. ANDREWS CENTER |
SC |
|
|
|
|
|
|
|
|
|
1978(C) |
|||||||||||||||||||||||||||
|
WESTWOOD PLAZA |
SC |
|
|
|
|
|
|
|
|
|
1995(A) |
|||||||||||||||||||||||||||
|
WOODRUFF SHOPPING CENTER |
SC |
|
|
|
|
|
|
|
|
|
2010(A) |
|||||||||||||||||||||||||||
|
HIGHLAND SQUARE |
TN |
|
|
|
|
|
|
|
|
|
2021(A) |
|||||||||||||||||||||||||||
|
MENDENHALL COMMONS |
TN |
|
|
(
|
) |
|
|
|
|
|
|
2021(A) |
||||||||||||||||||||||||||
|
OLD TOWNE VILLAGE |
TN |
|
|
|
|
|
|
|
|
|
1978(C) |
|||||||||||||||||||||||||||
|
THE COMMONS AT DEXTER LAKE |
TN |
|
|
|
|
|
|
|
|
|
2021(A) |
|||||||||||||||||||||||||||
|
THE COMMONS AT DEXTER LAKE II |
TN |
|
|
|
|
|
|
|
|
|
2021(A) |
|
1350 W. 43RD ST. - WELLS FARGO |
TX |
3,707 | 247 | 1 | 3,708 | 247 | 3,955 | 13 | 3,942 | - |
2022(A) |
|||||||||||||||||||||||||||
|
1934 WEST GRAY |
TX |
|
|
|
|
|
|
|
|
|
2021(A) |
|||||||||||||||||||||||||||
|
1939 WEST GRAY |
TX |
|
|
(
|
) |
|
|
|
|
|
|
2021(A) |
||||||||||||||||||||||||||
|
43RD STREET CHASE BANK BLDG |
TX |
|
|
|
|
|
|
|
|
|
2021(A) |
|||||||||||||||||||||||||||
|
ACCENT PLAZA |
TX |
|
|
|
|
|
|
|
|
|
1996(A) |
|||||||||||||||||||||||||||
|
ALABAMA SHEPHERD S.C. |
TX |
|
|
|
|
|
|
|
|
|
2021(A) |
|||||||||||||||||||||||||||
|
ATASCOCITA COMMONS SHOP.CTR. |
TX |
|
|
|
|
|
|
|
|
|
2013(A) |
|||||||||||||||||||||||||||
|
BAYBROOK GATEWAY |
TX |
|
|
|
|
|
|
|
|
|
2021(A) |
|||||||||||||||||||||||||||
|
BAYBROOK WEBSTER PARCEL |
TX |
|
|
|
|
|
|
|
|
|
2022(A) |
|||||||||||||||||||||||||||
|
BELLAIRE BLVD S.C. |
TX |
|
|
|
|
|
|
|
|
|
2021(A) |
|||||||||||||||||||||||||||
|
BLALOCK MARKET |
TX |
|
|
|
|
|
|
|
|
|
2021(A) |
|||||||||||||||||||||||||||
|
CENTER AT BAYBROOK |
TX |
|
|
|
|
|
|
|
|
|
1998(A) |
|||||||||||||||||||||||||||
|
CENTER OF THE HILLS |
TX |
|
|
|
|
|
|
|
|
|
2008(A) |
|||||||||||||||||||||||||||
|
CITADEL BUILDING |
TX |
|
|
|
|
|
|
|
|
|
2021(A) |
|||||||||||||||||||||||||||
|
CONROE MARKETPLACE |
TX |
|
|
(
|
) |
|
|
|
|
|
|
2015(A) |
||||||||||||||||||||||||||
|
COPPERFIELD VILLAGE SHOP.CTR. |
TX |
|
|
|
|
|
|
|
|
|
2015(A) |
|||||||||||||||||||||||||||
|
COPPERWOOD VILLAGE |
TX |
|
|
|
|
|
|
|
|
|
2015(A) |
|||||||||||||||||||||||||||
|
CYPRESS TOWNE CENTER |
TX |
|
|
|
|
|
|
|
|
|
2003(C) |
|||||||||||||||||||||||||||
|
CYPRESS TOWNE CENTER |
TX |
|
|
|
|
|
|
|
|
|
2016(A) |
|||||||||||||||||||||||||||
|
CYPRESS TOWNE CENTER (PHASE II) |
TX |
|
|
(
|
) |
|
|
|
|
|
|
2016(A) |
||||||||||||||||||||||||||
|
DRISCOLL AT RIVER OAKS-RESI |
TX |
|
|
|
|
|
|
|
|
|
2021(A) |
|||||||||||||||||||||||||||
|
FIESTA TARGET |
TX |
|
|
|
|
|
|
|
|
|
2021(A) |
|||||||||||||||||||||||||||
|
FIESTA TRAILS |
TX |
|
|
|
|
|
|
|
|
|
2021(A) |
|||||||||||||||||||||||||||
|
GALVESTON PLACE |
TX |
|
|
|
|
|
|
|
|
|
2021(A) |
|||||||||||||||||||||||||||
|
GATEWAY STATION |
TX |
|
|
|
|
|
|
|
|
|
2011(A) |
|||||||||||||||||||||||||||
|
GATEWAY STATION PHASE II |
TX |
|
|
|
|
|
|
|
|
|
2017(A) |
|||||||||||||||||||||||||||
|
GRAND PARKWAY MARKET PLACE II |
TX |
|
|
|
|
|
|
|
|
|
2015(C) |
|||||||||||||||||||||||||||
|
GRAND PARKWAY MARKETPLACE |
TX |
|
|
|
|
|
|
|
|
|
2014(C) |
|||||||||||||||||||||||||||
|
HEB - DAIRY ASHFORD & MEMORIAL |
TX |
|
|
|
|
|
|
|
|
|
2021(A) |
|||||||||||||||||||||||||||
|
HEIGHTS PLAZA |
TX |
|
|
|
|
|
|
|
|
|
2021(A) |
|||||||||||||||||||||||||||
|
INDEPENDENCE PLAZA - LAREDO |
TX |
|
|
|
|
|
|
|
|
|
2021(A) |
|||||||||||||||||||||||||||
|
INDEPENDENCE PLAZA II - LAREDO |
TX |
|
|
|
|
|
|
|
|
|
2021(A) |
|||||||||||||||||||||||||||
|
KROGER PLAZA |
TX |
|
|
|
|
|
|
|
|
|
1995(A) |
|||||||||||||||||||||||||||
|
LAKE PRAIRIE TOWN CROSSING |
TX |
|
|
|
|
|
|
|
|
|
2006(C) |
|||||||||||||||||||||||||||
|
LAS TIENDAS PLAZA |
TX |
|
|
|
|
|
|
|
|
|
2005(C) |
|||||||||||||||||||||||||||
|
MONTGOMERY PLAZA |
TX |
|
|
|
|
|
|
|
|
|
2015(A) |
|||||||||||||||||||||||||||
|
MUELLER OUTPARCEL |
TX |
|
|
|
|
|
|
|
|
|
2021(A) |
|||||||||||||||||||||||||||
|
MUELLER REGIONAL RETAIL CENTER |
TX |
|
|
|
|
|
|
|
|
|
2021(A) |
|||||||||||||||||||||||||||
|
NORTH CREEK PLAZA |
TX |
|
|
|
|
|
|
|
|
|
2021(A) |
|||||||||||||||||||||||||||
|
OAK FOREST |
TX |
|
|
|
|
|
|
|
|
|
2021(A) |
|||||||||||||||||||||||||||
|
PLANTATION CENTRE |
TX |
|
|
|
|
|
|
|
|
|
2021(A) |
|||||||||||||||||||||||||||
|
PRESTON LEBANON CROSSING |
TX |
|
|
|
|
|
|
|
|
|
2006(C) |
|||||||||||||||||||||||||||
|
RANDALLS CENTER/KINGS CROSSING |
TX |
|
|
|
|
|
|
|
|
|
2021(A) |
|||||||||||||||||||||||||||
|
RICHMOND SQUARE |
TX |
|
|
(
|
) |
|
|
|
|
|
|
2021(A) |
||||||||||||||||||||||||||
|
RIVER OAKS S.C. EAST |
TX |
|
|
|
|
|
|
|
|
|
2021(A) |
|||||||||||||||||||||||||||
|
RIVER OAKS S.C. WEST |
TX |
|
|
|
|
|
|
|
|
|
2021(A) |
|||||||||||||||||||||||||||
|
ROCK PRAIRIE MARKETPLACE |
TX |
|
|
(
|
) |
|
|
|
|
|
|
2021(A) |
||||||||||||||||||||||||||
|
SHOPPES AT MEMORIAL VILLAGES |
TX |
|
|
(
|
) |
|
|
|
|
|
|
2021(A) |
||||||||||||||||||||||||||
|
SHOPS AT HILSHIRE VILLAGE |
TX |
|
|
|
|
|
|
|
|
|
2021(A) |
|||||||||||||||||||||||||||
|
SHOPS AT KIRBY DRIVE |
TX |
|
|
(
|
) |
|
|
|
|
|
|
2021(A) |
||||||||||||||||||||||||||
|
SHOPS AT THREE CORNERS |
TX |
|
|
(
|
) |
|
|
|
|
|
|
2021(A) |
||||||||||||||||||||||||||
|
STEVENS RANCH |
TX |
|
|
|
|
|
|
|
|
|
2021(A) |
|||||||||||||||||||||||||||
|
THE CENTRE AT COPPERFIELD |
TX |
|
|
|
|
|
|
|
|
|
2015(A) |
|||||||||||||||||||||||||||
|
THE CENTRE AT POST OAK |
TX |
|
|
(
|
) |
|
|
|
|
|
|
2021(A) |
||||||||||||||||||||||||||
|
THE SHOPPES @ WILDERNESS OAKS |
TX |
|
|
(
|
) |
|
|
|
|
|
|
2021(A) |
||||||||||||||||||||||||||
|
TOMBALL CROSSINGS |
TX |
|
|
|
|
|
|
|
|
|
2013(A) |
|||||||||||||||||||||||||||
|
TOMBALL MARKETPLACE |
TX |
|
|
|
|
|
|
|
|
|
2021(A) |
|||||||||||||||||||||||||||
|
TRENTON CROSSING - NORTH MCALLEN |
TX |
|
|
|
|
|
|
|
|
|
2021(A) |
|||||||||||||||||||||||||||
|
VILLAGE PLAZA AT BUNKER HILL |
TX |
|
|
|
|
|
|
|
|
|
2021(A) |
|||||||||||||||||||||||||||
|
WESTCHASE S.C. |
TX |
|
|
|
|
|
|
|
|
|
2021(A) |
|||||||||||||||||||||||||||
|
WESTHILL VILLAGE |
TX |
|
|
|
|
|
|
|
|
|
2021(A) |
|||||||||||||||||||||||||||
|
WOODBRIDGE SHOPPING CENTER |
TX |
|
|
|
|
|
|
|
|
|
2012(A) |
|
BURKE TOWN PLAZA |
VA |
- | 43,240 | (5,257 | ) | - | 37,983 | 37,983 | 9,149 | 28,834 | - |
2014(A) |
||||||||||||||||||||||||||
|
CENTRO ARLINGTON |
VA |
|
|
|
|
|
|
|
|
|
2021(A) |
|||||||||||||||||||||||||||
|
CENTRO ARLINGTON-RESI |
VA |
|
|
|
|
|
|
|
|
|
2021(A) |
|||||||||||||||||||||||||||
|
DOCSTONE COMMONS |
VA |
|
|
|
|
|
|
|
|
|
2016(A) |
|||||||||||||||||||||||||||
|
DOCSTONE O/P - STAPLES |
VA |
|
|
(
|
) |
|
|
|
|
|
|
2016(A) |
||||||||||||||||||||||||||
|
DULLES TOWN CROSSING |
VA |
|
|
|
|
|
|
|
|
|
2015(A) |
|||||||||||||||||||||||||||
|
GORDON PLAZA |
VA |
|
|
|
|
|
|
|
|
|
2017(A) |
|||||||||||||||||||||||||||
|
HILLTOP VILLAGE CENTER |
VA |
|
|
|
|
|
|
|
|
|
2021(A) |
|||||||||||||||||||||||||||
|
OLD TOWN PLAZA |
VA |
|
|
(
|
) |
|
|
|
|
|
|
2007(A) |
||||||||||||||||||||||||||
|
POTOMAC RUN PLAZA |
VA |
|
|
|
|
|
|
|
|
|
2008(A) |
|||||||||||||||||||||||||||
|
STAFFORD MARKETPLACE |
VA |
|
|
|
|
|
|
|
|
|
2015(A) |
|||||||||||||||||||||||||||
|
WEST ALEX - RETAIL |
VA |
|
|
|
|
|
|
|
|
|
2021(A) |
|||||||||||||||||||||||||||
|
WEST ALEX-OFFICE |
VA |
|
|
|
|
|
|
|
|
|
2021(A) |
|||||||||||||||||||||||||||
|
WEST ALEX-RESI |
VA |
|
|
|
|
|
|
|
|
|
2021(A) |
|||||||||||||||||||||||||||
|
AUBURN NORTH |
WA |
|
|
|
|
|
|
|
|
|
2007(A) |
|||||||||||||||||||||||||||
|
COVINGTON ESPLANADE |
WA |
|
|
|
|
|
|
|
|
|
2021(A) |
|||||||||||||||||||||||||||
|
FRANKLIN PARK COMMONS |
WA |
|
|
|
|
|
|
|
|
|
2015(A) |
|||||||||||||||||||||||||||
|
FRONTIER VILLAGE SHOPPING CTR. |
WA |
|
|
|
|
|
|
|
|
|
2012(A) |
|||||||||||||||||||||||||||
|
GATEWAY SHOPPING CENTER |
WA |
|
|
|
|
|
|
|
|
|
2016(A) |
|||||||||||||||||||||||||||
|
SILVERDALE PLAZA |
WA |
|
|
|
|
|
|
|
|
|
2012(A) |
|||||||||||||||||||||||||||
|
THE MARKETPLACE AT FACTORIA |
WA |
|
|
|
|
|
|
|
|
|
2013(A) |
|||||||||||||||||||||||||||
|
THE WHITTAKER |
WA |
|
|
|
|
|
|
|
|
|
2021(A) |
|
OTHER PROPERTY INTERESTS |
||||||||||||||||||||||||||||||||||||||
|
ASANTE RETAIL CENTER |
AZ |
|
|
(
|
) |
|
|
|
|
|
|
2004(C) |
||||||||||||||||||||||||||
|
GLADDEN FARMS |
AZ |
|
|
|
|
|
|
|
|
|
2021(A) |
|||||||||||||||||||||||||||
|
HOMESTEAD-WACHTEL LAND LEASE |
FL |
|
|
|
|
|
|
|
|
|
2013(A) |
|||||||||||||||||||||||||||
|
PALM COAST LANDING OUTPARCELS |
FL |
|
|
|
|
|
|
|
|
|
2021(A) |
|||||||||||||||||||||||||||
|
LAKE WALES S.C. |
FL |
|
|
|
|
|
|
|
|
|
2009(A) |
|||||||||||||||||||||||||||
|
FLINT - VACANT LAND |
MI |
|
|
(
|
) |
|
|
|
|
|
|
2012(A) |
||||||||||||||||||||||||||
|
CHARLOTTE SPORTS & FITNESS CTR |
NC |
|
|
|
|
|
|
|
|
|
1986(A) |
|||||||||||||||||||||||||||
|
SURF CITY CROSSING |
NC |
|
|
(
|
) |
|
|
|
|
|
|
2021(A) |
||||||||||||||||||||||||||
|
THE SHOPPES AT CAVENESS FARMS |
NC |
|
|
|
|
|
|
|
|
|
2021(A) |
|||||||||||||||||||||||||||
|
WAKE FOREST CROSSING II - LAND ONLY |
NC |
|
|
|
|
|
|
|
|
|
2021(A) |
|||||||||||||||||||||||||||
|
WAKEFIELD COMMONS III |
NC |
|
|
(
|
) |
|
|
|
|
|
|
2001(C) |
||||||||||||||||||||||||||
|
WAKEFIELD CROSSINGS |
NC |
|
|
(
|
) |
|
|
|
|
|
|
2001(C) |
||||||||||||||||||||||||||
|
HILLSBOROUGH PROMENADE |
NJ |
|
|
(
|
) |
|
|
|
|
|
|
2001(C) |
||||||||||||||||||||||||||
|
JERICHO ATRIUM |
NY |
|
|
|
|
|
|
|
|
|
2016(A) |
|||||||||||||||||||||||||||
|
KEY BANK BUILDING |
NY |
|
|
(
|
) |
|
|
|
|
|
|
2006(A) |
||||||||||||||||||||||||||
|
MANHASSET CENTER (RESIDENTIAL) |
NY |
|
|
|
|
|
|
|
|
|
2012(A) |
|||||||||||||||||||||||||||
|
MERRY LANE (PARKING LOT) |
NY |
|
|
|
|
|
|
|
|
|
2007(A) |
|||||||||||||||||||||||||||
|
NORTHPORT LAND PARCEL |
NY |
|
|
|
|
|
|
|
|
|
2012(A) |
|||||||||||||||||||||||||||
|
MCMINNVILLE PLAZA |
OR |
|
|
|
|
|
|
|
|
|
2006(C) |
|||||||||||||||||||||||||||
|
COULTER AVE. PARCEL |
PA |
|
|
|
|
|
|
|
|
|
2015(A) |
|||||||||||||||||||||||||||
|
1935 WEST GRAY |
TX |
|
|
|
|
|
|
|
|
|
2021(A) |
|||||||||||||||||||||||||||
|
2503 MCCUE, LLC |
TX |
|
|
|
|
|
|
|
|
|
2021(A) |
|||||||||||||||||||||||||||
|
CULLEN BLVD. AND EAST OREM DR. |
TX |
|
|
|
|
|
|
|
|
|
2021(A) |
|||||||||||||||||||||||||||
|
NORTH TOWNE PLAZA - BROWNSVILLE |
TX |
|
|
|
|
|
|
|
|
|
2021(A) |
|||||||||||||||||||||||||||
|
RICHMOND SQUARE - PAD |
TX |
|
|
|
|
|
|
|
|
|
2021(A) |
|||||||||||||||||||||||||||
|
TEXAS CITY LAND |
TX |
|
|
|
|
|
|
|
|
|
2021(A) |
|||||||||||||||||||||||||||
|
WESTOVER SQUARE |
TX |
|
|
(
|
) |
|
|
|
|
|
|
2021(A) |
||||||||||||||||||||||||||
|
BLUE RIDGE |
Various |
|
|
(
|
) |
|
|
|
|
|
|
2005(A) |
||||||||||||||||||||||||||
|
BALANCE OF PORTFOLIO (4) |
Various |
|
|
(
|
) |
|
|
|
|
|
|
|||||||||||||||||||||||||||
|
TOTALS |
$ |
|
$ |
|
$ |
|
$ |
|
$ |
|
$ |
|
$ |
|
$ |
|
$ |
|
||||||||||||||||||||
|
( 1 ) |
The negative balance for costs capitalized subsequent to acquisition could include parcels/out-parcels sold, assets held-for-sale, provision for losses and/or demolition of part of a property for redevelopment. |
|
( 2 ) |
Includes fair market value of debt adjustments, net and deferred financing costs, net. |
|
( 3 ) |
Shopping center includes land held for development. |
|
( 4 ) |
Includes fixtures, leasehold improvements and other costs capitalized. |
Depreciation and amortization are provided on the straight-line method over the estimated useful lives of the assets as follows:
|
Buildings and building improvements (in years) |
|
to |
|
|||
|
Fixtures, building and leasehold improvements (including certain identified intangible assets) |
|
Terms of leases or useful lives, whichever is shorter | ||||
The aggregate cost for Federal income tax purposes was approximately $
The changes in total real estate assets for the years ended December 31, 2022, 2021 and 2020 are as follows:
|
2022 |
2021 |
2020 |
||||||||||
|
Balance, beginning of period |
$ |
|
$ |
|
$ |
|
||||||
|
Additions during period: |
||||||||||||
|
Acquisitions |
|
|
|
|||||||||
|
Improvements |
|
|
|
|||||||||
|
Transfers from unconsolidated joint ventures |
|
|
|
|||||||||
|
Deductions during period: |
||||||||||||
|
Sales and assets held-for-sale |
(
|
) |
(
|
) |
(
|
) | ||||||
|
Transfers to operating lease right-of-use assets, net |
|
|
|
|||||||||
|
Transfers to unconsolidated joint ventures |
|
(
|
) |
|
||||||||
|
Adjustment for fully depreciated assets |
(
|
) |
(
|
) |
(
|
) | ||||||
|
Adjustment of property carrying values |
(
|
) |
|
(
|
) | |||||||
|
Balance, end of period |
$ |
|
$ |
|
$ |
|
||||||
The changes in accumulated depreciation for the years ended December 31, 2022, 2021 and 2020 are as follows:
|
2022 |
2021 |
2020 |
||||||||||
|
Balance, beginning of period |
$ |
|
$ |
|
$ |
|
||||||
|
Additions during period: |
||||||||||||
|
Depreciation for year |
|
|
|
|||||||||
|
Deductions during period: |
||||||||||||
|
Sales and assets held-for-sale |
(
|
) |
(
|
) |
(
|
) | ||||||
|
Transfers to operating lease right-of-use assets, net |
|
|
|
|||||||||
|
Adjustment for fully depreciated assets/other |
(
|
) |
(
|
) |
(
|
) | ||||||
|
Balance, end of period |
$ |
|
$ |
|
$ |
|
||||||
Reclassifications:
Certain amounts in the prior period have been reclassified in order to conform with the current period's presentation.
|
SCHEDULE IV - MORTGAGE LOANS ON REAL ESTATE |
|||||||
|
As of December 31, 2022 |
|||||||
|
(in thousands) |
|
Description |
Interest Rate |
Final Maturity Date |
Periodic Payment Terms (a) |
Prior Liens |
Original Face Amount of Mortgages |
Carrying Amount of Mortgages (b) |
Principal Amount of Loans Subject to Delinquent Principal or Interest |
|||||||||||||||||||||
|
Mortgage Loans: |
||||||||||||||||||||||||||||
|
Retail |
||||||||||||||||||||||||||||
|
Lynwood, CA |
|
% |
Jun-25 |
I |
$ | - | $ |
|
$ |
|
$ | - | ||||||||||||||||
|
Jacksonville, FL |
|
% |
Nov-26 |
I |
- |
|
|
- | ||||||||||||||||||||
|
San Antonio, TX |
|
% |
Sep-27 |
I |
- |
|
|
- | ||||||||||||||||||||
|
Fairfax, VA |
|
% |
May-29 |
I |
- |
|
|
- | ||||||||||||||||||||
|
Euless, TX |
|
% |
Jun-29 |
I |
- |
|
|
- | ||||||||||||||||||||
|
Las Vegas, NV |
|
% |
May-33 |
I |
- |
|
|
- | ||||||||||||||||||||
|
Las Vegas, NV |
|
% |
Oct-53 |
I |
- |
|
|
- | ||||||||||||||||||||
|
Nonretail |
||||||||||||||||||||||||||||
|
Commack, NY |
|
% |
Oct-26 |
P&I |
- |
|
|
- | ||||||||||||||||||||
|
Melbourne, FL |
|
% |
Dec-30 |
P&I |
- |
|
|
- | ||||||||||||||||||||
|
Other Financing Loans: |
||||||||||||||||||||||||||||
|
Nonretail |
||||||||||||||||||||||||||||
|
Borrower A |
|
% |
Apr-23 |
P&I |
- |
|
|
- | ||||||||||||||||||||
|
Borrower B |
|
% |
Mar-31 |
P&I |
- |
|
|
- | ||||||||||||||||||||
|
Allowance for Credit losses: |
- | - |
(
|
) | - | |||||||||||||||||||||||
| $ | - | $ |
|
$ |
|
$ |
|
|||||||||||||||||||||
|
(a) I = Interest only; P&I = Principal & Interest. |
|
(b) The aggregate cost for Federal income tax purposes was approximately $
|
|
For a reconciliation of mortgage and other financing receivables from January 1, 2020 to December 31, 2022, see Footnote 12 of the Notes to the Consolidated Financial Statements included in this Form 10 -K. |
|
The Company feels it is not practicable to estimate the fair value of each receivable as quoted market prices are not available. |
|
The cost of obtaining an independent valuation on these assets is deemed excessive considering the materiality of the total receivables. |