KINGSTONE COMPANIES, INC.
10-Ks and 10-Qs
|
|
|
|
|
|
|
|
|
|
|
|
|
|
|
|
|
|
|
|
|
|
|
|
|
|
|
|
|
|
|
|
|
|
|
|
|
|
|
|
|
|
|
|
|
|
|
|
|
|
|
|
|
|
|
|
|
|
|
|
|
|
|
|
|
United
States Securities and Exchange Commission
Washington, D.C. 20549
FORM 10-K
(Mark
One)
|
☒
|
ANNUAL REPORT UNDER SECTION 13 OR 15(d) OF THE SECURITIES EXCHANGE
ACT OF 1934
|
|
|
FOR THE FISCAL YEAR ENDED DECEMBER 31, 2018
|
|
☐
|
TRANSITION REPORT PURSUANT TO SECTION 13 OR 15(d) OF THE SECURITIES
EXCHANGE ACT OF 1934
|
|
FOR
THE TRANSITION PERIOD
FROM
TO
|
|
|
Commission
File Number
0-1665
|
KINGSTONE COMPANIES, INC.
(Exact
name of registrant as specified in its charter)
|
Delaware
|
36-2476480
|
|
(State
or other jurisdiction of incorporation or
organization)
|
(I.R.S.
Employer Identification No.)
|
|
15 Joys Lane, Kingston, New York
|
12401
|
|
(Address
of principal executive offices)
|
(Zip
Code)
|
|
(845) 802-7900
|
|
(Registrant’s
telephone number, including area code)
|
Securities
registered pursuant to Section 12(b) of the Act:
|
Title
of each class
|
Name of
each exchange on which registered
|
|
Common Stock
|
Nasdaq
Global Select Market
|
Securities
registered pursuant to Section 12(g) of the Act:
None
Indicate
by check mark if the registrant is a well-known seasoned issuer, as
defined in Rule 405 of the Securities Act. Yes ☐ No
☒
Indicate
by check mark if the registrant is not required to file reports
pursuant to Section 13 or Section 15(d) of the Exchange Act. Yes
☐ No ☒
Indicate
by check mark whether the registrant (1) has filed all reports
required to be filed by Section 13 or 15(d) of the Securities
Exchange Act of 1934 during the preceding 12 months (or for such
shorter period that the registrant was required to file such
reports), and (2) has been subject to such filing requirements for
the past 90 days. Yes ☒ No ☐
Indicate
by check mark whether the registrant has submitted electronically,
every Interactive Data File required to be submitted and posted
pursuant to Rule 405 of Regulation S-T during the preceding 12
months (or for such shorter period that the registrant was required
to submit such files). Yes ☒ No ☐
Indicate
by check mark if disclosure of delinquent filers pursuant to Item
405 of Regulation S-K is not contained herein, and will not be
contained, to the best of registrant’s knowledge, in
definitive proxy or information statements incorporated by
reference in Part III of this Form 10-K or any amendment to this
Form 10-K. ☐
Indicate
by check mark whether the registrant is a large accelerated filer,
an accelerated filer, a non-accelerated filer, a smaller reporting
company or an emerging growth company. See the definitions of
“large accelerated filer,” “accelerated
filer,” “smaller reporting company,” and
“emerging growth company” in Rule 12b-2 of the Exchange
Act. (Check one):
|
Large
accelerated filer ☐
|
Accelerated
filer ☒
|
|
|
|
|
Non-accelerated
☐
|
Smaller
reporting company ☒
|
|
|
|
|
Emerging
growth company ☐
|
|
Indicate
by check mark whether the registrant is a shell company (as defined
in Rule 12b-2 of the Exchange Act). Yes ☐ No
☒
As of
June 30, 2018, the aggregate market value of the registrant’s
common stock held by non-affiliates of the registrant was
$163,449,432 based on the closing sale price as reported on the
Nasdaq Global Select Market. As of March 12, 2019, there were
10,760,042 shares of common stock outstanding.
DOCUMENTS INCORPORATED BY REFERENCE
None
INDEX
|
|
|
Page No.
|
|
|
1
|
|||
|
PART I
|
|
|
|
|
2
|
|||
|
19
|
|||
|
28
|
|||
|
28
|
|||
|
28
|
|||
|
28
|
|||
|
PART II
|
|
|
|
|
29
|
|||
|
29
|
|||
|
30
|
|||
|
61
|
|||
|
61
|
|||
|
61
|
|||
|
61
|
|||
|
65
|
|||
|
PART III
|
|
|
|
|
66
|
|||
|
71
|
|||
|
76
|
|||
|
78
|
|||
|
79
|
|||
|
PART IV
|
|
|
|
|
80
|
|||
|
81
|
|||
|
|
82
|
||
PART
I
Forward-Looking
S
tatements
This
Annual Report contains forward-looking statements within the
meaning of the Private Securities Litigation Reform Act of 1995.
The events described in forward-looking statements contained in
this Annual Report may not occur. Generally, these statements
relate to business plans or strategies, projected or anticipated
results or other consequences of our plans or strategies, projected
or anticipated results from acquisitions to be made by us, or
projections involving anticipated revenues, earnings, costs or
other aspects of our operating results. The words
“may,” “will,” “expect,”
“believe,” “anticipate,”
“project,” “plan,” “intend,”
“estimate,” and “continue,” and their
opposites and similar expressions are intended to identify
forward-looking statements. We caution you that these statements
are not guarantees of future performance or events and are subject
to a number of uncertainties, risks and other influences, many of
which are beyond our control, which may influence the accuracy of
the statements and the projections upon which the statements are
based. Factors which may cause actual results and outcomes to
differ materially from those contained in the forward-looking
statements include, but are not limited to the risks and
uncertainties discussed in Part I Item 1A of this Annual Report
under “Factors That May Affect Future Results and Financial
Condition.”
Any one
or more of these uncertainties, risks and other influences could
materially affect our results of operations and whether
forward-looking statements made by us ultimately prove to be
accurate. Our actual results, performance and achievements could
differ materially from those expressed or implied in these
forward-looking statements. We undertake no obligation to publicly
update or revise any forward-looking statements, whether from new
information, future events or otherwise except as required by
law.
1
ITEM
1.
B
USINESS
.
(a)
Business Development
General
As used
in this Annual Report on Form 10-K (the “Annual
Report”), references to the “Company,”
“we,” “us,” or “our” refer to
Kingstone Companies, Inc. (“Kingstone”) and its
subsidiaries.
We
offer property and casualty insurance products to individuals and
small businesses through our wholly owned subsidiary, Kingstone
Insurance Company (“KICO”), domiciled in the state of
New York. KICO is a licensed property and casualty insurance
company in New York, New Jersey, Connecticut, Massachusetts,
Pennsylvania, Rhode Island, Maine, and New Hampshire. KICO is
currently offering its property and casualty insurance products in
New York, New Jersey, Rhode Island, Massachusetts, and
Pennsylvania. Although in 2018 KICO wrote 93.7% of its direct
written premiums in New York, we believe that New Jersey,
Connecticut, Massachusetts, Pennsylvania, Rhode Island, Maine, and
New Hampshire will represent an increasing portion of the total
over the coming years.
Recent Developments
Developments During 2018
●
Expanded Licensing; Connecticut, Maine, and New Hampshire
Expansion
In
2018, KICO continued to expanded its regional capabilities by
obtaining a license to write insurance policies in Connecticut,
Maine, and New Hampshire. Also in 2018, KICO’s homeowners
insurance product was launched in Massachusetts. We anticipate
writing business in Connecticut and Maine, in 2019.
●
Increased Rate of Dividends Declared
In
February 2018, we increased the quarterly dividends on our common
stock from $.08 per share to $.10 per share.
Dividends of $.10
per share were declared on February 28, 2018, May 31, 2018, August
31, 2018, and November 30, 2018 which were paid on March 15, 2018,
June 15, 2018, September 14, 2018, and December 14, 2018,
respectively.
●
Reduced Reliance on Quota Share Reinsurance
Effective July 1,
2018, KICO reduced the ceding percentage for its personal lines
quota share reinsurance treaty from 20% to 10%. The reduction of
the quota share ceding percentage allows KICO to retain a higher
portion of its premiums and resultant expected
profits.
2
●
Increased Catastrophe Reinsurance Coverage
Effective July 1,
2018, KICO increased the top limit of its catastrophe reinsurance
coverage to $450,000,000, which equates to more than a 1-in-250
year storm event according to the primary industry catastrophe
model that we follow.
Developments During 2017
●
Public Offering of Common
Stock
In
January and February 2017, we sold a total of 2,692,500 newly
issued shares of common stock in an underwritten public offering at
a public offering price of $12.00 per share. We received net
proceeds from the public offering of approximately $30,137,000
after deducting underwriting discounts and commissions, and other
offering expenses. Concurrently, selling shareholders sold a total
of 700,000 shares of our common stock. On March 1, 2017, we used
$23,000,000 of the net proceeds from the offering to contribute
capital to KICO in support of our ratings upgrade plan and
anticipated growth, including geographic and product
expansion.
●
A.M. Best Rating
In
April 2017, A.M. Best upgraded our financial strength rating from
B++ (Good) to A- (Excellent). This upgrade means that KICO has
achieved its long-standing goal of becoming an A-rated carrier. The
upgrade has resulted in increased growth from existing agents and
additional opportunities with new agents and in new
markets.
●
Expanded
Licensing; New Jersey, Rhode Island, and Massachusetts
Expansion
In
2017, KICO expanded its ability to write property and casualty
insurance by obtaining a license to write insurance policies in
Massachusetts. Also in 2017, KICO’s homeowners insurance
products were launched in New Jersey and Rhode Island. We began
writing New Jersey homeowners business in May and Rhode Island
homeowners business in December.
●
Increased Rate of Dividends Declared
In May
2017, we increased the quarterly dividends on our common stock from
$.0625 per share to $.08 per share.
A
dividend of $.0625 per share was declared on February 7, 2017 and
was paid on March 15, 2017. Dividends of $.08 per share were
declared on May 10, 2017, August 9, 2017 and November 8, 2017 and
were paid on June 15, 2017, September 15, 2017, and December 15,
2017, respectively.
3
●
Reduced Reliance on Quota Share Reinsurance
Effective July 1,
2017, KICO reduced the ceding percentage for its personal lines
quota share reinsurance treaty from 40% to 20%. The reduction of
the quota share ceding percentage allows KICO to retain a higher
portion of its premiums and resultant expected
profits.
●
Increased Catastrophe Reinsurance Coverage
Effective July 1,
2017, KICO increased the top limit of its catastrophe reinsurance
coverage to $320,000,000, which equated, at that time, to more than
a 1-in-250 year storm event according to the primary industry
catastrophe model that we follow.
●
Member of the Federal Home Loan Bank of New York
(“FHLBNY”),
In July
2017, KICO became a member of the Federal Home Loan Bank of New
York (“FHLBNY”), which provides additional access to
liquidity. Members have access to a variety of flexible, low cost
funding through FHLBNY’s various credit products, enabling
members to customize advances. Advances are to be fully
collateralized; eligible collateral to pledge includes residential
and commercial mortgage backed securities, along with U.S. Treasury
and agency securities.
●
Public Debt Offering
On
December 19, 2017, we issued $30,000,000 of our 5.50% Senior
Unsecured Notes due December 30, 2022, in an underwritten public
offering. The net proceeds to us were approximately $29,122,000. On
December 20, 2017, we used $25,000,000 of the net proceeds from the
debt offering to contribute capital to KICO, to support additional
growth. The remainder of the net proceeds will be used for general
corporate purposes. Interest is payable semi-annually in arrears on
June 30 and December 30 of each year, beginning on June 30 2018 at
the rate of 5.50% per year from December 19, 2017.
(b)
Business
Property and Casualty Insurance
Overview
Property and
casualty insurance companies provide policies in exchange for
premiums paid by their customers (the “insureds”). An
insurance policy is a contract between the insurance company and
its insureds where the insurance company agrees to pay for losses
that are covered under the contract. Such contracts are subject to
legal interpretation by courts, sometimes involving legislative
rulings and/or arbitration. Property insurance generally covers the
financial consequences of accidental losses to the insured’s
property, such as a home and the personal property in it, or a
business owner’s building, inventory and equipment. Casualty
insurance (also referred to as liability insurance) generally
covers the financial consequences related to the legal liability of
an individual or an organization resulting from negligent acts and
omissions that cause bodily injury and/or property damage to a
third party. Claims for property coverage generally are reported
and settled in a relatively short period of time, whereas those for
casualty coverage may take many years to settle.
We
generate revenues from earned premiums, ceding commissions from
quota share reinsurance, net investment income generated from our
investment portfolio, and net realized gains and losses on
investment securities. We also collect a variety of policy
feesincluding installment fees, reinstatement fees, and
non-sufficient fund fees related to situations involving extended
premium payment plans. Earned premiums represent premiums received
from insureds, which are recognized as revenue over the period of
time that coverage is provided (i.e., ratably over the life of the
policy). All of our policies are 12 month policies; therefore, a
significant period of time can elapse between the receipt of
insurance premiums and the payment of claims. During this time,
KICO invests the premiums, earning investment income and generating
net realized and unrealized gains and losses on associated
investments.
4
Insurance companies
incur a significant amount of their total expenses from insured
losses, which are commonly referred to as claims. In settling
insured losses, various loss adjustment expenses
(“LAE”) are incurred such as insurance adjusters’
fees and legal expenses. In addition, insurance companies incur
policy acquisition expenses, such as commissions paid to producers,
premium taxes, and other expenses related to the underwriting
process, including their employees’ compensation and
benefits.
The key
measure of relative underwriting performance for an insurance
company is the combined ratio. An insurance company’s
combined ratio is calculated by taking the ratio of incurred loss
and LAE to earned premiums (the “loss and LAE ratio”)
and adding it to the ratio of policy acquisition and other
underwriting expenses to earned premiums (the “expense
ratio”). A combined ratio under 100% indicates that an
insurance company is generating an underwriting profit prior to the
impact of investment income. After considering investment income
and investment gains or losses, insurance companies operating at a
combined ratio of greater than 100% can also be
profitable.
Business; Strategy
We are
a multi-line regional property and casualty insurance company
writing business exclusively through retail and wholesale agents
and brokers (“producers”) appointed by our wholly owned
subsidiary, KICO. We are licensed to write insurance policies in
New York, New Jersey, Connecticut, Maine, Massachusetts, New
Hampshire, Pennsylvania, and Rhode Island.
We seek
to deliver an attractive return on capital and to provide
consistent earnings growth through underwriting profits and income
from our investment portfolio. Our goal is to allocate capital
efficiently to those lines of business that generate sustainable
underwriting profits and to avoid lines of business for which an
underwriting profit is not likely. Our strategy is to be the
preferred multi-line property and casualty insurance company for
selected producers in the geographic markets in which we operate.
We believe producers place profitable business with us because we
provide excellent, consistent service to insureds and claimants.
Producers also value our financial stability coupled with
competitive rate and commission structures. We offer a variety of
personal and commercial lines products that further differentiate
us from other companies that distribute through our selected
producers.
Our
principal objectives are to grow profitably while managing risk
through prudent use of reinsurance in order to strengthen our
capital base. We generate underwriting income through adequate
pricing of insurance policies and by effectively managing our other
underwriting and operating expenses. We are pursuing profitable
growth by increasing the volume of business that we write with
existing producers in existing markets, by developing new
geographic markets and producer relationships, and by introducing
niche products that are relevant to our producers and
insureds.
For the
year ended December 31, 2018, our gross written premiums totaled
$146.7 million, an increase of 20.7% from the $121.6 million in
gross written premium for the year ended December 31,
2017.
Product Lines
Our
product lines include the following:
Personal lines -
Our largest line of
business is personal lines, consisting of homeowners and dwelling
fire multi-peril, cooperative/condominiums, renters, and personal
umbrella policies. Personal lines policies accounted for 81.8% of
our gross written premiums for the year ended December 31,
2018.
5
Commercial liability -
We offer
businessowners policies that consist primarily of small business
retail, service and office risks with limited a residential
exposure. We also write artisan’s liability policies for
small independent contractors with seven or fewer employees.
In addition, we write special multi-peril policies for larger and
more specialized risks and businessowners risks, including those
with limited residential exposures. Further, we write commercial
umbrella policies above our supporting commercial lines policies.
Commercial lines policies accounted for 11.4% of our gross written
premiums for the year ended December 31, 2018.
Livery physical damage -
We write
for-hire vehicle physical damage only policies for livery and car
service vehicles and taxicabs, primarily based in New York City.
These policies insure only the physical damage portion of insurance
for such vehicles, with no liability coverage included. These
policies accounted for 6.7% of our gross written premiums for the
year ended December 31, 2018.
Other -
We write canine legal liability
policies and have a small participation in mandatory state joint
underwriting associations. These policies accounted for 0.1% of our
gross written premiums for the year ended December 31,
2018.
Our Competitive Strengths
History of Growing Our Profitable Operations
KICO
has been in operation in the State of New York for over 130 years.
We have consistently grown the amount of profitable business that
we write by introducing new products, increasing volume written
with our selected producers in existing markets, and developing new
producer relationships and markets. KICO has earned an underwriting
profit in each of the past ten years, including in 2012 and 2013
when our financial results were adversely impacted by Superstorm
Sandy. The extensive heritage of our insurance company subsidiary
and our commitment to the markets in which we operate is a
competitive advantage with producers and insureds.
Strong Producer Relationships
Within
our selected producers’ offices, we compete with other
property and casualty insurance carriers available to those
producers. We carefully select the producers that distribute our
insurance policies and continuously monitor and evaluate their
performance. We believe our insurance producers value their
relationships with us because we provide excellent, consistent
personal service coupled with competitive rates and commission
levels. We have consistently been rated by insurance producers as
above average in the important areas of underwriting, claims
handling and service. In the biennial performance surveys conducted
by the Professional Insurance Agents of New York and New Jersey of
its membership since 2010, KICO was rated as one of the top
performing insurance companies in New York, twice ranking as the
top rated carrier among all those surveyed. Our relationship with
Selected Producers was further strengthened by the A.M. Best
upgrade to a financial strength rating of A- (Excellent) in April
2017. This has allowed us to provide many producers with an A-
rated carrier option that was not previously available to them in
the markets where we operate.
We
offer our selected producers access to a variety of personal and
commercial lines products, including some that are unique to us.
Many of our producers write multiple lines of business with us
which is an advantage relative to competitors that are focused on a
single product. We provide a multi-policy discount on homeowners
policies in order to attract and retain more of this multi-line
business. We have had a consistent presence in the New York market
and our producers value the longevity of the relationship. We
believe that the excellent service provided to our selected
producers, our broad product offerings, and our consistent prices
and financial stability provide a strong foundation for continued
profitable growth.
6
Sophisticated Underwriting and Risk Management
Practices
We
believe that a significant underwriting advantage exists due to our
local market presence and expertise. Our underwriting process
evaluates and screens out certain risks based on property reports,
individual insurance scoring, and information collected from
physical property inspections and driving records. We maintain
certain policy exclusions that reduce our exposure to risks that
can create severe losses. We target a preferred risk profile in
order to reduce adverse selection from risks seeking the lowest
premiums and minimal coverage levels.
Our
underwriting procedures, premium rates and policy terms support the
underwriting profitability of our personal lines policies. We apply
premium surcharges for certain coastal properties and maintain
deductibles for hurricane-prone exposures in order to provide an
appropriate premium for the risk of loss. We manage coastal risk
exposure through use of individual catastrophe risk scoring and
prudent use of reinsurance.
Our
underwriting expertise and risk management practices enable us to
profitably write personal and commercial lines business in our
markets without the need for frequent rate adjustments, in contrast
to many of our competitors. We believe that consistency in rates
and availability of our insurance products are important factors in
maintaining our selected producer relationships.
Effective Utilization of Reinsurance
Our
reinsurance treaties allow us to limit our exposure to the
financial impact of catastrophe losses and to reduce our net
liability on individual risks. Our reinsurance program is
structured to enable us to grow our premium volume while
maintaining regulatory capital and other financial ratios within
thresholds used for regulatory oversight purposes.
Our
reinsurance program also provides income from ceding commissions
earned pursuant to quota share reinsurance contracts. The income we
earn from ceding commissions typically exceeds our fixed operating
costs, which consist of other underwriting expenses. Quota share
reinsurance treaties transfer a portion of the profit (or loss)
associated with the subject insurance policies to the reinsurers.
We believe that the continued reduction in our reliance on quota
share reinsurance could increase our overall net underwriting
profits
.
Scalable, Low-Cost Operations
We
focus on efficiently managing our expenses, and invest in tools and
processes that improve the effectiveness of underwriting risks and
processing claims. We evaluate the costs and benefits of each new
tool or process in order to achieve optimal results. While the
majority of our policies are written for risks in downstate New
York, our Kingston, New York location provides a low-cost operating
environment. We now have a dedicated customer service unit located
in Kingston that has significantly improved the speed at which we
respond to customers.
7
We
continue to invest in improving our online application and quoting
systems for our personal lines and commercial products. We have
leveraged a paperless workflow management and document storage tool
that has improved efficiency and reduced costs. In late 2017, we
introduced an online payment portal that provides the ability for
insureds to make payments and to view policy information for all of
our products in one location. Our ability to control the growth of
our operating and other expenses while expanding our operations and
growing revenue at a higher rate is a key component of our business
model and is important to our future financial
success.
Underwriting and Claims Management
Philosophy
Our
underwriting philosophy is to target niche risk segments for which
we have detailed expertise and can take advantage of market
conditions. We monitor results on a regular basis and our selected
producers are reviewed by management on at least a quarterly
basis.
We
believe that our rates are appropriately competitive with other
carriers in our target markets. We believe that rate
consistency and the reliable availability of our products is
important to producers. We do not seek to grow by competing
based solely upon price. We seek to develop long-term
relationships with our selected producers who understand and
appreciate the consistent path we have chosen. We carefully
underwrite our business utilizing industry claims databases,
insurance scoring reports, physical inspection of risks and other
individual risk underwriting tools. We write homeowners and
dwelling fire business in coastal markets and are cognizant of our
exposure to hurricanes. We have mitigated this risk through
appropriate catastrophe reinsurance and application of hurricane
deductibles. We handle claims fairly while ensuring that coverage
provisions and exclusions are properly applied. Our claims and
underwriting expertise supports our ability to grow our profitable
business.
Distribution
We
generate business through our relationships with over 500
producers. We carefully select our producers by evaluating numerous
factors such as their need for our products, premium production
potential, loss history with other insurance companies that they
represent, product and market knowledge, and agency size. We only
distribute through agents and have never sought to distribute our
products direct to the consumer. We monitor and evaluate the
performance of our producers through periodic reviews of volume and
profitability. Our senior executives are actively involved in
managing our producer relationships.
Each
producer is assigned to a personal and commercial lines underwriter
and the producer can call that underwriter directly on any matter.
We believe that the close relationship and personal service
received from with their underwriters is a principal reason
producers place their business with us. Our producers have access
to a KICO website portal that provides them the ability to quote
risks for various products and to review policy forms and
underwriting guidelines for all lines of business. We send out
frequent “Producer Grams” in order to inform our
producers of updates at KICO. In addition, we have an active
Producer Council, made up of 11 active producers, to advise us on
market developments; and we have at least one annual meeting with
all of our producers.
Competition; Market
The
insurance industry is highly competitive. We constantly assess and
make projections for the market conditions and prices for our
products, but we cannot fully know our profitability until all
claims have been reported and settled.
Our
policyholders are located primarily in the downstate regions of New
York State, but we are actively growing into other Northeast
markets, including New Jersey and Rhode Island during 2017 followed
by Massachusetts in 2018. In addition, we are licensed to write
insurance policies in Connecticut, Maine, New Hampshire and
Pennsylvania. We anticipate launching a homeowners product in
Connecticut and Maine in 2019. These new homeowners markets align
well with the niche markets that have generated profitable results
in New York, and we believe that our market expertise can be
effectively utilized in these new markets.
8
In
2017, KICO was the 15th largest writer of homeowners and dwelling
fire insurance in the State of New York, according to data compiled
by SNL Financial LLC. Based on the same data, in 2017, we had a
1.3% market share for this combined group of personal lines
property business. We compete with large national carriers as well
as regional and local carriers in the property and casualty
marketplace in New York and other states. We believe that many
national and regional carriers have chosen to limit their rate of
premium growth or to decrease their presence in Northeastern states
due to the relatively high coastal population and associated
catastrophe risk that exists in the region.
Given
present market conditions, we believe that we have the opportunity
to significantly expand the size of our personal and commercial
lines business in New York, New Jersey, and other northeastern
states in which we are licensed.
Loss and Loss Adjustment Expense Reserves
We are
required to establish reserves for incurred losses that are unpaid,
including reserves for claims and loss adjustment expenses
(“LAE”), which represent the expenses of settling and
adjusting those claims. These reserves are balance sheet
liabilities representing estimates of future amounts required to
pay losses and loss expenses for claims that have occurred at or
before the balance sheet date, whether already known to us or not
yet reported. We establish these reserves after considering all
information known to us as of the date they are
recorded.
Loss
reserves fall into two categories: case reserves for reported
losses and LAE associated with specific reported claims, and
reserves for losses and LAE that are incurred but not reported
(“IBNR”). We establish these two categories of loss
reserves as follows:
Reserves for reported losses
- When a
claim is received, we establish a case reserve for the estimated
amount of its ultimate settlement and its estimated loss expenses.
We establish case reserves based upon the known facts about each
claim at the time the claim is reported and we may subsequently
increase or reduce the case reserves as additional facts and
information about each claim develops.
IBNR reserves
- We also estimate and
establish reserves for loss and LAE amounts incurred but not
reported (“IBNR”). IBNR reserves are calculated in bulk
as an estimate of ultimate losses and LAE less reported losses and
LAE. There are two types of IBNR; the first is a provision for
claims that have occurred but are not yet reported or known. We
refer to this as ‘Pure’ IBNR, and due to the fact that
we write primarily quickly reported property lines of business,
this type of IBNR does not make up a large portion of KICO’s
total IBNR. The second type of IBNR is a provision for expected
future development on known claims, from the evaluation date until
the time claims are settled and closed. We refer to this as
‘Case Development’ IBNR and it makes up the majority of
the IBNR that KICO records. Ultimate losses driving the
determination of appropriate IBNR levels are projected by using
generally accepted actuarial techniques.
The
liability for loss and LAE represents our best estimate of the
ultimate cost of all reported and unreported losses that are unpaid
as of the balance sheet evaluation date. The liability for loss and
LAE is estimated on an undiscounted basis, using individual
case-basis valuations, statistical analyses and various actuarial
procedures. The projection of future claim payment and reporting is
based on an analysis of our historical experience, supplemented by
analyses of industry loss data. We believe that the reserves for
loss and LAE are adequate to cover the ultimate cost of losses and
claims to date. However, because of the uncertainty from various
sources, including changes in claims settlement patterns and
handling procedures, litigation trends, judicial decisions, and
economic conditions, actual loss experience may not conform to the
assumptions used in determining the estimated amounts for such
liabilities at the balance sheet date. As adjustments to these
estimates become necessary, they are reflected in the period in
which the estimates are changed. Because of the nature of the
business historically written, we believe that we have limited
exposure to asbestos and environmental claim
liabilities.
9
We
engage an independent external actuarial specialist (the
‘Appointed Actuary’) to opine on our recorded statutory
reserves. The Appointed Actuary estimates a range of ultimate
losses, along with a range and recommended central estimate of IBNR
reserve amounts. Our carried IBNR reserves are based on an internal
actuarial analysis and reflect management’s best estimate of
unpaid loss and LAE liabilities, and fall within the range of those
determined as reasonable by the Appointed Actuary.
See
“Management’s Discussion and Analysis of Financial
Condition and Results of Operations – Principal Revenue and
Expense Items” in Item 7 of this Annual Report and Note 2 and
Note 11 in the accompanying Financial Statements for additional
information and details regarding our LAE.
Reconciliation of Loss and Loss Adjustment Expenses
The
table below shows the reconciliation of loss and LAE on a gross and
net basis, reflecting changes in losses incurred and paid
losses:
|
|
Years
ended
|
|
|
|
December
31,
|
|
|
|
2018
|
2017
|
|
|
|
|
|
Balance at
beginning of period
|
$
48,799,622
|
$
41,736,719
|
|
Less
reinsurance recoverables
|
(16,748,908
)
|
(15,776,880
)
|
|
Net balance,
beginning of period
|
32,050,714
|
25,959,839
|
|
|
|
|
|
Incurred
related to:
|
|
|
|
Current
year
|
57,143,077
|
34,246,081
|
|
Prior
years
|
1,152,128
|
(60,544
)
|
|
Total
incurred
|
58,295,205
|
34,185,537
|
|
|
|
|
|
Paid related
to:
|
|
|
|
Current
year
|
34,025,387
|
18,194,860
|
|
Prior
years
|
15,794,673
|
9,899,802
|
|
Total
paid
|
49,820,060
|
28,094,662
|
|
|
|
|
|
Net balance
at end of period
|
40,525,859
|
32,050,714
|
|
Add
reinsurance recoverables
|
15,671,247
|
16,748,908
|
|
Balance at
end of period
|
$
56,197,106
|
$
48,799,622
|
Our claims reserving practices are designed to set
reserves that, in the aggregate, are adequate to pay all claims at
their ultimate settlement value.
Loss and Loss Adjustment Expenses Development
The
table below shows the net loss development of reserves held as of
each calendar year-end from 2008 through 2018.
The first section of the table reflects the
changes in our loss and LAE reserves after each subsequent calendar
year of development. The table displays the re-estimated values of
incurred losses and LAE at each succeeding calendar year-end,
including payments made during the years indicated. The second
section of the table shows by year the cumulative amounts of loss
and LAE payments, net of amounts recoverable from reinsurers, as of
the end of each succeeding year. An example with respect to the net
loss and LAE reserves of $6,001,000 as of December 31, 2009 is as
follows. By December 31, 2011 (two years later), $3,992,000 had
actually been paid in settlement of the claims that relate to
liabilities as of December 31, 2009.
The
re-estimated ultimate reserves for those claims as of December 31,
2011 (two years later) had grown to $6,393,000.
The
“cumulative redundancy (deficiency)” represents, as of
December 31, 2018, the difference between the latest re-estimated
liability and the amounts as originally estimated. A redundancy
means that the original estimate was higher than the current
estimate. A deficiency means that the current estimate is higher
than the original estimate. Estimates for the liabilities in place
as of more recent evaluation dates have developed more favorably
than those from older evaluation points, especially as a percentage
of the starting estimate.
10
|
(in thousands of
$)
|
2008
|
2009
|
2010
|
2011
|
2012
|
2013
|
2014
|
2015
|
2016
|
2017
|
2018
|
|
Reserve for loss and loss
adjustment expenses, net of reinsurance
recoverables
|
5,823
|
6,001
|
7,280
|
8,520
|
12,065
|
17,139
|
21,663
|
23,170
|
25,960
|
32,051
|
32,051
|
|
Net reserve estimated as of One
year later
|
6,119
|
6,235
|
7,483
|
9,261
|
13,886
|
18,903
|
21,200
|
23,107
|
25,899
|
33,203
|
|
|
Two years later
|
6,609
|
6,393
|
8,289
|
11,022
|
16,875
|
18,332
|
21,501
|
24,413
|
26,970
|
|
|
|
Three years
later
|
6,729
|
6,486
|
9,170
|
12,968
|
16,624
|
18,687
|
22,576
|
25,509
|
|
|
|
|
Four years
later
|
6,711
|
7,182
|
10,128
|
12,552
|
16,767
|
19,386
|
23,243
|
|
|
|
|
|
Five years
later
|
7,261
|
7,766
|
9,925
|
12,440
|
16,985
|
19,449
|
|
|
|
|
|
|
Six years later
|
7,727
|
7,602
|
9,932
|
12,367
|
16,959
|
|
|
|
|
|
|
|
Seven years
later
|
7,554
|
7,615
|
9,779
|
12,307
|
|
|
|
|
|
|
|
|
Eight years
later
|
7,511
|
7,455
|
9,676
|
|
|
|
|
|
|
|
|
|
Nine years
later
|
7,330
|
7,406
|
|
|
|
|
|
|
|
|
|
|
Ten years later
|
7,284
|
|
|
|
|
|
|
|
|
|
|
|
Net cumulative redundancy
(deficiency)
|
(1,461
)
|
(1,405
)
|
(2,396
)
|
(3,787
)
|
(4,894
)
|
(2,310
)
|
(1,580
)
|
(2,339
)
|
(1,010
)
|
(1,152
)
|
|
|
(in thousands of
$)
|
2008
|
2009
|
2010
|
2011
|
2012
|
2013
|
2014
|
2015
|
2016
|
2017
|
2018
|
|
Cumulative amount of reserve paid,
net of reinsurance recoverable through
|
|
|
|
|
|
|
|
|
|
|
|
|
One year later
|
2,533
|
2,307
|
3,201
|
3,237
|
4,804
|
6,156
|
8,500
|
8,503
|
9,900
|
15,795
|
|
|
Two years later
|
3,974
|
3,992
|
4,947
|
5,661
|
8,833
|
10,629
|
12,853
|
14,456
|
17,187
|
|
|
|
Three years
later
|
5,054
|
4,659
|
6,199
|
8,221
|
11,873
|
13,571
|
16,564
|
19,533
|
|
|
|
|
Four years
later
|
5,373
|
5,238
|
7,737
|
10,100
|
13,785
|
16,166
|
19,838
|
|
|
|
|
|
Five years
later
|
5,717
|
5,997
|
8,585
|
10,903
|
15,479
|
17,262
|
|
|
|
|
|
|
Six years later
|
6,224
|
6,562
|
8,941
|
11,417
|
15,882
|
|
|
|
|
|
|
|
Seven years
later
|
6,718
|
6,749
|
9,275
|
11,725
|
|
|
|
|
|
|
|
|
Eight years
later
|
6,853
|
7,022
|
9,559
|
|
|
|
|
|
|
|
|
|
Nine years
later
|
7,103
|
7,298
|
|
|
|
|
|
|
|
|
|
|
Ten years later
|
7,190
|
|
|
|
|
|
|
|
|
|
|
|
|
|
|
|
|
|
|
|
|
|
|
|
|
Net reserve -
|
|
|
|
|
|
|
|
|
|
|
|
|
December 31,
|
5,823
|
6,001
|
7,280
|
8,520
|
12,065
|
17,139
|
21,663
|
23,170
|
25,960
|
32,051
|
40,526
|
|
* Reinsurance
Recoverable
|
9,766
|
10,512
|
10,432
|
9,960
|
18,420
|
17,364
|
18,250
|
16,707
|
15,777
|
16,749
|
15,671
|
|
* Gross reserves
-
|
|
|
|
|
|
|
|
|
|
|
|
|
December
31,
|
15,589
|
16,513
|
17,712
|
18,480
|
30,485
|
34,503
|
39,913
|
39,877
|
41,737
|
48,800
|
56,197
|
|
|
|
|
|
|
|
|
|
|
|
|
|
|
Net re-estimated
reserve
|
7,284
|
7,406
|
9,676
|
12,307
|
16,959
|
19,449
|
23,243
|
25,509
|
26,970
|
33,203
|
|
|
Re-estimated reinsurance
recoverable
|
12,503
|
12,506
|
13,154
|
13,797
|
28,355
|
21,048
|
21,231
|
18,810
|
17,285
|
16,852
|
|
|
Gross re-estimated
reserve
|
19,787
|
19,912
|
22,830
|
26,104
|
45,314
|
40,497
|
44,474
|
44,319
|
44,255
|
50,055
|
|
|
|
|
|
|
|
|
|
|
|
|
|
|
|
Gross cumulative redundancy
(deficiency)
|
(4,198
)
|
(3,399
)
|
(5,118
)
|
(7,624
)
|
(14,829
)
|
(5,994
)
|
(4,561
)
|
(4,442
)
|
(2,518
)
|
(1,255
)
|
|
We
purchase reinsurance to reduce our net liability on individual
risks, to protect against possible catastrophes, to remain within a
target ratio of net premiums written to policyholders’
surplus, and to expand our underwriting capacity. Participation in
reinsurance arrangements does not relieve us from our obligations
to policyholders. Our reinsurance program is structured to reflect
our obligations and goals.
11
Reinsurance
via quota share allows a carrier to write business without
increasing its underwriting leverage above a level determined by
management. The business written under a quota share
reinsurance structure obligates a reinsurer to assume some portion
of the risks involved, and gives the reinsurer the profit (or loss)
associated with such in exchange for a ceding commission. We
have determined it to be in the best interests of our shareholders
to prudently reduce our reliance on quota share reinsurance.
This will result in higher earned premiums and a reduction in
ceding commission revenue in future years but will allow us to
retain more net income from our profitable business.
Our quota share reinsurance treaties in effect for
the year ended December 31, 2018 for our personal lines business,
which primarily consists of homeowners policies, were covered under
the July 1, 2017/June 30, 2018 treaty year and the new treaty year
that began on July 1, 2018 (“2017/2019 Treaty”) (two
year treaty). I
n August 2018, we terminated our contract
with one of the reinsurers that was a party to the 2017/2019
Treaty. This termination was retroactive to July 1, 2018 and had
the effect of reducing the quota share ceding rate to 10% from
20%.
Excess of loss contracts provide coverage for
individual loss occurrences exceeding a certain threshold. The
quota share reinsurance treaties inure to the benefit of our excess
of loss treaties, as the maximum net retention on any single risk
occurrence is first limited through the excess of loss treaty, and
then that loss is shared again through the quota share reinsurance
treaty. Our maximum net retention under the quota share and excess
of loss treaties for any one personal lines occurrence for dates of
loss on or after July 1, 2018 is $900,000. Commercial lines
policies are not subject to a quota share reinsurance treaty. Our
maximum net retention under the excess of loss treaties for any one
commercial general liability occurrence for dates of loss on or
after July 1, 2018 is $750,000.
We
earn ceding commission revenue under the quota share reinsurance
treaties based on a provisional commission rate on all premiums
ceded to the reinsurers as adjusted by a sliding scale based on the
ultimate treaty year loss ratios on the policies reinsured under
each agreement. The sliding scale provides minimum and maximum
ceding commission rates in relation to specified ultimate loss
ratios.
Under
the 2017/2019 Treaty and 2016/2017 Treaty, KICO is receiving a
higher upfront fixed provisional rate than in prior years’
treaties. In exchange for the higher provisional rate, KICO has a
reduced opportunity to earn sliding scale contingent
commissions.
The
2017/2019 Treaty and the 2016/2017 Treaty are on a
“net” of catastrophe reinsurance basis, as opposed to
the “gross” arrangement that existed in prior treaties.
Under a “net” arrangement, all catastrophe reinsurance
coverage is purchased directly by us. Since we pay for all of the
catastrophe coverage, none of the losses covered under a
catastrophic event will be included in the quota share ceded
amounts, drastically reducing the adverse impact that a
catastrophic event can have on ceding commissions.
In
2018, we purchased catastrophe reinsurance to provide coverage of
up to $450,000,000 for losses associated with a single event. One
of the most commonly used catastrophe forecasting models prepared
for us indicates that the catastrophe reinsurance treaties provide
coverage in excess of our estimated probable maximum loss
associated with a single more than one-in-250 year storm event. The
direct retention for any single catastrophe event is $5,000,000.
Effective July 1, 2018 losses on personal lines policies are
subject to the 10% quota share treaty, which results in a net
retention by us of $4,500,000 of exposure per catastrophe
occurrence. Effective July 1, 2018, we have reinstatement premium
protection on the first $210,000,000 layer of catastrophe coverage
in excess of $5,000,000. This protects us from having to pay an
additional premium to reinstate catastrophe coverage for an event
up to this level.
12
Investments
Our
investment portfolio, including cash and cash equivalents, and
short term investments, as of December 31, 2018 and 2017, is
summarized in the table below by type of investment.
|
|
December 31,
2018
|
December 31,
2017
|
||
|
|
Carrying
|
% of
|
Carrying
|
% of
|
|
Category
|
Value
|
Portfolio
|
Value
|
Portfolio
|
|
|
|
|
|
|
|
Cash
and cash equivalents
|
$
21,138,403
|
10.8
%
|
$
48,381,633
|
25.8
%
|
|
|
|
|
|
|
|
Held
to maturity
|
|
|
|
|
|
U.S.
Treasury securities and
|
|
|
|
|
|
obligations
of U.S. government
|
|
|
|
|
|
corporations
and agencies
|
729,507
|
0.4
%
|
729,466
|
0.4
%
|
|
|
|
|
|
|
|
Political
subdivisions of states,
|
|
|
|
|
|
territories
and possessions
|
998,803
|
0.5
%
|
998,984
|
0.5
%
|
|
|
|
|
|
|
|
Corporate
and other bonds
|
|
|
|
|
|
Industrial
and miscellaneous
|
2,494,545
|
1.3
%
|
3,141,358
|
1.7
%
|
|
|
|
|
|
|
|
Available
for sale
|
|
|
|
|
|
U.S.
Treasury securities and
|
|
|
|
|
|
obligations
of U.S. government
|
|
|
|
|
|
corporations
and agencies
|
8,220,381
|
4.2
%
|
-
|
0.0
%
|
|
|
|
|
|
|
|
Political
subdivisions of states,
|
|
|
|
|
|
territories
and possessions
|
6,341,608
|
3.2
%
|
11,315,443
|
6.0
%
|
|
|
|
|
|
|
|
Corporate
and other bonds
|
|
|
|
|
|
Industrial
and miscellaneous
|
115,750,293
|
59.2
%
|
88,141,465
|
47.0
%
|
|
|
|
|
|
|
|
Residential
mortgage backed securities
|
21,465,234
|
11.0
%
|
20,531,348
|
10.9
%
|
|
|
|
|
|
|
|
Other
|
|
|
|
|
|
Preferred
stocks
|
6,152,956
|
3.1
%
|
7,000,941
|
3.7
%
|
|
|
|
|
|
|
|
Common
stocks
|
10,419,660
|
5.3
%
|
7,285,257
|
3.9
%
|
|
|
|
|
|
|
|
Other
investments
|
1,855,225
|
1.0
%
|
-
|
0.0
%
|
|
Total
|
$
195,566,615
|
100.0
%
|
$
187,525,895
|
100.0
%
|
13
The table below summarizes the credit quality of our fixed-maturity
securities available-for-sale as of December 31, 2018 and 2017 as
rated by Standard and Poor’s (or if unavailable from Standard
and Poor’s, then Moody’s or Fitch):
|
|
December 31,
2018
|
December 31,
2017
|
||
|
|
Estimated
|
Percentage
of
|
Estimated
|
Percentage
of
|
|
|
Fair
Market
|
Fair
Market
|
Fair
Market
|
Fair
Market
|
|
|
Value
|
Value
|
Value
|
Value
|
|
|
|
|
||
|
Rating
|
|
|
|
|
|
U.S.
Treasury securities
|
$
8,220,381
|
5.4
%
|
$
-
|
0.0
%
|
|
|
|
|
|
|
|
Corporate
and municipal bonds
|
|
|
|
|
|
AAA
|
979,123
|
0.6
%
|
1,358,143
|
1.1
%
|
|
AA
|
8,350,910
|
5.5
%
|
11,319,057
|
9.4
%
|
|
A
|
27,665,961
|
18.2
%
|
17,199,631
|
14.3
%
|
|
BBB
|
85,095,907
|
56.1
%
|
68,704,768
|
57.3
%
|
|
BB
|
-
|
0.0
%
|
875,310
|
0.7
%
|
|
Total
corporate and municipal bonds
|
122,091,901
|
80.4
%
|
99,456,909
|
82.8
%
|
|
|
|
|
|
|
|
Residential
mortgage backed securities
|
|
|
|
|
|
AAA
|
999,640
|
0.7
%
|
2,013,010
|
1.7
%
|
|
AA
|
12,743,906
|
8.5
%
|
11,021,144
|
9.2
%
|
|
A
|
4,777,356
|
3.1
%
|
3,902,768
|
3.3
%
|
|
CCC
|
1,440,825
|
0.9
%
|
1,420,296
|
1.2
%
|
|
CC
|
109,648
|
0.1
%
|
120,742
|
0.1
%
|
|
C
|
24,050
|
0.0
%
|
28,963
|
0.0
%
|
|
D
|
390,542
|
0.3
%
|
1,659,479
|
1.4
%
|
|
Non
rated
|
979,267
|
0.6
%
|
364,945
|
0.3
%
|
|
Total
residential mortgage backed securities
|
21,465,234
|
14.2
%
|
20,531,347
|
17.2
%
|
|
|
|
|
|
|
|
Total
|
$
151,777,516
|
100.0
%
|
$
119,988,256
|
100.0
%
|
See
“Management’s Discussion and Analysis of Financial
Condition and Results of Operations – Principal Revenue and
Expense Items” in Item 7 of this Annual Report and Note 2 and
Note 11 in the accompanying Financial Statements for additional
information.
Ratings
Many
insurance buyers, agents, brokers and secured lenders use the
ratings assigned by A.M. Best and other agencies to assist them in
assessing the financial strength and overall quality of the
companies with which they do business and from which they are
considering purchasing insurance or in determining the financial
strength of the company that provides insurance with respect to the
collateral they hold. A.M. Best financial strength ratings are
derived from an in-depth evaluation of an insurance company’s
balance sheet strengths, operating performances and business
profiles. A.M. Best evaluates, among other factors, the
company’s capitalization, underwriting leverage, financial
leverage, asset leverage, capital structure, quality and
appropriateness of reinsurance, adequacy of reserves, quality and
diversification of assets, liquidity, profitability, spread of
risk, revenue composition, market position, management, market risk
and event risk. A.M. Best financial strength ratings are intended
to provide an independent opinion of an insurer’s ability to
meet its obligations to policyholders and are not an evaluation
directed at investors.
14
In
November 2016, we commenced a plan of action to upgrade
KICO’s A.M. Best rating. In April 2017, A.M. Best upgraded
the Financial Strength Rating (FSR) of KICO to A- (Excellent) from
B++ (Good). The A.M. Best financial strength rating of A-
(Excellent) has created significant additional demand from our
existing producers, particularly for our New York homeowners
business where we compete against many carriers that are not A-
rated by A.M. Best. Other ratings assigned to KICO and Kingstone by
A.M. Best and Kroll Bond Rating Agency are as follows:
|
|
|
|
Kingstone
|
|
|
KICO
|
|
Companies
|
|
|
|
|
|
|
A.M. Best Long-Term issuer credit rating (ICR)
|
a- (stable outlook)
|
|
bbb- (stable outlook)
|
|
A.M. Best Long-Term issue credit rating (IR)
|
|
|
|
|
$30.0
million, 5.50% senior unsecured notes due Dec. 30,
2022
|
n/a
|
|
bbb- (stable outlook)
|
|
Kroll Bond Rating Agency insurance financial strength rating
(IFSR)
|
A- (stable outlook)
|
|
n/a
|
|
Kroll Bond Rating Agency issuer rating
|
n/a
|
|
BBB- (stable outlook)
|
|
$30.0
million, 5.50% senior unsecured notes due Dec. 30,
2022
|
n/a
|
|
BBB- (stable outlook)
|
KICO
also has a Demotech financial stability rating of A (Exceptional)
which generally makes its policies acceptable to mortgage lenders
that require homeowners to purchase insurance from highly rated
carriers.
Catastrophe Losses
In 2018
we had catastrophe losses, which are defined as losses from an
event for which a catastrophe bulletin and related serial number
has been issued by the Property Claims Services (PCS) unit of the
Insurance Services Office (ISO). PCS catastrophe bulletins are
issued for events that cause more than $25 million in total insured
losses and affect a significant number of policyholders and
insurers. Our predominant market, downstate New York, was affected
by several events, including one large event during the winter of
2018
. These claims were primarily from
losses due to frozen pipes and related water damage resulting from
abnormally low temperatures for an extended period.
The
effects of this catastrophe and other minor catastrophes during the
year increased our net loss ratio by 6.0 percentage points in 2018.
During the relatively mild winter of 2017, there was no catastrophe
impact from large storm events.
Government Regulation
Holding Company Regulation
We,
as the parent of KICO, are subject to the insurance holding company
laws of the state of New York. These laws generally require an
insurance company to register with the New York State Department of
Financial Services (the “DFS”) and to furnish annually
financial and other information about the operations of companies
within our holding company system. Generally, under these laws, all
material transactions among companies in the holding company system
to which KICO is a party must be fair and reasonable and, if
material or of a specified category, require prior notice and
approval or acknowledgement (absence of disapproval) by the
DFS.
Change of Control
The
insurance holding company laws of the state of New York require
approval by the DFS for any change of control of an insurer.
“Control” is generally defined as the possession,
direct or indirect, of the power to direct or cause the direction
of the management and policies of the company, whether through the
ownership of voting securities, by contract or otherwise. Control
is generally presumed to exist through the direct or indirect
ownership of 10% or more of the voting securities of a domestic
insurance company or any entity that controls a domestic insurance
company. Any future transactions that would constitute a change of
control of KICO, including a change of control of Kingstone
Companies, Inc., would generally require the party acquiring
control to obtain the approval of the DFS (and in any other state
in which KICO may operate). Obtaining these approvals may result in
the material delay of, or deter, any such transaction. These laws
may discourage potential acquisition proposals and may delay, deter
or prevent a change of control of Kingstone Companies, Inc.,
including through transactions, and in particular unsolicited
transactions, that some or all of our stockholders might consider
to be desirable.
15
State Insurance Regulation
Insurance
companies are subject to regulation and supervision by the
department of insurance in the state in which they are domiciled
and, to a lesser extent, other states in which they conduct
business. The primary purpose of such regulatory powers is to
protect individual policyholders. State insurance authorities have
broad regulatory, supervisory and administrative powers, including,
among other things, the power to grant and revoke licenses to
transact business, set the standards of solvency to be met and
maintained, determine the nature of, and limitations on,
investments and dividends, approve policy forms and rates, and in
some instances to regulate unfair trade and claims
practices.
KICO
is required to file detailed financial statements and other reports
with the insurance regulatory authorities in the states in which it
is licensed to transact business. These financial statements are
subject to periodic examination by the insurance
regulators.
In
addition, many states have laws and regulations that limit an
insurer’s ability to withdraw from a particular market. For
example, states may limit an insurer’s ability to cancel or
not renew policies. Furthermore, certain states prohibit an insurer
from withdrawing from one or more lines of business written in the
state, except pursuant to a plan that is approved by the insurance
regulatory authority. The state regulator may reject a plan that
may lead to market disruption. Laws and regulations, including
those in New York, that limit cancellation and non-renewal and that
subject program withdrawals to prior approval requirements may
restrict the ability of KICO to exit unprofitable markets. Such
laws did not affect KICO’s ability to withdraw from the
commercial auto market in New York State in 2015. On January 29,
2019, KICO was granted permission by the Texas Department of
Insurance to withdraw from the Texas insurance market for which it
never commenced business since receiving its certificate of
authority in August 2015.
Federal and State Legislative and Regulatory Changes
From
time to time, various regulatory and legislative changes have been
proposed in the insurance industry. Among the proposals that either
have been or are being considered are the possible introduction of
Federal regulation in addition to, or in lieu of, the current
system of state regulation of insurers, and proposals in various
state legislatures. Some of these proposals have been enacted to
conform portions of their insurance laws and regulations to various
model acts adopted by the National Association of Insurance
Commissioners (the “NAIC”).
In
2017, the DFS implemented new comprehensive cybersecurity
regulations, which became effective on March 1, 2017 with
transitional implementation periods. When fully implemented, in
March 1, 2019, the regulations require covered entities, including
KICO, to establish a cybersecurity policy, a chief information
security officer, oversight over third party service providers,
penetration and vulnerability assessments, secure systems to
maintain an audit trail, risk assessments to include access
privileges to nonpublic information, use of multi-factor
authentication, and an incident response plan, among other
provisions. Commencing February 15, 2018, and annually thereafter,
KICO must certify compliance to the DFS with the applicable
cybersecurity regulatory provisions.
16
In
2010 the Dodd-Frank Wall Street Reform and Consumer Protection Act
(the “Dodd-Frank Act”) became law. It established a
Federal Insurance Office (the “FIO”) within the U.S.
Department of the Treasury. The FIO is initially charged with
monitoring all aspects of the insurance industry (other than health
insurance, certain long-term care insurance and crop insurance),
gathering data, and conducting a study on methods to modernize and
improve the insurance regulatory system in the United States. In
December 2013, the FIO issued a report (as required under the
Dodd-Frank Act) entitled “How to Modernize and Improve the
System of Insurance Regulation in the United States” (the
“Report”), which stated that, given the
“uneven” progress the states have made with several
near-term state reforms, should the states fail to accomplish the
necessary modernization reforms in the near term, “Congress
should strongly consider direct federal involvement.” The FIO
continues to support the current state-based regulatory regime, but
will consider federal regulation should the states fail to take
steps to greater uniformity (e.g., federal licensing of insurers).
In 2017, the new President indicated that the provisions of this
law should be reviewed. In its September 2018 Annual Report on the
Insurance Industry (the “Report”), FIO provided an
overview of its statutory responsibilities and its role, as
described in the October 2017 Treasury report, A Financial System
That Creates Economic Opportunities: Asset Management and Insurance
(the “EO Report”). The Report then summarizes
FIO’s key activities since those described in its 2017 Annual
Report on the Insurance Industry. Next, the Report provides a
summary of the EO Report. Sections II through V are organized
around the four key themes from the EO Report: (1) Systemic Risk
and Solvency; (2) Efficient Regulation and Government Processes;
(3) International Engagement; and (4) Economic Growth and Informed
Choices. The Report concludes with a discussion and analysis of the
insurance industry’s financial performance in calendar year
2017, its financial condition as of December 31, 2017, and the
domestic insurance market outlook for 2018.
On
December 22, 2017, President Donald Trump signed into law a budget
reconciliation act commonly referred to as the Tax Cuts and Jobs
Act (TCJA). Overall, the reduction of the U.S. corporate tax rate
to 21 percent will generally lower the effective tax rates of
insurance companies operating in the United States.
State Regulatory Examinations
As
part of their regulatory oversight process, state regulatory
authorities conduct periodic detailed examinations of the financial
reporting of insurance companies domiciled in their states,
generally once every three to five years. Examinations are
generally carried out in cooperation with the insurance regulators
of other states under guidelines promulgated by the NAIC. The New
York DFS commenced its examination of KICO in 2016 as of December
31, 2015. The examination was completed in 2017 without any
material adverse findings.
Risk-Based Capital Regulations
State
regulatory authorities impose risk-based capital
(“RBC”) requirements on insurance enterprises. The RBC
Model serves as a benchmark for the regulation of insurance
companies. RBC provides for targeted surplus levels based on
formulas, which specify various weighting factors that are applied
to financial balances or various levels of activity based on the
perceived degree of risk, and are set forth in the RBC
requirements. Such formulas focus on four general types of risk:
(a) the risk with respect to the company’s assets (asset
or default risk); (b) the risk of default on amounts due from
reinsurers, policyholders, or other creditors (credit risk);
(c) the risk of underestimating liabilities from business
already written or inadequately pricing business to be written in
the coming year (underwriting risk); and (d) the risk
associated with items such as excessive premium growth, contingent
liabilities, and other items not reflected on the balance sheet
(off-balance sheet risk). The amount determined under such formulas
is called the authorized control level RBC
(“ACL”).
The
RBC guidelines define specific capital levels based on a
company’s ACL that are determined by the ratio of the
company’s total adjusted capital (“TAC”) to its
ACL. TAC is equal to statutory capital, plus or minus certain other
specified adjustments. KICO’s TAC is far above the ACL and is
in compliance with New York’s RBC requirements as of December
31, 2018.
Dividend Limitations
Our ability to receive dividends from KICO is
restricted by the state laws and insurance regulations of New York.
These restrictions are related to surplus and net investment
income.
Dividends are restricted to the lesser of 10% of
surplus or 100% of investment income (on a statutory accounting
basis) for the trailing 36 months, less dividends by KICO paid
during such period.
17
Insurance Regulatory Information System Ratios
The
Insurance Regulatory Information System (“IRIS”) was
developed by the NAIC and is intended primarily to assist state
insurance regulators in meeting their statutory mandates to oversee
the financial condition of insurance companies operating in their
respective states. IRIS identifies thirteen industry ratios and
specifies “usual values” for each ratio. Departure from
the usual values on four or more of the ratios can lead to
inquiries from individual state insurance commissioners as to
certain aspects of an insurer’s business. As of December 31,
2018, KICO did not have any ratios outside the usual
range.
Accounting Principles
Statutory
accounting principles (“SAP”) are a basis of accounting
developed by the NAIC. They are used to prepare the statutory
financial statements of insurance companies and to assist insurance
regulators in monitoring and regulating the solvency of insurance
companies. SAP is primarily concerned with measuring an
insurer’s policyholder surplus. Accordingly, statutory
accounting focuses on valuing assets and liabilities of insurers at
financial reporting dates in accordance with appropriate insurance
law and regulatory provisions applicable in each insurer’s
domiciliary state.
Generally
accepted accounting principles (“GAAP”) are concerned
with a company’s solvency, but are also concerned with other
financial measurements, principally income and cash flows.
Accordingly, GAAP gives more consideration to appropriate matching
of revenue and expenses and accounting for management’s
stewardship of assets than does SAP. As a direct result, different
types and amounts of assets and liabilities will be reflected in
financial statements prepared in accordance with GAAP as compared
to SAP.
Statutory
accounting practices established by the NAIC and adopted in part by
New York insurance regulators determine, among other things, the
amount of statutory surplus and statutory net income of KICO and
thus determine, in part, the amount of funds that are available to
Kingstone Companies, Inc. from which to pay dividends.
We were incorporated in
1961 and assumed the name DCAP Group, Inc. in 1999. On July 1,
2009, we changed our name to Kingstone Companies, Inc.
18
Employees
As
of December 31, 2018, we had 101 employees all of whom are located
in New York. None of our employees are covered by a collective
bargaining agreement. We believe that our relationship with our
employees is good.
ITEM
1A
.
RISK
FACTORS.
Factors That May Affect Future Results and Financial
Condition
Based
upon the following factors, as well as other factors affecting our
operating results and financial condition, past financial
performance should not be considered to be a reliable indicator of
future performance, and investors should not use historical trends
to anticipate results or trends in future periods. These factors,
among others, may affect the accuracy of certain forward-looking
statements contained in this Annual Report.
Risks Related to Our Business
As a property and casualty insurer, we may face significant losses
from catastrophes and severe weather events.
Because
of the exposure of our property and casualty business to
catastrophic events (such as Superstorm Sandy) and other severe
weather events, our operating results and financial condition may
vary significantly from one period to the next. Catastrophes can be
caused by various natural and man-made disasters, including
earthquakes, wildfires, tornadoes, hurricanes, severe winter
weather, storms and certain types of terrorism. We have catastrophe
reinsurance coverage with regard to losses of up to $450,000,000.
The initial $5,000,000 of losses in a catastrophe are subject to a
10% quota share reinsurance treaty, such that we retain $4,500,000
of risk per catastrophe occurrence. With respect to any additional
catastrophe losses of up to $445,000,000, we are 100% reinsured
under our catastrophe reinsurance program. Catastrophe coverage is
limited on an annual basis to two times the per occurrence amounts.
We may incur catastrophe losses in excess of: (i) those that
we project would be incurred, (ii) those that external
modeling firms estimate would be incurred, (iii) the average
expected level used in pricing or (iv) our current reinsurance
coverage limits. Despite our catastrophe management programs, we
are exposed to catastrophes that could have a material adverse
effect on our operating results and financial condition. Our
liquidity could be constrained by a catastrophe, or multiple
catastrophes, which may result in extraordinary losses or a
downgrade of our financial strength ratings. In addition, the
reinsurance losses that are incurred in connection with a
catastrophe could have an adverse impact on the terms and
conditions of future reinsurance treaties.
In
addition, we are subject to claims arising from non-catastrophic
weather events such as hurricanes, tropical storms, severe winter
weather, rain, hail and high winds. The incidence and severity of
weather conditions are largely unpredictable. There is generally an
increase in the frequency and severity of claims when severe
weather conditions occur.
19
Unanticipated increases in the severity or frequency of claims may
adversely affect our operating results and financial
condition.
Changes
in the severity or frequency of claims may affect our
profitability. Changes in homeowners claim severity are driven by
inflation in the construction industry, in building materials and
home furnishings, and by other economic and environmental factors,
including increased demand for services and supplies in areas
affected by catastrophes. Changes in bodily injury claim severity
are driven primarily by inflation in the medical sector of the
economy and by litigation costs. Changes in auto physical damage
claim severity are driven primarily by inflation in auto repair
costs, prices of auto parts and used car prices. However, changes
in the level of the severity of claims are not limited to the
effects of inflation and demand surge in these various sectors of
the economy. Increases in claim severity can arise from unexpected
events that are inherently difficult to predict, such as a change
in the law or an inability to enforce exclusions and limitations
contained in our policies. Although we pursue various loss
management initiatives to mitigate future increases in claim
severity, there can be no assurances that these initiatives will
successfully identify or reduce the effect of future increases in
claim severity, and a significant increase in claim frequency could
have an adverse effect on our operating results and financial
condition.
A downgrade in our financial strength rating from A.M. Best may
have a material adverse effect on our competitive position, the
marketability of our product offerings, and our liquidity,
operating results and financial condition.
In
April 2017, A.M. Best upgraded the financial strength rating of
KICO to A- (Excellent) from B++ (Good). Financial strength ratings
are important factors in establishing the competitive position of
insurance companies and generally have an effect on an insurance
company's business. Many insurance buyers, agents, brokers and
secured lenders use the ratings assigned by A.M. Best and other
agencies to assist them in assessing the financial strength and
overall quality of the companies with which they do business or
from which they are considering purchasing insurance or in
determining the financial strength of the company that provides
insurance with respect to the collateral they hold. A.M. Best
ratings are derived from an in-depth evaluation of an insurance
company’s balance sheet strengths, operating performances and
business profiles. A.M. Best evaluates, among other factors, the
company’s capitalization, underwriting leverage, financial
leverage, asset leverage, capital structure, quality and
appropriateness of reinsurance, adequacy of reserves, quality and
diversification of assets, liquidity, profitability, spread of
risk, revenue composition, market position, management, market risk
and event risk. On an ongoing basis, rating agencies such as A.M.
Best review the financial performance and condition of insurers and
can downgrade or change the outlook on an insurer's ratings due to,
for example, a change in an insurer's statutory capital, a reduced
confidence in management or a host of other considerations that may
or may not be under the insurer's control. All ratings are subject
to continuous review; therefore, the retention of these ratings
cannot be assured. A downgrade in our financial strength rating
from A.M. Best could have a material adverse effect on our
competitiveness, the marketability of our product offerings and our
ability to grow in the marketplace.
Adverse capital and credit market conditions may significantly
affect our ability to meet liquidity needs or our ability to obtain
credit on acceptable terms.
The
capital and credit markets can experience periods of volatility and
disruption. In some cases, markets have exerted downward pressure
on the availability of liquidity and credit capacity. In the event
that we need access to additional capital to support our operating
expenses, make payments on our outstanding and any future
indebtedness, pay for capital expenditures, or increase the amount
of insurance that we seek to underwrite or to otherwise grow our
business, our ability to obtain such capital may be limited and the
cost of any such capital may be significant. Our access to
additional financing will depend on a variety of factors, such as
market conditions, the general availability of credit, the overall
availability of credit to our industry, our credit ratings and
credit capacity as well as lenders' perception of our long or
short-term financial prospects. Similarly, our access to funds may
be impaired if regulatory authorities or rating agencies take
negative actions against us. If a combination of these factors
occurs, our internal sources of liquidity may prove to be
insufficient and, in such case, we may not be able to successfully
obtain additional financing on favorable terms.
20
We are exposed to significant financial and capital markets risk
which may adversely affect our results of operations, financial
condition and liquidity, and our net investment income can vary
from period to period.
We are
exposed to significant financial and capital markets risk,
including changes in interest rates, equity prices, market
volatility, general economic conditions, the performance of the
economy in general, the performance of the specific obligors
included in our portfolio, and other factors outside our control.
Our exposure to interest rate risk relates primarily to the market
price and cash flow variability associated with changes in interest
rates. Our investment portfolio contains interest rate sensitive
instruments, such as fixed income securities, which may be
adversely affected by changes in interest rates from governmental
monetary policies, domestic and international economic and
political conditions and other factors beyond our control. A rise
in interest rates would increase the net unrealized loss position
of our investment portfolio, which would be offset by our ability
to earn higher rates of return on funds reinvested. Conversely, a
decline in interest rates would decrease the net unrealized loss
position of our investment portfolio, which would be offset by
lower rates of return on funds reinvested.
In
addition, market volatility can make it difficult to value certain
of our securities if trading becomes less frequent. As such,
valuations may include assumptions or estimates that may have
significant period to period changes which could have a material
adverse effect on our consolidated results of operations or
financial condition. If significant, continued volatility, changes
in interest rates, changes in defaults, a lack of pricing
transparency, market liquidity and declines in equity prices,
individually or in tandem, could have a material adverse effect on
our results of operations, financial condition or cash flows
through realized losses, impairments, and changes in unrealized
positions.
Reinsurance may be
unavailable at current levels and prices, which may limit our
ability to write new business or maintain our financial strength
rating from A.M. Best.
We
purchase reinsurance to reduce our net liability on individual
risks, to protect against possible catastrophes, to remain within a
target ratio of net premiums written to policyholders’
surplus and to expand our underwriting capacity. Participation in
reinsurance arrangements does not relieve us from our obligations
to policyholders. Our personal lines catastrophe reinsurance
program was designed, utilizing our risk management methodology, to
address our exposure to catastrophes. Market conditions beyond our
control impact the availability and cost of the reinsurance we
purchase. No assurances can be given that reinsurance will remain
continuously available to us to the same extent and on the same
terms and rates as currently available. For example, our ability to
afford reinsurance to reduce our catastrophe risk may be dependent
upon our ability to adjust premium rates for its cost, and there
are no assurances that the terms and rates for our current
reinsurance program will continue to be available in the future. If
we are unable to maintain our current level of reinsurance or
purchase new reinsurance protection in amounts that we consider
sufficient and at prices that we consider acceptable, we will have
to either accept an increase in our exposure risk, reduce our
insurance writings or seek other alternatives. Our ability to
maintain our financial strength rating from A.M. Best depends, in
part, on our ability to purchase a sufficient level of catastrophe
reinsurance.
Reinsurance subjects us to the credit risk of our reinsurers, which
may have a material adverse effect on our operating results and
financial condition.
The
collectability of reinsurance recoverables is subject to
uncertainty arising from a number of factors, including changes in
market conditions, whether insured losses meet the qualifying
conditions of the reinsurance contract and whether reinsurers, or
their affiliates, have the financial capacity and willingness to
make payments under the terms of a reinsurance treaty or contract.
Since we are primarily liable to an insured for the full amount of
insurance coverage, our inability to collect a material recovery
from a reinsurer could have a material adverse effect on our
operating results and financial condition.
21
Applicable insurance laws regarding the change of control of our
company may impede potential acquisitions that our shareholders
might consider desirable.
We
are subject to statutes and regulations of the state of New York
which generally require that any person or entity desiring to
acquire direct or indirect control of KICO, our insurance company
subsidiary, obtain prior regulatory approval. In addition, a change
of control of Kingstone Companies, Inc. would require such
approval. These laws may discourage potential acquisition proposals
and may delay, deter or prevent a change of control of our company,
including through transactions, and in particular unsolicited
transactions. Some of our shareholders might consider such
transactions to be desirable. Similar regulations may apply in
other states in which we may operate.
The insurance industry is subject to extensive regulation that may
affect our operating costs and limit the growth of our business,
and changes within this regulatory environment may adversely affect
our operating costs and limit the growth of our
business.
We are
subject to extensive laws and regulations. State insurance
regulators are charged with protecting policyholders and have broad
regulatory, supervisory and administrative powers over our business
practices. These include, among other things, the power to grant
and revoke licenses to transact business and the power to regulate
and approve underwriting practices and rate changes, which may
delay the implementation of premium rate changes, prevent us from
making changes we believe are necessary to match rate to risk or
delay or prevent our entry into new states. In addition, many
states have laws and regulations that limit an insurer’s
ability to cancel or not renew policies and that prohibit an
insurer from withdrawing from one or more lines of business written
in the state, except pursuant to a plan that is approved by state
regulatory authorities. Laws and regulations that limit
cancellation and non-renewal and that subject program withdrawals
to prior approval requirements may restrict our ability to exit
unprofitable markets.
Because
the laws and regulations under which we operate are administered
and enforced by a number of different governmental authorities,
including state insurance regulators, state securities
administrators and the SEC, each of which exercises a degree of
interpretive latitude, we are subject to the risk that compliance
with any particular regulator's or enforcement authority's
interpretation of a legal issue may not result in compliance with
another's interpretation of the same issue, particularly when
compliance is judged in hindsight. In addition, there is risk that
any particular regulator's or enforcement authority's
interpretation of a legal issue may change over time to our
detriment, or that changes in the overall legal and regulatory
environment may, even in the absence of any change to a particular
regulator's or enforcement authority's interpretation of a legal
issue changing, cause us to change our views regarding the actions
we need to take from a legal risk management perspective, thereby
necessitating changes to our practices that may, in some cases,
limit our ability to grow and/or to improve the profitability of
our business.
While
the United States federal government does not directly regulate the
insurance industry, federal legislation and administrative policies
can affect us. Congress and various federal agencies periodically
discuss proposals that would provide for a federal charter for
insurance companies. We cannot predict whether any such laws will
be enacted or the effect that such laws would have on our business.
Moreover, there can be no assurance that changes will not be made
to current laws, rules and regulations, or that any other laws,
rules or regulations will not be adopted in the future, that could
adversely affect our business and financial condition.
22
We may not be able to
maintain the requisite amount of risk-based capital, which may
adversely affect our profitability and our ability to compete in
the property and casualty insurance markets.
The DFS
imposes risk-based capital requirements on insurance companies to
ensure that insurance companies maintain appropriate levels of
surplus to support their overall business operations and to protect
customers against adverse developments,
after taking into account default, credit,
underwriting and off-balance sheet risks. If the amount of our
capital falls below certain thresholds, we may face restrictions
with respect to soliciting new business and/or keeping existing
business.
Similar regulations
apply in other states in which we operate.
Changing climate conditions may adversely affect our financial
condition, profitability or cash flows.
We
recognize the scientific view that the world is getting warmer.
Climate change, to the extent it produces rising temperatures and
changes in weather patterns, could impact the frequency and/or
severity of weather events and affect the affordability and
availability of homeowners insurance.
Our operating results and
financial condition may be adversely affected by the cyclical
nature of the property and casualty business.
The
property and casualty market is cyclical and has experienced
periods characterized by relatively high levels of price
competition, less restrictive underwriting standards and relatively
low premium rates, followed by periods of relatively lower levels
of competition, more selective underwriting standards and
relatively high premium rates. A downturn in the profitability
cycle of the property and casualty business could have a material
adverse effect on our operating results and financial
condition.
Because substantially all of our revenue is currently derived from
sources located in New York, our business may be adversely affected
by conditions in such state.
Over
90% of our revenue is currently derived from sources located in the
State of New York and, accordingly, is affected by the prevailing
regulatory, economic, demographic, competitive and other conditions
in the state. Changes in any of these conditions could make it
costlier or difficult for us to conduct our business. Adverse
regulatory developments in New York, which could include
fundamental changes to the design or implementation of the
insurance regulatory framework, could have a material adverse
effect on our results of operations and financial
condition.
We are highly dependent on a relatively small number of insurance
brokers for a large portion of our revenues.
We
market our insurance products primarily through insurance brokers.
A large percentage of our gross premiums written are sourced
through a limited number of brokers. For the year ended December
31, 2018, twenty-four brokers provided a total of 35.4% of our
total gross premiums written for the year ended December 31, 2018.
The nature of our dependency on these brokers relates to the high
volume of business they consistently refer to us. Our relationship
with these brokers is based on the quality of the underwriting and
claims services we provide to our clients and on our financial
strength ratings. Any deterioration in these factors could result
in these brokers advising clients to place their risks with other
insurers rather than with us. A loss of all or a substantial
portion of the business provided by one or more of these brokers
could have a material adverse effect on our financial condition and
results of operations.
23
Actual claims incurred may exceed
current reserves established for claims, which may adversely affect
our operating results and financial condition
.
Recorded claim
reserves for our business are based on our best estimates of losses
after considering known facts and interpretations of circumstances.
Internal and external factors are considered. Internal factors
include, but are not limited to, actual claims paid, pending levels
of unpaid claims, product mix and contractual terms. External
factors include, but are not limited to, changes in the law, court
decisions, changes in regulatory requirements and economic
conditions. Because reserves are estimates of the unpaid portion of
losses that have occurred, the establishment of appropriate
reserves, including reserves for catastrophes, is an inherently
uncertain and complex process. The ultimate cost of losses may vary
materially from recorded reserves, and such variance may adversely
affect our operating results and financial condition.
As a holding company, we are dependent on the results of operations
of our subsidiary, KICO; there are restrictions on the payment of
dividends by KICO.
We are
a holding company and a legal entity separate and distinct from our
operating subsidiary, KICO. As a holding company with limited
operations of our own, currently the principal sources of our funds
are dividends and other payments from KICO. Consequently, we must
rely on KICO for our ability to repay debts (including $30,000,000
in aggregate principal amount of 5.5% Senior Unsecured Notes due
December 30, 2022 (the “Notes’)), pay expenses and pay
cash dividends to our shareholders.
State
insurance laws limit the ability of KICO to pay dividends and
require KICO to maintain specified minimum levels of statutory
capital and surplus. Maximum allowable dividends by KICO to us are
restricted to the lesser of 10% of surplus or 100% of net
investment income (on a statutory accounting basis) for the
trailing 36 months, less dividends paid by KICO during such period.
As of December 31, 2018, the maximum permissible distribution
that KICO could pay without prior regulatory approval was
approximately $4,846,000. The aggregate maximum amount of dividends
permitted by law to be paid by an insurance company does not
necessarily define an insurance company’s actual ability to
pay dividends. The actual ability to pay dividends may be further
constrained by business and regulatory considerations, such as the
impact of dividends on surplus, by our competitive position and by
the amount of premiums that we can write. State insurance
regulators have broad discretion to limit the payment of dividends
by insurance companies. Our ability to pay interest on the Notes as
it comes due and the principal of the Notes at their maturity may
be limited by these regulatory constraints.
We may not be able to generate sufficient cash to service our debt
obligations, including the Notes.
Our
ability to make payments on and to refinance our indebtedness,
including the Notes, will depend on our financial and operating
performance, which is subject to prevailing economic and
competitive conditions and to certain financial, business and other
factors beyond our control. We may be unable to maintain a
sufficient level of cash flows from operating activities to permit
us to pay the principal, premium, if any, and interest on our
indebtedness, including the Notes.
Our future results are dependent in part on our ability to
successfully operate in an insurance industry that is highly
competitive.
The
insurance industry is highly competitive. Many of our competitors
have well-established national reputations, substantially more
capital and significantly greater marketing and management
resources. Because of the competitive nature of the insurance
industry, including competition for customers, agents and brokers,
there can be no assurance that we will continue to effectively
compete with our industry rivals, or that competitive pressures
will not have a material adverse effect on our ability to grow our
business and to maintain profitable operating results or financial
condition.
24
If we lose key personnel or are unable to recruit qualified
personnel, our ability to implement our business strategies could
be delayed or hindered.
Our
future success will depend, in part, upon the efforts of Barry
Goldstein, our Executive Chairman, Dale Thatcher, our President and
Chief Executive Officer, and Benjamin Walden, Executive Vice
President and Chief Actuary of KICO. The loss of Messrs. Goldstein,
Thatcher, Walden or other key personnel could prevent us from fully
implementing our business strategies and could materially and
adversely affect our business, financial condition and results of
operations. As we continue to grow, we will need to recruit and
retain additional qualified management personnel, but we may not be
able to do so. Our ability to recruit and retain such personnel
will depend upon a number of factors, such as our results of
operations and prospects and the level of competition prevailing in
the market for qualified personnel. Mr. Goldstein entered into an
amended and restated employment agreement effective January 1, 2019
and expiring December 31, 2021 in which Mr. Goldstein stepped down
as Chief Executive Officer and became Executive Chairman of the
Board. Mr. Thatcher entered into an amended and restated employment
agreement effective January 1, 2019 and expiring on December 31,
2021, whereby Mr. Thatcher became Chief Executive Officer. Mr.
Walden is not a party to an employment agreement with
KICO.
Difficult conditions in the economy generally could adversely
affect our business and operating results.
As with
most businesses, we believe that difficult conditions in the
economy could have an adverse effect on our business and operating
results. General economic conditions also could adversely affect us
in the form of consumer behavior, which may include decreased
demand for our products. As consumers become more cost conscious,
they may choose to purchase lower levels of insurance.
Changes in accounting standards issued by the Financial Accounting
Standards Board or other standard-setting bodies may adversely
affect our reported results of operations and financial
condition.
Our
financial statements are subject to the application of generally
accepted accounting principles, which are periodically revised,
interpreted and/or expanded. Accordingly, we are required to adopt
new guidance or interpretations, which may have a material adverse
effect on our results of operations and financial condition that is
either unexpected or has a greater impact than
expected.
Our business could be adversely affected by a security breach or
other attack involving our computer systems or those of one or more
of our vendors.
Our
business requires that we develop and maintain computer systems to
run our operations and to store a significant volume of
confidential data. Some of these systems rely on third-party
vendors, through either a connection to, or an integration with,
those third-parties’ systems. In the course of our
operations, we acquire the personal confidential information of our
customers and employees. We also store our intellectual property,
trade secrets, and other sensitive business and financial
information.
25
All of
these systems are subject to “cyber attacks” by
sophisticated third parties with substantial computing resources
and capabilities, and to unauthorized or illegitimate actions by
employees, consultants, agents and other persons with legitimate
access to our systems. Such attacks or actions may include attempts
to:
●
steal,
corrupt, or destroy data, including our intellectual property,
financial data or the personal information of our customers or
employees
●
misappropriate
funds
●
disrupt
or shut down our systems
●
deny
customers, agents, brokers, or others access to our systems,
or
●
infect
our systems with viruses or malware.
While
we can take defensive measures, there can be no assurance that we
will be successful in preventing attacks or detecting and stopping
them once they have begun. Our business could be significantly
damaged by a security breach, data loss or corruption, or cyber
attack. In addition to the potentially high costs of investigating
and stopping such an event and implementing necessary fixes, we
could incur substantial liability if confidential customer or
employee information is stolen. In addition, such an event could
cause a significant disruption of our ability to conduct our
insurance operations. We have a cyber insurance policy to protect
against the monetary impact of some of these risks. However, the
occurrence of a security breach, data loss or corruption, or
cyber-attack, if sufficiently severe, could have a material adverse
effect on our business results.
We rely on our information technology and telecommunication
systems, and the failure of these systems could materially and
adversely affect our business.
Our
business is highly dependent upon the successful and uninterrupted
functioning of our information technology and telecommunications
systems. We rely on these systems to support our operations. The
failure of these systems could interrupt our operations and result
in a material adverse effect on our business.
Risks Related to Our Common Stock
Our stock price may fluctuate significantly and be highly volatile
and this may make it difficult for shareholders to resell shares of
our common stock at the volume, prices and times they find
attractive.
The
market price of our common stock could be subject to significant
fluctuations and be highly volatile, which may make it difficult
for shareholders to resell shares of our common stock at the
volume, prices and times they find attractive. There are many
factors that will impact our stock price and trading volume,
including, but not limited to, the factors listed above under
“Risks Related to Our Business.”
Stock
markets, in general, have experienced in recent years, and continue
to experience, significant price and volume volatility, and the
market price of our common stock may continue to be subject to
similar market fluctuations that may be unrelated to our operating
performance and prospects. Increased market volatility and
fluctuations could result in a substantial decline in the market
price of our common stock.
The trading volume in our common stock has been limited. As a
result, shareholders may not experience liquidity in their
investment in our common stock, thereby potentially limiting their
ability to resell their shares at the volume, times and prices they
find attractive.
Our
common stock is currently traded on The Nasdaq Global Select Market
(“Nasdaq”). Our common stock has substantially less
liquidity than the average trading market for many other publicly
traded insurance and other companies. An active trading market for
our common stock may not develop or, if developed, may not be
sustained. Such stocks can be more volatile than stocks trading in
an active public market. Therefore, shareholders have reduced
liquidity and may not be able to sell their shares at the volume,
prices and times that they desire.
26
There may be future issuances or resales of our common stock which
may materially and adversely affect the market price of our common
stock.
Subject
to any required state insurance regulatory approvals, we are not
restricted from issuing additional shares of our common stock in
the future, including securities convertible into, or exchangeable
or exercisable for, shares of our common stock. Our issuance of
additional shares of common stock in the future will dilute the
ownership interests of our then existing shareholders.
We have
an effective registration on Form S-3 under the Securities Act of
1933, as amended (the “Securities Act”) registering for
resale 595,238 shares of our common stock and effective
registration statements on Form S-8 under the Securities Act
registering an aggregate of 700,000 shares of our common stock
issuable under our 2005 Equity Participation Plan and an aggregate
of 700,000 shares of our common stock issuable under our 2014
Equity Participation Plan. Options to purchase 37,500 shares of our
common stock are outstanding under the 2014 plan and 466,124 shares
are reserved for issuance thereunder. We have also registered
up to $39,290,000 of our securities pursuant to registration
statements on Form S-3, which we may sell from time to time in one
or more offerings. The shares subject to the registration
statements on Form S-3 will be freely tradeable in the public
market. In addition, the shares issuable pursuant to the
registration statements on Form S-8 will be freely tradable in the
public market, except for shares held by our
affiliates.
The sale of a substantial number of shares of our
common stock or securities convertible into, or exchangeable or
exercisable for, shares of our common stock, whether directly by
us, by selling shareholders in future offerings or by our existing
shareholders in the secondary market, the perception that such
issuances or resales could occur or the availability for future
issuances or resale of shares of our common stock or securities
convertible into, or exchangeable or exercisable for, shares of our
common stock could materially and adversely affect the market price
of our common stock and our ability to raise capital through future
offerings of equity or equity-related securities on attractive
terms or at all.
In
addition, our board of directors is authorized to designate and
issue preferred stock without further shareholder approval, and we
may issue other equity and equity-related securities that are
senior to our common stock in the future for a number of reasons,
including, without limitation, to support operations and growth, to
maintain our capital ratios, and to comply with any future changes
in regulatory standards.
Our executive officers and directors own a substantial number of
shares of our common stock. This will enable them to significantly
influence the vote on all matters submitted to a vote of our
shareholders.
As of
March 12, 2019, our executive officers and directors beneficially
owned 911,508 shares of our common stock (including options to
purchase 10,000 shares of our common stock and 13,295 shares of our
common stock issuable upon the vesting of restricted stock within
60 days), representing 8.5% of the outstanding shares of our common
stock.
Accordingly, our
executive officers and directors, through their beneficial
ownership of our common stock, will be able to significantly
influence the vote on all matters submitted to a vote of our
shareholders, including the election of directors, amendments to
our restated certificate of incorporation or amended and restated
bylaws, mergers or other business combination transactions and
certain sales of assets outside the usual and regular course of
business. The interests of our executive officers and directors may
not coincide with the interests of our other shareholders, and they
could take actions that advance their own interests to the
detriment of our other shareholders.
27
Anti-takeover provisions and the regulations to which we may be
subject may make it more difficult for a third party to acquire
control of us, even if the change in control would be beneficial to
our shareholders.
We are
a holding company incorporated in Delaware. Anti-takeover
provisions in Delaware law and our restated certificate of
incorporation and bylaws, as well as regulatory approvals required
under state insurance laws, could make it more difficult for a
third party to acquire control of us and may prevent shareholders
from receiving a premium for their shares of common stock. Our
certificate of incorporation provides that our board of directors
may issue up to 2,500,000 shares of preferred stock, in one or more
series, without shareholder approval and with such terms,
preferences, rights and privileges as the board of directors may
deem appropriate. These provisions, the control of our executive
officers and directors over the election of our directors, and
other factors may hinder or prevent a change in control, even if
the change in control would be beneficial to, or sought by, our
shareholders.
ITEM
1B
U
NRESOLVED STAFF COMMENTS
.
None.
ITEM
2.
P
ROPERTIES
.
Our
principal executive offices are currently located at
15 Joys Lane, Kingston, New York 12401
. Our
insurance underwriting business is located principally at 15 Joys
Lane, Kingston, New York 12401. Our insurance underwriting business
also maintains an executive office located at 70 East Sunrise
Highway, Valley Stream, New York 11581, at which we lease 4,985
square feet of space.
We own
the building at which our insurance underwriting business
principally operates, free of mortgage.
None.
ITEM
4.
M
INE SAFETY DISCLOSURES
.
Not
applicable.
28
PART II
ITEM 5.
M
ARKET FOR REGISTRANT’S COMMON EQUITY, RELATED
STOCKHOLDER MATTERS AND ISSUER PURCHASES OF EQUITY
SECURITIES
.
Market Information
Our
common stock is quoted on The Nasdaq Global Select Market under the
symbol “KINS.”
Holders
As of
March 12, 2019, there were approximately 236 record holders of our
common stock.
Dividends
Holders of our common stock are entitled to dividends when,
as and if declared by our Board of Directors out of funds legally
available. We have paid a cash dividend in each quarter since
September 2011.
Future dividend
policy will be subject to the discretion of our Board of Directors
and will be contingent upon future earnings, if any, our financial
condition, capital requirements, general business conditions, and
other factors. Therefore, we can give no assurance that future
dividends of any kind will continue to be paid to holders of our
common stock.
Our
ability to pay dividends depends, in part, on the ability of KICO
to pay dividends to us. KICO, as an insurance subsidiary, is
subject to significant regulatory restrictions limiting its ability
to declare and pay dividends.
These
restrictions are related to surplus and net investment income.
Without the prior approval of the DFS, d
ividends are
restricted to the lesser of 10% of surplus or 100% of investment
income (on a statutory accounting basis) for the trailing 36
months, less dividends paid by KICO
during such period.
As of December 31, 2018, the maximum distribution
that KICO could pay without prior regulatory approval was
approximately $4,846,000, which is based on investment income for
the trailing 36 months, net of dividends paid by KICO during such
period.
See “Business – Government
Regulation” and “Management’s Discussion and
Analysis of Financial Condition and Results of Operation –
Liquidity” in Items 1 and 7, respectively, of this Annual
Report.
Recent Sales of Unregistered Securities
None.
Issuer Purchases of Equity Securities
There
were no purchases of common stock made by us or any
“affiliated purchaser” during the quarter ended
December 31, 2018.
ITEM
6
.
S
ELECTED FINANCIAL DATA
.
This
item is not applicable to smaller reporting companies.
29
ITEM
7
.
M
ANAGEMENT’S DISCUSSION AND ANALYSIS OF FINANCIAL
CONDITION AND RESULTS OF OPERATIONS
.
Overview
We
offer property and casualty insurance products to individuals and
small businesses through our wholly owned subsidiary, Kingstone
Insurance Company (“KICO”). KICO’s insureds are
located primarily in downstate New York, consisting of New York
City, Long Island and Westchester County, although we are actively
writing business in New Jersey, Rhode Island, Pennsylvania and
Massachusetts. We are licensed in the States of New York, New
Jersey, Rhode Island, Massachusetts, Pennsylvania, Connecticut,
Maine, and New Hampshire. For the year ended December 31, 2018,
93.7% of KICO’s direct written premiums came from the New
York policies.
We
derive substantially all of our revenue from KICO, which includes
revenues from earned premiums, ceding commissions from quota share
reinsurance, net investment income generated from its portfolio,
and net realized gains and losses on investment securities. All of
KICO’s insurance policies are written for a one-year term.
Earned premiums represent premiums received from insureds, which
are recognized as revenue over the period of time that insurance
coverage is provided (i.e., ratably over the one-year life of the
policy). A significant period of time can elapse from the receipt
of insurance premiums to the payment of insurance claims. During
this time, KICO invests the premiums, earns investment income and
generates net realized and unrealized investment gains and losses
on investments. Our holding company earns investment income from
its cash holdings and may also generate net realized and unrealized
investment gains and losses on future investments.
Our
expenses include the insurance underwriting expenses of KICO and
other operating expenses. Insurance companies incur a significant
amount of their total expenses from losses incurred by
policyholders, which are commonly referred to as claims. In
settling these claims, various loss adjustment expenses
(“LAE”) are incurred such as insurance adjusters’
fees and legal expenses. In addition, insurance companies incur
policy acquisition costs. Policy acquisition costs include
commissions paid to producers, premium taxes, and other expenses
related to the underwriting process, including employees’
compensation and benefits.
Other
operating expenses include our corporate expenses as a holding
company. These expenses include legal and auditing fees, executive
employment costs, and other costs directly associated with being a
public company.
Principal Revenue and Expense Items
Net premiums
earned:
Net premiums earned is the earned portion
of our written premiums, less that portion of premium that is ceded
to third party reinsurers under reinsurance agreements. The amount
ceded under these reinsurance agreements is based on a contractual
formula contained in the individual reinsurance agreement.
Insurance premiums are earned on a pro rata basis over the term of
the policy. At the end of each reporting period, premiums written
that are not earned are classified as unearned premiums and are
earned in subsequent periods over the remaining term of the policy.
Our insurance policies have a term of one year. Accordingly, for a
one-year policy written on July 1, 2018, we would earn half of the
premiums in 2018 and the other half in 2019.
Ceding commission
revenue:
Commissions on reinsurance premiums
ceded are earned in a manner consistent with the recognition of the
direct acquisition costs of the underlying insurance policies,
generally on a pro-rata basis over the terms of the policies
reinsured.
30
Net investment income and
net gains (losses) on investments:
We invest in
cash and cash equivalents, short-term investments, fixed-maturity
and equity securities. Our net investment income includes interest
and dividends earned on our invested assets, less investment
expenses. Net realized gains and losses on our investments are
reported separately from our net investment income. Net realized
gains occur when our investment securities are sold for more than
their costs or amortized costs, as applicable. Net realized losses
occur when our investment securities are sold for less than their
costs or amortized costs, as applicable, or are written down as a
result of other-than-temporary impairment. We classify our
fixed-maturity securities as either available-for-sale or
held-to-maturity. Net unrealized gains (losses) on those securities
classified as available-for-sale are reported separately within
accumulated other comprehensive income on our balance sheet while
our equity securities and other investments report changes in fair
value through earnings. See Note 2 in the accompanying Consolidated
Financial Statements for further discussion over our accounting
policies following Item 15 of this Annual Report.
Other
income:
We recognize installment fee income and
fees charged to reinstate a policy after it has been cancelled for
non-payment.
Loss and loss adjustment
expenses incurred:
Loss and LAE incurred
represent our largest expense item, and for any given reporting
period include estimates of future claim payments, changes in those
estimates from prior reporting periods and costs associated with
investigating, defending and servicing claims. These expenses
fluctuate based on the amount and types of risks we insure. We
record loss and LAE related to estimates of future claim payments
based on case-by-case valuations, statistical analyses and
actuarial procedures. We seek to establish all reserves at the most
likely ultimate liability based on our historical claims
experience. It is typical for certain claims to take several years
to settle and we revise our estimates as we receive additional
information on such claims. Our ability to estimate loss and LAE
accurately at the time of pricing our insurance policies is a
critical factor affecting our profitability.
Commission expenses and
other underwriting expenses:
Other underwriting
expenses include policy acquisition costs and other expenses
related to the underwriting of policies. Policy acquisition costs
represent the costs of originating new insurance policies that vary
with, and are primarily related to, the production of insurance
policies (principally commissions, premium taxes and certain
underwriting salaries). Policy acquisition costs are deferred and
recognized as expense as the related premiums are earned. Other
underwriting expenses represent general and administrative expenses
of our insurance business and are comprised of other costs
associated with our insurance activities such as regulatory fees,
telecommunication and technology costs, occupancy costs, employment
costs, and legal and auditing fees.
Other operating
expenses:
Other operating expenses include the corporate
expenses of our holding company, Kingstone Companies, Inc. These
expenses include executive employment costs, legal and auditing
fees, and other costs directly associated with being a public
company.
Stock-based
compensation:
Non-cash equity compensation includes the fair
value of stock grants issued to our directors, officers and
employees, and amortization of stock options issued to the
same.
Depreciation and
amortization:
Depreciation and amortization includes the
amortization of intangibles related to the acquisition of KICO,
depreciation of the real estate used in KICO’s operations, as
well as depreciation of capital expenditures for information
technology projects, office equipment and furniture.
Interest
expense:
Interest expense represents amounts we
incur on our outstanding indebtedness at the applicable interest
rates. Interest expense also includes amortization of debt discount
and issuance costs.
31
Income tax
expense:
We incur federal income tax expense on
our consolidated operations as well as state income tax expense for
our non-insurance underwriting subsidiaries.
Product Lines
Our
active product lines include the following:
Personal lines:
Our
largest line of business is personal lines, consisting of
homeowners, dwelling fire, cooperative/condominium, renters, and
personal umbrella policies.
We
offer businessowners policies, which consist primarily of small
business retail, service, and office risks, with limited
residential exposure. We also write artisan’s liability
policies for small independent contractors with smaller sized
workforces. In addition, we write special multi-peril
policies for larger and more specialized businessowners risks,
including those with limited residential exposures. Further, we
offer commercial umbrella policies written above our supporting
commercial lines policies.
Livery physical
damage:
We
write for-hire vehicle physical damage only policies for livery and
car service vehicles and taxicabs. These policies insure only the
physical damage portion of insurance for such vehicles, with no
liability coverage included.
Other:
We write
canine legal liability policies and have a small participation in
mandatory state joint underwriting associations.
Key Measures
We
utilize the following key measures in analyzing the results of our
insurance underwriting business:
Net loss ratio:
The
net loss ratio is a measure of the underwriting profitability of an
insurance company’s business. Expressed as a percentage, this
is the ratio of net losses and loss adjustment expenses
(“LAE”) incurred to net premiums earned.
Net underwriting expense
ratio:
The net underwriting expense ratio is a
measure of an insurance company’s operational efficiency in
administering its business. Expressed as a percentage, this is the
ratio of the sum of acquisition costs (the most significant being
commissions paid to our producers) and other underwriting expenses
less ceding commission revenue less other income to net premiums
earned.
Net combined
ratio:
The net combined ratio is a measure of an
insurance company’s overall underwriting profit. This is the
sum of the net loss and net underwriting expense ratios. If the net
combined ratio is at or above 100 percent, an insurance company
cannot be profitable without investment income, and may not be
profitable if investment income is insufficient.
Underwriting income:
Underwriting income is net pre-tax income attributable to our
insurance underwriting business before investment activity. It
excludes net investment income, net realized gains from
investments, and depreciation and amortization (net premiums earned
less expenses included in combined ratio). Underwriting income is a
measure of an insurance company’s overall operating
profitability before items such as investment income, depreciation
and amortization, interest expense and income taxes.
32
Critical Accounting Policies and Estimates
Our
consolidated financial statements include the accounts of Kingstone
Companies, Inc. and all majority-owned and controlled subsidiaries.
The preparation of financial statements in conformity with
accounting principles generally accepted in the United States
requires our management to make estimates and assumptions in
certain circumstances that affect amounts reported in our
consolidated financial statements and related notes. In preparing
these consolidated financial statements, our management has
utilized information including our past history, industry
standards, and the current economic environment, among other
factors, in forming its estimates and judgments of certain amounts
included in the consolidated financial statements, giving due
consideration to materiality. It is possible that the ultimate
outcome as anticipated by our management in formulating estimates
inherent in these financial statements might not materialize.
However, application of the critical accounting policies involves
the exercise of judgment and use of assumptions as to future
uncertainties and, as a result, actual results could differ from
these estimates. In addition, other companies may utilize different
estimates, which may impact comparability of our results of
operations to those of companies in similar
businesses.
We
believe that the most critical accounting policies relate to the
reporting of reserves for loss and LAE, including losses that have
occurred but have not been reported prior to the reporting date,
amounts recoverable from third party reinsurers, deferred ceding
commission revenue, deferred policy acquisition costs, deferred
income taxes, the impairment of investment securities, intangible
assets and the valuation of stock-based compensation. See Note 2
(Summary Significant Accounting Policies) of the Notes to
Consolidated Financial Statements following Item 15 of this Annual
Report.
Overall, we are
pleased with our continuing year over year growth. We anticipate
launching homeowners products in Connecticut and Maine during 2019,
which will add to our already expanding market share in the
Northeast.
Turning
to 2019 expectations: Based on our current view of the
marketplace, we expect the following:
A GAAP
combined ratio, excluding catastrophe losses, between 82.0% and
84.0%.
●
This assumes no
prior-year casualty reserve development;
●
Catastrophe losses
of approximately 4.0 points.
33
Consolidated Results of Operations
The
following table summarizes the changes in the results of our
operations for the periods indicated:
|
|
Years ended December 31,
|
|||
|
($ in thousands)
|
2018
|
2017
|
Change
|
Percent
|
|
Revenues
|
|
|
|
|
|
Direct
written premiums
|
$
146,716
|
$
121,575
|
$
25,141
|
20.7
%
|
|
Assumed
written premiums
|
1
|
23
|
(22
)
|
(95.7
)%
|
|
|
146,717
|
121,598
|
25,119
|
20.7
%
|
|
Ceded
written premiums
|
|
|
|
|
|
Ceded
to quota share treaties in force during the period
|
15,880
|
23,623
|
(7,743
)
|
(32.8
)%
|
|
Return
of premiums previously ceded to prior quota share treaties
(1)
|
(4,553
)
|
(7,140
)
|
2,587
|
(36.2
)%
|
|
Ceded
to quota share treaties
|
11,327
|
16,483
|
(5,156
)
|
(31.3
)%
|
|
Ceded
to excess of loss treaties
|
1,386
|
1,209
|
177
|
14.6
%
|
|
Ceded
to catastrophe treaties
|
14,210
|
11,037
|
3,173
|
28.7
%
|
|
Total
ceded written premiums
|
26,923
|
28,729
|
(1,806
)
|
(6.3
)%
|
|
|
|
|
|
|
|
Net
written premiums
|
119,794
|
92,869
|
26,925
|
29.0
%
|
|
|
|
|
|
|
|
Change
in unearned premiums
|
|
|
|
|
|
Direct
and assumed
|
(13,384
)
|
(10,653
)
|
(2,731
)
|
25.6
%
|
|
Ceded
to quota share treaties
|
(2,995
)
|
(4,865
)
|
1,870
|
(38.4
)%
|
|
Change
in net unearned premiums
|
(16,379
)
|
(15,518
)
|
(861
)
|
5.5
%
|
|
|
|
|
|
|
|
Premiums
earned
|
|
|
|
|
|
Direct
and assumed
|
133,333
|
110,945
|
22,388
|
20.2
%
|
|
Ceded
to reinsurance treaties
|
(29,918
)
|
(33,594
)
|
3,676
|
(10.9
)%
|
|
Net
premiums earned
|
103,415
|
77,351
|
26,064
|
33.7
%
|
|
Ceding
commission revenue
|
|
|
|
|
|
Excluding
the effect of catastrophes
|
5,792
|
9,933
|
(4,141
)
|
(41.7
)%
|
|
Effect
of catastrophes
|
(459
)
|
-
|
(459
)
|
n/a
%
|
|
Total
ceding commission revenue
|
5,333
|
9,933
|
(4,600
)
|
(46.3
)%
|
|
Net
investment income
|
6,186
|
4,133
|
2,053
|
49.7
%
|
|
Net
(losses) gains on investments
|
(2,496
)
|
84
|
(2,580
)
|
(3,071.4
)%
|
|
Other
income
|
1,334
|
1,268
|
66
|
5.2
%
|
|
Total
revenues
|
113,772
|
92,769
|
21,003
|
22.6
%
|
|
Expenses
|
|
|
|
|
|
Loss
and loss adjustment expenses
|
|
|
|
|
|
Direct
and assumed:
|
|
|
|
|
|
Loss
and loss adjustment expenses excluding the effect of
catastrophes
|
61,950
|
48,253
|
13,697
|
28.4
%
|
|
Losses
from catastrophes (2)
|
10,828
|
-
|
10,828
|
n/a
%
|
|
Total
direct and assumed loss and loss adjustment expenses
|
72,778
|
48,253
|
24,525
|
50.8
%
|
|
|
|
|
|
|
|
Ceded
loss and loss adjustment expenses:
|
|
|
|
|
|
Loss
and loss adjustment expenses excluding the effect of
catastrophes
|
9,882
|
14,067
|
(4,185
)
|
(29.8
)%
|
|
Losses
from catastrophes (2)
|
4,600
|
-
|
4,600
|
n/a
%
|
|
Total
ceded loss and loss adjustment expenses
|
14,482
|
14,067
|
415
|
3.0
%
|
|
|
|
|
|
|
|
Net
loss and loss adjustment expenses:
|
|
|
|
|
|
Loss
and loss adjustment expenses excluding the effect of
catastrophes
|
52,068
|
34,186
|
17,882
|
52.3
%
|
|
Losses
from catastrophes (2)
|
6,228
|
-
|
6,228
|
n/a
%
|
|
Net
loss and loss adjustment expenses
|
58,296
|
34,186
|
24,110
|
70.5
%
|
|
|
|
|
|
|
|
Commission
expense
|
25,342
|
21,182
|
4,160
|
19.6
%
|
|
Other
underwriting expenses
|
20,943
|
18,116
|
2,827
|
15.6
%
|
|
Other
operating expenses
|
2,575
|
3,513
|
(938
)
|
(26.7
)%
|
|
Depreciation
and amortization
|
1,787
|
1,403
|
384
|
27.4
%
|
|
Interest
expense
|
1,822
|
60
|
1,762
|
2,936.7
%
|
|
Total
expenses
|
110,765
|
78,460
|
32,305
|
41.2
%
|
|
|
|
|
|
|
|
Income
from operations before taxes
|
3,007
|
14,309
|
(11,302
)
|
(79.0
)%
|
|
Income
tax (benefit) expense
|
(86
)
|
4,323
|
(4,409
)
|
(102.0
)%
|
|
Net income
|
$
3,093
|
$
9,986
|
$
(6,893
)
|
(69.0
)%
|
34
(1)
Effective July 1, 2018, we decreased the quota share ceding rate in
our personal lines quota share treaty from 20% to 10% (the
“2018 cut-off”). The 2018 cut-off resulted in an
approximately $4,553,000 return of unearned premiums from our
reinsurers that were previously ceded under the expiring personal
lines quota share treaty. Effective July 1, 2017, we decreased the
quota share ceding rate in our personal lines quota share treaty
from 40% to 20% (the “2017 cut-off”). The 2017 cut-off
resulted in an approximately $7,140,000 return of unearned premiums
from our reinsurers that were previously ceded under the expiring
personal lines quota share treaty.
(2) The
year ended December 31, 2018 includes catastrophe losses, which are
defined as losses from an event for which a catastrophe bulletin
and related serial number has been issued by the Property Claims
Services (PCS) unit of the Insurance Services Office (ISO). PCS
catastrophe bulletins are issued for events that cause more than
$25 million in total insured losses and affect a significant number
of policyholders and insurers.
|
|
Years
ended December 31,
|
|||
|
|
2018
|
2017
|
Percentage Point
Change
|
Percent
Change
|
|
|
|
|
|
|
|
Key ratios:
|
|
|
|
|
|
Net
loss ratio
|
56.4
%
|
44.2
%
|
12.2
|
27.6
%
|
|
Net
underwriting expense ratio
|
38.4
%
|
36.4
%
|
2.0
|
5.5
%
|
|
Net
combined ratio
|
94.8
%
|
80.6
%
|
14.2
|
17.6
%
|
Direct Written Premiums
Direct written premiums during the year ended
December 31, 2018 (“Year Ended 2018”) were $146,716,000
compared to $121,575,000 during the year ended December 31, 2017
(“Year Ended 2017”). The increase of $25,141,000, or
20.7%, was primarily due to an increase in policies in-force during
Year Ended 2018 as compared to Year Ended 2017. We wrote more new
policies as a result of continued demand for our products in the
markets that we serve. Policies in-force increased by 19.3% as of
December 31, 2018 compared to Dec
ember 31, 2017
.
During
Year Ended 2017, we started writing homeowners policies in New
Jersey and Rhode Island. In Year Ended 2018, we started writing
homeowners policies in Massachusetts. We refer to our New York
business as our “Core” business and the business
outside of New York as our “Expansion” business. Direct
written premiums from our Expansion business were $9,080,000 in
Year Ended 2018, compared to $1,800,000 in Year Ended
2017.
Net Written Premiums and Net Premiums Earned
The
following table describes the quota share reinsurance ceding rates
in effect during Year Ended 2018 and Year Ended 2017, respectively.
This table should be referred to in conjunction with the
discussions for net written premiums, net premiums earned, ceding
commission revenue and net loss and loss adjustment expenses that
follow.
35
|
|
Year
ended December 31, 2018
|
Year
ended December 31, 2017
|
||
|
|
January
1,
to
June
30,
|
July
1,
to
December
31,
|
January
1,
to
June
30,
|
July
1,
to
December 31,
|
|
|
("2017/2019 Treaty")
|
("2017/2019 Treaty")
|
("2016/2017 Treaty")
|
("2017/2019 Treaty")
|
|
|
|
|
|
|
|
Quota share reinsurance rates
|
|
|
|
|
|
Personal
lines
|
20% (1)
|
10% (1)
|
40%
|
20% (1)
|
(1)
2017/2019 Treaty is a two-year treaty, quota share
reinsurance rate was reduced to 10% effective July 1,
2018.
See “Reinsurance” below for changes to
our personal lines quota share treaties effective July 1, 2018 and
2017.
Net
written premiums increased $26,925,000, or 29.0%, to $119,794,000
in Year Ended 2018 from $92,869,000 in Year Ended 2017. Net written
premiums include direct and assumed premiums, less the amount of
written premiums ceded under our reinsurance treaties (quota share,
excess of loss, and catastrophe). Our personal lines business is
currently subject to a quota share treaty. A reduction to the quota
share percentage or elimination of a quota share treaty will reduce
our ceded written premiums, which will result in a corresponding
increase to our net written premiums. The increase in net written
premiums is due to growth and the reductions of our personal lines
quota share reinsurance rate to 20% and 10% on July 1, 2017 and
July 1, 2018, respectively.
Change in quota share ceding rate
Effective
July 1, 2018, we decreased the quota share ceding rate in our
personal lines quota share treaty from 20% to 10%. The Cut-off of
this treaty on July 1, 2018 resulted in a $4,553,000 return of
unearned premiums from our reinsurers that were previously ceded
under the expiring personal lines quota share treaty. Our quota
share ceding rate changed from 40% to 20% in Year Ended 2017
resulting in a $7,140,000 return of unearned premiums from our
reinsurers that were previously ceded. The table below shows the
effect of the $4,553,000 and $7,140,000 return of ceded premiums on
net written premiums for Year Ended 2018 and Year Ended 2017,
respectively:
|
|
Years
ended December 31,
|
|||
|
($ in thousands)
|
2018
|
2017
|
Change
|
Percent
|
|
|
|
|
|
|
|
Net
written premiums
|
$
119,794
|
$
92,869
|
$
26,925
|
29.0
%
|
|
Return
of premiums previously ceded to prior quota share
treaties
|
4,553
|
7,140
|
(2,587
)
|
(36.2)
%
|
|
Net
written premiums without the effect of the July 1, 2017
Cut-off
|
$
115,241
|
$
85,729
|
$
29,512
|
34.4
%
|
Without
the effect of the 2018 Cut-off and 2017 Cut-off, net written
premiums increased by $29,512,000, or 34.4%, in 2018 compared to
2017.
Excess of loss reinsurance treaties
An
increase in written premiums will, to a lesser extent than the
change in quota share ceding rate, increase the premiums ceded
under our excess of loss treaties. In Year Ended 2018, our ceded
excess of loss reinsurance premiums increased by $177,000 over the
comparable ceded premiums for Year Ended 2017. The increase was due
to an increase in premiums subject to excess of loss
reinsurance.
36
Catastrophe reinsurance treaty
Most
of the premiums written under our personal lines are also subject
to our catastrophe treaties. An increase in our personal lines
business gives rise to more property exposure, which increases our
exposure to catastrophe risk; therefore, our premiums ceded under
catastrophe treaties will increase. This results in an increase in
premiums ceded under our catastrophe treaties provided that
reinsurance rates are stable or are increasing. In Year Ended 2018,
our premiums ceded under catastrophe treaties increased by
$3,173,000 over the comparable ceded premiums for Year Ended 2017.
The increase was due to an increase in our catastrophe coverage and
an increase in premiums subject to catastrophe reinsurance,
partially offset by more favorable reinsurance rates in Year Ended
2018. Our ceded catastrophe premiums are paid based on the total
direct written premiums subject to the catastrophe reinsurance
treaty.
Our
ceded catastrophe premiums are paid based on the total direct
written premiums subject to the catastrophe reinsurance
treaty.
Net premiums earned
Net
premiums earned increased $26,064,000, or 33.7%, to $103,415,000 in
Year Ended 2018 from $77,351,000 in Year Ended 2017. The increase
was due to the increase in written premiums discussed above and our
retaining more earned premiums effective July 1, 2017 and 2018, as
a result of the reductions of the quota share percentage in our
personal lines quota share treaties.
Ceding Commission Revenue
The
following table details the quota share provisional ceding
commission rates in effect during Year Ended 2018 and Year Ended
2017. This table should be referred to in conjunction with the
discussion for ceding commission revenue that follows.
|
|
Year
ended December 31, 2018
|
Year ended December 31,
2017
|
||
|
|
January
1,
to
June
30,
|
July
1,
to
December
31,
|
January
1,
to
June
30,
|
July
1,
to
December
31,
|
|
|
("2017/2019 Treaty")
|
("2017/2019 Treaty")
|
("2015/2016 Treaty")
|
("2016/2017 Treaty")
|
|
|
|
|
|
|
|
Provisional ceding commission rate on quota share
treaty
|
|
|
|
|
|
Personal
lines
|
53%
|
53%
|
52%
|
53%
|
The
following table summarizes the changes in the components of ceding
commission revenue (in thousands) for the periods
indicated:
|
|
Years
ended December 31,
|
|||
|
($
in thousands)
|
2018
|
2017
|
Change
|
Percent
|
|
|
|
|
|
|
|
Provisional
ceding commissions earned
|
$
6,746
|
$
10,677
|
$
(3,931
)
|
(36.8)
%
|
|
|
|
|
|
|
|
Contingent
ceding commissions earned
|
|
|
|
|
|
Contingent
ceding commissions earned excluding
|
|
|
|
|
|
the
effect of catastrophes
|
(954
)
|
(744
)
|
(210
)
|
28.2
%
|
|
Effect
of catastrophes on ceding commissions earned
|
(459
)
|
-
|
(459
)
|
n/a
|
|
Contingent
ceding commissions earned
|
(1,413
)
|
(744
)
|
(669
)
|
89.9
%
|
|
|
|
|
|
|
|
Total
ceding commission revenue
|
$
5,333
|
$
9,933
|
$
(4,600
)
|
(46.3)
%
|
37
Ceding commission revenue was
$5,333,000
in Year Ended 2018 compared to
$9,933,000
in Year Ended 2017. The
decrease of
$4,600,000,
or
46.3%, was due to a decrease in provisional ceding commissions
earned, as well as a decrease in contingent ceding commissions
earned. The reduction in provisional ceding commissions occurred
due to the decision to retain more of our profitable business (see
below for discussion of provisional ceding commissions earned and
contingent ceding commissions earned).
Provisional Ceding Commissions
Earned
We
receive a provisional ceding commission based on ceded written
premiums. The $3,931,000 decrease in provisional ceding commissions
earned is primarily due to the decreases in the quota share ceding
rate: (1) effective July 1, 2018 to 10%, from the 20% rate in
effect from July 1, 2017 through June 30, 2018, and (2) effective
July 1, 2017 to 20%, from the 40% rate in effect from January 1,
2017 through June 30, 2017; thus there were fewer ceded premiums in
2018 available to earn ceding commissions than there were in 2017.
The decrease was partially offset by an increase in personal lines
direct written premiums subject to the quota share and by the one
percentage point increase in our provisional ceding commission rate
as disclosed in the table above.
Contingent Ceding Commissions Earned
We
receive a contingent ceding commission based on a sliding scale in
relation to the losses incurred under our quota share treaties. The
lower the ceded loss ratio, the more contingent commission we
receive. The amount of contingent ceding commissions we are
eligible to receive under the 2017/2019 Treaty is subject to change
based on losses incurred from claims with accident dates beginning
July 1, 2017. The amount of contingent ceding commissions we are
eligible to receive under our prior years’ quota share
treaties is subject to change based on losses incurred related to
claims with accident dates before July 1, 2017.
The
2017/2019 Treaty and 2016/2017 Treaty structures limit the amount
of contingent ceding commissions that we can receive by setting a
higher provisional commission rate than the rates received in prior
years. As a result of the higher upfront provisional ceding
commissions that we receive, there is only a limited opportunity to
earn contingent ceding commissions under these treaties. Under our
current “net” treaty structure, catastrophe losses in
excess of the $5,000,000 retention will fall outside of the quota
share treaty and such losses will not have an impact on contingent
ceding commissions. In Year Ended 2018, catastrophe losses of
$1,506,000 were ceded under our personal lines quota share treaty.
These catastrophe losses resulted in the Loss Ratios for the period
July 1, 2017 through June 30, 2018 (attributable to the 2017/2019
Treaty) being higher than the contractual Loss Ratio at which
provisional ceding commissions were being earned. As a result, we
incurred a negative adjustment or reduction to the contingent
ceding commissions of $459,000 relative to what would have been
earned had the catastrophe losses not occurred. See
“Reinsurance” below for changes to our personal lines
quota share treaty effective July 1, 2018.
38
Net Investment Income
Net investment income was
$6,186,000
in Year Ended 2018 compared to
$4,133,000
in Year Ended 2017. The
increase of
$2,053,000
, or
49.7%, was due to an increase in average invested assets in Year
Ended 2018. The average yield on invested assets was 3.79% as of
December 31, 2018 compared to 3.66% as of December 31, 2017. The
pre-tax equivalent yield on invested assets was 3.44% and 3.70% as
of December 31, 2018 and 2017, respectively.
Cash
and invested assets were $195,567,000 as of December 31, 2018,
compared to $187,526,000 as of December 31, 2017. The $8,041,000
increase in cash and invested assets resulted primarily from
increased operating cash flows for the year ended December 31,
2018.
Net Gains and Losses on Investments
Net losses on investments were
$2,496,000
in Year Ended 2018 compared to a net
gain of
$84,000
in Year Ended
2017. The increased loss of
$2,580,000
, was primarily attributable to an accounting
standard change (ASU 2016-01, see
Note 2 in the accompanying
Consolidated Financial Statements for further discussion over our
accounting policies following Item 15 of this Annual
Report
) with respect to the changes in
fair value of equity securities and other investments.
Historically, the change in unrealized gains (losses) for these
investments would flow through other comprehensive (loss) income.
As a result of the new accounting standard, the change in
unrealized gains (losses) is now recorded in the statements of
income and comprehensive (loss) income. Unrealized losses on our
equity securities and other investments in Year Ended 2018 were
$2,383,000. Realized losses on investments was $56,000 in Year
Ended 2018 compared to realized gains of $84,000 in Year Ended
2017.
Other Income
Other
income was $1,334,000 in Year Ended 2018 compared to $1,268,000 in
Year Ended 2017.
The increase of
$66,000, or 5.2%, was primarily due to an increase in installment
and other fees earned in our insurance underwriting
business.
Net Loss and LAE
Net loss and LAE was
$52,068,000
in Year Ended 2018 compared to
$34,186,000
in Year Ended 2017. The
net loss ratio was 56.4% in Year Ended 2018 compared to 44.2% in
Year Ended 2017, an increase of 12.2 percentage
points.
39
The
following graphs summarize the changes in the components of net
loss ratio for the periods indicated:
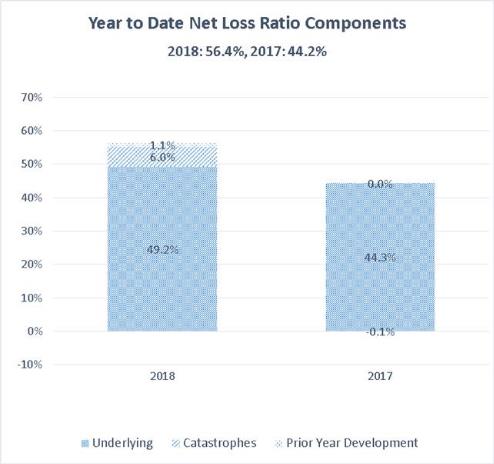
During
2018, the net loss ratio increased compared to 2017 primarily due
to the impact of catastrophe losses. In 2018 there were nine
catastrophic events that affected us, with most of the impact
related to several major winter storms from the first quarter. We
recorded a 6.0 point impact from catastrophes in 2018 in comparison
to no impact from catastrophe events during 2017. In addition
to the impact of catastrophes, we recorded 1.1 points of
unfavorable prior year loss development in 2018 compared to 0.1
points of favorable prior year development in 2017. The underlying
loss ratio excluding the impact of catastrophes and prior year
development was 49.2% in 2018, an increase of 4.9 points from the
44.3% underlying loss ratio for 2017. The underlying loss
ratio rose due to an increased impact from larger fire and
liability claims in 2018 compared to 2017. Average claim severity
on smaller non-weather related water claims has also increased
significantly over the last year. See table below under
“Additional Financial Information” summarizing net loss
ratios by line of business.
40
Commission Expense
Commission expense was
$25,342,000
in 2018 or 19.0% of direct earned
premiums. Commission expense was
$21,182,000
in 2017 or 19.1% of direct earned premiums. The
increase of
$4,160,000
is due
to the increase in direct written premiums in 2018 as compared to
2017.
Other Underwriting Expenses
Other
underwriting expenses were $20,943,000 in Year Ended 2018 compared
to $18,116,000 in Year Ended 2017. The increase of $2,827,000, or
15.6%, was primarily due to expenses related to growth in direct
written premiums. We are also incurring expenses related to
expansion into the states where we are newly licensed to write
business (“Expansion Expenses”). Expenses directly
related to the increase in direct written premiums primarily
consist of underwriting expenses, software usage fees, and state
premium taxes. Expenses indirectly related to the increase in
direct written premiums primarily consist of salaries along with
related other employment costs. Expansion Expenses were $1,653,000
in Year Ended 2018 compared to $1,044,000 in Year Ended 2017. The
increase of $619,000 includes the costs of salaries and employment
costs, professional fees, IT and data services specifically
attributable to the expansion into new states.
Core
salaries and employment costs were $8,444,000 in Year Ended 2018
compared to $7,385,000 in Year Ended 2017. The increase of
$1,059,000, or 14.3%, was less than the 20.7% increase in total
direct written premiums. The increase in employment costs was due
to hiring of additional staff to service our current level of
business and anticipated growth in volume, hiring our new Chief
Operating Officer in March 2018 (Chief Executive Officer effective
January 1, 2019) as well as annual increases in salaries. Growth
related to our Expansion business creates a lag in net premiums
earned compared to direct written premiums for that business. This
lag in net premiums earned along with the reduction to quota share
rates distorts net underwriting expense ratio comparisons between
periods. Therefore, we believe that reviewing the ratio of Core
other underwriting expenses to Core net premiums earned offers a
more consistent comparison between periods and is a more accurate
indicator of our overall other underwriting expense efficiency. The
following table breaks out the Core and Expansion components of our
underwriting expense ratio for the periods indicated:
|
|
Years
ended
December
31,
|
$ or
|
|
|
|
2018
|
2017
|
Point
Change
|
|
|
|
|
|
|
Net
premiums earned
|
|
|
|
|
Core
|
$
99,657
|
$
77,007
|
$
22,650
|
|
Expansion
|
3,758
|
344
|
3,414
|
|
Total
|
$
103,415
|
$
77,351
|
$
26,064
|
|
|
|
|
|
|
Other
underwriting expenses
|
|
|
|
|
Core
|
$
19,290
|
$
17,072
|
$
2,218
|
|
Expansion
|
1,653
|
1,044
|
609
|
|
Total
|
$
20,943
|
$
18,116
|
$
2,827
|
|
|
|
|
|
|
Other
underwriting expenses as a percentage
|
|
|
|
|
of
net premiums earned
|
|
|
|
|
Core
|
19.4
%
|
22.2
%
|
-2.8
%
|
|
Expansion
|
44.0
%
|
303.5
%
|
-259.5
%
|
|
Total
|
20.3
%
|
23.4
%
|
-3.1
%
|
The
ratio of Core other underwriting expenses to Core net premiums
earned was 19.4% in Year Ended 2018 compared to 22.2% in Year Ended
2017, a decrease of 1.3 percentage points.
41
Our net underwriting expense ratio in Year Ended
2018 was 38.4% compared with 36.4% in Year Ended 2017. The
following table shows the individual components of our net
underwriting expense ratio for the periods indicated:
|
|
Years
ended
|
|
|
|
|
December
31,
|
Percentage
|
|
|
|
2018
|
2017
|
Point
Change
|
|
|
|
|
|
|
Ceding
commission revenue - provisional
|
(6.5
)%
|
(13.8
)%
|
7.3
|
|
Ceding
commission revenue - contingent
|
1.4
|
1.0
|
0.4
|
|
Other
income
|
(1.2
)
|
(1.6
)
|
0.4
|
|
Acquisition
costs and other underwriting expenses:
|
|
|
|
|
Commission
expense
|
24.5
|
27.4
|
(2.9
)
|
|
|
18.2
|
13.0
|
5.2
|
|
Other
underwriting expenses
|
|
|
|
|
Core
|
|
|
|
|
Employment
costs
|
8.2
|
9.5
|
(1.3
)
|
|
Other Core Expenses
|
10.4
|
12.6
|
(2.2
)
|
|
Total
Core Expenses
|
18.6
|
22.1
|
(3.5
)
|
|
Expansion
Expenses
|
1.6
|
1.3
|
0.3
|
|
Total
other underwriting expenses
|
20.2
|
23.4
|
(3.2
)
|
|
|
|
|
|
|
Net
underwriting expense ratio
|
38.4
%
|
36.4
%
|
2.0
|
The
decrease in our other underwriting expense ratio excluding the
impact of ceding commission revenue and commission expense was
driven by a decline of 3.5 points from the impact of employment
costs and other expenses attributable to our growing Core
business.
The
overall increase of 2.0 percentage points in the net underwriting
expense ratio was driven almost entirely by the change in our quota
share ceding rates and its impact on provisional ceding commission
revenue as a result of the additional retention resulting from the
Cut-off to our quota share treaty on July 1, 2018. The components
of our net underwriting expense ratio related to commissions and
other underwriting expenses improved in nearly all categories, but
this was more than offset by reductions in the reinsurance ceding
commission revenue components.
Other Operating Expenses
Other operating expenses, related to the expenses
of our holding company, were
$2,575,000
in Year Ended 2018 compared to
$3,513,
000 in Year Ended 2018. The
decrease in Year Ended 2018 of $938,000, or 26.7%, was primarily
due to a decrease in accrued executive bonus compensation pursuant
to the employment agreement effective January 1, 2017 with Barry B.
Goldstein, our Chief Executive Officer. The bonus is a one-time
payment computed at the end of the three-year period ended December
31, 2019, and the amount accrued through December 31, 2018 will
only be paid if the three-year computation meets the required terms
of profitability. The decrease in executive bonus computation was
partially offset by an increase in salary and equity compensation
due to the hiring of Dale A. Thatcher, our new Chief Operating
Officer, in March 2018 (Chief Executive Officer effective January
1, 2019).
42
Depreciation and Amortization
Depreciation
and amortization was $1,787,000 in Year Ended 2018 compared to
$1,403,000 in Year Ended 2017. The increase of $384,000, or 27.4%,
in depreciation and amortization was primarily due to depreciation
of our new systems platform for handling business being written in
Expansion states. The increase was also impacted by newly purchased
assets used to upgrade our systems infrastructure and improvements
to the Kingston, New York home office building from which we
operate.
Interest Expense
Interest
expense in Year Ended 2018 was $1,822,000 and $60,000 in Year Ended
2017. We incurred interest expense in connection with our
$30.0 million issuance of long-term debt in December
2017.
Income Tax Benefit/Expense
Income
tax benefit in Year Ended 2018 was $86,000, which resulted in an
effective tax rate of (2.9) %. Income tax expense in Year Ended
2017 was $4,323,000, which resulted in an effective tax rate of
30.2%. The change in our effective tax rate includes the change in
the federal tax rate from 35% to 21% (see Note 2 in the
accompanying Consolidated Financial Statements for further
discussion over our accounting policies following Item 15 of this
Annual Report). In addition, permanent differences in Year Ended
2018 had a greater impact on reducing the current year effective
tax rate due to a decrease in income before taxes in Year Ended
2018 compared to the Year Ended 2017 amount. Income before taxes
was $3,007,000 in Year Ended 2018 compared to income before taxes
of $14,309,000 in Year Ended 2017.
Net Income
Net
income was $3,093,000 in Year Ended 2018 compared to $9,986,000 in
Year Ended 2017. The decrease in net income of $6,893,000, or
69.0%, was due to the circumstances described above, which caused
the increase in our net loss ratio, decrease in ceding commission
revenue, net losses on investments, increases in other underwriting
expenses, depreciation and amortization and interest expense,
partially offset by the increase in our net premiums earned, net
investment income and decrease in other operating
expenses.
Additional Financial Information
We
operate our business as one segment, property and casualty
insurance. Within this segment, we offer a wide array of property
and casualty policies to our producers. The following table
summarizes gross and net premiums written, net premiums earned, and
loss and loss adjustment expenses by major product type, which were
determined based primarily on similar economic characteristics and
risks of loss.
43
|
|
Years
ended
|
|
|
|
December
31,
|
|
|
|
2018
|
2017
|
|
|
|
|
|
Gross
premiums written:
|
|
|
|
Personal
lines
|
$
119,971,418
|
$
95,993,591
|
|
Commercial
lines
|
16,702,409
|
14,632,300
|
|
Livery
physical damage
|
9,792,456
|
10,727,707
|
|
Other(1)
|
251,190
|
244,427
|
|
Total
|
$
146,717,473
|
$
121,598,025
|
|
|
|
|
|
Net
premiums written:
|
|
|
|
Personal
lines
|
|
|
|
Excluding
the effect of quota share adjustments on July 1
|
$
90,439,690
|
$
61,756,415
|
|
Return
of premiums previously ceded to prior quota share treaties prior
quota share treaties
|
4,553,345
|
7,140,088
|
|
Personal
lines (2)
|
94,993,035
|
68,896,503
|
|
Commercial
lines
|
14,779,752
|
13,038,640
|
|
Livery
physical damage
|
9,792,456
|
10,727,707
|
|
Other(1)
|
228,551
|
206,026
|
|
Total
|
$
119,793,794
|
$
92,868,876
|
|
|
|
|
|
Net
premiums earned:
|
|
|
|
Personal
lines (2)
|
$
79,603,364
|
$
53,556,294
|
|
Commercial
lines
|
13,804,284
|
12,163,104
|
|
Livery
physical damage
|
9,797,939
|
11,441,168
|
|
Other(1)
|
209,128
|
190,457
|
|
Total
|
$
103,414,715
|
$
77,351,023
|
|
|
|
|
|
Net
loss and loss adjustment expenses:
|
|
|
|
Personal
lines
|
$
43,287,170
|
$
20,866,628
|
|
Commercial
lines
|
8,220,382
|
6,368,927
|
|
Livery
physical damage
|
4,211,273
|
4,870,947
|
|
Other(1)
|
334,015
|
(14,686
)
|
|
Unallocated
loss adjustment expenses
|
2,242,365
|
2,093,721
|
|
Total
|
$
58,295,205
|
$
34,185,537
|
|
|
|
|
|
Net
loss ratio:
|
|
|
|
Personal
lines
|
54.4
%
|
39.0
%
|
|
Commercial
lines
|
59.5
%
|
52.4
%
|
|
Livery
physical damage
|
43.0
%
|
42.6
%
|
|
Other(1)
|
159.7
%
|
-7.7
%
|
|
Total
|
56.4
%
|
44.2
%
|
(1)
“Other”
includes, among other things, premiums and loss and loss adjustment
expenses from our participation in a mandatory state joint
underwriting association and loss and loss adjustment expenses from
commercial auto.
(2)
See discussions
above with regard to “Net Written Premiums and Net Premiums
Earned”, as to changes in quota share ceding rates, effective
July 1, 2018 and 2017.
(3)
See discussions
above with regard to “Net Loss and LAE”, as to
catastrophe losses in 2018.
44
Insurance
Underwriting Business on a Standalone Basis
Our
insurance underwriting business reported on a standalone basis for
the years ended December 31, 2018 and 2017 follows:
|
|
Years
ended
|
|
|
|
December
31,
|
|
|
|
2018
|
2017
|
|
|
|
|
|
Revenue
s
|
|
|
|
Net
premiums earned
|
$
103,414,715
|
$
77,351,023
|
|
Ceding
commission revenue
|
5,332,630
|
9,933,133
|
|
Net
investment income
|
6,037,441
|
4,132,586
|
|
Net
(losses) gains on investments
|
(2,439,026
)
|
84,313
|
|
Other
income
|
1,266,654
|
1,210,897
|
|
Total
revenues
|
113,612,414
|
92,711,952
|
|
|
|
|
|
Expense
s
|
|
|
|
Loss
and loss adjustment expenses
|
58,295,205
|
34,185,537
|
|
Commission
expense
|
25,342,137
|
21,182,254
|
|
Other
underwriting expenses
|
20,943,342
|
18,115,614
|
|
Depreciation
and amortization
|
1,787,150
|
1,402,928
|
|
Total
expenses
|
106,367,834
|
74,886,333
|
|
|
|
|
|
Income
from operations
|
7,244,580
|
17,825,619
|
|
Income
tax expense
|
1,387,508
|
5,764,191
|
|
Net
incom
e
|
$
5,857,072
|
$
12,061,428
|
|
|
|
|
|
Key Measures:
|
|
|
|
Net
loss ratio
|
56.4
%
|
44.2
%
|
|
Net
underwriting expense ratio
|
38.4
%
|
36.4
%
|
|
Net
combined ratio
|
94.8
%
|
80.6
%
|
|
|
|
|
|
Reconciliation
of net underwriting expense ratio:
|
|
|
|
Acquisition
costs and other
|
|
|
|
underwriting
expenses
|
$
46,285,479
|
$
39,297,868
|
|
Less:
Ceding commission revenue
|
(5,332,630
)
|
(9,933,133
)
|
|
Less:
Other income
|
(1,266,654
)
|
(1,210,897
)
|
|
Net
underwriting expenses
|
$
39,686,195
|
$
28,153,838
|
|
|
|
|
|
Net
premiums earned
|
$
103,414,715
|
$
77,351,023
|
|
|
|
|
|
Net
Underwriting Expense Ratio
|
38.4
%
|
36.4
%
|
45
An
analysis of our direct, assumed and ceded earned premiums, loss and
loss adjustment expenses, and loss ratios is shown
below:
|
|
Direct
|
Assumed
|
Ceded
|
Net
|
|
|
|
|
|
|
|
Year ended December 31,
2018
|
|
|
|
|
|
Written
premiums
|
$
146,716,468
|
$
1,004
|
$
(26,923,679
)
|
$
119,793,793
|
|
Change
in unearned premiums
|
(13,388,535
)
|
4,067
|
(2,994,610
)
|
(16,379,078
)
|
|
Earned
premiums
|
$
133,327,933
|
$
5,071
|
$
(29,918,289
)
|
$
103,414,715
|
|
|
|
|
|
|
|
Loss
and loss adjustment expenses exluding
|
|
|
|
|
|
the
effect of catastrophes
|
$
61,921,559
|
$
28,237
|
$
(9,882,474
)
|
$
52,067,322
|
|
Catastrophe
loss
|
10,828,121
|
-
|
(4,600,238
)
|
6,227,883
|
|
Loss
and loss adjustment expenses
|
$
72,749,680
|
$
28,237
|
$
(14,482,712
)
|
$
58,295,205
|
|
|
|
|
|
|
|
Loss
ratio excluding the effect of catastrophes
|
46.4
%
|
556.8
%
|
33.0
%
|
50.4
%
|
|
Catastrophe
loss
|
8.1
%
|
0.0
%
|
15.4
%
|
6.0
%
|
|
Loss
ratio
|
54.5
%
|
556.8
%
|
48.4
%
|
56.4
%
|
|
|
|
|
|
|
|
Year ended December 31,
2017
|
|
|
|
|
|
Written
premiums
|
$
121,575,178
|
$
22,847
|
$
(28,729,149
)
|
$
92,868,876
|
|
Change
in unearned premiums
|
(10,662,744
)
|
9,456
|
(4,864,565
)
|
(15,517,853
)
|
|
Earned
premiums
|
$
110,912,434
|
$
32,303
|
$
(33,593,714
)
|
$
77,351,023
|
|
|
|
|
|
|
|
Loss
and loss adjustment expenses exluding
|
|
|
|
|
|
the
effect of catastrophes
|
$
48,222,147
|
$
30,417
|
$
(14,067,027
)
|
$
34,185,537
|
|
Catastrophe
loss
|
-
|
-
|
-
|
-
|
|
Loss
and loss adjustment expenses
|
$
48,222,147
|
$
30,417
|
$
(14,067,027
)
|
$
34,185,537
|
|
|
|
|
|
|
|
Loss
ratio excluding the effect of catastrophes
|
43.5
%
|
94.2
%
|
41.9
%
|
44.2
%
|
|
Catastrophe
loss
|
0.0
%
|
0.0
%
|
0.0
%
|
0.0
%
|
|
Loss
ratio
|
43.5
%
|
94.2
%
|
41.9
%
|
44.2
%
|
46
The key
measures for our insurance underwriting business for the years
ended December 31, 2018 and 2017 are as follows:
|
|
Years
ended
|
|
|
|
December
31,
|
|
|
|
2018
|
2017
|
|
|
|
|
|
Net
premiums earned
|
$
103,414,715
|
$
77,351,023
|
|
Ceding
commission revenue
|
5,332,630
|
9,933,133
|
|
Other
income
|
1,266,654
|
1,210,897
|
|
|
|
|
|
Loss
and loss adjustment expenses (1)
|
58,295,205
|
34,185,537
|
|
|
|
|
|
Acquisition costs and other underwriting
expenses:
|
|
|
|
Commission
expense
|
25,342,137
|
21,182,254
|
|
Other
underwriting expenses
|
20,943,342
|
18,115,614
|
|
Total
acquisition costs and other
|
|
|
|
underwriting
expenses
|
46,285,479
|
39,297,868
|
|
|
|
|
|
Underwriting
income
|
$
5,433,315
|
$
15,011,648
|
|
|
|
|
|
Key
Measures:
|
|
|
|
Net
loss ratio excluding the effect of catastrophes
|
50.4
%
|
44.2
%
|
|
Effect
of catastrophe loss on net loss ratio (1)
|
6.0
%
|
0.0
%
|
|
Net
loss ratio
|
56.4
%
|
44.2
%
|
|
|
|
|
|
Net
underwriting expense ratio excluding the
|
|
|
|
effect
of catastrophes
|
37.9
%
|
36.4
%
|
|
Effect
of catastrophe loss on net underwriting
|
|
|
|
expense
ratio (2)
|
0.5
%
|
0.0
%
|
|
Net
underwriting expense ratio
|
38.4
%
|
36.4
%
|
|
|
|
|
|
Net
combined ratio excluding the effect
|
|
|
|
of
catastrophes
|
88.3
%
|
80.6
%
|
|
Effect
of catastrophe loss on net combined
|
|
|
|
ratio
(1) (2)
|
6.5
%
|
0.0
%
|
|
Net
combined ratio
|
94.8
%
|
80.6
%
|
|
|
|
|
|
Reconciliation
of net underwriting expense ratio:
|
|
|
|
Acquisition
costs and other
|
|
|
|
underwriting
expenses
|
$
46,285,479
|
$
39,297,868
|
|
Less:
Ceding commission revenue (2)
|
(5,332,630
)
|
(9,933,133
)
|
|
Less:
Other income
|
(1,266,654
)
|
(1,210,897
)
|
|
|
$
39,686,195
|
$
28,153,838
|
|
|
|
|
|
Net
earned premium
|
$
103,414,715
|
$
77,351,023
|
|
|
|
|
|
Net
Underwriting Expense Ratio
|
38.4
%
|
36.4
%
|
(1)
The year ended
December 31, 2018, includes the sum of net catastrophe losses and
loss adjustment expenses of $6,227,883.
(2)
The year ended
December, 2018, the effect of catastrophe loss on our net
underwriting expense ratio includes the direct effect of reduced
contingent ceding commission revenue by $459,068 and does not
include the indirect effects of a $124,817 decrease in other
underwriting expenses.
47
Investments
Portfolio Summary
The
following table presents a breakdown of the amortized cost,
aggregate estimated fair value and unrealized gains and losses by
investment type as of December 31, 2018 and 2017:
Available-for-Sale Securities
|
|
December
31, 2018
|
|||||
|
|
|
|
|
|
|
|
|
|
Cost
or
|
Gross
|
Gross
Unrealized Losses
|
Estimated
|
%
of
|
|
|
|
Amortized
|
Unrealized
|
Less
than 12
|
More
than 12
|
Fair
|
Estimated
|
|
Categor
y
|
Cos
t
|
Gains
|
Months
|
Months
|
Value
|
Fair
Value
|
|
|
|
|
|
|
|
|
|
U.S.
Treasury securities and
|
|
|
|
|
|
|
|
obligations
of U.S. government
|
|
|
|
|
|
|
|
corporations
and agencies
|
$
8,222,050
|
$
26,331
|
$
(28,000
)
|
$
-
|
$
8,220,381
|
5.4
%
|
|
|
|
|
|
|
|
|
|
Political
subdivisions of States,
|
|
|
|
|
|
|
|
Territories
and Possessions
|
6,339,540
|
50,903
|
(12,327
)
|
(36,508
)
|
6,341,608
|
4.2
%
|
|
|
|
|
|
|
|
|
|
Corporate
and other bonds
|
|
|
|
|
|
|
|
Industrial
and miscellaneous
|
119,078,698
|
123,740
|
(2,775,540
)
|
(676,605
)
|
115,750,293
|
76.3
%
|
|
|
|
|
|
|
|
|
|
Residential
mortgage and other
|
|
|
|
|
|
|
|
asset
backed securities (1)
|
21,790,973
|
236,502
|
(231,229
)
|
(331,012
)
|
21,465,234
|
14.1
%
|
|
Total
fixed-maturity securities
|
155,431,261
|
437,476
|
(3,047,096
)
|
(1,044,125
)
|
151,777,516
|
100.0
%
|
(1) In 2017, KICO placed certain residential mortgage backed
securities as eligible collateral in a designated custodian account
related to its relationship with the Federal Home Loan Bank of New
York ("FHLBNY"). The eligible collateral would be pledged to FHLBNY
if KICO draws an advance from FHBLNY. As of December 31, 2018, the
estimated fair value of the eligible investments was $5,116,000.
KICO will retain all rights regarding all securities if pledged as
collateral. As of December 31, 2018, there was no outstanding
balance on the FHLBNY credit line.
|
|
December
31, 2017
|
|||||
|
|
|
|
|
|
|
|
|
|
Cost
or
|
Gross
|
Gross
Unrealized Losses
|
Estimated
|
%
of
|
|
|
|
Amortized
|
Unrealized
|
Less
than 12
|
More
than 12
|
Fair
|
Estimated
|
|
Categor
y
|
Cos
t
|
Gains
|
Months
|
Months
|
Value
|
Fair
Value
|
|
|
|
|
|
|
|
|
|
U.S.
Treasury securities and
|
|
|
|
|
|
|
|
obligations
of U.S. government
|
|
|
|
|
|
|
|
corporations
and agencies
|
$
-
|
$
-
|
$
-
|
$
-
|
$
-
|
0.0
%
|
|
|
|
|
|
|
|
|
|
Political
subdivisions of States,
|
|
|
|
|
|
|
|
Territories
and Possessions
|
11,096,122
|
250,135
|
(30,814
)
|
-
|
11,315,443
|
9.4
%
|
|
|
|
|
|
|
|
|
|
Corporate
and other bonds
|
|
|
|
|
|
|
|
Industrial
and miscellaneous
|
87,562,631
|
1,189,207
|
(269,857
)
|
(340,516
)
|
88,141,465
|
73.5
%
|
|
|
|
|
|
|
|
|
|
Residential
mortgage and other
|
|
|
|
|
|
|
|
asset
backed securities (1)
|
20,463,353
|
305,499
|
(48,482
)
|
(189,022
)
|
20,531,348
|
17.1
%
|
|
Total
fixed-maturity securities
|
119,122,106
|
1,744,841
|
(349,153
)
|
(529,538
)
|
119,988,256
|
100.0
%
|
(1) In
2017, KICO placed certain residential mortgage backed securities as
eligible collateral in a designated custodian account related to
its membership in the FHLBNY. The eligible collateral would be
pledged to FHLBNY if KICO draws an advance from the FHBLNY credit
line. As of December 31, 2017, the estimated fair value of the
eligible investments was $6,703,000. KICO will retain all rights
regarding all securities if pledged as collateral. As of December
31, 2017, there was no outstanding balance on the FHLBNY credit
line.
48
Equity Securities
The
following table presents a breakdown of the cost, estimated fair
value, and gross gains and losses of investments in equity
securities as of December 31, 2018 and 2017:
|
|
December
31, 2018
|
||||
|
|
|
|
|
Estimated
|
%
of
|
|
|
|
Gross
|
Gross
|
Fair
|
Estimated
|
|
Categor
y
|
Cost
|
Gains
|
Losses
|
Value
|
Fair
Value
|
|
|
|
|
|
|
|
|
Equity Securities:
|
|
|
|
|
|
|
Preferred
stocks
|
$
6,694,754
|
$
-
|
$
(541,798
)
|
$
6,152,956
|
37.1
%
|
|
Common
stocks and exchange
|
|
|
|
|
|
|
traded
mutual funds
|
11,611,232
|
99,817
|
(1,291,389
)
|
10,419,660
|
62.9
%
|
|
Total
|
$
18,305,986
|
$
99,817
|
$
(1,833,187
)
|
$
16,572,616
|
100.0
%
|
|
|
December
31, 2017
|
||||
|
|
|
|
|
Estimated
|
%
of
|
|
|
|
Gross
|
Gross
|
Fair
|
Estimated
|
|
Categor
y
|
Cost
|
Gains
|
Losses
|
Value
|
Fair
Value
|
|
|
|
|
|
|
|
|
Equity Securities:
|
|
|
|
|
|
|
Preferred
stocks
|
$
7,081,099
|
$
60,867
|
$
(141,025
)
|
$
7,000,941
|
49.0
%
|
|
Common
stocks and exchange
|
|
|
|
|
|
|
traded
mutual funds
|
6,680,742
|
841,250
|
(236,735
)
|
7,285,257
|
51.0
%
|
|
Total
|
$
13,761,841
|
$
902,117
|
$
(377,760
)
|
$
14,286,198
|
100.0
%
|
Other Investments
Pursuant to the
definition of “Fair Value Measurement,” set forth in
the Accounting Standards Codification 820 (the “ASC
820”) an entity is permitted, as a practical expedient, to
estimate the fair value of an investment within the scope of ASC
820 using the net asset value (“NAV”) per share (or its
equivalent) of the investment. The following table presents a
breakdown of the cost, estimated fair value, and gross losses of
our other investments as of December 31, 2018 and
2017:
|
|
December
31, 2018
|
December
31, 2017
|
||||
|
|
|
Gross
|
Estimated
|
|
Gross
|
Estimated
|
|
Categor
y
|
Cost
|
(Losses)
|
Fair
Value
|
Cost
|
Gains
|
Fair
Value
|
|
|
|
|
|
|
|
|
|
Other Investments:
|
|
|
|
|
|
|
|
Hedge
fund
|
$
1,999,381
|
$
(144,156
)
|
$
1,855,225
|
$
-
|
$
-
|
$
-
|
|
Total
|
$
1,999,381
|
$
(144,156
)
|
$
1,855,225
|
$
-
|
$
-
|
$
-
|
49
Held-to-Maturity Securities
|
|
December
31, 2018
|
|||||
|
|
|
|
|
|
|
|
|
|
Cost
or
|
Gross
|
Gross
Unrealized Losses
|
Estimated
|
%
of
|
|
|
|
Amortized
|
Unrealized
|
Less
than 12
|
More
than 12
|
Fair
|
Estimated
|
|
Categor
y
|
Cos
t
|
Gains
|
Months
|
Months
|
Value
|
Fair
Value
|
|
|
|
|
|
|
|
|
|
U.S.
Treasury securities
|
$
729,507
|
$
147,532
|
$
(3,964
)
|
$
-
|
$
873,075
|
19.7
%
|
|
|
|
|
|
|
|
|
|
Political
subdivisions of States,
|
|
|
|
|
|
|
|
Territories
and Possessions
|
998,803
|
33,862
|
-
|
-
|
1,032,665
|
23.3
%
|
|
|
|
|
|
|
|
|
|
Corporate
and other bonds
|
|
|
|
|
|
|
|
Industrial
and miscellaneous
|
2,494,545
|
38,461
|
(1,425
)
|
(10,905
)
|
2,520,676
|
57.0
%
|
|
|
|
|
|
|
|
|
|
Total
|
$
4,222,855
|
$
219,855
|
$
(5,389
)
|
$
(10,905
)
|
$
4,426,416
|
100.0
%
|
|
|
December
31, 2017
|
|||||
|
|
|
|
|
|
|
|
|
|
Cost
or
|
Gross
|
Gross
Unrealized Losses
|
Estimated
|
%
of
|
|
|
|
Amortized
|
Unrealized
|
Less
than 12
|
More
than 12
|
Fair
|
Estimated
|
|
Categor
y
|
Cos
t
|
Gains
|
Months
|
Months
|
Value
|
Fair
Value
|
|
|
|
|
|
|
|
|
|
U.S.
Treasury securities
|
$
729,466
|
$
147,573
|
$
(1,729
)
|
$
-
|
$
875,310
|
17.0
%
|
|
|
|
|
|
|
|
|
|
Political
subdivisions of States,
|
|
|
|
|
|
|
|
Territories
and Possessions
|
998,984
|
50,366
|
-
|
-
|
1,049,350
|
20.4
%
|
|
|
|
|
|
|
|
|
|
Corporate
and other bonds
|
|
|
|
|
|
|
|
Industrial
and miscellaneous
|
3,141,358
|
90,358
|
-
|
(6,300
)
|
3,225,416
|
62.6
%
|
|
|
|
|
|
|
|
|
|
Total
|
$
4,869,808
|
$
288,297
|
$
(1,729
)
|
$
(6,300
)
|
$
5,150,076
|
100.0
%
|
Held-to-maturity
U.S. Treasury securities are held in trust pursuant to various
states’ minimum fund requirements.
A
summary of the amortized cost and fair value of our investments in
held-to-maturity securities by contractual maturity as of December
31, 2018 and 2017 is shown below:
|
|
December
31, 2018
|
December
31, 2017
|
||
|
|
Amortized
|
Estimated
|
Amortized
|
Estimated
|
|
Remaining Time to
Maturit
y
|
Cost
|
Fair
Value
|
Cost
|
Fair
Value
|
|
|
|
|
|
|
|
Less
than one year
|
$
-
|
$
-
|
$
-
|
$
-
|
|
One
to five years
|
2,996,685
|
3,036,531
|
2,546,459
|
2,601,898
|
|
Five
to ten years
|
619,663
|
635,846
|
1,716,884
|
1,794,139
|
|
More
than 10 years
|
606,507
|
754,039
|
606,465
|
754,039
|
|
Total
|
$
4,222,855
|
$
4,426,416
|
$
4,869,808
|
$
5,150,076
|
50
Credit Rating of Fixed-Maturity Securities
The
table below summarizes the credit quality of our available-for-sale
fixed-maturity securities as of December 31, 2018 and 2017 as rated
by Standard and Poor’s (or, if unavailable from Standard and
Poor’s, then Moody’s or Fitch):
|
|
December
31, 2018
|
December
31, 2017
|
||
|
|
Estimated
|
Percentage
of
|
Estimated
|
Percentage
of
|
|
|
Fair
Market
|
Fair
Market
|
Fair
Market
|
Fair
Market
|
|
|
Value
|
Value
|
Value
|
Value
|
|
|
|
|
|
|
|
Rating
|
|
|
|
|
|
U.S. Treasury securities
|
$
8,220,381
|
5.4
%
|
$
-
|
0.0
%
|
|
|
|
|
|
|
|
Corporate and municipal bonds
|
|
|
|
|
|
AAA
|
979,123
|
0.6
%
|
1,358,143
|
1.1
%
|
|
AA
|
8,350,910
|
5.5
%
|
11,319,057
|
9.4
%
|
|
A
|
27,665,961
|
18.2
%
|
17,199,631
|
14.3
%
|
|
BBB
|
85,095,907
|
56.1
%
|
68,704,768
|
57.3
%
|
|
BB
|
-
|
0.0
%
|
875,310
|
0.7
%
|
|
Total corporate and municipal bonds
|
122,091,901
|
80.4
%
|
99,456,909
|
82.8
%
|
|
|
|
|
|
|
|
Residential mortgage backed securities
|
|
|
|
|
|
AAA
|
999,640
|
0.7
%
|
2,013,010
|
1.7
%
|
|
AA
|
12,743,906
|
8.5
%
|
11,021,144
|
9.2
%
|
|
A
|
4,777,356
|
3.1
%
|
3,902,768
|
3.3
%
|
|
CCC
|
1,440,825
|
0.9
%
|
1,420,296
|
1.2
%
|
|
CC
|
109,648
|
0.1
%
|
120,742
|
0.1
%
|
|
C
|
24,050
|
0.0
%
|
28,963
|
0.0
%
|
|
D
|
390,542
|
0.3
%
|
1,659,479
|
1.4
%
|
|
Non rated
|
979,267
|
0.6
%
|
364,945
|
0.3
%
|
|
Total residential
mortgage backed securities
|
21,465,234
|
14.2
%
|
20,531,347
|
17.2
%
|
|
|
|
|
|
|
|
Total
|
$
151,777,516
|
100.0
%
|
$
119,988,256
|
100.0
%
|
The
table below details the average yield by type of fixed-maturity
security as of December 31, 2018 and 2017:
|
Categor
y
|
December
31, 2018
|
December
31, 2017
|
|
U.S.
Treasury securities and
obligations
of U.S. government
corporations
and agencies
|
2.20
%
|
3.32
%
|
|
|
|
|
|
Political
subdivisions of States,
Territories
and Possessions
|
3.62
%
|
3.49
%
|
|
|
|
|
|
Corporate and other bonds
Industrial
and miscellaneous
|
4.11
%
|
3.98
%
|
|
|
|
|
|
Residential
mortgage backed securities
|
1.94
%
|
1.83
%
|
|
|
|
|
|
Total
|
3.68
%
|
3.58
%
|
51
The
table below lists the weighted average maturity and effective
duration in years on our fixed-maturity securities as of December
31, 2018 and 2017:
|
|
December
31, 2018
|
December
31, 2017
|
|
Weighted
average effective maturity
|
5.6
|
5.7
|
|
|
|
|
|
Weighted
average final maturity
|
6.9
|
7.8
|
|
|
|
|
|
Effective
duration
|
4.6
|
4.9
|
Fair Value Consideration
As
disclosed in Note 4 to the Consolidated Financial Statements, with
respect to “Fair Value Measurements,” we define fair
value as the price that would be received to sell an asset or paid
to transfer a liability in a transaction involving identical or
comparable assets or liabilities between market participants (an
“exit price”). The fair value hierarchy distinguishes
between inputs based on market data from independent sources
(“observable inputs”) and a reporting entity’s
internal assumptions based upon the best information available when
external market data is limited or unavailable (“unobservable
inputs”). The fair value hierarchy prioritizes fair value
measurements into three levels based on the nature of the inputs.
Quoted prices in active markets for identical assets have the
highest priority (“Level 1”), followed by observable
inputs other than quoted prices including prices for similar but
not identical assets or liabilities (“Level 2”), and
unobservable inputs, including the reporting entity’s
estimates of the assumption that market participants would use,
having the lowest priority (“Level 3”). As of December
31
, 2018
and December 31, 2017,
81% and 73%, respectively, of the investment portfolio recorded at
fair value was priced based upon quoted market prices.
As more
fully described in Note 3 to our Consolidated Financial Statements,
“Investments—Impairment Review,” we completed a
detailed review of all our securities in a continuous loss position
as of December 31
, 2018
and
December 31, 2017.
In
December, 2017, we
disposed of one of
our held-to-maturity debt securities that was previously included
in other than temporary impairment (“OTTI”); the bond
was issued by the Commonwealth of Puerto Rico
(“PR”).
In July
2016, PR defaulted on its interest payment to bondholders. Due to
the credit deterioration of PR, we recorded our first credit loss
component of OTTI on this investment as of June 30, 2016. As of
December 31, 2016, the full amount of the write-down was recognized
as a credit component of OTTI in the amount of $69,911. In
September 2017, Hurricane Maria significantly affected Puerto Rico.
The impact of this event further contributed to the credit
deterioration of PR and, as a result, we recorded an additional
credit loss component of OTTI on this investment for the amount of
$50,000 during the quarter ended September 30, 2017. The total of
the two OTTI write-downs of this investment as of December 31, 2017
was $119,911. We determined that none of the other unrealized
losses were deemed to be OTTI for our portfolio of fixed-maturity
investments and equity securities for the years ended December 31,
2018 and 2017. Significant factors influencing our determination
that unrealized losses were temporary included the magnitude of the
unrealized losses in relation to each security’s cost, the
nature of the investment and management’s intent and ability
to retain the investment for a period of time sufficient to allow
for an anticipated recovery of fair value to our cost
basis.
52
The
table below summarizes the gross unrealized losses of our
fixed-maturity securities available-for-sale and equity securities
by length of time the security has continuously been in an
unrealized loss position as of December 31, 2018 and
2017:
|
|
December
31, 2018
|
|||||||
|
|
Less
than 12 months
|
12
months or more
|
Total
|
|||||
|
|
Estimated
|
|
No.
of
|
Estimated
|
|
No.
of
|
Aggregate
|
|
|
|
Fair
|
Unrealized
|
Positions
|
Fair
|
Unrealized
|
Positions
|
Fair
|
Unrealized
|
|
Categor
y
|
Value
|
Losses
|
Held
|
Value
|
Losses
|
Held
|
Value
|
Losses
|
|
|
|
|
|
|
|
|
|
|
|
Fixed-Maturity Securities:
|
|
|
|
|
|
|
|
|
|
U.S.
Treasury securities
|
|
|
|
|
|
|
|
|
|
and
obligations of U.S.
|
|
|
|
|
|
|
|
|
|
government
corporations
|
|
|
|
|
|
|
|
|
|
and
agencies
|
$
4,948,530
|
$
(28,000
)
|
3
|
$
-
|
$
-
|
-
|
$
4,948,530
|
$
(28,000
)
|
|
|
|
|
|
|
|
|
|
|
|
Political
subdivisions of
|
|
|
|
|
|
|
|
|
|
States,
Territories and
|
|
|
|
|
|
|
|
|
|
Possessions
|
555,375
|
(12,327
)
|
1
|
1,436,242
|
(36,508
)
|
3
|
1,991,617
|
(48,835
)
|
|
|
|
|
|
|
|
|
|
|
|
Corporate
and other
|
|
|
|
|
|
|
|
|
|
bonds
industrial and
|
|
|
|
|
|
|
|
|
|
miscellaneous
|
81,004,459
|
(2,775,540
)
|
97
|
13,424,888
|
(676,605
)
|
24
|
94,429,347
|
(3,452,145
)
|
|
|
|
|
|
|
|
|
|
|
|
Residential
mortgage and other
|
|
|
|
|
|
|
|
|
|
asset
backed securities
|
7,002,713
|
(231,229
)
|
9
|
11,928,425
|
(331,012
)
|
19
|
18,931,138
|
(562,241
)
|
|
|
|
|
|
|
|
|
|
|
|
Total
fixed-maturity
|
|
|
|
|
|
|
|
|
|
securities
|
$
93,511,077
|
$
(3,047,096
)
|
110
|
$
26,789,555
|
$
(1,044,125
)
|
46
|
$
120,300,632
|
$
(4,091,221
)
|
53
|
|
December
31, 2017
|
|||||||
|
|
Less
than 12 months
|
12
months or more
|
Total
|
|||||
|
|
Estimated
|
|
No.
of
|
Estimated
|
|
No.
of
|
Aggregate
|
|
|
|
Fair
|
Unrealized
|
Positions
|
Fair
|
Unrealized
|
Positions
|
Fair
|
Unrealized
|
|
Categor
y
|
Value
|
Losses
|
Held
|
Value
|
Losses
|
Held
|
Value
|
Losses
|
|
|
|
|
|
|
|
|
|
|
|
Fixed-Maturity Securities:
|
|
|
|
|
|
|
|
|
|
Political
subdivisions of
|
|
|
|
|
|
|
|
|
|
States,
Territories and
|
|
|
|
|
|
|
|
|
|
Possessions
|
$
1,549,839
|
$
(30,814
)
|
4
|
$
-
|
$
-
|
-
|
$
1,549,839
|
$
(30,814
)
|
|
|
|
|
|
|
|
|
|
|
|
Corporate
and other
|
|
|
|
|
|
|
|
|
|
bonds
industrial and
|
|
|
|
|
|
|
|
|
|
miscellaneous
|
15,036,462
|
(269,857
)
|
20
|
9,113,924
|
(340,516
)
|
17
|
24,150,386
|
(610,373
)
|
|
|
|
|
|
|
|
|
|
|
|
Residential
mortgage and other
|
|
|
|
|
|
|
|
|
|
asset
backed securities
|
6,956,371
|
(48,482
)
|
6
|
7,867,572
|
(189,022
)
|
15
|
14,823,943
|
(237,504
)
|
|
|
|
|
|
|
|
|
|
|
|
Total
fixed-maturity
|
|
|
|
|
|
|
|
|
|
securities
|
$
23,542,672
|
$
(349,153
)
|
30
|
$
16,981,496
|
$
(529,538
)
|
32
|
$
40,524,168
|
$
(878,691
)
|
|
|
|
|
|
|
|
|
|
|
|
Equity Securities:
|
|
|
|
|
|
|
|
|
|
Preferred
stocks
|
$
1,605,217
|
$
(20,313
)
|
5
|
$
1,776,675
|
$
(120,712
)
|
3
|
$
3,381,892
|
$
(141,025
)
|
|
Common
stocks and
|
|
|
|
|
|
|
|
|
|
exchange
traded mutual funds
|
1,446,375
|
(222,205
)
|
4
|
124,900
|
(14,530
)
|
1
|
1,571,275
|
(236,735
)
|
|
|
|
|
|
|
|
|
|
|
|
Total
equity securities
|
$
3,051,592
|
$
(242,518
)
|
9
|
$
1,901,575
|
$
(135,242
)
|
4
|
$
4,953,167
|
$
(377,760
)
|
|
|
|
|
|
|
|
|
|
|
|
Total
|
$
26,594,264
|
$
(591,671
)
|
39
|
$
18,883,071
|
$
(664,780
)
|
36
|
$
45,477,335
|
$
(1,256,451
)
|
54
There
were 156 securities at December 31
,
2018
that accounted for the gross unrealized loss, none of
which were deemed by us to be other than temporarily impaired.
There were 75 securities at December 31, 2017 that accounted for
the gross unrealized loss, none of which were deemed by us to be
other than temporarily impaired. Significant factors influencing
our determination that unrealized losses were temporary included
the magnitude of the unrealized losses in relation to each
security’s cost, the nature of the investment and
management’s intent not to sell these securities and it being
not more likely than not that we will be required to sell these
investments before anticipated recovery of fair value to our cost
basis.
Liquidity and Capital Resources
Cash Flows
The
primary sources of cash flow are from our insurance underwriting
subsidiary, KICO, and include direct premiums written, ceding
commissions from our quota share reinsurers, loss recovery payments
from our reinsurers, investment income and proceeds from the sale
or maturity of investments. Funds are used by KICO for ceded
premium payments to reinsurers, which are paid on a net basis after
subtracting losses paid on reinsured claims and reinsurance
commissions. KICO also uses funds for loss payments and loss
adjustment expenses on our net business, commissions to producers,
salaries and other underwriting expenses as well as to purchase
investments and fixed assets.
On
January 31, 2017, we closed on an underwritten public offering of
2,500,000 shares of our common stock. On February 14, 2017, we
closed on the underwriters’ purchase option for an additional
192,500 shares of our common stock. The public offering price for
the 2,692,500 shares sold was $12.00 per share. The aggregate net
proceeds to us were approximately $30,137,000. On March 1, 2017, we
used $23,000,000 of the net proceeds of the offering to contribute
capital to KICO, to support its ratings upgrade plan and additional
growth. The remainder of the net proceeds will be used for general
corporate purposes.
On
December 19, 2017, we issued $30 million of our 5.50% Senior
Unsecured Notes due December 30, 2022 pursuant to an underwritten
public offering. The net proceeds to us were approximately
$29,121,000. On December 20, 2017, we used $25,000,000 of the net
proceeds from the debt offering to contribute capital to KICO, to
support additional growth. The remainder of the net proceeds will
be used for general corporate purposes. Interest will be payable
semi-annually in arrears on June 30 and December 30 of each year,
which began on June 30, 2018 at the rate of 5.50% per year from
December 19, 2017.
For the
year ended December 31, 2018, the primary source of cash flow for
our holding company was the dividends received from KICO, subject
to statutory restrictions. For the year ended December 31, 2018,
KICO paid dividends of $3,600,000 to us.
KICO is
a member of the Federal Home Loan Bank of New York, which provides
additional access to liquidity. Members have access to a variety of
flexible, low cost funding through FHLBNY’s credit products,
enabling members to customize advances. Advances are to be fully
collateralized; eligible collateral to pledge to FHLBNY includes
residential and commercial mortgage backed securities, along with
U.S. Treasury and agency securities. See Note 3 to our Consolidated
Financial Statements, – “Investments”, for
eligible collateral held in a designated custodian account
available for future advances. Advances are limited to 5% of
KICO’s net admitted assets as of December 31, 2018 and are
due and payable within one year of borrowing. The maximum allowable
advance as of December 31, 2018, based on the net admitted assets
as of December 31, 2018, was approximately $10,960,000. Advances
are limited to the amount of available collateral, which was
approximately $5,116,000 as of December 31, 2018. There were no
borrowings under this facility during the year ended December 31,
2018.
55
As of
December 31, 2018, invested assets and cash in our holding company
was approximately $4,212,000. If the aforementioned sources of cash
flow currently available are insufficient to cover our holding
company cash requirements, we will seek to obtain additional
financing.
Our
reconciliation of net income to net cash provided by operations is
generally influenced by the collection of premiums in advance of
paid losses, the timing of reinsurance, issuing company settlements
and loss payments.
Cash
flow and liquidity are categorized into three sources:
(1) operating activities; (2) investing activities; and
(3) financing activities, which are shown in the following
table:
|
Years
Ended December 31,
|
2018
|
2017
|
|
|
|
|
|
Cash
flows provided by (used in):
|
|
|
|
Operating
activities
|
$
22,295,366
|
$
28,046,140
|
|
Investing
activities
|
(43,401,314
)
|
(47,626,330
)
|
|
Financing
activities
|
(6,137,282
)
|
55,917,303
|
|
Net (decrease) increase in cash and cash equivalents
|
(27,243,230
)
|
36,337,113
|
|
Cash
and cash equivalents, beginning of period
|
48,381,633
|
12,044,520
|
|
Cash and cash equivalents, end of period
|
$
21,138,403
|
$
48,381,633
|
Net
cash provided by operating activities was $22,295,000 in 2018 as
compared to $28,046,000 in 2017. The $5,751,000 decrease in cash
flows provided by operating activities in 2018 was primarily a
result of a decrease in net income (adjusted for non-cash items) of
$3,513,000, fluctuations in other assets, accounts payable, accrued
expenses and other liabilities of $4,679,000, partially offset by
an increase in net cash arising from insurance related items from
KICO of $2,441,000.
Net
cash used in investing activities was $43,401,000 in 2018 compared
to $47,626,000 in 2017. The $4,225,000 decrease in net cash used in
investing activities was the result of a $16,012,000 increase in
sales or maturities of invested assets and $92,000 decrease in
fixed asset acquisitions in 2018, which offset the $15,879,000
increase in acquisitions of invested assets.
Net
cash provided by financing activities was $6,137,000 in 2018
compared to $55,917,000 provided in 2017. The $62,055,000 decrease
in net cash provided by financing activities is the result of the
$30,137,000 net proceeds we received from the public offering of
our common stock in January/February 2017 and the $29,122,000 net
proceeds we received from the issuance of long-term debt pursuant
to the public offering in December 2017 and a $1,065,000 increase
in dividends paid due to an increase in the shares outstanding and
dividend paid per share.
56
Reinsurance
The
following table provides summary information with respect to each
reinsurer that accounted for more than 10% of our reinsurance
recoverables on paid and unpaid losses and loss adjustment expenses
as of December 31, 2018:
|
|
|
Amount
|
|
|
|
|
Recoverable
|
|
|
|
A.M.
|
as
of
|
|
|
($
in thousands)
|
Best
Rating
|
December
31, 2018
|
%
|
|
Cavello
Bay Reinsurance Limited
|
A-
|
$
6,596
|
32.8
%
|
|
Swiss
Reinsurance America Corporation
|
A+
|
5,750
|
28.6
%
|
|
Hannover
Rueck SE
|
A+
|
3,909
|
19.4
%
|
|
|
|
16,255
|
80.8
%
|
|
Others
|
|
3,870
|
19.2
%
|
|
Total
|
|
$
20,125
|
100.0
%
|
Reinsurance
recoverable from Cavello Bay Reinsurance Limited and Motors
Insurance Corporation (included in “Others”) are
secured pursuant to collateralized trust agreements. Assets held in
the two trusts are not included in our invested assets and
investment income earned on these assets is credited to the two
reinsurers respectively.
Our
quota share reinsurance treaties are on a July 1 through June 30
fiscal year basis; therefore, for year to date fiscal periods after
June 30, two separate treaties will be included in such
periods.
Our
quota share reinsurance treaty in effect for 2018 for our personal
lines business, which primarily consists of homeowners policies,
was covered under the 2017/2019 Treaty. Our quota share reinsurance
treaty in effect for 2017 for our personal lines business, which
primarily consists of homeowners policies, was covered under the
2017/2019 Treaty and 2016/2017 Treaty.
In
March 2017, we bound our personal lines quota share reinsurance
treaty effective July 1, 2017. The treaty provides for a reduction
in the quota share ceding rate to 20%, from 40% in the 2016/2017
Treaty, and an increase in the provisional ceding commission rate
to 53%, from 52% in the 2016/2017 Treaty. The 2017/2019 Treaty
covers a two year period from July 1, 2017 through June 30, 2019.
In August 2018, we reduced our quota share ceding rate under the
2017/2019 Treaty to 10%, from 20%, effective July 1,
2018.
We
entered into new excess of loss and catastrophe reinsurance
treaties effective July 1, 2018. Material terms for our reinsurance
treaties in effect for the treaty years shown below are as
follows:
57
|
|
Treaty Year
|
||
|
|
July 1, 2018
|
July 1, 2017
|
July 1, 2016
|
|
|
to
|
to
|
to
|
|
Line of Business
|
June 30, 2019
|
June 30, 2018
|
June 30, 2017
|
|
|
|
|
|
|
Personal
Lines:
|
|
|
|
|
Homeowners,
dwelling fire and canine legal liability
|
|
|
|
|
Quota
share treaty:
|
|
|
|
|
Percent
ceded
|
10
%
|
20
%
|
40
%
|
|
Risk
retained
|
$
900,000
|
$
800,000
|
$
500,000
|
|
Losses
per occurrence subject to quota share reinsurance
coverage
|
$
1,000,000
|
$
1,000,000
|
$
833,333
|
|
Excess
of loss coverage and facultative facility above quota share
coverage (1)
|
$
9,000,000
|
$
9,000,000
|
$
3,666,667
|
|
|
in
excess of
|
in
excess of
|
in
excess of
|
|
|
$
1,000,000
|
$
1,000,000
|
$
833,333
|
|
Total
reinsurance coverage per occurrence
|
$
9,100,000
|
$
9,200,000
|
$
4,000,000
|
|
Losses
per occurrence subject to reinsurance coverage
|
$
10,000,000
|
$
10,000,000
|
$
4,500,000
|
|
Expiration date
|
June 30,
2019
|
June 30,
2018
|
June 30,
2017
|
|
Personal
Umbrella
|
|
|
|
|
Quota
share treaty:
|
|
|
|
|
Percent
ceded - first $1,000,000 of coverage
|
90
%
|
90
%
|
90
%
|
|
Percent
ceded - excess of $1,000,000 dollars of coverage
|
100
%
|
100
%
|
100
%
|
|
Risk
retained
|
$
100,000
|
$
100,000
|
$
100,000
|
|
Total
reinsurance coverage per occurrence
|
$
4,900,000
|
$
4,900,000
|
$
4,900,000
|
|
Losses
per occurrence subject to quota share reinsurance
coverage
|
$
5,000,000
|
$
5,000,000
|
$
5,000,000
|
|
Expiration
date
|
June
30, 2019
|
June
30, 2018
|
June
30, 2017
|
|
|
|
|
|
|
Commercial
Lines:
|
|
|
|
|
General
liability commercial policies
|
|
|
|
|
Quota
share treaty
|
None
|
None
|
None
|
|
Risk
retained
|
$
750,000
|
$
750,000
|
$
500,000
|
|
Excess
of loss coverage above risk retained
|
$
3,750,000
|
$
3,750,000
|
$
4,000,000
|
|
|
in
excess of
|
in
excess of
|
in
excess of
|
|
|
$
750,000
|
$
750,000
|
$
500,000
|
|
Total
reinsurance coverage per occurrence
|
$
3,750,000
|
$
3,750,000
|
$
4,000,000
|
|
Losses
per occurrence subject to reinsurance coverage
|
$
4,500,000
|
$
4,500,000
|
$
4,500,000
|
|
|
|
|
|
|
Commercial
Umbrella
|
|
|
|
|
Quota
share treaty:
|
|
|
|
|
Percent
ceded - first $1,000,000 of coverage
|
90
%
|
90
%
|
90
%
|
|
Percent
ceded - excess of $1,000,000 of coverage
|
100
%
|
100
%
|
100
%
|
|
Risk
retained
|
$
100,000
|
$
100,000
|
$
100,000
|
|
Total
reinsurance coverage per occurrence
|
$
4,900,000
|
$
4,900,000
|
$
4,900,000
|
|
Losses
per occurrence subject to quota share reinsurance
coverage
|
$
5,000,000
|
$
5,000,000
|
$
5,000,000
|
|
Expiration
date
|
June
30, 2019
|
June
30, 2018
|
June
30, 2017
|
|
|
|
|
|
|
Catastrophe
Reinsurance:
|
|
|
|
|
Initial
loss subject to personal lines quota share treaty
|
$
5,000,000
|
$
5,000,000
|
$
5,000,000
|
|
Risk
retained per catastrophe occurrence (2)
|
$
4,500,000
|
$
4,000,000
|
$
3,000,000
|
|
Catastrophe
loss coverage in excess of quota share coverage (3)
(4)
|
$
445,000,000
|
$
315,000,000
|
$
247,000,000
|
|
Reinstatement
premium protection (5)
|
Yes
|
Yes
|
Yes
|
(1)
For
personal lines, the 2017/2019 Treaty includes the addition of an
automatic facultative facility allowing KICO to obtain homeowners
single risk coverage up to $10,000,000 in total insured value,
which covers direct losses from $3,500,000 to
$10,000,000.
(2)
Plus
losses in excess of catastrophe coverage.
(3)
Catastrophe
coverage is limited on an annual basis to two times the per
occurrence amounts. Effective July 1, 2016, the duration of a
catastrophe occurrence from windstorm, hail, tornado, hurricane and
cyclone was extended to 168 consecutive hours from 120 consecutive
hours.
(4)
Effective
July 1, 2018, the top $50,000,000 layer of catastrophe reinsurance
coverage has a two-year term expiring on June 30,
2020.
(5)
Effective
July 1, 2016, reinstatement premium protection for $20,000,000 of
catastrophe coverage in excess of $5,000,000.
Effective
July 1, 2017, reinstatement premium protection for $145,000,000 of
catastrophe coverage in excess of $5,000,000.
Effective
July 1, 2018, reinstatement premium protection for $210,000,000 of
catastrophe coverage in excess of $5,000,000
.
58
The
single maximum risks per occurrence to which the Company is subject
under the treaties effective July 1, 2018 are as
follows:
|
|
July
1, 2018 - June 30, 2019
|
|
|
Treaty
|
Extent
of Loss
|
Risk
Retained
|
|
Personal Lines (1)
|
Initial $1,000,000
$1,000,000 - $10,000,000
Over $10,000,000
|
$900,000
None(2)
100%
|
|
Personal Umbrella
|
Initial $1,000,000
$1,000,000 - $5,000,000
Over $5,000,000
|
$100,000
None
100%
|
|
Commercial Lines
|
Initial $750,000
$750,000 - $4,500,000
Over $4,500,000
|
$750,000
None
(3)
100%
|
|
Commercial Umbrella
|
Initial $1,000,000
$1,000,000 - $5,000,000
Over $5,000,000
|
$100,000
None
100%
|
|
Catastrophe (4)
|
Initial $5,000,000
$5,000,000 - $450,000,000
Over $450,000,00
|
$4,500,000
None
100%
|
(1)
Treaty
for July 1, 2018 – June 30, 2019 (the “2017/2019
Treaty”) is a two-year treaty with expiration date of June
30, 2019.
(2)
Covered
by excess of loss treaties up to $3,500,000 and by facultative
facility from $3,500,000 to $10,000,000.
(3)
Covered by excess
of loss treaties.
(4)
Catastrophe
coverage is limited on an annual basis to two times the per
occurrence amounts.
59
The
single maximum risks per occurrence to which the Company is subject
under the treaty years shown below are as follows:
|
|
July
1, 2017 - June 30, 2018
|
|
July
1, 2016 - June 30, 2017
|
||
|
Treaty
|
Range
of Loss
|
Risk
Retained
|
|
Range
of Loss
|
Risk
Retained
|
|
Personal Lines (1)
|
Initial $1,000,000
$1,000,000 - $10,000,000
Over $10,000,000
|
$800,000
None(2)
100%
|
|
Initial $
833,333
$833,333 - $4,500,000
Over
$4,500,000
|
$500,000
None(3)
100%
|
|
Personal Umbrella
|
Initial $1,000,000
$1,000,000 - $5,000,000
Over $5,000,000
|
$100,000
None
100%
|
|
Initial $1,000,000
$1,000,000 - $5,000,000
Over $5,000,000
|
$100,000
None
100%
|
|
Commercial Lines
|
Initial $750,000
$750,000 - $4,500,000
Over $4,500,000
|
$750,000
None(3)
100%
|
|
Initial $500,000
$500,000 - $4,500,000
Over $4,500,000
|
$500,000
None(3)
100%
|
|
Commercial Umbrella
|
Initial $1,000,000
$1,000,000 - $5,000,000
Over $5,000,000
|
$100,000
None
100%
|
|
Initial $1,000,000
$1,000,000 - $5,000,000
Over $5,000,000
|
$100,000
None
100%
|
|
Catastrophe (4)
|
Initial $5,000,000
$5,000,000 - $320,000,000
Over $320,000,000
|
$4,000,000
None
100%
|
|
Initial
$5,000,000
$5,000,000
- $252,000,000
Over
$252,000,000
|
$3,000,000
None
100%
|
(1)
Treaty
for July 1, 2017 – June 30, 2018 is a two-year treaty with
expiration date of June 30, 2019.
(2)
Covered
by excess of loss treaties up to $3,500,000 and by facultative
facility from $3,500,000 to $10,000,000.
(3)
Covered by excess
of loss treaties.
(4)
Catastrophe
coverage is limited on an annual basis to two times the per
occurrence amounts.
Inflation
Premiums
are established before we know the amount of losses and loss
adjustment expenses or the extent to which inflation may affect
such amounts. We attempt to anticipate the potential impact of
inflation in establishing our reserves, especially as it relates to
medical and hospital rates where historical inflation rates have
exceeded the general level of inflation. Inflation in excess of the
levels we have assumed could cause loss and loss adjustment
expenses to be higher than we anticipated, which would require us
to increase reserves and reduce earnings.
Fluctuations
in rates of inflation also influence interest rates, which in turn
impact the market value of our investment portfolio and yields on
new investments. Operating expenses, including salaries and
benefits, generally are impacted by inflation.
60
Off-Balance Sheet Arrangements
We have
no off-balance sheet arrangements that have or are reasonably
likely to have a current or future effect on our financial
condition, changes in financial condition, revenues or expenses,
results of operations, or liquidity that are material to
investors.
This
item is not applicable to smaller reporting companies.
The
financial statements required by this Item 8 are included in this
Annual Report following Item 15 hereof. As a first year accelerated
filer, we are not required to provide supplementary financial
information.
None.
Disclosure Controls and Procedures
We
maintain a system of disclosure controls and procedures (as defined
in Rule 13a-15(e) under the Exchange Act that are designed to
assure that information required to be disclosed in the reports we
file or submit under the Exchange Act is recorded, processed,
summarized and reported within the time periods specified in the
SEC’s rules and forms, and that such information is
accumulated and communicated to management, including our Chief
Executive Officer and Chief Financial Officer, as appropriate, to
allow timely decisions regarding required disclosures. Based on
this evaluation, our Chief Executive Officer and Chief Financial
Officer have concluded that, as of the end of such period, our
disclosure controls and procedures are: (i) effective in recording,
processing, summarizing, and reporting information on a timely
basis that we are required to disclose in the reports that we file
or submit under the Exchange Act, and (ii) effective in ensuring
that information that we are required to disclose in the reports
that we file or submit under the Exchange Act is accumulated and
communicated to our management, including our Chief Executive
Officer and Chief Financial Officer, as appropriate, to allow
timely decisions regarding required disclosure.
61
Management’s Annual Report on Internal Control over Financial
Reporting
Our
management is responsible for establishing and maintaining adequate
internal control over financial reporting as defined in
Rule 13a-15(f) under the Exchange Act. Internal control over
financial reporting is a process designed by, or under the
supervision of, our Chief Executive Officer and Chief Financial
Officer, and effected by the board of directors, management, and
other personnel, to provide reasonable assurance regarding the
reliability of financial reporting and the preparation of financial
statements for external purposes in accordance with GAAP including
those policies and procedures that: (i) pertain to the
maintenance of records that, in reasonable detail, accurately and
fairly reflect the transactions and dispositions of our assets,
(ii) provide reasonable assurance that transactions are
recorded as necessary to permit preparation of financial statements
in accordance with GAAP and that receipts and expenditures are
being made only in accordance with authorizations of our management
and directors, and (iii) provide reasonable assurance
regarding prevention or timely detection of unauthorized
acquisition, use, or disposition of our assets that could have a
material effect on the financial statements.
Because of
its inherent limitations, internal control over financial reporting
may not prevent or detect misstatements. Also, projections of any
evaluation of effectiveness to future periods are subject to the
risk that controls may become inadequate because of changes in
conditions, or that the degree of compliance with policies and
procedures may deteriorate.
Management
conducted an evaluation of the effectiveness of our internal
control over financial reporting as of December 31, 2018 based on
the framework in
Internal Control
– Integrated Framework (2013)
issued by the Committee
of Sponsoring Organizations of the Treadway Commission. Based on
the evaluation of the effectiveness of our internal control over
financial reporting management concluded that our internal control
over financial reporting was effective as of December 31,
2018. The independent registered public accounting firm of the
Company also reported on the effectiveness of the Company’s
internal control over financial reporting as of December 31, 2018.
Management’s report and the independent registered public
accounting firm’s report are included under Item 8 of this
Report under the captions entitled “Management’s Annual
Report on Internal Control Over Financial Reporting” and
“Report of Independent Registered Public Accounting
Firm.”
There
was no change in our internal control over financial reporting
during our most recently completed fiscal quarter that has
materially affected, or is reasonably likely to materially affect,
our internal control over financial reporting.
62
REPORT OF INDEPENDENT REGISTERED PUBLIC ACCOUNTING
FIRM
ON INTERNAL CONTROL OVER FINANCIAL REPORTING
To the
Shareholders and Board of Directors of
Kingstone
Companies, Inc.
Opinion on Internal Control over Financial
Reporting
We have
audited Kingstone Companies, Inc. and Subsidiaries’ (the
“Company”) internal control over financial reporting as
of December 31, 2018, based on criteria established in
Internal Control – Integrated Framework
(2013)
issued by the Committee of Sponsoring Organizations
of the Treadway Commission (“COSO”). In our opinion,
the Company maintained, in all material respects, effective
internal control over financial reporting as of December 31, 2018,
based on criteria established in
Internal Control – Integrated Framework
(2013)
issued by COSO.
We have
also audited, in accordance with the standards of the Public
Company Accounting Oversight Board (United States) (the
“PCAOB”), the consolidated balance sheets as of
December 31, 2018 and 2017 and the related consolidated statements
of income and comprehensive income (loss), stockholders’
equity, and cash flows for the years then ended of the Company and
our report dated March 18, 2019 expressed an unqualified opinion
with explanatory language related to the
Company’s
change in accounting for equity securities in 2018 on those
financial statements.
63
Basis for Opinion
The
Company's management is responsible for maintaining effective
internal control over financial reporting, and for its assessment
of the effectiveness of internal control over financial reporting,
included in the accompanying Management’s Annual Report on
Internal Control over
Financial
Reporting. Our responsibility is to express an opinion on the
Company's internal control over financial reporting based on our
audit. We are a public accounting firm registered with the PCAOB
and are required to be independent with respect to the Company in
accordance with the U.S. federal securities laws and the applicable
rules and regulations of the Securities and Exchange Commission and
the PCAOB.
We
conducted our audit in accordance with the standards of the PCAOB.
Those standards require that we plan and perform the audit to
obtain reasonable assurance about whether effective internal
control over financial reporting was maintained in all material
respects. Our audit of internal control over financial reporting
included obtaining an understanding of internal control over
financial reporting, assessing the risk that a material weakness
exists, and testing and evaluating the design and operating
effectiveness of internal control based on the assessed risk. Our
audit also included performing such other procedures as we
considered necessary in the circumstances. We believe that our
audit provides a reasonable basis for our opinion.
Definition and Limitations of Internal Control over Financial
Reporting
A
company’s internal control over financial reporting is a
process designed to provide reasonable assurance regarding the
reliability of financial reporting and the preparation of financial
statements for external purposes in accordance with generally
accepted accounting principles. A company's internal control over
financial reporting includes those policies and procedures that (1)
pertain to the maintenance of records that, in reasonable detail,
accurately and fairly reflect the transactions and dispositions of
the assets of the company; (2) provide reasonable assurance that
transactions are recorded as necessary to permit preparation of
financial statements in accordance with generally accepted
accounting principles, and that receipts and expenditures of the
company are being made only in accordance with authorizations of
management and directors of the company; and (3) provide reasonable
assurance regarding prevention or timely detection of unauthorized
acquisition, use, or disposition of the company’s assets that
could have a material effect on the financial
statements.
Because
of the inherent limitations, internal control over financial
reporting may not prevent or detect misstatements. Also,
projections of any evaluation of effectiveness to future periods
are subject to the risk that controls may become inadequate because
of changes in conditions, or that the degree of compliance with the
policies or procedures may deteriorate.
/s/
Marcum LLP
Marcum
LLP
Hartford,
CT
March
18, 2019
64
On
March 14, 2018, the Company and Dale A. Thatcher, a director of the
Company, entered into an employment agreement (the “2018
Thatcher Employment Agreement”) pursuant to which Mr.
Thatcher would serve as the Company’s Chief Operating
Officer. The 2018 Thatcher Employment Agreement became effective as
of March 15, 2018 and expired on December 31, 2018. Pursuant the
2018 Thatcher Employment Agreement, Mr. Thatcher was entitled to
receive a base salary of $500,000 per annum and a minimum bonus
equal to 15% of his base salary. Concurrently with the execution of
the 2018 Thatcher Employment Agreement, the Company granted to Mr.
Thatcher 35,715 shares of restricted common stock under the 2014
Equity Plan (the “Stock Grant Agreement”). Subject to
the terms of the Stock Grant Agreement, such shares will vest in
three equal installments on each of the three annual anniversaries
following the grant date. The foregoing description of the 2018
Thatcher Employment Agreement and the Stock Grant Agreement is
qualified in its entirety by reference to the full text of the 2018
Thatcher Employment Agreement filed as Exhibit 10(k) and the Stock
Grant Agreement filed as Exhibit 10(j) to this Annual Report, which
are incorporated by reference herein.
There
were no arrangements or understandings between Mr. Thatcher and any
other persons pursuant to which he was appointed as Chief Operating
Officer. There were also no family relationships between Mr.
Thatcher and any director or executive officer of the Company, and
the Company did not enter into any transactions with Mr. Thatcher
that reportable pursuant to Item 404(a) of Regulation S-K. The
foregoing information is being disclosed under Item 9B of this
Annual Report in lieu of providing such disclosure in Item 5.02 of
a Current Report on Form 8-K.
As
disclosed elsewhere in this Annual Report, on October 16, 2018, the
Company and Mr. Thatcher entered into an employment agreement,
effective as of January 1, 2019 and expiring on December 31, 2021,
pursuant to which Mr. Thatcher was promoted to succeed Mr.
Goldstein as Chief Executive Officer.
65
PART III
Executive Officers and Directors
The
following table sets forth the positions and offices presently held
by each of our current directors and executive officers and their
ages:
|
Name
|
Age
|
Positions and Offices Held
|
|
|
|
|
|
Barry B. Goldstein
|
65
|
Executive Chairman of the Board and Director
|
|
Dale A. Thatcher
|
57
|
Chief Executive Officer and Director
|
|
Victor J. Brodsky
|
61
|
Chief Financial Officer and Treasurer
|
|
Benjamin Walden
|
51
|
Executive Vice President and Chief Actuary, Kingstone Insurance
Company
|
|
Floyd R. Tupper
|
64
|
Secretary and Director
|
|
Jay M. Haft
|
83
|
Director
|
|
William L. Yankus
|
59
|
Director
|
|
Carla A. D’Andre
|
63
|
Director
|
|
Timothy P. McFadden
|
56
|
Director
|
Barry B. Goldstein
On
October 16, 2018, the Company announced that Mr. Goldstein would
step down as Chief Executive Officer, effective January 1, 2019.
Additionally, the Company announced that Mr. Goldstein, current
Chairman of the Board of Directors of the Company, had been named
Executive Chairman. Mr. Goldstein served as our President, Chief
Executive Officer, Chairman of the Board, and a director since
March 2001. He served as our Chief Financial Officer from March
2001 to November 2007 and as our Treasurer from May 2001 to August
2013. Since January 2006, Mr. Goldstein has served as
Chairman of the Board of Kingstone Insurance Company
(“KICO”) (formerly known as Commercial Mutual Insurance
Company), a New York property and casualty insurer, as well as
Chairman of its Executive Committee. Mr. Goldstein has served as
Chief Investment Officer of KICO since August 2008 and as its
President and Chief Executive Officer since January 2012. He was
Treasurer of KICO from March 2010 through September 2010. Effective
July 1, 2009, we acquired a 100% equity interest in KICO. From 1997
to 2004, Mr. Goldstein served as President of AIA Acquisition
Corp., which operated insurance agencies in Pennsylvania and which
sold substantially all of its assets to us in 2003. Mr. Goldstein
received his B.A. and M.B.A. from State University of New York at
Buffalo. We believe that Mr. Goldstein’s extensive experience
in the insurance industry, including his executive-level service
with KICO since 2006, give him the qualifications and skills to
serve as one of our directors.
Dale A. Thatcher
On
October 16, 2018, the Company announced that Mr. Thatcher would
succeed Mr. Goldstein as Chief Executive Officer, effective January
1, 2019. Mr. Thatcher was elected our Chief Operating Officer and
KICO’s President in March 2018. Mr. Thatcher is the founder
of Atherstone Partners, a consulting practice in insurance and
investments. Prior to starting Atherstone, Mr. Thatcher was
Executive Vice President and Chief Financial Officer for Selective
Insurance Group, Inc. and previously Chief Accounting Officer for
the Ohio Casualty Group. He is a certified public accountant
(inactive), a chartered property and casualty underwriter and a
chartered life underwriter. Mr. Thatcher has served as one of our
directors since August 2017 and currently serves as Co-Chair of our
Finance Committee. He is an alumnus of the University of Cincinnati
and Harvard University. We believe that Mr. Thatcher’s
executive-level experience in the insurance industry gives him the
qualifications and skills to serve as one of our
directors.
66
Victor J. Brodsky
Mr.
Brodsky has served as our Chief Financial Officer since August 2009
and as our Treasurer since August 2013. He served as our Chief
Accounting Officer from August 2007 through July 2009, as our
Principal Financial Officer for Securities and Exchange Commission
(“SEC”) reporting purposes from November 2007 through
July 2009 and as our Secretary from December 2008 to August 2013.
In addition, Mr. Brodsky has served as a director of KICO since
February 2008, as Chief Financial Officer of KICO since September
2010 and as Executive Vice President of KICO since February 2017.
He also served as Senior Vice President of KICO from January 2012
to February 2017 and as Treasurer of KICO from September 2010
through December 2011. Mr. Brodsky served from May 2008 through
March 15, 2010 as Vice President of Financial Reporting and
Principal Financial Officer for SEC reporting purposes of Vertical
Branding Inc. Mr. Brodsky served as Chief Financial Officer of
Vertical Branding from March 1998 through May 2008 and as a
director of Vertical Branding from May 2002 through November 2005.
He served as its Secretary from November 2005 through May 2008 and
from April 2009 to March 15, 2010. A receiver was appointed for the
business of Vertical Branding in February 2010. Prior to joining
Vertical Branding, Mr. Brodsky spent 16 years at the CPA firm of
Michael & Adest in New York. Mr. Brodsky earned a Bachelor
of Business Administration degree from Hofstra University, with a
major in accounting, and is a licensed CPA in New
York.
Benjamin Walden
Mr.
Walden has served as Executive Vice President of KICO since
February 2017 and as Chief Actuary of KICO since December 2013.
From January 2015 to February 2017, he served as Senior Vice
President of KICO and from December 2013 to January 2015, he served
as Vice President of KICO. From February 2010 to November 2013, Mr.
Walden served as Chief Actuary for Interboro Insurance Company, a
personal lines carrier. From July 2008 to February 2010, Mr. Walden
was President of Assigned Risk Consulting, Inc., an independent
actuarial consulting firm. From October 2001 to April 2009, he
served as Vice President and Chief Actuary of AutoOne Insurance, an
assigned risk automobile servicing carrier. Mr. Walden was also an
actuarial consultant at Milliman, Inc., an independent provider of
actuarial and consulting services, from January 1998 to October
2001. Mr. Walden has been a Fellow of the Casualty Actuarial
Society since 1999 and holds a
Bachelor of Science Degree in Mathematics
from Villanova
University.
Floyd R. Tupper
Mr.
Tupper is a certified public accountant in New York City. For over
30 years, Mr. Tupper has counseled high-net worth individuals by
creating tax planning strategies to achieve their goals as well as
those of their families. He has also helped small businesses by
developing business strategies to meet their current and future
needs. He began his career in public accounting with Ernst &
Young LLP prior to becoming self-employed. Mr. Tupper holds an
M.B.A. in Taxation from the New York University Stern School of
Business and a B.S. from New York University. Mr. Tupper has served
as a director of KICO, and Chairman of its Audit Committee, since
2006. He also serves as a member of its Investment Committee.
From 1990 until 2010, Mr. Tupper served as a Trustee of The Acorn
School in New York City. He was also a member of the school’s
Executive Committee and served as its Treasurer from 1990 to 2010.
Mr. Tupper is a member of the American Institute of Certified
Public Accountants and the New York State Society of Certified
Public Accountants. He has served as one of our directors and
Chairman of our Audit Committee since June 2014 and as our
Secretary since June 2015. We believe that Mr. Tupper’s
accounting experience, as well as his service on the Board of KICO
since 2006 (including his service as Chairman of its Audit
Committee), give him the qualifications and skills to serve as one
of our directors.
67
Jay M. Haft
Mr.
Haft served for more than 15 years as a personal advisor to Victor
Vekselberg, a Russian entrepreneur with considerable interests in
oil, aluminum, utilities and other industries. Mr. Haft is a
partner at Columbus Nova, the U.S.-based investment and operating
arm of Mr. Vekselberg’s Renova Group of companies. Mr. Haft
is also a strategic and financial consultant for growth stage
companies. He is active in international corporate finance and
mergers and acquisitions as well as in the representation of
emerging growth companies. Mr. Haft has extensive experience in the
Russian market, in which he has worked on growth strategies for
companies looking to internationalize their business assets and
enter international capital markets. He has been a founder,
consultant and/or director of numerous public and private
corporations, and served as Chairman of the Board of Dusa
Pharmaceuticals, Inc. Mr. Haft serves on the Board of The Link of
Times Foundation and The Mariinski Foundation and is an advisor to
Montezemolo & Partners. He has been instrumental in strategic
planning and fundraising for a variety of Internet and high-tech,
leading edge medical technology and marketing companies over the
years. Mr. Haft served as counsel to Reed Smith, an international
law firm. Mr. Haft is a past member of the Florida Commission for
Government Accountability to the People, a past national trustee
and Treasurer of the Miami City Ballet, and a past Board member of
the Concert Association of Florida. He is also a past trustee of
Florida International University Foundation and previously served
on the advisory board of the Wolfsonian Museum and Florida
International University Law School. Mr. Haft served as our Vice
Chairman of the Board from February 1999 until March 2001. From
October 1989 to February 1999, he served as our Chairman of the
Board and he has served as one of our directors since 1989 (serving
as Chariman of our Nominating and Corporate Governance Committee
since 2010). Mr. Haft received B.A. and LL.B. degrees from Yale
University. We believe that Mr. Haft’s corporate finance,
business consultation, legal and executive-level experience, as
well as his service on the Board of KICO since 2009, give him the
qualifications and skills to serve as one of our
directors.
William L. Yankus
Mr. Yankus brings to the Board over 30 years’ experience
in the insurance industry. Since September 2015, Mr.
Yankus has provided insurance-related consulting services through
Pheasant Hill Advisors, LLC. From 2011 to 2015, he was
Managing Director – Investment Banking at Stern Agee where he
focused on small and mid-sized insurers. Mr. Yankus
served as Managing Director-Insurance Research at Fox-Pitt, Kelton
from 1993 to 2009 and then as Head of Insurance Research at its
successor, Macquerie, from 2009 to 2010. Mr. Yankus
served as Vice President, Insurance Research at Conning &
Company from 1985 to 1993. He is a chartered financial
analyst and a member of The CFA Institute and the American
Institute of Financial Analysts. Mr. Yankus has served
as one of our directors since March 2016 and Chairman of our
Compensation Committee since April 2017. He received his
B.A. degree in Economics and Accounting from The College of the
Holy Cross. We believe that Mr. Yankus’ executive level
experience in the insurance industry gives him the qualifications
and skills to serve as one of our directors.
68
Carla A. D’Andre
Ms.
D’Andre has more than 40 years of experience in the insurance
industry. Since 2009, Ms. D’Andre has been Chairman, CEO and
President of D’Andre Insurance Group, Inc., which she
co-founded. D’Andre Insurance Group, Inc. is the parent of
two independent insurance agencies. Prior to co-founding
D’Andre Insurance Group, Ms. D’Andre held
executive-level roles at several companies in the insurance
industry, including Executive Vice President, Head – Global
Corporate Practice and Member – Partner’s Council at
Willis Group Holdings plc, a multinational risk advisor, insurance
brokerage and reinsurance brokerage company; Managing Director and
Strategic Account Manager at AON Risk Services, a global provider
of risk management solutions; Chief Operating Officer at XL
Capital’s insurance and technology start-up firm, Inquis
Logic Inc.; Member of Senior Management and Managing Director of
Swiss Re New Markets and Director of Alternative Markets at Swiss
ReAmerica, affiliates of Swiss Reinsurance Company Ltd, a global
reinsurance company; Senior Vice President of Sedgwick North
America, an insurance brokerage firm; and Vice President of Johnson
& Higgins, an insurance brokerage firm. Ms. D’Andre
serves in senior capacities in several insurance industry groups.
In January 2019 she was elected by her peers to a three-year term
as a member of The Institutes’ CPCU Society Leadership
Council., She also serves as a member of the Executive Advisory
Council of St. John’s University School of Risk Management,
Insurance and Actuarial Science. She has served as one of our
directors since May 2017 and currently serves as Co-Chair of our
Finance Committee. Ms. D’Andre has an M.B.A. from Pace
University’s Lubin School of Business and a B.B.A. from St.
John’s University’s School of Risk Management,
Insurance and Actuarial Science. We believe that Ms.
D’Andre’s extensive experience in multiple capacities
in the insurance industry gives her the qualifications and skills
to serve as one of our directors.
Timothy P. McFadden
Mr.
McFadden has more than 27 years of experience in the insurance
industry. Since 2012, Mr. McFadden has served as CEO and President
of State Farm Indemnity Auto Insurance Company and Senior Vice
President of State Farm Insurance, Eastern Market Area. Since 2015,
he has also served as CEO and President of State Farm Florida Fire
Company. Mr. McFadden served as Senior Vice President of State Farm
Insurance Companies, Southern Zone from 2008 to 2011 and Senior
Vice President of State Farm Insurance Companies, Southern &
Mid Atlantic Zones from 2011 to 2013. He is a member of the Board
of State Farm Indemnity Auto Insurance Company, Local Initiatives
Support Corporation, American College Ethics Board, State Farm
Florida Fire Company, Top Layer Reinsurance and Florida Council of
100. Mr. McFadden received his B.S. degree from the United States
Military Academy at West Point and his J.D. from Stetson College of
Law. He also completed the General Management Program at Harvard
Business School and received his Chartered Life Underwriter
Designation from The American College of Financial Services. We
believe that Mr. McFadden's executive level experience in the
insurance industry gives him the qualifications and skills to serve
as one of our directors.
Family Relationships
There
are no family relationships among any of our executive officers and
directors.
Term of Office
Each
director will hold office until the next annual meeting of
stockholders and until his successor is elected and qualified or
until his earlier resignation or removal. Each executive officer
will hold office until the initial meeting of the Board of
Directors following the next annual meeting of stockholders and
until his successor is elected and qualified or until his earlier
resignation or removal.
Audit Committee
The
Audit Committee of the Board of Directors is responsible for
overseeing our accounting and financial reporting processes and the
audits of our financial statements. The members of the Audit
Committee are Messrs. Tupper, Haft and Yankus.
69
Audit Committee Financial Expert
Our
Board of Directors has determined that Mr. Tupper qualifies as an
“audit committee financial expert,” as defined in
applicable Nasdaq listing standards and federal securities rules
and regulations, and that Mr. Tupper is independent under
applicable and federal securities rules and regulations on
independence of Audit Committee members.
Section 16(a) Beneficial Ownership Reporting
Compliance
Section
16 of the Exchange Act requires that reports of beneficial
ownership of common shares and changes in such ownership be filed
with the SEC by Section 16 “reporting persons,”
including directors, certain officers, holders of more than 10% of
the outstanding common shares and certain trusts of which reporting
persons are trustees. We are required to disclose in this Annual
Report each reporting person whom we know to have failed to file
any required reports under Section 16 on a timely basis during the
fiscal year ended December 31, 2018. To our knowledge, based solely
on a review of copies of Forms 3, 4 and 5 filed with the SEC and
written representations that no other reports were required, during
the fiscal year ended December 31, 2018, our officers, directors
and 10% stockholders complied with all Section 16(a) filing
requirements applicable to them, except that Mr. Walden filed one
Form 4 late reporting one transaction.
Code of Ethics; Officer and Director Trading Restrictions
Policy
Our Board of Directors has adopted a Code of
Ethics for our principal executive officer, principal financial
officer, principal accounting officer or controller, or persons
performing similar functions. Our Board of Directors has also
adopted an Officer and Director Trading Restrictions Policy for our
officers and directors as well as the officers and directors of
KICO. Copies of the Code of Ethics and Officer and Director Trading
Restrictions Policy are posted on our website,
www.kingstonecompanies.com. We intend to satisfy the disclosure
requirement under Item 5.05(c) of Form 8-K regarding an amendment
to, or a waiver from, our Code of Ethics or Officer and Director
Trading Restrictions Policy by posting such information on our
website,
www.kingstonecompanies.com
.
70
Summary Compensation Table
The
following table sets forth certain information concerning the
compensation for the fiscal years ended December 31, 2018 and 2017
for certain executive officers, including our Chief Executive
Officer through the end of 2018:
|
Name and Principal Position
|
Year
|
Salary
|
Bonus
|
Stock Awards(1)
|
Option Awards(1)
|
Non-Equity
Incentive Plan
Compensation
|
All Other
Compensation
|
Total
|
|
Barry B.
Goldstein
|
2018
|
$
630,000
|
$
-
|
$
-
|
$
-
|
$
21,887
(3)
|
$
43,784
(4)
|
$
695,671
|
|
Chief
Executive Officer
|
2017
|
$
630,000
|
$
-
|
$
-
|
$
-
|
$
1,670,111
(2)
|
$
24,152
|
$
2,324,263
|
|
|
|
|
|
|
|
|
|
|
|
Dale A.
Thatcher
|
2018
|
$
398,630
|
$
-
|
$
750,000
|
$
-
|
$
59,795
(3)
|
$
79,157
(4)
|
$
1,287,582
|
|
Chief
Operating Officer
|
|
|
|
|
|
|
|
|
|
|
|
|
|
|
|
|
|
|
|
Victor J.
Brodsky
|
2018
|
$
350,000
|
$
-
|
$
140,009
|
$
-
|
$
17,573
(3)
|
$
27,759
(4)
|
$
535,341
|
|
Chief
Financial Officer
|
2017
|
$
320,000
|
$
30,000
|
$
149,500
|
$
-
|
$
49,832
(3)
|
$
24,500
|
$
573,832
|
(1)
Amounts reflect the
aggregate grant date fair value of grants made in each respective
fiscal year computed in accordance with stock-based accounting
rules (FASB ASC Topic 718-Stock Compensation), excluding the effect
of estimated forfeitures. Assumptions used in the calculations of
these amounts are included in Note 12 to our Consolidated Financial
Statements included in this Annual Report.
(2)
Represents
bonus compensation of $660,446 accrued
pursuant to Mr. Goldstein’s employment agreement for 2017 and
paid in 2018, $945,000 of long-term bonus compensation accrued
pursuant to Mr. Goldstein’s employment agreement and payable
in 2020 if incentive goals are maintained through December 31, 2019
and $64,655 accrued pursuant to the KICO employee profit sharing
plan and paid in 2018. As of the date of this Annual Report, the
above referenced long-term bonus compensation accrued and payable
in 2020, if incentive goals are maintained through December 31,
2019 has been reduced by $247,311.
(3)
Represents
amounts earned pursuant to the KICO employee profit sharing plan
for 2018 and 2017.
(4)
For
2018, all other compensation consists of the following items for
each named executive officer above.
●
For
Mr. Goldstein, the amount in the table above includes employer
matching contributions under our deferred compensation plan of
$15,018, employer matching contributions under our defined
compensation plan of $10,266, a car allowance of $12,000 and KICO
director fees.
●
For
Mr. Thatcher, the amount in the table above includes compensation
paid to him for his service as a non-employee director during 2018
comprised of a cash retainer of $11,458 and restricted shares of
our common stock with a grant date fair value of $41,300, matching
contributions under our defined compensation plan of $10,615, a car
allowance of $9,567 and KICO director fees.
●
For
Mr. Brodsky, the amount in the table above includes employer
matching contributions under our defined contribution plan of
$10,847, a car allowance of $7,200 and KICO director
fees.
71
Employment Contracts
Barry Goldstein
(1)
Agreement
in effect for the years ended December 31, 2017 and
2018.
Mr.
Goldstein is employed as our President, Chairman of the Board and
Chief Executive Officer pursuant to an employment agreement, dated
January 20, 2017 (the “Goldstein Employment
Agreement”), that expired on December 31, 2019. Pursuant to
the 2017 Goldstein Employment Agreement, Mr. Goldstein is entitled
to receive an annual base salary of $630,000 (an increase from
$575,000 per annum in effect through December 31, 2016) and an
annual bonus equal to 6% of the Company's consolidated income from
operations before taxes, exclusive of the Company's consolidated
net investment income (loss) and net realized gains (losses) on
investments (consistent with the bonus payable to Mr. Goldstein
through December 31, 2016). In addition, pursuant to the 2017
Goldstein Employment Agreement, Mr. Goldstein is entitled to a
long-term compensation payment ("LTC") of between $945,000 and
$2,835,000 in the event the Company's adjusted book value per share
(as defined in the 2017 Goldstein Employment Agreement) has
increased by at least an average of 8% per annum as of December 31,
2019 as compared to December 31, 2016 (with the maximum LTC payment
being due if the average per annum increase is at least 14%).
Accrued LTC compensation expense (credit) of $(247,311) and
$945,000 for the years ended December 31, 2018 and 2017 is included
in other operating expenses on the accompanying consolidated
statements of income and comprehensive (loss) income.
Further, pursuant
to the 2017 Goldstein Employment Agreement, in the event that Mr.
Goldstein's employment is terminated by the Company without cause
or he resigns for good reason (each as defined in the 2017
Goldstein Employment Agreement), Mr. Goldstein would be entitled to
receive his base salary, the 6% bonus and the LTC payment for the
remainder of the term. Mr. Goldstein would be entitled, under
certain circumstances, to a payment equal to one and one-half times
his then annual salary and the target LTC payment of $1,890,000 in
the event of the termination of his employment following a change
of control of the Company.
(2)
Agreement in effect
as of January 1, 2019
On
October 16, 2018, the Company entered into an amended and restated
employment agreement with Barry Goldstein, its President, Chairman
of the Board and Chief Executive Officer, effective as of January
1, 2019 and expiring on December 31, 2021 (the “Amended
Employment Agreement”). Pursuant to the Amended Employment
Agreement, Mr. Goldstein will step down as Chief Executive Officer
on January 1, 2019 and has currently been named Executive Chairman
of the Board.
72
Mr.
Goldstein will be entitled to receive an annual base salary of
$636,500 for the calendar year 2019 and $500,000 for each of the
calendar years 2020 and 2021. In addition, Mr. Goldstein is
eligible to receive an annual performance bonus equal to 3% of the
Company’s consolidated income from operations before taxes,
exclusive of the Company’s consolidated net investment income
(loss) and net realized gains (losses) on investments. In addition,
pursuant to the Amended Employment Agreement, Mr. Goldstein will
continue to be entitled to a long-term compensation award
(“LTC”) (which is a continuation of the previous terms
under the 2017 Goldstein Employment Agreement) of between $945,000
and $2,835,000 based on a specified minimum increase in the
Company’s adjusted book value per share (as defined in the
Amended Employment Agreement) as of December 31, 2019 as compared
to December 31, 2016 (with the maximum LTC payment being due if the
average per annum increase is at least 14%). Further, pursuant to
the Amended Employment Agreement, in the event that Mr.
Goldstein’s employment is terminated by the Company without
cause or he resigns for good reason (each as defined in the Amended
Employment Agreement), Mr. Goldstein would be entitled to receive
separation payments equal to his then applicable base salary, the
3% bonus and the LTC payment for the remainder of the term. Mr.
Goldstein would be entitled, under certain circumstances, to a
payment equal to three times his then annual salary and the target
LTC payment in the event of the termination of his employment
within eighteen months following a change of control of the
Company. Pursuant to the Amended Employment Agreement, Mr.
Goldstein will be entitled to receive a grant, under the terms of
the 2014 Plan, during the first 30 days of January 2020, with
respect to a number of shares of restricted stock determined by
dividing $436,500 by the fair market value of the Company stock on
the date of grant. The January 2020 grant will become vested with
respect to fifty percent (50%) of the award on each of December 31,
2020 and December 31, 2021 based on continued provision of services
on each vesting date. Also pursuant to the Amended Employment
Agreement, Mr. Goldstein will be entitled to receive a grant, under
the 2014 Plan, during the first 30 days of 2021, with respect to a
number of shares of restricted stock determined by dividing
$236,500 by the fair market value of the Company stock on the date
of grant. The January 2021 grant will become vested as of December
31, 2021 based on continued provision of services on the vesting
date.
Dale A. Thatcher
(1)
Agreement in effect
for the year ended December 31, 2018
On
March 14, 2018, the Company and Dale A. Thatcher, a director of the
Company, entered into the 2018 Thatcher Employment Agreement
pursuant to which Mr. Thatcher would serve as the Company’s
Chief Operating Officer. The 2018 Thatcher Employment Agreement
became effective as of March 15, 2018 and expired on December 31,
2018. Pursuant the 2018 Thatcher Employment Agreement, Mr. Thatcher
was entitled to receive a base salary of $500,000 per annum and a
minimum bonus equal to 15% of his base salary. Concurrently with
the execution of the 2018 Thatcher Employment Agreement, the
Company granted to Mr. Thatcher 35,715 shares of restricted common
stock under the 2014 Equity Plan. Subject to the terms of the Stock
Grant Agreement, such shares will vest in three equal installments
on each of the three annual anniversaries following the grant
date.
(2)
Agreement in effect
as of January 1, 2019
On
October 16, 2018, the Company and Mr. Thatcher entered into an
Employment Agreement effective as of January 1, 2019 and expiring
on December 31, 2021 (the “2019 Thatcher Employment
Agreement”). Pursuant to the 2019 Thatcher Employment
Agreement, Mr. Thatcher will succeed Mr. Goldstein as Chief
Executive Officer. Mr. Thatcher will continue to serve as a
director and will remain President of KICO.
73
Mr.
Thatcher will be entitled to receive an annual base salary of
$500,000 for 2019, $630,000 for 2020 and no increase in 2021. In
addition, Mr. Thatcher is eligible to receive an annual performance
bonus equal to 3% of the Company’s consolidated income from
operations before taxes, exclusive of the Company’s
consolidated net investment income (loss) and net realized gains
(losses) on investments. Pursuant to the 2019 Thatcher Employment
Agreement, in the event that Mr. Thatcher’s employment is
terminated by the Company without cause or he resigns for good
reason (each as defined in the 2019 Thatcher Employment Agreement),
Mr. Thatcher would be entitled to receive separation payments equal
to his then applicable base salary and the 3% bonus for the
remainder of the term. Pursuant to the 2019 Thatcher Employment
Agreement, Mr.Thatcher will be entitled to receive a grant, under
the terms of the 2014 Equity Plan, with respect to a number of
shares of restricted stock in each of 2019, 2020 and 2021
determined by dividing $750,000, $1,250,000 and $1,500,000,
respectively, by the fair market value of the Company stock on the
date of grant. Each grant vests ratably over a three-year period
from the date of grant.
OUTSTANDING EQUITY AWARDS AT FISCAL YEAR-END
The
following table sets forth certain information concerning
unexercised options held by the above named executive officers as
of December 31, 2018.
|
|
Option
Awards
|
Stock
Awards
|
|||||
|
Name
|
Number
of Securities Underlying
Unexercised
Options
Exercisable
|
Number of Securities Underlying Unexercised Options Unexercisable
Option Exercise Price
|
Option
Expiration Date
|
Number of Shares of Stock That Have Not
Vested
|
Market Value of Shares of Stock That Have
Not
Vested
|
Equity Incentive Plan Awards: Number of Unearned
Shares That Have Not
Vested
|
Equity Incentive Plan Awards: Market or Payout
Value of Unearned Shares That Have Not
Vested
|
|
Dale
A. Thatcher
|
-
|
-
|
|
530
(1)
|
$
9,376
|
-
|
$
-
|
|
|
|
|
|
2,000
(2)
|
$
35,380
|
-
|
$
-
|
|
|
|
|
|
35,715
(3)
|
$
631,798
|
-
|
$
-
|
|
Victor
J. Brodsky
|
-
|
-
|
|
3,889
(4)
|
$
68,794
|
-
|
$
-
|
|
|
|
|
|
6,983
(5)
|
$
123,529
|
|
|
|
|
|
|
|
|
|
|
|
(1)
Such shares vest to
the
extent of 265 shares on
each of August 9, 2019 and 2020
.
(2)
Such shares vest to
the
extent of 667 shares on
each of January 16, 2019 and 2020, and 666 shares on January 16,
2021
.
(3)
Such shares vest to
the
extent of 11,905 shares
on each of March 14, 2019, 2020 and 2021
.
(4)
Such shares vest in
14 as nearly equal as possible monthly installments through
February 23, 2020.
(5)
Such shares vest to
the extent of 2,328 shares on each of February 22, 2019 and 2020,
and 2,327 shares on February 22, 2021.
74
Termination of Employment and
Change-in-Control
Arrangements
Barry Goldstein
Pursuant to the Goldstein Employment Agreement, in the event that
Mr. Goldstein's employment is terminated by us without cause or he
resigns for good reason (each as defined in the Goldstein
Employment Agreement), Mr. Goldstein would be entitled to receive
his base salary, the 6% bonus and the LTC payment for the remainder
of the term. In addition, in such event, Mr.
Goldstein’s vested options would remain exercisable until the
first anniversary of the termination date.
Mr. Goldstein would be
entitled, under certain circumstances, to a payment equal to one
and one-half times his then annual salary and the target LTC
payment of $1,890,000 in the event of the termination of his
employment within eighteen months following a change of control of
the Company.
Under
such circumstances, Mr. Goldstein’s outstanding options would
become exercisable and would remain exercisable until the first
anniversary of the termination date.
Dale A. Thatcher
Pursuant to the 2019 Thatcher Employment Agreement, in the event
that Mr. Thatcher’s employment is terminated by the Company
without cause or he resigns for good reason (each as defined in the
2019 Thatcher Employment Agreement), Mr. Thatcher would be entitled
to receive separation payments equal to his then applicable base
salary and the 3% bonus for the remainder of the term.
In the event of the termination of Mr. Thatcher's employment within
eighteen months following a change of control of the Company, Mr.
Thatcher would be entitled, under certain circumstances, to (i) a
payment equal to one and one-half times the sum of his then annual
salary and annual performance bonus and (ii) payment of health
insurance premiums for the remainder of the term. In the event of
Mr. Thatcher's retirement from the Company, all stock grants
previously granted to Mr. Thatcher will continue to vest in
accordance with the original schedule as of Mr. Thatcher was still
employed by the Company.
Compensation of Directors
The
following table sets forth certain information concerning the
compensation of our directors for the fiscal year ended December
31, 2018:
DIRECTOR COMPENSATION
|
Name
|
Fees
Earned or
Paid in
Cash
|
Stock
Awards(2)
|
Option
Awards
|
Total
|
|
|
|
|
|
|
|
Jay
M. Haft
|
$
61,000
|
$
41,300
|
$
-
|
$
102,300
|
|
Floyd
R. Tupper
|
$
72,500
|
$
41,300
|
$
-
|
$
113,800
|
|
William
L. Yankus
|
$
67,500
|
$
41,300
|
$
-
|
$
108,800
|
|
Carla
A. D’Andre
|
$
61,000
|
$
41,300
|
$
-
|
$
102,300
|
|
Timothy
P. McFadden(1)
|
$
18,437
|
$
12,362
|
$
-
|
$
30,799
|
(1)
Mr.
McFadden was appointed a director in August 2018.
(2)
Amounts reflect the
aggregate grant date fair value of grants made in the fiscal year
computed in accordance with stock-based accounting rules (FASB ASC
Topic 718-Stock Compensation), excluding the effect of estimated
forfeitures. Assumptions used in the calculations of these amounts
are included in Note 12 to our Consolidated Financial Statements
included in this Annual Report. The aggregate number of unvested
restricted stock awards outstanding as of fiscal year end for each
non-employee director is as follows:
|
Name
|
Unvested Restricted Stock Awards (#)
|
|
|
|
|
Jay
M. Haft
|
1,999
|
|
Floyd
R. Tupper
|
3,999
|
|
William
L. Yankus
|
3,833
|
|
Carla
A. D’Andre
|
2,833
|
|
Timothy
P. McFadden
|
795
|
75
Our
non-employee directors are currently entitled to receive annual
compensation for their services as directors as
follows:
●
Effective
January 1, 2019, $60,000
●
Effective
January 1, 2019, an additional $25,000 for service as audit
committee chair, an additional $20,000 for service as compensation
committee chair, and an additional $15,000 for services as chair
for other committees
●
Effective
January 1, 2019, $40,000 of our common stock determined by the
closing stock price on the first business day of the year, which
vest on December 31 of the same year.
During
2018, our non-employee directors were entitled to receive annual
compensation for their services as directors as
follows:
●
$50,000
(including $6,000 for services as a director of KICO)
●
An
additional $11,000 for services as committee chair (and $1,500 for
services as KICO committee chair)
●
2,000
shares of our common stock which vest in one-third increments over
a three year period (the initial grant of shares having been made
in January 2016)
ITEM
12.
S
ECURITY OWNERSHIP OF CERTAIN BENEFICIAL OWNERS
AND
MANAGEMENT AND
RELATED STOCKHOLDER MATTERS
.
Security Ownership
The
following table sets forth certain information as of March 12, 2018
regarding the beneficial ownership of our shares of common stock by
(i) each person who we believe to be the beneficial owner of more
than 5% of our outstanding shares of common stock, (ii) each
present director, (iii) named executive officer and (iv) all of our
present executive officers and directors as a group.
76
|
Name
and Address
of
Beneficial Owner
|
Number
of Shares
Beneficially
Owned
|
Approximate
Percent
of Class
|
|
|
|
|
|
Barry
B. Goldstein
15
Joys Lane
Kingston,
New York
|
658,194
(1)
|
6.1
%
|
|
|
|
|
|
Jay
M. Haft
69
Beaver Dam Road
Salisbury,
Connecticut
|
90,424
|
*
|
|
|
|
|
|
Floyd
R. Tupper
220 East 57
th
Street
New
York, New York
|
58,897
(2)
|
*
|
|
|
|
|
|
Dale
A. Thatcher
212
Third Street
Milford,
Pennsylvania
|
37,837
(3)
|
*
|
|
|
|
|
|
Victor
J. Brodsky
15
Joys Lane
Kingston,
New York
|
29,796
(4)
|
*
|
|
|
|
|
|
Benjamin
Walden
15
Joys Lane
Kingston,
New York
|
15,458
(5)
|
*
|
|
|
|
|
|
Carla
A. D’Andre
3561
Avocado Avenue
Miami,
Florida
|
11,401
|
*
|
|
|
|
|
|
William
L. Yankus
10
Pheasant Hill Road
Farmington,
Connecticut
|
7,501
(6)
|
*
|
|
|
|
|
|
Timothy
P. McFadden
310 8
th
Avenue N.
Saint
Petersburg, Florida
|
2,000
|
*
|
|
|
|
|
|
RenaissanceRe
Ventures Ltd.
Renaissance
Other Investments
Holding
II Ltd.
RenaissanceRe
Holdings Ltd.
Renaissance
House
12
Crow Lane
Pembrooke
HM19
Bermuda
|
595,238
(7)
|
5.5
%
|
|
|
|
|
|
All
executive officers
and
directors as a group
(9
persons)
|
911,508(1)(2)(3)(4)(5)(6)
|
8.5
%
|
*
Less than
1%.
|
|
|
|
(1)
|
The
information regarding Mr. Goldstein is based solely on publicly
available information filed with the SEC.
Includes 73,168
shares of common stock owned by Mr. Goldstein's wife. Mr. Goldstein
has sole voting and dispositive power over 585,026 shares of common
stock and shared voting and dispositive power over 73,168 shares of
common stock.
|
|
|
|
|
(2)
|
Includes
31,460 shares owned by Mr. Tupper’s wife.
Mr. Tupper has sole
voting and dispositive power over 27,437 shares of common stock and
shared voting and dispositive power over 31,460 shares of common
stock
|
|
|
|
|
(3)
|
Includes
11,905 shares issuable upon the vesting of restricted stock within
60 days.
|
|
(4)
|
Includes
556 shares issuable upon the vesting of restricted stock within 60
days.
|
|
|
|
|
(5)
|
Includes
10,000 shares issuable upon the exercise of options that are
exercisable currently and 334 shares issuable upon the vesting of
restricted stock within 60 days.
|
|
|
|
|
(6)
|
Includes
500 shares issuable upon the vesting of restricted stock within 60
days.
|
|
|
|
|
(7)
|
The
information regarding RenaissanceRe Ventures Ltd.
(“RenaissanceRe Ventures”), Renaissance Other
Investments Holding II Ltd. (“ROIHL II”) and
RenaissanceRe Holdings Ltd. (“RenaissanceRe Holdings”)
is based solely on a Schedule 13G/A filed by such reporting persons
with the SEC on February 14, 2019 (the “Renaissance
13G/A”). According to the Renaissance 13G/A, RenaissanceRe
Ventures, ROIHL II and RenaissanceRe Holdings each have shared
voting and dispositive power over the 595,238 shares of common
stock.
|
Securities Authorized for Issuance Under Equity Compensation
Plans
The
following table sets forth information as of December 31, 2018 with
respect to compensation plans (including individual compensation
arrangements) under which our common shares are authorized for
issuance, aggregated as follows:
●
All compensation plans
previously approved by security holders; and
●
All compensation plans not
previously approved by security holders.
77
EQUITY COMPENSATION PLAN INFORMATION
|
|
Number
of securities to be issued upon exercise of outstanding options,
warrants and rights
|
Weighted
average exercise price of outstanding options, warrants and
rights
|
Number
of securities remaining available for future issuance under equity
compensation plans (excluding securities reflected in column
(a))
|
|
|
(a)
|
(b)
|
(c)
|
|
Equity
compensation plans approved by security holders
|
37,500
|
$
8.60
|
466,124
|
|
|
|
|
|
|
Equity compensation plans not approved by security
holders
|
|
|
|
|
|
|
|
|
|
Total
|
37,500
|
$
8.36
|
466,124
|
Director Independence
Board of Directors
Our
Board of Directors is currently comprised of Barry B. Goldstein,
Dale A. Thatcher, Jay M. Haft, Floyd R. Tupper, William L. Yankus,
Carla A. D’Andre, and Timothy P. McFadden. Our board of
directors has determined that each of Messrs. Haft, Tupper, Yankus,
McFadden, and Ms. D’Andre are independent under applicable
Nasdaq listing standards and federal securities rules and
regulations.
Audit Committee
The
members of our Board’s Audit Committee currently are Messrs.
Tupper, Haft, and Yankus, each of whom is independent
under applicable Nasdaq listing standards and
federal securities rules and regulations on independence of Audit
Committee members
.
Nominating and Corporate Governance Committee
The
members of our Board’s Nominating and Corporate Governance
Committee currently are Mr. Haft and Ms. D’Andre, each of
whom is independent
under applicable
Nasdaq listing standards and federal securities rules and
regulations on independence
.
Compensation Committee
The
members of our Board’s Compensation Committee currently are
Messrs. Yankus, Haft, and Tupper and Ms. D’Andre, each of
whom is independent under applicable Nasdaq listing standards and
federal securities rules and regulations on
independence.
78
Related Party Transactions
The
daughter of Barry Goldstein, Amanda Goldstein, is employed as
Investor Relations Director by the Company and serves as vice
president of a subsidiary of the Company. For the fiscal year
ending December 31, 2018, she earned $142,629 in
compensation.
The
following is a summary of the fees billed to us by Marcum LLP, our
independent auditors, for professional services rendered for the
fiscal year ended December 31, 2018 and 2017.
|
Fee
Category
|
Fiscal 2018
Fees
|
Fiscal 2017
Fees
|
|
Audit
Fees(1)
|
$
309,684
|
$
392,214
|
|
Tax
Fees(2)
|
$
-
|
$
-
|
|
Audit-Related
Fees(3)
|
$
-
|
$
-
|
|
All Other
Fees(4)
|
$
-
|
$
-
|
|
|
$
309,684
|
$
392,214
|
(1)
Audit
Fees consist of fees billed for services rendered for the audit of
our consolidated financial statements and review of our condensed
consolidated financial statements included in our quarterly reports
on Form 10-Q, services rendered in connection with the filing of
Forms S-3 and services provided in connection with other statutory
or regulatory filings.
(2)
Marcum
did not provide any tax services during the period.
(3)
Marcum
did not provide any “Audit-Related Fees” during the
period.
(4)
Marcum
did not provide any “other services” during the
period.
The
Audit Committee is responsible for the appointment, compensation
and oversight of the work of the independent auditors and approves
in advance any services to be performed by the independent
auditors, whether audit-related or not. The Audit Committee reviews
each proposed engagement to determine whether the provision of
services is compatible with maintaining the independence of the
independent auditors. Substantially all of the fees shown above
were pre-approved by the Audit Committee.
79
PART IV
|
Exhibit
Number
|
Description of Exhibit
|
|
|
|
|
|
|
Restated Certificate of Incorporation, as amended (incorporated by
reference to Exhibit 3(a) to the Company’s Quarterly Report
on Form 10-Q for the period ended March 31, 2014 filed on May 15,
2014).
|
||
|
|
|
|
|
By-laws, as amended (incorporated by reference to Exhibit 3.1 to
the Company’s current Report on Form 8-K filed on November 9,
2009).
|
||
|
|
|
|
|
Indenture, dated as of December 19, 2017, between Kingstone
Companies, Inc. and Wilmington Trust, National Association
(incorporated by reference to Exhibit 4.1 to the Company’s
Current Report on Form 8-K filed December 20, 2017).
|
||
|
|
|
|
|
First Supplemental Indenture, dated as of December 19, 2017,
between Kingstone Companies, Inc. and Wilmington Trust, National
Association (incorporated by reference to Exhibit 4.2 to the
Company’s Current Report on Form 8-K filed December 20,
2017).
|
||
|
|
|
|
|
Form of Global Note representing $30,000,000 aggregate principal
amount of 5.50% Senior Unsecured Notes due 2022 (incorporated by
reference to Exhibit 4.3 to the Company’s Current Report on
Form 8-K filed December 20, 2017).
|
||
|
|
|
|
|
2005 Equity Participation Plan (incorporated by reference to
Exhibit 10(a) to the Company’s Annual Report on Form 10-K
filed March 25, 2015).
|
||
|
|
|
|
|
2014 Equity Participation Plan (incorporated by reference to
Exhibit 10.1 to the Company’s Current Report on Form 8-K
filed August 14, 2014).
|
||
|
|
|
|
|
Amended and Restated Employment Agreement, dated as of October 16,
2018, by and between Kingstone Companies, Inc. and Barry B.
Goldstein (incorporated by reference to Exhibit 10.1 to the
Company’s Current Report on Form 8-K filed on October 22,
2018).
|
||
|
|
|
|
|
Stock Option Agreement, dated as of August 12, 2014, between
Kingstone Companies, Inc. and Barry B. Goldstein (2005 Equity
Participation Plan) (incorporated by reference to Exhibit 10.3 to
the Company’s Current Report on Form 8-K filed August 14,
2014).
|
||
|
|
|
|
|
Stock Option Agreement, dated as of August 12, 2014, between
Kingstone Companies, Inc. and Barry B. Goldstein (2014 Equity
Participation Plan) (incorporated by reference to Exhibit 10.4 to
the Company’s Current Report on Form 8-K filed August 14,
2014).
|
||
|
|
|
|
|
Purchase Agreement, dated April 18, 2016, by and between Kingstone
Companies, Inc. and RenaissanceRe Ventures Ltd. (incorporated by
reference to Exhibit 10.1 to the Company’s Current Report on
Form 8-K filed April 19, 2016).
|
||
|
|
|
|
|
Underwriting Agreement, dated January 25, 2017, among Kingstone
Companies, Inc., the selling stockholders named therein and Sandler
O’Neill & Partners, L.P., as representative of the
underwriters named therein (incorporated by reference to Exhibit
1.1 to the Company’s Current Report on Form 8-K filed January
27, 2017).
|
||
|
|
|
|
|
Underwriting Agreement, dated December 14, 2017, between Kingstone
Companies, Inc. and Sandler O’Neill & Partners, L.P.
(incorporated by reference to Exhibit 1.1 to the Company’s
Current Report on Form 8-K filed December 18, 2017).
|
||
|
|
|
|
|
Employment Agreement, dated as of October 16, 2018, by and between
Kingstone Companies, Inc. and Dale A. Thatcher (incorporated by
reference to Exhibit 10.2 to the Company’s Current Report on
Form 8-K filed on October 22, 2018).
|
||
|
|
|
|
|
Stock Grant Agreement, dated as of March 14, 2018, between
Kingstone Companies, Inc. and Dale A. Thatcher.
|
||
|
|
|
|
|
Employment Agreement, dated March 14, 2018, between Kingstone
Insurance Company and Dale A. Thatcher.
|
||
|
|
|
|
|
Deferred Compensation Plan, dated as of June 18, 2018 (incorporated
by reference to Exhibit 10.1 to the Company’s Current Report
on Form 8-K filed on June 20, 2018).
|
||
|
|
|
|
|
Subsidiaries (incorporated by reference to Exhibit 21 to the
Company’s Annual Report on Form 10-K filed March 16,
2017).
|
||
|
|
|
|
|
Consent of Marcum LLP.
|
||
|
|
|
|
|
Rule 13a-14(a)/15d-14(a) Certification of Principal Executive
Officer as Adopted Pursuant to Section 302 of the Sarbanes-Oxley
Act of 2002.
|
||
|
|
|
|
|
Rule 13a-14(a)/15d-14(a) Certification of Principal Financial
Officer as Adopted Pursuant to Section 302 of the Sarbanes-Oxley
Act of 2002.
|
||
|
|
|
|
|
Certification of Chief Executive Officer and Chief Financial
Officer Pursuant to 18 U.S.C. Section 1350, as Adopted Pursuant to
Section 906 of the Sarbanes-Oxley Act of 2002.
|
||
|
|
|
|
|
101.INS
|
XBRL Instance Document.
|
|
|
|
|
|
|
101.SCH
|
101.SCH XBRL Taxonomy Extension Schema.
|
|
|
|
|
|
|
101.CAL
|
101.CAL XBRL Taxonomy Extension Calculation Linkbase.
|
|
|
|
|
|
|
101.DEF
|
101.DEF XBRL Taxonomy Extension Definition Linkbase.
|
|
|
|
|
|
|
101.LAB
|
101.LAB XBRL Taxonomy Extension Label Linkbase.
|
|
|
|
|
|
|
101.PRE
|
101.PRE XBRL Taxonomy Extension Presentation Linkbase.
|
|
80
Not applicable.
81
S
IGNATURES
Pursuant to the
requirements of Section 13 or 15(d) of the Securities Exchange Act
of 1934, the registrant has duly caused this report to be signed on
its behalf by the undersigned, thereunto duly
authorized.
|
|
KINGSTONE
COMPANIES, INC.
|
|
|
|
|
|
|
|
|
March 18,
2019
|
By:
|
/s/
Dale A.
Thatcher
|
|
|
|
|
Dale A.
Thatcher
|
|
|
|
|
Chief Executive
Officer
|
|
Pursuant to the
requirements of the Securities Exchange Act of 1934, this report
has been signed below by the following persons on behalf of the
registrant and in the capacities and on the dates
indicated.
|
Signature
|
|
Title
|
|
Date
|
|
|
|
|
|
|
|
/s/
Dale A.
Thatcher
|
|
Chief Executive
Officer, and Director (Principal Executive
Officer)
|
|
March 18,
2019
|
|
Dale A.
Thatcher
|
|
|
|
|
|
|
|
|
|
|
|
/s/
Victor J.
Brodsky
|
|
Chief Financial
Officer and Treasurer
(Principal
Financial and Accounting Officer)
|
|
March 18,
2019
|
|
Victor J.
Brodsky
|
|
|
|
|
|
|
|
|
|
|
|
/s/
Barry B.
Goldstein
|
|
Executive Chairman
of the Board
|
|
March 18,
2019
|
|
Barry B.
Goldstein
|
|
|
|
|
|
|
|
|
|
|
|
/s/
Jay M.
Haft
|
|
Director |
|
March 18, 2019 |
|
Jay M. Haft
|
|
|
|
|
|
|
|
|
|
|
|
/s/
Floyd R.
Tupper
|
|
Director |
|
March 18, 2019 |
|
Floyd R.
Tupper
|
|
|
|
|
|
|
|
|
|
|
|
/s/
William L.
Yankus
|
|
Director |
|
March 18, 2019 |
|
William L.
Yankus
|
|
|
|
|
|
|
|
|
|
|
|
/s/
Carla
D’Andre
|
|
Director |
|
March 18, 2019 |
|
Carla
D’Andre
|
|
|
|
|
|
|
|
|
|
|
|
/s/
Timothy P.
McFadden
|
|
Director |
|
March 18, 2019 |
|
Timothy P.
McFadden
|
|
|
|
|
82
Index to Consolidated Financial Statements
|
|
Page
|
|
Report of Independent Registered Public Accounting
Firm
|
F-2
|
|
Consolidated Balance Sheets as of December 31, 2018 and
2017
|
F-3
|
|
Consolidated Statements of Income and Comprehensive Income (Loss)
for the years ended
|
F-4
|
|
December
31, 2018 and 2017
|
|
|
Consolidated Statements of Stockholders’ Equity for the years
ended December 31, 2018
|
F-5
|
|
and
2017
|
|
|
Consolidated Statements of Cash Flows for the years ended
December 31, 2018 and 2017
|
F-6
|
|
Notes to Consolidated Financial Statements
|
F-7
|
REPORT OF INDEPENDENT REGISTERED PUBLIC ACCOUNTING
FIRM
To the
Shareholders and Board of Directors of
Kingstone
Companies, Inc.
Opinion on the Financial Statements
We have audited the accompanying consolidated balance sheets of
Kingstone Companies, Inc. and Subsidiaries (the
“Company”) as of December 31, 2018 and 2017, the
related consolidated statements of income and comprehensive income
(loss)
,
stockholders’
equity and cash flows for the years then ended, and the related
notes (collectively referred to as the “financial
statements”). In our opinion, the financial statements
present fairly, in all material respects, the financial position of
the Company as of December 31, 2018 and 2017, and the results of
its operations and its cash flows for the years then ended, in
conformity with accounting principles generally accepted in the
United States of America.
We also
have audited, in accordance with the standards of the Public
Company Accounting Oversight Board (United States) (the "PCAOB"),
the Company's internal control over financial reporting as of
December 31, 2018, based on criteria established in
Internal Control - Integrated Framework
(2013)
issued by the Committee of Sponsoring Organizations
of the Treadway Commission and our report dated March 18,
2019
,
expressed an
unqualified opinion on the effectiveness of the Company’s
internal control over financial reporting.
Change in Accounting Principle
As
discussed in Note 2 to the financial statements, the Company has
changed its method of accounting for the recognition and
measurement of equity securities in 2018.
Basis for Opinion
These
financial statements are the responsibility of the Company's
management. Our responsibility is to express an opinion on the
Company's financial statements based on our audits. We are a public
accounting firm registered with the PCAOB and are required to be
independent with respect to the Company in accordance with the U.S.
federal securities laws and the applicable rules and regulations of
the Securities and Exchange Commission and the PCAOB.
We
conducted our audits in accordance with the standards of the PCAOB.
Those standards require that we plan and perform the audits to
obtain reasonable assurance about whether the financial statements
are free of material misstatement, whether due to error or fraud.
Our audits included performing procedures to assess the risks of
material misstatement of the financial statements, whether due to
error or fraud, and performing procedures that respond to those
risks. Such procedures included examining, on a test basis,
evidence regarding the amounts and disclosures in the financial
statements. Our audits also included evaluating the accounting
principles used and significant estimates made by management, as
well as evaluating the overall presentation of the financial
statements. We believe that our audits provide a reasonable basis
for our opinion.
/s/
Marcum
LLP
Marcum
LLP
Hartford,
CT
March
18, 2019
We have
served as the Company’s auditor since 2012
.
F-2
|
KINGSTONE COMPANIES, INC. AND SUBSIDIARIES
|
||
|
Consolidated
Balance Sheets
|
||
|
|
December
31,
|
December
31,
|
|
|
2018
|
2017
|
|
|
|
|
|
Assets
|
|
|
|
Fixed-maturity
securities, held-to-maturity, at amortized cost (fair value
of
|
|
|
|
$4,426,416
at December 31, 2018 and $5,150,076 at December 31,
2017)
|
$
4,222,855
|
$
4,869,808
|
|
Fixed-maturity
securities, available-for-sale, at fair value (amortized cost
of
|
|
|
|
$155,431,261
at December 31, 2018 and $119,122,106 at December 31,
2017)
|
151,777,517
|
119,988,256
|
|
Equity
securities, at fair value (cost of $18,305,986 at December 31, 2018
and
|
|
|
|
$13,761,841
at December 31, 2017)
|
16,572,616
|
14,286,198
|
|
Other
investments
|
1,855,225
|
-
|
|
Total
investments
|
174,428,213
|
139,144,262
|
|
Cash
and cash equivalents
|
21,138,403
|
48,381,633
|
|
Investment
subscription receivable
|
-
|
2,000,000
|
|
Premiums
receivable, net
|
13,961,599
|
13,217,698
|
|
Reinsurance
receivables, net
|
26,367,115
|
28,519,130
|
|
Deferred
policy acquisition costs
|
17,907,737
|
14,847,236
|
|
Intangible
assets, net
|
670,000
|
1,010,000
|
|
Property
and equipment, net
|
6,056,929
|
4,772,577
|
|
Deferred
income tax
|
354,233
|
-
|
|
Other
assets
|
5,867,850
|
2,655,527
|
|
Total assets
|
$
266,752,079
|
$
254,548,063
|
|
|
|
|
|
Liabilities
|
|
|
|
Loss
and loss adjustment expense reserves
|
$
56,197,106
|
$
48,799,622
|
|
Unearned
premiums
|
79,032,131
|
65,647,663
|
|
Advance
premiums
|
2,107,629
|
1,477,693
|
|
Reinsurance
balances payable
|
1,933,376
|
2,563,966
|
|
Deferred
ceding commission revenue
|
2,686,677
|
4,266,412
|
|
Accounts
payable, accrued expenses and other liabilities
|
6,819,231
|
7,487,654
|
|
Income
taxes payable
|
15,035
|
-
|
|
Deferred
income tax
|
-
|
600,342
|
|
Long-term
debt, net
|
29,295,251
|
29,126,965
|
|
Total liabilities
|
178,086,436
|
159,970,317
|
|
|
|
|
|
Commitments and Contingencies
|
|
|
|
|
|
|
|
Stockholders' Equity
|
|
|
|
Preferred
stock, $.01 par value; authorized 2,500,000 shares
|
-
|
-
|
|
Common
stock, $.01 par value; authorized 20,000,000 shares; issued
11,775,148 shares
|
|
|
|
at
December 31, 2018 and 11,618,646 at December 31, 2017;
outstanding
|
|
|
|
10,747,709
shares at December 31, 2018 and 10,631,837 shares at December 31,
2017
|
117,751
|
116,186
|
|
Capital
in excess of par
|
67,763,940
|
68,380,390
|
|
Accumulated
other comprehensive (loss) income
|
(2,884,313
)
|
1,100,647
|
|
Retained
earnings
|
26,380,816
|
27,152,822
|
|
|
91,378,194
|
96,750,045
|
|
Treasury
stock, at cost, 1,027,439 shares at December 31, 2018
|
|
|
|
and
986,809 shares at December 31, 2017
|
(2,712,552
)
|
(2,172,299
)
|
|
Total stockholders' equity
|
88,665,642
|
94,577,746
|
|
|
|
|
|
Total liabilities and stockholders' equity
|
$
266,752,078
|
$
254,548,063
|
See accompanying notes to these consolidated financial
statements.
F-3
|
|
|
|
|
Consolidated
Statements of Income and Comprehensive Income
(Loss)
|
||
|
Years ended December 31,
|
2018
|
2017
|
|
|
|
|
|
Revenues
|
|
|
|
Net
premiums earned
|
$
103,414,715
|
$
77,351,023
|
|
Ceding
commission revenue
|
5,332,630
|
9,933,133
|
|
Net
investment income
|
6,186,248
|
4,132,586
|
|
Net
(losses) gains on investments
|
(2,495,857
)
|
84,313
|
|
Other
income
|
1,334,162
|
1,268,255
|
|
Total
revenues
|
113,771,898
|
92,769,310
|
|
|
|
|
|
Expenses
|
|
|
|
Loss
and loss adjustment expenses
|
58,295,205
|
34,185,537
|
|
Commission
expense
|
25,342,137
|
21,182,254
|
|
Other
underwriting expenses
|
20,943,342
|
18,115,614
|
|
Other
operating expenses
|
2,575,404
|
3,512,927
|
|
Depreciation
and amortization
|
1,787,150
|
1,402,928
|
|
Interest
expense
|
1,821,597
|
60,335
|
|
Total
expenses
|
110,764,835
|
78,459,595
|
|
|
|
|
|
Income
from operations before taxes
|
3,007,063
|
14,309,715
|
|
Income
tax (benefit) expense
|
(86,183
)
|
4,323,230
|
|
Net income
|
3,093,246
|
9,986,485
|
|
|
|
|
|
Other comprehensive (loss) income, net of tax
|
|
|
|
Gross
change in unrealized (losses) gains
|
|
|
|
on
available-for-sale-securities
|
(4,984,149
)
|
1,364,319
|
|
|
|
|
|
Reclassification
adjustment for losses (gains)
|
|
|
|
included
in net income
|
464,254
|
(84,313
)
|
|
Net
change in unrealized (losses) gains
|
(4,519,895
)
|
1,280,006
|
|
Income
tax benefit (expense) related to items
|
|
|
|
of
other comprehensive (loss) income
|
949,177
|
(435,202
)
|
|
Other comprehensive (loss) income, net of tax
|
(3,570,718
)
|
844,804
|
|
|
|
|
|
Comprehensive (loss) income
|
$
(477,472
)
|
$
10,831,289
|
|
|
|
|
|
Earnings
per common share:
|
|
|
|
Basic
|
$
0.29
|
$
0.96
|
|
Diluted
|
$
0.29
|
$
0.94
|
|
|
|
|
|
Weighted
average common shares outstanding
|
|
|
|
Basic
|
10,686,813
|
10,388,440
|
|
Diluted
|
10,716,886
|
10,581,577
|
|
|
|
|
|
Dividends
declared and paid per common share
|
$
0.4000
|
$
0.3025
|
See accompanying notes to these consolidated financial
statements.
F-4
|
KINGSTONE
COMPANIES, INC. AND SUBSIDIARIES
|
||||||||||
|
|
|
|
|
|
|
|
|
|
|
|
|
Consolidated
Statements of Stockholders' Equity
|
||||||||||
|
Years
ended December 31, 2018 and 2017
|
||||||||||
|
|
|
|
|
|
|
|
|
|
|
|
|
|
|
|
|
|
|
Accumulated
|
|
|
|
|
|
|
|
|
|
|
Capital
|
Other
|
|
|
|
|
|
|
Preferred
Stock
|
Common
Stock
|
in
Excess
|
Comprehensive
|
Retained
|
Treasury
Stock
|
|
|||
|
|
Shares
|
Amount
|
Shares
|
Amount
|
of
Par
|
Income
(Loss)
|
Earnings
|
Shares
|
Amount
|
Total
|
|
Balance, January 1,
2017
|
-
|
$
-
|
8,896,335
|
$
88,963
|
$
37,950,401
|
$
72,931
|
$
20,563,720
|
974,469
|
$
(1,995,462
)
|
$
56,680,553
|
|
Proceeds from public offering, net
of
offering costs of $2,173,000
|
-
|
-
|
2,692,500
|
26,925
|
30,109,774
|
-
|
-
|
-
|
-
|
30,136,699
|
|
Stock-based
compensation
|
-
|
-
|
-
|
-
|
270,231
|
-
|
-
|
-
|
-
|
270,231
|
|
Vesting of restricted stock
awards
|
-
|
-
|
12,311
|
123
|
(123
)
|
-
|
-
|
-
|
-
|
-
|
|
Shares deducted from restricted
stock
awards for payment of withholding
taxes
|
-
|
-
|
(1,730
)
|
(18
)
|
(27,627
)
|
-
|
-
|
-
|
-
|
(27,645
)
|
|
Exercise of stock
options
|
-
|
-
|
19,230
|
193
|
77,734
|
-
|
-
|
-
|
-
|
77,927
|
|
Acquisition of treasury
stock
|
-
|
-
|
-
|
-
|
-
|
-
|
-
|
12,340
|
(176,837
)
|
(176,837
)
|
|
Dividends
|
-
|
-
|
-
|
-
|
-
|
-
|
(3,214,471
)
|
-
|
-
|
(3,214,471
)
|
|
Net income
|
-
|
-
|
-
|
-
|
-
|
-
|
9,986,485
|
-
|
-
|
9,986,485
|
|
Other comprehensive
income
|
-
|
-
|
-
|
-
|
-
|
844,804
|
-
|
-
|
-
|
844,804
|
|
Reclassify stranded tax effects
from accumulated other comprehensive income to retained
earnings
|
-
|
-
|
-
|
-
|
-
|
182,912
|
(182,912
)
|
-
|
-
|
-
|
|
Balance, December 31, 2017, as
reported
|
-
|
-
|
11,618,646
|
116,186
|
68,380,390
|
1,100,647
|
27,152,822
|
986,809
|
(2,172,299
)
|
94,577,746
|
|
Cumulative effect of adoption of
updated
accounting guidance for equity
financial
instruments at January 1, 2018
|
-
|
-
|
-
|
-
|
-
|
(414,242
)
|
414,242
|
-
|
-
|
-
|
|
Balance, January 1, 2018, as
adjusted
|
-
|
-
|
11,618,646
|
116,186
|
68,380,390
|
686,405
|
27,567,064
|
986,809
|
(2,172,299
)
|
94,577,746
|
|
Stock-based
compensation
|
-
|
-
|
-
|
-
|
702,650
|
-
|
-
|
-
|
-
|
702,650
|
|
Shares deducted from exercise of
stock
options for payment of withholding
taxes
|
-
|
-
|
(72,063
)
|
(719
)
|
(1,356,452
)
|
-
|
-
|
-
|
-
|
(1,357,171
)
|
|
Vesting of restricted stock
awards
|
-
|
-
|
19,482
|
190
|
(190
)
|
-
|
-
|
-
|
-
|
-
|
|
Shares deducted from restricted
stock
awards for payment of withholding
taxes
|
-
|
-
|
(2,877
)
|
(29
)
|
(50,975
)
|
-
|
-
|
-
|
-
|
(51,004
)
|
|
Exercise of stock
options
|
-
|
-
|
211,960
|
2,123
|
88,517
|
-
|
-
|
-
|
-
|
90,640
|
|
Acquisition of treasury
stock
|
-
|
-
|
-
|
-
|
-
|
-
|
-
|
40,630
|
(540,253
)
|
(540,253
)
|
|
Dividends
|
-
|
-
|
-
|
-
|
-
|
-
|
(4,279,494
)
|
-
|
-
|
(4,279,494
)
|
|
Net income
|
-
|
-
|
-
|
-
|
-
|
-
|
3,093,246
|
-
|
-
|
3,093,246
|
|
Other comprehensive
loss
|
-
|
-
|
-
|
-
|
-
|
(3,570,718
)
|
-
|
-
|
-
|
(3,570,718
)
|
|
Balance, December 31,
2018
|
-
|
$
-
|
11,775,148
|
$
117,751
|
$
67,763,940
|
$
(2,884,313
)
|
$
26,380,816
|
1,027,439
|
$
(2,712,552
)
|
$
88,665,642
|
See accompanying notes to these consolidated financial
statements.
F-5
|
KINGSTONE
COMPANIES, INC. AND SUBSIDIARIES
|
||
|
|
|
|
|
Consolidated
Statements of Cash Flows
|
|
|
|
Years ended December 31,
|
2018
|
2017
|
|
|
|
|
|
Cash flows from operating activities:
|
|
|
|
Net
income
|
$
3,093,246
|
$
9,986,485
|
|
Adjustments
to reconcile net income to net cash flows provided by operating
activities:
|
|
|
|
Net
losses (gains) on sale of investments
|
93,974
|
(84,313
)
|
|
Unrealized
losses of equity investments
|
2,257,727
|
-
|
|
Net
unrealized losses of other investments
|
144,156
|
-
|
|
Depreciation
and amortization
|
1,787,150
|
1,402,928
|
|
Amortization
of bond premium, net
|
373,014
|
548,846
|
|
Amortization
of discount and issuance costs on long-term debt
|
168,286
|
5,335
|
|
Stock-based
compensation
|
702,650
|
270,231
|
|
Deferred
income tax benefit
|
(5,398
)
|
(1,809
)
|
|
(Increase)
decrease in operating assets:
|
|
|
|
Premiums
receivable, net
|
(743,901
)
|
(1,568,300
)
|
|
Reinsurance
receivables, net
|
2,152,015
|
3,678,635
|
|
Deferred
policy acquisition costs
|
(3,060,501
)
|
(2,607,455
)
|
|
Other
assets
|
(3,215,227
)
|
(1,228,493
)
|
|
Increase
(decrease) in operating liabilities:
|
|
|
|
Loss
and loss adjustment expense reserves
|
7,397,484
|
7,062,903
|
|
Unearned
premiums
|
13,384,468
|
10,653,288
|
|
Advance
premiums
|
629,936
|
56,133
|
|
Reinsurance
balances payable
|
(630,590
)
|
417,949
|
|
Deferred
ceding commission revenue
|
(1,579,735
)
|
(2,585,429
)
|
|
Accounts
payable, accrued expenses and other liabilities
|
(653,388
)
|
2,039,206
|
|
Net cash flows provided by operating activities
|
22,295,366
|
28,046,140
|
|
|
|
|
|
Cash flows from investing activities:
|
|
|
|
Purchase
- fixed-maturity securities, held-to-maturity
|
-
|
(121,271
)
|
|
Purchase
- fixed-maturity securities, available-for-sale
|
(58,542,741
)
|
(50,396,228
)
|
|
Purchase
- equity securities
|
(13,380,542
)
|
(7,526,326
)
|
|
Sale
and redemption - fixed-maturity securities,
held-to-maturity
|
624,963
|
247,500
|
|
Sale
or maturity - fixed-maturity securities,
available-for-sale
|
21,381,668
|
11,132,000
|
|
Sale
- equity securities
|
9,246,840
|
3,862,127
|
|
Investment
subscription
|
-
|
(2,000,000
)
|
|
Acquisition
of fixed assets
|
(2,731,502
)
|
(2,824,132
)
|
|
Net cash flows used in investing activities
|
(43,401,314
)
|
(47,626,330
)
|
|
|
|
|
|
Cash flows from financing activities:
|
|
|
|
Net
proceeds from issuance of common stock
|
-
|
30,136,699
|
|
Net
proceeds from issuance of long-term debt
|
-
|
29,121,630
|
|
Proceeds
from exercise of stock options
|
90,640
|
77,927
|
|
Withholding
taxes paid on net exercise of stock options
|
(1,357,171
)
|
-
|
|
Withholding
taxes paid on vested retricted stock awards
|
(51,004
)
|
(27,645
)
|
|
Purchase
of treasury stock
|
(540,253
)
|
(176,837
)
|
|
Dividends
paid
|
(4,279,494
)
|
(3,214,471
)
|
|
Net cash flows (used in) provided by financing
activities
|
(6,137,282
)
|
55,917,303
|
|
|
|
|
|
(Decrease)
increase in cash and cash equivalents
|
$
(27,243,230
)
|
$
36,337,113
|
|
Cash
and cash equivalents, beginning of period
|
48,381,633
|
12,044,520
|
|
Cash and cash equivalents, end of period
|
$
21,138,403
|
$
48,381,633
|
|
|
|
|
|
Supplemental
disclosures of cash flow information:
|
|
|
|
Cash paid for
income taxes
|
$
2,201,000
|
$
5,773,000
|
|
Cash paid for
interest
|
$
1,700,417
|
$
-
|
See accompanying notes to these consolidated financial
statements.
F-6
KINGSTONE COMPANIES, INC. AND SUBSIDIARIES
NOTES TO CONSOLIDATED FINANCIAL STATEMENTS
YEARS ENDED DECEMBER 31, 2018 AND 2017
Note 1 - Nature of Business
Kingstone
Companies, Inc. (referred to herein as "Kingstone" or the
“Company”), through its wholly owned subsidiary,
Kingstone Insurance Company (“KICO”), underwrites
property and casualty insurance to small businesses and individuals
exclusively through independent agents and brokers. KICO is a
licensed insurance company in the States of New York, New Jersey,
Rhode Island, Massachusetts, Pennsylvania, Connecticut, Maine and
New Hampshire. KICO is currently offering its property and casualty
insurance products in New York, New Jersey, Rhode Island,
Massachusetts and Pennsylvania. Although New Jersey, Rhode Island
and Massachusetts are now growing expansion markets for the
Company, 93.7% and 98.5% of KICO’s direct written premiums
for the years ended December 31, 2018 and 2017, respectively, came
from the New York policies.
Note 2 – Summary of Significant Accounting
Policies
Basis of Presentation
The
accompanying consolidated financial statements have been prepared
in accordance with accounting principles generally accepted in the
United States of America (“GAAP”).
Principles of Consolidation
The
consolidated financial statements consist of Kingstone and its
wholly owned subsidiaries: KICO and its wholly owned subsidiaries,
CMIC Properties, Inc. (“Properties”) and 15 Joys Lane,
LLC (“15 Joys Lane”), which together own the land and
building from which KICO operates. All significant inter-company
account balances and transactions have been eliminated in
consolidation.
Revenue Recognition
Net Premiums Earned
Insurance policies issued by the Company are short-duration
contracts. Accordingly, premium revenues, net of premiums ceded to
reinsurers, are recognized as earned in proportion to the amount of
insurance protection provided, on a pro-rata basis over the terms
of the underlying policies. Unearned premiums represent premiums
applicable to the unexpired portions of in-force insurance
contracts at the end of each year.
Ceding Commission Revenue
Commissions
on reinsurance premiums ceded are earned in a manner consistent
with the recognition of the costs of the reinsurance, generally on
a pro-rata basis over the terms of the policies reinsured. Unearned
amounts are recorded as deferred ceding commission revenue. Certain
reinsurance agreements contain provisions whereby the ceding
commission rates vary based on the loss experience under the
agreements. The Company records ceding commission revenue based on
its current estimate of subject losses. The Company records
adjustments to ceding commission revenue in the period that changes
in the estimated losses are determined.
F-7
Loss and Loss Adjustment Expenses (“LAE”)
Reserves
The liability for loss and LAE represents management’s best
estimate of the ultimate cost of all reported and unreported losses
that are unpaid as of the balance sheet date. The liability for
loss and LAE is estimated on an undiscounted basis, using
individual case-basis valuations, statistical analyses and various
actuarial reserving methodologies. The projection of future claim
payment and reporting is based on an analysis of the
Company’s historical experience, supplemented by analyses of
industry loss data. Management believes that the reserves for loss
and LAE are adequate to cover the ultimate cost of losses and
claims to date; however, because of the uncertainty from various
sources, including changes in reporting patterns, claims settlement
patterns, judicial decisions, legislation, and economic conditions,
actual loss experience may not conform to the assumptions used in
determining the estimated amounts for such liability at the balance
sheet date. Adjustments to these estimates are reflected in expense
for the period in which the estimates are changed. Because of the
nature of the business historically written, management believes
that the Company has limited exposure to environmental claim
liabilities.
Reinsurance
In the normal course of business, the Company seeks to reduce the
loss that may arise from catastrophes or other events that cause
unfavorable underwriting results. This is done by reinsuring
certain levels of risk in various areas of exposure with a panel of
financially secure reinsurance carriers.
Reinsurance receivables represents management’s best estimate
of paid and unpaid loss and LAE recoverable from reinsurers, and
ceded losses receivable and unearned ceded premiums under
reinsurance agreements. Ceded losses receivable are estimated using
techniques and assumptions consistent with those used in estimating
the liability for loss and LAE. Management believes that
reinsurance receivables as recorded represent its best estimate of
such amounts; however, as changes in the estimated ultimate
liability for loss and LAE are determined, the estimated ultimate
amount receivable from the reinsurers will also change.
Accordingly, the ultimate receivable could be significantly in
excess of or less than the amount recorded in the consolidated
financial statements. Adjustments to these estimates are reflected
in the period in which the estimates are changed. Loss and LAE
incurred as presented in the consolidated statements of income and
comprehensive income
(loss)
are net of reinsurance recoveries.
Management has evaluated its reinsurance arrangements and
determined that significant insurance risk is transferred to the
reinsurers. Reinsurance agreements have been determined to be
short-duration prospective contracts and, accordingly, the costs of
the reinsurance are recognized over the life of the contract in a
manner consistent with the earning of premiums on the underlying
policies subject to the reinsurance contract.
Management estimates uncollectible amounts receivable from
reinsurers based on an assessment of factors including the
creditworthiness of the reinsurers and the adequacy of collateral
obtained, where applicable. There was no allowance for
uncollectible reinsurance as of December 31, 2018 and 2017. The
Company did not expense any uncollectible reinsurance for the years
ended December 31, 2018 and 2017. Significant uncertainties are
inherent in the assessment of the creditworthiness of reinsurers
and estimates of any uncollectible amounts due from reinsurers. Any
change in the ability of the Company’s reinsurers to meet
their contractual obligations could have a material adverse effect
on the consolidated financial statements as well as KICO’s
ability to meet its regulatory capital and surplus
requirements.
F-8
Cash and Cash Equivalents
The Company considers all highly liquid investments with original
maturities of three months or less to be cash equivalents. The
Company maintains its cash balances at several financial
institutions.
Investments
The Company classifies its fixed-maturity securities as either
held-to-maturity or available-for-sale.
Effective January 1,
2018, the Company adopted ASU 2016-01, which resulted in changes in
the estimated fair value of equity securities and other investments
held at December 31, 2018 being reported in net income instead of
other comprehensive income (loss). For additional discussion, see
Note 2, Accounting Policies.
The
Company may sell its available-for-sale securities, equity
securities, and other investments in response to changes in
interest rates, risk/reward characteristics, liquidity needs or
other factors. Fixed-maturity securities that the Company has the
specific intent and ability to hold until maturity are classified
as such and carried at amortized cost.
Available-for-sale securities are reported at their estimated fair
values based on quoted market prices from a recognized pricing
service, with unrealized gains and losses, net of tax effects,
reported as a separate component of accumulated other comprehensive
income (loss). Realized gains and losses are determined on the
specific identification method and reported in net income in the
consolidated statements of income and comprehensive income
(loss).
Equity securities are reported at their estimated fair values based
on quoted market prices from recognized pricing services, with
unrealized gains and losses reported in net income. Other
investments are reported at their estimated fair values using the
net asset value (“NAV”) per share (or its equivalent)
of the instrument with unrealized gains and losses reported in net
income. See Note 3, Investments for additional
discussion.
Investment income is accrued to the balance sheet dates of the
consolidated financial statements and includes amortization of
premium and accretion of discount on fixed-maturity securities.
Interest is recognized when earned, while dividends are recognized
when declared. Due and accrued investment income totaled
approximately $1,721,000 and $1,136,000 as of December 31, 2018 and
2017, respectively, and is included in other assets on the
accompanying consolidated balance sheets.
Premiums Receivable
Premiums receivable include balances due currently or in the future
and are presented net of an allowance for doubtful accounts of
approximately $255,000 and $291,000 as of December 31, 2018 and
2017, respectively. The allowance for uncollectible amounts is
based on an analysis of amounts receivable giving consideration to
historical loss experience and current economic conditions and
reflects an amount that, in management’s judgment, is
adequate. Uncollectible premiums receivable balances of
approximately $252,000 and $138,000 were written off for the years
ended December 31, 2018 and 2017, respectively.
Deferred Policy Acquisition Costs
Policy
acquisition costs represent the costs of writing business that vary
with, and are primarily related to, the successful production of
insurance business (principally commissions, premium taxes and
certain underwriting salaries). Policy acquisition costs are
deferred and recognized as expense as related premiums are
earned.
F-9
Intangible Assets
The
Company has recorded acquired identifiable intangible assets. The
cost of a group of assets acquired in a transaction is allocated to
the individual assets including identifiable intangible assets
based on their fair values. Identifiable intangible assets with a
finite useful life are amortized over the period that the asset is
expected to contribute directly or indirectly to the future cash
flows of the Company. Intangible assets with an indefinite life are
not amortized, but are subject to impairment testing if events or
changes in circumstances indicate that it is more likely than not
the asset is impaired. All identifiable intangible assets are
tested for recoverability whenever events or changes in
circumstances indicate that a carrying amount may not be
recoverable. No impairment losses from intangible assets were
recognized for the years ended December 31, 2018 and
2017.
Property and Equipment
Building and building improvements, automobiles, furniture,
computer equipment, and computer software are reported at cost less
accumulated depreciation. Depreciation is provided using the
straight-line method over the estimated useful lives of the assets.
The Company estimates the useful life for computer equipment,
computer software, automobiles, furniture and other equipment is
three years, and building and building improvements is 39
years.
The Company reviews its real estate assets used as its headquarters
to evaluate the necessity of recording impairment losses for market
changes due to declines in the estimated fair value of the
property. In evaluating potential impairment, management considers
the current estimated fair value compared to the carrying value of
the asset. At December 31, 2018 and 2017, the fair value of the
real estate assets is estimated to be in excess of the carrying
value.
Income Taxes
Deferred
tax assets and liabilities are recognized for the future tax
consequences attributable to differences between the financial
statement carrying amounts of existing assets and liabilities and
their respective tax basis and for operating loss and tax credit
carry forwards. Deferred tax assets and liabilities are measured
using enacted tax rates expected to apply to taxable income in the
years in which those temporary differences are expected to be
recovered or settled. The effect on deferred tax assets and
liabilities of a change in tax rates is recognized in income in the
period that includes the enactment date. The Company files a
consolidated tax return with its subsidiaries
.
At December 31, 2018, the Company had no
material unrecognized tax benefits and no adjustments to
liabilities or operations were required.
On
December 22, 2017, the Tax Cuts and Jobs Act of 2017 was enacted
(see Note 15 - Income Taxes).
F-10
Assessments
Insurance related assessments are accrued in the period in which
they have been incurred. A typical obligating event would be the
issuance of an insurance policy or the occurrence of a claim. The
Company is subject to a variety of assessments.
Concentration and Credit Risk
Financial instruments that potentially subject the Company to
concentration of credit risk are primarily cash and cash
equivalents, investments, and premium and reinsurance receivables.
Investments are diversified through many industries and geographic
regions based upon KICO’s Investment Committee’s
guidelines, which employs a variety of investment strategies. The
Company believes that no significant concentration of credit risk
exists with respect to investments. At times, cash may be uninsured
or in deposit accounts that exceed the Federal Deposit Insurance
Corporation (“FDIC”) insurance limits. The Company has
not experienced any losses in such accounts and management believes
the Company is not exposed to any significant credit risk. Cash
equivalents are not insured by the FDIC.
As of December 31, 2018 and 2017, the Company’s cash
equivalents were as follows:
|
|
December
31,
|
December
31,
|
|
|
2018
|
2017
|
|
|
|
|
|
Collateralized
bank repurchase agreement (1)
|
$
568,123
|
$
10,249,985
|
|
Money market
funds
|
15,012,559
|
35,874,700
|
|
Total
|
$
15,580,682
|
$
46,124,685
|
(1)
The Company has a security interest in certain of the bank's
holdings of direct obligations of the United States or one or more
agencies thereof. The collateral is held in a hold-in-custody
arrangement with a third party who maintains physical possession of
the collateral on behalf of the bank.
At December 31, 2018, the outstanding premiums receivable balance
is generally diversified due to the large number of individual
insureds comprising the Company’s customer base. The
Company’s customer base is concentrated in the New York City
metropolitan area. The Company also has receivables from its
reinsurers.
Reinsurance contracts do not relieve the Company of its obligations
to policyholders. Failure of reinsurers to honor their obligations
could result in losses to the Company. The Company periodically
evaluates the financial condition of its reinsurers to minimize its
exposure to significant losses from reinsurer insolvencies. See
Note 7 for reinsurance recoverables on unpaid and paid losses by
reinsurer. Management’s policy is to review all outstanding
receivables quarterly as well as the bad debt write-offs
experienced in the past and establish an allowance for doubtful
accounts, if deemed necessary.
F-11
Direct premiums earned from lines of business in excess of 10% of
the total subject the Company to concentration risk for the years
ended December 31, 2018 and 2017 as follows:
|
|
Years
ended December 31,
|
|
|
|
2018
|
2017
|
|
Personal
Lines
|
80.7
%
|
77.2
%
|
|
Commercial
Lines
|
11.6
%
|
12.2
%
|
|
Livery
physical damage
|
n/a
|
10.3
%
|
|
Total
premiums earned subject to concentration
|
92.3
%
|
99.7
%
|
|
Premiums
earned not subject to concentration
|
7.7
%
|
0.3
%
|
|
Total
premiums earned
|
100.0
%
|
100.0
%
|
Use of Estimates
The preparation of financial statements in conformity with GAAP
requires management to make estimates and assumptions that affect
the reported amounts of assets and liabilities and disclosure of
contingent assets and liabilities at the date of the consolidated
financial statements and the reported amounts of revenues and
expenses during the reporting period. The actual results could
differ from these estimates and assumptions, which include the
reserves for losses and loss adjustment expenses, which are subject
to estimation errors due to the inherent uncertainty in projecting
ultimate claim amounts that will be reported and settled over a
period of many years. In addition, estimates and assumptions
associated with receivables under reinsurance contracts related to
contingent ceding commission revenue require judgments by
management. On an on-going basis, management reevaluates its
assumptions and the methods for calculating these estimates. Actual
results may differ significantly from the estimates and assumptions
used in preparing the consolidated financial
statements.
Earnings per share
Basic
earnings per common share is computed by dividing income available
to common stockholders by the weighted-average number of common
shares outstanding. Diluted earnings per common share reflect, in
periods in which they have a dilutive effect, the impact of common
shares issuable upon the exercise of stock options as well as
non-vested restricted stock awards. The computation of diluted
earnings per share excludes those options with an exercise price in
excess of the average market price of the Company’s common
shares during the periods presented. Additionally, the computation
of diluted earnings per share excludes unvested restricted stock
awards as calculated using the treasury stock method.
F-12
Advertising Costs
Advertising costs are charged to operations when the advertising is
initiated. Advertising costs are included in other underwriting
expenses in the accompanying consolidated statements of income and
comprehensive income (loss), and were approximately
$173,000
and $202,000 for the years ended December 31, 2018 and 2017,
respectively.
Stock-based Compensation
Stock-based compensation expense in 2018 and 2017 is the estimated
fair value of restricted stock awards and options granted,
amortized on a straight-line basis over the requisite service
period for the entire portion of the award less an estimate for
anticipated forfeitures. The Company uses the
“simplified” method to estimate the expected term of
the options because the Company’s historical share option
exercise experience does not provide a reasonable basis upon which
to estimate expected term.
Compensated Absences
Employees
of the Company are entitled to paid vacations, sick days, and other
time off depending on job classification, length of service and
other factors. It is impracticable to estimate the amount of
compensation of future absences and, accordingly, no liability has
been recorded in the accompanying consolidated financial
statements. The Company’s policy is to recognize the cost of
compensated absences when paid to employees.
Comprehensive Income (Loss)
Comprehensive income (loss) refers to revenues, expenses, gains and
losses that are included in comprehensive income (loss) but are
excluded from net income as these amounts are recorded directly as
an adjustment to stockholders' equity, primarily from changes in
unrealized gains and losses on available-for-sale securities, and
related income taxes
.
Accounting Changes
In May
2014, the Financial Accounting Standards Board (“FASB”)
issued Accounting Standards Update (“ASU”) 2014-09
– Revenue from Contracts with Customers (Topic 606)
(“ASU 2014-09”). The core principle of the new guidance
is that an entity should recognize revenue to reflect the transfer
of goods and services to customers in an amount equal to the
consideration the entity receives or expects to receive. The
Company adopted ASU 2014-09 effective January 1, 2018. The standard
excludes from its scope the accounting for insurance contracts,
financial instruments, and certain other agreements that are
governed under other GAAP guidance. Accordingly, the adoption of
ASU 2014-09, as amended, did not have a material impact on the
Company’s consolidated financial statements.
F-13
In
January 2016, the FASB issued ASU 2016-01 – Financial
Instruments – Overall (Subtopic 825-10): Recognition and
Measurement of Financial Assets and Financial Liabilities
(“ASU 2016-01”). Effective January 1, 2018, the Company
adopted the provisions of ASU 2016-01. The updated guidance
requires equity investments, including limited partnership
interests, except those accounted for under the equity method of
accounting, that have a readily determinable fair value to be
measured at fair value with any changes in fair value recognized in
net income. Equity securities that do not have readily determinable
fair values may be measured at estimated fair value or cost less
impairment, if any, adjusted for subsequent observable price
changes, with changes in the carrying value recognized in net
income. A qualitative assessment for impairment is required for
equity investments without readily determinable fair values. The
updated guidance also eliminates the requirement to disclose the
method and significant assumptions used to estimate the fair value
of financial instruments measured at amortized cost on the balance
sheet. The adoption of this guidance resulted in the recognition
of approximately $414,000 of net after-tax unrealized
gains on equity investments as a cumulative effect adjustment that
increased retained earnings as of January 1, 2018 and
decreased accumulated other comprehensive income (loss)
(“AOCI”) by the same amount. The Company elected to
report changes in the fair value of equity investments in net gains
(losses) on investments in the consolidated statements of income
and comprehensive income (loss). At December 31, 2017, equity
investments were classified as available-for-sale on the Company's
consolidated balance sheet. However, upon adoption, the updated
guidance eliminated the available-for-sale balance sheet
classification for equity investments. Furthermore, for the year
ended December 31, 2018, net loss on investments of approximately
$2,496,000 recorded in the consolidated statements of income and
comprehensive income (loss) includes net losses of approximately
$2,402,000 from the estimated fair value change of equity
securities and other investments.
In
August 2016, the FASB issued ASU 2016-15 – Statement of Cash
Flows (Topic 320): Classification of Certain Cash Receipts and Cash
Payments (“ASU 2016-15”). The revised ASU provides
accounting guidance for eight specific cash flow issues. The FASB
issued the standard to clarify areas where GAAP has been either
unclear or lacking in specific guidance. The Company adopted this
ASU effective January 1, 2018, and it did not have a material
impact on the Company’s consolidated financial
statements.
In May
2017, the FASB issued ASU 2017-09, Compensation - Stock
Compensation (Topic 718): Scope of Modification Accounting
(“ASU 2017-09”).
ASU 2017-09 clarifies when to
account for a change to the terms or conditions of a share-based
payment award as a modification. Under the new guidance,
modification accounting is required only if the fair value, the
vesting conditions, or the classification of the award (as equity
or liability) changes as a result of the change in terms or
conditions. The Company adopted this ASU effective January 1, 2018
on a prospective basis and it did not have a material impact on the
Company’s consolidated financial statements.
In
February 2018, the FASB issued ASU 2018-02 - Income Statement
– Reporting Comprehensive Income (Topic 220) –
Reclassification of Certain Tax Effects from Accumulated Other
Comprehensive Income (“ASU 2018-02”). The deferred
income tax liability for unrealized gains on available-for-sale
securities that were re-measured due to the reduction in corporate
income tax rates under the Tax Cuts and Jobs Act of 2017 (the
“Tax Act”) resulted in a stranded tax effect within
AOCI. This is due to the effect of the tax rate change being
recorded through continuing operations as required under Accounting
Standards Codification 740 (“ASC 740”). The revised ASU
allows for the reclassification of the stranded tax effects as a
result of the Act from AOCI to retained earnings and requires
certain other disclosures. Effective December 31, 2017, the Company
chose to early adopt the provisions of ASU 2018-02 and recorded a
one-time reclassification of $182,912 from AOCI to retained
earnings for the stranded tax effects resulting from the newly
enacted corporate tax rate. The amount of the reclassification was
the difference between the historical corporate tax rate and the
newly enacted 21% corporate tax rate.
F-14
Recent Accounting Pronouncements
In
February 2016, the FASB issued ASU 2016-02 – Leases (Topic
842) (“ASU 2016-02”). Under this ASU, lessees will
recognize a right-of-use-asset and corresponding liability on the
balance sheet for all leases, except for leases covering a period
of fewer than 12 months. The liability is to be measured as the
present value of the future minimum lease payments taking into
account renewal options if applicable plus initial incremental
direct costs such as commissions. The minimum payments are
discounted using the rate implicit in the lease or, if not known,
the lessee’s incremental borrowing rate. The lessee’s
income statement treatment for leases will vary depending on the
nature of what is being leased. A financing type lease is present
when, among other matters, the asset is being leased for a
substantial portion of its economic life or has an end-of-term
title transfer or a bargain purchase option as in today’s
practice. The payment of the liability set up for such leases will
be apportioned between interest and principal; the right-of use
asset will be generally amortized on a straight-line basis. If the
lease does not qualify as a financing type lease, it will be
accounted for on the income statement as rent on a straight-line
basis. The Company will be adopting ASU 2016-02 effective January
1, 2019. Under the new lease guidance, the Company’s assets
and liabilities will increase by approximately $960,000 primarily
related to an operating lease for office space. The Company does
not expect material changes to the consolidated statements of
income and comprehensive income
(loss)
.
In June
2016, FASB issued ASU 2016-13 - Financial Instruments - Credit
Losses (Topic 326): Measurement of Credit Losses on Financial
Instruments (“ASU 2016-13”). The revised accounting
guidance requires the measurement of all expected credit losses for
financial assets held at the reporting date based on historical
experience, current conditions, and reasonable and supportable
forecasts and requires enhanced disclosures related to the
significant estimates and judgments used in estimating credit
losses, as well as the credit quality and underwriting standards of
an organization’s portfolio. In addition, ASU 2016-13 amends
the accounting for credit losses of available-for-sale debt
securities and purchased financial assets with credit
deterioration. ASU 2016-13 will be effective on January 1, 2020.
The Company is currently evaluating the effect the updated guidance
will have on its consolidated financial statements.
In
August 2018, the Securities and Exchange Commission (the
“SEC”) adopted the final rule under SEC Release
No. 33-10532, “Disclosure Update and
Simplification,” amending certain disclosure requirements
that were redundant, duplicative, overlapping, outdated or
superseded. In addition, the amendments expanded the disclosure
requirements on the analysis of stockholders' equity for interim
financial statements. Under the amendments, an analysis of changes
in each caption of stockholders' equity presented in the balance
sheet must be provided in a note or separate statement. The
analysis should present a reconciliation of the beginning balance
to the ending balance of each period for which a statement of
comprehensive income is required to be filed. This final rule is
effective on November 5, 2018. The Company is evaluating the impact
of this guidance on its consolidated financial statements. The
Company anticipates its first presentation of changes in
stockholders’ equity will be included in its Form 10-Q for
the quarter ended March 31, 2019.
The
Company has determined that all other recently issued
accounting pronouncements will not have a material impact on its
consolidated financial position, results of operations and cash
flows, or do not apply to its operations.
F-15
Available-for-Sale Securities
The amortized cost and estimated fair value of investments in
available-for-sale fixed-maturity securities as of December 31,
2018 and December 31, 2017 are summarized as follows:
|
|
December 31, 2018
|
|||||
|
|
|
|
|
|
|
Net
|
|
|
Cost or
|
Gross
|
Gross Unrealized Losses
|
Estimated
|
Unrealized
|
|
|
|
Amortized
|
Unrealized
|
Less than 12
|
More than 12
|
Fair
|
Gains/
|
|
Categor
y
|
Cost
|
Gains
|
Months
|
Months
|
Value
|
(Losses
)
|
|
|
|
|
|
|
|
|
|
Fixed-Maturity Securities:
|
|
|
|
|
|
|
|
U.S.
Treasury securities and
|
|
|
|
|
|
|
|
obligations of U.S. government
|
|
|
|
|
|
|
|
corporations
and agencies
|
$
8,222,050
|
$
26,331
|
$
(28,000
)
|
$
-
|
$
8,220,381
|
$
(1,669
)
|
|
|
|
|
|
|
|
|
|
Political subdivisions of States,
|
|
|
|
|
|
|
|
Territories
and Possessions
|
6,339,540
|
50,903
|
(12,327
)
|
(36,508
)
|
6,341,608
|
2,068
|
|
|
|
|
|
|
|
|
|
Corporate and other bonds
|
|
|
|
|
|
|
|
Industrial
and miscellaneous
|
119,078,698
|
123,740
|
(2,775,540
)
|
(676,605
)
|
115,750,293
|
(3,328,405
)
|
|
|
|
|
|
|
|
|
|
Residential mortgage and other
|
|
|
|
|
|
|
|
asset
backed securities (1)
|
21,790,973
|
236,502
|
(231,229
)
|
(331,012
)
|
21,465,234
|
(325,739
)
|
|
Total
|
$
155,431,261
|
$
437,476
|
$
(3,047,096
)
|
$
(1,044,125
)
|
$
151,777,516
|
$
(3,653,745
)
|
(1)
In
2017, KICO placed certain residential mortgage backed securities as
eligible collateral in a designated custodian account related to
its membership in the Federal Home Loan Bank of New York ("FHLBNY")
(See Note 9). The eligible collateral would be pledged to FHLBNY if
KICO draws an advance from the FHBLNY credit line. As of December
31, 2018, the estimated fair value of the eligible investments was
approximately $5,116,000. KICO will retain all rights regarding all
securities if pledged as collateral. As of December 31, 2018, there
was no outstanding balance on the FHLBNY credit line.
F-16
|
|
December 31, 2017
|
|||||
|
|
|
|
|
|
|
Net
|
|
|
Cost or
|
Gross
|
Gross
Unrealized Losses
|
Estimated
|
Unrealized
|
|
|
|
Amortized
|
Unrealized
|
Less than
12
|
More than
12
|
Fair
|
Gains/
|
|
Category
|
Cost
|
Gains
|
Months
|
Months
|
Value
|
(Losses)
|
|
|
|
|||||
|
Fixed-Maturity Securities:
|
|
|
|
|
|
|
|
Political
subdivisions of States,
|
|
|
|
|
|
|
|
Territories
and Possessions
|
$
11,096,122
|
$
250,135
|
$
(30,814
)
|
$
-
|
$
11,315,443
|
$
219,321
|
|
|
|
|
|
|
|
|
|
Corporate
and other bonds
|
|
|
|
|
|
|
|
Industrial
and miscellaneous
|
87,562,631
|
1,189,207
|
(269,857
)
|
(340,516
)
|
88,141,465
|
578,834
|
|
|
|
|
|
|
|
|
|
Residential
mortgage and other
|
|
|
|
|
|
|
|
asset
backed securities (1)
|
20,463,353
|
305,499
|
(48,482
)
|
(189,022
)
|
20,531,348
|
67,995
|
|
Total
|
$
119,122,106
|
$
1,744,841
|
$
(349,153
)
|
$
(529,538
)
|
$
119,988,256
|
$
866,150
|
(1)
In
2017, KICO placed certain residential mortgage backed securities as
eligible collateral in a designated custodian account related to
its membership in the FHLBNY (see Note 9). The eligible collateral
would be pledged to FHLBNY if KICO draws an advance from the FHBLNY
credit line. As of December 31, 2017, the estimated fair value of
the eligible investments was approximately $6,703,000. KICO will
retain all rights regarding all securities if pledged as
collateral. As of December 31, 2017, there was no outstanding
balance on the FHLBNY credit line.
A summary of the amortized cost and estimated fair value of the
Company’s investments in available-for-sale fixed-maturity
securities by contractual maturity as of December 31, 2018 and 2017
is shown below:
The actual maturities may differ from contractual maturities
because certain borrowers have the right to call or prepay
obligations with or without penalties.
|
|
December 31, 2018
|
December 31, 2017
|
||
|
|
Amortized
|
Estimated
|
Amortized
|
Estimated
|
|
Remaining Time to Maturity
|
Cost
|
Fair Value
|
Cost
|
Fair Value
|
|
|
|
|
||
|
Less
than one year
|
$
6,742,519
|
$
6,738,014
|
$
2,585,479
|
$
2,595,938
|
|
One
to five years
|
47,038,838
|
46,640,012
|
31,716,345
|
32,065,197
|
|
Five
to ten years
|
76,884,505
|
74,290,076
|
62,702,945
|
63,129,543
|
|
More
than ten years
|
2,974,426
|
2,644,180
|
1,653,984
|
1,666,230
|
|
Residential
mortgage and other asset backed securities
|
21,790,973
|
21,465,234
|
20,463,353
|
20,531,348
|
|
Total
|
$
155,431,261
|
$
151,777,516
|
$
119,122,106
|
$
119,988,256
|
F-17
Equity Securities
The
cost, estimated fair value, and gross gains and losses of
investments in equity securities as of December 31, 2018 and 2017
are as follows:
|
|
December 31, 2018
|
|||
|
|
|
Gross
|
Gross
|
Estimated
|
|
Category
|
Cost
|
Gains
|
Losses
|
Fair Value
|
|
|
|
|||
|
Equity Securities:
|
|
|
|
|
|
Preferred
stocks
|
$
6,694,754
|
$
-
|
$
(541,798
)
|
$
6,152,956
|
|
Common
stocks and exchange
|
|
|
|
|
|
traded
mutual funds
|
11,611,232
|
99,817
|
(1,291,389
)
|
10,419,660
|
|
Total
|
$
18,305,986
|
$
99,817
|
$
(1,833,187
)
|
$
16,572,616
|
|
|
December 31, 2017
|
|||
|
|
|
Gross
|
Gross
|
Estimated
|
|
Category
|
Cost
|
Gains
|
Losses
|
Fair Value
|
|
|
|
|||
|
Equity Securities:
|
|
|
|
|
|
Preferred
stocks
|
$
7,081,099
|
$
60,867
|
$
(141,025
)
|
$
7,000,941
|
|
Common
stocks and exchange
|
|
|
|
|
|
traded
mutual funds
|
6,680,742
|
841,250
|
(236,735
)
|
7,285,257
|
|
Total
|
$
13,761,841
|
$
902,117
|
$
(377,760
)
|
$
14,286,198
|
Other Investments
The
cost, estimated fair value, and gross losses of the Company’s
other investments as of December 31, 2018 and, 2017 are as
follows:
|
|
December 31, 2018
|
December 31, 2017
|
||||
|
|
|
Gross
|
Estimated
|
|
Gross
|
Estimated
|
|
Category
|
Cost
|
Losses
|
Fair Value
|
Cost
|
Gains/(Losses)
|
Fair Value
|
|
|
|
|
|
|
||
|
Other Investments:
|
|
|
|
|
|
|
|
Hedge
fund
|
$
1,999,381
|
$
(144,156
)
|
$
1,855,225
|
$
-
|
$
-
|
$
-
|
|
Total
|
$
1,999,381
|
$
(144,156
)
|
$
1,855,225
|
$
-
|
$
-
|
$
-
|
F-18
Held-to-Maturity Securities
The amortized cost and estimated fair value of investments in
held-to-maturity fixed-maturity securities as of December 31, 2018
and 2017 are summarized as follows:
|
|
December 31, 2018
|
|||||
|
|
|
|
|
|
|
|
|
|
Cost or
|
Gross
|
Gross
Unrealized Losses
|
Estimated
|
Net
|
|
|
|
Amortized
|
Unrealized
|
Less than
12
|
More than
12
|
Fair
|
Unrealized
|
|
Category
|
Cost
|
Gains
|
Months
|
Months
|
Value
|
Gains/(Losses)
|
|
|
|
|||||
|
Held-to-Maturity Securities:
|
|
|
|
|
|
|
|
U.S.
Treasury securities
|
$
729,507
|
$
147,532
|
$
(3,964
)
|
$
-
|
$
873,075
|
$
143,568
|
|
|
|
|
|
|
|
|
|
Political
subdivisions of States,
|
|
|
|
|
|
|
|
Territories
and Possessions
|
998,803
|
33,862
|
-
|
-
|
1,032,665
|
33,862
|
|
|
|
|
|
|
|
|
|
Corporate
and other bonds
|
|
|
|
|
|
|
|
Industrial
and miscellaneous
|
2,494,545
|
38,461
|
(1,425
)
|
(10,905
)
|
2,520,676
|
26,131
|
|
|
|
|
|
|
|
|
|
Total
|
$
4,222,855
|
$
219,855
|
$
(5,389
)
|
$
(10,905
)
|
$
4,426,416
|
$
203,561
|
|
|
December 31, 2017
|
|||||
|
|
|
|
|
|
|
|
|
|
Cost or
|
Gross
|
Gross
Unrealized Losses
|
Estimated
|
Net
|
|
|
|
Amortized
|
Unrealized
|
Less than
12
|
More than
12
|
Fair
|
Unrealized
|
|
Category
|
Cost
|
Gains
|
Months
|
Months
|
Value
|
Gains/(Losses)
|
|
|
|
|||||
|
Held-to-Maturity Securities:
|
|
|
|
|
|
|
|
U.S.
Treasury securities
|
$
729,466
|
$
147,573
|
$
(1,729
)
|
$
-
|
$
875,310
|
$
145,844
|
|
|
|
|
|
|
|
|
|
Political
subdivisions of States,
|
|
|
|
|
|
|
|
Territories
and Possessions
|
998,984
|
50,366
|
-
|
-
|
1,049,350
|
50,366
|
|
|
|
|
|
|
|
|
|
Corporate
and other bonds
|
|
|
|
|
|
|
|
Industrial
and miscellaneous
|
3,141,358
|
90,358
|
-
|
(6,300
)
|
3,225,416
|
84,058
|
|
|
|
|
|
|
|
|
|
Total
|
$
4,869,808
|
$
288,297
|
$
(1,729
)
|
$
(6,300
)
|
$
5,150,076
|
$
280,268
|
Held-to-maturity U.S. Treasury securities are held in trust
pursuant to various states’ minimum fund
requirements.
F-19
A summary of the amortized cost and the estimated fair value of the
Company’s investments in held-to-maturity securities by
contractual maturity as of December 31, 2018 and 2017 is shown
below:
|
|
December 31, 2018
|
December 31, 2017
|
||
|
|
Amortized
|
Estimated
|
Amortized
|
Estimated
|
|
Remaining Time to Maturity
|
Cost
|
Fair Value
|
Cost
|
Fair Value
|
|
|
|
|
||
|
Less
than one year
|
$
-
|
$
-
|
$
-
|
$
-
|
|
One
to five years
|
2,996,685
|
3,036,531
|
2,546,459
|
2,601,898
|
|
Five
to ten years
|
619,663
|
635,846
|
1,716,884
|
1,794,139
|
|
More
than ten years
|
606,507
|
754,039
|
606,465
|
754,039
|
|
Total
|
$
4,222,855
|
$
4,426,416
|
$
4,869,808
|
$
5,150,076
|
The actual maturities may differ from contractual maturities
because certain borrowers have the right to call or prepay
obligations with or without penalties.
Investment Income
Major categories of the Company’s net investment income are
summarized as follows:
|
|
Years
ended
|
|
|
|
December 31,
|
|
|
|
2018
|
2017
|
|
|
|
|
|
Income:
|
|
|
|
Fixed-maturity
securities
|
$
5,316,970
|
$
3,664,577
|
|
Equity
securities
|
820,827
|
564,071
|
|
Cash
and cash equivalents
|
219,238
|
56,075
|
|
Total
|
6,357,035
|
4,284,723
|
|
Expenses:
|
|
|
|
Investment
expenses
|
170,787
|
152,137
|
|
Net
investment income
|
$
6,186,248
|
$
4,132,586
|
Proceeds from the sale and redemption of fixed-maturity securities
held-to-maturity were $624,963 and $247,500 for the years ended
December 31, 2018 and 2017, respectively. Proceeds from the sale
and redemption of fixed-maturity securities held-to-maturity for
the year ended December 31, 2017 includes one redemption of
$200,000 and one sale of $47,500. The sale was to dispose of a bond
issued by the Commonwealth of Puerto Rico that was deemed to have a
permanent credit impairment by the Company (see Impairment Review
Below).
Proceeds from the sale and maturity of fixed-maturity securities
available-for-sale were $21,381,668 and $11,132,000 for the years
ended December 31, 2018 and 2017, respectively.
F-20
Proceeds from the sale of equity securities were $9,246,840 and
$3,862,127 for the years ended December 31, 2018 and 2017,
respectively.
The Company’s net (losses) gains on investments are
summarized as follows:
|
|
Years
ended
|
|
|
|
December
31,
|
|
|
|
2018
|
2017
|
|
Realized (Losses) Gains
|
|
|
|
|
|
|
|
Fixed-maturity
securities:
|
|
|
|
Gross
realized gains
|
$
117,186
|
$
70,478
|
|
Gross
realized losses (1)
|
(618,699
)
|
(309,247
)
|
|
|
(501,513
)
|
(238,769
)
|
|
|
|
|
|
Equity
securities:
|
|
|
|
Gross
realized gains
|
992,012
|
636,880
|
|
Gross
realized losses
|
(584,473
)
|
(263,798
)
|
|
|
407,539
|
373,082
|
|
|
|
|
|
Net realized
(losses) gains
|
(93,974
)
|
134,313
|
|
|
|
|
|
Other-than-temporary
impairment losses:
|
|
|
|
Fixed-maturity
securities
|
-
|
(50,000
)
|
|
|
|
|
|
Unrealized (Losses) Gains
|
|
|
|
|
||
|
Equity
Securities:
|
|
|
|
Gross
gains
|
-
|
-
|
|
Gross
losses
|
(2,257,727
)
|
-
|
|
|
(2,257,727
)
|
-
|
|
|
|
|
|
Other
investments:
|
|
|
|
Gross
gains
|
-
|
-
|
|
Gross
losses
|
(144,156
)
|
-
|
|
|
(144,156
)
|
-
|
|
|
|
|
|
Net
unrealized losses
|
(2,401,883
)
|
-
|
|
|
|
|
|
Net (losses)
gains on investments
|
$
(2,495,857
)
|
$
84,313
|
(1)
Gross
realized losses for the year ended December 31, 2018 includes a
$23,912 loss from the redemption of a fixed-maturity security
held-to-maturity. Gross realized losses for the year ended December
31, 2017 includes a $59,916 loss from the sale of a fixed-maturity
security held-to-maturity issued by the Commonwealth of Puerto Rico
(see impairment review below).
F-21
Impairment Review
The Company regularly reviews its fixed-maturity securities (and
reviewed its equity securities portfolios prior to January 1, 2018)
to evaluate the necessity of recording impairment losses as charges
to operations for other-than-temporary declines in the fair value
of investments. In evaluating potential impairment, GAAP specifies
(i) if the Company does not have the intent to sell a debt security
prior to recovery and (ii) it is more likely than not that it will
not have to sell the debt security prior to recovery, the security
would not be considered other-than-temporarily impaired unless
there is a credit loss. When the Company does not intend to
sell the security and it is more likely than not that the Company
will not have to sell the security before recovery of its cost
basis, it will recognize the credit component of an
other-than-temporary impairment (“OTTI”) of a debt
security in earnings and the remaining portion in comprehensive
income
(loss)
.
The credit loss component recognized in earnings is identified as
the amount of principal cash flows not expected to be received over
the remaining term of the security based on cash flow
projections. For held-to-maturity fixed-maturity securities,
the amount of OTTI recorded in comprehensive income
(loss)
for the noncredit portion of a previous OTTI is amortized
prospectively over the remaining life of the security on the basis
of timing of future estimated cash flows of the
security.
OTTI losses are recorded in the consolidated statements of income
and comprehensive income (loss) as net realized losses on
investments and result in a permanent reduction of the cost basis
of the underlying investment. The determination of OTTI is a
subjective process and different judgments and assumptions could
affect the timing of loss realization. At December 31, 2018 and
December 31, 2017, there were 156 and 62 fixed-maturity securities,
respectively, and 13 equity securities at December 31, 2017 that
accounted for the gross unrealized loss. In December 2017, the
Company disposed of one of its held-to-maturity debt securities
that was previously recorded in OTTI, which was a bond issued by
the Commonwealth of Puerto Rico. In July 2016, Puerto Rico
defaulted on its interest payment to bondholders. Due to the credit
deterioration of Puerto Rico, the Company recorded its first credit
loss component of OTTI on this investment as of June 30, 2016. As
of December 31, 2016, the full amount of the write-down was
recognized as a credit component of OTTI in the amount of $69,911.
In September 2017, Hurricane Maria significantly affected Puerto
Rico. The impact of this event further contributed to the credit
deterioration of Puerto Rico and, as a result, the Company recorded
an additional credit loss component of OTTI on this investment for
the amount of $50,000 during the quarter ended September 30, 2017.
The total of the two OTTI write-downs of this investment through
December 31, 2017 was $119,911. The Company determined that none of
the other unrealized losses were deemed to be OTTI for its
portfolio of investments for the years ended December 31, 2018 and
2017. Significant factors influencing the Company’s
determination that unrealized losses were temporary included the
magnitude of the unrealized losses in relation to each
security’s cost, the nature of the investment and
management’s intent and ability to retain the investment for
a period of time sufficient to allow for an anticipated recovery of
fair value to the Company’s cost basis.
F-22
KINGSTONE COMPANIES, INC. AND SUBSIDIARIES
NOTES TO CONSOLIDATED FINANCIAL STATEMENTS
YEARS ENDED DECEMBER 31, 2018 AND 2017
The Company held available-for-sale securities with unrealized
losses representing declines that were considered temporary at
December 31, 2018 and 2017 as follows:
|
|
December 31, 2018
|
|||||||
|
|
Less than 12 months
|
12 months or more
|
Total
|
|||||
|
|
Estimated
|
|
No. of
|
Estimated
|
|
No. of
|
Estimated
|
|
|
|
Fair
|
Unrealized
|
Positions
|
Fair
|
Unrealized
|
Positions
|
Fair
|
Unrealized
|
|
Category
|
Value
|
Losses
|
Held
|
Value
|
Losses
|
Held
|
Value
|
Losses
|
|
|
|
|||||||
|
Fixed-Maturity Securities:
|
|
|
|
|
|
|
|
|
|
U.S. Treasury
securities
|
|
|
|
|
|
|
|
|
|
and
obligations of U.S.
|
|
|
|
|
|
|
|
|
|
government
corporations
|
|
|
|
|
|
|
|
|
|
and
agencies
|
$
4,948,530
|
$
(28,000
)
|
3
|
$
-
|
$
-
|
-
|
$
4,948,530
|
$
(28,000
)
|
|
|
|
|
|
|
|
|
|
|
|
Political
subdivisions of
|
|
|
|
|
|
|
|
|
|
States,
Territories and
|
|
|
|
|
|
|
|
|
|
Possessions
|
555,375
|
(12,327
)
|
1
|
1,436,242
|
(36,508
)
|
3
|
1,991,617
|
(48,835
)
|
|
|
|
|
|
|
|
|
|
|
|
Corporate
and other
|
|
|
|
|
|
|
|
|
|
bonds
industrial and
|
|
|
|
|
|
|
|
|
|
miscellaneous
|
81,004,459
|
(2,775,540
)
|
97
|
13,424,888
|
(676,605
)
|
24
|
94,429,347
|
(3,452,145
)
|
|
|
|
|
|
|
|
|
|
|
|
Residential
mortgage and other
|
|
|
|
|
|
|
|
|
|
asset
backed securities
|
7,002,713
|
(231,229
)
|
9
|
11,928,425
|
(331,012
)
|
19
|
18,931,138
|
(562,241
)
|
|
|
|
|
|
|
|
|
|
|
|
Total
fixed-maturity
|
|
|
|
|
|
|
|
|
|
securities
|
$
93,511,077
|
$
(3,047,096
)
|
110
|
$
26,789,555
|
$
(1,044,125
)
|
46
|
$
120,300,632
|
$
(4,091,221
)
|
F-23
KINGSTONE COMPANIES, INC. AND SUBSIDIARIES
NOTES TO CONSOLIDATED FINANCIAL STATEMENTS
YEARS ENDED DECEMBER 31, 2018 AND 2017
|
|
December 31, 2017
|
|||||||
|
|
Less than 12 months
|
12 months or more
|
Total
|
|||||
|
|
Estimated
|
|
No. of
|
Estimated
|
|
No. of
|
Estimated
|
|
|
|
Fair
|
Unrealized
|
Positions
|
Fair
|
Unrealized
|
Positions
|
Fair
|
Unrealized
|
|
Category
|
Value
|
Losses
|
Held
|
Value
|
Losses
|
Held
|
Value
|
Losses
|
|
|
|
|||||||
|
Fixed-Maturity Securities:
|
|
|
|
|
|
|
|
|
|
Political
subdivisions of
|
|
|
|
|
|
|
|
|
|
States,
Territories and
|
|
|
|
|
|
|
|
|
|
Possessions
|
$
1,549,839
|
$
(30,814
)
|
4
|
$
-
|
$
-
|
-
|
$
1,549,839
|
$
(30,814
)
|
|
|
|
|
|
|
|
|
|
|
|
Corporate
and other
|
|
|
|
|
|
|
|
|
|
bonds
industrial and
|
|
|
|
|
|
|
|
|
|
miscellaneous
|
15,036,462
|
(269,857
)
|
20
|
9,113,924
|
(340,516
)
|
17
|
24,150,386
|
(610,373
)
|
|
|
|
|
|
|
|
|
|
|
|
Residential
mortgage and other
|
|
|
|
|
|
|
|
|
|
asset
backed securities
|
6,956,371
|
(48,482
)
|
6
|
7,867,572
|
(189,022
)
|
15
|
14,823,943
|
(237,504
)
|
|
|
|
|
|
|
|
|
|
|
|
Total
fixed-maturity
|
|
|
|
|
|
|
|
|
|
securities
|
$
23,542,672
|
$
(349,153
)
|
30
|
$
16,981,496
|
$
(529,538
)
|
32
|
$
40,524,168
|
$
(878,691
)
|
|
|
|
|
|
|
|
|
|
|
|
Equity Securities:
|
|
|
|
|
|
|
|
|
|
Preferred
stocks
|
$
1,605,217
|
$
(20,313
)
|
5
|
$
1,776,675
|
$
(120,712
)
|
3
|
$
3,381,892
|
$
(141,025
)
|
|
Common
stocks and
|
|
|
|
|
|
|
|
|
|
exchange
traded mutual funds
|
1,446,375
|
(222,205
)
|
4
|
124,900
|
(14,530
)
|
1
|
1,571,275
|
(236,735
)
|
|
|
|
|
|
|
|
|
|
|
|
Total
equity securities
|
$
3,051,592
|
$
(242,518
)
|
9
|
$
1,901,575
|
$
(135,242
)
|
4
|
$
4,953,167
|
$
(377,760
)
|
|
|
|
|
|
|
|
|
|
|
|
Total
|
$
26,594,264
|
$
(591,671
)
|
39
|
$
18,883,071
|
$
(664,780
)
|
36
|
$
45,477,335
|
$
(1,256,451
)
|
F-24
KINGSTONE COMPANIES, INC. AND SUBSIDIARIES
NOTES TO CONSOLIDATED FINANCIAL STATEMENTS
YEARS ENDED DECEMBER 31, 2018 AND 2017
Note 4 - Fair Value Measurements
Fair value is the price that would be received upon sale of an
asset or paid to transfer a liability in an orderly transaction
between market participants at the measurement date. The valuation
technique used by the Company to estimate the fair value of its
financial instruments is the market approach, which uses prices and
other relevant information generated by market transactions
involving identical or comparable assets.
The fair value hierarchy gives the highest priority to quoted
prices in active markets for identical assets or liabilities
(Level 1) and the lowest priority to unobservable inputs
(Level 3). If the inputs used to measure the assets or
liabilities fall within different levels of the hierarchy, the
classification is based on the lowest level input that is
significant to the fair value measurement of the asset or
liability. Classification of assets and liabilities within the
hierarchy considers the markets in which the assets and liabilities
are traded, including during period of market disruption, and the
reliability and transparency of the assumptions used to determine
fair value. The hierarchy requires the use of observable market
data when available. The levels of the hierarchy and those
investments included in each are as follows:
Level 1
—Inputs to
the valuation methodology are quoted prices (unadjusted) for
identical assets or liabilities traded in active markets. Included
are those investments traded on an active exchange, such as the
NASDAQ Global Select Market, U.S. Treasury securities and
obligations of U.S. government agencies, together with
corporate debt securities that are generally investment
grade.
Level 2
—Inputs to
the valuation methodology include quoted prices for similar assets
or liabilities in active markets, quoted prices for identical or
similar assets or liabilities in markets that are not active,
inputs other than quoted prices that are observable for the asset
or liability and market-corroborated inputs. Municipal and
corporate bonds, and residential mortgage-backed securities, that
are traded in less active markets are classified as Level 2.
These securities are valued using market price quotations for
recently executed transactions.
Level 3
—Inputs to
the valuation methodology are unobservable for the asset or
liability and are significant to the fair value measurement.
Material assumptions and factors considered in pricing investment
securities and other assets may include appraisals, projected cash
flows, market clearing activity or liquidity circumstances in the
security or similar securities that may have occurred since the
prior pricing period.
The availability of observable inputs varies and is affected by a
wide variety of factors. When the valuation is based on models or
inputs that are less observable or unobservable in the market, the
determination of fair value requires significantly more judgment.
The degree of judgment exercised by management in determining fair
value is greatest for investments categorized as Level 3. For
investments in this category, the Company considers prices and
inputs that are current as of the measurement date. In periods of
market dislocation, as characterized by current market conditions,
the ability to observe prices and inputs may be reduced for many
instruments. This condition could cause a security to be
reclassified between levels.
F-25
KINGSTONE COMPANIES, INC. AND SUBSIDIARIES
NOTES TO CONSOLIDATED FINANCIAL STATEMENTS
YEARS ENDED DECEMBER 31, 2018 AND 2017
The Company’s investments measured at fair value on a
recurring basis are allocated among fair value levels at December
31, 2018 and 2017 as follows:
|
|
December 31,
2018
|
|||
|
|
Level
1
|
Level
2
|
Level
3
|
Total
|
|
|
|
|||
|
Fixed-maturity
securities available-for-sale
|
|
|
|
|
|
U.S. Treasury
securities
|
|
|
|
|
|
and
obligations of U.S.
|
|
|
|
|
|
government
corporations
|
|
|
|
|
|
and
agencies
|
$
8,220,381
|
$
-
|
$
-
|
$
8,220,381
|
|
|
|
|
|
|
|
Political
subdivisions of
|
|
|
|
|
|
States,
Territories and
|
|
|
|
|
|
Possessions
|
-
|
6,341,608
|
-
|
6,341,608
|
|
|
|
|
|
|
|
Corporate
and other
|
|
|
|
|
|
bonds
industrial and
|
|
|
|
|
|
miscellaneous
|
112,076,270
|
3,674,023
|
-
|
115,750,293
|
|
|
|
|
|
|
|
Residential
mortgage backed securities
|
-
|
21,465,234
|
-
|
21,465,234
|
|
Total fixed
maturities
|
120,296,651
|
31,480,865
|
-
|
151,777,516
|
|
Equity
securities
|
16,572,616
|
-
|
-
|
16,572,616
|
|
Total
investments
|
$
136,869,267
|
$
31,480,865
|
$
-
|
$
168,350,132
|
|
|
December 31,
2017
|
|||
|
|
Level
1
|
Level
2
|
Level
3
|
Total
|
|
|
|
|||
|
Fixed-maturity
securities available-for-sale
|
|
|
|
|
|
Political
subdivisions of
|
|
|
|
|
|
States,
Territories and
|
|
|
|
|
|
Possessions
|
$
-
|
$
11,315,443
|
$
-
|
$
11,315,443
|
|
|
|
|
|
|
|
Corporate
and other
|
|
|
|
|
|
bonds
industrial and
|
|
|
|
|
|
miscellaneous
|
83,597,300
|
4,544,165
|
-
|
88,141,465
|
|
|
|
|
|
|
|
Residential
mortgage backed securities
|
-
|
20,531,348
|
-
|
20,531,348
|
|
Total fixed
maturities
|
83,597,300
|
36,390,956
|
-
|
119,988,256
|
|
Equity
securities
|
14,286,198
|
-
|
-
|
14,286,198
|
|
Total
investments
|
$
97,883,498
|
$
36,390,956
|
$
-
|
$
134,274,454
|
F-26
KINGSTONE COMPANIES, INC. AND SUBSIDIARIES
NOTES TO CONSOLIDATED FINANCIAL STATEMENTS
YEARS ENDED DECEMBER 31, 2018 AND 2017
Pursuant to ASC 820 “Fair Value Measurement,” an entity
is permitted, as a practical expedient, to estimate the fair value
of an investment within the scope of ASC 820 using the net asset
value (“NAV”) per share (or its equivalent) of the
investment. The following table sets forth the Company’s
investment in a hedge fund investment measured at NAV per share (or
its equivalent) as of December 31, 2018 and 2017. The Company
measures this investment at fair value on a recurring basis. Fair
value using NAV per share is as follows as of the dates
indicated:
|
Category
|
December 31, 2018
|
December 31, 2017
|
|
|
|
|
|
Other Investments:
|
|
|
|
Hedge
fund
|
$
1,855,225
|
$
-
|
|
Total
|
$
1,855,225
|
$
-
|
The investment is generally redeemable with at least 45 days prior
written notice. The hedge fund investment is accounted for as a
limited partnership by the Company. Revenue is earned based upon
the Company’s allocated share of the partnership's changes in
unrealized gains and losses to its partners. S
uch amounts
have been recorded in the 2018 consolidated statement of income and
comprehensive income
(loss)
within net (losses) gains on investments.
The
carrying amount, estimated fair value and the level of the fair
value hierarchy of the Company’s long-term debt, which is not
measured at fair value is as follows:
|
|
December 31,
2018
|
|||
|
|
Level
1
|
Level
2
|
Level
3
|
Total
|
|
Long-term
debt
|
|
|||
|
|
|
|
|
|
|
Senior Notes
due 2022
|
$
-
|
$
28,521,734
|
$
-
|
$
28,521,734
|
|
|
December 31,
2017
|
|||
|
|
Level
1
|
Level
2
|
Level
3
|
Total
|
|
Long-term
debt
|
|
|||
|
|
|
|
|
|
|
Senior Notes
due 2022
|
$
-
|
$
28,943,251
|
$
-
|
$
28,943,251
|
The
fair value of long-term debt is estimated based on observable
market prices when available. When observable market prices were
not available, the fair values of debt were based on observable
market prices of comparable instruments adjusted for differences
between the observed instruments and the instruments being valued
or is estimated using discounted cash flow analyses, based on
current incremental borrowing rates for similar types of borrowing
arrangements.
Note 5 - Fair Value of Financial Instruments and Real
Estate
The Company uses the following methods and assumptions in
estimating the fair value of financial instruments and real
estate:
Equity securities, available-for-sale fixed income securities, and
other investments:
Fair value disclosures for these investments are
included in “Note 3 - Investments” and “Note
4 – Fair Value Measurements”.
Cash and cash equivalents:
The carrying values of cash and
cash equivalents approximate their fair values because of the
short-term nature of these instruments.
F-27
KINGSTONE COMPANIES, INC. AND SUBSIDIARIES
NOTES TO CONSOLIDATED FINANCIAL STATEMENTS
YEARS ENDED DECEMBER 31, 2018 AND 2017
Premiums receivable, reinsurance receivables, and investment
subscription receivable:
The carrying values reported in the
accompanying consolidated balance sheets for these financial
instruments approximate their fair values due to the short-term
nature of the assets.
Real estate:
The estimated fair value of the land and
building included in property and equipment, which is used in the
Company’s operations, approximates the carrying value. The
estimated fair value was based on an appraisal prepared using the
sales comparison approach, and accordingly the real estate is a
Level 3 asset under the fair value hierarchy.
Reinsurance balances payable:
The carrying value reported in the
consolidated balance sheets for these financial instruments
approximates fair value.
Long-term debt:
The estimated fair value of
long-term debt is based on observable market interest rates when
available. When observable market interest rates were not
available, the estimated fair values of debt were based on
observable market interest rates of comparable instruments adjusted
for differences between the observed instruments and the
instruments being valued or is estimated using discounted cash flow
analyses, based on current incremental borrowing rates for similar
types of borrowing arrangements.
The
estimated fair values of the Company’s financial instruments
as of December 31, 2018 and 2017 are as follows:
|
|
December 31, 2018
|
December 31, 2017
|
||
|
|
Carrying
|
Estimated
|
Carrying
|
Estimated
|
|
|
Value
|
Fair Value
|
Value
|
Fair Value
|
|
|
|
|
|
|
|
Fixed-maturity
securities-held-to maturity
|
$
4,222,855
|
$
4,426,416
|
$
4,869,808
|
$
5,150,076
|
|
Cash
and cash equivalents
|
$
21,138,403
|
$
21,138,403
|
$
48,381,633
|
$
48,381,633
|
|
Investment
subscription receivable
|
$
-
|
$
-
|
$
2,000,000
|
$
2,000,000
|
|
Premiums
receivable, net
|
$
13,961,599
|
$
13,961,599
|
$
13,217,698
|
$
13,217,698
|
|
Reinsurance
receivables, net
|
$
26,367,115
|
$
26,367,115
|
$
28,519,130
|
$
28,519,130
|
|
Real
estate, net of accumulated depreciation
|
$
2,300,827
|
$
2,705,000
|
$
2,261,829
|
$
2,705,000
|
|
Reinsurance
balances payable
|
$
1,933,376
|
$
1,933,376
|
$
2,563,966
|
$
2,563,966
|
|
Long-term
debt, net
|
$
29,295,251
|
$
28,521,734
|
$
29,126,965
|
$
28,943,251
|
Note 6 - Intangibles
Intangible
assets consist of finite and indefinite life assets. Finite life
intangible assets include customer and producer relationships and
other identifiable intangibles. The insurance company license is
considered an indefinite life intangible asset subject to annual
impairment testing. The remaining weighted average amortization
period of identified intangible assets of finite useful life is
approximately 0.5 years as of December 31, 2018.
F-28
KINGSTONE COMPANIES, INC. AND SUBSIDIARIES
NOTES TO CONSOLIDATED FINANCIAL STATEMENTS
YEARS ENDED DECEMBER 31, 2018 AND 2017
The
components of intangible assets and their useful lives, accumulated
amortization, and net carrying value as of December 31, 2018
and 2017 are summarized as follows:
|
|
|
December 31,
2018
|
December 31,
2017
|
||||
|
|
Useful
|
Gross
|
|
Net
|
Gross
|
|
Net
|
|
|
Life
|
Carrying
|
Accumulated
|
Carrying
|
Carrying
|
Accumulated
|
Carrying
|
|
|
(in
yrs)
|
Value
|
Amortization
|
Amount
|
Value
|
Amortization
|
Amount
|
|
Insurance
license
|
-
|
$
500,000
|
$
-
|
$
500,000
|
$
500,000
|
$
-
|
$
500,000
|
|
Customer
relationships
|
10
|
3,400,000
|
3,230,000
|
170,000
|
3,400,000
|
2,890,000
|
510,000
|
|
Other
identifiable
|
|
|
|
|
|
|
|
|
intangibles
|
7
|
950,000
|
950,000
|
-
|
950,000
|
950,000
|
-
|
|
Total
|
|
$
4,850,000
|
$
4,180,000
|
$
670,000
|
$
4,850,000
|
$
3,840,000
|
$
1,010,000
|
Intangible asset impairment testing and amortization
The
Company performs an analysis annually as of December 31, or sooner
if there are indicators that the asset may be impaired, to identify
potential impairment of intangible assets with both finite and
indefinite lives and measures the amount of any impairment loss
that may need to be recognized. Intangible asset impairment testing
requires an evaluation of the estimated fair value of each
identified intangible asset to its carrying value. An impairment
charge would be recorded if the estimated fair value is less than
the carrying amount of the intangible asset. No impairments have
been identified for the years ended December 31, 2018 and
2017.
The
Company recorded amortization expense related to intangibles of
$340,000, for each of the years ended December 31, 2018 and 2017.
The $170,000 remaining net carrying amount of finite life
intangibles will be amortized during the year ending December 31,
2019.
Note 7 - Reinsurance
The
Company’s quota share reinsurance treaties are on a July 1
through June 30 fiscal year basis; therefore, for year to date
fiscal periods after June 30, two separate treaties will be
included in such periods.
The
Company’s quota share reinsurance treaties in effect for the
year ended December 31, 2018 for its personal lines business, which
primarily consists of homeowners’ policies, were covered
under the July 1, 2017 through June 30, 2018 treaty year and the
new treaty year that began on July 1, 2018 (“2017/2019
Treaty”). The Company’s quota share reinsurance
treaties in effect for the year ended December 31, 2017 were
covered under the 2017/2019 Treaty and July 1, 2016 through June
30, 2017 treaty year (“2016/2017 Treaty”).
In
March 2017, the Company bound its personal lines quota share
reinsurance treaty effective July 1, 2017. The treaty provided for
a reduction in the quota share ceding rate to 20%, from 40% in the
2016/2017 Treaty, and an increase in the provisional ceding
commission rate to 53%, from 52% in the 2016/2017 Treaty. The
2017/2019 Treaty covered a two-year period from July 1, 2017
through June 30, 2019. In August 2018, the Company terminated its
contract with one of the reinsurers that was a party to the
2017/2019 Treaty. This termination was retroactive to July 1, 2018
and had the effect of reducing the quota share ceding rate to 10%
from 20%.
F-29
KINGSTONE COMPANIES, INC. AND SUBSIDIARIES
NOTES TO CONSOLIDATED FINANCIAL STATEMENTS
YEARS ENDED DECEMBER 31, 2018 AND 2017
The
Company entered into new excess of loss and catastrophe reinsurance
treaties effective July 1, 2018. Material terms for reinsurance
treaties in effect for the treaty years shown below are as
follows:
|
|
Treaty
Year
|
||
|
|
July 1,
2018
|
July 1,
2017
|
July 1,
2016
|
|
|
to
|
to
|
to
|
|
Line of
Busines
|
June 30,
2019
|
June 30,
2018
|
June 30,
2017
|
|
|
|
|
|
|
Personal Lines
:
|
|
|
|
|
Homeowners,
dwelling fire and canine legal liability
|
|
|
|
|
Quota share
treaty:
|
|
|
|
|
Percent
ceded
|
10
%
|
20
%
|
40
%
|
|
Risk
retained
|
$
900,000
|
$
800,000
|
$
500,000
|
|
Losses per
occurrence subject to quota share reinsurance coverage
|
$
1,000,000
|
$
1,000,000
|
$
833,333
|
|
Excess of
loss coverage and facultative facility above quota share coverage
(1)
|
$
9,000,000
|
$
9,000,000
|
$
3,666,667
|
|
|
in excess
of
|
in excess
of
|
in excess
of
|
|
|
$
1,000,000
|
$
1,000,000
|
$
833,333
|
|
Total
reinsurance coverage per occurrence
|
$
9,100,000
|
$
9,200,000
|
$
4,000,000
|
|
Losses per
occurrence subject to reinsurance coverage
|
$
10,000,000
|
$
10,000,000
|
$
4,500,000
|
|
Expiration
date
|
June 30, 2019 |
June 30,
2019
|
June 30,
2017
|
|
|
|
|
|
|
Personal
Umbrella
|
|
|
|
|
Quota share
treaty:
|
|
|
|
|
Percent ceded
- first $1,000,000 of coverage
|
90
%
|
90
%
|
90
%
|
|
Percent ceded
- excess of $1,000,000 dollars of coverage
|
100
%
|
100
%
|
100
%
|
|
Risk
retained
|
$
100,000
|
$
100,000
|
$
100,000
|
|
Total
reinsurance coverage per occurrence
|
$
4,900,000
|
$
4,900,000
|
$
4,900,000
|
|
Losses per
occurrence subject to quota share reinsurance coverage
|
$
5,000,000
|
$
5,000,000
|
$
5,000,000
|
|
Expiration
date
|
June 30, 2019 |
June 30,
2018
|
June 30,
2017
|
|
|
|
|
|
|
Commercial Lines
:
|
|
|
|
|
General
liability commercial policies
|
|
|
|
|
Quota share
treaty
|
None
|
None
|
None
|
|
Risk
retained
|
$
750,000
|
$
750,000
|
$
500,000
|
|
Excess of
loss coverage above risk retained
|
$
3,750,000
|
$
3,750,000
|
$
4,000,000
|
|
|
in excess of |
in excess
of
|
in excess
of
|
|
|
$
750,000
|
$
750,000
|
$
500,000
|
|
Total
reinsurance coverage per occurrence
|
$
3,750,000
|
$
3,750,000
|
$
4,000,000
|
|
Losses per
occurrence subject to reinsurance coverage
|
$
4,500,000
|
$
4,500,000
|
$
4,500,000
|
|
|
|
|
|
|
Commercial
Umbrella
|
|
|
|
|
Quota share
treaty:
|
|
|
|
|
Percent ceded
- first $1,000,000 of coverage
|
90
%
|
90
%
|
90
%
|
|
Percent ceded
- excess of $1,000,000 of coverage
|
100
%
|
100
%
|
100
%
|
|
Risk
retained
|
$
100,000
|
$
100,000
|
$
100,000
|
|
Total
reinsurance coverage per occurrence
|
$
4,900,000
|
$
4,900,000
|
$
4,900,000
|
|
Losses per
occurrence subject to quota share reinsurance coverage
|
$
5,000,000
|
$
5,000,000
|
$
5,000,000
|
|
Expiration
date
|
June 30,
2019
|
June
30, 2018
|
June
30, 2017
|
|
|
-
|
-
|
-
|
|
Catastrophe Reinsurance
:
|
|
|
|
|
Initial
loss subject to personal lines quota share treaty
|
$
5,000,000
|
$
5,000,000
|
$
5,000,000
|
|
Risk retained
per catastrophe occurrence (2)
|
$
4,500,000
|
$
4,000,000
|
$
3,000,000
|
|
Catastrophe
loss coverage in excess of quota share coverage (3)
(4)
|
$
445,000,000
|
$
315,000,000
|
$
247,000,000
|
|
Reinstatement
premium protection (5)
|
Yes
|
Yes
|
Yes
|
(1)
For
personal lines, the 2017/2019 Treaty includes the addition of an
automatic facultative facility allowing KICO to obtain homeowners
single risk coverage up to $10,000,000 in total insured value,
which covers direct losses from $3,500,000 to
$10,000,000.
(2)
Plus
losses in excess of catastrophe coverage.
(3)
Catastrophe
coverage is limited on an annual basis to two times the per
occurrence amounts.
Effective July 1,
2016, the duration of a catastrophe occurrence from windstorm,
hail, tornado, hurricane and cyclone was extended to 168
consecutive hours from 120 consecutive hours.
(4)
Effective
July 1, 2018, the top $50,000,000 layer of catastrophe reinsurance
coverage has a two year term expiring on June 30,
2020.
(5)
Effective July 1,
2016, reinstatement premium protection for $20,000,000 of
catastrophe coverage in excess of $5,000,000.
Effective
July 1, 2017, reinstatement premium protection for $145,000,000 of
catastrophe coverage in excess of $5,000,000.
Effective July 1, 2018, reinstatement premium protection for
$210,000,000 of catastrophe coverage in excess of
$5,000,000.
F-30
KINGSTONE COMPANIES, INC. AND SUBSIDIARIES
NOTES TO CONSOLIDATED FINANCIAL STATEMENTS
YEARS ENDED DECEMBER 31, 2018 AND 2017
The single maximum risks per occurrence to which the Company is
subject under the treaties effective July 1, 2018 are as
follows:
|
|
|
July 1, 2018 - June 30, 2019
|
||
|
Treaty
|
|
Extent of Loss
|
|
Risk Retained
|
|
Personal
Lines (1)
|
|
Initial
$1,000,000
|
|
$900,000
|
|
|
|
$1,000,000
- $10,000,000
|
|
None(2)
|
|
|
|
Over
$10,000,000
|
|
100%
|
|
|
|
|
|
|
|
Personal
Umbrella
|
|
Initial
$1,000,000
|
|
$100,000
|
|
|
|
$1,000,000
- $5,000,000
|
|
None
|
|
|
|
Over
$5,000,000
|
|
100%
|
|
|
|
|
|
|
|
Commercial
Lines
|
|
Initial
$750,000
|
|
$750,000
|
|
|
|
$750,000
- $4,500,000
|
|
None(3)
|
|
|
|
Over
$4,500,000
|
|
100%
|
|
|
|
|
|
|
|
Commercial
Umbrella
|
|
Initial
$1,000,000
|
|
$100,000
|
|
|
|
$1,000,000
- $5,000,000
|
|
None
|
|
|
|
Over
$5,000,000
|
|
100%
|
|
|
|
|
|
|
|
Catastrophe
(4)
|
|
Initial
$5,000,000
|
|
$4,500,000
|
|
|
|
$5,000,000
- $450,000,000
|
|
None
|
|
|
|
Over
$450,000,000
|
|
100%
|
(1)
Treaty
for July 1, 2018 – June 30, 2019 is a two year treaty with
expiration date of June 30, 2019.
(2)
Covered
by excess of loss treaties up to $3,500,000 and by facultative
facility from $3,500,000 to $10,000,000.
(3)
Covered by excess
of loss treaties.
(4)
Catastrophe
coverage is limited on an annual basis to two times the per
occurrence amounts.
F-31
KINGSTONE COMPANIES, INC. AND SUBSIDIARIES
NOTES TO CONSOLIDATED FINANCIAL STATEMENTS
YEARS ENDED DECEMBER 31, 2018 AND 2017
The single maximum risks per occurrence to which the Company is
subject under the treaty years shown below are as
follows:
|
|
|
July 1, 2017 - June 30, 2018
|
|
July 1, 2016 - June 30, 2017
|
|||||
|
Treaty
|
|
Range of Loss
|
|
Risk Retained
|
|
Range of Loss
|
|
Risk Retained
|
|
|
Personal
Lines
|
|
Initial
$1,000,000
|
|
$800,000
|
|
Initial
$833,333
|
|
$500,000
|
|
|
|
|
$1,000,000
- $10,000,000
|
|
None(2)
|
|
$833,333
- $4,500,000
|
|
None(3)
|
|
|
|
|
Over
$10,000,000
|
|
100%
|
|
Over
$4,500,000
|
|
100%
|
|
|
|
|
|
|
|
|
|
|
|
|
|
Personal
Umbrella
|
|
Initial
$1,000,000
|
|
$100,000
|
|
Initial
$1,000,000
|
|
$100,000
|
|
|
|
|
$1,000,000
- $5,000,000
|
|
None
|
|
$1,000,000
- $5,000,000
|
|
None
|
|
|
|
|
Over
$5,000,000
|
|
100%
|
|
Over
$5,000,000
|
|
100%
|
|
|
|
|
|
|
|
|
|
|
|
|
|
Commercial
Lines
|
|
Initial
$750,000
|
|
$750,000
|
|
Initial
$500,000
|
|
$500,000
|
|
|
|
|
$750,000
- $4,500,000
|
|
None(3)
|
|
$500,000
- $4,500,000
|
|
None(3)
|
|
|
|
|
Over
$4,500,000
|
|
100%
|
|
Over
$4,500,000
|
|
100%
|
|
|
|
|
|
|
|
|
|
|
|
|
|
Commercial
Umbrella
|
|
Initial
$1,000,000
|
|
$100,000
|
|
Initial
$1,000,000
|
|
$100,000
|
|
|
|
|
$1,000,000
- $5,000,000
|
|
None
|
|
$1,000,000
- $5,000,000
|
|
None
|
|
|
|
|
Over
$5,000,000
|
|
100%
|
|
Over
$5,000,000
|
|
100%
|
|
|
|
|
|
|
|
|
|
|
|
|
|
Catastrophe
(4)
|
|
Initial
$5,000,000
|
|
$4,000,000
|
|
Initial
$5,000,000
|
|
$3,000,000
|
|
|
|
|
$5,000,000
- $320,000,000
|
|
None
|
|
$5,000,000
- $252,000,000
|
|
None
|
|
|
|
|
Over
$320,000,000
|
|
100%
|
|
Over
$252,000,000
|
|
100%
|
|
(1)
Treaty
for July 1, 2017 – June 30, 2018 is a two year treaty with
expiration date of June 30, 2019.
(2)
Covered
by excess of loss treaties up to $3,500,000 and by facultative
facility from $3,500,000 to $10,000,000.
(3)
Covered by excess
of loss treaties.
(4)
Catastrophe
coverage is limited on an annual basis to two times the per
occurrence amounts.
The Company’s reinsurance program is structured to enable the
Company to significantly grow its premium volume while maintaining
regulatory capital and other financial ratios generally within or
below the expected ranges used for regulatory oversight purposes.
The reinsurance program also provides income as a result of ceding
commissions earned pursuant to the quota share reinsurance
contracts. The Company’s participation in reinsurance
arrangements does not relieve the Company of its obligations to
policyholders.
F-32
KINGSTONE COMPANIES, INC. AND SUBSIDIARIES
NOTES TO CONSOLIDATED FINANCIAL STATEMENTS
YEARS ENDED DECEMBER 31, 2018 AND 2017
Approximate reinsurance recoverables on unpaid and paid losses by
reinsurer at December 31, 2018 and 2017 are as
follows:
|
|
Unpaid
|
Paid
|
|
|
|
|
($ in
thousands)
|
Losses
|
Losses
|
Total
|
Security
|
|
|
December
31, 2018
|
|
|
|
|
|
|
Cavello Bay
Reinsurance Limited (1)
|
$
5,319
|
$
1,277
|
$
6,596
|
$
7,548
|
(2
)
|
|
Swiss
Reinsurance America Corporation
|
4,499
|
1,251
|
5,750
|
-
|
|
|
Hanover
Rueck SE
|
2,728
|
1,181
|
3,909
|
-
|
|
|
SCOR
Reinsurance Company
|
528
|
89
|
617
|
-
|
|
|
Allied
World Assurance Company
|
306
|
373
|
679
|
-
|
|
|
Others
|
2,291
|
282
|
2,573
|
58
|
(3
)
|
|
Total
|
$
15,671
|
$
4,453
|
$
20,124
|
$
7,606
|
|
|
|
|
|
|
|
|
|
December
31, 2017
|
|
|
|
|
|
|
Maiden
Reinsurace Company (1)
|
$
8,160
|
$
968
|
$
9,128
|
$
10,583
|
(2
)
|
|
Swiss
Reinsurance America Corporation
|
4,299
|
600
|
4,899
|
-
|
|
|
Hanover
Rueck SE
|
857
|
420
|
1,277
|
-
|
|
|
SCOR
Reinsurance Company
|
851
|
209
|
1,060
|
-
|
|
|
Allied
World Assurance Company
|
1,649
|
188
|
1,837
|
-
|
|
|
Others
|
932
|
148
|
1,080
|
205
|
(4
)
|
|
Total
|
$
16,748
|
$
2,533
|
$
19,281
|
$
10,788
|
|
(1)
On
December 27, 2018, Enstar Group Limited announced that one of its
wholly owned subsidiaries, Cavello Bay Reinsurance Limited acquired
Maiden Reinsurance North America, Inc.
(2) Secured pursuant to collateralized trust
agreements.
(2) Represents $53,000 secured pursuant to collateralized trust
agreement and $5,000 guaranteed by an irrevocable letter of
credit.
(3) Represents $202,000 secured pursuant to collateralized trust
agreement and $3,000 guaranteed by an irrevocable letter of
credit.
Assets held in the trusts referred to in footnotes (2), (3), and
(4) in the table above are not included in the Company’s
invested assets and investment income earned on these assets is
credited to the reinsurers respectively. In addition to reinsurance
recoverables on unpaid and paid losses, reinsurance receivables in
the accompanying consolidated balance sheets as of December 31,
2018 and 2017 include unearned ceded premiums of approximately
$6,243,000 and $9,237,000, respectively.
Ceding Commission Revenue
The Company earns ceding commission revenue under its quota share
reinsurance agreements based on: (i) a fixed provisional commission
rate at which provisional ceding commissions are earned, and (ii) a
sliding scale of commission rates and ultimate treaty year loss
ratios on the policies reinsured under each of these agreements
based upon which contingent ceding commissions are earned. The
sliding scale includes minimum and maximum commission rates in
relation to specified ultimate loss ratios. The commission rate and
contingent ceding commissions earned increases when the estimated
ultimate loss ratio decreases and, conversely, the commission rate
and contingent ceding commissions earned decreases when the
estimated ultimate loss ratio increases.
The Company’s estimated ultimate treaty year loss ratios (the
“Loss Ratio(s)”) for treaties in effect for the year
ended December 31, 2018 are attributable to contracts for the
2017/2019 Treaty. The Company’s estimated ultimate treaty
year Loss Ratios for treaties in effect for the year ended December
31, 2017 are attributable to contracts for the 2017/2019 Treaty and
2016/2017 Treaty.
F-33
KINGSTONE COMPANIES, INC. AND SUBSIDIARIES
NOTES TO CONSOLIDATED FINANCIAL STATEMENTS
YEARS ENDED DECEMBER 31, 2018 AND 2017
Treaties in effect for the year ended December 31,
2018
Under
the 2017/2019 Treaty, the Company receives an upfront fixed
provisional rate that is subject to a sliding scale contingent
adjustment based upon the Loss Ratio. Under this arrangement, the
Company earns and earned provisional ceding commissions that are
subject to later adjustment dependent on changes to the estimated
Loss Ratio for the 2017/2019 Treaty. The Company’s Loss
Ratios for the period July 1, 2018 through December 31, 2018
attributable to the 2017/2019 Treaty were consistent with the
contractual Loss Ratio at which provisional ceding commissions were
earned, and therefore no contingent commission adjustment was
recorded for the six-month period ended December 31, 2018. The
Company’s Loss Ratios for the period July 1, 2017 through
June 30, 2018 attributable to the 2017/2019 Treaty were higher than
the contractual Loss Ratio at which provisional ceding commissions
were earned. Accordingly, for the six months ended June 30, 2018,
the Company incurred negative contingent ceding commissions as a
result of the estimated Loss Ratio for the 2017/2019 Treaty, which
reduced contingent ceding commissions earned.
Treaties in effect for the year ended December 31,
2017
Under
the 2017/2019 Treaty and the 2016/2017 Treaty, the Company
received, an upfront fixed provisional rate that was subject to a
sliding scale contingent adjustment based upon the Loss Ratio.
Under this arrangement, the Company earned provisional ceding
commissions that were subject to later adjustment dependent on
changes to the estimated Loss Ratio for the 2017/2019 Treaty and
2016/2017 Treaty. The Company’s Loss Ratios for the period
July 1, 2017 through December 31, 2017 attributable to the
2017/2019 Treaty, and from July 1, 2016 through December 31, 2017
attributable to the 2016/2017 Treaty, were consistent with the
contractual Loss Ratio at which the provisional ceding commissions
were earned and therefore no additional contingent commission was
recorded for the year ended December 31, 2017 with respect to these
treaties.
In addition to the treaties that were in effect for the years ended
December 31, 2018 and 2017, the Loss Ratios from prior years’
treaties are subject to change as loss reserves from those periods
increase or decrease, resulting in an increase or decrease in the
commission rate and contingent ceding commissions
earned.
Ceding commission revenues earned consists of the
following:
|
|
Years
ended
|
|
|
|
December
31,
|
|
|
|
2018
|
2017
|
|
|
|
|
|
Provisional
ceding commissions earned
|
$
6,745,928
|
$
10,677,214
|
|
Contingent
ceding commissions earned
|
(1,413,298
)
|
(744,081
)
|
|
|
$
5,332,630
|
$
9,933,133
|
Provisional ceding commissions are settled monthly. Balances due
from reinsurers for contingent ceding commissions on quota share
treaties are settled annually based on the Loss Ratio of each
treaty year that ends on June 30.
As discussed above,
the Loss Ratios from prior
years’ treaties are subject to change as incurred losses from
those periods develop, resulting in an increase or decrease in the
commission rate and contingent ceding commissions earned. As of
December 31, 2018 and 2017, net contingent ceding commissions
payable to reinsurers under all treaties was approximately
$1,581,000 and $1,850,000, respectively, which are recorded in
reinsurance balances payable on the accompanying consolidated
balance sheets.
F-34
KINGSTONE COMPANIES, INC. AND SUBSIDIARIES
NOTES TO CONSOLIDATED FINANCIAL STATEMENTS
YEARS ENDED DECEMBER 31, 2018 AND 2017
Note 8 -
Deferred Policy Acquisition
Costs and Deferred Ceding Commission Revenue
Deferred policy acquisition costs incurred and policy-related
ceding commission revenue are deferred and amortized to income on
property and casualty insurance business as follows:
|
|
Years
ended
|
|
|
|
December
31,
|
|
|
|
|
|
|
Net deferred
policy acquisition costs, net of ceding
|
|
|
|
commission
revenue, beginning of year
|
$
10,580,824
|
$
5,387,940
|
|
|
|
|
|
Cost incurred
and deferred:
|
|
|
|
Commissions
and brokerage
|
27,687,907
|
23,093,880
|
|
Other
underwriting and policy acquisition costs
|
8,227,992
|
6,669,904
|
|
Ceding
commission revenue
|
(5,166,193
)
|
(8,091,785
)
|
|
Net deferred
policy acquisition costs
|
30,749,706
|
21,671,999
|
|
Return of
deferred ceding commission revenue
|
|
|
|
due to
reduction of quota share
|
(2,413,273
)
|
(3,648,859
)
|
|
Amortization
|
(23,696,197
)
|
(12,830,256
)
|
|
|
4,640,236
|
5,192,884
|
|
|
|
|
|
Net deferred
policy acquisition costs, net of ceding
|
|
|
|
commission
revenue, end of year
|
$
15,221,060
|
$
10,580,824
|
Ending balances for deferred policy acquisition costs and deferred
ceding commission revenue as of December 31, 2018 and 2017
follows:
|
|
December
31,
|
|
|
|
2018
|
2017
|
|
|
|
|
|
Deferred
policy acquisition costs
|
$
17,907,737
|
$
14,847,236
|
|
Deferred
ceding commission revenue
|
(2,686,677
)
|
(4,266,412
)
|
|
Balance at
end of period
|
$
15,221,060
|
$
10,580,824
|
Note 9 – Debt
Federal Home Loan Bank
In July
2017, KICO became a member of, and invested in, the Federal Home
Loan Bank of New York (“FHLBNY”). The aggregate
investment in dividend bearing common stock was $18,400 as of
December 31, 2018. FHLBNY members have access to a variety of
flexible, low cost funding through FHLBNY’s credit products,
enabling members to customize advances, which are to be fully
collateralized. Eligible collateral to pledge to FHLBNY includes
residential and commercial mortgage backed securities, along with
U.S. Treasury and agency securities. See Note 3 – Investments
for eligible collateral held in a designated custodian account
available for future advances. Advances are limited to 5% of
KICO’s net admitted assets as of December 31 of the previous
year and are due and payable within one year of borrowing. The
maximum allowable advance as of December 31, 2018 was approximately
$9,849,000 based on KICO’s net admitted assets as of December
31, 2018. Advances are limited to the amount of available
collateral, which was approximately $5,116,000 as of December 31,
2018. There were no borrowings under this facility during the year
ended December 31, 2018.
F-35
KINGSTONE COMPANIES, INC. AND SUBSIDIARIES
NOTES TO CONSOLIDATED FINANCIAL STATEMENTS
YEARS ENDED DECEMBER 31, 2018 AND 2017
Long-term Debt
On December 19, 2017, the Company issued $30 million of its 5.50%
Senior Unsecured Notes due December 30, 2022 (the
“Notes”) in an underwritten public offering. Interest
is payable semi-annually in arrears on June 30 and December 30 of
each year, which began on June 30, 2018 at the rate of 5.50%. The
net proceeds of the issuance were $29,121,630, net of discount of
$163,200 and transaction costs of $715,170, for an effective yield
of 5.67%. The balance of long-term debt as of December 31, 2018 and
2017 is as follows:
|
|
December 31,
|
December 31,
|
|
|
2018
|
2017
|
|
|
|
|
|
5.50%
Senior Unsecured Notes
|
$
30,000,000
|
$
30,000,000
|
|
Discount
|
(129,796
)
|
(162,209
)
|
|
Issuance
costs
|
(574,953
)
|
(710,826
)
|
|
Long-term
debt, net
|
$
29,295,251
|
$
29,126,965
|
The Notes are unsecured obligations of the Company and are not the
obligations of or guaranteed by any of the Company's subsidiaries.
The Notes rank senior in right of payment to any of the Company's
existing and future indebtedness that is by its terms expressly
subordinated or junior in right of payment to the Notes. The Notes
rank equally in right of payment to all of the Company's existing
and future senior indebtedness, but will be effectively
subordinated to any secured indebtedness to the extent of the
value of the collateral securing such secured indebtedness. In
addition, the Notes will be structurally subordinated to the
indebtedness and other obligations of the Company's subsidiaries.
The Company may redeem the Notes, at any time in whole or from time
to time in part, at the redemption price equal to the greater of:
(i) 100% of the principal amount of the Notes to be redeemed; and
(ii) the sum of the present values of the remaining scheduled
payments of principal and interest on the Notes to be redeemed that
would be due if the Notes matured on the applicable redemption date
(exclusive of interest accrued to the applicable redemption date)
discounted to the redemption date on a semi-annual basis at the
Treasury Rate, plus 50 basis points.
On
December 20, 2017, the Company used $25,000,000 of the net proceeds
from the offering to contribute capital to KICO, to support
additional growth. The remainder of the net proceeds are being used
for general corporate purposes. A registration statement relating
to the debt issued in the offering was filed with the SEC which
became effective on November 28, 2017.
F-36
KINGSTONE COMPANIES, INC. AND SUBSIDIARIES
NOTES TO CONSOLIDATED FINANCIAL STATEMENTS
YEARS ENDED DECEMBER 31, 2018 AND 2017
Note 10 - Property and Equipment
The components of property and equipment are summarized as
follows:
|
|
|
Accumulated
|
|
|
|
Cost
|
Depreciation
|
Net
|
|
|
|
|
|
|
December 31, 2018
|
|
|
|
|
Building
|
$
2,231,967
|
$
(554,077
)
|
$
1,677,890
|
|
Land
|
622,937
|
-
|
622,937
|
|
Furniture
office equipment
|
723,217
|
(586,010
)
|
137,207
|
|
Computer
equipment and software
|
7,240,613
|
(3,621,718
)
|
3,618,895
|
|
Total
|
$
10,818,734
|
$
(4,761,805
)
|
$
6,056,929
|
|
|
|
|
|
|
December 31, 2017
|
|
|
|
|
Building
|
$
2,146,950
|
$
(460,819
)
|
$
1,686,131
|
|
Land
|
575,698
|
-
|
575,698
|
|
Furniture
office equipment
|
707,524
|
(493,558
)
|
213,966
|
|
Computer
equipment and software
|
4,657,174
|
(2,360,392
)
|
2,296,782
|
|
Total
|
$
8,087,346
|
$
(3,314,769
)
|
$
4,772,577
|
Depreciation expense for the years ended December 31, 2018 and 2017
was $1,447,150 and $1,062,928, respectively.
Note 11 -
Property and Casualty
Insurance Activity
Premiums written, ceded and earned are as follows:
|
|
Direct
|
Assumed
|
Ceded
|
Net
|
|
|
|
|
|
|
|
Year
ended December 31, 2018
|
|
|
|
|
|
Premiums
written
|
$
146,716,468
|
$
1,004
|
$
(26,923,679
)
|
$
119,793,793
|
|
Change in
unearned premiums
|
(13,388,535
)
|
4,067
|
(2,994,610
)
|
(16,379,078
)
|
|
Premiums
earned
|
$
133,327,933
|
$
5,071
|
$
(29,918,289
)
|
$
103,414,715
|
|
|
|
|
|
|
|
Year
ended December 31, 2017
|
|
|
|
|
|
Premiums
written
|
$
121,575,178
|
$
22,847
|
$
(28,729,149
)
|
$
92,868,876
|
|
Change in
unearned premiums
|
(10,662,744
)
|
9,456
|
(4,864,565
)
|
(15,517,853
)
|
|
Premiums
earned
|
$
110,912,434
|
$
32,303
|
$
(33,593,714
)
|
$
77,351,023
|
Premium
receipts in advance of the policy effective date are recorded as
advance premiums. The balance of advance premiums as of December
31, 2018 and 2017 was $2,107,629 and $1,477,693,
respectively.
F-37
KINGSTONE COMPANIES, INC. AND SUBSIDIARIES
NOTES TO CONSOLIDATED FINANCIAL STATEMENTS
YEARS ENDED DECEMBER 31, 2018 AND 2017
The components of the liability for loss and LAE expenses and
related reinsurance receivables as of December 31, 2018 and 2017
are as follows:
|
|
Gross
|
Reinsurance
|
|
|
Liability
|
Receivables
|
|
December
31, 2018
|
|
|
|
Case-basis
reserves
|
$
35,812,037
|
$
12,283,616
|
|
Loss
adjustment expenses
|
9,102,862
|
1,433,170
|
|
IBNR
reserves
|
11,282,207
|
1,954,461
|
|
Recoverable
on unpaid losses
|
|
15,671,247
|
|
Recoverable
on paid losses
|
-
|
4,453,298
|
|
Total loss
and loss adjustment expenses
|
$
56,197,106
|
20,124,545
|
|
Unearned
premiums
|
|
6,242,570
|
|
Total
reinsurance receivables
|
|
$
26,367,115
|
|
|
|
|
|
December
31, 2017
|
|
|
|
Case-basis
reserves
|
$
30,499,592
|
$
11,987,693
|
|
Loss
adjustment expenses
|
8,635,199
|
1,990,506
|
|
IBNR
reserves
|
9,664,831
|
2,770,709
|
|
Recoverable
on unpaid losses
|
|
16,748,908
|
|
Recoverable
on paid losses
|
-
|
2,533,042
|
|
Total loss
and loss adjustment expenses
|
$
48,799,622
|
19,281,950
|
|
Unearned
premiums
|
|
9,237,180
|
|
Total
reinsurance receivables
|
|
$
28,519,130
|
The following table provides a reconciliation of the beginning and
ending balances for unpaid losses and
LAE:
|
|
Years
ended
|
|
|
|
December
31,
|
|
|
|
2018
|
2017
|
|
|
|
|
|
Balance at
beginning of period
|
$
48,799,622
|
$
41,736,719
|
|
Less
reinsurance recoverables
|
(16,748,908
)
|
(15,776,880
)
|
|
Net balance,
beginning of period
|
32,050,714
|
25,959,839
|
|
|
|
|
|
Incurred
related to:
|
|
|
|
Current
year
|
57,143,077
|
34,246,081
|
|
Prior
years
|
1,152,128
|
(60,544
)
|
|
Total
incurred
|
58,295,205
|
34,185,537
|
|
|
|
|
|
Paid related
to:
|
|
|
|
Current
year
|
34,025,387
|
18,194,860
|
|
Prior
years
|
15,794,673
|
9,899,802
|
|
Total
paid
|
49,820,060
|
28,094,662
|
|
|
|
|
|
Net balance
at end of period
|
40,525,859
|
32,050,714
|
|
Add
reinsurance recoverables
|
15,671,247
|
16,748,908
|
|
Balance at
end of period
|
$
56,197,106
|
$
48,799,622
|
F-38
KINGSTONE COMPANIES, INC. AND SUBSIDIARIES
NOTES TO CONSOLIDATED FINANCIAL STATEMENTS
YEARS ENDED DECEMBER 31, 2018 AND 2017
Incurred losses and LAE are net of reinsurance recoveries under
reinsurance contracts of $14,482,712 and $14,067,027 for the years
ended December 31, 2018 and 2017, respectively.
Prior
year incurred loss and LAE development results from changes in
ultimate loss and LAE estimates by line of business and accident
year. Prior year loss and LAE development incurred during the years
ended December 31, 2018 and 2017 was unfavorable $1,152,128 and
favorable $(60,544) respectively. The Company’s management
continually monitors claims activity to assess the appropriateness
of carried case and incurred but not reported (“IBNR”)
reserves, giving
consideration to
Company and industry trends.
Loss and LAE reserves
The reserving process for loss and LAE reserves provides for the
Company’s best estimate at a particular point in time of the
ultimate unpaid cost of all losses and LAE incurred, including
settlement and administration of losses, and is based on facts and
circumstances then known including losses that have occurred but
that have not yet been reported. The process relies on standard
actuarial reserving methodologies, judgments relative to estimates
of ultimate claims severity and frequency, the length of time
before losses will develop to their ultimate level
(‘tail’ factors), and the likelihood of changes in the
law or other external factors that are beyond the Company’s
control. Several actuarial reserving methodologies are used to
estimate required loss reserves. The process produces carried
reserves set by management based upon the actuaries’ best
estimate and is the cumulative combination of the best estimates
made by line of business, accident year, and loss and LAE. The
amount of loss and LAE reserves for individual reported claims (the
“case reserve”) is determined by the claims department
and changes over time as new information is gathered. Such
information includes a review of coverage applicability,
comparative liability on the part of the insured, injury severity,
property damage, replacement cost estimates, and any other
information considered pertinent to estimating the exposure
presented by the claim. The amounts of loss and LAE reserves for
unreported claims and development on known claims (IBNR reserves)
are determined using historical information aggregated by line of
insurance as adjusted to current conditions. Since this process
produces loss reserves set by management based upon the
actuaries’ best estimate, there is no explicit or implicit
provision for uncertainty in the carried loss
reserves.
Due to the inherent uncertainty associated with the reserving
process, the ultimate liability may differ, perhaps substantially,
from the original estimate. Such estimates are regularly reviewed
and updated and any resulting adjustments are included in the
current period’s results. Reserves are closely monitored and
are recomputed periodically using the most recent information on
reported claims and a variety of statistical techniques. On at
least a quarterly basis, the Company reviews by line of business
existing reserves, new claims, changes to existing case reserves
and paid losses with respect to the current and prior periods.
Several methods are used, varying by line of business and accident
year, in order to select the estimated period-end loss reserves.
These methods include the following:
Paid Loss Development
– historical patterns of paid
loss development are used to project future paid loss emergence in
order to estimate required reserves.
Incurred Loss
Development
– historical
patterns of incurred loss development, reflecting both paid losses
and changes in case reserves, are used to project future incurred
loss emergence in order to estimate required
reserves.
F-39
KINGSTONE COMPANIES, INC. AND SUBSIDIARIES
NOTES TO CONSOLIDATED FINANCIAL STATEMENTS
YEARS ENDED DECEMBER 31, 2018 AND 2017
Paid Bornhuetter-Ferguson
(“BF”)
– an
estimated loss ratio for a particular accident year is determined,
and is weighted against the portion of the accident year claims
that have been paid, based on historical paid loss development
patterns. The estimate of required reserves assumes that the
remaining unpaid portion of a particular accident year will pay out
at a rate consistent with the estimated loss ratio for that year.
This method can be useful for situations where an unusually high or
low amount of paid losses exists at the early stages of the claims
development process.
Incurred Bornhuetter-Ferguson
(“BF”)
- an
estimated loss ratio for a particular accident year is determined,
and is weighted against the portion of the accident year claims
that have been reported, based on historical incurred loss
development patterns. The estimate of required reserves assumes
that the remaining unreported portion of a particular accident year
will pay out at a rate consistent with the estimated loss ratio for
that year. This method can be useful for situations where an
unusually high or low amount of reported losses exists at the early
stages of the claims development process.
Incremental Claim-Based
Methods
– historical
patterns of incremental incurred losses and paid LAE during various
stages of development are reviewed and assumptions are made
regarding average loss and LAE development applied to remaining
claims inventory. Such methods more properly reflect changes in the
speed of claims closure and the relative adequacy of case reserve
levels at various stages of development. These methods also provide
a more accurate estimate of IBNR for lines of business with
relatively few remaining open claims but for which significant
recent settlement activity has occurred.
Management’s best estimate of required reserves is generally
based on an average of the methods above, with appropriate
weighting of the various methods based on the line of business and
accident year being projected. In some cases, additional methods or
historical data from industry sources are employed to supplement
the projections derived from the methods listed above.
Two key assumptions that materially affect the estimate of loss
reserves are the loss ratio estimate for the current accident year
used in the BF methods described above, and the loss development
factor selections used in the loss development methods described
above. The loss ratio estimates used in the BF methods are selected
after reviewing historical accident year loss ratios adjusted for
rate changes, trend, and mix of business.
The Company is not aware of any claim trends that have emerged or
that would cause future adverse development that have not already
been considered in existing case reserves and in its current loss
development factors.
In New York State, lawsuits for negligence are subject to certain
limitations and must be commenced within three years from the date
of the accident or are otherwise barred. Accordingly, the
Company’s exposure to unreported claims (“pure”
IBNR) for accident dates of December 31, 2015 and prior is limited,
although there remains the possibility of adverse development on
reported claims (“case development” IBNR). In certain
rare circumstances states have retroactively revised a statute of
limitations. The Company is not aware of any such effort that would
have a material impact on the Company’s results.
F-40
KINGSTONE COMPANIES, INC. AND SUBSIDIARIES
NOTES TO CONSOLIDATED FINANCIAL STATEMENTS
YEARS ENDED DECEMBER 31, 2018 AND 2017
The
following is information about incurred and paid claims development
as of December 31, 2018, net of reinsurance, as well as the
cumulative reported claims by accident year and total IBNR reserves
as of December 31, 2018 included in the net incurred loss and
allocated expense amounts. The historical information regarding
incurred and paid claims development for the years ended December
31, 2009 to December 31, 2015 is presented as supplementary
unaudited information.
Reported claim counts are measured on an occurrence or per event
basis. A single claim occurrence could result in more than
one loss type or claimant; however, the Company counts claims at
the occurrence level as a single claim regardless of the number of
claimants or claim features involved.
|
All Lines of Business
|
|
|
|
|
|
|
|
|
|
|
|
|
||
|
(in thousands, except reported claims data)
|
|
|
|
|
|
|
|
|
|
|
||||
|
|
|
|
|
|
|
|
|
|
|
|
|
As
of
|
|
|
|
|
Incurred Loss
and Allocated Loss Adjustment Expenses, Net of
Reinsurance
|
|
December 31,
2018
|
|
||||||||||
|
|
For the Years
Ended December 31,
|
|
|
IBNR
|
Cumulative
Number of Reported Claims by Accident Year
|
|
||||||||
|
Accident
Year
|
2009
|
2010
|
2011
|
2012
|
2013
|
2014
|
2015
|
2016
|
2017
|
2018
|
|
|
||
|
|
(Unaudited 2009
- 2017)
|
|
|
|
|
|
||||||||
|
|
|
|
|
|
|
|
|
|
|
|
|
|
|
|
|
2009
|
$4,403
|
$4,254
|
$4,287
|
$4,384
|
$4,511
|
$4,609
|
$4,616
|
$4,667
|
$4,690
|
$
4,672
|
|
$
-
|
1,136
|
|
|
2010
|
|
5,598
|
5,707
|
6,429
|
6,623
|
6,912
|
6,853
|
6,838
|
6,840
|
6,787
|
|
-
|
1,617
|
|
|
2011
|
|
|
7,603
|
7,678
|
8,618
|
9,440
|
9,198
|
9,066
|
9,144
|
9,171
|
|
(3)
|
1,914
|
|
|
2012
|
|
|
|
9,539
|
9,344
|
10,278
|
10,382
|
10,582
|
10,790
|
10,791
|
|
(4)
|
4,702
|
(1)
|
|
2013
|
|
|
|
|
10,728
|
9,745
|
9,424
|
9,621
|
10,061
|
10,089
|
|
38
|
1,560
|
|
|
2014
|
|
|
|
|
|
14,193
|
14,260
|
14,218
|
14,564
|
15,023
|
|
238
|
2,131
|
|
|
2015
|
|
|
|
|
|
|
22,340
|
21,994
|
22,148
|
22,491
|
|
537
|
2,552
|
|
|
2016
|
|
|
|
|
|
|
|
26,062
|
24,941
|
24,789
|
|
1,096
|
2,862
|
|
|
2017
|
|
|
|
|
|
|
|
|
31,605
|
32,169
|
|
2,697
|
3,335
|
|
|
2018
|
|
|
|
|
|
|
|
|
|
54,455
|
|
9,079
|
3,935
|
|
|
|
|
|
|
|
|
|
|
|
Total
|
$
190,437
|
|
|
|
|
|
(1)
Reported claims for accident year 2012 includes 3,406 claims from
Superstorm Sandy.
|
|
|
|
|
|
|||||||||
|
All Lines of Business
|
|
|
|
|
|
|
|
|
||
|
(in thousands)
|
|
|
|
|
|
|
|
|
|
|
|
|
Cumulative Paid
Loss and Allocated Loss Adjustment Expenses, Net of
Reinsurance
|
|||||||||
|
|
For the Years
Ended December 31,
|
|
||||||||
|
Accident
Year
|
2009
|
2010
|
2011
|
2012
|
2013
|
2014
|
2015
|
2016
|
2017
|
2018
|
|
|
(Unaudited 2009
- 2017)
|
|
||||||||
|
|
|
|
|
|
|
|
|
|
|
|
|
2009
|
$2,298
|
$3,068
|
$3,607
|
$3,920
|
$4,134
|
$4,362
|
$4,424
|
$4,468
|
$4,487
|
$
4,659
|
|
2010
|
|
2,566
|
3,947
|
4,972
|
5,602
|
6,323
|
6,576
|
6,720
|
6,772
|
6,780
|
|
2011
|
|
|
3,740
|
5,117
|
6,228
|
7,170
|
8,139
|
8,540
|
8,702
|
8,727
|
|
2012
|
|
|
|
3,950
|
5,770
|
7,127
|
8,196
|
9,187
|
10,236
|
10,323
|
|
2013
|
|
|
|
|
3,405
|
5,303
|
6,633
|
7,591
|
8,407
|
9,056
|
|
2014
|
|
|
|
|
|
5,710
|
9,429
|
10,738
|
11,770
|
13,819
|
|
2015
|
|
|
|
|
|
|
12,295
|
16,181
|
18,266
|
19,984
|
|
2016
|
|
|
|
|
|
|
|
15,364
|
19,001
|
21,106
|
|
2017
|
|
|
|
|
|
|
|
|
16,704
|
24,820
|
|
2018
|
|
|
|
|
|
|
|
|
|
32,383
|
|
|
|
|
|
|
|
|
|
|
Total
|
$
151,657
|
|
|
|
|
|
|
|
|
|
|
|
|
|
Net
liability for unpaid loss and allocated loss adjustment expenses
for the accident years presented
|
$
38,780
|
|||||||||
|
All
outstanding liabilities before 2009, net of
reinsurance
|
93
|
|||||||||
|
Liabilities
for loss and allocted loss adjustment expenses, net of
reinsurance
|
$
38,873
|
|||||||||
F-41
KINGSTONE COMPANIES, INC. AND SUBSIDIARIES
NOTES TO CONSOLIDATED FINANCIAL STATEMENTS
YEARS ENDED DECEMBER 31, 2018 AND 2017
Reported
claim counts are measured on an occurrence or per event basis.
A single claim occurrence could result in more than one loss
type or claimant; however the Company counts claims at the
occurrence level as a single claim regardless of the number of
claimants or claim features involved.
The
reconciliation of the net incurred and paid claims development
tables to the liability for loss and LAE reserves in the
consolidated balance sheet is as follows:
|
|
As of
|
|
(in thousands)
|
December 31, 2018
|
|
Liabilities for
loss and loss adjustment expenses, net of reinsurance
|
$
38,873
|
|
Total
reinsurance recoverable on unpaid losses
|
15,671
|
|
Unallocated
loss adjustment expenses
|
1,653
|
|
Total
gross liability for loss and LAE reserves
|
$
56,197
|
The
following is supplementary unaudited information about average
historical claims duration as of December 31, 2018:
|
Average Annual Percentage Payout of Incurred Loss and Allocated
Loss Adjustment Expenses by Age, Net of Reinsurance
(unaudited)
|
||||||||||
|
Years
|
1
|
2
|
3
|
4
|
5
|
6
|
7
|
8
|
9
|
10
|
|
|
|
|
|
|
|
|
|
|
|
|
|
All
Lines of Business
|
46.4%
|
18.8%
|
11.4%
|
8.6%
|
9.5%
|
5.8%
|
1.5%
|
0.7%
|
0.3%
|
3.7%
|
The
percentages in the above table do not add up to 100% because the
percentages represent averages across all accident years at each
development stage.
Note 12 – Stockholders’ Equity
Public Offering of Common Stock
On
January 31, 2017, the Company closed on an underwritten public
offering of 2,500,000 shares of its Common Stock. On February 14,
2017, the Company closed on the underwriters’ purchase option
for an additional 192,500 shares of its Common Stock. The public
offering price for the 2,692,500 shares sold was $12.00 per share.
The aggregate net proceeds to the Company were approximately
$30,137,000, after deducting underwriting discounts and commissions
and other offering expenses in the aggregate amount of
approximately $2,173,000.
On
March 1, 2017, the Company used $23,000,000 of the net proceeds
from the offering to contribute capital to its insurance
subsidiary, KICO, to support its ratings upgrade plan and
additional growth. The remainder of the net proceeds will be used
for general corporate purposes. A shelf registration statement
relating to the shares sold in the offering was filed with the SEC
and became effective on January 19, 2017.
Dividends Declared
Dividends
declared and paid on Common Stock were $4,279,494 and $3,214,471
for the years ended December 31, 2018 and 2017, respectively.
The Company’s Board of Directors approved a quarterly
dividend on February 14, 2019 of $.10 per share payable in cash on
March 15, 2019 to stockholders of record as of February 28, 2019
(see Note 19 - Subsequent Events).
F-42
KINGSTONE COMPANIES, INC. AND SUBSIDIARIES
NOTES TO CONSOLIDATED FINANCIAL STATEMENTS
YEARS ENDED DECEMBER 31, 2018 AND 2017
Stock Options
Pursuant
to the Company’s 2005 Equity Participation Plan (the
“2005 Plan”), which provides for the issuance of
incentive stock options, non-statutory stock options and restricted
stock, a maximum of 700,000 shares of the Company’s Common
Stock are permitted to be issued pursuant to options granted and
restricted stock issued. Effective August 12, 2014, the Company
adopted the 2014 Equity Participation Plan (the “2014
Plan”) pursuant to which, a maximum of 700,000 shares of
Common Stock of the Company are authorized to be issued pursuant to
the grant of incentive stock options, non-statutory stock options,
stock appreciation rights, restricted stock and stock bonuses.
Incentive stock options granted under the 2014 Plan and 2005 Plan
expire no later than ten years from the date of grant (except no
later than five years for a grant to a 10% stockholder). The Board
of Directors or the Compensation Committee determines the
expiration date with respect to non-statutory stock options and the
vesting provisions for restricted stock granted under the 2014 Plan
and 2005 Plan.
The
results of operations for the years ended December 31, 2018 and
2017 include stock-based compensation expense totaling
approximately $6,000 and $38,000, respectively. Stock-based
compensation expense related to stock options is net of estimated
forfeitures of approximately 17% for the years ended December 31,
2018 and 2017. Such amounts have been included in the consolidated
statements of income and comprehensive income (loss) within other
operating expenses.
Stock-based
compensation expense in 2018 and 2017 is the estimated fair value
of options granted amortized on a straight-line basis over the
requisite service period for the entire portion of the award less
an estimate for anticipated forfeitures. The Company uses the
“simplified” method to estimate the expected term of
the options because the Company’s historical share option
exercise experience does not provide a reasonable basis upon which
to estimate expected term. No options were granted during the years
ended December 31, 2018 and 2017.
The
Black-Scholes Option Valuation Model was developed for use in
estimating the fair value of traded options, which have no vesting
restrictions and are fully transferable. In addition, option
valuation models require the input of highly subjective assumptions
including the expected stock price volatility. Because our stock
options have characteristics significantly different from those of
traded options, and because changes in the subjective input
assumptions can materially affect the fair value estimate, in
management's opinion, the existing models do not necessarily
provide a reliable single measure of the fair value of our stock
options.
F-43
KINGSTONE COMPANIES, INC. AND SUBSIDIARIES
NOTES TO CONSOLIDATED FINANCIAL STATEMENTS
YEARS ENDED DECEMBER 31, 2018 AND 2017
A
summary of stock option activity under the Company’s 2014
Plan and 2005 Plan for the year ended December 31, 2018 is as
follows:
|
Stock Options
|
Number of Shares
|
Weighted Average Exercise Price per Share
|
Weighted Average Remaining Contractual Term
|
Aggregate Intrinsic Value
|
|
|
|
|
|
|
|
Outstanding
at January 1, 2018
|
341,150
|
$
6.69
|
1.67
|
$
4,131,028
|
|
|
|
|
|
|
|
Granted
|
-
|
$
-
|
-
|
$
-
|
|
Exercised
|
(303,650
)
|
$
6.48
|
-
|
$
3,794,505
|
|
Forfeited
|
-
|
$
-
|
-
|
$
-
|
|
|
|
|
|
|
|
Outstanding at
December 31, 2018
|
37,500
|
$
8.36
|
2.24
|
$
349,950
|
|
|
|
|
|
|
|
Vested and
Exercisable at December 31, 2018
|
27,500
|
$
8.37
|
2.26
|
$
256,313
|
The
aggregate intrinsic value of options outstanding and options
exercisable at December 31, 2018 is calculated as the difference
between the exercise price of the underlying options and the market
price of the Company’s Common Stock for the options that had
exercise prices that were lower than the $17.69 closing price of
the Company’s Common Stock on December 31, 2018.
The total intrinsic value of options exercised in
the year ended December 31, 2018 was $3,794,505, determined as of
the date of exercise.
Participants in the 2005 and 2014 Plans may exercise their
outstanding vested options, in whole or in part, by having the
Company reduce the number of shares otherwise issuable by a number
of shares having a fair market value equal to the exercise price of
the option being exercised (“Net Exercise”), or by
exchanging a number of shares owned for a period of greater than
one year having a fair market value equal to the exercise price of
the option being exercised (“Share Exchange”). The
Company received cash proceeds of $90,640 from the exercise of
options for the purchase of 15,250 shares of common stock during
the year ended December 31, 2018. The Company received 7,855 shares
from the exercise of options under a Share Exchange for the
purchase of 30,000 shares of common stock during the year ended
December 31, 2018. The remaining 258,400 options exercised during
the year ended December 31, 2018 were Net Exercises, resulting in
the issuance of 94,647 shares of common stock.
The Company
received cash proceeds of $77,927 from the exercise of options for
the purchase of 13,750 shares of common stock during the year ended
December 31, 2017. The remaining 7,850
options exercised during the year ended December
31, 2017 were Net Exercises.
As of
December 31, 2018, the estimated fair value of unamortized
compensation cost related to unvested stock option awards was
approximately $1,000. Unamortized compensation cost as of December
31, 2018 is expected to be recognized over a remaining
weighted-average vesting period of 0.19 years.
As of
December 31, 2018, there were 466,124 shares reserved for grants
under the 2014 Plan.
F-44
KINGSTONE COMPANIES, INC. AND SUBSIDIARIES
NOTES TO CONSOLIDATED FINANCIAL STATEMENTS
YEARS ENDED DECEMBER 31, 2018 AND 2017
Restricted Stock Awards
A summary of the restricted common stock activity under the
Company’s 2014 Plan for the year ended December 31, 2018 is
as follows:
|
Restricted Stock Awards
|
Shares
|
Weighted Average Grant Date Fair Value per Share
|
Aggregate Fair Value
|
|
|
|
|
|
|
Balance
at January 1, 2018
|
47,337
|
$
14.35
|
$
679,180
|
|
|
|
|
|
|
Granted
|
92,004
|
$
18.67
|
$
1,717,958
|
|
Vested
|
(15,752
)
|
$
14.07
|
$
(221,613
)
|
|
Forfeited
|
(3,090
)
|
$
15.00
|
$
(46,350
)
|
|
|
|
|
|
|
Balance at December
31, 2018
|
120,499
|
$
17.66
|
$
2,129,175
|
Fair value was calculated using the closing price of the
Company’s Common Stock on the grant date. For the year ended
December 31, 2018 and 2017, stock-based compensation for these
grants was approximately $697,000 and $232,000, respectively, which
is included in other operating expenses on the accompanying
consolidated statements of income and comprehensive income (loss).
These amounts reflect the Company’s accounting expense and do
not correspond to the actual value that will be recognized by the
directors, executives and employees.
Note 13 - Statutory Financial Information and Accounting
Policies
For
regulatory purposes, KICO prepares its statutory basis financial
statements in accordance with Statements of Statutory Accounting
Principles (“statutory basis” or “SAP”) as
promulgated by the National Association of Insurance Commissioners
(the “NAIC”) and the prescribed or permitted practices
of the New York State Department of Financial Services (the
“DFS”). The more significant SAP variances from GAAP
are as follows:
|
|
|
|
●
|
Policy
acquisition costs are charged to operations in the year such costs
are incurred, rather than being deferred and amortized as premiums
are earned over the terms of the policies.
|
|
|
|
|
●
|
Ceding
commission revenues are earned when ceded premiums are written
except for ceding commission revenues in excess of anticipated
acquisition costs, which are deferred and amortized as ceded
premiums are earned. GAAP requires that all ceding commission
revenues be earned as the underlying ceded premiums are earned over
the term of the reinsurance agreements.
|
|
|
|
|
●
|
Certain
assets including certain receivables, a portion of the net deferred
tax asset, prepaid expenses and furniture and equipment are not
admitted.
|
|
|
|
|
●
|
Investments
in fixed-maturity securities are valued at NAIC value for statutory
financial purposes, which is primarily amortized cost. GAAP
requires certain investments in fixed-maturity securities
classified as available-for-sale, to be reported at fair
value.
|
|
|
|
|
●
|
Certain
amounts related to ceded reinsurance are reported on a net basis
within the statutory basis financial statements. GAAP requires
these amounts to be shown gross.
|
|
●
|
For SAP
purposes, changes in deferred income taxes relating to temporary
differences between net income for financial reporting purposes and
taxable income are recognized as a separate component of gains and
losses in surplus rather than included in income tax expense or
benefit as required under GAAP.
|
F-45
KINGSTONE COMPANIES, INC. AND SUBSIDIARIES
NOTES TO CONSOLIDATED FINANCIAL STATEMENTS
YEARS ENDED DECEMBER 31, 2018 AND 2017
State
insurance laws restrict the ability of KICO to declare dividends.
These restrictions are related to surplus and net investment
income. Dividends are restricted to the lesser of 10% of surplus or
100% of investment income (on a statutory accounting basis) for the
trailing 36 months, net of dividends paid by KICO during such
period. State insurance regulators require insurance companies to
maintain specified levels of statutory capital and surplus.
Generally, dividends may only be paid out of unassigned surplus,
and the amount of an insurer’s unassigned surplus following
payment of any dividends must be reasonable in relation to the
insurer’s outstanding liabilities and adequate to meet its
financial needs. For the years ended December 31, 2018 and 2017,
KICO paid dividends to Kingstone of $3,600,000 and $2,900,000,
respectively. On February 19, 2019, KICO’s Board of Directors
approved a cash dividend of $2,000,000 to Kingstone, which was paid
on February 20, 2019. For the years ended December 31, 2018 and
2017, KICO recorded statutory basis net income of $3,801,498 and
$7,907,743, respectively. At December 31, 2018 and 2017, KICO
reported statutory basis surplus as regards policyholders of
$98,745,944 and $101,290,282, respectively, as filed with the
DFS.
Note 14 - Risk Based Capital
State insurance departments impose risk-based capital
(“RBC”) requirements on insurance enterprises. The RBC
Model serves as a benchmark for the regulation of insurance
companies by state insurance regulators. RBC provides for targeted
surplus levels based on formulas, which specify various weighting
factors that are applied to financial balances or various levels of
activity based on the perceived degree of risk, and are set forth
in the RBC requirements. Such formulas focus on four general types
of risk: (a) the risk with respect to the company’s
assets (asset or default risk); (b) the risk of default on
amounts due from reinsurers, policyholders, or other creditors
(credit risk); (c) the risk of underestimating liabilities
from business already written or inadequately pricing business to
be written in the coming year (underwriting risk); and,
(d) the risk associated with items such as excessive premium
growth, contingent liabilities, and other items not reflected on
the balance sheet (off-balance sheet risk). The amount determined
under such formulas is called the authorized control level RBC
(“ACL”).
The RBC guidelines define specific capital levels based on a
company’s ACL that are determined by the ratio of the
company’s total adjusted capital (“TAC”) to its
ACL. TAC is equal to statutory capital, plus or minus certain other
specified adjustments. The Company’s TAC was above the ACL
for each of the last two years and is in compliance with RBC
requirements as of December 31, 2018 and 2017.
F-46
KINGSTONE COMPANIES, INC. AND SUBSIDIARIES
NOTES TO CONSOLIDATED FINANCIAL STATEMENTS
YEARS ENDED DECEMBER 31, 2018 AND 2017
Note 15 – Income Taxes
The Company files a consolidated U.S. federal income tax return
that includes all wholly owned subsidiaries. State tax returns are
filed on a consolidated or separate return basis depending on
applicable laws. The Company records adjustments related to prior
years’ taxes during the period when they are identified,
generally when the tax returns are filed. The effect of
these adjustments on the current and prior periods (during which
the differences originated) is evaluated based upon quantitative
and qualitative factors and are considered in relation to the
consolidated financial statements taken as a whole for the
respective periods.
The provision for income taxes is comprised of the
following:
|
Years ended December 31,
|
2018
|
2017
|
|
|
|
|
|
Current
federal income tax expense
|
$
(74,001
)
|
$
4,317,686
|
|
Current state
income tax (benefit) expense
|
(6,784
)
|
7,353
|
|
Deferred
federal and state income tax benefit
|
(5,398
)
|
(1,809
)
|
|
Income tax
(benefit) expense
|
$
(86,183
)
|
$
4,323,230
|
A reconciliation of the federal statutory rate to the
Company’s effective tax rate is as follows:
|
Years ended December 31,
|
2018
|
2017
|
||
|
Computed
expected tax expense
|
$
631,483
|
21.0
%
|
$
5,008,400
|
35.0
%
|
|
Change in
enacted tax rates on net deferred tax liabilities
|
-
|
-
|
(405,218
)
|
(2.8
)
|
|
State taxes,
net of Federal benefit
|
(377,884
)
|
(12.6
)
|
(101,858
)
|
(0.7
)
|
|
State
valuation allowance
|
390,976
|
13.0
|
124,486
|
0.9
|
|
Benefit of
lower tax brackets
|
-
|
-
|
(100,000
)
|
(0.7
)
|
|
Permanent
differences
|
|
|
|
|
|
Dividends
received deduction
|
(85,703
)
|
(2.9
)
|
(138,197
)
|
(1.0
)
|
|
Non-taxable
investment income
|
(40,861
)
|
(1.4
)
|
(85,684
)
|
(0.6
)
|
|
Excess
benefit from stock-based compensation
|
(569,459
)
|
(18.9
)
|
-
|
-
|
|
Stock-based
compensation
|
(16,960
)
|
(0.5
)
|
(25,821
)
|
(0.2
)
|
|
Other
permanent differences
|
42,496
|
1.4
|
46,962
|
0.3
|
|
Prior year
tax matters
|
(61,415
)
|
(2.0
)
|
4,172
|
-
|
|
Other
|
1,144
|
-
|
(4,012
)
|
-
|
|
Income tax
(benefit) expense, as reported
|
$
(86,183
)
|
(2.9
)%
|
$
4,323,230
|
30.2
%
|
Deferred tax assets and liabilities are determined using the
enacted tax rates applicable to the period the temporary
differences are expected to be recovered. Accordingly, the current
period income tax provision can be affected by the enactment of new
tax rates. The net deferred income taxes on the balance sheets
reflect temporary differences between the carrying amounts of the
assets and liabilities for financial reporting purposes and income
tax purposes, tax effected at a various rates depending on whether
the temporary differences are subject to federal taxes, state
taxes, or both.
On December 22, 2017, the Tax Cuts and Jobs Act (the “Tax
Act”) was enacted by the U.S. federal government. The Company
has accounted for the material impacts of the Tax Act by
re-measuring its deferred tax assets/(liabilities) at the 21%
enacted tax rate as of December 31, 2017. As of December 31, 2017,
the impact of the change in tax rate was a decrease in net deferred
income tax liabilities of $405,218 with a corresponding increase in
deferred income tax benefit. Upon completion of the 2017 U.S.
income tax return in 2018, the Company did not identify any
additional re-measurement adjustments to its recorded deferred tax
liabilities and the one-time transition tax.
F-47
KINGSTONE COMPANIES, INC. AND SUBSIDIARIES
NOTES TO CONSOLIDATED FINANCIAL STATEMENTS
YEARS ENDED DECEMBER 31, 2018 AND 2017
Deferred income tax liability for unrealized gains on
available-for-sale securities that were re-measured due to the Act
resulted in a stranded tax effect within AOCI. Due to the effect of
the tax rate change being recorded through continuing operations as
required under ASC 740. On February 14, 2018, the FASB issued ASU
2018-02, Income Statement – Reporting Comprehensive Income
(Topic 220) – Reclassification of Certain Tax Effects from
Accumulated Other Comprehensive Income (“ASU 2018-02”),
which allows for the reclassification of the stranded tax effects
as a result of the Act from AOCI to retained earnings and requires
certain other disclosures. The Company chose to early adopt the
provisions of ASU 2018-02 and recorded a one-time reclassification
of $182,912 from AOCI to retained earnings as of December 31, 2017
for the stranded tax effects resulting from the newly enacted
corporate tax rate. The amount of the reclassification was the
difference between the historical corporate tax rate and the newly
enacted 21% corporate tax rate (see the accompanying statement of
consolidated stockholders’ equity for reclassification of the
stranded tax effects).
Significant components of the Company’s deferred tax assets
and liabilities are as follows:
|
|
December
31,
|
December
31,
|
|
|
2018
|
2017
|
|
|
|
|
|
Deferred tax
asset:
|
|
|
|
Net operating
loss carryovers (1)
|
$
90,438
|
$
103,655
|
|
Claims
reserve discount
|
343,905
|
300,005
|
|
Unearned
premium
|
3,145,682
|
2,431,301
|
|
Deferred
ceding commission revenue
|
564,202
|
895,947
|
|
Other
|
383,733
|
382,522
|
|
Total
deferred tax assets
|
4,527,960
|
4,113,430
|
|
|
|
|
|
Deferred tax
liability:
|
|
|
|
Investment in
KICO (2)
|
759,543
|
759,543
|
|
Deferred
acquisition costs
|
3,760,625
|
3,117,920
|
|
Intangibles
|
140,700
|
212,100
|
|
Depreciation
and amortization
|
664,194
|
328,735
|
|
Net
unrealized (losses) gains of securities -
available-for-sale
|
(1,151,335
)
|
295,474
|
|
Total
deferred tax liabilities
|
4,173,727
|
4,713,772
|
|
|
|
|
|
Net deferred
income tax asset (liability)
|
$
354,233
|
$
(600,342
)
|
(1)
The
deferred tax assets from net operating loss carryovers are as
follows:
|
|
December
31,
|
December
31,
|
|
|
Type of
NOL
|
2018
|
2017
|
Expiration
|
|
State only
(A)
|
$
1,305,365
|
$
824,996
|
December 31,
2038
|
|
Valuation
allowance
|
(1,217,027
)
|
(725,541
)
|
|
|
State only,
net of valuation allowance
|
88,338
|
99,455
|
|
|
Amount
subject to Annual Limitation, federal only (B)
|
2,100
|
4,200
|
December 31,
2019
|
|
Total
deferred tax asset from net operating loss carryovers
|
$
90,438
|
$
103,655
|
|
(A) Kingstone generates operating losses for state purposes and has
prior year NOLs available. The state NOL as of December 31, 2018
and 2017 was approximately
$20,083,000
and
$12,692,000
, respectively. KICO, the Company’s
insurance underwriting subsidiary, is not subject to state income
taxes. KICO’s state tax obligations are paid through a gross
premiums tax, which is included in
the consolidated
statements of income and comprehensive income (loss) within other
underwriting expenses
. Kingstone has
recorded a valuation allowance due to the uncertainty of generating
enough state taxable income to utilize 100% of the available state
NOLs over their remaining lives, which expire between 2027 and
2038.
F-48
KINGSTONE COMPANIES, INC. AND SUBSIDIARIES
NOTES TO CONSOLIDATED FINANCIAL STATEMENTS
YEARS ENDED DECEMBER 31, 2018 AND 2017
(B)
The Company has a remaining NOL of $10,000 that is subject to
Internal Revenue Code Section 382, which places a limitation on the
utilization of the federal net operating loss to approximately
$10,000 per year (“Annual Limitation”) as a result of a
greater than 50% ownership change of the Company in 1999. The
remaining loss subject to the Annual Limitation will expire on
December 31, 2019.
(2)
Deferred tax liability - investment in
KICO
On
July 1, 2009, the Company completed the acquisition of 100% of the
issued and outstanding common stock of KICO (formerly known as
Commercial Mutual Insurance Company (“CMIC”)) pursuant
to the conversion of CMIC from an advance premium cooperative
insurance company to a stock property and casualty insurance
company. Pursuant to the plan of conversion, the Company acquired a
100% equity interest in KICO, in consideration for the exchange of
$3,750,000 principal amount of surplus notes of CMIC. In addition,
the Company forgave all accrued and unpaid interest on the surplus
notes as of the date of conversion. As of the date of acquisition,
unpaid accrued interest on the surplus notes along with the
accretion of the discount on the original purchase of the surplus
notes totaled $2,921,319 (collectively the “Untaxed
Interest”). As of the date of acquisition, the deferred tax
liability on the Untaxed Interest was $1,169,000. Under GAAP
guidance for business combinations, a temporary difference with an
indefinite life exists when the parent company has a lower carrying
value of its subsidiary for income tax purposes. The deferred tax
liability was reduced to $759,543 upon the reduction of federal
income tax rates as of December 31, 2017. The Company is required
to maintain its deferred tax liability of $759,543 related to this
temporary difference until the stock of KICO is sold, or the assets
of KICO are sold or KICO and the parent are merged.
The table below reconciles the changes in net deferred income tax
assets (liabilities) to the deferred income tax provision for the
year ended December 31, 2018:
|
Change in net
deferred income tax assets
|
$
(954,575
)
|
|
Deferred tax
benefit allocated to other comprehensive (loss) income
|
(949,177
)
|
|
Deferred
income tax benefit
|
$
(5,398
)
|
In assessing the valuation of deferred tax assets, the Company
considers whether it is more likely than not that some portion or
all of the deferred tax assets will not be realized. The ultimate
realization of deferred tax assets is dependent upon the generation
of future taxable income during the periods in which those
temporary differences become deductible. No valuation allowance
against deferred tax assets has been established, except for NOL
limitations, as the Company believes it is more likely than not the
deferred tax assets will be realized based on the historical
taxable income of KICO, or by offset to deferred tax
liabilities.
The Company had no material unrecognized tax benefit and no
adjustments to liabilities or operations were required. There were
no material interest or penalties related to income taxes that have
been accrued or recognized as of and for the years ended December
31, 2018 and 2017. If any had been recognized these would be
reported in income tax expense.
F-49
KINGSTONE COMPANIES, INC. AND SUBSIDIARIES
NOTES TO CONSOLIDATED FINANCIAL STATEMENTS
YEARS ENDED DECEMBER 31, 2018 AND 2017
Generally, taxing authorities may examine the Company’s tax
returns for the three years from the date of filing. The
Company’s tax returns for the years ended December 31, 2014
through December 31, 2017 remain subject to examination.
The
Company’s federal income tax return for the year ended
December 31, 2016 has been examined by the Internal Revenue Service
and was accepted as filed.
Note 16 - Employee Benefit Plans
Employee Profit Sharing Plan
The Company maintained a discretionary employee profit sharing plan
(the “Profit Sharing Plan”) available to full-time
employees who were employed as of December 31. For the years ended
December 31, 2018 and 2017, the Profit Sharing Plan called for a
bonus to be paid based on a formula that is tied to the annual GAAP
combined ratio (“Combined Ratio”). The maximum the
bonus can be is 25% of eligible wages at a Combined Ratio of 70%.
The bonus decreased by 1% for each percentage point increase in the
Combined Ratio. There is a minimum bonus of 5% at a Combined Ratio
of 90% and above. The bonus is allocated 35% to the
employees’ 401(k) account and 65% as cash through payroll.
The Company incurred approximately $445,000 and $989,000 of expense
for the years ended December 31, 2018 and 2017, respectively,
related to the Profit Sharing Plan, which is recorded in other
operating expenses on the accompanying consolidated statements of
income and comprehensive income (loss).
Employee Bonus Plan
In November 2018, the Company’s Board of Directors approved a
new discretionary employee bonus plan (“Bonus Plan”) to
replace the existing Profit Sharing Plan to be effective as of
January 1, 2019. Eligible employees can receive a target bonus rate
of between 12% and 30% of base salary depending on their position.
The target bonus rate is subject to adjustment depending on annual
performance evaluation scores. The Bonus Plan is funded through a
point system whereby up to 60 points are funded by a target return
on investment (“Target ROE”) sliding scale and up to 40
points are funded by achieving various annual corporate goals as
approved in advance by the Company’s Board of Directors. A
maximum of 60 points can be achieved with a Target ROE of 14%. The
bonus is decreased by six points for each percentage point decease
in Target ROE. The minimum of six points can be achieved with
Target ROE of 5%.
401 (k) Plan
The Company maintains a salary reduction plan under Section 401(k)
of the Internal Revenue Code (the “401(k) Plan”) for
its qualified employees. The Company matches 100% of each
participant’s contribution up to 4% of the
participant’s eligible contribution. The Company, at its
discretion, may allocate an amount for additional contributions
(“Additional Contributions”) to the 401(k) Plan
included in the Profit Sharing Plan as discussed above. The Company
incurred approximately $247,000 and $545,000 of expense for the
years ended December 31, 2018 and 2017, respectively, related to
the 401(k) Plan, which is recorded in other operating expenses on
the accompany consolidated statements of income and comprehensive
income (loss). For the years ended December 31, 2018 and 2017,
Additional Contributions totaled approximately $-0- and $309,000,
respectively.
F-50
KINGSTONE COMPANIES, INC. AND SUBSIDIARIES
NOTES TO CONSOLIDATED FINANCIAL STATEMENTS
YEARS ENDED DECEMBER 31, 2018 AND 2017
Deferred Compensation Plan
On June
18, 2018, the Company adopted the Kingstone Companies, Inc.
Deferred Compensation Plan (the "Deferred Compensation Plan"). The
Deferred Compensation Plan is offered to a select group
(“Participants”), consisting of management and highly
compensated employees as a method of recognizing and retaining such
Participants. The Deferred Compensation Plan provides for eligible
Participants to elect to defer up to 75% of their base compensation
and up to 100% of bonuses and other compensation and to have such
deferred amounts deemed to be invested in specified investment
options. In addition to the Participant deferrals, the Company
may choose to make matching contributions to some or all of the
Participants in the Deferred Compensation Plan to the extent the
Participant did not receive the maximum matching or non-elective
contributions permissible under the Company’s 401(k) Plan due
to limitations under the Internal Revenue Code or the 401(k) Plan.
Participants may elect to receive payment of their account balances
in a single cash payment or in annual installments for a period of
up to ten years. The first payroll subject to the Deferred
Compensation Plan was in July 2018. The deferred compensation
liability as of December 31, 2018 amounted to $298,638 and is
recorded in accounts payable, accrued expenses and other
liabilities in the consolidated balance sheets. The Company made
voluntary contributions of $24,957 for the year ended December 31,
2018, which are recorded in other operating expenses in the
consolidated statements of income and comprehensive income
(loss)
.
Note 17 - Commitments and Contingencies
Litigation
From time to time, the Company may be involved in various legal
proceedings in the ordinary course of business. For example, to the
extent a claim asserted by a third party in a lawsuit against one
of the Company’s insureds covered by a particular policy, the
Company may have a duty to defend the insured party against the
claim. These claims may relate to bodily injury, property damage or
other compensable injuries as set forth in the policy. Such
proceedings are considered in estimating the liability for loss and
LAE expenses. The Company is currently not subject to any other
pending legal proceedings that management believes are likely to
have a material adverse effect on the consolidated financial
statements.
Office Lease
The Company is a party to a non-cancellable operating lease, dated
March 27, 2015, for its office facility for KICO located in Valley
Stream, New York. In June 2016, the Company entered into a lease
modification agreement. The original lease had a term of seven
years and nine months. The lease modification increased the space
occupied by KICO and extended the lease term to seven years and
nine months to be measured from the additional premises
commencement date. The additional premises commencement date was
September 19, 2016, and additional rent was payable beginning March
19, 2017. The original lease commencement date was July 1, 2015 and
rent commencement began January 1, 2016.
In addition to the base rental costs, occupancy lease agreements
generally provide for rent escalations resulting from increased
assessments from real estate taxes and other charges. Rent expense
under the lease is recognized on a straight-line basis over the
lease term. At December 31, 2018, cumulative rent expense exceeded
cumulative rent payments by $91,800. This difference is recorded as
deferred rent and is included in accounts payable, accrued expenses
and other liabilities in the accompanying consolidated balance
sheets.
F-51
KINGSTONE COMPANIES, INC. AND SUBSIDIARIES
NOTES TO CONSOLIDATED FINANCIAL STATEMENTS
YEARS ENDED DECEMBER 31, 2018 AND 2017
As of December 31, 2018, aggregate future minimum rental
commitments under this agreement are as follows:
|
For the Year
|
|
|
Ending
|
|
|
December 31,
|
Total
|
|
2019
|
$
169,861
|
|
2020
|
175,806
|
|
2021
|
181,959
|
|
2022
|
188,328
|
|
2023
|
194,919
|
|
Thereafter
|
49,145
|
|
Total
|
$
960,018
|
Rent expense for the years ended December 31, 2018 and 2017
amounted to $165,368, and is
included in the consolidated
statements of income and comprehensive income
(loss)
within
other underwriting
expenses.
Employment Agreements
Barry Goldstein
(1)
Agreement
in effect for the years ended December 31, 2017 and
2018
On
January 20, 2017, the Company and Mr. Goldstein, the
Company’s President, Chairman of the Board and Chief
Executive Officer through December 31, 2018, entered into a new
employment agreement (the “2017 Goldstein Employment
Agreement”). The 2017 Goldstein Employment Agreement
was effective as of January 1, 2017 and was originally scheduled to
expire on December 31, 2019 (see below for Agreement in effect as
January 1, 2019).
Pursuant
to the 2017 Goldstein Employment Agreement, Mr. Goldstein was
entitled to receive an annual base salary of $630,000 and an annual
bonus equal to 6% of the Company's consolidated income from
operations before taxes, exclusive of net investment income (loss)
and net realized gains (losses) on investments. In addition,
pursuant to the 2017 Goldstein Employment Agreement, Mr. Goldstein
was entitled to a long-term compensation payment ("LTC") of between
$945,000 and $2,835,000 in the event the Company's adjusted book
value per share as defined, increased by at least an average of 8%
per annum as of December 31, 2019 as compared to December 31, 2016
(with the maximum LTC payment being due if the average per annum
increase is at least 14%). Accrued LTC compensation expense
(credit) of $(247,311) and $945,000 for the years ended December
31, 2018 and 2017 is included in other operating expenses on the
accompanying consolidated statements of income and comprehensive
income
(loss)
.
Further,
pursuant to the 2017 Goldstein Employment Agreement, in the event
that Mr. Goldstein's employment is terminated by the Company
without cause or he resigns for good reason each as defined, Mr.
Goldstein would be entitled to receive his base salary, the 6%
bonus and the LTC payment for the remainder of the term. Mr.
Goldstein would be entitled, under certain circumstances, to a
payment equal to one and one-half times his then annual salary and
the target LTC payment of $1,890,000 in the event of the
termination of his employment following a change of control of the
Company.
(2) Agreement
in effect as of January 1, 2019
F-52
KINGSTONE COMPANIES, INC. AND SUBSIDIARIES
NOTES TO CONSOLIDATED FINANCIAL STATEMENTS
YEARS ENDED DECEMBER 31, 2018 AND 2017
On
October 16, 2018, the Company entered into an amended and restated
employment agreement with Mr. Goldstein effective as of January 1,
2019 and expiring on December 31, 2021 (the “Amended
Employment Agreement”). Pursuant to the Amended Employment
Agreement, Mr. Goldstein stepped down as Chief Executive Officer on
January 1, 2019 and was named Executive Chairman of the
Board.
Mr.
Goldstein will be entitled to receive an annual base salary of
$636,500 for the calendar year 2019 and $500,000 for each of the
calendar years 2020 and 2021. In addition, Mr. Goldstein is
eligible to receive an annual performance bonus equal to 3% of the
Company’s consolidated income from operations before taxes,
exclusive of net investment income (loss) and net realized gains
(losses) on investments. In addition, Mr. Goldstein will continue
to be entitled to a long-term compensation award
(“LTC”) (which is a continuation of the previous terms
under the 2017 Goldstein Employment Agreement) of between $945,000
and $2,835,000 based on a specified minimum increase in the
Company’s adjusted book value per share, as defined, as of
December 31, 2019 as compared to December 31, 2016 (with the
maximum LTC payment being due if the average per annum increase is
at least 14%). Furthermore, in the event that Mr. Goldstein’s
employment is terminated by the Company without cause or he resigns
for good reason, each as defined, Mr. Goldstein would be entitled
to receive separation payments equal to his then applicable base
salary, the 3% bonus and the LTC payment for the remainder of the
term. Mr. Goldstein would be entitled, under certain circumstances,
to a payment equal to three times his then annual salary and the
target LTC payment in the event of the termination of his
employment following a change of control of the Company. Mr.
Goldstein will also be entitled to receive a grant, under the terms
of the 2014 Plan, during the first 30 days of January 2020, with
respect to a number of shares of restricted stock determined by
dividing $436,500 by the fair market value of the Company stock on
the date of grant. The January 2020 grant will become vested with
respect to 50% of the award on each of December 31, 2020 and
December 31, 2021 based on continued provision of services on each
vesting date. In addition, Mr. Goldstein will be entitled to
receive a grant, under the 2014 Plan, during the first 30 days of
2021, with respect to a number of shares of restricted stock
determined by dividing $236,500 by the fair market value of the
Company stock on the date of grant. The January 2021 grant will
become vested as of December 31, 2021 based on continued provision
of services on the vesting date.
Dale A. Thatcher
(1) Agreement
in effect for the year ended December 31, 2018
On
March 14, 2018, the Company and Dale A. Thatcher, a director of the
Company, entered into an employment agreement (the “Thatcher
Employment Agreement”) pursuant to which Mr. Thatcher serves
as the Company’s Chief Operating Officer. Mr. Thatcher
also serves as KICO’s President. The Thatcher
Employment Agreement became effective as of March 15, 2018 and
expired on December 31, 2018.
Pursuant
to the Thatcher Employment Agreement, Mr. Thatcher is entitled to
receive a base salary of $500,000 per annum and a minimum bonus
equal to 15% of his base salary. Concurrently with the
execution of the Thatcher Employment Agreement, the Company
granted to Mr. Thatcher 35,715 shares of restricted Common Stock
under the 2014 Plan. The shares granted will vest in three
equal installments on each of the three anniversaries following the
grant date, subject to the terms of the restricted stock grant
agreement between the Company and Mr. Thatcher.
(2) Agreement
in effect as of January 1, 2019
F-53
KINGSTONE COMPANIES, INC. AND SUBSIDIARIES
NOTES TO CONSOLIDATED FINANCIAL STATEMENTS
YEARS ENDED DECEMBER 31, 2018 AND 2017
On
October 16, 2018, the Company and Mr. Thatcher entered into an
Employment Agreement effective as of January 1, 2019 and expiring
on December 31, 2021 (the “2019 Thatcher Employment
Agreement”). Pursuant to the 2019 Thatcher Employment
Agreement, Mr. Thatcher was promoted to succeed Mr. Goldstein as
Chief Executive Officer effective January 1, 2019. Mr. Thatcher
will continue to serve as a director and will remain President of
KICO.
Mr.
Thatcher will be entitled to receive an annual base salary of
$500,000 for 2019, $630,000 for 2020 and no increase in 2021. In
addition, Mr. Thatcher is eligible to receive an annual performance
bonus equal to 3% of the Company’s consolidated income from
operations before taxes, exclusive of the net investment income
(loss) and net realized gains (losses) on investments. In the event
that Mr. Thatcher’s employment is terminated by the Company
without cause or he resigns for good reason, each as defined, Mr.
Thatcher would be entitled to receive separation payments equal to
his then applicable base salary and the 3% bonus for the remainder
of the term. Mr. Thatcher will also be entitled to receive a grant,
under the terms of the 2014 Equity Plan, with respect to a number
of shares of restricted stock in each of 2019, 2020 and 2021
determined by dividing $750,000, $1,250,000 and $1,500,000,
respectively, by the fair market value of the Company’s stock
on the date of grant.
Each grant
vests ratably over a three-year period from the date of
grant.
Approval Required for Transactions with Subsidiary
On July
1, 2009, Kingstone completed the acquisition of 100% of the issued
and outstanding common stock of KICO (formerly known as Commercial
Mutual Insurance Company (“CMIC”)) pursuant to the
conversion of CMIC from an advance premium cooperative to a stock
property and casualty insurance company. Pursuant to the plan of
conversion, Kingstone acquired a 100% equity interest in KICO. In
connection with the plan of conversion of CMIC, the Company has
agreed with the DFS that any intercompany transaction between
itself and KICO must be filed with the DFS 30 days prior to
implementation.
Note
18 - Earnings Per Common Share
Basic
net earnings per common share is computed by dividing income
available to common shareholders by the weighted-average number of
common shares outstanding. Diluted earnings per common share
reflect, in periods in which they have a dilutive effect, the
impact of common shares issuable upon exercise of stock options as
well as non-vested restricted stock awards. The computation of
diluted earnings per common share excludes those options with an
exercise price in excess of the average market price of the
Company’s common shares during the periods
presented.
The
computation of diluted earnings per common share excludes
outstanding options in periods where the exercise of such options
would be anti-dilutive. For the years ended December 31, 2018 and
2017, the inclusion of -0- options, in the computation of diluted
earnings per common share would have been anti-dilutive for the
periods and, as a result, the weighted average number of common
shares used in the calculation of diluted earnings per common share
has not been adjusted for the effect of such options.
F-54
KINGSTONE COMPANIES, INC. AND SUBSIDIARIES
NOTES TO CONSOLIDATED FINANCIAL STATEMENTS
YEARS ENDED DECEMBER 31, 2018 AND 2017
The
reconciliation of the weighted average number of common shares used
in the calculation of basic and diluted earnings per common share
follows:
|
|
Years
ended
|
|
|
|
December
31,
|
|
|
|
2018
|
2017
|
|
|
|
|
|
Weighted
average number of shares outstanding
|
10,686,813
|
10,388,440
|
|
|
|
|
|
Effect of
dilutive securities, common share equivalents:
|
|
|
|
Stock
options
|
19,823
|
188,983
|
|
Restricted
stock awards
|
10,250
|
4,154
|
|
|
|
|
|
Weighted
average number of shares outstanding,
|
|
|
|
used for
computing diluted earnings per share
|
10,716,886
|
10,581,577
|
Note 19 - Subsequent Events
The
Company has evaluated events that occurred subsequent to December
31, 2018 through March 18, 2019, the date these consolidated
financial statements were issued for matters that required
disclosure or adjustment in these consolidated financial
statements.
Dividends Declared and Paid
On
February 14, 2019, the Company’s Board of Directors approved
a dividend of $.10 per share payable in cash on March 15, 2019 to
stockholders of record as of February 28, 2019.
Note 20 – Quarterly Financial Data (Unaudited)
The
following is a summary of unaudited quarterly results of operations
for the years ended December 31, 2018 and 2017:
F-55
KINGSTONE COMPANIES, INC. AND SUBSIDIARIES
NOTES TO CONSOLIDATED FINANCIAL STATEMENTS
YEARS ENDED DECEMBER 31, 2018 AND 2017
|
|
2018
|
||||
|
|
March
31,
|
June
30,
|
September
30,
|
December
31,
|
Total
|
|
|
|
|
|
|
|
|
Net
premiums earned
|
$
22,837,617
|
$
24,104,614
|
$
27,533,907
|
$
28,938,577
|
$
103,414,715
|
|
Ceding
commission revenue
|
1,695,158
|
1,691,168
|
1,044,529
|
901,775
|
5,332,630
|
|
Net
investment income
|
1,383,989
|
1,556,866
|
1,602,371
|
1,643,022
|
6,186,248
|
|
Net
(losses) gains on investments
|
(523,127
)
|
(106,733
)
|
352,025
|
(2,218,022
)
|
(2,495,857
)
|
|
Total
revenues
|
25,701,870
|
27,546,186
|
30,885,909
|
29,637,933
|
113,771,898
|
|
Loss
and loss adjustment expenses
|
17,266,330
|
11,176,085
|
13,296,708
|
16,556,082
|
58,295,205
|
|
Commission
expense and
|
|
|
|
|
|
|
other
underwriting expenses
|
10,831,451
|
11,093,175
|
11,788,002
|
12,572,851
|
46,285,479
|
|
Net
income (loss)
|
(2,717,934
)
|
2,757,297
|
3,933,730
|
(879,847
)
|
3,093,246
|
|
Basic
earnings (loss) per share
|
$
(0.28
)
|
$
0.26
|
$
0.37
|
$
(0.08
)
|
$
0.29
|
|
Diluted
earnings (loss) per share
|
$
(0.28
)
|
$
0.25
|
$
0.36
|
$
(0.08
)
|
$
0.29
|
|
|
2017
|
||||
|
|
March
31,
|
June
30,
|
September
30,
|
December
31,
|
Total
|
|
|
|
|
|
|
|
|
Net
premiums earned
|
$
16,369,748
|
$
16,953,727
|
$
21,514,408
|
$
22,513,140
|
$
77,351,023
|
|
Ceding
commission revenue
|
3,184,452
|
3,305,938
|
1,717,610
|
1,725,133
|
9,933,133
|
|
Net
investment income
|
857,800
|
1,026,004
|
1,033,307
|
1,215,475
|
4,132,586
|
|
Net
realized gain (loss) on investments
|
(54,506
)
|
130,423
|
20,998
|
(12,602
)
|
84,313
|
|
Total
revenues
|
20,647,194
|
21,724,251
|
24,614,653
|
25,783,212
|
92,769,310
|
|
Loss
and loss adjustment expenses
|
8,292,996
|
7,454,922
|
7,073,323
|
11,364,296
|
34,185,537
|
|
Commission
expense and
|
|
|
|
|
|
|
other
underwriting expenses
|
9,101,395
|
9,301,182
|
9,975,938
|
10,919,353
|
39,297,868
|
|
Net
income
|
1,470,580
|
2,510,392
|
4,073,921
|
1,931,592
|
9,986,485
|
|
Basic
earnings per share
|
$
0.15
|
$
0.24
|
$
0.38
|
$
0.18
|
$
0.96
|
|
Diluted
earnings per share
|
$
0.15
|
$
0.23
|
$
0.38
|
$
0.18
|
$
0.94
|
Due to
changes in number of shares outstanding from quarter to quarter,
the total earnings per share of the four quarters may not
necessarily equal the earnings per share for the year.
F-56
TABLE OF CONTENTS
Part IItem 1. BusinessItem 1A. Risk FactorsItem 1B Unresolved Staff CommentsItem 2. PropertiesItem 3. Legal ProceedingsItem 4. Mine Safety DisclosuresPart IIItem 5. Market For Registrant S Common Equity, Related Stockholder Matters and Issuer Purchases Of Equity SecuritiesItem 6. Selected Financial DataItem 7. Management S Discussion and Analysis Of Financial Condition and Results Of OperationsItem 7A. Quantitative and Qualitative Disclosures About Market RiskItem 8. Financial Statements and Supplementary DataItem 9. Changes in and Disagreements with Accountants on Accounting and Financial DisclosureItem 9A. Controls and ProceduresItem 9B. Other InformationPart IIIItem 10. Directors, Executive Officers and Corporate GovernanceItem 11. Executive CompensationItem 12. Security Ownership Of Certain Beneficial Owners and Management and Related Stockholder MattersItem 13. Certain Relationships and Related Transactions, and Director IndependenceItem 14. Principal Accountant Fees and ServicesPart IVItem 15. Exhibits and Financial Statement SchedulesItem 16. Form 10-k SummaryNote 1 - Nature Of BusinessNote 2 Summary Of Significant Accounting PoliciesNote 3 - InvestmentsNote 4 - Fair Value MeasurementsNote 5 - Fair Value Of Financial Instruments and Real EstateNote 6 - IntangiblesNote 7 - ReinsuranceNote 8 - Deferred Policy Acquisition Costs and Deferred Ceding Commission RevenueNote 9 DebtNote 10 - Property and EquipmentNote 11 - Property and Casualty Insurance ActivityNote 12 Stockholders EquityNote 13 - Statutory Financial Information and Accounting PoliciesNote 14 - Risk Based CapitalNote 15 Income TaxesNote 16 - Employee Benefit PlansNote 17 - Commitments and ContingenciesNote 18 - Earnings Per Common ShareNote 19 - Subsequent EventsNote 20 Quarterly Financial Data (unaudited)