KKR & CO. INC.
10-Ks and 10-Qs
|
|
|
|
UNITED STATES
SECURITIES AND EXCHANGE COMMISSION
WASHINGTON, D.C. 20549
Form 10-K
ý
ANNUAL REPORT PURSUANT TO SECTION 13 OR 15(d) OF THE SECURITIES EXCHANGE ACT OF 1934.
For the fiscal year ended
December 31, 2015
Or
o
TRANSITION REPORT PURSUANT TO SECTION 13 OR 15(d) OF THE SECURITIES EXCHANGE ACT OF 1934.
For the Transition period from to .
Commission File Number 001-34820
KKR & CO. L.P.
(Exact name of Registrant as specified in its charter)
|
Delaware
|
|
26-0426107
|
|
(State or other Jurisdiction of
Incorporation or Organization)
|
|
(I.R.S. Employer
Identification Number)
|
9 West 57
th
Street, Suite 4200
New York, New York 10019
Telephone: (212) 750-8300
(Address, zip code, and telephone number, including
area code, of registrant’s principal executive office.)
Securities registered pursuant to Section 12(b) of the Act:
|
Title of each class
|
Name of each exchange on which registered
|
|
Common units representing limited
partner interests
|
New York Stock Exchange
|
Securities registered pursuant to Section 12(g) of the Act: None
Indicate by check mark if the registrant is a well‑known seasoned issuer, as defined in Rule 405 of the Securities Act.
Yes
ý
No
o
Indicate by check mark if the registrant is not required to file reports pursuant to Section 13 or Section 15(d) of the Act. Yes
o
No
ý
Indicate by check mark whether the registrant (1) has filed all reports required to be filed by Section 13 and 15(d) of the Securities Exchange Act of 1934 during the preceding 12 months (or for such shorter periods that the registrant was required to file such reports), and (2) has been subject to such filing requirements for the past 90 days. Yes
ý
No
o
Indicate by check mark whether the registrant has submitted electronically and posted on its corporate Web site, if any, every Interactive Data File required to be submitted and posted pursuant to Rule 405 of Regulation S-T during the preceding 12 months (or for such shorter period that the registrant was required to submit and post such files). Yes
ý
No
o
Indicate by check mark if disclosure of delinquent filers pursuant to Item 405 of Regulation S‑K is not contained herein, and will not be contained, to the best of registrant’s knowledge, in definitive proxy or information statements incorporated by reference in Part III of this Form 10‑K or any amendment to this Form 10‑K.
o
Indicate by check mark whether the registrant is a large accelerated filer, an accelerated filer, a non-accelerated filer, or a smaller reporting company. See the definitions of “large accelerated filer,” “accelerated filer” and “smaller reporting company” in Rule 12b-2 of the Exchange Act:
|
Large accelerated filer
x
|
Accelerated filer
o
|
Non-accelerated filer
o
|
Smaller reporting company
o
|
|||
|
(Do not check if a smaller reporting company)
|
||||||
Indicate by check mark whether the registrant is a shell company (as defined in Rule 12b-2 of the Exchange Act). Yes
o
No
ý
The aggregate market value of the common units of the registrant held by non‑affiliates as of June 30, 2015, was approximately $10.1 billion. As of
February 22, 2016
, there were
449,251,468
Common Units of the registrant outstanding.
DOCUMENTS INCORPORATED BY REFERENCE
None
KKR & CO. L.P.
FORM 10-K
For the Year Ended
December 31, 2015
INDEX
|
|
|
Page No.
|
|
|
PART 1
|
|
|
|
|
|
|
Item 1.
|
Business
|
|
|
|
|
|
|
Item 1A.
|
Risk Factors
|
|
|
Item 1B.
|
Unresolved Staff Comments
|
|
|
|
|
|
|
Item 2.
|
Properties
|
|
|
|
|
|
|
Item 3.
|
Legal Proceedings
|
|
|
|
|
|
|
Item 4.
|
Mine Safety Disclosures
|
|
|
PART II
|
||
|
|
|
|
|
Item 5.
|
Market for Registrant's Common Equity, Related Stockholder Matters and Issuer Purchases of Equity Securities
|
|
|
|
|
|
|
Item 6.
|
Selected Financial Data
|
|
|
|
|
|
|
Item 7.
|
||
|
|
|
|
|
Item 7A.
|
||
|
|
|
|
|
Item 8.
|
Financial Statements and Supplementary Data
|
|
|
|
|
|
|
Item 9.
|
Changes in and Disagreements with Accountants on Accounting and Financial Disclosure
|
|
|
|
|
|
|
Item 9A.
|
||
|
|
|
|
|
Item 9B.
|
||
|
PART III
|
||
|
Item 10.
|
Directors, Executive Officers and Corporate Governance
|
|
|
Item 11.
|
Executive Compensation
|
|
|
Item 12.
|
Security Ownership of Certain Beneficial Owners and Management and Related Stockholder Matters
|
|
|
Item 13.
|
Certain Relationships and Related Transactions, and Director Independence
|
|
|
Item 14.
|
Principal Accounting Fees and Services
|
|
|
PART IV
|
||
|
Item 15
|
Exhibits
, Financial Statement Schedules
|
|
|
SIGNATURES
|
||
2
CAUTIONARY NOTE REGARDING FORWARD-LOOKING STATEMENTS
This report contains forward looking statements within the meaning of Section 27A of the Securities Act of 1933, or the Securities Act, and Section 21E of the Securities Exchange Act of 1934, or the Exchange Act, which reflect our current views with respect to, among other things, our operations and financial performance. You can identify these forward looking statements by the use of words such as "outlook," "believe," "expect," "potential," "continue," "may," "should," "seek," "approximately," "predict," "intend," "will," "plan," "estimate," "anticipate," the negative version of these words, other comparable words or other statements that do not relate strictly to historical or factual matters. Without limiting the foregoing, statements regarding the strategic partnership with Marshall Wace LLP, the declaration and payment of distributions on common units of KKR, the timing, manner and volume of repurchases of common units pursuant to a repurchase program and the expected synergies from the acquisitions or strategic partnerships, may constitute forward-looking statements that are subject to the risk that the benefits and anticipated synergies from such transactions are not realized. Forward looking statements are subject to various risks and uncertainties. Accordingly, there are or will be important factors that could cause actual outcomes or results to differ materially from those indicated in these statements. We believe these factors include those described under the section entitled "Risk Factors" in this report. These factors should be read in conjunction with the other cautionary statements that are included in this report and in our other periodic filings. We do not undertake any obligation to publicly update or review any forward looking statement, whether as a result of new information, future developments or otherwise.
In this report, references to "KKR," "we," "us," "our" and "our partnership" refer to KKR & Co. L.P. and its consolidated subsidiaries. Prior to KKR & Co. L.P. becoming listed on the New York Stock Exchange ("NYSE") on July 15, 2010, KKR Group Holdings L.P. ("Group Holdings") consolidated the financial results of KKR Management Holdings L.P. and KKR Fund Holdings L.P. (together, the "KKR Group Partnerships") and their consolidated subsidiaries. On August 5, 2014, KKR International Holdings L.P. became a KKR Group Partnership. Each KKR Group Partnership has an identical number of partner interests and, when held together, one Class A partner interest in each of the KKR Group Partnerships together represents one KKR Group Partnership Unit.
References to "our Managing Partner" are to KKR Management LLC, which acts as our general partner and unless otherwise indicated, references to equity interests in KKR's business, or to percentage interests in KKR's business, reflect the aggregate equity of the KKR Group Partnerships and are net of amounts that have been allocated to our principals and other employees and non-employee operating consultants in respect of the carried interest from KKR's business as part of our "carry pool" and certain minority interests. References to "principals" are to our senior employees and non-employee operating consultants who hold interests in KKR's business through KKR Holdings L.P., which we refer to as "KKR Holdings," and references to our "senior principals" are to our senior employees who hold interests in our Managing Partner entitling them to vote for the election of its directors.
References to non-employee operating consultants include employees of KKR Capstone and are not employees of KKR. KKR Capstone refers to a group of entities that are owned and controlled by their senior management. KKR Capstone is not a subsidiary or affiliate of KKR. KKR Capstone operates under several consulting agreements with KKR and uses the "KKR" name under license from KKR.
Prior to October 1, 2009, KKR's business was conducted through multiple entities for which there was no single holding entity, but were under common control of senior KKR principals, and in which senior principals and KKR's other principals and individuals held ownership interests (collectively, the "Predecessor Owners"). On October 1, 2009, we completed the acquisition of all of the assets and liabilities of KKR & Co. (Guernsey) L.P. (f/k/a KKR Private Equity Investors, L.P. or "KPE") and, in connection with such acquisition, completed a series of transactions pursuant to which the business of KKR was reorganized into a holding company structure. The reorganization involved a contribution of certain equity interests in KKR's business that were held by KKR's Predecessor Owners to the KKR Group Partnerships in exchange for equity interests in the KKR Group Partnerships held through KKR Holdings. We refer to the acquisition of the assets and liabilities of KPE and to our subsequent reorganization into a holding company structure as the "KPE Transaction."
In this report, the term "GAAP" refers to accounting principles generally accepted in the United States of America.
We disclose certain financial measures in this report that are calculated and presented using methodologies other than in accordance with GAAP. We believe that providing these performance measures on a supplemental basis to our GAAP results is
3
helpful to unitholders in assessing the overall performance of KKR's businesses. These financial measures should not be considered as a substitute for similar financial measures calculated in accordance with GAAP, if available. We caution readers that these non-GAAP financial measures may differ from the calculations of other investment managers, and as a result, may not be comparable to similar measures presented by other investment managers. Reconciliations of these non-GAAP financial measures to the most directly comparable financial measures calculated and presented in accordance with GAAP, where applicable, are included within "Financial Statements and Supplementary Data — Note 13. Segment Reporting" and later in this report under "Management's Discussion and Analysis of Financial Condition and Results of Operations — Segment Balance Sheet."
This report uses the terms assets under management or AUM, fee paying assets under management or FPAUM, fee related earnings or FRE, economic net income or ENI, equity invested, gross dollars invested, syndicated capital, equity invested, book value and adjusted units. You should note that our calculations of these financial measures and other financial measures may differ from the calculations of other investment managers and, as a result, our financial measures may not be comparable to similar measures presented by other investment managers. These and other financial measures are defined in the section "Management's Discussion and Analysis of Financial Condition & Results of Operations—Key Financial Measures under GAAP—Segment Operating and Performance Measures" and "— Segment Balance Sheet —Liquidity—Liquidity Needs."
References to "our funds" or "our vehicles" refer to investment funds, vehicles and/or accounts advised, sponsored or managed by one or more subsidiaries of KKR including CLO and CMBS vehicles, unless context requires otherwise. They do not include investment funds, vehicles or accounts of any hedge fund manager with which we have formed a strategic partnership where we have acquired a non-controlling interest.
Unless otherwise indicated, references in this report to our fully exchanged and diluted common units outstanding, or to our common units outstanding on a fully exchanged and diluted basis, reflect (i) actual common units outstanding, (ii) common units into which KKR Group Partnership Units not held by us are exchangeable pursuant to the terms of the exchange agreement described in this report, (iii) common units issuable in respect of exchangeable equity securities issued in connection with the acquisition of Avoca Capital ("Avoca"), and (iv) common units issuable pursuant to any equity awards actually issued or vested but not yet delivered under the KKR & Co. L.P. 2010 Equity Incentive Plan, which we refer to as our "Equity Incentive Plan," but do not reflect common units available for issuance pursuant to our Equity Incentive Plan for which grants have not yet been made.
4
Overview
We are a leading global investment firm that manages investments across multiple asset classes including private equity, energy, infrastructure, real estate, credit and hedge funds. We aim to generate attractive investment returns by following a patient and disciplined investment approach, employing world‑class people, and driving growth and value creation in the assets we manage. We invest our own capital alongside the capital we manage for fund investors and bring debt and equity investment opportunities to others through our capital markets business.
Our business offers a broad range of investment management services to our fund investors and provides capital markets services to our firm, our portfolio companies and third parties. Throughout our history, we have consistently been a leader in the private equity industry, having completed more than 260 private equity investments in portfolio companies with a total transaction value in excess of $515 billion. We have grown our firm by expanding our geographical presence and building businesses in areas, such as credit, special situations, hedge funds, collateralized loan obligations (“CLOs”), capital markets, infrastructure, energy and real estate. Our balance sheet has provided a significant source of capital in the growth and expansion of our business, and has allowed us to further align our interests with those of our fund investors. These efforts build on our core principles and industry expertise, allowing us to leverage the intellectual capital and synergies in our businesses, and to capitalize on a broader range of the opportunities we source. Additionally, we have increased our focus on meeting the needs of our existing fund investors and in developing relationships with new investors in our funds.
We conduct our business with offices throughout the world, providing us with a pre‑eminent global platform for sourcing transactions, raising capital and carrying out capital markets activities. Our growth has been driven by value that we have created through our operationally focused investment approach, the expansion of our existing businesses, our entry into new lines of business, innovation in the products that we offer investors in our funds, an increased focus on providing tailored solutions to our clients and the integration of capital markets distribution activities.
As a global investment firm, we earn management, monitoring, transaction, incentive fees and carried interest for providing investment management, monitoring and other services to our funds, vehicles, CLOs, managed accounts and portfolio companies, and we generate transaction‑specific income from capital markets transactions. We earn additional investment income from investing our own capital alongside that of our fund investors, from other assets on our balance sheet and from the carried interest we receive from our funds and certain of our other investment vehicles. A carried interest entitles the sponsor of a fund to a specified percentage of investment gains that are generated on third‑party capital that is invested.
Our investment teams have deep industry knowledge and are supported by a substantial and diversified capital base, an integrated global investment platform, the expertise of operating consultants and senior advisors and a worldwide network of business relationships that provide a significant source of investment opportunities, specialized knowledge during due diligence and substantial resources for creating and realizing value for stakeholders. These teams invest capital, a substantial portion of which is of a long duration and not subject to redemption. With over 75% of our fee paying assets under management not subject to redemption for at least 8 years from inception, we have significant flexibility to grow investments and select exit opportunities. We believe that these aspects of our business will help us continue to expand and grow our business and deliver strong investment performance in a variety of economic and financial conditions.
Our Firm
With offices around the world, we have established ourselves as a leading global investment firm. We have multilingual and multicultural investment teams with local market knowledge and significant business, investment, and operational experience in the countries in which we invest. We believe that our global capabilities have helped us to raise capital, capture a greater number of investment opportunities, and assist our portfolio companies in their increasing reliance on global markets and sourcing, while enabling us to diversify our operations.
Though our operations span multiple continents and asset classes, our investment professionals are supported by an integrated infrastructure and operate under a common set of principles and business practices that are monitored by a variety of committees. The firm operates with a single culture that rewards investment discipline, creativity, determination, and patience and the sharing of information, resources, expertise, and best practices across offices and asset classes. When appropriate, we staff transactions across multiple offices and businesses in order to take advantage of the industry‑ specific expertise of our investment professionals, and we hold regular meetings in which investment professionals throughout our offices share their
5
knowledge and experiences. We believe that the ability to draw on the local cultural fluency of our investment professionals while maintaining a centralized and integrated global infrastructure distinguishes us from other investment firms and has been a substantial contributing factor to our ability to raise funds, invest internationally and expand our businesses.
Since our inception, one of our fundamental philosophies has been to align the interests of the firm and our principals with the interests of our fund investors, portfolio companies and other stakeholders. We achieve this by putting our own capital behind our ideas. As of
December 31, 2015
, we and our employees and other personnel have approximately $12.3 billion invested in or committed to our own funds and portfolio companies, including $8.9 billion funded through our balance sheet, $1.4 billion of additional commitments from our balance sheet to investment funds, $1.0 billion in personal investments and $1.0 billion of additional commitments from personal investments.
Our Segments
Private Markets
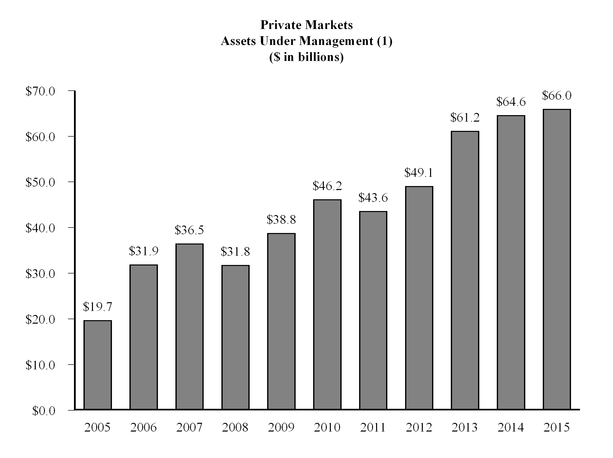
Through our Private Markets segment, we manage and sponsor a group of private equity funds and co-investment vehicles that invest capital for long-term appreciation, either through controlling ownership of a company or strategic minority positions. We also manage and sponsor a group of funds and co-investment vehicles that invest capital in real assets, such as infrastructure, energy and real estate. These funds, vehicles and accounts are managed by Kohlberg Kravis Roberts & Co. L.P., an SEC registered investment adviser. As of
December 31, 2015
, the segment had
$66.0 billion
of AUM and FPAUM of
$45.3 billion
, consisting of $34.9 billion in private equity and $10.4 billion in real assets (including infrastructure, energy and real estate) and other strategies. Prior to 2010, FPAUM in the Private Markets segment consisted entirely of private equity funds.
|
(1)
|
For the years 2006 through 2008, assets under management are presented pro forma for the KPE Transaction, and therefore, exclude the net asset value of KPE and its former commitments to our investment funds. AUM as of and after December 31, 2014 has been adjusted to include capital commitments for which we are eligible to receive fees or carried interest upon deployment of capital. This item increased our AUM by approximately $3.1 billion as of December 31, 2014 but is excluded from AUM for all prior years presented.
|
6
The table below presents information as of
December 31, 2015
relating to our current private equity funds and other investment vehicles for which we have the ability to earn carried interest. This data does not reflect acquisitions or disposals of investments, changes in investment values or distributions occurring after
December 31, 2015
.
|
|
Investment Period (1)
|
Amount ($ in millions)
|
||||||||||||||||||||
|
|
Commencement Date
|
End Date
|
Commitment (2)
|
Uncalled
Commitments
|
Percentage
Committed by
General
Partner
|
Invested
|
Realized
|
Remaining
Cost (3)
|
Remaining
Fair Value
|
|||||||||||||
|
Private Markets
|
|
|
|
|
|
|
|
|
|
|
|
|
|
|
|
|||||||
|
Private Equity Funds
|
|
|
|
|
|
|
|
|
|
|
|
|
|
|
|
|||||||
|
European Fund IV
|
12/2014
|
12/2020
|
$
|
3,468.0
|
|
$
|
3,307.1
|
|
5.7%
|
$
|
160.9
|
|
$
|
—
|
|
$
|
160.9
|
|
$
|
185.7
|
|
|
|
Asian Fund II
|
4/2013
|
4/2019
|
5,825.0
|
|
3,979.3
|
|
1.3%
|
2,599.7
|
|
753.9
|
|
1,845.8
|
|
3,163.6
|
|
|||||||
|
North America Fund XI
|
9/2012
|
9/2018
|
8,718.4
|
|
3,704.0
|
|
2.9%
|
5,932.1
|
|
1,733.8
|
|
4,635.4
|
|
6,983.8
|
|
|||||||
|
China Growth Fund
|
11/2010
|
11/2016
|
1,010.0
|
|
307.6
|
|
1.0%
|
702.4
|
|
283.4
|
|
544.4
|
|
713.4
|
|
|||||||
|
E2 Investors (Annex Fund)
|
8/2009
|
11/2013
|
195.8
|
|
—
|
|
4.9%
|
195.8
|
|
195.7
|
|
18.1
|
|
10.3
|
|
|||||||
|
European Fund III
|
3/2008
|
3/2014
|
6,121.8
|
|
812.1
|
|
4.6%
|
5,309.7
|
|
4,447.2
|
|
3,224.2
|
|
4,240.2
|
|
|||||||
|
Asian Fund
|
7/2007
|
4/2013
|
3,983.3
|
|
129.5
|
|
2.5%
|
3,853.8
|
|
5,397.4
|
|
1,918.7
|
|
2,534.0
|
|
|||||||
|
2006 Fund
|
9/2006
|
9/2012
|
17,642.2
|
|
525.6
|
|
2.1%
|
17,116.6
|
|
18,411.5
|
|
7,703.3
|
|
13,028.5
|
|
|||||||
|
European Fund II
|
11/2005
|
10/2008
|
5,750.8
|
|
—
|
|
2.1%
|
5,750.8
|
|
6,611.1
|
|
825.0
|
|
2,003.2
|
|
|||||||
|
Millennium Fund
|
12/2002
|
12/2008
|
6,000.0
|
|
—
|
|
2.5%
|
6,000.0
|
|
12,517.4
|
|
714.0
|
|
1,521.1
|
|
|||||||
|
European Fund
|
12/1999
|
12/2005
|
3,085.4
|
|
—
|
|
3.2%
|
3,085.4
|
|
8,748.0
|
|
—
|
|
17.1
|
|
|||||||
|
Total Private Equity Funds
|
|
|
61,800.7
|
|
12,765.2
|
|
|
50,707.2
|
|
59,099.4
|
|
21,589.8
|
|
34,400.9
|
|
|||||||
|
Co-Investment Vehicles
|
Various
|
Various
|
5,774.0
|
|
2,709.6
|
|
Various
|
3,137.4
|
|
2,511.0
|
|
2,118.0
|
|
2,865.8
|
|
|||||||
|
Total Private Equity
|
|
|
67,574.7
|
|
15,474.8
|
|
|
53,844.6
|
|
61,610.4
|
|
23,707.8
|
|
37,266.7
|
|
|||||||
|
Real Assets
|
|
|
|
|
|
|
|
|
|
|
|
|
|
|
|
|||||||
|
Energy Income and Growth Fund
|
9/2013
|
9/2018
|
1,974.2
|
|
1,142.6
|
|
12.8%
|
831.6
|
|
143.9
|
|
757.1
|
|
544.3
|
|
|||||||
|
Natural Resources Fund
|
Various
|
Various
|
887.4
|
|
2.9
|
|
Various
|
884.5
|
|
96.6
|
|
809.9
|
|
200.1
|
|
|||||||
|
Global Energy Opportunities
|
Various
|
Various
|
1,026.4
|
|
808.7
|
|
Various
|
252.7
|
|
55.0
|
|
144.8
|
|
124.7
|
|
|||||||
|
Global Infrastructure Investors
|
9/2011
|
10/2014
|
1,039.9
|
|
100.9
|
|
4.8%
|
967.0
|
|
216.4
|
|
847.8
|
|
972.7
|
|
|||||||
|
Global Infrastructure Investors II
|
10/2014
|
10/2020
|
3,028.3
|
|
2,685.7
|
|
4.1%
|
346.5
|
|
8.9
|
|
338.9
|
|
354.0
|
|
|||||||
|
Infrastructure Co-Investments
|
Various
|
Various
|
1,125.0
|
|
—
|
|
Various
|
1,125.0
|
|
377.9
|
|
1,124.4
|
|
1,520.1
|
|
|||||||
|
Real Estate Partners Americas
|
5/2013
|
12/2016
|
1,229.1
|
|
598.2
|
|
16.3%
|
777.5
|
|
314.5
|
|
630.5
|
|
740.7
|
|
|||||||
|
Real Estate Partners Europe
|
9/2015
|
(4)
|
591.3
|
|
591.3
|
|
10.9%
|
—
|
|
—
|
|
—
|
|
—
|
|
|||||||
|
Real Assets
|
|
|
10,901.6
|
|
5,930.3
|
|
|
5,184.8
|
|
1,213.2
|
|
4,653.4
|
|
4,456.6
|
|
|||||||
|
Unallocated Commitments
|
1,361.2
|
|
1,361.2
|
|
Various
|
—
|
|
—
|
|
—
|
|
—
|
|
|||||||||
|
Private Markets Total
|
|
|
$
|
79,837.5
|
|
$
|
22,766.3
|
|
|
$
|
59,029.4
|
|
$
|
62,823.6
|
|
$
|
28,361.2
|
|
$
|
41,723.3
|
|
|
|
(1)
|
The commencement date represents the date on which the general partner of the applicable fund commenced investment of the fund’s capital or the date of the first closing. The end date represents the earlier of (i) the date on which the general partner of the applicable fund was or will be required by the fund’s governing agreement to cease making investments on behalf of the fund, unless extended by a vote of the fund investors or (ii) the date on which the last investment was made.
|
|
(2)
|
The commitment represents the aggregate capital commitments to the fund, including capital commitments by third-party fund investors and the general partner. Foreign currency commitments have been converted into U.S. dollars based on (i) the foreign exchange rate at the date of purchase for each investment and (ii) the exchange rate that prevailed on
December 31, 2015
, in the case of uncalled commitments.
|
|
(3)
|
The remaining cost represents the initial investment of the general partner and limited partners, with the limited partners’ investment reduced for any return of capital and realized gains from which the general partner did not receive a carried interest.
|
|
(4)
|
Four years from final close.
|
7
Performance
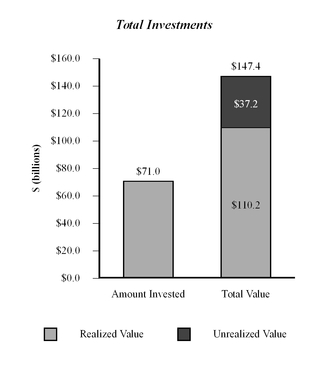
We take a long‑term approach to Private Markets investing and measure the success of our investments over a period of years rather than months. Given the duration of these investments, the firm focuses on realized multiples of invested capital and IRRs when deploying capital in these transactions. We have more than doubled the value of capital that we have invested in our Private Markets investment funds, turning
$71.0 billion
of capital into
$147.4 billion
of value from our inception in 1976 to
December 31, 2015
. Over this same period, the value of capital that we have invested in our Private Markets investment funds and that has been realized and partially realized has grown from
$51.1 billion
to
$126.5 billion
.
Amount Invested and Total Value for
Private Markets Investment Funds
As of
December 31, 2015

From our inception in 1976 through
December 31, 2015
, our investment funds with at least 36 months of investment activity generated a cumulative gross IRR of 25.6%, compared to the 11.7% and 8.7% gross IRR achieved by the S&P 500 Index and MSCI World Index, respectively, over the same period, despite the cyclical and sometimes challenging environments in which we have operated. The S&P 500 Index and MSCI World Index are unmanaged indices and such returns assume reinvestment of distributions and do not reflect any fees or expenses. Our past performance, however, may not be representative of performance in any given period. For example, as of March 31, 2009, the date of the lowest aggregate valuation of our private equity funds during the most recent downturn, the investments in certain of our private equity funds at the time were marked down to 67% of original cost. For additional information regarding impact of market conditions on the value and performance of our investments, see “Risk Factors-Risks Related to Our Business-Difficult market conditions can adversely affect our business in many ways, including by reducing the value or performance of the investments that we manage or by reducing the ability of our funds to raise or deploy capital, each of which could negatively impact our net income and cash flow and adversely affect our financial condition.” and “-Risks Related to the Assets We Manage-The historical returns attributable to our funds, including those presented in this report, should not be considered as indicative of the future results of our funds or of our future results or of any returns on our common units.”
The tables below present information as of
December 31, 2015
relating to the historical performance of certain of our Private Markets investment vehicles since inception, which we believe illustrates the benefits of our investment approach. The information presented under Total Investments includes all of the investments made by the specified investment vehicle, while the information presented under Realized/Partially Realized Investments includes only those investments that have been disposed of or have otherwise generated disposition proceeds or current income including dividends that has been distributed
8
by the relevant fund. This data does not reflect additional capital raised since
December 31, 2015
or acquisitions or disposals of investments, changes in investment values or distributions occurring after that date. Past performance is no guarantee of future results.
|
|
Amount
|
Fair Value of Investments
|
|
|
|
||||||||||||||||||||
|
Private Markets Investment Funds
|
Commitment
|
Invested (5)
|
Realized (5)
|
Unrealized
|
Total Value
|
Gross
IRR (5)
|
Net IRR (5)
|
Multiple of Invested
Capital (5)
|
|||||||||||||||||
|
($ in millions)
|
|
||||||||||||||||||||||||
|
Total Investments
|
|
|
|
|
|
|
|
|
|
|
|
|
|
|
|
|
|||||||||
|
Legacy Funds (1)
|
|
|
|
|
|
|
|
|
|
|
|
|
|
|
|
|
|||||||||
|
1976 Fund
|
$
|
31.4
|
|
$
|
31.4
|
|
$
|
537.2
|
|
$
|
—
|
|
$
|
537.2
|
|
39.5
|
%
|
35.5
|
%
|
17.1
|
|
||||
|
1980 Fund
|
356.8
|
|
356.8
|
|
1,827.8
|
|
—
|
|
1,827.8
|
|
29.0
|
%
|
25.8
|
%
|
5.1
|
|
|||||||||
|
1982 Fund
|
327.6
|
|
327.6
|
|
1,290.7
|
|
—
|
|
1,290.7
|
|
48.1
|
%
|
39.2
|
%
|
3.9
|
|
|||||||||
|
1984 Fund
|
1,000.0
|
|
1,000.0
|
|
5,963.5
|
|
—
|
|
5,963.5
|
|
34.5
|
%
|
28.9
|
%
|
6.0
|
|
|||||||||
|
1986 Fund
|
671.8
|
|
671.8
|
|
9,080.7
|
|
—
|
|
9,080.7
|
|
34.4
|
%
|
28.9
|
%
|
13.5
|
|
|||||||||
|
1987 Fund
|
6,129.6
|
|
6,129.6
|
|
14,949.2
|
|
—
|
|
14,949.2
|
|
12.1
|
%
|
8.9
|
%
|
2.4
|
|
|||||||||
|
1993 Fund
|
1,945.7
|
|
1,945.7
|
|
4,143.3
|
|
—
|
|
4,143.3
|
|
23.6
|
%
|
16.8
|
%
|
2.1
|
|
|||||||||
|
1996 Fund
|
6,011.6
|
|
6,011.6
|
|
12,476.9
|
|
—
|
|
12,476.9
|
|
18.0
|
%
|
13.3
|
%
|
2.1
|
|
|||||||||
|
Subtotal - Legacy Funds
|
16,474.5
|
|
16,474.5
|
|
50,269.3
|
|
—
|
|
50,269.3
|
|
26.1
|
%
|
19.9
|
%
|
3.1
|
|
|||||||||
|
Included Funds
|
|
|
|
|
|
|
|
|
|
|
|
|
|
|
|
|
|||||||||
|
European Fund (1999) (2)
|
3,085.4
|
|
3,085.4
|
|
8,748.0
|
|
17.1
|
|
8,765.1
|
|
26.9
|
%
|
20.2
|
%
|
2.8
|
|
|||||||||
|
Millennium Fund (2002)
|
6,000.0
|
|
6,000.0
|
|
12,517.4
|
|
1,521.1
|
|
14,038.5
|
|
22.2
|
%
|
16.3
|
%
|
2.3
|
|
|||||||||
|
European Fund II (2005) (2)
|
5,750.8
|
|
5,750.8
|
|
6,611.1
|
|
2,003.2
|
|
8,614.3
|
|
6.4
|
%
|
4.7
|
%
|
1.5
|
|
|||||||||
|
2006 Fund (2006)
|
17,642.2
|
|
17,116.6
|
|
18,411.5
|
|
13,028.5
|
|
31,440.0
|
|
11.6
|
%
|
8.9
|
%
|
1.8
|
|
|||||||||
|
Asian Fund (2007)
|
3,983.3
|
|
3,853.8
|
|
5,397.4
|
|
2,534.0
|
|
7,931.4
|
|
18.7
|
%
|
13.5
|
%
|
2.1
|
|
|||||||||
|
European Fund III (2008) (2)
|
6,121.8
|
|
5,309.7
|
|
4,447.2
|
|
4,240.2
|
|
8,687.4
|
|
15.2
|
%
|
9.6
|
%
|
1.6
|
|
|||||||||
|
E2 Investors (Annex Fund) (2009) (2)
|
195.8
|
|
195.8
|
|
195.7
|
|
10.3
|
|
206.0
|
|
1.5
|
%
|
1.1
|
%
|
1.1
|
|
|||||||||
|
China Growth Fund (2010)
|
1,010.0
|
|
702.4
|
|
283.4
|
|
713.4
|
|
996.8
|
|
15.1
|
%
|
8.0
|
%
|
1.4
|
|
|||||||||
|
Natural Resources Fund (2010)
|
887.4
|
|
884.5
|
|
96.6
|
|
200.1
|
|
296.7
|
|
(45.8
|
)%
|
(48.5
|
)%
|
0.3
|
|
|||||||||
|
Global Infrastructure Investors (2011) (2)
|
1,039.9
|
|
967.0
|
|
216.4
|
|
972.7
|
|
1,189.1
|
|
9.1
|
%
|
7.6
|
%
|
1.2
|
|
|||||||||
|
North America Fund XI (2012)
|
8,718.4
|
|
5,932.1
|
|
1,733.8
|
|
6,983.8
|
|
8,717.6
|
|
26.4
|
%
|
19.5
|
%
|
1.5
|
|
|||||||||
|
Asian Fund II (2013) (3)
|
5,825.0
|
|
2,599.7
|
|
753.9
|
|
3,163.6
|
|
3,917.5
|
|
N/A
|
|
N/A
|
|
N/A
|
|
|||||||||
|
Real Estate Partners Americas (2013) (3)
|
1,229.1
|
|
777.5
|
|
314.5
|
|
740.7
|
|
1,055.2
|
|
N/A
|
|
N/A
|
|
N/A
|
|
|||||||||
|
Energy Income and Growth Fund (2013) (3)
|
1,974.2
|
|
831.6
|
|
143.9
|
|
544.3
|
|
688.2
|
|
N/A
|
|
N/A
|
|
N/A
|
|
|||||||||
|
Global Infrastructure Investors II (2014) (2) (3)
|
3,028.3
|
|
346.5
|
|
8.9
|
|
354.0
|
|
362.9
|
|
N/A
|
|
N/A
|
|
N/A
|
|
|||||||||
|
European Fund IV (2015) (2) (3)
|
3,468.0
|
|
160.9
|
|
—
|
|
185.7
|
|
185.7
|
|
N/A
|
|
N/A
|
|
N/A
|
|
|||||||||
|
Real Estate Partners Europe (2015) (2) (3)
|
591.3
|
|
—
|
|
—
|
|
—
|
|
—
|
|
N/A
|
|
N/A
|
|
N/A
|
|
|||||||||
|
Subtotal - Included Funds
|
70,550.9
|
|
54,514.3
|
|
59,879.7
|
|
37,212.7
|
|
97,092.4
|
|
15.4
|
%
|
11.1
|
%
|
1.8
|
|
|||||||||
|
All Funds
|
$
|
87,025.4
|
|
$
|
70,988.8
|
|
$
|
110,149.0
|
|
$
|
37,212.7
|
|
$
|
147,361.7
|
|
25.6
|
%
|
18.9
|
%
|
2.1
|
|
||||
9
|
|
Amount
|
Fair Value of Investments
|
|
|
|
||||||||||||||||||||
|
Private Markets Investment Funds
|
Commitment
|
Invested (5)
|
Realized (5)
|
Unrealized
|
Total Value
|
Gross
IRR (5) |
Net IRR (5)
|
Multiple of Invested
Capital (5) |
|||||||||||||||||
|
($ in millions)
|
|
||||||||||||||||||||||||
|
Realized/Partially Realized Investments (4)
|
|
|
|
|
|
|
|
|
|
|
|
|
|
|
|
|
|||||||||
|
Legacy Funds (1)
|
|
|
|
|
|
|
|
|
|
|
|
|
|
|
|
|
|||||||||
|
1976 Fund
|
$
|
31.4
|
|
$
|
31.4
|
|
$
|
537.2
|
|
$
|
—
|
|
$
|
537.2
|
|
39.5
|
%
|
35.5
|
%
|
17.1
|
|
||||
|
1980 Fund
|
356.8
|
|
356.8
|
|
1,827.8
|
|
—
|
|
1,827.8
|
|
29.0
|
%
|
25.8
|
%
|
5.1
|
|
|||||||||
|
1982 Fund
|
327.6
|
|
327.6
|
|
1,290.7
|
|
—
|
|
1,290.7
|
|
48.1
|
%
|
39.2
|
%
|
3.9
|
|
|||||||||
|
1984 Fund
|
1,000.0
|
|
1,000.0
|
|
5,963.5
|
|
—
|
|
5,963.5
|
|
34.5
|
%
|
28.9
|
%
|
6.0
|
|
|||||||||
|
1986 Fund
|
671.8
|
|
671.8
|
|
9,080.7
|
|
—
|
|
9,080.7
|
|
34.4
|
%
|
28.9
|
%
|
13.5
|
|
|||||||||
|
1987 Fund
|
6,129.6
|
|
6,129.6
|
|
14,949.2
|
|
—
|
|
14,949.2
|
|
12.1
|
%
|
8.9
|
%
|
2.4
|
|
|||||||||
|
1993 Fund
|
1,945.7
|
|
1,945.7
|
|
4,143.3
|
|
—
|
|
4,143.3
|
|
23.6
|
%
|
16.8
|
%
|
2.1
|
|
|||||||||
|
1996 Fund
|
6,011.6
|
|
6,011.6
|
|
12,476.9
|
|
—
|
|
12,476.9
|
|
18.0
|
%
|
13.3
|
%
|
2.1
|
|
|||||||||
|
Subtotal - Legacy Funds
|
16,474.5
|
|
16,474.5
|
|
50,269.3
|
|
—
|
|
50,269.3
|
|
26.1
|
%
|
19.9
|
%
|
3.1
|
|
|||||||||
|
Included Funds
|
|
|
|
|
|
|
|
|
|
|
|
|
|
|
|
|
|||||||||
|
European Fund (1999) (2)
|
3,085.4
|
|
3,085.4
|
|
8,748.0
|
|
17.1
|
|
8,765.1
|
|
26.9
|
%
|
20.2
|
%
|
2.8
|
|
|||||||||
|
Millennium Fund (2002)
|
6,000.0
|
|
5,599.4
|
|
12,517.4
|
|
1,402.2
|
|
13,919.6
|
|
25.0
|
%
|
19.4
|
%
|
2.5
|
|
|||||||||
|
European Fund II (2005) (2)
|
5,750.8
|
|
5,245.4
|
|
6,611.1
|
|
2,001.6
|
|
8,612.7
|
|
7.8
|
%
|
6.7
|
%
|
1.6
|
|
|||||||||
|
2006 Fund (2006)
|
17,642.2
|
|
10,867.0
|
|
18,411.5
|
|
7,208.4
|
|
25,619.9
|
|
17.1
|
%
|
14.8
|
%
|
2.4
|
|
|||||||||
|
Asian Fund (2007)
|
3,983.3
|
|
2,953.6
|
|
5,397.4
|
|
1,791.2
|
|
7,188.6
|
|
22.3
|
%
|
19.1
|
%
|
2.4
|
|
|||||||||
|
European Fund III (2008) (2)
|
6,121.8
|
|
2,694.3
|
|
4,447.2
|
|
1,324.9
|
|
5,772.1
|
|
22.0
|
%
|
18.6
|
%
|
2.1
|
|
|||||||||
|
E2 Investors (Annex Fund) (2009) (2)
|
195.8
|
|
94.8
|
|
195.7
|
|
—
|
|
195.7
|
|
19.8
|
%
|
19.8
|
%
|
2.1
|
|
|||||||||
|
China Growth Fund (2010)
|
1,010.0
|
|
371.3
|
|
283.4
|
|
377.0
|
|
660.4
|
|
20.3
|
%
|
18.1
|
%
|
1.8
|
|
|||||||||
|
Natural Resources Fund (2010)
|
887.4
|
|
884.6
|
|
96.6
|
|
200.1
|
|
296.7
|
|
(45.8
|
)%
|
(48.5
|
)%
|
0.3
|
|
|||||||||
|
Global Infrastructure Investors (2011) (2)
|
1,039.9
|
|
765.1
|
|
216.3
|
|
711.5
|
|
927.8
|
|
7.8
|
%
|
7.8
|
%
|
1.2
|
|
|||||||||
|
North America Fund XI (2012)
|
8,718.4
|
|
2,074.9
|
|
1,733.9
|
|
2,551.7
|
|
4,285.6
|
|
49.6
|
%
|
48.7
|
%
|
2.1
|
|
|||||||||
|
Asian Fund II (2013) (4)
|
5,825.0
|
|
—
|
|
—
|
|
—
|
|
—
|
|
—
|
|
—
|
|
—
|
|
|||||||||
|
Real Estate Partners Americas (2013) (4)
|
1,229.1
|
|
—
|
|
—
|
|
—
|
|
—
|
|
—
|
|
—
|
|
—
|
|
|||||||||
|
Energy Income and Growth Fund (2013) (4)
|
1,974.2
|
|
—
|
|
—
|
|
—
|
|
—
|
|
—
|
|
—
|
|
—
|
|
|||||||||
|
Global Infrastructure Investors II (2014) (2) (4)
|
3,028.3
|
|
—
|
|
—
|
|
—
|
|
—
|
|
—
|
|
—
|
|
—
|
|
|||||||||
|
European Fund IV (2015) (2) (4)
|
3,468.0
|
|
—
|
|
—
|
|
—
|
|
—
|
|
—
|
|
—
|
|
—
|
|
|||||||||
|
Real Estate Partners Europe (2015) (2) (4)
|
591.3
|
|
—
|
|
—
|
|
—
|
|
—
|
|
—
|
|
—
|
|
—
|
|
|||||||||
|
Subtotal - Included Funds
|
70,550.9
|
|
34,635.8
|
|
58,658.5
|
|
17,585.7
|
|
76,244.2
|
|
19.4
|
%
|
16.1
|
%
|
2.2
|
|
|||||||||
|
All Realized/Partially Realized Investments
|
$
|
87,025.4
|
|
$
|
51,110.3
|
|
$
|
108,927.8
|
|
$
|
17,585.7
|
|
$
|
126,513.5
|
|
25.8
|
%
|
20.8
|
%
|
2.5
|
|
||||
(1)
These funds were not contributed to KKR as part of the KPE Transaction.
|
(2)
|
The capital commitments of the European Fund, European Fund II, European Fund III, E2 Investors (Annex Fund), European Fund IV, Global Infrastructure Investors, Global Infrastructure Investors II and Real Estate Partners Europe include euro-denominated commitments of €196.5 million, €2,597.5 million, €2,882.8 million, €55.5 million, €1,626.1 million, €30.0 million, €243.8 million and €275.6 million, respectively. Such amounts have been converted into U.S. dollars based on (i) the foreign exchange rate at the date of purchase for each investment and (ii) the exchange rate prevailing on
December 31, 2015
in the case of unfunded commitments.
|
|
(3)
|
The gross IRR, net IRR and multiple of invested capital are calculated for our investment funds that have invested for at least 36 months prior to December 31, 2015. None of the Asian Fund II, Real Estate Partners Americas, Energy Income and Growth Fund, Global Infrastructure Investors II, European Fund IV or Real Estate Partners Europe have invested for at least 36 months as of
December 31, 2015
. We therefore have not calculated gross IRRs, net IRRs and multiples of invested capital with respect to those funds.
|
|
(4)
|
An investment is considered partially realized when it has been disposed of or has otherwise generated disposition proceeds or current income that has been distributed by the relevant fund. In periods prior to the three months ended September 30, 2015, realized proceeds excluded current income such as dividends and interest. None of the Asian Fund II, Real Estate Partners Americas, Energy Income and Growth Fund, Global Infrastructure Investors II, European Fund IV or Real Estate Partners Europe have any investments that are considered partially realized. We therefore have not calculated gross IRRs, net IRRs and multiples of invested capital with respect to the investments of those funds.
|
|
(5)
|
IRRs measure the aggregate annual compounded returns generated by a fund’s investments over a holding period. Net IRRs presented under Total Investments are calculated after giving effect to the allocation of realized and unrealized carried interest and the payment of any applicable management fees. Net IRRs presented under Realized/Partially Realized Investments are calculated after giving effect to the allocation of realized and unrealized carried interest, but before payment of any applicable management fees as management fees are applied to funds, not investments. Gross IRRs are calculated before giving effect to the allocation of carried interest and the payment of any applicable management fees.
|
The multiples of invested capital measure the aggregate value generated by a fund’s investments in absolute terms. Each multiple of invested capital is calculated by adding together the total realized and unrealized values of a fund’s investments and dividing by the total amount of capital invested by the fund. Such amounts do not give effect to the allocation of any realized and unrealized returns on a fund’s investments to the fund’s general partner pursuant to a carried interest or the payment of any applicable management fees.
KKR Private Markets funds may utilize third party financing facilities to provide liquidity to such funds. In such event IRRs are calculated from the time capital contributions are due from fund investors to the time fund investors receive a related distribution from the fund, and the use of such financing
10
facilities generally decreases the amount of invested capital that would otherwise be used to calculate IRRs and multiples of invested capital, which tends to increase IRRs and multiples when fair value grows over time and decrease IRRs and multiples when fair value decreases over time. KKR Private Markets funds also generally provide in certain circumstances, which vary depending on the relevant fund documents, for a portion of capital returned to investors to be restored to unused commitments as recycled capital. For KKR's Private Markets funds that have a preferred return, we take into account recycled capital in the calculation of IRRs and multiples of invested capital because the calculation of the preferred return includes the effect of recycled capital. For KKR's Private Markets funds that do not have a preferred return, we do not take recycled capital into account in the calculation of IRRs and multiples of invested capital. The inclusion of recycled capital generally causes invested and realized amounts to be higher and IRRs and multiples of invested capital to be lower than had recycled capital not been included. The inclusion of recycled capital would reduce the composite net IRR of all Included Funds by 0.1% and the composite net IRR of all Legacy Funds by 0.5%, and would reduce the composite multiple of invested capital of Included Funds by less than 0.1 and the composite multiple of invested capital of Legacy Funds by 0.4.
For more information, see “Risk Factors-Risks Related to the Assets We Manage-The historical returns attributable to our funds, including those presented in this report, should not be considered as indicative of the future results of our funds or of our future results or of any returns on our common units.”
Private Equity
We are a world leader in private equity, having raised 19 funds with approximately $78.3 billion of capital commitments through
December 31, 2015
. We invest in industry‑leading franchises and attract world‑class management teams. Our investment approach leverages our capital base, sourcing advantage, global network and industry knowledge. It also leverages a sizeable team of operating consultants, who work exclusively with our investment professionals and portfolio company management teams and otherwise at our direction, as well as senior advisors, many of whom are former chief executive officers and leaders of the business community.
Portfolio
The following chart presents information concerning the amount of capital invested by private equity funds by geography through
December 31, 2015
. We believe that this data illustrates the benefits of our business approach and our ability to source and invest in deals in multiple geographies.

Our current private equity portfolio consists of over 108 companies with approximately $200 billion of annual revenues. These companies are headquartered in 21 countries and operate in 19 general industries which take advantage of our broad and deep industry and operating expertise. Many of these companies are leading franchises with global operations, strong management teams and attractive growth prospects, which we believe will provide benefits through a broad range of business conditions.
11
Investment Approach
Our approach to making private equity investments focuses on achieving multiples of invested capital and attractive risk‑adjusted IRRs by selecting high‑ quality investments that may be made at attractive prices, applying rigorous standards of due diligence when making investment decisions, implementing strategic and operational changes that drive growth and value creation in acquired businesses, carefully monitoring investments, and making informed decisions when developing investment exit strategies.
We believe that we have achieved a leading position in the private equity industry by applying a disciplined investment approach and by building strong partnerships with highly motivated management teams who put their own capital at risk. When making private equity investments, we seek out strong business franchises, attractive growth prospects, leading market positions, and the ability to generate attractive returns. In our private equity funds, we do not effect transactions that are “hostile”, meaning a target company’s board of directors makes an unfavorable recommendation with respect to the transaction or publicly opposes the consummation of the transaction.
Sourcing and Selecting Investments
We have access to significant opportunities for making private equity investments as a result of our sizeable capital base, global platform, and relationships with leading executives from major companies, commercial and investment banks, and other investment and advisory institutions. Members of our global network contact us with new investment opportunities, including a substantial number of exclusive investment opportunities and opportunities that are made available to only a limited number of other firms. We also proactively pursue business development strategies that are designed to generate deals internally based on the depth of our industry knowledge and our reputation as a leading financial sponsor.
To enhance our ability to identify and consummate private equity investments, we have organized our investment professionals in industry‑specific teams. Our industry teams work closely with our operating consultants and other advisors to identify businesses that can be grown and improved. These teams conduct their own primary research, develop a list of industry themes and trends, identify companies and assets in need of operational improvement, and seek out businesses and assets that they believe will benefit from our involvement. They possess a detailed understanding of the economic drivers, opportunities for value creation, and strategies that can be designed and implemented to improve companies across the industries in which we invest.
Due Diligence and the Investment Decision
When an investment team determines that an investment proposal is worth consideration, the proposal is formally presented to the applicable regional investment committee and the due diligence process commences if appropriate. The objective of the due diligence process is to identify attractive investment opportunities based on the facts and circumstances surrounding an investment and to prepare a framework that may be used from the date of an acquisition to drive operational improvement and value creation. When conducting due diligence, investment teams evaluate a number of important business, financial, tax, accounting, environmental, social, governance, legal and regulatory issues in order to determine whether an investment is suitable. While the due diligence process differs depending on the type of investment we make, generally, in connection with the private equity due diligence process, investment professionals spend significant amounts of time meeting with a company’s management and operating personnel, visiting plants and facilities, and where appropriate, speaking with other stakeholders interested in and impacted by the investment in order to understand the opportunities and risks associated with the proposed investment. Our investment professionals may also use the services of outside accountants, consultants, lawyers, investment banks, and industry experts as appropriate to assist them in this process. Investment committees monitor all due diligence practices, and the applicable investment committee must approve an investment before it may be made.
Building Successful and Competitive Businesses
Portfolio management committees are responsible for working with our investment professionals from the date on which a private equity investment is made until the time it is exited in order to ensure that strategic and operational objectives are accomplished and that the performance of the investment is closely monitored. When investing in a private equity portfolio company, we partner with management teams to execute on our investment thesis, and we rigorously track performance through regular monitoring of detailed operational and financial metrics as well as appropriate environmental, social and governance issues. We have developed a global network of experienced managers and operating executives who assist the private equity portfolio companies in making operational improvements and achieving growth. We augment these resources with operational guidance from operating consultants at KKR Capstone, senior advisors, and investment teams, and with “100‑Day Plans” that focus the firm’s efforts and drive our strategies. We seek to emphasize efficient capital management, top‑line growth, R&D spending, geographical expansion, cost optimization, and investment for the long‑term.
12
Realizing Investments
We have developed substantial expertise for realizing private equity investments. From our inception through
December 31, 2015
, the firm has generated approximately $110.2 billion of cash proceeds from the sale of our private equity portfolio companies in initial public offerings and secondary offerings, dividends, and sales to strategic buyers. When exiting private equity investments, our objective is to structure the exit in a manner that optimizes returns for fund investors and, in the case of publicly traded companies, minimizes the impact that the exit has on the trading price of the company’s securities. We believe that our ability to successfully realize investments is attributable in part to the strength and discipline of our portfolio management committees and capital markets business, as well as the firm’s longstanding relationships with corporate buyers and members of the investment banking and investing communities.
Private Equity Fund Structures
The private equity funds that we sponsor and manage have finite lives and investment periods. Each fund is organized as one or more partnerships, and each partnership is controlled by a general partner. Private equity fund investors are limited partners who agree to contribute a specified amount of capital to the fund from time to time for use in qualifying investments during the investment period, which generally lasts up to six years depending on how quickly capital is deployed. The investment period for certain funds may be terminated upon supermajority vote (based on capital commitment) of the fund’s limited partners or by the fund’s advisory committee. The term of our private equity funds generally last for 10 to 12 years and may last up to 15 years from the date of the fund’s first or last investment, subject to a limited number of extensions with the consent of the limited partners or the applicable advisory committee. Given the length of the investment periods and terms of our private equity funds and the limited conditions under which such periods can be terminated and commitments may be withdrawn, the AUM of our private equity funds provide a long‑term stable capital base.
Each private equity fund’s general partner is generally entitled to a carried interest that allocates to it 20% of the net profits realized by the limited partners from the fund’s investments. Our newer private equity funds, the North America Fund XI, Asian Fund II and European Fund IV have a performance hurdle which requires that we return 7%, compounded annually, to limited partners in the fund prior to receiving our 20% share of net profits realized by limited partners. Such performance hurdles are subject to a catch‑up allocation to the general partner after the hurdle has been reached. Our earlier private equity funds do not include a performance hurdle. The timing of receipt of carried interest in respect of investments of our carry funds is dictated by the terms of the partnership agreements that govern such funds, and is distributed to the general partner of a private equity fund only after all of the following are met: (i) a realization event has occurred (e.g., sale of a portfolio company, dividend, etc.); (ii) the vehicle has achieved positive overall investment returns since its inception, in excess of performance hurdles where applicable; and (iii) with respect to investments with a fair value below cost, cost has been returned to fund investors in an amount sufficient to reduce remaining cost to the investments’ fair value. For a fund that has a fair value above cost, overall, but has one or more investments where fair value is below cost, the shortfall between cost and fair value for such investments is referred to as a “netting hole.” See “Management’s Discussion and Analysis of Financial Condition and Results of Operations-Liquidity-Sources of Liquidity” for a discussion of netting holes. Net realized profit or loss is not netted between or among funds except for the Annex Fund as discussed below under “-Other Private Equity Investment Vehicles-E2 Investors (Annex Fund)”. In addition, the agreements governing KKR’s private equity funds generally include a “clawback” or, in certain instances, a “net loss sharing” provision that, if triggered, may give rise to a contingent obligation that may require the general partner to return or contribute amounts to the fund for distribution to fund investors at the end of the life of the fund. Our newer private equity funds do not have a net loss sharing provision. See “Management’s Discussion and Analysis of Financial Condition and Results of Operations-Critical Accounting Policies-Clawback Provision”, “Management’s Discussion and Analysis of Financial Condition-Critical Accounting Policies-Net Loss Sharing Provision” and “Risk Factors-The “clawback” or “net loss sharing” provisions in our governing agreements may give rise to a contingent obligation that may require us to return or contribute amounts to our funds and fund investors.”
We enter into management agreements with our private equity funds pursuant to which we receive management fees in exchange for providing the funds with management and other services. Gross management fees for our private equity funds generally range from 1% to 2% of committed capital during the fund’s investment period and is generally 0.75% to 1.25% of invested capital after the expiration of the fund’s investment period with subsequent reductions over time, which causes the fees to be reduced as investments are liquidated. These management fees are paid by private equity fund investors, who generally contribute capital to the fund in order to allow the fund to pay the fees to us. Our private equity funds generally require that management fees be returned to fund investors before a carried interest may be paid.
We also enter into monitoring agreements with our portfolio companies pursuant to which we receive periodic monitoring fees in exchange for providing them with management, consulting, and other services, and we typically receive transaction fees for providing portfolio companies with financial, advisory and other services in connection with specific transactions. Monitoring fees may provide for a termination payment following an initial public offering or change of control. In some cases,
13
we may be entitled to other fees that are paid by an investment target upon closing a transaction or when a potential investment is not consummated. Our private equity fund agreements typically require us to share 80% to 100% of any monitoring, transaction and other fees that are allocable to a fund (after reduction for expenses incurred allocable to a fund from unconsummated transactions) with fund investors.
In addition, the agreements governing our private equity funds enable investors in those funds to reduce their capital commitments available for further investments, on an investor‑by‑investor basis, in the event certain “key persons” (for example, both of Messrs. Kravis and Roberts, and, in the case of certain geographically or product focused funds, one or more of the investment professionals focused on such funds) cease to be actively involved in the management of the fund. While these provisions do not allow investors in our funds to withdraw capital that has been invested or cause a fund to terminate, the occurrence of a “key man” event could cause disruption in our business, reduce the amount of capital that we have available for future investments, and make it more challenging to raise additional capital in the future.
Because private equity fund investors typically are unwilling to invest their capital in a fund unless the fund’s manager also invests its own capital in the fund’s investments, our private equity fund documents generally require the general partners of the funds to make minimum capital commitments to the funds. The amounts of these commitments, which are negotiated by fund investors, generally range from 2% to 5% of a fund’s total capital commitments at final closing, but may be greater for certain funds pursuing newer strategies. When investments are made, the general partner contributes capital to the fund based on its fund commitment percentage and acquires a capital interest in the investment that is not subject to a carried interest or management fees.
Other Private Equity Investment Vehicles
E2 Investors (Annex Fund).
We established the Annex Fund in 2009 to enable fund investors in the European Fund II and the Millennium Fund to make additional investments in portfolio companies of the European Fund II, which had already been fully invested. This fund has several features that distinguish it from our other private equity funds, including: (i) it does not pay a management fee to us; (ii) its general partner is only entitled to a carried interest after netting any losses, costs, and expenses relating to European Fund II and certain Millennium Fund investments from the profits of the Annex Fund investments; and (iii) no transaction or incremental monitoring fees are charged in connection with investments in which the Annex Fund participates. The Annex Fund reached the end of its investment period in November 2013.
Other Private Equity Products.
We have offered significant co‑investment opportunities to both fund investors and other third parties. We have built out our capital markets and distribution capabilities and created new investment structures and products that allow us to syndicate a portion of the equity needed to finance acquisitions. These structures include co‑investment vehicles and a principal‑protected private equity product, which generally entitles the firm to receive management fees and/or a carried interest. In addition, we manage certain separately managed accounts in the form of separate investment vehicles based on terms that are separately negotiated with investors in those vehicles. We also offer multi‑strategy products, which invest in our funds, co‑investment vehicles and external funds and have launched a strategy focused on growth equity opportunities in the technology, media and telecommunications sector.
Real Assets
Energy
In 2010 we launched our first dedicated energy fund, which acquired and operated oil and natural gas properties in mature basins located primarily in the United States. In acquiring these properties, which are typically considered to be non‑core by their sellers, we sought to generate value through optimizing production , reducing operating costs, and optimizing commercial and marketing arrangements.
Since the launch of our first dedicated energy fund, we have invested in our capabilities, both with respect to our team of investment professionals and our relationships with technical partners. With these capabilities, we have expanded our energy platform to target real asset investment opportunities across the upstream and midstream segments of the oil and gas industry. As part of this effort, we have completed investments in oil and gas drilling development transactions with operating companies and have also acquired mineral and royalty interests. We invest in these energy strategies through the KKR Energy Income and Growth Fund. As of
December 31, 2015
, we have received $2.9 billion of capital commitments to our energy funds and $1.0 billion of capital commitments to this strategy through separately managed accounts.
Our energy business aims to deliver current returns to fund investors through distributions generated by producing and selling oil and natural gas reserves and capital appreciation. The goal is to provide investors with exposure to commodity prices
14
and optionality associated with future drilling and production. We work closely with external teams of technical and operational experts to assist in the selection, evaluation and operation of investments.
Infrastructure
We manage infrastructure investments and began investing through our first dedicated infrastructure fund, KKR Global Infrastructure Investors L.P., in 2011. We believe that the global infrastructure market provides an opportunity for the firm’s private investment, operational improvement capabilities and stakeholder engagement. This strategy seeks to achieve returns including current income through the acquisition and operational improvement of assets important to the functioning of the economy. Through this strategy we have made investments in parking, alternative energy, district heating and contracted electricity generation, water and wastewater, locomotive transportation, midstream and telecommunications infrastructure. As of
December 31, 2015
, we had received $4.1 billion of capital commitments to our infrastructure funds and $1.1 billion of capital commitments to this strategy through separately managed accounts and co‑investment vehicles.
Real Estate
The firm developed a dedicated real estate strategy beginning in 2011 using our own seed capital. Since launching our first dedicated real estate fund, KKR Real Estate Partners Americas, in 2013, we have expanded our real estate strategy to pursue real estate investments in Western Europe and real estate credit. In addition, we have the flexibility to invest in real estate transactions across the capital structure through various vehicles, including our private equity and alternative credit funds. We have also established investment platforms with strategic partners to invest in commercial real estate in Germany and the United States. Our real estate platform targets real estate opportunities, including direct investments in real property, debt, special situations transactions and businesses with significant real estate holdings that can benefit from KKR’s operational expertise. We seek to partner with real estate owners, lenders, operators, and developers to provide flexible capital to respond to transaction specific needs, including the outright purchase or financing of existing assets or companies and the funding of future development or acquisition opportunities. Through this strategy, we have made real estate investments in residential and commercial assets. As of
December 31, 2015
, we have received $1.8 billion of capital commitments through our real estate funds.
Real Asset Investment Process
Our energy, infrastructure and real estate funds have a similar investment process as that described under “-Private Equity.” Investment teams for a particular real asset strategy formally present investments to the applicable strategy oriented investment committee, which monitors all due diligence practices and must approve an investment before it may be made. Most of our real asset strategies also have a portfolio management committee that works with our investment professionals from the date on which an investment is made until the time it is exited in order to ensure that strategic and operational objectives are accomplished and that the performance of the investment is closely monitored. In addition to leveraging the resources of the firm, our energy and real estate investment teams partner with technical experts and operators to manage our real asset investments.
Real Asset Fund Structures
Our energy, infrastructure and real estate funds generally have investment periods of up to 6 years and generally have a fund term of up to 13 years. Management fees for such funds range from 0.75% to 1.5% on commitments, invested capital or net asset value during the investment period and on invested capital or net asset value for investments thereafter, subject to certain adjustments. These funds generally have performance hurdles of 8% to 10% subject to a catch‑up allocation to the general partner after the hurdle has been reached. Thereafter the general partners of such funds generally share in 10% to 20% of net profits realized by limited partners.
Public Markets
We operate and report our combined credit and hedge funds businesses through the Public Markets segment. Our credit business advises funds, CLOs, separately managed accounts, and investment companies registered under the Investment Company Act, including a business development company or BDC, undertakings for collective investment in transferable securities or UCITS, and alternative investments funds or AIFs, which invest capital in (i) leveraged credit strategies, such as leveraged loans, high yield bonds and opportunistic credit, and (ii) alternative credit strategies such as mezzanine investments, direct lending investments, special situations investments and long/short credit investment strategies. The funds, accounts, registered investment companies and CLOs in our leveraged credit and alternative credit strategies are managed by KKR Credit Advisors (US) LLC, which is an SEC‑registered investment adviser, KKR Credit Advisors (Ireland), regulated by the Central
15
Bank of Ireland, and KKR Credit Advisors (UK), regulated by the United Kingdom Financial Conduct Authority, or FCA. KKR Credit Advisors (Ireland) and KKR Credit Advisors (UK) (formerly known collectively as Avoca Capital) were acquired by KKR on February 19, 2014. Our Public Markets segment also includes our hedge funds business that offers a variety of investment strategies including customized hedge fund portfolios and hedge fund‑of‑fund solutions. The funds and accounts in our hedge fund business are managed by Prisma Capital Partners LP (KKR Prisma or Prisma), an SEC‑registered investment adviser. Through our Public Markets segment, we also have developed strategic partnerships by acquiring minority stakes in other hedge fund managers.
We intend to continue to grow the Public Markets business by leveraging our global investment platform, experienced investment professionals and the ability to adapt our investment strategies to different market conditions to capitalize on investment opportunities that may arise at various levels of the capital structure and across market cycles.
As of
December 31, 2015
, this segment had
$53.5 billion
of AUM, comprised of
$17.4 billion
of assets managed in our leveraged credit strategies,
$15.5 billion
of assets managed in our alternative credit strategies,
$11.0 billion
of assets managed in our hedge fund solutions strategies, $8.7 billion of assets managed in our strategic partnerships and
$0.9 billion
of assets managed in other strategies. Our alternative credit investments include
$2.0 billion
of assets managed in our mezzanine strategy,
$6.5 billion
of assets managed in our direct lending strategy,
$6.6 billion
of assets managed in our special situations strategies and
$0.4 billion
of assets managed in our long/short credit strategy. The following chart presents the growth in the AUM of our Public Markets segment from the commencement of its operations in August 2004 through
December 31, 2015
.
16
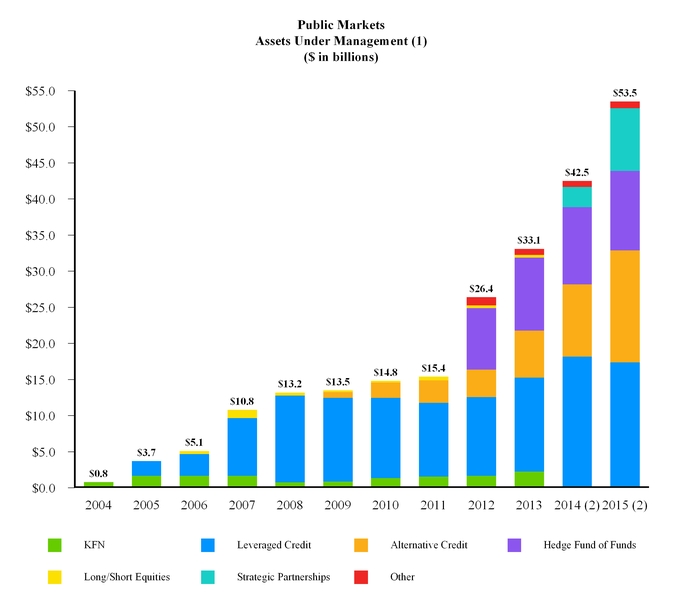
|
(1)
|
For years 2006 through 2008, assets under management are presented pro forma for the KPE Transaction and, therefore, exclude the net asset value of KPE and its former commitments to our investment funds. Assets under management of KKR Prisma and Avoca are included in the years on and after the completion of the respective acquisitions.
|
|
(2)
|
AUM as of and after December 31, 2014 has been adjusted to include (i) KKR's pro-rata portion of AUM managed by other asset managers in which KKR holds a minority stake and (ii) capital commitments for which we are eligible to receive fees or carried interest upon deployment of capital. These two items increased our AUM by approximately $5.4 billion as of December 31, 2014 but are excluded from AUM for all prior years presented.
|
Credit
Performance
We generally review our performance in our credit business by investment strategy. Our leveraged credit strategies principally invest in leveraged loans and high yield bonds, or a combination of both. In certain cases these strategies have meaningful track records and may be compared to widely‑known indices. The following table presents information regarding larger leveraged credit strategies managed by KKR from inception to
December 31, 2015
. Past performance is no guarantee of future results.
17
Leveraged Credit Strategies: Inception-to-Date Annualized Gross Performance vs. Benchmark by Strategy
|
($ in millions)
|
Inception Date
|
Gross
Returns
|
Net
Returns
|
Benchmark (1)
|
Benchmark
Gross
Returns
|
||||||||
|
Bank Loans Plus High Yield (2)
|
Jul 2008
|
8.07
|
%
|
7.41
|
%
|
65% S&P/ LSTA, 35% BoAML HY Master II Index (3)
|
5.72
|
%
|
|||||
|
Opportunistic Credit (4)
|
May 2008
|
12.18
|
%
|
10.21
|
%
|
BoAML HY Master II Index (4)
|
6.96
|
%
|
|||||
|
Bank Loans (2)
|
Apr 2011
|
4.38
|
%
|
3.76
|
%
|
S&P/ LSTA Loan Index (5)
|
3.07
|
%
|
|||||
|
High Yield (2)
|
Apr 2011
|
5.50
|
%
|
4.92
|
%
|
BoAML HY Master II Index (6)
|
4.00
|
%
|
|||||
|
Bank Loans Conservative
|
Apr 2011
|
4.24
|
%
|
3.62
|
%
|
S&P/ LSTA BB-B Loan Index (7)
|
3.30
|
%
|
|||||
|
European Leveraged Loans (8)
|
Sep 2009
|
5.88
|
%
|
5.36
|
%
|
CS Inst West European Leveraged Loan Index (9)
|
4.92
|
%
|
|||||
|
(1)
|
The Benchmarks referred to herein include the S&P/LSTA Leveraged Loan Index (the “S&P/LSTA Loan Index”), the Bank of America Merrill Lynch High Yield Master II Index (the “BoAML HY Master II Index”), the S&P European Leveraged Loan Index (the “ELLI”) and Credit Suisse Institutional Western European Leveraged Loan Index (the “CS Inst European Leveraged Loan Index”). The S&P/LSTA Loan Index is an index that comprises all loans that meet the inclusion criteria and that have marks from the LSTA/LPC mark-to-market service. The inclusion criteria consist of the following: (i) syndicated term loan instruments consisting of term loans (both amortizing and institutional), acquisition loans (after they are drawn down) and bridge loans; (ii) secured; (iii) U.S. dollar denominated; (iv) minimum term of one year at inception; and (v) minimum initial spread of LIBOR plus 1.25%. The BoAML HY Master II Index is a market value weighted index of below investment grade U.S. dollar denominated corporate bonds publicly issued in the U.S. domestic market. “Yankee” bonds (debt of foreign issuers issued in the U.S. domestic market) are included in the BoAML HY Master II Index provided that the issuer is domiciled in a country having investment grade foreign currency long-term debt rating. Qualifying bonds must have maturities of one year or more, a fixed coupon schedule and minimum outstanding of US$100 million. In addition, issuers having a credit rating lower than BBB3, but not in default, are also included. The ELLI is based upon Euro denominated facilities. The index reflects the market-weighted performance of institutional leveraged loan portfolios investing in European credits. All the index components are loans syndicated to European loan investors. The ELLI series uses real-time market weightings, spreads and interest payments. The Index was calculated monthly from January 1, 2002 to January 1, 2004; then weekly until May 2, 2013, and is currently calculated daily. The CS Inst European Leveraged Loan Index contains only institutional loan facilities priced above
90
, excluding TL and TLa facilities and loans rated CC, C or are in default. It is designed to more closely reflect the investment criteria of institutional investors. While the returns of these strategies reflect the reinvestment of income and dividends, none of the indices presented in the chart above reflect such reinvestment, which has the effect of increasing the reported relative performance of these strategies as compared to the indices. Furthermore, these indices are not subject to management fees, incentive allocations or expenses. It is not possible to invest directly in unmanaged indices.
|
|
(2)
|
The AUM of the Bank Loans Plus High Yield strategy is also included in the AUM of the High Yield strategy and the AUM of the Bank Loans strategy.
|
|
(3)
|
Performance is based on a blended composite of Bank Loans Plus High Yield strategy accounts. The Benchmark used for purposes of comparison for the Bank Loans Plus High Yield strategy is based on
65%
S&P/LSTA Loan Index and
35%
BoAML HY Master II Index.
|
|
(4)
|
The Opportunistic Credit strategy invests in high yield securities and corporate loans with no preset allocation. The Benchmark used for purposes of comparison for the Opportunistic Credit strategy presented herein is based on the BoAML HY Master II Index. Funds within this strategy may utilize third party financing facilities to provide liquidity to such funds. In cases where financing facilities are used, the amounts drawn on the facility are deducted from the assets of the fund in the calculation of net asset value, which tends to increase returns when net asset value grows over time and decrease returns when net asset value decreases over time.
|
|
(5)
|
Performance is based on a composite of portfolios that primarily invest in leveraged loans. The Benchmark used for purposes of comparison for the Bank Loans strategy is based on the S&P/LSTA Loan Index.
|
|
(6)
|
Performance is based on a composite of portfolios that primarily invest in high yield securities. The Benchmark used for purposes of comparison for the High Yield strategy is based on the BoAML HY Master II Index.
|
|
(7)
|
Performance is based on a composite of portfolios that primarily invest in leveraged loans rated B-/Baa3 or higher. The Benchmark used for purposes of comparison for the Bank Loans strategy is based on the S&P/LSTA BB/B Loan Index.
|
|
(8)
|
The AUM amounts reflected have been converted to U.S. dollars based on the exchange rate prevailing on
December 31, 2015
. The returns presented are calculated based on local currency.
|
(9) Performance is based on a composite of portfolios that primarily invest in higher quality leveraged loans. The Benchmark used for purposes of comparison for the European Senior Loans strategy is based on the CS Inst West European Leveraged Loan Index.
Our alternative credit strategies primarily invest in more illiquid instruments through private investment funds. The following table presents information regarding our Public Markets alternative credit funds where investors are subject to capital commitments from inception to
December 31, 2015
. Some of our alternative credit funds have begun investing more recently and therefore have not yet developed meaningful track records, and thus their performance is not included below. Past performance is no guarantee of future results.
18
Alternative Credit Strategies: Fund Performance
|
|
|
Amount
|
Fair Value of Investments
|
|
|
|
|||||||||||||||||||||||||
|
Public Markets
Investment Funds
|
Inception Date
|
Commitment
|
Invested*
|
Realized*
|
Unrealized
|
Total Value
|
Gross
IRR**
|
Net IRR**
|
Multiple
of Invested
Capital***
|
||||||||||||||||||||||
|
($ in Millions)
|
|
||||||||||||||||||||||||||||||
|
Special Situations Fund
|
Dec-12
|
$
|
2,257.6
|
|
$
|
2,129.6
|
|
$
|
257.6
|
|
$
|
2,205.6
|
|
$
|
2,463.2
|
|
9.6
|
%
|
7.0
|
%
|
1.2
|
|
|||||||||
|
Special Situations Fund II
|
Dec-14
|
2,675.5
|
|
592.1
|
|
—
|
|
452.4
|
|
452.4
|
|
N/A
|
|
N/A
|
|
N/A
|
|
||||||||||||||
|
Mezzanine Partners
|
Mar-10
|
1,022.8
|
|
872.2
|
|
541.0
|
|
634.3
|
|
1,175.3
|
|
13.8
|
%
|
8.4
|
%
|
1.3
|
|
||||||||||||||
|
Lending Partners
|
Dec-11
|
460.2
|
|
369.7
|
|
181.5
|
|
303.3
|
|
484.8
|
|
11.4
|
%
|
9.4
|
%
|
1.3
|
|
||||||||||||||
|
Lending Partners II
|
Jun-14
|
1,335.9
|
|
446.3
|
|
26.4
|
|
475.7
|
|
502.1
|
|
10.9
|
%
|
8.2
|
%
|
1.1
|
|
||||||||||||||
|
Lending Partners Europe
|
Mar-15
|
780.1
|
|
16.5
|
|
—
|
|
24.0
|
|
24.0
|
|
N/A
|
|
N/A
|
|
N/A
|
|
||||||||||||||
|
Revolving Credit Partners
|
May-15
|
510.0
|
|
—
|
|
—
|
|
(2.8
|
)
|
(2.8
|
)
|
N/A
|
|
N/A
|
|
N/A
|
|
||||||||||||||
|
Private Credit Opportunities Partners II
|
Dec-15
|
350.0
|
|
—
|
|
—
|
|
—
|
|
—
|
|
N/A
|
|
N/A
|
|
N/A
|
|
||||||||||||||
|
All Funds
|
|
$
|
9,392.1
|
|
$
|
4,426.4
|
|
$
|
1,006.5
|
|
$
|
4,092.5
|
|
$
|
5,099.0
|
|
|
|
|
|
1.2
|
|
|||||||||
* Recycled capital is excluded from the amounts invested and realized.
** KKR alternative credit funds may utilize third party financing facilities to provide liquidity to such funds, and in such event IRRs are calculated from the time capital contributions are due from fund investors to the time fund investors receive a related distribution from the fund. In cases where financing facilities are used, their use generally decreases the amount of invested capital that would otherwise be used to calculate IRRs, which tends to increase IRRs when fair value grows over time and decrease IRRs when fair value decreases over time. IRRs measure the aggregate annual compounded returns generated by a fund’s investments over a holding period and are calculated taking into account recycled capital. Net IRRs presented are calculated after giving effect to the allocation of realized and unrealized carried interest and the payment of any applicable management fees. Gross IRRs are calculated before giving effect to the allocation of carried interest and the payment of any applicable management fees.
*** The multiples of invested capital measure the aggregate value generated by a fund’s investments in absolute terms. Each multiple of invested capital is calculated by adding together the total realized and unrealized values of a fund’s investments and dividing by the total amount of capital invested by the fund. In cases where financing facilities are used, their use generally decreases the amount of invested capital that would otherwise be used to calculate multiples of invested capital, which tends to increase multiples when fair value grows over time and decrease multiples when fair value decreases over time. . Such amounts do not give effect to the allocation of any realized and unrealized returns on a fund’s investments to the fund’s general partner pursuant to a carried interest or the payment of any applicable management fees and are calculated without taking into account recycled capital.
Such past performance may not be representative of performance in any given period. For additional information regarding impact of market conditions on the value and performance of our investments, see “Risk Factors-Risks Related to Our Business-Difficult market conditions can adversely affect our business in many ways, including by reducing the value or performance of the investments that we manage or by reducing the ability of our funds to raise or deploy capital, each of which could negatively impact our net income and cash flow and adversely affect our financial condition.” and “-Risks Related to the Assets We Manage-The historical returns attributable to our funds, including those presented in this report, should not be considered as indicative of the future results of our funds or of our future results or of any returns on our common units.”
Investment Approach
Our approach to making investments focuses on creating investment portfolios that seek to generate attractive risk‑adjusted returns by selecting investments that may be made at attractive prices, subjecting investments to regular monitoring and oversight, and, for more liquid investments, making buy and sell decisions based on price targets and relative value parameters. The firm employs both “top‑down” and “bottom‑up” analyses when making investments. Our top‑down analysis involves, as appropriate, a macro analysis of relative asset valuations, long‑term industry trends, business cycles, regulatory trends, interest rate expectations, credit fundamentals and technical factors to target specific industry sectors and asset classes in which to invest. From a bottom‑up perspective, our investment decision is predicated on an investment thesis that is developed using our proprietary resources and knowledge and due diligence.
Sourcing and Selecting Investments
We source investment opportunities through a variety of channels, including internal deal generation strategies and the firm’s global network of contacts at major companies, corporate executives, commercial and investment banks, financial intermediaries, other private equity sponsors and other investment and advisory institutions. We are also provided with opportunities to invest in certain strategies, where appropriate, in the securities of KKR’s private equity portfolio companies, though there are limitations across the platform on the maximum size of such KKR‑affiliated investments.
19
Due Diligence and the Investment Decision
Once a potential investment has been identified, our investment professionals screen the opportunity and make a preliminary determination concerning whether we should proceed with further diligence. When evaluating the suitability of an investment for our funds, we typically employ a relative value framework and subject the investment to due diligence. This review considers many factors including, as appropriate, expected returns, capital structure, credit ratings, historical and projected financial data, the issuer’s competitive position, the quality and track record of the issuer’s management team, margin stability, and industry and company trends. Investment professionals use the services of outside advisors and industry experts as appropriate to assist them in the due diligence process and, when relevant and permitted, leverage the knowledge and experience of our Private Markets investment professionals. Strategy‑specific investment committees monitor all due diligence practices.
Monitoring Investments
We monitor our portfolios of investments using, as applicable, daily, quarterly and annual analyses. Daily analyses include morning market meetings, industry and company pricing runs, industry and company reports and discussions with the firm’s Private Markets investment professionals on an as‑needed basis. Quarterly analyses include the preparation of quarterly operating results, reconciliations of actual results to projections and updates to financial models (baseline and stress cases). Annual analyses involve conducting internal audits, and testing compliance with monitoring and documentation requirements.
Credit Strategies
Our credit strategies business pursues investments in debt securities ranging from liquid securities such as leveraged loans and high‑yield bonds to alternative credit including longer‑duration strategies such as mezzanine, special situations and direct lending and revolving credit. These investments may be made across a range of vehicles including funds, single‑ or cross‑strategy separately managed accounts, and registered investment companies. These managed accounts enable us to tailor an investment program to meet the specific risk, return and investment objective of investors in our funds.
Leveraged Credit.
Our leveraged credit strategies are principally directed at investing in leveraged loans, high‑yield bonds or a combination of both. Our opportunistic credit strategy seeks to deploy capital across investment themes that take advantage of credit market dislocations, spanning asset types and liquidity profiles. These leveraged credit strategies are pursued primarily through separately managed accounts and registered investment companies, with a smaller amount of capital residing in funds. We are entitled to receive a fee or a combination of a fee and an incentive allocation for managing these vehicles.
Structured Credit Vehicles.
We manage structured credit vehicles in the form of collateralized loan obligation transactions, or CLOs. CLOs are typically structured as bankruptcy‑remote, special purpose investment vehicles which acquire, monitor and, to varying degrees, manage a pool of credit assets. The CLOs serve as long term financing for credit investments and as a way to minimize refinancing risk, minimize maturity risk and secure a fixed cost of funds over an underlying market interest rate. We may receive a fee for managing certain CLOs.
Alternative Credit.
Our alternative credit strategies leverage the knowledge and relationships developed in the leveraged credit business. These strategies include private credit strategies such as mezzanine and distressed investing and special situations strategies. As with our leveraged credit strategy, these are pursued through a combination of separately managed accounts, a BDC and funds. For managing these accounts and funds, we are entitled to receive either fees or a combination of fees and carried interest.
Direct Lending.
We seek to make investments in proprietarily sourced primarily senior debt financings for middle‑market companies through our direct lending strategy. We closed our first dedicated direct lending fund, KKR Lending Partners L.P. in December 2012 and had AUM of
$6.5 billion
in this strategy as of
December 31, 2015
.
Mezzanine.
We seek to make mezzanine investments in directly sourced third‑party mezzanine and mezzanine-like transactions through this strategy. These investments often consist of mezzanine debt, which generates a current yield, coupled with marginal equity exposure with additional upside potential. We closed our first dedicated mezzanine fund, KKR Mezzanine Partners I L.P. in August 2011 and had AUM of
$2.0 billion
in this strategy as of
December 31, 2015
.
Special Situations.
We seek to make opportunistic investments largely in distressed companies through our special situations investment strategy. These investments include secondary market distressed investments (including post‑ restructuring equity), control‑oriented opportunities, rescue financing (debt or equity investments made to
20
address covenant, maturity or liquidity issues), debtor‑in‑possession or exit financing, structured principal investments, and other event‑driven investments in debt or equity. We closed our first dedicated special situations fund, KKR Special Situations Fund L.P., in December 2013 and had AUM of
$6.6 billion
in this strategy as of
December 31, 2015
.
Long/short credit.
Our long/short credit strategy invests across capital structures with a focus primarily on corporate credit opportunities and had AUM of
$0.4 billion
in this strategy as of
December 31, 2015
.
Products for Individual Investors
KKR Credit Advisors (US) LLC serves as the registered investment adviser to an investment company registered under the Investment Company Act (or, in the case of the BDC we manage, as its sub‑adviser), which are subject to the Investment Company Act and the rules thereunder. The management fees we receive from these registered investment companies are generally paid on a regular basis (typically monthly) and proportionately increase or decrease based on the net asset value or gross assets of the investment company. The management fees we are paid for managing these investment companies will generally be subject to contractual rights that require their board of directors to provide prior notice (or, in the case of the BDC we manage, the investment adviser) in order to terminate our investment management services.
Hedge Funds
Overview
Our hedge fund business is comprised of customized hedge fund solutions and minority interests in other public markets managers and funds. We established our hedge fund business in October 2012 with the acquisition of Prisma Capital Partners LP through which we provide customized hedge fund portfolio and hedge fund‑of‑fund solutions. We expect to grow this business with the acquisition of majority and minority interests or stakes in third party hedge fund management companies or by seeding strategies with strategic hedge fund partners.
KKR Prisma
KKR Prisma constructs and manages customized hedge fund portfolios and hedge fund‑of‑funds. It seeks to deliver superior performance by utilizing portfolio construction techniques and an integrated, quantitative approach to risk management. KKR Prisma takes a specialist approach by seeking leading niche hedge fund managers in various alternative investment strategies. Various strategies are offered to investors, including moderate and low‑volatility, equity, credit and opportunistic, in both commingled and separate account portfolios. For the period beginning in June 2004 through
December 31, 2015
, our hedge fund-of-funds low volatility strategy, which consists of the majority of our hedge fund-of-funds AUM and FPAUM, generated a gross annualized return of 7.0%. As of
December 31, 2015
, our hedge fund-of-funds accounted for
$11.0 billion
of AUM.
Strategic Partnerships
Through our Public Markets segment, we also have developed strategic partnerships by acquiring minority stakes in other hedge fund managers. In this business we have a 24.9% interest in Marshall Wace LLP, a leading global liquid alternatives manager, a 24.9% interest in Nephila Capital Ltd., or Nephila, an investment manager focused on investing in natural catastrophe and weather risk, a 24.9% interest in BlackGold Capital Management L.P., or BlackGold, a credit‑oriented investment manager focused on investing in energy and hard asset investments. We have also seeded Acion Partners Limited, a Hong Kong based investment manager that manages Asian event driven investments.
21
Public Markets Vehicle Structures
The table below presents information as of
December 31, 2015
relating to our Public Markets vehicles:
|
($ in millions)
|
AUM
|
FPAUM
|
Typical
Management
Fee Rate
|
Incentive Fee /
Carried
Interest
|
Preferred
Return
|
Duration
of Capital
|
||||||||||
|
Leveraged Credit:
|
|
|
|
|
|
|
|
|
||||||||
|
Leveraged Credit SMAs/Funds
|
$
|
7,129
|
|
$
|
6,647
|
|
0.50%-1.50%
|
Various (1)
|
Various (1)
|
Subject to redemptions
|
||||||
|
CLO’s
|
9,021
|
|
9,021
|
|
0.50%
|
Various (1)
|
Various (1)
|
10-14 Years (2)
|
||||||||
|
Total Leveraged Credit
|
16,150
|
|
15,668
|
|
|
|
|
|
||||||||
|
Alternative Credit Vehicles (3)
|
13,463
|
|
7,340
|
|
0.75%-1.50% (4)
|
10.00-20.00%
|
8.00-12.00%
|
8-15 Years (2)
|
||||||||
|
Hedge Fund Solutions
|
11,028
|
|
10,530
|
|
0.50%-1.50%
|
Various (1)
|
Various (1)
|
Subject to redemptions
|
||||||||
|
Strategic Partnerships (6)
|
8,737
|
|
8,737
|
|
0.75%-2.00%
|
Various
|
Various
|
Subject to redemptions
|
||||||||
|
Corporate Capital Trust (5)
|
4,138
|
|
4,138
|
|
1.00%
|
10.00%
|
7.00%
|
7 years (5)
|
||||||||
|
Total
|
$
|
53,516
|
|
$
|
46,413
|
|
|
|
|
|
||||||
|
(1)
|
Certain funds and CLOs are subject to a performance fee in which the manager or general partner of the funds share in up to 20% (in our hedge fund solutions business, up to 10%) of the net profits earned by investors in excess of performance hurdles (generally tied to a benchmark or index) and subject to a provision requiring the funds and vehicles to regain prior losses before any performance fee is earned.
|
|
(2)
|
Term for duration of capital is since inception. Inception dates for CLOs were between 2004 and 2015 and for separately managed accounts and funds investing in alternative credit strategies from 2009 through 2015.
|
|
(3)
|
AUM and FPAUM include all assets invested by vehicles that principally invest in alternative credit strategies, respectively, and consequently may include a certain amount of assets, currently less than $1.0 billion, invested in other strategies.
|
|
(4)
|
Lower fees on uninvested capital in certain vehicles.
|
|
(5)
|
Corporate Capital Trust is a BDC sub-advised by KKR. By December 31, 2018, the capital in the Corporate Capital Trust vehicle may have an indefinite duration. This vehicle invests in both leveraged credit and alternative credit strategies.
|
|
(6)
|
Includes KKR's pro rata portion of AUM and FPAUM managed by other asset managers in which KKR holds a minority interest.
|
Capital Markets
Our Capital Markets segment is comprised primarily of our global capital markets business. Our capital markets business supports our firm, our portfolio companies and third-party clients by developing and implementing both traditional and non-traditional capital solutions for investments or companies seeking financing. These services include arranging debt and equity financing for transactions, placing and underwriting securities offerings and providing other types of capital markets services. When we underwrite an offering of securities or a loan on a firm commitment basis, we commit to buy and sell an issue of securities or indebtedness and generate revenue by purchasing the securities or indebtedness at a discount or for a fee. When we act in an agency capacity, we generate revenue for arranging financing or placing securities or debt with capital markets investors. We may also provide issuers with capital markets advice on security selection, access to markets, marketing considerations, securities pricing, and other aspects of capital markets transactions in exchange for a fee. KKR Capital Markets LLC is an SEC-registered broker-dealer and a FINRA member, and we are also registered or authorized to carry out certain broker-dealer activities in various countries in North America, Europe, Asia-Pacific and the Middle East. Our third party capital markets activities are generally carried out through Merchant Capital Solutions LLC, a joint venture with one other unaffiliated partner, and non-bank financial companies, or NBFCs, in India.
Client & Partner Group
We have a Client & Partner Group that is responsible for raising capital for us globally across all products, expanding our client relationships across asset classes and across types of fund investors, developing products to meet our clients’ needs, and servicing existing fund investors and products. We also provide fundraising services to fund managers in whom we have invested through our stakes business. As of
December 31, 2015
, we had
80
executives and professionals dedicated to our Client & Partner Group.
22
As of
December 31, 2015
, we had 895 investors in funds across all our strategies, which reflects the addition of over
100
investors during the year. On average, a fund investor is invested in approximately 1.7 of our products as of
December 31, 2015
. The following charts detail our investor base by type and geography as of
December 31, 2015
.
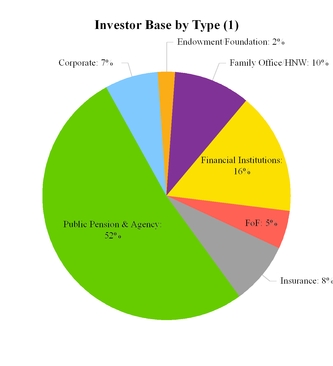
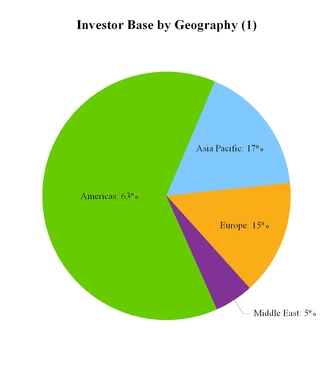
_________________________
|
(1)
|
Based on the AUM of our Private Markets investment funds, Private Markets co‑investment vehicles, and Public Markets separately managed accounts and investment funds. These charts exclude (a) commitments in connection with Private and Public Markets vehicles for which we are entitled to management fees or carried interest upon the satisfaction of certain conditions, which had not been met as of December 31, 2015 and (b) assets managed by other asset managers with which KKR has formed strategic partnerships where KKR does not hold more than a 50% ownership interest. Allocations are assigned to a type or geographic region according to subscriptions received from a limited partner.
|
Principal Activities
Through our Principal Activities segment, we manage the firm’s own assets and deploy capital to support and grow our businesses. We use our Principal Activities assets to support our investment management and capital markets businesses. Typically, the funds in our Private Markets and Public Markets businesses contractually require us, as general partner of the funds, to make sizable capital commitments from time to time. We believe our general partner commitments are indicative of the conviction we have in a given fund’s strategy, which assists us in raising new funds from limited partners. We also deploy Principal Activities assets in order to help establish a track record for fundraising purposes in new strategies. We may also use our own capital to seed investments for new funds, to bridge capital selectively for our funds’ investments or finance strategic acquisitions and partnerships, although the financial results of an acquired business or strategic partnership have been reported in our other segments.
Our Principal Activities assets also provide the required capital to fund the various commitments of our Capital Markets business when underwriting or syndicating securities, or when providing term loan commitments for transactions involving our portfolio companies and for third parties. Our Principal Activities assets also may be utilized to satisfy regulatory requirements for our Capital Markets business and risk retention requirements for our CLO business.
We also make opportunistic investments through our Principal Activities segment, which include co-investments alongside our Private Markets and Public Markets funds, as well as make Principal Activities investments that do not involve our Private Markets or Public Markets funds.
We endeavor to use our balance sheet strategically and opportunistically to generate an attractive risk-adjusted return on equity in a manner that is consistent with our fiduciary duties and in compliance with applicable laws.
23
The chart below presents the holdings of our Principal Activities segment by asset class as of December 31, 2015.
Holdings by Asset Class
(1)
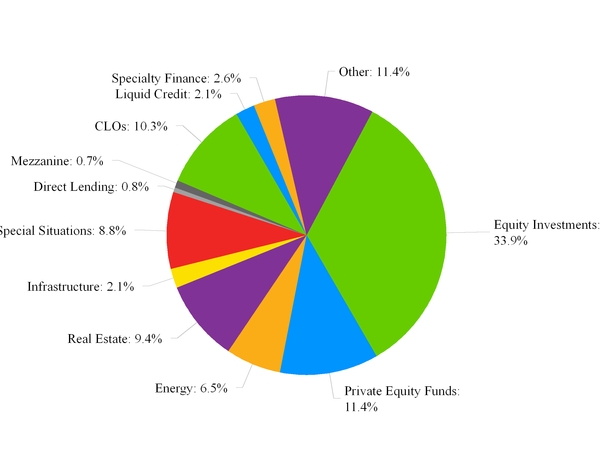
_________________________
|
(1)
|
General partner commitments in our funds are included in the various asset classes shown above. Assets and revenues of other asset managers with which KKR has formed strategic partnerships where KKR does not hold more than 50% ownership interest are not included in our Principal Activities business but are reported in the financial results of our other segments. Private equity funds represent holdings in KKR sponsored private equity funds. Equity investments consist of opportunistic investments including co-investments alongside such KKR sponsored private equity funds. However, equity investments in other asset classes, such as real estate, special situations and energy appear in these other asset classes.
|
Competition
We compete with other investment managers for both fund investors and investment opportunities. The firm’s competitors consist primarily of sponsors of public and private investment funds, real estate development companies, business development companies, investment banks, commercial finance companies and operating companies acting as strategic buyers. We believe that competition for fund investors is based primarily on investment performance, investor liquidity and willingness to invest, investor perception of investment managers’ drive, focus and alignment of interest, business reputation, duration of relationships, quality of services, pricing, fund terms including fees, and the relative attractiveness of the types of investments that have been or are to be made. We believe that competition for investment opportunities is based primarily on the pricing, terms and structure of a proposed investment and certainty of execution. In addition to these traditional competitors within the global investment management industry, we also face competition from local and regional firms, financial institutions and sovereign wealth funds, in the various countries in which we invest. In certain emerging markets, local firms may have more established relationships with the companies in which we are attempting to invest. These competitors often fall into one of the aforementioned categories but in some cases may represent new types of fund investors, including high net worth individuals, family offices and state‑ sponsored entities.
There are numerous funds focused on private equity, real assets, credit and hedge fund strategies that compete for investor capital. Fund managers have also increasingly adopted investment strategies outside of their traditional focus. For example,
24
funds focused on credit and equity strategies have become active in taking control positions in companies, while private equity funds have acquired minority equity or debt positions in publicly listed companies. This convergence could heighten competition for investments. Furthermore, as institutional fund investors increasingly consolidate their relationships for multiple investment products with a few investment firms, competition for capital from such institutional fund investors may become more acute.
Some of the entities that we compete with as an investment firm may have greater financial, technical, marketing and other resources and more personnel than us and, in the case of some asset classes, longer operating histories, more established relationships or greater experience. Several of our competitors also have raised, or may raise, significant amounts of capital and have investment objectives that are similar to the investment objectives of our funds, which may create additional competition for investment opportunities. Some of these competitors may also have lower costs of capital and access to funding sources that are not available to us, which may create competitive advantages for them. For example, master limited partnerships, or MLPs, which typically invest in oil and gas assets, may have a lower cost of capital than, and may compete with our energy funds for investment opportunities. In addition, some of these competitors may have higher risk tolerances, different risk assessments or lower return thresholds, which could allow them to consider a wider range of investments and to bid more aggressively than us for investments. Strategic buyers may also be able to achieve synergistic cost savings or revenue enhancements with respect to a targeted portfolio company, which may provide them with a competitive advantage in bidding for such investments.
We expect to compete as a capital markets business primarily with investment banks and independent broker‑dealers in the North America, Europe, Asia‑ Pacific and the Middle East. We principally focus our capital markets activities on the firm, our portfolio companies and fund investors, but we also seek to service other third parties, principally through Merchant Capital Solutions LLC. While we generally target customers with whom we have existing relationships, those customers may have similar relationships with the firm’s competitors, many of whom will have access to competing securities transactions, greater financial, technical or marketing resources or more established reputations than us. The limited operating history of our capital markets business could make it difficult for us to compete with established investment banks or broker‑dealers, participate in capital markets transactions of issuers or successfully grow the firm’s capital markets business over time.
Competition is also intense for the attraction and retention of qualified employees and consultants. Our ability to continue to compete effectively in our businesses will depend upon our ability to attract new employees and consultants and retain and motivate our existing employees and consultants.
Employees, Consultants and Advisors
As of
December 31, 2015
, we employed approximately
1,200
people worldwide:
|
Investment Professionals
|
370
|
|
|
Other Professionals
|
569
|
|
|
Support Staff
|
257
|
|
|
Total Employees(1)
|
1,196
|
|
(1) Does not include consolidated consultants and other consultants who provide services to us or our funds.
Investment Professionals
Our
370
investment professionals come from diverse backgrounds in private equity, real assets, credit, hedge funds and other asset classes and include executives with operations, strategic consulting, risk management, liability management and finance experience. As a group, these professionals provide us with a strong global team for identifying attractive investment opportunities, creating value, and generating superior returns.
Other Professionals
Our
569
other professionals come from diverse backgrounds in capital markets, capital raising, client services, public affairs, finance, tax, legal, compliance, human resources, and information technology. As a group, these professionals provide us with a strong team for overseeing investments and performing capital markets activities, servicing our existing fund investors and creating relationships with new fund investors globally. Additionally, a majority of these other professionals are responsible for supporting the global infrastructure of KKR.
25
KKR Capstone
We have developed an institutionalized process for creating value in investments. As part of our effort, we utilize a team of
49
operating consultants at KKR Capstone, who are not KKR employees but work exclusively with our investment professionals and portfolio company management teams or our designees. With professionals in North America, Europe and the Asia‑Pacific, KKR Capstone provides additional expertise for assessing investment opportunities and assisting managers of portfolio companies in defining strategic priorities and implementing operational changes. During the initial phases of an investment, KKR Capstone’s work seeks to implement our thesis for value creation. These operating consultants may assist portfolio companies in addressing top‑line growth, cost optimization and efficient capital allocation and in developing operating and financial metrics. Over time, this work shifts to identifying challenges and taking advantage of business opportunities that arise during the life of an investment. KKR Capstone is consolidated in KKR’s financial results for GAAP purposes, but is not a subsidiary or affiliate of KKR.
Senior Advisors
To complement the expertise of our investment professionals, we have a team of senior advisors and other advisors. While not KKR employees, they provide us with additional operational and strategic insights. The responsibilities of senior advisors include serving on the boards of our portfolio companies, helping us source and evaluate individual investment opportunities and assisting portfolio companies with operational matters. These individuals include current and former chief executive officers, chief financial officers and chairmen of major corporations and leading positions of public agencies worldwide.
26
Organizational Structure
The following simplified diagram illustrates our organizational structure as of
December 31, 2015
, unless otherwise noted. Certain entities depicted below may be held through intervening entities not shown in the diagram.
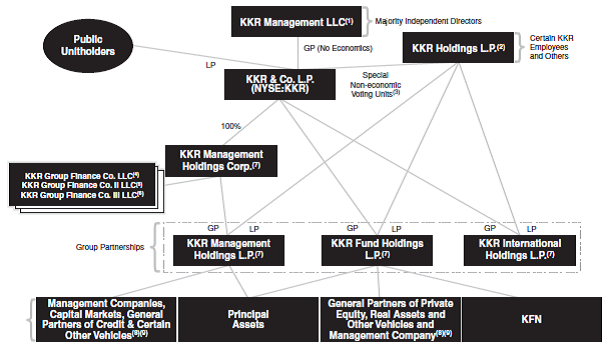
|
(1)
|
KKR Management LLC serves as the general partner of KKR & Co. L.P., which is governed by a Board of Directors consisting of a majority of independent directors. KKR Management LLC does not hold any economic interests in KKR & Co. L.P. and is owned by senior KKR employees.
|
|
(2)
|
KKR Holdings is the holding vehicle through which certain of our current and former employees and other persons indirectly own their interest in KKR. KKR Group Partnership Units that are held by KKR Holdings are exchangeable for our common units on a one‑for‑one basis, subject to customary conversion rate adjustments for splits, unit distributions and reclassifications and compliance with applicable vesting and transfer restrictions. As limited partner interests, these KKR Group Partnership Units are non‑voting and do not entitle KKR Holdings to participate in the management of our business and affairs. As of December 31, 2015, KKR Holdings had a 44.1% interest in our business indirectly through its limited partner interests in the KKR Group Partnerships.
|
|
(3)
|
KKR Holdings holds special non‑economic voting units in our partnership that entitle it to cast, with respect to those limited matters that may be submitted to a vote of our unitholders, a number of votes equal to the number of KKR Group Partnership Units that it holds from time to time.
|
|
(4)
|
KKR Group Finance Co. LLC is a wholly‑owned subsidiary of KKR Management Holdings Corp. and the issuer of our $500 million aggregate principal amount of 6.375% Senior Notes due 2020 (the “2020 Senior Notes”). The 2020 Senior Notes are guaranteed by KKR & Co. L.P. and the KKR Group Partnerships.
|
|
(5)
|
KKR Group Finance Co. II LLC is a wholly‑owned subsidiary of KKR Management Holdings Corp. and the issuer of our $500 million aggregate principal amount of 5.500% Senior Notes due 2043 (the “2043 Senior Notes”), which were issued on February 1, 2013. The 2043 Senior Notes are guaranteed by KKR & Co. L.P. and the KKR Group Partnerships.
|
|
(6)
|
KKR Group Finance Co. III LLC is a wholly‑owned subsidiary of KKR Management Holdings Corp. and the issuer of our $1,000 million aggregate principal amount of 5.125% Senior Notes due 2044 (the “2044 Senior Notes”), which were issued on May 29, 2014 and on March 18, 2015. The 2044 Senior Notes are guaranteed by KKR & Co. L.P. and the KKR Group Partnerships.
|
|
(7)
|
Because the income of KKR Management Holdings L.P. is likely to be primarily non‑qualifying income for purposes of the qualifying income exception to the publicly traded partnership rules, we formed KKR Management Holdings Corp., which is subject to taxation as a corporation for U.S. federal income tax purposes, to hold our KKR Group Partnership Units in KKR Management Holdings L.P. Accordingly, our allocable share of the taxable income of KKR Management Holdings L.P. will be subject to taxation at a corporate rate. KKR Management Holdings L.P., which is treated as a partnership for U.S. federal income tax purposes, was formed to hold interests in our fee generating businesses and other assets that may not generate qualifying income for purposes of the qualifying income exception to the publicly traded partnership rules. KKR Fund Holdings L.P., which is also treated as a partnership for U.S. federal income tax purposes, was formed to hold interests in our businesses and assets that will generate qualifying income for purposes of the qualifying income exception to the publicly traded partnership rules. KKR International
|
27
Holdings L.P. was formed generally to hold certain non‑U.S. assets that may generate non‑qualifying income under the U.S. federal income tax laws applicable to publicly traded partnerships. As of February 22, 2016, KKR International Holdings L.P. holds no assets.
|
(8)
|
KKR Management Holdings L.P. is the parent company of Kohlberg Kravis Roberts & Co. L.P., the SEC‑registered investment adviser, which in turn is generally the parent company for most of KKR’s other management and capital markets subsidiaries including KKR Credit Advisors (US) LLC, Prisma Capital Partners LP and KKR Capital Markets Holdings L.P., the holding company for KKR Capital Markets LLC. KKR Fund Holdings L.P. is the parent company of KKR Credit Advisors (Ireland).
|
|
(9)
|
40% of the carried interest earned in relation to our investment funds and carry paying co‑investment vehicles is allocated to a carry pool, from which carried interest is allocable to our employees and selected other individuals. No carried interest has been allocated with respect to co‑investments acquired from KPE in the KPE Transaction.
|
Regulation
Our operations are subject to regulation and supervision in a number of jurisdictions. The level of regulation and supervision to which we are subject varies from jurisdiction to jurisdiction and is based on the type of business activity involved. We, in conjunction with our outside advisors and counsel, seek to manage our business and operations in compliance with such regulation and supervision. The regulatory and legal requirements that apply to our activities are subject to change from time to time and may become more restrictive, which may make compliance with applicable requirements more difficult or expensive or otherwise restrict our ability to conduct our business activities in the manner in which they are now conducted. Changes in applicable regulatory and legal requirements, including changes in their enforcement, could materially and adversely affect our business and our financial condition and results of operations. As a matter of public policy, the regulatory bodies that regulate our business activities are generally responsible for safeguarding the integrity of the securities and financial markets and protecting fund investors who participate in those markets rather than protecting the interests of our unitholders.
United States
Regulation as an Investment Adviser
We conduct our advisory business through our investment adviser subsidiaries, including Kohlberg Kravis Roberts & Co. L.P. and its wholly‑owned subsidiaries KKR Credit Advisors (US) LLC and Prisma Capital Partners LP, each of which is registered as an investment adviser with the SEC under the Investment Advisers Act. The investment advisers are subject to the anti‑fraud provisions of the Investment Advisers Act and to fiduciary duties derived from these provisions which apply to our relationships with our advisory clients globally, including funds that we manage. These provisions and duties impose restrictions and obligations on us with respect to our dealings with our fund investors and our investments, including for example restrictions on agency cross and principal transactions. Our registered investment advisers are subject to periodic SEC examinations and other requirements under the Investment Advisers Act and related regulations primarily intended to benefit advisory clients. These additional requirements relate, among other things, to maintaining an effective and comprehensive compliance program, recordkeeping and reporting requirements and disclosure requirements. The Investment Advisers Act generally grants the SEC broad administrative powers, including the power to limit or restrict an investment adviser from conducting advisory activities in the event it fails to comply with federal securities laws. Additional sanctions that may be imposed for failure to comply with applicable requirements include the prohibition of individuals from associating with an investment adviser, the revocation of registrations and other censures and fines.
KKR Credit Advisors (US) LLC is also subject to regulation under the Investment Company Act as an investment adviser to a registered investment company. The KKR Income Opportunities Fund is a closed‑end management company registered under the Investment Company Act. The closed‑end management company and KKR Credit Advisors (US) LLC are subject to the Investment Company Act and the rules thereunder, which among other things regulate the relationship between a registered investment company and its investment adviser and prohibit or restrict principal transactions and joint transactions.
Regulation as a Broker‑Dealer
KKR Capital Markets LLC, one of our subsidiaries, is registered as a broker‑ dealer with the SEC under the Exchange Act and in all 50 U.S. States and U.S. territories and is a member of the Financial Industry Regulatory Authority, or FINRA. MCS Capital Markets LLC is registered as a broker‑ dealer with the SEC under the Exchange Act and in
35
U.S. States. As registered broker‑dealers, KKR Capital Markets LLC and MCS Capital Markets LLC are subject to periodic SEC and FINRA examinations and reviews. A broker‑dealer is subject to legal requirements covering all aspects of its securities business, including sales and trading practices, public and private securities offerings, use and safekeeping of customers’ funds and securities, capital structure, record‑ keeping and retention and the conduct and qualifications of directors, officers, employees and other associated persons. These requirements include the SEC’s “uniform net capital rule,” which specifies the minimum
28
level of net capital that a broker‑dealer must maintain, requires a significant part of the broker‑ dealer’s assets to be kept in relatively liquid form, imposes certain requirements that may have the effect of prohibiting a broker‑dealer from distributing or withdrawing its capital and subjects any distributions or withdrawals of capital by a broker‑dealer to notice requirements. These and other requirements also include rules that limit a broker‑dealer’s ratio of subordinated debt to equity in its regulatory capital composition, constrain a broker‑dealer’s ability to expand its business under certain circumstances and impose additional requirements when the broker‑dealer participates in securities offerings of affiliated entities. Violations of these requirements may result in censures, fines, the issuance of cease‑and‑desist orders, revocation of licenses or registrations, the suspension or expulsion from the securities industry of the broker‑dealer or its officers or employees or other similar consequences by regulatory bodies.
United Kingdom
We have several subsidiaries which are authorized and regulated by the United Kingdom Financial Conduct Authority, or FCA, under the Financial Services and Markets Act 2000, or FSMA, and are authorized in the United Kingdom with permission to engage in certain specified activities. FSMA and related rules govern most aspects of investment business, including sales, research and trading practices, provision of investment advice, corporate finance, use and safekeeping of client funds and securities, regulatory capital, record keeping, margin practices and procedures, approval standards for individuals, anti‑money laundering, periodic reporting and settlement procedures. The FCA is responsible for administering these requirements and our compliance with the FSMA and related rules. Violations of these requirements may result in censures, fines, imposition of additional requirements, injunctions, restitution orders, revocation or modification of permissions or registrations, the suspension or expulsion from certain “controlled functions” within the financial services industry of officers or employees performing such functions or other similar consequences.
KKR Capital Markets Limited has permission to engage in a number of regulated activities regulated under FSMA, including dealing as principal or agent and arranging deals in relation to certain types of specified investments and arranging the safeguarding and administration of assets. KKR Capital Markets Limited also benefits from a passport under the single market directives to offer services cross border into all countries in the European Economic Area and Gibraltar. Kohlberg Kravis Roberts & Co. Partners LLP has permission to engage in a number of regulated activities including advising on and arranging deals relating to corporate finance business in relation to certain types of specified investments. KKR Asset Management Partners LLP has permission to engage in a number of regulated activities including and advising on and arranging deals in relation to certain types of specified investments. KKR Credit Advisors (UK) has permission to advise, arrange, manage and deal as agent in certain types of investments. Prisma Capital Management International LLP is authorized to carry on any investment services and activities on a regular basis except reception and transmission of orders in relation to one or more financial instruments or investment advice.
Other Jurisdictions
Certain other subsidiaries or funds that we advise are registered with, have been licensed by or have obtained authorizations to operate in their respective jurisdictions outside of the United States. These registrations, licenses or authorizations relate to providing investment advice, broker‑dealer activities, marketing of securities and other regulated activities. Failure to comply with the laws and regulations governing these subsidiaries and funds that have been registered, licensed or authorized could expose us to liability and/or damage our reputation.
KKR Credit Advisors (Ireland) and KKR Alternative Investment Management are regulated by the Central Bank of Ireland. KKR Credit Advisors (Ireland) is authorized to carry out a number of regulated activities including receiving and transmitting orders, portfolio management and providing investment advice. KKR Alternative Investment Management is an authorized EU alternative investment manager permitted to conduct portfolio management, risk management and certain administrative activities.
KKR Capital Markets LLC and MCS Capital Markets LLC, respectively, are also registered as an international dealer under the Securities Act (Ontario). This registration permits us to trade in non‑Canadian equity and debt securities with certain types of investors located in Ontario, Canada.
KKR Capital Markets Japan Limited, a joint stock corporation, is registered as a Type I and Type II Financial Instruments Business Operator (broker dealer) under the Financial Instruments and Exchange Act of Japan, and a money lender under the Money Lending Business Act of Japan.
29
KKR MENA Limited, a Dubai International Financial Centre company, is licensed to arrange credit or deals in investments, advise on financial products or credit, and manage assets, and is regulated by the Dubai Financial Services Authority.
KKR Saudi Limited is licensed by the Capital Market Authority in Saudi Arabia and is authorized for the activity of arranging in the securities business.
KKR Australia Pty Limited and KKR Australia Investment Management Pty Limited are Australian financial services licensed and are authorized to provide advice on and deal in financial products for wholesale clients, and are regulated by the Australian Securities and Investments Commission.
KKR Capital Markets Asia Limited is licensed by the Securities and Futures Commission in Hong Kong to carry on dealing in securities and advising on securities regulated activities.
KKR Singapore Pte. Ltd. holds a capital markets services license to conduct fund management for accredited and/or institutional investors only, and is regulated by Monetary Authority of Singapore.
KKR Holdings Mauritius, Ltd. and KKR Account Adviser (Mauritius), Ltd. are unrestricted investment advisers authorized to manage portfolios of securities and give advice on securities transactions, and are regulated by the Financial Services Commission, Mauritius.
KKR Account Adviser (Mauritius), Ltd. is registered as a Foreign Institutional Investor, or FII, with the Securities and Exchange Board of India ("SEBI"), under the SEBI (Foreign Institutional Investors) Regulations, 1995 pursuant to which it can make investments in listed and unlisted securities of Indian issuers.
KKR Mauritius Direct Investments I, Ltd. is registered as a Foreign Portfolio Investor, or FPI, with SEBI under the SEBI (Foreign Portfolio Investor) Regulations, 2014 pursuant to which it can make investments in listed and unlisted securities of Indian issuers, and is incorporated as an investment holding company in Mauritius regulated by the Financial Services Commission, Mauritius.
KKR India Financial Services Private Limited is registered with the Reserve Bank of India as a non‑deposit taking non‑banking financial company and is authorized to undertake lending and financing activities.
KKR Capital Markets India Private Limited is licensed by the SEBI as a merchant bank that is authorized to execute capital market mandates, underwrite issues, offer investment advisory and other consultancy/advisory services.
Silverview Investments Pte. Ltd., Silverview Portfolio Investments Pte. Ltd. (earlier known as KKR Asia II Portfolio Investors Pte. Ltd.), Moneyline Portfolio Investments Limited are registered with SEBI either as an FII sub‑account or an FPI pursuant to which they can make investments in listed and unlisted securities of Indian issuers.
KKR India Asset Finance Private Limited (formerly known as Motichand Finance Private Limited) is registered with the Reserve Bank of India as a non‑ deposit taking non‑banking financial company and is authorized to undertake lending and financing activities.
Daena Venture Capital Investments, Ltd. is incorporated as an investment holding company in Mauritius regulated by the Financial Services Commission, Mauritius and was registered with SEBI as a foreign venture capital investor, or FVCI; however the FVCI certificated of registration has been surrendered with effect from December 18, 2015.
KKR Asia II Venture Investments Pte Ltd. is registered with SEBI as a foreign venture capital investor, or FVCI, under the SEBI (Foreign Venture Capital Investors) Regulations, 2000 pursuant to which it can make certain investments in securities of Indian issuers and is incorporated as an investment holding company in Singapore.
From time to time, one or more of our investment funds or their related investment vehicles may be regulated as a mutual fund by the Cayman Islands Monetary Authority, regulated as an investment limited partnership by the Central Bank of Ireland, listed on the Irish Stock Exchange, notified with the Financial Services Agency of Japan for sale pursuant to certain private placement exemptions and/or for investment pursuant to certain exemption, registered with the Financial Supervisory Service of the Republic of Korea, licensed by or granted in principal approval from SEBI, subject to the regulatory supervision of the Commission de Surveillance du Secteur Financier of Luxembourg, notified with the Netherlands Authority for Financial Markets for sale pursuant to certain private placement exemptions, or registered under the Investment Company Act.
30
There are a number of legislative and regulatory initiatives in the United States and in Europe that could significantly affect our business. Please see “Risk Factors-Risks Related to Our Business-Extensive regulation of our businesses affects our activities and creates the potential for significant liabilities and penalties. The possibility of increased regulatory focus or legislative or regulatory changes could result in additional burdens on our business.”
Website and Availability of SEC Filings
Our website address is
www.kkr.com
. Information on our website is not incorporated by reference herein and is not a part of this Form 10‑K. We make available free of charge on our website or provide a link on our website to our Annual Report on Form 10‑K, Quarterly Reports on Form 10‑Q and Current Reports on Form 8‑K, and any amendments to those reports filed or furnished pursuant to Section 13(a) or 15(d) of the Exchange Act, as soon as reasonably practicable after those reports are electronically filed with, or furnished to, the SEC. To access these filings, go to the “KKR & Co. L.P.” portion of our “Investor Center” page on our website, then click on “SEC Filings”. You may also read and copy any document we file at the SEC’s public reference room located at 100 F Street, N.E., Washington, DC 20549. Please call the SEC at 1‑800‑SEC‑0330 for further information on the public reference room. In addition these reports and the other documents we file with the SEC are available at a website maintained by the SEC at
www.sec.gov
.
From time to time, we may use our website as a channel of distribution of material information. Financial and other material information regarding our company is routinely posted on and accessible at
www.kkr.com
. In addition, you may automatically receive e‑mail alerts and other information about our company by enrolling your e‑mail address by visiting the “E‑ mail Alerts” section at under the “KKR & Co. L.P.” section of the “Investor Center” heading at
www.kkr.com
.
31
Investing in our securities involves risk. Persons investing in our securities should carefully consider the risks described below and the other information contained in this report and other filings that we make from time to time with the SEC, including our consolidated and combined financial statements and accompanying notes. Any of the following risks could materially and adversely affect our business, financial condition or results of operations. Our business, financial condition or results of operations could also be adversely affected by additional factors that apply to all companies generally, as well as other risks that are not currently known to us or that we currently view to be immaterial. In any such case, the trading price of our securities could decline and you may lose all or part of your original investment. While we attempt to mitigate known risks to the extent we believe to be practicable and reasonable, we can provide no assurance, and we make no representation, that our mitigation efforts will be successful.
Risks Related to Our Business
Difficult market conditions can adversely affect our business in many ways, including by reducing the value or performance of the investments that we manage or by reducing the ability of our funds to raise or deploy capital, each of which could negatively impact our net income and cash flow and adversely affect our financial prospects and condition.
Our business and the businesses of the companies in which we invest are materially affected by conditions in the financial markets and economic conditions or events throughout the world, such as interest rates, availability of credit, inflation rates, economic uncertainty, changes in laws (including laws relating to taxation), trade barriers, commodity prices, currency exchange rates and controls and national and international political circumstances (including wars, terrorist acts or security operations). For example, the unprecedented turmoil in the global financial markets during 2008 and 2009 provoked significant volatility of securities prices, contraction in the availability of credit and the failure of a number of companies, including leading financing institutions, and had a material adverse effect on our businesses and the businesses of the companies in which we invest. A more recent example of volatility has occurred beginning in the late summer of 2015 and is continuing.
Low levels of growth and high levels of government debt in major markets including the United States and Europe persists, and Europe continues to experience high unemployment and ongoing austerity. Concerns regarding sovereign defaults and the possibility that one or more countries might leave the European Union have resurfaced. The pace of China’s fixed asset investment growth has been slowing, which may pose a risk to the economic stability of China and its major trading partners. China’s slowing also has the potential to hinder the demand for and prices of many important global commodities and consequently reduce capital spending in industries dependent on commodity prices. Although lower commodity prices, including the falling price of oil, are expected to benefit the economies of commodity importing countries, certain of our investments focused on the development, exploration and production of oil and natural gas properties, as well as the sale of products or services used in the natural resources sector, have and will continue to suffer from such a decline. In addition, the Federal Reserve may continue to raise interest rates in 2016, thus raising the cost of financing and possibly slowing economic growth in the United States. Furthermore, higher interest rates in the United States could also reduce the relative attractiveness of other global markets, thereby applying pressure to foreign asset values and currencies.
Such market and economic conditions and events are outside our control and may affect the level and volatility of securities prices and the liquidity and the value of our investments. In addition, we may not be able to or may choose not to manage our exposure to these conditions and/or events. For example, as of March 31, 2009, the date of the lowest aggregate valuation of our private equity funds during the 2008 and 2009 financial market turmoil, the investments in the private equity funds contributed to us in the KPE Transaction were marked down to 67% of original cost, and values across all geographies declined. For example, as of March 31, 2009, the European Fund II, European Fund III, 2006 Fund and Asian Fund had multiples of invested capital of 0.5x, 0.6x, 0.7x and 0.8x, respectively. If not reversed, recent declines in the equity, commodity and debt in the markets are also expected to cause write down in our investments and the investments of our funds. Our profitability may also be adversely affected by our fixed costs and the possibility that we would be unable to scale back other costs within a time frame sufficient to match any decreases in net income relating to changes in market and economic conditions.
Unfavorable market conditions may reduce opportunities for our funds to make, exit and realize value from their investments. For example, when financing is not available, it is difficult for potential buyers to raise sufficient capital to purchase assets in our funds’ portfolios. Consequently, we may earn lower than expected returns on investments, which could cause us to realize diminished or no carried interest. In addition, we may not be able to find suitable investments for the funds to effectively deploy capital, which could adversely affect our ability to raise new funds because we can generally only raise capital for a successor fund following the substantial and successful deployment of capital from the existing fund. In the event of poor performance by existing funds or during periods of unfavorable fundraising conditions, pressures by fund investors for
32
lower fees, different fee sharing arrangements for transaction or other fees, and other concessions (for example, the inclusion of performance hurdles that require us in our newer funds, including all our newer private equity funds such as North America Fund XI, Asian Fund II and European Fund IV, to generate a specified return on investment prior to our right to receive carried interest) will likely continue and could increase. The outcome of such negotiations could result in our agreement to terms that are materially less favorable to us than for prior funds we have managed. In addition, successor funds raised by us when such unfavorable circumstances described above exist would also likely result in smaller funds than our comparable predecessor funds. Fund investors may also seek to redeploy capital away from certain of our credit or other non‑private equity investment vehicles, which permit redemptions on relatively short notice, in order to meet liquidity needs or invest in other asset classes or with other managers. Any of these developments could adversely affect our future revenues, net income, cash flow, financial condition or ability to retain our employees. See “-Our inability to raise additional or successor funds could have a material adverse impact on our business” and “-Our investors in future funds may negotiate to pay us lower management fees and the economic terms of our future funds may be less favorable to us than those of our existing funds, which could adversely affect our revenues.”
During periods of difficult market or economic conditions or slowdowns (which may occur across one or more industries, sectors or geographies), companies in which we have invested may experience decreased revenues, financial losses, credit rating downgrades, difficulty in obtaining access to financing and increased funding costs. These companies may also have difficulty in expanding their businesses and operations or be unable to meet their debt service obligations or other expenses as they become due, including amounts payable to us. Negative financial results in our funds’ portfolio companies may result in lower investment returns for our investment funds, which could materially and adversely affect our operating results and cash flow. To the extent the operating performance of such portfolio companies (as well as valuation multiples) deteriorate or do not improve, our funds may sell those assets at values that are less than we projected or even at a loss, thereby significantly affecting those funds’ performance and consequently our operating results and cash flow and resulting in lower or no carried interest being paid to us. Adverse conditions may also increase the risk of default with respect to private equity, credit and other investments that we manage or the abandonment or foreclosure of our real asset investments. Even if economic and market conditions do improve broadly, adverse conditions in particular sectors may also cause our performance to suffer. Finally, low interest rates related to monetary stimulus, economic stagnation or deflation may negatively impact expected returns on all types of investments as the demand for relatively higher return assets increases and the supply decreases. In addition, our Capital Markets segment generates fees through a variety of activities in connection with the issuance and placement of equity and debt securities and credit facilities, with the size of fees generally correlated to overall transaction sizes. As a result, the conditions in financial markets as described above, as well as transaction activity in our Private Markets segment and to a lesser extent, Public Markets segment, impact both the frequency and size of fees generated by this segment.
Changes in the debt financing markets may negatively impact the ability of our investment funds, their portfolio companies and strategies pursued with our balance sheet assets to obtain attractive financing for their investments or refinance existing debt and may increase the cost of such financing if it is obtained, which could lead to lower‑yielding investments and potentially decrease our net income.
In the event that our funds are unable to obtain committed debt financing for potential acquisitions or can only obtain debt at an increased interest rate or on unfavorable terms, our funds may have difficulty completing otherwise profitable acquisitions or may generate profits that are lower than would otherwise be the case, either of which could lead to a decrease in the investment income earned by us. Any failure by lenders to provide previously committed financing can also expose us to potential claims by sellers of businesses which we may have contracted to purchase. Similarly, certain of the strategies pursued using our balance sheet assets rely on the use of leverage, including the issuance of CLOs, and other secured and unsecured borrowings. Additionally, credit spreads in the lowest rated high yield bonds have increased from cyclical lows in 2014, and financing sources particularly in the U.S., are exercising caution in providing new credits. This tightening in debt financing could impact our ability to finance transactions. Our ability to generate returns on these assets and make cash available for distribution to our unitholders would be reduced to the extent that changes in market conditions cause the cost of our financing to increase relative to the income that can be derived from the assets acquired and financed. Similarly, our portfolio companies regularly utilize the corporate debt markets in order to obtain financing for their operations. To the extent that credit markets render such financing difficult to obtain or more expensive, this may negatively impact the operating performance of those portfolio companies and, therefore, the investment returns on our funds. In addition, to the extent that conditions in the credit markets impair the ability of our portfolio companies to refinance or extend maturities on their outstanding debt, either on favorable terms or at all, the operating performance of those portfolio companies may be negatively impacted, which could impair the value of our investment in those portfolio companies and lead to a decrease in the investment income earned by us. In some cases, the inability of our portfolio companies to refinance or extend maturities may result in the inability of those companies to repay debt at maturity and may cause the companies to sell assets, undergo a recapitalization or seek bankruptcy protection, which would also likely impair the value of our investment and lead to a decrease in investment income earned by us.
33
We have significant liquidity requirements, and adverse economic and market conditions may adversely affect our sources of liquidity, which could adversely affect our business operations in the future.
We expect that our primary liquidity needs will consist of cash required to:
|
•
|
continue to grow our business, including seeding new strategies and funding our capital commitments made to existing and future funds, co‑ investments and any net capital requirements of our capital markets companies;
|
|
•
|
warehouse investments in portfolio companies or other investments for the benefit of one or more of our funds, accounts or CLOs pending the contribution of committed capital by the investors in such vehicles;
|
|
•
|
service debt obligations including the payment of obligations upon maturity or redemption, as well as any contingent liabilities that may give rise to future cash payments;
|
|
•
|
fund cash operating expenses and amounts recorded for litigation matters;
|
|
•
|
pay amounts that may become due under our tax receivable agreement with KKR Holdings;
|
|
•
|
make cash distributions in accordance with our distribution policy;
|
|
•
|
underwrite commitments within our capital markets business;
|
|
•
|
fund our equity commitment to joint ventures such as Merchant Capital Solutions LLC;
|
|
•
|
make future purchase price payments in connection with our proprietary acquisitions, such as our acquisition of Prisma and strategic partnerships with other fund managers;
|
|
•
|
acquire additional principal assets, including other businesses and office space; and
|
|
•
|
repurchase KKR & Co. L.P. common units, including pursuant to the unit repurchase program announced on October 27, 2015.
|
These liquidity requirements are significant and, in some cases, involve capital that will remain invested for extended periods of time. As of December 31, 2015, we have approximately $1.4 billion of remaining unfunded capital commitments to our investment funds. Our commitments to our funds will require significant cash outlays over time, and there can be no assurance that we will be able to generate sufficient cash flows from realizations of investments to fund them.
In addition, as of December 31, 2015, we had $2.0 billion of borrowings outstanding under our credit facilities and debt securities and
$1.3 billion
of cash and short‑term investments. This includes KFN’s debt obligations of $657.3 million and KFN’s 7.375% Series A LLC preferred shares of $373.8 million, which do not provide for recourse to KKR beyond the assets of KFN. While we have long‑term committed financings with substantial facility limits, the terms of those facilities will expire in 2017 and 2019, and our senior notes become due in 2020, 2043 and 2044, and any borrowings thereunder will require refinancing or renewal, which could result in higher borrowing costs, or issuing equity. Depending on credit or other market conditions, we may not be able to renew all or part of these borrowings or find alternate sources of financing on commercially reasonable terms and we may not be able to raise equity. In addition, the incurrence of additional debt by us or our subsidiaries in the future could result in downgrades of our existing corporate credit ratings, which could limit the availability of future financing and increase our costs of borrowing.
In addition, the underwriting commitments for our capital markets business may require significant cash obligations, and these commitments may also put pressure on our liquidity. The holding company for our capital markets business has entered into a credit agreement that provides for revolving borrowings of up to $500 million, which can only be used in connection with our capital markets business, including placing and underwriting securities offerings. To the extent we commit to buy and sell an issue of securities in firm commitment underwritings or otherwise, we may be required to borrow under our credit agreement for our capital markets business to fund such obligations, which, depending on the size and timing of the obligations, may limit our ability to enter into other underwriting arrangements or similar activities, service existing debt obligations or otherwise grow our business. Regulatory capital requirements may also limit the ability of our broker‑dealer subsidiaries to participate in underwriting or other transactions or to allocate our capital more efficiently across our businesses.
34
In connection with our acquisition of Prisma and strategic partnerships with Nephila and Marshall Wace, we may be obligated to make future purchase price payments based on the respective performance of these businesses or the exercise of certain options. In addition in connection with the development of a new KKR office in New York City, we will be required to pay for the construction and completion of the office.
In the event that our liquidity requirements were to exceed available liquid assets for the reasons specified above or for any other reason, we could be forced to sell assets or seek to raise debt or equity capital on unfavorable terms. For further discussion of our liquidity needs see “Management’s Discussion and Analysis of Financial Condition and Results of Operations-Liquidity.”
The “clawback” or “net loss sharing” provisions in our governing agreements may give rise to a contingent obligation that may require us to return or contribute amounts to our funds and fund investors.
The partnership documents governing our carry‑paying funds, including funds relating to private equity, infrastructure, energy, real estate, mezzanine, direct lending and special situations investments, generally include a “clawback” provision that, if triggered, may give rise to a contingent obligation requiring the general partner to return amounts to the fund for distribution to the fund investors at the end of the life of the fund. Under a clawback obligation, upon the liquidation of a fund, the general partner is required to return, typically on an after‑tax basis, previously distributed carry to the extent that, due to the diminished performance of later investments, the aggregate amount of carry distributions received by the general partner during the term of the fund exceed the amount to which the general partner was ultimately entitled, including the effects of any performance thresholds. Excluding carried interest received by the general partners of funds that were not contributed to us in the KPE Transaction, as of December 31, 2015, no carried interest was subject to this clawback obligation, assuming that all applicable carry paying funds were liquidated at their December 31, 2015 fair values. Had the investments in such funds been liquidated at zero value, the clawback obligation would have been
$2,423.4 million
.
Certain private equity funds that were contributed to us in the KPE Transaction in 2009 also include a “net loss sharing provision.” Upon the liquidation of an investment vehicle to which a net loss sharing obligation applies, the general partner is required to contribute capital to the vehicle, to fund 20% of the net losses on investments. In these vehicles, such losses would be required to be paid by us to the fund investors in those vehicles in the event of a liquidation of the fund regardless of whether any carried interest had previously been distributed, and a greater share of investment losses would be allocable to us relative to the capital that we contributed to it as general partner. Based on the fair market values as of December 31, 2015, there would have been no net loss sharing obligation. If the vehicles were liquidated at zero value, the net loss sharing obligation would have been zero as of December 31, 2015.
Prior to the KPE Transaction in 2009, certain of our principals who received carried interest distributions with respect to certain private equity funds contributed to us had personally guaranteed, on a several basis and subject to a cap, the contingent obligations of the general partners of such private equity funds to repay amounts to fund investors pursuant to the general partners’ clawback obligations. The terms of the KPE Transaction require that our principals remain responsible for any clawback obligations relating to carry distributions received prior to the KPE Transaction, up to a maximum of
$223.6 million
. Through investment realizations, this amount has been reduced to
$159.7 million
as of December 31, 2015. Using valuations as of December 31, 2015, no amounts are due with respect to the clawback obligation required to be funded by our principals. Carry distributions arising subsequent to the KPE Transaction may give rise to clawback obligations that may be allocated generally to us and our principals who participate in the carry pool. Unlike the clawback obligation, we will be responsible for amounts due under a net loss sharing obligation and will indemnify our principals for any personal guarantees that they have provided with respect to such amounts. In addition, guarantees of or similar arrangements relating to clawback or net loss sharing obligations in favor of third party investors in an individual investment partnership by entities we own may limit distributions of carried interest more generally.
Our earnings and cash flow are highly variable due to the nature of our business and we do not intend to provide earnings guidance, each of which may cause the value of interests in our business to be volatile.
Our earnings are highly variable from quarter to quarter due to the volatility of investment returns of most of our funds, other investment vehicles and our principal assets and the fees earned from our businesses. We recognize earnings on investments in our funds based on our allocable share of realized and unrealized gains (or losses) reported by such funds and for certain of our recent funds, when a performance hurdle is achieved. During times of market volatility, as we are presently experiencing, the fair value of our funds and our principal assets are more variable, and as publicly traded equity securities currently represent a higher proportion of the assets of many of our funds and principal assets than in the prior year, volatility in the equity markets may have a greater impact on our reported results than in the past. See also "Management's Discussion and Analysis of Financial Condition & Results of Operations--Critical Accounting Policies -- Fair Value Measurements" for a
35
discussion of the impact of equity markets on the value of private equity investments. A decline in realized or unrealized gains, a failure to achieve a performance hurdle or an increase in realized or unrealized losses, would adversely affect our net income.
Fee income, which we recognize when contractually earned, can vary due to fluctuations in AUM, the number of investment transactions made by our funds, the number of portfolio companies we manage, the fee provisions contained in our funds and other investment products and transactions by our capital markets business. In any particular quarter, fee income may vary significantly due to the receipt of termination fees or fees received by our Capital Markets business from syndications, in particular large equity syndications. While these events occur periodically, they generally do not occur every quarter and their size and frequency are variable. Fees and Other for the years ended December 31, 2013, 2014 and 2015 were
$762.5 million
and
$1,110.0 million
and
$1,043.8 million
, respectively. We may create new funds or investment products or vary the terms of our funds or investment products (for example our newer funds include performance hurdles), which may alter the composition or mix of our income from time to time. We may also experience fluctuations in our results from quarter to quarter, including our revenue and net income, due to a number of other factors, including changes in the values of our funds’ investments, changes in the amount of distributions or interest earned in respect of investments, changes in our operating expenses, the degree to which we encounter competition and general economic and market conditions. In addition, our earnings and cash flows are dependent in part on the performance of KFN, a specialty finance company that we acquired in 2014, and is subject to the risks to KFN’s businesses as described elsewhere in the report. Although KFN is a subsidiary of KKR, KFN has its own indebtedness and preferred shares outstanding. The terms of its indebtedness and preferred shares impose limitations on KFN’s current and future operations and may restrict its ability to make distributions to KKR. Net income (loss) attributable to KKR & Co. L.P. for the years ended December 31, 2013, 2014 and 2015 was
$691.2 million
,
$477.6 million
and
$488.5 million
, respectively. Such fluctuations may lead to variability in the value of interests in our business and cause our results for a particular period not to be indicative of our performance in future periods. It may be difficult for us to achieve steady growth in net income and cash flow on a quarterly basis, which could in turn lead to large adverse movements in the value of interests in our business.
The timing and receipt of carried interest from our investment funds are unpredictable and will contribute to the volatility of our cash flows. For example, with respect to our private equity funds, carried interest is distributed to the general partner of a private equity fund with a clawback or net loss sharing provision only after all of the following are met: (i) a realization event has occurred (e.g., sale of a portfolio company, dividend, etc.); (ii) the vehicle has achieved positive overall investment returns since its inception, in excess of performance hurdles where applicable; and (iii) with respect to investments with a fair value below cost, cost has been returned to fund investors in an amount sufficient to reduce remaining cost to the investments’ fair value. Carried interest payments from investments depend on our funds’ performance and opportunities for realizing gains, which may be limited. It takes a substantial period of time to identify attractive investment opportunities, to raise all the funds needed to make an investment and then to realize the cash value (or other proceeds) of an investment through a sale, public offering or other exit. To the extent an investment is not profitable, no carried interest will be received from our funds with respect to that investment and, to the extent such investment remains unprofitable, we will only be entitled to a management fee on that investment. Furthermore, certain vehicles and separately managed accounts may not provide for the payment of any carried interest at all. Even if an investment proves to be profitable, it may be several years before any profits can be realized in cash. We cannot predict when, or if, any realization of investments will occur. In addition, if finance providers, such as commercial and investment banks, make it difficult for potential purchasers to secure financing to purchase companies in our investment funds’ portfolio, it may decrease potential realization events and the potential to earn carried interest. A downturn in the equity markets would also make it more difficult to exit investments by selling equity securities. If we were to have a realization event in a particular quarter, the event may have a significant impact on our cash flows during the quarter that may not be replicated in subsequent quarters. A decline in realized or unrealized gains, or an increase in realized or unrealized losses, would adversely affect our investment income, which could further increase the volatility of our quarterly results.
The timing and receipt of carried interest also varies with the life cycle of certain of our funds. Our carry paying funds that have completed their investment periods and are able to realize mature investments, sometimes referred to as being in a harvesting period, are more likely to make larger distributions than our carry paying funds that are in their fund raising or investment periods that precede the harvesting period. During times when a significant portion of our assets under management is attributable to carry paying funds that are not in their harvesting periods, we may receive substantially lower carried interest distributions.
In addition, with respect to certain of the funds that we advise, such as hedge funds and fund of funds, we are entitled to incentive fees that are generally paid annually in June and December if the net asset value of a fund has increased over a certain pre‑determined hurdle rate or a specified high‑water mark. These funds generally also have “high‑water mark” provisions whereby if the funds have experienced losses in prior periods, we will not be able to earn incentive fees with respect to a fund investor’s account until the net asset value of the fund investor’s account exceeds the highest period end value on which incentive fees were previously paid. The incentive fees we earn are therefore dependent on the net asset value of these funds or
36
vehicles, which could lead to volatility in our quarterly results and cash flow. Fees, including incentive fees, from KFN have been eliminated upon the completion of the KFN merger on a segment basis.
A decline in the pace or size of investment by our funds, or a change in the terms governing transaction fees, management fees or monitoring fees would result in our receiving less revenue from fees.
The transaction and management or monitoring fees that we earn are driven in part by the pace at which our funds make investments and the size of those investments. Any decline in that pace or the size of investments would reduce our revenue from transaction and management or monitoring fees. Likewise, during an attractive selling environment, our funds may capitalize on increased opportunities to exit investments. Any increase in the pace at which our funds exit investments, if not offset by new commitments and investments, would reduce future management fees. Many factors could cause such a decline in the pace of investment or the transaction and management or monitoring fees we receive, including:
|
•
|
the inability of our investment professionals to identify attractive investment opportunities;
|
|
•
|
competition for such opportunities among other potential acquirers;
|
|
•
|
decreased availability of capital or financing on attractive terms;
|
|
•
|
our failure to consummate identified investment opportunities because of business, regulatory or legal complexities and adverse developments in the U.S. or global economy or financial markets;
|
|
•
|
terms we may agree with or provide to our fund investors or investors in separately managed accounts with respect to fees such as increasing the percentage of transaction or other fees we may share with our fund investors; and
|
|
•
|
new regulations, guidance or other actions provided or taken by regulatory authorities.
|
Our inability to raise additional or successor funds (or raise successor funds of a comparable size as our predecessor funds) could have a material adverse impact on our business.
Our current private equity funds and certain other funds and investment vehicles have a finite life and a finite amount of commitments from fund investors. Once a fund nears the end of its investment period, our success depends on our ability to raise additional or successor funds in order to keep making investments and, over the long term, earning management fees (although our funds and investment vehicles generally continue to earn management fees at a reduced fee rate after the expiration of their investment periods). Even if we are successful in raising successor funds, to the extent we are unable to raise successor funds of a comparable size to our predecessor funds or the extent that we are delayed in raising such a successor fund, our revenues may decrease as the investment period of our predecessor funds expire and associated fees decrease. For example, KKR North America Fund XI and European IV are smaller than their respective predecessor funds . The performance of our funds also impacts our ability to raise capital, and deterioration in the performance of our funds would result in challenges to future fundraising. The evolving preferences of our fund investors may necessitate that alternatives to the traditional investment fund structure, such as managed accounts, smaller funds and co‑investment vehicles, become a larger part of our business going forward. This could increase our cost of raising capital at the scale we have historically achieved. Furthermore, in order to raise capital for new strategies and products without drawing capital away from our existing products, we will need to seek new sources of capital such as individual investors.
To raise new funds and pursue new strategies, we have and expect to continue to use the capital from our balance sheet, which may decrease the liquidity available for other parts of our business. In addition if a new strategy or fund does not develop as anticipated and such assets are not ultimately transferred to a fund, we may be forced to realize losses on these retained assets. Institutional investors in funds that have suffered from decreasing returns, liquidity pressure, increased volatility or difficulty maintaining targeted asset allocations, may materially decrease or temporarily suspend making new fund investments. Such investors may elect to reduce their overall portfolio allocations to alternative investments such as private equity funds, resulting in a smaller overall pool of available capital in our industry. In addition, the asset allocation rules or regulations or investment policies to which such third‑party investors are subject, could inhibit or restrict the ability of third‑party investors to make investments in our investment funds. Coupled with a lack of distributions from their existing investment portfolios, many of these investors may have been left with disproportionately outsized remaining commitments to, and invested capital in, a number of investment funds, which may significantly limit their ability to make new commitments to third‑party managed investment funds such as those advised by us.
37
Fund investors may also seek to redeploy capital away from certain of our credit vehicles, hedge fund, fund of funds, registered investment products or other investment vehicles, which permit redemptions on relatively short notice in order to meet liquidity needs or invest in other asset classes. We believe that our ability to avoid excessive redemption levels primarily depends on our funds’ continued satisfactory performance, although redemptions may also be driven by other factors important to our fund investors, including their need for liquidity and compliance with investment mandates, even if our performance is superior. Investors' liquidity needs tend to be more pronounced during periods of market volatility, as at present. Any such redemptions would decrease our AUM and revenues. Investors may also deploy capital away from funds of funds if they deem this asset class’s fee structure unattractive relative to the fees of other alternative products.
In addition, the Dodd Frank Wall Street Reform and Consumer Protection Act, or Dodd Frank Act, under what has become known as the “Volcker Rule,” broadly prohibits depository institution holding companies (including foreign banks with U.S. branches, agencies or commercial lending companies and certain insurance companies), insured depository institutions and their subsidiaries and controlled affiliates, or "banking entities," from investing in “covered funds,” including third party private equity funds like ours. Final regulations implementing the Volcker Rule were approved by the federal banking agencies, the SEC and the CFTC on December 10, 2013, although there is still some uncertainty regarding the implementation of the Volcker Rule and the final regulations and their practical implications. Although banking entities are expected to have until July 21, 2017 to conform their covered fund investments and relationships that were in place prior to December 31, 2013 to the requirements of the final regulations ( and may have until July 21, 2022 to conform investments in a private equity fund that qualifies as an "illiquid fund"), U.S. banking entities will be limited in their ability to undertake new contractual commitments to private equity funds like ours. Foreign banking entities may be able to continue to invest in private equity funds like ours under a Volcker Rule exemption for covered fund activities and investment that occur solely outside of the United States.
Banking entities have historically represented an important class of investors for our funds, with financial institutions constituting approximately 16% of our AUM as of December 31, 2015, and it is possible that other institutions will not be available to replace this traditional source of capital for our private equity funds. Furthermore, divestitures by banking entities of interests in private equity funds and hedge funds over the next several years to comply with the Volcker Rule may lead to lower prices in the secondary market for our fund interests, which could have adverse implications for our ability to raise funds from investors who may have considered the availability of secondary market liquidity as a factor in determining whether to invest. In addition to federal law, changes in state and local law may limit investment activities of state pension plans and insurance companies.
The number of funds raising capital varies from year to year, and in years where relatively few funds are raising capital, the growth of our AUM, FPAUM and associated fees may be significantly lower. For example, for the year ended December 31, 2015, our AUM increased to $119.5 billion of which $19.9 billion was attributable to new capital raised, while AUM as of December 31, 2014 on an adjusted basis was $107.1 billion of which $13.3 billion was attributable to new capital raised. We had several successful fundraises in 2015 for newer strategies such as European real estate, infrastructure, direct lending, mezzanine and special situations, there is no assurance that fundraises for other new strategies or successor funds will experience similar success in the future.
Our investors in future funds, including separately managed accounts, may negotiate to pay us lower management fees or reimburse us for fewer expenses and the economic terms of our future funds may be less favorable to us than those of our existing funds, which could adversely affect our revenues or profitability.
In connection with raising new funds or securing additional investments in existing funds, we negotiate terms for such funds and investments with investors. The outcome of such negotiations could result in our agreement to terms that are materially less favorable to us than the terms of prior funds we have advised or funds advised by our competitors. For example, such terms could restrict our ability to raise investment funds with investment objectives or strategies that compete with existing funds, reduce fee revenues we earn, reduce the percentage of profits on third‑party capital in which we share, include a performance hurdle that requires us to generate a specified return on investment prior to our right to receive carried interest or add expenses and obligations for us in managing the fund or increase our potential liabilities. For example our newer private equity funds, including North America Fund XI, Asian Fund II and European Fund IV, include a performance hurdle that requires us to generate a 7% return on investment prior to receiving our share of fund gains. Furthermore, as institutional investors increasingly consolidate their relationships with investment firms and competition becomes more acute, we may receive more of these requests to modify the terms in our new funds. Certain of our newer funds also include more favorable terms for fund investors that commit to early closes for our funds. Additionally, in certain funds, we have agreed to charge management fees based on invested capital or net asset value as opposed to charging management fees based on committed capital. In certain cases, we have provided “fee holidays” to certain investors in which we do not charge management fees for a fixed period of time (such as the first six months). Agreement to terms that are materially less favorable to us could result in a decrease in our profitability.
38
Certain institutional investors have also publicly criticized certain fund fee and expense structures, including monitoring fees and transaction and advisory fees. We have received and expect to continue to receive requests from a variety of fund investors and groups representing such investors to decrease fees and to modify our carried interest and incentive fee structures, which could result in a reduction or delay in the timing of receipt of the fees and carried interest and incentive fees we earn. The SEC has also recently focused on certain fund fees and expenses, including whether such fees and expenses were appropriately disclosed to limited partners, which may cause fund investor resistance to our receipt of fees and /expenses be reimbursed to us. In our newer flagship private equity funds, we have increased the percentage of transaction and monitoring fees that are credited against fund management fees to as much as 100% of the amount of the transaction and monitoring fee attributable to that fund. In September of 2009, the Institutional Limited Partners Association, or “ILPA,” published a set of Private Equity Principles, or the “Principles,” which were revised in January 2011. The Principles were developed in order to encourage discussion between limited partners and general partners regarding private equity fund partnership terms. Certain of the Principles call for enhanced alignment of interests between general partners and limited partners through modifications of some of the terms of fund arrangements, including proposed guidelines for fees and carried interest structures. We provided ILPA our endorsement of the Principles, representing an indication of our general support for the efforts of ILPA.
In addition, certain institutional investors, including sovereign wealth funds and public pension funds, have demonstrated an increased preference for alternatives to the traditional investment fund structure, such as managed accounts, specialized funds and co‑investment vehicles. We also have entered into strategic partnerships with individual investors whereby we manage that investor’s capital across a variety of our products on separately negotiated terms. There can be no assurance that such alternatives will be as profitable to us as the traditional investment fund structure, and the impact such a trend could have on our results of operations, if widely implemented, is unclear. Moreover, certain institutional investors are demonstrating a preference to in‑source their own investment professionals and to make direct investments in alternative assets without the assistance of investment advisers like us. Such institutional investors may become our competitors and could cease to be our clients.
Any agreement to or changes in terms less favorable to us could adversely affect our revenues and profitability.
The investment management business is intensely competitive, which could have a material adverse impact on our business.
We compete as an investment manager for both fund investors and investment opportunities. The investment management business is highly fragmented, with our competitors consisting primarily of sponsors of public and private investment funds, real estate development companies, business development companies, investment banks, commercial finance companies and operating companies acting as strategic buyers of businesses. We believe that competition for fund investors is based primarily on:
|
•
|
investment performance;
|
|
•
|
investor liquidity and willingness to invest;
|
|
•
|
investor perception of investment managers’ drive, focus and alignment of interest;
|
|
•
|
business reputation;
|
|
•
|
the duration of relationships with fund investors;
|
|
•
|
the quality of services provided to fund investors;
|
|
•
|
pricing;
|
|
•
|
fund terms (including fees); and
|
|
•
|
the relative attractiveness of the types of investments that have been or will be made.
|
We believe that competition for investment opportunities is based primarily on the pricing, terms and structure of a proposed investment and certainty of execution.
39
A number of factors serve to increase our competitive risks:
|
•
|
a number of our competitors in some of our businesses may have greater financial, technical, marketing and other resources and more personnel than we do, and, in the case of some asset classes, longer operating histories, more established relationships or greater experience;
|
|
•
|
fund investors may materially decrease their allocations in new funds due to their experiences following an economic downturn, the limited availability of capital, regulatory requirements or a desire to consolidate their relationships with investment firms;
|
|
•
|
some of our competitors may have better expertise or be regarded by fund investors as having better expertise in a specific asset class or geographic region than we do;
|
|
•
|
some of our competitors have agreed to terms on their investment funds or products that may be more favorable to fund investors than our funds or products, such as lower management fees, greater fee sharing, or performance hurdles for carried interest, and therefore we may be forced to match or otherwise revise our terms to be less favorable to us than they have been in the past;
|
|
•
|
some of our funds may not perform as well as competitors’ funds or other available investment products;
|
|
•
|
our competitors have raised or may raise significant amounts of capital, and many of them have similar investment objectives and strategies to our funds, which may create additional competition for investment opportunities and may reduce the size and duration of pricing inefficiencies that many alternative investment strategies seek to exploit;
|
|
•
|
some of these competitors may also have a lower cost of capital and access to funding sources that are not available to us, which may create competitive disadvantages for us with respect to investment opportunities;
|
|
•
|
some of our competitors may have higher risk tolerances, different risk assessments or lower return thresholds, which could allow them to consider a wider variety of investments and to bid more aggressively than us for investments;
|
|
•
|
some of our competitors may be subject to less regulation or less regulatory scrutiny and accordingly may have more flexibility to undertake and execute certain businesses or investments than we do and/or bear less expense to comply with such regulations than we do;
|
|
•
|
there are relatively few barriers to entry impeding the formation of new funds, including a relatively low cost of entering these businesses, and the successful efforts of new entrants into our various lines of business, including major commercial and investment banks and other financial institutions, have resulted in increased competition;
|
|
•
|
some fund investors may prefer to invest with an investment manager that is not publicly traded, is smaller, or manages fewer investment products; and
|
|
•
|
other industry participants will from time to time seek to recruit our investment professionals and other employees away from us.
|
We may lose investment opportunities in the future if we do not match investment prices, structures and terms offered by competitors. Our competitors that are corporate buyers may be able to achieve synergistic cost savings in respect of an investment, which may provide them with a competitive advantage in bidding for an investment. Alternatively, we may experience decreased investment returns and increased risks of loss if we match investment prices, structures and terms offered by competitors. Moreover, as a result, if we are forced to compete with other investment firms on the basis of price, we may not be able to maintain our current fund fee, carried interest or other terms. There is a risk that fees and carried interest in the alternative investment management industry will decline, without regard to the historical performance of a manager. Fee or carried interest income reductions on existing or future funds, without corresponding decreases in our cost structure, would adversely affect our revenues and profitability.
In addition, if interest rates were to rise or if market conditions for competing investment products become or are favorable and such products begin to offer rates of return superior to those achieved by our funds, the attractiveness of our funds relative to investments in other investment products could decrease. This competitive pressure could adversely affect our ability to make successful investments and limit our ability to raise future funds, either of which would adversely impact our business, results of operations and cash flow.
40
Our structure involves complex provisions of U.S. federal income tax laws for which no clear precedent or authority may be available. These structures also are subject to potential legislative, judicial or administrative change and differing interpretations, possibly on a retroactive basis.
The U.S. federal income tax treatment of our unitholders depends in some instances on determinations of fact and interpretations of complex provisions of U.S. federal income tax laws for which no clear precedent or authority may be available. The U.S. federal income tax rules are constantly under review by persons involved in the legislative process, the Internal Revenue Service, or IRS, and the U.S. Department of the Treasury, frequently resulting in revised interpretations of established concepts, statutory changes, revisions to regulations and other modifications and interpretations. The present U.S. federal income tax treatment of owning our common units may be modified by administrative, legislative or judicial interpretation at any time, and any such action may affect investments and commitments previously made. The maintenance of the structure and tax attributes of the KKR Group Partnerships, which comprise our businesses, requires significant monitoring and resources. Failure to maintain this structure could result in material adverse tax consequences. Our organizational documents and agreements give the Managing Partner broad authority to modify the amended and restated partnership agreement from time to time as the Managing Partner determines to be necessary or appropriate, without the consent of the unitholders, to address changes in U.S. federal, state and local income tax regulations, legislation or interpretation. In some circumstances, such revisions could have a material adverse impact on some or all unitholders.
The U.S. Congress has considered legislation that would have (i) in some cases after a ten‑year period, precluded us from qualifying as a partnership or required us to hold carried interest through taxable subsidiary corporations and (ii) taxed certain income and gains at increased rates. If any similar legislation were to be enacted and apply to us, the after‑tax income and gain related to our business, as well as the market price of our units, could be reduced.
In the past, a number of legislative and administrative proposals have been introduced and, in certain cases, have been passed by the U.S. House of Representatives, that would have, in general, treated all or a portion of our carried interest as income subject to a tax rate that is higher than under current law. It is unclear when or whether the U.S. Congress will pass such legislation or what provisions will be included in any legislation, if enacted.
Some legislative and administrative proposals have provided that, for taxable years beginning after the date of enactment (or in some cases, beginning ten years after the date of enactment), income derived with respect to carried interest would not meet the qualifying income requirements under the publicly traded partnership rules. Therefore, if similar legislation is enacted, following such enactment (or such ten‑year period), we would be precluded from qualifying as a partnership for U.S. federal income tax purposes. If we were taxed as a U.S. corporation, our effective tax rate would increase significantly. The federal statutory rate for corporations is currently 35%. In addition, we could be subject to increased state and local taxes. Furthermore, you could be subject to tax on our conversion into a corporation.
States and other jurisdictions have also considered legislation to increase taxes with respect to carried interest. For example, New York has periodically considered legislation under which you could be subject to New York state income tax on income in respect of our common units as a result of certain activities of our affiliates in New York, although it is unclear when or whether such legislation will be enacted.
If the proposed legislation described above or any similar legislation were to be enacted and apply to us, the after‑tax income and gain related to our business, our ability to fund cash distributions, as well as the market price of our units, could be reduced.
Additional proposed changes in the U.S. and foreign taxation of businesses could adversely affect us.
The U.S. Congress, the Organization for Economic Co‑operation and Development (or, OECD) and other government agencies in jurisdictions in which we and our affiliates invest or do business have maintained a focus on issues related to the taxation of multinational companies. The OECD is contemplating changes to numerous long‑standing tax principles through its base erosion and profit shifting (or, BEPS) project, which is focused on a number of issues, including the distribution of profits between affiliated entities in different tax jurisdictions. Additionally, the Obama administration has announced other proposals for potential reform to the U.S. federal income tax rules for businesses, including reducing the deductibility of interest for corporations, reducing the top marginal rate on corporations and subjecting entities, like many of our entities, currently treated as partnerships for tax purposes to an entity‑level income tax similar to the corporate income tax. A number of European jurisdictions have enacted taxes on financial transactions, and the European Commission has proposed legislation to harmonize these taxes under the so-called "enhanced cooperation procedure", which provides for adoption of EU-level legislation applicable to some but not all EU Member States. Several of these proposals for reform, if enacted by the U.S. or by other countries in which we or our affiliates invest or do business, could adversely affect our investment returns and could reduce the
41
cash we have available for distributions to unitholders or for other uses by us. It is unclear what any actual legislation could provide, when it would be proposed or what its prospects for enactment could be.
We depend on our founders and other key personnel, the loss of whose services could have a material adverse effect on our business, results and financial condition.
We depend on the efforts, skills, reputations and business contacts of our employees, including our founders, Henry Kravis and George Roberts, and other key personnel, the information and deal flow they and others generate during the normal course of their activities and the synergies among the diverse fields of expertise and knowledge held by our professionals. Accordingly, our success depends on the continued service of these individuals, who are not obligated to remain employed with us. The loss of the services of any of them could have a material adverse effect on our revenues, net income and cash flows and could harm our ability to maintain or grow AUM in existing funds or raise additional funds in the future.
Our employees and other key personnel possess substantial experience and expertise and have strong business relationships with investors in our funds and other members of the business community. As a result, the loss of these personnel could jeopardize our relationships with investors in our funds and members of the business community and result in the reduction of AUM or fewer investment opportunities. For example, if any of our principals were to join or form a competing firm, our business, results and financial condition could suffer.
Furthermore, the agreements governing our committed capital funds generally provide that in the event certain “key persons” (for example, both of Messrs. Kravis and Roberts for our private equity funds, and, in the case of certain geographically or product focused funds, one or more of the executives focused on such funds) generally cease to actively manage a fund or be substantially involved in KKR activities, investors in the fund will be entitled to reduce, in whole or in part, their capital commitments available for further investments on an investor‑by‑investor basis. In the case of certain of our fully paid-up funds, investors may be permitted to terminate their investment in the event a "key persons" provision is triggered, which could possibly lead to a liquidation of those funds. In addition, the occurrence of such a "key person" event could cause us to agree to less favorable ongoing terms with respect to the affected fund. The occurrence of such an event would likely have a significant negative impact on our revenue, net income and cash flow.
If we cannot retain and motivate our principals and other key personnel and recruit, retain and motivate new employees and other key personnel, our business, results and financial condition could be adversely affected.
Our most important asset is our people, and our continued success is highly dependent upon the efforts of our employees and other key personnel, and to a substantial degree on our ability to retain and motivate our employees and other key personnel and to strategically recruit, retain and motivate new talented employees, including qualified investment professionals. However, we may not be successful in these efforts as the market for qualified investment professionals is extremely competitive. Our ability to recruit, retain and motivate our employees is dependent on our ability to offer highly attractive incentive opportunities. If previously proposed legislation regarding the increased taxation of carried interest were to be enacted, income and gains recognized with respect to carried interest would be treated for U.S. federal income tax purposes as ordinary income rather than as capital gain. Such legislation would materially increase the amount of taxes that we, our employees and other key personnel would be required to pay, thereby adversely affecting our ability to offer such attractive incentive opportunities. See “-Risks Related to U.S. Taxation”. Similarly, changes in the United Kingdom with respect to the taxation of carried interest, including the proposal to tax certain carried interest returns as income from April 6, 2016 would impact our ability to recruit, retain and motivate employees and key personnel in the United Kingdom. In addition, there have been proposed laws and regulations that sought to regulate the compensation of certain of our employees. See “-Extensive Regulation of our business affects our activities and creates the potential for significant liabilities and penalties.” The possibility of increased regulatory focus or legislative or regulatory changes could result in additional burdens on our business.” The loss of even a small number of our investment professionals could jeopardize the performance of our funds and other investment products, which would have a material adverse effect on our results of operations. Efforts to retain or attract employees, including our investment professionals, may result in significant additional expenses, which could adversely affect our profitability.
Many of our employees hold interests in our business through KKR Holdings. These individuals historically received financial benefits from our business in the form of distributions and amounts funded by KKR Holdings and through their direct and indirect participation in the value of KKR Group Partnership Units held by KKR Holdings. While all of our employees receive base salaries from us, annual cash bonuses for certain employees currently are borne by KKR Holdings from cash reserves based upon distributions on a portion of KKR Group Partnership Units held by KKR Holdings. In 2015, the amount of such annual cash bonuses paid by KKR Holdings L.P. was $74.6 million. Effective with the distribution to be paid on March 8, 2016, with respect to the quarter ending December 31, 2015, KKR has changed its distribution policy. Under the new distribution policy, KKR intends to make equal quarterly distributions to holders of its common units in an amount of $0.16 per common unit per quarter. To the extent that distributions are made on KKR Group Partnership Units underlying any unvested
42
KKR Holdings units, such amounts under the new distribution policy would be insufficient to fund annual cash bonus compensation. We, therefore, expect to pay an increasing portion and eventually all of the cash bonus payments from other sources, including cash from our operations and the carry pool. As a result, either our profit margins or our employee retention or both may be adversely impacted. There can be no assurance that the carry pool will have sufficient cash available to continue to make such cash payments in the future and fluctuations from the distributions generated from the carry pool, if not offset by compensation from other sources, could render our compensation less attractive. In any of these circumstances, a higher percentage of our revenue may be paid out in the form of cash compensation, which would be expected to have an adverse impact on our profit margins.
Moreover, in connection with the KPE Transaction, we made large grants of KKR Holdings units that vested in installments over a five year period commencing October 1, 2009 and that completely vested on October 1, 2014, subject to certain transfer restrictions. We have granted and expect to grant equity awards from our Equity Incentive Plan, which has caused dilution. While we evaluate the grant of equity awards from our Equity Incentive Plan to employees on an annual basis, the size of the grants, if any, is made at our discretion and is expected to be generally smaller in number of units than the grants of KKR Holdings units made on October 1, 2009 and with service‑based vesting periods generally of approximately three years from date of grant. As we increase the use of equity awards from our Equity Incentive Plan in the future, expense associated with equity based compensation may increase materially. For example, in 2016 we allocated equity awards relating to 13.3 million KKR & Co. L.P. common units, under the Equity Incentive Plan. In 2016 KKR Holdings granted 28.9 million KKR Holdings units to certain senior employees and non-employee operating consultants. Such grants are subject to price vesting conditions in addition to service-based vesting conditions, which may make such grants a less effective retention mechanism if the price vesting condition is not achieved. See "Executive Compensation--Compensation Discussion and Analysis--Compensation Elements--KKR Holdings Market Condition Awards" for the terms and conditions of such KKR Holdings units. The value of the KKR Holdings units and common units may drop in value or be volatile, which may make our equity less attractive to our employees. In July 2015, the SEC also proposed rules requiring companies to develop and enforce recovery policies that in the event of an accounting restatement, “claw back” from current and former executive officers incentive-based compensation they would not have received based on the restatement. If such rules are adopted as proposed and are deemed applicable to any component of our compensation, the effectiveness of our compensation as a retention mechanism may be further reduced. In addition, less carried interest from the carry pool may be allocated to certain of our employees, which may result in less cash payments to such employees. To the extent our equity incentive or carry pool programs are not effective, we may be limited in our ability to attract, retain and motivate talented employees and other key personnel and we may need to increase the level of cash compensation that we pay.
In addition, there is no guarantee that the confidentiality and restrictive covenant agreements to which our employees and other key personnel are subject, together with our other arrangements with them, will prevent them from leaving us, joining our competitors or otherwise competing with us. Depending on which entity is a party to these agreements and/or the laws applicable to them, we may not be able to enforce them or become subject to lawsuits or other claims, and certain of these agreements might be waived, modified or amended at any time without our consent. Even when enforceable, these agreements expire after a certain period of time, at which point each of our employees and other key personnel are in any event free to compete against us and solicit our fund investors and employees. See “Certain Relationships and Related Transactions, and Director Independence-Confidentiality and Restrictive Covenant Agreements.”
We strive to maintain a work environment that reinforces our culture of collaboration, motivation and alignment of interests with fund investors. If we do not continue to develop and implement the right processes and tools to manage our changing enterprise and maintain our culture, our ability to compete successfully and achieve our business objectives could be impaired, which could negatively impact our business, financial condition and results of operations.
Operational risks and data security breaches may disrupt our businesses, result in losses or limit our growth.
We rely heavily on our financial, accounting and other data processing systems. If any of these systems do not operate properly or are disabled, we could suffer financial loss, a disruption of our businesses, liability to our funds, regulatory intervention or reputational damage. In addition, we operate in businesses that are highly dependent on information systems and technology. For example, we face operational risk from errors made in the execution, confirmation or settlement of transactions. We also face operational risk from transactions not being properly recorded, evaluated or accounted for in our funds. In particular, our Public Markets business is highly dependent on our ability to process and evaluate, on a daily basis, transactions across markets and geographies in a time-sensitive, efficient and accurate manner. Our information systems and technology may not continue to be able to accommodate our growth, may not be suitable for new products and strategies and may be subject to security risks, and the cost of maintaining such systems may increase from our current level. Such a failure to accommodate growth, or an increase in costs related to such information systems, could have a material adverse effect on our business. Furthermore, we depend on our principal offices in New York City, where most of our administrative personnel are
43
located, and technology and infrastructure concentrated in New York City and other offices for the continued operation of our business. We are also dependent on an increasingly concentrated group of third party vendors that we do not control for hosting solutions and technologies. A disaster or a disruption in the infrastructure that supports our businesses, including a disruption involving electronic communications or other services used by us, our vendors or third parties with whom we conduct business, or directly affecting our principal offices, could have a material adverse impact on our ability to continue to operate our business without interruption. Our business continuation or disaster recovery programs may not be sufficient to mitigate the harm that may result from such a disaster or disruption. In addition, insurance and other safeguards might only partially reimburse us for our losses, if at all.
Our operations rely on the secure processing, storage and transmission of confidential and other information in our computer systems and networks. We face various security threats on a regular basis, including ongoing cyber security threats to and attacks on our information technology infrastructure that are intended to gain access to our proprietary information, destroy data or disable, degrade or sabotage our systems. Although we take protective measures and endeavor to modify them as circumstances warrant, our computer systems, software and networks may be vulnerable to unauthorized access, theft, misuse, computer viruses or other malicious code, and other events that could have a security impact. We and our employees may be the target of fraudulent emails. The costs related to cyber or other security threats or disruptions may not be fully insured or indemnified by other means. In addition, cyber security has become a top priority for regulators around the world. If one or more of such events occur, this potentially could jeopardize our or our fund investors’ or counterparties’ confidential and other information processed and stored in, and transmitted through, our computer systems and networks, or otherwise cause interruptions or malfunctions in our, our fund investors’, our counterparties’ or third parties’ operations, which could result in significant losses, increased costs, disruption of our business, liability to our fund investors and other counter-parties, regulatory intervention or reputational damage. Finally, we rely on third party service providers for certain aspects of our business, including for certain information systems, technology, administration, tax and compliance matters. Any interruption or deterioration in the performance of these third parties could impair the quality of our and our funds’ operations and could impact our reputation and adversely affect our businesses and limit our ability to grow.
Our portfolio companies also rely on data processing systems and the secure processing, storage and transmission of information, including payment and health information. A disruption or compromise of these systems could have a material adverse effect on the value of these businesses. Our funds may invest in strategic assets having a national or regional profile or in infrastructure assets, the nature of which could expose them to a greater risk of being subject to a terrorist attack or security breach than other assets or businesses. Such an event may have adverse consequences on our investment or assets of the same type or may require portfolio companies to increase preventative security measures or expand insurance coverage.
Our organizational documents do not limit our ability to enter into new lines of businesses, and we may expand into new investment strategies, geographic markets and businesses, each of which may result in additional risks and uncertainties in our businesses.
We intend, to the extent that market conditions warrant, to seek to grow our businesses by increasing AUM in existing businesses, pursuing new investment strategies, including investment opportunities in new asset classes, developing new types of investment structures and products (such as managed accounts and structured products), and expanding into new geographic markets and businesses. We have in the past opened offices in Asia, the Middle East and Latin America, and also developed a capital markets business in the United States, Europe, the Middle East and Asia-Pacific, which we intend to grow and diversify. We have also launched a number of new investment initiatives in areas such as real estate, energy, infrastructure, hedge funds and growth equity.
Our organic growth strategy focuses on providing resources to foster the development of new product offerings and business strategies by our investment professionals and launching successor and related products, such that our new strategies achieve a level of scale and profitability. Given our diverse platform, these initiatives could create conflicts of interests with existing products, increase our costs and expose us to new market risks, and legal and regulatory requirements. The success of our organic growth strategy will also depend on, among other things, our ability to correctly identify and create products that appeal to the limited partners of our funds and vehicles. While we have made significant expenditures to develop these new strategies and products, there is no assurance that they will achieve a satisfactory level of scale and profitability. We have and may continue to pursue growth through acquisitions of other investment management companies, acquisitions of critical business partners, strategic partnerships or other strategic initiatives, which may include entering into new lines of business. In addition, we expect opportunities will arise to acquire other alternative or traditional investment managers. For example, we have built and expanded our hedge fund solutions business with the acquisition of Prisma and expanded our European credit business with our acquisition of Avoca. We have also made minority investments in hedge fund managers, and we have entered into joint ventures with third parties to participate in new real estate investment strategies. To the extent we make strategic
44
investments or acquisitions, undertake other strategic initiatives or enter into a new line of business, we will face numerous risks and uncertainties, including risks associated with:
|
•
|
our ability to successfully negotiate and enter into beneficial arrangements with our counterparties;
|
|
•
|
the required investment of capital and other resources;
|
|
•
|
the incurrence of substantial transaction-related costs including non-recurring transaction-related costs;
|
|
•
|
delays or failure to complete an acquisition or other transaction in a timely manner or at all due to a failure to obtain shareholder or regulatory approvals or satisfy any other closing conditions, which may subject us to damages or require us to pay significant costs;
|
|
•
|
lawsuits challenging an acquisition or unfavorable judgments in such lawsuits, which may prevent the closing of the transaction, cause delays, or require us to incur substantial costs including in costs associated with the indemnification of directors;
|
|
•
|
the possibility that we have insufficient expertise to engage in such activities profitably or without incurring inappropriate amounts of risk or liability or have not appropriately planned for such activities;
|
|
•
|
the possibility of diversion of management’s time and attention from our core business;
|
|
•
|
the possibility of disruption of our ongoing business;
|
|
•
|
the failure to realize the anticipated benefits from an acquired business or strategic partnership in a timely manner, if at all;
|
|
•
|
combining, integrating or developing operational and management systems and controls including an acquired business’s internal controls and procedures;
|
|
•
|
integration of the businesses including the employees of an acquired business;
|
|
•
|
potential increase in concentration of the investors in our funds;
|
|
•
|
disagreements with joint venture partners or other stakeholders in strategic partnerships;
|
|
•
|
the additional business risks of the acquired business and the broadening of our geographic footprint, including the risks associated with conducting operations in foreign jurisdictions such as taxation;
|
|
•
|
properly managing conflicts of interests;
|
|
•
|
our ability to obtain requisite regulatory approvals and licenses without undue cost or delay and without being required to comply with material restrictions or material conditions that would be detrimental to us or to the combined organization; and
|
|
•
|
regulatory scrutiny or litigation exposure due to the activities of the third party hedge fund managers or joint venture partners.
|
Entry into certain lines of business may subject us to new laws and regulations with which we are not familiar, or from which we are currently exempt, and may lead to increased litigation and regulatory risk and costs. If a new business generates insufficient revenues or if we are unable to efficiently manage our expanded operations, our results of operations will be adversely affected. Our strategic initiatives include joint ventures or the acquisition of minority interests in third parties, in which case we will be subject to additional risks and uncertainties in that we may be dependent upon, and subject to liability, losses or reputational damage relating to, systems, controls and personnel that are not under our control.
We may not be successful in executing upon or managing the complexities of new investment strategies, markets and businesses, which could adversely affect our business, results of operations and financial condition.
Our growth strategy is based, in part, on the expansion of our platform through selective investment in, and development or acquisition of, businesses and investment strategies complementary to our business. The expansion into new products and geographies has demanded greater management attention and dedication of resources to manage the increasing complexity of operations and regulatory compliance. This growth strategy involves a number of risks, including the risk that the expected
45
synergies from a newly developed product or strategic alliance will not be realized, that the expected results will not be achieved, that new strategies are not appropriately planned for or integrated into the firm, that the new strategies may conflict, detract from or compete against our existing businesses, that the investment process, controls and procedures that we have developed around our existing platform will prove insufficient or inadequate or that our information systems and technology, including related security systems, may prove to be inadequate. We have also entered into strategic partnerships and separately managed accounts, which lack the scale of our traditional funds and are more costly to administer. The prevalence of these accounts may also present conflicts and introduce complexity in the deployment of capital. The offering of investment products to retail investors, including any funds registered under the Investment Company Act, may result in increased compliance and litigation costs. We may also incur significant charges in connection with such investments, which ultimately may result in significant losses and costs. Such losses could adversely impact our business, results of operations and financial condition, as well as do harm to our professional reputation.
If we are unable to syndicate the securities or indebtedness or realize returns on investments financed with our balance sheet assets, our liquidity, business, results of operations and financial condition could be adversely affected.
Our balance sheet assets provide us with a significant source of capital to grow and expand our business, increase our participation in our transactions and underwrite commitments in our capital markets business. Our balance sheet assets have provided a source of capital to underwrite loans, securities or other financial instruments, which we generally expect to syndicate to third parties. To the extent that we are unable to do so, we may be required to sell such investments at a significant loss or hold them indefinitely. If we are required to retain investments on our balance sheet for an extended period of time, the inability of our capital markets business to complete additional transactions would impair our results.
We generally have a larger balance sheet than many of our competitors, and consequently, the performance of these balance sheet assets has a greater impact on our results of operations. Our success in deploying our balance sheet and generating returns on this capital will depend among other things on the availability of suitable opportunities after giving priority in investment opportunities to our advised investment funds and accounts, the level of competition from other companies that may have greater financial resources and our ability to value potential development or acquisition opportunities accurately and negotiate acceptable terms for those opportunities. To the extent we are unsuccessful in deploying our balance sheet , our business and financial results may suffer. In addition, as our balance sheet has been a significant source of capital for new strategies, to the extent that such strategies are not successful or our balance sheet assets cease to provide adequate liquidity, we would be limited in our ability to seed new businesses or support our existing business as effectively as contemplated. See also “-If we are unable to consummate or successfully integrate additional development opportunities, acquisitions or joint ventures, we may not be able to implement our growth strategy successfully.”
Extensive regulation of our businesses affects our activities and creates the potential for significant liabilities and penalties. The possibility of increased regulatory focus or legislative or regulatory changes could adversely affect our business.
Our business is subject to extensive regulation, including periodic examinations, inquiries and investigations by governmental and self‑regulatory organizations in the jurisdictions in which we operate around the world. Many of these regulators, including U.S. federal and state and foreign government agencies and self‑regulatory organizations, are empowered to impose fines, suspensions of personnel or other sanctions, including censure, the issuance of cease‑and‑desist orders or the suspension or expulsion of applicable licenses and memberships; any of the foregoing may damage our relations with existing fund investors, may impair our ability to raise capital for successor funds, or may contravene provisions concerning compliance with law in agreements to which we are a party. Even if a sanction is not imposed or the sanction imposed against us or our personnel by a regulator were small in monetary amount, the adverse publicity relating to the regulatory activity or imposition of these sanctions could harm our reputation and cause us to lose existing fund investors or fail to gain new fund investors. In addition, actions by regulators against other investment managers can cause changes in business practices that could materially adversely affect our business, financial condition and results of operations.
In particular, the private equity industry has come under increased regulatory and news media scrutiny with governmental officials and regulators, including the SEC, focusing on the private equity industry’s fees, allocation of expenses to funds, valuation practices, allocation of fund investment opportunities, and disclosures to fund investors. SEC focus areas have recently included the acceleration of monitoring fees, the allocation of broken-deal expenses, the disclosure, use and compensation of operating partners or consultants, outside business activities of firm principals and employees, group purchasing arrangements and general conflicts of interest disclosures.
Any changes in the regulatory framework applicable to our business, including the changes and potential changes described below, as well as adverse news media attention, may impose additional expenses or capital requirements on us, limit our fundraising for our investment products, result in limitations in the manner in which our business is conducted, have an adverse impact upon our financial condition, results of operations, reputation or prospects, impair employee retention or
46
recruitment and require substantial attention by senior management. It is impossible to determine the extent of the impact of any new laws, regulations, initiatives or regulatory guidance that may be proposed or may become law on our business or the markets in which we operate. If enacted, any new regulation or regulatory framework could negatively impact our funds and us in a number of ways, including increasing our costs and the cost for our funds of investing, borrowing, hedging or operating, increasing the funds’ or our regulatory operating costs, imposing additional burdens on the funds’ or our staff, and potentially requiring the disclosure of sensitive information. In addition, we may be adversely affected by changes in the interpretation or enforcement of existing laws and rules by these governmental authorities and self‑regulatory organizations. New laws or regulations could make compliance more difficult or more expensive, affect the manner in which we conduct business and divert significant management and operational resources and attention from our business. Moreover, we anticipate the potential for an increase in regulatory investigations and new or enhanced reporting requirements of the trading and other investment activities of alternative investment management funds and firms, including our funds and us. Such investigations and reporting obligations will likely impose additional expenses on us, may require the attention of senior management and increase the complexity of managing our business and may result in fines or other sanctions if we or any of our funds are deemed to have violated any law or regulations.
Regulation under the Dodd‑Frank Act.
There have been a number of legislative and regulatory proposals affecting the financial sector in the United States. In particular, the Dodd‑Frank Wall Street Reform and Consumer Protection Act, or Dodd‑Frank Act, that President Obama signed into law on July 21, 2010, created a significant amount of new regulation. Among other things, the Dodd‑Frank Act:
|
•
|
established the Financial Stability Oversight Council, or FSOC, an inter‑agency body charged with, among other things, designating systemically important nonbank financial companies for heightened prudential supervision and making recommendations regarding the imposition of enhanced regulatory standards regarding capital, leverage, conflicts and other requirements for financial firms deemed to pose a systemic threat to U.S. financial stability;
|
|
•
|
requires private equity and hedge fund advisers to register with the SEC under the Investment Advisers Act (as described elsewhere in this report, Kohlberg Kravis Roberts & Co. L.P. and its wholly‑owned subsidiaries KKR Credit Advisors (US) LLC and Prisma Capital Partners LP are registered with the SEC as investment advisers under the Investment Advisers Act), to maintain extensive records and to file reports if deemed necessary for purposes of systemic risk assessment by certain governmental bodies;
|
|
•
|
directs federal regulatory agencies to review and, in certain cases, prohibit compensation arrangements at financial institutions that give employees incentives to engage in conduct deemed to encourage inappropriate risk taking by covered financial institutions;
|
|
•
|
requires public companies to adopt and disclose policies requiring, in the event the company is required to issue an accounting restatement, the clawback of related incentive compensation from current and former executive officers;
|
|
•
|
restricts the ability of banking organizations to sponsor or invest in private equity and hedge funds;
|
|
•
|
granted the U.S. government resolution authority to liquidate or take emergency measures with regard to troubled financial institutions that fall outside the existing resolution authority of the Federal Deposit Insurance Corporation, or FDIC; and
|
|
•
|
created a Consumer Financial Protection Bureau within the U.S. Federal Reserve.
|
Some of these provisions are subject to further rule making and to the discretion of regulatory bodies, such as the FSOC. For example, the following rulemakings have been enacted and the following notices of proposed rulemakings have been announced that may apply to us or our subsidiaries:
|
•
|
On April 3, 2012, the FSOC issued a final rule and interpretive guidance regarding the process by which it designates nonbank financial companies as systemically important. The rule and guidance detail a three‑stage review process, with the level of scrutiny increasing at each stage. During the first stage, the FSOC applies a broad set of uniform quantitative metrics to identify nonbank financial companies that warrant additional review. In this first stage, the FSOC considers whether a nonbank financial company has at least $50 billion in total consolidated assets and whether it meets other thresholds relating to credit default swaps outstanding, derivative liabilities, loans and bonds outstanding, a minimum leverage ratio of total consolidated assets to total equity of 15 to 1, and a short‑term debt ratio of debt (with maturities less than 12 months) to total consolidated assets of 10%. A company that meets both the asset test and at least one of the other thresholds will be subject to additional review in Stage 2. Although we have
|
47
more than $50 billion in total consolidated assets as of December 31, 2015, we believe we do not currently meet the Stage 1 criteria outlined above; however, those criteria as well as our business may evolve over time. Additional uncertainty is created because the FSOC retains authority to designate any nonbank financial company as systemically important, even if the company does not meet the Stage 1 criteria. The FSOC will consider in the future whether to establish “an additional set of metrics or thresholds tailored to evaluate hedge funds and private equity firms and their advisers.” The preamble to the final rule notes that less regulatory data is generally available for hedge funds and private equity firms, but indicates that, in developing any such additional metrics or thresholds, it intends to review financial disclosures that private fund advisers are required to file with the SEC and CFTC, as further described below.
|
•
|
In May 2014, the FSOC hosted a public conference devoted exclusively to the asset management industry to help inform the FSOC’s ongoing assessment of potential risks to U.S. financial stability. On December 18, 2014, the FSOC issued a notice seeking public comment on potential systemic risks from asset management products and activities, focusing in particular on (1) liquidity and redemption risks, (2) use of leverage, (3) operational functions, and (4) resolution‑related issues. According to such notice, the FSOC has not made any determination regarding the existence or nature of any potential risks to financial stability posed by the asset management industry.
|
|
•
|
If the FSOC were to determine that we were a systemically important nonbank financial company, we would be subject to a heightened degree of regulation, including more stringent standards relating to capital, leverage, liquidity, risk management, resolution planning, credit exposure reporting, and concentration limits, restrictions on acquisitions and annual stress testing by the Federal Reserve. There can be no assurance that nonbank financial firms such as us will not become subject to the aforementioned restrictions or other requirements for financial firms deemed to be systemically important to the financial stability of the U.S. economy.
|
|
•
|
The Dodd‑Frank Act, under what has become known as the “Volcker Rule,” broadly prohibits depository institution holding companies (including foreign banks with U.S. branches or agencies), insured depository institutions and their subsidiaries and controlled affiliates (or banking entities), from investing in third‑party private equity funds like ours. See “-Our inability to raise additional or successor funds (or raise successor funds of a comparable size as our predecessor funds) could have a material adverse impact on our business.”
|
|
•
|
On October 26, 2011, the SEC adopted a rule requiring certain advisers to private funds to periodically file reports on Form PF. Large private fund advisers including advisers with at least $1.5 billion in assets under management attributable to hedge funds and advisers with at least $2 billion in assets under management attributable to private equity funds are subject to more detailed and in certain cases more frequent reporting requirements. The information is to be used by the FSOC in monitoring risks to the U.S. financial system.
|
|
•
|
On March 2, 2011, the SEC issued for public comment a proposed a rule as part of a joint rule‑making effort with other federal regulatory agencies designed to prohibit certain incentive‑based compensation arrangements deemed to encourage inappropriate risk taking by covered financial institutions by providing "excessive" compensation, fees or benefits or that could lead to material losses. The proposed rule would cover financial institutions with total consolidated assets of at least $1 billion, including investment advisers and broker‑dealers, and provide heightened requirements for financial institutions with total consolidated assets of at least $50 billion. The application of this rule to us could require us to substantially revise our compensation strategy and affect our ability to recruit and retain qualified employees.
|
|
•
|
The Dodd‑Frank Act amended the Exchange Act to compensate and protect whistleblowers who voluntarily provide original information to the SEC and establishes a fund to be used to pay whistleblowers who will be entitled to receive a payment equal to between 10% and 30% of certain monetary sanctions imposed in a successful government action resulting from the information provided by the whistleblower.
|
As mandated by the Dodd‑Frank Act, the Commodity Futures Trading Commission, or CFTC, has proposed or adopted a series of rules to establish a comprehensive new regulatory framework for swaps. Under Title VII of the Dodd‑Frank Act, the CFTC has assumed regulatory authority over many types of swaps. As a result:
|
•
|
Operating pooled funds, or providing investment advice to clients that trade swaps is now a basis for registration with the CFTC, absent an applicable exemption. Also, although not mandated by the Dodd‑Frank Act, the CFTC in 2012 issued a final rule that rescinded an exemption from CFTC registration for commodity pool operators in connection with privately offered funds. Operating our funds in a manner consistent with one or more exemptions from registration with the CFTC may limit the activities of certain of our funds, and monitoring and analysis of these
|
48
exemptions requires management and operational resources and attention. Registration with the CFTC, if required, could impact our operations and add additional costs associated with ongoing compliance.
|
•
|
The Dodd‑Frank Act also imposes regulatory requirements on the trading of swaps, including requirements that most swaps be executed on an exchange or “swap execution facility” and cleared through a central clearing house. Although these requirements presently apply only to certain classes of interest rate and credit default swaps, the CFTC is expected to mandate central execution and clearing with respect to additional classes of swaps in the future.
|
|
•
|
The CFTC issued regulations with quantitative tests and thresholds to determine whether entities acting as “swap dealers” or “major swap participants” must register in the appropriate category and comply with capital, margin, record keeping, reporting and business conduct rules. Our funds could become subject to the requirement to register as major swap participants due to changes to the funds’ investment strategy or valuations, or revisions to the thresholds for registration.
|
|
•
|
The CFTC has proposed rules instituting position limits on certain physical commodity futures contracts that, if finalized as proposed, would limit positions in 28 agricultural, energy and metals commodities, including swaps, futures and options that are economically equivalent to those commodity contracts. If the proposed rules are adopted in substantially the form proposed and to the extent that we do not qualify for an exemption, we may be required to aggregate the positions of our various investment funds and the positions of our portfolio companies, which in turn may require us and our portfolio companies to limit our trading activities, and impact the ability of our investment funds to invest or remain invested in certain derivatives, or engage in otherwise profitable acquisitions in particular industries. The Dodd-Frank Act also requires SEC to establish position limits on security-based swaps, which rules could have a similar impact on our business.
|
|
•
|
The CFTC and banking regulators have adopted, and the SEC has proposed, rules regarding minimum margin and capital requirements for over‑the‑counter swaps. The imposition of these requirements could increase the cost of trading in the derivative markets, which could in turn make it more expensive and difficult for us or our funds to enter into swaps and other derivatives in the normal course of our business and reduce the effectiveness of the funds’ investment strategies. These rules could also adversely impact liquidity in derivatives markets, which could expose our funds to greater risks and reduce hedging opportunities in connection with their trading activities. The compliance dates for the CTFC and banking margin rules will be phased in between 2016 and 2020, depending on the aggregate notional amount of over-the-counter swaps traded by market participants and their affiliates.
|
Additionally, federal banking and housing agencies finalized rules implementing the Dodd-Frank Act's five percent risk retention requirement for originators of asset-backed securities. Although such rules will not become fully effective until December 24, 2016, they contain provisions may have an adverse effect on us and/or the holders of the notes issued by our CLOs, or on the primary or secondary market for CLO securities generally, including the level of liquidity and trading of CLO securities.
The implementation of any new regulations could increase the cost of trading in the commodities and derivative markets, which could in turn make it more expensive and difficult for us or our funds to enter into swaps and other derivatives in the normal course of our business. Moreover, these increased regulatory responsibilities and increased costs could reduce trading levels in the commodities and derivative markets by a number of market participants, which could in turn adversely impact liquidity in the markets and expose our funds to greater risks in connection with their trading activities.
EU‑Wide Regulations.
The EU Alternative Investment Fund Managers Directive (AIFMD) entered into effect on July 22, 2013. The AIFMD establishes a comprehensive regulatory and supervisory framework for alternative investment fund managers (AIFMs) managing and/or marketing alternative investment funds (AIFs) in the EU. The AIFMD imposes various substantive requirements on authorized AIFMs including rules on the structure of remuneration for certain personnel that are similar to those applicable under CRD III and IV (as defined below), a threshold for regulatory capital, reporting obligations in respect of controlled EU portfolio companies and increased transparency towards investors and regulators and allows authorized AIFMs to market AIFs to professional investors throughout the EU under an “EU passport”. The AIFMD also imposes a new, strict depositary regime.
The EU passport has been available to authorized EU AIFMs, since July 2013 but has yet to become available to non EU AIFMs. In the meantime (and until at least 2018), non‑EU AIFMs may continue to market within the EU under the private placement regimes (NPPRs) of the individual member states, where available, subject to complying with certain minimum requirements imposed by the AIFMD and any additional requirements that individual member states may impose. In 2015, the European Securities and Markets Authority (ESMA) published advice in relation to the application of the EU passport to non-EU AIFMs and AIFs from certain jurisdictions and its opinion on the function of the EU passport for EU AIFMS and NPPRs.
49
Upon the effectiveness of any measures adopted by the EU Commission extending the EU passport to non-EU AIFMs and AIFs, the NPPRs allowing marketing by non-EU authorized AIFMs in certain member states will likely be further restricted, and NPPRs may become unavailable for marketing by non-EU authorized AIFMs in all member states as early as 2019. While our authorized EU AIFs continue to be marketed under an EU passport, the availability of the NPPRs and the uncertainty regarding the application of the EU passport to non EU AIFMs and AIFs may adversely impact the marketing of new strategies.
The AIFMD, the Level 2 Regulation and EU member state implementing measures could have an adverse effect on our businesses by, among other things, (i) imposing disclosure obligations and restrictions on distributions by EU portfolio companies of the funds we manage, (ii) potentially requiring changes in our compensation structures for key personnel, thereby potentially affecting our ability to recruit and retain these personnel, and (iii) generally increasing our compliance costs. Although a subsidiary of ours is registered as an Irish AIFM, we may not be able to benefit from the EU marketing passport for all of our funds under the AIFMD. In addition, there are areas of the AIFMD that are subject to legal uncertainty, including the scope of the legal structures qualifying as AIFs whose management and marketing requires authorization, and failure to comply even in areas where there is legal uncertainty can result in fines. Compliance with the AIFMD has also increased the cost and complexity of raising capital for our funds and consequently may also slow the pace of fundraising.
In July 2014, revisions to the Markets in Financial Instruments Directive (known as MiFID I), consisting of the revised directive, MiFID II, and a new related regulation, MiFIR, came into force; however, the date upon which they will apply to our business is uncertain. MiFID II and MiFIR further strengthen the EU regulatory framework for the provision of investment services and trading in financial instruments by introducing a number of substantial reforms in regards to transaction reporting, market structure, securities trading and conduct of business rules, including new harmonized rules for authorization of EU branches of third country firms looking to provide certain investment services in the EU. Work on the Level 2 measures on MiFID II is still under way, and the final delegated acts have not yet been adopted. The application of MiFID II and MiFIR will result in new regulatory burdens, including the requirement to trade certain derivatives on regulated trading venues. The increased regulatory burden could result in increased costs, and any failure to comply with the new requirements, even in areas where there is legal uncertainty, could result in fines.
On January 1, 2011, an amendment to the Capital Requirements Directive (CRD III) entered into force. Among other things, CRD III required EU member states to introduce stricter controls on remuneration for key employees and risk takers within specified credit institutions and investment firms. The CRD III was further amended by the Capital Requirements Directive IV and the Capital Requirements Regulation as discussed below, which introduced a limited number of additional remuneration requirements, including a cap on variable remuneration. Two of our subsidiaries (established in the UK and Ireland) are subject to the remuneration‑related requirements of CRD IV and similar requirements under the AIFMD. Additionally, the European Banking Authority has published final guidelines on sound remuneration policies under CRD IV which set out the requirements for remuneration policies, group application and proportionality, along with criteria for the allocation of remuneration as fixed and variable and details on the disclosures required under the Capital Requirements Regulation. These guidelines will apply from January 1, 2017. These measures required changes in our compensation structures for key personnel, thereby potentially affecting these subsidiaries’ ability to recruit and retain these personnel.
In 2010, the Basel Committee on Banking Supervision, an international body comprised of senior representatives of bank supervisory authorities and central banks from 27 countries, including the United States, finalized a comprehensive set of capital and liquidity standards, commonly referred to as “Basel III,” for internationally active banking organizations. These new standards, which are expected to be fully phased in by 2019, are expected to require banks to hold more capital, predominantly in the form of common equity, than under the current capital framework. In the EU, Basel III’s capital and liquidity standards have been implemented in a revision to CRD III and a new Capital Requirements Regulation, collectively referred to as CRD IV, which came into force on January 1, 2014. CRD IV replaced CRD III and created a single harmonized prudential rule book for banks, introducing new corporate governance rules and enhanced the powers of regulators. Like CRD III, CRD IV applies to specified credit institutions and investment firms. CRD IV has enhanced our financial reporting obligations and subjected us to new reporting requirements, which increases costs and the risk of non‑compliance.
In August 2012, the regulation on OTC Derivatives, Central Counterparties and Trade Repositories (also known as the European Market Infrastructure Regulation, or EMIR) became effective. EMIR applies to derivatives transactions in which one of the parties is established in the EU, and may in some circumstances apply to transactions between two non‑EU counterparties where these contracts have a direct, substantial and foreseeable effect within the EU. Certain of the requirements of EMIR came into force in March 2013, and other obligations will be phased in. In particular, EMIR imposes a requirement that certain “standardized” OTC derivatives contracts are centrally cleared. This requirement will be phased in based on the relevant entities' activities over a period from June 2016 to December 2018. Where OTC transactions are not subject to central clearing, techniques must be employed to monitor, measure and mitigate the operational and counterparty risks presented by the transaction. These risk mitigation techniques include trade confirmation, reconciliation processes, exchange of margin, and the daily mark to market of trades. Certain of these risk mitigation and reporting obligations are already in force. Initial margin
50
requirement for uncleared trades are expected to be phased in between September 1, 2016 and September 1, 2020. Variation margin requirements for uncleared trades are expected to be phased in between September 1, 2016, and March 1, 2017. The European Commission has not yet adopted an equivalence decision for the U.S., but “conditional” equivalence has been proposed in relation to certain parts of the CFTC and SEC regimes, whereby adherence to the relevant U.S. regimes as well as a number of additional stipulations would deemed equivalent to EMIR. Ongoing regulatory uncertainty regarding the interaction between U.S. and EU requirements for central clearing and related activities could result in duplicative regulatory obligations in the two jurisdictions and could increase our costs of compliance. The implementation of any new regulations could increase the cost of trading in the commodities and derivative markets, which could in turn make it more expensive and difficult for us or our funds to enter into swaps and other derivatives in the normal course of our business. Moreover, these increased regulatory responsibilities and increased costs could reduce trading levels in the commodities and derivative markets by a number of market participants, which could in turn adversely impact liquidity in the markets and expose our funds to greater risks in connection with their trading activities.
A number of other EU financial regulatory initiatives have the potential to adversely affect our business. Future acquisitions by KKR or our funds could lead to application of the EU’s Financial Conglomerates Directive, which introduced a prudential regime for financial conglomerates to address perceived risks associated with large cross‑sector businesses, and could increase the costs of investing in insurance companies and banks in the EU. Other recent EU financial regulatory initiatives include the Short Selling Regulation, which limits sovereign and naked short selling of government bonds and stocks, the Bank Recovery and Resolution Directive (BRRD), which established a recovery and resolution framework for EU credit institutions and investment firms, a new regulation (CSDR) on central securities depositories (CSDs), which introduces common securities settlement standards across the EU and harmonizes the rules governing CSDs, and a new regulation on reporting and transparency of securities financing transactions (SFT Regulation), which requires all SFTs to be reported to trade repositories, places additional reporting requirements on investment managers, and introduces prior risk disclosures and written consent before assets are rehypothecated. The European Commission has also proposed a Money Market Funds (MMF) Regulation. The EU has adopted certain risk retention and due diligence requirements in respect of various types of EU-regulated investors that, among other things, restrict investors from taking positions in securitization. The implementation of these new requirements could increase our and our funds’ costs and the complexity of managing our business and could result in fines if we or any of our funds were deemed to have violated any of the new regulations.
Other regulations of the financial markets.
Certain requirements imposed by regulators are designed primarily to ensure the integrity of the financial markets and are not designed to protect holders of interests in our business or our funds. Consequently, these regulations often serve to limit our activities. In addition to many of the regulations and proposed regulations described above under “-Regulation under the Dodd‑Frank Act,” and “-EU‑Wide Regulation,” U.S. federal bank regulatory agencies have issued leveraged lending guidance covering transactions characterized by a degree of financial leverage. Such guidance limits the amount or availability of debt financing and may increase the cost of financing we are able to obtain for our transactions and may cause the returns on our investments to suffer.
Regulators in the U.S. and abroad are also considering a variety of regulatory measures that could affect various non‑bank financial institutions that operate outside of the regulated banking system and the activities in which they engage. These reform measures are generally intended to mitigate against the kind of market disruptions that prevailed in 2008 and 2009 and that ultimately affected both banks and non‑banks. If these regulations are adopted, they could impose additional regulatory burdens and costs, including potentially imposing capital requirements, limiting financing and leverage and increasing costs, in each case causing the returns on our lending and credit investment activities to suffer. Certain of our businesses may also be directly subject to such new regulation, which could cause such businesses to limit or cease engaging in certain activities.
Certain of the funds and accounts we manage that engage in originating, lending and/or servicing loans, may consider investments that would subject us to state and federal regulation, borrower disclosure requirements, limits on fees and interest rates on some loans, state lender licensing requirements and other regulatory requirements in the conduct of their business. If our funds and accounts make these investments, they may also be subject to consumer disclosures and substantive requirements on consumer loan terms and other federal regulatory requirements applicable to consumer lending that are administered by the Consumer Financial Protection Bureau. These state and federal regulatory programs are designed to protect borrowers.
State and federal regulators and other governmental entities have authority to bring administrative enforcement actions or litigation to enforce compliance with applicable lending or consumer protection laws, with remedies that can include fines and monetary penalties, restitution of borrowers, injunctions to conform to law, or limitation or revocation of licenses and other remedies and penalties. In addition, lenders and servicers may be subject to litigation brought by or on behalf of borrowers for violations of laws or unfair or deceptive practices. If we enter into transactions that subject us to these risks, failure to conform to applicable regulatory and legal requirements could be costly and have a detrimental impact on certain of our funds and accounts and ultimately on us
51
Portfolio Company Regulatory Environment.
We are subject to certain laws, such as certain environmental laws, takeover laws, anti‑bribery and anti‑corruption laws, escheat or abandoned property laws, and antitrust laws, that may impose requirements on us and our portfolio companies as an affiliated group. As a result, we could become jointly and severally liable for all or part of fines imposed on our portfolio companies or be fined directly for violations committed by portfolio companies, and such fines imposed directly on us could be greater than those imposed on the portfolio company. Compliance with these laws or contracts could also require us to commit significant resources and capital towards information gathering and monitoring thereby increasing our operating costs. For example, on April 2, 2014, the European Commission announced that it had fined 11 producers of underground and submarine high voltage power cables a total of 302 million euro for participation in a ten‑year market and customer sharing cartel. Fines were also imposed on parent companies of the producers involved, including Goldman Sachs, the former parent company of one of the cartel members. The Federal Energy Regulatory Commission (FERC) has proposed a rule requiring regional transmission organizations and independent systems operators to collect, report and keep updated substantial information concerning their ownership structure and corporate relationships, corporate officers, direct and indirect investors (including non-controlling and passive non-voting investors), and lending and other material contractual relationships. If such rules are adopted as proposed, we and certain of our portfolio companies may become subject to costly and burdensome data collection and reporting requirements.
In the United States, certain statutes may subject us or our funds to the liabilities of our portfolio companies. The Comprehensive Environmental Response, Compensation and Liability Act, also referred to as the Superfund, requires cleanup of sites from which there has been a release or threatened release of hazardous substances, and authorizes the EPA to take any necessary response action at Superfund sites, including ordering potentially responsible parties liable for the release to pay for such actions. Potentially responsible parties are broadly defined under CERCLA. In addition, we or certain of our investment funds could potentially be held liable under ERISA for the pension obligations of one or more of our portfolio companies if we or the investment fund were determined to be a “trade or business” under ERISA and deemed part of the same “controlled group” as the portfolio company under such rules, and the pension obligations of any particular portfolio company could be material. In a decision of a federal appellate court (
Sun Capital Partners III LP v. New England Teamsters & Trucking Indus. Pension Fund
), a private equity firm was held to be engaged in a “trade or business” under ERISA.
Similarly, our portfolio companies may be subject to contractual obligations which may impose obligations or restrictions on their affiliates. The interpretation of such contractual provisions will depend on local laws. Given that we do not control all of our portfolio companies and that our portfolio companies generally operate independently of each other, there is a risk that we could contravene one or more of such laws, regulations and contractual arrangements due to limited access and opportunities to monitor compliance. In addition, compliance with these laws or contracts could require us to commit significant resources and capital towards information gathering and monitoring thereby increasing our operating costs.
Complex regulations may limit our ability to raise capital, increase the costs of our capital raising activities and may subject us to penalties
.
We regularly rely on exemptions in the United States from various requirements of the Securities Act, the Exchange Act, the Investment Company Act, the Commodity Exchange Act and the U.S. Employee Retirement Income Security Act of 1974, or ERISA, in conducting our investment management activities. These exemptions are sometimes highly complex and may in certain circumstances depend on compliance by third parties whom we do not control. If for any reason these exemptions were to become unavailable to us, we could become subject to additional restrictive and costly registration requirements, regulatory action, or third party claims and our business could be materially and adversely affected. For example, in raising new funds, we typically rely on private placement exemptions from registration under the Securities Act, including Regulation D, which was recently amended to prohibit issuers (including our funds) from relying on certain of the exemptions from registration if the fund or any of its “covered persons” (including certain officers and directors, but also including certain third parties including, among others, promoters, placement agents and beneficial owners of 20% of outstanding voting securities of the fund) has been the subject of a “disqualifying event,” or a “bad actor,” which can include a variety of criminal, regulatory and civil matters. If any of the covered persons associated with our funds is subject to a disqualifying event, one or more of our funds could lose the ability to raise capital in a Rule 506 private offering for a significant period of time, which could significantly impair our ability to raise new funds, and, therefore, could materially adversely affect our business, financial condition and results of operations. In addition, if certain of our employees or any potential significant investor has been the subject of a disqualifying event, we could be required to reassign or terminate such an employee or we could be required to refuse the investment of such an investor, which could impair our relationships with investors, harm our reputation, or make it more difficult to raise new funds. See also “-Risks Related to Our Organizational Structure-If we were deemed to be an “investment company” subject to regulation under the Investment Company Act, applicable restrictions could make it impractical for us to continue our business as contemplated and could have a material adverse effect on our business.”
52
We are and will become further subject to additional regulatory and compliance burdens as we expand our product offerings and investment platform to include retail investors. For example, funds in our Public Markets segment are registered under the Investment Company Act as management investment companies. These funds and KKR Credit Advisors (US) LLC, which serves as their investment adviser (or in the case of a BDC, as its sub‑adviser), are subject to the Investment Company Act and the rules thereunder, which, among other things, regulate the relationship between a registered investment company (or business development company) and its investment adviser and prohibit or severely restrict principal transactions and joint transactions. As our business expands we may be required to make additional registrations, including in jurisdictions outside the U.S. Compliance with these rules will increase our compliance costs and create potential for additional liabilities and penalties the management of which would divert management’s attention from our business and investments.
In June 2010, the SEC approved Rule 206(4)‑5 under the Advisers Act regarding “pay to play” practices by investment advisers involving campaign contributions and other payments to government clients and elected officials able to exert influence on such clients. Among other restrictions, the rule prohibits investment advisers from providing advisory services for compensation to a government client for two years, subject to very limited exceptions, after the investment adviser, its senior executives or its personnel involved in soliciting investments from government entities make contributions to certain candidates and officials in position to influence the hiring of an investment adviser by such government client. Advisers are required to implement compliance policies designed, among other matters, to track contributions by certain of the adviser’s employees and engagements of third parties that solicit government entities and to keep certain records in order to enable the SEC to determine compliance with the rule. There has also been similar rule‑making on a state‑level regarding “pay to play” practices by investment advisers, including in California and New York, and FINRA has proposed its own set of regulations. Any failure on our part to comply with these rules could cause us to lose compensation for our advisory services or expose us to significant penalties and reputational damage.
Federal, state and foreign anti‑corruption and sanctions laws applicable to us and our portfolio companies creates the potential for significant liabilities and penalties and reputational harm
.
We are also subject to a number of laws and regulations governing payments and contributions to political persons or other third parties, including restrictions imposed by the Foreign Corrupt Practices Act, or FCPA, as well as trade sanctions and export control laws administered by the Office of Foreign Assets Control, or OFAC, the U.S. Department of Commerce and the U.S. Department of State. The FCPA is intended to prohibit bribery of foreign governments and their officials and political parties, and requires public companies in the United States to keep books and records that accurately and fairly reflect those companies’ transactions. OFAC, the U.S. Department of Commerce and the U.S. Department of State administer and enforce various export control laws and regulations, including economic and trade sanctions based on U.S. foreign policy and national security goals against targeted foreign states, organizations and individuals. These laws and regulations relate to a number of aspects of our business, including servicing existing fund investors, finding new fund investors, and sourcing new investments, as well as activities by the portfolio companies in our investment portfolio or other controlled investments.
The Iran Threat Reduction and Syrian Human Rights Act of 2012 (“ITRA”) expanded the scope of U.S. sanctions against Iran and amended the Exchange Act. Specifically, Section 219 of the ITRA amended the Exchange Act to require public reporting companies to disclose in their annual or quarterly reports any dealings or transactions the company or its affiliates engaged in during the previous reporting period involving Iran or other individuals and entities targeted by certain OFAC sanctions. In some cases, ITRA requires companies to disclose these types of transactions even if they are permissible under U.S. law or are conducted outside of the United States by a foreign affiliate. We are required to separately file, concurrently with this annual report, a notice that such activities have been disclosed in this annual report. The SEC is required to post this notice of disclosure on its website and send the report to the U.S. President and certain U.S. Congressional committees. The U.S. President thereafter is required to initiate an investigation and, within 180 days of initiating such an investigation, to determine whether sanctions should be imposed. Disclosure of such activity, even if such activity is not subject to sanctions under applicable law, and any sanctions actually imposed on us or our affiliates as a result of these activities, could harm our reputation and have a negative impact on our business.
Similar laws in non‑U.S. jurisdictions, such as EU sanctions or the U.K. Bribery Act, as well as other applicable anti‑bribery, anti‑corruption, anti‑money laundering, or sanction or other export control laws in the U.S. and abroad, may also impose stricter or more onerous requirements than the FCPA, OFAC, the U.S. Department of Commerce and the U.S. Department of State, and implementing them may disrupt our business or cause us to incur significantly more costs to comply with those laws. Different laws may also contain conflicting provisions, making compliance with all laws more difficult. If we fail to comply with these laws and regulations, we could be exposed to claims for damages, civil or criminal financial penalties, reputational harm, incarceration of our employees, restrictions on our operations and other liabilities, which could negatively affect our business, operating results and financial condition. In addition, we may be subject to successor liability for FCPA
53
violations or other acts of bribery, or violations of applicable sanctions or other export control laws committed by companies in which we or our funds invest or which we or our funds acquire.
We are subject to substantial litigation risks and may face significant liabilities and damage to our professional reputation as a result of litigation allegations and negative publicity.
The activities of our businesses, including the investment decisions we make and the activities of our employees in connection with our portfolio companies, may subject us and them to the risk of litigation by third parties, including fund investors dissatisfied with the performance or management of their funds, debt or equity holders of our portfolio companies, and a variety of other potential litigants. See the section entitled “Litigation” appearing in Note 17 “Commitments and Contingencies” of our financial statements included elsewhere in this report. By way of example, we, our funds and certain of our employees are each exposed to the risks of litigation relating to investment activities of our funds and actions taken by the officers and directors (some of whom may be KKR employees) of portfolio companies, such as the risk of shareholder litigation by other shareholders of public companies or holders of debt instruments of companies in which our funds have significant investments. We are also exposed to risks of litigation, investigation or negative publicity in the event of any transactions that are alleged not to have been properly addressed.
To the extent investors in our investment funds suffer losses resulting from fraud, gross negligence, willful misconduct or other similar misconduct, such investors may have remedies against us, our investment funds, our employees or our affiliates. Investors in our funds do not have legal remedies against us, the general partners of our funds, our funds, our employees or our affiliates solely based on their dissatisfaction with the investment performance of those funds. While the general partners and investment advisers to our investment funds, including their directors, officers, employees and affiliates, are generally indemnified to the fullest extent permitted by law with respect to their conduct in connection with the management of the business and affairs of our investment funds, such indemnity generally does not extend to actions determined to have involved fraud, gross negligence, willful misconduct or other similar misconduct.
In addition, we have formed and may continue to form funds targeting retail investors, which may subject us to additional risk of litigation and regulatory scrutiny. See-“Extensive regulation of our businesses affects our activities and creates the potential for significant liabilities and penalties. The possibility of increased regulatory focus or legislative or regulatory changes could adversely affect our business.”
If any civil or criminal lawsuits were brought against us and resulted in a finding of substantial legal liability or culpability, the lawsuit could materially adversely affect our business, financial condition or results of operations or cause significant reputational harm to us, which could seriously impact our business. We depend to a large extent on our business relationships and our reputation for integrity and high caliber professional services to attract and retain fund investors and qualified professionals and to pursue investment opportunities for our funds. As a result, allegations of improper conduct by private litigants or regulators, whether the ultimate outcome is favorable or unfavorable to us, as well as negative publicity and press speculation about us, our investment activities or the private equity industry in general, whether or not valid, may harm our reputation, which may be more damaging to our business than to other types of businesses.
In addition, with a workforce composed of many highly paid professionals, we face the risk of litigation relating to claims for compensation or other damages, which may, individually or in the aggregate, be significant in amount. The cost of settling any such claims could negatively impact our business, financial condition and results of operations.
Misconduct of our employees or by our portfolio companies could harm us by impairing our ability to attract and retain clients and subjecting us to significant legal liability and reputational harm.
There is a risk that our principals and employees could engage in misconduct that adversely affects our business. We are subject to a number of obligations and standards arising from our business and our authority over the assets we manage. The violation of these obligations and standards by any of our employees would adversely affect our clients and us. We may also be adversely affected if there is misconduct by senior management of portfolio companies in which our funds invest, even though we may be unable to control or mitigate such misconduct. Our business often requires that we deal with confidential matters of great significance to companies in which we may invest. If our employees were improperly to use or disclose confidential information, we could suffer serious harm to our reputation, financial position and current and future business relationships, as well as face potentially significant litigation. It is not always possible to detect or deter employee misconduct, and the precautions we take to detect and prevent this activity may not be effective in all cases. If any of our employees or the employees of portfolio companies were to engage in misconduct or were to be accused of such misconduct, our business and our reputation could be adversely affected.
54
Underwriting, syndicating and securities placement activities expose us to risks.
KKR Capital Markets LLC or KCM, a subsidiary of ours, may act as an underwriter, syndicator or placement agent in securities offerings, and our joint venture’s subsidiary, MCS Capital Markets LLC, may also act as an underwriter, syndicator or placement agent in securities offerings. We may incur losses and be subject to reputational harm to the extent that, for any reason, we are unable to sell securities or indebtedness we purchased or placed as an underwriter, syndicator or placement agent at the anticipated price levels. As an underwriter, syndicator or placement agent, we also may be subject to potential liability for material misstatements or omissions in prospectuses and other offering documents relating to offerings we underwrite, syndicate or place.
We are subject to risks in using prime brokers, custodians, administrators and other agents.
Certain of our investment funds and our principal activities depend on the services of prime brokers, custodians, administrators and other agents to carry out certain securities transactions.
In the event of the insolvency of a prime broker and/or custodian, our funds may not be able to recover equivalent assets in full as they will rank among the prime broker’s and custodian’s unsecured creditors in relation to assets which the prime broker or custodian borrows, lends or otherwise uses. In addition, our and our funds’ cash held with a prime broker or custodian may not be segregated from the prime broker’s or custodian’s own cash, and our funds therefore may rank as unsecured creditors in relation thereto. The inability to recover assets from the prime broker or custodian could have a material impact on the performance of our funds and our business, financial condition and results of operations. Counterparties have generally reacted to recent market volatility by tightening their underwriting standards and increasing their margin requirements for all categories of financing, which has the result of decreasing the overall amount of leverage available and increasing the costs of borrowing. Many of our funds have credit lines, and if a lender under one or more of these credit lines were to become insolvent, we may have difficulty replacing the credit line and one or more of our funds may face liquidity problems.
Default risk may arise from events or circumstances that are difficult to detect, foresee or evaluate. In addition, concerns about, or a default by, one large participant could lead to significant liquidity problems for other participants, which may in turn
expose us to significant losses. We may not accurately anticipate the impact of market stress or counterparty financial condition, and as a result, we may not have taken sufficient action to reduce these risks effectively.
Compliance with applicable accounting requirements may materially strain our resources, materially increase our annual expenses and exposes us to other risks.
The SEC may require in the future that we report our financial results under International Financial Reporting Standards, or IFRS, instead of under U.S. GAAP. IFRS is a set of accounting principles that has been gaining acceptance on a worldwide basis. These standards are published by the London‑ based International Accounting Standards Board (“IASB”) and are more focused on objectives and principles and less reliant on detailed rules than U.S. GAAP. Today, there remain significant and material differences in several key areas between U.S. GAAP and IFRS which would affect us if we were required to prepare financial statements in conformity with IFRS. Additionally, U.S. GAAP provides specific guidance in classes of accounting transactions for which equivalent guidance in IFRS does not exist. The adoption of IFRS is highly complex and would have an impact on many aspects and operations of KKR, including but not limited to financial accounting and reporting systems, internal controls, taxes, borrowing covenants and cash management. It is expected that a significant amount of time, internal and external resources and expenses over a multi‑year period would be required for this conversion.
Risks Related to the Assets We Manage
As an investment manager, we sponsor and manage funds that make investments worldwide on behalf of third‑party investors and, in connection with those activities, are required to deploy our own capital in those investments. The investments of these funds are subject to many risks and uncertainties which, to the extent they are material, are discussed below. In addition, we have balance sheet investments and manage those assets on our own behalf. These risks, as they apply to our balance sheet investments, may have a greater impact on our results and financial conditions as we directly bear the full risk of our balance sheet. As a result, the gains and losses on such assets are reflected in our net income and the risks set forth below relating to the assets that we manage will directly affect our operating performance.
55
The historical returns attributable to our funds, including those presented in this report, should not be considered as indicative of the future results of our funds, our balance sheet or of our future results or of any returns on our common units.
We have presented in this report certain information relating to our investment returns, such as net and gross IRRs, multiples of invested capital and realized and unrealized investment values for funds that we have sponsored and managed. The historical and potential future returns of the funds that we manage are not directly linked to returns on KKR Group Partnership Units.
Moreover, historical returns of our funds may not be indicative of the future results that you should expect from us, which could negatively impact the fees and incentive amounts received by us from such funds. In particular, the future results of our funds or balance sheet assets may differ significantly from their historical results including for the following reasons:
|
•
|
the rates of returns of our funds reflect unrealized gains as of the applicable valuation date that may never be realized, which may adversely affect the ultimate value realized from those funds’ investments;
|
|
•
|
the historical returns that we present in this report derive largely from the performance of our earlier private equity funds, whereas future fund returns will depend increasingly on the performance of our newer funds, which may have little or no investment track record, and in particular you will not benefit from any value that was created in our funds prior to the KPE Transaction to the extent such value has been realized and we may be required to repay excess amounts previously received in respect of carried interest in our funds if, upon liquidation of the fund, we have received carried interest distributions in excess of the amount to which we were entitled;
|
|
•
|
the future performance of our funds will be affected by macroeconomic factors, including negative factors arising from disruptions in the global financial markets that were not prevalent in the periods relevant to the historical return data included in this report;
|
|
•
|
in some historical periods, the rates of return of some of our funds have been positively influenced by a number of investments that experienced a substantial decrease in the average holding period of such investments and rapid and substantial increases in value following the dates on which those investments were made; the actual or expected length of holding periods related to investments is likely longer than such historical periods; those trends and rates of return may not be repeated in the future;
|
|
•
|
our newly established funds may generate lower returns during the period that they take to deploy their capital;
|
|
•
|
our funds’ returns have benefited from investment opportunities and general market conditions in certain historical periods that may not repeat themselves, and there can be no assurance that our current or future funds will be able to avail themselves of comparable investment opportunities or market conditions; and
|
|
•
|
we may create new funds and investment products in the future that reflect a different asset mix in terms of allocations among funds, investment strategies, geographic and industry exposure, vintage year and economic terms.
|
In addition, our historical rates of return reflect our historical cost structure, which has varied and may vary further in the future. Certain of our newer funds, for example, have lower fee structures and also have performance hurdles. Future returns will also be affected by the risks described elsewhere in this report, including risks of the industry sectors and businesses in which a particular fund invests and changes in laws. See “-Risks Related to our Business-Difficult market conditions can adversely affect our business in many ways, including by reducing the value or performance of the investments that we manage or by reducing the ability of our funds to raise or deploy capital, each of which could negatively impact our net income and cash flow and adversely affect our financial condition.”
Valuation methodologies for certain assets in our funds and on our balance sheet can be subjective and the fair value of assets established pursuant to such methodologies may never be realized, which could result in significant losses for our funds and us.
There are no readily ascertainable market prices for a substantial majority of illiquid investments of our investment funds, our finance vehicles or other assets on our balance sheet. When determining fair values of investments, we use the last reported market price as of the statement of financial condition date for investments that have readily observable market prices. When an investment does not have a readily available market price, the fair value of the investment represents the value, as determined by us in good faith, at which the investment could be sold in an orderly disposition over a reasonable period of time between
56
willing parties other than in a forced or liquidation sale. There is no single standard for determining fair value in good faith and in many cases fair value is best expressed as a range of fair values from which a single estimate may be derived. When making fair value determinations for our private equity investments, we typically use a market multiples approach that considers a specified financial measure (such as EBITDA) and/or a discounted cash flow analysis. Real asset investments in infrastructure, energy and real estate are valued using one or more of the discounted cash flow analysis, market comparables analysis and direct income capitalization, which in each case incorporates significant assumptions and judgments. Credit investments are valued using values obtained from dealers or market makers, and where these values are not available, credit investments are valued by us based on ranges of valuations determined by an independent valuation firm.
Each of these methodologies requires estimates of key inputs and significant assumptions and judgments. We also consider a range of additional factors that we deem relevant, including the applicability of a control premium or illiquidity discount, the presence of significant unconsolidated assets and liabilities, any favorable or unfavorable tax attributes, the method of likely exit, financial projections, estimates of assumed growth rates, terminal values, discount rates including risk free rates, capital structure, risk premiums and other factors, and determining these factors may involve a significant degree of our management’s judgment and the judgment of management of our portfolio companies.
Because valuations, and in particular valuations of investments for which market quotations are not readily available, are inherently uncertain, may fluctuate over short periods of time and may be based on estimates, determinations of fair value may differ materially from the values that would have resulted if a ready market had existed. Even if market quotations are available for our investments, such quotations may not reflect the value that we would actually be able to realize because of various factors, including possible illiquidity associated with a large ownership position, subsequent illiquidity in the market for a company’s securities, future market price volatility or the potential for a future loss in market value based on poor industry conditions or the market’s view of overall company and management performance. Our partners’ capital could be adversely affected if the values of investments that we record is materially higher than the values that are ultimately realized upon the disposal of the investments and changes in values attributed to investments from quarter to quarter may result in volatility in our AUM and such changes could materially affect the results of operations that we report from period to period. There can be no assurance that the investment values that we record from time to time will ultimately be realized and that we will be able to realize the investment values that are presented in this report.
Because there is significant uncertainty in the valuation of, or in the stability of the value of, illiquid investments, the fair values of investments reflected in an investment fund’s or finance vehicle’s net asset value, or NAV, do not necessarily reflect the prices that would actually be obtained by us on behalf of the fund or finance vehicle when such investments are realized. For example there may be liabilities such as unknown or uncertain tax exposures with respect to investments, especially those outside the United States, which may not be fully reflected in valuations. Realizations at values significantly lower than the values at which investments have been reflected in prior fund NAVs would result in losses for the applicable fund and the loss of potential carried interest and other fees. Also, if realizations of our investments produce values materially different than the carrying values reflected in prior fund NAVs, fund investors may lose confidence in us, which could in turn result in difficulty in raising capital for future funds.
In addition, because we value our entire portfolio only on a quarterly basis, subsequent events that may have a material impact on those valuations may not be reflected until the next quarterly valuation date.
Our investments are impacted by various economic conditions that are difficult to quantify or predict, and may have a significant impact on the valuation of our investments and, therefore, on the investment income we realize and our financial condition and results of operations.
Our investments are impacted by various economic conditions that are difficult to quantify or predict and may have a significant impact on the valuation of our investments and, therefore, on the investment income we realize and our financial condition and results of operations. For example,
|
•
|
Global equity markets, which may be volatile, significantly impact the valuation of our portfolio companies and, therefore, the investment income that we recognize. For our investments that are publicly listed and thus have readily observable market prices, global equity markets have a direct impact on valuation. For other investments, these markets have an indirect impact on valuation as we typically utilize market multiples (i.e. stock price of comparable companies divided by earnings or cash flow) as a critical input to ascertain fair value of our investments that do not have readily observable market prices. In addition, the valuation for any particular period may not be realized at the time of disposition. For example, because our private equity funds often hold very large amounts of the securities of their portfolio companies, the disposition of these securities often takes place over a long period of time, which can further expose us to volatility risk. In addition, the receptivity of equity markets to initial public offerings, or IPOs, as
|
57
well as subsequent secondary equity offerings by companies already public, impacts our ability to realize investment gains. Unfavorable market conditions, market volatility and other factors may also adversely impact the performance of our hedge fund businesses and our strategic partnerships with hedge fund asset managers and the level or pace of subscriptions or redemptions from the funds in these businesses.
|
•
|
Changes in credit markets can also impact valuations and may have offsetting results depending on the valuation methodology used. For example, we typically use a discounted cash flow analysis as one of the methodologies to ascertain the fair value of our investments that do not have readily observable market prices. If applicable interest rates rise, then the assumed cost of capital for those portfolio companies would be expected to increase under the discounted cash flow analysis, and this effect would negatively impact their valuations if not offset by other factors. Rising U.S. interest rates may also negatively impact certain foreign currencies that depend on foreign capital flows. Conversely, a fall in interest rates can positively impact valuations of certain portfolio companies if not offset by other factors. These impacts could be substantial depending upon the magnitude of the change in interest rates. In certain cases, the valuations obtained from the discounted cash flow analysis and the other primary methodology we use, the market multiples approach, may yield different and offsetting results. For example, the positive impact of falling interest rates on discounted cash flow valuations may offset the negative impact of the market multiples valuation approach and may result in less of a decline in value than for those investments that had a readily observable market price. Finally, low interest rates related to monetary stimulus and economic stagnation may also negatively impact expected returns on all investments, as the demand for relatively higher return assets increases and supply decreases.
|
|
•
|
Foreign exchange rates can materially impact the valuations of our investments that are denominated in currencies other than the U.S. dollar. For example, U.S. dollar appreciation relative to other currencies is likely to cause a decrease in the dollar value of non‑U.S. investments to the extent unhedged.
|
|
•
|
Conditions in commodity markets impact the performance of our portfolio companies and other investments in a variety of ways, including through the direct or indirect impact on the cost of the inputs used in their operations as well as the pricing and profitability of the products or services that they sell. The price of commodities has historically been subject to substantial volatility, which among other things, could be driven by economic, monetary, political or weather related factors. If certain of our portfolio companies are unable to raise prices to offset increases in the cost of raw materials or other inputs, or if consumers defer purchases of or seek substitutes for the products of such portfolio companies, such portfolio companies could experience lower operating income which may in turn reduce the valuation of those portfolio companies. The value of energy real asset investments generally increase or decrease with the increase or decrease, respectively, of commodity prices. As we make additional investments in oil and gas companies and assets, the value of our portfolio and the investment income we realize may become increasingly sensitive to oil and gas prices. Apart from our energy real asset investments, a number of our other investments may be dependent to varying degrees on the energy sector through, for example, the provision of equipment and services used in energy exploration and production. These companies may benefit from an increase or suffer from a decline in commodity prices.
|
Changes in these factors can have a significant effect on the results of the valuation methodologies used to value our portfolio, and our reported fair values for these assets could vary materially if these factors from prior quarters were to change significantly. See “Management’s Discussion and Analysis of Financial Condition and Results of Operations-Business Environment.”
Global and regional economic conditions have a substantial impact on the value of investments. See “-Risks Related to Our Business-Difficult market conditions can adversely affect our business in many ways, including by reducing the value or performance of the investments that we manage or by reducing the ability of our funds to raise or deploy capital, each of which could negatively impact our net income and cash flow and adversely affect our financial condition.”
Dependence on significant leverage in investments by our funds and our balance sheet assets could adversely affect our ability to achieve attractive rates of return on those investments.
Because many of our funds’ investments and our balance sheet assets often rely heavily on the use of leverage, our ability to achieve attractive rates of return will depend on our continued ability to access sufficient sources of indebtedness at attractive rates. For example, our credit funds use varying degrees of leverage when making investments. Similarly, in many private equity investments, indebtedness may constitute 70% or more of a portfolio company’s total debt and equity capitalization, including debt that may be incurred in connection with the investment, and a portfolio company’s indebtedness may also increase in recapitalization transactions subsequent to the company’s acquisition. The absence of available sources of sufficient debt financing for extended periods of time could therefore materially and adversely affect our funds and our
58
portfolio companies. Also, an increase in either the general levels of interest rates or in the risk spread demanded by sources of indebtedness such as we experienced during 2009 would make it more expensive to finance those investments. In addition, increases in interest rates could decrease the value of fixed‑rate debt investments that our balance sheet assets, finance vehicles or our funds make. Increases in interest rates could also make it more difficult to locate and consummate private equity and other investments because other potential buyers, including operating companies acting as strategic buyers, may be able to bid for an asset at a higher price due to a lower overall cost of capital or their ability to benefit from a higher amount of cost savings following the acquisition of the asset. In addition, a portion of the indebtedness used to finance private equity investments often includes high‑ yield debt securities issued in the capital markets. Capital markets are volatile, and there may be times when we might not be able to access those markets at attractive rates, or at all, when completing an investment.
Investments in highly leveraged entities are also inherently more sensitive to declines in revenues, increases in expenses and interest rates and adverse economic, market and industry developments. The incurrence of a significant amount of indebtedness by an entity could, among other things:
|
•
|
subject the entity to a number of restrictive covenants, terms and conditions, any violation of which would be viewed by creditors as an event of default and could materially impact our ability to realize value from our investment;
|
|
•
|
allow even moderate reductions in operating cash flow to render it unable to service its indebtedness;
|
|
•
|
give rise to an obligation to make mandatory prepayments of debt using excess cash flow, which might limit the entity’s ability to respond to changing industry conditions to the extent additional cash is needed for the response, to make unplanned but necessary capital expenditures or to take advantage of growth opportunities;
|
|
•
|
limit the entity’s ability to adjust to changing market conditions, thereby placing it at a competitive disadvantage compared to its competitors who have relatively less debt;
|
|
•
|
limit the entity’s ability to engage in strategic acquisitions that might be necessary to generate attractive returns or further growth; and
|
|
•
|
limit the entity’s ability to obtain additional financing or increase the cost of obtaining such financing, including for capital expenditures, working capital or other general corporate purposes.
|
A leveraged company’s income and equity also tend to increase or decrease at a greater rate than would otherwise be the case if money had not been borrowed. As a result, the risk of loss associated with a leveraged company is generally greater than for comparable companies with comparatively less debt. For example, leveraged companies could default on their debt obligations due to a decrease in revenues and cash flow precipitated by an economic downturn or by poor relative performance at such a company. Similarly, the leveraged nature of some of our investments in real assets increases the risk that a decline in the fair value of the underlying real asset will result in their abandonment or foreclosure. For example, if the property-level debt on a particular investment has reached its maturity and the underlying asset value has declined below its debt-level, we may, in absence of cooperation with the lender in regards to a partial debt-write-off, be forced to put the investment into liquidation.
When our existing portfolio investments reach the point when debt incurred to finance those investments matures in significant amounts and must be either repaid or refinanced, those investments may materially suffer if they have generated insufficient cash flow to repay maturing debt and there is insufficient capacity and availability in the financing markets to permit them to refinance maturing debt on satisfactory terms, or at all. If the financing for such purposes were to be unavailable or uneconomic when significant amounts of the debt incurred to finance our existing portfolio investments start to come due, these investments could be materially and adversely affected. In the event of default or potential default under applicable financing arrangements, one or more of our portfolio companies may go bankrupt, which could give rise to substantial investment losses, adverse claims or litigation against us or our employees and damage to our reputation.
Among the sectors particularly challenged by downturns in the global credit markets, including the downturn experienced from 2008 through 2010, are the CLO and leveraged finance markets. We have significant exposure to these markets through our CLO subsidiaries, which we principally acquired in the acquisitions of KFN and Avoca. As of December 31, 2015, we indirectly hold below investment grade corporate loans and securities with a $8.4 billion estimated fair market value through our CLO subsidiaries. Each of these subsidiaries is a special purpose company that issued to us and other investors notes secured by a pool of collateral consisting primarily of corporate leveraged loans. In most cases, our CLO holdings are deeply subordinated, representing the CLO subsidiary’s substantial leverage, which increases both the opportunity for higher returns as well as the magnitude of losses when compared to holders or investors that rank more senior to us in right of payment. These
59
loans and bonds also generally involve a higher degree of risk than investment grade rated debt including the risks described in the paragraphs above. Our CLO subsidiaries have historically experienced an increase in downgrades, depreciations in market value and defaults in respect of leveraged loans in their collateral during downturns in credit markets. The CLOs’ portfolio profile tests set limits on the amount of discounted obligations a CLO can hold. During any time that a CLO issuer exceeds such a limit, the ability of the CLO’s manager to sell assets and reinvest available principal proceeds into substitute assets is restricted. In such circumstances, CLOs may fail certain over‑collateralization tests, which would cause diversions of cash flows away from us as holders of the more junior CLO, which may impact our cash flows. The ability of the CLOs to make interest payments to the holders of the senior notes of those structures is highly dependent upon the performance of the CLO collateral. If the collateral in those structures were to experience a significant decrease in cash flow due to an increased default level, payment of all principal and interest outstanding may be accelerated as a result of an event of default or by holders of the senior notes. There can be no assurance that market conditions giving rise to these types of consequences will not occur, re‑occur, subsist or become more acute in the future. In July 2009, KFN surrendered for cancellation approximately $298.4 million in aggregate of notes issued to it by certain of its CLOs. The surrendered notes were cancelled and the obligations due under such notes were deemed extinguished. Because our CLO structures involve complex collateral and other arrangements, the documentation for such structures is complex, is subject to differing interpretations and involves legal risk. These CLOs have served as long‑term, non‑recourse financing for debt investments and as a way to minimize refinancing risk, minimize maturity risk and secure a fixed cost of funds over an underlying market interest rate. An inability to continue to utilize CLOs or other similar financing vehicles successfully could limit our ability to fund future investments, grow our business or fully execute our business strategy and our results of operations may be adversely affected.
Our CLO subsidiaries regularly use significant leverage to finance their assets. An inability by such subsidiaries to continue to raise or utilize leverage, to refinance or extend the maturities of their outstanding indebtedness or to maintain adequate levels of collateral under the terms of their collateralized loan obligations could limit their ability to grow their business, reinvest principal cash, distribute cash to us or fully execute their business strategy, and our results of operations may be adversely affected. If these subsidiaries are unable to maintain their operating results and access to capital resources, they could face substantial liquidity problems and might be required to dispose of material assets or operations to meet debt service and other obligations. These CLO strategies and the value of the assets of such CLO subsidiaries are also sensitive to changes in interest rates because these strategies rely on borrowed money and because the value of the underlying portfolio loans can fall when interest rates rise. If interest rates on CLO borrowings increase and the interest rates on the portfolio do not also increase, the CLO strategy is unlikely to achieve its projected returns. Also, if interest rates increase in the future, our CLO portfolio will likely experience a reduction in value because it would hold assets receiving below market rates of interest.
Our hedge fund‑of‑funds, long/short credit fund, other credit‑ oriented funds and CLOs may choose to use leverage as part of their respective investment programs and regularly borrow a substantial amount of their capital. The use of leverage poses a significant degree of risk and enhances the possibility of a significant loss in the value of the investment portfolio. A fund may borrow money from time to time to purchase or carry securities or debt obligations or may enter into derivative transactions (such as total return swaps) with counterparties that have embedded leverage. The interest expense and other costs incurred in connection with such borrowing may not be recovered by appreciation in the securities purchased or carried and will be lost-and the timing and magnitude of such losses may be accelerated or exacerbated-in the event of a decline in the market value of such securities or debt obligations. Gains realized with borrowed funds may cause the fund’s net asset value to increase at a faster rate than would be the case without borrowings. However, if investment results fail to cover the cost of borrowings, the fund’s net asset value could also decrease faster than if there had been no borrowings.
Any of the foregoing circumstances could have a material adverse effect on our financial condition, results of operations and cash flow.
The due diligence process that we undertake in connection with our investments may not reveal all facts that may be relevant in connection with an investment.
Before making our investments, we conduct due diligence that we deem reasonable and appropriate based on the facts and circumstances applicable to each investment. The objective of the due diligence process is to identify attractive investment opportunities based on the facts and circumstances surrounding an investment, to identify possible risks associated with that investment and, in the case of private equity investments, to prepare a framework that may be used from the date of an acquisition to drive operational achievement and value creation. When conducting due diligence, we typically evaluate a number of important business, financial, tax, accounting, environmental and legal issues in determining whether or not to proceed with an investment. Outside consultants, legal advisors, accountants and investment banks are involved in the due diligence process in varying degrees depending on the type of investment. Nevertheless, when conducting due diligence and making an assessment regarding an investment, we rely on resources available to us, including information provided by the
60
target of the investment and, in some circumstances, third‑party investigations. The due diligence process may at times be subjective with respect to newly organized companies or carve-out transactions for which only limited information is available.
Instances of bribery, fraud, accounting irregularities and other improper, illegal or corrupt practices can be difficult to detect, and fraud and other deceptive practices can be widespread in certain jurisdictions. Several of our funds invest in emerging market countries that may not have established laws and regulations that are as stringent as in more developed nations, or where existing laws and regulations may not be consistently enforced. For example, our funds invest throughout jurisdictions that have material perceptions of corruption according to international rating standards (such as Transparency International and Corruption Perceptions Index) such as China, India, Indonesia, Latin America, the Middle East and Africa. Due diligence on investment opportunities in these jurisdictions is frequently more complicated because consistent and uniform commercial practices in such locations may not have developed. Bribery, fraud, accounting irregularities and corrupt practices can be especially difficult to detect in such locations.
The due diligence conducted for certain of our Public Markets strategies is limited to publicly available information. Accordingly, we cannot be certain that the due diligence investigation that we will carry out with respect to any investment opportunity will reveal or highlight all relevant facts (including fraud, bribery and other illegal activities and contingent liabilities) that may be necessary or helpful in evaluating such investment opportunity, including the existence of contingent liabilities. We also cannot be certain that our due diligence investigations will result in investments being successful or that the actual financial performance of an investment will not fall short of the financial projections we used when evaluating that investment.
When we conduct due diligence in making and monitoring investments in third party hedge funds, we rely on information supplied by third party hedge funds or by service providers to such third party hedge funds. The information we receive from them may not be accurate or complete and therefore we may not have all the relevant facts necessary to properly assess and monitor our funds’ investment in a particular hedge fund.
Our investment management activities involve investments in relatively high‑risk, illiquid assets, and we may fail to realize any profits from these activities for a considerable period of time or lose some or all of the capital invested.
Many of our funds and our balance sheet may hold investments in securities that are not publicly traded. In many cases, our funds or we may be prohibited by contract or by applicable securities laws from selling such securities at many points in time. Our funds or we will generally not be able to sell these securities publicly unless their sale is registered under applicable securities laws, or unless an exemption from such registration is available, and then only at such times when we do not possess material nonpublic information. The ability of many of our funds or us to dispose of investments is heavily dependent on the capital markets and in particular the public equity markets. For example, the ability to realize any value from an investment may depend upon the ability to complete an initial public offering of the portfolio company in which such investment is made. Even if the securities are publicly traded, large holdings of securities can often be disposed of only over a substantial length of time, exposing our investment returns to risks of downward movement in market prices during the intended disposition period. Moreover, because the investment strategy of many of our funds, particularly our private equity funds, often entails or having representation on our funds' public portfolio company boards, our funds may be restricted in their ability to effect such sales during certain time periods. As certain of our funds have a finite term, we could also be forced to dispose of investments sooner than otherwise desirable. Accordingly, under certain conditions, our funds may be forced to either sell securities at lower prices than they had expected to realize or defer sales that they had planned to make, potentially for a considerable period of time. Moreover, we may determine that we may be required to sell our balance sheet assets alongside our funds’ investments at such times. We have made and expect to continue to make significant capital investments in our current and future funds and other strategies. Contributing capital to these funds is risky, and we may lose some or all of the principal amount of our investments.
Our investments are subject to a number of inherent risks.
Our results are highly dependent on our continued ability to generate attractive returns from our investments. Investments made by our private equity, credit or other investments involve a number of significant risks inherent to private equity, credit and other investing, including the following:
|
•
|
companies in which investments are made may have limited financial resources and may be unable to meet their obligations under their securities, which may be accompanied by a deterioration in the value of their equity securities or any collateral or guarantees provided with respect to their debt;
|
61
|
•
|
companies in which investments are made are more likely to depend on the management talents and efforts of a small group of persons and, as a result, the death, disability, resignation or termination of one or more of those persons could have a material adverse impact on their business and prospects;
|
|
•
|
companies in which private equity investments are made may be businesses or divisions acquired from larger operating entities which may require a rebuilding or replacement of financial reporting, information technology, operational and other functions;
|
|
•
|
companies in which investments are made may from time to time be parties to litigation, may be engaged in rapidly changing businesses with products subject to a substantial risk of obsolescence and may require substantial additional capital to support their operations, finance expansion or maintain their competitive position;
|
|
•
|
instances of bribery, fraud and other deceptive practices committed by senior management of portfolio companies in which our funds or we invest may undermine our due diligence efforts with respect to such companies, and if such fraud is discovered, negatively affect the valuation of a fund’s investments as well as contribute to overall market volatility that can negatively impact a fund’s or our investment program;
|
|
•
|
our funds may make investments that they do not advantageously dispose of prior to the date the applicable fund is dissolved, either by expiration of such fund’s term or otherwise, resulting in a lower than expected return on the investments and, potentially, on the fund itself;
|
|
•
|
our portfolio companies generally have capital structures established on the basis of financial projections based primarily on management judgments and assumptions, and general economic conditions and other factors may cause actual performance to fall short of these financial projections, which could cause a substantial decrease in the value of our equity holdings in the portfolio company and cause our funds’ or our performance to fall short of our expectations;
|
|
•
|
executive officers, directors and employees of an equity sponsor may be named as defendants in litigation involving a company in which an investment is made or is being made, and we or our funds may indemnify such executive officers, directors or employees for liability relating to such litigation;
|
|
•
|
we advise funds that invest in businesses that operate in a variety of industries that are subject to extensive domestic and foreign regulation (including companies that supply services to governmental agencies), such as the telecommunications industry, the defense and government services industry, the healthcare industry and oil and gas industry, that may involve greater risk due to rapidly changing market and governmental conditions in those sectors;
|
|
•
|
our transactions involve complex tax structuring that could be challenged or disregarded, which may result in losing treaty benefits or would otherwise adversely impact our investments; and
|
|
•
|
significant failures of our portfolio companies to comply with laws and regulations applicable to them could affect the ability of our funds or us to invest in other companies in certain industries in the future and could harm our reputation;
|
Our investments in real assets such as real estate, infrastructure assets and energy may expose us to increased risks and liabilities and may expose our unitholders to adverse tax consequences.
Investments in real assets, which may include real estate, infrastructure assets, oil and gas properties and other energy assets, may expose us to increased risks and liabilities that are inherent in the ownership of real assets. For example,
|
•
|
Ownership of real assets in our funds or vehicles may increase our risk of liability under environmental laws that impose, regardless of fault, joint and several liability for the cost of remediating contamination and compensation for damages. In addition, changes in environmental laws or regulations or the environmental condition of an investment may create liabilities that did not exist at the time of acquisition that would not have been foreseen. Even in cases where we are indemnified by a seller with respect to an investment against liabilities arising out of violations of environmental laws and regulations, there can be no assurance as to the financial viability of the seller to satisfy such indemnities or our ability to achieve enforcement of such indemnities.
|
|
•
|
Ownership of real assets may also present additional risk of liability for personal and property injury or impose significant operating challenges and costs, for example with respect to compliance with zoning, environmental or other applicable laws.
|
62
|
•
|
Real asset investments may face construction risks, without limitation: (i) labor disputes, shortages of material and skilled labor, or work stoppages; (ii) slower than projected construction progress and the unavailability or late delivery of necessary equipment; (iii) less than optimal coordination with public utilities in the relocation of their facilities; (iv) adverse weather conditions and unexpected construction conditions; (v) accidents or the breakdown or failure of construction equipment or processes; (vi) catastrophic events such as explosions, fires, and terrorist activities, and other similar events and (vii) risks associated with holding direct or indirect interests in undeveloped land or underdeveloped real property. These risks could result in substantial unanticipated delays or expenses (which may exceed expected or forecasted budgets) and, under certain circumstances, could prevent completion of construction activities once undertaken. Certain real asset investments may remain in construction phases for a prolonged period and, accordingly, may not be cash generative for a prolonged period. Recourse against the contractor may be subject to liability caps or may be subject to default or insolvency on the part of the contractor.
|
|
•
|
The operation of real assets is exposed to potential unplanned interruptions caused by significant catastrophic or force majeure events. These risks could, among other effects, adversely impact the cash flows available from investments in real assets, cause personal injury or loss of life, damage property, or instigate disruptions of service. In addition, the cost of repairing or replacing damaged assets could be considerable. Repeated or prolonged service interruptions may result in permanent loss of customers, litigation, or penalties for regulatory or contractual non‑compliance. Force majeure events that are incapable of, or too costly to, cure may also have a permanent adverse effect on an investment.
|
|
•
|
The management of the business or operations of a real asset may be contracted to a third‑party management company unaffiliated with us. Although it would be possible to replace any such operator, the failure of such an operator to adequately perform its duties or to act in ways that are in the portfolio company’s best interest, or the breach by an operator of applicable agreements or laws, rules, and regulations, could have an adverse effect on the investment’s financial condition or results of operations. Real asset investments may involve the subcontracting of design and construction activities in respect of projects, and as a result our investments are subject to the risk that contractual provisions passing liabilities to a subcontractor could be ineffective, the subcontractor fails to perform services which it has agreed to provide and in cases where a single subcontractor provides services to various investments, the subcontractor becomes insolvent.
|
Without limiting the foregoing disclosure, we note that investments that we have made and will continue to make in the oil and gas industries may present specific environmental, safety and other inherent risks, and such investments are subject to stringent and complex foreign, federal, state and local laws, ordinances and regulations specific to oil and gas industries, for example governing controls, taxes, transportation of oil and natural gas, exploration and production, permitting, and various conservation laws and regulations applicable to oil and natural gas production and related operations in addition to regulations governing occupational health and safety, the discharge of materials into the environment or otherwise relating to environmental protection. Failure to comply with applicable laws and regulations may result in the assessment of administrative, civil and criminal penalties, the imposition of remedial obligations and the issuance of orders enjoining some or all of our operations in affected areas. These laws and regulations may also restrict the rate of oil and natural gas production below the rate that would otherwise be possible and increase the cost of production thus reducing profitability. Our oil and gas investments are subject to other risks, such as:
|
•
|
The acquisition of oil and gas properties at appropriate prices.
|
|
•
|
Currently unforeseen environmental incidents may occur or past non‑ compliance with environmental laws or regulations may be discovered making it difficult to predict the future costs or impact of compliance.
|
|
•
|
The oil and gas industries present inherent risk of personal and property injury, for which we may not be fully insured.
|
|
•
|
The use of new technologies, including hydraulic fracturing.
|
|
•
|
Our estimated oil, natural gas, and natural gas liquids reserve quantities and future production rates are based on many assumptions that may prove to be inaccurate. Any material inaccuracies in these reserve estimates or the underlying assumptions will materially affect the quantities and value of our reserves.
|
|
•
|
The performance of our energy investments depend on the skill, ability and decisions of third party operators. The success of our investment will depend on their exploitation, development, construction and drilling activities and the timing and cost of drilling, completing and operating wells. Failure of such operators to comply with applicable laws, rules and regulations could result in liabilities to us, reduce the value of our interest in the oil and natural gas properties, adversely affect our cash flows and results of operations.
|
63
|
•
|
If commodity prices decline and remain depressed for a prolonged period, a significant portion of our development projects may become uneconomic and cause write downs of the value of our oil and natural gas properties, which may reduce the value of our energy investments, have a negative impact on our ability to use these investments as collateral or otherwise have a material adverse effect on our results of operations.
|
Investments in real estate are subject to the risks inherent in the ownership and operation of real estate and real estate related businesses and assets. These risks include those associated with the burdens of ownership of real property, general and local economic conditions, changes in supply of and demand for competing properties in an area (as a result, for instance, of overbuilding), fluctuations in the average occupancy, the financial resources of tenants, changes in building, environmental and other laws, energy and supply shortages, various uninsured or uninsurable risks, natural disasters, changes in government regulations (such as rent control), changes in real property tax rates, changes in interest rates, the reduced availability of mortgage funds which may render the sale or refinancing of properties difficult or impracticable, negative developments in the economy that depress travel activity, environmental liabilities, contingent liabilities on disposition of assets, terrorist attacks, war and other factors that are beyond our control.
|
•
|
The success of certain investments will depend on the ability to restructure and effect improvements in the operations of the applicable properties, and there is no assurance, we will be successful in identifying or implementing such restructuring programs and improvements.
|
|
•
|
If we acquire direct or indirect interests in undeveloped land or underdeveloped real property, which may often be non‑income producing, they will be subject to the risks normally associated with such assets and development activities, including risks relating to the availability and timely receipt of zoning and other regulatory or environmental approvals, the cost and timely completion of construction (including risks beyond the control of our fund, such as weather or labor conditions or material shortages) and the availability of both construction and permanent financing on favorable terms.
|
|
•
|
The strategy of our real estate funds may be based, in part, on the availability for purchase of assets at favorable prices, and upon the continuation or improvement of market conditions, or on the availability of refinancing. No assurance can be given that the real estate businesses or assets can be acquired or disposed of at favorable prices or that refinancing will be available.
|
|
•
|
Lenders in commercial real estate financing customarily will require a “bad boy” guarantee, which typically provides that the lender can recover losses from the guarantors for certain bad acts, such as fraud or intentional misrepresentation, intentional waste, willful misconduct, criminal acts, misappropriation of funds, voluntary incurrence of prohibited debt and environmental losses sustained by lender. For our acquisitions, “bad boy” guarantees would generally be extended by our funds, our balance sheet or a combination of both depending on the ownership of the relevant asset. In addition, “bad boy” guarantees typically provide that the loan will be a full personal recourse obligation of the guarantor, for certain actions, such as prohibited transfers of the collateral or changes of control and voluntary bankruptcy of the borrower. It is expected that commercial real estate financing arrangements generally will require “bad boy” guarantees and in the event that such a guarantee is called, a fund’s or our assets could be adversely affected. Moreover, “bad boy” guarantees could apply to actions of the joint venture partners associated with the investments, and in certain cases the acts of such joint venture partner could result in liability to our funds or us under such guarantees.
|
|
•
|
The acquisition, ownership and disposition of real properties carry certain specific litigation risks. Litigation may be commenced with respect to a property acquired in relation to activities that took place prior to the acquisition of such property. In addition, at the time of disposition, other potential buyers may bring claims related to the asset or for due diligence expenses or other damages. After the sale of a real estate asset, buyers may later sue our funds or us for losses associated with latent defects or other problems not uncovered in due diligence.
|
|
•
|
Our funds or we may be subject to certain risks associated with investments in particular assets. Real estate investment trusts (or REITs) be affected by changes in the value of their underlying properties and by defaults by borrowers or tenants. REITs depend on their ability to generate cash flow to make distributions and may be impacted by changes in tax laws or by a failure to qualify for tax‑free pass through income. Investments in real estate debt investments may be unsecured and subordinated to a substantial amount of indebtedness. Such debt investments may not be protected by financial covenants. Non‑performing real estate loans may require a substantial amount of workout negotiations and/or restructuring, which may entail, among other things, a substantial reduction in the interest rate and a substantial write-down of the principal of such loan. Investments in commercial mortgage loans are subject to risks of delinquency and foreclosure, and risks of loss. In the event of any default under a mortgage loan held directly by our fund or us, our fund or we will bear a risk of loss of principal to the extent of any deficiency between the value of the
|
64
collateral and the principal to the extent of any deficiency between the value of the collateral the principal and accrued interest of the loan. Investments in assets or businesses that are distressed may have little or no near term cash flow and involve a high degree of risk. Such investments subject to bankruptcy or insolvency could be subordinated or disallowed.
Infrastructure investments often involve an ongoing commitment to a municipal, state, federal or foreign government or regulatory agencies. The nature of these obligations exposes the owners of infrastructure investments to a higher level of regulatory control than typically imposed on other businesses. They may also rely on complex government licenses, concessions, leases or contracts, which may be difficult to obtain or maintain. Revenues for such investments may rely on contractual agreements for the provision of services with a limited number of counterparties, and are consequently subject to counterparty default risk. The operations and cash flow of infrastructure investments are also more sensitive to inflation and, in certain cases, commodity price risk. Furthermore, services provided by infrastructure investments may be subject to rate regulations by government entities that determines or limits prices that may be charged. Similarly, users of applicable services or government entities in response to such users may react negatively to any adjustments in rates reducing the profitability of such infrastructure investments.
In addition, investments in real assets may cause adverse tax consequences for certain non‑U.S. unitholders regarding income effectively connected with the conduct of a U.S. trade or business and the imposition of certain tax withholding. Please see “-Risks Related to U.S. Taxation-Non‑ U.S. persons face unique U.S. tax issues from owning our common units that may result in adverse tax consequences to them”. Moreover, investments in real assets may also require all our unitholders to file tax returns and pay taxes in various state and local jurisdictions in the U.S. and abroad where these real assets are located. Please see “Risks Related to U.S. Taxation-Holders of our common units may be subject to state, local and foreign taxes and return filing requirements as a result of owning such common units”.
Certain of our funds and CLOs and our firm through our principal assets hold high‑yield, below investment grade or unrated debt, or securities of companies that are experiencing significant financial or business difficulties, which generally entail greater risk, and if those losses are realized, it could adversely affect our results of operations, and our cash available for distribution to unitholders.
Certain of our funds and CLOs in our Public Markets segment and our firm through our principal assets invest in below investment grade or unrated debt, including corporate loans and bonds, each of which generally involves a higher degree of risk than investment grade rated debt, and may be less liquid. Issuers of high yield or unrated debt may be highly leveraged, and their relatively high debt‑to‑equity ratios create increased risks that their operations might not generate sufficient cash flow to service their debt obligations. As a result, high yield or unrated debt is often less liquid than investment grade rated debt. Also, investments may be made in loans and other forms of debt that are not marketable securities and therefore are not liquid. In the absence of appropriate hedging measures, changes in interest rates generally will also cause the value of debt investments to vary inversely to such changes. The obligor of a debt security or instrument may not be able or willing to pay interest or to repay principal when due in accordance with the terms of the associated agreement and collateral may not be available or sufficient to cover such liabilities. Commercial bank lenders and other creditors may be able to contest payments to the holders of other debt obligations of the same obligor in the event of default under their commercial bank loan agreements. Sub‑participation interests in syndicated debt may be subject to certain risks as a result of having no direct contractual relationship with underlying borrowers. Debt securities and instruments may be rated below investment grade by recognized rating agencies or unrated and face ongoing uncertainties and exposure to adverse business, financial or economic conditions and the issuer’s failure to make timely interest and principal payments.
Certain of our investment funds, especially in our special situations strategy, and our firm through principal assets may hold interests in business enterprises involved in work‑outs, liquidations, reorganizations, bankruptcies and similar transactions and may purchase high risk receivables. An investment in such business enterprises entails the risk that the transaction in which such business enterprise is involved either will be unsuccessful, will take considerable time or will result in a distribution of cash or a new security the value of which will be less than the purchase price to the fund of the security or other financial instrument in respect of which such distribution is received. In addition, if an anticipated transaction does not in fact occur, we or the fund may be required to sell the investment at a loss. Investments in troubled companies may also be adversely affected by U.S. federal and state and non‑U.S. laws relating to, among other things, fraudulent conveyances, voidable preferences, lender liability and a bankruptcy court’s discretionary power to disallow, subordinate or disenfranchise particular claims. Investments in securities and private claims of troubled companies made in connection with an attempt to influence a restructuring proposal or plan of reorganization in a bankruptcy case may also involve substantial litigation, which has the potential to adversely impact us or unrelated funds or portfolio companies. Because there is substantial uncertainty concerning the outcome of transactions involving financially troubled companies, there is a potential risk of loss of the entire investment in
65
such company. Such investments involve a substantial degree of risk, and a decline in value of the assets would have a material adverse effect on our financial performance.
Our investment in Nephila is exposed to natural catastrophe and weather risk.
Our investment in Nephila, an investment manager focused on investing in natural catastrophe and weather risk, is exposed to a risk of reduced revenues resulting from natural disasters. Because catastrophic loss events are by their nature unpredictable, historical results of operations of Nephila may not be indicative of its future results of operations. As a result of the occurrence of one or more major catastrophes in any given period, the expected returns from this investment may fall short of our expectations.
We often pursue investment opportunities that involve business, regulatory, legal or other complexities.
As an element of our investment style, we often pursue complex investment opportunities. This can often take the form of substantial business, regulatory or legal complexity that would deter other investment managers. Our tolerance for complexity presents risks, as such transactions can be more difficult, expensive and time consuming to finance and execute; it can be more difficult to manage or realize value from the assets acquired in such transactions; and such transactions sometimes entail a higher level of regulatory scrutiny, the application of complex tax laws or a greater risk of contingent liabilities. Our transactions involve complex tax structures that are costly to establish, monitor and maintain, and as we pursue a larger number of transactions across multiple assets classes and in multiple jurisdictions, such costs will increase and the risk that a tax matter is overlooked or inadequately or inconsistently addressed will increase. Consequently, we may fail to achieve the desired tax benefit or otherwise decrease the returns of our investments or damage the reputation of our firm. Changes in law and regulation and in the enforcement of existing law and regulation, such as antitrust laws and tax laws, also adds complexity and risk to our business. Further, we, directly or through our funds, may acquire an investment that is subject to contingent liabilities, which could be unknown to us at the time of acquisition or, if they are known to us, we may not accurately assess or protect against the risks that they present. Acquired contingent liabilities could thus result in unforeseen losses for us or our funds. In addition, in connection with the disposition of an investment in a portfolio company, we or a fund may be required to make representations about the business and financial affairs of such portfolio company typical of those made in connection with the sale of a business. We or a fund may also be required to indemnify the purchasers of such investment to the extent that any such representations are inaccurate. These arrangements may result in the incurrence of contingent liabilities by us or a fund, even after the disposition of an investment. Any of these risks could harm the performance of us or our funds.
Our private equity investments are typically among the largest in the industry, which involves certain complexities and risks that are not encountered in small‑ and medium‑sized investments.
Our private equity funds make investments in companies with relatively large capitalizations, which involves certain complexities and risks that are not encountered in small‑ and medium‑sized investments. For example, larger transactions may be more difficult to finance and exiting larger deals may present incremental challenges. In addition, larger transactions may pose greater challenges in implementing changes in the company’s management, culture, finances or operations, and may entail greater scrutiny by regulators, interest groups and other third parties. These constituencies may be more active in opposing some larger investments by certain private equity firms.
In some transactions, the amount of equity capital that is required to complete a large capitalization private equity transaction may be significant and are required to be structured as a consortium transaction. A consortium transaction involves an equity investment in which two or more other private equity firms serve together or collectively as equity sponsors. While we have sought to limit where possible the amount of consortium transactions in which we have been involved, we have participated in a significant number of those transactions. Consortium transactions generally entail a reduced level of control by our firm over the investment because governance rights must be shared with the other consortium investors. Accordingly, we may not be able to control decisions relating to a consortium investment, including decisions relating to the management and operation of the company and the timing and nature of any exit, which could result in the risks described in “-Our funds have made investments in companies that we do not control, exposing us to the risk of decisions made by others with which we may not agree.” Any of these factors could increase the risk that our larger investments could be less successful. The consequences to our investment funds of an unsuccessful larger investment could be more severe given the size of the investment. Moreover, we have significant co‑investments in such large investments, and as a result the poor performance of any such large investment may have a material adverse impact on our financial results. See “-We and certain of our funds may make a limited number of investments, or investments that are concentrated in certain geographic regions or asset types, which could negatively affect our performance or the performance of our funds to the extent those concentrated investments perform poorly” and “-Because we hold interests in some of our portfolio companies both through our management of private equity
66
funds as well as through separate investments in those funds and direct co‑investments, fluctuation in the fair values of these portfolio companies may have a disproportionate impact on the investment income earned by us.”
We and our funds have made investments in companies that we do not control, exposing us to the risk of decisions made by others with which we may not agree.
We and our funds and accounts hold investments that include debt instruments and equity securities of companies that we do not control, and such investments may comprise an increasing part of our business. Such instruments and securities may be acquired by our funds and accounts through trading activities or through purchases of securities from the issuer or we may purchase such instruments and securities on a principal basis. In addition, our funds and accounts may acquire minority equity interests, particularly when making private equity investments in Asia or sponsoring investments as part of a large investor consortium or through many of our Public Markets funds, and may also dispose of a portion of their majority equity investments in portfolio companies over time in a manner that results in the funds or accounts retaining a minority investment. We and our funds, including our newer private equity funds, have made certain minority investments in publicly traded companies. We have also increasingly made minority investments in companies including hedge fund managers with our balance sheet assets. Transactions made by companies we do not control could be viewed as unwanted, damage our reputation, and consequently impair our ability to source transactions in the future. Those investments will be subject to the risk that the company in which the investment is made may make business, financial or management decisions with which we do not agree or that the majority stakeholders or the management of the company may take risks or otherwise act in a manner that does not serve our interests. These companies may be subject to complex regulatory requirements and instances of non-compliance by them may subject us to reputational harm or in certain cases, liability. We are also reliant on the systems and processes of these companies including for financial information and valuations of our investments in or with them, including hedge fund managers and their funds, but we do not control the decisions and judgments made during such processes. Our investments in hedge fund managers through our stakes and seeding business may subject us to additional regulatory complexities or scrutiny if we are deemed to control the company for regulatory purposes, despite our minority interest. These asset managers may also be dependent on their founders and other key persons, and the loss of these key personnel could adversely impact our investment. If any of the foregoing were to occur, the value of the investments held by our funds or accounts or by us could decrease and our financial condition, results of operations and cash flow could be adversely affected.
We make investments in companies that are based outside of the United States, which may expose us to additional risks not typically associated with investing in companies that are based in the United States.
Many of our funds, vehicles and accounts invest or have the flexibility to invest a significant portion of their assets in the equity, debt, loans or other securities of issuers that are based outside of the United States. A substantial amount of these investments consist of private equity investments made by our private equity funds. For example, as of December 31, 2015, approximately 49% of the unrealized value of the investments of those funds and accounts was attributable to foreign investments. Investing in companies that are based or have significant operations in countries outside of the United States and, in particular, in emerging markets such as China and India, Eastern Europe, countries in south and southeast Asia, Brazil, Latin America and Africa, involves risks and considerations that are not typically associated with investments in companies established in the United States. These risks may include the following:
|
•
|
the possibility of exchange control regulations, restrictions on repatriation of profit on investments or of capital invested, political and social instability, nationalization or expropriation of assets;
|
|
•
|
the imposition of non‑U.S. taxes and changes in tax law;
|
|
•
|
differences in the legal and regulatory environment, for example the recognition of information barriers, or enhanced legal and regulatory compliance;
|
|
•
|
greater levels of corruption and potential exposure to the FCPA and other laws that prohibit improper payments or offers of payments to foreign governments, their officials and other third parties;
|
|
•
|
violations of sanctions regimes;
|
|
•
|
limitations on borrowings to be used to fund acquisitions or dividends;
|
|
•
|
limitations on permissible counterparties in our transactions or consolidation rules that effectively restrict the types of businesses in which we may invest;
|
67
|
•
|
political risks generally, including political hostility to investments by foreign or private equity investors;
|
|
•
|
less liquid markets;
|
|
•
|
reliance on a more limited number of commodity inputs, service providers and/or distribution mechanisms;
|
|
•
|
adverse fluctuations in currency exchange rates and costs associated with conversion of investment principal and income from one currency into another;
|
|
•
|
higher rates of inflation;
|
|
•
|
less available current information about an issuer;
|
|
•
|
higher transaction costs;
|
|
•
|
less government supervision of exchanges, brokers and issuers;
|
|
•
|
less developed bankruptcy and other laws;
|
|
•
|
greater application of concepts like equitable subordination, which may, in bankruptcy or insolvency, result in the subordination of debt or other senior interests held by our investment funds, vehicles or accounts in companies in which our investment funds, vehicles or accounts also hold equity interests;
|
|
•
|
difficulty in enforcing contractual obligations;
|
|
•
|
lack of uniform accounting, auditing and financial reporting standards;
|
|
•
|
less stringent requirements relating to fiduciary duties;
|
|
•
|
fewer investor protections; and
|
|
•
|
greater price volatility.
|
As a result of the complexity of and lack of clear laws, precedent or authority with respect to the application of various income tax laws to our structures, the application of rules governing how transactions and structures should be reported is also subject to differing interpretations. In particular, certain jurisdictions have either proposed or adopted rules that seek to limit the amount of interest that may be deductible where the lender and the borrower are related parties (or where third party borrowings have been guaranteed by a related party) and in some cases, without regard to whether the lender is a related party, or may seek to interpret existing rules in a more restrictive manner. In addition, the tax authorities of certain countries have sought to disallow tax deductions for transaction and certain other costs at the portfolio company level either on the basis that the entity claiming the deduction does not benefit from the costs incurred or on other grounds. These measures will most likely adversely affect portfolio companies in those jurisdictions in which our investment funds have investments, and limit the benefits of additional investments in those countries. Our business is also subject to the risk that similar measures might be introduced in other countries in which our investment funds currently have investments or plan to invest in the future, or that other legislative or regulatory measures that negatively affect their respective portfolio investments might be promulgated in any of the countries in which they invest.
In addition, certain countries such as Australia, China, India, Japan, Brazil and South Korea, where we have made investments, have sought to tax investment gains derived by nonresident investors, including private equity funds, from the disposition of the equity in companies operating in those countries. In some cases this development is the result of new legislation or changes in the interpretation of existing legislation and local authority assertions that investors have a local taxable presence or are holding companies for trading purposes rather than for capital purposes, or are not otherwise entitled to treaty benefits.
Further, the tax authorities in certain countries, such as Australia, Belgium, China, India, Japan, Denmark, Germany, and South Korea have sought to deny the benefits of income tax treaties or EU Directives with respect to withholding taxes on interest and dividends and capital gains, of nonresident entities. Benefits of income tax treaties or EU Directives could be denied under each country's general anti-avoidance rules or on the basis that the entity benefiting from such treaty or Directive
68
is not the owner of the income, is a mere conduit inserted primarily to access treaty benefits or Directives, or otherwise lacks substance.
These various proposals and initiatives could result in an increase in taxes paid by our funds and/or increased tax withholding with respect to our investors.
In July 2013, the Organisation for Economic Co-operation and Development ("OECD") published its Action Plan on Base Erosion and Profit Shifting ("BEPS"). The OECD released its final reports in October 2015 describing measures for a reform of the international tax rules to be implemented by the member states by the end of 2016. The BEPS project looks at various different ways in which domestic tax rules around the world, and the bilateral double tax treaties that govern the interplay between them, could be amended to address issues such as "double non-taxation" or "profit shifting". Among measures published by the OECD, there are specific Actions to prevent treaty abuse, the deductibility of interest expense and neutralizing the effects of certain hybrid mismatch arrangements which are potentially very relevant to some of our structures and could have an adverse tax impact on our funds, investors and/or our portfolio companies.
As a result of the complexity of our structures, foreign jurisdictions may seek to tax an additional portion of the fee income associated with our management advisory activity. Foreign jurisdictions may assert that an additional amount of fee income is subject to local tax, potentially reducing our profits associated with such income, although this risk may be mitigated by the availability of foreign tax credits. We or our funds may also inadvertently establish a taxable presence in a jurisdiction because of activities conducted there. Compliance with tax laws and structures in these jurisdictions and the costs of adapting to changes in tax policies require significant oversight and cost.
Although we expect that most of the capital commitments of our funds, vehicles and accounts will be denominated in U.S. dollars, our investments and capital commitments that are denominated in a foreign currency, such as euro, will be subject to the risk that the value of a particular currency will change in relation to one or more other currencies. Among the factors that may affect currency values are trade balances, the ability of countries to pay their national debt, levels of short‑term interest rates, differences in relative values of similar assets in different currencies, long‑term opportunities for investment and capital appreciation and political developments. We may employ hedging techniques to minimize these risks, but we can offer no assurance that such strategies will be effective or even available at all. If we engage in hedging transactions, we may be exposed to additional risks associated with such transactions. See “-Risk management activities may adversely affect the return on our investments.” Furthermore, we or our funds have and expect to continue to invest in European companies and companies that have operations that may be affected by the Eurozone economy. While concerns about sovereign defaults and the possibility that one or more countries might leave the European Union or the Eurozone are unresolved, such an event or austerity and other measures introduced in order to limit or contain these issues, could have a material adverse effect on investments by our funds in European companies. Legal uncertainty about the funding of euro denominated obligations following any break up of or exits from the Eurozone could also materially adversely affect a fund.
Third party investors in our funds with commitment‑based structures may not satisfy their contractual obligation to fund capital calls when requested by us, which could adversely affect a fund’s operations and performance.
Investors in certain of our funds make capital commitments to those funds that the funds are entitled to call from those investors at any time during prescribed periods. We depend on fund investors fulfilling their commitments when we call capital from them in order for such funds to consummate investments and otherwise pay their obligations (for example, management fees) when due. Any fund investor that did not fund a capital call would generally be subject to several possible penalties, including having a significant amount of existing investment forfeited in that fund. However, the impact of the penalty is directly correlated to the amount of capital previously invested by the investor in the fund and if an investor has invested little or no capital, for instance early in the life of the fund, then the forfeiture penalty may not be as meaningful. Investors may in the future also negotiate for lesser or reduced penalties at the outset of the fund, thereby inhibiting our ability to enforce the funding of a capital call. If our fund investors were to fail to satisfy a significant amount of capital calls for any particular fund or funds, the operation and performance of those funds could be materially and adversely affected.
Our equity investments and many of our debt investments often rank junior to investments made by others, exposing us to greater risk of losing our investment.
In many cases, the companies in which we or our funds invest have, or are permitted to have, outstanding indebtedness or equity securities that rank senior to our or our fund’s investment. By their terms, such instruments may provide that their holders are entitled to receive payments of distributions, interest or principal on or before the dates on which payments are to be made in respect of our investment. Also, in the event of insolvency, liquidation, dissolution, reorganization or bankruptcy of a company in which an investment is made, holders of securities ranking senior to our investment would typically be entitled to
69
receive payment in full before distributions could be made in respect of its investment. In addition, debt investments made by us or our funds in our portfolio companies may be equitably subordinated to the debt investments made by third parties in our portfolio companies. After repaying senior security holders, the company may not have any remaining assets to use for repaying amounts owed in respect of our investment. To the extent that any assets remain, holders of claims that rank equally with our investment would be entitled to share on an equal and ratable basis in distributions that are made out of those assets. Also, during periods of financial distress or following an insolvency, the ability of us or our funds to influence a company’s affairs and to take actions to protect an investment may be substantially less than that of the senior creditors.
Risk management activities may adversely affect the return on our investments.
When managing exposure to market risks, we employ hedging strategies or certain forms of derivative instruments to limit our exposure to changes in the relative values of investments that may result from market developments, including changes in prevailing interest rates and currency exchange rates. The scope of risk management activities undertaken by us is selective and varies based on the level and volatility of interest rates, prevailing foreign currency exchange rates, the types of investments that are made and other changing market conditions. The use of hedging transactions and other derivative instruments to reduce the effects of a decline in the value of a position does not eliminate the possibility of fluctuations in the value of the position or prevent losses if the value of the position declines. However, such activities can establish other positions designed to gain from those same developments, thereby offsetting the decline in the value of the position. Such transactions may also limit the opportunity for gain if the value of a position increases. Moreover, it may not be possible to limit the exposure to a market development that is so generally anticipated that a hedging or other derivative transaction cannot be entered into at an acceptable price.
The success of any hedging or other derivative transactions that we enter into generally will depend on our ability to correctly predict market changes. As a result, while we may enter into such transactions in order to reduce our exposure to market risks, unanticipated market changes may result in poorer overall investment performance than if the hedging or other derivative transaction had not been executed. In addition, the degree of correlation between price movements of the instruments used in connection with hedging activities and price movements in a position being hedged may vary. Moreover, for a variety of reasons, we may not seek or be successful in establishing a perfect correlation between the instruments used in hedging or other derivative transactions and the positions being hedged. An imperfect correlation could prevent us from achieving the intended result and could give rise to a loss. In addition, it may not be possible to fully or perfectly limit our exposure against all changes in the value of its investments, because the value of investments is likely to fluctuate as a result of a number of factors, some of which will be beyond our control or ability to hedge.
While hedging arrangements may reduce certain risks, such arrangements themselves may entail certain other risks. These arrangements may require the posting of cash collateral, including at a time when a fund has insufficient cash or illiquid assets such that the posting of the cash is either impossible or requires the sale of assets at prices that do not reflect their underlying value. Moreover, these hedging arrangements may generate significant transaction costs, including potential tax costs, that reduce the returns generated by a fund. The CFTC has proposed or adopted regulations governing swaps and security‑ based swaps, which may limit our trading activities and our ability to implement effective hedging strategies or increase the costs of compliance. See “Risks Related to Our Business-Extensive regulation of our businesses affects our activities and creates the potential for significant liabilities and penalties. The possibility of increased regulatory focus or legislative or regulatory changes could result in additional burdens on our business.”
The assets of our funds and our firm through our principal assets may make a limited number of investments, or investments that are concentrated in certain issuers, geographic regions or asset types, which could negatively affect our performance or the performance of our funds to the extent those concentrated assets perform poorly.
The governing agreements of our funds contain only limited investment restrictions and only limited requirements as to diversification of fund investments, either by geographic region or asset type. Our private equity funds generally permit up to 20% of the fund to be invested in a single company. Similarly, subject to certain concentration limits, our balance sheet may hold significant exposures to certain issuers, industries or asset classes. As of December 31, 2015, investments in private equity, CLOs, alternative credit, energy and real estate each represent more than 5% of our investments on a consolidated segment basis. During periods of difficult market conditions or slowdowns in these sectors or geographic regions, decreased revenues, difficulty in obtaining access to financing and increased funding costs may be exacerbated by this concentration of investments, which would result in lower investment returns. Because a significant portion of a fund’s capital may be invested in a single investment or portfolio company, a loss with respect to such investment or portfolio company could have a significant adverse impact on such fund’s capital. Accordingly, a lack of diversification on the part of a fund could adversely affect a fund’s performance and therefore, our financial condition and results of operations. Where our balance sheet has a significant exposure to an issuer, industry or asset class, as was the case with energy investments beginning in late 2014 through and into
70
2016, losses may have an even greater impact on our financial condition and results of operations, as we would directly bear the full extent of such losses.
Because we hold interests in some of our portfolio companies both through our management of private equity funds as well as through separate investments in those funds and direct co‑investments, fluctuation in the fair values of these portfolio companies may have a disproportionate impact on the investment income earned by us.
We hold interests in some of our portfolio companies through our management of private equity and other funds, as well as through separate investments in those funds and co‑investments in certain portfolio companies of such funds. As of December 31, 2015, we hold significant aggregate investments in each of First Data Corporation and Walgreens Boots Alliance Inc. (the company resulting from Walgreen’s acquisition of Alliance Boots GmbH), which each represent more than 5% of our investments on a consolidated segment basis. As a result of our disproportionate investment in these companies, or any other portfolio companies for which similar investments are held in the future, any fluctuation in the fair values of these portfolio companies may have a disproportionate impact on the investment income earned by us as compared to other portfolio companies.
Our business activities may give rise to a conflict of interest with our funds.
As we have expanded and as we continue to expand the number and scope of our businesses, we increasingly confront potential conflicts of interest relating to investment activities among our various funds and also our own account. For example,
|
•
|
In pursuing the interest of our fund investors, we may take actions that could reduce our AUM or our profits that we could otherwise realize in the short term.
|
|
•
|
We may be required to allocate investment opportunities among investment vehicles that may have overlapping investment objectives, including vehicles that may have different fee structures, and among KKR co‑investment vehicles (including vehicles in which KKR employees may investment) and third party co‑investors.
|
|
•
|
We may, on behalf of our funds or KKR itself, buy, sell, hold or otherwise deal with securities or other investments that may be purchased, sold or held by our other funds or that are otherwise issued by a portfolio company in which our funds invest. Conflicts of interest may arise between a fund, on one hand, and KKR on the other or among our funds including but not limited to those relating to the purchase or sale of investments, the structuring of, or exercise of rights with respect to investment transactions and the advice we provide to our funds. For example we may sell an investment at a different time or for different consideration than our funds.
|
|
•
|
We may invest on behalf of our fund or for our own account in a portfolio company of one fund that is a competitor, service provider, supplier, customer, or other counterparty with respect to a portfolio company of another fund.
|
|
•
|
We may structure an investment in a manner that may be attractive to fund investors or to KKR Holdings L.P., from a tax perspective but that may require corporate taxation to unitholders.
|
|
•
|
A decision to acquire material non‑public information about a company while pursuing an investment opportunity for a particular fund or our own account may result in our having to restrict the ability of other funds to take any action.
|
|
•
|
Our fiduciary obligations to our fund investors may preclude us from pursuing attractive proprietary investment opportunities, in particular as we enter into strategic relationships with broad investment mandates similar to the investments we make with our balance sheet. Notwithstanding the foregoing, we also allocate certain investments, which we believe are not suitable for our funds to our balance sheet.
|
|
•
|
Conflicts may arise in allocating investments, time, services, expenses or resources among the investment activities of our funds, KKR, other KKR‑affiliated entities and the employees of KKR.
|
|
•
|
Our principals have made personal investments in a variety of our investment funds, which may result in conflicts of interest among investors of our funds or unitholders regarding investment decisions for these funds.
|
|
•
|
The general partner’s entitlement to receive carried interest from many of our funds may create an incentive for that general partner to make riskier and more speculative investments on behalf of a fund than would be the case in the absence of such an arrangement. In addition, for our funds that pay carried interest based on accrued rather than realized gains, the amount of carried interest to which the general partner is entitled and the timing of its receipt of carried interest will depend on the valuation by the general partner of the fund’s investment.
|
71
|
•
|
From time to time, one of our funds may seek to effect a purchase or sale of an investment with one or more of our other funds in a so‑called “cross transaction”.
|
|
•
|
The investors in our investment vehicles are based in a wide variety of jurisdictions and take a wide variety of forms, and consequently have diverging interests among themselves from a regulatory, tax or legal perspective or with respect to investment policies and target risk/return profiles.
|
|
•
|
We or our affiliates, including our capital markets business, may receive fees or other compensation in connection with specific transactions or different clients that may give rise to conflicts. The decision to take on an opportunity in one of our businesses may, as a practical matter, also limit the ability of one or our other businesses to take advantage of other related opportunities.
|
In addition, our funds and accounts also invest in a broad range of asset classes throughout the corporate capital structure. These investments include investments in corporate loans and debt securities, preferred equity securities and common equity securities. In certain cases, we may manage separate funds or accounts that invest in different parts of the same company’s capital structure. For example, our credit funds may invest in different classes of the same company’s debt and may make debt investments in a company that is owned by one of our private equity funds. In those cases, the interests of our funds may not always be aligned, which could create actual or potential conflicts of interest or the appearance of such conflicts. For example, one of our private equity funds could have an interest in pursuing an acquisition, divestiture or other transaction that, in its judgment, could enhance the value of the private equity investment, even though the proposed transaction would subject one of our credit fund’s debt investments to additional or increased risks. Finally, our ability to effectively implement a public securities strategy may be limited to the extent that contractual obligations entered into in the ordinary course of our private equity business impose restrictions on our engaging in transactions that we may be interested in otherwise pursuing.
We may also cause different investment funds to invest in a single portfolio company, for example where the fund that made an initial investment no longer has capital available to invest. Conflicts may also arise where we make balance sheet investments for our own account or permit employees to invest alongside our investment vehicles or our balance sheet for their own account. In certain cases, we may require that a transaction or investment be approved by fund investors or their advisory committees, be approved by an independent valuation expert, be subject to a fairness opinion, be based on arms‑length pricing data or be calculated in accordance with a formula provided for in a fund’s governing documents prior to the completion of the relevant transaction to address potential conflicts of interest. Such instances include principal transactions where we or our affiliates warehouse an investment in a portfolio company for the benefit of one or more of our funds or accounts pending the contribution of committed capital by the investors in such funds or accounts, follow‑on investments by a fund other than a fund which made an initial investment in a company or transactions in which we arrange for one of our funds or accounts to buy a security from, or sell a security to, another one of our funds or accounts.
Appropriately dealing with conflicts of interest is complex and difficult and we could suffer reputational damage or potential liability if we fail, or appear to fail, to deal appropriately with conflicts as they arise. Regulatory scrutiny of, or litigation in connection with, conflicts of interest could have a material adverse effect on our reputation which could in turn materially adversely affect our business in a number of ways, including as a result of an inability to raise additional funds and a reluctance of counterparties to do business with us.
Investors in certain of our Public Markets funds may redeem their investments in these funds with minimal notice.
Investors in our funds of funds along with those in our long/short credit strategy and other investment vehicles may generally submit redemptions to redeem their investments on a quarterly or monthly basis following the expiration of a specified period of time or in certain cases capital may be withdrawn earlier subject to a fee, in each case subject to the applicable fund’s specific redemption provisions. For certain KKR Prisma funds managed as part of a single investor’s mandate the length of time to redeem an investment may vary and will depend on the liquidity constraints of each KKR Prisma fund’s underlying hedge fund portfolio. Factors which could result in investors leaving our funds include changes in interest rates that make other investments more attractive, changes in investor perception regarding our focus or alignment of interest, unhappiness with a fund’s performance or investment strategy, changes in our reputation, departures or changes in responsibilities of key investment professionals, performance and liquidity needs of fund investors. In a declining market or period of economic disruption or uncertainty, the pace of redemptions and consequent reduction in our AUM could accelerate. The decrease in revenues that would result from significant redemptions from our funds of funds or other similar investment vehicles could have a material adverse effect on our business, revenues, net income and cash flows.
A portion of assets invested in our fund of hedge funds strategy are managed through separately managed accounts or entities structured for investment by one investor or related investors whereby we earn management and incentive fees, and we
72
intend to continue to seek additional separately managed account or single entity mandates. The investment management agreements we enter into in connection with managing separately managed accounts or entities on behalf of certain clients may be terminated by such clients on as little as 30 days’ prior written notice, or less in certain prescribed circumstances. In addition, the boards of directors of certain funds we manage could terminate our advisory engagement of those companies, on as little as 30 days’ prior written notice. Similarly, we provide subadvisory services to other investment advisors and managers. Such investment advisors and managers could terminate our subadvisory agreements on as little as 30 days’ prior written notice. In the case of any such terminations, the management and incentive fees we earn in connection with managing such account or company would immediately cease, which could result in a significant adverse impact on our revenues.
In addition, certain funds in our Public Markets business are registered under the Investment Company Act as management investment companies. These funds and KKR Credit Advisors (US) LLC, which serves as their investment adviser (or, in the case of the business development company, as its sub‑adviser), are subject to the Investment Company Act and the rules thereunder. One of these funds is a New York Stock Exchange‑listed closed‑end fund. In addition, the management fees we are paid for managing investment companies will generally be subject to contractual rights the company’s board of directors (or, in the case of the business development company we manage, the investment adviser) has to terminate our management of an account on as short as 60 days’ prior notice. Termination of these agreements would reduce the fees we earn from the relevant funds, which could have a material adverse effect on our results of operations.
Our funds of funds may be subject to risks related to the limited rights it has to withdraw, transfer or otherwise liquidate its investments.
A fund of funds is subject to risks related to the limited rights it has to withdraw, transfer or otherwise liquidate its investments from the underlying hedge funds or other funds in which it invests. Hedge funds, including those in which our fund of funds are invested and the hedge funds we offer to our fund investors, may make investments or hold trading positions in markets that are volatile and which may become illiquid. Timely divestiture or sale of trading positions can be impaired by decreased trading volume, increased price volatility, concentrated trading positions, limitations on the ability to transfer positions in highly specialized or structured transactions to which they may be a party, and changes in industry and government regulations. It may be impossible or costly for hedge funds to liquidate positions rapidly in order to meet margin calls, withdrawal requests or otherwise, particularly if there are other market participants seeking to dispose of similar assets at the same time or the relevant market is otherwise moving against a position or in the event of trading halts or daily price movement limits on the market or otherwise.
Moreover, these risks may be exacerbated for funds of funds such as those we manage. For example, if one of our funds of funds were to invest a significant portion of its assets in two or more hedge funds that each had illiquid positions in the same issuer, the illiquidity risk for our funds of hedge funds would be compounded. In 2008 many hedge funds experienced significant declines in value. In many cases, these declines in value were both provoked and exacerbated by margin calls and forced selling of assets, often at distressed prices. Moreover, certain funds of funds were invested in hedge funds that halted redemptions in the face of illiquidity and other issues, which precluded those funds of funds from receiving their capital back on request. There can be no guarantee that such a situation would not recur, particularly in times of market distress.
Terms of the governing documents may also limit a fund of funds’ ability to withdraw, transfer or otherwise liquidate their investments in underlying portfolio funds. Under the terms of the governing documents of the relevant portfolio funds or other investments, the ability of a fund of funds or account to redeem any amount invested therein may be subject to certain restrictions and conditions, including restrictions on the redemption of capital for an initial period, restrictions on the amount of redemptions and the frequency with which redemptions can be made, and investment minimums that must be maintained. Additionally, portfolio funds typically reserve the right to reduce (“gate”) or suspend redemptions, to set aside (“side pocket”) capital that cannot be redeemed for so long as an event or circumstance has not occurred or ceased to exist, respectively, and to satisfy redemptions by making distributions in‑kind, under certain circumstances. The ability of our funds of funds or accounts to redeem portfolio fund interests may be adversely affected to varying degrees by such restrictions depending on, among other things, the length of any restricted periods imposed by the portfolio fund, the amount and timing of a requested redemption in relation to the time remaining of any restricted periods imposed by portfolio funds, the aggregate amount of redemption requests, the next regularly scheduled redemption dates of such portfolio funds, the imposition of “gates” or suspensions, the use of “side pockets”, the decision by a portfolio fund to satisfy redemptions in‑kind, and the satisfaction of other conditions.
73
Investments by our fund of funds, other hedge funds and similar investment vehicles and strategic partnerships with hedge fund managers are subject to numerous additional risks.
Investments by one or more hedge funds and investment vehicles with similar characteristics that we currently advise or may organize in the future are subject to numerous additional risks including the following:
|
•
|
Generally, there are few limitations on the execution of investment strategies of a hedge fund or fund of funds, which are subject to the sole discretion of the management company or the general partner of such funds.
|
|
•
|
Hedge funds may engage in short selling, which is subject to theoretically unlimited loss, in that the price of the underlying security could theoretically increase without limit, thus increasing the cost of buying those securities to cover the short position. There can be no assurance that the security necessary to cover a short position will be available for purchase. Purchasing securities to close out the short position can itself cause the prices of the securities to rise further, thereby exacerbating the loss.
|
|
•
|
We may enter into credit default swaps (or CDS) as investments or hedges. CDS involve greater risks than investing in the reference obligation directly. In addition to general market risks, CDS are subject to risks related to changes in interest rates, credit spreads, credit quality and expected recovery rates of the underlying credit instrument. A CDS is a contract in which the protection “buyer” is generally obligated to pay the protection “seller” an upfront or a periodic stream of payments over the term of the contract provided that no credit event, such as a default, on a reference obligation has occurred. If a credit event occurs, the seller generally must pay the buyer the “par value” (full notional value) of the swap in exchange for an equal face amount of deliverable obligations of the issuer (also known as the reference entity) of the underlying credit instrument referenced in the CDS, or, if the swap is cash settled, the seller may be required to deliver the related net cash amount. The protection buyer will lose its investment and recover nothing should no event of default occur. If an event of default were to occur, the value of the reference obligation received by the protection seller (if any), coupled with the periodic payments previously received, may be less than the full notional value it pays to the buyer, resulting in a loss of value to the seller. If we act as the protection seller in respect of a CDS contract, we would be exposed to many of the same risks of leverage described herein since if an event of default occurs the seller must pay the buyer the full notional value of the reference obligation.
|
|
•
|
Hedge funds and investment vehicles with similar characteristics are exposed to the risk that a counterparty will not settle a transaction in accordance with its terms and conditions because of a dispute over the terms of the contract (whether or not bona fide) or because of a credit or liquidity problem, thus causing the fund to suffer a loss. Counterparty risk is accentuated for contracts with longer maturities where events may intervene to prevent settlement, or where the fund has concentrated its transactions with a single or small group of counterparties. Generally, hedge funds and investment vehicles with similar characteristics are not restricted from dealing with any particular counterparty or from concentrating any or all of their transactions with one counterparty. Moreover, the fund’s internal consideration of the creditworthiness of their counterparties may prove insufficient. The absence of a regulated market to facilitate settlement may increase the potential for losses.
|
|
•
|
Credit risk may arise through a default by one of several large institutions that are dependent on one another to meet their liquidity or operational needs, so that a default by one institution causes a series of defaults by the other institutions. This systemic risk may adversely affect the financial intermediaries (such as clearing agencies, clearing houses, banks, securities firms and exchanges) with which the hedge funds and investment vehicles with similar characteristics interact on a daily basis.
|
|
•
|
The efficacy of investment and trading strategies depend largely on the ability to establish and maintain an overall market position in a combination of financial instruments. A hedge fund’s trading orders may not be executed in a timely and efficient manner due to various circumstances, including systems failures or human error. In such event, the funds might only be able to acquire some but not all of the components of the position, or if the overall position were to need adjustment, the funds might not be able to make such adjustment. As a result, the funds would not be able to achieve the market position selected by the management company or general partner of such funds, and might incur a loss in liquidating their position.
|
|
•
|
These funds may make investments that they do not advantageously dispose of prior to the date the applicable fund is dissolved, either by expiration of such fund’s term or otherwise. Although we generally expect that investments will be disposed of prior to dissolution or be suitable for in-kind distribution at dissolution, and the general partners of the funds have a limited ability to extend the term of the fund with the consent of fund investors or the advisory board of the fund, as applicable, our funds may have to sell, distribute or otherwise dispose of investments at a disadvantageous
|
74
time as a result of dissolution. This would result in a lower than expected return on the investments and, perhaps, on the fund itself.
|
•
|
These funds may rely on computer programs, internal infrastructure and services, quantitative models (both proprietary models and those supplied by third parties) and information and data provided by third parties to trade, clear and settle securities and other transactions, among other activities, that are critical to the oversight of certain funds’ activities. If any such models, information or data prove to be incorrect or incomplete, any decisions made in reliance thereon could expose the funds to potential risks. Any hedging based on faulty models, information or data may prove to be unsuccessful and adversely impact a fund’s profits.
|
|
•
|
Hedge fund investments are also subject to risks relating to investments in commodities, futures, options and other derivatives, the prices of which are highly volatile and may be subject to the theoretically unlimited risk of loss in certain circumstances, including if the fund writes a call option. Price movements of commodities, futures and options contracts and payments pursuant to swap agreements are influenced by, among other things, interest rates, changing supply and demand relationships, trade, fiscal, monetary and exchange control programs and policies of governments and national and international political and economic events and policies. The value of futures, options and swap agreements also depends upon the price of the commodities underlying them. In addition, hedge funds’ assets are subject to the risk of the failure of any of the exchanges on which their positions trade or of their clearinghouses or counterparties. Most U.S. commodities exchanges limit fluctuations in certain commodity interest prices during a single day by imposing “daily price fluctuation limits” or “daily limits,” the existence of which may reduce liquidity or effectively curtail trading in particular markets. Our fund of hedge fund business may also be subject to and may subject our firm to extensive regulations, including those of the Commodity Futures Trading Commission and the regulations described under “-Risks Related to Our Business-Extensive regulation of our businesses affects our activities and creates the potential for significant liabilities and penalties. The possibility of increased regulatory focus or legislative or regulatory changes could result in additional burdens on our business”.
|
The hedge fund managers with which we have strategic partnerships are subject to the risks above. To the extent the financial condition of these hedge fund managers is adversely affected by these risks, our revenues, AUM and FPAUM may decline.
Risks Related to Our Common Units
As a limited partnership, we qualify for some exemptions from the corporate governance and other requirements of the NYSE.
We are a limited partnership and, as a result, qualify for exceptions from certain corporate governance and other requirements of the rules of the NYSE. Pursuant to these exceptions, limited partnerships may elect, and we have elected, not to comply with certain corporate governance requirements of the NYSE, including the requirements: (i) that the listed company have a nominating and corporate governance committee that is composed entirely of independent directors; (ii) that the listed company have a compensation committee that is composed entirely of independent directors and (iii) that the compensation committee be required to consider certain independence factors when engaging compensation consultants, legal counsel and other committee advisers. In addition, as a limited partnership, we are not required to obtain unitholder approval for (a) the issuance of common units to certain related parties where the number of common units exceeds one percent of the outstanding common units or voting power, (b) the issuance of common units that equals or exceeds 20% of the outstanding common units or voting power, or (c) a change of control transaction, and we are not required to hold annual unitholder meetings. Accordingly, you do not have the same protections afforded to equity holders of entities that are subject to all of the corporate governance requirements of the NYSE.
Our founders are able to determine or influence the outcome of any matter that may be submitted for a vote of our limited partners.
Very few matters are required to be submitted to a vote of our unitholders, and generally such matters require a majority or more of all the outstanding voting units. As of February 22, 2016, KKR Holdings owns 361,346,588 KKR Group Partnership Units, or 44% of the outstanding KKR Group Partnership Units. Depending upon the number of units actually voted, we believe our senior employees should generally have sufficient voting power to substantially influence matters subject to a majority or more of all outstanding voting units. Matters that require a vote of a majority of all outstanding voting units include a merger or consolidation of our business, a sale of all or substantially all of our assets and amendments to our partnership agreement that may be material to holders of our common units. In addition, our limited partnership agreement contains provisions that require a majority vote of all outstanding voting units to make certain amendments to our partnership agreement that would materially and adversely affect all holders of our common units or a particular class of holders of common units, and since approximately 44% of our voting units, as of February 22, 2016, are controlled by KKR Holdings, we believe KKR
75
Holdings should generally have the ability to substantially influence amendments that could materially and adversely affect the holders of our common units either as a whole or as a particular class.
The voting rights of holders of our common units are further restricted by provisions in our limited partnership agreement stating that any of our common units held by a person that beneficially owns 20% or more of any class of our common units then outstanding (other than our Managing Partner or its affiliates, or a direct or subsequently approved transferee of our Managing Partner or its affiliates) cannot be voted on any matter. Our limited partnership agreement also contains provisions limiting the ability of the holders of our common units to call meetings, to acquire information about our operations, and to influence the manner or direction of our management. Our limited partnership agreement does not restrict our Managing Partner’s ability to take actions that may result in our partnership being treated as an entity taxable as a corporation for U.S. federal (and applicable state) income tax purposes. Furthermore, holders of our common units would not be entitled to dissenters’ rights of appraisal under our limited partnership agreement or applicable Delaware law in the event of a merger or consolidation, a sale of substantially all of our assets or any other transaction or event.
Our limited partnership agreement contains provisions that reduce or eliminate duties (including fiduciary duties) of our Managing Partner and limit remedies available to unitholders for actions that might otherwise constitute a breach of duty. It will be difficult for unitholders to successfully challenge a resolution of a conflict of interest by our Managing Partner or by its conflicts committee.
Our limited partnership agreement contains provisions that require holders of our common units to waive or consent to conduct by our Managing Partner and its affiliates that might otherwise raise issues about compliance with fiduciary duties or applicable law. For example, our limited partnership agreement provides that when our Managing Partner is acting in its individual capacity, as opposed to in its capacity as our Managing Partner, it may act without any fiduciary obligations to holders of our common units, whatsoever. When our Managing Partner, in its capacity as our general partner, or our conflicts committee is permitted to or required to make a decision in its “sole discretion” or “discretion” or that it deems “necessary or appropriate” or “necessary or advisable,” then our Managing Partner or the conflicts committee will be entitled to consider only such interests and factors as it desires, including its own interests, and will have no duty or obligation (fiduciary or otherwise) to give any consideration to any interest of or factors affecting us or any holder of our common units and will not be subject to any different standards imposed by our limited partnership agreement, the Delaware Revised Uniform Limited Partnership Act, which is referred to as the Delaware Limited Partnership Act, or under any other law, rule or regulation or in equity. These standards reduce the obligations to which our Managing Partner would otherwise be held. See also “-We are a Delaware limited partnership, and there are provisions in our limited partnership agreement regarding exculpation and indemnification of our officers and directors that differ from the Delaware General Corporation Law (DGCL) in a manner that may be less protective of the interests of our common unitholders.”
The above modifications of fiduciary duties are expressly permitted by Delaware law. Hence, we and holders of our common units will only have recourse and be able to seek remedies against our Managing Partner if our Managing Partner breaches its obligations pursuant to our limited partnership agreement. Unless our Managing Partner breaches its obligations pursuant to our limited partnership agreement, we and holders of our common units will not have any recourse against our Managing Partner even if our Managing Partner were to act in a manner that was inconsistent with traditional fiduciary duties. Furthermore, even if there has been a breach of the obligations set forth in our limited partnership agreement, our limited partnership agreement provides that our Managing Partner and its officers and directors will not be liable to us or holders of our common units, for errors of judgment or for any acts or omissions unless there has been a final and non‑appealable judgment by a court of competent jurisdiction determining that our Managing Partner or its officers and directors acted in bad faith or engaged in fraud or willful misconduct. These provisions are detrimental to the holders of our common units because they restrict the remedies available to unitholders for actions that without such limitations might constitute breaches of duty including fiduciary duties.
Whenever a potential conflict of interest exists between us and our Managing Partner, our Managing Partner may resolve such conflict of interest. If our Managing Partner determines that its resolution of the conflict of interest is on terms no less favorable to us than those generally being provided to or available from unrelated third parties or is fair and reasonable to us, taking into account the totality of the relationships between us and our Managing Partner, then it will be presumed that in making this determination, our Managing Partner acted in good faith. A holder of our common units seeking to challenge this resolution of the conflict of interest would bear the burden of overcoming such presumption. This is different from the situation with Delaware corporations, where a conflict resolution by an interested party would be presumed to be unfair and the interested party would have the burden of demonstrating that the resolution was fair.
Also, if our Managing Partner obtains the approval of the conflicts committee of our Managing Partner, the resolution will be conclusively deemed to be fair and reasonable to us and not a breach by our Managing Partner of any duties it may owe to us or holders of our common units. This is different from the situation with Delaware corporations, where a conflict resolution by a committee consisting solely of independent directors may, in certain circumstances, merely shift the burden of
76
demonstrating unfairness to the plaintiff. If you purchase, receive or otherwise hold a common unit, you will be treated as having consented to the provisions set forth in our limited partnership agreement, including provisions regarding conflicts of interest situations that, in the absence of such provisions, might be considered a breach of fiduciary or other duties under applicable state law. As a result, unitholders will, as a practical matter, not be able to successfully challenge an informed decision by the conflicts committee.
We have also agreed to indemnify our Managing Partner and any of its affiliates and any member, partner, tax matters partner, officer, director, employee agent, fiduciary or trustee of our partnership, our Managing Partner or any of our affiliates and certain other specified persons, to the fullest extent permitted by law, against any and all losses, claims, damages, liabilities, joint or several, expenses (including legal fees and expenses), judgments, fines, penalties, interest, settlements or other amounts incurred by our Managing Partner or these other persons. We have agreed to provide this indemnification unless there has been a final and non‑appealable judgment by a court of competent jurisdiction determining that these persons acted in bad faith or engaged in fraud or willful misconduct. We have also agreed to provide this indemnification for criminal proceedings.
Our Managing Partner may exercise its right to call and purchase common units as provided in our limited partnership agreement or assign this right to one of its affiliates or to us. Our Managing Partner may use its own discretion, free of fiduciary duty restrictions, in determining whether to exercise this right. As a result, a unitholder may have his common units purchased from him at an undesirable time or price. For additional information, see our limited partnership agreement filed as an exhibit to this annual report.
Any claims, suits, actions or proceedings concerning the matters described above or any other matter arising out of or relating in any way to the limited partnership agreement may only be brought in the Court of Chancery of the State of Delaware or, if such court does not have subject matter jurisdiction thereof, any other court in the State of Delaware with subject matter jurisdiction.
The market price and trading volume of our common units may be volatile, which could result in rapid and substantial losses for our common unitholders.
The market price of our common units may be highly volatile, could be subject to wide fluctuations and could decline significantly in the future. In addition, the trading volume in our common units may fluctuate and cause significant price variations to occur. If the market price of our common units declines significantly, you may be unable to sell your common units at an attractive price, if at all. Some of the factors that could negatively affect the price of our common units or result in fluctuations in the price or trading volume of our common units include:
|
•
|
variations in our quarterly operating results or distributions, which may be substantial;
|
|
•
|
our policy of taking a long‑term perspective on making investment, operational and strategic decisions, which is expected to result in significant and unpredictable variations in our quarterly returns;
|
|
•
|
failure to meet analysts’ earnings estimates;
|
|
•
|
publication of research reports about us or the investment management industry or the failure of securities analysts to cover our common units sufficiently;
|
|
•
|
additions or departures of our principals and other key management personnel;
|
|
•
|
adverse market reaction to any indebtedness we may incur or securities we may issue in the future;
|
|
•
|
changes in market valuations of similar companies;
|
|
•
|
speculation in the press or investment community;
|
|
•
|
changes or proposed changes in laws or regulations or differing interpretations thereof affecting our business or enforcement of these laws and regulations, or announcements relating to these matters;
|
|
•
|
a lack of liquidity in the trading of our common units;
|
77
|
•
|
adverse publicity about the investment management or private equity industry generally or individual scandals, specifically; and
|
|
•
|
general market and economic conditions.
|
An investment in our common units is not an investment in any of our funds, and the assets and revenues of our funds are not directly available to us.
Our common units are only securities of KKR & Co. L.P., the holding company of the KKR business. While our historical consolidated and combined financial information includes financial information, including assets and revenues, of certain funds on a consolidated basis, and our future financial information will continue to consolidate certain of these funds, such assets and revenues are available to the fund and not to us except to a limited extent through management fees, carried interest or other incentive income, distributions and other proceeds arising from agreements with funds, as discussed in more detail in this report.
Our common unit price may decline due to the large number of common units eligible for future sale, for exchange, and issuable pursuant to our equity incentive plan and acquisitions.
The market price of our common units could decline as a result of sales of a large number of common units in the market or the perception that such sales could occur. These sales, or the possibility that these sales may occur, also might make it more difficult for us to sell common units in the future at a time and at a price that we deem appropriate. As of February 22, 2016, we have 457,834,875 common units outstanding, which amount excludes common units beneficially owned by KKR Holdings in the form of KKR Group Partnership Units discussed below and common units available for future issuance under the KKR & Co. L.P. 2010 Equity Incentive Plan, which we refer to as our Equity Incentive Plan.
As of February 22, 2016, KKR Holdings owns 361,346,588 KKR Group Partnership Units that may be exchanged, on a quarterly basis, for our common units on a one‑for‑one basis, subject to customary conversion rate adjustments for splits, unit distributions and reclassifications. Except for interests held by our founders and certain interests held by other principals that were vested upon grant, interests in KKR Holdings that are held by our principals are subject to service, performance and/or price-based vesting at the time of grant and, following such vesting, additional restrictions in certain cases on exchanges. During 2015, 3,100,780 previously unvested units in KKR Holdings vested. The market price of our common units could decline as a result of the exchange or the perception that an exchange may occur of a large number of KKR Group Partnership Units for our common units. These exchanges, or the possibility that these exchanges may occur, also might make it more difficult for holders of our common units to sell our common units in the future at a time and at a price that they deem appropriate.
In addition, we will continue to issue additional common units pursuant to our Equity Incentive Plan. The total number of common units which may be issued under our Equity Incentive Plan is equivalent to 15% of the number of fully exchanged and diluted common units outstanding as of the beginning of the year. The amount may be increased each year to the extent that we issue additional equity. As of February 19, 2016, KKR may issue common units registered on KKR's registration statement on Form S-8 (no. 333-171601) for this purpose and may also issue 24.6 million common units under the Equity Incentive Plan that were not registered on KKR’s registration statement on Form S‑8. In addition previously issued awards that were canceled or are canceled in the future, or in certain cases, withheld in respect of tax withholding obligations, are or will become available for further grant under the terms of the Equity Incentive Plan. See “Executive Compensation-KKR & Co. L.P. Equity Incentive Plan”. In addition, our limited partnership agreement authorizes us to issue an unlimited number of additional partnership securities and options, rights, warrants and appreciation rights relating to partnership securities for the consideration and on the terms and conditions established by our Managing Partner in its sole discretion without the approval of our unitholders. In accordance with the Delaware Limited Partnership Act and the provisions of our partnership agreement, we may also issue additional partner interests that have designations, preferences, rights, powers and duties that are different from, and may be senior to, those applicable to our common units. Similarly, the partnership agreements of the KKR Group Partnerships authorize the general partners of the KKR Group Partnerships to issue an unlimited number of additional securities of the KKR Group Partnerships with such designations, preferences, rights, powers and duties that are different from, and may be senior to, those applicable to the KKR Group Partnerships Units, and which may be exchangeable for KKR Group Partnership Units. In the past, we have issued and sold common units of KKR & Co. L.P. to generate cash proceeds to pay withholding taxes, social benefit payments or similar payments payable by us in respect of awards granted pursuant to the Equity Incentive Plan or the amount of cash delivered in respect of awards granted pursuant to the Equity Incentive Plan that are settled in cash instead of common units. As of February 19, 2016, we may issue up to 0.8 million common units as registered on our registration statement on Form S-3 (no. 333-196059) in respect of such withholding taxes and cash settled equity awards.
78
We have used and in the future may continue to use common units as consideration in acquisitions and strategic investments. For example, in connection with KKR’s acquisition of KFN, KKR issued approximately 104.3 million common units of KKR & Co. L.P., in connection with KKR’s acquisition of Avoca, we issued securities exchangeable into 4.9 million common units and in connection with KKR's acquisition of Marshall Wace, we issued approximately 7.3 million common units. In addition, in connection with the Prisma and Nephila transactions, we may make certain contingent payments in the form of common units. If our valuations of these transactions are not accurate or if the value of these acquisitions and investments is not realized, our distributions per common unit and the value of our common units may decline.
Risks Related to Our Organizational Structure
Potential conflicts of interest may arise among our Managing Partner, our affiliates and us. Our Managing Partner and our affiliates have limited fiduciary duties to us and the holders of KKR Group Partnership Units, which may permit them to favor their own interests to our detriment and that of the holders of KKR Group Partnership Units.
Our Managing Partner, which is our general partner, will manage the business and affairs of our business, and will be governed by a board of directors that is co‑chaired by our founders, who also serve as our Co‑Chief Executive Officers. Conflicts of interest may arise among our Managing Partner and its affiliates, on the one hand, and us and our unitholders, on the other hand. As a result of these conflicts, our Managing Partner may favor its own interests and the interests of its affiliates over us and our unitholders. These conflicts include, among others, the following:
|
•
|
Our Managing Partner indirectly through its holding of controlling entities determines the amount and timing of the KKR Group Partnership’s investments and dispositions, cash expenditures, including those relating to compensation, indebtedness, issuances of additional partner interests, tax liabilities and amounts of reserves, each of which can affect the amount of cash that is available for distribution to holders of KKR Group Partnership Units;
|
|
•
|
Our Managing Partner is allowed to take into account the interests of parties other than us in resolving conflicts of interest, which has the effect of limiting its duties, including fiduciary duties, to us. For example, our affiliates that serve as the general partners of our funds or as broker‑dealers have fiduciary and/or contractual obligations to our fund investors or other third parties. Such obligations may cause such affiliates to regularly take actions with respect to the allocation of investments among our investment funds (including funds that have different fee structures), the purchase or sale of investments in our investment funds, the structuring of investment transactions for those funds and the advice and services we provide that comply with these fiduciary and contractual obligations but that might adversely affect our near‑term results of operations or cash flow. Our Managing Partner will have no obligation to intervene in, or to notify us of, such actions by such affiliates;
|
|
•
|
Because certain of our principals indirectly hold their KKR Group Partnership Units through KKR Holdings L.P. and its subsidiaries, which are not subject to corporate income taxation and we hold some of the KKR Group Partnership Units through one or more wholly‑owned subsidiaries that are taxable as a corporation, conflicts may arise between our principals and us relating to the selection and structuring of investments or transactions, declaring distributions and other matters; without limiting the foregoing, certain investments made by us or through our funds may be determined to be held through KKR Management Holdings L.P., which would result in less taxation to our principals who are limited partners in KKR Holdings as compared to our unitholders;
|
|
•
|
Our Managing Partner, including its directors and officers, has limited its and their liability and reduced or eliminated its and their duties, including fiduciary duties, under our partnership agreement to the fullest extent permitted by law, while also restricting the remedies available to holders of common units for actions that, without these limitations, might constitute breaches of duty, including fiduciary duties. In addition, we have agreed to indemnify our Managing Partner, including its directors and officers, and our Managing Partner’s affiliates to the fullest extent permitted by law, except with respect to conduct involving bad faith, fraud or willful misconduct;
|
|
•
|
Our partnership agreement does not restrict our Managing Partner from paying us or our affiliates for any services rendered, or from entering into additional contractual arrangements with any of these entities on our behalf, so long as the terms of any such additional contractual arrangements are fair and reasonable to us as determined under our partnership agreement. Neither our limited partnership agreement nor any of the other agreements, contracts and arrangements between us on the one hand, and our Managing Partner and its affiliates on the other, are or will be the result of arm’s‑length negotiations. The conflicts committee will be responsible for, among other things, enforcing our rights and those of our unitholders under certain agreements against KKR Holdings and certain of its subsidiaries and designees, a general partner or limited partner of KKR Holdings, or a person who holds a partnership or equity interest in the foregoing entities;
|
79
|
•
|
Our Managing Partner and its affiliates will have no obligation to permit us to use any facilities or assets of our Managing Partner and its affiliates, except as may be provided in contracts entered into specifically dealing with such use. There will not be any obligation of our Managing Partner and its affiliates to enter into any contracts of this kind.
|
|
•
|
Our Managing Partner determines how much debt we incur and that decision may adversely affect any credit ratings we receive;
|
|
•
|
Our Managing Partner determines which costs incurred by it and its affiliates are reimbursable by us;
|
|
•
|
Other than as set forth in the confidentiality and restrictive covenant agreements, which in certain cases may only be agreements between our principals and KKR Holdings and which may not be enforceable by us or otherwise waived, modified or amended, affiliates of our Managing Partner and existing and former personnel employed by our Managing Partner are not prohibited from engaging in other businesses or activities, including those that might be in direct competition with us;
|
|
•
|
Our Managing Partner controls the enforcement of obligations owed to the KKR Group Partnerships by us and our affiliates; and
|
|
•
|
Our Managing Partner or our Managing Partner conflicts committee decides whether to retain separate counsel, accountants or others to perform services for us.
|
See “Certain Relationships and Related Transactions, and Director Independence.”
Certain actions by our Managing Partner’s board of directors require the approval of the Class A shares of our Managing Partner, all of which are held by our senior employees.
All of our Managing Partner’s outstanding Class A shares are held by our senior employees. Although the affirmative vote of a majority of the directors of our Managing Partner is required for any action to be taken by our Managing Partner’s board of directors, certain specified actions approved by our Managing Partner’s board of directors will also require the approval of a majority of the Class A shares of our Managing Partner. These actions consist of the following:
|
•
|
the entry into a debt financing arrangement by us in an amount in excess of 10% of our existing long‑term indebtedness (other than the entry into certain intercompany debt financing arrangements);
|
|
•
|
the issuance by our partnership or our subsidiaries of any securities that would (i) represent, after such issuance, or upon conversion, exchange or exercise, as the case may be, at least 5% on a fully diluted, as converted, exchanged or exercised basis, of any class of our or their equity securities or (ii) have designations, preferences, rights, priorities or powers that are more favorable than those of KKR Group Partnership Units;
|
|
•
|
the adoption by us of a shareholder rights plan;
|
|
•
|
the amendment of our limited partnership agreement or the limited partnership agreements of the KKR Group Partnerships;
|
|
•
|
the exchange or disposition of all or substantially all of our assets or the assets of any KKR Group Partnership;
|
|
•
|
the merger, sale or other combination of the partnership or any KKR Group Partnership with or into any other person;
|
|
•
|
the transfer, mortgage, pledge, hypothecation or grant of a security interest in all or substantially all of the assets of the KKR Group Partnerships;
|
|
•
|
the appointment or removal of a Chief Executive Officer or a Co‑Chief Executive Officer of our Managing Partner or our partnership;
|
|
•
|
the termination of the employment of any of our officers or the officers of any of our subsidiaries or the termination of the association of a partner with any of our subsidiaries, in each case, without cause;
|
|
•
|
the liquidation or dissolution of the partnership, our Managing Partner or any KKR Group Partnership; and
|
|
•
|
the withdrawal, removal or substitution of our Managing Partner as our general partner or any person as the general partner of a KKR Group Partnership, or the transfer of beneficial ownership of all or any part of a general partner interest in our partnership or a KKR Group Partnership to any person other than one of its wholly-owned subsidiaries.
|
80
In addition, holders representing a majority of the Class A shares of our Managing Partner have the authority to unilaterally appoint our Managing Partner’s directors and also have the ability to appoint the officers of our Managing Partner. Messrs. Kravis and Roberts, as the designated members of our Managing Partner, represent a majority of the total voting power of the outstanding Class A shares, when they act together. However, neither of them controls the voting of the Class A shares, when acting alone.
Our common unitholders do not elect our Managing Partner or vote on our Managing Partner’s directors and have limited ability to influence decisions regarding our business.
Our common unitholders do not elect our Managing Partner or its board of directors and, unlike the holders of common stock in a corporation, have only limited voting rights on matters affecting our business and therefore limited ability to influence decisions regarding our business. Furthermore, if our common unitholders are dissatisfied with the performance of our Managing Partner, they have no ability to remove our Managing Partner, with or without cause.
The control of our Managing Partner may be transferred to a third party without our consent.
Our Managing Partner may transfer its general partner interest to a third party in a merger or consolidation or in a transfer of all or substantially all of its assets without our consent or the consent of our common unitholders. Furthermore, the members of our Managing Partner may sell or transfer all or part of their limited liability company interests in our Managing Partner without our approval, subject to certain restrictions. A new general partner may not be willing or able to form new funds and could form funds that have investment objectives and governing terms that differ materially from those of our current funds. A new owner could also have a different investment philosophy, employ investment professionals who are less experienced, be unsuccessful in identifying investment opportunities or have a track record that is not as successful as our track record. If any of the foregoing were to occur, we could experience difficulty in making new investments, and the value of our existing investments, our business, our results of operations and our financial condition could materially suffer.
We intend to pay periodic distributions to the holders of our common units, but our ability to do so may be limited by our holding company structure and contractual restrictions.
We intend to pay cash distributions on a quarterly basis. We are a holding company and have no material assets other than the KKR Group Partnership Units that we hold through wholly‑owned subsidiaries and have no independent means of generating income. Accordingly, we intend to cause the KKR Group Partnerships to make distributions on the KKR Group Partnership Units, including KKR Group Partnership Units that we directly or indirectly hold, in order to provide us with sufficient amounts to fund distributions we may declare. If the KKR Group Partnerships make such distributions, other holders of KKR Group Partnership Units, including KKR Holdings, will be entitled to receive equivalent distributions pro rata based on their KKR Group Partnership Units.
The declaration and payment of any future distributions will be at the sole discretion of our Managing Partner, which may change our distribution policy at any time. Our Managing Partner will take into account general economic and business conditions, our strategic plans and prospects, our business and investment opportunities, our financial condition and operating results, compensation expense, working capital requirements and anticipated cash needs, debt and contractual restrictions and obligations (including payment obligations pursuant to the tax receivable agreement), legal, tax and regulatory restrictions, restrictions or other implications on the payment of distributions by us to the holders of KKR Group Partnership Units or by our subsidiaries to us and such other factors as our Managing Partner may deem relevant. Under the Delaware Limited Partnership Act, we may not make a distribution to a partner if after the distribution all our liabilities, other than liabilities to partners on account of their partnership interests and liabilities for which the recourse of creditors is limited to specific property of the partnership, would exceed the fair value of our assets. If we were to make such an impermissible distribution, any limited partner who received a distribution and knew at the time of the distribution that the distribution was in violation of the Delaware Limited Partnership Act would be liable to us for the amount of the distribution for three years. Furthermore, by paying cash distributions rather than investing that cash in our businesses, we risk slowing the pace of our growth, or not having a sufficient amount of cash to fund our operations, new investments or unanticipated capital expenditures, should the need arise.
Our ability to characterize such distributions as capital gains or qualified dividend income may be limited, and you should expect that some or all of such distributions may be regarded as ordinary income.
81
We will be required to pay our principals for most of the benefits relating to any additional tax depreciation or amortization deductions we may claim as a result of the tax basis step‑up we receive in connection with subsequent exchanges of our common units and related transactions.
We and one or more of our intermediate holding companies are required to acquire KKR Group Partnership Units from time to time pursuant to our exchange agreement with KKR Holdings. To the extent this occurs, the exchanges are expected to result in an increase in one of our intermediate holding company’s share of the tax basis of the tangible and intangible assets of KKR Management Holdings L.P., primarily attributable to a portion of the goodwill inherent in our business, that would not otherwise have been available. This increase in tax basis may increase (for tax purposes) depreciation and amortization and therefore reduce the amount of income tax our intermediate holding companies would otherwise be required to pay in the future. This increase in tax basis may also decrease gain (or increase loss) on future dispositions of certain capital assets to the extent tax basis is allocated to those capital assets.
We are party to a tax receivable agreement with KKR Holdings requiring our intermediate holding company to pay to KKR Holdings or transferees of its KKR Group Partnership Units 85% of the amount of cash savings, if any, in U.S. federal, state and local income tax that the intermediate holding companies actually realize as a result of this increase in tax basis, as well as 85% of the amount of any such savings the intermediate holding companies actually realize as a result of increases in tax basis that arise due to future payments under the agreement. A termination of the agreement or a change of control could give rise to similar payments based on tax savings that we would be deemed to realize in connection with such events. This payment obligation will be an obligation of our intermediate holding companies and not of either KKR Group Partnership. In the event that any of our current or future subsidiaries become taxable as corporations and acquire KKR Group Partnership Units in the future, or if we become taxable as a corporation for U.S. federal income tax purposes, we expect that each such entity will become subject to a tax receivable agreement with substantially similar terms. While the actual increase in tax basis, as well as the amount and timing of any payments under this agreement, will vary depending upon a number of factors, including the timing of exchanges, the price of our common units at the time of the exchange, the extent to which such exchanges are taxable and the amount and timing of our taxable income, we expect that as a result of the size of the increases in the tax basis of the tangible and intangible assets of the KKR Group Partnerships, the payments that we may be required to make to our existing owners will be substantial. The payments under the tax receivable agreement are not conditioned upon our existing owners’ continued ownership of us. We may need to incur debt to finance payments under the tax receivable agreement to the extent our cash resources are insufficient to meet our obligations under the tax receivable agreement as a result of timing discrepancies or otherwise. In particular, our intermediate holding companies’ obligations under the tax receivable agreement would be effectively accelerated in the event of an early termination of the tax receivable agreement by our intermediate holding companies or in the event of certain mergers, asset sales and other forms of business combinations or other changes of control. In these situations, our obligations under the tax receivable agreement could have a substantial negative impact on our liquidity.
Payments under the tax receivable agreement will be based upon the tax reporting positions that our Managing Partner will determine. We are not aware of any issue that would cause the IRS to challenge a tax basis increase. However, neither KKR Holdings nor its transferees will reimburse us for any payments previously made under the tax receivable agreement if such tax basis increase, or the tax benefits we claim arising from such increase, is successfully challenged by the IRS. As a result, in certain circumstances, payments to KKR Holdings or its transferees under the tax receivable agreement could be in excess of the intermediate holding companies’ cash tax savings. The intermediate holding companies’ ability to achieve benefits from any tax basis increase, and the payments to be made under this agreement, will depend upon a number of factors, as discussed above, including the timing and amount of our future income.
If we were deemed to be an “investment company” subject to regulation under the Investment Company Act, applicable restrictions could make it impractical for us to continue our business as contemplated and could have a material adverse effect on our business.
A person will generally be deemed to be an “investment company” for purposes of the Investment Company Act if:
|
•
|
it is or holds itself out as being engaged primarily, or proposes to engage primarily, in the business of investing, reinvesting or trading in securities; or
|
|
•
|
absent an applicable exemption, it owns or proposes to acquire investment securities having a value exceeding 40% of the value of its total assets (exclusive of U.S. government securities and cash items) on an unconsolidated basis.
|
We believe that we are engaged primarily in the business of providing investment management services and not in the business of investing, reinvesting or trading in securities. We regard ourselves as an investment management firm and do not
82
propose to engage primarily in the business of investing, reinvesting or trading in securities. Accordingly, we do not believe that we are an “orthodox” investment company as defined in Section 3(a)(1)(A) of the Investment Company Act and described in the first bullet point above.
With regard to the provision described in the second bullet point above, we have no material assets other than our equity interests in subsidiaries, which in turn have no material assets other than equity interests, directly or indirectly, in the KKR Group Partnerships. Through these interests, we indirectly are the sole general partners of the KKR Group Partnerships and indirectly are vested with all management and control over the KKR Group Partnerships. We do not believe our equity interests in our subsidiaries are investment securities, and we believe that the capital interests of the general partners of our funds in their respective funds are neither securities nor investment securities. Accordingly, based on our determination, less than 40% of the partnership’s total assets (exclusive of U.S. government securities and cash items) on an unconsolidated basis are comprised of assets that could be considered investment securities. However, our subsidiaries have a significant number of investment securities, and we expect to make investments in other investment securities from time to time. We monitor these holdings regularly to confirm our continued compliance with the 40% test described in the second bullet point above. The need to comply with this 40% test may cause us to restrict our business and subsidiaries with respect to the assets in which we can invest and/or the types of securities we may issue, sell investment securities, including on unfavorable terms, acquire assets or businesses that could change the nature of our business or potentially take other actions which may be viewed as adverse by the holders of our common units, in order to ensure conformity with exceptions provided by, and rules and regulations promulgated under, the Investment Company Act.
With respect to our subsidiary KFN, we believe it is not and does not propose to be primarily engaged in the business of investing, reinvesting or trading in securities, and we do not believe that KFN has held itself out as such. KFN conducts its operations primarily through its majority‑owned subsidiaries, each of which is either outside of the definition of an investment company as defined in the Investment Company Act or excepted from such definition under the Investment Company Act. KFN monitors its holdings regularly to confirm its continued compliance with the 40% test described in the second bullet point above, and restricts its subsidiaries with respect to the assets in which each of them can invest and/or the types of securities each of them may issue in order to ensure conformity with exceptions provided by, and rules and regulations promulgated under, the Investment Company Act. If the SEC were to disagree with KFN’s treatment of one or more of its subsidiaries as being excepted from the Investment Company Act, with its determination that one or more of its other holdings are not investment securities for purposes of the 40% test, or with its determinations as to the nature of its business or the manner in which it holds itself out, KFN and/or one or more of its subsidiaries could be required either (i) to change substantially the manner in which it conducts its operations to avoid being subject to the Investment Company Act or (ii) to register as an investment company. Either of these would likely have a material adverse effect on KFN, its ability to service its indebtedness and to make distributions on its shares, and on the market price of its shares and securities, and could thereby materially adversely affect our business, financial condition and results of operations.
The Investment Company Act and the rules thereunder contain detailed parameters for the organization and operation of investment companies. Among other things, the Investment Company Act and the rules thereunder limit or prohibit transactions with affiliates, impose limitations on the issuance of debt and equity securities, generally prohibit the issuance of options and impose certain governance requirements. We intend to conduct our operations so that we will not be deemed to be an investment company under the Investment Company Act. If anything were to happen which would cause the partnership to be deemed to be an investment company under the Investment Company Act, requirements imposed by the Investment Company Act, including limitations on our capital structure, ability to transact business with affiliates and ability to compensate key employees, would make it impractical for us to continue our business as currently conducted, impair the agreements and arrangements between and among the partnership, the KKR Group Partnerships and KKR Holdings, or any combination thereof, and materially adversely affect our business, financial condition and results of operations. In addition, we may be required to limit the amount of investments that we make as a principal, potentially divest of our investments or otherwise conduct our business in a manner that does not subject us to the registration and other requirements of the Investment Company Act.
On August 31, 2011 the SEC published an advance notice of proposed rulemaking regarding Rule 3a‑7 and a concept release seeking information on Section 3(c)(5)(C), two provisions with which KKR’s subsidiaries, including KFN, must comply under the 40% test described above. Among the issues for which the SEC has requested comment is whether Rule 3a‑7 should be modified so that parent companies of subsidiaries that rely on Rule 3a‑7 should treat their interests in such subsidiaries as investment securities for purposes of the 40% test. The SEC is also seeking information about the nature of entities that invest in mortgages and mortgage‑related pools and how the SEC staff’s interpretive positions in connection with Section 3(c)(5)(C) affect these entities. Any guidance or action from the SEC or its staff, including changes that the SEC may ultimately propose and adopt to the way Rule 3a‑7 applies to entities or new or modified interpretive positions related to
83
Section 3(c)(5)(C), could further inhibit KKR’s ability, or the ability of any of its subsidiaries, including KFN, to pursue its current or future operating strategies, which could have a material adverse effect on us.
We are a Delaware limited partnership, and there are certain provisions in our limited partnership agreement regarding exculpation and indemnification of our officers and directors that differ from the Delaware General Corporation Law (DGCL) in a manner that may be less protective of the interests of our common unitholders.
Our limited partnership agreement provides that to the fullest extent permitted by applicable law our directors or officers will not be liable to us. However, under the DGCL, a director or officer would be liable to us for (i) breach of duty of loyalty to us or our shareholders, (ii) intentional misconduct or knowing violations of the law that are not done in good faith, (iii) improper redemption of shares or declaration of dividend, or (iv) a transaction from which the director derived an improper personal benefit. In addition, our limited partnership agreement provides that we indemnify our directors and officers for acts or omissions to the fullest extent provided by law. However, under the DGCL, a corporation can only indemnify directors and officers for acts or omissions if the director or officer acted in good faith, in a manner he reasonably believed to be in the best interests of the corporation, and, in criminal action, if the officer or director had no reasonable cause to believe his conduct was unlawful. Accordingly, our limited partnership agreement may be less protective of the interests of our common unitholders, when compared to the DGCL, insofar as it relates to the exculpation and indemnification of our officers and directors. See also “-Our limited partnership agreement contains provisions that reduce or eliminate duties (including fiduciary duties) of our limited partner and limit remedies available for unitholders for actions that might otherwise constitute a breach of duty. It will be difficult for unitholders to successfully challenge a resolution of a conflict of interest by our Managing Partner or by its conflicts committee.”
Risks Related to U.S. Taxation
If we were treated as a corporation for U.S. federal income tax or state tax purposes, then our distributions to you would be substantially reduced and the value of our common units could be adversely affected.
The value of your investment in us depends in part on our being treated as a partnership for U.S. federal income tax purposes, which requires that 90% or more of our gross income for every taxable year consist of qualifying income, as defined in Section 7704 of the Internal Revenue Code of 1986, as amended (the “Code”), and that our partnership not be registered under the Investment Company Act. Qualifying income generally includes dividends, interest, capital gains from the sale or other disposition of stocks and securities, gain from the sale or other disposition of real property, real property rents, income and gains from energy and oil and gas investments and certain other forms of investment income. We intend to structure our investments so as to satisfy these requirements, including by generally holding investments that generate non‑qualifying income through one or more subsidiaries that are treated as corporations for U.S. federal income tax purposes. Nonetheless, we may not meet these requirements, may not correctly identify investments that should be owned through corporate subsidiaries, or current law may change so as to cause, in any of these events, us to be treated as a corporation for U.S. federal income tax purposes or otherwise subject us to U.S. federal income tax. We have not requested, and do not plan to request, a ruling from the IRS, on this or any other matter affecting us.
If we were treated as a corporation for U.S. federal income tax purposes, we would pay U.S. federal, state and local income tax on our taxable income at the applicable tax rates. Distributions to you would generally be taxed again as corporate distributions, and no income, gains, losses, deductions or credits would otherwise flow through to you. Because a tax would be imposed upon us as a corporation, our distributions to you would be substantially reduced which could cause a reduction in the value of our common units.
Our unitholders may be subject to U.S. federal income tax on their share of our taxable income, regardless of whether they receive any cash distributions, and they may recognize income in excess of cash distributions.
As long as 90% of our gross income for each taxable year constitutes qualifying income as defined in Section 7704 of the Code and we are not registered as an investment company under the Investment Company Act on a continuing basis, and assuming there is no change in law, we will be treated, for U.S. federal income tax purposes, as a partnership and not as an association or a publicly traded partnership taxable as a corporation. Accordingly, each unitholder will be required to take into account its allocable share of our items of income, gain, loss and deduction. Distributions to a unitholder will generally be taxable to the unitholder for U.S. federal income tax purposes only to the extent the amount distributed exceeds the unitholder's tax basis in the unit. That treatment contrasts with the treatment of a shareholder in a corporation. For example, a shareholder in a corporation who receives a distribution of earnings from the corporation will generally report the distribution as dividend income for U.S. federal income tax purposes. In contrast, a holder of our units who receives a distribution of earnings from us will not report the distribution as dividend income (and will treat the distribution as taxable only to the extent the amount
84
distributed exceeds the unitholder's tax basis in the units), but will instead report the holder's allocable share of items of our income for U.S. federal income tax purposes. As a result, a unitholder may be subject to U.S. federal, state, local and possibly, in some cases, foreign income taxation on its allocable share of our items of income, gain, loss, deduction and credit (including its allocable share of those items of any entity in which we invest that is treated as a partnership or is otherwise subject to tax on a flow through basis) for each of our taxable years ending with or within the unitholder’s taxable year, regardless of whether or not such unitholder receives cash distributions. See “-Risks Related to Our Business-The U.S. Congress has considered legislation that would have (i) in some cases after a ten‑year period, precluded us from qualifying as a partnership or required us to hold carried interest through taxable subsidiary corporations and (ii) taxed certain income and gains at increased rates. If any similar legislation were to be enacted and apply to us, the after‑tax income and gain related to our business, as well as the market price of our units, could be reduced.”
You should not expect to receive cash distributions equal to your allocable share of our net taxable income, because, among other things, we currently have a fixed distribution policy. In addition, certain of our holdings, including holdings, if any, in controlled foreign corporations, or a CFCs, passive foreign investment companies, or a PFICs, or entities treated as partnerships for U.S. federal income tax purposes, may produce taxable income prior to the receipt of cash relating to such income, and holders of our common units that are U.S. taxpayers may be required to take such income into account in determining their taxable income. In the event of an inadvertent termination of the partnership status for which the IRS has granted limited relief, each holder of our common units may be obligated to make such adjustments as the IRS may require to maintain our status as a partnership. Such adjustments may require the holders of our common units to recognize additional amounts in income during the years in which they hold such units. In addition, because of our methods of allocating income and gain among holders of our common units, you may be taxed on amounts that accrued economically before you became a unitholder.
We can make no assurances that our cash distributions to you will be sufficient to cover your tax liability arising from your investment in us in any given year, quarter or other period. We are under no obligation to make any distribution, and we generally do not make annual tax distributions. In addition, in certain circumstances, we may not be able to make any distributions or will only be making distributions in amounts less than your tax liability attributable to your investment in us. To the extent taxable income is allocated to you in excess of the cash distributions made, the excess amount would typically be applied to increase the tax basis of your investment in us under applicable U.S. federal tax laws. Furthermore, when we make cash distributions, we anticipate making cash distributions on a quarterly basis while allocating taxable income on a monthly basis. As a result, if you dispose of your common units, you may be allocated taxable income during the time you held your common units without receiving any cash distributions corresponding to that period. Moreover, when an investment is realized at the end of a fiscal quarter, taxable income allocable to such realization is generally made during the same taxable period, but the distribution, if any, generated by such realization may not be paid until a later period. Accordingly, you should ensure that you have sufficient cash flow from sources other than our cash distributions to pay for all of your tax liabilities.
Our interests in certain of our businesses will be held through intermediate holding companies, which will be treated as corporations for U.S. federal income tax purposes; such corporations may be liable for significant taxes and may create other adverse tax consequences, which could potentially adversely affect the value of our common units.
In light of the publicly traded partnership rules under U.S. federal income tax laws and other requirements, we will hold our interest in certain of our businesses through intermediate holding companies, which will be treated as corporations for U.S. federal income tax purposes. The intermediate holding companies organized in the United States or otherwise subject to regular U.S. federal income taxation will be liable for U.S. federal income taxes at regular rates on all of their taxable income as well as applicable state, local and other taxes. These taxes would reduce the amount of distributions available to be made on our common units. In addition, these taxes could be increased if the IRS were to successfully reallocate deductions or income of the related entities conducting our business.
Changes in U.S. tax law could adversely affect our ability to raise funds from certain foreign investors.
Under legislation known as the U.S. Foreign Account Tax Compliance Act, or FATCA, U.S. withholding agents and all entities in a broadly defined class of foreign financial institutions, or FFIs, are required to comply with a complicated and expansive reporting regime or be subject to a 30% United States withholding tax on certain U.S. payments (and beginning in 2019, a 30% withholding tax on gross proceeds from the sale of U.S. stocks and securities) and non‑U.S. entities which are not FFIs are required to either certify they have no substantial U.S. beneficial ownership or to report certain information with respect to their substantial U.S. beneficial ownership or be subject to a 30% U.S. withholding tax on certain U.S. payments (and beginning in 2019, a 30% withholding tax on gross proceeds from the sale of U.S. stocks and securities). The reporting
85
obligations imposed under FATCA and related intergovernmental require FFIs to enter into agreements with the IRS and other jurisdictions to obtain and disclose information about certain fund investors to the IRS. In addition, the administrative and economic costs of compliance with FATCA may discourage some foreign investors from investing in U.S. funds, which could adversely affect our ability to raise funds from these investors.
We may hold or acquire certain investments through an entity classified as a PFIC or CFC for U.S. federal income tax purposes.
Certain of our investments may be in foreign corporations or may be acquired through a foreign subsidiary that would be classified as a corporation for U.S. federal income tax purposes. Such an entity may be PFIC for U.S. federal income tax purposes. In addition, we may hold certain investments in foreign corporations that are treated as CFCs. Unitholders may experience adverse U.S. tax consequences as a result of holding an indirect interest in a PFIC or CFC. These investments may produce taxable income prior to the receipt of cash relating to such income, and unitholders that are U.S. taxpayers will be required to take such income into account in determining their gross income subject to tax. In addition, all or a portion of gain on the sale of a CFC may be taxable at ordinary income rates. Further, with respect to gain on the sale of and excess distributions from a PFIC for which an election for current inclusions is not made, such income would be taxable at ordinary income rates and be subject to an additional tax charge equivalent to an interest charge on the deferral of income inclusions from that PFIC.
Tax gain or loss on disposition of our common units could be more or less than expected.
If you sell your common units, you will recognize a gain or loss equal to the difference between the amount realized and your adjusted tax basis allocated to those common units. Prior distributions to you in excess of the total net taxable income allocated to you will have decreased the tax basis in your common units. Therefore, such excess distributions will increase your taxable gain, or decrease your taxable loss, when the common units are sold and may result in a taxable gain even if the sale price is less than the original cost. A portion of the amount realized, whether or not representing gain, may be ordinary income to you.
Unitholders may be allocated taxable gain on the disposition of certain assets, even if they did not share in the economic appreciation inherent in such assets.
We and our intermediate holding companies will be allocated taxable gains and losses recognized by the KKR Group Partnerships based upon our percentage ownership in each KKR Group Partnership. Our share of such taxable gains and losses generally will be allocated pro rata to our unitholders. In some circumstances, under the U.S. federal income tax rules affecting partners and partnerships, the taxable gain or loss allocated to a unitholder may not correspond to that unitholder’s share of the economic appreciation or depreciation in the particular asset. This is primarily an issue of the timing of the payment of tax, rather than a net increase in tax liability, because the gain or loss allocation would generally be expected to be offset as a unitholder sells units.
Non‑U.S. persons face unique U.S. tax issues from owning our common units that may result in adverse tax consequences to them.
We expect that a portion of our income will be treated as income effectively connected with a U.S. trade or business for U.S. federal income tax purposes, or ECI, with respect to non-U.S. unitholders, including by reason of investments in certain U.S. real property holding corporations, real estate investment trusts (or REITS), real estate assets and energy assets. To the extent our income is treated as ECI, non‑U.S. unitholders generally would be subject to withholding tax on their allocable share of such income, would be required to file a U.S. federal income tax return for such year reporting their allocable share of income effectively connected with such trade or business and any other income treated as ECI, and would be subject to U.S. federal income tax at regular U.S. tax rates on any such income (state and local income taxes and filings may also apply in that event). Non‑U.S. unitholders that are corporations may also be subject to a 30% branch profits tax (potentially reduced under an applicable treaty) on their actual or deemed distributions of such income. In addition, distributions to non‑U.S. unitholders that are attributable to profits on the sale of a U.S. real property interest may also be subject to 30% withholding tax. Also, non‑U.S. unitholders may be subject to 30% withholding on allocations of our income that are U.S. source fixed or determinable annual or periodic income under the Code, unless an exemption from or a reduced rate of such withholding applies (under an applicable treaty of the Code) and certain tax status information is provided. Finally, if we are treated as being engaged in a U.S. trade or business, a portion of any gain recognized by non‑U.S. unitholders on the sale or exchange of common units may be treated for U.S. federal income tax purposes as ECI, and hence such non‑U.S. unitholders could be subject to U.S. federal income tax on the sale or exchange of common units.
86
Tax‑exempt entities and tax-exempt or tax-deferred accounts face unique tax issues from owning common units that may result in adverse tax consequences to them.
Generally, a tax‑exempt partner of a partnership would be treated as earning unrelated business taxable income, or UBTI, if the partnership regularly engages in a trade or business that is unrelated to the exempt function of the tax‑exempt partner, if the partnership derives income from debt financed property or if the partner interest itself is debt‑financed. As a result of our ownership of real estate assets and energy assets and incurrence of acquisition indebtedness we will derive income that constitutes UBTI. Consequently, a holder of common units that is a tax‑exempt entity (including an individual retirement account, or IRA, or a 401(k) plan participant) will likely be subject to unrelated business income tax to the extent that its allocable share of our income consists of UBTI and thus may be subject to U.S. federal income taxes and U.S. federal income tax reporting with respect to such income. In addition, a tax‑exempt investor may be subject to unrelated business income tax on a sale of their common units.
We cannot match transferors and transferees of common units, and we will therefore adopt certain income tax accounting conventions that may not conform with all aspects of applicable tax requirements. The IRS may challenge this treatment, which could adversely affect the value of our common units.
Because we cannot match transferors and transferees of common units, we have adopted depreciation, amortization and other tax accounting positions that may not conform with all aspects of existing Treasury regulations. A successful IRS challenge to those positions could adversely affect the amount of tax benefits available to our unitholders. It also could affect the timing of these tax benefits or the amount of gain on the sale of common units and could have a negative impact on the value of our common units or result in audits of and adjustments to our unitholders’ tax returns.
In addition, our taxable income and losses are determined and apportioned among unitholders using conventions we regard as consistent with applicable law. As a result, if you transfer your common units, you may be allocated income, gain, loss and deduction realized by us after the date of transfer. Similarly, a transferee may be allocated income, gain, loss and deduction realized by us prior to the date of the transferee’s acquisition of our common units. A transferee may also bear the cost of withholding tax imposed with respect to income allocated to a transferor through a reduction in the cash distributed to the transferee.
The sale or exchange of 50% or more of our capital and profit interests will result in the termination of our partnership for U.S. federal income tax purposes.
We will be considered to have been terminated for U.S. federal income tax purposes if there is a sale or exchange of 50% or more of the total interests in our capital and profits within a 12‑month period. A termination of our partnership would, among other things, result in the closing of our taxable year for all unitholders and may make it more likely that we are unable to meet the qualifying income requirements necessary to maintain our status as a partnership for U.S. federal income tax purposes.
Holders of our common units may be subject to state, local and foreign taxes and return filing requirements as a result of owning such units.
In addition to U.S. federal income taxes, holders of our common units may be subject to other taxes, including state, local and foreign taxes, and estate, inheritance or intangible taxes that are imposed by the various jurisdictions in which we do business or own property now or in the future, even if the holders of our common units do not reside in any of those jurisdictions. Holders of our common units may be required to file state and local income tax returns and pay state and local income taxes in some or all of these jurisdictions in the U.S. and abroad. Further, holders of our common units may be subject to penalties for failure to comply with those requirements. It is the responsibility of each unitholder to file all U.S. federal, state, local and foreign tax returns that may be required of such unitholder. In addition our investments in real assets may expose unitholders to additional adverse tax consequences. See “-Our investments in real assets such as real estate and energy may expose us to increased risks and liabilities and may expose our unitholders to adverse tax consequences.”
Certain U.S. holders of common units are subject to additional tax on “net investment income.”
U.S. holders that are individuals, estates or trusts are subject to a Medicare tax of 3.8% on “net investment income” (or undistributed “net investment income,” in the case of estates and trusts) for each taxable year, with such tax applying to the lesser of such income or the excess of such person’s adjusted gross income (with certain adjustments) over a specified amount. Net investment income includes net income from interest, dividends, annuities, royalties and rents and net gain attributable to the disposition of investment property. It is anticipated that net income and gain attributable to an investment in our common units will be included in a U.S. holder’s “net investment income” subject to this Medicare tax.
87
We may not be able to furnish to each unitholder specific tax information within 90 days after the close of each calendar year, which means that holders of common units who are U.S. taxpayers should anticipate the need to file annually a request for an extension of the due date of their income tax return.
As a publicly traded partnership, our operating results, including distributions of income, dividends, gains, losses or deductions, and adjustments to carrying basis, will be reported on Schedule K‑1 and distributed to each unitholder annually. It may require longer than 90 days after the end of our fiscal year to obtain the requisite information from all lower‑tier entities so that Schedule K‑1s may be prepared for the unitholders. For this reason, holders of common units who are U.S. taxpayers should anticipate the need to file annually with the IRS (and certain states) a request for an extension past April 15 or the otherwise applicable due date of their income tax return for the taxable year.
88
We may be liable for adjustments to our tax returns as a result of recently enacted legislation.
Legislation was recently enacted that significantly changes the rules for U.S. federal income tax audits of partnerships. Such audits will continue to be conducted at a partnership level, but with respect to tax returns for taxable years beginning after December 31, 2017, unless a partnership qualifies for and affirmatively elects an alternative procedure, any adjustments to the amount of tax due (including interest and penalties) will be payable by the partnership. Under the elective alternative procedure, a partnership would issue information returns to persons who were partners in the audited year, who would then be required to take the adjustments into account in calculating their own tax liability, and the partnership would not be liable for the adjustments. If a partnership elects the alternative procedure for a given adjustment, the amount of taxes for which its partners would be liable would be increased by any applicable penalties and a special interest charge. There can be no assurance that we will be eligible to make such an election or that we will, in fact, make such an election for any given adjustment. If we do not or are not able to make such an elections, then (1) our then-current unitholders, in the aggregate, could indirectly bear income tax liabilities in excess of the aggregate amount of taxes that would have been due had we elected the alternative procedure, and (2) a given unitholder may indirectly bear taxes attributable to income allocable to other unitholders or former unitholders, including taxes (as well as interest and penalties) with respect to periods prior to such holder's ownership of common units. Amounts available for distribution to our unitholders may be reduced as a result of our obligation to pay any taxes associated with an adjustment, Many issues and overall effect of this new legislation on us are uncertain, and unitholders should consult their own tax advisors regarding all aspects of this legislation as it affects their particular circumstances.
None.
Our principal executive offices are located in leased office space at 9 West 57th Street, New York, New York. We also lease the space for our other offices. We do not own any real property as of December 31, 2015. We consider these facilities to be suitable and adequate for the management and operations of our business.
On October 29, 2015, we entered into agreements relating to the construction and development of office space at 30 Hudson Yards in New York, New York to serve as our new corporate headquarters beginning in 2020.
The section entitled “Litigation” appearing in Note 17 “Commitments and Contingencies” of our financial statements included elsewhere in this report is incorporated herein by reference.
Not applicable.
89
Our common units representing limited partner interests began trading on the New York Stock Exchange, or NYSE, on July 15, 2010 and are traded under the symbol "KKR." The following table sets forth the high and low intra-day sales prices per unit of our common units, for the periods indicated, as reported by the NYSE.
|
Sales price
|
|||||||||||||||
|
2015
|
2014
|
||||||||||||||
|
High
|
Low
|
High
|
High
|
||||||||||||
|
First Quarter
|
$
|
25.04
|
|
$
|
22.36
|
|
$
|
26.50
|
|
$
|
22.07
|
|
|||
|
Second Quarter
|
$
|
23.79
|
|
$
|
22.35
|
|
$
|
24.69
|
|
$
|
21.20
|
|
|||
|
Third Quarter
|
$
|
24.79
|
|
$
|
8.00
|
|
$
|
25.58
|
|
$
|
21.51
|
|
|||
|
Fourth Quarter
|
$
|
19.20
|
|
$
|
14.33
|
|
$
|
23.59
|
|
$
|
18.84
|
|
|||
The number of holders of record of our common units as of February 22, 2016 was 74. This does not include the number of unitholders that hold shares in "street-name" through banks or broker-dealers.
Distribution Policy
The following table presents the distributions paid to holders of our common units at the close of business on the specified record date during fiscal
2014
and
2015
:
|
Payment Date
|
Record Date
|
Distribution per unit
|
||
|
March 4, 2014
|
February 18, 2014
|
$0.48
|
||
|
May 23, 2014
|
May 9, 2014
|
$0.43
|
||
|
August 19, 2014
|
August 4, 2014
|
$0.67
|
||
|
November 18, 2014
|
November 3, 2014
|
$0.45
|
||
|
March 6, 2015
|
February 20, 2015
|
$0.35
|
||
|
May 18, 2015
|
May 4, 2015
|
$0.46
|
||
|
August 18, 2015
|
August 3, 2015
|
$0.42
|
||
|
November 24, 2015
|
November 6, 2015
|
$0.35
|
||
Our distribution policy for 2014 through the nine months ended September 30, 2015 was to make quarterly cash distributions in amounts that in the aggregate constituted substantially all of the cash earnings of our investment management business, 40% of the net realized investment income of KKR (other than KFN), and 100% of the net realized investment income of KFN, in each case in excess of amounts determined by us to be necessary or appropriate to provide for the conduct of our business, to make appropriate investments in our business and our investment funds and to comply with applicable law and any of our debt instruments or other obligations.
On October 27, 2015, KKR announced a change to its distribution policy effective beginning with the distribution declared on February 11, 2016 with respect to the quarter ending December 31, 2015. Under the new distribution policy, KKR intends to make equal quarterly distributions to holders of its common units in an amount of $0.16 per common unit per quarter. KKR's regular distribution per common unit of $0.16 was declared on February 11, 2016 for the quarter ended December 31, 2015.
Because we make our investment in our business through a holding company structure and the applicable holding companies do not own any material cash- generating assets other than their direct and indirect holdings in KKR Group Partnership Units, distributions are expected to be funded in the following manner:
90
• First, the KKR Group Partnerships will make distributions to holders of KKR Group Partnership Units, including the holding companies through which we invest, in proportion to their percentage interests in the KKR Group Partnerships;
• Second, the holding companies through which we invest will distribute to us the amount of any distributions that they receive from the KKR Group Partnerships, after deducting any applicable taxes, and
• Third, we will distribute to holders of our units the amount of any distributions that we receive from our holding companies through which we invest.
The partnership agreements of the KKR Group Partnerships provide for cash distributions, which are referred to as tax distributions, to the partners of such partnerships if we determine that the taxable income of the relevant partnership will give rise to taxable income for its partners. However, holders should not expect the KKR Group Partnerships will make any tax distributions, and there can be no assurance that, for any particular holder, our distributions will be sufficient to pay such holder's actual U.S. or non-U.S. tax liability.
The declaration and payment of any distributions are subject to the discretion of the board of directors of the general partner of KKR & Co. L.P., which may change the distribution policy at any time, and the terms of its limited partnership agreement. There can be no assurance that distributions will be made as intended or at all, that unitholders will receive sufficient distributions to satisfy payment of their tax liabilities as limited partners of KKR & Co. L.P. or that any particular distribution policy will be maintained. When KKR & Co. L.P. receives distributions from the KKR Group Partnerships (the holding companies of the KKR business), KKR Holdings receives its pro rata share of such distributions from the KKR Group Partnerships. Furthermore, the declaration and payment of distributions is subject to legal, contractual and regulatory restrictions on the payment of distributions by us or our subsidiaries, including restrictions contained in our debt agreements, and such other factors as the board of directors of our Managing Partner considers relevant including, among others, our available cash and current and anticipated cash needs, including funding of investment commitments and debt service and future debt repayment obligations; general economic and business conditions; our strategic plans and prospects; our results of operations and financial condition; and our capital requirements.
The board of directors of the general partner of KKR & Co. L.P. may change the distribution policy at any time and from time to time. We are not currently restricted by any contract from making distributions to our unitholders, although certain of our subsidiaries are bound by credit agreements that contain certain restricted payment and/or other covenants, which may have the effect of limiting the amount of distributions that we receive from our subsidiaries. See "Management's Discussion and Analysis of Financial Condition and Results of Operations—Liquidity—Sources of Cash". In addition, under Section 17-607 of the Delaware Limited Partnership Act, we will not be permitted to make a distribution if, after giving effect to the distribution, our liabilities would exceed the fair value of our assets.
91
Common Unit Repurchases in the Fourth Quarter of
2015
The table below sets forth the information with respect to purchases made by or on behalf of KKR & Co. L.P. or any “affiliated purchaser” (as defined in Rule 10b-18(a)(3) under the Securities Exchange Act of 1934) of our common units during the fourth quarter of the year ended
December 31, 2015
.
|
Issuer Purchases of Common Units
|
||||||||||||||
|
(amounts in thousands, except per unit amounts)
|
||||||||||||||
|
Total Number of Units Purchased
|
Average Price Paid Per Units
|
Cumulative Number of Units Purchased as Part of Publicly Announced Plans or Programs (1)
|
Approximate Dollar Value of Units that May Yet Be Purchased Under the Plans or Programs
|
|||||||||||
|
Month #1
(October 1, 2015 to
October 31, 2015)
|
—
|
|
N/A
|
—
|
|
$
|
500,000
|
|
||||||
|
Month #2
(November 1, 2015 to
November 30, 2015)
|
2,108,800
|
|
$
|
17.85
|
|
2,108,800
|
|
$
|
462,349
|
|
||||
|
Month #3
(December 1, 2015 to
December 31, 2015)
|
7,811,092
|
|
$
|
15.91
|
|
9,919,892
|
|
$
|
338,071
|
|
||||
|
Total through December 31, 2015
|
9,919,892
|
|
|
|||||||||||
|
Purchases subsequent to December 31, 2015:
|
|
|||||||||||||
|
(January 1, 2016 to
February 11, 2016)
|
7,535,292
|
|
$
|
14.34
|
|
17,455,184
|
|
$
|
230,000
|
|
||||
|
Total through February 11, 2016 (date of Earnings Release)
|
17,455,184
|
|
||||||||||||
|
(1) On October 27, 2015, KKR announced the authorization of a program providing for the repurchase by KKR of up to $500 million in the aggregate of its outstanding common units. Under this unit repurchase program, units may be repurchased from time to time in open market transactions, in privately negotiated transactions or otherwise. The timing, manner, price and amount of any unit repurchases will be determined by KKR in its discretion and will depend on a variety of factors, including legal requirements, price and economic and market conditions. KKR expects that the program, which has no expiration date, will be in effect until the maximum approved dollar amount has been used to repurchase common units. The program does not require KKR to repurchase any specific number of common units, and the program may be suspended, extended, modified or discontinued at any time.
|
||||||||||||||
During the fourth quarter of 2015 in addition to the units repurchased as described in the table above, (1) cash was used to pay the amount of withholding taxes, social benefit payments or similar payments payable by us in respect of awards granted pursuant to the Equity Incentive Plan and (2) cash was delivered in respect of certain awards granted pursuant to the Equity Incentive Plan. These payments represented the equivalent of equity awards representing
1,660,645
KKR common units. Since cash was used to settle the amounts in (1) and (2) above,
1,660,645
KKR common units were canceled, and accordingly, such units are no longer included in KKR's common unit count on a fully diluted basis.
Additionally, during the fourth quarter of
2015
, 3,284,253 KKR Group Partnership Units were exchanged by KKR Holdings and its principals for an equal number of our common units, resulting in an increase in our ownership of the KKR Group Partnerships and a corresponding decrease in the ownership of the KKR Group Partnerships by KKR Holdings.
Unregistered Sales of Equity Securities
On September 9, 2015, a subsidiary of KKR & Co. L.P. agreed to acquire a 24.9% equity interest in Marshall Wace for a combination of cash and KKR & Co. L.P. common units. On November 2, 2015, the transaction closed, and KKR & Co. L.P. delivered 7,364,545 common units to the sellers of the Marshall Wace business in partial satisfaction of its obligations under the acquisition agreement. These common units were issued in reliance on Section 4(a)(2) of the Securities Act of 1933, as a transaction by the issuer not involving a public offering. Each of the unit recipients represented that it was an accredited investor. KKR & Co. L.P. also entered into a registration rights agreement with the selling shareholders of Marshall Wace.
92
The following tables set forth our selected historical consolidated financial data as of and for the years ended
December 31, 2015
, 2014, 2013, 2012 and 2011. We derived the selected historical consolidated financial data as of
December 31, 2015
and 2014 and for the years ending
December 31, 2015
, 2014 and 2013 from the audited consolidated financial statements included elsewhere in this report. We derived the selected historical consolidated financial data as of December 31, 2013, 2012 and 2011 and for the years ended December 31, 2012 and 2011 from our audited consolidated financial statements which are not included in this report. You should read the following data together with "Management's Discussion and Analysis of Financial Condition and Results of Operations" and our consolidated financial statements and related notes included elsewhere in this report.
|
Year Ended December 31,
|
|||||||||||||||||||
|
2015
|
2014
|
2013
|
2012
|
2011
|
|||||||||||||||
|
(all dollars are in thousands, except unit and per unit data)
|
|||||||||||||||||||
|
Statement of Operations Data:
|
|||||||||||||||||||
|
Fees and Other
|
$
|
1,043,768
|
|
$
|
1,110,008
|
|
$
|
762,546
|
|
$
|
568,442
|
|
$
|
723,620
|
|
||||
|
Less: Total Expenses
|
1,871,225
|
|
2,196,067
|
|
1,767,138
|
|
1,598,788
|
|
1,214,005
|
|
|||||||||
|
Total Investment Income (Loss)
|
6,169,125
|
|
6,544,748
|
|
8,896,746
|
|
9,101,995
|
|
1,456,116
|
|
|||||||||
|
Income (Loss) Before Taxes
|
5,341,668
|
|
5,458,689
|
|
7,892,154
|
|
8,071,649
|
|
965,731
|
|
|||||||||
|
Income Taxes
|
66,636
|
|
63,669
|
|
37,926
|
|
43,405
|
|
89,245
|
|
|||||||||
|
Net Income (Loss)
|
5,275,032
|
|
5,395,020
|
|
7,854,228
|
|
8,028,244
|
|
876,486
|
|
|||||||||
|
Net Income (Loss) Attributable to
Redeemable Noncontrolling Interests
|
(4,512
|
)
|
(3,341
|
)
|
62,255
|
|
34,963
|
|
4,318
|
|
|||||||||
|
Net Income (Loss) Attributable to
Noncontrolling Interests and
Appropriated Capital
|
4,791,062
|
|
4,920,750
|
|
7,100,747
|
|
7,432,445
|
|
870,247
|
|
|||||||||
|
Net Income (Loss) Attributable to
KKR & Co. L.P.
|
$
|
488,482
|
|
$
|
477,611
|
|
$
|
691,226
|
|
$
|
560,836
|
|
$
|
1,921
|
|
||||
|
Net Income (Loss) Attributable to
KKR & Co. L.P. Per Common Unit
|
|||||||||||||||||||
|
Basic
|
$
|
1.09
|
|
$
|
1.25
|
|
$
|
2.51
|
|
$
|
2.35
|
|
$
|
0.01
|
|
||||
|
Diluted
|
$
|
1.01
|
|
$
|
1.16
|
|
$
|
2.30
|
|
$
|
2.21
|
|
$
|
0.01
|
|
||||
|
Weighted Average Common Units Outstanding
|
|||||||||||||||||||
|
Basic
|
448,884,185
|
381,092,394
|
274,910,628
|
238,503,257
|
220,235,469
|
||||||||||||||
|
Diluted
|
482,699,194
|
412,049,275
|
300,254,090
|
254,093,160
|
222,519,174
|
||||||||||||||
|
Statement of Financial Condition Data
(period end):
|
|||||||||||||||||||
|
Total Assets
|
$
|
71,057,759
|
|
$
|
65,872,745
|
|
$
|
51,427,201
|
|
$
|
44,426,353
|
|
$
|
40,377,645
|
|
||||
|
Total Liabilities
|
$
|
21,590,174
|
|
$
|
14,168,684
|
|
$
|
4,842,383
|
|
$
|
3,020,899
|
|
$
|
2,692,995
|
|
||||
|
Redeemable Noncontrolling Interests
|
$
|
188,629
|
|
$
|
300,098
|
|
$
|
627,807
|
|
$
|
462,564
|
|
$
|
275,507
|
|
||||
|
Noncontrolling Interests
|
$
|
43,731,774
|
|
$
|
46,004,377
|
|
$
|
43,235,001
|
|
$
|
38,938,531
|
|
$
|
36,080,445
|
|
||||
|
Appropriated Capital
|
$
|
—
|
|
$
|
16,895
|
|
$
|
—
|
|
$
|
—
|
|
$
|
—
|
|
||||
|
Total KKR & Co. L.P. Partners' Capital (1)
|
$
|
5,547,182
|
|
$
|
5,382,691
|
|
$
|
2,722,010
|
|
$
|
2,004,359
|
|
$
|
1,328,698
|
|
||||
|
(1)
|
Total KKR & Co. L.P. partners' capital reflects only the portion of equity attributable to KKR & Co. L.P. (56% interest in the KKR Group Partnerships as of December 31, 2015) and differs from book value reported on a segment basis primarily as a result of the exclusion of the equity impact of KKR Management Holdings Corp. and allocations of equity to KKR Holdings. KKR Holdings' 44% interest in the KKR Group Partnerships as of December 31, 2015 is reflected as noncontrolling interests and is not included in total KKR & Co. L.P. partners' capital.
|
|||
93
The following discussion and analysis should be read in conjunction with the consolidated financial statements of KKR and the related notes included elsewhere in this report. The historical consolidated financial data discussed below reflects the historical results and financial position of KKR. In addition, this discussion and analysis contains forward looking statements and involves numerous risks and uncertainties, including those described under “Cautionary Note Regarding Forward‑looking Statements” and “Risk Factors.” Actual results may differ materially from those contained in any forward looking statements.
Overview of Business
For a detailed discussion about our businesses, business segments and our firm, see “Item 1--Business.”
Business Environment
Market Conditions
Global Economic Conditions
. As a global investment firm, we are affected by financial and economic conditions globally. Global and regional economic conditions have a substantial impact on our financial condition and results of operations, impacting the values of the investments we make, our ability to exit these investments profitably and our ability to make new investments. According to the Bureau of Economic Analysis as of January 2016, real GDP in the U.S. increased at a seasonally adjusted annualized rate of 2.4% for the full year ended December 31, 2015. According to the Bureau of Labor Statistics, the U.S. unemployment rate decreased to 5.0% as of December 31, 2015 compared to 5.6% as of December 31, 2014. As of January 2016, Eurostat projects GDP growth for the full year ended December 31, 2015 in the Euro Area of 1.5% relative to the prior year. Continuing controversy and uncertainty surrounding key issues such as immigration, austerity, and globalization and European Union exit risk surrounding Greece and the United Kingdom may continue to impair growth and lead to volatility. In the event of an exit, losses incurred by U.K. and Greek counterparties could have adverse repercussions across financial markets, which could adversely affect valuations within our European investments. As of January 2016, the IMF estimates that China’s economy will expand at a rate of 6.9% for 2015, lower than the 7.3% rate in 2014 but higher than its 6.3% estimate for 2016. This slowdown could adversely impact the value of our investments in China and the global economy generally, and other emerging markets, in particular, could also suffer from weaker Chinese imports of both their commodities and finished goods. In addition, the sharp correction and high volatility in China's stock market coupled with the devaluation of the Chinese yuan may adversely impact the value of our investments in China and make it more difficult to access capital in those markets. For a further discussion of how market conditions may affect our businesses, see “Risk Factors- Risks Related to Our Business - Difficult market conditions can adversely affect our business in many ways, including by reducing the value or performance of the investments that we manage or by reducing the ability of our funds to raise or deploy capital, each of which could negatively impact our net income and cash flow and adversely affect our financial condition.”
Global Equity and Credit Markets
. Global equity and debt markets have a substantial effect on our financial condition and results of operations. In general, a climate of reasonable interest rates and high levels of liquidity in the debt and equity capital markets provide a positive environment for us to generate attractive investment returns in our funds that generate carry. Periods of volatility and dislocation in the capital markets present substantial risks, but also can present us with opportunities to invest at reduced valuations that position us for future growth.
Most of our investments are in equities, so a change in global equity prices or in market volatility directly impacts the value of our investments and our profitability as well as our ability to realize investment gains and the receptiveness of fund investors to our investment products. For the year ended December 31, 2015, global equity markets were mixed, with the S&P 500 Index up 1.4% and the MSCI World Index down 0.3% on a total return basis including dividends. However, since December 31, 2015, equity markets have fallen significantly, with the S&P 500 Index down 4.5% and the MSCI World Index down 6.0% on a total return basis including dividends as of February 22, 2016, adversely impacting, at least for the time being, the overall value of our equity investments, in particular our publicly traded securities, including our sizable holding of First Data Corporation (NYSE:FDC). As of February 22, 2016, the market prices of publicly held equity securities held through our private equity funds and in our Principal Activities segment have declined, which we estimate would result in a decrease of at least approximately $550 million to our economic net income in the first quarter of 2016 if the market prices of these securities do not appreciate or if the declines are not offset by gains in other investments or income elsewhere in our business. Of this amount, First Data Corporation accounts for approximately $350 million of the decrease. With respect to the total decrease to our economic net income, approximately 55.9% would be allocable to KKR & Co. L.P. The foregoing amounts do not reflect changes in value of any of our investments other than our publicly held equity securities and may not, therefore be reflective of
94
our business as a whole. Equity market volatility as evidenced by the Chicago Board Options Exchange Market Volatility Index, or the VIX, a measure of volatility, ended at 18.2 as of December 31, 2015, remaining relatively unchanged from 19.2 as of December 31, 2014. However, since December 31, 2015, equity market volatility has increased meaningfully, rising from 18.2 as at December 31, 2015 to 28.1 as at February 11, 2016. For a further discussion of our valuation methods, see “Risk Factors-Risks Related to the Assets We Manage - Our investments are impacted by various economic conditions that are difficult to quantify or predict, and may have a significant impact on the valuation of our investments and, therefore, on the investment income we realize and our financial condition and results of operations” in our Annual Report and “-Critical Accounting Policies-Fair Value Measurements-Level III Valuation Methodologies” in this report.
Many of our investments are in credit instruments, and our funds and their portfolio companies also rely on credit financing and the ability to refinance existing debt. Consequently, any decrease in the value of credit instruments that we have invested in or any increase in the cost of credit financing reduces our returns and decreases our net income. In particular due in part to holdings of credit assets such as CLOs on our balance sheet, the performance of the credit markets has had an amplified impact on our financial results, as we directly bear the full extent of such losses. Credit markets can also impact valuations because a discounted cash flow analysis is generally used as one of the methodologies used to ascertain the fair value of our investments that do not have readily observable market prices. In addition, with respect to our credit investments, increased credit spreads lead to a reduction in the value of these investments, if not offset by hedging or other factors. Within credit markets, spreads have widened during the fiscal year ended December 31, 2015 with significant increases in spreads in the third and fourth quarters of the year. Low interest rates related to monetary stimulus and economic stagnation also has negatively impact expected returns on all investments, as the demand for relatively higher return assets increases and supply decreases. Higher interest rates in conjunction with slower growth or weaker currencies in some emerging market economies may cause the default risk of these countries to increase, and this could impact the operations or value of our investments that operate in these regions. Areas such as the Eurozone and Japan, which have ongoing central bank quantitative easing campaigns and comparatively low interest rates relative to the Unites States, could potentially endure further currency volatility and weakness relative to the U.S. dollar.
The subinvestment grade credit indices fell during the year ended December 31, 2015, with the S&P/LSTA Leveraged Loan Index down 0.7% and the BoAML HY Master II Index down 4.6%. In the quarter ended December 31, 2015, government bond yields rose as the U.S. Federal Reserve increased the target range for the Fed Funds rate by 25 basis points, raising rates for the first time since December 2008. For the year ended December 31, 2015, 10-year government bond yields rose 10 basis points in the United States and 9 basis points in Germany and fell 6 basis points in Japan and 80 basis points in China. For further discussion of the impact of global credit markets on our financial condition and results of operations, see “Risk Factors - Risks Related to the Assets We Manage -Changes in the debt financing markets may negatively impact the ability of our investment funds, their portfolio companies and strategies pursued with our balance sheet assets to obtain attractive financing for their investments or refinance existing debt and may increase the cost of such financing if it is obtained, which could lead to lower-yielding investments and potentially decrease our net income,” “-Risks Related to the Assets We Manage - Our investments are impacted by various economic conditions that are difficult to quantify or predict, and may have a significant impact on the valuation of our investments and, therefore, on the investment income we realize and our financial condition and results of operations” and “- Because we hold interests in some of our portfolio companies both through our management of private equity funds as well as through separate investments in those funds and direct co-investments, fluctuation in the fair values of these portfolio companies may have a disproportionate impact on the investment income earned by us” and “-Critical Accounting Policies-Fair Value Measurements-Level III Valuation Methodologies” in this report.
Foreign Exchange Rates
. Foreign exchange rates have a substantial impact on the valuations of our investments that are denominated in currencies other than the U.S. dollar. Currency volatility, which has become more pronounced in recent quarters, can also affect our businesses which deal in cross‑border trade. The U.S. dollar has appreciated against a number of currencies over recent periods, which is likely to cause a decrease in the U.S. dollar value of our non‑U.S. investments to the extent unhedged, contributing to portfolio companies that export to the U.S. suffering a decline in revenues, and making the exports of U.S. based companies less competitive. While this may cause a decrease in the U.S. dollar values of our assets and portfolio companies outside the United States, we also expect it to create opportunities to invest at more attractive U.S. dollar prices in certain countries. For the year ended December 31, 2015, the euro and the British pound both fell 10.2 % and 5.4%, respectively, relative to the U.S. dollar. In China, the potential for greater CNY depreciation remains a large source of uncertainty. The cumulative devaluation of the yuan since August 2015, which effectively makes Chinese exports cheaper and imports more expensive, may impact global trade substantially for the reasons discussed above. For additional information regarding our foreign exchange rate risk, see “Quantitative and Qualitative Disclosure About Market Risk - Exchange Rate Risk” in this report.
95
Commodity Markets
. Our Private Markets portfolio contains energy real asset investments and certain of our Public Markets strategies and products, including direct lending, special situations and CLOs, have meaningful investments in energy sector. The value of these investments are heavily influenced by the price of natural gas and oil, which have declined meaningfully over the course of the year. The long-term price of WTI crude oil declined from approximately $67 per barrel to $50 per barrel and the long-term price of natural gas declined from approximately $3.77 per mcf to $2.90 per mcf as of December 31, 2014 and December 31, 2015, respectively. Since December 31, 2015 the long-term price of WTI crude oil and natural gas has continued to decline with the long-term price of WTI crude oil at $45 per barrel and the long-term price of natural gas at $2.56 per mcf, in each case as of February 22, 2016. If such decline in prices persists or worsens or if it is not offset by other factors, we would expect the value of our energy real asset investments to be adversely impacted. In addition, due in part to holdings of direct energy assets on our balance sheet, which had a fair value of $0.6 billion as of December 31, 2015, these price movements have had an amplified impact on our financial results, as we directly bear the full extent of such losses. For additional information regarding our energy real assets, see “-Critical Accounting Policies-Fair Value Measurements-Level III Valuation Methodologies-Real Asset Investments” in this report and “Risk Factors - Risks Related to the Assets We Manage - Because we hold interests in some of our portfolio companies both through our management of private equity funds as well as through separate investments in those funds and direct co-investments, fluctuation in the fair values of these portfolio companies may have a disproportionate impact on the investment income earned by us” in this report.
Business Conditions
Our segment revenues consist of fees, performance income and investment income. Our ability to grow our revenues depends in part on our ability to attract new capital and investors, our successful deployment of capital including from our balance sheet and our ability to realize investments.
|
•
|
Our ability to attract new capital and investors.
Our ability to attract new capital and investors in our funds is driven, in part, by the extent to which they continue to see the alternative asset management industry generally, and our investment products specifically, as an attractive vehicle for capital appreciation or income. Since 2010, we have expanded into strategies such as energy, infrastructure, real estate, alternative credit and hedge funds. In several of these strategies, our first time funds have begun raising successor funds, and we expect the cost of raising such successor funds to be lower. We have also reached out to a new investor base of retail and high net worth clients. However, fundraising continues to be competitive. While we had several successful fundraises in 2015 for newer strategies such as real estate, European real estate, infrastructure, direct lending, mezzanine and special situations , there is no assurance that fundraises for other new strategies or successor funds will experience similar success in the future. While our flagship Americas fund has begun fundraising, our other flagship private equity funds have completed fundraising or are not expected to commence fundraising in early 2016. Consequently, our AUM, FPAUM and associated fees attributable to new capital raised may be lower than in prior years. New capital raised for the fiscal years ended December 31, 2013, 2014 and 2015 was $21.2 billion, $13.3 billion and $19.8 billion, which in the case of new capital raised in the fiscal year ended December 31, 2015, includes our pro-rata portion of new capital of other asset managers in which we have a minority interest and the inclusion of new capital commitments for which KKR is eligible to receive fees or carried interest upon deployment of capital.
|
|
•
|
|
|
•
|
Our ability to sell investments.
The strength and liquidity of the U.S. and relevant global equity markets generally, and the initial public offering market specifically affects the value of, and our ability to successfully exit, our equity positions in our private equity portfolio companies in a timely manner. We may also realize investments through strategic sales. For the fiscal years ended December 31 2013, 2014 and 2015, through exit activity in our investments, we realized carried interest of $0.7 billion, $1.2 billion and $1.0 billion. Since December 31, 2015, we have closed the
|
96
strategic sales of Dalmia Cement (manufacturing sector), Masan Consumer Corporation (consumer products sector) and Legends Outlets Kansas City (real estate asset). We have also completed a dividend recapitalization at US Foods (retail sector). Such sales, however, are episodic and reduced levels of sale activity in future quarters would reduce transaction fees, realized carry and distributions.
Basis of Accounting
We consolidate the financial results of the KKR Group Partnerships and their consolidated subsidiaries, which include the accounts of our investment management and capital markets companies, the general partners of certain unconsolidated funds and vehicles, general partners of consolidated funds and their respective consolidated funds and certain other entities including certain consolidated CLOs and commercial real estate mortgage-backed securities ("CMBS", and together with CLOs, referred to hereafter as collateralized financing entities "CFEs").
In accordance with accounting principles generally accepted in the United States of America, or GAAP, certain entities, including a substantial number of our funds and CFEs, are consolidated notwithstanding the fact that we may hold only a minority economic interest in those entities. In particular, in the majority of our consolidated funds and other investment vehicles, we hold a general partner interest that gives us substantive controlling rights over such funds and vehicles. With respect to our consolidated funds and vehicles, we generally have operational discretion and control, and fund investors have no substantive rights to impact ongoing governance and operating activities of the fund, including the ability to remove the general partner, also known as kick-out rights. As of
December 31, 2015
, our AUM in our Private Markets segment included 21 consolidated investment funds and 21 unconsolidated investment vehicles. Our AUM in our Public Markets segment included 32 consolidated investment vehicles, including CLOs, and 69 unconsolidated vehicles.
When an entity is consolidated, we reflect the assets, liabilities, fees, expenses, investment income and cash flows of the consolidated entity on a gross basis. While the consolidation of a consolidated fund or entity does not have an effect on the amounts of net income attributable to KKR or KKR's partners' capital that KKR reports, the consolidation does significantly impact the financial statement presentation. This is due to the fact that the assets, liabilities, fees, expenses and investment income of the consolidated funds and entities are reflected on a gross basis while the allocable share of those amounts that are attributable to third parties are reflected as single line items. The single line items in which the assets, liabilities, fees, expenses and investment income attributable to third parties are recorded are presented as noncontrolling interests on the consolidated statements of financial condition and net income attributable to noncontrolling interests on the consolidated statements of operations. For a further discussion of our consolidation policies, see "Item 8. Financial Statements and Supplementary Data--Summary of Significant Accounting Policies."
Key Financial Measures Under GAAP
Fees and Other
Fees and other consist primarily of (i) transaction fees earned in connection with successful investment transactions and from capital markets activities, (ii) management and incentive fees from providing investment management services to unconsolidated funds, CLOs, other vehicles and separately managed accounts, (iii) monitoring fees from providing services to portfolio companies, (iv) revenue earned by oil and gas-producing entities that are consolidated and (v) consulting fees earned by entities that employ non-employee operating consultants. These fees are based on the contractual terms of the governing agreements and are recognized when earned, which coincides with the period during which the related services are performed and in the case of transaction fees, upon closing of the transaction. Monitoring fees may provide for a termination payment following an initial public offering or change of control. These termination payments are recognized in the period when the related transaction closes.
Fees and other reported in our consolidated financial statements do not include the management or incentive fees that we earn from consolidated funds and other entities, because those fees are eliminated in consolidation. However, because those management and incentive fees are earned from, and funded by, third-party investors who hold noncontrolling interests in the consolidated funds and entities, net income attributable to KKR is increased by the amount of the management fees that are eliminated in consolidation. Accordingly, while the consolidation of funds and other entities impacts the amount of fees that are recognized in our financial statements, it does not affect the ultimate amount of net income attributable to KKR or KKR's partners' capital.
For a further discussion of our fee policies, see “Item 8. Financial Statements and Supplementary Data--Summary of Significant Accounting Policies."
97
Expenses
Compensation and Benefits
Compensation and benefits expense includes cash compensation consisting of salaries, bonuses, and benefits, as well as equity-based compensation consisting of charges associated with the vesting of equity-based awards and carry pool allocations. All employees and employees of certain consolidated entities receive a base salary that is paid by KKR or its consolidated entities, and is accounted for as compensation and benefits expense. These employees are also eligible to receive discretionary cash bonuses based on performance, overall profitability and other matters. While cash bonuses paid to most employees are borne by KKR and certain consolidated entities and result in customary compensation and benefits expense, cash bonuses that are paid to certain employees are currently borne by KKR Holdings. These bonuses are funded with distributions that KKR Holdings receives on KKR Group Partnership Units held by KKR Holdings but are not then passed on to holders of unvested units of KKR Holdings. The distributions to be paid by KKR are expected to decrease in 2016 and subsequent years as a result of the change in distribution policy announced on October 27, 2015. Because employees are not entitled to receive distributions on units that are unvested, any amounts allocated to employees in excess of an employee's vested equity interests are reflected as employee compensation and benefits expense. These compensation charges are recorded based on the unvested portion of quarterly earnings distributions received by KKR Holdings at the time of the distribution. See "Risks Related to Our Business - If we cannot retain and motivate our principals and other key personnel and recruit, retain and motivate new principals and other key personnel, our business, results and financial condition could be adversely affected" regarding the adequacy of such distributions to fund future discretionary cash bonuses.
With respect to KKR's active and future funds and co-investment vehicles that provide for carried interest, KKR allocates to its employees and other personnel a portion of the carried interest earned as part of its carry pool. KKR currently allocates approximately 40% of the carry it earns from these funds and vehicles to its carry pool. These amounts are accounted for as compensatory profit-sharing arrangements in conjunction with the related carried interest income and recorded as compensation and benefits expense for KKR employees and general, administrative and other expense for certain non-employee consultants and service providers in the consolidated statements of operations.
General, Administrative and Other
General, administrative and other expense consists primarily of professional fees paid to legal advisors, accountants, advisors and consultants, insurance costs, travel and related expenses, communications and information services, depreciation and amortization charges, changes in fair value of contingent consideration, expenses incurred by oil and gas-producing entities (including impairment charges) that are consolidated and other general and operating expenses which are not borne by fund investors and are not offset by credits attributable to fund investors' noncontrolling interests in consolidated funds. General, administrative and other expense also consists of costs incurred in connection with pursuing potential investments that do not result in completed transactions, a substantial portion of which are borne by fund investors.
Investment Income (Loss)
Net Gains (Losses) from Investment Activities
Net gains (losses) from investment activities consist of realized and unrealized gains and losses arising from our investment activities. The majority of our net gains (losses) from investment activities are related to our private equity investments. Fluctuations in net gains (losses) from investment activities between reporting periods is driven primarily by changes in the fair value of our investment portfolio as well as the realization of investments. The fair value of, as well as the ability to recognize gains from, our private equity investments is significantly impacted by the global financial markets, which, in turn, affects the net gains (losses) from investment activities recognized in any given period. Upon the disposition of an investment, previously recognized unrealized gains and losses are reversed and an offsetting realized gain or loss is recognized in the current period. Since our investments are carried at fair value, fluctuations between periods could be significant due to changes to the inputs to our valuation process over time. For a further discussion of our fair value measurements and fair value of investments, see "—Critical Accounting Policies—Fair Value Measurements."
Dividend Income
Dividend income consists primarily of distributions that investment funds receive from portfolio companies in which they invest. Dividend income is recognized primarily in connection with (i) dispositions of operations by portfolio companies, (ii) distributions of excess cash generated from operations from portfolio companies and (iii) other significant refinancings undertaken by portfolio companies.
98
Interest Income
Interest income consists primarily of interest that is received on our cash balances and other investments including credit instruments in which our consolidated funds and other entities invest.
Interest Expense
Interest expense is incurred from debt issued by KKR, including debt issued by KFN which was consolidated upon completion of the acquisition of KFN, credit facilities entered into by KKR, debt securities issued by consolidated CFEs and financing arrangements at our consolidated funds entered into primarily with the objective of managing cash flow. KFN's debt obligations are non-recourse to KKR beyond the assets of KFN. Debt securities issued by consolidated CFEs are supported solely by the investments held at the CFE and are not collateralized by assets of any other KKR entity. Our obligations under financing arrangements at our consolidated funds are generally limited to our pro-rata equity interest in such funds. Our management companies bear no obligations with respect to financing arrangements at our consolidated funds. We also capitalize debt financing costs incurred in connection with new debt arrangements. Such costs are amortized into interest expense using either the interest method or the straight-line method, as appropriate. See "—Liquidity".
Income Taxes
The KKR Group Partnerships and certain of their subsidiaries operate in the United States as partnerships for U.S. federal income tax purposes and as corporate entities in non-U.S. jurisdictions. Accordingly, these entities, in some cases, are subject to New York City unincorporated business taxes, or non-U.S. income taxes. Furthermore, we hold our interest in one of the KKR Group Partnerships through KKR Management Holdings Corp., which is treated as a corporation for U.S. federal income tax purposes, and certain other subsidiaries of the KKR Group Partnerships are treated as corporations for U.S. federal income tax purposes. Accordingly, such subsidiaries of KKR, including KKR Management Holdings Corp., and of the KKR Group Partnerships are subject to U.S. federal, state and local corporate income taxes at the entity level and the related tax provision attributable to KKR's share of this income is reflected in the financial statements. We also generate certain interest income to our unitholders and interest deductions to KKR Management Holdings Corp.
We use the asset and liability method to account for income taxes in accordance with GAAP. Under this method, deferred tax assets and liabilities are recognized for the expected future tax consequences of differences between the carrying amounts of assets and liabilities and their respective tax basis using currently enacted tax rates. The effect on deferred tax assets and liabilities of a change in tax rates is recognized in income in the period when the change is enacted. Deferred tax assets are reduced by a valuation allowance when it is more likely than not that all or a portion of the deferred tax assets will not be realized.
Tax laws are complex and subject to different interpretations by the taxpayer and respective governmental taxing authorities. Significant judgment is required in determining tax expense and in evaluating tax positions including evaluating uncertainties. We review our tax positions quarterly and adjust our tax balances as new information becomes available.
Net Income (Loss) Attributable to Noncontrolling Interests
Net income (loss) attributable to noncontrolling interests represents the ownership interests that certain third parties hold in entities that are consolidated in the financial statements as well as the ownership interests in our KKR Group Partnerships that are held by KKR Holdings. The allocable share of income and expense attributable to these interests is accounted for as net income (loss) attributable to noncontrolling interests. Historically, the amount of net income (loss) attributable to noncontrolling interests has been substantial and has resulted in significant charges and credits in the statements of operations. Given the consolidation of certain of our investment funds and the significant ownership interests in our KKR Group Partnerships held by KKR Holdings, we expect this activity to continue.
99
Segment Operating and Performance Measures
The segment key performance measures that follow are used by management in making operating and resource deployment decisions as well as assessing the overall performance of each of KKR's reportable business segments. The reportable segments for KKR's business are presented prior to giving effect to the allocation of income (loss) between KKR & Co. L.P. and KKR Holdings L.P. and as such represent the business in total. In addition, KKR's reportable segments are presented without giving effect to the consolidation of the funds or CFEs that KKR manages.
We disclose the following financial measures in this report that are calculated and presented using methodologies other than in accordance with GAAP. We believe that providing these performance measures on a supplemental basis to our GAAP results is helpful to unitholders in assessing the overall performance of KKR's businesses. These financial measures should not be considered as a substitute for similar financial measures calculated in accordance with GAAP, if available. We caution readers that these non-GAAP financial measures may differ from the calculations of other investment managers, and as a result, may not be comparable to similar measures presented by other investment managers. Reconciliations of these non-GAAP financial measures to the most directly comparable financial measures calculated and presented in accordance with GAAP, where applicable, are included within "Financial Statements and Supplementary Data — Note 13. Segment Reporting" and later in this report under "—Segment Balance Sheet."
Adjusted Units
Adjusted units are used as a measure of the total equity ownership of KKR that is held by KKR & Co. L.P. (including equity awards issued under the Equity Incentive Plan), KKR Holdings and other holders of securities exchangeable into common units of KKR & Co. L.P. and represent the fully diluted unit count using the if-converted method. We believe this measure is useful to unitholders as it provides an indication of the total equity ownership of KKR as if all outstanding KKR Holdings units, equity awards issued under the Equity Incentive Plan and other exchangeable securities had been exchanged for common units of KKR & Co. L.P.
After-Tax Cash Earnings
After-tax cash earnings is used by management as a measure of the cash earnings of KKR. KKR believes this measure, which was formerly referred to as total distributable earnings, is useful to unitholders as it provides a supplemental measure to assess performance, excluding the impact of mark-to-market gains (losses). After-tax cash earnings excludes certain realized investment losses to the extent unrealized losses on these investments were recognized prior to the combination with KPE on October 1, 2009.
Assets Under Management ("AUM")
Assets under management represent the assets managed by KKR or by its strategic partners from which KKR is entitled to receive fees or a carried interest (either currently or upon deployment of capital) and general partner capital. We believe this measure is useful to unitholders as it provides additional insight into KKR's capital raising activities and the overall activity in its investment funds and strategic partnerships. As of December 31, 2014, AUM has been adjusted to include (i) capital commitments for which we are eligible to receive fees or carried interest upon deployment of capital and (ii) KKR's pro-rata portion of AUM managed by other asset managers in which KKR holds a minority stake. Our reported AUM for periods prior to December 31, 2014 does not include these two items.
As of and subsequent to December 31, 2014, KKR calculates the amount of AUM as the sum of: (i) the fair value of the investments of KKR's investment funds; (ii) uncalled capital commitments from these funds, including uncalled capital commitments from which KKR is currently not earning management fees or carried interest; (iii) the fair value of investments in KKR's co-investment vehicles; (iv) the par value of outstanding CLOs (excluding CLOs wholly-owned by KKR); (v) KKR's pro-rata portion of the AUM managed by strategic partnerships in which KKR holds a minority ownership interest and (vi) the fair value of other assets managed by KKR. The pro-rata portion of the AUM managed by strategic partnerships is calculated based on KKR’s percentage ownership interest in such entities multiplied by such entity’s respective AUM. KKR's definition of AUM is not based on any definition of AUM that may be set forth in the agreements governing the investment funds, vehicles or accounts that it manages or calculated pursuant to any regulatory definitions.
Fee Paying AUM ("FPAUM")
Fee paying AUM ("FPAUM") represents only those assets under management of KKR or its strategic partners from which KKR receives management fees. We believe this measure is useful to unitholders as it provides additional insight into the capital base upon which KKR earns management fees. As of December 31, 2014, FPAUM has been adjusted to include KKR's
100
pro-rata portion of FPAUM managed by other asset managers in which KKR holds a minority stake. Our reported FPAUM for periods prior to December 31, 2014 does not include this item.
FPAUM is the sum of all of the individual fee bases that are used to calculate KKR's fees and differs from AUM in the following respects: (i) assets and commitments from which KKR does not receive a fee are excluded (i.e., assets and commitments with respect to which it receives only carried interest or is otherwise not currently receiving a fee) and (ii) certain assets, primarily in its private equity funds, are reflected based on capital commitments and invested capital as opposed to fair value because fees are not impacted by changes in the fair value of underlying investments.
Book Value
Book value is a measure of the net assets of KKR’s reportable segments and is used by management primarily in assessing the unrealized value of KKR’s investment portfolio, including carried interest, as well as KKR’s overall liquidity position. We believe this measure is useful to unitholders as it provides additional insight into the assets and liabilities of KKR excluding the assets and liabilities that are allocated to noncontrolling interest holders. Book value differs from KKR & Co. L.P. partners’ capital on a GAAP basis primarily as a result of the exclusion of ownership interests attributable to KKR Holdings.
Economic net income (loss) (“ENI”)
Economic net income (loss) is a measure of profitability for KKR’s reportable segments and is used by management as an alternative measurement of the operating and investment earnings of KKR and its business segments. We believe this measure is useful to unitholders as it provides additional insight into the overall profitability of KKR’s businesses inclusive of carried interest and related carry pool allocations and investment income. ENI is comprised of total segment revenues less total segment expenses and certain economic interests in KKR’s segments held by third parties. ENI differs from net income (loss) on a GAAP basis as a result of: (i) the inclusion of management fees earned from consolidated funds that were eliminated in consolidation; (ii) the exclusion of fees and expenses of certain consolidated entities; (iii) the exclusion of charges relating to the amortization of intangible assets; (iv) the exclusion of non-cash equity-based charges and other non-cash compensation charges borne by KKR Holdings or incurred under the Equity Incentive Plan and other securities that are exchangeable for common units of KKR & Co. L.P.; (v) the exclusion of certain non-recurring items; (vi) the exclusion of investment income (loss) relating to noncontrolling interests; and (vii) the exclusion of income taxes.
Equity Invested
Equity invested is the aggregate amount of equity capital that has been invested by KKR’s investment funds and carry-yielding co-investment vehicles and is used as a measure of investment activity for KKR and its business segments during a given period. We believe this measure is useful to unitholders as it provides additional insight into KKR’s investments among its investment funds and carry-yielding co-investment vehicles. Such amounts include: (i) capital invested by fund investors and co-investors with respect to which KKR is entitled to a carried interest and (ii) capital invested by KKR’s investment funds, including investments made using investment financing arrangements.
Gross Dollars Invested
Gross dollars invested is the aggregate amount of capital that has been invested by all of KKR’s Public Markets investment vehicles in our private credit non-liquid strategies and is used as a measure of investment activity for a portion of KKR’s Public Markets segment in a given period. We believe this measure is useful to unitholders as it provides additional insight into KKR’s investment of capital across private credit non-liquid strategies for all the investment vehicles in the Public Markets segment. Such amounts include capital invested by fund investors and co-investors with respect to which KKR’s Public Markets business is entitled to a fee or carried interest.
Syndicated Capital
Syndicated capital is generally the aggregate amount of capital in transactions originated by KKR and its investment funds and carry-yielding co-investment vehicles, which has been distributed to third parties in exchange for a fee. It does not include (i) capital invested in such transactions by KKR investment funds and carry-yielding co-investment vehicles, which is instead reported in equity invested and (ii) debt capital that is arranged as part of the acquisition financing of transactions originated by KKR investment funds. Syndicated capital is used as a measure of investment activity for KKR and its business segments during a given period, and we believe that this measure is useful to unitholders as it provides additional insight into levels of syndication activity in KKR's Capital Markets segment and across its investment platform.
Uncalled Commitments
Uncalled commitments are used as a measure of unfunded capital commitments that KKR’s investment funds and carry-paying co-investment vehicles have received from partners to contribute capital to fund future investments. We believe this
101
measure is useful to unitholders as it provides additional insight into the amount of capital that is available to KKR’s investment funds to make future investments. Uncalled commitments are not reduced for investments completed using fund-level investment financing arrangements.
Consolidated Results of Operations
The following is a discussion of our consolidated results of operations for the years ended
December 31, 2015
and
2014
. You should read this discussion in conjunction with the consolidated financial statements and related notes included elsewhere in this report. For a more detailed discussion of the factors that affected the results of operations of our three business segments in these periods, see “—Segment Analysis.”
Year ended
December 31, 2015
compared to year ended
December 31, 2014
|
|
Year Ended
|
||||||||||
|
|
December 31, 2015
|
December 31, 2014
|
Change
|
||||||||
|
|
($ in thousands)
|
||||||||||
|
Revenues
|
|
|
|
|
|||||||
|
Fees and Other
|
$
|
1,043,768
|
|
$
|
1,110,008
|
|
$
|
(66,240
|
)
|
||
|
Expenses
|
|
|
|
|
|||||||
|
Compensation and Benefits
|
1,180,591
|
|
1,263,852
|
|
(83,261
|
)
|
|||||
|
Occupancy and Related Charges
|
65,683
|
|
62,564
|
|
3,119
|
|
|||||
|
General, Administrative and Other
|
624,951
|
|
869,651
|
|
(244,700
|
)
|
|||||
|
Total Expenses
|
1,871,225
|
|
2,196,067
|
|
(324,842
|
)
|
|||||
|
Investment Income (Loss)
|
|
|
|
|
|||||||
|
Net Gains (Losses) from Investment Activities
|
4,672,627
|
|
4,778,232
|
|
(105,605
|
)
|
|||||
|
Dividend Income
|
850,527
|
|
1,174,501
|
|
(323,974
|
)
|
|||||
|
Interest Income
|
1,219,197
|
|
909,207
|
|
309,990
|
|
|||||
|
Interest Expense
|
(573,226
|
)
|
(317,192
|
)
|
(256,034
|
)
|
|||||
|
Total Investment Income (Loss)
|
6,169,125
|
|
6,544,748
|
|
(375,623
|
)
|
|||||
|
Income (Loss) Before Taxes
|
5,341,668
|
|
5,458,689
|
|
(117,021
|
)
|
|||||
|
Income Tax / (Benefit)
|
66,636
|
|
63,669
|
|
2,967
|
|
|||||
|
Net Income (Loss)
|
5,275,032
|
|
5,395,020
|
|
(119,988
|
)
|
|||||
|
Net Income (Loss) Attributable to Redeemable Noncontrolling Interests
|
(4,512
|
)
|
(3,341
|
)
|
(1,171
|
)
|
|||||
|
Net Income (Loss) Attributable to Noncontrolling Interests and Appropriated Capital
|
4,791,062
|
|
4,920,750
|
|
(129,688
|
)
|
|||||
|
Net Income (Loss) Attributable to KKR & Co. L.P.
|
$
|
488,482
|
|
$
|
477,611
|
|
$
|
10,871
|
|
||
Fees and Other
The net decrease was primarily due to (i) an $87.5 million decrease in transaction fees, (ii) a $74.5 million decrease in revenues earned by consolidated oil and gas producing entities and (iii) a $34.3 million decrease in incentive fees. These decreases were partially offset by a $145.6 million increase in monitoring fees. The decrease in transaction fees was primarily attributable to a decrease in both our Private Markets segment and Capital Markets segment. In our Private Markets segment the decreases were primarily attributable to a decrease in the average fee earned on completed investments. During the year ended December 31, 2015, in our Private Markets segment there were 37 transaction fee-generating investments paying an
102
average fee of $3.9 million compared to 33 transaction fee-generating investments paying an average fee of $6.5 million during the year ended December 31, 2014. Transaction fees vary by investment based upon a number of factors, the most significant of which are transaction size, the particular discussions as to the amount of the fees, the complexity of the transaction and KKR’s role in the transaction. In our Capital Markets Segment transaction fees decreased primarily due to a decrease in the number and size of capital markets transactions for the year ended December 31, 2015 compared to the year ended December 31, 2014. We completed 116 capital markets transactions for the year ended December 31, 2015 of which 16 represented equity offerings and 100 represented debt offerings, as compared to 139 transactions for the year ended December 31, 2014 of which 15 represented equity offerings and 124 represented debt offerings. The decrease in revenue earned by consolidated oil and gas producing entities was primarily the result of a decrease in oil prices for the year ended December 31, 2015 as compared to the prior period, and to a lesser extent, reduced production volumes that resulted from assets sold in the third and fourth quarters of 2014, partially offset by revenues of oil and gas producing entities of KFN, which was acquired on April 30, 2014. The decrease in incentive fees was due primarily to a decrease in incentive fees received from KFN as a result of our acquisition of it on April 30, 2014, as incentive fees from KFN after that date were eliminated from segment results, as well as lower incentive fees in our hedge fund-of-funds platform and European credit platform driven by less favorable financial performance in the current year.
The increase in monitoring fees was primarily the result of $198.8 million of monitoring fees received during 2015 from the termination of monitoring fee arrangements in connection with the initial public offering (IPO) or partial exits of First Data Corporation (NYSE: FDC), Walgreens Boots Alliance, Inc. (NASDAQ: WBA), J.M. Smucker Company (NYSE: SJM), Zimmer Biomet Holdings, Inc. (NYSE: ZBH) and GoDaddy, Inc. (NYSE: GDDY) compared to approximately $23.2 million of such fees received during the year ended December 31, 2014. These types of termination payments may occur in the future; however, they are infrequent in nature and are generally correlated with IPO and other realization activity in our private equity portfolio. This increase in monitoring fees from termination payments was partially offset by a decrease in recurring monitoring fees of $46.1 million. The decrease in recurring monitoring fees was primarily the result of a decrease in the number of portfolio companies paying a monitoring fee and a decrease in the average size of the fee. For the year ended December 31, 2015, we had 43 portfolio companies that were paying an average monitoring fee of $1.5 million compared with 50 portfolio companies that were paying an average monitoring fee of $2.2 million for the year ended December 31, 2014. In future periods, we anticipate that recurring monitoring fees will continue to decrease as a result of realizations and other transactions such as initial public offerings, if not offset by additional portfolio companies paying recurring monitoring fees.
Expenses
The decrease was primarily due to a decrease in general administrative and other expense of $244.7 million and a decrease in compensation and benefits of $83.3 million. The decrease in general administrative and other expense was primarily attributable to (i) a lower level of impairment charges relating to long-lived assets at our consolidated oil and gas producing entities during the year ended December 31, 2015 as compared to the year ended December 31, 2014, (ii) a decrease in operating expenses of our consolidated oil and gas producing entities that resulted primarily from assets sold in the third and fourth quarters of 2014 and a reduction in depreciation in 2015 as a result of an impairment of the long-lived assets of these entities in the fourth quarter of 2014 and (iii) non-recurring amounts accrued for litigation in 2014. The decrease in compensation and benefits is due primarily to (i) lower carry pool allocations as a result of the recognition of a lower level of carried interest during the year ended December 31, 2015 as compared to the year ended December 31, 2014, (ii) lower equity-based compensation related to KKR Holdings reflecting fewer KKR Holdings units vesting for expense recognition purposes and a lower level of amounts allocated to principals in excess of such principal’s vested equity interests. These decreases were partially offset by (i) an increase in cash compensation reflecting a higher level of fees which generally results in higher compensation expense and (ii) higher equity-based compensation relating primarily to additional equity grants under the Equity Incentive Plan.
103
Net Gains (Losses) from Investment Activities
The following is a summary of net gains (losses) from investment activities:
|
Year Ended December 31,
|
|||||||
|
|
2015
|
2014
|
|||||
|
|
($ in thousands)
|
||||||
|
Net Gains (Losses) from Private Equity Investments
|
$
|
5,592,970
|
|
$
|
4,586,193
|
|
|
|
Other Net Gains (Losses) from Investment Activities (1)
|
(920,343
|
)
|
192,039
|
|
|||
|
Net Gains (Losses) from Investment Activities
|
$
|
4,672,627
|
|
$
|
4,778,232
|
|
|
|
(1)
The 2015 amount includes a realized loss of approximately $2 billion on a consolidated basis relating to the write off of Energy Future Holdings (energy sector) which had previously been marked at zero on an unrealized basis. Accordingly, this write off had no impact on our Net Gains (Losses) from Investment Activities during the year ended December 31, 2015.
|
|||||||
The majority of our net gains (losses) from investment activities relate to our private equity portfolio. The following is a summary of the components of net gains (losses) from investment activities for private equity investments which illustrates the variances from the prior period. See “—Segment Analysis—Private Markets Segment” for further information regarding gains and losses in our private equity portfolio.
|
Year Ended December 31,
|
|||||||
|
|
2015
|
2014
|
|||||
|
|
($ in thousands)
|
||||||
|
Realized Gains
|
$
|
4,701,511
|
|
$
|
6,224,683
|
|
|
|
Unrealized Losses from Sales of Investments and Realization of Gains (a)
|
(4,024,214
|
)
|
(6,278,529
|
)
|
|||
|
Realized Losses
|
(248,918
|
)
|
(1,238,897
|
)
|
|||
|
Unrealized Gains from Sales of Investments and Realization of Losses (b)
|
239,587
|
|
1,233,070
|
|
|||
|
Unrealized Gains from Changes in Fair Value
|
9,669,247
|
|
9,218,981
|
|
|||
|
Unrealized Losses from Changes in Fair Value
|
(4,744,243
|
)
|
(4,573,115
|
)
|
|||
|
Net Gains (Losses) from Investment Activities - Private Equity Investments
|
$
|
5,592,970
|
|
$
|
4,586,193
|
|
|
|
(a)
|
Amounts represent the reversal of previously recognized unrealized gains in connection with realization events where such gains become realized.
|
|
(b)
|
Amounts represent the reversal of previously recognized unrealized losses in connection with realization events where such losses become realized.
|
A significant driver of net gains (losses) from investment activities for the year ended
December 31, 2015
was related to unrealized gains and losses from changes in fair value in our private equity investments. The net increase in the value of our private markets portfolio was driven primarily by net unrealized gains of $1.8 billion, $1.5 billion and $0.9 billion in our 2006 Fund, North America Fund XI and Asian Fund II, respectively. For the year ended
December 31, 2015
, the value of our private equity investment portfolio increased 14.2%.
This was comprised of a 19.5% increase in the share prices of various publicly held or publicly indexed investments and a 9.3% increase in value of our privately held investments. The most significant increases in share prices of various publicly held or publicly indexed investments were gains in Walgreens Boots Alliance, Inc., PRA Health Sciences, Inc. (NASDAQ: PRAH) and GoDaddy, Inc. These increases were partially offset by decreased share prices of various publicly held investments, the most significant of which were RigNet (NASDAQ: RNET), HCA Holdings, Inc. (NYSE: HCA) and CITIC Envirotech Ltd. (SES: U19.SI). Subsequent to December 31, 2015, world equity markets declined sharply with both the S&P 500 and the MSCI World Index down on a total return basis, including dividends, as of February 22, 2016. See "--Business Environment". Our privately held investments contributed the remainder of the change in value, the most significant of which were gains relating to Panasonic Healthcare Co. Ltd (healthcare sector), Capital Safety Group (industrial sector) and Alliant Insurance Services (financial services sector). The unrealized gains on our privately held investments were partially offset by unrealized losses relating primarily to BIS Industries Ltd. (industrial sector), Acteon Group Ltd (energy sector) and Aceco TI S.A (technology sector). The increased valuations of individual companies in our privately held investments, in the aggregate, generally related to (i) in the case of Capital Safety Group and Alliant Insurance Services, valuations that reflect agreements to sell these investments in whole or in part, (ii) an increase in the value of market comparables and (iii) individual company performance. The decreased valuations of individual companies in our privately held investments, in the aggregate, generally related to (i) individual company performance or, in certain cases, an unfavorable business outlook and (ii) a decrease in the value of market comparables.
104
A significant driver of net gains (losses) from investment activities for the year ended
December 31, 2014
was related to unrealized gains and losses from changes in fair value in our private equity investments. The net unrealized investment gains in our private equity portfolio were driven primarily by net unrealized gains of $2.2 billion, $1.2 billion and $1.1 billion in our 2006 Fund, European Fund III and North America Fund XI, respectively. Approximately 23% of the net change in value for the year ended
December 31, 2014
was attributable to changes in share prices of various publicly-listed investments, the most significant of which were gains on PRA Health Sciences, Inc., HCA, Inc., NXP Semiconductors N.V. (NASDAQ: NXPI) and Yageo Corporation (TW: 2327). These increases were partially offset by decreased share prices of various publicly held investments, the most significant of which were Tarkett S.A. (PA:TKTT), ProSiebenSat.1 Media AG (XETRA: PSM) and China Greenland Rundong Auto Group Ltd (HK: 1365). Our privately‑held investments contributed the remainder of the change in value, the most significant of which were gains relating to Alliance Boots GmbH (healthcare sector), Biomet, Inc. (healthcare sector) and WILD Flavors GmbH (consumer products sector). The unrealized gains on our privately‑held investments were partially offset by unrealized losses relating primarily to Northgate Information Solutions (technology sector), Samson Resources (energy sector) and Toys R Us (retail sector). The unrealized gains were also offset by unrealized losses in our energy assets from our Natural Resources Fund and Energy Income and Growth Fund of approximately $352 million. The increased valuations of individual companies in our privately‑held investments, in the aggregate, generally related to (i) an increase in the value of market comparables and individual company performance, (ii) in the case of WILD Flavors GmbH and Biomet, Inc., an increase that primarily reflected agreements to sell these investments, with the sale of WILD Flavors GmbH completed in October 2014, and (iii) in the case of Alliance Boots GmbH, primarily due to an agreement to exit the investment and to a lesser extent an increase in the value of a publicly traded stock that was expected to be delivered pursuant to this agreement, which was completed on December 31, 2014. The decreased valuations of individual companies in our privately‑held investments, in the aggregate, generally related to individual company performance or, in certain cases, an unfavorable business outlook. The decreased valuation of energy assets are generally related to decreases in commodity prices.
Dividend Income
During the year ended
December 31, 2015
we received dividends of $123.7 million from WMF (consumer products sector), $114.9 million from CITIC Envirotech Ltd., $86.2 million from MMI Holdings Limited (technology sector), $80.5 million from Academy Sports and Outdoors (retail sector), $65.9 million from Aricent Inc. (technology sector) and an aggregate of $379.3 million of dividends from other investments. During the year ended December 31, 2014, we received dividends of $178.6 million from Visma (technology sector), $171.6 million from Capsugel (manufacturing sector), $162.1 million from Capital Safety Group, $87.7 million from WMF and an aggregate of $574.5 million of dividends from other investments. Significant dividends from portfolio companies are generally not recurring quarterly dividends, and while they may occur in the future, their size and frequency are variable.
Interest Income
The increase was primarily due to a net increase in (i) the amount of credit instruments in our consolidated Public Markets investment vehicles, including growth in our CLO platform when compared to the prior period, (ii) the consolidation of CMBS entities beginning in the second quarter of 2015, and (iii) the acquisition of KFN on April 30, 2014 which did not contribute to our interest income for the first four months of 2014.
Interest Expense
The increase was primarily due to (i) increased interest expense in connection with the growth of our CLO platforms, the majority of which are consolidated, (ii) interest expense on our 2044 Senior Notes issued on May 29, 2014 and an additional issuance of such notes on March 18, 2015, (iii) increased interest expense related to financing facilities entered into by our consolidated investment funds for purposes of financing their operating and investing activities, (iv) the consolidation of CMBS entities beginning in the second quarter of 2015 and (v) the acquisition of KFN on April 30, 2014 which did not contribute to our interest expense for the first four months of 2014.
Income (Loss) Before Taxes
The decrease was primarily due to lower investment income and lower fees and other, partially offset by lower expenses, as described above.
105
Income Tax (Benefit)
Income taxes for the year ended December 31, 2015 remained largely unchanged from the year ended December 31, 2014. Because certain investment funds owned by the KKR Group Partnerships are subject to corporate taxes, unrealized losses recognized by those funds during 2015 offset an increase in KKR & Co. L.P.'s weighted average ownership percentage in the KKR Group Partnerships, which increased from approximately 49.5% for the year ended December 31, 2014 to approximately 54.9% for the year ended December 31, 2015. The increase in ownership, primarily the result of exchanges of units in KKR Holdings for KKR common units during 2015, subjects a greater level of income to corporate taxes.
Net Income (Loss) Attributable to Noncontrolling Interests and Appropriated Capital
The decrease was primarily driven by lower investment income as described above and a decrease in KKR Holdings' weighted average ownership percentage in the KKR Group Partnerships from approximately 50.5% for the year ended December 31, 2014 to approximately 45.1% for the year ended December 31, 2015. This decrease in ownership percentage is primarily due to exchanges of units in KKR Holdings for KKR common units during the year.
Net Income (Loss) Attributable to KKR & Co. L.P.
Net income attributable to KKR & Co L.P. for the year ended December 31, 2015 remained largely unchanged from the year ended December 31, 2014 due to the net impact of lower investment income as described above, which was offset by an increase in KKR & Co. L.P's weighted average ownership percentage in the KKR Group Partnerships from approximately 49.5% for the year ended December 31, 2014 to approximately 54.9% for the year ended December 31, 2015.
106
Year ended
December 31, 2014
compared to year ended
December 31, 2013
|
|
Year Ended
|
||||||||||
|
|
December 31, 2014
|
December 31, 2013
|
Change
|
||||||||
|
|
($ in thousands)
|
||||||||||
|
Revenues
|
|
|
|
|
|||||||
|
Fees and Other
|
$
|
1,110,008
|
|
$
|
762,546
|
|
$
|
347,462
|
|
||
|
Expenses
|
|
|
|
|
|||||||
|
Compensation and Benefits
|
1,263,852
|
|
1,266,592
|
|
(2,740
|
)
|
|||||
|
Occupancy and Related Charges
|
62,564
|
|
61,720
|
|
844
|
|
|||||
|
General, Administrative and Other
|
869,651
|
|
438,826
|
|
430,825
|
|
|||||
|
Total Expenses
|
2,196,067
|
|
1,767,138
|
|
428,929
|
|
|||||
|
Investment Income (Loss)
|
|
|
|
|
|||||||
|
Net Gains (Losses) from Investment Activities
|
4,778,232
|
|
7,826,082
|
|
(3,047,850
|
)
|
|||||
|
Dividend Income
|
1,174,501
|
|
695,521
|
|
478,980
|
|
|||||
|
Interest Income
|
909,207
|
|
474,759
|
|
434,448
|
|
|||||
|
Interest Expense
|
(317,192
|
)
|
(99,616
|
)
|
(217,576
|
)
|
|||||
|
Total Investment Income (Loss)
|
6,544,748
|
|
8,896,746
|
|
(2,351,998
|
)
|
|||||
|
Income (Loss) Before Taxes
|
5,458,689
|
|
7,892,154
|
|
(2,433,465
|
)
|
|||||
|
Income Tax / (Benefit)
|
63,669
|
|
37,926
|
|
25,743
|
|
|||||
|
Net Income (Loss)
|
5,395,020
|
|
7,854,228
|
|
(2,459,208
|
)
|
|||||
|
Net Income (Loss) Attributable to Redeemable Noncontrolling Interests
|
(3,341
|
)
|
62,255
|
|
(65,596
|
)
|
|||||
|
Net Income (Loss) Attributable to Noncontrolling Interests and Appropriated Capital
|
4,920,750
|
|
7,100,747
|
|
(2,179,997
|
)
|
|||||
|
Net Income (Loss) Attributable to KKR & Co. L.P.
|
$
|
477,611
|
|
$
|
691,226
|
|
$
|
(213,615
|
)
|
||
Fees and Other
The net increase was primarily due to an increase in revenues earned by consolidated oil and gas producing entities of $164.8 million, an increase in transaction fees of $137.6 million and an increase in management fees of $37.3 million. The increase in revenue earned by consolidated oil and gas producing entities was primarily the result of the acquisition of KFN, which owned oil and gas producing entities, completed on April 30, 2014, and to a lesser extent, growth in the activities of our other consolidated oil and gas producing entities. The increase in transaction fees was primarily driven by (i) an increase in the size of fee‑generating investments completed during the year ended December 31, 2014 in our Private Markets segment and (ii) an increase in transaction fees in our capital markets business reflecting larger transaction sizes when compared to the prior period, including a capital markets fee received from the syndication of equity in First Data Corporation of approximately $43 million. During the year ended December 31, 2014, our Private Markets segment had 33 transaction fee‑generating investments with a total combined transaction value of approximately $15.4 billion compared to 33 transaction fee‑generating investments with a total combined transaction value of approximately $15.0 billion during the year ended December 31, 2013. Transaction fees vary by investment based upon a number of factors, the most significant of which are transaction size, the particular discussions as to the amount of the fees, the complexity of the transaction and KKR’s role in the transaction. The increase in management fees was primarily the result of the acquisition of Avoca on February 19, 2014 and to a lesser extent new capital raised primarily in our Public Markets segment, partially offset by a decrease in management fees received from KFN as a result of our acquisition of KFN on April 30, 2014, as management fees from KFN after that date are now eliminated in consolidation.
107
Expenses
The increase was primarily due to an increase in general, administrative and other expenses of $430.8 million, partially offset by a decrease in compensation and benefits of $2.7 million. The increase in general, administrative and other expenses is primarily due to an increase of approximately $330 million relating to the activities of our consolidated oil and gas producing entities which were not consolidated prior to the third quarter of 2013 as well as the activities of oil and gas producing entities acquired in the acquisition of KFN completed on April 30, 2014. This increase included an impairment charge of approximately $220 million relating to long‑lived assets at our consolidated oil and gas producing entities. In addition, general, administrative, and other expenses increased as a result of (i) increased expenses attributable to Avoca which we acquired on February 19, 2014, (ii) expenses incurred by consolidated CLOs that were consolidated subsequent to the acquisition of Avoca and the acquisition of KFN, which was completed on April 30, 2014, and (iii) an increase in amounts accrued for litigation. The decrease in compensation and benefits is due primarily to (i) lower equity‑based compensation reflecting fewer KKR Holdings units vesting for expense recognition purposes under the graded attribution method of expense recognition, (ii) lower carry pool allocations as a result of the recognition of a lower level of carried interest during the year ended December 31, 2014 as compared to the year ended December 31, 2013, partially offset by (i) an increase in cash compensation reflecting a higher level of fees as well as increased headcount and (ii) higher equity‑based compensation relating primarily to additional equity grants under the Equity Incentive Plan.
Net Gains (Losses) from Investment Activities
The following is a summary of net gains (losses) from investment activities:
|
Year Ended December 31,
|
|||||||
|
|
2014
|
2013
|
|||||
|
|
($ in thousands)
|
||||||
|
Net Gains (Losses) from Private Equity Investments
|
$
|
4,586,193
|
|
$
|
7,716,772
|
|
|
|
Other Net Gains (Losses) from Investment Activities
|
192,039
|
|
109,310
|
|
|||
|
Net Gains (Losses) from Investment Activities
|
$
|
4,778,232
|
|
$
|
7,826,082
|
|
|
The majority of our net gains (losses) from investment activities relate to our private equity portfolio. The following is a summary of the components of net gains (losses) from investment activities for private equity investments which illustrates the variances from the prior period. See “—Segment Analysis—Private Markets Segment” for further information regarding gains and losses in our private equity portfolio.
|
Year Ended December 31,
|
|||||||
|
|
2014
|
2013
|
|||||
|
|
($ in thousands)
|
||||||
|
Realized Gains
|
$
|
6,224,683
|
|
$
|
4,712,997
|
|
|
|
Unrealized Losses from Sales of Investments and Realization of Gains (a)
|
(6,278,529
|
)
|
(4,155,261
|
)
|
|||
|
Realized Losses
|
(1,238,897
|
)
|
(1,048,778
|
)
|
|||
|
Unrealized Gains from Sales of Investments and Realization of Losses (b)
|
1,233,070
|
|
1,058,710
|
|
|||
|
Unrealized Gains from Changes in Fair Value
|
9,218,981
|
|
9,361,938
|
|
|||
|
Unrealized Losses from Changes in Fair Value
|
(4,573,115
|
)
|
(2,212,834
|
)
|
|||
|
Net Gains (Losses) from Investment Activities - Private Equity Investments
|
$
|
4,586,193
|
|
$
|
7,716,772
|
|
|
|
(a)
|
Amounts represent the reversal of previously recognized unrealized gains in connection with realization events where such gains become realized.
|
|
(b)
|
Amounts represent the reversal of previously recognized unrealized losses in connection with realization events where such losses become realized.
|
The appreciation in the market value of our private equity portfolio was driven primarily by net unrealized gains of $2.2 billion, $1.2 billion and $1.1 billion in our 2006 Fund, European Fund III and North America Fund XI, respectively. Approximately 23% of the net change in value for the year ended December 31, 2014 was attributable to changes in share prices of various publicly‑listed investments, the most significant of which were gains on PRA Health Sciences, Inc., HCA, Inc., NXP Semiconductors N.V. and Yageo Corporation. These increases were partially offset by decreased share prices of various publicly held investments, the most significant of which were Tarkett S.A., ProSiebenSat.1 Media AG and China Greenland Rundong Auto Group Ltd. Our privately‑held investments contributed the remainder of the change in value, the
108
most significant of which were gains relating to Alliance Boots GmbH, Biomet, Inc. and WILD Flavors GmbH. The unrealized gains on our privately‑held investments were partially offset by unrealized losses relating primarily to Northgate Information Solutions, Samson Resources and Toys R Us. The unrealized gains were also offset by unrealized losses in our energy assets from our Natural Resources Fund and Energy Income and Growth Fund of approximately $352 million. The increased valuations of individual companies in our privately‑held investments, in the aggregate, generally related to (i) an increase in the value of market comparables and individual company performance, (ii) in the case of WILD Flavors GmbH and Biomet, Inc., an increase that primarily reflected agreements to sell these investments, with the sale of WILD Flavors GmbH completed in October 2014, and (iii) in the case of Alliance Boots GmbH, primarily due to an agreement to exit the investment and to a lesser extent an increase in the value of a publicly traded stock that is expected to be delivered pursuant to this agreement, which was completed on December 31, 2014. The decreased valuations of individual companies in our privately‑held investments, in the aggregate, generally related to individual company performance or, in certain cases, an unfavorable business outlook. The decreased valuation of energy assets are generally related to decreases in commodity prices.
Dividend Income
During the year ended December 31, 2014, we received dividends of $178.6 million from Visma, $171.6 million from Capsugel, $162.1 million from Capital Safety Group, $87.7 million from WMF and an aggregate of $574.5 million of dividends from other investments. During the year ended December 31, 2013, we received dividends of $191.6 million from Capsugel, $139.7 million from Pets at Home Ltd. (LSE: PETS.L), $113.9 million from Visma, $85.6 million from Tarkett S.A., $52.0 million from Santander Consumer USA (NYSE: SC) and an aggregate of $112.7 million of dividends from other investments. Significant dividends from portfolio companies are generally not recurring quarterly dividends, and while they may occur in the future, their size and frequency are variable.
Interest Income
The increase was primarily due to the consolidation of debt instruments held by KFN including CLOs, subsequent to the acquisition of KFN on April 30, 2014, as well as a net increase in the amount of credit instruments in our consolidated Public Markets investment vehicles, including CLOs acquired in the Avoca acquisition on February 19, 2014.
Interest Expense
The increase was primarily due to (i) interest expense associated with consolidated CLOs acquired in the Avoca and KFN acquisitions which were completed on February 19, 2014 and April 30, 2014, respectively, (ii) interest expense associated with senior and subordinated debt at KFN and (iii) interest expense on our 2044 Senior Notes issued on May 29, 2014.
Income (Loss) Before Taxes
The decrease was primarily due to a decrease in investment income and increase in expenses, partially offset by an increase in fees.
Income Taxes
The increase was primarily due to an increase in the amount of income in the KKR Group Partnerships that is subject to either corporate or local taxes, or both, as well as an increase in KKR & Co. L.P.’s ownership percentage in the KKR Group Partnerships from approximately 39.9% for the year ended December 31, 2013 to approximately 49.5% for the year ended December 31, 2014. This increase in ownership subjects a greater level of income to corporate taxes.
Net Income (Loss) Attributable to Redeemable Noncontrolling Interests
The decrease was primarily driven by the termination of our KKR Equity Strategies fund and to a lesser extent decreased investment income for funds and vehicles where noncontrolling interests are redeemable.
Net Income (Loss) Attributable to Noncontrolling Interests and Appropriated Capital
The decrease was primarily attributable to the overall decrease in investment income described above as well as a decrease in KKR Holdings’ ownership percentage in the KKR Group Partnerships from approximately 60.1% for the year ended December 31, 2013 to approximately 50.5% for the year ended December 31, 2014.
109
Net Income (Loss) Attributable to KKR & Co. L.P.
The decrease was primarily attributable to the decrease in income before taxes as described above, partially offset by an increase in KKR & Co. L.P.’s ownership percentage in the KKR Group Partnerships from approximately 39.9% for the year ended December 31, 2013 to approximately 49.5% for the year ended December 31, 2014. This increase in ownership percentage was principally the result of the issuance of KKR common units in connection with the acquisition of KFN.
110
Segment Analysis
The following is a discussion of the results of our four reportable business segments for years ended
December 31, 2015
,
2014
and
2013
. You should read this discussion in conjunction with the information included under “—Basis of Financial Presentation—Segment Operating and Performance Measures” and the consolidated financial statements and related notes included elsewhere in this report.
KKR’s management has reevaluated the manner in which it makes operational and resource deployment decisions and assesses the overall performance of each of KKR’s operating segments. As a result, KKR has modified the presentation of its segment financial information. In addition, since becoming a public company, our principal assets have grown in significance and are a meaningful contributor to our financial results.
Certain of the more significant changes between KKR’s current segment presentation and its previously reported segment presentation are described in the following commentary.
Inclusion of a Fourth Segment
All income (loss) on investments is attributed to a new fourth segment called Principal Activities. Previously, income on investments held directly by KKR was reported in the Private Markets segment, Public Markets segment or Capital Markets segment based on the character of the income generated. For example, income from private equity investments was previously included in the Private Markets segment. However, the financial results of acquired businesses and strategic partnerships have been reported in our other segments.
Expense Allocations
We have changed the manner in which expenses are allocated among our operating segments. Specifically, as described below, (i) a portion of expenses, except for broken deal expenses, previously reflected in our Private Markets, Public Markets or Capital Markets segments are now reflected in the Principal Activities segment and (ii) corporate expenses are allocated across all segments.
Expenses Allocated to Principal Activities
A portion of our cash compensation and benefits, occupancy and related charges and other operating expenses previously included in the Private Markets, Public Markets and Capital Markets segments is now allocated to the Principal Activities segment. The Principal Activities segments incurs its own direct costs, and an allocation from the other segments is also made to reflect the estimated amount of costs that are necessary to operate our Principal Activities segment, which are incremental to those costs incurred directly by the Principal Activities segment. The total amount of expenses (other than its direct costs) that is allocated to Principal Activities is based on the proportion of revenue earned by Principal Activities, relative to other operating segments, over the preceding four annual periods. This allocation percentage is updated annually or more frequently if there are material changes to our business. Below is a summary of the allocation to Principal Activities, relative to other operating segments, for the years ended December 31, 2015, 2014 and 2013:
|
•
|
2015 Allocation: 25.4%, based on revenues earned in 2014, 2013, 2012 and 2011
|
|
•
|
2014 Allocation: 31.7%, based on revenues earned in 2013, 2012, 2011 and 2010
|
|
•
|
2013 Allocation: 37.8%, based on revenues earned in 2012, 2011, 2010 and 2009
|
The expense allocation expected to be used in 2016 to allocate expense to the Principal Activities segment, based on revenues earned in 2015, 2014, 2013 and 2012 is approximately 23%, subject to adjustments if there are material changes to our business.
Once the total amount of expense to be allocated to the Principal Activities segment is estimated for each reporting period, the amount of this expense will be allocated from the Private Markets, Public Markets and Capital Markets segments based on the proportion of headcount in each of these three segments.
111
Allocations of Corporate Overhead
Corporate expenses are allocated to each of the Private Markets, Public Markets, Capital Markets and Principal Activities segments based on the proportion of revenues earned by each segment over the preceding four calendar years. In our previously reported segment presentation, all corporate expenses were allocated to the Private Markets segment. Below is a summary of the allocations to each of our operating segments for the years ended December 31, 2015, 2014 and 2013.
|
Expense Allocation
|
|||||||||
|
Segment
|
2015
|
2014
|
2013
|
||||||
|
Private Markets
|
58.7
|
%
|
56.2
|
%
|
53.0
|
%
|
|||
|
Public Markets
|
9.8
|
%
|
7.1
|
%
|
4.8
|
%
|
|||
|
Capital Markets
|
6.1
|
%
|
5.0
|
%
|
4.4
|
%
|
|||
|
Principal Activities
|
25.4
|
%
|
31.7
|
%
|
37.8
|
%
|
|||
|
Total Reportable Segments
|
100.0
|
%
|
100.0
|
%
|
100.0
|
%
|
|||
|
Based on revenue earned in
|
2014, 2013, 2012 & 2011
|
2013, 2012, 2011 & 2010
|
2012, 2011, 2010 & 2009
|
||||||
Based on the proportion of revenues earned by each segment in 2015, 2014, 2013 and 2012, the corporate expense allocation expected to be used in 2016 to allocate expense to the Private Markets, Public Markets, Capital Markets and Principal Activities segments is approximately 61%, 10%, 6% and 23%, respectively, subject to adjustments if there are material changes to our business.
In connection with these modifications, segment information for the years ended December 31, 2014 and 2013 has been presented in this Annual Report on Form 10-K in conformity with KKR’s current segment presentation. Consequently, this information will not be consistent with historical segment financial results previously reported. While the modified segment presentation impacted the amount of economic net income reported by each operating segment, it had no impact on KKR’s economic net income on a total reportable segment basis.
112
Private Markets Segment
The following tables set forth information regarding the results of operations and certain key operating metrics for our Private Markets segment for the years ended
December 31, 2015
and
2014
.
Year ended
December 31, 2015
compared to year ended
December 31, 2014
|
|
Year Ended
|
||||||||||
|
|
December 31, 2015
|
December 31, 2014
|
Change
|
||||||||
|
|
($ in thousands)
|
||||||||||
|
Segment Revenues
|
|
|
|
|
|||||||
|
Management, Monitoring and Transaction Fees, Net
|
|
|
|
|
|||||||
|
Management Fees
|
$
|
465,575
|
|
$
|
453,210
|
|
$
|
12,365
|
|
||
|
Monitoring Fees
|
264,643
|
|
135,160
|
|
129,483
|
|
|||||
|
Transaction Fees
|
144,652
|
|
214,612
|
|
(69,960
|
)
|
|||||
|
Fee Credits
|
(195,025
|
)
|
(198,680
|
)
|
3,655
|
|
|||||
|
Total Management, Monitoring and Transaction Fees, Net
|
679,845
|
|
604,302
|
|
75,543
|
|
|||||
|
Performance Income
|
|
|
|
|
|||||||
|
Realized Incentive Fees
|
—
|
|
—
|
|
—
|
|
|||||
|
Realized Carried Interest
|
1,018,201
|
|
1,159,011
|
|
(140,810
|
)
|
|||||
|
Unrealized Carried Interest
|
182,628
|
|
70,058
|
|
112,570
|
|
|||||
|
Total Performance Income
|
1,200,829
|
|
1,229,069
|
|
(28,240
|
)
|
|||||
|
Investment Income (Loss)
|
|
|
|
|
|||||||
|
Net Realized Gains (Losses)
|
—
|
|
—
|
|
—
|
|
|||||
|
Net Unrealized Gains (Losses)
|
—
|
|
—
|
|
—
|
|
|||||
|
Total Realized and Unrealized
|
—
|
|
—
|
|
—
|
|
|||||
|
Interest Income and Dividends
|
—
|
|
—
|
|
—
|
|
|||||
|
Interest Expense
|
—
|
|
—
|
|
—
|
|
|||||
|
Net Interest and Dividends
|
—
|
|
—
|
|
—
|
|
|||||
|
Total Investment Income (Loss)
|
—
|
|
—
|
|
—
|
|
|||||
|
Total Segment Revenues
|
1,880,674
|
|
1,833,371
|
|
47,303
|
|
|||||
|
Segment Expenses
|
|
|
|
|
|||||||
|
Compensation and Benefits
|
|
|
|
|
|||||||
|
Cash Compensation and Benefits
|
193,995
|
|
153,339
|
|
40,656
|
|
|||||
|
Realized Performance Income Compensation
|
407,280
|
|
463,605
|
|
(56,325
|
)
|
|||||
|
Unrealized Performance Income Compensation
|
74,560
|
|
33,430
|
|
41,130
|
|
|||||
|
Total Compensation and Benefits
|
675,835
|
|
650,374
|
|
25,461
|
|
|||||
|
Occupancy and related charges
|
33,640
|
|
30,946
|
|
2,694
|
|
|||||
|
Other operating expenses
|
127,836
|
|
125,398
|
|
2,438
|
|
|||||
|
Total Segment Expenses
|
837,311
|
|
806,718
|
|
30,593
|
|
|||||
|
Income (Loss) attributable to noncontrolling interests
|
1,645
|
|
1,424
|
|
221
|
|
|||||
|
Economic Net Income (Loss)
|
$
|
1,041,718
|
|
$
|
1,025,229
|
|
$
|
16,489
|
|
||
|
Assets Under Management
|
$
|
66,028,600
|
|
$
|
64,611,300
|
|
$
|
1,417,300
|
|
||
|
Fee Paying Assets Under Management
|
$
|
45,307,400
|
|
$
|
47,262,500
|
|
$
|
(1,955,100
|
)
|
||
|
Equity Invested
|
$
|
5,527,900
|
|
$
|
7,223,400
|
|
$
|
(1,695,500
|
)
|
||
|
Uncalled Commitments
|
$
|
22,766,300
|
|
$
|
18,272,400
|
|
$
|
4,493,900
|
|
||
113
Segment Revenues
Management, Monitoring and Transaction Fees, Net
The net increase was primarily due to an increase in monitoring fees of $129.5 million and an increase in management fees of $12.4 million, partially offset by a decrease in transaction fees of $70.0 million.
The increase in monitoring fees was primarily the result of $198.8 million of monitoring fees received during 2015 from the termination of monitoring fee arrangements in connection with the initial public offering (IPO) or partial exits of First Data Corporation (NYSE: FDC), Walgreens Boots Alliance, Inc. (NASDAQ: WBA), J.M. Smucker Company (NYSE: SJM), Zimmer Biomet Holdings, Inc. (NYSE: ZBH) and GoDaddy, Inc. (NYSE: GDDY) compared to approximately $23.2 million of such fees received during the year ended December 31, 2014. These types of termination payments may occur in the future; however, they are infrequent in nature and are generally correlated with IPO and other realization activity in our private equity portfolio. This increase in monitoring fees from termination payments was partially offset by a decrease in recurring monitoring fees of $46.1 million. The decrease in recurring monitoring fees was primarily the result of a decrease in the number of portfolio companies paying a monitoring fee and a decrease in the average size of the fee. For the year ended December 31, 2015, we had 43 portfolio companies that were paying an average monitoring fee of $1.5 million compared with 50 portfolio companies that were paying an average monitoring fee of $2.2 million for the year ended December 31, 2014. In future periods, we anticipate that recurring monitoring fees will continue to decrease as a result of realizations and other transactions such as initial public offerings, if not offset by additional portfolio companies paying recurring monitoring fees.
The increase in management fees was primarily due to new capital raised in European Fund IV and Global Infrastructure Investors II offset by a decrease in management fees attributable to lower invested capital in our European Fund II, 2006 Fund and European Fund III as a result of realizations. See also discussion under “- Assets Under Management” and “- Fee-Paying Assets Under Management”. The decrease in transaction fees was primarily attributable to a decrease in the average fee earned on completed investments during the year ended December 31, 2015. During the year ended December 31, 2015, there were 37 transaction fee-generating investments paying an average fee of $3.9 million compared to 33 transaction fee-generating investments paying an average fee of $6.5 million during the year ended December 31, 2014. Transaction fees vary by investment based upon a number of factors, the most significant of which are transaction size, the particular discussions as to the amount of the fees, the complexity of the transaction and KKR’s role in the transaction.
Performance Income
The net decrease is attributable to lower net carried interest losses primarily resulting from a lower level of investment gains at carry earning funds during the current period.
Realized carried interest for the year ended December 31, 2015 consisted primarily of realized gains from the sales or partial sale of Walgreens Boots Alliance, Inc., Capital Safety Group and Zimmer Biomet Holdings, Inc.
Realized carried interest for the year ended December 31, 2014 consisted primarily of realized gains from the sales of Oriental Brewery (consumer products sector), WILD Flavors GmbH and Versatel GmbH (telecom sector).
114
The following table presents net unrealized carried interest by investment vehicle for the years ended
December 31, 2015
and
2014
:
|
|
Year Ended December 31,
|
||||||
|
|
2015
|
2014
|
|||||
|
|
($ in thousands)
|
||||||
|
North America Fund XI
|
$
|
209,361
|
|
$
|
189,063
|
|
|
|
Asian Fund II
|
163,645
|
|
58,967
|
|
|||
|
European Fund III
|
42,923
|
|
(34,914
|
)
|
|||
|
China Growth Fund
|
31,730
|
|
(6,346
|
)
|
|||
|
European Fund II
|
30,797
|
|
(112,091
|
)
|
|||
|
Real Estate Partners Americas
|
14,669
|
|
(662
|
)
|
|||
|
Global Infrastructure Investors
|
6,678
|
|
—
|
|
|||
|
European Fund IV
|
3,813
|
|
—
|
|
|||
|
European Fund
|
(3,705
|
)
|
(826
|
)
|
|||
|
E2 Investors
|
(20,564
|
)
|
(20,253
|
)
|
|||
|
Millennium Fund
|
(26,714
|
)
|
(40,489
|
)
|
|||
|
Co-Investment Vehicles and Other
|
(39,248
|
)
|
99,026
|
|
|||
|
2006 Fund
|
(111,965
|
)
|
128,970
|
|
|||
|
Asian Fund
|
(116,185
|
)
|
(176,456
|
)
|
|||
|
Management Fee Refunds
|
(2,607
|
)
|
(13,931
|
)
|
|||
|
Total (a)
|
$
|
182,628
|
|
$
|
70,058
|
|
|
|
(a)
|
The above table excludes any funds for which there was no unrealized carried interest during either of the periods presented.
|
For the year ended
December 31, 2015
, the net unrealized carried interest income of
$182.6 million
included $1,021.5 million representing net increases in the value of various portfolio companies, which were partially offset by unrealized losses of $838.9 million primarily representing reversals of previously recognized net unrealized gains in connection with the occurrence of realization events such as partial or full sales and management fee refunds.
For the year ended
December 31, 2015
, the value of our private equity investment portfolio increased 14.2%.
This was comprised of a 19.5% increase in the share prices of various publicly held or publicly indexed investments and a 9.3% increase in value of our privately held investments. The most significant increases in share prices of various publicly held or publicly indexed investments were gains in Walgreens Boots Alliance, Inc., PRA Health Sciences, Inc. (NASDAQ: PRAH) and GoDaddy, Inc. These increases were partially offset by decreased share prices of various publicly held investments, the most significant of which were RigNet (NASDAQ: RNET), HCA Holdings, Inc. (NYSE: HCA) and CITIC Envirotech Ltd. (SES: U19.SI). Subsequent to December 31, 2015, world equity markets declined sharply with both the S&P 500 and the MSCI World Index down on a total return basis, including dividends, as of February 22, 2016. See "--Business Environment". Our privately held investments contributed the remainder of the change in value, the most significant of which were gains relating to Panasonic Healthcare Co. Ltd (healthcare sector), Capital Safety Group (industrial sector) and Alliant Insurance Services (financial services sector). The unrealized gains on our privately held investments were partially offset by unrealized losses relating primarily to BIS Industries Ltd. (industrial sector), Acteon Group Ltd (energy sector) and Aceco TI S.A (technology sector). The increased valuations of individual companies in our privately held investments, in the aggregate, generally related to (i) in the case of Capital Safety Group and Alliant Insurance Services, valuations that reflect agreements to sell these investments in whole or in part, (ii) an increase in the value of market comparables and (iii) individual company performance. The decreased valuations of individual companies in our privately held investments, in the aggregate, generally related to (i) individual company performance or, in certain cases, an unfavorable business outlook and (ii) a decrease in the value of market comparables.
The reversals of previously recognized net unrealized gains for the year ended
December 31, 2015
resulted primarily from the sale or partial sales of Walgreens Boots Alliance, Inc., Capital Safety Group and Zimmer Biomet Holdings, Inc. During the year ended December 31, 2015, we wrote off Energy Future Holdings (energy sector) and recognized realized losses. This write-off did not have a significant impact on our 2015 net carried interest because this investment had already been written down to zero value in prior periods. See "--Segment Analysis--Principal Activities Segment" and "--Liquidity--Liquidity
115
Needs--Cash Earnings" for a discussion of how the Energy Future Holdings write-off impacted Principal Activities and our cash earnings. Subsequent to December 31, 2015, we expect to write-off our investment in Samson Resources once our losses are realized. Since this investment has already been written down to zero value in periods prior to December 31, 2015, this write-off is not expected to have a significant impact on our net carried interest in future periods.
For the year ended December 31, 2014, the net unrealized carried interest income of $70.1 million include $1,098.2 million representing net increases in the value of various portfolio companies, which were partially offset by unrealized losses of $1,028.1 million primarily representing reversals of previously recognized net unrealized gains in connection with the occurrence of realization events such as partial or full sales and management fee refunds.
For the year ended December 31, 2014, the value of our private equity investment portfolio increased 12.8%. Increased share prices of various publicly held investments comprised approximately 23% of the net increase in value for the year ended December 31, 2014, the most significant of which were gains on PRA Health Sciences, Inc., HCA, Inc., NXP Semiconductors N.V. and Yageo Corporation. These increases were partially offset by decreased share prices of various publicly held investments, the most significant of which were Tarkett S.A., ProSiebenSat.1 Media AG and Rundong Automobile Group. Our privately‑held investments contributed the remainder of the change in value, the most significant of which were gains relating to Alliance Boots GmbH, Biomet, Inc. and WILD Flavors GmbH. The unrealized gains on our privately‑held investments were partially offset by unrealized losses relating primarily to Northgate Information Solutions, Samson Resources and Toys R Us. The increased valuations of individual companies in our privately‑held investments, in the aggregate, generally related to (i) an increase in the value of market comparables and individual company performance, (ii) in the case of WILD Flavors GmbH and Biomet, Inc., an increase that primarily reflected agreements to sell these investments, with the sale of WILD Flavors GmbH completed in October 2014, and (iii) in the case of Alliance Boots GmbH, primarily due to an agreement to exit the investment and to a lesser extent an increase in the value of a publicly traded stock that was expected to be delivered pursuant to this agreement, which was completed on December 31, 2014. The decreased valuations of individual companies in our privately‑held investments, in the aggregate, generally related to individual company performance or, in certain cases, an unfavorable business outlook.
The reversals of previously recognized net unrealized gains for the year ended December 31, 2014 resulted primarily from the sale of Oriental Brewery, the sale of WILD Flavors GmbH, the partial sale of HCA, Inc. and the sale of Jazz Pharmaceuticals, Inc. (NASDAQ: JAZZ). During the year ended December 31, 2014, we wrote off A.T.U Auto‑Teile‑Unger (retail sector) and U.N RO‑RO Isletmeleri A.S. (transportation sector) and recognized realized losses. These 2014 write‑offs did not have a significant impact on our 2014 net carried interest because these interests had already been substantially written down in prior periods.
Segment Expenses
Compensation and Benefits
The net increase was due primarily to (i) higher cash compensation and benefits consistent with a higher level of fee income in the current period and (ii) a decrease in the amount of compensation expenses allocated from Private Markets to Principal Activities as result of a decrease in the proportion of revenue earned by Principal Activities relative to other operating segments during 2015. These increases were partially offset by lower allocations to carry pool driven by the lower levels of net carried interest as discussed in "Performance Income" above.
Occupancy and Other Operating Expenses
The net increase was primarily driven by (i) higher allocations of corporate operating expenses to Private Markets due to an increase in both the amount of corporate operating expenses incurred by the firm and an increase in the proportion of revenue earned by Private Markets relative to other operating segments in 2015, (ii) a decrease in the amount of operating expenses allocated from Private Markets to Principal Activities as a result of a decrease in the proportion of revenue earned by Principal Activities relative to other operating segments during 2015 and (iii) an increase in professional fees and other expenses. These increases were partially offset by a decrease in expenses for unconsummated transactions, also known as broken deal expenses.
Economic Net Income (Loss)
The increase was primarily due to higher fee income, partially offset by an increase in segment expenses and a decrease in performance income as described above.
116
Assets Under Management
The following table reflects the changes in our Private Markets AUM from
December 31, 2014
to
December 31, 2015
:
|
|
($ in thousands)
|
||
|
December 31, 2014 - As Adjusted
|
$
|
64,611,300
|
|
|
New Capital Raised
|
6,950,200
|
|
|
|
Distributions
|
(11,832,500
|
)
|
|
|
Change in Value
|
6,299,600
|
|
|
|
December 31, 2015
|
$
|
66,028,600
|
|
As of December 31, 2014, AUM has been adjusted to include capital commitments for which we are eligible to receive fees or carried interest upon deployment of capital. Our reported AUM for periods prior to December 31, 2014 does not include this item.
AUM for the Private Markets segment was
$66.0 billion
at
December 31, 2015
, an increase of $1.4 billion, compared to $64.6 billion at
December 31, 2014
, on an as adjusted basis. The increase was primarily attributable to new capital raised primarily in European Fund IV and Global Infrastructure Investors II and to a lesser extent an increase in value of our Private Markets portfolio. These increases were partially offset by distributions to private equity fund investors of $11.8 billion comprised of $6.9 billion of realized gains and $4.9 billion of return of original cost.
The increase in the value of our Private Markets portfolio was driven primarily by net unrealized gains of $1.8 billion, $1.5 billion and $0.9 billion in our 2006 Fund, North America Fund XI and Asian Fund II, respectively.
This was comprised of a 19.5% increase in the share prices of various publicly held or publicly indexed investments and a 9.3% increase in value of our privately held investments. The most significant increases in share prices of various publicly held or publicly indexed investments were gains in Walgreens Boots Alliance, Inc., PRA Health Sciences, Inc. (NASDAQ: PRAH) and GoDaddy, Inc. These increases were partially offset by decreased share prices of various publicly held investments, the most significant of which were RigNet (NASDAQ: RNET), HCA Holdings, Inc. (NYSE: HCA) and CITIC Envirotech Ltd. (SES: U19.SI). Subsequent to December 31, 2015, world equity markets declined sharply with both the S&P 500 and the MSCI World Index down on a total return basis, including dividends, as of February 22, 2016. See "--Business Environment". Our privately held investments contributed the remainder of the change in value, the most significant of which were gains relating to Panasonic Healthcare Co. Ltd (healthcare sector), Capital Safety Group (industrial sector) and Alliant Insurance Services (financial services sector). The unrealized gains on our privately held investments were partially offset by unrealized losses relating primarily to BIS Industries Ltd. (industrial sector), Acteon Group Ltd (energy sector) and Aceco TI S.A (technology sector). The increased valuations of individual companies in our privately held investments, in the aggregate, generally related to (i) in the case of Capital Safety Group and Alliant Insurance Services, valuations that reflect agreements to sell these investments in whole or in part, (ii) an increase in the value of market comparables and (iii) individual company performance. The decreased valuations of individual companies in our privately held investments, in the aggregate, generally related to (i) individual company performance or, in certain cases, an unfavorable business outlook and (ii) a decrease in the value of market comparables.
Fee-Paying Assets Under Management
The following table reflects the changes in our Private Markets FPAUM from
December 31, 2014
to
December 31, 2015
:
|
|
($ in thousands)
|
||
|
December 31, 2014
|
$
|
47,262,500
|
|
|
New Capital Raised
|
3,896,100
|
|
|
|
Distributions and Other
|
(5,545,200
|
)
|
|
|
Change in Value
|
(306,000
|
)
|
|
|
December 31, 2015
|
$
|
45,307,400
|
|
FPAUM in our Private Markets segment was
$45.3 billion
at
December 31, 2015
, a decrease of $2.0 billion, compared to $47.3 billion at
December 31, 2014
. The decrease was primarily attributable to distributions to private equity fund investors and a reduction in FPAUM attributable to the invested capital of Samson Resources due to its bankruptcy proceedings which is included within distributions and other in the table above. These decreases were partially offset by new capital raised of $3.9 billion primarily in our European Fund IV and Global Infrastructure Investors II funds.
117
Equity Invested
The decrease was due to a decrease in the amount of equity invested in our private equity platform, which was partially offset by an increase in equity invested in our real assets platforms (real estate, energy and infrastructure). For the years ended
December 31, 2015
and
2014
, equity invested in our private equity platform was $4.1 billion and $5.9 billion, respectively, and equity invested in our real assets platforms was $1.4 billion and $1.3 billion, respectively. Generally, the operating companies acquired through our private equity business have higher transaction values and result in higher equity invested relative to transactions in our real assets businesses. The number of large private equity investments made in any quarter is volatile and consequently, a significant amount of equity invested in one quarter or a few quarters may not be indicative of a similar level of capital deployment in future quarters.
Uncalled Commitments
As of
December 31, 2015
, our Private Markets segment had
$22.8 billion
of remaining uncalled capital commitments that could be called for investments in new transactions.
118
The following tables set forth information regarding the results of operations and certain key operating metrics for our Private Markets segment for the years ended December 31, 2014 and 2013.
Year ended
December 31, 2014
compared to year ended
December 31, 2013
|
|
Year Ended
|
||||||||||
|
|
December 31, 2014
|
December 31, 2013
|
Change
|
||||||||
|
|
($ in thousands)
|
||||||||||
|
Segment Revenues
|
|
|
|
|
|||||||
|
Management, Monitoring and Transaction Fees, Net
|
|
|
|
|
|||||||
|
Management Fees
|
$
|
453,210
|
|
$
|
459,496
|
|
$
|
(6,286
|
)
|
||
|
Monitoring Fees
|
135,160
|
|
120,267
|
|
14,893
|
|
|||||
|
Transaction Fees
|
214,612
|
|
150,118
|
|
64,494
|
|
|||||
|
Fee Credits
|
(198,680
|
)
|
(136,662
|
)
|
(62,018
|
)
|
|||||
|
Total Management, Monitoring and Transaction Fees, Net
|
604,302
|
|
593,219
|
|
11,083
|
|
|||||
|
Performance Income
|
|
|
|
|
|||||||
|
Realized Incentive Fees
|
—
|
|
—
|
|
—
|
|
|||||
|
Realized Carried Interest
|
1,159,011
|
|
690,027
|
|
468,984
|
|
|||||
|
Unrealized Carried Interest
|
70,058
|
|
661,803
|
|
(591,745
|
)
|
|||||
|
Total Performance Income
|
1,229,069
|
|
1,351,830
|
|
(122,761
|
)
|
|||||
|
Investment Income (Loss)
|
|
|
|
|
|||||||
|
Net Realized Gains (Losses)
|
—
|
|
—
|
|
—
|
|
|||||
|
Net Unrealized Gains (Losses)
|
—
|
|
—
|
|
—
|
|
|||||
|
Total Realized and Unrealized
|
—
|
|
—
|
|
—
|
|
|||||
|
Interest Income and Dividends
|
—
|
|
—
|
|
—
|
|
|||||
|
Interest Expense
|
—
|
|
—
|
|
—
|
|
|||||
|
Net Interest and Dividends
|
—
|
|
—
|
|
—
|
|
|||||
|
Total Investment Income (Loss)
|
—
|
|
—
|
|
—
|
|
|||||
|
Total Segment Revenues
|
1,833,371
|
|
1,945,049
|
|
(111,678
|
)
|
|||||
|
Segment Expenses
|
|
|
|
|
|||||||
|
Compensation and Benefits
|
|
|
|
|
|||||||
|
Cash Compensation and Benefits
|
153,339
|
|
148,557
|
|
4,782
|
|
|||||
|
Realized Performance Income Compensation
|
463,605
|
|
276,011
|
|
187,594
|
|
|||||
|
Unrealized Performance Income Compensation
|
33,430
|
|
282,003
|
|
(248,573
|
)
|
|||||
|
Total Compensation and Benefits
|
650,374
|
|
706,571
|
|
(56,197
|
)
|
|||||
|
Occupancy and related charges
|
30,946
|
|
31,769
|
|
(823
|
)
|
|||||
|
Other operating expenses
|
125,398
|
|
106,917
|
|
18,481
|
|
|||||
|
Total Segment Expenses
|
806,718
|
|
845,257
|
|
(38,539
|
)
|
|||||
|
Income (Loss) attributable to noncontrolling interests
|
1,424
|
|
1,498
|
|
(74
|
)
|
|||||
|
Economic Net Income (Loss)
|
$
|
1,025,229
|
|
$
|
1,098,294
|
|
$
|
(73,065
|
)
|
||
|
Assets Under Management
|
$
|
64,611,300
|
|
$
|
61,242,900
|
|
$
|
3,368,400
|
|
||
|
Fee Paying Assets Under Management
|
$
|
47,262,500
|
|
$
|
50,156,300
|
|
$
|
(2,893,800
|
)
|
||
|
Equity Invested
|
$
|
7,223,400
|
|
$
|
5,840,900
|
|
$
|
1,382,500
|
|
||
|
Uncalled Commitments
|
$
|
18,272,400
|
|
$
|
20,101,600
|
|
$
|
(1,829,200
|
)
|
||
119
Segment Revenues
Management, Monitoring and Transaction Fees, Net
The net increase was primarily due to an increase in transaction fees of $64.5 million, partially offset by an increase in fee credits of $62.0 million. The increase in transaction fees was attributable to an increase in the size of fee‑generating investments completed. During the year ended December 31, 2014, there were 33 transaction fee‑generating investments with a total combined transaction value of approximately $15.4 billion compared to 33 transaction fee‑generating investments with a total combined transaction value of approximately $15.0 billion during the year ended December 31, 2013. Transaction fees vary by investment based upon a number of factors, the most significant of which are transaction size, the particular discussions as to the amount of the fees, the complexity of the transaction and KKR’s role in the transaction. The increase in fee credits is primarily attributable to the increase in transaction fees, as described above. See also discussion under “-Assets Under Management” and “-Fee‑Paying Assets Under Management”.
Performance Income
The net decrease primarily reflects a lower level of unrealized appreciation in our private equity portfolio in the 2014 period than in the 2013 period. While the value of our private equity portfolio increased in the 2014 period, the amount of appreciation was less than that in the prior period.
Realized carried interest for the year ended December 31, 2014 increased compared to the year ended December 31, 2013 and consisted primarily of realized gains from the sales of Oriental Brewery, WILD Flavors GmbH and Versatel GmbH.
Realized carried interest for the year ended December 31, 2013 consisted primarily of realized gains from the partial sale and final sale of Dollar General Corporation (NYSE: DG), the partial sale of HCA, Inc. and sale of Intelligence, Ltd. (services sector).
The following table presents net unrealized carried interest by investment vehicle for the year ended December 31, 2014 and 2013:
|
|
Year Ended December 31,
|
||||||
|
|
2014
|
2013
|
|||||
|
|
($ in thousands)
|
||||||
|
North America Fund XI
|
$
|
189,063
|
|
$
|
34,389
|
|
|
|
2006 Fund
|
128,970
|
|
294,883
|
|
|||
|
Co-Investment Vehicles and Other
|
99,026
|
|
22,009
|
|
|||
|
Asian Fund II
|
58,967
|
|
—
|
|
|||
|
Real Estate Partners Americas
|
(662
|
)
|
12,516
|
|
|||
|
European Fund
|
(826
|
)
|
19
|
|
|||
|
China Growth Fund
|
(6,346
|
)
|
6,937
|
|
|||
|
E2 Investors
|
(20,253
|
)
|
14,774
|
|
|||
|
European Fund III
|
(34,914
|
)
|
124,463
|
|
|||
|
Millennium Fund
|
(40,489
|
)
|
12,128
|
|
|||
|
European Fund II
|
(112,091
|
)
|
169,819
|
|
|||
|
Asian Fund
|
(176,456
|
)
|
148
|
|
|||
|
Management Fee Refunds
|
(13,931
|
)
|
(30,282
|
)
|
|||
|
Total (a)
|
$
|
70,058
|
|
$
|
661,803
|
|
|
|
(a)
|
The above table excludes any funds for which there was no unrealized carried interest during either of the periods presented.
|
For the year ended December 31, 2014, the net unrealized carried interest income of $70.1 million included $1,098.2 million representing net increases in the value of various portfolio companies, which were partially offset by unrealized losses of $1,028.1 million primarily representing reversals of previously recognized net unrealized gains in connection with the occurrence of realization events such as partial or full sales and management fee refunds.
120
For the year ended December 31, 2014, the value of our private equity investment portfolio increased 12.8%. Increased share prices of various publicly held investments comprised approximately 23% of the net increase in value for the year ended December 31, 2014, the most significant of which were gains on PRA Health Sciences, Inc., HCA, Inc., NXP Semiconductors N.V. and Yageo Corporation. These increases were partially offset by decreased share prices of various publicly held investments, the most significant of which were Tarkett S.A., ProSiebenSat.1 Media AG and Rundong Automobile Group. Our privately‑held investments contributed the remainder of the change in value, the most significant of which were gains relating to Alliance Boots GmbH, Biomet, Inc. and WILD Flavors GmbH. The unrealized gains on our privately‑held investments were partially offset by unrealized losses relating primarily to Northgate Information Solutions, Samson Resources and Toys R Us. The increased valuations of individual companies in our privately‑held investments, in the aggregate, generally related to (i) an increase in the value of market comparables and individual company performance, (ii) in the case of WILD Flavors GmbH and Biomet, Inc., an increase that primarily reflected agreements to sell these investments, with the sale of WILD Flavors GmbH completed in October 2014, and (iii) in the case of Alliance Boots GmbH, primarily due to an agreement to exit the investment and to a lesser extent an increase in the value of a publicly traded stock that is expected to be delivered pursuant to this agreement, which was completed on December 31, 2014. The decreased valuations of individual companies in our privately‑held investments, in the aggregate, generally related to individual company performance or, in certain cases, an unfavorable business outlook.
The reversals of previously recognized net unrealized gains for the year ended December 31, 2014 resulted primarily from the sale of Oriental Brewery, the sale of WILD Flavors GmbH, the partial sale of HCA, Inc. and the sale of Jazz Pharmaceuticals, Inc. During the year ended December 31, 2014, we wrote off A.T.U Auto‑Teile‑Unger and U.N RO‑RO Isletmeleri A.S. and recognized realized losses. These 2014 write‑offs did not have a significant impact on our 2014 net carried interest because these interests had already been substantially written down in prior periods.
For the year ended December 31, 2013, the unrealized carried interest gain of $661.8 million included $1,174.6 million reflecting net increases in the value of various portfolio companies, which were partially offset by $512.8 million primarily representing reversals of previously recognized net unrealized gains in connection with the occurrence of realization events such as partial or full sales and management fee refunds.
For the year ended December 31, 2013, the value of our private equity investment portfolio increased 20.2%. Increased share prices of various publicly held investments comprised approximately 46% of the net increase in value for the year ended December 31, 2013, the most significant of which were gains on HCA, Inc., ProSiebenSat.1 Media AG and NXP Semiconductors N.V. These increases were partially offset by decreased share prices of various publicly held investments, the most significant of which were Bharti Infratel Ltd. (NS: INFRATEL) and China Outfitters Holdings Ltd (HK: 1146). Our private portfolio contributed the remainder of the change in value, the most significant of which were gains relating to Alliance Boots GmbH, Academy Sports and Outdoors and Oriental Brewery. The unrealized gains on our private portfolio were partially offset by unrealized losses relating primarily to Toys R Us, Samson Resources, and U.N RO‑RO Isletmeleri A.S. The increased valuations of our private portfolio, in the aggregate, generally related to (i) an increase in the value of market comparables and individual company performance and (ii) in the case of Alliance Boots GmbH, in part due to the increase in the value of a publicly traded stock that was delivered pursuant to a previously announced transaction, which was completed on December 31, 2014. The decreased valuations of our private portfolio, in the aggregate, generally related to individual company performance or, in certain cases, an unfavorable business outlook.
The reversals of previously recognized net unrealized gains for the year ended December 31, 2013 resulted primarily from the partial sales and final sale of Dollar General Corporation, the partial sales of HCA, Inc. and sale of Intelligence, Ltd. During the year ended December 31, 2013, we wrote off PagesJaunes Group (media sector) (currently known as Solocal Group SA (PA: LOCAL) and our remaining warrants in Eastman Kodak (NYSE: KODK) and sold our remaining investment in Seven West Media Ltd. (AX: SWM) realizing a modest loss. None of these write‑offs had a material impact on our 2013 net carried interest because these interests had already been substantially written down in prior periods.
Segment Expenses
Compensation and Benefits
The net decrease was due primarily to lower allocations to carry pool driven by the lower levels of unrealized carried interest, partially offset by an increase in realized carried interest and higher cash compensation and benefits primarily reflecting (i) increased headcount, (ii) higher allocations of corporate compensation to Private Markets due to an increase in both the amount of corporate compensation incurred by the firm primarily as a result of an increase in headcount and an increase in the proportion of revenue earned by Private Markets relative to other operating segments in 2014 and (iii) a higher level of fees, which generally results in higher compensation expenses.
121
Occupancy and Other Operating Expenses
The net increase was primarily driven by (i) an increase in expenses for unconsummated transactions, also known as broken deal expenses, (ii) an increase in professional fee expenses reflecting the overall growth of this segment and (iii) a decrease in the amount of operating expenses allocated from Private Markets to Principal Activities primarily as result of a decrease in the proportion of revenue earned by Principal Activities relative to other operating segments during 2014. These increases were partially offset by lower allocations of corporate operating expenses to Private Markets due primarily to a decrease in the amount of corporate operating expenses incurred by the firm.
Economic Net Income (Loss)
The decrease was primarily due to the decrease in performance income, partially offset by increases in management, monitoring and transaction fees, net and a decrease in segment expenses as described above.
Assets Under Management
The following table reflects the changes in our Private Markets AUM from
December 31, 2013
to
December 31, 2014
:
|
|
($ in thousands)
|
||
|
December 31, 2013
|
$
|
61,242,900
|
|
|
New Capital Raised
|
6,056,000
|
|
|
|
Distributions
|
(10,724,800
|
)
|
|
|
Net Changes in Fee Base of Certain Funds
|
(933,800
|
)
|
|
|
Change in Value
|
5,865,500
|
|
|
|
December 31, 2014 - As Reported
|
61,505,800
|
|
|
|
Capital Commitments Where Fees or Carry are Payable Upon Deployment
|
3,105,500
|
|
|
|
December 31, 2014 - As Adjusted
|
$
|
64,611,300
|
|
AUM for the Private Markets segment was $64.6 billion at December 31, 2014, on an as adjusted basis, an increase of $3.4 billion, compared to $61.2 billion at December 31, 2013. The increase was primarily attributable to new capital raised of $6.1 billion and appreciation in the market value of our private equity portfolio of $5.9 billion. These increases were partially offset by distributions to private equity fund investors of $10.7 billion comprised of $7.3 billion of realized gains and $3.4 billion of return of original cost. In addition, AUM as of December 31, 2014 has been adjusted to include capital commitments for which we are eligible to receive fees or carried interest upon deployment of capital. This item increased our AUM by approximately $3.1 billion as of December 31, 2014 but is excluded from AUM as of December 31, 2013.
The appreciation in the market value of our private equity portfolio was driven primarily by net unrealized gains of $2.2 billion, $1.2 billion and $1.1 billion in our 2006 Fund, European Fund III and North America Fund XI, respectively. Approximately 23% of the net change in value for the year ended December 31, 2014 was attributable to changes in share prices of various publicly‑listed investments, the most significant of which were gains on PRA Health Sciences, Inc., HCA, Inc., NXP Semiconductors N.V. and Yageo Corporation. These increases were partially offset by decreased share prices of various publicly held investments, the most significant of which were Tarkett S.A., ProSiebenSat.1 Media AG and Rundong Automobile Group. Our privately‑held investments contributed the remainder of the change in value, the most significant of which were gains relating to Alliance Boots GmbH, Biomet, Inc. and WILD Flavors GmbH. The unrealized gains on our privately‑held investments were partially offset by unrealized losses relating primarily to Northgate Information Solutions, Samson Resources and Toys R Us. The unrealized gains were also offset by unrealized losses in our energy assets from our Natural Resources Fund and Energy Income and Growth Fund of approximately $352 million. The increased valuations of individual companies in our privately‑held investments, in the aggregate, generally related to (i) an increase in the value of market comparables and individual company performance, (ii) in the case of WILD Flavors GmbH and Biomet, Inc., an increase that primarily reflected agreements to sell these investments, with the sale of WILD Flavors GmbH completed in October 2014, and (iii) in the case of Alliance Boots GmbH, primarily due to an agreement to exit the investment and to a lesser extent an increase in the value of a publicly traded stock that is expected to be delivered pursuant to this agreement, which was completed on December 31, 2014. The decreased valuations of individual companies in our privately‑held investments, in the aggregate, generally related to individual company performance or, in certain cases, an unfavorable business outlook. The decreased valuation of energy assets are generally related to decreases in commodity prices.
122
Fee-Paying Assets Under Management
The following table reflects the changes in our Private Markets FPAUM from
December 31, 2013
to
December 31, 2014
:
|
|
($ in thousands)
|
||
|
December 31, 2013
|
$
|
50,156,300
|
|
|
New Capital Raised
|
5,298,500
|
|
|
|
Distributions
|
(6,833,800
|
)
|
|
|
Net Changes in Fee Base of Certain Funds
|
(964,700
|
)
|
|
|
Change in Value
|
(393,800
|
)
|
|
|
December 31, 2014
|
$
|
47,262,500
|
|
FPAUM in our Private Markets segment was $47.3 billion at December 31, 2014, a decrease of $2.9 billion, compared to $50.2 billion at December 31, 2013. The decrease was primarily attributable to (i) distributions to private equity fund investors, (ii) a reduction in FPAUM attributable to the invested capital of Energy Future Holdings due to its bankruptcy and (iii) a reduction reflecting the impact of our European Fund III entering its post‑investment period. This decrease was partially offset by new capital raised of $5.3 billion relating primarily to additional capital raised in our Infrastructure Investors Fund II, European Fund IV and capital deployed in our 2006 Fund which earns fees on invested capital in its post‑investment period.
Equity Invested
The increase was due to an increase in the number and size of private equity investments closed during the year ended December 31, 2014 as compared with the year ended December 31, 2013. Generally, the operating companies acquired through our private equity business have higher transaction values and result in higher equity invested, relative to transactions in our real assets businesses. The number of large private equity investments made in any quarter is volatile and consequently, a significant amount of equity invested in one quarter or a few quarters may not be indicative of a similar level of capital deployment in future quarters. For the year ended December 31, 2014, there were 96 transactions with a total combined transaction value of approximately $21.8 billion compared to 70 transactions with a total combined transaction value of approximately $17.0 billion for the year ended December 31, 2013.
Uncalled Commitments
As of December 31, 2014, our Private Markets Segment had $18.3 billion of remaining uncalled capital commitments that could be called for investments in new transactions.
123
Public Markets Segment
The following tables set forth information regarding the results of operations and certain key operating metrics for our Public Markets segment for the years ended
December 31, 2015
and
2014
.
Year ended
December 31, 2015
compared to year ended
December 31, 2014
|
|
Year Ended
|
|||||||||||
|
|
December 31, 2015
|
December 31, 2014
|
Change
|
|||||||||
|
|
($ in thousands)
|
|||||||||||
|
Segment Revenues
|
|
|
||||||||||
|
Management, Monitoring and Transaction Fees, Net
|
|
|
|
|
||||||||
|
Management Fees
|
$
|
266,458
|
|
$
|
272,833
|
|
$
|
(6,375
|
)
|
|||
|
Monitoring Fees
|
—
|
|
—
|
|
—
|
|
||||||
|
Transaction Fees
|
28,872
|
|
27,145
|
|
1,727
|
|
||||||
|
Fee Credits
|
(24,595
|
)
|
(23,357
|
)
|
(1,238
|
)
|
||||||
|
Total Management, Monitoring and Transaction Fees, Net
|
270,735
|
|
276,621
|
|
(5,886
|
)
|
||||||
|
Performance Income
|
|
|
|
|
||||||||
|
Realized Incentive Fees
|
19,647
|
|
47,807
|
|
(28,160
|
)
|
||||||
|
Realized Carried Interest
|
8,953
|
|
34,650
|
|
(25,697
|
)
|
||||||
|
Unrealized Carried Interest
|
(19,083
|
)
|
40,075
|
|
(59,158
|
)
|
||||||
|
Total Performance Income
|
9,517
|
|
122,532
|
|
(113,015
|
)
|
||||||
|
Investment Income (Loss)
|
|
|
|
|
||||||||
|
Net Realized Gains (Losses)
|
—
|
|
—
|
|
—
|
|
||||||
|
Net Unrealized Gains (Losses)
|
—
|
|
—
|
|
—
|
|
||||||
|
Total Realized and Unrealized
|
—
|
|
—
|
|
—
|
|
||||||
|
Interest Income and Dividends
|
—
|
|
—
|
|
—
|
|
||||||
|
Interest Expense
|
—
|
|
—
|
|
—
|
|
||||||
|
Net Interest and Dividends
|
—
|
|
—
|
|
—
|
|
||||||
|
Total Investment Income (Loss)
|
—
|
|
—
|
|
—
|
|
||||||
|
Total Segment Revenues
|
280,252
|
|
399,153
|
|
(118,901
|
)
|
||||||
|
Segment Expenses
|
|
|
|
|
||||||||
|
Compensation and Benefits
|
|
|
|
|
||||||||
|
Cash Compensation and Benefits
|
73,863
|
|
64,530
|
|
9,333
|
|
||||||
|
Realized Performance Income Compensation
|
11,438
|
|
32,984
|
|
(21,546
|
)
|
||||||
|
Unrealized Performance Income Compensation
|
(7,633
|
)
|
16,029
|
|
(23,662
|
)
|
||||||
|
Total Compensation and Benefits
|
77,668
|
|
113,543
|
|
(35,875
|
)
|
||||||
|
Occupancy and related charges
|
9,808
|
|
7,214
|
|
2,594
|
|
||||||
|
Other operating expenses
|
40,591
|
|
31,501
|
|
9,090
|
|
||||||
|
Total Segment Expenses
|
128,067
|
|
152,258
|
|
(24,191
|
)
|
||||||
|
Income (Loss) attributable to noncontrolling interests
|
1,259
|
|
1,636
|
|
(377
|
)
|
||||||
|
Economic Net Income (Loss)
|
$
|
150,926
|
|
$
|
245,259
|
|
$
|
(94,333
|
)
|
|||
|
|
|
|
|
|
||||||||
|
Assets Under Management
|
$
|
53,515,700
|
|
$
|
42,508,000
|
|
$
|
11,007,700
|
|
|||
|
Fee Paying Assets Under Management
|
$
|
46,413,100
|
|
$
|
38,594,700
|
|
$
|
7,818,400
|
|
|||
|
Equity Invested
|
$
|
2,214,700
|
|
$
|
3,027,400
|
|
$
|
(812,700
|
)
|
|||
|
Uncalled Commitments
|
$
|
6,690,800
|
|
$
|
2,841,300
|
|
$
|
3,849,500
|
|
|||
|
Gross Dollars Invested
|
$
|
5,244,900
|
|
$
|
4,425,600
|
|
$
|
819,300
|
|
|||
124
Segment Revenues
Management, Monitoring and Transaction Fees, Net
The net decrease was primarily due to a decrease in management fees of $6.4 million. The decrease in management fees was due primarily to (i) a decrease in management fees received from KFN as a result of our acquisition of it on April 30, 2014, as management fees from KFN after that date were eliminated from segment results, (ii) redemptions in our hedge funds business and (iii) our mezzanine fund entering its post-investment period where it earns fees at a lower rate and on invested rather than committed capital. These decreases were partially offset by management fees earned from new capital raised primarily in Corporate Capital Trust (a BDC sub‑advised by KKR) as well as management fees earned relating to our investment in Marshall Wace LLP ("Marshall Wace") which was completed in the fourth quarter of 2015.
Performance Income
The net decrease was primarily attributable to net carried interest losses in 2015 and a lower level of incentive fees. The net carried interest losses were primarily due to losses in our special situations strategy accounts and funds as well as lower overall appreciation in our mezzanine and direct lending strategies during 2015. The decrease in incentive fees is due primarily to a decrease in incentive fees received from KFN as a result of our acquisition of it on April 30, 2014, as incentive fees from KFN after that date were eliminated from segment results, as well as lower incentive fees in our hedge fund-of-funds platform and European credit platform driven primarily by less favorable financial performance in the current year. Incentive fees are typically determined for the twelve-month periods ending in either the second or fourth quarters of the calendar year, however, such fees may also be determined quarterly or at other points during the year. Whether an incentive fee from KKR vehicles is payable in any given period, and the amount of an incentive fee payment, if any, depends on the investment performance of the vehicle and as a result are expected to vary significantly from period to period.
Segment Expenses
Compensation and Benefits
The decrease was primarily due to (i) reversals of unrealized performance income compensation in connection with net carried interest losses in 2015 in certain carry earning funds, (ii) lower appreciation in certain carry earning funds in 2015 and (iii) a decrease in realized performance income compensation reflecting the decrease in incentive fees, each of which are described above.
Occupancy and Other Operating Expenses
The increase was primarily driven by (i) higher occupancy costs reflecting the cost of an exit of office space during the year, (ii) higher allocations of corporate other operating expenses to Public Markets due to an increase in both the amount of corporate other operating expenses incurred by the firm and an increase in the proportion of revenue earned by Public Markets relative to other operating segments in 2015 and (iii) a decrease in the amount of operating expenses allocated from Public Markets to Principal Activities as result of a decrease in the proportion of revenue earned by Principal Activities relative to other operating segments during 2015.
Economic Net Income (Loss)
The decrease is primarily attributable to the decrease in performance income and fees partially offset by lower expenses as described above.
125
Assets Under Management
The following table reflects the changes in our Public Markets AUM from
December 31, 2014
to
December 31, 2015
:
|
|
($ in thousands)
|
||
|
December 31, 2014 - As Adjusted
|
$
|
42,508,000
|
|
|
New Capital Raised
|
12,926,300
|
|
|
|
Acquisitions
|
6,010,800
|
|
|
|
Distributions
|
(4,087,900
|
)
|
|
|
Redemptions
|
(2,873,500
|
)
|
|
|
Net Changes in Fee Base of Certain Funds
|
(238,600
|
)
|
|
|
Change in Value
|
(729,400
|
)
|
|
|
December 31, 2015
|
$
|
53,515,700
|
|
As of December 31, 2014, AUM has been adjusted to include (i) capital commitments for which we are eligible to receive fees or carried interest upon deployment of capital and (ii) KKR's pro-rata portion of AUM managed by other asset managers in which KKR holds a minority stake. Our reported AUM for periods prior to December 31, 2014 does not include these items.
AUM in our Public Markets segment totaled
$53.5 billion
at
December 31, 2015
, an increase of $11.0 billion compared to AUM of $42.5 billion at
December 31, 2014
, on an as adjusted basis. The increase for the period was primarily due to new capital raised across multiple strategies primarily in our CLOs, special situations strategy, hedge funds business and Corporate Capital Trust. In addition, in the fourth quarter of 2015, KKR acquired 24.9% of Marshall Wace, resulting in the inclusion of KKR's pro-rata portion of the AUM managed by Marshall Wace. Partially offsetting these increases were (i) redemptions and distributions of $7.0 billion from certain investment vehicles across multiple strategies including our hedge funds business, strategic partnerships and CLOs, (ii) decreases in value of $0.7 billion primarily in our European credit platform related to foreign currency fluctuations and (iii) a net change in fee base of $0.2 billion reflecting our Mezzanine Fund entering its post-investment period.
Fee-Paying Assets Under Management
The following table reflects the changes in our Public Markets FPAUM from
December 31, 2014
to
December 31, 2015
:
|
|
($ in thousands)
|
||
|
December 31, 2014 - As Adjusted
|
$
|
38,594,700
|
|
|
New Capital Raised
|
9,212,400
|
|
|
|
Acquisitions
|
6,010,800
|
|
|
|
Distributions
|
(3,455,800
|
)
|
|
|
Redemptions
|
(2,873,500
|
)
|
|
|
Net Changes in Fee Base of Certain Funds
|
(325,200
|
)
|
|
|
Change in Value
|
(750,300
|
)
|
|
|
December 31, 2015
|
$
|
46,413,100
|
|
As of December 31, 2014, FPAUM has been adjusted to include KKR's pro-rata portion of AUM managed by other asset managers in which KKR holds a minority stake. Our reported AUM for periods prior to December 31, 2014 does not include this item.
FPAUM in our Public Markets segment was
$46.4 billion
at
December 31, 2015
, an increase of $7.8 billion compared to FPAUM of $38.6 billion at
December 31, 2014
, on an as adjusted basis. The increase was primarily due to new capital raised of $9.2 billion across multiple strategies primarily in our CLOs, special situations strategy, hedge funds business and Corporate Capital Trust. In addition, in the fourth quarter of 2015, KKR acquired 24.9% of Marshall Wace, resulting in the inclusion of KKR's pro-rata portion of the FPAUM managed by Marshall Wace. Partially offsetting these increases were (i) decreases of $6.3 billion relating to redemptions and distributions from certain investment vehicles across multiple strategies primarily in CLOs, our hedge funds platform and strategic partnerships, (ii) decreases in value primarily in our European credit and hedge fund platforms related to foreign currency fluctuations and (iii) a net change in fee base of $0.3 billion reflecting our Mezzanine Fund entering its post-investment period.
Equity Invested
The increase is primarily due to a higher level of net capital deployed in our direct lending, special situations and mezzanine strategies.
126
Uncalled Commitments
As of
December 31, 2015
, our Public Markets segment had
$6.7 billion
of uncalled capital commitments that could be called for investments in new transactions.
Gross Dollars Invested
The increase is primarily due to a higher level of investment activity in our direct lending, special situations and mezzanine strategies.
127
The following tables set forth information regarding the results of operations and certain key operating metrics for our Public Markets segment for the years ended December 31, 2014 and 2013.
Year ended
December 31, 2014
compared to year ended
December 31, 2013
|
|
Year Ended
|
|||||||||||
|
|
December 31, 2014
|
December 31, 2013
|
Change
|
|||||||||
|
|
($ in thousands)
|
|||||||||||
|
Segment Revenues
|
|
|
||||||||||
|
Management, Monitoring and Transaction Fees, Net
|
|
|
|
|
||||||||
|
Management Fees
|
$
|
272,833
|
|
$
|
206,134
|
|
$
|
66,699
|
|
|||
|
Monitoring Fees
|
—
|
|
—
|
|
—
|
|
||||||
|
Transaction Fees
|
27,145
|
|
40,314
|
|
(13,169
|
)
|
||||||
|
Fee Credits
|
(23,357
|
)
|
(29,950
|
)
|
6,593
|
|
||||||
|
Total Management, Monitoring and Transaction Fees, Net
|
276,621
|
|
216,498
|
|
60,123
|
|
||||||
|
Performance Income
|
|
|
|
|
||||||||
|
Realized Incentive Fees
|
47,807
|
|
72,359
|
|
(24,552
|
)
|
||||||
|
Realized Carried Interest
|
34,650
|
|
—
|
|
34,650
|
|
||||||
|
Unrealized Carried Interest
|
40,075
|
|
62,338
|
|
(22,263
|
)
|
||||||
|
Total Performance Income
|
122,532
|
|
134,697
|
|
(12,165
|
)
|
||||||
|
Investment Income (Loss)
|
|
|
|
|
||||||||
|
Net Realized Gains (Losses)
|
—
|
|
—
|
|
—
|
|
||||||
|
Net Unrealized Gains (Losses)
|
—
|
|
—
|
|
—
|
|
||||||
|
Total Realized and Unrealized
|
—
|
|
—
|
|
—
|
|
||||||
|
Interest Income and Dividends
|
—
|
|
—
|
|
—
|
|
||||||
|
Interest Expense
|
—
|
|
—
|
|
—
|
|
||||||
|
Net Interest and Dividends
|
—
|
|
—
|
|
—
|
|
||||||
|
Total Investment Income (Loss)
|
—
|
|
—
|
|
—
|
|
||||||
|
Total Segment Revenues
|
399,153
|
|
351,195
|
|
47,958
|
|
||||||
|
Segment Expenses
|
|
|
|
|
||||||||
|
Compensation and Benefits
|
|
|
|
|
||||||||
|
Cash Compensation and Benefits
|
64,530
|
|
24,696
|
|
39,834
|
|
||||||
|
Realized Performance Income Compensation
|
32,984
|
|
28,944
|
|
4,040
|
|
||||||
|
Unrealized Performance Income Compensation
|
16,029
|
|
24,935
|
|
(8,906
|
)
|
||||||
|
Total Compensation and Benefits
|
113,543
|
|
78,575
|
|
34,968
|
|
||||||
|
Occupancy and related charges
|
7,214
|
|
2,837
|
|
4,377
|
|
||||||
|
Other operating expenses
|
31,501
|
|
36,006
|
|
(4,505
|
)
|
||||||
|
Total Segment Expenses
|
152,258
|
|
117,418
|
|
34,840
|
|
||||||
|
Income (Loss) attributable to noncontrolling interests
|
1,636
|
|
1,560
|
|
76
|
|
||||||
|
Economic Net Income (Loss)
|
$
|
245,259
|
|
$
|
232,217
|
|
$
|
13,042
|
|
|||
|
|
|
|
|
|
||||||||
|
Assets Under Management
|
$
|
42,508,000
|
|
$
|
33,077,400
|
|
$
|
9,430,600
|
|
|||
|
Fee Paying Assets Under Management
|
$
|
38,594,700
|
|
$
|
27,241,200
|
|
$
|
11,353,500
|
|
|||
|
Equity Invested
|
$
|
3,027,400
|
|
$
|
1,553,000
|
|
$
|
1,474,400
|
|
|||
|
Uncalled Commitments
|
$
|
2,841,300
|
|
$
|
2,362,300
|
|
$
|
479,000
|
|
|||
|
Gross Dollars Invested
|
$
|
4,425,600
|
|
$
|
4,213,300
|
|
$
|
212,300
|
|
|||
128
Segment Revenues
Management, Monitoring and Transaction Fees, Net
The net increase was primarily due to an increase in management fees of $66.7 million and a decrease in fee credits of $6.6 million, partially offset by a decrease in transaction fees of $13.2 million. The increase in management fees is due primarily to our acquisition of Avoca on February 19, 2014 and new capital raised, primarily in our special situations strategies, Corporate Capital Trust and our hedge fund of funds platform. These increases were partially offset by a decrease in management fees received from KFN as a result of our acquisition of it on April 30, 2014 as management fees from KFN after that date are eliminated from segment results. The decrease in transaction fees is due primarily to a decrease in the size of fee earning transactions in the current period. The decrease in fee credits is due primarily to the decrease in transaction fees as described above.
Performance Income
This decrease was primarily driven by a decrease in incentive fees of $24.6 million and a lower level of unrealized carried interest of $22.3 million, partially offset by a higher level of realized carried interest of $34.7 million. During the year ended December 31, 2014, we realized $34.7 million of carried interest from two alternative credit accounts. The decrease in incentive fees is due to a decrease in investment income in our hedge funds business and loss of incentive fees received from KFN as a result of our acquisition of it on April 30, 2014, partially offset by an increase in incentive fees received from Avoca following our acquisition of Avoca on February 19, 2014, and Corporate Capital Trust resulting from favorable performance. Incentive fees are typically determined for the twelve‑ month periods ending in either the second or fourth quarters of the calendar year, however, such fees may be determined at other points during the year for certain strategies. Whether an incentive fee from KKR vehicles is payable in any given period, and the amount of an incentive fee payment, if any, depends on the investment performance of the vehicle and as a result are expected to vary significantly from period to period. The decrease in unrealized carried interest was primarily driven by the reversals of previously recognized net unrealized gains for the year ended December 31, 2014, partially offset by an increase in unrealized carried interest across our carry‑earning funds, the most significant of which were in our special situations strategy.
Segment Expenses
Compensation and Benefits
The increase was primarily due to (i) higher compensation expenses relating to Avoca, which was acquired on February 19, 2014, (ii) higher allocations to carry pool driven by the higher levels of net carried interest, as described above and (iii) an increase in compensation and benefits in connection with the increase in fees, which generally results in higher compensation expense. These increases were partially offset by a decrease in compensation associated with incentive fees as a result of the overall decrease in incentive fees of as described above.
Occupancy and Other Operating Expenses
This decrease was due to the net effect of a $9.7 million one‑time expense incurred in connection with the launch of a closed end fund in the 2013 period which was partially offset in the 2014 period by the operating expenses of Avoca, which we acquired on February 19, 2014.
Economic Net Income (Loss)
The increase is primarily attributable to the increase in management fees, which was partially offset by the decrease in performance income and the increase in segment expenses.
129
Assets Under Management
The following table reflects the changes in our Public Markets AUM from
December 31, 2013
to
December 31, 2014
:
|
|
($ in thousands)
|
||
|
December 31, 2013
|
$
|
33,077,400
|
|
|
New Capital Raised
|
7,253,000
|
|
|
|
Acquisitions
|
8,423,000
|
|
|
|
KFN Acquisition
|
(4,511,900
|
)
|
|
|
Distributions
|
(3,967,300
|
)
|
|
|
Redemptions
|
(3,303,900
|
)
|
|
|
Change in Value
|
136,400
|
|
|
|
December 31, 2014 - As Reported
|
$
|
37,106,700
|
|
|
Net AUM of Strategic Partnerships (pro-rata based on ownership interest)
|
2,810,800
|
|
|
|
Capital Commitments Where Fees or Carry are Payable Upon Deployment
|
2,590,500
|
|
|
|
December 31, 2014 - As Adjusted
|
42,508,000
|
|
|
AUM in our Public Markets segment totaled $42.5 billion at December 31, 2014, on an as adjusted basis, an increase of $9.4 billion compared to AUM of $33.1 billion at December 31, 2013. The increase was primarily due to the acquisition of Avoca, which contributed $8.4 billion of AUM, as well as $7.3 billion of new capital raised. These increases were partially offset by the acquisition of KFN, which reduced AUM by $4.5 billion, and $7.3 billion of distributions and redemptions from certain investment vehicles, the most significant of which were from our hedge fund of funds platform and CLOs. In addition, AUM as of December 31, 2014 has been adjusted to include (i) KKR's pro-rata portion of AUM managed by other asset managers in which KKR holds a minority stake and (ii) capital commitments for which we are eligible to receive fees or carried interest upon deployment of capital. These two items increased our AUM by approximately $5.4 billion as of December 31, 2014 but are excluded from AUM as of December 31, 2013.
Fee-Paying Assets Under Management
The following table reflects the changes in our Public Markets FPAUM from
December 31, 2013
to
December 31, 2014
:
|
|
($ in thousands)
|
||
|
December 31, 2013
|
$
|
27,241,200
|
|
|
New Capital Raised
|
6,304,600
|
|
|
|
Acquisitions
|
7,971,000
|
|
|
|
KFN Acquisition
|
(2,684,700
|
)
|
|
|
Distributions
|
(1,929,500
|
)
|
|
|
Redemptions
|
(3,303,900
|
)
|
|
|
Change in Value
|
(424,000
|
)
|
|
|
Other
|
2,609,200
|
|
|
|
December 31, 2014 - As Reported
|
$
|
35,783,900
|
|
|
Net FPAUM of Strategic Partnerships (pro-rata based on ownership interest)
|
2,810,800
|
|
|
|
December 31, 2014 - As Adjusted
|
38,594,700
|
|
|
FPAUM in our Public Markets segment was $35.8 billion at December 31, 2014, on an as adjusted basis, an increase of $8.6 billion compared to FPAUM of $27.2 billion at December 31, 2013. The increase was primarily due to the acquisition of Avoca, which contributed $8.0 billion of FPAUM, $6.3 billion of new capital raised and $2.6 billion of CLOs partially owned by KKR that were not previously included in FPAUM and was not new capital raised during the period (included in Other above). These increases were partially offset by the acquisition of KFN, which reduced FPAUM by $2.7 billion, and $5.2 billion of redemptions and distributions from certain investment vehicles, the most significant of which were from our CLOs and hedge fund of funds platform. In addition, FPAUM has been adjusted to include KKR's pro-rata portion of FPAUM managed by other asset managers in which KKR holds a minority stake. This item increased our AUM by approximately $2.8 billion as of December 31, 2014 but is excluded from FPAUM as of as of December 31, 2013.
Equity Invested
The increase is primarily due to a higher level of net capital deployed, primarily in our special situations and direct lending strategies partially offset by a lower level of capital deployed in our mezzanine strategy.
130
Uncalled Commitments
As of December 31, 2014, our Public Markets segment had $2.8 billion of uncalled capital commitments that could be called for investments in new transactions.
Gross Dollars Invested
The increase is primarily due to a higher level of investment activity in our special situations and direct lending strategies, partially offset by a decrease in investment activity in our mezzanine strategies.
131
Capital Markets Segment
The following tables set forth information regarding the results of operations and certain key operating metrics for our Capital Markets segment for the years ended
December 31, 2015
and
2014
.
Year ended
December 31, 2015
compared to year ended
December 31, 2014
|
|
Year Ended
|
|||||||||||
|
|
December 31, 2015
|
December 31, 2014
|
Change
|
|||||||||
|
|
($ in thousands)
|
|||||||||||
|
Segment Revenues
|
|
|
||||||||||
|
Management, Monitoring and Transaction Fees, Net
|
|
|
|
|
||||||||
|
Management Fees
|
$
|
—
|
|
$
|
—
|
|
$
|
—
|
|
|||
|
Monitoring Fees
|
—
|
|
—
|
|
—
|
|
||||||
|
Transaction Fees
|
191,470
|
|
217,920
|
|
(26,450
|
)
|
||||||
|
Fee Credits
|
—
|
|
—
|
|
—
|
|
||||||
|
Total Management, Monitoring and Transaction Fees, Net
|
191,470
|
|
217,920
|
|
(26,450
|
)
|
||||||
|
Performance Income
|
|
|
|
|
||||||||
|
Realized Incentive Fees
|
—
|
|
—
|
|
—
|
|
||||||
|
Realized Carried Interest
|
—
|
|
—
|
|
—
|
|
||||||
|
Unrealized Carried Interest
|
—
|
|
—
|
|
—
|
|
||||||
|
Total Performance Income
|
—
|
|
—
|
|
—
|
|
||||||
|
Investment Income (Loss)
|
|
|
|
|
||||||||
|
Net Realized Gains (Losses)
|
—
|
|
—
|
|
—
|
|
||||||
|
Net Unrealized Gains (Losses)
|
—
|
|
—
|
|
—
|
|
||||||
|
Total Realized and Unrealized
|
—
|
|
—
|
|
—
|
|
||||||
|
Interest Income and Dividends
|
—
|
|
—
|
|
—
|
|
||||||
|
Interest Expense
|
—
|
|
—
|
|
—
|
|
||||||
|
Net Interest and Dividends
|
—
|
|
—
|
|
—
|
|
||||||
|
Total Investment Income (Loss)
|
—
|
|
—
|
|
—
|
|
||||||
|
Total Segment Revenues
|
191,470
|
|
217,920
|
|
(26,450
|
)
|
||||||
|
Segment Expenses
|
|
|
|
|
||||||||
|
Compensation and Benefits
|
|
|
|
|
||||||||
|
Cash Compensation and Benefits
|
34,562
|
|
41,551
|
|
(6,989
|
)
|
||||||
|
Realized Performance Income Compensation
|
—
|
|
—
|
|
—
|
|
||||||
|
Unrealized Performance Income Compensation
|
—
|
|
—
|
|
—
|
|
||||||
|
Total Compensation and Benefits
|
34,562
|
|
41,551
|
|
(6,989
|
)
|
||||||
|
Occupancy and related charges
|
2,641
|
|
1,523
|
|
1,118
|
|
||||||
|
Other operating expenses
|
14,618
|
|
11,497
|
|
3,121
|
|
||||||
|
Total Segment Expenses
|
51,821
|
|
54,571
|
|
(2,750
|
)
|
||||||
|
Income (Loss) attributable to noncontrolling interests
|
13,103
|
|
11,886
|
|
1,217
|
|
||||||
|
Economic Net Income (Loss)
|
$
|
126,546
|
|
$
|
151,463
|
|
$
|
(24,917
|
)
|
|||
|
Syndicated Capital
|
$
|
868,900
|
|
$
|
2,567,300
|
|
$
|
(1,698,400
|
)
|
|||
Segment Revenues
Management, Monitoring and Transaction Fees, Net
Transaction fees decreased due to a decrease in the number and size of capital markets transactions for the year ended December 31, 2015 compared to the year ended December 31, 2014. Our capital markets business does not generate management or monitoring fees. Overall, we completed 116 capital markets transactions for the year ended December 31, 2015
132
of which 16 represented equity offerings and 100 represented debt offerings, as compared to 139 transactions for the year ended December 31, 2014 of which 15 represented equity offerings and 124 represented debt offerings. We earned fees in connection with underwriting, syndication and other capital markets services. While each of the capital markets transactions that we undertake in this segment is separately negotiated, our fee rates are generally higher with respect to underwriting or syndicating equity offerings than with respect to debt offerings, and the amount of fees that we collect for like transactions generally correlates with overall transaction sizes. Our capital markets fees are sourced from our Private Markets and Public Markets platforms as well as third party companies. For the year ended December 31, 2015 approximately 24% of our transaction fees were earned from third parties as compared to 31% for the year ended December 31, 2014. Our transaction fees are comprised of fees from various geographic regions. For the year ended December 31, 2015 approximately 44% of our transaction fees were sourced outside the United States as compared to approximately 38% for the year ended December 31, 2014. Our capital markets business is dependent on the overall capital markets environment, which is influenced by, among other things, equity prices, credit spreads and volatility.
Segment Expenses
Compensation and Benefits
The decrease was primarily due to a decrease in cash compensation and benefits related to lower transaction fees, which generally results in lower compensation expense.
Occupancy and Other Operating Expenses
The increase was primarily driven by higher allocations of corporate other operating expenses to Capital Markets due to an increase in both the amount of corporate other operating expenses incurred by the firm and to a lesser extent an increase in the proportion of revenue earned by Capital Markets relative to other operating segments in 2015. Additionally, there was a decrease in the amount of operating expenses allocated from Capital Markets to Principal Activities as result of a decrease in the proportion of revenue earned by Principal Activities relative to other operating segments during 2015.
Economic Net Income (Loss)
The decrease is primarily attributable to the decrease in transaction fees as described above
Syndicated Capital
The decrease is primarily due to a decrease in the size of syndication transactions in the year ended December 31, 2015 as compared to the year ended December 31, 2014. The 2014 amounts included the syndication of equity in First Data Corporation of approximately $1.8 billion. Overall, we completed 10 syndication transactions for the year ended December 31, 2015 as compared to 8 syndication transactions for the year ended December 31, 2014.
133
The following tables set forth information regarding the results of operations and certain key operating metrics for our Capital Markets segment for the years ended December 31, 2014 and 2013.
Year ended
December 31, 2014
compared to year ended
December 31, 2013
|
|
Year Ended
|
|||||||||||
|
|
December 31, 2014
|
December 31, 2013
|
Change
|
|||||||||
|
|
($ in thousands)
|
|||||||||||
|
Segment Revenues
|
|
|
||||||||||
|
Management, Monitoring and Transaction Fees, Net
|
|
|
|
|
||||||||
|
Management Fees
|
$
|
—
|
|
$
|
—
|
|
$
|
—
|
|
|||
|
Monitoring Fees
|
—
|
|
—
|
|
—
|
|
||||||
|
Transaction Fees
|
217,920
|
|
146,254
|
|
71,666
|
|
||||||
|
Fee Credits
|
—
|
|
—
|
|
—
|
|
||||||
|
Total Management, Monitoring and Transaction Fees, Net
|
217,920
|
|
146,254
|
|
71,666
|
|
||||||
|
Performance Income
|
|
|
|
|
||||||||
|
Realized Incentive Fees
|
—
|
|
—
|
|
—
|
|
||||||
|
Realized Carried Interest
|
—
|
|
—
|
|
—
|
|
||||||
|
Unrealized Carried Interest
|
—
|
|
—
|
|
—
|
|
||||||
|
Total Performance Income
|
—
|
|
—
|
|
—
|
|
||||||
|
Investment Income (Loss)
|
|
|
|
|
||||||||
|
Net Realized Gains (Losses)
|
—
|
|
—
|
|
—
|
|
||||||
|
Net Unrealized Gains (Losses)
|
—
|
|
—
|
|
—
|
|
||||||
|
Total Realized and Unrealized
|
—
|
|
—
|
|
—
|
|
||||||
|
Interest Income and Dividends
|
—
|
|
—
|
|
—
|
|
||||||
|
Interest Expense
|
—
|
|
—
|
|
—
|
|
||||||
|
Net Interest and Dividends
|
—
|
|
—
|
|
—
|
|
||||||
|
Total Investment Income (Loss)
|
—
|
|
—
|
|
—
|
|
||||||
|
Total Segment Revenues
|
217,920
|
|
146,254
|
|
71,666
|
|
||||||
|
Segment Expenses
|
|
|
|
|
||||||||
|
Compensation and Benefits
|
|
|
|
|
||||||||
|
Cash Compensation and Benefits
|
41,551
|
|
31,118
|
|
10,433
|
|
||||||
|
Realized Performance Income Compensation
|
—
|
|
—
|
|
—
|
|
||||||
|
Unrealized Performance Income Compensation
|
—
|
|
—
|
|
—
|
|
||||||
|
Total Compensation and Benefits
|
41,551
|
|
31,118
|
|
10,433
|
|
||||||
|
Occupancy and related charges
|
1,523
|
|
877
|
|
646
|
|
||||||
|
Other operating expenses
|
11,497
|
|
9,698
|
|
1,799
|
|
||||||
|
Total Segment Expenses
|
54,571
|
|
41,693
|
|
12,878
|
|
||||||
|
Income (Loss) attributable to noncontrolling interests
|
11,886
|
|
3,329
|
|
8,557
|
|
||||||
|
Economic Net Income (Loss)
|
$
|
151,463
|
|
$
|
101,232
|
|
$
|
50,231
|
|
|||
|
Syndicated Capital
|
$
|
2,567,300
|
|
$
|
1,112,100
|
|
$
|
1,455,200
|
|
|||
Segment Revenues
Management, Monitoring and Transaction Fees, Net
Transaction fees increased primarily due to an increase in the size of capital markets transactions in the year ended December 31, 2014 compared to the year ended December 31, 2013, including syndication fees received from First Data Corporation of approximately $43 million in the third quarter of 2014. Our capital markets business does not generate management or monitoring fees. Overall, we completed 139 capital markets transactions for the year ended December 31, 2014 of which 15 represented equity offerings and 124 represented debt offerings, as compared to 128 transactions for the year ended
134
December 31, 2013 of which 16 represented equity offerings and 112 represented debt offerings. We earned fees in connection with underwriting, syndication and other capital markets services. While each of the capital markets transactions that we undertake in this segment is separately negotiated, our fee rates are generally higher with respect to underwriting or syndicating equity offerings than with respect to debt offerings, and the amount of fees that we collect for like transactions generally correlates with overall transaction sizes. Our capital markets fees are sourced from our Private Markets and Public Markets platforms as well as third party companies. For the years ended December 31, 2014 approximately 31% of our transaction fees were earned from third parties, as compared to 29% for the year ended December 31, 2013. Our transaction fees are comprised of fees from various global regions. For the year ended December 31, 2014 approximately 38% of our transaction fees were sourced internationally as compared to approximately 30% for the year ended December 31, 2013. Our capital markets business is dependent on the overall capital markets environment, which is influenced by equity prices, credit spreads and volatility.
Segment Expenses
Compensation and Benefits
The increase was primarily due to an increase in cash compensation and benefits related to higher fees, which generally results in higher compensation expense, and to a lesser extent increased headcount.
Occupancy and Other Operating Expenses
This increase was primarily driven by an increase in professional fees in connection with the higher overall level of capital markets transaction activity.
Economic Net Income (Loss)
The increase is primarily attributable to the increase in transaction fees, partially offset by the increase in compensation and benefits, described above.
Syndicated Capital
The increase is primarily due to an increase in the size of syndication transactions when compared to year ended December 31, 2013, which included the syndication of equity in First Data Corporation of approximately $1.8 billion in the third quarter of 2014. Overall, we completed 8 syndication transactions for the year ended December 31, 2014 as compared to 10 syndication transactions for the year ended December 31, 2013.
135
Principal Activities Segment
The following tables set forth information regarding the results of operations for our Principal Activities segment for the years ended
December 31, 2015
and
2014
.
Year ended
December 31, 2015
compared to year ended
December 31, 2014
|
|
Year Ended
|
|||||||||||
|
|
December 31, 2015
|
December 31, 2014
|
Change
|
|||||||||
|
|
($ in thousands)
|
|||||||||||
|
Segment Revenues
|
|
|
||||||||||
|
Management, Monitoring and Transaction Fees, Net
|
|
|
|
|
||||||||
|
Management Fees
|
$
|
—
|
|
$
|
—
|
|
$
|
—
|
|
|||
|
Monitoring Fees
|
—
|
|
—
|
|
—
|
|
||||||
|
Transaction Fees
|
—
|
|
—
|
|
—
|
|
||||||
|
Fee Credits
|
—
|
|
—
|
|
—
|
|
||||||
|
Total Management, Monitoring and Transaction Fees, Net
|
—
|
|
—
|
|
—
|
|
||||||
|
Performance Income
|
|
|
|
|
||||||||
|
Realized Incentive Fees
|
—
|
|
—
|
|
—
|
|
||||||
|
Realized Carried Interest
|
—
|
|
—
|
|
—
|
|
||||||
|
Unrealized Carried Interest
|
—
|
|
—
|
|
—
|
|
||||||
|
Total Performance Income
|
—
|
|
—
|
|
—
|
|
||||||
|
Investment Income (Loss)
|
|
|
|
|
||||||||
|
Net Realized Gains (Losses)
|
337,023
|
|
628,403
|
|
(291,380
|
)
|
||||||
|
Net Unrealized Gains (Losses)
|
(391,962
|
)
|
(396,425
|
)
|
4,463
|
|
||||||
|
Total Realized and Unrealized
|
(54,939
|
)
|
231,978
|
|
(286,917
|
)
|
||||||
|
Interest Income and Dividends
|
411,536
|
|
408,084
|
|
3,452
|
|
||||||
|
Interest Expense
|
(203,085
|
)
|
(134,909
|
)
|
(68,176
|
)
|
||||||
|
Net Interest and Dividends
|
208,451
|
|
273,175
|
|
(64,724
|
)
|
||||||
|
Total Investment Income (Loss)
|
153,512
|
|
505,153
|
|
(351,641
|
)
|
||||||
|
Total Segment Revenues
|
153,512
|
|
505,153
|
|
(351,641
|
)
|
||||||
|
Segment Expenses
|
|
|
|
|
||||||||
|
Compensation and Benefits
|
|
|
|
|
||||||||
|
Cash Compensation and Benefits
|
107,572
|
|
121,161
|
|
(13,589
|
)
|
||||||
|
Realized Performance Income Compensation
|
—
|
|
—
|
|
—
|
|
||||||
|
Unrealized Performance Income Compensation
|
—
|
|
—
|
|
—
|
|
||||||
|
Total Compensation and Benefits
|
107,572
|
|
121,161
|
|
(13,589
|
)
|
||||||
|
Occupancy and related charges
|
16,568
|
|
18,104
|
|
(1,536
|
)
|
||||||
|
Other operating expenses
|
50,573
|
|
60,673
|
|
(10,100
|
)
|
||||||
|
Total Segment Expenses
|
174,713
|
|
199,938
|
|
(25,225
|
)
|
||||||
|
Income (Loss) attributable to noncontrolling interests
|
—
|
|
—
|
|
—
|
|
||||||
|
Economic Net Income (Loss)
|
$
|
(21,201
|
)
|
$
|
305,215
|
|
$
|
(326,416
|
)
|
|||
136
Segment Revenues
Investment Income
The net decrease is primarily due to a decrease in total realized and unrealized gains of $286.9 million, as well as a decrease in net interest and dividends of $64.7 million.
For the year ended December 31, 2015, net realized gains were comprised primarily of gains from the sale of private equity investments, generally held through or alongside our funds, including the sales or partial sales of Walgreens Boots Alliance, Inc., The Nielsen Company B.V. (NYSE: NLSN), Zimmer Biomet Holdings, Inc. and Kion GmbH (XETRA: KGX). These realized gains were partially offset by realized losses on the sale or write off of other private equity investments, generally held through or alongside our funds, including the write-off of Energy Future Holdings. Realized investment losses from balance sheet investments that were already written down as of October 1, 2009 that have been excluded from net realized gains (losses) above related to Energy Future Holdings and amounted to approximately $100 million for the year ended December 31, 2015. Net unrealized losses were primarily attributable to (i) the reversal of gains on sales of private equity investments noted in the realized gains commentary above and (ii) overall reductions in value of our investments in CLOs, energy investments in working interests in oil and gas producing properties and special situations investments. A decrease in the value of our CLO portfolio was experienced in each quarter of 2015 and was due primarily to a decrease in the market value of underlying collateral as well as a reduction in overall market prices for these securities. With respect to our energy portfolio, a decrease in value was experienced in three of four quarters during 2015 and is due primarily to a drop in long‑term oil, condensate, natural gas liquids, and natural gas prices during the year ended December 31, 2015. Offsetting these unrealized losses were unrealized gains resulting from increases in value of various investments, most notably First Data Corporation, Walgreens Boots Alliance, Inc. and WMI Holdings Corp. (NASDAQ: WMIH), as well as the reversal of unrealized losses related to the write-off of Energy Future Holdings, Corp. Subsequent to December 31, 2015, the value of First Data Corporation has declined sharply. See "--Business Environment". Additionally, subsequent to December 31, 2015, we expect to write-off our investment in Samson Resources once our losses become realized. Since this investment has already been written down to zero value in periods prior to December 31, 2015, this write-off is not expected to have a significant impact on our economic net income in future periods. However, this write-off could reduce our cash earnings by approximately $250 million.
As of December 31, 2015, we held $96.6 million of investments in CLOs that are not held for investment purposes and are carried at cost. For the year ended December 31, 2015, the unrealized loss relating to changes in fair value for these investments in CLOs was $7.6 million. Prior to the quarter ended September 30, 2015, all CLOs were carried at fair value.
For the year ended December 31, 2014, net realized gains were comprised primarily of gains from the sale of private equity investments, generally held through or alongside our funds, including the sales or partial sales of HCA, Inc., NXP Semiconductors N.V. and The Nielsen Company B.V. Net unrealized losses are primarily related to (i) the reversal of gains on sales of private equity investments noted in the realized gains commentary above, (ii) declines in value of various investments in working interests in oil and gas producing properties, (iii) a decline in value for Samson Resources, (iv) overall reductions in value of our investments in CLOs, driven primarily by a decrease in the market value of underlying collateral and (v) a decline in value of investments in specialty finance companies. For the year ended December 31, 2014, mark-to-market unrealized losses reflected in net unrealized losses relating to our energy investments in working interests in oil and gas producing properties were approximately $149 million, the majority of which occurred in the fourth quarter of 2014 primarily as a result of a decline in oil and gas prices. These unrealized losses and reversals of gains upon realization events were partially offset by unrealized gains resulting from increases in value of various private equity investments including First Data Corporation, Alliance Boots GmbH and Biomet, Inc.
For the year ended December 31, 2015, interest income and dividends were comprised of (i) $316.5 million of interest income which consists primarily of interest that is received from interest yielding CLOs and credit investments and, to a lesser extent, from our cash balances and other assets and (ii) $95.0 million of dividend income received primarily from distributions received through our investment funds and other assets. For the year ended December 31, 2014, interest income and dividends were comprised of (i) $241.7 million of interest income which consists primarily of interest that is received from interest yielding CLOs and credit investments and, to a lesser extent, from our cash balances and other assets and (ii) $166.4 million of dividend income received primarily from distributions received through our investment funds and other assets, including approximately $84 million received from our energy investments in working interests in oil and gas producing properties. The increase from the prior period is primarily due to more significant levels of investments in interest yielding CLOs and credit investments, which were largely offset by a decrease in dividend income from our private equity and energy investments portfolio.
137
The increase in interest expense is primarily due to our 2044 Senior Notes issued on May 29, 2014 and an additional issuance of such notes on March 18, 2015, as well as the debt obligations of KFN acquired on April 30, 2014 which did not contribute to our interest expense for the first four months of 2014.
Segment Expenses
Compensation and Benefits
The decrease was primarily due to a decrease in the amount of compensation and benefits expenses allocated from the other operating segments to Principal Activities, as well as a lower amount of corporate compensation allocated to Principal Activities, in each case as a result of a decrease in the proportion of revenue earned by Principal Activities relative to other operating segments during 2015. Partially offsetting these decreases was an increase in the aggregate compensation and benefits expense in our other operating segments that are allocable to the Principal Activities segment. See “-Segment Analysis-Private Markets”, “-Segment Analysis-Public Markets” and “-Segment Analysis-Capital Markets” for additional information regarding the compensation and benefit expenses of these other segments, and “-Segment Analysis" for a discussion of expense allocations among segments.
Occupancy and Other Operating Expenses
The decrease was primarily driven by a decrease in the amount of occupancy and other operating expenses allocated from the other operating segments as a result of a decrease in the proportion of revenue earned by Principal Activities relative to other operating segments during 2015.
Economic Net Income (Loss)
The decrease is primarily attributable to the decrease in investment income as described above.
138
The following tables set forth information regarding the results of operations for our Principal Activities segment for the years ended
December 31, 2014
and 2013.
Year ended
December 31, 2014
compared to year ended
December 31, 2013
|
|
Year Ended
|
|||||||||||
|
|
December 31, 2014
|
December 31, 2013
|
Change
|
|||||||||
|
|
($ in thousands)
|
|||||||||||
|
Segment Revenues
|
|
|
||||||||||
|
Management, Monitoring and Transaction Fees, Net
|
|
|
|
|
||||||||
|
Management Fees
|
$
|
—
|
|
$
|
—
|
|
$
|
—
|
|
|||
|
Monitoring Fees
|
—
|
|
—
|
|
—
|
|
||||||
|
Transaction Fees
|
—
|
|
—
|
|
—
|
|
||||||
|
Fee Credits
|
—
|
|
—
|
|
—
|
|
||||||
|
Total Management, Monitoring and Transaction Fees, Net
|
—
|
|
—
|
|
—
|
|
||||||
|
Performance Income
|
|
|
|
|
||||||||
|
Realized Incentive Fees
|
—
|
|
—
|
|
—
|
|
||||||
|
Realized Carried Interest
|
—
|
|
—
|
|
—
|
|
||||||
|
Unrealized Carried Interest
|
—
|
|
—
|
|
—
|
|
||||||
|
Total Performance Income
|
—
|
|
—
|
|
—
|
|
||||||
|
Investment Income (Loss)
|
|
|
|
|
||||||||
|
Net Realized Gains (Losses)
|
628,403
|
|
635,633
|
|
(7,230
|
)
|
||||||
|
Net Unrealized Gains (Losses)
|
(396,425
|
)
|
301,262
|
|
(697,687
|
)
|
||||||
|
Total Realized and Unrealized
|
231,978
|
|
936,895
|
|
(704,917
|
)
|
||||||
|
Interest Income and Dividends
|
408,084
|
|
87,168
|
|
320,916
|
|
||||||
|
Interest Expense
|
(134,909
|
)
|
(65,662
|
)
|
(69,247
|
)
|
||||||
|
Net Interest and Dividends
|
273,175
|
|
21,506
|
|
251,669
|
|
||||||
|
Total Investment Income (Loss)
|
505,153
|
|
958,401
|
|
(453,248
|
)
|
||||||
|
Total Segment Revenues
|
505,153
|
|
958,401
|
|
(453,248
|
)
|
||||||
|
Segment Expenses
|
|
|
|
|
||||||||
|
Compensation and Benefits
|
|
|
|
|
||||||||
|
Cash Compensation and Benefits
|
121,161
|
|
110,457
|
|
10,704
|
|
||||||
|
Realized Performance Income Compensation
|
—
|
|
—
|
|
—
|
|
||||||
|
Unrealized Performance Income Compensation
|
—
|
|
—
|
|
—
|
|
||||||
|
Total Compensation and Benefits
|
121,161
|
|
110,457
|
|
10,704
|
|
||||||
|
Occupancy and related charges
|
18,104
|
|
20,844
|
|
(2,740
|
)
|
||||||
|
Other operating expenses
|
60,673
|
|
63,262
|
|
(2,589
|
)
|
||||||
|
Total Segment Expenses
|
199,938
|
|
194,563
|
|
5,375
|
|
||||||
|
Income (Loss) attributable to noncontrolling interests
|
—
|
|
—
|
|
—
|
|
||||||
|
Economic Net Income (Loss)
|
$
|
305,215
|
|
$
|
763,838
|
|
$
|
(458,623
|
)
|
|||
139
Segment Revenues
Investment Income
The net decrease is primarily due to a decrease in total realized and unrealized gains of $704.9 million, which were partially offset by an increase in net interest and dividends of $251.7 million.
For the year ended December 31, 2014, net realized gains were comprised primarily of gains from the sale of private equity investments, generally held through or alongside our funds, including the sales or partial sales of HCA, Inc., NXP Semiconductors N.V. and The Nielsen Company B.V. Net unrealized losses are primarily related to (i) the reversal of gains on sales of private equity investments noted in the realized gains commentary above, (ii) declines in value of various investments in working interests in oil and gas producing properties, (iii) a decline in value for Samson Resources, (iv) overall reductions in value of our investments in CLOs, driven primarily by a decrease in the market value of underlying collateral and (v) a decline in value of investments in specialty finance companies. For the year ended December 31, 2014, mark-to-market unrealized losses reflected in net unrealized losses relating to our energy investments in working interests in oil and gas producing properties were approximately $149 million, the majority of which occurred in the fourth quarter of 2014 primarily as a result of a decline in oil prices. These unrealized losses and reversals of gains upon realization events were partially offset by unrealized gains resulting from increases in value of various private equity investments including First Data Corporation, Alliance Boots GmbH and Biomet, Inc.
For the year ended December 31, 2013, net realized gains were comprised primarily of realized gains from the sales or partial sales of private equity investments, generally held through or alongside our funds, the most significant of which were HCA, Inc., Dollar General Corporation, NXP Semiconductors N.V. and Intelligence, Ltd. These realized gains were partially offset by realized losses primarily related to the sale or write-off of private equity investments, generally held through or alongside our funds, including the write-off of PagesJaunes Group. Realized investment losses from balance sheet investments that were already written down as of October 1, 2009 that have been excluded from net realized gains (losses) above amounted to approximately $205 million for the year ended December 31, 2013. The net unrealized gains related primarily to increases in the value of various private equity investments, most notably HCA, Inc., ProSiebenSat.1 Media AG and Alliance Boots GmbH, partially offset by unrealized losses relating to our investment in Samson Resources, as well as reversals of unrealized gains primarily in connection with the sales of the investments noted in the realized gains commentary above.
For the year ended December 31, 2014, interest income and dividends were comprised of (i) $241.7 million of interest income which consisted primarily of interest that was received from interest yielding CLOs and credit investments and, to a lesser extent, from our cash balances and other assets and (ii) $166.4 million of dividend income received primarily from distributions received through our investment funds and other assets, including approximately $84 million received from our energy investments in working interests in oil and gas producing properties. For the year ended December 31, 2013, interest income and dividends were comprised of (i) $41.2 million of interest income which consists primarily of interest received on our cash balances and (ii) $46.0 million of dividend income received primarily from distributions received through our investment funds and other assets. The increase from the prior period is primarily due to an increase in dividend income in our private equity and energy investments portfolio as well as more significant levels of investments in interest yielding CLOs and credit investments as a result of our acquisition of KFN on April 30, 2014 and to a lesser extent our acquisition of Avoca on February 19, 2014.
The increase in interest expense is primarily due to our 2044 Senior Notes issued on May 29, 2014 as well as interest expense relating to debt obligations at KFN subsequent to KKR’s acquisition of it on April 30, 2014.
Segment Expenses
Compensation and Benefits
The increase was primarily due to (i) an increase in cash compensation and benefits incurred directly by the Principal Activities segment and (ii) an increase in the aggregate compensation and benefits expense in our other operating segments that are allocable to the Principal Activities segment. See commentary for these operating segments in “-Segment Analysis-Private Markets”, “-Segment Analysis-Public Markets” and “-Segment Analysis-Capital Markets”. These increases were partially offset by a decrease in the amount of compensation and benefits expenses allocated from the other operating segments as a result of a decrease in the proportion of revenue earned by Principal Activities relative to other operating segments during 2014.
140
Occupancy and Other Operating Expenses
The decrease was primarily driven by a decrease in the amount of occupancy and other operating expenses allocated from the other operating segments as a result of a decrease in the proportion of revenue earned by Principal Activities relative to other operating segments during 2014. This decrease was partially offset by an increase in occupancy and other operating expenses incurred directly by the Principal Activities segment.
Economic Net Income (Loss)
The decrease is primarily attributable to the decrease in investment income, described above.
Segment Balance Sheet
Our segment balance sheet is the balance sheet of KKR & Co. L.P. and its subsidiaries on a segment basis which include, but are not limited to, our investment management companies, broker-dealer companies, general partners of our investment funds and KFN. Our segment balance sheet excludes the assets and liabilities of our investment funds and CFEs.
Investments
Investments is a term used solely for purposes of financial presentation of a portion of KKR's balance sheet and includes majority investments in subsidiaries that operate KKR's asset management and other businesses, including the general partner interests of KKR's investment funds.
Cash and Short-Term Investments
Cash and short-term investments represent cash and liquid short-term investments in high-grade, short-duration cash management strategies used by KKR to generate additional yield on our excess liquidity and is used by management in evaluating KKR's liquidity position. We believe this measure is useful to unitholders as it provides additional insight into KKR's available liquidity. Cash and short-term investments differ from cash and cash equivalents on a GAAP basis as a result of the inclusion of liquid short-term investments in cash and short-term investments. The impact that these liquid short-term investments have on cash and cash equivalents on a GAAP basis is reflected in the consolidated statements of cash flows within cash flows from operating activities. Accordingly, the exclusion of these investments from cash and cash equivalents on a GAAP basis has no impact on cash provided (used) by operating activities, investing activities or financing activities. As of
December 31, 2015
, we had cash and short-term investments on a segment basis of approximately
$1.3 billion
. Excluding approximately
$0.2 billion
of liquid short-term investments, cash and short-term investments may be reconciled to cash and cash equivalents of approximately $1.0 billion as of
December 31, 2015
.
141
The following tables present our segment balance sheet as of
December 31, 2015
and
December 31, 2014
:
|
As of
|
As of
|
|||||||
|
|
December 31, 2015
|
December 31, 2014
|
||||||
|
|
($ in thousands, except per unit amounts)
|
|||||||
|
Cash and short-term investments
|
$
|
1,287,650
|
|
$
|
1,121,385
|
|
||
|
Investments
|
8,958,089
|
|
9,807,606
|
|
||||
|
Unrealized carry (a)
|
1,415,478
|
|
1,283,022
|
|
||||
|
Other assets
|
1,613,139
|
|
999,654
|
|
||||
|
Corporate Real Estate
|
154,942
|
|
—
|
|
||||
|
Total assets
|
$
|
13,429,298
|
|
$
|
13,211,667
|
|
||
|
Debt obligations - KKR (ex-KFN)
|
$
|
2,000,000
|
|
$
|
1,527,000
|
|
||
|
Debt obligations - KFN
|
657,310
|
|
657,310
|
|
||||
|
Preferred shares - KFN
|
373,750
|
|
373,750
|
|
||||
|
Other liabilities
|
291,537
|
|
413,808
|
|
||||
|
Total liabilities
|
3,322,597
|
|
2,971,868
|
|
||||
|
Noncontrolling interests
|
127,472
|
|
121,574
|
|
||||
|
Book Value
|
$
|
9,979,229
|
|
$
|
10,118,225
|
|
||
|
Book Value Per Outstanding Adjusted Unit
|
$
|
12.18
|
|
$
|
12.48
|
|
||
|
Book Value Per Adjusted Unit
|
$
|
11.78
|
|
$
|
12.07
|
|
||
|
(a)
Unrealized Carry
|
|
|
|
|
||||
|
Private Markets
|
$
|
1,340,556
|
|
$
|
1,196,633
|
|
||
|
Public Markets
|
74,922
|
|
86,389
|
|
||||
|
Total
|
$
|
1,415,478
|
|
$
|
1,283,022
|
|
||
The following table presents our most significant investments based on their fair market value as of December 31, 2015.
|
As of December 31, 2015
|
|||||||
|
($ in thousands)
|
|||||||
|
Significant Investments:
|
Fair
Value
|
Fair Value as a
Percentage of Total Investments |
|||||
|
First Data Corporation (NYSE: FDC)
|
$
|
1,266,196
|
|
14.1
|
%
|
||
|
Walgreens Boots Alliance (NASDAQ: WBA)
|
748,688
|
|
8.4
|
%
|
|||
|
WMI Holdings Corp. (NASDAQ: WMIH)
|
311,270
|
|
3.5
|
%
|
|||
|
Oil & Gas Royalties Investment
|
173,800
|
|
1.9
|
%
|
|||
|
HCA Holdings, Inc. (NYSE: HCA)
|
169,332
|
|
1.9
|
%
|
|||
|
Total Significant Investments
|
2,669,286
|
|
29.8
|
%
|
|||
|
Other Investments
|
6,288,803
|
|
70.2
|
%
|
|||
|
Total Investments
|
$
|
8,958,089
|
|
100.0
|
%
|
||
142
The following tables provide reconciliations of KKR’s GAAP Common Units Outstanding - Basic to Adjusted Units and KKR & Co. L.P. Partners’ Capital to Book Value:
|
|
As of
|
|
|
|
December 31, 2015
|
|
|
GAAP Common Units Outstanding - Basic
|
457,834,875
|
|
|
Adjustments:
|
|
|
|
Unvested Common Units (a)
|
23,212,300
|
|
|
Other Exchangeable Securities (b)
|
4,689,610
|
|
|
GAAP Common Units Outstanding - Diluted
|
485,736,785
|
|
|
Adjustments:
|
|
|
|
KKR Holdings Units (c)
|
361,346,588
|
|
|
Adjusted Units
|
847,083,373
|
|
|
Adjustments:
|
||
|
Unvested Common Units and Unvested Other Exchangeable Securities
|
(24,060,289
|
)
|
|
Adjusted Units Eligible for Distribution
|
823,023,084
|
|
|
Adjustments:
|
||
|
Vested Other Exchangeable Securities (b)
|
(3,841,621
|
)
|
|
Outstanding Adjusted Units
|
819,181,463
|
|
|
(a)
|
Represents equity awards granted under the Equity Incentive Plan. The issuance of common units of KKR & Co. L.P. pursuant to awards under the Equity Incentive Plan dilutes KKR common unitholders and KKR Holdings pro rata in accordance with their respective percentage interests in the KKR business.
|
|
(b)
|
Represents securities in a subsidiary of a KKR Group Partnership and of KKR & Co. L.P. that are exchangeable into KKR & Co. L.P. common units issued in connection with the acquisition of Avoca.
|
|
(c)
|
Common units that may be issued by KKR & Co. L.P. upon exchange of units in KKR Holdings L.P. for KKR common units.
|
|
|
As of
|
||
|
($ in thousands, except per unit amounts)
|
December 31, 2015
|
||
|
KKR & Co. L.P. Partners’ Capital
|
$
|
5,547,182
|
|
|
|
|
|
|
|
Noncontrolling interests held by KKR Holdings L.P.
|
4,347,153
|
|
|
|
|
|
|
|
|
Equity impact of KKR Management Holdings Corp. and other
|
84,894
|
|
|
|
|
|
|
|
|
Book Value
|
$
|
9,979,229
|
|
Liquidity
We manage our liquidity and capital requirements by focusing on our cash flows before the consolidation of our funds and CFEs and the effect of changes in short term assets and liabilities, which we anticipate will be settled for cash within one year. Our primary cash flow activities on a segment basis typically involve: (i) generating cash flow from operations; (ii) generating income from investment activities, by investing in investments that generate yield (namely interest and dividends) as well as the sale of investments and other assets; (iii) funding capital commitments that we have made to our funds and CLOs, (iv) developing and funding new investment strategies, investment products and other growth initiatives, including acquisitions; (v) underwriting and funding commitments in our capital markets business; (vi) distributing cash flow to our fund investors, unitholders and certain holders of certain exchangeable securities; and (vii) borrowings, interest payments and repayments under credit agreements, our senior notes and other borrowing arrangements. As of
December 31, 2015
, we had cash and short-term investments on a segment basis of
$1.3 billion
. See "-Liquidity - Liquidity Needs - Distributions."
Sources of Liquidity
Our primary sources of liquidity consist of amounts received from: (i) our operating activities, including the fees earned from our funds, managed accounts, portfolio companies, and capital markets transactions; (ii) realizations on carried interest from our investment funds; (iii) interest and dividends from investments that generate yield, including our investments in CLOs; (iv) realizations on and sales of investments and other assets; and (v) borrowings under our credit facilities, debt offerings and other borrowing arrangements. In addition, we may generate cash proceeds from sales of equity securities.
143
With respect to our private equity funds, carried interest is distributed to the general partner of a private equity fund with a clawback or net loss sharing provision only after all of the following are met: (i) a realization event has occurred (e.g., sale of a portfolio company, dividend, etc.); (ii) the vehicle has achieved positive overall investment returns since its inception, in excess of performance hurdles where applicable; and (iii) with respect to investments with a fair value below cost, cost has been returned to fund investors in an amount sufficient to reduce remaining cost to the investments' fair value. As of
December 31, 2015
, certain of our funds had met the first and second criteria, as described above, but did not meet the third criteria. In these cases, carried interest accrues on the consolidated statement of operations, but will not be distributed in cash to us as the general partner of an investment fund upon a realization event. For a fund that has a fair value above cost, overall, but has one or more investments where fair value is below cost, the shortfall between cost and fair value for such investments is referred to as a "netting hole." When netting holes are present, realized gains on individual investments that would otherwise allow the general partner to receive carried interest distributions are instead used to return invested capital to our funds' limited partners in an amount equal to the netting hole. Once netting holes have been filled with either (a) return of capital equal to the netting hole for those investments where fair value is below cost, or (b) increases in the fair value of those investments where fair value is below cost, then realized carried interest will be distributed to the general partner upon a realization event. A fund that is in a position to pay cash carry refers to a fund for which carried interest is expected to be paid to the general partner upon the next material realization event, which includes funds with no netting holes as well as funds with a netting hole that is sufficiently small in size such that the next material realization event would be expected to result in the payment of carried interest.
As of
December 31, 2015
, netting holes in excess of $50 million existed at four of our private equity funds, the most significant of which were our North America Fund XI, European Fund II and European Fund III which had netting holes of approximately $232 million, $213 million and $87 million, respectively. In accordance with the criteria set forth above, funds may develop netting holes in the future and netting holes for those and other funds may otherwise increase or decrease in the future.
We have access to funding under various credit facilities and other borrowing arrangements that we have entered into with major financial institutions or which we receive from the capital markets. For a full discussion of the principal terms of these sources of funding, see Note 9 “Debt Obligations” of our financial statements included elsewhere in this report. The following describes other sources of liquidity.
KFN Securities
In addition to the sources of funding described in Note 9 “Debt Obligations” of our financial statements included elsewhere in this report, KFN has the following issuance of preferred stock.
|
•
|
On January 17, 2013, KFN issued 14.95 million of Series A LLC Preferred Shares (the "KFN Preferred Shares") at a price of $25 per share. The KFN Preferred Shares trade on the NYSE under the ticker symbol "KFN.PR" and began trading on January 28, 2013. Distributions on the KFN Preferred Shares are cumulative and are payable by KFN, when, as, and if declared by KFN's board of directors, quarterly on January 15, April 15, July 15 and October 15 of each year at a rate per annum equal to 7.375%. Unless distributions have been declared and paid or declared and set apart for payment on the KFN Preferred Shares for the then-current quarterly distribution period and all past quarterly distribution periods, subject to certain exceptions, KFN may not declare or pay or set apart payment for distributions on KFN's common shares or other junior shares, including payments to KKR. If KFN experiences a dissolution event, then the holders of the KFN Preferred Shares outstanding at such time will be entitled to receive a payment out of KFN's assets available for distribution to such holders equal to the sum of the $25 liquidation preference per KFN Preferred Share and accumulated and unpaid distributions (whether or not declared), if any, to, but excluding, the date of the dissolution event (the "Series A Liquidation Value"), to the extent that KFN has sufficient gross income (excluding any gross income attributable to the sale or exchange of capital assets) in the year of the dissolution event and in the prior years in which the KFN Preferred Shares have been outstanding to ensure that each holder of KFN Preferred Shares will have a capital account balance equal to the Series A Liquidation Value. The KFN Preferred Shares are not convertible into shares of any other class or series of the KFN's shares. Except under limited circumstances relating to an event of default in the payment of distributions, holders of the KFN Preferred Shares have no voting rights. At any time or from time to time on or after January 15, 2018, KFN may, at its option, redeem the KFN Preferred Shares, in whole or in part, upon not less than 30 nor more than 60 days' notice, at a price of $25 per KFN Preferred Share plus accumulated and unpaid distributions (whether or not declared), if any, to, but excluding, the redemption date, if any. Holders of the KFN Preferred Shares have no right to require the redemption of the KFN Preferred Shares.
|
144
Common Units
|
•
|
On May 16, 2014, KKR & Co. L.P. filed a registration statement with the Securities and Exchange Commission for the sale by us from time to time of up to 5,000,000 common units of KKR & Co. L.P. to generate cash proceeds (a) up to (1) the amount of withholding taxes, social benefit payments or similar payments payable by us in respect of awards granted pursuant to the Equity Incentive Plan, the KKR Financial Holdings LLC 2007 Share Incentive Plan (the "KFN Share Incentive Plan") and the KKR Asset Management LLC 2011 Share Incentive Plan (the "KAM Share Incentive Plan"), and together with the Equity Incentive Plan and the KFN Share Incentive Plan, the "Plans", and (2) the amount of cash delivered in respect of awards granted pursuant to the Plans that are settled in cash instead of common units; and (b) to the extent the net proceeds from the sale of common units exceeds the amounts due under clause (a), for general corporate purposes. The administrator of the Equity Incentive Plan is expected to reduce the maximum number of common units eligible to be issued under the Equity Incentive Plan by the number of common units issued and sold pursuant to this Registration Statement, as applicable, unless such reduction is already provided for with respect to such awards under the terms of the Equity Incentive Plan. The KFN Share Incentive Plan terminated in May 2015, but continues to govern unexpired awards. No additional equity awards will be issued under the KFN Share Incentive Plan or the KAM Share Incentive Plan. The Securities and Exchange Commission declared the registration statement effective on June 4, 2014. As of
December 31, 2015
, 4,173,039 common units have been issued and sold under the registration statement and are included in our basic common units outstanding as of
December 31, 2015
. In the quarter ended December 31, 2015, we canceled 1.7 million granted equity awards for approximately $27 million to satisfy tax obligations in connection with their vesting. As of February 22, 2015, there are no equity awards withheld for tax obligations.
|
Liquidity Needs
We expect that our primary liquidity needs will consist of cash required to:
|
•
|
continue to grow our business, including seeding new strategies and funding our capital commitments made to existing and future funds, co-investments and any net capital requirements of our capital markets companies;
|
|
•
|
warehouse investments in portfolio companies or other investments for the benefit of one or more of our funds, vehicles, accounts or CLOs pending the contribution of committed capital by the investors in such vehicles;
|
|
•
|
service debt obligations, as well as any contingent liabilities that may give rise to future cash payments;
|
|
•
|
fund cash operating expenses and amounts recorded for litigation matters;
|
|
•
|
pay amounts that may become due under our tax receivable agreement with KKR Holdings;
|
|
•
|
make cash distributions in accordance with our distribution policy;
|
|
•
|
underwrite commitments within our capital markets business;
|
|
•
|
fund our equity commitment to joint ventures such as Merchant Capital Solutions LLC;
|
|
•
|
make future purchase price payments in connection with our proprietary acquisitions or investments, such as our acquisition of Prisma and strategic partnerships with Nephila and Marshall Wace;
|
|
•
|
acquire additional principal assets, including other businesses and corporate real estate; and
|
|
•
|
repurchase KKR & Co. L.P. common units pursuant to the unit repurchase program announced on October 27, 2015.
|
145
KKR & Co. L.P. Unit Repurchase Program
On October 27, 2015, KKR announced the authorization of a program providing for the repurchase by KKR of up to $500 million in the aggregate of its outstanding common units. Under this unit repurchase program, units may be repurchased from time to time in open market transactions, in privately negotiated transactions or otherwise. The timing, manner, price and amount of any unit repurchases will be determined by KKR in its discretion and will depend on a variety of factors, including legal requirements, price and economic and market conditions. KKR expects that the program, which has no expiration date, will be in effect until the maximum approved dollar amount has been used to repurchase common units. The program does not require KKR to repurchase any specific number of common units, and the program may be suspended, extended, modified or discontinued at any time. Since inception of the unit repurchase program through December 31, 2015, KKR has repurchased and canceled approximately
9.9 million
of outstanding common units for approximately $161.9 million. From December 31, 2015 through February 11, 2016, KKR has repurchased and canceled approximately 7.6 million of outstanding common units for approximately $108.1 million. For additional information regarding units repurchased since the inception of this program see "Item 5--Market for Registrant's Common Equity, Related Stockholder Matters and Issuer Purchases of Equity Securities."
Capital Commitments
The agreements governing our active investment funds generally require the general partners of the funds to make minimum capital commitments to such funds, which usually range from 2% to 5% of a fund's total capital commitments at final closing, but may be greater for certain funds pursuing newer strategies. In addition, we are responsible for certain limited partner interests in some of our private equity funds. The following table presents our uncalled commitments to our active investment funds as of
December 31, 2015
:
|
Uncalled
Commitments
|
|||
|
Private Markets
|
($ in thousands)
|
||
|
European Fund IV
|
$
|
184,700
|
|
|
Energy Income and Growth Fund
|
147,100
|
|
|
|
Global Infrastructure Investors II
|
110,900
|
|
|
|
North America Fund XI
|
100,500
|
|
|
|
Real Estate Partners Americas
|
97,300
|
|
|
|
European Fund III
|
66,300
|
|
|
|
Real Estate Partners Europe
|
64,700
|
|
|
|
Asian Fund II
|
50,900
|
|
|
|
2006 Fund
|
22,700
|
|
|
|
Co-Investment Vehicles
|
69,600
|
|
|
|
Other Private Markets Funds
|
10,600
|
|
|
|
Total Private Markets Commitments
|
925,300
|
|
|
|
|
|
|
|
|
Public Markets
|
|
|
|
|
Special Situations Fund
|
14,900
|
|
|
|
Special Situations Fund II
|
195,100
|
|
|
|
Mezzanine Fund
|
6,500
|
|
|
|
Lending Partners
|
13,900
|
|
|
|
Lending Partners II
|
33,300
|
|
|
|
Lending Partners Europe
|
39,600
|
|
|
|
Other Alternative Credit Vehicles
|
125,200
|
|
|
|
Total Public Markets Commitments
|
428,500
|
|
|
|
|
|
|
|
|
Total Uncalled Commitments
|
$
|
1,353,800
|
|
As of
December 31, 2015
, KKR had unfunded commitments consisting of (i)
$1,353.8 million
, as shown above, to its active private equity and other investment vehicles, (ii)
$191.1 million
in connection with commitments by KKR's capital markets business, (iii)
$128.6 million
relating to Merchant Capital Solutions as described below and (iv) other investment
146
commitments of
$171.6 million
. Whether these amounts are actually funded, in whole or in part depends on the terms of such commitments, including the satisfaction or waiver of any conditions to funding.
Prisma Capital Partners
On October 1, 2012, KKR acquired all of the equity interests of Prisma subject to potential purchase price payments in 2014 and 2017. KKR may become obligated to make future purchase price payments in 2017 based on whether the Prisma business grows to achieve certain operating performance metrics when measured in such year. KKR has the right in its sole discretion to pay a portion of such future purchase price payment, if any, in KKR & Co. L.P. common units rather than in cash. See "—Liquidity—Contractual Obligations, Commitments and Contingencies on an Unconsolidated Basis."
Merchant Capital Solutions
Merchant Capital Solutions LLC (MCS, formerly known as MerchCap Solutions LLC) is a joint venture partnership with Stone Point Capital. MCS seeks to provide capital markets services to mid-market and sponsor-backed companies as well as make certain balance sheet investments to support client needs. As of
December 31, 2015
each of KKR and Stone Point have committed $150 million of equity to MCS to support its business for total equity commitments of $300 million. KKR's remaining unfunded commitment is approximately
$128.6 million
as of
December 31, 2015
. KKR expects that certain capital markets activities for third parties (other than KKR and its portfolio companies) will be principally conducted by MCS.
Investment in Marshall Wace LLP
On November 2, 2015, KKR entered into a long-term strategic relationship with Marshall Wace LLP and its affiliates ("Marshall Wace") and acquired a 24.9% interest in Marshall Wace through a combination of cash and common units. KKR and Marshall Wace have the option to grow KKR's ownership interest over time to 39.9%, which would require the use of cash and/or KKR common units. KKR's investment in Marshall Wace is accounted for using the equity method of accounting.
Tax Receivable Agreement
We and certain intermediate holding companies that are taxable corporations for U.S. federal, state and local income tax purposes, may be required to acquire KKR Group Partnership Units from time to time pursuant to our exchange agreement with KKR Holdings. KKR Management Holdings L.P. made an election under Section 754 of the Internal Revenue Code that will remain in effect for each taxable year in which an exchange of KKR Group Partnership Units for common units occurs, which may result in an increase in our intermediate holding companies' share of the tax basis of the assets of the KKR Group Partnerships at the time of an exchange of KKR Group Partnership Units. Certain of these exchanges are expected to result in an increase in our intermediate holding companies' share of the tax basis of the tangible and intangible assets of the KKR Group Partnerships, primarily attributable to a portion of the goodwill inherent in our business that would not otherwise have been available. This increase in tax basis may increase depreciation and amortization deductions for tax purposes and therefore reduce the amount of income tax our intermediate holding companies would otherwise be required to pay in the future. This increase in tax basis may also decrease gain (or increase loss) on future dispositions of certain capital assets to the extent tax basis is allocated to those capital assets.
We have entered into a tax receivable agreement with KKR Holdings, which requires our intermediate holding companies to pay to KKR Holdings, or to current and former principals who have exchanged KKR Holdings units for KKR common units as transferees of KKR Group Partnership Units, 85% of the amount of cash savings, if any, in U.S. federal, state and local income tax that the intermediate holding companies realize as a result of the increase in tax basis described above, as well as 85% of the amount of any such savings the intermediate holding companies realize as a result of increases in tax basis that arise due to future payments under the agreement. We expect our intermediate holding companies to benefit from the remaining 15% of cash savings, if any, in income tax that they realize. A termination of the agreement or a change of control could give rise to similar payments based on tax savings that we would be deemed to realize in connection with such events. In the event that other of our current or future subsidiaries become taxable as corporations and acquire KKR Group Partnership Units in the future, or if we become taxable as a corporation for U.S. federal income tax purposes, we expect that each will become subject to a tax receivable agreement with substantially similar terms.
These payment obligations are obligations of our intermediate holding companies and not the KKR Group Partnerships. As such, cash payments received by common unitholders may vary from those received by holders of KKR Group Partnership Units held by KKR Holdings and its current and former principals to the extent payments are made to those parties under the tax receivable agreement. Payments made under the tax receivable agreement are required to be made within 90 days of the
147
filing of the tax returns of our intermediate holding companies, which may result in a timing difference between the tax savings received by KKR's intermediate holdings companies and the cash payments made to the selling holders of KKR Group Partnership Units.
For the years ended December 31, 2015, 2014 and 2013, cash payments that have been made under the tax receivable agreement were
$5.7 million
, $5.7 million and $4.7 million, respectively. We expect our intermediate holding companies to benefit from the remaining 15% of cash savings, if any, in income tax that they realize. As of December 31, 2015,
$3.4 million
of cumulative income tax savings have been realized. See "-Liquidity-Other Liquidity Needs- Contractual Obligations, Commitments and Contingencies" for a discussion of amounts payable and cumulative cash payments made under this agreement.
Distributions
On October 27, 2015, KKR announced a change to its distribution policy effective beginning with the distribution declared on February 11, 2016 with respect to the quarter ending December 31, 2015. Under the new distribution policy, KKR intends to make equal quarterly distributions to holders of its common units in an amount of $0.16 per common unit per quarter. KKR's regular distribution per common unit of $0.16 was declared on February 11, 2016 for the quarter ended December 31, 2015.
The declaration and payment of any distributions are subject to the discretion of the board of directors of the general partner of KKR & Co. L.P., which may change the distribution policy at any time, and the terms of its limited partnership agreement. There can be no assurance that distributions will be made as intended or at all, that unitholders will receive sufficient distributions to satisfy payment of their tax liabilities as limited partners of KKR & Co. L.P. or that any particular distribution policy will be maintained. When KKR & Co. L.P. receives distributions from the KKR Group Partnerships (the holding companies of the KKR business), KKR Holdings receives its pro rata share of such distributions from the KKR Group Partnerships. Furthermore, the declaration and payment of distributions is subject to legal, contractual and regulatory restrictions on the payment of distributions by us or our subsidiaries, including restrictions contained in our debt agreements, and such other factors as the board of directors of our Managing Partner considers relevant.
148
Cash Earnings
The following table presents our cash earnings and distributions for the year ended
December 31, 2015
,
2014
and 2013 as described above. For a discussion of the components that drove the changes in our cash earnings, see “—Segment Analysis.”
|
|
Year Ended
|
|||||||||||
|
($ in thousands except per unit data)
|
December 31, 2015
|
December 31, 2014
|
December 31, 2013
|
|||||||||
|
Cash Revenues
|
||||||||||||
|
Fees
|
$
|
1,142,050
|
|
$
|
1,098,843
|
|
$
|
955,971
|
|
|||
|
Realized performance income (loss)
|
1,046,801
|
|
1,241,468
|
|
762,386
|
|
||||||
|
Net realized investment income (loss)
|
545,474
|
|
(1)
|
901,578
|
|
657,139
|
|
|||||
|
Total Cash Revenues
|
2,734,325
|
|
3,241,889
|
|
2,375,496
|
|
||||||
|
Cash Expenses
|
||||||||||||
|
Cash compensation and benefits
|
409,992
|
|
380,581
|
|
314,828
|
|
||||||
|
Realized performance income compensation
|
418,718
|
|
496,589
|
|
304,955
|
|
||||||
|
Occupancy and related charges
|
62,657
|
|
57,787
|
|
56,327
|
|
||||||
|
Other operating expenses
|
233,618
|
|
229,069
|
|
215,883
|
|
||||||
|
Total Cash Expenses
|
1,124,985
|
|
1,164,026
|
|
891,993
|
|
||||||
|
Cash Earnings Before Noncontrolling Interests and Local Taxes
|
1,609,340
|
|
2,077,863
|
|
1,483,503
|
|
||||||
|
Less: Corporate and local income taxes paid
|
(140,677
|
)
|
(131,081
|
)
|
(120,052
|
)
|
||||||
|
Less: Noncontrolling interests
|
(16,007
|
)
|
(14,946
|
)
|
(6,387
|
)
|
||||||
|
Cash Earnings
|
$
|
1,452,656
|
|
$
|
1,931,836
|
|
$
|
1,357,064
|
|
|||
|
Cash Earnings Per Adjusted Units Eligible for Distribution
|
$
|
1.78
|
|
$
|
2.47
|
|
$
|
1.97
|
|
|||
|
|
|
|||||||||||
|
Distribution Per KKR & Co LP common unit
|
$
|
1.39
|
|
$
|
1.90
|
|
$
|
1.40
|
|
|||
|
(1)
Amount includes a $100.0 million realized loss on a segment basis relating to the write off of Energy Future Holdings which had previously been marked at zero on an unrealized basis. Accordingly, this write off had no impact on our Economic Net Income during the year ended December 31, 2015.
|
||||||||||||
Fee Related Earnings (“FRE”)
Fee related earnings is comprised of (i) total management, monitoring and transaction fees, net, less (ii) cash compensation and benefits, occupancy and related charges and other operating expenses that have not been allocated to our Principal Activities segment. Fee related earnings is a measure of the operating earnings of KKR and its business segments before performance income, related performance income compensation and investment income. KKR believes this measure is useful to unitholders as it provides additional insight into the operating profitability of KKR's fee generating management companies and capital markets businesses. Our calculation of FRE as described above differs from our calculation of FRE for periods prior to September 30, 2015 in that the above calculation (a) excludes incentive fees and related compensation and (b) excludes expenses that have been allocated to our Principal Activities segment. For a discussion of the changes in the components of FRE, see "--Segment Analysis."
149
A reconciliation of Net Income (Loss) Attributable to KKR & Co. L.P. on a GAAP basis to ENI and FRE is provided below.
|
|
Year Ended
|
|||||||||||
|
|
December 31, 2015
|
December 31, 2014
|
December 31, 2013
|
|||||||||
|
|
($ in thousands)
|
|||||||||||
|
Net income (loss) attributable to KKR & Co. L.P.
|
$
|
488,482
|
|
$
|
477,611
|
|
$
|
691,226
|
|
|||
|
Plus: Net income (loss) attributable to noncontrolling
interests held by KKR Holdings L.P. |
433,693
|
|
585,135
|
|
1,056,126
|
|
||||||
|
Plus: Non-cash equity-based charges
|
261,579
|
|
310,403
|
|
307,514
|
|
||||||
|
Plus: Amortization of intangibles and other, net
|
47,599
|
|
290,348
|
|
102,789
|
|
||||||
|
Plus: Income tax (benefit)
|
66,636
|
|
63,669
|
|
37,926
|
|
||||||
|
Economic Net Income (Loss)
|
1,297,989
|
|
1,727,166
|
|
2,195,581
|
|
||||||
|
Plus: Income attributable to segment noncontrolling interests
|
16,007
|
|
14,946
|
|
6,387
|
|
||||||
|
Less: Total investment income (loss)
|
153,512
|
|
505,153
|
|
958,401
|
|
||||||
|
Less: Net performance income (loss)
|
724,701
|
|
805,553
|
|
874,634
|
|
||||||
|
Plus: Expenses of Principal Activities Segment
|
174,713
|
|
199,938
|
|
194,563
|
|
||||||
|
Fee Related Earnings
|
610,496
|
|
631,344
|
|
563,496
|
|
||||||
Other Liquidity Needs
We may also be required to fund various underwriting commitments in our capital markets business in connection with the underwriting of loans, securities or other financial instruments. We generally expect that these commitments will be syndicated to third parties or otherwise fulfilled or terminated, although we may in some instances elect to retain a portion of the commitments for our own investment.
Contractual Obligations, Commitments and Contingencies on an Unconsolidated Basis
In the ordinary course of business, we enter into contractual arrangements that may require future cash payments. The following table sets forth information relating to anticipated future cash payments as of
December 31, 2015
on an unconsolidated basis before the consolidation of funds and CFEs:
|
|
Payments due by Period
|
|||||||||||||||||||
|
Types of Contractual Obligations
|
<1 Year
|
1-3 Years
|
3-5 Years
|
>5 Years
|
Total
|
|||||||||||||||
|
|
($ in millions)
|
|||||||||||||||||||
|
Uncalled commitments to investment funds (1)
|
$
|
1,353.8
|
|
$
|
—
|
|
$
|
—
|
|
$
|
—
|
|
$
|
1,353.8
|
|
|||||
|
Debt payment obligations (2)
|
—
|
|
—
|
|
500.0
|
|
2,157.3
|
|
2,657.3
|
|
||||||||||
|
Interest obligations on debt (3)
|
155.3
|
|
298.4
|
|
298.4
|
|
2,592.8
|
|
3,344.9
|
|
||||||||||
|
Underwriting commitments (4)
|
126.2
|
|
—
|
|
—
|
|
—
|
|
126.2
|
|
||||||||||
|
Lending commitments (5)
|
64.9
|
|
—
|
|
—
|
|
—
|
|
64.9
|
|
||||||||||
|
Other commitments (6)
|
252.6
|
|
45.1
|
|
—
|
|
2.5
|
|
300.2
|
|
||||||||||
|
Lease obligations
|
53.0
|
|
91.5
|
|
77.7
|
|
23.6
|
|
245.8
|
|
||||||||||
|
Corporate real estate (7)
|
—
|
|
—
|
|
292.5
|
|
—
|
|
292.5
|
|
||||||||||
|
Total
|
$
|
2,005.8
|
|
$
|
435.0
|
|
$
|
1,168.6
|
|
$
|
4,776.2
|
|
$
|
8,385.6
|
|
|||||
|
(1)
|
These uncalled commitments represent amounts committed by us to fund a portion of the purchase price paid for each investment made by our investment funds which are actively investing. Because capital contributions are due on demand, the above commitments have been presented as falling due within one year. However, given the size of such commitments and the rates at which our investment funds make investments, we expect that the capital commitments presented above will be called over a period of several years. See "—Liquidity—Liquidity Needs."
|
|
(2)
|
Represents the 2020 Senior Notes, 2043 Senior Notes, 2044 Senior Notes, KFN 2041 Senior Notes, KFN 2042 Senior Notes, KFN Junior Subordinated Notes and any borrowings outstanding on the Corporate Credit Agreement and KCM Credit Agreement which are presented gross of unamortized discounts and net of unamortized premiums. KFN's debt obligations are non-recourse to KKR beyond the assets of KFN.
|
|
(3)
|
These interest obligations on debt represent estimated interest to be paid over the maturity of the related debt obligation, which has been calculated assuming the debt outstanding at
December 31, 2015
is not repaid until its maturity. Future
|
150
interest rates are assumed to be those in effect as of
December 31, 2015
, including both variable and fixed rates, as applicable, provided for by the relevant debt agreements. The amounts presented above include accrued interest on outstanding indebtedness.
|
(4)
|
Represents various commitments in our capital markets business in connection with the underwriting of loans, securities and other financial instruments. These commitments are shown net of amounts syndicated.
|
|
(5)
|
Represents obligations in our capital markets business to lend under various revolving credit facilities.
|
|
(6)
|
Represents our commitment to MCS and investment commitments of KFN. See "—Liquidity—Liquidity Needs—Merchant Capital Solutions."
|
|
(7)
|
Represents the purchase price due upon delivery of a new KKR office being constructed, all or a portion of which represents construction financing obtained by the developer and may be refinanced upon delivery of the completed office.
|
The commitment table above excludes contractual amounts owed under the tax receivable agreement, because the ultimate amount and timing of the amounts due are not presently known. As of
December 31, 2015
, a payable of
$128.0 million
has been recorded in due to affiliates in the consolidated financial statements representing management's best estimate of the amounts currently expected to be owed under the tax receivable agreement. As of
December 31, 2015
, approximately
$19.0 million
of cumulative cash payments have been made under the tax receivable agreement. See "—Liquidity Needs—Tax Receivable Agreement."
The commitment table above excludes certain contingent consideration payments that may be owed in connection with acquisitions and other investments because the ultimate amounts due are not presently known. As of
December 31, 2015
, the recorded amount of contingent consideration obligations where the amounts are not currently known was approximately
$46.6 million
.
In the normal course of business, we enter into contracts that contain a variety of representations and warranties that provide general indemnifications. In addition, certain of our consolidated funds and KFN have provided certain indemnities relating to environmental and other matters and have provided nonrecourse carve-out guarantees for fraud, willful misconduct and other customary wrongful acts, each in connection with the financing of certain real estate investments that we have made. Our maximum exposure under these arrangements is unknown as this would involve future claims that may be made against us that have not yet occurred. However, based on prior experience, we expect the risk of material loss to be low.
The partnership documents governing our carry-paying funds, including funds and vehicles relating to private equity, mezzanine, infrastructure, energy, direct lending and special situations investments, generally include a "clawback" provision that, if triggered, may give rise to a contingent obligation requiring the general partner to return amounts to the fund for distribution to the fund investors at the end of the life of the fund. Under a clawback obligation, upon the liquidation of a fund, the general partner is required to return, typically on an after-tax basis, previously distributed carry to the extent that, due to the diminished performance of later investments, the aggregate amount of carry distributions received by the general partner during the term of the fund exceed the amount to which the general partner was ultimately entitled, including the effects of any performance thresholds. Excluding carried interest received by the general partners of funds that were not contributed to us in the KPE Transaction, as of
December 31, 2015
, no carried interest was subject to this clawback obligation, assuming that all applicable carry paying funds were liquidated at their
December 31, 2015
fair values. Had the investments in such funds been liquidated at zero value, the clawback obligation would have been
$2,423.4 million
. Carried interest is recognized in the statement of operations based on the contractual conditions set forth in the agreements governing the fund as if the fund were terminated and liquidated at the reporting date and the fund's investments were realized at the then estimated fair values. Amounts earned pursuant to carried interest are earned by the general partner of those funds to the extent that cumulative investment returns are positive and where applicable, preferred return thresholds have been met. If these investment amounts earned decrease or turn negative in subsequent periods, recognized carried interest will be reversed and to the extent that the aggregate amount of carry distributions received by the general partner during the term of the fund exceed the amount to which the general partner was ultimately entitled, a clawback obligation would be recorded. For funds that are consolidated, this clawback obligation, if any, is reflected as an increase in noncontrolling interests in the consolidated statements of financial condition. For funds that are not consolidated, this clawback obligation, if any, is reflected as a reduction of our investment balance as this is where carried interest is initially recorded.
Certain private equity funds that were contributed to us in the KPE Transaction in 2009 also include a "net loss sharing provision." Upon the liquidation of an investment vehicle to which a net loss sharing obligation applies, the general partner is
151
required to contribute capital to the vehicle, to fund 20% of the net losses on investments. In these vehicles, such losses would be required to be paid by us to the fund investors in those vehicles in the event of a liquidation of the fund regardless of whether any carried interest had previously been distributed, and a greater share of investment losses would be allocable to us relative to the capital that we contributed to it as general partner. Based on the fair market values as of
December 31, 2015
, there would have been no net loss sharing obligation. If the vehicles were liquidated at zero value, the net loss sharing obligation would have been zero as of
December 31, 2015
.
Prior to the KPE Transaction in 2009, certain principals who received carried interest distributions with respect to certain private equity funds contributed to us had personally guaranteed, on a several basis and subject to a cap, the contingent obligations of the general partners of such private equity funds to repay amounts to fund investors pursuant to the general partners' clawback obligations. The terms of the KPE Transaction require that principals remain responsible for any clawback obligations relating to carry distributions received prior to the KPE Transaction, up to a maximum of
$223.6 million
. Through investment realizations, KKR's potential exposure has been reduced to
$159.7 million
as of
December 31, 2015
. Using valuations as of
December 31, 2015
, no amounts are due with respect to the clawback obligation required to be funded by principals. Carry distributions arising subsequent to the KPE Transaction may give rise to clawback obligations that may be allocated generally to us and to persons who participate in the carry pool. Unlike the clawback obligation, we will be responsible for amounts due under a net loss sharing obligation and will indemnify principals for any personal guarantees that they have provided with respect to such amounts. In addition, guarantees of or similar arrangements relating to clawback or net loss sharing obligations in favor of third party investors in an individual investment partnership by entities we own may limit distributions of carried interest more generally.
Contractual Obligations, Commitments and Contingencies on a Consolidated Basis
In the ordinary course of business, we and our consolidated funds and CFEs enter into contractual arrangements that may require future cash payments. The following table sets forth information relating to anticipated future cash payments as of
December 31, 2015
. This table differs from the table presented above which sets forth contractual commitments on an unconsolidated basis principally because this table includes the obligations of our consolidated funds and CFEs.
|
|
Payments due by Period
|
|||||||||||||||||||
|
Types of Contractual Obligations
|
<1 Year
|
1-3 Years
|
3-5 Years
|
>5 Years
|
Total
|
|||||||||||||||
|
|
($ in millions)
|
|||||||||||||||||||
|
Uncalled commitments to investment funds (1)
|
$
|
25,142.0
|
|
$
|
—
|
|
$
|
—
|
|
$
|
—
|
|
$
|
25,142.0
|
|
|||||
|
Debt payment obligations (2)
|
1,512.1
|
|
1,594.9
|
|
1,392.8
|
|
14,314.0
|
|
18,813.8
|
|
||||||||||
|
Interest obligations on debt (3)
|
614.8
|
|
1,091.3
|
|
1,044.8
|
|
4,168.7
|
|
6,919.6
|
|
||||||||||
|
Underwriting commitments (4)
|
126.2
|
|
—
|
|
—
|
|
—
|
|
126.2
|
|
||||||||||
|
Lending commitments (5)
|
64.9
|
|
—
|
|
—
|
|
—
|
|
64.9
|
|
||||||||||
|
Other commitments (6)
|
252.6
|
|
45.1
|
|
—
|
|
2.5
|
|
300.2
|
|
||||||||||
|
Lease obligations
|
53.0
|
|
91.5
|
|
77.7
|
|
23.6
|
|
245.8
|
|
||||||||||
|
Corporate real estate (7)
|
—
|
|
—
|
|
292.5
|
|
—
|
|
292.5
|
|
||||||||||
|
Total
|
$
|
27,765.6
|
|
$
|
2,822.8
|
|
$
|
2,807.8
|
|
$
|
18,508.8
|
|
$
|
51,905.0
|
|
|||||
|
(1)
|
These uncalled commitments represent amounts committed by our consolidated investment funds, which include amounts committed by KKR and our fund investors, to fund the purchase price paid for each investment made by our investment funds which are actively investing. Because capital contributions are due on demand, the above commitments have been presented as falling due within one year. However, given the size of such commitments and the rates at which our investment funds make investments, we expect that the capital commitments presented above will be called over a period of several years. See "—Liquidity—Liquidity Needs."
|
|
(2)
|
Amounts include (i) the 2020 Senior Notes, 2043 Senior Notes and 2044 Senior Notes of $2.0 billion gross of unamortized discount, (ii) KFN 2041 Senior Notes and KFN 2042 Senior Notes of $0.4 billion, net of unamortized premium, (iii) KFN Junior Subordinated Notes of $0.3 billion, gross of unamortized discount, (iv) financing arrangements entered into by our consolidated funds with the objective of providing liquidity to the funds of $3.6 billion, (v) debt securities issued by our consolidated CLOs of $8.2 billion, (vi) debt securities issued by our consolidated CMBS entities of $4.3 billion and any borrowings outstanding on the Corporate Credit Agreement and KCM Credit Agreement. KFN's debt obligations are non-recourse to KKR beyond the assets of KFN. Debt securities issued by consolidated CLOs and CMBS entities are supported solely by the investments held at the CLO and CMBS vehicles and are not collateralized by assets of any other KKR entity. Obligations under financing arrangements entered into by our consolidated funds are generally limited to our pro-rata equity interest in such funds. Our management companies bear no obligations to repay any financing arrangements at our consolidated funds.
|
152
|
(3)
|
These interest obligations on debt represent estimated interest to be paid over the maturity of the related debt obligation, which has been calculated assuming the debt outstanding at
December 31, 2015
is not repaid until its maturity. Future interest rates are assumed to be those in effect as of
December 31, 2015
, including both variable and fixed rates, as applicable, provided for by the relevant debt agreements. The amounts presented above include accrued interest on outstanding indebtedness.
|
|
(4)
|
Represents various commitments in our capital markets business in connection with the underwriting of loans, securities and other financial instruments. These commitments are shown net of amounts syndicated.
|
|
(5)
|
Represents obligations in our capital markets business to lend under various revolving credit facilities.
|
|
(6)
|
Represents our commitment to MCS and investment commitments of KFN. See "—Liquidity—Liquidity Needs—Merchant Capital Solutions."
|
|
(7)
|
Represents the purchase price due upon delivery of a new KKR office being constructed, all or a portion of which represents construction financing obtained by the developer and may be refinanced upon delivery of the completed office.
|
The commitment table above excludes contractual amounts owed under the tax receivable agreement because the ultimate amount and timing of the amounts due are not presently known. As of
December 31, 2015
, a payable of
$128.0 million
has been recorded in due to affiliates in the consolidated financial statements representing management's best estimate of the amounts currently expected to be owed under the tax receivable agreement. As of
December 31, 2015
, approximately
$19.0 million
of cumulative cash payments have been made under the tax receivable agreement. See "—Liquidity Needs—Tax Receivable Agreement."
The commitment table above excludes certain contingent consideration payments that may be owed in connection with acquisitions and other investments because the ultimate amounts due are not presently known. As of
December 31, 2015
, the recorded amount of contingent consideration obligations where the amounts are not currently known was approximately
$46.6 million
.
Off Balance Sheet Arrangements
Other than contractual commitments and other legal contingencies incurred in the normal course of our business, we do not have any off-balance sheet financings or liabilities.
The accompanying consolidated statements of cash flows include the cash flows of our consolidated entities which, in particular, include our consolidated funds and CFEs notwithstanding the fact that we may hold only a minority economic interest in those funds and CFEs. The assets of our consolidated funds and CFEs, on a gross basis, are substantially larger than the assets of our business and, accordingly, have a substantial effect on the cash flows reflected in our consolidated statements of cash flows. The primary cash flow activities of our consolidated funds and CFEs involve: (i) capital contributions from fund investors; (ii) using the capital of fund investors to make investments; (iii) financing certain investments with indebtedness; (iv) generating cash flows through the realization of investments; and (v) distributing cash flows from the realization of investments to fund investors. Because our consolidated funds and CFEs are treated as investment companies for accounting purposes, certain of these cash flow amounts are included in our cash flows from operations.
Net Cash Provided by (Used in) Operating Activities
Our net cash provided by (used in) operating activities was $0.4 billion, $1.5 billion and $2.6 billion during the years ended December 31, 2015, 2014 and 2013, respectively. These amounts primarily included: (i) proceeds from sales of investments and principal payments net of purchases of investments by our funds and CFEs of $(0.7) billion, $1.0 billion and $1.4 billion during the years ended December 31, 2015, 2014 and 2013, respectively; (ii) net realized gains (losses) on investments of $3.0 billion, $5.4 billion and $3.9 billion during the years ended December 31, 2015, 2014 and 2013, respectively; and (iii) change in unrealized gains (losses) on investments of $1.7 billion, $(0.7) billion and $3.9 billion during the years ended December 31, 2015, 2014 and 2013, respectively. Certain KKR funds and CFEs are, for GAAP purposes, investment companies and reflect their investments and other financial instruments at fair value.
153
Net Cash Provided by (Used in) Investing Activities
Our net cash provided by (used in) investing activities was $(425.2) million, $(22.9) million and $15.5 million during the years ended December 31, 2015, 2014 and 2013, respectively. Our investing activities included: (i) a change in restricted cash and cash equivalents (that primarily funds collateral requirements) of $(164.6) million, $(10.8) million and $29.9 million during the years ended December 31, 2015, 2014 and 2013, respectively; (ii) the purchases of fixed assets of $(169.4) million, $(12.2) million and $(14.4) million during the years ended December 31, 2015, 2014 and 2013, respectively; (iii) proceeds from sales of oil and natural gas properties, net of development of oil and natural gas properties of $(91.1) million and $(151.4) million for the years ended December 31, 2015 and 2014, respectively; and (iv) net of cash acquired of $151.5 million for the year ended December 31, 2014.
Net Cash Provided by (Used in) Financing Activities
Our net cash provided by (used in) financing activities was $169.4 million, $(1.9) billion and $(2.5) billion during the years ended December 31, 2015, 2014 and 2013, respectively. Our financing activities primarily included: (i) distributions to, net of contributions by our noncontrolling and redeemable noncontrolling interests, of $(7.0) billion, $(2.7) billion and $(2.9) billion during the years ended December 31, 2015, 2014 and 2013, respectively; (ii) proceeds received net of repayment of debt obligations of $8.1 billion, $1.7 billion and $0.8 billion during the years ended December 31, 2015, 2014 and 2013, respectively; and (iii) distributions to our partners of $(706.6) million, $(785.0) million and $(431.6) million during the years ended December 31, 2015, 2014 and 2013, respectively.
154
Critical Accounting Policies
The preparation of our consolidated financial statements in accordance with GAAP requires our management to make estimates and judgments that affect the reported amounts of assets and liabilities, disclosure of contingent assets and liabilities, and reported amounts of fees, expenses and investment income. Our management bases these estimates and judgments on available information, historical experience and other assumptions that we believe are reasonable under the circumstances. However, these estimates, judgments and assumptions are often subjective and may be impacted negatively based on changing circumstances or changes in our analyses. If actual amounts are ultimately different from those estimated, judged or assumed, revisions are included in the consolidated financial statements in the period in which the actual amounts become known. We believe our critical accounting policies could potentially produce materially different results if we were to change underlying estimates, judgments or assumptions.
The following discussion details certain of our critical accounting policies. For a full discussion of all critical accounting policies, please see the notes to the consolidated financial statements "--Item 8. Financial Statements and Supplementary Data--Summary of Significant Accounting Policies."
Fair Value Measurements
Investments and other financial instruments are measured and carried at fair value. The majority of investments and other financial instruments are held by the consolidated funds and vehicles. KKR's funds are, for GAAP purposes, investment companies and reflect their investments and other financial instruments at fair value. KKR has retained the specialized accounting for the consolidated funds and vehicles in consolidation. Accordingly, the unrealized gains and losses resulting from changes in fair value of the investments held by KKR's funds are reflected as a component of Net Gains (Losses) from Investment Activities in the consolidated statements of operations.
For investments and other financial instruments that are not held in a consolidated fund or vehicle, KKR has elected the fair value option since these investments and other financial instruments are similar to those in the consolidated funds and vehicles. Such election is irrevocable and is applied on an investment by investment basis at initial recognition. Unrealized gains and losses resulting from changes in fair value are reflected as a component of Net Gains (Losses) from Investment Activities in the consolidated statements of operations. The methodology for measuring the fair value of such investments and other financial instruments is consistent with the methodologies applied to investments and other financial instruments that are held in consolidated funds and vehicles. In addition, KKR has elected the fair value option for the investments and debt obligations of consolidated CFEs.
The carrying amounts of Other Assets, Accounts Payable, Accrued Expenses and Other Liabilities recognized on the consolidated statements of financial condition (excluding fixed assets, goodwill, intangible assets, oil and gas assets, net, contingent consideration and certain debt obligations) approximate fair value due to their short term maturities. Further information on Fixed Assets is presented in Note 7, "Other Assets and Accounts Payable, Accrued Expenses and Other Liabilities". Further information on Goodwill and Intangible Assets is presented in Note 16 "Goodwill and Intangible Assets." Further information on contingent consideration is presented in Note 14 "Acquisitions." Further information on KKR's debt obligations is presented in Note 9, "Debt Obligations".
Fair value is the price that would be received to sell an asset or paid to transfer a liability in an orderly transaction between market participants at the measurement date. Where available, fair value is based on observable market prices or parameters or derived from such prices or parameters. Where observable prices or inputs are not available, valuation techniques are applied. These valuation techniques involve varying levels of management estimation and judgment, the degree of which is dependent on a variety of factors. See Note 5, "Fair Value Measurements" for further information on KKR's valuation techniques that involve unobservable inputs. Assets and liabilities recorded at fair value in the statements of financial condition are categorized based upon the level of judgment associated with the inputs used to measure their value. Hierarchical levels, as defined under GAAP, are directly related to the amount of subjectivity associated with the inputs to the valuation of these assets and liabilities. The hierarchical levels defined under GAAP are as follows:
Level I
Inputs are unadjusted, quoted prices in active markets for identical assets or liabilities at the measurement date. The type of investments and other financial instruments included in this category are publicly-listed equities and debt and securities sold short. We classified 27.1% of total investments measured and reported at fair value as Level I at
December 31, 2015
.
155
Level II
Inputs are other than quoted prices that are observable for the asset or liability, either directly or indirectly. Level II inputs include quoted prices for similar instruments in active markets, and inputs other than quoted prices that are observable for the asset or liability. The type of investments and other financial instruments included in this category are credit investments, investments and debt obligations of consolidated CMBS vehicles and consolidated CLOs (beginning on January 1, 2015), convertible debt securities indexed to publicly-listed securities, less liquid and restricted equity securities and certain over-the-counter derivatives such as foreign currency option and forward contracts. We classified 23.9% of total investments measured and reported at fair value as Level II at
December 31, 2015
.
Level III
Inputs are unobservable for the asset or liability, and include situations where there is little, if any, market activity for the asset or liability. The types of assets and liabilities generally included in this category are private portfolio companies, real assets investments and credit investments for which a sufficiently liquid trading market does not exist. We classified 49.0% of total investments measured and reported at fair value as Level III at
December 31, 2015
. The valuation of our Level III investments at
December 31, 2015
represents management's best estimate of the amounts that we would anticipate realizing on the sale of these investments at such date.
In certain cases, the inputs used to measure fair value may fall into different levels of the fair value hierarchy. In such cases, the level in the fair value hierarchy within which the fair value measurement in its entirety falls has been determined based on the lowest level input that is significant to the fair value measurement in its entirety. Our assessment of the significance of a particular input to the fair value measurement in its entirety requires judgment and consideration of factors specific to the asset.
A significant decrease in the volume and level of activity for the asset or liability is an indication that transactions or quoted prices may not be representative of fair value because in such market conditions there may be increased instances of transactions that are not orderly. In those circumstances, further analysis of transactions or quoted prices is needed, and a significant adjustment to the transactions or quoted prices may be necessary to estimate fair value.
The availability of observable inputs can vary depending on the financial asset or liability and is affected by a wide variety of factors, including, for example, the type of instrument, whether the instrument has recently been issued, whether the instrument is traded on an active exchange or in the secondary market, and current market conditions. To the extent that valuation is based on models or inputs that are less observable or unobservable in the market, the determination of fair value requires more judgment. Accordingly, the degree of judgment exercised by us in determining fair value is greatest for instruments categorized in Level III. The variability and availability of the observable inputs affected by the factors described above may cause transfers between Levels I, II, and III, which we recognize at the beginning of the reporting period.
Investments and other financial instruments that have readily observable market prices (such as those traded on a securities exchange) are stated at the last quoted sales price as of the reporting date. We do not adjust the quoted price for these investments, even in situations where we hold a large position and a sale could reasonably affect the quoted price.
Level II Valuation Methodologies
Financial assets and liabilities categorized as Level II consist primarily of credit investments, investments and debt obligations of consolidated CFEs, convertible debt securities indexed to publicly-listed securities, less liquid and restricted equity securities and certain over-the-counter derivatives such as foreign currency option and forward contracts.
Credit investments, investments of consolidated CLOs and CMBS debt obligations:
These instruments generally have bid and ask prices that can be observed in the marketplace. Bid prices reflect the highest price that KKR and others are willing to pay for an instrument. Ask prices represent the lowest price that KKR and others are willing to accept for an instrument. For financial assets and liabilities whose inputs are based on bid-ask prices obtained from third party pricing services, fair value may not always be a predetermined point in the bid-ask range. KKR’s policy is generally to allow for mid-market pricing and adjusting to the point within the bid-ask range that meets KKR’s best estimate of fair value.
Securities indexed to publicly listed securities:
The securities are typically valued using standard convertible security pricing models. The key inputs into these models that require some amount of judgment are the credit spreads utilized and the volatility assumed. To the extent the company being valued has other outstanding debt securities that are publicly-traded, the implied credit spread on the company’s other outstanding debt securities would be utilized in the valuation. To the extent the
156
company being valued does not have other outstanding debt securities that are publicly-traded, the credit spread will be estimated based on the implied credit spreads observed in comparable publicly-traded debt securities. In certain cases, an additional spread will be added to reflect an illiquidity discount due to the fact that the security being valued is not publicly-traded. The volatility assumption is based upon the historically observed volatility of the underlying equity security into which the convertible debt security is convertible and/or the volatility implied by the prices of options on the underlying equity security.
Restricted Equity Securities:
The valuation of certain equity securities is based on an observable price for an identical security adjusted for the effect of a restriction.
Derivatives:
The valuation incorporates observable inputs comprising yield curves, foreign currency rates and credit spreads.
CLO Debt Obligations:
Beginning on January 1, 2015 with the adoption of ASU 2014-13, KKR measures CLO debt obligations on the basis of the fair value of the financial assets of the CLO.
Investments of consolidated CMBS entities:
KKR measures the investments of CMBS vehicles on the basis of the fair value of the financial liabilities of the CMBS.
Level III Valuation Methodologies
Management’s determination of fair value is based upon the best information available for a given circumstance and may incorporate assumptions that are management's best estimates after consideration of a variety of internal and external factors.
Financial assets and liabilities categorized as Level III consist primarily of the following:
Private Equity Investments:
We generally employ two valuation methodologies when determining the fair value of a private equity investment. The first methodology is typically a market comparables analysis that considers key financial inputs and recent public and private transactions and other available measures. The second methodology utilized is typically a discounted cash flow analysis, which incorporates significant assumptions and judgments. Estimates of key inputs used in this methodology include the weighted average cost of capital for the investment and assumed inputs used to calculate terminal values, such as exit EBITDA multiples. Other inputs are also used in both methodologies. For valuations determined for periods other than at year end, various inputs may be estimated prior to the end of the relevant period. Also, as discussed in greater detail under "—Business Environment" and "Risk Factors—Risks Related to the Assets We Manage—Our investments are impacted by various economic conditions that are difficult to quantify or predict, but may have a significant adverse impact on the value of our investments," a change in interest rates could have a significant impact on valuations. In certain cases the results of the discounted cash flow approach can be significantly impacted by these estimates. In addition, when a definitive agreement has been executed to sell an investment, KKR generally considers a significant determinant of fair value to be the consideration to be received by KKR pursuant to the executed definitive agreement.
Upon completion of the valuations conducted using these methodologies, a weighting is ascribed to each method, and an illiquidity discount is typically applied where appropriate. The ultimate fair value recorded for a particular investment will generally be within a range suggested by the two methodologies, except that the value may be higher or lower than such range in the case of investments being sold pursuant to an executed definitive agreement.
When determining the weighting ascribed to each valuation methodology, we consider, among other factors, the availability of direct market comparables, the applicability of a discounted cash flow analysis, the expected hold period and manner of realization for the investment, and in the case of investments being sold pursuant to an executed definitive agreement, the probability of such sale being completed. These factors can result in different weightings among investments in the portfolio and in certain instances may result in up to a 100% weighting to a single methodology. Across the Level III private equity investment portfolio, approximately
80.0%
of the fair value is derived from investments that are valued based exactly 50% on market comparables and 50% on a discounted cash flow analysis. Less than
5%
of the fair value of the Level III private equity investment portfolio is derived from investments that are valued either based 100% on market comparables or 100% on a discounted cash flow analysis. As of
December 31, 2015
, the overall weights ascribed to the market comparables methodology, the discounted cash flow methodology and a methodology based on pending sales for our Level III private equity investments were 46% and 51% and 3%, respectively. As of
December 31, 2015
, we believe that the approach of using the market multiples methodology, the discounted cash flow methodology and valuations based on pending sales resulted in valuations of our aggregate Level III private equity portfolio that were 3.1% lower than if only the discounted cash flow methodology had been used and only 3.2% higher than if only the market comparables methodology had been used.
157
When an illiquidity discount is to be applied, we seek to take a uniform approach across our portfolio and generally apply a minimum 5% discount to all private equity investments. We then evaluate such private equity investments to determine if factors exist that could make it more challenging to monetize the investment and, therefore, justify applying a higher illiquidity discount. These factors generally include (i) whether we are unable to freely sell the portfolio company or conduct an initial public offering of the portfolio company due to the consent rights of a third party or similar factors, (ii) whether the portfolio company is undergoing significant restructuring activity or similar factors and (iii) characteristics about the portfolio company regarding its size and/or whether the portfolio company is experiencing, or expected to experience, a significant decline in earnings. These factors generally make it less likely that a portfolio company would be sold or publicly offered in the near term at a price indicated by using just a market multiples and/or discounted cash flow analysis, and these factors tend to reduce the number of opportunities to sell an investment and/or increase the time horizon over which an investment may be monetized. Depending on the applicability of these factors, we determine the amount of any incremental illiquidity discount to be applied above the 5% minimum, and during the time we hold the investment, the illiquidity discount may be increased or decreased, from time to time, based on changes to these factors. The amount of illiquidity discount applied at any time requires considerable judgment about what a market participant would consider and is based on the facts and circumstances of each individual investment. Accordingly, the illiquidity discount ultimately considered by a market participant upon the realization of any investment may be higher or lower than that estimated by us in our valuations.
Real Assets Investments:
Real asset investments in infrastructure, energy and real estate are valued using one or more of the discounted cash flow analysis, market comparables analysis and direct income capitalization, which in each case incorporates significant assumptions and judgments. Infrastructure investments are generally valued using the discounted cash flow analysis. Key inputs used in this methodology include the weighted average cost of capital and assumed inputs used to calculate terminal values, such as exit EBITDA multiples. Energy investments are generally valued using a discounted cash flow analysis. Key inputs used in this methodology that require estimates include the weighted average cost of capital. In addition, the valuations of energy investments generally incorporate both commodity prices as quoted on indices and long-term commodity price forecasts, which may be substantially different from, and are currently higher than, commodity prices on certain indices for equivalent future dates. Certain energy investments do not include an illiquidity discount. Long-term commodity price forecasts are utilized to capture the value of the investments across a range of commodity prices within the energy investment portfolio associated with future development and to reflect a range of price expectations. Real estate investments are generally valued using a combination of direct income capitalization and discounted cash flow analysis. Key inputs used in such methodologies that require estimates include an unlevered discount rate and current capitalization rate, and certain real estate investments do not include a minimum illiquidity discount. The valuations of real assets investments also use other inputs.
During the year ended
December 31, 2015
, the value of our energy real asset investments in oil and gas producing properties decreased meaningfully. This decrease in value was primarily attributable to a drop in long‑term oil, condensate, natural gas liquids, and natural gas prices during the year ended
December 31, 2015
. The long-term price of WTI crude oil declined from approximately $67 per barrel to $50 per barrel and the long-term price of natural gas declined from approximately $3.77 per mcf to $2.90 per mcf as of December 31, 2014 and December 31, 2015, respectively.
On a segment basis, our energy real asset investments in oil and gas producing properties as of
December 31, 2015
had a fair value of approximately
$581 million
. Based on this fair value, we estimate that an immediate, hypothetical 10% decline in the fair value of these energy investments from one or more adverse movements to the investments' valuation inputs would result in a decline in investment income of $58.1 million and a decline in net income attributable to KKR & Co. L.P. of $32.5 million, after deducting amounts that are attributable to noncontrolling interests held by KKR Holdings L.P. As of
December 31, 2015
, if we were to value our energy investments using only the commodity prices as quoted on indices and did not use long-term commodity price forecasts, and also held all other inputs to their valuation constant, we estimate that investment income would have been approximately $53 million lower, resulting in a lower amount of net income attributable to KKR & Co. L.P. of approximately
55.9%
of the overall decrease in investment income, after deducting amounts that are attributable to noncontrolling interests held by KKR Holdings L.P.
These hypothetical declines relate only to investment income. There would be no current impact on KKR's carried interest since all of the investment funds which hold these types of energy investments have investment values that are below their cost and as such are not currently accruing carried interest. Additionally, there would be no impact on fees since fees earned from investment funds which hold investments in oil and gas producing properties are based on either committed capital or capital invested.
For GAAP purposes, where KKR holds energy investments consisting of working interests in oil and gas producing properties directly and not through an investment fund, such working interests are consolidated based on the proportion of the
158
working interests held by us. Accordingly, we reflect the assets, liabilities, revenues, expenses, investment income and cash flows of the consolidated working interests on a gross basis and changes in the value of these energy investments are not reflected as unrealized gains and losses in the consolidated statements of operations. Accordingly, a change in fair value for these investments does not result in a decrease in net gains (losses) from investment activities, but may result in an impairment charge reflected in general, administrative and other expenses. For segment purposes, these directly held working interests are treated as investments and changes in value are reflected in our segment results as unrealized gains and losses.
Credit Investments:
Credit investments are valued using values obtained from dealers or market makers, and where these values are not available, credit investments are valued by us based on ranges of values determined by an independent valuation firm. Valuation models are based on discounted cash flow analyses, for which the key inputs are determined based on market comparables, which incorporate similar instruments from similar issuers.
Other Investments:
We generally employ the same valuation methodologies as described above for private equity investments when valuing these other investments.
CLO Debt Obligations:
Prior to January 1, 2015 and the adoption of ASU 2014-13, collateralized loan obligation senior secured and subordinated notes were initially valued at the transaction price and were subsequently valued using a third party valuation service. The approach used to estimate the fair values was the discounted cash flow method, which includes consideration of the cash flows of the debt obligation based on projected quarterly interest payments and quarterly amortization. The debt obligations were discounted based on the appropriate yield curve given the debt obligation's respective maturity and credit rating. The most significant inputs to the valuation of these financial instruments were default and loss expectations and discount margins. Beginning on January 1, 2015, with the adoption of ASU 2014-13, KKR measures CLO debt obligations on the basis of the fair value of the financial assets of the CLO.
Key unobservable inputs that have a significant impact on our Level III investment valuations as described above are included in Note 5 "Fair Value Measurements" of the financial statements included elsewhere in this report. We utilize several unobservable pricing inputs and assumptions in determining the fair value of our Level III investments. These unobservable pricing inputs and assumptions may differ by investment and in the application of our valuation methodologies. Our reported fair value estimates could vary materially if we had chosen to incorporate different unobservable pricing inputs and other assumptions or, for applicable investments, if we only used either the discounted cash flow methodology or the market comparables methodology instead of assigning a weighting to both methodologies.
Level III Valuation Process
The valuation process involved for Level III measurements is completed on a quarterly basis and is designed to subject the valuation of Level III investments to an appropriate level of consistency, oversight, and review. As of December 31, 2015, the valuation process for Level III measurements, as described below, subjected valuations to the review and oversight of various committees. We have a Private Markets valuation committee for private equity and real assets investments and a valuation committee for credit and credit related investments. The Private Markets valuation committee is assisted by subcommittees in the valuation of real asset and growth equity investments, and is also assisted by a valuation team. The Private Markets valuation committee is comprised only of employees who are not investment professionals responsible for preparing preliminary valuations or for oversight of the investments being valued. The valuation teams and subcommittees for real asset and growth equity investments, however, include investment professionals who participate in the preparation of preliminary valuations or are responsible for oversight for those investments. The credit valuation committee is also assisted by a valuation team. The credit valuation teams include investment professionals responsible for preparing preliminary valuations or for oversight of the investments being valued. The credit valuation committee is comprised of investment professionals with no responsibility for preparing preliminary valuations, but certain committee members are responsible for oversight of the investments being valued. The valuation committees and teams are responsible for coordinating and consistently implementing our quarterly valuation policies, guidelines and processes. For Private Markets investments classified as Level III, investment professionals prepare preliminary valuations based on their evaluation of financial and operating data, company specific developments, market valuations of comparable companies and other factors. These preliminary valuations are reviewed with the investment professionals by the applicable valuation team and are also reviewed by an independent valuation firm engaged by us to perform certain procedures in order to assess the reasonableness of our valuations annually for all Level III investments in Private Markets and quarterly for investments other than investments which have values less than pre-set value thresholds and which in the aggregate comprise less than 5% of the total value of our Level III Private Markets investments. For most investments classified as Level III in credit, in general, an independent valuation firm is engaged by us to provide third party valuations, or ranges of valuations from which our investment professionals select a point in the range to determine the preliminary valuation, or an independent valuation firm is engaged by us to perform certain procedures in order to assess the reasonableness and provide positive assurance of our valuations. Approximately 8% of the total value of our Level III
159
credit investments are not valued with the engagement of an independent valuation firm. These preliminary valuations are reviewed by senior investment professionals for each credit strategy. All preliminary valuations in Private Markets and credit are then reviewed by the applicable valuation committee, and after reflecting any input by their respective valuation committees, the preliminary valuations are presented to the firm's management committee. When these valuations are approved by this committee after reflecting any input from it, the valuations of Level III investments, as well as the valuations of Level I and Level II investments, are presented to the audit committee of our board of directors and are then reported on to the board of directors.
As of
December 31, 2015
, upon completion by, where applicable, an independent valuation firm of certain limited procedures requested to be performed by them, the independent valuation firm concluded that the fair values, as determined by KKR, of Private Markets investments reviewed by them were reasonable. The limited procedures did not involve an audit, review, compilation or any other form of examination or attestation under generally accepted auditing standards and were not conducted on all Level III investments. We are responsible for determining the fair value of investments in good faith, and the limited procedures performed by an independent valuation firm are supplementary to the inquiries and procedures that we are required to undertake to determine the fair value of the commensurate investments.
As described above, Level II and Level III investments were valued using internal models with significant unobservable inputs and our determinations of the fair values of these investments may differ materially from the values that would have resulted if readily observable inputs had existed. Additional external factors may cause those values, and the values of investments for which readily observable inputs exist, to increase or decrease over time, which may create volatility in our earnings and the amounts of assets and partners' capital that we report from time to time.
Changes in the fair value of the investments of our consolidated private equity funds may impact the net gains (losses) from investment activities of our private equity funds as described under "—Key Financial Measures under GAAP—Investment Income (Loss)—Net Gains (Losses) from Investment Activities." Based on the investments of our private equity funds as of
December 31, 2015
, we estimate that an immediate 10% decrease in the fair value of the funds' investments generally would result in a commensurate change in the amount of net gains (losses) from investment activities (except that carried interest would likely be more significantly impacted), regardless of whether the investment was valued using observable market prices or management estimates with significant unobservable pricing inputs. The impact that the consequential decrease in investment income would have on net income attributable to KKR would generally be significantly less than the amount described above, given that a majority of the change in fair value would be attributable to noncontrolling interests and therefore we are only impacted to the extent of our carried interest and our balance sheet investments.
As of
December 31, 2015
, investments which represented greater than 5% of consolidated investments consisted of Walgreens Boots Alliance, Inc. and First Data Corporation valued at
$5.1 billion
and
$4.3 billion
, respectively. On a segment basis, as of
December 31, 2015
, investments which represented greater than 5% of total reportable segments investments consisted of First Data Corporation and Walgreens Boots Alliance, Inc. valued at
$1,266.2 million
and
$748.7 million
, respectively. Our investment income can be impacted by volatility in the public markets related to our holdings of publicly traded securities, including our sizable holdings of First Data Corporation (NYSE:FDC) and Walgreens Boots Alliance, Inc. (NASDAQ: WBA). See "--Business Environment."
Recognition of Investment Income
Investment income consists primarily of the net impact of: (i) realized and unrealized gains and losses on investments, (ii) dividends, (iii) interest income, (iv) interest expense and (v) foreign exchange gains and losses relating to mark-to-market activity on foreign exchange forward contracts, foreign currency options, foreign denominated debt and debt securities issued by consolidated CFEs. Unrealized gains or losses resulting from the aforementioned activities are included in net gains (losses) from investment activities. Upon disposition of an instrument that is marked-to-market, previously recognized unrealized gains or losses are reversed and a realized gain or loss is recognized. While this reversal generally does not significantly impact the net amounts of gains (losses) that we recognize from investment activities, it affects the manner in which we classify our gains and losses for reporting purposes.
Due to the consolidation of the majority of our funds, the portion of our funds' investment income that is allocable to our carried interests and capital investments is not shown in the consolidated financial statements. For funds that are consolidated, all investment income (loss), including the portion of a funds' investment income (loss) that is allocable to KKR's carried interest, is included in investment income (loss) on the consolidated statements of operations. The carried interest that KKR retains in net income (loss) attributable to KKR & Co. L.P. is reflected as an adjustment to net income (loss) attributable to noncontrolling interests. Because the substantial majority of our funds are consolidated and because we hold only a minority
160
economic interest in our funds' investments, our share of the investment income generated by our funds' investment activities is significantly less than the total amount of investment income presented in the consolidated financial statements.
Carried interest entitles the general partner of a fund to a greater allocable share of the fund's earnings from investments relative to the capital contributed by the general partner and correspondingly reduces noncontrolling interests' attributable share of those earnings. Amounts earned pursuant to carried interest are included as investment income (loss) in net gains (losses) from investment activities and are earned by the general partner of those funds to the extent that cumulative investment returns are positive and where applicable, preferred return thresholds have been met. If these investment returns decrease or turn negative in subsequent periods, recognized carried interest will be reversed and reflected as investment losses in net gains (losses) from investment activities.
Carried interest is recognized in the statement of operations based on the contractual conditions set forth in the agreements governing the fund as if the fund were terminated and liquidated at the reporting date and the fund's investments were realized at the then estimated fair values. Due to the extended durations of our private equity funds, we believe that this approach results in income recognition that best reflects our periodic performance in the management of those funds. Amounts earned pursuant to carried interest are earned by the general partner of those funds to the extent that cumulative investment returns are positive and where applicable, preferred return thresholds have been met. If these investment amounts earned decrease or turn negative in subsequent periods, recognized carried interest will be reversed and to the extent that the aggregate amount of carry distributions received by the general partner during the term of the fund exceed the amount to which the general partner was ultimately entitled, a clawback obligation would be recorded. For funds that are consolidated, this clawback obligation, if any, is reflected as an increase in noncontrolling interests in the consolidated statements of financial condition. For funds that are not consolidated, this clawback obligation, if any, is reflected as a reduction of our investment balance as this is where carried interest is initially recorded.
Recently Issued Accounting Pronouncements
For a full discussion of recently issued accounting pronouncements, please see the notes to the consolidated financial statements "--Item 8. Financial Statements and Supplementary Data--Summary of Significant Accounting Policies."
161
Our exposure to market risks primarily relates to movements in the fair value of investments, including the effect that those movements have on our management fees, carried interest and net gains from investment activities. The fair value of investments may fluctuate in response to changes in the values of investments, foreign currency exchange rates and interest rates. Additionally, interest rate movements can adversely impact the amount of interest income we receive on credit instruments bearing variable rates and could also impact the amount of interest that we pay on debt obligations bearing variable rates.
The quantitative information provided in this section was prepared using estimates and assumptions that management believes are appropriate in order to provide a reader with an indication of the directional impact that a hypothetical adverse movement in certain risks would have on net income attributable to KKR & Co. L.P. In all cases, these directional impacts are presented after deducting amounts that are attributable to noncontrolling interests held by KKR Holdings L.P. As of
December 31, 2015
, KKR & Co. L.P. and KKR Holdings L.P. held interests in our business of
56%
and
44%
, respectively. The actual impact of a hypothetical adverse movement in these risks could be materially different from the amounts shown below.
The firm uses various committees to help manage market risk and general business risks.
Management of Market Risk
When we commit capital of a certain amount from our balance sheet to investments or transactions, a balance sheet committee of senior employees, including our two Co-Chief Executive Officers, the Chief Financial Officer and Chief Administrative Officer, must approve the investment or transaction before it may be made. The committee may delegate authority to other employees subject to maximum commitment sizes or other limitations determined by the committee. In addition, this committee supervises activities governing KKR's capital structure, liquidity, and the composition of our balance sheet.
Certain securities transactions by our capital markets business are subject to risk tolerance limits, regulatory capital requirements and the review and approval of one or more committees in compliance with rules applicable to broker-dealers pursuant to the Securities Exchange Act of 1934. When our capital is committed to capital markets transactions, after diligence is conducted, such transactions are subject to the review and approval of a capital markets underwriting committee. These transactions are also subject to risk tolerance limits. The risk tolerance limits establish the level of investment we may make in a single company or type of transaction, for example and are designed to avoid undue concentration and risk exposure. Regulatory capital requirements also place limits on the size of securities underwritings the capital markets business can conduct based on quantitative measure of assets, liabilities and certain off-balance-sheet items. Aggregate balance sheet risk is monitored on an ongoing basis by the balance sheet committee referenced above.
With respect to the funds and other investment vehicles through which we make investments for our fund investors, KKR manages risk by subjecting transactions to the review and approval of an applicable investment committee, and then a portfolio management committee (or other applicable senior employees) regularly monitors these investments. Before making an investment, investment professionals identify risks in due diligence, evaluating, among other things, business, financial, legal and regulatory issues, financial data and other information. An investment team presents the investment and its identified risks to an investment committee, which must approve each investment before it may be made. If an investment is made, a portfolio management committee (or other applicable senior employees) is responsible for working with our investment professionals to monitor the investment on an ongoing basis.
Management of General Business Risk
KKR has a risk committee comprised of senior employees from across our business segments and across business operations, and includes our Chief Administrative Officer, our Chief Financial Officer, and our General Counsel. The risk committee monitors and evaluates KKR's general business risks. The Chief Administrative Officer, who also serves as the chairman of the risk committee, regularly reports to our Co-Chief Executive Officers and quarterly to the Audit Committee, which is the chief committee that monitors risk on behalf of the Board of Directors.
KKR's global conflicts committee is responsible for analyzing and addressing new or potential conflicts of interest that may arise in KKR's business, including conflicts relating to specific transactions and circumstances as well as those implicit in the overall activities of KKR and its various businesses and monitors compliance matters. Our Chief Administrative Officer, Chief Financial Officer, General Counsel and Chief Compliance Officer are members of this committee.
162
KKR's management committee is responsible for evaluating certain matters affecting the business of KKR. It consists of our Co-Chief Executive Officers, Chief Administrative Officer, Chief Financial Officer, General Counsel and other senior employees across our business segments and across business operations, and is chaired by our Chief Administrative Officer. The management committee was responsible for approving the valuations of our Level III investments in Private Markets and Public Markets as of December 31, 2015.
Changes in Fair Value
The majority of our investments are reported at fair value. Net changes in the fair value of investments impact the net gains (losses) from investment activities in our consolidated statements of operations. Based on investments held as of
December 31, 2015
, we estimate that an immediate 10% decrease in the fair value of investments generally would result in a commensurate change in the amount of net gains (losses) from investment activities (except that carried interest would likely be more significantly impacted), regardless of whether the investment was valued using observable market prices or management estimates with significant unobservable pricing inputs. The impact that the consequential decrease in investment income would have on net income attributable to KKR & Co. L.P. would generally be significantly less than the amount described above, given that a majority of the change in fair value would be attributable to noncontrolling interests and therefore we are only impacted to the extent of our carried interest and our balance sheet investments and to a lesser extent our management fees. Because of this, the quantitative information that follows represents the impact that a reduction to each of the income streams shown below would have on net income attributable to KKR & Co. L.P. The actual impact to individual line items within the consolidated statements of operations would differ from the amounts shown below as a result of (i) the elimination of management fees and carried interest, (ii) the gross-up of net gains (losses) from investment activities, in each case as a result of the consolidation of the majority of our private equity and credit funds and (iii) the inclusion of amounts attributable to KKR Holdings L.P. in individual line items within the consolidated statement of operations.
Based on the fair value of investments as of
December 31, 2015
, we estimate that an immediate, hypothetical 10% decline in the fair value of investments would result in declines in net income attributable to KKR & Co. L.P. in
2016
from reductions in the following items, if not offset by other factors:
|
Year Ended December 31, 2015
|
|||||||||||||
|
Management fees
|
Carried Interest, Net of Carry Pool Allocation
|
Net Gains/(Losses) From Investment Activities Excluding Carried Interest
|
|||||||||||
|
($ in thousands)
|
|||||||||||||
|
10% Decline in Fair Value of Investments (1)
|
$
|
12,074
|
|
(2)
|
$
|
231,314
|
|
(3)
|
$
|
500,757
|
|
(3)
|
|
|
(1)
|
An immediate, hypothetical 10% decline in the fair value of investments would also impact our ability to earn incentive fees. Since the majority of our incentive fees are earned at December 31st or June 30th of each calendar year and are not subject to clawback, a 10% decline in fair value would generally result in the recognition of no incentive fees on a prospective basis and result in lower net income relative to prior years where such incentive fees may have been earned.
|
||||||||||||
|
(2)
|
Represents an annualized reduction in management fees.
|
||||||||||||
|
(3)
|
Decrease would impact our statement of operations in a single quarter. With respect to carried interest, for purposes of this analysis the impact of preferred returns are ignored.
|
||||||||||||
Management Fees
Our management fees in our Private Markets investment funds are generally calculated based on the amount of capital committed or invested by a fund, as described under "Business—Our Segments—Private Markets." Accordingly, movements in the fair value of investments do not significantly affect the amount of fees we may charge in Private Markets funds. In the case of our Public Markets business, management fees are often calculated based on the average NAV of the fund or vehicle for that particular period, although certain funds in our Public Markets segment have management fees based on the amount of capital committed or invested. To the extent that management fees are calculated based on the NAV of the fund's investments, the amount of fees that we may charge will be increased or decreased in direct proportion to the effect of changes in the fair value of the fund's investments. The proportion of our management fees that are based on NAV depends on the number and type of funds in existence. For the year ended
December 31, 2015
, the fund management fees that were recognized based on the NAV of the applicable funds or separately managed accounts was approximately
25%
.
163
Publicly Traded Securities
Our investment funds and KKR's balance sheet hold certain investments in portfolio companies whose securities are publicly traded. The market prices of securities may be volatile and are likely to fluctuate due to a number of factors beyond our control. These factors include actual or anticipated fluctuations in the quarterly and annual results of such companies or of other companies in the industries in which they operate, market perceptions concerning the availability of additional securities for sale, general economic, social or political developments, industry conditions, changes in government regulation, shortfalls in operating results from levels forecasted by securities analysts, the general state of the securities markets and other material events, such as significant management changes, re-financings, acquisitions and dispositions. In addition, although the majority of our investments are comprised of investments in portfolio companies whose securities are not publicly traded, the value of these privately held investments may also fluctuate as our Level III investments are valued in part using a market comparables analysis. Consequently due to similar factors beyond our control as described above for portfolio companies whose securities are publicly traded, the value of these Level III investments may fluctuate with market prices. Subsequent to December 31, 2015, world equity markets declined sharply with both the S&P 500 and the MSCI World Index down substantially on a total return basis, including dividends, as of February 22, 2016. See "--Management's Discussion and Analysis of Financial Condition and Results of Operations--Business Environment".
Exchange Rate Risk
Our investment funds and KKR's balance sheet hold investments denominated in currencies other than the U.S. dollar. Those investments expose us and our fund investors to the risk that the value of the investments will be affected by changes in exchange rates between the currency in which the investments are denominated and the currency in which the investments are made. Additionally, a portion of our management fees are denominated in non-U.S. dollar currencies. Our policy is to minimize these risks by employing hedging techniques, including using foreign currency options and foreign exchange forward contracts to reduce exposure to future changes in exchange rates when a meaningful amount of capital has been invested in currencies other than the currencies in which the investments are denominated.
Our primary exposure to exchange rate risk relates to movements in the value of exchange rates between the U.S. dollar and other currencies in which our investments are denominated (primarily euros and British pounds), net of the impact of foreign exchange hedging strategies. The quantitative information that follows represents the impact that a reduction to each of the income streams shown below would have on net income attributable to KKR & Co. L.P. The actual impact to individual line items within the statements of operations would differ from the amounts shown below as a result of (i) the elimination of management fees and carried interest, (ii) the gross-up of net gains (losses) from investment activities, in each case as a result of the consolidation of the majority of our private equity and credit funds and (iii) the inclusion of amounts attributable to KKR Holdings L.P. in individual line items within the consolidated statement of operations.
We estimate that an immediate, hypothetical 10% decline in the exchange rates between the U.S. dollar and all of the major foreign currencies in which our investments and fees were denominated as of
December 31, 2015
(i.e. an increase in the value of the U.S. dollar against these foreign currencies) would result in declines in net income attributable to KKR & Co. L.P. in
2016
from reductions in the following items, net of the impact of foreign exchange hedging strategies, if not offset by other factors:
|
Year Ended December 31, 2015
|
|||||||||||||
|
Management fees
|
Carried Interest, Net of Carry Pool Allocation
|
Net Gains/(Losses) From Investment Activities Excluding Carried Interest
|
|||||||||||
|
($ in thousands)
|
|||||||||||||
|
10% Decline in Foreign Currencies Against the U.S. Dollar (1)
|
$
|
6,806
|
|
(2)
|
$
|
33,210
|
|
(3)
|
$
|
21,215
|
|
(3)
|
|
|
(1)
|
An immediate, hypothetical 10% decline in exchange rates between the U.S. dollar and all of the major foreign currencies in which our investments were denominated would only marginally impact our ability to earn incentive fees since the majority of our funds in which we are entitled to earn incentive fees are denominated in U.S. dollars.
|
||||||||||||
|
(2)
|
Represents an annualized reduction in management fees.
|
||||||||||||
|
(3)
|
Decrease would impact our statement of operations in a single quarter. With respect to carried interest, for purposes of this analysis the impact of preferred returns are ignored.
|
||||||||||||
164
Interest Rate Risk
Valuation of Investments
Changes in credit markets and in particular, interest rates, can impact investment valuations, particularly our Private Markets investments and may have offsetting results depending on the valuation methodology used. For example, we typically use a discounted cash flow analysis as one of the methodologies to ascertain the fair value of our investments that do not have readily observable market prices. If applicable interest rates rise, then the assumed cost of capital for those portfolio companies would be expected to increase under the discounted cash flow analysis, and this effect would negatively impact their valuations if not offset by other factors. Conversely, a fall in interest rates can positively impact valuations of certain portfolio companies if not offset by other factors. These impacts could be substantial depending upon the magnitude of the change in interest rates. In certain cases, the valuations obtained from the discounted cash flow analysis and the other primary methodology we use, the market multiples approach, may yield different and offsetting results. For example, the positive impact of falling interest rates on discounted cash flow valuations may offset the negative impact of the market multiples valuation approach and may result in less of a decline in value than for those investments that had a readily observable market price. Finally, low interest rates related to monetary stimulus and economic stagnation may also negatively impact expected returns on all investments, as the demand for relatively higher return assets increases and supply decreases.
Interest Income
We and our consolidated funds hold credit investments, including CFEs that generate interest income based on variable interest rates. We are exposed to interest rate risk relating to investments that generate yield since a meaningful portion of credit investments held by us and our consolidated funds earn income based on variable interest rates. However, the contractual interest rate structure for a large portion of our credit investments bearing variable rates have "floors" which establish a minimum rate of interest that will be earned. In the current low interest rate environment, a large portion of the credit investments held by us and our consolidated funds are earning interest at the contractual floor and therefore, for these investments, a decrease in variable interests rates would not impact the amount of interest income earned. With respect to consolidated funds and CFEs, the impact on net income attributable to KKR & Co. L.P. resulting from a decrease of a hypothetical 100 basis points in variable interest rates used in the recognition of interest income would not be expected to be material since (i) many variable rate investments are subject to floors as described above and (ii) a substantial portion of this decrease would be attributable to noncontrolling interests. With respect to credit investments held by KKR outside of the consolidated funds, all of the interest income earned inures to KKR & Co. L.P., however a large portion of these investments are subject to floors as described above. Accordingly, the impact on net income attributable to KKR & Co. L.P. resulting from a decrease of a hypothetical 100 basis points in variable interest rates used in the recognition of interest income would not be expected to be material.
Interest Expense
Our consolidated funds have debt obligations that include revolving credit agreements, certain investment financing arrangements and debt securities issued by CFE vehicles structured through the use of term loans and revolving credit facilities that accrue interest at variable rates. Changes in these rates would affect the amount of interest payments that our consolidated funds would have to make. With respect to consolidated funds, the impact on net income attributable to KKR & Co. L.P. resulting from an increase of a hypothetical 100 basis points in variable interest rates used in the recognition of interest expense would not be expected to be material since a substantial portion of this increase would be attributable to noncontrolling interests. With respect to debt obligations held by KKR outside of the consolidated funds, as of December 31, 2015, KKR had no debt obligations outstanding that accrue interest at a variable rate.
Credit Risk
We are party to agreements providing for various financial services and transactions that contain an element of risk in the event that the counterparties are unable to meet the terms of such agreements. In these agreements, we depend on these counterparties to make payment or otherwise perform. We generally endeavor to minimize our risk of exposure by limiting the counterparties with which we enter into financial transactions to reputable financial institutions. In addition, availability of financing from financial institutions may be uncertain due to market events, and we may not be able to access these financing markets.
165
INDEX TO CONSOLIDATED FINANCIAL STATEMENTS
|
Report of Independent Registered Public Accounting Firm
|
|
|
Consolidated Statements of Financial Condition as of December 31, 2015 and 2014
|
|
|
Consolidated Statements of Operations for the Years Ended December 31, 2015, 2014 and 2013
|
|
|
Consolidated Statements of Comprehensive Income (Loss) for the Years Ended December 31, 2015, 2014 and 2013
|
|
|
Consolidated Statements of Changes in Equity for the Years Ended December 31, 2015, 2014 and 2013
|
|
|
Consolidated Statements of Cash Flows for the Years Ended December 31, 2015, 2014 and 2013
|
|
|
Notes to Consolidated Financial Statements
|
|
166
REPORT OF INDEPENDENT REGISTERED PUBLIC ACCOUNTING FIRM
To the Board of Directors and Unitholders of KKR & Co. L.P.:
We have audited the accompanying consolidated statements of financial condition of KKR & Co. L.P. and subsidiaries (the "Company") as of December 31, 2015 and 2014, and the related consolidated statements of operations, comprehensive income (loss), changes in equity, and cash flows for each of the three years in the period ended December 31, 2015. Our audits also included the financial statement schedule listed in Item 15. We also have audited the Company's internal control over financial reporting as of December 31, 2015, based on criteria established in
Internal Control-Integrated Framework (2013)
issued by the Committee of Sponsoring Organizations of the Treadway Commission. The Company's management is responsible for these financial statements and financial statement schedule, for maintaining effective internal control over financial reporting, and for its assessment of the effectiveness of internal control over financial reporting, included in the accompanying Management's Report on Internal Control over Financial Reporting. Our responsibility is to express an opinion on these financial statements and financial statement schedule and an opinion on the Company's internal control over financial reporting based on our audits.
We conducted our audits in accordance with the standards of the Public Company Accounting Oversight Board (United States). Those standards require that we plan and perform the audit to obtain reasonable assurance about whether the financial statements are free of material misstatement and whether effective internal control over financial reporting was maintained in all material respects. Our audits of the financial statements included examining, on a test basis, evidence supporting the amounts and disclosures in the financial statements, assessing the accounting principles used and significant estimates made by management, and evaluating the overall financial statement presentation. Our audit of internal control over financial reporting included obtaining an understanding of internal control over financial reporting, assessing the risk that a material weakness exists, and testing and evaluating the design and operating effectiveness of internal control based on the assessed risk. Our audits also included performing such other procedures as we considered necessary in the circumstances. We believe that our audits provide a reasonable basis for our opinions.
A company's internal control over financial reporting is a process designed by, or under the supervision of, the company's principal executive and principal financial officers, or persons performing similar functions, and effected by the company's board of directors, management, and other personnel to provide reasonable assurance regarding the reliability of financial reporting and the preparation of financial statements for external purposes in accordance with generally accepted accounting principles. A company's internal control over financial reporting includes those policies and procedures that (1) pertain to the maintenance of records that, in reasonable detail, accurately and fairly reflect the transactions and dispositions of the assets of the company; (2) provide reasonable assurance that transactions are recorded as necessary to permit preparation of financial statements in accordance with generally accepted accounting principles, and that receipts and expenditures of the company are being made only in accordance with authorizations of management and directors of the company; and (3) provide reasonable assurance regarding prevention or timely detection of unauthorized acquisition, use, or disposition of the company's assets that could have a material effect on the financial statements.
Because of the inherent limitations of internal control over financial reporting, including the possibility of collusion or improper management override of controls, material misstatements due to error or fraud may not be prevented or detected on a timely basis. Also, projections of any evaluation of the effectiveness of the internal control over financial reporting to future periods are subject to the risk that the controls may become inadequate because of changes in conditions, or that the degree of compliance with the policies or procedures may deteriorate.
In our opinion, the consolidated financial statements referred to above present fairly, in all material respects, the financial position of KKR & Co. L.P. and subsidiaries as of December 31, 2015 and 2014, and the results of their operations and their cash flows for each of the three years in the period ended December 31, 2015, in conformity with accounting principles generally accepted in the United States of America. Also, in our opinion, such financial statement schedule, when considered in relation to the basic consolidated financial statements taken as a whole, presents fairly in all material respects the information set forth therein. Also, in our opinion, the Company maintained, in all material respects, effective internal control over financial reporting as of December 31, 2015, based on the criteria established in
Internal Control-Integrated Framework (2013)
issued by the Committee of Sponsoring Organizations of the Treadway Commission.
/s/ Deloitte & Touche LLP
New York, New York
February 26, 2016
167
KKR & CO. L.P.
CONSOLIDATED STATEMENTS OF FINANCIAL CONDITION
(Amounts in Thousands, Except Unit Data)
|
December 31,
2015 |
December 31,
2014 |
||||||
|
Assets
|
|
|
|
|
|||
|
Cash and Cash Equivalents
|
$
|
1,047,740
|
|
$
|
918,080
|
|
|
|
Cash and Cash Equivalents Held at Consolidated Entities
|
1,472,120
|
|
1,372,775
|
|
|||
|
Restricted Cash and Cash Equivalents
|
267,628
|
|
102,991
|
|
|||
|
Investments
|
65,305,931
|
|
60,167,626
|
|
|||
|
Due from Affiliates
|
139,783
|
|
147,056
|
|
|||
|
Other Assets
|
2,824,557
|
|
3,164,217
|
|
|||
|
Total Assets
|
$
|
71,057,759
|
|
$
|
65,872,745
|
|
|
|
Liabilities and Equity
|
|
|
|
|
|||
|
Debt Obligations
|
$
|
18,730,017
|
|
$
|
10,837,784
|
|
|
|
Due to Affiliates
|
144,807
|
|
131,548
|
|
|||
|
Accounts Payable, Accrued Expenses and Other Liabilities
|
2,715,350
|
|
3,199,352
|
|
|||
|
Total Liabilities
|
21,590,174
|
|
14,168,684
|
|
|||
|
Commitments and Contingencies
|
|
|
|
||||
|
Redeemable Noncontrolling Interests
|
188,629
|
|
300,098
|
|
|||
|
Equity
|
|
|
|
|
|||
|
KKR & Co. L.P. Partners’ Capital (457,834,875 and 433,330,540 common units issued and outstanding as of December 31, 2015 and 2014, respectively)
|
5,575,981
|
|
5,403,095
|
|
|||
|
Accumulated Other Comprehensive Income (Loss)
|
(28,799
|
)
|
(20,404
|
)
|
|||
|
Total KKR & Co. L.P. Partners’ Capital
|
5,547,182
|
|
5,382,691
|
|
|||
|
Noncontrolling Interests
|
43,731,774
|
|
46,004,377
|
|
|||
|
Appropriated Capital
|
—
|
|
16,895
|
|
|||
|
Total Equity
|
49,278,956
|
|
51,403,963
|
|
|||
|
Total Liabilities and Equity
|
$
|
71,057,759
|
|
$
|
65,872,745
|
|
|
See notes to consolidated financial statements.
168
KKR & CO. L.P.
CONSOLIDATED STATEMENTS OF FINANCIAL CONDITION (Continued)
(Amounts in Thousands)
The following presents the portion of the balances presented in the consolidated statements of financial condition attributable to consolidated variable interest entities (“VIEs”) as of
December 31, 2015
and
2014
. The assets of consolidated collateralized financing entities (“CFEs”) holding collateralized loan obligations ("CLOs") and commercial real estate mortgage-backed securities ("CMBS”), which comprise the majority of KKR’s consolidated VIEs, are held solely as collateral to satisfy the obligations of the CFEs. KKR has no right to the benefits from, nor does KKR bear the risks associated with, the assets held by these CFEs beyond KKR’s beneficial interest therein and any fees generated from the CFEs. The assets in each CFE can be used only to settle the debt of the related CFE. The noteholders and other creditors of the CFEs have no recourse to KKR’s general assets. There are neither explicit arrangements nor does KKR hold implicit variable interests that would require KKR to provide any ongoing financial support to the CFEs.
|
|
December 31, 2015
|
December 31, 2014
|
|||||
|
Assets
|
|
|
|||||
|
Cash and Cash Equivalents Held at Consolidated Entities
|
$
|
975,433
|
|
$
|
1,046,018
|
|
|
|
Investments
|
12,735,309
|
|
8,559,967
|
|
|||
|
Other Assets
|
133,953
|
|
129,949
|
|
|||
|
Total Assets
|
$
|
13,844,695
|
|
$
|
9,735,934
|
|
|
|
|
|
|
|||||
|
Liabilities
|
|
|
|||||
|
Debt Obligations
|
$
|
12,365,222
|
|
$
|
7,615,340
|
|
|
|
Accounts Payable, Accrued Expenses and Other Liabilities
|
546,129
|
|
638,953
|
|
|||
|
Total Liabilities
|
$
|
12,911,351
|
|
$
|
8,254,293
|
|
|
See notes to consolidated financial statements.
169
KKR & CO. L.P.
CONSOLIDATED STATEMENTS OF OPERATIONS
(Amounts in Thousands, Except Unit Data)
|
|
For the Years Ended December 31,
|
||||||||||
|
|
2015
|
2014
|
2013
|
||||||||
|
Revenues
|
|
|
|
|
|
|
|||||
|
Fees and Other
|
$
|
1,043,768
|
|
$
|
1,110,008
|
|
$
|
762,546
|
|
||
|
Expenses
|
|
|
|
|
|
|
|||||
|
Compensation and Benefits
|
1,180,591
|
|
1,263,852
|
|
1,266,592
|
|
|||||
|
Occupancy and Related Charges
|
65,683
|
|
62,564
|
|
61,720
|
|
|||||
|
General, Administrative and Other
|
624,951
|
|
869,651
|
|
438,826
|
|
|||||
|
Total Expenses
|
1,871,225
|
|
2,196,067
|
|
1,767,138
|
|
|||||
|
Investment Income (Loss)
|
|
|
|
|
|
|
|||||
|
Net Gains (Losses) from Investment Activities
|
4,672,627
|
|
4,778,232
|
|
7,826,082
|
|
|||||
|
Dividend Income
|
850,527
|
|
1,174,501
|
|
695,521
|
|
|||||
|
Interest Income
|
1,219,197
|
|
909,207
|
|
474,759
|
|
|||||
|
Interest Expense
|
(573,226
|
)
|
(317,192
|
)
|
(99,616
|
)
|
|||||
|
Total Investment Income (Loss)
|
6,169,125
|
|
6,544,748
|
|
8,896,746
|
|
|||||
|
Income (Loss) Before Taxes
|
5,341,668
|
|
5,458,689
|
|
7,892,154
|
|
|||||
|
Income Tax / (Benefit)
|
66,636
|
|
63,669
|
|
37,926
|
|
|||||
|
Net Income (Loss)
|
5,275,032
|
|
5,395,020
|
|
7,854,228
|
|
|||||
|
Net Income (Loss) Attributable to Redeemable Noncontrolling Interests
|
(4,512
|
)
|
(3,341
|
)
|
62,255
|
|
|||||
|
Net Income (Loss) Attributable to Noncontrolling Interests and Appropriated Capital
|
4,791,062
|
|
4,920,750
|
|
7,100,747
|
|
|||||
|
Net Income (Loss) Attributable to KKR & Co. L.P.
|
$
|
488,482
|
|
$
|
477,611
|
|
$
|
691,226
|
|
||
|
Net Income (Loss) Attributable to KKR & Co. L.P. Per Common Unit
|
|
|
|
|
|
|
|||||
|
Basic
|
$
|
1.09
|
|
$
|
1.25
|
|
$
|
2.51
|
|
||
|
Diluted
|
$
|
1.01
|
|
$
|
1.16
|
|
$
|
2.30
|
|
||
|
Weighted Average Common Units Outstanding
|
|
|
|
|
|
|
|||||
|
Basic
|
448,884,185
|
|
381,092,394
|
|
274,910,628
|
|
|||||
|
Diluted
|
482,699,194
|
|
412,049,275
|
|
300,254,090
|
|
|||||
See notes to consolidated financial statements.
170
KKR & CO. L.P.
CONSOLIDATED STATEMENTS OF COMPREHENSIVE INCOME (LOSS)
(Amounts in Thousands)
|
|
For the Years Ended December 31,
|
||||||||||
|
|
2015
|
2014
|
2013
|
||||||||
|
Net Income (Loss)
|
$
|
5,275,032
|
|
$
|
5,395,020
|
|
$
|
7,854,228
|
|
||
|
Other Comprehensive Income (Loss), Net of Tax:
|
|
|
|
|
|||||||
|
Foreign Currency Translation Gain (Loss)
|
(27,176
|
)
|
(37,119
|
)
|
(4,642
|
)
|
|||||
|
Comprehensive Income (Loss)
|
5,247,856
|
|
5,357,901
|
|
7,849,586
|
|
|||||
|
Less: Comprehensive Income (Loss) Attributable to Redeemable Noncontrolling Interests
|
(4,512
|
)
|
(3,341
|
)
|
62,255
|
|
|||||
|
Less: Comprehensive Income (Loss) Attributable to Noncontrolling Interests and Appropriated Capital
|
4,771,152
|
|
4,897,831
|
|
7,096,898
|
|
|||||
|
Comprehensive Income (Loss) Attributable to KKR & Co. L.P.
|
$
|
481,216
|
|
$
|
463,411
|
|
$
|
690,433
|
|
||
See notes to consolidated financial statements.
171
KKR & CO. L.P.
CONSOLIDATED STATEMENTS OF CHANGES IN EQUITY
(Amounts in Thousands, Except Unit Data)
|
|
KKR & Co. L.P.
|
|
|
|
||||||||||||||||||||||
|
Common
Units
|
Partners’
Capital
|
Accumulated
Other
Comprehensive
Income (Loss)
|
Noncontrolling
Interests
|
Appropriated Capital
|
Total
Equity
|
Redeemable
Noncontrolling
Interests
|
||||||||||||||||||||
|
Balance at January 1, 2013
|
253,363,691
|
|
$
|
2,008,965
|
|
$
|
(4,606
|
)
|
$
|
38,938,531
|
|
$
|
—
|
|
$
|
40,942,890
|
|
$
|
462,564
|
|
||||||
|
Net Income (Loss)
|
|
|
691,226
|
|
|
|
7,100,747
|
|
7,791,973
|
|
62,255
|
|
||||||||||||||
|
Other Comprehensive Income (Loss)-Foreign Currency Translation (Net of Tax)
|
|
|
|
|
(793
|
)
|
(3,849
|
)
|
(4,642
|
)
|
|
|
||||||||||||||
|
Contributions of Net Assets of previously Unconsolidated Entities
|
294,767
|
|
294,767
|
|
||||||||||||||||||||||
|
Exchange of KKR Holdings L.P. Units and Other Exchangeable Securities to KKR & Co. L.P. Common Units
|
28,184,258
|
|
333,804
|
|
(776
|
)
|
(333,028
|
)
|
—
|
|
|
|
||||||||||||||
|
Tax Effects Resulting from Exchange of KKR Holdings L.P. Units and delivery of KKR & Co. L.P. Common Units
|
|
|
18,924
|
|
276
|
|
|
|
19,200
|
|
|
|
||||||||||||||
|
Net Delivery of Common Units-Equity Incentive Plan
|
6,595,378
|
|
(8,136
|
)
|
|
|
|
|
(8,136
|
)
|
|
|
||||||||||||||
|
Equity Based Compensation
|
114,709
|
|
|
|
192,805
|
|
307,514
|
|
|
|
||||||||||||||||
|
Capital Contributions
|
|
|
|
|
7,475,577
|
|
7,475,577
|
|
176,503
|
|
||||||||||||||||
|
Capital Distributions
|
|
|
(431,583
|
)
|
|
|
(10,430,549
|
)
|
(10,862,132
|
)
|
(73,515
|
)
|
||||||||||||||
|
Balance at December 31, 2013
|
288,143,327
|
|
$
|
2,727,909
|
|
$
|
(5,899
|
)
|
$
|
43,235,001
|
|
$
|
—
|
|
$
|
45,957,011
|
|
$
|
627,807
|
|
||||||
|
Net Income (Loss)
|
|
|
477,611
|
|
|
|
4,929,337
|
|
(8,587
|
)
|
5,398,361
|
|
(3,341
|
)
|
||||||||||||
|
Other Comprehensive Income (Loss)-Foreign Currency Translation (Net of Tax)
|
|
|
|
|
(14,200
|
)
|
(20,725
|
)
|
(2,194
|
)
|
(37,119
|
)
|
|
|
||||||||||||
|
Exchange of KKR Holdings L.P. Units and Other Exchangeable Securities to KKR & Co. L.P. Common Units and transfers of CLO beneficial interests to appropriated capital
|
27,228,991
|
|
332,479
|
|
(833
|
)
|
(359,322
|
)
|
27,676
|
|
—
|
|
|
|
||||||||||||
|
Tax Effects Resulting from Exchange of KKR Holdings L.P. Units and delivery of KKR & Co. L.P. Common Units
|
|
|
46,311
|
|
528
|
|
|
|
46,839
|
|
|
|
||||||||||||||
|
Net Delivery of Common Units-Equity Incentive Plan
|
9,952,634
|
|
(8,757
|
)
|
|
|
|
|
(8,757
|
)
|
|
|
||||||||||||||
|
Equity Based Compensation
|
158,927
|
|
|
|
151,476
|
|
310,403
|
|
|
|
||||||||||||||||
|
Acquisitions
|
108,005,588
|
|
2,453,610
|
|
435,478
|
|
2,889,088
|
|
||||||||||||||||||
|
Capital Contributions
|
|
|
|
|
11,236,018
|
|
11,236,018
|
|
148,355
|
|
||||||||||||||||
|
Capital Distributions
|
|
|
(784,995
|
)
|
|
|
(13,602,886
|
)
|
(14,387,881
|
)
|
(472,723
|
)
|
||||||||||||||
|
Balance at December 31, 2014
|
433,330,540
|
|
$
|
5,403,095
|
|
$
|
(20,404
|
)
|
$
|
46,004,377
|
|
$
|
16,895
|
|
$
|
51,403,963
|
|
$
|
300,098
|
|
||||||
|
Net Income (Loss)
|
|
|
488,482
|
|
|
|
4,791,062
|
|
5,279,544
|
|
(4,512
|
)
|
||||||||||||||
|
Other Comprehensive Income (Loss)- Foreign Currency Translation (Net of Tax)
|
|
|
|
|
(7,266
|
)
|
(19,910
|
)
|
(27,176
|
)
|
|
|
||||||||||||||
|
Cumulative-effect adjustment from adoption of accounting guidance
|
(307
|
)
|
(16,895
|
)
|
(17,202
|
)
|
||||||||||||||||||||
|
Exchange of KKR Holdings L.P. Units and Other Securities to KKR & Co. L.P. Common Units
|
16,095,538
|
|
207,114
|
|
(1,483
|
)
|
(205,631
|
)
|
—
|
|
|
|
||||||||||||||
|
Tax Effects Resulting from Exchange of KKR Holdings L.P. Units and delivery of KKR & Co. L.P. Common Units
|
|
|
18,244
|
|
354
|
|
|
|
|
|
18,598
|
|
|
|
||||||||||||
|
Net Delivery of Common Units-Equity Incentive Plan
|
10,964,144
|
|
15,245
|
|
|
|
15,245
|
|
||||||||||||||||||
|
Equity Based Compensation
|
|
|
186,346
|
|
|
|
75,233
|
|
|
|
261,579
|
|
|
|
||||||||||||
|
Common Units Issued in Connection with the Purchase of an Investment
|
7,364,545
|
|
126,302
|
|
126,302
|
|
||||||||||||||||||||
|
Unit Repurchases
|
(9,919,892
|
)
|
(161,929
|
)
|
(161,929
|
)
|
||||||||||||||||||||
|
Capital Contributions
|
|
|
0
|
|
|
|
6,274,296
|
|
|
|
6,274,296
|
|
193,269
|
|
||||||||||||
|
Capital Distributions
|
|
|
(706,611
|
)
|
|
|
(13,187,653
|
)
|
|
|
(13,894,264
|
)
|
(300,226
|
)
|
||||||||||||
|
Balance at December 31, 2015
|
457,834,875
|
|
$
|
5,575,981
|
|
$
|
(28,799
|
)
|
$
|
43,731,774
|
|
$
|
—
|
|
$
|
49,278,956
|
|
$
|
188,629
|
|
||||||
See notes to consolidated financial statements.
172
KKR & CO. L.P.
CONSOLIDATED STATEMENTS OF CASH FLOWS
(Amounts in Thousands)
|
|
For the Years Ended December 31,
|
||||||||||
|
|
2015
|
2014
|
2013
|
||||||||
|
Operating Activities
|
|
|
|
|
|
|
|||||
|
Net Income (Loss)
|
$
|
5,275,032
|
|
$
|
5,395,020
|
|
$
|
7,854,228
|
|
||
|
Adjustments to Reconcile Net Income (Loss) to Net Cash Provided (Used) by Operating Activities:
|
|
|
|
|
|||||||
|
Equity Based Compensation
|
261,579
|
|
310,403
|
|
307,514
|
|
|||||
|
Net Realized (Gains) Losses on Investments
|
(3,001,884
|
)
|
(5,433,586
|
)
|
(3,909,432
|
)
|
|||||
|
Change in Unrealized (Gains) Losses on Investments
|
(1,670,743
|
)
|
655,354
|
|
(3,916,650
|
)
|
|||||
|
Other Non-Cash Amounts
|
(78,522
|
)
|
73,061
|
|
(95,961
|
)
|
|||||
|
Cash Flows Due to Changes in Operating Assets and Liabilities:
|
|
|
|
|
|
|
|||||
|
Change in Cash and Cash Equivalents Held at Consolidated Entities
|
(160,092
|
)
|
(166,275
|
)
|
166,552
|
|
|||||
|
Change in Due from / to Affiliates
|
15,264
|
|
(3,368
|
)
|
(25,314
|
)
|
|||||
|
Change in Other Assets
|
605,305
|
|
(150,131
|
)
|
248,330
|
|
|||||
|
Change in Accounts Payable, Accrued Expenses and Other Liabilities
|
(187,661
|
)
|
(156,176
|
)
|
578,724
|
|
|||||
|
Investments Purchased
|
(27,936,898
|
)
|
(37,935,909
|
)
|
(31,844,648
|
)
|
|||||
|
Proceeds from Sale of Investments and Principal Payments
|
27,264,024
|
|
38,900,257
|
|
33,214,410
|
|
|||||
|
Net Cash Provided (Used) by Operating Activities
|
385,404
|
|
1,488,650
|
|
2,577,753
|
|
|||||
|
Investing Activities
|
|
|
|
|
|
|
|||||
|
Change in Restricted Cash and Cash Equivalents
|
(164,637
|
)
|
(10,849
|
)
|
29,852
|
|
|||||
|
Purchases of Fixed Assets
|
(169,419
|
)
|
(12,163
|
)
|
(14,396
|
)
|
|||||
|
Development of Oil and Natural Gas Properties
|
(95,959
|
)
|
(233,777
|
)
|
—
|
|
|||||
|
Proceeds from Sale of Oil and Natural Gas Properties
|
4,863
|
|
82,423
|
|
—
|
|
|||||
|
Net Cash Acquired
|
—
|
|
151,491
|
|
—
|
|
|||||
|
Net Cash Provided (Used) by Investing Activities
|
(425,152
|
)
|
(22,875
|
)
|
15,456
|
|
|||||
|
Financing Activities
|
|
|
|
|
|
|
|||||
|
Distributions to Partners
|
(706,611
|
)
|
(784,995
|
)
|
(431,583
|
)
|
|||||
|
Distributions to Redeemable Noncontrolling Interests
|
(300,226
|
)
|
(472,723
|
)
|
(73,515
|
)
|
|||||
|
Contributions from Redeemable Noncontrolling Interests
|
193,269
|
|
148,355
|
|
176,503
|
|
|||||
|
Distributions to Noncontrolling Interests
|
(13,187,653
|
)
|
(13,602,886
|
)
|
(10,430,549
|
)
|
|||||
|
Contributions from Noncontrolling Interests
|
6,274,296
|
|
11,196,066
|
|
7,475,577
|
|
|||||
|
Net Delivery of Common Units - Equity Incentive Plan
|
15,245
|
|
(8,757
|
)
|
(8,136
|
)
|
|||||
|
Unit Repurchases
|
(161,929
|
)
|
—
|
|
—
|
|
|||||
|
Proceeds from Debt Obligations
|
14,014,510
|
|
5,433,135
|
|
1,374,343
|
|
|||||
|
Repayment of Debt Obligations
|
(5,926,162
|
)
|
(3,728,195
|
)
|
(594,970
|
)
|
|||||
|
Financing Costs Paid
|
(45,331
|
)
|
(34,078
|
)
|
(4,960
|
)
|
|||||
|
Net Cash Provided (Used) by Financing Activities
|
169,408
|
|
(1,854,078
|
)
|
(2,517,290
|
)
|
|||||
|
Net Increase/(Decrease) in Cash and Cash Equivalents
|
129,660
|
|
(388,303
|
)
|
75,919
|
|
|||||
|
Cash and Cash Equivalents, Beginning of Period
|
918,080
|
|
1,306,383
|
|
1,230,464
|
|
|||||
|
Cash and Cash Equivalents, End of Period
|
$
|
1,047,740
|
|
$
|
918,080
|
|
$
|
1,306,383
|
|
||
See notes to consolidated financial statements.
173
KKR & CO. L.P.
CONSOLIDATED STATEMENTS OF CASH FLOWS (Continued)
(Amounts in Thousands)
|
|
For the Years Ended December 31,
|
||||||||||
|
|
2015
|
2014
|
2013
|
||||||||
|
Supplemental Disclosures of Cash Flow Information
|
|
|
|
|
|||||||
|
Payments for Interest
|
$
|
485,739
|
|
$
|
195,055
|
|
$
|
74,835
|
|
||
|
Payments for Income Taxes
|
$
|
40,468
|
|
$
|
47,138
|
|
$
|
81,419
|
|
||
|
Supplemental Disclosures of Non-Cash Investing and Financing Activities
|
|
|
|
|
|||||||
|
Non-Cash Contributions of Equity Based Compensation
|
$
|
261,579
|
|
$
|
310,403
|
|
$
|
307,514
|
|
||
|
Cumulative effect adjustment from adoption of accounting guidance
|
$
|
(17,202
|
)
|
$
|
—
|
|
$
|
—
|
|
||
|
Debt Obligations - Net Gains (Losses), Translation and Other
|
$
|
226,577
|
|
$
|
328,464
|
|
$
|
(5,435
|
)
|
||
|
Tax Effects Resulting from Exchange of KKR Holdings L.P. Units and delivery of KKR & Co. L.P. Common Units
|
$
|
18,598
|
|
$
|
46,839
|
|
$
|
19,200
|
|
||
|
Non-Cash Contributions from Noncontrolling Interests
|
$
|
—
|
|
$
|
39,952
|
|
$
|
—
|
|
||
|
Impairments of Oil and Natural Gas Properties
|
$
|
53,926
|
|
$
|
220,063
|
|
$
|
—
|
|
||
|
Gains on Sales of Oil and Natural Gas Properties
|
$
|
—
|
|
$
|
16,924
|
|
$
|
—
|
|
||
|
Net Assets Acquired
|
|
|
|
|
|||||||
|
Cash and Cash Equivalents Held at Consolidated Entities
|
$
|
—
|
|
$
|
765,231
|
|
$
|
—
|
|
||
|
Restricted Cash and Cash Equivalents
|
$
|
—
|
|
$
|
35,038
|
|
$
|
—
|
|
||
|
Investments
|
$
|
—
|
|
$
|
9,225,660
|
|
$
|
—
|
|
||
|
Other Assets
|
$
|
—
|
|
$
|
885,314
|
|
$
|
—
|
|
||
|
Debt Obligations
|
$
|
—
|
|
$
|
7,538,726
|
|
$
|
—
|
|
||
|
Accounts Payable, Accrued Expenses and Other Liabilities
|
$
|
—
|
|
$
|
616,979
|
|
$
|
—
|
|
||
|
Contribution of Net Assets of Previously Unconsolidated Entities
|
|||||||||||
|
Investments
|
$
|
—
|
|
$
|
—
|
|
$
|
294,767
|
|
||
See notes to consolidated financial statements.
174
KKR & CO. L.P.
NOTES TO CONSOLIDATED FINANCIAL STATEMENTS
(All Amounts in Thousands, Except Unit, Per Unit Data, and Except Where Noted)
1. ORGANIZATION
KKR & Co. L.P. (NYSE: KKR), together with its consolidated subsidiaries (“KKR”), is a leading global investment firm that manages investments across multiple asset classes including private equity, energy, infrastructure, real estate, credit and hedge funds. KKR aims to generate attractive investment returns by following a patient and disciplined investment approach, employing world class people, and driving growth and value creation at the asset level. KKR invests its own capital alongside the capital it manages for fund investors and brings debt and equity investment opportunities to others through its capital markets business.
KKR & Co. L.P. was formed as a Delaware limited partnership on June 25, 2007 and its general partner is KKR Management LLC (the “Managing Partner”). KKR & Co. L.P. is the parent company of KKR Group Limited, which is the non-economic general partner of KKR Group Holdings L.P. (“Group Holdings”), and KKR & Co. L.P. is the sole limited partner of Group Holdings. Group Holdings holds a controlling economic interest in each of (i) KKR Management Holdings L.P. (“Management Holdings”) through KKR Management Holdings Corp., a Delaware corporation which is a domestic corporation for U.S. federal income tax purposes, (ii) KKR Fund Holdings L.P. (“Fund Holdings”) directly and through KKR Fund Holdings GP Limited, a Cayman Island limited company which is a disregarded entity for U.S. federal income tax purposes, and (iii) KKR International Holdings L.P. (“International Holdings”, and together with Management Holdings and Fund Holdings, the “KKR Group Partnerships”) directly and through KKR Fund Holdings GP Limited. Group Holdings also owns certain economic interests in Management Holdings through a wholly owned Delaware corporate subsidiary of KKR Management Holdings Corp. and certain economic interests in Fund Holdings through a Delaware partnership of which Group Holdings is the general partner with a
99%
economic interest and KKR Management Holdings Corp. is a limited partner with a
1%
economic interest. KKR & Co. L.P., through its indirect controlling economic interests in the KKR Group Partnerships, is the holding partnership for the KKR business.
KKR & Co. L.P. both indirectly controls the KKR Group Partnerships and indirectly holds Class A partner units in each KKR Group Partnership (collectively, “KKR Group Partnership Units”) representing economic interests in KKR’s business. The remaining KKR Group Partnership Units are held by KKR Holdings L.P. (“KKR Holdings”), which is not a subsidiary of KKR. As of
December 31, 2015
, KKR & Co. L.P. held approximately
56%
of the KKR Group Partnership Units and principals through KKR Holdings held approximately
44%
of the KKR Group Partnership Units. The percentage ownership in the KKR Group Partnerships will continue to change as KKR Holdings and/or principals exchange units in the KKR Group Partnerships for KKR & Co. L.P. common units or when KKR & Co. L.P. otherwise issues or repurchases KKR & Co. L.P. common units.
For acquisitions KKR made during the year ended December 31, 2014, see Note 14 “Acquisitions”.
The following table presents the effect of changes in the ownership interest in the KKR Group Partnerships on KKR:
|
For the Years Ended December 31,
|
|||||||||||
|
2015
|
2014
|
2013
|
|||||||||
|
Net income (loss) attributable to KKR & Co. L.P.
|
$
|
488,482
|
|
$
|
477,611
|
|
$
|
691,226
|
|
||
|
Transfers from noncontrolling interests:
|
|||||||||||
|
Exchange of KKR Group Partnership units held by KKR Holdings L.P.(a)
|
212,043
|
|
380,916
|
|
341,410
|
|
|||||
|
Change from net income (loss) attributable to KKR & Co. L.P. and transfers from noncontrolling interests held by KKR Holdings
|
$
|
700,525
|
|
$
|
858,527
|
|
$
|
1,032,636
|
|
||
|
(a)
|
Increase in KKR’s partners’ capital for exchange of
15,850,161
,
27,172,269
and
28,184,258
for the years ended December 31, 2015, 2014, and 2013, respectively, KKR Group Partnerships units held by KKR Holdings L.P., inclusive of deferred taxes.
|
175
Notes to Consolidated Financial Statements (Continued)
2. SUMMARY OF SIGNIFICANT ACCOUNTING POLICIES
Basis of Presentation
The accompanying consolidated financial statements (referred to hereafter as the “financial statements”) have been prepared in accordance with accounting principles generally accepted in the United States of America (“GAAP”).
KKR & Co. L.P. consolidates the financial results of the KKR Group Partnerships and their consolidated subsidiaries, which include the accounts of KKR’s investment management and capital markets companies, the general partners of certain unconsolidated funds and vehicles, general partners of consolidated funds and their respective consolidated funds and certain other entities including CFEs. References in the accompanying financial statements to “principals” are to KKR’s senior employees and non‑employee operating consultants who hold interests in KKR’s business through KKR Holdings, and references to “Senior Principals” are to KKR’s senior employees who hold interests in the Managing Partner entitling them to vote for the election of the Managing Partner’s directors.
All intercompany transactions and balances have been eliminated.
Use of Estimates
The preparation of the financial statements in conformity with GAAP requires management to make estimates and assumptions that affect the reported amounts of assets and liabilities, the disclosure of contingent assets and liabilities at the date of the financial statements and the reported amounts of fees, expenses and investment income (loss) during the reporting periods. Such estimates include but are not limited to the valuation of investments and financial instruments. Actual results could differ from those estimates, and such differences could be material to the financial statements.
Principles of Consolidation
The types of entities KKR assesses for consolidation include (i) subsidiaries, including management companies, broker-dealers and general partners of investment funds that KKR manages, (ii) entities that have all the attributes of an investment company, like investment funds, (iii) CFEs and (iv) other entities, including entities that employ non-employee operating consultants. Each of these entities is assessed for consolidation on a case by case basis depending on the specific facts and circumstances surrounding that entity.
Pursuant to its consolidation policy, KKR first considers whether an entity is considered a VIE and therefore whether to apply the consolidation guidance under the VIE model. Entities that do not qualify as VIEs are generally assessed for consolidation as voting interest entities (“VOEs”) under the voting interest model.
The consolidation rules were revised effective January 1, 2010 which had the effect of changing the criteria for determining whether a reporting entity is the primary beneficiary of a VIE. However, the adoption of these new consolidation rules was indefinitely deferred (the “Deferral”) for a reporting entity’s interests in certain entities. In particular, entities that have all the attributes of an investment company such as investment funds generally meet the conditions necessary for the Deferral. Entities that are securitization or asset-backed financing entities such as CFEs would generally not qualify for the Deferral. Accordingly, when making the assessment of whether an entity is a VIE, KKR considers whether the entity being assessed meets the conditions for the Deferral and therefore would be subject to the rules that existed prior to January 1, 2010. Under both sets of rules, VIEs for which KKR is determined to be the primary beneficiary are consolidated and such VIEs generally include certain CFEs and entities that employ non-employee operating consultants.
An entity in which KKR holds a variable interest is a VIE if any one of the following conditions exist: (a) the total equity investment at risk is not sufficient to permit the legal entity to finance its activities without additional subordinated financial support, (b) the holders of equity investment at risk (as a group) lack either the direct or indirect ability through voting rights or similar rights to make decisions about a legal entity’s activities that have a significant effect on the success of the legal entity or the obligation to absorb the expected losses or right to receive the expected residual returns, or (c) the voting rights of some investors are disproportionate to their obligation to absorb the expected losses of the legal entity, their rights to receive the expected residual returns of the legal entity, or both and substantially all of the legal entity’s activities either involve or are conducted on behalf of an investor with disproportionately few voting rights.
With respect to VIEs such as KKR’s investment funds that qualify for the Deferral and therefore apply the previous consolidation rules, KKR is determined to be the primary beneficiary if its involvement, through holding interests directly or indirectly in the VIE or contractually through other variable interests (e.g., carried interest), would be expected to absorb a
176
Notes to Consolidated Financial Statements (Continued)
majority of the VIE’s expected losses, receive a majority of the VIE’s expected residual returns, or both. In cases where two or more KKR related parties hold a variable interest in a VIE, and the aggregate variable interest held by those parties would, if held by a single party, identify that party as the primary beneficiary, then KKR is determined to be the primary beneficiary to the extent it is the party within the related party group that is most closely associated with the VIE.
Under the voting interest model, KKR consolidates those entities it controls through a majority voting interest or through other means, including those VOEs in which the general partner is presumed to have control. KKR does not consolidate those VOEs in which the presumption of control by the general partner has been overcome through either the granting of substantive rights to the unaffiliated fund investors to either dissolve the fund or remove the general partner (“kick-out rights”) or the granting of substantive participating rights.
The consolidation assessment, including the determination as to whether an entity qualifies as a VIE or VOE depends on the facts and circumstances surrounding each entity and therefore certain of KKR’s investment funds may qualify as VIEs whereas others may qualify as VOEs.
With respect to KKR’s consolidated funds that are not CFEs, KKR meets the criteria for the Deferral and therefore applies the consolidation rules that existed prior to January 1, 2010. For these funds, KKR generally has operational discretion and control, and fund investors have no substantive rights to impact ongoing governance and operating activities of the fund, including the ability to remove the general partner, also known as kick-out rights. As a result, a fund should be consolidated unless KKR has a nominal level of equity at risk. To the extent that KKR commits a nominal amount of equity to a given fund and has no obligation to fund any future losses, the equity at risk to KKR is not considered substantive and the fund is typically considered a VIE. In these cases, the fund investors are generally deemed to be the primary beneficiaries, and KKR does not consolidate the fund. In cases when KKR’s equity at risk is deemed to be substantive, the fund is generally considered to be a VOE and KKR generally consolidates the fund under the VOE model.
With respect to CFEs, which are generally VIEs, the criteria for the Deferral are not met and therefore KKR applies the consolidation rules issued on January 1, 2010.
With respect to CLOs, in its role as collateral manager, KKR generally has the power to direct the activities of the CLO entities that most significantly impact the economic performance of the entity. In some, but not all cases, KKR, through both its residual interest in the CLO and the potential to earn an incentive fee, may have variable interests that represent an obligation to absorb losses of, or a right to receive benefits from, the CLO that could potentially be significant to the CLO. In cases where KKR has both (a) the power to direct the activities of the CLO that most significantly impact the CLOs economic performance and (b) the obligation to absorb losses of the CLO or the right to receive benefits from the CLO that could potentially be significant to the CLO, KKR consolidates the CLO.
With respect to consolidated CMBS vehicles, KKR holds unrated and non-investment grade rated securities issued by the CMBS, which are the most subordinate tranche of the CMBS vehicle. The economic performance of the CMBS is most significantly impacted by the performance of the underlying assets. Thus, the activities that most significantly impact the CMBS economic performance are the activities that most significantly impact the performance of the underlying assets. The special servicer has the ability to manage the CMBS assets that are delinquent or in default to improve the economic performance of the CMBS. KKR generally has the right to unilaterally appoint and remove the special servicer for the CMBS and as such is considered the controlling class of the CMBS vehicle. These rights give KKR the ability to direct the activities that could most significantly impact the economic performance of the CMBS. Additionally, as the holder of the most subordinate tranche, KKR is in a first loss position and has the right to receive benefits, including the actual residual returns of the CMBS, if any. In these cases, KKR is deemed to be the primary beneficiary and consolidates the CMBS.
Certain of KKR’s funds and CFEs are consolidated by KKR notwithstanding the fact that KKR has only a minority economic interest in those funds and CFEs. KKR’s financial statements reflect the assets, liabilities, fees, expenses, investment income (loss) and cash flows of the consolidated KKR funds and CFEs on a gross basis. With respect to KKR's consolidated funds, the majority of the economic interests in those funds, which are held by fund investors or other third parties, are attributed to noncontrolling interests in the accompanying financial statements. All of the management fees and certain other amounts earned by KKR from those funds are eliminated in consolidation. However, because the eliminated amounts are earned from and funded by noncontrolling interests, KKR’s attributable share of the net income (loss) from those funds is increased by the amounts eliminated. Accordingly, the elimination in consolidation of such amounts has
no
effect on net income (loss) attributable to KKR or KKR partners’ capital. With respect to consolidated CFEs, interests held by third party investors are recorded in debt obligations.
177
Notes to Consolidated Financial Statements (Continued)
KKR’s funds are, for GAAP purposes, investment companies and therefore are not required to consolidate their investments in portfolio companies even if majority-owned and controlled. Rather, the consolidated funds and vehicles reflect their investments at fair value as described below in “Fair Value Measurements”.
Business Combinations
Acquisitions are accounted for using the acquisition method of accounting. The purchase price of an acquisition is allocated to the assets acquired and liabilities assumed using the estimated fair values at the acquisition date. Transaction costs are expensed as incurred.
Intangible Assets
Intangible assets consist primarily of contractual rights to earn future fee income, including management and incentive fees, and are recorded in Other Assets in the accompanying consolidated statements of financial condition. Identifiable finite-lived intangible assets are amortized on a straight-line basis over their estimated useful lives and amortization expense is included within General, Administrative and Other in the accompanying consolidated statements of operations. Intangible assets are reviewed for impairment when circumstances indicate impairment may exist. KKR does not have any indefinite-lived intangible assets.
Goodwill
Goodwill represents the excess of acquisition cost over the fair value of net tangible and intangible assets acquired in connection with an acquisition. Goodwill is assessed for impairment annually or more frequently if circumstances indicate impairment may have occurred. Goodwill is recorded in Other Assets in the accompanying consolidated statements of financial condition.
Redeemable Noncontrolling Interests
Redeemable Noncontrolling Interests represent noncontrolling interests of certain investment vehicles and funds that are subject to periodic redemption by fund investors following the expiration of a specified period of time (typically between
one
and
three years
), or may be withdrawn subject to a redemption fee during the period when capital may not be otherwise withdrawn. Fund investors interests subject to redemption as described above are presented as Redeemable Noncontrolling Interests in the accompanying consolidated statements of financial condition and presented as Net Income (Loss) Attributable to Redeemable Noncontrolling Interests in the accompanying consolidated statements of operations.
When redeemable amounts become legally payable to fund investors, they are classified as a liability and included in Accounts Payable, Accrued Expenses and Other Liabilities in the accompanying consolidated statements of financial condition. For all consolidated investment vehicles and funds in which redemption rights have not been granted, noncontrolling interests are presented within Equity in the accompanying consolidated statements of financial condition as noncontrolling interests.
Noncontrolling Interests
Noncontrolling interests represent (i) noncontrolling interests in consolidated entities and (ii) noncontrolling interests held by KKR Holdings.
Noncontrolling Interests in Consolidated Entities
Noncontrolling interests in consolidated entities represent the non-redeemable ownership interests in KKR that are held primarily by:
|
(i)
|
third party fund investors in KKR’s funds;
|
|
(ii)
|
third parties entitled to up to
1%
of the carried interest received by certain general partners of KKR’s funds and
1%
of KKR’s other profits (losses) through and including December 31, 2015;
|
|
(iii)
|
certain former principals and their designees representing a portion of the carried interest received by the general partners of KKR’s private equity funds that was allocated to them with respect to private equity investments made during such former principals’ tenure with KKR prior to October 1, 2009;
|
178
Notes to Consolidated Financial Statements (Continued)
|
(iv)
|
certain principals and former principals representing all of the capital invested by or on behalf of the general partners of KKR’s private equity funds prior to October 1, 2009 and any returns thereon;
|
|
(v)
|
third parties in KKR’s capital markets business;
|
|
(vi)
|
holders of exchangeable equity securities representing ownership interests in a subsidiary of a KKR Group Partnership issued in connection with the acquisition of Avoca; and
|
|
(vii)
|
holders of the
7.375%
Series A LLC Preferred Shares of KFN whose rights are limited to the assets of KFN.
|
Noncontrolling Interests held by KKR Holdings
Noncontrolling interests held by KKR Holdings include economic interests held by principals in the KKR Group Partnerships. Such principals receive financial benefits from KKR’s business in the form of distributions received from KKR Holdings and through their direct and indirect participation in the value of KKR Group Partnership Units held by KKR Holdings. These financial benefits are not paid by KKR and are borne by KKR Holdings.
The following table presents the calculation of noncontrolling interests held by KKR Holdings:
|
|
For the Years Ended December 31,
|
||||||||||
|
|
2015
|
2014
|
2013
|
||||||||
|
Balance at the beginning of the period
|
$
|
4,661,679
|
|
$
|
5,116,761
|
|
$
|
4,981,864
|
|
||
|
Net income (loss) attributable to noncontrolling interests held by KKR Holdings (a)
|
433,693
|
|
585,135
|
|
1,056,126
|
|
|||||
|
Other comprehensive income (loss), net of tax (b)
|
(14,030
|
)
|
(15,202
|
)
|
(3,114
|
)
|
|||||
|
Impact of the exchange of KKR Holdings units to KKR & Co. L.P. common units (c)
|
(203,127
|
)
|
(357,551
|
)
|
(333,028
|
)
|
|||||
|
Equity based compensation
|
59,114
|
|
129,012
|
|
192,805
|
|
|||||
|
Capital contributions
|
25,573
|
|
30,402
|
|
31,553
|
|
|||||
|
Capital distributions
|
(615,749
|
)
|
(826,878
|
)
|
(809,445
|
)
|
|||||
|
Balance at the end of the period
|
$
|
4,347,153
|
|
|
$
|
4,661,679
|
|
$
|
5,116,761
|
|
|
|
(a)
|
Refer to the table below for calculation of Net income (loss) attributable to noncontrolling interests held by KKR Holdings.
|
|
(b)
|
Calculated on a pro rata basis based on the weighted average KKR Group Partnership Units held by KKR Holdings during the reporting period.
|
|
(c)
|
Calculated based on the proportion of KKR Holdings units exchanged for KKR & Co. L.P. common units pursuant to the exchange agreement during the reporting period. The exchange agreement provides for the exchange of KKR Group Partnership Units held by KKR Holdings for KKR & Co. L.P. common units.
|
Net income (loss) attributable to KKR & Co. L.P. after allocation to noncontrolling interests held by KKR Holdings, with the exception of certain tax assets and liabilities that are directly allocable to KKR Management Holdings Corp., is attributed based on the percentage of the weighted average KKR Group Partnership Units held by KKR and KKR Holdings, each of which hold equity of the KKR Group Partnerships. However, primarily because of the (i) contribution of certain expenses borne entirely by KKR Holdings, (ii) the periodic exchange of KKR Holdings units for KKR & Co. L.P. common units pursuant to the exchange agreement and (iii) the contribution of certain expenses borne entirely by KKR associated with the KKR & Co. L.P. 2010 Equity Incentive Plan (“Equity Incentive Plan”), equity allocations shown in the consolidated statement of changes in equity differ from their respective pro-rata ownership interests in KKR’s net assets.
179
Notes to Consolidated Financial Statements (Continued)
The following table presents net income (loss) attributable to noncontrolling interests held by KKR Holdings:
|
|
For the Years Ended December 31,
|
||||||||||
|
|
2015
|
2014
|
2013
|
||||||||
|
Net income (loss)
|
$
|
5,275,032
|
|
$
|
5,395,020
|
|
$
|
7,854,228
|
|
||
|
Less:
Net income (loss) attributable to Redeemable Noncontrolling Interests
|
(4,512
|
)
|
(3,341
|
)
|
62,255
|
|
|||||
|
Less:
Net income (loss) attributable to Noncontrolling Interests in consolidated entities and appropriated capital
|
4,357,369
|
|
4,335,615
|
|
6,044,621
|
|
|||||
|
Plus:
Income tax / (benefit) attributable to KKR Management Holdings Corp.
|
21,241
|
|
28,806
|
|
15,387
|
|
|||||
|
Net income (loss) attributable to KKR & Co. L.P. and KKR Holdings
|
$
|
943,416
|
|
$
|
1,091,552
|
|
$
|
1,762,739
|
|
||
|
Net income (loss) attributable to noncontrolling interests held by KKR Holdings
|
$
|
433,693
|
|
$
|
585,135
|
|
$
|
1,056,126
|
|
||
Investments
Investments consist primarily of private equity, real assets, credit, investments of consolidated CFEs, and other investments. Investments are carried at their estimated fair values, with unrealized gains or losses resulting from changes in fair value reflected as a component of Net Gains (Losses) from Investment Activities in the consolidated statements of operations. Investments denominated in currencies other than the U.S. dollar are valued based on the spot rate of the respective currency at the end of the reporting period with changes related to exchange rate movements reflected as a component of Net Gains (Losses) from Investment Activities in the consolidated statements of operations. Security and loan transactions are recorded on a trade date basis. Further disclosure on investments is presented in Note 4, “Investments.”
The following describes the types of securities held within each investment class.
Private Equity
— Consists primarily of equity investments in operating businesses.
Real Assets
— Consists primarily of investments in (i) energy related assets, principally oil and natural gas producing properties, (ii) infrastructure assets, and (iii) real estate, principally residential and commercial real estate assets and businesses, which, in each case, are held through consolidated investment vehicles.
Credit
— Consists primarily of investments in below investment grade corporate debt securities (primarily high yield bonds and syndicated bank loans), distressed and opportunistic debt and interests in unconsolidated CLOs.
Investments of Consolidated CFEs
— Consists primarily of (i) investments in below investment grade corporate debt securities (primarily high yield bonds and syndicated bank loans) held directly by the consolidated CLOs and (ii) investments in newly originated, fixed-rate mortgage loans held directly by the consolidated CMBS vehicles.
Other
— Consists primarily of (i) investments in common stock, preferred stock, warrants and options of companies that are not private equity, real assets, credit or investments of consolidated CFEs and (ii) equity method investments.
Energy Investments Held Through Consolidated Investment Vehicles
Certain energy investments are made through KKR’s consolidated investment funds, including investments in working and royalty interests in oil and natural gas producing properties as well as investments in operating companies that operate in the energy industry. Since these investments are held through investment funds, such investments are reflected at fair value as of the end of the reporting period.
Investments in operating companies that are held through KKR’s investment funds are generally classified within private equity investments and investments in working and royalty interests in oil and natural gas producing properties are generally classified as real asset investments. See also "Energy Investments held directly by KKR" within this footnote.
180
Notes to Consolidated Financial Statements (Continued)
Fair Value Measurements
Investments and other financial instruments are measured and carried at fair value. The majority of investments and other financial instruments are held by the consolidated funds and vehicles. KKR’s funds are, for GAAP purposes, investment companies and reflect their investments and other financial instruments at fair value. KKR has retained the specialized accounting for the consolidated funds and vehicles in consolidation. Accordingly, the unrealized gains and losses resulting from changes in fair value of the investments held by KKR’s funds are reflected as a component of Net Gains (Losses) from Investment Activities in the consolidated statements of operations.
For investments and other financial instruments that are not held in a consolidated fund or vehicle, KKR has elected the fair value option since these investments and other financial instruments are similar to those in the consolidated funds and vehicles. Such election is irrevocable and is applied on an investment by investment basis at initial recognition. Unrealized gains and losses resulting from changes in fair value are reflected as a component of Net Gains (Losses) from Investment Activities in the consolidated statements of operations. The methodology for measuring the fair value of such investments and other financial instruments is consistent with the methodologies applied to investments and other financial instruments that are held in consolidated funds and vehicles. In addition, KKR has elected the fair value option for the investments of consolidated CFEs.
The carrying amounts of Other Assets, Accounts Payable, Accrued Expenses and Other Liabilities recognized on the consolidated statements of financial condition (excluding fixed assets, goodwill, intangible assets, oil & gas assets, net, contingent consideration and certain debt obligations) approximate fair value due to their short term maturities. Further information on KKR’s debt obligations are presented in Note 9, “Debt Obligations.”
Fair value is the price that would be received to sell an asset or paid to transfer a liability in an orderly transaction between market participants at the measurement date. Where available, fair value is based on observable market prices or parameters or derived from such prices or parameters. Where observable prices or inputs are not available, valuation techniques are applied. These valuation techniques involve varying levels of management estimation and judgment, the degree of which is dependent on a variety of factors. See Note 5, “Fair Value Measurements” for further information on KKR’s valuation techniques that involve unobservable inputs. Assets and liabilities recorded at fair value in the statements of financial condition are categorized based upon the level of judgment associated with the inputs used to measure their fair value. Hierarchical levels, as defined under GAAP, are directly related to the amount of subjectivity associated with the inputs to the valuation of these assets and liabilities. The hierarchical levels defined under GAAP are as follows:
Level I
Inputs are unadjusted, quoted prices in active markets for identical assets or liabilities at the measurement date. The type of investments and other financial instruments included in this category are publicly-listed equities, debt and securities sold short.
Level II
Inputs are other than quoted prices that are observable for the asset or liability, either directly or indirectly. Level II inputs include quoted prices for similar instruments in active markets, and inputs other than quoted prices that are observable for the asset or liability. The type of investments and other financial instruments included in this category are credit investments, investments and debt obligations of consolidated CMBS vehicles and consolidated CLO entities (beginning on January 1, 2015), convertible debt securities indexed to publicly-listed securities, less liquid and restricted equity securities and certain over-the-counter derivatives such as foreign currency option and forward contracts.
Level III
Inputs are unobservable for the asset or liability, and include situations where there is little, if any, market activity for the asset or liability. The types of assets and liabilities generally included in this category are private portfolio companies, real assets investments, credit investments and debt obligations of consolidated CLOs (prior to January 1, 2015) for which a sufficiently liquid trading market does not exist.
In certain cases, the inputs used to measure fair value may fall into different levels of the fair value hierarchy. In such cases, the level in the fair value hierarchy within which the fair value measurement in its entirety falls has been determined based on the lowest level input that is significant to the fair value measurement in its entirety. KKR’s assessment of the significance of a particular input to the fair value measurement in its entirety requires judgment and consideration of factors specific to the asset.
181
Notes to Consolidated Financial Statements (Continued)
A significant decrease in the volume and level of activity for the asset or liability is an indication that transactions or quoted prices may not be representative of fair value because in such market conditions there may be increased instances of transactions that are not orderly. In those circumstances, further analysis of transactions or quoted prices is needed, and a significant adjustment to the transactions or quoted prices may be necessary to estimate fair value.
The availability of observable inputs can vary depending on the financial asset or liability and is affected by a wide variety of factors, including, for example, the type of instrument, whether the instrument has recently been issued, whether the instrument is traded on an active exchange or in the secondary market, and current market conditions. To the extent that valuation is based on models or inputs that are less observable or unobservable in the market, the determination of fair value requires more judgment. Accordingly, the degree of judgment exercised by KKR in determining fair value is greatest for instruments categorized in Level III. The variability and availability of the observable inputs affected by the factors described above may cause transfers between Levels I, II, and III, which KKR recognizes at the beginning of the reporting period.
Investments and other financial instruments that have readily observable market prices (such as those traded on a securities exchange) are stated at the last quoted sales price as of the reporting date. KKR does not adjust the quoted price for these investments, even in situations where KKR holds a large position and a sale could reasonably affect the quoted price.
Management’s determination of fair value is based upon the best information available for a given circumstance and may incorporate assumptions that are management’s best estimates after consideration of a variety of internal and external factors.
Measuring the Financial Assets and the Financial Liabilities of a Consolidated Collateralized Financing Entity
As of January 1, 2015, KKR has adopted the measurement alternative included in ASU 2014-13, “Measuring the Financial Assets and the Financial Liabilities of a Consolidated Collateralized Financing Entity” (“ASU 2014-13”), and has applied the amendments using a modified retrospective approach by recording a cumulative-effect adjustment to equity as of January 1, 2015. Refer to the consolidated statements of changes in equity for the impact of this adjustment. Pursuant to ASU 2014-13, KKR measures both the financial assets and financial liabilities of the consolidated CFEs in its consolidated financial statements using the more observable of the fair value of the financial assets and the fair value of the financial liabilities.
Prior to the adoption of ASU 2014-13, KKR elected the fair value option for the assets and liabilities of the consolidated CLO vehicles. As of January 1, 2015, KKR did not hold any beneficial interests in any CMBS vehicle, and consequently did not consolidate any CMBS vehicles. KKR accounted for the difference between the fair value of the assets and the fair value of the liabilities of the consolidated CLOs in Net Gains (Losses) from Investment Activities in the consolidated statements of operations. This amount was attributed to KKR and third party beneficial interest holders based on each beneficial holder’s residual interest in the consolidated CLOs. The amount attributed to third party beneficial interest holders was reflected in the consolidated statements of operations in Net Income (Loss) Attributable to Noncontrolling Interests and Appropriated Capital and in the consolidated statements of financial condition in Appropriated Capital within Equity. The amount was recorded as Appropriated Capital since the other holders of the CLOs’ beneficial interests, not KKR, received the benefits or absorbed the losses associated with their proportionate share of the CLOs’ assets and liabilities.
Pursuant to the adoption of ASU 2014-13, KKR is required to determine whether the fair value of the financial assets or financial liabilities are more observable. For the consolidated CLO entities, KKR has determined that the fair value of the financial assets of the consolidated CLOs, which are Level II assets within the GAAP hierarchical levels, are more observable than the fair value of the financial liabilities of the consolidated CLOs, which are Level III liabilities. As a result, the financial assets of the consolidated CLOs are being measured at fair value and the financial liabilities are being measured in consolidation as: (1) the sum of the fair value of the financial assets and the carrying value of any nonfinancial assets that are incidental to the operations of the CLOs less (2) the sum of the fair value of any beneficial interests retained by KKR (other than those that represent compensation for services) and KKR’s carrying value of any beneficial interests that represent compensation for services. The resulting amount is allocated to the individual financial liabilities (other than the beneficial interests retained by KKR).
For the consolidated CMBS vehicles, KKR has determined that the fair value of the financial liabilities of the consolidated CMBS vehicles, which are Level II liabilities within the GAAP hierarchical levels, are more observable than the fair value of the financial assets of the consolidated CMBS vehicles, which are Level III assets. As a result, the financial liabilities of the consolidated CMBS vehicles are being measured at fair value and the financial assets are being measured in consolidation as: (1) the sum of the fair value of the financial liabilities (other than the beneficial interests retained by KKR), the fair value of the beneficial interests retained by KKR and the carrying value of any nonfinancial liabilities that are incidental to the operations of
182
Notes to Consolidated Financial Statements (Continued)
the CMBS vehicles less (2) the carrying value of any nonfinancial assets that are incidental to the operations of the CMBS vehicles. The resulting amount is allocated to the individual financial assets.
Under the measurement alternative pursuant to ASU 2014-13, KKR’s consolidated net income (loss) reflects KKR’s own economic interests in the consolidated CFEs including (i) changes in the fair value of the beneficial interests retained by KKR and (ii) beneficial interests that represent compensation for services rendered.
Level II Valuation Methodologies
Financial assets and liabilities categorized as Level II consist primarily of credit investments, investments and debt obligations of consolidated CFEs, convertible debt securities indexed to publicly-listed securities, less liquid and restricted equity securities and certain over-the-counter derivatives such as foreign currency option and forward contracts.
Credit investments, investments of consolidated CLOs and CMBS debt obligations:
These instruments generally have bid and ask prices that can be observed in the marketplace. Bid prices reflect the highest price that KKR and others are willing to pay for an instrument. Ask prices represent the lowest price that KKR and others are willing to accept for an instrument. For financial assets and liabilities whose inputs are based on bid-ask prices obtained from third party pricing services, fair value may not always be a predetermined point in the bid-ask range. KKR’s policy is generally to allow for mid-market pricing and adjusting to the point within the bid-ask range that meets KKR’s best estimate of fair value.
Securities indexed to publicly listed securities:
The securities are typically valued using standard convertible security pricing models. The key inputs into these models that require some amount of judgment are the credit spreads utilized and the volatility assumed. To the extent the company being valued has other outstanding debt securities that are publicly-traded, the implied credit spread on the company’s other outstanding debt securities would be utilized in the valuation. To the extent the company being valued does not have other outstanding debt securities that are publicly-traded, the credit spread will be estimated based on the implied credit spreads observed in comparable publicly-traded debt securities. In certain cases, an additional spread will be added to reflect an illiquidity discount due to the fact that the security being valued is not publicly-traded. The volatility assumption is based upon the historically observed volatility of the underlying equity security into which the convertible debt security is convertible and/or the volatility implied by the prices of options on the underlying equity security.
Restricted Equity Securities:
The valuation of certain equity securities is based on an observable price for an identical security adjusted for the effect of a restriction.
Derivatives:
The valuation incorporates observable inputs comprising yield curves, foreign currency rates and credit spreads.
CLO Debt Obligations:
Beginning on January 1, 2015 with the adoption of ASU 2014-13, KKR measures CLO debt obligations on the basis of the fair value of the financial assets of the CLO.
Investments of consolidated CMBS vehicles:
KKR measures the investments of CMBS vehicles on the basis of the fair value of the financial liabilities of the CMBS.
Level III Valuation Methodologies
Financial assets and liabilities categorized as Level III consist primarily of the following:
Private Equity Investments:
KKR generally employs
two
valuation methodologies when determining the fair value of a private equity investment. The first methodology is typically a market comparables analysis that considers key financial inputs and recent public and private transactions and other available measures. The second methodology utilized is typically a discounted cash flow analysis, which incorporates significant assumptions and judgments. Estimates of key inputs used in this methodology include the weighted average cost of capital for the investment and assumed inputs used to calculate terminal values, such as exit EBITDA multiples. Other inputs are also used in both methodologies. However, when a definitive agreement has been executed to sell an investment, KKR generally considers a significant determinant of fair value to be the consideration to be received by KKR pursuant to the executed definitive agreement.
Upon completion of the valuations conducted using these methodologies, a weighting is ascribed to each method, and an illiquidity discount is typically applied where appropriate. The ultimate fair value recorded for a particular investment will
183
Notes to Consolidated Financial Statements (Continued)
generally be within a range suggested by the two methodologies, except that the value may be higher or lower than such range in the case of investments being sold pursuant to an executed definitive agreement.
When determining the weighting ascribed to each valuation methodology, KKR considers, among other factors, the availability of direct market comparables, the applicability of a discounted cash flow analysis, the expected hold period and manner of realization for the investment, and in the case of investments being sold pursuant to an executed definitive agreement, the probability of such sale being completed. These factors can result in different weightings among investments in the portfolio and in certain instances may result in up to a
100%
weighting to a single methodology. Across the Level III private equity investment portfolio, approximately
80.0%
of the fair value is derived from investments that are valued based exactly
50%
on market comparables and
50%
on a discounted cash flow analysis. Less than
5%
of the fair value of the Level III private equity investment portfolio is derived from investments that are valued either based
100%
on market comparables or
100%
on a discounted cash flow analysis.
When an illiquidity discount is to be applied, KKR seeks to take a uniform approach across its portfolio and generally applies a minimum
5%
discount to all private equity investments. KKR then evaluates such private equity investments to determine if factors exist that could make it more challenging to monetize the investment and, therefore, justify applying a higher illiquidity discount. These factors generally include (i) whether KKR is unable to sell the portfolio company or conduct an initial public offering of the portfolio company due to the consent rights of a third party or similar factors, (ii) whether the portfolio company is undergoing significant restructuring activity or similar factors and (iii) characteristics about the portfolio company regarding its size and/or whether the portfolio company is experiencing, or expected to experience, a significant decline in earnings. These factors generally make it less likely that a portfolio company would be sold or publicly offered in the near term at a price indicated by using just a market multiples and/or discounted cash flow analysis, and these factors tend to reduce the number of opportunities to sell an investment and/or increase the time horizon over which an investment may be monetized. Depending on the applicability of these factors, KKR determines the amount of any incremental illiquidity discount to be applied above the
5%
minimum, and during the time KKR holds the investment, the illiquidity discount may be increased or decreased, from time to time, based on changes to these factors. The amount of illiquidity discount applied at any time requires considerable judgment about what a market participant would consider and is based on the facts and circumstances of each individual investment. Accordingly, the illiquidity discount ultimately considered by a market participant upon the realization of any investment may be higher or lower than that estimated by KKR in its valuations.
Real Assets Investments:
Real asset investments in infrastructure, energy and real estate are valued using one or more of the discounted cash flow analysis, market comparables analysis and direct income capitalization, which in each case incorporates significant assumptions and judgments. Infrastructure investments are generally valued using the discounted cash flow analysis. Key inputs used in this methodology include the weighted average cost of capital and assumed inputs used to calculate terminal values, such as exit EBITDA multiples. Energy investments are generally valued using a discounted cash flow analysis. Key inputs used in this methodology that require estimates include the weighted average cost of capital. In addition, the valuations of energy investments generally incorporate both commodity prices as quoted on indices and long-term commodity price forecasts, which may be substantially different from, and are currently higher than, commodity prices on certain indices for equivalent future dates. Certain energy investments do not include an illiquidity discount. Long-term commodity price forecasts are utilized to capture the value of the investments across a range of commodity prices within the energy investment portfolio associated with future development and to reflect a range of price expectations. Real estate investments are generally valued using a combination of direct income capitalization and discounted cash flow analysis. Key inputs used in such methodologies that require estimates include an unlevered discount rate and current capitalization rate, and certain real estate investments do not include a minimum illiquidity discount. The valuations of real assets investments also use other inputs.
Credit Investments:
Credit investments are valued using values obtained from dealers or market makers, and where these values are not available, credit investments are valued by KKR based on ranges of valuations determined by an independent valuation firm. Valuation models are based on discounted cash flow analyses, for which the key inputs are determined based on market comparables, which incorporate similar instruments from similar issuers.
Other Investments:
With respect to other investments including equity method investments for which the fair value election has been made, KKR generally employs the same valuation methodologies as described above for private equity investments when valuing these other investments.
CLO Debt Obligations:
Prior to January 1, 2015 and the adoption of ASU 2014-13, collateralized loan obligation senior secured and subordinated notes were initially valued at the transaction price and were subsequently valued using a third party valuation service. The approach used to estimate the fair values was the discounted cash flow method, which includes consideration of the cash flows of the debt obligation based on projected quarterly interest payments and quarterly
184
Notes to Consolidated Financial Statements (Continued)
amortization. The debt obligations were discounted based on the appropriate yield curve given the debt obligation's respective maturity and credit rating. The most significant inputs to the valuation of these financial instruments were default and loss expectations and discount margins. As described above in
Fair Value Measurements
-
Summary of Significant Accounting Policies - Level II Valuation Methodologies,
beginning on January 1, 2015, with the adoption of ASU 2014-13, KKR measures CLO debt obligations on the basis of the fair value of the financial assets of the CLO.
Key unobservable inputs that have a significant impact on KKR’s Level III investment valuations as described above are included in Note 5 “Fair Value Measurements.” KKR utilizes several unobservable pricing inputs and assumptions in determining the fair value of its Level III investments. These unobservable pricing inputs and assumptions may differ by investment and in the application of KKR’s valuation methodologies. KKR’s reported fair value estimates could vary materially if KKR had chosen to incorporate different unobservable pricing inputs and other assumptions or, for applicable investments, if KKR only used either the discounted cash flow methodology or the market comparables methodology instead of assigning a weighting to both methodologies.
Level III Valuation Process
The valuation process involved for Level III measurements is completed on a quarterly basis and is designed to subject the valuation of Level III investments to an appropriate level of consistency, oversight, and review. As of December 31, 2015, the valuation process for Level III measurements, as described below, subjected valuations to the review and oversight of various committees. KKR has a Private Markets valuation committee for private equity and real assets investments and a valuation committee for credit and credit-related investments. The Private Markets valuation committee is assisted by subcommittees in the valuation of real asset and growth equity investments, and is also assisted by a valuation team. The Private Markets valuation committee is comprised only of employees who are not investment professionals responsible for preparing preliminary valuations or for oversight of the investments being valued. The valuation teams and subcommittees for real asset and growth equity investments, however, include investment professionals who participate in the preparation of preliminary valuations or are responsible for oversight for those investments. The credit valuation committee is also assisted by a valuation team. The credit valuation teams include investment professionals responsible for preparing preliminary valuations or for oversight of the investments being valued. The credit valuation committee is comprised of investment professionals with no responsibility for preparing preliminary valuations, but certain committee members are responsible for oversight of the investments being valued. The valuation committees and teams are responsible for coordinating and consistently implementing KKR’s quarterly valuation policies, guidelines and processes. For Private Markets investments classified as Level III, investment professionals prepare preliminary valuations based on their evaluation of financial and operating data, company specific developments, market valuations of comparable companies and other factors. These preliminary valuations are reviewed with the investment professionals by the applicable valuation team and are also reviewed by an independent valuation firm engaged by KKR to perform certain procedures in order to assess the reasonableness of KKR’s valuations annually for all Level III investments in Private Markets and quarterly for investments other than certain investments, which have values less than pre-set value thresholds and which in the aggregate comprise less than
5%
of the total value of KKR’s Level III Private Markets investments. For most investments classified as Level III in credit, in general, an independent valuation firm is engaged by KKR to provide third party valuations, or ranges of valuations from which KKR’s investment professionals select a point in the range to determine the preliminary valuation, or an independent valuation firm is engaged by KKR to perform certain procedures in order to assess the reasonableness and provide positive assurance of KKR’s valuations. These preliminary valuations are reviewed by senior investment professionals for each credit strategy. All preliminary valuations in Private Markets and Public Markets are then reviewed by the applicable valuation committee, and after reflecting any input by their respective valuation committees, the preliminary valuations are presented to the firm’s management committee. When these valuations are approved by this committee after reflecting any input from it, the valuations of Level III investments, as well as the valuations of Level I and Level II investments, are presented to the audit committee of KKR’s board of directors and are then reported on to the board of directors.
Energy Investments Held Directly by KKR
KKR makes certain energy investments directly in working and royalty interests in oil and natural gas producing properties outside its investment funds, which as a result of the acquisition of KKR Financial Holdings LLC ("KFN") on April 30, 2014 became more significant. Oil and natural gas producing activities are accounted for under the successful efforts method of accounting and such working interests are consolidated based on the proportion of the working interests held by KKR. Accordingly, KKR reflects its proportionate share of the underlying statements of financial condition and statements of operations of the consolidated working interests on a gross basis and changes in the value of these working interests are not reflected as unrealized gains and losses in the consolidated statements of operations. Under the successful efforts method, exploration costs, other than the costs of drilling exploratory wells, are charged to expense as incurred. Costs that are associated with the drilling of successful exploration wells are capitalized if proved reserves are found. Lease acquisition costs are
185
Notes to Consolidated Financial Statements (Continued)
capitalized when incurred. Costs associated with the drilling of exploratory wells that do not find proved reserves, geological and geophysical costs and costs of certain nonproducing leasehold costs are charged to expense as incurred.
Expenditures for repairs and maintenance, including workovers, are charged to expense as incurred.
The capitalized costs of producing oil and natural gas properties are depleted on a field-by-field basis using the units-of production method based on the ratio of current production to estimated total net proved oil, natural gas and natural gas liquid reserves. Proved developed reserves are used in computing depletion rates for drilling and development costs and total proved reserves are used for depletion rates of leasehold costs.
Estimated dismantlement and abandonment costs for oil and natural gas properties, net of salvage value, are capitalized at their estimated net present value and amortized on a unit-of-production basis over the remaining life of the related proved developed reserves.
Whenever events or changes in circumstances indicate that the carrying amounts of oil and natural gas properties may not be recoverable, KKR evaluates the proved oil and natural gas properties and related equipment and facilities for impairment on a field-by-field basis. The determination of recoverability is made based upon estimated undiscounted future net cash flows. The amount of impairment loss, if any, is determined by comparing the fair value, as determined by a discounted cash flow analysis, with the carrying value of the related asset. Unproved oil and natural gas properties are assessed periodically and, at a minimum, annually on a property-by-property basis, and any impairment in value is recognized when incurred and is recorded in General, Administrative, and Other expense in the consolidated statements of operations.
Fees and Other
Fees and other consist primarily of (i) transaction fees earned in connection with successful investment transactions and from capital markets activities, (ii) management and incentive fees from providing investment management services to unconsolidated funds, CLOs, other vehicles, and separately managed accounts, (iii) monitoring fees from providing services to portfolio companies, (iv) revenue earned by oil and gas-producing entities that are consolidated and (v) consulting fees earned by entities that employ non-employee operating consultants.
For the years ended
December 31, 2015
,
2014
and
2013
, respectively, fees and other consisted of the following:
|
|
For the Years Ended December 31,
|
||||||||||
|
|
2015
|
2014
|
2013
|
||||||||
|
Transaction Fees
|
$
|
337,544
|
|
$
|
425,019
|
|
$
|
287,387
|
|
||
|
Monitoring Fees
|
336,159
|
|
190,584
|
|
161,796
|
|
|||||
|
Management Fees
|
201,006
|
|
215,266
|
|
177,961
|
|
|||||
|
Oil and Gas Revenue
|
112,328
|
|
186,876
|
|
22,105
|
|
|||||
|
Consulting Fees
|
40,316
|
|
41,573
|
|
47,930
|
|
|||||
|
Incentive Fees
|
16,415
|
|
50,690
|
|
65,367
|
|
|||||
|
Total Fees and Other
|
$
|
1,043,768
|
|
$
|
1,110,008
|
|
$
|
762,546
|
|
||
All fees presented in the table above, except for oil and gas revenue, are earned from KKR investment funds, vehicles and portfolio companies. Consulting fees are earned by certain consolidated entities that employ non-employee operating consultants from providing advisory and other services to portfolio companies and other companies and are recognized as the services are rendered. These fees are separately negotiated with each company for which services are provided and are not shared with KKR.
Transaction Fees
Transaction fees are earned by KKR primarily in connection with successful investment transactions and capital markets activities. Transaction fees are recognized upon closing of the transaction. Fees are typically paid on or shortly after the closing of a transaction.
In connection with pursuing successful portfolio company investments, KKR receives reimbursement for certain transaction‑related expenses. Transaction‑related expenses, which are reimbursed by third parties, are typically deferred until the transaction is consummated and are recorded in Other Assets on the consolidated statements of financial condition on the
186
Notes to Consolidated Financial Statements (Continued)
date incurred. The costs of successfully completed transactions are borne by the KKR investment funds and included as a component of the investment’s cost basis. Subsequent to closing, investments are recorded at fair value each reporting period as described in the section above titled “Investments”. Upon reimbursement from a third party, the cash receipt is recorded and the deferred amounts are relieved. No fees or expenses are recorded for these reimbursements.
Monitoring Fees
Monitoring fees are earned by KKR for services provided to portfolio companies and are recognized as services are rendered. These fees are generally paid based on a fixed periodic schedule by the portfolio companies either in advance or in arrears and are separately negotiated for each portfolio company.
In connection with the monitoring of portfolio companies and certain unconsolidated funds, KKR receives reimbursement for certain expenses incurred on behalf of these entities. Costs incurred in monitoring these entities are classified as general, administrative and other expenses and reimbursements of such costs are classified as monitoring fees. In addition, certain monitoring fee provisions may provide for a termination payment following an initial public offering or change of control. These termination payments are recognized in the period when the related transaction closes.
Management Fees
Management fees are recognized in the period during which the related services are performed in accordance with the contractual terms of the related agreement. Management fees earned from private equity funds and certain investment vehicles are based upon a percentage of capital committed or capital invested during the investment period, and thereafter generally based on remaining invested capital or net asset value. For certain other investment vehicles, CLOs, and separately managed accounts, management fees are recognized in the period during which the related services are performed and are based upon the net asset value, gross assets or as otherwise defined in the respective agreements.
Management fees received from KKR’s consolidated funds and vehicles are eliminated in consolidation. However, because these amounts are funded by, and earned from, noncontrolling interests, KKR’s allocated share of the net income from KKR’s consolidated funds and vehicles is increased by the amount of fees that are eliminated. Accordingly, the elimination of these fees does not have an effect on the net income (loss) attributable to KKR or KKR partners’ capital.
Private Equity Funds
For KKR’s consolidated and unconsolidated private equity funds, gross management fees generally range from
1%
to
2%
of committed capital during the fund’s investment period and is generally
0.75%
to
1.25%
of invested capital after the expiration of the fund’s investment period with subsequent reductions over time. Typically, an investment period is defined as a period of up to
six
years. The actual length of the investment period may be shorter based on the timing and deployment of committed capital.
Certain of KKR’s private equity funds require the management company to refund up to
20%
of any cash management fees earned from limited partners in the event that the funds recognize a carried interest. At such time as the fund recognizes a carried interest in an amount sufficient to cover
20%
of the cash management fees earned or a portion thereof, a liability to the fund’s limited partners is recorded and revenue is reduced for the amount of the carried interest recognized, not to exceed
20%
of the cash management fees earned. The refunds to the limited partners are paid, and the liabilities relieved, at such time that the underlying investments are sold and the associated carried interests are realized. In the event that a fund’s carried interest is not sufficient to cover all or a portion of the amount that represents
20%
of the earned cash management fees, these fees would not be returned to the funds’ limited partners, in accordance with the respective fund agreements.
Other Investment Vehicles
Certain other investment vehicles that invest capital in real assets, credit and hedge fund strategies provide for management fees determined quarterly based on an annual rate generally ranging from
0.5%
to
1.5%
. Such rate may be based on the investment vehicles’ average net asset value, capital commitments, or invested capital.
CLOs
KKR’s management agreements for its CLO vehicles provide for senior collateral management fees and subordinate collateral management fees. Senior collateral management fees are determined based on an annual rate ranging from
0.15%
to
0.20%
of collateral and subordinate collateral management fees are determined based on an annual rate ranging from
0.30%
to
187
Notes to Consolidated Financial Statements (Continued)
0.35%
of collateral. If amounts distributable on any payment date are insufficient to pay the collateral management fees according to the priority of payments, any shortfall is deferred and payable on subsequent payment dates. KKR has the right to waive all or any portion of any collateral management fee. For the purpose of calculating the collateral management fees, collateral, the payment dates, and the priority of payments are terms defined in the management agreements.
Oil and Gas Revenue Recognition
Oil and gas revenues are recognized when production is sold to a purchaser at fixed or determinable prices, when delivery has occurred and title has transferred and collectability of the revenue is reasonably assured. The oil and gas producing entities consolidated by KKR follow the sales method of accounting for natural gas revenues. Under this method of accounting, revenues are recognized based on volumes sold, which may differ from the volume to which the entity is entitled based on KKR’s working interest. An imbalance is recognized as a liability only when the estimated remaining reserves will not be sufficient to enable the under-produced owners to recoup their entitled share through future production. Under the sales method, no receivables are recorded when these entities have taken less than their share of production and no payables are recorded when it has taken more than its share of production unless reserves are not sufficient.
Consulting Fees
Consulting fees are earned by certain consolidated entities that employ non‑employee operating consultants from providing advisory and other services to portfolio companies and other companies and are recognized as the services are rendered. These fees are separately negotiated with each company for which services are provided and are not shared with KKR.
Incentive Fees
Incentive fees earned on the performance of certain hedge fund structures are recognized based on fund performance, subject to the achievement of minimum return levels, and/or high water marks, in accordance with the respective terms set out in each fund’s governing agreements. Incentive fee rates generally range from
5%
to
20%
. KKR does not record performance‑based incentive fees until the end of each fund’s measurement period (which is generally
one
year) when the performance‑based incentive fees become fixed and determinable.
Investment Income
Investment income consists primarily of the net impact of:
|
(i)
|
Realized and unrealized gains and losses on investments, securities sold short and debt obligations of consolidated CFEs which are recorded in Net Gains (Losses) from Investment Activities.
|
|
(ii)
|
Foreign exchange gains and losses relating to mark‑to‑market activity on foreign exchange forward contracts, foreign currency options and foreign denominated debt which are recorded in Net Gains (Losses) from Investment Activities.
|
|
(iii)
|
Dividends, which are recognized on the ex‑dividend date, or in the absence of a formal declaration, on the date it is received.
|
|
(iv)
|
Interest income, which is recognized as earned.
|
|
(v)
|
Interest expense, which is recognized as incurred. In addition to these interest costs, KKR capitalizes debt financing costs incurred in connection with new debt arrangements. Such costs are amortized into interest expense using either the interest method or the straight‑line method, as appropriate.
|
Unrealized gains or losses result from changes in fair value of investments during the period and are included in Net Gains (Losses) from Investment Activities. Upon disposition of an investment, previously recognized unrealized gains or losses are reversed and a realized gain or loss is recognized.
Carried Interest
Carried interest entitles the general partner of a fund to a greater allocable share of the fund’s earnings from investments relative to the capital contributed by the general partner and correspondingly reduces noncontrolling interests’ attributable share of those earnings. Amounts earned pursuant to carried interest are included as investment income (loss) in Net Gains (Losses)
188
Notes to Consolidated Financial Statements (Continued)
from Investment Activities in the consolidated statements of operations and are earned by the general partner of those funds to the extent that cumulative investment returns are positive and where applicable, preferred return thresholds have been met. If these investment returns decrease or turn negative in subsequent periods, recognized carried interest will be reversed and reflected as investment losses in Net Gains (Losses) from Investment Activities in the consolidated statements of operations. Carried interest is recognized based on the contractual formula set forth in the agreements governing the fund as if the fund was terminated at the reporting date with the then estimated fair values of the investments realized. Due to the extended durations of KKR’s private equity funds and other investment vehicles, KKR believes that this approach results in income recognition that best reflects the periodic performance of KKR in the management of those funds. For funds that are consolidated, all investment income (loss), including the portion of a funds’ investment income (loss) that is allocable to KKR’s carried interest, is included in investment income (loss) on the consolidated statements of operations. The carried interest that KKR retains in net income (loss) attributable to KKR & Co. L.P. is reflected as an adjustment to net income (loss) attributable to noncontrolling interests. See Note 13 “Segment Reporting” for the amount of carried interest income earned or reversed for years ended
December 31, 2015
,
2014
and
2013
.
The agreements governing KKR’s private equity funds generally include a “clawback” or, in certain instances, a “net loss sharing” provision that, if triggered, may give rise to a contingent obligation that may require the general partner to return or contribute amounts to the fund for distribution to fund investors at the end of the life of the fund. See Note 17 “Commitments and Contingencies.”
Compensation and Benefits
Compensation and Benefits expense includes cash compensation consisting of salaries, bonuses, and benefits, as well as equity based compensation consisting of charges associated with the vesting of equity‑based awards and carry pool allocations.
All KKR employees and employees of certain consolidated entities receive a base salary that is paid by KKR or its consolidated entities, and is accounted for as Compensation and Benefits expense in the consolidated statements of operations. These employees are also eligible to receive discretionary cash bonuses based on performance, overall profitability and other matters. While cash bonuses paid to most employees are borne by KKR and certain consolidated entities and result in customary compensation and benefits expense, cash bonuses that are paid to certain of KKR’s principals are currently borne by KKR Holdings. These bonuses are funded with distributions that KKR Holdings receives on KKR Group Partnership Units held by KKR Holdings but are not then passed on to holders of unvested units of KKR Holdings. Because KKR principals are not entitled to receive distributions on units that are unvested, any amounts allocated to principals in excess of a principal’s vested equity interests are reflected as employee compensation and benefits expense. These compensation charges are recorded based on the unvested portion of quarterly earnings distributions received by KKR Holdings at the time of the distribution.
Further disclosure regarding equity based compensation is presented in Note 11 “Equity Based Compensation.”
Carry Pool Allocation
With respect to KKR’s active and future funds and co‑investment vehicles that provide for carried interest, KKR allocates to its employees and employees of certain consolidated entities a portion of the carried interest earned in relation to these funds as part of its carry pool. KKR currently allocates approximately
40%
of the carry it earns from these funds and vehicles to its carry pool. These amounts are accounted for as compensatory profit‑sharing arrangements in Accounts Payable, Accrued Expenses and Other Liabilities within the accompanying consolidated statements of financial condition in conjunction with the related carried interest income and recorded as compensation expense for KKR employees and general, administrative and other expense for certain non‑employee consultants and service providers in the consolidated statements of operations. See Note 13 “Segment Reporting” for the amount of carry pool allocation expense recognized for the years ended
December 31, 2015
,
2014
and
2013
.
Profit Sharing Plan
KKR provides certain profit sharing programs for KKR employees and other eligible personnel. In particular, KKR provides a 401(k) plan (the “Plan”) for eligible employees in the United States. For certain professionals who are participants in the Plan, KKR may, in its discretion, contribute an amount after the end of the Plan year. For the years ended
December 31, 2015
,
2014
and
2013
, KKR incurred expenses of
$7.9 million
,
$6.9 million
and
$7.7 million
, respectively, in connection with the Plan and other profit sharing programs.
189
Notes to Consolidated Financial Statements (Continued)
General, Administrative and Other
General, administrative and other expense consists primarily of professional fees paid to legal advisors, accountants, advisors and consultants, insurance costs, travel and related expenses, communications and information services, depreciation and amortization charges, changes in fair value of contingent consideration, expenses incurred by oil and gas‑producing entities (including impairment charges) that are consolidated and other general and operating expenses which are not borne by fund investors and are not offset by credits attributable to fund investors’ noncontrolling interests in consolidated funds. General, administrative and other expense also consists of costs incurred in connection with pursuing potential investments that do not result in completed transactions, a substantial portion of which are borne by fund investors.
Foreign Currency
Consolidated entities which have a functional currency that differs from KKR’s reporting currency are primarily KKR’s investment management and capital markets companies located outside the United States. Foreign currency denominated assets and liabilities are translated using the exchange rates prevailing at the end of each reporting period. Results of foreign operations are translated at the weighted average exchange rate for each reporting period. Translation adjustments are included as a component of accumulated other comprehensive income (loss) until realized. Foreign currency income or expenses resulting from transactions outside of the functional currency of a consolidated entity are recorded as incurred in general, administrative and other expense in the consolidated statements of operations.
Derivatives
Derivative contracts include forward, swap and option contracts related to foreign currencies and credit standing of reference entities to manage foreign exchange risk and credit risk arising from certain assets and liabilities. All derivatives are recognized in Other Assets or Accounts Payable, Accrued Expenses and Other Liabilities and are presented gross in the consolidated statements of financial condition and measured at fair value with changes in fair value recorded in Net Gains (Losses) from Investment Activities in the accompanying consolidated statements of operations. KKR’s derivative financial instruments contain credit risk to the extent that its counterparties may be unable to meet the terms of the agreements. KKR attempts to minimize this risk by limiting its counterparties to major financial institutions with strong credit ratings.
Securities Sold Short
Whether part of a hedging transaction or a transaction in its own right, securities sold short represent obligations of KKR to deliver the specified security at the contracted price at a future point in time, and thereby create a liability to repurchase the security in the market at the prevailing prices. The liability for such securities sold short, which is recorded in Accounts Payable, Accrued Expenses and Other Liabilities in the statement of financial condition, is marked to market based on the current fair value of the underlying security at the reporting date with changes in fair value recorded as unrealized gains or losses in Net Gains (Losses) from Investment Activities in the accompanying consolidated statements of operations. These transactions may involve market risk in excess of the amount currently reflected in the accompanying consolidated statements of financial condition.
Cash and Cash Equivalents
KKR considers all highly liquid short‑term investments with original maturities of 90 days or less when purchased to be cash equivalents.
Cash and Cash Equivalents Held at Consolidated Entities
Cash and cash equivalents held at consolidated entities represents cash that, although not legally restricted, is not available to fund general liquidity needs of KKR as the use of such funds is generally limited to the investment activities of KKR’s investment funds and CFEs.
Restricted Cash and Cash Equivalents
Restricted cash and cash equivalents primarily represent amounts that are held by third parties under certain of KKR’s financing and derivative transactions.
190
Notes to Consolidated Financial Statements (Continued)
Due from and Due to Affiliates
KKR considers its principals and their related entities, unconsolidated funds and the portfolio companies of its funds to be affiliates. Receivables from and payables to affiliates are recorded at their current settlement amount.
Fixed Assets, Depreciation and Amortization
Fixed assets consist primarily of corporate real estate, leasehold improvements, furniture and computer hardware. Such amounts are recorded at cost less accumulated depreciation and amortization and are included in Other Assets within the accompanying consolidated statements of financial condition. Depreciation and amortization are calculated using the straight‑line method over the assets’ estimated economic useful lives, which for leasehold improvements are the lesser of the lease terms or the life of the asset, and
three
to
seven
years for other fixed assets.
Comprehensive Income (Loss)
Comprehensive income is defined as the change in equity of a business enterprise during a period from transactions and other events and circumstances, excluding those resulting from contributions from and distributions to owners. In the accompanying consolidated financial statements, comprehensive income represents Net Income (Loss), as presented in the consolidated statements of operations and net foreign currency translation gains / (losses).
Net Income (Loss) Attributable to KKR & Co. L.P. Per Common Unit
Basic Income (Loss) Attributable to KKR per common unit is calculated by dividing Net Income (Loss) Attributable to KKR by the weighted‑average number of common units outstanding for the period. Diluted Income (Loss) Attributable to KKR per common unit reflects the assumed conversion of all dilutive securities. Diluted Income (Loss) Attributable to KKR per common unit excludes the anti‑dilutive effect of KKR Holdings units, which are exchangeable on a one‑for‑one basis into common units of KKR & Co. L.P. The KKR Holdings units are excluded from the diluted calculation since the exchange of these units would not dilute KKR’s respective ownership interests in the KKR Group Partnerships.
Income Taxes
The consolidated entities of KKR are generally treated as partnerships or disregarded entities for U.S. and non‑U.S. tax purposes. However, certain consolidated subsidiaries are treated as corporations for U.S. and non‑U.S tax purposes and are therefore subject to U.S. federal, state and/or local income taxes at the entity‑level. In addition, certain consolidated entities which are treated as partnerships for U.S. tax purposes are subject to the New York City Unincorporated Business Tax or other local taxes.
Income taxes are accounted for using the asset and liability method of accounting. Under this method, deferred tax assets and liabilities are recognized for the expected future tax consequences of differences between the carrying amounts of assets and liabilities and their respective tax basis, using tax rates in effect for the year in which the differences are expected to reverse. The effect on deferred assets and liabilities of a change in tax rates is recognized in income in the period when the change is enacted. Deferred tax assets, which are recorded in Other Assets within the statement of financial condition, are reduced by a valuation allowance when, based on the weight of available evidence, it is more likely than not that some portion or all of the deferred tax assets will not be realized. When evaluating the realizability of the deferred tax assets, all evidence, both positive and negative, is considered. Items considered when evaluating the need for a valuation allowance include the ability to carry back losses, future reversals of existing temporary differences, tax planning strategies, and expectations of future earnings.
For a particular tax‑paying component of an entity and within a particular tax jurisdiction, deferred tax assets and liabilities are offset and presented as a single amount within Other Assets or Accounts Payable, Accrued and Other Liabilities, as applicable, in the accompanying statements of financial position.
KKR analyzes its tax filing positions in all of the U.S. federal, state, local and foreign tax jurisdictions where it is required to file income tax returns, as well as for all open tax years in these jurisdictions. If, based on this analysis, KKR determines that uncertainties in tax positions exist, a reserve is established. KKR recognizes accrued interest and penalties related to uncertain tax positions within the provision for income taxes in the consolidated statements of operations.
KKR records uncertain tax positions on the basis of a two‑step process: (a) determination is made whether it is more likely than not that the tax positions will be sustained based on the technical merits of the position and (b) those tax positions that
191
Notes to Consolidated Financial Statements (Continued)
meet the more‑likely‑than‑not threshold are recognized as the largest amount of tax benefit that is greater than 50 percent likely to be realized upon ultimate settlement with the related tax authority.
Recently Issued Accounting Pronouncements
Revenue from Contracts with Customers
In May 2014, the FASB issued ASU 2014
-09
, Revenue from Contracts with Customers Topic 606 (“ASU 2014
-09
”) which outlines a single comprehensive model for entities to use in accounting for revenue arising from contracts with customers and supersedes most current revenue recognition guidance, including industry-specific guidance. Revenue recorded under ASU 2014
-09
will depict the transfer of promised goods or services to customers in an amount that reflects the consideration to which the entity expects to be entitled in exchange for those goods or services. In July 2015, the FASB deferred the effective date of ASU 2014
-09
to annual reporting periods beginning after December 15, 2017. Early adoption will be permitted as of annual reporting periods beginning after December 15, 2016, including interim reporting periods within those annual periods. A full retrospective or modified retrospective approach is required. KKR is currently evaluating the impact the adoption of this guidance may have on its financial statements, including with respect to the timing of the recognition of carried interest.
Measurement of Financial Assets and Liabilities - Consolidated Collateralized Financing Entities
In August 2014, the FASB issued ASU 2014‑13, “Measuring the Financial Assets and the Financial Liabilities of a Consolidated Collateralized Financing Entity” (“CFE”), such as CLO and CMBS vehicles. ASU 2014‑13 provides an entity with an election to measure the financial assets and financial liabilities of a consolidated CFE on the basis of either the fair value of the CFE’s financial assets or financial liabilities, whichever is more observable. The guidance is effective for annual periods, and interim periods within those annual periods, beginning after December 15, 2015. Early adoption is permitted and this guidance was early adopted by KKR on January 1, 2015 using a modified retrospective approach by recording a cumulative-effect adjustment to equity as of the beginning of the annual period.
Refer above to
Variable Interest Entities - Collateralized Loan Obligations
.
Consolidation
In February 2015, the FASB issued ASU No. 2015-02, Consolidation (Topic 810): Amendments to the Consolidation Analysis ("ASU 2015-02"). The guidance in ASU 2015-02 eliminates the presumption that a general partner should consolidate a limited partnership and also eliminates the consolidation model specific to limited partnerships. The amendments also clarify how to treat fees paid to an asset manager or other entity that makes the decisions for the investment vehicle and whether such fees should be considered in determining when a variable interest entity should be reported on an asset manager's balance sheet. ASU 2015-02 is effective for reporting periods starting after December 15, 2015 and for interim periods within the fiscal year. Early adoption is permitted, and a full retrospective or modified retrospective approach is required. KKR is evaluating the impact on its financial statements and expects to deconsolidate a significant number of investment funds, vehicles and entities upon adoption of this guidance.
Interest - Imputation of Interest
In April 2015, the FASB issued ASU No. 2015-03, Interest - Imputation of Interest (Subtopic 835-30): Simplifying the Presentation of Debt Issuance Costs (“ASU 2015-03”). The guidance in ASU 2015-03 requires that debt issuance costs related to a recognized debt liability be presented in the balance sheet as a direct deduction from the carrying amount of that debt liability, consistent with debt discounts. In August 2015, the FASB clarified that line-of-credit arrangements are outside the scope of ASU 2015-03. ASU 2015-03 is effective for fiscal years beginning after December 15, 2015, and interim periods within those fiscal years. Early adoption is permitted, and a retrospective approach is required. The adoption of this guidance is not expected to have a material impact on KKR’s financial statements.
192
Notes to Consolidated Financial Statements (Continued)
Disclosures for Investments in Certain Entities that Calculate Net Asset Value per Share
In May 2015, the FASB issued amended guidance on the disclosures for investments in certain entities that calculate net asset value per share (or its equivalent). The amendments remove the requirement to categorize within the fair value hierarchy all investments for which fair value is measured using the net asset value per share practical expedient. The amendments also remove the requirement to make certain disclosures for all investments that are eligible to be measured at fair value using the net asset value per share practical expedient. Rather, those disclosures are limited to investments for which the entity has elected to measure the fair value using that practical expedient. The guidance is effective for fiscal years beginning after December 15, 2015 and for interim periods within those years. The guidance shall be applied retrospectively for all periods presented. Early application is permitted. The guidance is not expected to have a material impact on KKR’s financial statements.
Financial Instruments
In January 2016, the FASB issued ASU No. 2016-01, Financial Instruments (Topic 825): Recognition and Measurement of Financial Assets and Liabilities (“ASU 2016-01”). The amended guidance (i) requires equity investments (except those accounted for under the equity method of accounting or those that result in consolidation of the investee) to be measured at fair value with changes in fair value recognized in net income; (ii) eliminates the requirement to disclose the method(s) and significant assumptions used to estimate the fair value that is currently required to be disclosed for financial instruments measured at fair value; (iii) requires an entity to present separately in other comprehensive income the portion of the total change in the fair value of a liability resulting from a change in the instrument-specific credit risk when the entity has elected to measure the liability at fair value in accordance with the fair value option for financial instruments and (iv) requires separate presentation of financial assets and financial liabilities by measurement category and form of financial asset (that is, securities or loans and receivables) on the balance sheet or the accompanying notes to the financial statements. ASU 2016-01 is effective for fiscal years beginning after December 15, 2017, including interim periods within those fiscal years. The amended guidance should be applied by means of a cumulative-effect adjustment to the balance sheet as of the beginning of the fiscal year of adoption. The amended guidance related to equity securities without readily determinable fair values (including the disclosure requirements) should be applied prospectively to equity investments that exist as of the date of adoption. KKR is currently evaluating the impact on the financial statements.
193
Notes to Consolidated Financial Statements (Continued)
3. NET GAINS (LOSSES) FROM INVESTMENT ACTIVITIES
Net Gains (Losses) from Investment Activities in the consolidated statements of operations consist primarily of the realized and unrealized gains and losses on investments (including foreign exchange gains and losses attributable to foreign denominated investments and related activities) and other financial instruments, including those for which the fair value option has been elected. Unrealized gains or losses result from changes in the fair value of these investments and other financial instruments during a period. Upon disposition of an investment or financial instrument, previously recognized unrealized gains or losses are reversed and an offsetting realized gain or loss is recognized in the current period.
The following table summarizes total Net Gains (Losses) from Investment Activities for the years ended
December 31, 2015
, 2014 and 2013, respectively:
|
For the Years Ended December 31,
|
|||||||||||||||||||||||
|
2015
|
2014
|
2013
|
|||||||||||||||||||||
|
|
Net Realized
Gains (Losses)
|
|
Net Unrealized
Gains (Losses)
|
|
Net Realized
Gains (Losses)
|
|
Net Unrealized
Gains (Losses)
|
|
Net Realized
Gains (Losses) |
|
Net Unrealized
Gains (Losses) |
|
|||||||||||
|
Private Equity (a)
|
$
|
4,452,593
|
|
$
|
1,140,377
|
|
$
|
4,985,786
|
|
$
|
(399,593
|
)
|
$
|
3,664,219
|
|
$
|
4,052,553
|
|
|||||
|
Credit and Other (a)
|
138,915
|
|
(800,027
|
)
|
323,676
|
|
(229,004
|
)
|
351,417
|
|
182,752
|
|
|||||||||||
|
Investments of Consolidated CFEs (a)
|
(54,367
|
)
|
(220,577
|
)
|
15,921
|
|
(237,199
|
)
|
—
|
|
—
|
|
|||||||||||
|
Real Assets (a)
|
(2,035,727
|
)
|
1,591,541
|
|
225,497
|
|
(548,788
|
)
|
15,868
|
|
(64,667
|
)
|
|||||||||||
|
Foreign Exchange Forward Contracts and
Options (b)
|
415,370
|
|
87,482
|
|
(10,620
|
)
|
787,682
|
|
17,760
|
|
(235,794
|
)
|
|||||||||||
|
Securities Sold Short (b)
|
(6,860
|
)
|
3,909
|
|
(59,071
|
)
|
21,057
|
|
(105,513
|
)
|
(19,205
|
)
|
|||||||||||
|
Other Derivatives
|
17,694
|
|
2,449
|
|
(34,319
|
)
|
(15,384
|
)
|
(24,223
|
)
|
(2,030
|
)
|
|||||||||||
|
Debt Obligations - Net Gains (Losses) and Other (c)
|
74,266
|
|
(134,411
|
)
|
(13,284
|
)
|
(34,125
|
)
|
(10,096
|
)
|
3,041
|
|
|||||||||||
|
Total Net Gains (Losses) from Investment Activities
|
$
|
3,001,884
|
|
$
|
1,670,743
|
|
$
|
5,433,586
|
|
$
|
(655,354
|
)
|
$
|
3,909,432
|
|
|
$
|
3,916,650
|
|
||||
|
(a)
|
See Note 4 “Investments.”
|
|
(b)
|
See Note 7 “Other Assets and Accounts Payable, Accrued Expenses and Other Liabilities.”
|
|
(c)
|
See Note 9 "Debt Obligations."
|
4. INVESTMENTS
Investments consist of the following:
|
|
Fair Value
|
Cost
|
|||||||||||||
|
|
December 31, 2015
|
December 31, 2014
|
December 31, 2015
|
December 31, 2014
|
|||||||||||
|
Private Equity
|
$
|
36,398,474
|
|
$
|
38,222,255
|
|
$
|
26,370,241
|
|
$
|
29,317,314
|
|
|||
|
Credit
|
6,300,004
|
|
6,702,740
|
|
7,144,934
|
|
6,906,583
|
|
|||||||
|
Investments of Consolidated CFEs
|
12,735,309
|
|
8,559,967
|
|
13,203,483
|
|
8,815,286
|
|
|||||||
|
Real Assets
|
4,048,281
|
|
3,130,404
|
|
4,681,228
|
|
5,354,191
|
|
|||||||
|
Other
|
5,823,863
|
|
3,552,260
|
|
5,687,660
|
|
3,182,917
|
|
|||||||
|
Total Investments
|
$
|
65,305,931
|
|
$
|
60,167,626
|
|
$
|
57,087,546
|
|
$
|
53,576,291
|
|
|||
As of
December 31, 2015
, investments which represented greater than
5%
of total investments consisted of Walgreens Boots Alliance, Inc. of
$5.1 billion
and First Data Corporation of
$4.3 billion
. As of December 31, 2014, investments which represented greater than
5%
of total investments consisted of Walgreens Boots Alliance, Inc. of
$5.5 billion
and First Data Corporation of
$3.8 billion
. In addition, as of
December 31, 2015
and 2014, investments totaling
$14.2 billion
and
$11.4 billion
, respectively, were pledged as direct collateral against various financing arrangements. See Note 9 “Debt Obligations.” The majority of the securities underlying private equity investments represent equity securities.
194
Notes to Consolidated Financial Statements (Continued)
The following table represents private equity investments by industry as of
December 31, 2015
and 2014, respectively:
|
|
Fair Value
|
||||||
|
|
December 31, 2015
|
December 31, 2014
|
|||||
|
Health Care
|
$
|
10,477,069
|
|
$
|
10,269,605
|
|
|
|
Financial Services
|
6,265,748
|
|
5,691,815
|
|
|||
|
Technology
|
4,686,795
|
|
4,262,800
|
|
|||
|
Retail
|
4,187,517
|
|
4,141,276
|
|
|||
|
Manufacturing
|
3,602,594
|
|
4,227,859
|
|
|||
|
Other
|
7,178,751
|
|
9,628,900
|
|
|||
|
|
$
|
36,398,474
|
|
$
|
38,222,255
|
|
|
In the table above, other investments represent private equity investments in the following industries: Consumer Products, Education, Energy, Forestry, Media, Services, Telecommunications, Transportation, Hotel/Leisure, Packaging, Mining, Agriculture and Recycling. None of these industries represents more than
10%
of total private equity investments as of
December 31, 2015
.
Equity Method
As of December 31, 2015 and 2014, KKR had equity method investments totaling
$1,929.6 million
and
$1,467.4 million
, respectively, which are recorded in Other Investments. Equity method investments include (i) certain investments in private equity funds, real assets funds and credit funds, which are not consolidated and (ii) certain investments in operating companies in which KKR is deemed to exert significant influence.
Under the equity method of accounting, KKR’s share of earnings (losses) from equity method investments is reflected as a component of Net Gains (Losses) from Investment Activities in the consolidated statements of operations. Because the underlying investments of unconsolidated investment funds are reported at fair value, the carrying value of these equity method investments representing KKR’s interests in unconsolidated funds approximates fair value. The carrying value of equity method investments in certain operating companies, which KKR is determined to exert significant influence, is determined based on the amounts invested by KKR, adjusted for the equity in earnings or losses of the investee allocated based on KKR’s respective ownership percentage, less distributions. In some cases, KKR has elected the fair value option to account for certain of these equity method investments. With respect to equity method investments where KKR has elected the fair value option, KKR's share of the investee's underlying net income or loss predominantly represents fair value adjustments in the investments. Changes in estimated fair value are recorded in Net Gains (Losses) from Investment Activities in the consolidated statements of operations.
KKR evaluates each of its equity method investments to determine if any are significant as defined by guidance from the United States Securities and Exchange Commission. As of and for the years ended December 31, 2015, 2014 and 2013, no individual equity method investment held by KKR met the significance criteria. As such, KKR is not required to present separate financial statements for any of its equity method investments.
Summarized Financial Information
The following table shows summarized financial information relating to the statements of financial condition for KKR's equity method investments assuming 100% ownership as of December 31, 2015 and 2014:
|
December 31, 2015
|
December 31, 2014
|
|||||
|
Total Assets
|
$
|
8,759,354
|
|
$
|
7,157,281
|
|
|
Total Liabilities
|
$
|
2,387,866
|
|
$
|
1,814,781
|
|
|
Total Equity
|
$
|
6,371,488
|
|
$
|
5,342,500
|
|
195
Notes to Consolidated Financial Statements (Continued)
The following table shows summarized financial information relating to the statements of operations for KKR's equity method investments assuming 100% ownership for the years ended December 31, 2015, 2014 and 2013:
|
For the years ended December 31,
|
|||||||||||
|
2015
|
2014
|
2013
|
|||||||||
|
Investment Related Revenues
|
$
|
240,877
|
|
$
|
175,343
|
|
$
|
112,850
|
|
||
|
Other Revenues
|
623,714
|
|
409,984
|
|
333,382
|
|
|||||
|
Investment Related Expenses
|
53,081
|
|
29,157
|
|
8,238
|
|
|||||
|
Other Expenses
|
675,293
|
|
448,096
|
|
185,636
|
|
|||||
|
Net Realized and Unrealized Gain/(Loss) from Investments
|
(307,301
|
)
|
350,248
|
|
(5,829
|
)
|
|||||
|
Net Income
|
$
|
(171,084
|
)
|
|
$
|
458,322
|
|
|
$
|
246,529
|
|
5
. FAIR VALUE MEASUREMENTS
The following tables summarize the valuation of KKR’s assets and liabilities reported at fair value by the fair value hierarchy levels described in Note 2 “Summary of Significant Accounting Policies” as of
December 31, 2015
and
2014
including those investments, other financial instruments and debt obligations of consolidated CFEs for which the fair value option has been elected. Equity Method Investments for which the fair value option has not been elected have been excluded from the tables below.
Assets, at fair value:
|
|
December 31, 2015
|
||||||||||||||
|
|
Quoted Prices in
Active Markets for
Identical Assets
(Level I)
|
Significant Other
Observable Inputs
(Level II)
|
Significant
Unobservable Inputs
(Level III)
|
Total
|
|||||||||||
|
Private Equity
|
$
|
16,614,008
|
|
$
|
880,928
|
|
$
|
18,903,538
|
|
$
|
36,398,474
|
|
|||
|
Credit
|
—
|
|
1,287,649
|
|
5,012,355
|
|
6,300,004
|
|
|||||||
|
Investments of Consolidated CFEs
|
—
|
|
12,735,309
|
|
—
|
|
12,735,309
|
|
|||||||
|
Real Assets
|
—
|
|
—
|
|
4,048,281
|
|
4,048,281
|
|
|||||||
|
Other
|
817,328
|
|
449,715
|
|
3,472,794
|
|
4,739,837
|
|
|||||||
|
Total
|
17,431,336
|
|
15,353,601
|
|
31,436,968
|
|
64,221,905
|
|
|||||||
|
Foreign Exchange Contracts and Options
|
—
|
|
635,183
|
|
—
|
|
635,183
|
|
|||||||
|
Other Derivatives
|
—
|
|
5,703
|
|
—
|
|
5,703
|
|
|||||||
|
Total Assets
|
$
|
17,431,336
|
|
$
|
15,994,487
|
|
$
|
31,436,968
|
|
$
|
64,862,791
|
|
|||
|
|
December 31, 2014
|
||||||||||||||
|
|
Quoted Prices in
Active Markets for
Identical Assets
(Level I)
|
Significant Other
Observable Inputs
(Level II)
|
Significant
Unobservable Inputs
(Level III)
|
Total
|
|||||||||||
|
Private Equity
|
$
|
5,940,470
|
|
$
|
6,005,764
|
|
$
|
26,276,021
|
|
$
|
38,222,255
|
|
|||
|
Credit
|
—
|
|
2,510,038
|
|
4,192,702
|
|
6,702,740
|
|
|||||||
|
Investments of Consolidated CFEs
|
—
|
|
8,467,472
|
|
92,495
|
|
8,559,967
|
|
|||||||
|
Real Assets
|
—
|
|
—
|
|
3,130,404
|
|
3,130,404
|
|
|||||||
|
Other
|
573,983
|
|
276,051
|
|
2,133,001
|
|
2,983,035
|
|
|||||||
|
Total
|
6,514,453
|
|
17,259,325
|
|
35,824,623
|
|
59,598,401
|
|
|||||||
|
Foreign Exchange Contracts and Options
|
—
|
|
517,088
|
|
—
|
|
517,088
|
|
|||||||
|
Other Derivatives
|
2,246
|
|
9,651
|
|
—
|
|
11,897
|
|
|||||||
|
Total Assets
|
$
|
6,516,699
|
|
$
|
17,786,064
|
|
$
|
35,824,623
|
|
$
|
60,127,386
|
|
|||
196
Notes to Consolidated Financial Statements (Continued)
Liabilities, at fair value:
|
|
December 31, 2015
|
||||||||||||||
|
|
Quoted Prices in
Active Markets for
Identical Assets
(Level I)
|
Significant Other
Observable Inputs
(Level II)
|
Significant
Unobservable Inputs
(Level III)
|
Total
|
|||||||||||
|
Securities Sold Short
|
$
|
286,981
|
|
$
|
13,009
|
|
$
|
—
|
|
$
|
299,990
|
|
|||
|
Foreign Exchange Contracts and Options
|
—
|
|
83,748
|
|
—
|
|
83,748
|
|
|||||||
|
Unfunded Revolver Commitments
|
—
|
|
15,533
|
|
—
|
|
15,533
|
|
|||||||
|
Other Derivatives
|
—
|
|
104,518
|
|
—
|
|
104,518
|
|
|||||||
|
Debt Obligations of Consolidated CFEs
|
—
|
|
12,365,222
|
|
—
|
|
12,365,222
|
|
|||||||
|
Total Liabilities
|
$
|
286,981
|
|
$
|
12,582,030
|
|
$
|
—
|
|
$
|
12,869,011
|
|
|||
|
|
December 31, 2014
|
||||||||||||||
|
|
Quoted Prices in
Active Markets for
Identical Assets
(Level I)
|
Significant Other
Observable Inputs
(Level II)
|
Significant
Unobservable Inputs
(Level III)
|
Total
|
|||||||||||
|
Securities Sold Short
|
$
|
630,794
|
|
$
|
2,338
|
|
$
|
—
|
|
$
|
633,132
|
|
|||
|
Foreign Exchange Contracts and Options
|
—
|
|
71,956
|
|
—
|
|
71,956
|
|
|||||||
|
Unfunded Revolver Commitments
|
—
|
|
3,858
|
|
—
|
|
3,858
|
|
|||||||
|
Other Derivatives
|
—
|
|
75,150
|
|
—
|
|
75,150
|
|
|||||||
|
Debt Obligations of Consolidated CFEs
|
—
|
|
—
|
|
7,615,340
|
|
7,615,340
|
|
|||||||
|
Total Liabilities
|
$
|
630,794
|
|
$
|
153,302
|
|
$
|
7,615,340
|
|
$
|
8,399,436
|
|
|||
The following tables summarize changes in assets and liabilities reported at fair value for which Level III inputs have been used to determine fair value for the years ended December 31, 2015 and 2014, respectively:
|
|
For the Year Ended December 31, 2015
|
||||||||||||||||||||||||||
|
Level III Assets
|
Level III Liabilities
|
||||||||||||||||||||||||||
|
|
Private
Equity
|
Credit
|
Investments of
Consolidated
CFEs
|
Real Assets
|
Other
|
Total Level III Assets
|
Debt Obligations of
Consolidated CFEs
|
||||||||||||||||||||
|
Balance, Beg. of Period
|
$
|
26,276,021
|
|
$
|
4,192,702
|
|
$
|
92,495
|
|
$
|
3,130,404
|
|
$
|
2,133,001
|
|
$
|
35,824,623
|
|
$
|
7,615,340
|
|
||||||
|
Transfers In (1)
|
—
|
|
45,461
|
|
108,340
|
|
—
|
|
1,187
|
|
154,988
|
|
—
|
|
|||||||||||||
|
Transfers Out (2)
|
(6,775,013
|
)
|
(12,860
|
)
|
(153,656
|
)
|
—
|
|
(1,710
|
)
|
(6,943,239
|
)
|
—
|
|
|||||||||||||
|
Acquisitions
|
—
|
|
—
|
|
—
|
|
—
|
|
—
|
|
—
|
|
—
|
|
|||||||||||||
|
Purchases
|
1,822,388
|
|
2,641,247
|
|
1,308
|
|
1,489,967
|
|
1,615,298
|
|
7,570,208
|
|
—
|
|
|||||||||||||
|
Sales
|
(4,698,120
|
)
|
(1,601,897
|
)
|
(3,138
|
)
|
(127,906
|
)
|
(350,844
|
)
|
(6,781,905
|
)
|
—
|
|
|||||||||||||
|
Settlements
|
—
|
|
291,341
|
|
(883
|
)
|
—
|
|
—
|
|
290,458
|
|
—
|
|
|||||||||||||
|
Net Realized Gains (Losses)
|
1,806,962
|
|
(33,943
|
)
|
—
|
|
(2,035,726
|
)
|
61,533
|
|
(201,174
|
)
|
—
|
|
|||||||||||||
|
Net Unrealized Gains (Losses)
|
471,300
|
|
(496,416
|
)
|
(44,466
|
)
|
1,591,542
|
|
7,273
|
|
1,529,233
|
|
—
|
|
|||||||||||||
|
Change in Accounting Principle (3)
|
—
|
|
—
|
|
—
|
|
—
|
|
—
|
|
—
|
|
(7,615,340
|
)
|
|||||||||||||
|
Change in Other Comprehensive Income
|
—
|
|
(13,280
|
)
|
—
|
|
—
|
|
7,056
|
|
(6,224
|
)
|
—
|
|
|||||||||||||
|
Balance, End of Period
|
$
|
18,903,538
|
|
$
|
5,012,355
|
|
$
|
—
|
|
$
|
4,048,281
|
|
$
|
3,472,794
|
|
$
|
31,436,968
|
|
$
|
—
|
|
||||||
|
Changes in Net Unrealized Gains (Losses) Included in Net Gains (Losses) from Investment Activities related to Level III Assets and Liabilities still held as of the Reporting Date
|
$
|
1,820,279
|
|
$
|
(601,455
|
)
|
$
|
—
|
|
$
|
(442,524
|
)
|
$
|
26,992
|
|
$
|
803,292
|
|
$
|
—
|
|
||||||
197
Notes to Consolidated Financial Statements (Continued)
|
|
For the Year Ended December 31, 2014
|
||||||||||||||||||||||||||
|
Level III Assets
|
Level III Liabilities
|
||||||||||||||||||||||||||
|
|
Private
Equity
|
Credit
|
Investments of
Consolidated
CFEs
|
Real Assets
|
Other
|
Total Level III Assets
|
Debt Obligations of
Consolidated CFEs
|
||||||||||||||||||||
|
Balance, Beg. of Period
|
$
|
29,646,471
|
|
$
|
1,944,464
|
|
$
|
—
|
|
$
|
2,736,708
|
|
$
|
348,486
|
|
$
|
34,676,129
|
|
$
|
—
|
|
||||||
|
Transfers In (1)
|
—
|
|
614,289
|
|
—
|
|
—
|
|
54,397
|
|
668,686
|
|
—
|
|
|||||||||||||
|
Transfers Out (2)
|
(7,081,883
|
)
|
(149,860
|
)
|
—
|
|
—
|
|
(202,010
|
)
|
(7,433,753
|
)
|
—
|
|
|||||||||||||
|
Acquisitions
|
82,986
|
|
405,720
|
|
97,996
|
|
35,192
|
|
606,914
|
|
1,228,808
|
|
6,814,217
|
|
|||||||||||||
|
Purchases
|
6,341,501
|
|
2,360,565
|
|
4,884
|
|
1,163,161
|
|
1,497,251
|
|
11,367,362
|
|
2,463,639
|
|
|||||||||||||
|
Sales
|
(5,767,506
|
)
|
(991,408
|
)
|
(15,907
|
)
|
(482,485
|
)
|
(152,406
|
)
|
(7,409,712
|
)
|
(1,435,708
|
)
|
|||||||||||||
|
Settlements
|
—
|
|
194,997
|
|
6,691
|
|
—
|
|
(2,054
|
)
|
199,634
|
|
3,988
|
|
|||||||||||||
|
Net Realized Gains (Losses)
|
2,312,973
|
|
(3,643
|
)
|
—
|
|
217,004
|
|
5,200
|
|
2,531,534
|
|
—
|
|
|||||||||||||
|
Net Unrealized Gains (Losses)
|
741,479
|
|
(156,221
|
)
|
(1,169
|
)
|
(539,176
|
)
|
(22,777
|
)
|
22,136
|
|
(23,840
|
)
|
|||||||||||||
|
Change in Other Comprehensive Income
|
—
|
|
(26,201
|
)
|
—
|
|
—
|
|
—
|
|
(26,201
|
)
|
(206,956
|
)
|
|||||||||||||
|
Balance, End of Period
|
$
|
26,276,021
|
|
$
|
4,192,702
|
|
$
|
92,495
|
|
$
|
3,130,404
|
|
$
|
2,133,001
|
|
$
|
35,824,623
|
|
$
|
7,615,340
|
|
||||||
|
Changes in Net Unrealized Gains (Losses) Included in Net Gains (Losses) from Investment Activities related to Level III Assets and Liabilities still held as of the Reporting Date
|
$
|
3,200,086
|
|
$
|
(127,323
|
)
|
$
|
(1,786
|
)
|
$
|
(543,891
|
)
|
$
|
(18,036
|
)
|
$
|
2,509,050
|
|
$
|
(23,840
|
)
|
||||||
|
(1)
|
The Transfers In noted in the tables above for credit, investments of consolidated CFEs and other investments are principally attributable to certain investments that experienced an insignificant level of market activity during the period and thus were valued in the absence of observable inputs.
|
|
(2)
|
The Transfers Out noted in the tables above for private equity investments are attributable to portfolio companies that are now valued using their publicly traded market price. The Transfers Out noted above for credit, investments of consolidated CFEs and other investments are principally attributable to certain investments that experienced a higher level of market activity during the period and thus were valued using observable inputs.
|
|
(3)
|
Upon adoption of ASU 2014-13, the debt obligations of consolidated CLOs are no longer Level III financial liabilities under the GAAP fair value hierarchy. As of
December 31, 2015
, the debt obligations of consolidated CLOs are measured on the basis of the fair value of the financial assets of the CLO and are classified as Level II financial liabilities. See Note 2 " Summary of Significant Accounting Policies".
|
Total realized and unrealized gains and losses recorded for Level III investments are reported in Net Gains (Losses) from Investment Activities in the accompanying consolidated statements of operations. For private equity investments, there were
three
transfers for
$5,539.0 million
for the year ended December 31, 2015 between Level I and Level II investments. There was
one
transfer for
$318.9 million
between Level I and Level II for private equity investments during the year ended
December 31, 2014
. Transfers were attributable to portfolio companies that are now valued using their publicly traded market prices.
The following table presents additional information about valuation methodologies and significant unobservable inputs used for investments that are measured at fair value and categorized within Level III as of
December 31, 2015
:
|
Fair Value
December 31,
2015
|
Valuation
Methodologies
|
Unobservable Input(s) (1)
|
Weighted
Average (2)
|
Range
|
Impact to
Valuation
from an
Increase in
Input (3)
|
||||||||||
|
Private Equity Investments
|
$
|
18,903,538
|
|
|
|
|
|
|
|
||||||
|
Retail
|
$
|
3,583,195
|
|
Inputs to market comparable and discounted cash flow
|
Illiquidity Discount
|
8.2%
|
5.0% - 20.0%
|
|
Decrease
|
||||||
|
|
|
|
Weight Ascribed to Market Comparables
|
49.9%
|
0% - 50.0%
|
|
(4)
|
||||||||
|
|
|
|
Weight Ascribed to Discounted Cash Flow
|
50.1%
|
50.0% - 100%
|
|
(5)
|
||||||||
|
|
|
|
Market comparables
|
Enterprise Value/LTM EBITDA Multiple
|
10.3x
|
5.6x - 13.6x
|
|
Increase
|
|||||||
|
|
|
|
Enterprise Value/Forward EBITDA Multiple
|
9.7x
|
5.5x - 13.2x
|
|
Increase
|
||||||||
|
|
|
|
Discounted cash flow
|
Weighted Average Cost of Capital
|
10.7%
|
9.1% - 24.7%
|
|
Decrease
|
|||||||
|
|
|
|
Enterprise Value/LTM EBITDA Exit Multiple
|
8.3x
|
6.0x - 10.0x
|
|
Increase
|
||||||||
198
Notes to Consolidated Financial Statements (Continued)
|
Manufacturing
|
$
|
3,181,626
|
|
Inputs to market comparable, discounted cash flow and transaction cost
|
Illiquidity Discount
|
8.3%
|
5.0% - 15.0%
|
|
Decrease
|
||||||
|
|
|
|
Weight Ascribed to Market Comparables
|
44.8%
|
33.3% - 50.0%
|
|
(4)
|
||||||||
|
|
|
|
Weight Ascribed to Discounted Cash Flow
|
53.6%
|
33.3% - 66.7%
|
|
(5)
|
||||||||
|
|
|
|
Weight Ascribed to Transaction Price
|
33.3%
|
33.3% - 33.3%
|
|
(6)
|
||||||||
|
|
|
|
Market comparables
|
Enterprise Value/LTM EBITDA Multiple
|
11.4x
|
8.0x - 16.5x
|
|
Increase
|
|||||||
|
|
|
|
Enterprise Value/Forward EBITDA Multiple
|
10.5x
|
7.8x - 12.9x
|
|
Increase
|
||||||||
|
Control Premium
|
20.0%
|
20.0% - 20.0%
|
(7)
|
Increase
|
|||||||||||
|
|
|
|
Discounted cash flow
|
Weighted Average Cost of Capital
|
13.0%
|
10.0% - 20.1%
|
|
Decrease
|
|||||||
|
|
|
|
Enterprise Value/LTM EBITDA Exit Multiple
|
9.3x
|
7.0x - 10.5x
|
|
Increase
|
||||||||
|
Technology
|
$
|
3,090,729
|
|
Inputs to market comparable, discounted cash flow and transaction cost
|
Illiquidity Discount
|
10.7%
|
5.0% - 15.0%
|
|
Decrease
|
||||||
|
|
|
|
Weight Ascribed to Market Comparables
|
50.2%
|
0% - 100%
|
|
(4)
|
||||||||
|
|
|
|
Weight Ascribed to Discounted Cash Flow
|
45.4%
|
0% - 100%
|
|
(5)
|
||||||||
|
Weight Ascribed to Transaction Price
|
34.3%
|
25.0% - 100%
|
|
|
(6)
|
||||||||||
|
|
|
|
Market comparables
|
Enterprise Value/LTM EBITDA Multiple
|
13.8x
|
6.0x - 18.0x
|
Increase
|
||||||||
|
|
|
|
Enterprise Value/Forward EBITDA Multiple
|
11.6x
|
5.1x - 15.4x
|
Increase
|
|||||||||
|
|
|
|
Discounted cash flow
|
Weighted Average Cost of Capital
|
11.5%
|
7.2% - 31.3%
|
|
Decrease
|
|||||||
|
|
|
|
Enterprise Value/LTM EBITDA Exit Multiple
|
9.3x
|
5.5x - 11.0x
|
|
Increase
|
||||||||
|
Healthcare
|
$
|
2,276,992
|
|
Inputs to market comparable, discounted cash flow and transaction cost
|
Illiquidity Discount
|
8.9%
|
5.0% - 15.0%
|
|
Decrease
|
||||||
|
|
|
|
Weight Ascribed to Market Comparables
|
38.2%
|
0% - 50.0%
|
|
(4)
|
||||||||
|
|
|
|
Weight Ascribed to Discounted Cash Flow
|
61.8%
|
50.0% - 100%
|
|
(5)
|
||||||||
|
|
|
Market comparables
|
Enterprise Value/LTM EBITDA Multiple
|
10.7x
|
10.4x - 11.9x
|
Increase
|
|||||||||
|
|
|
|
Enterprise Value/Forward EBITDA Multiple
|
10.2x
|
10.0x - 10.8x
|
Increase
|
|||||||||
|
|
|
Discounted cash flow
|
Weighted Average Cost of Capital
|
10.2%
|
8.6% - 11.8%
|
|
Decrease
|
||||||||
|
|
|
|
Enterprise Value/LTM EBITDA Exit Multiple
|
8.6x
|
7.5x - 10.0x
|
|
Increase
|
||||||||
|
Other
|
$
|
6,770,996
|
|
Inputs to market comparable, discounted cash flow and transaction cost
|
Illiquidity Discount
|
11.8%
|
5.0% - 20.0%
|
|
Decrease
|
||||||
|
|
|
|
Weight Ascribed to Market Comparables
|
45.3%
|
0% - 50.%
|
|
(4)
|
||||||||
|
Weight Ascribed to Discounted Cash Flow
|
50.9%
|
12.5% - 100%
|
|
(5)
|
|||||||||||
|
|
|
|
Weight Ascribed to Transaction Price
|
56.1%
|
33.3% - 75.0%
|
|
(6)
|
||||||||
|
|
|
|
Market comparables
|
Enterprise Value/LTM EBITDA Multiple
|
12.4x
|
5.9x - 33.1x
|
|
Increase
|
|||||||
|
|
|
|
Enterprise Value/Forward EBITDA Multiple
|
10.5x
|
5.5x - 17.8x
|
|
Increase
|
||||||||
|
|
|
|
Control Premium
|
15.7%
|
10.0% - 20.0%
|
(7
|
)
|
Increase
|
|||||||
|
|
|
|
Discounted cash flow
|
Weighted Average Cost of Capital
|
11.5%
|
7.4% - 20.0%
|
|
Decrease
|
|||||||
|
|
|
|
Enterprise Value/LTM EBITDA Exit Multiple
|
10.1x
|
6.0x - 12.0x
|
|
Increase
|
||||||||
|
Real Assets
|
$
|
4,048,281
|
|
|
|
|
|
|
|
||||||
|
Energy
|
$
|
1,221,243
|
|
Discounted cash flow
|
Weighted Average Cost of Capital
|
11.1%
|
8.1% - 17.0%
|
|
Decrease
|
||||||
|
Average Price Per BOE (10)
|
$34.37
|
$24.39- $41.70
|
Increase
|
||||||||||||
|
Infrastructure
|
$
|
1,657,950
|
|
Discounted cash flow
|
Weighted Average Cost of Capital
|
7.6%
|
5.4% - 9.8%
|
|
Decrease
|
||||||
|
|
|
|
Enterprise Value/LTM EBITDA Exit Multiple
|
10.4x
|
7.8x - 15.0x
|
|
Increase
|
||||||||
|
Real Estate
|
$
|
1,169,088
|
|
Inputs to direct income capitalization and discounted cash flow
|
Weight Ascribed to Direct Income Capitalization
|
40.4%
|
0% - 100%
|
|
(9)
|
||||||
|
|
|
|
Weight Ascribed to Discounted Cash Flow
|
59.6%
|
0% - 100%
|
|
(5)
|
||||||||
|
|
|
|
Direct Income Capitalization
|
Current Capitalization Rate
|
6.6%
|
5.1% - 10.9%
|
|
Decrease
|
|||||||
|
|
|
|
Discounted cash flow
|
Unlevered Discount Rate
|
10.9%
|
6.8% - 20.0%
|
|
Decrease
|
|||||||
|
Credit
|
$
|
5,012,355
|
|
(8
|
)
|
Yield Analysis
|
Yield
|
9.4%
|
5.5% - 30.3%
|
|
Decrease
|
||||
|
|
|
|
Net Leverage
|
4.6x
|
0.5x - 18.3x
|
|
Decrease
|
||||||||
|
|
|
|
EBITDA Multiple
|
6.4x
|
0.8x - 25.4x
|
|
Increase
|
||||||||
199
Notes to Consolidated Financial Statements (Continued)
In the table above, Other Investments, within private equity investments, represents the following industries: Financial Services, Consumer Products, Education, Energy, Forestry, Media, Services, Telecommunications, Transportation, Hotels/Leisure, Packaging, Agriculture and Recycling. None of these industries represents more than
10%
of total Level III private equity investments as of
December 31, 2015
.
|
(1)
|
In determining certain of these inputs, management evaluates a variety of factors including economic conditions, industry and market developments, market valuations of comparable companies and company specific developments including exit strategies and realization opportunities. Management has determined that market participants would take these inputs into account when valuing the investments. LTM means Last Twelve Months and EBITDA means Earnings Before Interest Taxes Depreciation and Amortization.
|
|
(2)
|
Inputs were weighted based on the fair value of the investments included in the range.
|
|
(3)
|
Unless otherwise noted, this column represents the directional change in the fair value of the Level III investments that would result from an increase to the corresponding unobservable input. A decrease to the unobservable input would have the opposite effect. Significant increases and decreases in these inputs in isolation could result in significantly higher or lower fair value measurements.
|
|
(4)
|
The directional change from an increase in the weight ascribed to the market comparables approach would increase the fair value of the Level III investments if the market comparables approach results in a higher valuation than the discounted cash flow approach and transaction price. The opposite would be true if the market comparables approach results in a lower valuation than the discounted cash flow approach and transaction price.
|
|
(5)
|
The directional change from an increase in the weight ascribed to the discounted cash flow approach would increase the fair value of the Level III investments if the discounted cash flow approach results in a higher valuation than the market comparables approach, transaction price and direct income capitalization approach. The opposite would be true if the discounted cash flow approach results in a lower valuation than the market comparables approach and transaction price.
|
|
(6)
|
The directional change from an increase in the weight ascribed to the transaction price would increase the fair value of the Level III investments if the transaction price results in a higher valuation than the market comparables and discounted cash flow approach. The opposite would be true if the transaction price results in a lower valuation than the market comparables approach and discounted cash flow approach.
|
|
(7)
|
Level III private equity investments whose valuations include a control premium represent less than
10%
of total Level III private equity investments. The valuations for the remaining investments do not include a control premium.
|
|
(8)
|
Amounts include
$546.4 million
of investments that were valued using dealer quotes or third party valuation firms.
|
|
(9)
|
The directional change from an increase in the weight ascribed to the direct income capitalization approach would increase the fair value of the Level III investments if the direct income capitalization approach results in a higher valuation than the discounted cash flow approach. The opposite would be true if the direct income capitalization approach results in a lower valuation than the discounted cash flow approach.
|
|
(10)
|
The total Energy fair value amount includes multiple investments (in multiple locations throughout North America) that are held in multiple investment funds and produce varying quantities of oil, condensate, natural gas liquids, and natural gas. Commodity price may be measured using a common volumetric equivalent where one barrel of oil equivalent, or BOE, is determined using the ratio of six thousand cubic feet of natural gas to one barrel of oil, condensate or natural gas liquids. The price per BOE is provided to show the aggregate of all price inputs for the various investments over a common volumetric equivalent although the valuations for specific investments may use price inputs specific to the asset for purposes of our valuations. The discounted cash flows include forecasted production of liquids (oil, condensate, and natural gas liquids) and natural gas with a forecasted revenue ratio of approximately
68%
liquids and
32%
natural gas.
|
In the table above, certain private equity investments may be valued at cost for a period of time after an acquisition as the best indicator of fair value. In addition, certain valuations of private equity investments may be entirely or partially derived by reference to observable valuation measures for a pending or consummated transaction.
The table above excludes Other Investments in the amount of
$3.5 billion
comprised primarily of privately-held equity and equity-like securities (e.g. warrants) in companies that are neither private equity, real assets nor credit investments. These investments were valued using Level III valuation methodologies that are generally the same as those shown for private equity investments.
The various unobservable inputs used to determine the Level III valuations may have similar or diverging impacts on valuation. Significant increases and decreases in these inputs in isolation and interrelationships between those inputs could result in significantly higher or lower fair value measurements as noted in the table above.
200
Notes to Consolidated Financial Statements (Continued)
6. NET INCOME (LOSS) ATTRIBUTABLE TO KKR & CO. L.P. PER COMMON UNIT
For the years ended
December 31, 2015
,
2014
, and 2013, basic and diluted Net Income (Loss) attributable to KKR & Co. L.P. per common unit were calculated as follows:
|
|
For the Years Ended December 31,
|
||||||||||
|
|
2015
|
2014
|
2013
|
||||||||
|
Net Income (Loss) Attributable to KKR & Co. L.P.
|
$
|
488,482
|
|
$
|
477,611
|
|
$
|
691,226
|
|
||
|
Basic Net Income (Loss) Per Common Unit
|
|
|
|
||||||||
|
Weighted Average Common Units Outstanding - Basic
|
448,884,185
|
|
381,092,394
|
|
274,910,628
|
|
|||||
|
Net Income (Loss) Attributable to KKR & Co. L.P. Per Common Unit - Basic
|
$
|
1.09
|
|
$
|
1.25
|
|
$
|
2.51
|
|
||
|
Diluted Net Income (Loss) Per Common Unit
|
|
|
|
||||||||
|
Weighted Average Common Units Outstanding - Basic
|
448,884,185
|
|
381,092,394
|
|
274,910,628
|
|
|||||
|
Weighted Average Unvested Common Units and Other Exchangeable Securities
|
33,815,009
|
|
30,956,881
|
|
25,343,462
|
|
|||||
|
Weighted Average Common Units Outstanding - Diluted
|
482,699,194
|
|
412,049,275
|
|
300,254,090
|
|
|||||
|
Net Income (Loss) Attributable to KKR & Co. L.P. Per Common Unit - Diluted
|
$
|
1.01
|
|
$
|
1.16
|
|
$
|
2.30
|
|
||
Weighted Average Common Units Outstanding—Diluted primarily includes unvested equity awards that have been granted under the Equity Incentive Plan as well as exchangeable equity securities issued in connection with the acquisition of Avoca. Vesting or exchanges of these equity interests dilute KKR and KKR Holdings pro rata in accordance with their respective ownership interests in the KKR Group Partnerships.
|
|
For the Years Ended December 31,
|
|||||||
|
|
2015
|
2014
|
2013
|
|||||
|
Weighted Average KKR Holdings Units Outstanding
|
368,399,872
|
|
388,198,713
|
|
414,581,851
|
|
||
For the years ended
December 31, 2015
,
2014
and 2013, KKR Holdings units have been excluded from the calculation of Net Income (Loss) attributable to KKR & Co. L.P. per common unit - diluted since the exchange of these units would not dilute KKR’s respective ownership interests in the KKR Group Partnerships.
201
Notes to Consolidated Financial Statements (Continued)
7. OTHER ASSETS AND ACCOUNTS PAYABLE, ACCRUED EXPENSES AND OTHER LIABILITIES
Other Assets consist of the following:
|
|
December 31, 2015
|
December 31, 2014
|
|||||
|
Foreign Exchange Contracts and Options (a)
|
$
|
635,183
|
|
$
|
517,088
|
|
|
|
Interest, Dividend and Notes Receivable (b)
|
372,699
|
|
594,288
|
|
|||
|
Due from Broker (c)
|
365,678
|
|
561,554
|
|
|||
|
Oil & Gas Assets, net (d)
|
355,537
|
|
460,658
|
|
|||
|
Deferred Tax Assets, net
|
275,391
|
|
237,982
|
|
|||
|
Fixed Assets, net (e)
|
226,340
|
|
76,247
|
|
|||
|
Intangible Assets, net (f)
|
176,987
|
|
209,202
|
|
|||
|
Goodwill (f)
|
89,000
|
|
89,000
|
|
|||
|
Deferred Financing Costs
|
80,645
|
|
46,058
|
|
|||
|
Receivables
|
78,297
|
|
55,876
|
|
|||
|
Unsettled Investment Sales (g)
|
74,862
|
|
176,622
|
|
|||
|
Deferred Transaction Related Expenses
|
35,422
|
|
14,981
|
|
|||
|
Prepaid Taxes
|
24,326
|
|
31,267
|
|
|||
|
Prepaid Expenses
|
13,697
|
|
8,812
|
|
|||
|
Derivative Assets
|
5,703
|
|
11,897
|
|
|||
|
Other
|
14,790
|
|
72,685
|
|
|||
|
Total
|
$
|
2,824,557
|
|
$
|
3,164,217
|
|
|
|
(a)
|
Represents derivative financial instruments used to manage foreign exchange risk arising from certain foreign denominated investments. Such instruments are measured at fair value with changes in fair value recorded in Net Gains (Losses) from Investment Activities in the accompanying consolidated statements of operations. The cost bases for these instruments at
December 31, 2015
and 2014 was
$27,191
and
$2,332
, respectively. See Note 3 “Net Gains (Losses) from Investment Activities” for the net changes in fair value associated with these instruments.
|
|
(b)
|
Represents interest and dividend receivables and promissory notes due from third parties. The promissory notes bear interest at rates ranging from
2.0%
-
3.0%
per annum and mature between 2016 and 2018.
|
|
(c)
|
Represents amounts held at clearing brokers resulting from securities transactions.
|
(d) Includes proved and unproved oil and natural gas properties under the successful efforts method of accounting, which is net of impairment write-downs, accumulated depreciation, depletion and amortization. Depreciation, depletion and amortization amounted to
$69.6 million
and
$86.2 million
for the years ended December 31, 2015 and 2014, respectively. Whenever events or changes in circumstances indicate that the carrying amounts of such oil and natural gas properties may not be recoverable, KKR evaluates its proved and unproved oil and natural gas properties and related equipment and facilities for impairment on a field-by-field basis. For the years ended
December 31, 2015
and 2014, KKR recorded impairment charges totaling approximately
$54.0 million
and
$220.1 million
, respectively, to write down certain of its oil and natural gas properties. The impairment charge is recorded in General, Administrative and Other in the consolidated statements of operations.
(e) Net of accumulated depreciation and amortization of
$135,487
and
$122,908
as of
December 31, 2015
and
2014
, respectively. Depreciation and amortization expense of
$15,418
,
$15,923
and
$14,714
for the years ended
December 31, 2015
,
2014
and 2013, respectively, is included in General, Administrative and Other in the accompanying consolidated statements of operations.
|
(f)
|
See Note 16 “Goodwill and Intangible Assets.”
|
|
(g)
|
Represents amounts due from third parties for investments sold for which cash settlement has not occurred.
|
202
Notes to Consolidated Financial Statements (Continued)
Accounts Payable, Accrued Expenses and Other Liabilities consist of the following:
|
|
December 31, 2015
|
December 31, 2014
|
|||||
|
Amounts Payable to Carry Pool (a)
|
$
|
1,199,000
|
|
$
|
1,100,943
|
|
|
|
Unsettled Investment Purchases (b)
|
594,152
|
|
891,649
|
|
|||
|
Securities Sold Short (c)
|
299,990
|
|
633,132
|
|
|||
|
Accounts Payable and Accrued Expenses
|
112,007
|
|
119,491
|
|
|||
|
Interest Payable
|
102,195
|
|
61,643
|
|
|||
|
Foreign Exchange Contracts and Options (d)
|
83,748
|
|
71,956
|
|
|||
|
Derivative Liabilities
|
104,518
|
|
75,150
|
|
|||
|
Contingent Consideration Obligation (e)
|
46,600
|
|
40,600
|
|
|||
|
Income Taxes Payable
|
8,770
|
|
6,362
|
|
|||
|
Due to Broker (f)
|
27,121
|
|
72,509
|
|
|||
|
Deferred Rent and Income
|
21,706
|
|
26,894
|
|
|||
|
Accrued Compensation and Benefits
|
17,765
|
|
17,799
|
|
|||
|
Other Liabilities
|
97,778
|
|
81,224
|
|
|||
|
Total
|
$
|
2,715,350
|
|
$
|
3,199,352
|
|
|
|
(a)
|
Represents the amount of carried interest payable to principals, professionals and other individuals with respect to KKR’s active funds and co-investment vehicles that provide for carried interest.
|
|
(b)
|
Represents amounts owed to third parties for investment purchases for which cash settlement has not occurred.
|
|
(c)
|
Represents the obligations of KKR to deliver a specified security at a future point in time. Such securities are measured at fair value with changes in fair value recorded in Net Gains (Losses) from Investment Activities in the accompanying consolidated statements of operations. See Note 3 “Net Gains (Losses) from Investment Activities” for the net changes in fair value associated with these instruments. The cost bases for these instruments at
December 31, 2015
and 2014 were
$298,838
and
$628,071
, respectively.
|
|
(d)
|
Represents derivative financial instruments used to manage foreign exchange risk arising from certain foreign denominated investments. Such instruments are measured at fair value with changes in fair value recorded in Net Gains (Losses) from Investment Activities in the accompanying consolidated statements of operations. The cost bases for these instruments at
December 31, 2015
and 2014 was
$6,038
and
$0
, respectively. See Note 3 “Net Gains (Losses) from Investment Activities” for the net changes in fair value associated with these instruments.
|
|
(e)
|
Represents the fair value of the contingent consideration related to the acquisition of Prisma. During the year ended December 31, 2014, a portion of the obligation recorded as of June 30, 2014 was settled for
$123.6 million
. Of this amount, approximately
$84.1 million
was settled with the issuance of
3.7 million
KKR & Co. L.P. common units.
|
|
(f)
|
Represents amounts owed for securities transactions initiated at clearing brokers.
|
203
Notes to Consolidated Financial Statements (Continued)
8. VARIABLE INTEREST ENTITIES
Consolidated VIEs
KKR consolidates certain VIEs in which it is determined that KKR is the primary beneficiary, which predominately are CFEs. In developing its conclusion that it is the primary beneficiary of these CFEs, KKR determined that it has more than an insignificant variable interest in these CFEs by virtue of its residual interest in these CFEs and, in certain cases, the presence of an incentive fee. These
two
variable interests were determined to expose KKR to a more than insignificant amount of these CFEs’ variability relative to its anticipated economic performance. In addition, KKR has the power to direct the activities that most significantly impact the economic performance of the entities. In each case, KKR’s variable interests represent an obligation to absorb losses of or a right to receive benefits from the entity that could potentially be significant to the entity. In consideration of these factors, KKR concluded that it was the primary beneficiary of these CFEs for consolidation accounting purposes. The primary purpose of these CFEs is to provide investment opportunities with the objective of generating current income for these CFE investors. The investment strategies of these CFEs are similar and the fundamental risks of these CFEs have similar characteristics, which include loss of invested capital and loss of management fees and/or incentive based fees in certain cases. KKR does not provide performance guarantees and has no other financial obligation to provide funding to these consolidated CFEs.
Unconsolidated VIEs
KKR holds variable interests in certain VIEs which are not consolidated as it is determined that KKR is not the primary beneficiary. VIEs that are not consolidated include (i) certain investment funds sponsored by KKR where the equity at risk to KKR is not considered substantive and (ii) certain CLO vehicles where KKR does not hold a variable interest that exposes KKR to a more than insignificant amount of the CLO vehicle’s variability.
Investments in Unconsolidated Investment Funds
KKR’s investment strategies differ by investment fund; however, the fundamental risks have similar characteristics, including loss of invested capital and loss of management fees and carried interests. KKR’s maximum exposure to loss as a result of its investments in the unconsolidated investment funds is the carrying value of such investments, which was
$262.7 million
at
December 31, 2015
. Accordingly disaggregation of KKR’s involvement by type of unconsolidated investment fund would not provide more useful information. For these unconsolidated investment funds in which KKR is the sponsor, KKR may have an obligation as general partner to provide commitments to such investment funds. As of
December 31, 2015
, KKR's commitments to these unconsolidated investment funds was
$10.0 million
. KKR has not provided any financial support other than its obligated amount as of
December 31, 2015
.
Investments in Unconsolidated CLO Vehicles
KKR provides collateral management services for, and has made nominal investments in, certain CLO vehicles that it does not consolidate. KKR’s investments in the unconsolidated CLO vehicles, if any, are carried at fair value in the consolidated statements of financial condition. KKR earns management fees, including subordinated collateral management fees, for managing the collateral of the CLO vehicles. At
December 31, 2015
, combined assets under management in the pools of unconsolidated CLO vehicles were
$1.4 billion
. KKR’s maximum exposure to loss as a result of its investments in the residual interests of unconsolidated CLO vehicles is the carrying value of such investments, which was
$1.6 million
at
December 31, 2015
. CLO investors in the CLO vehicles may only use the assets of the CLO to settle the debt of the related CLO, and otherwise have no recourse against KKR for any losses sustained in the CLO structures.
As of
December 31, 2015
and 2014, the maximum exposure to loss, before allocations to the carry pool, if any, for those VIEs in which KKR is determined not to be the primary beneficiary but in which it has a variable interest is as follows:
|
|
December 31, 2015
|
December 31, 2014
|
|||||
|
Investments
|
$
|
264,277
|
|
$
|
375,061
|
|
|
|
Due from Affiliates, net
|
4,315
|
|
3,478
|
|
|||
|
Maximum Exposure to Loss
|
$
|
268,592
|
|
$
|
378,539
|
|
|
204
Notes to Consolidated Financial Statements (Continued)
KKR borrows and enters into credit agreements and issues debt for its general operating and investment purposes and certain of its investment funds borrow to meet financing needs of their operating and investing activities. In connection with the acquisition of KFN on April 30, 2014, KKR consolidates and reports KFN's debt obligations which are non-recourse to KKR beyond the assets of KFN.
Fund financing facilities have been established for the benefit of certain KKR investment funds. When a KKR investment fund borrows from the facility in which it participates, the proceeds from the borrowings are strictly limited for their intended use by the borrowing investment fund. KKR’s obligations with respect to these financing arrangements are generally limited to KKR’s pro-rata equity interest in such funds.
In addition, consolidated CFE vehicles issue debt securities to third party investors which are collateralized by assets held by the CFE vehicle. KKR bears no obligation with respect to financing arrangements at KKR’s consolidated CFEs. Debt securities issued by CFEs are supported solely by the assets held at the CFEs and are not collateralized by assets of any other KKR entity.
KKR’s borrowings consisted of the following:
|
December 31,
|
||||||||||||||||||||||||
|
|
2015
|
|
2014
|
|
||||||||||||||||||||
|
|
Financing Available
|
Borrowing Outstanding
|
Fair Value
|
|
Financing Available
|
Borrowing Outstanding
|
Fair Value
|
|
||||||||||||||||
|
Revolving Credit Facilities:
|
||||||||||||||||||||||||
|
Corporate Credit Agreement
|
$
|
1,000,000
|
|
$
|
—
|
|
$
|
—
|
|
|
$
|
1,000,000
|
|
$
|
—
|
|
$
|
—
|
|
|
||||
|
KCM Credit Agreement
|
500,000
|
|
—
|
|
—
|
|
473,000
|
|
27,000
|
|
27,000
|
|
(j)
|
|||||||||||
|
Notes Issued:
|
||||||||||||||||||||||||
|
KKR Issued 6.375% Notes Due 2020 (a)
|
—
|
|
499,012
|
|
578,510
|
|
(k)
|
—
|
|
498,804
|
|
583,692
|
|
(k)
|
||||||||||
|
KKR Issued 5.500% Notes Due 2043 (b)
|
—
|
|
494,836
|
|
517,880
|
|
(k)
|
—
|
|
494,644
|
|
566,250
|
|
(k)
|
||||||||||
|
KKR Issued 5.125% Notes Due 2044 (c)
|
—
|
|
998,589
|
|
994,960
|
|
(k)
|
—
|
|
493,214
|
|
539,797
|
|
(k)
|
||||||||||
|
KFN Issued 8.375% Notes Due 2041 (d)
|
—
|
|
289,660
|
|
273,965
|
|
(l)
|
—
|
|
290,861
|
|
287,359
|
|
(l)
|
||||||||||
|
KFN Issued 7.500% Notes Due 2042 (e)
|
—
|
|
123,346
|
|
120,425
|
|
(l)
|
—
|
|
123,663
|
|
125,856
|
|
(l)
|
||||||||||
|
KFN Issued Junior Subordinated Notes (f)
|
—
|
|
248,498
|
|
216,757
|
|
—
|
|
246,907
|
|
228,087
|
|
||||||||||||
|
Other Consolidated Debt Obligations:
|
||||||||||||||||||||||||
|
Fund Financing Facilities (g)
|
3,465,238
|
|
3,710,854
|
|
3,710,854
|
|
(m)
|
2,150,819
|
|
1,047,351
|
|
1,047,351
|
|
(m)
|
||||||||||
|
CLO Debt Obligations (h)
|
—
|
|
8,093,141
|
|
8,093,141
|
|
—
|
|
7,615,340
|
|
7,615,340
|
|
||||||||||||
|
CMBS Debt Obligations (i)
|
—
|
|
4,272,081
|
|
4,272,081
|
|
—
|
|
—
|
|
—
|
|
||||||||||||
|
|
$
|
4,965,238
|
|
$
|
18,730,017
|
|
$
|
18,778,573
|
|
|
$
|
3,623,819
|
|
$
|
10,837,784
|
|
$
|
11,020,732
|
|
|
||||
|
(a)
|
$500 million
aggregate principal amount of
6.375%
senior notes of KKR due 2020.
|
|
(b)
|
$500 million
aggregate principal amount of
5.500%
senior notes of KKR due 2043.
|
|
(c)
|
$1.0 billion
aggregate principal amount of
5.125%
senior notes of KKR due 2044.
|
|
(d)
|
KKR consolidates KFN and thus reports KFN’s outstanding
$259 million
aggregate principal amount of
8.375%
senior notes due 2041.
|
|
(e)
|
KKR consolidates KFN and thus reports KFN’s outstanding
$115 million
aggregate principal amount of
7.500%
senior notes due 2042.
|
|
(f)
|
KKR consolidates KFN and thus reports KFN’s outstanding
$284 million
aggregate principal amount of junior subordinated notes. The weighted average interest rate is
5.4%
and the weighted average years to maturity is
21.0
years as of
December 31, 2015
. These debt obligations are classified as Level III within the fair value hierarchy and valued using the same valuation methodologies as KKR’s Level III credit investments.
|
|
(g)
|
Certain of KKR’s investment funds have entered into financing arrangements with major financial institutions, generally to enable such investment funds to make investments prior to or without receiving capital from fund limited partners. The weighted average interest rate is
2.3%
and
2.9%
as of
December 31, 2015
and 2014, respectively. In addition, the weighted average years to maturity is
2.5
years and
2.9
years as of
December 31, 2015
and 2014, respectively.
|
|
(h)
|
CLO debt obligations are carried at fair value and are classified as Level II within the fair value hierarchy. See Note 5 “Fair Value Measurements.”
|
|
(i)
|
CMBS debt obligations are carried at fair value and are classified as Level II within the fair value hierarchy. See Note 5 “Fair Value Measurements.”
|
|
(j)
|
Carrying value approximates fair value given the credit facility's interest rate is variable.
|
205
Notes to Consolidated Financial Statements (Continued)
|
(k)
|
The notes are classified as Level II within the fair value hierarchy and fair value is determined by third party broker quotes.
|
|
(l)
|
The notes are classified as Level I within the fair value hierarchy and fair value is determined by quoted prices in active markets since the debt is publicly listed.
|
|
(m)
|
Carrying value approximates fair value given the fund financing facilities’ interest rates are variable.
|
Revolving Credit Facilities
Corporate Credit Agreement
On October 22, 2014, Kohlberg Kravis Roberts & Co. L.P. and the KKR Group Partnerships, as borrowers, entered into a credit agreement with certain lending institutions and HSBC Bank USA, National Association, as Administrative Agent (the "Corporate Credit Agreement"). The Corporate Credit Agreement provides the borrowers with a senior unsecured multicurrency revolving credit facility in an aggregate principal amount of
$1.0 billion
, as of the closing date, with the option to request an increase in the facility amount of up to an additional
$250 million
, for an aggregate principal amount of
$1.25 billion
, subject to certain conditions, including obtaining new or increased commitments from new or existing lenders. The credit facility is a
five
‑year facility, scheduled to mature on October 22, 2019, with the borrowers’ option to extend the maturity date, subject to the consent of the applicable lenders, and the borrowers may prepay, terminate or reduce the commitments under the credit facility at any time without penalty. Interest on borrowings under the credit facility are based on either London Interbank Offered Rate (LIBOR) or Alternate Base Rate, with the applicable margin (per annum in excess of LIBOR or the Alternate Base Rate) based on a corporate ratings‑based pricing grid ranging from 69 basis points to 120 basis points (for LIBOR borrowings). Borrowings under the credit facility are guaranteed by KKR & Co. L.P. and any other entity (other than the borrowers) that guarantees the 2020 Senior Notes, 2043 Senior Notes or the 2044 Senior Notes. The Corporate Credit Agreement replaces a credit agreement dated February 26, 2008,which was terminated on October 22, 2014. For the years ended
December 31, 2015
and
2014
, no amounts were borrowed under the credit facility, except for a letter of credit of
$15.0 million
.
KCM Credit Agreement
On February 27, 2008, KKR Capital Markets entered into a revolving credit agreement with a major financial institution (the “KCM Credit Agreement”) for use in KKR’s capital markets business. This financial institution also holds an ownership interest in our capital markets business. The KCM Credit Agreement, as amended, provides for revolving borrowings of up to
$500 million
with a
$500 million
sublimit for letters of credit.
On March 30, 2012, an agreement was made to extend the maturity of the KCM Credit Agreement from February 27, 2013 to March 30, 2017. In addition to extending the term, certain other terms of the KCM Credit Agreement were renegotiated including a reduction of the cost of funding on amounts drawn and a reduced commitment fee. If a borrowing is made on the KCM Credit Agreement, the interest rate will vary depending on the type of drawdown requested. If the loan is a Eurocurrency Loan, it will be based on the LIBOR Rate plus the applicable margin which ranges initially between
1.25%
and
2.50%
, depending on the amount and nature of the loan. If the loan is an ABR Loan, it will be based on the Prime Rate plus the applicable margin which ranges initially between
0.25%
and
1.50%
depending on the amount and nature of the loan. Borrowings under this facility may only be used for KKR’s capital markets business, and its only obligors are entities involved in our capital markets business, and its liabilities are non-recourse to other parts of KKR's business.
For the year ended
December 31, 2015
, a total of
$97 million
was borrowed under the KCM Credit Agreement. Repayments under the KCM Credit Agreement were
$124 million
for the year ended December 31, 2015. For the year ended
December 31, 2014
,
$751.0 million
was borrowed and
$724.0 million
was repaid under the credit facility.
Notes Issued
KKR Issued 6.375% Notes Due 2020
On September 29, 2010, KKR Group Finance Co. LLC, a subsidiary of KKR Management Holdings Corp., issued
$500 million
aggregate principal amount of
6.375%
Senior Notes (the “2020 Senior Notes”), which were issued at a price of
99.584%
. The 2020 Senior Notes are unsecured and unsubordinated obligations of KKR Group Finance Co. LLC and will mature on September 29, 2020, unless earlier redeemed or repurchased. The 2020 Senior Notes are fully and unconditionally guaranteed, jointly and severally, by KKR & Co. L.P. and the KKR Group Partnerships. The guarantees are unsecured and unsubordinated obligations of the guarantors.
The 2020 Senior Notes bear interest at a rate of
6.375%
per annum, accruing from September 29, 2010. Interest is payable semi‑annually in arrears on March 29 and September 29 of each year.
206
Notes to Consolidated Financial Statements (Continued)
The indenture, as supplemented by a first supplemental indenture, relating to the 2020 Senior Notes includes covenants, including limitations on KKR Group Finance Co. LLC and the guarantors’ ability to, subject to exceptions, incur indebtedness secured by liens on voting stock or profit participating equity interests of their subsidiaries or merge, consolidate or sell, transfer or lease assets. The indenture, as supplemented, also provides for events of default and further provides that the trustee or the holders of not less than
25%
in aggregate principal amount of the outstanding 2020 Senior Notes may declare the 2020 Senior Notes immediately due and payable upon the occurrence and during the continuance of any event of default after expiration of any applicable grace period. In the case of specified events of bankruptcy, insolvency, receivership or reorganization, the principal amount of the 2020 Senior Notes and any accrued and unpaid interest on the 2020 Senior Notes automatically becomes due and payable. All or a portion of the 2020 Senior Notes may be redeemed at the issuer’s option in whole or in part, at any time, and from time to time, prior to their stated maturity, at the make‑whole redemption price set forth in the 2020 Senior Notes. If a change of control repurchase event occurs, the 2020 Senior Notes are subject to repurchase by the issuer at a repurchase price in cash equal to
101%
of the aggregate principal amount of the 2020 Senior Notes repurchased plus any accrued and unpaid interest on the 2020 Senior Notes repurchased to, but not including, the date of repurchase.
KKR Issued 5.500% Notes Due 2043
On February 1, 2013, KKR Group Finance Co. II LLC, a subsidiary of KKR Management Holdings Corp., issued
$500 million
aggregate principal amount of
5.50%
Senior Notes (the “2043 Senior Notes”), which were issued at a price of
98.856%
. The 2043 Senior Notes are unsecured and unsubordinated obligations of KKR Group Finance Co. II LLC and will mature on February 1, 2043, unless earlier redeemed or repurchased. The 2043 Senior Notes are fully and unconditionally guaranteed, jointly and severally, by KKR & Co. L.P. and the KKR Group Partnerships. The guarantees are unsecured and unsubordinated obligations of the guarantors.
The 2043 Senior Notes bear interest at a rate of
5.50%
per annum, accruing from February 1, 2013. Interest is payable semi‑annually in arrears on February 1 and August 1 of each year.
The indenture, as supplemented by a first supplemental indenture, relating to the 2043 Senior Notes includes covenants, including limitations on KKR Group Finance Co. II LLC and the guarantors’ ability to, subject to exceptions, incur indebtedness secured by liens on voting stock or profit participating equity interests of their subsidiaries or merge, consolidate or sell, transfer or lease assets. The indenture, as supplemented, also provides for events of default and further provides that the trustee or the holders of not less than
25%
in aggregate principal amount of the outstanding 2043 Senior Notes may declare the 2043 Senior Notes immediately due and payable upon the occurrence and during the continuance of any event of default after expiration of any applicable grace period. In the case of specified events of bankruptcy, insolvency, receivership or reorganization, the principal amount of the 2043 Senior Notes and any accrued and unpaid interest on the 2043 Senior Notes automatically becomes due and payable. All or a portion of the 2043 Senior Notes may be redeemed at the issuer’s option in whole or in part, at any time, and from time to time, prior to their stated maturity, at the make‑whole redemption price set forth in the 2043 Senior Notes. If a change of control repurchase event occurs, the 2043 Senior Notes are subject to repurchase by the issuer at a repurchase price in cash equal to
101%
of the aggregate principal amount of the 2043 Senior Notes repurchased plus any accrued and unpaid interest on the 2043 Senior Notes repurchased to, but not including, the date of repurchase.
KKR Issued 5.125% Notes Due 2044
On May 29, 2014, KKR Group Finance Co. III LLC, a subsidiary of KKR Management Holdings Corp., issued
$500 million
aggregate principal amount of
5.125%
Senior Notes due 2044 (the “2044 Senior Notes”), which were issued at a price of
98.612%
. The 2044 Senior Notes are unsecured and unsubordinated obligations of the issuer and will mature on June 1, 2044, unless earlier redeemed or repurchased. The 2044 Senior Notes are fully and unconditionally guaranteed, jointly and severally, by KKR & Co. L.P. and the KKR Group Partnerships. The guarantees are unsecured and unsubordinated obligations of the guarantors.
The 2044 Senior Notes bear interest at a rate of
5.125%
per annum, accruing from May 29, 2014. Interest is payable semi‑annually in arrears on June 1 and December 1 of each year, commencing on December 1, 2014.
The indenture, as supplemented by a first supplemental indenture, relating to the 2044 Senior Notes includes covenants, including limitations on the issuer’s and the guarantors’ ability to, subject to exceptions, incur indebtedness secured by liens on voting stock or profit participating equity interests of their subsidiaries or merge, consolidate or sell, transfer or lease assets. The indenture, as supplemented, also provides for events of default and further provides that the trustee or the holders of not less than
25%
in aggregate principal amount of the outstanding 2044 Senior Notes may declare the 2044 Senior Notes immediately due and payable upon the occurrence and during the continuance of any event of default after expiration of any applicable grace period. In the case of specified events of bankruptcy, insolvency, receivership or reorganization, the principal amount of the 2044 Senior Notes and any accrued and unpaid interest on the 2044 Senior Notes automatically becomes due and
207
Notes to Consolidated Financial Statements (Continued)
payable. All or a portion of the 2044 Senior Notes may be redeemed at the issuer’s option in whole or in part, at any time, and from time to time, prior to their stated maturity, at the make‑whole redemption price set forth in the 2044 Senior Notes. If a change of control repurchase event occurs, the 2044 Senior Notes are subject to repurchase by the issuer at a repurchase price in cash equal to
101%
of the aggregate principal amount of the 2044 Senior Notes repurchased plus any accrued and unpaid interest on the 2044 Senior Notes repurchased to, but not including, the date of repurchase.
On March 18, 2015, KKR Group Finance Co. III LLC, a subsidiary of KKR Management Holdings Corp., issued an additional
$500 million
aggregate principal amount of its 2044 Notes, which were priced at
101.062%
. The 2044 Notes issued in March 2015 form a single series with the 2044 Notes issued in May 2014, and the terms are identical to each other except for the issue date, issue price, the first payment date, June 1, 2015, and the date from which interest begins to accrue for the 2044 Notes issued in March 2015.
KFN Issued 8.375% Notes Due 2041
On November 15, 2011, KFN issued
$258.8 million
par amount of
8.375%
Senior Notes (“KFN 2041 Senior Notes”), resulting in net proceeds to KFN of
$250.7 million
. The notes trade under the ticker symbol “KFH” on the NYSE. Interest on the
8.375%
Senior Notes is payable quarterly in arrears on February 15, May 15, August 15 and November 15 of each year. The KFN 2041 Senior Notes will mature on November 15, 2041 unless previously redeemed or repurchased in accordance with their terms prior to such date. KFN may redeem the KFN 2041 Senior Notes, in whole or in part, at any time on or after November 15, 2016 at a redemption price equal to
100%
of the principal amount redeemed plus accrued and unpaid interest to the redemption date. Upon a change of control and reduction in the KFN 2041 Senior Notes’ ratings to below investment grade by two nationally recognized statistical ratings organizations, as defined in the indenture, KFN will be required to make an offer to repurchase all outstanding KFN 2041 Senior Notes at a price in cash equal to
101%
of the principal amount of the notes, plus accrued and unpaid interest to, but not including, the repurchase date. The KFN 2041 Senior Notes contain certain restrictions on KFN’s ability to create liens over its equity interests in its subsidiaries and to merge, consolidate or sell all or substantially all of its assets. If an event of default with respect to the KFN 2041 Senior Notes occurs and is continuing, the trustee or the holders of at least
25%
in aggregate principal amount of the notes then outstanding may declare the principal of the notes to be due and payable immediately.
KFN Issued 7.500% Notes Due 2042
On March 20, 2012, KFN issued
$115.0 million
par amount of
7.500%
Senior Notes (“KFN 2042 Senior Notes”), resulting in net proceeds to KFN of
$111.4 million
. The notes trade under the ticker symbol “KFI” on the NYSE. Interest on the
7.500%
Senior Notes is payable quarterly in arrears on June 20, September 20, December 20 and March 20 of each year. The KFN 2042 Senior Notes will mature on March 20, 2042 unless previously redeemed or repurchased in accordance with their terms prior to such date. KFN may redeem the KFN 2042 Senior Notes, in whole or in part, at any time on or after March 20, 2017 at a redemption price equal to
100%
of the principal amount redeemed plus accrued and unpaid interest to the redemption date. Upon a change of control and reduction in the KFN 2042 Senior Notes’ ratings to below investment grade by two nationally recognized statistical ratings organizations, all terms as defined in the applicable indenture, KFN will be required to make an offer to repurchase all outstanding KFN 2042 Senior Notes at a price in cash equal to
101%
of the principal amount of the notes, plus accrued and unpaid interest to, but not including, the repurchase date. The KFN 2042 Senior Notes contain certain restrictions on KFN’s ability to create liens over its equity interests in its subsidiaries and to merge, consolidate or sell all or substantially all of its assets, subject to qualifications and limitations set forth in the applicable indenture. Otherwise, the Indenture does not contain any provisions that would limit KFN's ability to incur indebtedness. If an event of default with respect to the KFN 2042 Senior Notes occurs and is continuing, the trustee or the holders of at least
25%
in aggregate principal amount of the notes then outstanding may declare the principal of the notes to be due and payable immediately.
KFN Issued Junior Subordinated Notes
KFN has also established
six
30
‑year trusts from 2006 through 2007 for the sole purpose of issuing trust preferred securities. These trusts issued preferred securities to unaffiliated investors and common securities to KFN. The combined proceeds were invested by the trusts in junior subordinated notes issued by KFN. The junior subordinated notes are the sole assets of trusts and mature between 2036 and 2037. Interest is payable quarterly and are fixed, floating or a combination among the
six
trusts.
Other Consolidated Debt Obligations
Fund Financing Facilities
Certain of KKR’s investment funds have entered into financing arrangements with major financial institutions, generally in connection with the management of capital calls to fund limited partners to provide liquidity to such investment funds. These
208
Notes to Consolidated Financial Statements (Continued)
financing arrangements are generally not direct obligations of the general partners of KKR’s investment funds or its management companies. Such borrowings have varying maturities and bear interest at floating rates. Borrowings are generally secured by the investment purchased with the proceeds of the borrowing and/or the uncalled capital commitment of each respective fund. When an investment vehicle borrows, the proceeds are available only for use by that investment vehicle and are not available for the benefit of other investment vehicles or KKR. Collateral within each investment vehicle is also available only against borrowings by that investment vehicle and not against the borrowings of other investment vehicles or KKR. For the years ended
December 31, 2015
and
2014
,
$7.2 billion
was borrowed and
$3.6 billion
was repaid and
$2.4 billion
was borrowed and
$2.2 billion
was repaid, respectively.
Debt Obligations of Consolidated CFEs
As of
December 31, 2015
, debt obligations of consolidated CFEs consisted of the following:
|
|
Borrowing
Outstanding
|
Weighted
Average
Interest Rate
|
|
Weighted Average
Remaining
Maturity in Years
|
||||
|
Senior Secured Notes of Consolidated CLOs
|
$
|
7,802,665
|
|
2.2
|
%
|
9.8
|
||
|
Debt Obligations of Consolidated CMBS Vehicles
|
4,272,081
|
|
3.4
|
%
|
33.0
|
|||
|
Subordinated Notes of Consolidated CLOs
|
290,476
|
|
(a)
|
|
8.9
|
|||
|
|
$
|
12,365,222
|
|
|
|
|
|
|
(a) The subordinated notes do not have contractual interest rates but instead receive a pro rata amount of the net distributions from the excess cash flows of the respective CLO vehicle. Accordingly, weighted average borrowing rates for the subordinated notes are based on cash distributions during the period, if any.
Debt obligations of consolidated CFEs are collateralized by assets held by each respective CFE vehicle and assets of one CFE vehicle may not be used to satisfy the liabilities of another. As of
December 31, 2015
, the fair value of the consolidated CFE assets was
$13.8 billion
. This collateral consisted of Cash and Cash Equivalents Held at Consolidated Entities, Investments, and Other Assets.
As part of KKR’s borrowing arrangements, KKR is subject to certain financial and operating covenants. KKR was in compliance with all of its debt covenants as of
December 31, 2015
.
Scheduled principal payments for debt obligations at
December 31, 2015
are as follows:
|
Revolving Credit
Facilities
|
Notes Issued
|
Other Consolidated
Debt Obligations
|
Total
|
||||||||||||
|
2016
|
$
|
—
|
|
$
|
—
|
|
$
|
1,512,122
|
|
$
|
1,512,122
|
|
|||
|
2017 ‑ 2018
|
—
|
|
—
|
|
1,594,913
|
|
1,594,913
|
|
|||||||
|
2019 ‑ 2020
|
—
|
|
500,000
|
|
892,839
|
|
1,392,839
|
|
|||||||
|
2021 and Thereafter
|
—
|
|
2,157,250
|
|
12,156,682
|
|
14,313,932
|
|
|||||||
|
$
|
—
|
|
$
|
2,657,250
|
|
$
|
16,156,556
|
|
$
|
18,813,806
|
|
||||
209
Notes to Consolidated Financial Statements (Continued)
10. INCOME TAXES
The provision (benefit) for income taxes consists of the following:
|
For the Years Ended December 31,
|
|||||||||||
|
2015
|
2014
|
2013
|
|||||||||
|
Current
|
|||||||||||
|
Federal Income Tax
|
$
|
27,978
|
|
$
|
29,388
|
|
$
|
35,234
|
|
||
|
State and Local Income Tax
|
6,320
|
|
8,921
|
|
6,269
|
|
|||||
|
Foreign Income Tax
|
42,036
|
|
31,972
|
|
22,740
|
|
|||||
|
Subtotal
|
76,334
|
|
70,281
|
|
64,243
|
|
|||||
|
Deferred
|
|||||||||||
|
Federal Income Tax
|
(19,133
|
)
|
(6,327
|
)
|
(21,277
|
)
|
|||||
|
State and Local Income Tax
|
8,264
|
|
344
|
|
(4,319
|
)
|
|||||
|
Foreign Income Tax
|
1,171
|
|
(629
|
)
|
(721
|
)
|
|||||
|
Subtotal
|
(9,698
|
)
|
(6,612
|
)
|
(26,317
|
)
|
|||||
|
Total Income Taxes
|
$
|
66,636
|
|
$
|
63,669
|
|
$
|
37,926
|
|
||
The following table reconciles the U.S. Federal Statutory Tax Rate to the Effective Income Tax Rate:
|
For the Years Ended December 31,
|
||||||||
|
2015
|
2014
|
2013
|
||||||
|
Statutory U.S. Federal Income Tax Rate
|
35.00
|
%
|
35.00
|
%
|
35.00
|
%
|
||
|
Income not attributable to KKR Management Holdings Corp. (a)
|
(36.04
|
)%
|
(36.36
|
)%
|
(35.84
|
)%
|
||
|
Foreign Income Taxes
|
0.81
|
%
|
0.58
|
%
|
0.28
|
%
|
||
|
State and Local Income Taxes
|
0.21
|
%
|
0.13
|
%
|
0.00
|
%
|
||
|
Compensation Charges Borne by KKR Holdings
|
1.92
|
%
|
2.08
|
%
|
1.35
|
%
|
||
|
Change in Valuation Allowance
|
0.29
|
%
|
0.08
|
%
|
—
|
%
|
||
|
Other
|
(0.94
|
)%
|
(0.34
|
)%
|
(0.31
|
)%
|
||
|
Effective Income Tax Rate
|
1.25
|
%
|
1.17
|
%
|
0.48
|
%
|
||
|
(a)
|
Represents primarily income attributable to (i) redeemable noncontrolling interests, (ii) noncontrolling interests and appropriated capital and (iii) investment income of certain entities and net carried interest of certain general partners of KKR investment funds that are not controlled and consolidated by KKR Management Holdings L.P.
|
210
Notes to Consolidated Financial Statements (Continued)
Deferred income taxes reflect the net tax effects of temporary differences that may exist between the carrying amounts of assets and liabilities for financial reporting purposes and the amounts used for income tax purposes using enacted tax rates in effect for the year in which the differences are expected to reverse. A summary of the tax effects of the temporary differences is as follows:
|
As of December 31,
|
|||||||
|
2015
|
2014
|
||||||
|
Deferred Tax Assets
|
|||||||
|
Fund Management Fees
|
$
|
76,017
|
|
$
|
74,775
|
|
|
|
Equity Based Compensation
|
32,193
|
|
27,373
|
|
|||
|
KKR Holdings Unit Exchanges (a)
|
156,202
|
|
147,531
|
|
|||
|
Depreciation and Amortization
|
34,128
|
|
30,571
|
|
|||
|
Federal Foreign Tax Credit
|
25,041
|
|
6,389
|
|
|||
|
Other
|
10,291
|
|
904
|
|
|||
|
Total Deferred Tax Assets before Valuation Allowance
|
333,872
|
|
287,543
|
|
|||
|
Valuation Allowance
|
(19,781
|
)
|
(4,153
|
)
|
|||
|
Total Deferred Tax Assets
|
314,091
|
|
283,390
|
|
|||
|
Deferred Tax Liabilities
|
|||||||
|
Investment Basis Differences / Net Unrealized Gains
|
38,700
|
|
45,408
|
|
|||
|
Total Deferred Tax Liabilities
|
38,700
|
|
45,408
|
|
|||
|
Total Deferred Taxes, Net
|
$
|
275,391
|
|
$
|
237,982
|
|
|
|
(a)
|
In connection with exchanges of KKR Holdings units into common units of KKR & Co. L.P., KKR records a deferred tax asset associated with an increase in KKR Management Holdings Corp.’s share of the tax basis of the tangible and intangible assets of KKR Management Holdings L.P. This amount was offset by an adjustment to record amounts due to KKR Holdings and principals under the tax receivable agreement, which is included within Due to Affiliates in the consolidated statements of financial condition. The net impact of these adjustments was recorded as an adjustment to equity at the time of the exchanges.
|
Future realization of the above deferred tax assets is dependent on KKR generating sufficient taxable income within the period of time that the tax benefits are expected to reverse. KKR considers projections of taxable income in evaluating its ability to utilize those deferred tax assets. In projecting its taxable income, KKR begins with historical results and incorporates assumptions concerning the amount and timing of future pretax operating income. Those assumptions require significant judgment and are consistent with the plans and estimates that KKR uses to manage its business. As of December 31, 2015, KKR had a federal foreign tax credit (“FTC”) carryforward of
$25 million
. The FTCs are related to taxes paid in foreign jurisdictions, which if not utilized, will begin to expire in 2024. KKR has determined that a portion of the FTC carryforward will not ultimately be realized due to federal limitations on FTC utilization. Therefore, KKR has established a valuation allowance of
$19.8 million
as of December 31, 2015 against the deferred tax asset. For all other deferred tax assets, KKR has determined that it is more likely than not that they will be realized and that a valuation allowance is not needed as of December 31, 2015. In addition, because KKR has not recorded an operating loss since its inception, KKR has not recorded a deferred tax asset for any federal or state net operating tax loss carry forwards.
KKR files its tax returns as prescribed by the tax laws of the jurisdictions in which it operates. In the normal course of business, KKR is subject to examination by federal and certain state, local and foreign tax regulators. As of December 31, 2015, the federal, state and local tax returns of KKR and its predecessor entities for the years 2012 through 2014 are open under normal statute of limitations and are therefore subject to examination.
211
Notes to Consolidated Financial Statements (Continued)
At December 31, 2015, 2014 and 2013, KKR’s unrecognized tax benefits, excluding related interest and penalties, were:
|
For the Years Ended December 31,
|
|||||||||||
|
2015
|
2014
|
2013
|
|||||||||
|
Unrecognized Tax Benefits, beginning of period
|
$
|
7,180
|
|
$
|
6,028
|
|
$
|
4,627
|
|
||
|
Gross increases in tax positions in prior periods
|
—
|
|
44
|
|
—
|
|
|||||
|
Gross decreases in tax positions in prior periods
|
(116
|
)
|
—
|
|
(33
|
)
|
|||||
|
Gross increases in tax positions in current period
|
15,959
|
|
1,369
|
|
2,741
|
|
|||||
|
Lapse of statute of limitations
|
(231
|
)
|
(261
|
)
|
(1,307
|
)
|
|||||
|
Unrecognized Tax Benefits, end of period
|
$
|
22,792
|
|
$
|
7,180
|
|
$
|
6,028
|
|
||
If the above tax benefits were recognized it would reduce the annual effective income tax rate. KKR believes that there will not be a significant increase or decrease to the tax positions within
12 months
of the reporting date.
The unrecognized tax benefits are recorded in Accounts Payable, Accrued Expenses and Other Liabilities. KKR recognizes interest and penalties accrued related to unrecognized tax positions in income taxes. For the years ended December 31, 2015, 2014 and 2013, interest and penalties included in KKR’s tax provision were immaterial.
212
Notes to Consolidated Financial Statements (Continued)
11. EQUITY BASED COMPENSATION
The following table summarizes the expense associated with equity based compensation for the years ended
December 31, 2015
,
2014
and 2013, respectively.
|
Year Ended December 31,
|
|||||||||||
|
|
2015
|
2014
|
2013
|
||||||||
|
Equity Incentive Plan Units
|
$
|
186,346
|
|
$
|
158,927
|
|
$
|
114,709
|
|
||
|
Other Exchangeable Securities
|
16,119
|
|
22,464
|
|
—
|
|
|||||
|
KKR Holdings Principal Awards
|
6,726
|
|
29,838
|
|
88,641
|
|
|||||
|
KKR Holdings Restricted Equity Units
|
132
|
|
887
|
|
3,768
|
|
|||||
|
Discretionary Compensation
|
52,256
|
|
98,287
|
|
100,396
|
|
|||||
|
Total
|
$
|
261,579
|
|
$
|
310,403
|
|
$
|
307,514
|
|
||
Equity Incentive Plan
Under the Equity Incentive Plan, KKR is permitted to grant equity awards representing ownership interests in KKR & Co. L.P. common units. Vested awards under the Equity Incentive Plan dilute KKR & Co. L.P. common unitholders and KKR Holdings pro rata in accordance with their respective percentage interests in the KKR Group Partnerships.
The total number of common units that may be issued under the Equity Incentive Plan is equivalent to
15%
of the number of fully diluted common units outstanding, subject to annual adjustment. Equity awards have been granted under the Equity Incentive Plan and are generally subject to service based vesting, typically over a
three
to
five
year period from the date of grant. In certain cases, these awards are subject to transfer restrictions and/or minimum retained ownership requirements. The transfer restriction period, if applicable, lasts for (i)
one year
with respect to one-half of the interests vesting on any vesting date and (ii)
two years
with respect to the other one-half of the interests vesting on such vesting date. While providing services to KKR, if applicable, certain of these recipients are also subject to minimum retained ownership rules requiring them to continuously hold common unit equivalents equal to at least
15%
of their cumulatively vested interests.
Expense associated with the vesting of these awards is based on the closing price of the KKR & Co. L.P. common units on the date of grant, discounted for the lack of participation rights in the expected distributions on unvested units, which ranges from
8%
to
56%
(for awards granted prior to December 31, 2015) multiplied by the number of unvested units on the grant date. The grant date fair value of a KKR & Co. L.P. common unit reflects a discount for lack of distribution participation rights, because equity awards are not entitled to receive distributions while unvested. The discount range for awards granted prior to December 31, 2015 was based on management’s estimates of future distributions that unvested equity awards will not be entitled to receive between the grant date and the vesting date. Therefore, units granted prior to December 31, 2015 that vest in earlier periods have a lower discount as compared to units that vest in later periods, which have a higher discount. The discount range will generally increase when the level of expected annual distributions increased relative to the grant date fair value of a KKR & Co. L.P. common unit. A decrease in expected annual distributions relative to the grant date fair value of a KKR & Co. L.P. common unit would generally have the opposite effect.
In connection with the change to KKR's distribution policy effective beginning with the distribution declared on February 11, 2016, KKR intends to make equal quarterly distributions to holders of its common units in an amount of
$0.16
per common unit per quarter (
$0.64
per year). Accordingly, for grants under the Equity Incentive Plan made subsequent to December 31, 2015, the discount for the lack of participation rights in the expected distributions on unvested units will based on the
$0.64
expected annual distribution.
Expense is recognized on a straight line basis over the life of the award and assumes a forfeiture rate of up to
8%
annually based upon expected turnover by class of recipient.
213
Notes to Consolidated Financial Statements (Continued)
As of
December 31, 2015
, there was approximately
$225.3 million
of estimated unrecognized expense related to unvested
awards. That cost is expected to be recognized as follows:
|
Year
|
Unrecognized Expense
(in millions) |
|||
|
2016
|
$
|
130.0
|
|
|
|
2017
|
76.0
|
|
||
|
2018
|
18.7
|
|
||
|
2019
|
0.6
|
|
||
|
Total
|
$
|
225.3
|
|
|
A summary of the status of unvested awards granted under the Equity Incentive Plan from January 1, 2015 through
December 31, 2015
is presented below:
|
|
Units
|
Weighted
Average Grant
Date Fair Value
|
||||
|
Balance, January 1, 2015
|
20,488,737
|
|
$
|
12.33
|
|
|
|
Granted
|
16,104,931
|
|
16.98
|
|
||
|
Vested
|
(10,648,392
|
)
|
13.85
|
|
||
|
Forfeited
|
(2,817,048
|
)
|
14.44
|
|
||
|
Balance, December 31, 2015
|
23,128,228
|
|
$
|
14.61
|
|
|
The weighted average remaining vesting period over which unvested awards are expected to vest is
1.1
years.
A summary of the remaining vesting tranches of awards granted under the Equity Incentive Plan is presented below:
|
Vesting Date
|
Units
|
||
|
April 1, 2016
|
7,136,962
|
|
|
|
October 1, 2016
|
4,189,133
|
|
|
|
April 1, 2017
|
5,320,984
|
|
|
|
October 1, 2017
|
1,338,201
|
|
|
|
April 1, 2018
|
4,055,043
|
|
|
|
October 1, 2018
|
997,308
|
|
|
|
April 1, 2019
|
6,947
|
|
|
|
October 1, 2019
|
83,650
|
|
|
|
|
23,128,228
|
|
|
Subsequent to December 31, 2015, approximately
13.3 million
common units were issued under the Equity Incentive Plan with terms and conditions substantially the same as the units described above.
Other Exchangeable Securities
In connection with the acquisition of Avoca, KKR issued
2,545,602
equity securities of a subsidiary of a KKR Group Partnership and of KKR & Co. L.P. both of which are exchangeable into common units of KKR & Co. L.P. on a
one
-for-one basis (“Other Exchangeable Securities”). Certain Other Exchangeable Securities are subject to time based vesting (generally over a
three
-year period from February 19, 2014) and are not exchangeable into common units until vested, and in certain cases are subject to minimum retained ownership requirements and transfer restrictions. Consistent with grants of KKR Holdings awards and grants made under the KKR Equity Incentive Plan, holders of Other Exchangeable Securities are not entitled to receive distributions while unvested.
The fair value of Other Exchangeable Securities is based on the closing price of KKR & Co. L.P. common units on the date of grant. KKR determined this to be the best evidence of fair value as a KKR & Co. L.P. common unit is traded in an active market and has an observable market price. Additionally, Other Exchangeable Securities are instruments with terms and
214
Notes to Consolidated Financial Statements (Continued)
conditions similar to those of a KKR & Co. L.P. common unit. Specifically, these Other Exchangeable Securities are exchangeable into KKR & Co. L.P. common units on a
one
-for-one basis upon vesting.
Expense associated with the vesting of these Other Exchangeable Securities is based on the closing price of a KKR & Co. L.P. common unit on the date of grant, discounted for the lack of participation rights in the expected distributions on unvested Other Exchangeable Securities, which currently ranges from
8%
to
56%
(for awards granted prior to December 31, 2015) multiplied by the number of unvested Other Exchangeable Securities on the issuance date. The discount range was based on management’s estimates of future distributions that unvested Other Exchangeable Securities will not be entitled to receive between the issuance date and the vesting date. Therefore, Other Exchangeable Securities granted prior to December 31, 2015 that vest in earlier periods have a lower discount as compared to Other Exchangeable Securities that vest in later periods, which have a higher discount. The discount range will generally increase when the level of expected annual distributions increases relative to the issuance date fair value of a KKR & Co. L.P. common unit. A decrease in expected annual distributions relative to the grant date fair value of a KKR & Co. L.P. common unit would generally have the opposite effect. No Other Exchangeable Securities are anticipated to be issued subsequent to December 31, 2015. Expense is recognized on a straight line basis over the life of the security and assumes a forfeiture rate of up to
8%
annually based upon expected turnover by class of recipient.
As of
December 31, 2015
, there was approximately
$9.6 million
of estimated unrecognized expense related to unvested Other Exchangeable Securities. That cost is expected to be recognized by October 1, 2016.
A summary of the status of unvested Other Exchangeable Securities from January 1,
2015
through
December 31, 2015
is presented below:
|
|
Units
|
Weighted
Average Grant
Date Fair Value
|
||||
|
Balance, January 1, 2015
|
1,695,972
|
|
$
|
18.45
|
|
|
|
Granted
|
—
|
|
—
|
|
||
|
Vested
|
(847,983
|
)
|
19.62
|
|
||
|
Forfeited
|
—
|
|
—
|
|
||
|
Balance, December 31, 2015
|
847,989
|
|
$
|
17.28
|
|
|
The weighted average remaining vesting period over which unvested Other Exchangeable Securities are expected to vest is less than
one
year and all units will vest on October 1, 2016.
KKR Holdings—Principal Awards
Certain KKR employees and non-employee operating consultants and other service providers received grants of KKR Holdings units (“Principal Awards”) which are exchangeable for KKR Group Partnership Units. These units are generally subject to minimum retained ownership requirements and allow for their exchange into common units of KKR & Co. L.P. on a
one
-for-one basis. As of
December 31, 2015
and 2014, KKR Holdings owned approximately
44.1%
, or
361,346,588
and
46.5%
, or
377,196,749
, respectively, of the outstanding KKR Group Partnership Units. Substantially all Principal Awards are fully vested as of October 1, 2015 and there is no material unrecognized expense with respect to them.
KKR Holdings—Restricted Equity Units
Grants of restricted equity units based on KKR Group Partnership Units held by KKR Holdings were made to professionals, support staff, and other personnel (“Holdings REU Awards”). These grants are funded by KKR Holdings and do not dilute KKR’s interests in the KKR Group Partnerships. Substantially all Holdings REU Awards were fully vested as of April 1, 2015 and there is no material unrecognized expense with respect to them.
KKR Holdings - Market Condition Awards
In 2016, certain KKR employees and non-employee operating consultants received grants of approximately
28.9 million
KKR Holdings units subject to price and service-based vesting requirements (“Market Condition Awards”). Tranches of these Market Condition Awards become eligible to vest periodically over a
three
year period beginning on January 1, 2018, upon satisfaction of a service-based vesting condition and also a price vesting condition based on the price of KKR common units reaching and maintaining certain specified price thresholds for a specified period of time. None of these Market Condition
215
Notes to Consolidated Financial Statements (Continued)
Awards are eligible to vest prior to January 1, 2018 and if applicable price targets are not achieved by the close of business on January 1, 2021, any unvested Market Condition Awards will be automatically canceled and forfeited. These Market Condition Awards are not subject to additional transfer restrictions after vesting but are subject to minimum retained ownership requirements.
The Market Condition Awards are outstanding but previously unallocated units, and consequently these grants will not increase the number of KKR Holdings units outstanding and if and when vested and exchanged, these Incentive Awards would not dilute KKR's respective ownership interests in the KKR Group Partnerships.
Discretionary Compensation
All KKR employees and certain employees of certain consolidated entities are eligible to receive discretionary cash bonuses. While cash bonuses paid to most employees are borne by KKR and certain consolidated entities and result in customary compensation and benefits expense, cash bonuses that are paid to certain principals are currently borne by KKR Holdings. These bonuses are funded with distributions that KKR Holdings receives on KKR Group Partnership Units held by KKR Holdings but are not then passed on to holders of unvested units of KKR Holdings. Because principals are not entitled to receive distributions on units that are unvested, any amounts allocated to principals in excess of a principal’s vested equity interests are reflected as employee compensation and benefits expense. These compensation charges are recorded based on the unvested portion of quarterly earnings distributions received by KKR Holdings at the time of the distribution.
216
Notes to Consolidated Financial Statements (Continued)
12. RELATED PARTY TRANSACTIONS
Due from Affiliates consists of:
|
|
December 31, 2015
|
December 31, 2014
|
|||||
|
Amounts due from portfolio companies
|
$
|
46,716
|
|
$
|
64,989
|
|
|
|
Amounts due from unconsolidated investment funds
|
74,409
|
|
47,229
|
|
|||
|
Amounts due from related entities
|
18,658
|
|
34,838
|
|
|||
|
Due from Affiliates
|
$
|
139,783
|
|
$
|
147,056
|
|
|
Due to Affiliates consists of:
|
|
December 31, 2015
|
December 31, 2014
|
|||||
|
Amounts due to KKR Holdings in connection with the tax receivable agreement
|
$
|
127,962
|
|
$
|
121,803
|
|
|
|
Amounts due to related entities
|
16,845
|
|
9,745
|
|
|||
|
Due to Affiliates
|
$
|
144,807
|
|
$
|
131,548
|
|
|
Tax Receivable Agreement
KKR and certain intermediate holding companies that are taxable corporations for U.S. federal, state and local income tax purposes, may be required to acquire KKR Group Partnership Units from time to time pursuant to the exchange agreement with KKR Holdings. KKR Management Holdings L.P. made an election under Section 754 of the Internal Revenue Code that will remain in effect for each taxable year in which an exchange of KKR Group Partnership Units for common units occurs, which may result in an increase in KKR’s intermediate holding companies’ share of the tax basis of the assets of the KKR Group Partnerships at the time of an exchange of KKR Group Partnership Units. Certain of these exchanges are expected to result in an increase in KKR’s intermediate holding companies’ share of the tax basis of the tangible and intangible assets of the KKR Group Partnerships, primarily attributable to a portion of the goodwill inherent in KKR’s business that would not otherwise have been available. This increase in tax basis may increase depreciation and amortization deductions for tax purposes and therefore reduce the amount of income tax KKR’s intermediate holding companies would otherwise be required to pay in the future. This increase in tax basis may also decrease gain (or increase loss) on future dispositions of certain capital assets to the extent tax basis is allocated to those capital assets.
KKR has entered into a tax receivable agreement with KKR Holdings, which requires KKR’s intermediate holding companies to pay to KKR Holdings, or to current and former principals who have exchanged KKR Holdings units for KKR common units (as transferees of KKR Group Partnership Units),
85%
of the amount of cash savings, if any, in U.S. federal, state and local income tax that the intermediate holding companies realize as a result of the increase in tax basis described above, as well as
85%
of the amount of any such savings the intermediate holding companies realize as a result of increases in tax basis that arise due to future payments under the agreement. A termination of the agreement or a change of control could give rise to similar payments based on tax savings that KKR would be deemed to realize in connection with such events. In the event that other of KKR’s current or future subsidiaries become taxable as corporations and acquire KKR Group Partnership Units in the future, or if KKR becomes taxable as a corporation for U.S. federal income tax purposes, KKR expects that each will become subject to a tax receivable agreement with substantially similar terms.
These payment obligations are obligations of KKR’s intermediate holding companies and not the KKR Group Partnerships and are recorded within Due to Affiliates in the accompanying consolidated statements of financial condition. As such, cash payments received by common unitholders may vary from those received by holders of KKR Group Partnership Units held by KKR Holdings and KKR’s current and former principals to the extent payments are made to those parties under the tax receivable agreement. Payments made under the tax receivable agreement are required to be made within
90
days of the filing of the tax returns of KKR’s intermediate holding companies which may result in a timing difference between the tax savings received by KKR’s intermediate holdings companies and the cash payments made to the selling holders of KKR Group Partnership Units.
For the years ended
December 31, 2015
,
2014
and
2013
, cash payments that have been made under the tax receivable agreement were
$5.7 million
,
$5.7 million
and
$4.7 million
, respectively. KKR expects its intermediate holding companies to benefit from the remaining
15%
of cash savings, if any, in income tax that they realize. As of
December 31, 2015
,
$3.4 million
of cumulative income tax savings have been realized.
217
Notes to Consolidated Financial Statements (Continued)
Discretionary Investments
Certain of KKR’s investment professionals, including its principals and other qualifying personnel are permitted to invest, and have invested, their own capital in side‑by‑side investments with KKR’s investment vehicles and with KKR in its strategic partnerships with and seed investments in other asset managers. Side‑by‑side investments are made on the same terms and conditions as those acquired by the applicable investment vehicle, except that the side‑ by‑side investments do not subject the investor to management fees, incentive fees or a carried interest. The cash invested by these individuals aggregated
$434.9 million
,
$398.3 million
and
$292.8 million
for the years ended
December 31, 2015
,
2014
and
2013
, respectively.
Aircraft and Other Services
Certain of the Senior Principals own aircraft that KKR uses for business purposes in the ordinary course of its operations. These Senior Principals paid for the purchase of these aircraft with personal funds and bear all operating, personnel and maintenance costs associated with their operation. The hourly rates that KKR pays for the use of these aircraft are based on current market rates for chartering private aircraft of the same type. KKR incurred
$4.4 million
,
$3.4 million
and
$4.2 million
for the use of these aircraft for the years ended
December 31, 2015
,
2014
and
2013
, respectively.
Facilities
Certain trusts, whose beneficiaries include children of Mr. Kravis and Mr. Roberts, and certain other Senior Principals who are not executive officers of KKR, are partners in a real‑estate based partnership that maintains an ownership interest in KKR’s Menlo Park location. Payments made to this partnership were
$7.3 million
,
$7.2 million
and
$7.2 million
for the years ended
December 31, 2015
,
2014
and
2013
, respectively.
218
Notes to Consolidated Financial Statements (Continued)
13. SEGMENT REPORTING
KKR operates through
four
reportable business segments. These segments, which are differentiated primarily by their business objectives and investment strategies are presented below. These financial results represent the combined financial results of the KKR Group Partnerships on a segment basis.
Private Markets
Through KKR’s Private Markets segment, KKR manages and sponsors a group of private equity funds and co-investment vehicles that invest capital for long-term appreciation, either through controlling ownership of a company or strategic minority positions. KKR also manages and sponsors a group of funds and co-investment vehicles that invest capital in real assets, such as infrastructure, energy and real estate. These funds, vehicles and accounts are managed by Kohlberg Kravis Roberts & Co. L.P., an SEC registered investment adviser.
Public Markets
KKR operates and reports its combined credit and hedge funds businesses through the Public Markets segment. KKR’s credit business advises funds, CLOs, separately managed accounts, and investment companies registered under the Investment Company Act, including a business development company or BDC, undertakings for collective investment in transferable securities or UCITS, and alternative investment funds or AIFs, which invest capital in (i) leveraged credit strategies, such as leveraged loans, high yield bonds and opportunistic credit, and (ii) alternative credit strategies such as mezzanine investments, direct lending investments, special situations investments, and long/short credit investment strategies. The funds, accounts, registered investment companies and CLOs in KKR's leveraged credit and alternative credit strategies are managed by KKR Credit Advisors (US) LLC, which is an SEC-registered investment adviser, KKR Credit Advisors (Ireland), regulated by the Central Bank of Ireland, and KKR Credit Advisors (UK) LLP, regulated by the United Kingdom Financial Conduct Authority or FCA. KKR’s Public Markets segment also includes its hedge funds business that offers a variety of investment strategies, including customized hedge fund portfolios and hedge fund-of-fund solutions. The funds and accounts in our hedge fund business are managed by Prisma Capital Partners LP (KKR Prisma or Prisma), an SEC‑registered investment adviser. Through our Public Markets segment, we also have developed strategic partnerships by acquiring minority stakes in other hedge fund managers.
Capital Markets
The Capital Markets segment is comprised primarily of KKR’s global capital markets business. KKR’s capital markets business supports the firm, portfolio companies, and third-party clients by developing and implementing both traditional and non-traditional capital solutions for investments or companies seeking financing. These services include arranging debt and equity financing for transactions, placing and underwriting securities offerings and providing other types of capital markets services. When KKR underwrites an offering of securities or a loan on a firm commitment basis, KKR commits to buy and sell an issue of securities or indebtedness and generate revenue by purchasing the securities or indebtedness at a discount or for a fee. When KKR acts in an agency capacity, KKR generates revenue for arranging financing or placing securities or debt with capital markets investors. We may also provide issuers with capital markets advice on security selection, access to markets, marketing considerations, securities pricing, and other aspects of capital markets transactions in exchange for a fee. KKR Capital Markets LLC is an SEC-registered broker-dealer and a FINRA member, and KKR is also registered or authorized to carry out certain broker-dealer activities in various countries in North America, Europe, Asia-Pacific and the Middle East. KKR’s third party capital markets activities are generally carried out through Merchant Capital Solutions LLC, a joint venture with one other unaffiliated partner, and non-bank financial companies, or NBFCs, in India.
Principal Activities
Through KKR's Principal Activities segment, we manage the firm’s assets and deploy capital to support and grow our businesses.
We use KKR's Principal Activities assets to support KKR's investment management and capital markets businesses. Typically, the funds in our Private Markets and Public Markets businesses contractually require KKR, as general partner of the funds, to make sizable capital commitments from time to time. KKR also deploys Principal Activities assets in order to help establish a track record for fundraising purposes in new strategies. KKR may also use its own capital to seed investments for new funds, to bridge capital selectively for its funds’ investments or finance strategic acquisitions and partnerships, although the financial results of an acquired businesses or strategic partnership may be reported in our Public Markets segment.
219
Notes to Consolidated Financial Statements (Continued)
Principal Activities assets also provide the required capital to fund the various commitments of the Capital Markets business when underwriting or syndicating securities, or when providing term loan commitments for transactions involving portfolio companies and for third parties. Principal Activities assets also may be utilized to satisfy regulatory requirements for the Capital Markets business and risk retention requirements for CLOs.
KKR earns the majority of its fees from subsidiaries located in the United States.
Key Performance Measure - Economic Net Income (“ENI”)
ENI is used by management in making operating and resource deployment decisions as well as assessing the overall performance of each of KKR’s reportable business segments. The reportable segments for KKR’s business are presented prior to giving effect to the allocation of income (loss) between KKR & Co. L.P. and KKR Holdings and as such represents the business in total. In addition, KKR’s reportable segments are presented without giving effect to the consolidation of the funds that KKR manages.
ENI is a measure of profitability for KKR’s reportable segments and is used by management as an alternative measurement of the operating and investment earnings of KKR and its business segments. ENI is comprised of total segment revenues; less total segment expenses and certain economic interests in KKR’s segments held by third parties. ENI differs from net income (loss) on a GAAP basis as a result of: (i) the inclusion of management fees earned from consolidated funds that were eliminated in consolidation; (ii) the exclusion of fees and expenses of certain consolidated entities; (iii) the exclusion of charges relating to the amortization of intangible assets; (iv) the exclusion of non-cash equity-based charges and other non-cash compensation charges borne by KKR Holdings or incurred under the Equity Incentive Plan and other securities that are exchangeable for common units of KKR & Co. L.P.; (v) the exclusion of certain non-recurring items; (vi) the exclusion of investment income (loss) relating to noncontrolling interests; and (vii) the exclusion of income taxes.
Modification of Segment Information
KKR’s management has reevaluated the manner in which it makes operational and resource deployment decisions and assesses the overall performance of each of KKR’s operating segments. As a result, KKR has modified the presentation of its segment financial information. In addition, since becoming a public company, KKR's principal assets have grown in significance and are a meaningful contributor to its financial results.
Certain of the more significant changes between KKR’s current segment presentation and its previously reported segment presentation are described in the following commentary.
Inclusion of a Fourth Segment
All income (loss) on investments is attributed to a new fourth segment called Principal Activities. Previously, income on investments held directly by KKR was reported in the Private Markets segment, Public Markets segment or Capital Markets segment based on the character of the income generated. For example, income from private equity investments was previously included in the Private Markets segment. However, the financial results of acquired businesses and strategic partnerships have been reported in our other segments.
Expense Allocations
KKR has changed the manner in which expenses are allocated among its operating segments. Specifically, as described below, (i) a portion of expenses, except for broken deal expenses, previously reflected in the Private Markets, Public Markets or Capital Markets segments are now reflected in the Principal Activities segment and (ii) corporate expenses are allocated across all segments.
Expenses Allocated to Principal Activities
A portion of the cash compensation and benefits, occupancy and related charges and other operating expenses previously included in the Private Markets, Public Markets and Capital Markets segments is now allocated to the Principal Activities segment. The Principal Activities segment incurs its own direct costs, and an allocation from the other segments is also made to reflect the estimated amount of costs that are necessary to operate the Principal Activities segment, which are incremental to those costs incurred directly by the Principal Activities segment. The total amount of expenses (other than its direct costs) that is allocated to Principal Activities is based on the proportion of revenue earned by Principal Activities, relative to other
220
Notes to Consolidated Financial Statements (Continued)
operating segments, over the preceding four annual periods. This allocation percentage is updated annually or more frequently if there are material changes to KKR's business.
Once the total amount of expense to be allocated to the Principal Activities segment is estimated for each reporting period, the amount of this expense will be allocated from the Private Markets, Public Markets and Capital Markets segments based on the proportion of headcount in each of these
three
segments.
Allocations of Corporate Overhead
Corporate expenses are allocated to each of the Private Markets, Public Markets, Capital Markets and Principal Activities segments based on the proportion of revenues earned by each segment over the preceding four calendar years. In KKR's previously reported segment presentation, all corporate expenses were allocated to the Private Markets segment.
In connection with these modifications, segment information for the years ended December 31, 2014 and 2013 has been presented in conformity with KKR’s current segment presentation. Consequently, this information will not be consistent with historical segment financial results previously reported. While the modified segment presentation impacted the amount of economic net income reported by each operating segment, it had no impact on KKR’s economic net income on a total reportable segment basis.
221
Notes to Consolidated Financial Statements (Continued)
The following tables present the financial data for KKR’s reportable segments:
|
|
As of and for the Year Ended December 31, 2015
|
||||||||||||||||||
|
|
Private
Markets
|
Public
Markets
|
Capital
Markets
|
Principal
Activities
|
Total
Reportable
Segments
|
||||||||||||||
|
Segment Revenues
|
|
|
|
|
|
|
|
|
|||||||||||
|
Management, Monitoring and Transaction Fees, Net
|
|
|
|
|
|
|
|
|
|||||||||||
|
Management Fees
|
$
|
465,575
|
|
$
|
266,458
|
|
$
|
—
|
|
$
|
—
|
|
$
|
732,033
|
|
||||
|
Monitoring Fees
|
264,643
|
|
—
|
|
—
|
|
—
|
|
264,643
|
|
|||||||||
|
Transaction Fees
|
144,652
|
|
28,872
|
|
191,470
|
|
—
|
|
364,994
|
|
|||||||||
|
Fee Credits (1)
|
(195,025
|
)
|
(24,595
|
)
|
—
|
|
—
|
|
(219,620
|
)
|
|||||||||
|
Total Management, Monitoring and Transaction Fees, Net
|
679,845
|
|
270,735
|
|
191,470
|
|
—
|
|
1,142,050
|
|
|||||||||
|
Performance Income
|
|
|
|
|
|
|
|
|
|
|
|||||||||
|
Realized Incentive Fees
|
—
|
|
19,647
|
|
—
|
|
—
|
|
19,647
|
|
|||||||||
|
Realized Carried Interest
|
1,018,201
|
|
8,953
|
|
—
|
|
—
|
|
1,027,154
|
|
|||||||||
|
Unrealized Carried Interest
|
182,628
|
|
(19,083
|
)
|
—
|
|
—
|
|
163,545
|
|
|||||||||
|
Total Performance Income
|
1,200,829
|
|
9,517
|
|
—
|
|
—
|
|
1,210,346
|
|
|||||||||
|
Investment Income (Loss)
|
|
|
|
|
|
|
|
|
|
|
|||||||||
|
Net Realized Gains (Losses)
|
—
|
|
—
|
|
—
|
|
337,023
|
|
337,023
|
|
|||||||||
|
Net Unrealized Gains (Losses)
|
—
|
|
—
|
|
—
|
|
(391,962
|
)
|
(391,962
|
)
|
|||||||||
|
Total Realized and Unrealized
|
—
|
|
—
|
|
—
|
|
(54,939
|
)
|
(54,939
|
)
|
|||||||||
|
Interest Income and Dividends
|
—
|
|
—
|
|
—
|
|
411,536
|
|
411,536
|
|
|||||||||
|
Interest Expense
|
—
|
|
—
|
|
—
|
|
(203,085
|
)
|
(203,085
|
)
|
|||||||||
|
Net Interest and Dividends
|
—
|
|
—
|
|
—
|
|
208,451
|
|
208,451
|
|
|||||||||
|
Total Investment Income (Loss)
|
—
|
|
—
|
|
—
|
|
153,512
|
|
153,512
|
|
|||||||||
|
Total Segment Revenues
|
1,880,674
|
|
280,252
|
|
191,470
|
|
153,512
|
|
2,505,908
|
|
|||||||||
|
Segment Expenses
|
|
|
|
|
|
|
|
|
|
|
|||||||||
|
Compensation and Benefits
|
|
|
|
|
|
|
|
|
|
|
|||||||||
|
Cash Compensation and Benefits
|
193,995
|
|
73,863
|
|
34,562
|
|
107,572
|
|
409,992
|
|
|||||||||
|
Realized Performance Income Compensation
|
407,280
|
|
11,438
|
|
—
|
|
—
|
|
418,718
|
|
|||||||||
|
Unrealized Performance Income Compensation
|
74,560
|
|
(7,633
|
)
|
—
|
|
—
|
|
66,927
|
|
|||||||||
|
Total Compensation and Benefits
|
675,835
|
|
77,668
|
|
34,562
|
|
107,572
|
|
895,637
|
|
|||||||||
|
Occupancy and Related Charges
|
33,640
|
|
9,808
|
|
2,641
|
|
16,568
|
|
62,657
|
|
|||||||||
|
Other Operating Expenses
|
127,836
|
|
40,591
|
|
14,618
|
|
50,573
|
|
233,618
|
|
|||||||||
|
Total Segment Expenses
|
837,311
|
|
128,067
|
|
51,821
|
|
174,713
|
|
1,191,912
|
|
|||||||||
|
Income (Loss) attributable to noncontrolling interests
|
1,645
|
|
1,259
|
|
13,103
|
|
—
|
|
16,007
|
|
|||||||||
|
Economic Net Income (Loss)
|
$
|
1,041,718
|
|
$
|
150,926
|
|
$
|
126,546
|
|
$
|
(21,201
|
)
|
$
|
1,297,989
|
|
||||
|
Total Assets
|
$
|
1,831,716
|
|
$
|
1,232,404
|
|
$
|
521,927
|
|
$
|
9,843,251
|
|
$
|
13,429,298
|
|
||||
|
(1)
|
KKR’s agreements with the fund investors of certain of its investment funds require KKR to share with these fund investors an agreed upon percentage of certain fees, including monitoring and transaction fees received from portfolio companies (“Fee Credits”). Fund investors receive Fee Credits only with respect to monitoring and transaction fees that are allocable to the fund’s investment in the portfolio company and not, for example, any fees allocable to capital invested through co-investment vehicles. Fee Credits are calculated after deducting certain fund-related expenses and generally amount to
80%
or
100%
of allocable monitoring and transaction fees after fund-related expenses are recovered, although the actual percentage may vary from fund to fund as well as among different classes of investors within a fund.
|
222
Notes to Consolidated Financial Statements (Continued)
|
|
As of and for the Year Ended December 31, 2014
|
||||||||||||||||||
|
|
Private
Markets
|
Public
Markets
|
Capital
Markets
|
Principal
Activities
|
Total
Reportable
Segments
|
||||||||||||||
|
Segment Revenues
|
|
|
|
|
|
|
|
|
|||||||||||
|
Management, Monitoring and Transaction Fees, Net
|
|
|
|
|
|
|
|
|
|||||||||||
|
Management Fees
|
$
|
453,210
|
|
$
|
272,833
|
|
$
|
—
|
|
—
|
|
$
|
726,043
|
|
|||||
|
Monitoring Fees
|
135,160
|
|
—
|
|
—
|
|
—
|
|
135,160
|
|
|||||||||
|
Transaction Fees
|
214,612
|
|
27,145
|
|
217,920
|
|
—
|
|
459,677
|
|
|||||||||
|
Fee Credits (1)
|
(198,680
|
)
|
(23,357
|
)
|
—
|
|
—
|
|
(222,037
|
)
|
|||||||||
|
Total Management, Monitoring and Transaction Fees, Net
|
604,302
|
|
276,621
|
|
217,920
|
|
—
|
|
1,098,843
|
|
|||||||||
|
Performance Income
|
|
|
|
|
|
|
|
|
|
|
|||||||||
|
Realized Incentive Fees
|
—
|
|
47,807
|
|
—
|
|
—
|
|
47,807
|
|
|||||||||
|
Realized Carried Interest
|
1,159,011
|
|
34,650
|
|
—
|
|
—
|
|
1,193,661
|
|
|||||||||
|
Unrealized Carried Interest
|
70,058
|
|
40,075
|
|
—
|
|
—
|
|
110,133
|
|
|||||||||
|
Total Performance Income
|
1,229,069
|
|
122,532
|
|
—
|
|
—
|
|
1,351,601
|
|
|||||||||
|
Investment Income (Loss)
|
|
|
|
|
|
|
|
|
|
|
|||||||||
|
Net Realized Gains (Losses)
|
—
|
|
—
|
|
—
|
|
628,403
|
|
628,403
|
|
|||||||||
|
Net Unrealized Gains (Losses)
|
—
|
|
—
|
|
—
|
|
(396,425
|
)
|
(396,425
|
)
|
|||||||||
|
Total Realized and Unrealized
|
—
|
|
—
|
|
—
|
|
231,978
|
|
231,978
|
|
|||||||||
|
Interest Income and Dividends
|
—
|
|
—
|
|
—
|
|
408,084
|
|
408,084
|
|
|||||||||
|
Interest Expense
|
—
|
|
—
|
|
—
|
|
(134,909
|
)
|
(134,909
|
)
|
|||||||||
|
Net Interest and Dividends
|
—
|
|
—
|
|
—
|
|
273,175
|
|
273,175
|
|
|||||||||
|
Total Investment Income (Loss)
|
—
|
|
—
|
|
—
|
|
505,153
|
|
505,153
|
|
|||||||||
|
Total Segment Revenues
|
1,833,371
|
|
399,153
|
|
217,920
|
|
505,153
|
|
2,955,597
|
|
|||||||||
|
Segment Expenses
|
|
|
|
|
|
|
|
|
|
|
|||||||||
|
Compensation and Benefits
|
|
|
|
|
|
|
|
|
|
|
|||||||||
|
Cash Compensation and Benefits
|
153,339
|
|
64,530
|
|
41,551
|
|
121,161
|
|
380,581
|
|
|||||||||
|
Realized Performance Income Compensation
|
463,605
|
|
32,984
|
|
—
|
|
—
|
|
496,589
|
|
|||||||||
|
Unrealized Performance Income Compensation
|
33,430
|
|
16,029
|
|
—
|
|
—
|
|
49,459
|
|
|||||||||
|
Total Compensation and Benefits
|
650,374
|
|
113,543
|
|
41,551
|
|
121,161
|
|
926,629
|
|
|||||||||
|
Occupancy and Related Charges
|
30,946
|
|
7,214
|
|
1,523
|
|
18,104
|
|
57,787
|
|
|||||||||
|
Other Operating Expenses
|
125,398
|
|
31,501
|
|
11,497
|
|
60,673
|
|
229,069
|
|
|||||||||
|
Total Segment Expenses
|
806,718
|
|
152,258
|
|
54,571
|
|
199,938
|
|
1,213,485
|
|
|||||||||
|
Income (Loss) attributable to noncontrolling interests
|
1,424
|
|
1,636
|
|
11,886
|
|
—
|
|
14,946
|
|
|||||||||
|
Economic Net Income (Loss)
|
$
|
1,025,229
|
|
$
|
245,259
|
|
$
|
151,463
|
|
$
|
305,215
|
|
$
|
1,727,166
|
|
||||
|
Total Assets
|
$
|
1,658,164
|
|
$
|
685,809
|
|
$
|
462,072
|
|
$
|
10,405,622
|
|
$
|
13,211,667
|
|
||||
|
(1)
|
KKR’s agreements with the fund investors of certain of its investment funds require KKR to share with these fund investors an agreed upon percentage of certain fees, including monitoring and transaction fees received from portfolio companies (“Fee Credits”). Fund investors receive Fee Credits only with respect to monitoring and transaction fees that are allocable to the fund’s investment in the portfolio company and not, for example, any fees allocable to capital invested through co-investment vehicles. Fee Credits are calculated after deducting certain fund-related expenses and generally amount to
80%
or
100%
of allocable monitoring and transaction fees after fund-related expenses are recovered, although the actual percentage may vary from fund to fund as well as among different classes of investors within a fund.
|
223
Notes to Consolidated Financial Statements (Continued)
|
|
As of and for the Year Ended December 31, 2013
|
||||||||||||||||||
|
|
Private
Markets
|
Public
Markets
|
Capital
Markets
|
Principal
Activities
|
Total
Reportable
Segments
|
||||||||||||||
|
Segment Revenues
|
|
|
|
|
|
|
|
|
|||||||||||
|
Management, Monitoring and Transaction Fees, Net
|
|
|
|
|
|
|
|
|
|||||||||||
|
Management Fees
|
$
|
459,496
|
|
$
|
206,134
|
|
$
|
—
|
|
$
|
—
|
|
$
|
665,630
|
|
||||
|
Monitoring Fees
|
120,267
|
|
—
|
|
—
|
|
—
|
|
120,267
|
|
|||||||||
|
Transaction Fees
|
150,118
|
|
40,314
|
|
146,254
|
|
—
|
|
336,686
|
|
|||||||||
|
Fee Credits (1)
|
(136,662
|
)
|
(29,950
|
)
|
—
|
|
—
|
|
(166,612
|
)
|
|||||||||
|
Total Management, Monitoring and Transaction Fees, Net
|
593,219
|
|
216,498
|
|
146,254
|
|
—
|
|
955,971
|
|
|||||||||
|
Performance Income
|
|
|
|
|
|
|
|
|
|
|
|||||||||
|
Realized Incentive Fees
|
—
|
|
72,359
|
|
—
|
|
—
|
|
72,359
|
|
|||||||||
|
Realized Carried Interest
|
690,027
|
|
—
|
|
—
|
|
—
|
|
690,027
|
|
|||||||||
|
Unrealized Carried Interest
|
661,803
|
|
62,338
|
|
—
|
|
—
|
|
724,141
|
|
|||||||||
|
Total Performance Income
|
1,351,830
|
|
134,697
|
|
—
|
|
—
|
|
1,486,527
|
|
|||||||||
|
Investment Income (Loss)
|
|
|
|
|
|
|
|
|
|
|
|||||||||
|
Net Realized Gains (Losses)
|
—
|
|
—
|
|
—
|
|
635,633
|
|
635,633
|
|
|||||||||
|
Net Unrealized Gains (Losses)
|
—
|
|
—
|
|
—
|
|
301,262
|
|
301,262
|
|
|||||||||
|
Total Realized and Unrealized
|
—
|
|
—
|
|
—
|
|
936,895
|
|
936,895
|
|
|||||||||
|
Interest Income and Dividends
|
—
|
|
—
|
|
—
|
|
87,168
|
|
87,168
|
|
|||||||||
|
Interest Expense
|
—
|
|
—
|
|
—
|
|
(65,662
|
)
|
(65,662
|
)
|
|||||||||
|
Net Interest and Dividends
|
—
|
|
—
|
|
—
|
|
21,506
|
|
21,506
|
|
|||||||||
|
Total Investment Income (Loss)
|
—
|
|
—
|
|
—
|
|
958,401
|
|
958,401
|
|
|||||||||
|
Total Segment Revenues
|
1,945,049
|
|
351,195
|
|
146,254
|
|
958,401
|
|
3,400,899
|
|
|||||||||
|
Segment Expenses
|
|
|
|
|
|
|
|
|
|
|
|||||||||
|
Compensation and Benefits
|
|
|
|
|
|
|
|
|
|||||||||||
|
Cash Compensation and Benefits
|
148,557
|
|
24,696
|
|
31,118
|
|
110,457
|
|
314,828
|
|
|||||||||
|
Realized Performance Income Compensation
|
276,011
|
|
28,944
|
|
—
|
|
—
|
|
304,955
|
|
|||||||||
|
Unrealized Performance Income Compensation
|
282,003
|
|
24,935
|
|
—
|
|
—
|
|
306,938
|
|
|||||||||
|
Total Compensation and Benefits
|
706,571
|
|
78,575
|
|
31,118
|
|
110,457
|
|
926,721
|
|
|||||||||
|
Occupancy and Related Charges
|
31,769
|
|
2,837
|
|
877
|
|
20,844
|
|
56,327
|
|
|||||||||
|
Other Operating Expenses
|
106,917
|
|
36,006
|
|
9,698
|
|
63,262
|
|
215,883
|
|
|||||||||
|
Total Segment Expenses
|
845,257
|
|
117,418
|
|
41,693
|
|
194,563
|
|
1,198,931
|
|
|||||||||
|
Income (Loss) attributable to noncontrolling interests
|
1,498
|
|
1,560
|
|
3,329
|
|
—
|
|
6,387
|
|
|||||||||
|
Economic Net Income (Loss)
|
$
|
1,098,294
|
|
$
|
232,217
|
|
$
|
101,232
|
|
$
|
763,838
|
|
$
|
2,195,581
|
|
||||
|
Total Assets
|
$
|
1,600,433
|
|
$
|
360,891
|
|
$
|
441,012
|
|
$
|
6,580,721
|
|
$
|
8,983,057
|
|
||||
|
(1)
|
KKR’s agreements with the fund investors of certain of its investment funds require KKR to share with these fund investors an agreed upon percentage of certain fees, including monitoring and transaction fees received from portfolio companies (“Fee Credits”). Fund investors receive Fee Credits only with respect to monitoring and transaction fees that are allocable to the fund’s investment in the portfolio company and not, for example, any fees allocable to capital invested through co-investment vehicles. Fee Credits are calculated after deducting certain fund-related expenses and generally amount to
80%
or
100%
of allocable monitoring and transaction fees after fund-related expenses are recovered, although the actual percentage may vary from fund to fund as well as among different classes of investors within a fund.
|
224
Notes to Consolidated Financial Statements (Continued)
The following tables reconcile KKR’s total reportable segments to the most directly comparable financial measures calculated and presented in accordance with GAAP:
Fees
|
|
For the Years Ended December 31,
|
||||||||||
|
|
2015
|
2014
|
2013
|
||||||||
|
Total Segment Revenues
|
$
|
2,505,908
|
|
$
|
2,955,597
|
|
$
|
3,400,899
|
|
||
|
Management fees relating to consolidated funds and other
entities
|
(531,027
|
)
|
(510,777
|
)
|
(487,669
|
)
|
|||||
|
Fee credits relating to consolidated funds
|
202,269
|
|
203,466
|
|
144,416
|
|
|||||
|
Net realized and unrealized carried interest
|
(1,190,699
|
)
|
(1,303,794
|
)
|
(1,414,168
|
)
|
|||||
|
Total investment income (loss)
|
(153,512
|
)
|
(505,153
|
)
|
(958,401
|
)
|
|||||
|
Revenue earned by oil & gas producing entities
|
112,328
|
|
186,876
|
|
22,105
|
|
|||||
|
Reimbursable expenses
|
66,144
|
|
55,424
|
|
41,529
|
|
|||||
|
Other
|
32,357
|
|
28,369
|
|
13,835
|
|
|||||
|
Fees and Other
|
$
|
1,043,768
|
|
$
|
1,110,008
|
|
$
|
762,546
|
|
||
Expenses
|
|
For the Years Ended December 31,
|
||||||||||
|
|
2015
|
2014
|
2013
|
||||||||
|
Total Segment Expenses
|
$
|
1,191,912
|
|
$
|
1,213,485
|
|
$
|
1,198,931
|
|
||
|
Equity based compensation
|
261,579
|
|
310,403
|
|
307,514
|
|
|||||
|
Reimbursable expenses
|
103,307
|
|
92,366
|
|
58,358
|
|
|||||
|
Operating expenses relating to consolidated funds and
other entities
|
65,012
|
|
93,182
|
|
26,835
|
|
|||||
|
Expenses incurred by oil & gas producing entities
|
153,611
|
|
333,123
|
|
20,442
|
|
|||||
|
Intangible amortization, acquisition, litigation and certain
non-recurring costs
|
49,766
|
|
102,877
|
|
92,593
|
|
|||||
|
Other
|
46,038
|
|
50,631
|
|
62,465
|
|
|||||
|
Total Expenses
|
$
|
1,871,225
|
|
$
|
2,196,067
|
|
$
|
1,767,138
|
|
||
Income (Loss) Before Taxes
|
|
For the Years Ended December 31,
|
||||||||||
|
|
2015
|
2014
|
2013
|
||||||||
|
Economic net income
|
$
|
1,297,989
|
|
$
|
1,727,166
|
|
$
|
2,195,581
|
|
||
|
Income tax (benefit)
|
(66,636
|
)
|
(63,669
|
)
|
(37,926
|
)
|
|||||
|
Amortization of intangibles and other, net
|
(47,599
|
)
|
(290,348
|
)
|
(102,789
|
)
|
|||||
|
Equity based compensation
|
(261,579
|
)
|
(310,403
|
)
|
(307,514
|
)
|
|||||
|
Net income (loss) attributable to noncontrolling interests held by
KKR Holdings
|
(433,693
|
)
|
(585,135
|
)
|
(1,056,126
|
)
|
|||||
|
Net income (loss) attributable to KKR & Co. L.P.
|
$
|
488,482
|
|
$
|
477,611
|
|
$
|
691,226
|
|
||
|
Net income (loss) attributable to noncontrolling interests and
appropriated capital
|
4,791,062
|
|
4,920,750
|
|
7,100,747
|
|
|||||
|
Net income (loss) attributable to redeemable noncontrolling
interests
|
(4,512
|
)
|
(3,341
|
)
|
62,255
|
|
|||||
|
Income tax (benefit)
|
66,636
|
|
63,669
|
|
37,926
|
|
|||||
|
Income (loss) before taxes
|
$
|
5,341,668
|
|
$
|
5,458,689
|
|
$
|
7,892,154
|
|
||
225
Notes to Consolidated Financial Statements (Continued)
The items that reconcile KKR’s total reportable segments to the corresponding consolidated amounts calculated and presented in accordance with GAAP for net income (loss) attributable to redeemable noncontrolling interests and income (loss) attributable to noncontrolling interests and appropriated capital are primarily attributable to the impact of the consolidation of KKR's funds and certain other entities.
Assets
|
As of December 31,
|
|||||||
|
|
2015
|
2014
|
|||||
|
Total Segment Assets
|
$
|
13,429,298
|
|
$
|
13,211,667
|
|
|
|
Consolidation of KKR Funds, CFEs and other entities
|
57,581,456
|
|
52,617,368
|
|
|||
|
Accounting basis difference for oil & natural gas properties
|
47,005
|
|
43,710
|
|
|||
|
Total Assets
|
$
|
71,057,759
|
|
$
|
65,872,745
|
|
|
226
14. ACQUISITIONS
Acquisition of KFN
On April 30, 2014, KKR completed its acquisition of KFN by merger (the “Merger”) contemplated by an Agreement and Plan of Merger (the “Merger Agreement”), pursuant to which KFN became a subsidiary of KKR. KFN is a specialty finance company with expertise in a range of asset classes in which it invests, consisting primarily of corporate loans, also known as leveraged loans, high yield debt securities, interests in joint ventures and partnerships, and interests in oil and gas properties. The addition of KFN provided KKR with over
$2 billion
of permanent equity capital to support the continued growth of its business.
The total consideration paid was approximately
$2.4 billion
consisting entirely of the issuance of
104.3 million
KKR common units as follows (amounts in thousands except unit data):
|
Number of KKR common units issued
|
104,340,028
|
|
|
|
KKR common unit price on April 30, 2014
|
$
|
22.71
|
|
|
Estimated fair value of KKR common units issued
|
$
|
2,369,559
|
|
The following is a summary of the estimated fair values of the assets acquired and liabilities as of April 30, 2014, the date they were assumed (amounts in thousands):
|
Cash and cash equivalents
|
$
|
210,413
|
|
|
Cash and cash equivalents held at consolidated entities
|
614,929
|
|
|
|
Restricted cash and cash equivalents
|
35,038
|
|
|
|
Investments
|
1,235,813
|
|
|
|
Investments of consolidated CLOs
|
6,742,768
|
|
|
|
Other assets
|
642,721
|
|
|
|
Other assets of consolidated CLOs
|
133,036
|
|
|
|
Total assets
|
9,614,718
|
|
|
|
|
|
|
|
|
Debt obligations
|
724,509
|
|
|
|
Debt obligations of consolidated CLOs
|
5,663,666
|
|
|
|
Accounts payable, accrued expenses and other liabilities
|
118,427
|
|
|
|
Other liabilities of consolidated CLOs
|
344,660
|
|
|
|
Total liabilities
|
6,851,262
|
|
|
|
|
|
|
|
|
Noncontrolling interests
|
378,983
|
|
|
|
|
|
|
|
|
Fair value of Net Assets Acquired
|
2,384,473
|
|
|
|
Less: Fair value of consideration transferred
|
2,369,559
|
|
|
|
Gain on acquisition
|
$
|
14,914
|
|
As of April 30, 2014, the fair value of the net assets acquired exceeded the fair value of consideration transferred by approximately
$14.9 million
and relates primarily to the difference between the fair value of the assets and liabilities of CLOs consolidated by KFN. This amount has been recorded in net gains (losses) from investment activities in the consolidated statements of operations.
The consolidated statement of operations for the year ended December 31, 2014 includes the financial results of KFN since the date of acquisition, April 30, 2014, through December 31, 2014. During this period, KFN’s revenues and net income (loss) attributable to KKR & Co. L.P. were
$57.6 million
and
$(113.2) million
, respectively. Fees for KFN represent oil and gas revenue from working and royalty interests in oil and natural gas producing properties consolidated by KKR. Additionally, the portion of net income that is allocable to KKR reflects KKR’s approximate ownership interest in the KKR Group Partnerships after applicable corporate and local income taxes for the year ended December 31, 2014.
On a segment basis, the financial results of KFN are included within the Principal Activities segment.
227
KKR incurred
$8.3 million
of acquisition related costs through the date of closing, which were expensed as incurred and are reflected within General, Administrative and Other.
Acquisition of Avoca Capital
On February 19, 2014, KKR closed its acquisition of
100%
of the equity interests of Avoca Capital and its affiliates (“Avoca”). Avoca, now renamed KKR Credit Advisors (Ireland), was a European credit investment manager with approximately
$8.2 billion
in assets under management at the time of acquisition. The addition of Avoca provided KKR with a greater presence in the European leveraged credit markets.
The total consideration included
$83.3 million
in cash and
$56.5 million
in securities of a subsidiary of a KKR Group Partnership and of KKR & Co. L.P. that are exchangeable into approximately
2.4 million
KKR & Co. L.P. common units, at any time, at the election of the holders of the securities. In connection with this transaction, there is
no
contingent consideration payable in the future.
The following is a summary of the estimated fair values of the assets acquired and liabilities as of February 19, 2014, the date they were assumed:
|
Cash and cash equivalents
|
$
|
24,381
|
|
|
Investments
|
20,905
|
|
|
|
Investments of consolidated CLOs
|
1,226,174
|
|
|
|
Other assets of consolidated CLOs
|
186,609
|
|
|
|
Other assets
|
7,370
|
|
|
|
Intangible assets
|
65,880
|
|
|
|
Total assets
|
1,531,319
|
|
|
|
|
|
|
|
|
Liabilities
|
13,584
|
|
|
|
Debt obligations of consolidated CLOs
|
1,150,551
|
|
|
|
Other liabilities of consolidated CLOs
|
140,308
|
|
|
|
Total liabilities
|
1,304,443
|
|
|
|
|
|
|
|
|
Fair Value of Net Assets Acquired
|
226,876
|
|
|
|
Less: Fair value of subordinated notes of consolidated CLOs held by KKR prior to acquisition (a)
|
74,029
|
|
|
|
Less: Fair value of consideration transferred
|
139,798
|
|
|
|
Gain on acquisition
|
$
|
13,049
|
|
|
(a)
|
Represents subordinated notes in one of the consolidated CLOs held by KKR prior to the acquisition of Avoca. Upon acquisition of Avoca, KKR’s investment in the subordinated notes was offset against the corresponding debt obligations of the consolidated CLO in purchase accounting.
|
As of February 19, 2014, the fair value of the net assets acquired exceeded the fair value of consideration transferred by approximately
$13.0 million
and relates primarily to the difference between the fair value of the assets and liabilities of CLOs required to be consolidated in connection with the Avoca transaction. This amount has been recorded in net gains (losses) from investment activities in the consolidated statements of operations.
The consolidated statement of operations for the year ended December 31, 2014 includes the financial results of Avoca since the date of acquisition, February 19, 2014, through December 31, 2014. During this period, Avoca’s revenues and net income (loss) attributable to KKR & Co. L.P. were
$39.7 million
and
$(3.3) million
, respectively. This net income (loss) attributable to KKR & Co. L.P. reflects amortization of intangible assets and equity based compensation charges associated with Avoca since the date of the acquisition. Additionally, the portion of net income that is allocable to KKR reflects KKR’s approximate ownership interest in the KKR Group Partnerships after applicable corporate and local income taxes for the year ended December 31, 2014.
On a segment basis, the financial results of Avoca are included within the Public Markets segment.
228
KKR incurred
$4.4 million
of acquisition related costs through the date of closing, which were expensed as incurred and are reflected within General, Administrative and Other.
Pro Forma Financial Information
The information that follows provides supplemental information about pro forma revenues and net income (loss) attributable to KKR & Co. L.P. as if the acquisitions of KFN and Avoca had been consummated as of
January 1, 2013
. Such information is unaudited and is based on estimates and assumptions which KKR believes are reasonable. These results are not necessarily indicative of the consolidated statements of operations in future periods or the results that would have actually been realized had KKR, KFN and Avoca been a combined entity during
2014
and
2013
(amounts in thousands except unit data).
|
Year Ended December 31,
|
|||||||
|
Selected Pro Forma Financial Information
|
2014
|
2013
|
|||||
|
Revenues
|
$
|
1,152,397
|
|
$
|
871,144
|
|
|
|
Net Income (Loss) attributable to KKR & Co. L.P.
|
$
|
533,828
|
|
$
|
820,352
|
|
|
|
Net Income (Loss) attributable to KKR & Co. L.P. per common unit-basic
|
$
|
1.28
|
|
$
|
2.16
|
|
|
|
Net Income (Loss) attributable to KKR & Co. L.P. per common unit-diluted
|
$
|
1.19
|
|
$
|
2.00
|
|
|
229
Notes to Consolidated Financial Statements (Continued)
15. TOTAL EQUITY
Unit Repurchase Program
On October 27, 2015, KKR announced the authorization of a program providing for the repurchase by KKR of up to
$500 million
in the aggregate of its outstanding common units. Under this unit repurchase program, units may be repurchased from time to time in open market transactions, in privately negotiated transactions or otherwise. The timing, manner, price and amount of any unit repurchases will be determined by KKR in its discretion and will depend on a variety of factors, including legal requirements, price and economic and market conditions. KKR expects that the program, which has no expiration date, will be in effect until the maximum approved dollar amount has been used to repurchase common units. The program does not require KKR to repurchase any specific number of common units, and the program may be suspended, extended, modified or discontinued at any time. Since inception of the unit repurchase program through December 31, 2015, KKR has repurchased approximately
9.9 million
of outstanding common units.
Distribution Policy
On October 27, 2015, KKR announced a change to its distribution policy effective beginning with the distribution declared on February 11, 2016 with respect to the quarter ending December 31, 2015. Under the new distribution policy, KKR intends to make equal quarterly distributions to holders of its common units in an amount of
$0.16
per common unit per quarter. The declaration and payment of any distributions are subject to the discretion of the board of directors of the general partner of KKR and the terms of its limited partnership agreement. There can be no assurance that distributions will be made as intended or at all, that unitholders will receive sufficient distributions to satisfy payment of their tax liabilities as limited partners of KKR or that any particular distribution policy will be maintained.
230
Notes to Consolidated Financial Statements (Continued)
16. GOODWILL AND INTANGIBLE ASSETS
Goodwill
Goodwill from the acquisition of Prisma Capital Partners LP and its affiliates ("Prisma") represents the excess of acquisition costs over the fair value of net tangible and intangible assets acquired and is primarily attributed to synergies expected to arise after the acquisition of Prisma. The carrying value of goodwill was
$89.0 million
as of
December 31, 2015
and
December 31, 2014
, and is recorded within Other Assets on the consolidated statements of financial condition. Goodwill has been allocated entirely to the Public Markets segment. As of
December 31, 2015
, the fair value of KKR’s reporting units substantially exceeded their respective carrying values. All of the goodwill is currently expected to be deductible for tax purposes. See Note 7 “Other Assets and Accounts Payable, Accrued Expenses and Other Liabilities.”
Intangible Assets
Intangible Assets, Net consists of the following:
|
|
As of
|
||||||
|
|
December 31, 2015
|
December 31, 2014
|
|||||
|
Finite-Lived Intangible Assets
|
$
|
284,766
|
|
$
|
284,766
|
|
|
|
Accumulated Amortization (includes foreign exchange)
|
(107,779
|
)
|
(75,564
|
)
|
|||
|
Intangible Assets, Net
|
$
|
176,987
|
|
$
|
209,202
|
|
|
Changes in Intangible Assets, Net consists of the following:
|
Years Ended
|
|||||||
|
|
December 31, 2015
|
December 31, 2014
|
|||||
|
Balance, Beginning of Period
|
$
|
209,202
|
|
$
|
177,545
|
|
|
|
Avoca Acquisition
|
—
|
|
65,880
|
|
|||
|
Amortization Expense
|
(27,004
|
)
|
(27,080
|
)
|
|||
|
Foreign Exchange
|
(5,211
|
)
|
(7,143
|
)
|
|||
|
Balance, End of Period
|
$
|
176,987
|
|
$
|
209,202
|
|
|
Amortization expense including foreign exchange relating to intangible assets held at December 31, 2015 is expected to be as follows:
|
2016
|
$
|
26,907
|
|
|
|
2017
|
26,357
|
|
||
|
2018
|
19,922
|
|
||
|
2019
|
16,988
|
|
||
|
2020
|
16,836
|
|
||
|
2021 and thereafter
|
69,977
|
|
||
|
Total Amortization Expense of Intangible Assets
|
$
|
176,987
|
|
|
The intangible assets as of December 31, 2015 are expected to amortize over a weighted‑average period of
8.9
years.
231
Notes to Consolidated Financial Statements (Continued)
17. COMMITMENTS AND CONTINGENCIES
Debt Covenants
Borrowings of KKR contain various debt covenants. These covenants do not, in management’s opinion, materially restrict KKR’s operating business or investment strategies. KKR is in compliance with its debt covenants in all material respects as of
December 31, 2015
.
Investment Commitments
As of
December 31, 2015
, KKR had unfunded commitments consisting of (i)
$1,353.8 million
to its active private equity and other investment vehicles and (ii)
$191.1 million
in connection with commitments by KKR’s capital markets business, (iii)
$128.6 million
relating to Merchant Capital Solutions LLC and (iv) other investment commitments of
$171.6 million
. Whether these amounts are actually funded, in whole or in part depends on the terms of such commitments, including the satisfaction or waiver of any conditions to funding.
Non-cancelable Operating Leases
KKR’s non-cancelable operating leases consist primarily of leases of office space around the world. There are no material rent holidays, contingent rent, rent concessions or leasehold improvement incentives associated with any of these property leases. In addition to base rentals, certain lease agreements are subject to escalation provisions and rent expense is recognized on a straight‑line basis over the term of the lease agreement.
As of
December 31, 2015
, the approximate aggregate minimum future lease payments, net of sublease income, required on the operating leases are as follows:
|
2016
|
$
|
52,965
|
|
|
2017
|
48,181
|
|
|
|
2018
|
43,353
|
|
|
|
2019
|
39,292
|
|
|
|
2020 and thereafter
|
62,018
|
|
|
|
Total minimum payments required
|
$
|
245,809
|
|
Contingent Repayment Guarantees
The partnership documents governing KKR’s carry—paying funds, including funds relating to private equity, infrastructure, energy, real estate, mezzanine, direct lending and special situations investments, generally include a “clawback” provision that, if triggered, may give rise to a contingent obligation requiring the general partner to return amounts to the fund for distribution to the fund investors at the end of the life of the fund. Under a clawback obligation, upon the liquidation of a fund, the general partner is required to return, typically on an after-tax basis, previously distributed carry to the extent that, due to the diminished performance of later investments, the aggregate amount of carry distributions received by the general partner during the term of the fund exceed the amount to which the general partner was ultimately entitled, including the effects of any performance thresholds. Excluding carried interest received by the general partners of funds that were not contributed to KKR in the acquisition of the assets and liabilities of KKR & Co. (Guernsey) L.P. (formerly known as KKR Private Equity Investors, L.P.) on October 1, 2009 (the “KPE Transaction”), as of
December 31, 2015
,
no
carried interest was subject to this clawback obligation, assuming that all applicable carry paying funds were liquidated at their
December 31, 2015
fair values. Had the investments in such funds been liquidated at
zero
value, the clawback obligation would have been
$2,423.4 million
. Carried interest is recognized in the statement of operations based on the contractual conditions set forth in the agreements governing the fund as if the fund were terminated and liquidated at the reporting date and the fund’s investments were realized at the then estimated fair values. Amounts earned pursuant to carried interest are earned by the general partner of those funds to the extent that cumulative investment returns are positive and where applicable, preferred return thresholds have been met. If these investment amounts earned decrease or turn negative in subsequent periods, recognized carried interest will be reversed and to the extent that the aggregate amount of carry distributions received by the general partner during the term of the fund exceed the amount to which the general partner was ultimately entitled, a clawback obligation would be recorded. For funds that are consolidated, this clawback obligation, if any, is reflected as an increase in noncontrolling interests in the consolidated statements of financial condition. For funds that are not consolidated, this clawback obligation, if any, is reflected as a reduction of KKR’s investment balance as this is where carried interest is initially recorded.
232
Notes to Consolidated Financial Statements (Continued)
Certain private equity funds that were contributed to KKR in the KPE Transaction in 2009 also include a “net loss sharing provision.” Upon the liquidation of an investment vehicle to which a net loss sharing obligation applies, the general partner is required to contribute capital to the vehicle, to fund
20%
of the net losses on investments. In these vehicles, such losses would be required to be paid by KKR to the fund investors in those vehicles in the event of a liquidation of the fund regardless of whether any carried interest had previously been distributed, and a greater share of investment losses would be allocable to KKR relative to the capital that KKR contributed to it as general partner. Based on the fair market values as of
December 31, 2015
, there would have been no net loss sharing obligation. If the vehicles were liquidated at
zero
value, the net loss sharing obligation would have been
zero
as of
December 31, 2015
.
Prior to the KPE Transaction in 2009, certain principals who received carried interest distributions with respect to certain private equity funds contributed to KKR had personally guaranteed, on a several basis and subject to a cap, the contingent obligations of the general partners of such private equity funds to repay amounts to fund investors pursuant to the general partners’ clawback obligations. The terms of the KPE Transaction require that principals remain responsible for any clawback obligations relating to carry distributions received prior to the KPE Transaction, up to a maximum of
$223.6 million
. Through investment realizations, KKR's potential exposure has been reduced to
$159.7 million
as of
December 31, 2015
. Using valuations as of
December 31, 2015
,
no
amounts are due with respect to the clawback obligation required to be funded by principals. Carry distributions arising subsequent to the KPE Transaction may give rise to clawback obligations that may be allocated generally to KKR and persons who participate in the carry pool. Unlike the clawback obligation, KKR will be responsible for all amounts due under a net loss sharing obligation and will indemnify principals for any personal guarantees that they have provided with respect to such amounts. In addition, guarantees of or similar arrangements relating to clawback or net loss sharing obligations in favor of third party investors in an individual investment partnership by entities KKR owns may limit distributions of carried interest more generally.
Indemnifications
In the normal course of business, KKR enters into contracts that contain a variety of representations and warranties that provide general indemnifications and other indemnities relating to contractual performance. In addition, certain of KKR’s consolidated funds and KFN have provided certain indemnities relating to environmental and other matters and has provided nonrecourse carve-out guarantees for fraud, willful misconduct and other customary wrongful acts, each in connection with the financing of certain real estate investments that KKR has made. KKR’s maximum exposure under these arrangements is unknown as this would involve future claims that may be made against KKR that have not yet occurred. However, based on experience, KKR expects the risk of material loss to be low.
Litigation
From time to time, KKR is involved in various legal proceedings, lawsuits and claims incidental to the conduct of KKR’s business. KKR’s business is also subject to extensive regulation, which may result in regulatory proceedings against it.
KKR currently is and expects to continue to become, from time to time, subject to examinations, inquiries and investigations by various U.S. and non U.S. governmental and regulatory agencies, including but not limited to the U.S. Securities and Exchange Commission, or SEC, Department of Justice, state attorney generals, Financial Industry Regulatory Authority, or FINRA, and the U.K. Financial Conduct Authority. Such examinations, inquiries and investigations may result in the commencement of civil, criminal or administrative proceedings against KKR or its personnel.
Moreover, in the ordinary course of business, KKR is and can be both the defendant and the plaintiff in numerous lawsuits with respect to acquisitions, bankruptcy, insolvency and other types of proceedings. Such lawsuits may involve claims that adversely affect the value of certain investments owned by KKR’s funds.
KKR establishes an accrued liability for legal proceedings only when those matters present loss contingencies that are both probable and reasonably estimable. In such cases, there may be an exposure to loss in excess of any amounts accrued. No loss contingency is recorded for matters where such losses are either not probable or reasonably estimable (or both) at the time of determination. Such matters may be subject to many uncertainties, including among others (i) the proceedings may be in early stages; (ii) damages sought may be unspecified, unsupportable, unexplained or uncertain; (iii) discovery may not have been started or is incomplete; (iv) there may be uncertainty as to the outcome of pending appeals or motions; (v) there may be significant factual issues to be resolved; or (vi) there may be novel legal issues or unsettled legal theories to be presented or a large number of parties. Consequently, management is unable to estimate a range of potential loss, if any, related to these matters. In addition, loss contingencies may be, in part or in whole, subject to insurance or other payments such as contributions and/or indemnity, which may reduce any ultimate loss.
233
Notes to Consolidated Financial Statements (Continued)
It is not possible to predict the ultimate outcome of all pending legal proceedings, and some of the matters discussed above seek or may seek potentially large and/or indeterminate amounts. As of such date, based on information known by management, management has not concluded that the final resolutions of the matters above will have a material effect upon the consolidated financial statements. However, given the potentially large and/or indeterminate amounts sought or may be sought in certain of these matters and the inherent unpredictability of investigations and litigations, it is possible that an adverse outcome in certain matters could, from time to time, have a material effect on KKR’s financial results in any particular period.
18. REGULATORY CAPITAL REQUIREMENTS
KKR has a registered broker-dealer subsidiary which is subject to the minimum net capital requirements of the SEC and the FINRA. Additionally, KKR entities based in London and Ireland are subject to the regulatory capital requirements of the U.K. Financial Conduct Authority and the Central Bank of Ireland, respectively. In addition, KKR has an entity based in Hong Kong which is subject to the capital requirements of the Hong Kong Securities and Futures Ordinance, an entity based in Japan subject to the capital requirements of Financial Services Authority of Japan, and
two
entities based in Mumbai which are subject to capital requirements of the Reserve Bank of India or RBI and the Securities and Exchange Board of India or SEBI. All of these entities have continuously operated in excess of their respective minimum regulatory capital requirements.
The regulatory capital requirements referred to above may restrict KKR’s ability to withdraw capital from its registered broker-dealer entities. At
December 31, 2015
, approximately
$152.6 million
of cash at KKR’s registered broker-dealer entities may be restricted as to the payment of cash dividends and advances to KKR.
19. QUARTERLY FINANCIAL DATA (UNAUDITED)
|
Three Months Ended,
|
|||||||||||||||
|
March 31, 2015
|
June 30, 2015
|
September 30, 2015
|
December 31, 2015
|
||||||||||||
|
Statement of Operations Data:
|
|||||||||||||||
|
Fees and Other
|
$
|
291,345
|
|
$
|
255,874
|
|
$
|
188,626
|
|
$
|
307,923
|
|
|||
|
Less: Total Expenses
|
515,033
|
|
554,177
|
|
276,920
|
|
525,095
|
|
|||||||
|
Total Investment Income (Loss)
|
2,182,835
|
|
3,634,718
|
|
(1,136,991
|
)
|
1,488,563
|
|
|||||||
|
Income (Loss) Before Taxes
|
1,959,147
|
|
3,336,415
|
|
(1,225,285
|
)
|
1,271,391
|
|
|||||||
|
Income Tax / (Benefit)
|
16,138
|
|
30,547
|
|
(7,390
|
)
|
27,341
|
|
|||||||
|
Net Income (Loss)
|
1,943,009
|
|
3,305,868
|
|
(1,217,895
|
)
|
1,244,050
|
|
|||||||
|
Less: Net Income (Loss) Attributable to Redeemable Noncontrolling Interests
|
1,933
|
|
(891
|
)
|
(12,925
|
)
|
7,371
|
|
|||||||
|
Less: Net Income (Loss) Attributable to Noncontrolling Interests and Appropriated Capital
|
1,670,569
|
|
2,930,453
|
|
(1,014,382
|
)
|
1,204,422
|
|
|||||||
|
Net Income (Loss) Attributable to KKR & Co. L.P.
|
$
|
270,507
|
|
$
|
376,306
|
|
$
|
(190,588
|
)
|
$
|
32,257
|
|
|||
|
Net Income (Loss) Attributable to KKR & Co. L.P. Per Common Unit
|
|||||||||||||||
|
Basic
|
$
|
0.62
|
|
$
|
0.84
|
|
$
|
(0.42
|
)
|
$
|
0.07
|
|
|||
|
Diluted
|
$
|
0.57
|
|
$
|
0.78
|
|
$
|
(0.42
|
)
|
$
|
0.07
|
|
|||
|
Weighted Average Common Units Outstanding
|
|||||||||||||||
|
Basic
|
434,874,820
|
|
446,794,950
|
|
452,165,697
|
|
461,374,013
|
|
|||||||
|
Diluted
|
472,225,344
|
|
482,651,491
|
|
452,165,697
|
|
489,704,787
|
|
|||||||
234
Notes to Consolidated Financial Statements (Continued)
|
Three Months Ended,
|
|||||||||||||||
|
March 31, 2014
|
June 30, 2014
|
September 30, 2014
|
December 31, 2014
|
||||||||||||
|
Statement of Operations Data:
|
|||||||||||||||
|
Fees and Other
|
$
|
302,926
|
|
$
|
249,370
|
|
$
|
344,768
|
|
$
|
212,944
|
|
|||
|
Less: Total Expenses
|
473,171
|
|
585,325
|
|
504,410
|
|
633,161
|
|
|||||||
|
Total Investment Income (Loss)
|
2,196,113
|
|
2,394,627
|
|
1,060,953
|
|
893,055
|
|
|||||||
|
Income (Loss) Before Taxes
|
2,025,868
|
|
2,058,672
|
|
901,311
|
|
472,838
|
|
|||||||
|
Income Tax / (Benefit)
|
21,702
|
|
6,176
|
|
29,267
|
|
6,524
|
|
|||||||
|
Net Income (Loss)
|
2,004,166
|
|
2,052,496
|
|
872,044
|
|
466,314
|
|
|||||||
|
Less: Net Income (Loss) Attributable to Redeemable Noncontrolling Interests
|
10,637
|
|
(6,809
|
)
|
(2,462
|
)
|
(4,707
|
)
|
|||||||
|
Less: Net Income (Loss) Attributable to Noncontrolling Interests and Appropriated Capital
|
1,783,488
|
|
1,881,090
|
|
784,568
|
|
471,604
|
|
|||||||
|
Net Income (Loss) Attributable to KKR & Co. L.P.
|
$
|
210,041
|
|
$
|
178,215
|
|
$
|
89,938
|
|
$
|
(583
|
)
|
|||
|
Net Income (Loss) Attributable to KKR & Co. L.P. Per Common Unit
|
|||||||||||||||
|
Basic
|
$
|
0.72
|
|
$
|
0.47
|
|
$
|
0.21
|
|
$
|
0.00
|
|
|||
|
Diluted
|
$
|
0.65
|
|
$
|
0.43
|
|
$
|
0.20
|
|
$
|
0.00
|
|
|||
|
Weighted Average Common Units Outstanding
|
|||||||||||||||
|
Basic
|
293,490,461
|
|
377,542,161
|
|
419,961,455
|
|
431,432,521
|
|
|||||||
|
Diluted
|
325,104,229
|
|
410,179,838
|
|
452,019,742
|
|
458,982,859
|
|
|||||||
20. SUBSEQUENT EVENTS
Distribution
A distribution of
$0.16
per KKR & Co. L.P. common unit was announced on
February 11, 2016
, and will be paid on
March 8, 2016
to unitholders of record as of the close of business on
February 22, 2016
. KKR Holdings will receive its pro rata share of the distribution from the KKR Group Partnerships.
235
None.
Any controls and procedures, no matter how well designed and operated, can provide only reasonable assurance of achieving the desired control objectives. Our management, with the participation of our Co-Chief Executive Officers and Chief Financial Officer, has evaluated the effectiveness of our disclosure controls and procedures (as such term is defined in Rules 13a-15(e) and 15d- 15(e) under the Exchange Act) as of the end of the period covered by this report. Based on such evaluation, our Co-Chief Executive Officers and Chief Financial Officer have concluded that, as of the end of such period, our disclosure controls and procedures are at the reasonable assurance level: (i) effective in recording, processing, summarizing, and reporting information on a timely basis that we are required to disclose in the reports that we file or submit under the Exchange Act; and (ii) effective in ensuring that information that we are required to disclose in the reports that we file or submit under the Exchange Act is accumulated and communicated to our management, including our Co-Chief Executive Officers and Chief Financial Officer, as appropriate, to allow timely decisions regarding required disclosure.
Management's Report on Internal Control Over Financial Reporting
Our management is responsible for establishing and maintaining adequate internal control over financial reporting. Internal control over financial reporting (as defined in Rule 13a-15(f) and 15d-15(f) under the Exchange Act) is a process designed by, or under the supervision of, a company's principal executive and principal financial officers and effected by the board of directors, management and other personnel, to provide reasonable assurance regarding the reliability of financial reporting and the preparation of financial statements for external purposes in accordance with generally accepted accounting principles and includes those policies and procedures that:
• Pertain to the maintenance of records that in reasonable detail accurately and fairly reflect the transactions and dispositions of the assets of the company;
• Provide reasonable assurance that transactions are recorded as necessary to permit preparation of financial statements in accordance with generally accepted accounting principles, and that receipts and expenditures of the company are being made only in accordance with authorizations of management and directors of the company; and
• Provide reasonable assurance regarding prevention or timely detection of unauthorized acquisition, use, or disposition of the company's assets that could have a material effect on the financial statements.
Our management assessed the effectiveness of our internal control over financial reporting as of
December 31, 2015
. In making this assessment, management used the criteria set forth by the Committee of Sponsoring Organizations of the Treadway Commission (COSO) in Internal Control—Integrated Framework, that was issued in 2013.
Based on its assessment, our management has concluded that, as of
December 31, 2015
, our internal control over financial reporting is effective.
Changes in Internal Control Over Financial Reporting
No changes in our internal control over financial reporting (as such term is defined in Rule 13a-15(f) of the Exchange Act) occurred during the fourth quarter of
2015
that materially affected, or are reasonably likely to materially affect, our internal control over financial reporting.
Attestation Report of the Independent Registered Public Accounting Firm
Our independent registered public accounting firm, Deloitte & Touche LLP, has issued its attestation report on our internal control over financial reporting which is included in Item 8. Financial Statements and Supplementary Data.
236
On February 23, 2016, the board of directors of our Managing Partner authorized grants of restricted equity units as deferred equity bonus compensation to each of our Chief Administrative Officer, Chief Financial Officer, and General Counsel. See "Executive Compensation—Compensation Discussion and Analysis—Compensation Elements—Year-End Bonus Compensation" for more information regarding the number of units granted and the terms of the awards, which is incorporated herein by reference.
On February 23, 2016, board of directors of our Managing Partner consented to the grant by KKR Holdings L.P. of units in KKR Holdings L.P. to each of our Chief Administrative Officer, Chief Financial Officer, and General Counsel. See "Executive Compensation—Compensation Discussion and Analysis—Compensation Elements—KKR Holdings Market Condition Awards" for more information regarding the number of units granted and the terms of the awards, which is incorporated herein by reference.
237
Our Managing Partner
As is commonly the case with limited partnerships, our limited partnership agreement provides for the management of our business and affairs by a general partner rather than a board of directors. Our Managing Partner serves as our sole general partner. Our Managing Partner has a board of directors that is co-chaired by our founders Henry Kravis and George Roberts, who also serve as our Co-Chief Executive Officers and are authorized to appoint our other officers. Our Managing Partner does not have any economic interest in our partnership.
Directors and Executive Officers
The following table presents certain information concerning the board of directors and executive officers of our Managing Partner.
|
Name
|
Age
|
Position with Managing Partner
|
||
|
Henry R. Kravis
|
72
|
|
Co-Chief Executive Officer, Co-Chairman and Director
|
|
|
George R. Roberts
|
72
|
|
Co-Chief Executive Officer, Co-Chairman and Director
|
|
|
David C. Drummond
|
52
|
|
Director
|
|
|
Joseph A. Grundfest
|
64
|
|
Director
|
|
|
John B. Hess
|
61
|
|
Director
|
|
|
Patricia F. Russo
|
63
|
|
Director
|
|
|
Thomas M. Schoewe
|
63
|
|
Director
|
|
|
Robert W. Scully
|
66
|
|
Director
|
|
|
Todd A. Fisher
|
50
|
|
Chief Administrative Officer
|
|
|
William J. Janetschek
|
53
|
|
Chief Financial Officer
|
|
|
David J. Sorkin
|
56
|
|
General Counsel and Secretary
|
|
Henry R. Kravis
co-founded KKR in 1976 and is Co-Chairman and Co-Chief Executive Officer of our Managing Partner. He is actively involved in managing the firm and serves on regional Private Equity Investment and Portfolio Management Committees. Mr. Kravis currently serves on the boards of First Data Corporation and ICONIQ Capital, LLC. He also serves as a director, chairman emeritus or trustee of several cultural, professional, and educational institutions, including The Business Council, Claremont McKenna College, Columbia Business School, Mount Sinai Hospital, Partnership for New York City, Partnership Fund for New York City, Rockefeller University, Sponsors for Educational Opportunity and Tsinghua University School of Economics and Management . He earned a B.A. from Claremont McKenna College in 1967 and an M.B.A. from the Columbia Business School in 1969. Mr. Kravis has more than four decades of experience financing, analyzing, and investing in public and private companies, as well as serving on the boards of a number of KKR portfolio companies . As our co-founder and Co-Chief Executive Officer, Mr. Kravis has an intimate knowledge of KKR's business, which allows him to provide insight into various aspects of our business and is of significant value to the board of directors. Mr. Kravis is a first cousin of Mr. Roberts.
George R. Roberts
co-founded KKR in 1976 and is Co-Chairman and Co-Chief Executive Officer of our Managing Partner. He is actively involved in managing the firm and serves on regional Private Equity Investment and Portfolio Management Committees. Mr. Roberts serves as a director or trustee of several cultural and educational institutions, including Claremont McKenna College. He is also founder and chairman of the board of directors of REDF, a San Francisco nonprofit organization. He earned a B.A. from Claremont McKenna College in 1966 and a J.D. from the University of California (Hastings) Law School in 1969. Mr. Roberts has more than four decades of experience financing, analyzing, and investing in public and private companies, as well as serving on the boards of a number of KKR portfolio companies. As our co-founder and Co-Chief Executive Officer, Mr. Roberts has an intimate knowledge of KKR's business, which allows him to provide insight into various aspects of our business and is of significant value to the board of directors. Mr. Roberts is a first cousin of Mr. Kravis.
238
David C. Drummond
has been a member of the board of directors of our Managing Partner since March 14, 2014. Mr. Drummond has served as the senior vice president, corporate development of Alphabet Inc. (and its predecessor Google Inc.) since January 2006, as its chief legal officer since December 2006, and as its secretary since 2002. Previously, he served as Google Inc.'s vice president, corporate development and general counsel since February 2002. Prior to joining Google Inc., from July 1999 to February 2002, Mr. Drummond served as chief financial officer of SmartForce, an educational software applications company. Prior to that, Mr. Drummond was a partner at the law firm of Wilson Sonsini Goodrich & Rosati. Mr. Drummond holds a Juris Doctor degree from Stanford University and a Bachelor of Arts degree in history from Santa Clara University. Mr. Drummond provides significant value to the oversight and development of our business through his management and leadership roles at a publicly-traded global technology business and his insight into legal developments affecting global enterprises.
Joseph A. Grundfest
has been a member of the board of directors of our Managing Partner since July 15, 2010. Mr. Grundfest has been a member of the faculty of Stanford Law School since 1990, where he is the William A. Franke Professor of Law and Business. He is also senior faculty of the Arthur and Toni Rembe Rock Center for Corporate Governance at Stanford University; founder and director of Directors' College, a venue for the professional education of directors of publicly traded corporations; and co-founder of Financial Engines, Inc., a provider of services and advice to participants in employer-sponsored retirement plans, where he has served as a director since its inception in 1996. Mr. Grundfest was a Commissioner of the SEC from 1985 to 1990. He holds a B.A. in Economics from Yale University and a J.D. from Stanford Law School. Mr. Grundfest's knowledge and expertise in capital markets, corporate governance, and securities laws provides significant value to the oversight and development of our business.
John B. Hess
has been a member of the board of directors of our Managing Partner since July 28, 2011. Mr. Hess has been the chief executive officer of Hess Corporation since 1995 and a director since 1978. He was also director of Dow Chemical Co. from 2006 to 2013. He serves on the Secretary of Energy Advisory Board Quadrennial Review Task Force and as a director on the Business Council, the Trilateral Commission and the Council on Foreign Relations and on the executive committee of the American Petroleum Institute. Mr. Hess is a member of the board of trustees at the New York Public Library, Mount Sinai Hospital, the Lincoln Center for the Performing Arts and the Dean's Advisors at Harvard Business School, and chairs The Harvard Business School Campaign. Mr. Hess earned a B.A. from Harvard College and an M.B.A. from Harvard Business School. Mr. Hess provides significant value to the oversight and development of our business through his management and leadership roles at a global energy business, and his involvement with major businesses and public policy organizations also provides valuable perspectives for our company.
Patricia F. Russo
has been a member of the board of directors of our Managing Partner since April 15, 2011. Ms. Russo served as chief executive officer of Alcatel-Lucent from 2006 to 2008. Prior to the merger of Alcatel and Lucent in 2006, she served as chairman and chief executive officer of Lucent Technologies, Inc. from 2003 to 2006, and as president and chief executive officer from 2002 to 2003. Before rejoining Lucent in 2002, Ms. Russo was president and chief operating officer of Eastman Kodak Company from March 2001 to December 2001. Since November 2015, Ms. Russo has been the chairman of Hewlett Packard Enterprise Company, which was spun off from Hewlett-Packard Company, where Ms. Russo served as a director from 2011 to November 2011. She also serves a director of Alcoa Inc. since 2008, Merck & Co., Inc. since 2009 and General Motors Company since 2009. Prior to its merger with Merck in 2009, Ms. Russo served as a director of Schering-Plough since 1995. She graduated from Georgetown University with a bachelor's degree in political science and history, and obtained an Advanced Management Degree from Harvard Business School's Advanced Management Program. Ms. Russo's management and leadership experience as chief executive officer of complex global companies as well as her experience with corporate strategy, mergers and acquisitions, and sales and marketing brings important expertise to the oversight and development of our business. Ms. Russo also brings extensive experience in corporate governance as a member of boards and board committees of other public companies.
Thomas M. Schoewe
has been a member of the board of directors of our Managing Partner since March 14, 2011. Mr. Schoewe was executive vice president and chief financial officer for Wal-Mart Stores, Inc., a position he held from 2000 to 2010, and was employed by Walmart in a transitional capacity to January 2011. Prior to his employment at Walmart, Mr. Schoewe served as senior vice president and chief financial officer for Black and Decker Corp., a position he held
from 1993 to 1999. Prior to that, he served for four years as Black and Decker's vice president of finance. He previously held the position of vice president of business planning and analysis. He joined Black and Decker in 1986 after serving at Chicago-based Beatrice Companies, where he was chief financial officer and controller of Beatrice Consumer Durables, Inc. He has
served on the board of directors of Northrop Grumman Corporation and General Motors Company since 2011. From 2001 to May 2012, he served on the board of directors of PulteGroup Inc., which merged with Centex Corporation in 2009 and previously served on the Centex board. Mr. Schoewe graduated from Loyola University of Chicago with a bachelor's of business administration degree in finance. Mr. Schoewe's experience in financial reporting, accounting and control, and business planning and analysis brings important expertise to the oversight and development of our business.
239
Robert W. Scully
has been a member of the board of directors of our Managing Partner since July 15, 2010. Mr. Scully was a member of the Office of the Chairman of Morgan Stanley from 2007 until his retirement in 2009, where he had previously been co-president, chairman of global capital markets and vice chairman of investment banking. Prior to joining Morgan Stanley, he served as a managing director at Lehman Brothers and at Salomon Brothers. Mr. Scully has served as a director of Zoetis Inc. since June 2013 and Chubb Limited (formerly ACE Limited) since May 2014 and as a public governor of the Financial Industry Regulatory Authority, or FINRA, since November 2014. Previously, he was a director of Bank of America Corporation until May 2013 and has also served as a director of GMAC Financial Services and MSCI Inc. He holds an A.B. from Princeton University and an MBA from Harvard Business School. Mr. Scully's 35-year career in the financial services industry brings important expertise to the oversight of our business. In addition, his leadership experience with a global financial services company brings an industry perspective to our business development within and outside the U.S. as well as issues such as talent development, senior client relationship management, strategic initiatives, risk management and audit and financial reporting.
Todd A. Fisher
joined KKR in 1993 and is Chief Administrative Officer of our Managing Partner. Mr. Fisher is responsible for overseeing the finance, legal, information technology, human resources, public affairs and office operations functions, coordinating with the various businesses and geographies of KKR and overseeing the firm's efforts in real estate investments. He is a member of KKR's Real Estate Investment and Portfolio Management Committees and also chairs the firm's Risk Committee. He served as a director of Maxeda B.V. until October 2015, as a director of Rockwood Holdings, Inc. until January 2013 and Northgate Information Solutions plc until 2012. Prior to joining KKR, Mr. Fisher worked for Goldman, Sachs & Co. in New York and for Drexel Burnham Lambert in Los Angeles. Mr. Fisher holds a B.A. from Brown University, an M.A. in International Affairs from Johns Hopkins University, and an M.B.A. from the Wharton School of the University of Pennsylvania. He is currently a member of the Board of Trustees of Brown University, the Board of Advisors for The Johns Hopkins University School for Advanced International Studies, the Advisory Board of the Clinton Health Access Initiative, the United States Holocaust Memorial Council and the Council on Foreign Relations.
William J. Janetschek
joined KKR in 1997 and is Chief Financial Officer of our Managing Partner. He has also been the president and chief executive officer of KKR Financial Services LLC since June 2014 and a director since May 2014. Prior to joining KKR, he was a Tax Partner at Deloitte & Touche LLP. He holds a B.S. from St. John's University and an M.S., Taxation from Pace University. Mr. Janetschek is actively involved in the community, serving as a sponsor and member of a variety of non-profit organizations including Student Sponsor Partners and St. John's University.
David J. Sorkin
joined KKR in 2007 and is General Counsel and Secretary of our Managing Partner. Prior to joining KKR, Mr. Sorkin was with Simpson Thacher & Bartlett LLP for 22 years. He served as a partner at the law firm and also served on the executive committee and was one of KKR's principal outside counsels. He received a B.A., summa cum laude, from Williams College and a J.D., cum laude, from Harvard Law School.
Independence and Composition of the Board of Directors
Our Managing Partner's board of directors consists of eight directors, six of whom, Messrs. Drummond, Grundfest, Hess, Schoewe and Scully and Ms. Russo, are independent under NYSE rules relating to corporate governance matters and the independence standards described in our corporate governance guidelines. In addition. Dieter Rampl, who served as a director for a portion of the fiscal year ended December 31, 2015, was an independent director during such time. While we are exempt from NYSE rules relating to board independence, our Managing Partner intends to maintain a board of directors that consists of at least a majority of directors who are independent under NYSE rules relating to corporate governance matters. In addition, the board has considered transactions and relationships between KKR and the companies and organizations on whose boards or other similar governing bodies where our directors also serve or where our directors serve as executive officers.
Board Committees
Our Managing Partner's board of directors has four standing committees: an audit committee, a conflicts committee, a nominating and corporate governance committee and an executive committee that operate pursuant to written charters as described below. Because we are a limited partnership, our Managing Partner's board is not required by NYSE rules to establish a compensation committee or a nominating and corporate governance committee or to meet other substantive NYSE corporate governance requirements. While the board has established a nominating and governance committee, we rely on available exemptions concerning the committee's composition and mandate.
240
Audit Committee
The audit committee consists of Messrs. Grundfest (Chairman), Schoewe and Scully. The purpose of the audit committee is to provide assistance to the board of directors in fulfilling its responsibility with respect to its oversight of: (i) the quality and integrity of our financial statements, including investment valuations; (ii) our compliance with legal and regulatory requirements; (iii) our independent registered public accounting firm's qualifications, independence and performance; and (iv) the performance of our internal audit function. The members of the audit committee meet the independence standards and financial literacy requirements for service on an audit committee of a board of directors pursuant to the Exchange Act and NYSE rules applicable to audit committees. The Managing Partner's board of directors has determined that each of Messrs. Grundfest, Schoewe and Scully is an "audit committee financial expert" within the meaning of Item 407(d)(5) of Regulation S-K. The audit committee has a charter which is available at the Investor Center section of our internet website at www.kkr.com.
Conflicts Committee
The conflicts committee consists of Messrs. Drummond, Grundfest, Hess, Schoewe and Scully and Ms. Russo. The conflicts committee is responsible for reviewing specific matters that the board of directors believes may involve a conflict of interest and for enforcing our rights under any of the exchange agreement, the tax receivable agreement, the limited partnership agreement of any KKR Group Partnership or our limited partnership agreement, which we refer collectively to as the covered agreements, against KKR Holdings and certain of its subsidiaries and designees, a general partner or limited partner of KKR Holdings, or a person who holds a partnership or equity interest in the foregoing entities. The conflicts committee is also authorized to take any action pursuant to any authority or rights granted to such committee under any covered agreement or with respect to any amendment, supplement, modification or waiver to any such agreement that would purport to modify such authority or rights. In addition, the conflicts committee shall approve any amendment to any of the covered agreements that in the reasonable judgment of our Managing Partner's board of directors is or will result in a conflict of interest. The conflicts committee will determine if the resolution of any conflict of interest submitted to it is fair and reasonable to our partnership. Any matters approved by the conflicts committee will be conclusively deemed to be fair and reasonable to our partnership and not a breach of any duties that may be owed to our unitholders. In addition, the conflicts committee may review and approve any related person transactions, other than those that are approved pursuant to our related person policy, as described under "Certain Relationships and Related Transactions, and Director Independence—Statement of Policy Regarding Transactions with Related Persons," and may establish guidelines or rules to cover specific categories of transactions. The members of the conflicts committee meet the independence standards under our corporate governance guidelines as required for service on the conflicts committee in accordance with its charter.
Nominating and Corporate Governance Committee
The nominating and corporate governance committee consists of Messrs. Kravis, Roberts and Scully. The nominating and corporate governance committee is responsible for identifying and recommending candidates for appointment to the board of directors and for assisting and advising the board of directors with respect to matters relating to the general operation of the board and corporate governance matters. Mr. Scully meets the independence standards under the rules of the NYSE as required for service on the nominating and corporate governance committee in accordance with its charter.
Executive Committee
The executive committee consists of Messrs. Kravis and Roberts. The purpose of the executive committee is to act, when necessary, in place of our Managing Partner's full board of directors during periods in which the board is not in session. The executive committee is authorized and empowered to act as if it were the full board of directors in overseeing our business and affairs, except that it is not authorized or empowered to take actions that have been specifically delegated to other board committees or to take actions with respect to: (i) the declaration of distributions on our common units; (ii) a merger or consolidation of our partnership with or into another entity; (iii) a sale, lease or exchange of all or substantially all of our assets; (iv) a liquidation or dissolution of our partnership; (v) any action that must be submitted to a vote of our Managing Partner's members or our unitholders; or (vi) any action that may not be delegated to a board committee under our Managing Partner's limited liability company agreement or the Delaware Limited Liability Company Act.
241
Code of Business Conduct and Ethics
We have a Code of Business Conduct and Ethics which applies to our principal executive officers, principal financial officer and principal accounting officer and is available on our internet website at www.kkr.com under the "Investor Center" section. In accordance with, and to the extent required by the rules and regulations of the Securities and Exchange Commission, we intend to disclose any amendment to or waiver of the Code of Business Conduct and Ethics on behalf of an executive officer or director either on our internet website or in a Current Report on Form 8-K filing.
Corporate Governance Guidelines
Our Managing Partner's board of directors has a governance policy which addresses matters such as the board of directors' responsibilities and duties, the board of directors' composition and compensation and director independence. The governance guidelines are available on our internet website at www.kkr.com under the "Investor Center" section.
Communications to the Board of Directors
The non-management members of our Managing Partner's board of directors meet regularly. At each meeting of the non-management members, the non- management directors choose a director to lead the meeting. All interested parties, including any employee or unitholder, may send communications to the non-management members of our Managing Partner's board of directors by writing to: the General Counsel, KKR & Co. L.P., 9 West 57th Street, Suite 4200, New York, New York 10019.
Section 16(a) Beneficial Ownership Reporting Compliance
Section 16(a) of the Exchange Act, requires the executive officers and directors of our general partner, and persons who beneficially own more than ten percent of a registered class of the Partnership's equity securities to file initial reports of ownership and reports of changes in ownership with the SEC and furnish the Partnership with copies of all Section 16(a) forms they file. To our knowledge, based solely on our review of the copies of such reports or written representations from such persons that they were not required to file a Form 5 to report previously unreported ownership or changes in ownership, we believe that, with respect to the fiscal year ended
December 31, 2015
, such persons complied with all such filing requirements except that KKR Holdings had one late Form 4 filing relating to one transaction.
Compensation Discussion and Analysis
Compensation Philosophy
Our compensation program has three primary objectives: (1) to attract, motivate and retain our employees, (2) to align their interests with those of our unitholders and fund investors, and (3) to reinforce our culture and values.
Our employees.
Our business as an investment firm is dependent on the services of our employees, including our named executive officers. Among other things, we depend on their ability to find, select and execute investments, manage and improve portfolio company operations, find and develop relationships with fund investors and other sources of capital, and provide other services, and we cannot compete without their continued employment with us. Therefore, it is important that our key employees are compensated in a manner that motivates them to excel consistently and encourages them to remain with the firm.
Alignment of interests.
Management equity ownership in the businesses in which we invest has been a guiding principle throughout our firm's history, and we apply that principle to ourselves: every employee of the firm is expected to have an equity interest in KKR. This equity ownership serves to align the interests of our employees with those of our unitholders. In addition, because we invest in and alongside our investment funds and have a carry pool from which we can allocate to our employees 40% of the carried interest that we generate through our business, we believe that our employees' interests are also aligned with those of our investors in the funds, vehicles and accounts that we manage, which in turn benefits our unitholders.
Culture and values.
One of our most important values is our "one- firm" approach with shared responsibility and success, and we also subscribe to a culture of meritocracy and fairness. Therefore, compensation is based on the performance of the firm as a whole as well as on an individual's contributions to the firm. For example, we do not compensate people based merely on an individual's accomplishments in relation to the profits and losses of his or her business unit. In addition, we conduct, at least annually, an evaluation process based on input from a wide range of persons regarding each employee's contribution to the
242
firm, including his or her commitment to the firm's culture and values. We believe that using this kind of an evaluation process also promotes a measure of objectivity as a balance to a single manager's judgment.
We refer to our two Co-Chief Executive Officers, our Chief Administrative Officer, our Chief Financial Officer and our General Counsel as our "named executive officers." We believe that the elements of compensation discussed below for our named executive officers serve these primary objectives. We, as a limited partnership with no annual meeting of unitholders, are not required to conduct say-on-pay or say-on-frequency votes as provided in the Dodd-Frank Act. However, we intend periodically to review the elements of our compensation, and we may make changes to the compensation structure relating to one or more named executive officers based on the outcome of such reviews from time to time.
KKR Holdings
Each of our named executive officers holds interests in our business through KKR Holdings, which is the entity that indirectly owns all of the outstanding KKR Group Partnership Units that are not allocable to us.
KKR Holdings units are, subject to certain restrictions, exchangeable for our common units, on a one-for-one basis, and generally cannot be sold to third parties for monetary value unless they are first exchanged for our common units. Because KKR Holdings units are exchangeable for our common units, we believe that our named executive officers' interests are aligned with those of our unitholders.
KKR Holdings, from time to time, receives distributions that are made on KKR Group Partnership Units that are held by it. To the extent such distributions are received on KKR Group Partnership Units that underlie any KKR Holdings units that have satisfied their respective vesting requirements, if any, at the time distributions are declared on the underlying KKR Group Partnership Units, such distributions will be allocated and further distributed to the named executive officers as and when received. To the extent that such distributions are made on KKR Group Partnership Units underlying any KKR Holdings units that have not satisfied all vesting requirements at the time distributions are declared on the underlying KKR Group Partnership Units, such distributions may be allocated or otherwise applied in such amounts and in such manner as our Co-Chief Executive Officers, acting through the general partner of KKR Holdings, may determine. KKR Holdings units subject solely to service-based vesting requirements generally vested three to five years from the date of grant. KKR Holdings units subject to price and service-based vesting requirements, which were first granted to certain of our named executive officers in 2016, are eligible to vest periodically in tranches over a three year period starting on January 1, 2018 subject to the satisfaction of certain price and service-based vesting requirements. See "-Compensation Elements - Year-End Bonus Compensation" for a description of these grants. As of February 22, 2016, approximately 7.7 million KKR Holdings units remain unallocated or unvested.
In
2015
, our named executive officers received distributions on their vested KKR Holdings units, and because these distributions are not considered to be compensation, they have not been reported in the Summary Compensation Table.
Compensation Elements
Base Salary
For
2015
, each of our named executive officers was paid an annual salary of $300,000. We believe that the base salary of our named executive officers should typically not be the most significant component of total compensation. Our Co-Chief Executive Officers determined that this amount was a sufficient minimum base salary for our named executive officers and decided that it should be the same for all named executive officers. We are responsible for funding this base salary.
Year-End Bonus Compensation
Other than their salary and certain incidental benefits noted below under "Other Compensation," our Co-Chief Executive Officers did not receive any additional compensation in
2015
. They have decided at this time not to receive any bonus or other amounts from us or from KKR Holdings in excess of distributions payable with respect to their KKR Holdings units. Instead, they have decided that year-end bonus payments from KKR Holdings for 2015 should be made to our other employees in order to motivate and retain them for the benefit of the firm.
In
2015
, our Chief Administrative Officer, Chief Financial Officer and General Counsel were awarded additional year-end compensation as bonus payments that were determined by our Co-Chief Executive Officers. Our Co-Chief Executive Officers made their subjective determinations by assessing our overall performance and the contributions that our Chief Administrative Officer, Chief Financial Officer and General Counsel made to our development and success, as a firm, during the year. Certain factors that were considered when determining the size of the bonus payments for our Chief Administrative Officer, Chief
243
Financial Officer and General Counsel include (i) their respective contributions and accomplishments in
2015
in terms of driving commercial results for the firm, leading and managing people, and living the firm's values; (ii) their respective performance and contributions relative to other senior employees at the firm, (iii) their respective performance and contributions in
2015
as compared to the prior year, and (iv) the overall financial performance of the firm in
2015
as compared to the prior year based on certain financial measures considered by management, including but not limited to cash earnings. More specifically, in assessing Mr. Fisher's contributions, they considered his service as the firm's Chief Administrative Officer, his role in overseeing the growth and operations of the firm, his leadership in the development of our real estate business and his leadership on the strategic direction of the firm generally. In assessing Mr. Janetschek's contributions, they considered his service as the Chief Financial Officer and his leadership and oversight of our finance, tax and accounting functions and related operations and his role with respect to strategic initiatives undertaken by the firm. Finally, in assessing Mr. Sorkin's contributions, they considered his leadership and oversight of our global legal and compliance functions and his role with respect to the strategic initiatives undertaken by the firm. In part, because the firm's performance in 2015 was mixed, with strong capital deployment and fundraising offset by weaker cash earnings and investment income than in 2014, the aggregate size of the bonus granted to the named executive officers, consisting of their cash bonus and deferred equity bonus, with respect to fiscal
2015
was generally lower relative to the total bonus granted with respect to fiscal 2014. In making these determinations, our Co-Chief Executive Officers consulted with certain of our senior employees and, with respect to the determinations for our Chief Financial Officer and General Counsel, considered the recommendations of our Chief Administrative Officer. We believe that the discretion permitted to our Co-Chief Executive Officers permits them to award bonus compensation in an amount they determine to be necessary to motivate and retain these named executive officers.
Once the bonus amount is determined, the bonus amount is divided into cash compensation and, for our named executive officers, a recommendation to our Managing Partner's board of directors for an award of deferred equity bonus compensation and, in some years, additional equity compensation. The amount of deferred equity bonus compensation for our principals is calculated using a graduated range of percentages applied to different incremental amounts of total salary and bonus compensation ranging from 5% to 50%. In addition, senior employees including our named executive officers are eligible, in some years, for additional equity compensation without reference to the graduated range of percentages. Grants of additional equity compensation may be made to our named executive officers in order to deliver a total bonus compensation determined by our Co-Chief Executive Officers as described above, less the cash compensation and deferred equity bonus. No grants of additional equity compensation were made to our named executive officers in connection with 2015 year-end bonus compensation, although market condition awards were granted to our named executive officers by KKR Holdings. See "—Market Condition Awards."
The cash bonus amounts paid to our Chief Administrative Officer, our Chief Financial Officer and our General Counsel for
2015
are reflected in the Bonus column of the
2015
Summary Compensation Table below.
The portion of the bonus payment granted to our named executive officers (other than our Co-Chief Executive Officers, who received none) as
2015
deferred equity bonus compensation consists of grants of equity awards issued under the Equity Incentive Plan. These equity awards are restricted equity units that may be settled for our common units on a one-for-one basis. See below under "Terms of Restricted Equity Units" for more information. We call these equity grants "deferred" equity bonus compensation, because our named executive officers' ability to monetize them into cash is deferred to the future when the vesting provisions (and any applicable transfer restrictions) discussed below lapse.
The number of restricted equity units granted to our named executive officers (other than our Co-Chief Executive Officers, who received none) is determined by our Managing Partner's board of directors. As part of
2015
year-end bonus compensation, our Managing Partner's board of directors approved the following grants: 101,540 restricted equity units to our Chief Administrative Officer, 57,727 restricted equity units to our Chief Financial Officer, and 59,799 restricted equity units to our General Counsel, in each case as deferred equity bonus compensation. The number of restricted equity units was determined by dividing the dollar amount of deferred equity bonus compensation recommended by the Co-Chief Executive Officers to the board of directors by the average closing price of our common units over the ten trading days ending December 4, 2015. Because these grants were made after December 31, 2015 and the associated restricted equity units are generally issued in the first quarter of the following year, they do not appear in the tables below, but will appear in the tables for the year ended December 31, 2016.
The restricted equity units that were granted as deferred equity bonus compensation in respect of fiscal
2015
year-end compensation are subject to a three-year service-based vesting condition (with the first vesting event occurring on April 1, 2017). The restricted equity units for the deferred equity bonus are not subject to additional transfer restrictions after vesting or any minimum retained ownership requirement. While our named executive officers did not receive restricted equity units as additional equity compensation in connection with fiscal 2015 year-end compensation, such additional restricted equity units received in respect of fiscal 2014 year-end compensation are subject to transfer restrictions after vesting and minimum retained
244
ownership requirements. From time to time such restrictions may be lifted and applied to an equivalent number of KKR Holdings Units held by an officer through KKR Holdings L.P. Vesting requirements serve as an employment retention mechanism and thereby enhance the alignment of interests between our named executive officers who receive year-end compensation payments and the firm. Because these restricted equity units are generally issued in the first quarter of the following year, they do not appear in the tables below, but will appear in the tables for the year ended December 31, 2016.
Our named executive officers along with other employees at the firm were eligible for additional equity compensation awards based on their performance and contributions during the year as described above. Eligibility for this additional equity compensation was introduced for 2014 year-end compensation for our named executive officers and grants made in February 2015 for 2014 year-end compensation are reflected in the Summary Compensation Table. While no additional equity compensation was granted to our named executive officers in connection with 2015 year-end bonus compensation, these additional equity compensation awards may become a component of our annual year-end bonus determination for our named executive officers in the future. However, see "—Market Condition Awards" for market condition awards granted to our named executive officers by KKR Holdings.
Market Condition Awards
In 2016 our named executive officers (other than our Co-Chief Executive Officers, who received none) also received grants of KKR Holdings units subject to price and service-based vesting requirements. The objective of these grants was to incentivize and retain certain senior employees, including certain of our named executive officers, align their interests with those of unitholders and provide meaningful incremental long-term economic incentives in addition to year-end compensation. These awards were not designed as an annual compensation program, but rather a retention and long-term incentive award program. The number of KKR Holdings units granted to our named executive officers was determined by the general partner of KKR Holdings. Following the receipt of the consent of our Managing Partner's board of directors, the general partner of KKR Holdings made the following grants: 900,000 KKR Holdings units to our Chief Administrative Officer, 550,000 KKR Holdings units to our Chief Financial Officer, and 550,000 KKR Holdings units to our General Counsel. The KKR Holdings units granted to our named executive officers are outstanding but previously unallocated units, and consequently these grants will not increase the number of KKR Holdings units outstanding. If and when vested and exchanged, these KKR Holdings units would not dilute KKR's respective ownership interests in the KKR Group Partnerships.
The KKR Holdings units granted to these named executive officers are subject to price and service-based vesting requirements. Tranches of these KKR Holdings units become eligible to vest periodically over a three year period beginning on January 1, 2018 upon satisfaction of a service-based vesting condition and also a price vesting condition based on the price of KKR common units reaching and maintaining certain specified price thresholds for a specified period of time. None of these KKR Holdings units are eligible to vest prior to January 1, 2018 and if applicable price targets are not achieved by the close of business on January 1, 2021, any of these KKR Holdings units that remain unvested will be automatically forfeited. These KKR Holdings units are not subject to additional transfer restrictions after vesting but are subject to minimum retained ownership requirements. Because these grants were made after December 31, 2015, they do not appear in the tables below, but will appear in the tables for the year ended December 31, 2016.
Carried Interest
We have available to allocate and distribute to a carry pool 40% of the carried interest that we earn, from which our employees are eligible to receive a carried interest allocation. Carry pool allocations for the named executive officers are made by first determining a total dollar value for the named executive officer's interest in the carry pool. Due to their unique status as co-founders of our firm, our Co-Chief Executive Officers determine their own allocation from the carry pool. To make this total dollar value determination for the other named executive officers, our Co-Chief Executive Officers take into consideration the executive officer's involvement with investments and impact on the portfolio, the size of the executive officer's bonus, and other factors similar to those considered when determining the size of the bonus, as described under "—Year-End Bonus Compensation". However, the total dollar value available to be allocated to the named executive officers and other employees is limited by the total amount of investments made by our investment funds during the fiscal year, and executive officers and other employees may not be allocated any dollar value of carry in any given year. After a total dollar value, if any, for each named executive officer is determined, such dollar value is then divided by the total value of investments made by our funds for the year, which yields a certain percentage for the named executive officer. This percentage is then applied consistently to each investment made during the year. Because the size of each investment is different, the nominal amount of the carry pool allocation differs by investment, although the percentage applied to each investment is consistent.
A portion of the carried interest that is available for allocation to our employees is not immediately allocated when it becomes available and is instead reserved. This reserved carried interest is later allocated to a discrete number of employees
245
when it is determined that they deserve additional carried interest allocations based on their performance. The carry pool is maintained and administered by KKR Associates Holdings L.P., which, similar to KKR Holdings, is not a subsidiary of ours. Allocations are determined by our Co-Chief Executive Officers acting through the general partner of KKR Associates Holdings L.P.
Carried interest, if any, from the carry pool in respect of any particular investment is only paid in cash after all of the following are met: (i) a realization event has occurred (e.g., sale of a portfolio company, dividend, etc.); (ii) the vehicle has achieved positive overall investment returns since its inception, in excess of performance hurdles where applicable; and (iii) with respect to investments with a fair value below cost, cost has been returned to fund investors in an amount sufficient to reduce remaining cost to the investments' fair value. To the extent any "clawback" obligation is triggered, carried interest previously distributed by the fund would have to be returned to such fund, thereby reducing the named executive officer's overall compensation for any such year. A portion of certain carried interest payable is generally not distributed to the recipient and is instead held in escrow in order to enhance the recipient's ability to satisfy any future clawback obligation. Because the amount of carried interest payable is directly tied to the realized performance of the underlying investments, we believe this fosters a strong alignment of interests among the investors in those funds and the named executive officers, and thus benefits our unitholders. In addition, several of our competitors use participation in carried interest as an important compensation element, and we believe that we must do the same in order to attract and retain the most qualified personnel.
Participation in our carry pool for our employees, including our named executive officers, is subject only to service-based vesting with certain exceptions, including acceleration upon death or disability. In general, the vesting for carry pool allocations for investments made during or after 2013 is annual over a four-year period (other than for our Co-Chief Executive Officers). The vesting schedules for investments made prior to 2013 range from four-year vesting (with no vesting upon grant) for the most junior employees up to two-year vesting (and 50% vesting upon grant) for most senior employees. Vesting serves as an employment retention mechanism and enhances the alignment of interests between a participant in our carry pool and the firm as well as the limited partners in our investment funds. Due to their status as co-founders of our firm, our Co-Chief Executive Officers are typically completely vested in their carried interest allocations upon grant.
Other Compensation
Our Co-Chief Executive Officers are reimbursed by us for the use of a car and driver, and we pay for the compensation of certain personnel who administer personal matters for them. We believe that these benefits are appropriate in light of the time that they spend on our business, the limited compensation paid by us for their services, and their unique status as co-founders of our firm. In addition, we may pay for certain tax preparation fees for our named executive officers.
Minimum Retained Ownership
While employed by us, unless waived in whole or in part, each of our named executive officers is required to hold at least 25% of the cumulative amount of KKR Holdings units that have satisfied vesting conditions during the duration of his employment with the firm. In addition, unless waived in whole or in part, each of our named executive officers may be required, on a grant by grant basis, to hold common unit equivalents of 15% of the cumulative restricted equity units granted under the Equity Incentive Plan that have satisfied the service-based vesting condition during the duration of his employment with the firm.
Compensation and Risk
Our compensation program includes elements that we believe discourage excessive risk-taking and align the compensation of our employees with the long- term performance of the firm. For example, other than certain equity that either immediately vested as part of the grants to all employees or our founders or that were made in exchange for the contribution of assets, in each case in connection with the consummation of the KPE Transaction in October 2009, a significant majority of the equity awards granted to our employees are subject to a multi-year vesting conditions, one- and two-year post-vesting transfer restriction periods, and/or a minimum retained ownership requirement. Because our equity awards have multi-year vesting provisions, the actual amount of compensation realized by the recipient will be tied to the long- term performance of our common units. In addition, market-condition KKR Holdings units granted to our senior employees in 2016, include price vesting conditions based on the price of our common stock in addition to service-based vesting requirements. We believe these vesting conditions more closely align the interests of these senior employees with those of our unitholders. Pursuant to our internal policies, our employees are not permitted to buy or sell derivative securities, including for hedging purposes, or to engage in short-selling to hedge their economic risk of ownership. In addition, we only make cash payments of carried interest to our employees when profitable investments have been realized and after sufficient cash has been distributed to the investors in our funds. Moreover, the general partner of a fund is required to return carried interest distributions to the fund due to, for
246
example, underperformance by the relevant fund subsequent to the payment of such carried interest. Accordingly, the employees would be subject to a "clawback," i.e., be required to return carried interest payments previously made to a principal, all of which further discourages excessive risk-taking by our personnel.
Summary Compensation Table
The following table presents summary information concerning compensation that was paid for services rendered by our named executive officers during the fiscal years ended December 31,
2013
,
2014
and
2015
.
In
2013
,
2014
and
2015
, our named executive officers received distributions based on their vested KKR Holdings units or common units. Because these distributions are not considered to be compensation, these distributions are not reflected as compensation in the table below. There are certain contractual arrangements we entered into with KKR Holdings at the time of the KPE Transaction in October 2009 and thereafter, including a tax receivable agreement, that relate to payments to our named executive officers that are not compensatory and are described in "Certain Relationships and Related Transactions, and Director Independence." Because restricted equity units and market-condition KKR Holdings units granted to our named executive officers as part of
2015
year-end bonus compensation and incentive awards were made after December 31, 2015, they do not appear in the tables below, and will appear in the tables for the year ended December 31, 2016.
Carried interest distributions to our named executive officers in respect of the carry pool for the years ended December 31,
2013
,
2014
and
2015
are reflected in the All Other Compensation column in the
2015
Summary Compensation Table below.
247
2015
Summary Compensation Table
|
Name and Principal Position
|
Year
|
Salary
($)
|
Bonus
($) (1)
|
Stock Awards ($) (2)
|
All Other Compensation ($) (3)
|
Total
($)
|
||||||||||||
|
Henry R. Kravis
|
2015
|
300,000
|
|
—
|
|
—
|
|
51,994,055
|
|
(4)
|
52,294,055
|
|
||||||
|
Co-Chief Executive Officer
|
2014
|
300,000
|
|
—
|
|
—
|
|
64,151,272
|
|
64,451,272
|
|
|||||||
|
2013
|
300,000
|
|
—
|
|
—
|
|
43,905,435
|
|
44,205,435
|
|
||||||||
|
George R. Roberts
|
2015
|
300,000
|
|
—
|
|
—
|
|
52,064,278
|
|
(5)
|
52,364,278
|
|
||||||
|
Co-Chief Executive Officer
|
2014
|
300,000
|
|
—
|
|
—
|
|
64,075,416
|
|
64,375,416
|
|
|||||||
|
2013
|
300,000
|
|
—
|
|
—
|
|
43,808,078
|
|
44,108,078
|
|
||||||||
|
Todd A. Fisher
|
2015
|
300,000
|
|
3,485,000
|
|
3,600,328
|
|
10,622,133
|
|
(6)
|
18,007,461
|
|
||||||
|
Chief Administrative Officer
|
2014
|
300,000
|
|
2,260,000
|
|
1,589,225
|
|
12,381,439
|
|
16,530,664
|
|
|||||||
|
2013
|
300,000
|
|
3,985,000
|
|
1,601,971
|
|
9,677,086
|
|
15,564,057
|
|
||||||||
|
William J. Janetschek
|
2015
|
300,000
|
|
2,325,000
|
|
3,676,867
|
|
2,705,105
|
|
(7)
|
9,006,972
|
|
||||||
|
Chief Financial Officer
|
2014
|
300,000
|
|
2,455,000
|
|
674,433
|
|
3,080,524
|
|
6,509,957
|
|
|||||||
|
2013
|
300,000
|
|
2,260,000
|
|
543,859
|
|
2,075,121
|
|
5,178,980
|
|
||||||||
|
David J. Sorkin
|
2015
|
300,000
|
|
2,390,000
|
|
3,676,867
|
|
1,396,629
|
|
(7)
|
7,763,496
|
|
||||||
|
General Counsel
|
2014
|
300,000
|
|
2,455,000
|
|
649,323
|
|
1,730,754
|
|
5,135,077
|
|
|||||||
|
2013
|
300,000
|
|
2,195,000
|
|
543,859
|
|
452,134
|
|
3,490,993
|
|
||||||||
|
(1)
|
Represents distributions received by KKR Holdings with respect to unvested KKR Holdings units that have been distributed to the named executive officer as bonus. The discretionary bonus payments in 2013, 2014 and 2015 were made by KKR Holdings and accordingly were not economically borne by us.
|
|||||||||||||||||
|
(2)
|
Stock awards reflected in the table above for each year presented represents equity award grants made in such reporting period relating to the equity portion of the prior year bonus compensation and reflect the grant date fair value of restricted equity units. Fair value of the restricted equity units granted to our named executive officers is calculated in accordance with Accounting Standards Codification Topic 718, Compensation—Stock Compensation ("ASC 718"). See Note 11 of the financial statements included elsewhere in this report for additional information about the valuation assumptions with respect to all grants reflected in this column. These amounts reflect the aggregate grant date fair values calculated under ASC Topic 718 and may not correspond to the actual value that will be recognized by our named executive officers.
|
|||||||||||||||||
|
(3)
|
Carried interest is presented on the basis of cash received by our named executive officers in the respective fiscal year. We believe that presenting actual cash received by our named executive officers is a more representative disclosure of their compensation than presenting accrued carried interest, because carried interest is paid only if and when there are profitable realization events relating to the underlying investments. Carried interest also includes amounts retained and allocated for distribution to the respective named executive officer, but not yet distributed to the named executive officer, which could be used to fund potential future clawback obligations if any were to arise.
|
|||||||||||||||||
|
(4)
|
Consists of $
51,527,045
in cash payments of carried interest from the carry pool during 2015;
$40,000
in fees for Mr. Kravis's service as a KKR-designated director on the board of directors of First Data Corporation, a KKR portfolio company, during 2015;
$5,000 in f
ees for Mr. Kravis's service as a KKR-designated director on the board of directors of China International Capital Corporation Limited, a KKR portfolio company, during 2015;
$165,454 rela
ted to Mr. Kravis's use of a car and driver during 20
15; $236,556 related
to certain personnel who administer personal matters for Mr. Kravis during 2015;
and $20,000 rela
ted to tax preparation fees. SEC rules require that transportation and personnel expenses not directly and integrally related to our business be disclosed as compensation to Mr. Kravis. Because we do not separately track personnel expenses based on whether they are incurred for business or for personal reasons, 100% of the preceding costs have been reported for Mr. Kravis.
|
|||||||||||||||||
|
(5)
|
Consists of $51,527,045
in cash payments of ca
rried interest from the car
ry pool during 2015;
$197,630 re
lated to Mr. Roberts's use of a car and driver during 201
5; $319,603
related to certain personnel who administer personal matters for Mr. Roberts during 2015; and
$20,000 rela
ted to tax preparation fees. SEC rules require that transportation and personnel expenses not directly and integrally related to our business be disclosed as compensation to Mr. Roberts. Because we do not separately track personnel expenses based on whether they are incurred for business or personal reasons, 100% of the preceding costs have been reported for Mr. Roberts.
|
|||||||||||||||||
|
(6)
|
Consists of
$10,564,231 in cash payments of carried interest from the carry pool during 2015; $37,902 in fees for Mr. Fisher's service as a KKR-designated director on the board of directors of Maxeda, a KKR portfolio company, during 2015; and $20,000 relate
d to tax preparation fees.
|
|||||||||||||||||
|
(7)
|
Consists of cash payments of carried interest from the carry pool during 2015 and $20,000 related to tax preparation fees.
|
|||||||||||||||||
248
Grants of Plan-Based Awards in
2015
The following table provides supplemental information relating to grants of equity awards in the year ended
December 31, 2015
provided in our Summary Compensation Table.
|
Name
|
Grant Date
|
All Other Stock Awards: Number of Shares of Stock or Units (#) (1)
|
Grant Date Fair Value of Stock and Option Awards ($) (2)
|
|||||||||
|
Henry R. Kravis
|
—
|
|
—
|
|
—
|
|
||||||
|
George R. Roberts
|
—
|
|
—
|
|
—
|
|
||||||
|
Todd A. Fisher
|
02/23/15
|
|
216,193
|
|
$
|
3,600,328
|
|
|||||
|
William J. Janetschek
|
02/23/15
|
|
220,789
|
|
$
|
3,676,867
|
|
|||||
|
David J. Sorkin
|
02/23/15
|
|
220,789
|
|
$
|
3,676,867
|
|
|||||
|
(1)
|
Stock awards reflected in the table above represent grants made in the year ended December 31, 2015 relating to the equity portion of the prior year bonus compensation. The amounts reflected in this column represent restricted equity units. Each grant of restricted equity units is subject to a service-based vesting condition over a period of three years (with the first vesting event occurring on April 1, 2016). The vesting terms of these grants are described under the caption "Narrative Disclosure to Summary Compensation Table and Grants of Plan-Based Awards—Terms of Restricted Equity Units" below.
|
|||||||||||
|
(2)
|
Amount represents the grant date fair value of the restricted equity units granted to our named executive officers as calculated in accordance with ASC Topic 718. See Note 11 of the financial statements included elsewhere in this report for additional information about the valuation assumptions with respect to all grants reflected in this column. These amounts reflect the aggregate grant date fair values calculated under ASC Topic 718 and may not correspond to the actual value that will be recognized by our named executive officers.
|
|||||||||||
Narrative Disclosure to Summary Compensation Table and Grants of Plan‑ Based Awards
Terms of KKR Holdings Units
The following description applies to KKR Holdings units granted prior to 2016.
Certain units that our named executive officers and other principals hold in KKR Holdings as of December 31, 2015 are subject to transfer restrictions and, except for interests held by our Co‑Chief Executive Officers and certain interests that were vested when granted in connection with the KPE Transaction in October 2009, were subject to multi‑year service‑based vesting requirements upon their initial grant. Due to their unique status as co‑founders of our firm, our Co‑Chief Executive Officers are completely vested in their ownership of KKR Holdings units.
In general, unvested KKR Holdings units initially vested in equal installments over a multi‑year period (which ranged from three to five years) from the grant date, subject to the recipient’s continued employment with us. Following this initial vesting (or the grant date if interests were vested upon grant), interests remained contingently vested while they were subject to certain transfer restrictions. Unvested KKR Holdings units were not entitled to receive distributions. As of February 22, 2016, 324,772,683 outstanding KKR Holdings units have vested, constituting
90%
of the KKR Holdings units outstanding. All of the KKR Holdings units granted to our named executive officers in 2009 and 2011 have vested as of the date of this filing; however 1.0 million units held by our named executive officers remain subject to transfer restrictions that will lapse in 2016.
KKR Holdings units that are subject to transfer restrictions, unless waived, may not be sold, exchanged or otherwise transferred for a specified period of time following the initial vesting date. The transfer restriction period typically lasts for (1) one year with respect to one‑half of the units vesting on the vesting date and (2) two years with respect to the other one‑half of the units vesting on such vesting date. Transfer restricted units become fully vested and transferable and may be exchanged into common units at the end of the transfer restriction period if the holder is not terminated for cause and has complied with the terms of his or her confidentiality and restrictive covenant agreement during the transfer restrictions period. See “Terms of Confidentiality and Restrictive Covenant Agreements” below.
Because KKR Holdings is a partnership, all of the KKR Holdings units have been legally allocated, but the allocation of certain of these units had not been communicated to each respective principal as of December 31, 2015. The units whose allocation has not been communicated are subject to performance‑ based vesting conditions, which include, (i) whether the principal is in good standing and has adhered to our policies and rules, (ii) performance of assigned tasks and duties in an effective, efficient and diligent manner, (iii) contribution and commitment to the growth, development and profitability of KKR
249
and our business, (iv) contribution and commitment to our management and general administration; (v) contribution and commitment to the culture, business principles, reputation and morale of KKR as a whole and the team or teams to which the principal has been assigned, and (vi) contribution and commitment to our recruiting, business development, public image and marketing efforts and the professional development of our personnel. These criteria are not sufficiently specific to constitute performance conditions for accounting purposes, and the achievement, or lack thereof, will be determined based upon the exercise of judgment by the general partner of KKR Holdings. Each principal will ultimately receive between zero and 100% of the units initially allocated. The allocation of these units has not yet been communicated to the award recipients as this was management’s decision on how to best incentivize its principals. It is anticipated that additional service‑based vesting conditions will be imposed at the time the allocation is initially communicated to the respective principals. We applied the guidance of ASC Topic 718 and concluded that these KKR Holdings units do not yet meet the criteria for recognition of compensation cost because neither the grant date nor the service inception date has occurred. In reaching a conclusion that the service inception date has not occurred, we considered (1) the fact that the vesting conditions are not sufficiently specific to constitute performance conditions for accounting purposes, (2) the significant judgment that can be exercised by the general partner of KKR Holdings in determining whether the vesting conditions are ultimately achieved, and (3) the absence of communication to the principals of any information related to the number of units they were initially allocated. The allocation of these units will be communicated to the award recipients when the performance‑based vesting conditions have been met, and currently there is no plan as to when the communication will occur. The determination as to whether the award recipients have satisfied the performance‑based vesting conditions is made by the general partner of KKR Holdings, and is based on multiple factors primarily related to the award recipients’ individual performance.
While employed by our firm, our principals, including our named executive officers, are also subject to minimum retained ownership rules that require them to continuously hold at least 25% of their cumulatively vested KKR Holdings units, unless waived.
The transfer and vesting restrictions and minimum retained ownership rules applicable to KKR Holdings units may not be enforceable in all cases and can be waived, modified or amended by KKR Holdings at any time without our consent.
The terms of the KKR Holdings units described above are distinct from equity awards issuable under our Equity Incentive Plan, which are described below.
Terms of Restricted Equity Units
Restricted equity units are equity awards issuable under our Equity Incentive Plan, which after vesting, may be settled for our common units on a one‑ for‑one basis (or an amount of cash equal to the fair market value of such common units).
In general, restricted equity units are subject to a service‑based vesting condition and vest in equal annual installments over a multi‑year period (generally three to five years) from a specified date, subject to the recipient’s continued employment with us. Following this service‑based vesting, certain restricted equity unit grant agreements may also subject the common units delivered upon settlement of such restricted equity units to transfer restrictions and/or minimum retained ownership requirements. Unvested restricted equity units granted under our Equity Incentive Plan are not entitled to receive distributions.
Common units delivered upon settlement of restricted equity units that are subject to transfer restrictions, unless waived, typically may not be sold, exchanged or otherwise transferred for a specified period of time following the vesting date. The transfer restriction period typically lasts for (1) one year with respect to one‑half of the units vesting on the service‑based vesting date and (2) two years with respect to the other one‑half of the units vesting on such service‑based vesting date. Transfer restricted common units become saleable at the end of the transfer restriction period if the holder has not been terminated for cause and has not breached in any significant or intentional manner, as determined by the Administrator, the terms of his or her confidentiality and restrictive covenants contained in the grant agreement during the transfer restriction period. See “Terms of Confidentiality and Restrictive Covenant Agreements” below.
While employed by our firm, our employees, including our named executive officers, may also be subject to a minimum retained ownership requirement under the restricted equity unit grant agreement, which would obligate them to continuously hold common unit equivalents of 15% of their cumulatively vested restricted equity units, unless waived. From time to time, the transfer restrictions and minimum retained ownership requirements applicable to restricted equity units of certain employees, including our named executive officers, may be transferred to such employees’ KKR Holdings units, if any, so that the total units of equity subject to transfer restrictions and minimum retained ownership requirements are expected to be the same, unless waived.
250
For additional information about equity awards granted under our Equity Incentive Plan, please also see “KKR & Co. L.P. Equity Incentive Plan” below.
Terms of Confidentiality and Restrictive Covenant Agreements
The confidentiality and restrictive covenant agreements with each of our named executive officers include prohibitions on them competing with us or soliciting certain fund investors or senior‑level employees of our firm and specified subsidiaries and affiliates during a restricted period following their departure from the firm. These agreements also require personnel to protect and use the firm’s confidential information only in accordance with confidentiality restrictions set forth in the agreement.
The restricted periods for our Co‑Chief Executive Officers expire on (1) for voluntary terminations or terminations with cause, two years from termination and (2) for terminations without cause, one year from termination. The restricted periods for our other named executive officers expire on (1) for voluntary terminations or terminations with cause, 18 months from termination, and (2) for terminations without cause, nine months from termination. These restricted periods are subject to reduction for any “garden leave” or “notice period” that an employee serves prior to termination of employment.
Our named executive officers other than our Co‑Chief Executive Officers have entered into these confidentiality and restrictive covenant agreements with us through their restricted equity unit grant agreements and separately also with KKR Holdings, which is entitled to waive, modify or amend them at any time without our consent. However, because our Co‑Chief Executive Officers have not received any restricted equity units, their confidentiality and restrictive covenant agreements are solely with KKR Holdings. Because KKR Holdings is the party to these agreements and not us, we may not be able to enforce them, and these agreements might be waived, modified or amended at any time without our consent.
Outstanding Equity Awards at
2015
Fiscal Year‑End
The following table sets forth information concerning unvested restricted equity units for each of the named executive officers as of
December 31, 2015
.
|
Stock Awards
|
|||||||||||||||
|
Name
|
Number of Shares
or Units of Stock
that Have Not
Vested (#)
|
Market Value of Shares
or Units of Stock
that Have Not
Vested ($)(1)
|
|||||||||||||
|
Henry R. Kravis
|
—
|
|
—
|
|
|||||||||||
|
George R. Roberts
|
—
|
|
—
|
|
|||||||||||
|
Todd A. Fisher
|
325,997(2)
|
|
$
|
5,082,293
|
|
||||||||||
|
William J. Janetschek
|
263,232(3)
|
|
$
|
4,103,787
|
|
||||||||||
|
David J. Sorkin
|
262,271(4)
|
|
$
|
4,088,805
|
|
||||||||||
|
(1)
|
These amounts are based on the closing market price of our common units on the last trading day of the year ended
December 31, 2015
, of $15.59 per common unit.
|
|
(2)
|
Includes (i) 48,960 restricted equity units granted on February 21, 2013, which will vest on April 1, 2016; (ii) 60,844 restricted equity units granted on February 5, 2014, which will vest in equal installments on April 1, 2016 and April 1, 2017; and (iii) 216,193 restricted equity units granted on February 23, 2015, which will vest in equal installments on April 1, 2016, April 1, 2017 and April 1, 2018.
|
|
(3)
|
Includes (i) 16,622 restricted equity units granted on February 21, 2013, which will vest on April 1, 2016; (ii) 25,821 restricted equity units granted on February 5, 2014, which will vest in equal installments on April 1, 2016 and April 1, 2017; and (iii) 220,789 restricted equity units granted on February 23, 2015, which will vest in equal installments on April 1, 2016, April 1, 2017 and April 1, 2018.
|
|
(4)
|
Includes (i) 16,622 restricted equity units granted on February 21, 2013, which will vest on April 1, 2016, (ii) 24,860 restricted equity units granted on February 5, 2014, which will vest in equal installments on April 1, 2016 and April 1, 2017; and (iii) 220,789 restricted equity units granted on February 23, 2015, which will vest in equal installments on April 1, 2016, April 1, 2017 and April 1, 2018.
|
251
Option Exercises and Stock Vested in
2015
The following table sets forth information concerning the vesting of KKR Holdings units and restricted equity units held by each of our named executive officers during the year ended
December 31, 2015
.
|
Stock Awards
|
||||||||||||||
|
Name
|
Number of
Shares Acquired on
Vesting (#)(1)
|
Value Realized on
Vesting ($)(2)
|
||||||||||||
|
Henry R. Kravis
|
—
|
|
—
|
|
||||||||||
|
George R. Roberts
|
—
|
|
—
|
|
||||||||||
|
Todd A. Fisher
|
163,197
|
|
$
|
3,766,587
|
|
|||||||||
|
William J. Janetschek
|
54,301
|
|
$
|
1,253,267
|
|
|||||||||
|
David J. Sorkin
|
55,277
|
|
$
|
1,275,793
|
|
|||||||||
|
(1)
|
The amounts reflected in this column represent KKR Holdings units and common units delivered. Upon vesting, KKR Holdings units and a portion of restricted equity units delivered upon vesting are subject to one‑ and two‑year transfer restrictions.
|
|
(2)
|
These amounts are based on the closing market price of our common units on each respective vesting date.
|
Pension Benefits for
2015
We provided no pension benefits during the year ended
December 31, 2015
.
Nonqualified Deferred Compensation for
2015
We provided no defined contribution plan for the deferral of compensation on a basis that is not tax‑qualified during the year ended
December 31, 2015
.
Potential Payments Upon Termination or Change in Control
Upon termination of employment, vesting generally ceases for restricted equity units that have not vested. In addition, transfer restricted vested KKR Holdings units, which consist of KKR Holdings units that were subject solely to service-based vesting conditions, and, if applicable, transfer restricted equity units (which term includes the transfer restricted common units that may be delivered upon settlement of such restricted equity units) remain subject to transfer restrictions for one‑ and two‑year periods, except as described below. See "Security Ownership of Certain Beneficial Owners and Management and Related Stockholder Matters" for additional information regarding KKR Holdings units and transfer restricted equity units of our named executive officers.
An employee who retires after the first date on which his or her age plus years of service to KKR equals 80 will continue to vest in his or her unvested restricted equity units for an additional two years following retirement, subject to compliance, if applicable, with the requirement that the holder not violate the terms and conditions of his or her confidentiality and restrictive covenants during the period in which such restricted equity unit, if applicable, remains transfer restricted over one‑ and two‑year periods. None of our named executive officers retired in the year ended December 31, 2015.
Upon death or permanent disability, a holder of restricted equity units becomes immediately vested in all unvested restricted equity units, and the transfer restrictions, if any, immediately lapse. The values of unvested restricted equity units held by the named executive officers as of
December 31, 2015
are set forth above in the Outstanding Equity Awards at 2015 Fiscal Year‑End Table.
In addition, upon a change in control of KKR, a holder of restricted equity units becomes immediately vested in all unvested restricted equity units, and the transfer restrictions, if any, immediately lapse. As noted above, the values of unvested restricted equity units held by the named executive officers as of
December 31, 2015
are set forth above in the Outstanding Equity Awards at 2015 Fiscal Year‑End Table.
In addition, the KKR Holdings units subject to price and service-based vesting conditions, which were granted to certain of the named executive officers in 2016, provide for additional vesting eligibility in connection with an involuntary termination
252
without cause. Upon involuntary termination of employment without cause, KKR Holdings units that are subject to price and service-based vesting conditions would continue to be eligible to vest according to the vesting dates specified under the applicable service-based vesting condition, provided that the price vesting condition has been met prior to the termination . Any KKR Holdings units for which the price vesting condition has not been met at the time of termination are forfeited. Upon death or permanent disability, such KKR Holdings units would continue to vest pursuant to the applicable price and time-based vesting conditions. Upon termination of employment for retirement or in the event of a change in control, there are no additional vesting eligibility for such KKR Holdings units.
Upon termination of employment, vesting generally ceases for carried interest allocations, except that for allocations made for investments in 2012 and in prior years only, the vesting of carried interest allocations of our named executive officers and other principals may continue for a certain pre‑ determined period of time if they are terminated without cause or if they leave without cause, subject to compliance, if applicable, with the requirement that the person not violate the terms and conditions of his or her confidentiality and restrictive covenant agreement. In addition, carried interest allocations become immediately vested upon death or permanent disability.
Director Compensation
We limit compensation for service on our Managing Partner’s board of directors to the independent directors. Each independent director receives (1) an annual cash retainer of $75,000, (2) an additional annual cash retainer of $15,000 if such independent director is a member of the nominating and corporate governance committee, (3) an additional annual cash retainer of $25,000 if such independent director is a member of the audit committee and (4) an additional annual cash retainer of $15,000 if such independent director serves as the chairman of the audit committee. Cash retainers are pro rated if, during the calendar year, a director joins the board of directors of our Managing Partner or a director joins or resigns from a committee. In addition, on July 24, 2015, 6,219 restricted equity units were approved for grant to each independent director pursuant to our Equity Incentive Plan.
|
Name
|
Fees
Earned or
Paid in Cash
($)
|
Stock
Awards
($)(1)
|
Total
($)
|
||||||||||||
|
David C. Drummond
|
75,000
|
|
150,000
|
|
225,000
|
|
|||||||||
|
Joseph A. Grundfest
|
115,000
|
|
150,000
|
|
265,000
|
|
|||||||||
|
John B. Hess
|
75,000
|
|
150,000
|
|
225,000
|
|
|||||||||
|
Dieter Rampl (2)
|
75,000
|
|
150,000
|
|
225,000
|
|
|||||||||
|
Patricia F. Russo
|
75,000
|
|
150,000
|
|
225,000
|
|
|||||||||
|
Thomas M. Schoewe
|
100,000
|
|
150,000
|
|
250,000
|
|
|||||||||
|
Robert W. Scully
|
115,000
|
|
150,000
|
|
265,000
|
|
|||||||||
|
(1)
|
Represents the aggregate grant date fair value of restricted equity units granted to each of the independent directors during the year ended
December 31, 2015
as calculated in accordance with ASC Topic 718. See Note 11 of the financial statements included elsewhere in this report for additional information about the valuation assumptions with respect to all grants reflected in this column. These amounts reflect the aggregate grant date fair values calculated under ASC Topic 718 and may not correspond to the actual value that will be recognized by the independent directors.
|
|
(2)
|
Dieter Rampl, a former independent director, resigned from our Managing Partner's board of directors on November 5, 2015, and upon his resignation 6,219 unvested restricted equity units were forfeited.
|
253
The following table details grants of restricted equity units to each of our independent directors of our Managing Partner in the year ended
December 31, 2015
. The table includes the grant date and grant date fair value of 2015 restricted equity units and the aggregate number of unvested restricted equity units as of
December 31, 2015
owned by each independent director who served as a director during the year ended
December 31, 2015
:
|
Name
|
Grant
Date(1)
|
Stock
Awards
(#)
|
Grant Date
Fair Value
($)(2)
|
Total Number of
Unvested Restricted
Equity Awards on
December 31, 2015
(#)
|
||||||
|
David C. Drummond
|
7/24/2015
|
6,219
|
|
150,000
|
6,219
|
|
||||
|
Joseph A. Grundfest
|
7/24/2015
|
6,219
|
|
150,000
|
6,219
|
|
||||
|
John B. Hess
|
7/24/2015
|
6,219
|
|
150,000
|
6,219
|
|
||||
|
Dieter Rampl (3)
|
7/24/2015
|
6,219
|
|
150,000
|
6,219
|
|
||||
|
Patricia F. Russo
|
7/24/2015
|
6,219
|
|
150,000
|
6,219
|
|
||||
|
Thomas M. Schoewe
|
7/24/2015
|
6,219
|
|
150,000
|
6,219
|
|
||||
|
Robert W. Scully
|
7/24/2015
|
6,219
|
|
150,000
|
6,219
|
|
||||
|
(1)
|
The restricted equity awards approved for grant on July 24, 2015 vest on October 1, 2016.
|
|
(2)
|
This column represents the grant date fair value of restricted equity units granted to each of the independent directors during the year ended December 31, 2015 as calculated in accordance with ASC Topic 718. These amounts reflect the aggregate grant date fair values calculated under ASC Topic 718 and may not correspond to the actual value that will be recognized by the independent directors.
|
|
(3)
|
Dieter Rampl, a former independent director, resigned from our Managing Partner's board of directors on November 5, 2015, and upon his resignation 6,219 unvested restricted equity units were forfeited.
|
KKR & Co. L.P. Equity Incentive Plan
Our Managing Partner has adopted the KKR & Co. L.P. 2010 Equity Incentive Plan, which is referred to as the Equity Incentive Plan.
Administration
The board of directors of our Managing Partner administers the Equity Incentive Plan. However, the board of directors of our Managing Partner may delegate such authority, including to a committee or subcommittee of the board of directors. Under the terms of the Equity Incentive Plan, the board of directors of our Managing Partner, or the committee or subcommittee thereof to whom authority to administer the Equity Incentive Plan has been delegated, as the case may be, is referred to as the Administrator. The Administrator determines who will receive awards under the Equity Incentive Plan, as well as the form of the awards, the number of units underlying the awards and the terms and conditions of the awards, consistent with the terms of the Equity Incentive Plan. The Administrator has full authority to interpret and administer the Equity Incentive Plan and its determinations will be final and binding on all parties concerned. The Administrator may delegate the authority to grant awards and the day‑to‑day administration of the plan to any of our employees. Grants of equity awards to our named executive officers under our Equity Incentive Plan are made only by our Managing Partner’s board of directors.
Common Units Subject to the Equity Incentive Plan
The total number of our common units that may be issued under the Equity Incentive Plan as of the effective date of the plan was equivalent to 15% of the number of fully diluted and exchanged common units outstanding as of such date; provided that beginning with the first fiscal year after the Equity Incentive Plan became effective and continuing with each subsequent fiscal year occurring thereafter, the aggregate number of common units covered by the plan will be increased, on the first day of each fiscal year of KKR & Co. L.P. occurring during the term of the plan, by a number of common units equal to the positive difference, if any, of (x) 15% of the aggregate number of common units outstanding (on a fully‑diluted and exchanged basis) on the last day of the immediately preceding fiscal year minus (y) the aggregate number of common units available for issuance under the plan as of the last day of such year, unless the Administrator should decide to increase the number of common units covered by the plan by a lesser amount on any such date.
254
Options and Unit Appreciation Rights
The Administrator may award non‑qualified unit options and unit appreciation rights under the Equity Incentive Plan. Options and unit appreciation rights granted under the Equity Incentive Plan will become vested and exercisable at such times and upon such terms and conditions as may be determined by the Administrator at the time of grant, but no option or unit appreciation right will be exercisable for a period of more than 10 years after it is granted. The exercise price per common unit will be determined by the Administrator, provided that options and unit appreciation rights granted to participants who are U.S. taxpayers (i) will not be granted with an exercise price less than 100% of the fair market value per underlying common unit on the date of grant and (ii) will not be granted unless the common unit on which it is granted constitutes equity of the participant’s “service recipient” within the meaning of Section 409A of the Internal Revenue Code of 1986, as amended. To the extent permitted by the Administrator, the exercise price of an option may be paid in cash or its equivalent, in common units having a fair market value equal to the aggregate exercise price and satisfying such other requirements as may be imposed by the Administrator, partly in cash and partly in common units or through net settlement in common units. As determined by the Administrator, unit appreciation rights may be settled in common units, cash or any combination thereof.
Other Equity‑Based Awards
The Administrator, in its sole discretion, may grant or sell common units, restricted common units, deferred restricted common units, phantom restricted common units, and any other awards that are valued in whole or in part by reference to, or are otherwise based on the fair market value of, the common units, including restricted equity units that may be granted from time to time, to our employees, including our named executive officers. Equity awards with price and service-based vesting conditions similar to those that apply to the KKR Holdings units described under "--KKR Holdings Market Condition Awards", which may or may not be subject to a minimum retained ownership requirement and transfer restrictions may also be granted. Any of these other equity‑based awards may be in such form, and dependent on such conditions, as the Administrator determines, including without limitation the right to receive, or vest with respect to, one or more common units (or the equivalent cash value of such units) upon the completion of a specified period of service, the occurrence of an event and/or the attainment of performance objectives. The Administrator may, in its discretion, determine whether other equity‑based awards will be payable in cash, common units or other assets or a combination of cash, common units and other assets.
Compensation Committee Interlocks and Insider Participation
Because we are a limited partnership, our Managing Partner’s board of directors is not required by NYSE rules to establish a compensation committee. Our founders, Messrs. Kravis and Roberts, serve as Co‑Chairmen of the board of directors of our Managing Partner and participated in discussions regarding executive compensation. For a description of certain transactions between us and our founders, see “Certain Relationships and Related Transactions, and Director Independence.”
Compensation Committee Report
The board of directors of our Managing Partner does not have a compensation committee. The entire board of directors has reviewed and discussed with management the foregoing Compensation Discussion and Analysis and, based on such review and discussion, has determined that the Compensation Discussion and Analysis should be included in this annual report.
|
Henry R. Kravis
George R. Roberts
David C. Drummond
Joseph A. Grundfest
John B. Hess
Patricia F. Russo
Thomas M. Schoewe
Robert W. Scully
|
|
255
Our Common Units
The following table sets forth the beneficial ownership of our common units and KKR Group Partnership Units that are exchangeable for our common units by:
|
•
|
each person known to us to beneficially own more than 5% of any class of the outstanding voting securities of our partnership based on our review of filings with the SEC;
|
|
•
|
each of the directors, persons chosen to become a director and named executive officers of our Managing Partner; and
|
|
•
|
the directors, persons chosen to become a director and executive officers of our Managing Partner as a group.
|
The numbers of common units and KKR Group Partnership Units outstanding and the percentage of beneficial ownership are based on 449,251,468 common units issued and outstanding and 361,346,588 KKR Group Partnership Units that are exchangeable for our common units as of February 22, 2016. Beneficial ownership is in each case determined in accordance with the rules of the SEC, and includes equity securities of which that person has the right to acquire beneficial ownership within 60 days of February 22, 2016. Under these rules, more than one person may be deemed a beneficial owner of the same securities and a person may be deemed a beneficial owner of securities as to which he has no economic interest.
|
Common Units
Beneficially Owned†
|
KKR Group
Partnership Units and
Special Voting Units
Beneficially Owned††
|
Percentage
of Combined
Beneficial
|
||||||||||||||
|
Name(1)
|
Number
|
Percent
|
Number
|
Percent
|
Ownership†††
|
|||||||||||
|
KKR Holdings(2)(4)
|
55,047
|
|
*
|
361,346,588
|
|
100.0%
|
44.6%
|
|||||||||
|
FMR LLC(3)
|
41,778,361
|
|
9.3%
|
—
|
|
—
|
9.3
|
|||||||||
|
Henry R. Kravis(2)(4)(5)
|
7,017,496
|
|
1.6
|
361,346,588
|
|
100.0
|
45.4
|
|||||||||
|
George R. Roberts(2)(4)(5)
|
5,931,368
|
|
1.3
|
361,346,588
|
|
100.0
|
45.3
|
|||||||||
|
David C. Drummond
|
8,660
|
|
*
|
—
|
|
—
|
*
|
|||||||||
|
Joseph A. Grundfest
|
43,276
|
|
*
|
—
|
|
—
|
*
|
|||||||||
|
John B. Hess
|
116,876
|
|
*
|
—
|
|
—
|
*
|
|||||||||
|
Patricia F. Russo
|
36,276
|
|
*
|
—
|
|
—
|
*
|
|||||||||
|
Thomas M. Schoewe
|
43,876
|
|
*
|
—
|
|
—
|
*
|
|||||||||
|
Robert W. Scully
|
211,676
|
|
*
|
—
|
|
—
|
*
|
|||||||||
|
Todd A. Fisher(6)
|
217,900
|
|
*
|
9,288,035
|
|
2.6
|
2.1
|
|||||||||
|
William J. Janetschek(6)
|
103,127
|
|
*
|
3,170,827
|
|
*
|
*
|
|||||||||
|
David J. Sorkin(6)
|
102,647
|
|
*
|
3,123,593
|
|
*
|
*
|
|||||||||
|
Directors and executive officers as a group
(11 persons)
|
9,110,967
|
|
2.0%
|
361,346,588
|
|
100.0%
|
45.7%
|
|||||||||
|
*
|
Less than 1.0%.
|
|
†
|
KKR Group Partnership Units held by KKR Holdings are exchangeable (together with the corresponding special voting units) for our common units on a one‑for‑one basis, subject to customary conversion rate adjustments for splits, unit distributions and reclassifications and compliance with lock‑ up, vesting and transfer restrictions as described under “Certain Relationships and Related Transactions, and Director Independence-Exchange Agreement.” Beneficial ownership of KKR Group Partnership Units reflected in this table has not also been reflected as beneficial ownership of our common units for which such KKR Group Partnership Units may be exchanged.
|
|
††
|
On any matters that may be submitted to a vote of our unitholders, the special voting units provide their holders with a number of votes that is equal to the aggregate number of KKR Group Partnership Units that such holders hold and entitle such holders to participate in the vote on the same basis as our unitholders.
|
256
|
†††
|
This column assumes the exchange of KKR Group Partnership Units beneficially owned into common units and a number of outstanding common units calculated in accordance with Rule 13d‑3(d)(1) of the Exchange Act.
|
|
(1)
|
The address of each director and executive officer is c/o KKR Management LLC, 9 West 57th Street, 42nd Floor, New York, New York 10019.
|
|
(2)
|
KKR Holdings owns, beneficially or of record, an aggregate of 55,047 common units and 361,346,588 exchangeable KKR Group Partnership Units. Our principals hold interests in KKR Holdings that will entitle them to participate in the value of the KKR Group Partnership Units held by KKR Holdings. KKR Holdings is a limited partnership that is controlled by KKR Holdings GP Limited, its sole general partner, which has investment control over all KKR Group Partnership Units and common units held by KKR Holdings and voting control over all special voting units held by KKR Holdings. Each of Messrs. Kravis and Roberts disclaims beneficial ownership of the securities that may be deemed to be beneficially owned by him, except to the extent of his own pecuniary interest therein. Messrs. Kravis and Roberts, by virtue of their rights under the organizational documents of KKR Holdings GP Limited (the general partner of KKR Holdings), may be deemed to share dispositive and/or voting power with respect to the KKR Group Partnership Units, special voting units and common units held by KKR Holdings. Mr. Kravis disclaims beneficial ownership of the securities that may be deemed to be beneficially owned by him, except with respect to 81,709,475 KKR Group Partnership Units in which he and certain related entities have a pecuniary interest. Mr. Roberts disclaims beneficial ownership of the securities that may be deemed to be beneficially owned by him, except with respect to 86,709,475 KKR Group Partnership Units in which he and certain related entities have a pecuniary interest. The address of KKR Holdings is c/o KKR Management LLC, 9 West 57th Street, 42nd Floor, New York, New York 10019.
|
|
(3)
|
Based on a Schedule 13G/A filed with the Securities and Exchange Commission on February 12, 2016, FMR LLC and Abigail P. Johnson may be deemed to beneficially own and have the sole power to dispose or to direct the disposition of 41,778,361 common units. The address of these beneficial owners is 245 Summer Street, Boston, Massachusetts 02210. Certain affiliates of Fidelity provide services to us in connection with the investment management, record keeping and administration of our Equity Incentive Plan and our retirement savings plans for which they received customary fees and expenses not in excess of $1.1 million, although certain of these fees are paid by participants in the respective plans. Affiliates of Fidelity have invested or committed to invest approximately $82.3 million as of December 31, 2015, in our investment vehicles. Fidelity and its affiliates have in the past and may in the future participate in offerings, syndications or similar transactions with our capital markets business, including in certain cases where equity of KKR portfolio companies are offered to Fidelity’s retail and institutional brokerage customers, on the same terms and conditions provided to other participants in such transactions. Affiliates of Fidelity may also sell common units owned by our employees, including our executive officers and directors, in ordinary brokerage transactions from time to time.
|
|
(4)
|
KKR MIF Fund Holdings L.P. owns, beneficially or of record, an aggregate of 1,028,156 common units. The sole general partner of KKR MIF Fund Holdings L.P. is KKR MIF Carry Holdings L.P. The sole general partner of KKR MIF Carry Holdings L.P. is KKR MIF Carry Limited. Each of KKR MIF Carry Holdings L.P. (as the sole general partner of KKR MIF Fund Holdings L.P.); KKR MIF Carry Limited (as the sole general partner of KKR MIF Carry Holdings L.P.); KKR Index Fund Investments L.P. (as the sole shareholder of KKR MIF Carry Limited); KKR IFI GP L.P. (as the sole general partner of KKR Index Fund Investments L.P.); KKR IFI Limited (as the sole general partner of KKR IFI GP L.P.); KKR Fund Holdings L.P. (as the sole shareholder of KKR IFI Limited); KKR Fund Holdings GP Limited (as a general partner of KKR Fund Holdings L.P.); KKR Group Holdings L.P. (as a general partner of KKR Fund Holdings L.P. and the sole shareholder of KKR Fund Holdings GP Limited); KKR Group Limited (as the sole general partner of KKR Group Holdings L.P.); KKR & Co. L.P. (as the sole shareholder of KKR Group Limited); and KKR Management LLC (as the sole general partner of KKR & Co. L.P.) may be deemed to be the beneficial owner of the securities. Messrs. Kravis and Roberts are the designated members of KKR Management LLC and may be deemed to share dispositive power with respect to the common units held by KKR MIF Fund Holdings L.P. Each of Messrs. Kravis and Roberts disclaims beneficial ownership of the securities.
|
|
(5)
|
KKR Reference Fund Investments L.P. owns, beneficially or of record, an aggregate of 3,639,010 common units. The sole general partner of KKR Reference Fund Investments L.P. is KKR IFI GP L.P. Each of KKR IFI GP L.P. (as the sole general partner of KKR Reference Fund Investments L.P.); KKR IFI Limited (as the sole general partner of KKR IFI GP L.P.); KKR Fund Holdings L.P. (as the sole shareholder of KKR IFI Limited); KKR Fund Holdings GP Limited (as a general partner of KKR Fund Holdings L.P.); KKR Group Holdings L.P. (as a general partner of KKR Fund Holdings L.P. and the sole shareholder of KKR Fund Holdings GP Limited); KKR Group Limited (as the sole general partner of KKR Group Holdings L.P.); KKR & Co. L.P. (as the sole shareholder of KKR Group Limited); and KKR Management LLC (as the sole general partner of KKR & Co. L.P.) may be deemed to be the beneficial owner of
|
257
the securities. Messrs. Kravis and Roberts are the designated members of KKR Management LLC and may be deemed to share dispositive power with respect to the common units held by KKR MIF Fund Holdings L.P. Each of Messrs. Kravis and Roberts disclaims beneficial ownership of the securities.
|
(6)
|
The common units above for Mr. Fisher include 151,445 common units that will vest within 60 days of February 22, 2016, and the common units above for Messrs. Janetschek and Sorkin consist solely of common units that will vest within 60 days of February 22, 2016. The reported KKR Group Partnership Units include 478,253, 282,878 and 270,351 units beneficially owned by Messrs. Fisher, Janetschek and Sorkin, respectively, that are subject to transfer restrictions.
|
Our Managing Partner
Our Managing Partner’s outstanding limited liability company interests consist of Class A shares, which are entitled to vote on the election and removal of directors and all other matters that have not been delegated to the board of directors or reserved for the vote of Class B members, and Class B shares, which are entitled to vote only with respect to any matter requiring the approval of holders of voting interests held directly or indirectly by us in the general partners of our non‑U.S. funds. Notwithstanding the number of Class A shares held by the Class A members, under our Managing Partner’s limited liability company agreement, Messrs. Kravis and Roberts, as the designated members of KKR Management LLC, are deemed to represent a majority of the Class A shares outstanding when acting together for purposes of voting on matters upon which holders of Class A shares are entitled to vote. Messrs. Kravis and Roberts may, in their discretion, designate one or more holders of Class A shares to hold such voting power and exercise all of the rights and duties of Messrs. Kravis and Roberts under our Managing Partner’s limited liability company agreement. While Messrs. Kravis and Roberts historically have acted with unanimity when managing our business, they have not entered into any agreement relating to the voting of their Class A shares. All of our Managing Partner’s other Class A shares are held by our other senior principals. Our Managing Partner’s Class B shares are divided equally among twelve principals, each of whom holds less than 10% of the voting power of the Class B shares. None of the shares in our Managing Partner provide these holders with economic interests in our business. See also “Risk Factors-Our limited partnership agreement contains provisions that reduce or eliminate duties (including fiduciary duties) of our limited partner and limit remedies available for unitholders for actions that might otherwise constitute a breach of duty. It will be difficult for unitholders to successfully challenge a resolution of a conflict of interest by our Managing Partner or by its conflicts committee.” In addition, see “Risk Factors-We are a Delaware limited partnership, and there are provisions in our limited partnership agreement regarding exculpation and indemnification of our officers and directors that differ from the Delaware General Corporation Law (DGCL) in a manner that may be less protective of the interests of our common unitholders.”
Securities Authorized for Issuance under Equity Compensation Plans
The table set forth below provides information concerning the awards that may be issued under our Equity Incentive Plan as of
December 31, 2015
.
|
Number of
Securities to be
Issued Upon
Exercise of
Outstanding Options,
Warrants and Rights(a)
|
Weighted‑Average
Exercise Price
of Outstanding
Options, Warrants
and Rights
|
Number of
Securities Remaining
Available for Future
Issuance Under Equity
Compensation Plans
(excluding securities
reflected in column(a))(b)
|
||||
|
Equity Compensation Plans Approved by Security Holders
|
23,212,300
|
|
—
|
|
71,960,560
|
|
|
Equity Compensation Plans Not Approved by Security Holders
|
—
|
|
—
|
|
—
|
|
|
Total
|
23,212,300
|
|
—
|
|
71,960,560
|
|
|
(a)
|
Reflects the aggregate number of restricted equity units granted under our Equity Incentive Plan and outstanding as of
December 31, 2015
.
|
|
(b)
|
The aggregate number of common units covered by the Equity Incentive Plan is increased on the first day of each fiscal year during its term by a number of units equal to the positive difference, if any, of (a) 15% of the aggregate
|
258
number of common units outstanding (on a fully‑diluted basis) on the last day of the immediately preceding fiscal year minus (b) the aggregate number of common units available for issuance under the Equity Incentive Plan as of such date (unless the Administrator of the Equity Incentive Plan should decide to increase the number of common units covered by the plan by a lesser amount). We have filed a registration statement and intend to file additional registration statements on Form S‑8 under the Securities Act to register common units covered by the Equity Incentive Plan (including pursuant to automatic annual increases). Any such Form S‑8 registration statement will automatically become effective upon filing. Accordingly, common units registered under such registration statement will be available for sale in the open market.
259
The following description is a summary of the material terms of the agreements described below, and does not contain all of the information that you may find useful. For additional information, you should read the copies of our investment agreement, our exchange agreement, our registration rights agreement, our tax receivable agreement and the partnership agreements of the KKR Group Partnerships, all of which have been filed as exhibits to this report.
The Investment Agreement
On August 4, 2009, we entered into an investment agreement by and among us, certain of our affiliates, KPE and certain of its affiliates, as a condition to the KPE Transaction.
U.S. Listing
The investment agreement provided that we and KPE each had the right to require that the other use its reasonable best efforts to cause KPE to contribute its units representing limited partner interests in KKR Group Holdings L.P. to us in exchange for an equivalent number of our common units and, in connection therewith, our common units received by KPE to be listed and traded on the NYSE by delivering an election notice to the other party. On February 24, 2010, we delivered an election notice to KPE pursuant to the investment agreement, and we commenced trading on the NYSE on July 15, 2010 under the symbol "KKR".
Indemnification and Insurance
The investment agreement provides that, for a period of six years after the closing of the NYSE listing on July 15, 2010, the KKR Group Partnerships will indemnify each present and former director and officer of the general partner of KPE and certain other persons serving in a similar role against all losses, liabilities, damages, judgments and fines incurred in connection with any suit, claim, action, proceeding, arbitration or investigation arising out of or related to actions taken by them in their capacity as directors or officers of the general partner of KPE or taken by them at the request of KPE or the general partner of KPE. In addition, the investment agreement also provides that the KKR Group Partnerships will indemnify us, KPE, each present and former director and officer of the general partner of KPE and certain other persons serving a similar role against all losses, liabilities, damages, judgments and fines to which any of them may become subject under the Securities Act, the Exchange Act, or other applicable law, statute, rule or regulation insofar as such losses, liabilities, damages, judgments and fines arise out of or are based upon any untrue statement or alleged untrue statement of a material fact contained in the registration statement relating to our common units to be issued to, and distributed by KPE or any other document issued by us, KPE or any of their respective affiliates in connection with, or otherwise relating to, our NYSE listing, or arise out of or are based upon the omission or alleged omission to state therein a material fact required to be stated therein or necessary to make the statements therein, in the light of the circumstances under which they were made, not misleading.
Pursuant to the investment agreement, we obtained directors' and officers' liability insurance for the benefit of the directors and officers (and former directors and officers) of the general partner of KPE which (i) is effective for a period from the date of the dissolution of KPE through and including the date that is six years after such date, (ii) covers claims arising out of or relating to any action, statement or omission of such directors and officers whether on or before the date of such dissolution (including the transactions contemplated by the investment agreement and the decision making process by the directors of the general partner of KPE in connection therewith) to the same extent as the directors and officers of our Managing Partner acting in their capacities as the directors and officers of the general partner of KPE are insured with respect thereto, and (iii) contains a coverage limit of $100 million.
Exchange Agreement
We have entered into an exchange agreement with KKR Holdings, the entity through which certain of our employees, including Messrs. Kravis, Roberts, Fisher, Janetschek and Sorkin, hold their KKR Group Partnership Units, pursuant to which KKR Holdings or certain transferees of its KKR Group Partnership Units may, on a quarterly basis (subject to the terms of the exchange agreement), exchange KKR Group Partnership Units held by them (together with corresponding special voting units) for our common units on a one-for-one basis, subject to customary conversion rate adjustments for splits, unit distributions and reclassifications. At the election of certain of our intermediate holding companies that are partners of the KKR Group Partnerships, the intermediate holding companies may settle exchanges of KKR Group Partnership Units with cash in an amount equal to the fair market value of the common units that would otherwise be deliverable in such exchanges. To the extent that KKR Group Partnership Units held by KKR Holdings or its transferees are exchanged for our common units, our interests in the KKR Group Partnerships will be correspondingly increased. Any common units received upon such exchange
260
will be subject to any restrictions that were applicable to the exchanged KKR Group Partnership Units, including any applicable transfer restrictions. During the year ended
December 31, 2015
, 15,850,161 KKR Group Partnership Units were exchanged for our common units pursuant to this agreement.
On November 2, 2010, the exchange agreement was amended and restated to provide certain rights to cancel exchanges or limit the number of units exchanged in a given quarter. The amendments also provided that certain exchanges will be with a new subsidiary, the result of which is that the income tax character of a small portion of income distributed to unitholders may differ from what it would have been absent the amendment. If additional taxes result from the inclusion of this subsidiary of ours, KKR Holdings will make payments to one of our subsidiaries in respect of those taxes.
Certain interests in KKR Holdings that are held by our employees are subject to transfer restrictions and vesting requirements that, unless waived, modified or amended, limit the ability of our employees to cause KKR Group Partnership Units to be exchanged under the exchange agreement so long as applicable vesting and transfer restrictions apply. The general partner of KKR Holdings, which is controlled by our founders, will have sole authority for waiving any applicable vesting or transfer restrictions.
As contemplated by the exchange agreement, a coordinated selling program has been established relating to sales of common units received pursuant to the exchanges by holders of KKR Holdings units. Pursuant to the program, sales generally take place quarterly, and management is permitted to establish an overall limit on such sales based upon the trading volume of our common units or any other factor that may be considered relevant.
Registration Rights Agreement
In connection with our NYSE listing, we entered into a registration rights agreement with KKR Holdings pursuant to which we granted KKR Holdings, its affiliates and transferees of its KKR Group Partnership Units the right, under certain circumstances and subject to certain restrictions, to require us to register under the Securities Act our common units (and other securities convertible into or exchangeable or exercisable for our common units) held or acquired by them. Under the registration rights agreement, holders of registration rights will have the right to request us to register the common units received upon the exchange of their KKR Holdings units and the sale of such common units and also have the right to require us to make available shelf registration statements permitting sales of common units into the market from time to time over an extended period. In addition, holders of registration rights will have the ability to exercise certain piggyback registration rights in connection with registered offerings requested by other holders of registration rights or initiated by us. On October 1, 2010, the registration statement we filed pursuant to this agreement was declared effective, and a post-effective amendment was declared effective on September 21, 2011. As of December 31, 2015, 361,346,588 common units remain unissued under that registration statement.
Tax Receivable Agreement
We and one or more of our intermediate holding companies may be required to acquire KKR Group Partnership Units from time to time pursuant to our exchange agreement with KKR Holdings. KKR Management Holdings L.P. has made an election under Section 754 of the Internal Revenue Code, which will remain in effect for each taxable year in which an exchange of KKR Group Partnership Units for common units occurs. Certain of these exchanges are expected to result in an increase in certain of our intermediate holding companies' share of the tax basis of the tangible and intangible assets of the KKR Group Partnerships, primarily attributable to a portion of the goodwill inherent in our business, that would not otherwise have been available. This increase in tax basis may increase depreciation and amortization deductions for tax purposes and therefore reduce the amount of income tax our intermediate holding companies would otherwise be required to pay in the future. This increase in tax basis may also decrease gain (or increase loss) on future dispositions of certain capital assets to the extent tax basis is allocated to those capital assets.
We have entered into a tax receivable agreement with KKR Holdings requiring our intermediate holding companies to pay to KKR Holdings or transferees of its KKR Group Partnership Units 85% of the amount of cash savings, if any, in U.S. federal, state and local income tax that our intermediate holding companies actually realize as a result of this increase in tax basis, as well as 85% of the amount of any such savings our intermediate holding companies actually realize as a result of increases in tax basis that arise due to future payments under the agreement. A termination of the agreement or a change of control could give rise to similar payments based on tax savings that we would be deemed to realize in connection with such events. This payment obligation is an obligation of the intermediate holding companies and not of either KKR Group Partnership. As such, the cash distributions to common unitholders may vary from holders of KKR Group Partnership Units (held by KKR Holdings and others) to the extent payments are made under the tax receivable agreement to exchanging holders of KKR Group
261
Partnership Units. As the payments reflect actual tax savings received by KKR entities, there may be a timing difference between the tax savings received by KKR entities and the cash payments to exchanging holders of KKR Group Partnership Units. We expect the intermediate holding companies to benefit from the remaining 15% of cash savings, if any, in income tax that
they
realize. In the event that other of our current or future subsidiaries become taxable as corporations and acquire KKR Group Partnership Units in the future, or if we become taxable as a corporation for U.S. federal income tax purposes, we expect that each will become subject to a tax receivable agreement with substantially similar terms.
For purposes of the tax receivable agreement, cash savings in income tax will be computed by comparing the actual income tax liability of our intermediate holding companies to the amount of such taxes that the
y
would have been required to pay had there been no increase to the tax basis of the tangible and intangible assets of the KKR Group Partnerships as a result of the exchanges of KKR Group Partnership Units and had the intermediate holding companies not entered into the tax receivable agreement. The term of the tax receivable agreement continues until all such tax benefits have been utilized or expired, unless the intermediate holding companies exercise their right to terminate the tax receivable agreement for an amount based on the agreed payments remaining to be made under the agreement.
Estimating the amount of payments that may be made under the tax receivable agreement is by its nature imprecise, insofar as the calculation of amounts payable depends on a variety of factors. The actual increase in tax basis, as well as the amount and timing of any payments under the tax receivable agreement, will vary depending upon a number of factors, including:
• the timing of exchanges—for instance, the increase in any tax deductions will vary depending on the fair market value, which may fluctuate over time, of the KKR Group Partnership Units, which will depend on the fair market value of the depreciable or amortizable assets of the KKR Group Partnerships at the time of the transaction;
• the price of our common units at the time of the exchange—the increase in any tax deductions, as well as the tax basis increase in other assets, of the KKR Group Partnerships, is directly proportional to the price of our common units at the time of the exchange;
• the extent to which such exchanges are taxable—if an exchange is not taxable for any reason (for instance, in the case of a charitable contribution), increased deductions will not be available; and
• the amount of tax, if any, our intermediate holding company is required to pay aside from any tax benefit from the exchanges, and the timing of any such payment. If our intermediate holding companies do not have taxable income aside from any tax benefit from the exchanges, they will not be required to make payments under the tax receivable agreement for that taxable year because no tax savings will have been actually realized.
We expect that as a result of the amount of the increases in the tax basis of the tangible and intangible assets of the KKR Group Partnerships, assuming no material changes in the relevant tax law and that we earn sufficient taxable income to realize the full tax benefit of the increased amortization of our assets, future payments under the tax receivable agreement will be substantial. The payments under the tax receivable agreement are not conditioned upon our principals' continued ownership of us and are required to be made within 90 days of the filing of the tax return
s
of our intermediate holding companies. For the year ended
December 31, 2015
such payments made to our principals, none of whom included a member of the board of directors of our Managing Partner, were approximately $5.2 million. Such payments to KKR Holdings were $0.6 million and a de minimis amount was paid to Messrs. Fisher, Janetschek and Sorkin.
The intermediate holding companies may terminate the tax receivable agreement at any time by making an early termination payment to KKR Holdings or its transferees, based upon the net present value (based upon certain assumptions in the tax receivable agreement) of all tax benefits that would be required to be paid by the intermediate holding companies to KKR Holdings or its transferees. In addition, the tax receivable agreement provides that upon certain mergers, asset sales, other forms of combination transactions or other changes of control, the minimum obligations of our intermediate holding companies or their successor with respect to exchanged or acquired KKR Group Partnership Units (whether exchanged or acquired before or after such transaction) would be based on certain assumptions, including that our intermediate holding companies would have sufficient taxable income to fully utilize the increased tax deductions and increased tax basis and other benefits related to entering into the tax receivable agreement. In these situations, our obligations under the tax receivable agreement could have a substantial negative impact on our liquidity.
262
Decisions made by our senior principals in the course of running our business, such as with respect to mergers, asset sales, other forms of business combinations or other changes of control, may influence the timing and amount of payments that are received by an exchanging or selling holder of partner interests in the KKR Group Partnerships under the tax receivable agreement. For example, the earlier disposition of assets following an exchange or acquisition transaction will generally accelerate payments under the tax receivable agreement and increase the present value of such payments, and the disposition of assets before an exchange or acquisition transaction will increase a principals' tax liability without giving rise to any rights of a principal to receive payments under the tax receivable agreement.
Payments under the tax receivable agreement will be based upon the tax reporting positions that our Managing Partner will determine. We are not aware of any issue that would cause the IRS to challenge a tax basis increase. However, neither KKR Holdings nor its transferees will reimburse us for any payments previously made under the tax receivable agreement if such tax basis increase, or the tax benefits we claim arising from such increase, is successfully challenged by the IRS. As a result, in certain circumstances payments to KKR Holdings or its transferees under the tax receivable agreement could be in excess of the intermediate holding compan
ies
' cash tax savings. The intermediate holding compan
ies
' ability to achieve benefits from any tax basis increase, and the payments to be made under this agreement, will depend upon a number of factors, as discussed above, including the timing and amount of our future income.
KKR Group Partnership Agreements
We indirectly control the general partners of the KKR Group Partnerships and, through the KKR Group Partnerships and their subsidiaries, the KKR business. Because our Managing Partner operates and controls us, our Managing Partner's board of directors and our officers are ultimately responsible for all material decisions of the KKR Group Partnerships and the KKR Group Partnerships' businesses.
On July 28, 2014, KKR formed KKR International Holdings L.P., a Cayman Islands limited partnership. KKR designated KKR International Holdings L.P. as a "KKR Group Partnership" and, in connection therewith, on August 5, 2014, KKR International Holdings L.P. entered into an amendment and joinder to the exchange agreement among KKR, KKR Fund Holdings L.P., KKR Management Holdings L.P., KKR Holdings, and the other parties thereto. Pursuant to the partnership agreements of the KKR Group Partnerships, our partnership, as the controlling general partner of KKR Fund Holdings L.P., KKR Management Holdings L.P. and KKR International Holdings L.P., have the indirect right to determine when distributions will be made to the holders of KKR Group Partnership Units and the amount of any such distributions.
The partnership agreements of the KKR Group Partnerships provide for tax distributions to the holders of KKR Group Partnership Units if the general partners of the KKR Group Partnerships determine that distributions from the KKR Group Partnerships would otherwise be insufficient to cover the tax liabilities of a holder of a KKR Group Partnership Unit. Generally, these tax distributions will be computed based on our estimate of the net taxable income of the relevant partnership allocable to a holder of a KKR Group Partnership Unit multiplied by an assumed tax rate equal to the highest effective marginal combined U.S. federal, state and local income tax rate prescribed for an individual or corporate resident in New York, New York (taking into account the nondeductibility of certain expenses and the character of our income).
The partnership agreements of the KKR Group Partnerships authorize the general partners of the KKR Group Partnerships to issue an unlimited number of additional securities of the KKR Group Partnerships with such designations, preferences, rights, powers and duties that are different from, and may be senior to, those applicable to the KKR Group Partnerships Units, and which may be exchangeable for KKR Group Partnership Units.
Firm Use of Private Aircraft
Certain of our senior employees, including Messrs. Kravis and Roberts, own aircraft that we use for business purposes in the ordinary course of our operations. These senior employees paid for the purchase of these aircraft with their personal funds and bear all operating, personnel and maintenance costs associated with their operation. The hourly rates that we pay for the use of these aircraft are based on current market rates for chartering private aircraft of the same type. We incurred
$4.4 million
for the use of these aircraft during the year ended
December 31, 2015
, of which substantially all was paid to entities collectively controlled by Messrs. Kravis and Roberts.
263
Side-By-Side and Other Investments
Because fund investors typically are unwilling to invest their capital in a fund unless the fund's manager also invests its own capital in the fund's investments, our investment fund documents generally require the general partners of our investment funds to make minimum capital commitments to the funds. The amount of these commitments, which are negotiated by fund investors, generally range from 2% to 5% of a fund's total capital commitments at final closing, but may be greater for certain funds pursuing new strategies. When investments are made, the general partner contributes capital to the fund based on its fund commitment percentage and if applicable, acquires a capital interest in the investment that is not subject to a carried interest. Historically, these capital contributions have been funded with cash from operations that otherwise would be distributed to our employees.
In connection with the KPE Transaction, we did not acquire capital interests in investments that were funded by our employees or others involved in our business prior to October 1, 2009. Rather, those capital interests were allocated to our employees or others involved in our business and are reflected in our financial statements as noncontrolling interests in consolidated entities to the extent that we hold the general partner interest in the fund. Any capital contributions that our private equity fund general partners are required to make to a fund will be funded by us and we will be entitled to receive our allocable share of the returns thereon.
In addition, our employees and certain other qualifying personnel are permitted to invest and have invested their own capital in our funds, side-by-side investments with our funds or the firm and the funds managed by our strategic partnerships with other fund managers. Side-by-side investments are investments generally made on the same terms and conditions as those available to the applicable fund or the firm and, they, together with their investments in our funds or the funds managed by our strategic partnerships with other funds managers, are not generally subject to management fees or a carried interest. The cash invested by our executive officers and their investment vehicles aggregated to
$434.9 million
for the year ended
December 31, 2015
, of which $30.0 million, $25.6 million, $4.4 million, $2.0 million and $0.6 million was invested by Messrs. Kravis, Roberts, Fisher, Janetschek, and Sorkin respectively. These investments are not included in the accompanying consolidated financial statements. In addition, our funds invested $6.0 million in
2015
from the commitments of certain investment vehicles associated with Mr. Hess. Such investments associated with Mr. Hess were made on the same terms and conditions as for other fund investors including management fees and/or a carried interest applicable to the relevant fund.
Indemnification of Directors, Officers and Others
Under our partnership agreement, in most circumstances we will indemnify the following persons, to the fullest extent permitted by law, from and against all losses, claims, damages, liabilities, joint or several, expenses (including legal fees and expenses), judgments, fines, penalties, interest, settlements or other amounts: our Managing Partner; any departing Managing Partner; any person who is or was an affiliate of our Managing Partner or any departing Managing Partner; any person who is or was a member, partner, tax matters partner, officer, director, employee, agent, fiduciary or trustee of our partnership or our subsidiaries, the general partner or any departing general partner or any affiliate of us or our subsidiaries, our Managing Partner or any departing Managing Partner; any person who is or was serving at the request of a Managing Partner or any departing Managing Partner or any affiliate of a Managing Partner or any departing Managing Partner as an officer, director, employee, member, partner, agent, fiduciary or trustee of another person; or any person designated by our Managing Partner. We have agreed to provide this indemnification unless there has been a final and non-appealable judgment by a court of competent jurisdiction determining that these persons acted in bad faith or engaged in fraud or willful misconduct. We have also agreed to provide this indemnification for criminal proceedings. Any indemnification under these provisions will only be out of our assets. Unless it otherwise agrees, our Managing Partner will not be personally liable for, or have any obligation to contribute or loan funds or assets to us to enable us to effectuate, indemnification. The indemnification of the persons described above shall be secondary to any indemnification such person is entitled from another person or the relevant KKR fund to the extent applicable. We may purchase insurance against liabilities asserted against and expenses incurred by persons in connection with our activities, regardless of whether we would have the power to indemnify the person against liabilities under our partnership agreement.
Each member of the board of directors (each an "Indemnitee") has entered into an indemnification agreement with the Managing Partner and us. Each indemnification agreement provides that the Indemnitee, subject to the limitations set forth in each indemnification agreement, shall be indemnified and held harmless by the Managing Partner on an after tax basis from and against any and all losses, claims, damages, liabilities, joint or several, expenses (including legal fees and expenses), judgments, fines, penalties, interest, settlements or other amounts arising from any and all threatened, pending or completed claims, demands, actions, suits or proceedings, whether civil, criminal, administrative or investigative, and whether formal or informal and including appeals, in which the Indemnitee may be involved, or is threatened to be involved, as a party or otherwise, by reason of being or having been or having agreed to serve as a member of the board of directors, or while serving
264
as a member of the board of directors, being or having been serving or having agreed to serve at the request of the Managing Partner as a director, officer, employee or agent (which, for purposes hereof, shall include a trustee, partner or manager or similar capacity) of another corporation, limited liability company, partnership, joint venture, trust, employee benefit plan or other enterprise, whether arising from acts or omissions to act occurring on, before or after the date of such indemnification agreement. Each indemnification agreement provides that the Indemnitee shall not be indemnified and held harmless if there has been a final and non-appealable judgment entered by an arbitral tribunal or court of competent jurisdiction determining that, in respect of the matter for which the Indemnitee is seeking indemnification pursuant to the indemnification agreement, the Indemnitee acted in bad faith or engaged in fraud or willful misconduct.
Guarantee of Contingent Obligations to Fund Partners; Indemnification
The partnership documents governing KKR's carry—paying funds, including funds relating to private equity, mezzanine, infrastructure, energy, real estate, direct lending and special situations investments, generally include a "clawback" provision that, if triggered, may give rise to a contingent obligation requiring the general partner to return amounts to the fund for distribution to the fund investors at the end of the life of the fund. Under a clawback obligation, upon the liquidation of a fund, the general partner is required to return, typically on an after-tax basis, previously distributed carry to the extent that, due to the diminished performance of later investments, the aggregate amount of carry distributions received by the general partner during the term of the fund exceed the amount to which the general partner was ultimately entitled, including the effects of any performance thresholds. Excluding carried interest received by the general partners of funds that were not contributed to KKR in the KPE Transaction, as of
December 31, 2015
, no carried interest was subject to this clawback obligation, assuming that all applicable carry paying funds were liquidated at their
December 31, 2015
fair values. Had the investments in such funds been liquidated at zero value, the clawback obligation would have been
$2,423.4 million
. Carried interest is recognized in the statement of operations based on the contractual conditions set forth in the agreements governing the fund as if the fund were terminated and liquidated at the reporting date and the fund's investments were realized at the then estimated fair values. Amounts earned pursuant to carried interest are earned by the general partner of those funds to the extent that cumulative investment returns are positive and where applicable, preferred return thresholds have been met. If these investment amounts earned decrease or turn negative in subsequent periods, recognized carried interest will be reversed and to the extent that the aggregate amount of carry distributions received by the general partner during the term of the fund exceed the amount to which the general partner was ultimately entitled, a clawback obligation would be recorded. For funds that are consolidated, this clawback obligation, if any, is reflected as an increase in noncontrolling interests in the consolidated statements of financial condition. For funds that are not consolidated, this clawback obligation, if any, is reflected as a reduction of KKR's investment balance as this is where carried interest is initially recorded.
Certain private equity funds that were contributed to KKR in the KPE Transaction in 2009 also include a "net loss sharing provision." Upon the liquidation of an investment vehicle to which a net loss sharing obligation applies, the general partner is required to contribute capital to the vehicle, to fund 20% of the net losses on investments. In these vehicles, such losses would be required to be paid by KKR to the fund investors in those vehicles in the event of a liquidation of the fund regardless of whether any carried interest had previously been distributed, and a greater share of investment losses would be allocable to KKR relative to the capital that KKR contributed to it as general partner. Based on the fair market values as of December 31, 2014, there would have been no net loss sharing obligation. If the vehicles were liquidated at zero value, the net loss sharing obligation would have been zero as of
December 31, 2015
.
Prior to the KPE Transaction in 2009, certain principals who received carried interest distributions with respect to certain private equity funds contributed to KKR had personally guaranteed, on a several basis and subject to a cap, the contingent obligations of the general partners of such private equity funds to repay amounts to fund investors pursuant to the general partners' clawback obligations. The terms of the KPE Transaction require that principals remain responsible for any clawback obligations relating to carry distributions received prior to the KPE Transaction, up to a maximum of $223.6 million. Through investment realizations, this amount has been reduced to
$159.7 million
as of
December 31, 2015
. Using valuations as of
December 31, 2015
, no amounts are due with respect to the clawback obligation required to be funded by principals. Carry distributions arising subsequent to the KPE Transaction may give rise to clawback obligations that may be allocated generally to KKR and principals who participate in the carry pool. Unlike the clawback obligation, KKR will be responsible for all amounts due under a net loss sharing obligation and will indemnify principals for any personal guarantees that they have provided with respect to such amounts. In addition, guarantees of or similar arrangements relating to clawback or net loss sharing obligations in favor of third party investors in an individual investment partnership by entities KKR owns may limit distributions of carried interest more generally.
265
Facilities
Certain trusts, whose beneficiaries include children of Mr. Kravis and Mr. Roberts, and certain other senior employees who are not executive officers of the Company, are partners in a real-estate based partnership that maintains an ownership interest in our Menlo Park location. Payments made from us to this partnership aggregated
$7.3 million
for the year ended
December 31, 2015
.
Confidentiality and Restrictive Covenant Agreements
Our employees have entered into confidentiality and restrictive covenant agreements that include prohibitions on our employees competing with us or soliciting certain fund investors or senior-level employees of our firm during a restricted period following their departure from the firm. For further information on these agreements, see "Executive Compensation—Narrative Disclosure to Summary Compensation Table and Grants of Plan-Based Awards in
2015
—Terms of Confidentiality and Restrictive Covenant Agreements."
Other Transactions with Related Persons
During part of
2015
, Mr. Hess's son was employed by the firm as an investment professional. In
2015
, in addition to customary benefits, he received total compensation of less than $200,000, consisting of a base salary and cash bonus. Such compensation and benefits was determined according to the firm's compensation philosophy and practices applicable to similarly situated employees. In February 2016, after appropriate appraisals were conducted, a company owned by Mr. Kravis purchased art from KKR for $537,900.
We have and may in the future continue to enter into ordinary course transactions with unaffiliated entities known to us to beneficially own more than 5% of any class of the outstanding voting securities of our partnership. These transactions may include investments by them in our funds generally on the same terms and conditions offered to other unaffiliated fund investors and participation in our capital markets transactions, including underwritings and syndications, generally on the same terms and conditions offered to other unaffiliated capital markets participants. See "Security Ownership of Certain Beneficial Owners and Management and Related Stockholder Matters."
Statement of Policy Regarding Transactions with Related Persons
The board of directors of our Managing Partner adopted a written statement of policy for our partnership regarding transactions with related persons, which we refer to as our related person policy. Our related person policy requires that a "related person" (as defined as in Item 404(a) of Regulation S-K) must promptly disclose to our General Counsel or other designated person any "related person transaction" (defined as any transaction, arrangement or relationship, or series of similar transactions, arrangements or relationships, including, without limitation, any loan, guarantee of indebtedness, transfer or lease of real estate, or use of company property) that is reportable by us under Item 404(a) of Regulation S-K in which we were or are to be a participant and the amount involved exceeds $120,000 and in which any related person had or will have a direct or indirect material interest) and all material facts with respect thereto. Those individuals will then communicate that information to the board of directors of our Managing Partner. No related person transaction will be consummated without the approval or ratification of a committee of the board consisting exclusively of disinterested directors; provided, however, the conflicts committee of our board of directors has pre-approved certain ordinary course transactions with persons known to us to beneficially own more than 5% of our outstanding common units on terms generally not less favorable as obtained from other third parties, including investments in our funds as limited partners and participation in capital markets transactions like underwritings and syndications, the renewal of pre-existing strategic relationships with an owner of more than 5% of our outstanding common units, the use of aircraft owned by our senior employees for business purposes, the employment of a director's son on terms made available to other similarly situated employees, certain investments by eligible employees in side-by-side investments with our firm and funds managed by our strategic partnership with other fund managers, and certain pro rata cash contributions to the Group Partnerships for cash management purposes. It is our policy that directors interested in a related person transaction will recuse themselves from any vote on a related person transaction in which they have an interest. All transactions entered into prior to July 14, 2010 were not approved in accordance with this policy as they were entered into prior to the date of adoption of the policy. All side-by-side and other investments described in this section are pre-approved in accordance with the terms of the policy.
Director Independence
Please see "Directors, Executive Officers and Corporate Governance—Independence and Composition of Board of Directors" for information on director independence.
266
The following table summarizes the aggregate fees for professional services provided by Deloitte & Touche LLP, the member firms of Deloitte Touche Tohmatsu Limited or their respective affiliates (collectively, the "Deloitte Entities") for the years ended
December 31, 2015
and 2014.
|
For the Year Ended
December 31, 2015
|
||||||||
|
KKR
|
Completed Transactions
|
|||||||
|
(in thousands)
|
||||||||
|
Audit Fees
|
$
|
20,241
|
|
(a)
|
$
|
—
|
|
|
|
Audit-Related Fees
|
$
|
7,157
|
|
(b)
|
$
|
6,102
|
|
(d)
|
|
Tax Fees
|
$
|
28,988
|
|
(c)
|
$
|
4,619
|
|
(d)
|
|
All Other Fees
|
$
|
—
|
|
$
|
—
|
|
||
|
For the Year Ended
December 31, 2014
|
|||||||||
|
KKR
|
Completed Transactions
|
||||||||
|
(in thousands)
|
|||||||||
|
Audit Fees
|
$
|
20,224
|
|
(a)
|
$
|
—
|
|
||
|
Audit-Related Fees
|
$
|
5,352
|
|
(b)
|
$
|
9,786
|
|
(d)
|
|
|
Tax Fees
|
$
|
20,735
|
|
(c)
|
$
|
9,226
|
|
(d)
|
|
|
All Other Fees
|
$
|
305
|
|
(e)
|
$
|
—
|
|
||
|
(a)
|
Audit Fees consisted of estimated fees for each audit year for (1) the audits of our consolidated financial statements in our Annual Report on Form 10-K and services related to, or required by, statute or regulation; (2) reviews of the interim consolidated financial statements included in our quarterly reports on Form 10-Q; and (3) comfort letters, consents and other services related to SEC and other regulatory filings. Estimate to actual adjustments for settlements of audit fees are reflected in the year audit fees are settled.
|
|||
|
(b)
|
Audit-Related Fees primarily included merger, acquisition, and investment due diligence services for strategic acquisitions or investments in target companies for in-process transactions and transactions not completed.
|
|||
|
(c)
|
Tax Fees consisted of fees for services rendered for tax compliance, planning and advisory services as well as tax fees for merger, acquisition, and investment due diligence services for strategic acquisitions or investments in target companies for in-process transactions and transactions not completed.
|
|||
|
(d)
|
Audit-Related and Tax Fees included merger, acquisition, and investment due diligence services for strategic acquisitions or investments in portfolio companies that have been completed. In addition, the Deloitte Entities provided audit, audit-related, tax and other services to the portfolio companies, which are approved directly by the portfolio company's management and are not included in the amounts presented here.
|
|||
|
(e)
|
All Other Fees in 2014 included a sourcing assessment and an accounting consultation related to a portfolio company.
|
|||
Our audit committee charter, which is available on our website at www.kkr.com under "Investor Center—KKR & Co. L.P.—Corporate Governance—Audit Charter", requires the audit committee to approve in advance all audit and non-audit related services to be provided by our independent registered public accounting firm in accordance with the audit and non-audit related services pre-approval policy. All services reported in the Audit, Audit-Related, Tax, and All Other categories above were approved by the audit committee.
267
(a) The following documents are filed as part of this annual report.
1. Financial Statements
See Item 8 above.
2. Financial Statement Schedules:
See Schedule II - Valuation and Qualifying Accounts - Years Ended December 31, 2015, 2014 and 2013 of this Annual Report on Form 10- K. The other schedules are omitted as they are not applicable or the amounts involved are not material.
3. Exhibits:
|
2.1
|
|
Amended and Restated Purchase and Sale Agreement (incorporated by reference to Exhibit 2.1 to Amendment No. 1 to the KKR & Co. L.P. registration statement on Form S-1 (File No. 133-165414) filed on April 16, 2010).
|
|
|
|
|
|
2.2
|
|
Amended and Restated Investment Agreement (incorporated by reference to Exhibit 2.2 to Amendment No. 1 to the KKR & Co. L.P. registration statement on Form S-1 (File No. 133-165414) filed on April 16, 2010).
|
|
|
|
|
|
2.3
|
|
Merger Agreement, dated as of December 16, 2013, among KKR & Co. L.P., KKR Fund Holdings L.P., Copal Merger Sub LLC, a Delaware limited liability company and KKR Financial Holdings LLC (incorporated by reference to Exhibit 2.1 to the KKR & Co. L.P. Current Report on Form 8-K filed on December 17, 2013).
|
|
|
|
|
|
3.1
|
|
Certificate of Limited Partnership of the Registrant (incorporated by reference to Exhibit 3.1 to the KKR & Co. L.P. registration statement on Form S-1 (File No. 133-165414) filed on March 12, 2010 (the "Registration Statement").
|
|
|
|
|
|
3.2
|
|
Amended and Restated Limited Partnership Agreement of the Registrant (incorporated by reference to Exhibit 3.1 to the KKR & Co. L.P. Current Report on Form 8-K filed on July 20, 2010).
|
|
|
|
|
|
3.3
|
|
Certificate of Formation of the Managing Partner of the Registrant (incorporated by reference to Exhibit 3.3 of the Registration Statement).
|
|
|
|
|
|
3.4
|
|
Amended and Restated Limited Liability Company Agreement of the Managing Partner of the Registrant (incorporated by reference to Exhibit 3.1 to the KKR & Co. L.P. Quarterly Report on Form 10-Q filed on August 5, 2011).
|
|
|
|
|
|
4.1
|
|
Indenture dated as of September 29, 2010 among KKR Group Finance Co. LLC, KKR & Co. L.P., KKR Management Holdings L.P., KKR Fund Holdings L.P. and The Bank of New York Mellon Trust Company, N. A., as trustee (incorporated by reference to Exhibit 4.1 to the KKR & Co. L.P. Current Report on Form 8-K filed on September 30, 2010).
|
|
|
|
|
|
4.2
|
|
First Supplemental Indenture dated as of September 29, 2010 among KKR Group Finance Co. LLC, KKR & Co. L.P., KKR Management Holdings L.P., KKR Fund Holdings L.P. and The Bank of New York Mellon Trust Company, N. A., as trustee (incorporated by reference to Exhibit 4.2 to the KKR & Co. L.P. Current Report on Form 8-K filed on September 30, 2010).
|
268
|
4.3
|
|
Second Supplemental Indenture dated as of August 5, 2014 among KKR Group Finance Co. LLC, KKR & Co. L.P., KKR Management Holdings L.P., KKR Fund Holdings L.P., KKR International Holdings L.P. and The Bank of New York Mellon Trust Company, N.A., as trustee (incorporated by reference to Exhibit 4.1 to the KKR & Co. L.P. Quarterly Report on Form 10-Q filed on August 7, 2014).
|
|
|
|
|
|
4.4
|
|
Form of 6.375% Senior Note due 2020 (included in Exhibit 4.2 to the KKR & Co. L.P. Current Report on Form 8-K filed on September 30, 2010).
|
|
|
|
|
|
4.5
|
|
Registration Rights Agreement of KKR & Co. L.P., dated as of October 1, 2012, by and among KKR & Co. L.P., AUSA Holding Company and the other persons listed on the signature page thereto (incorporated by reference to Exhibit 4.1 to the KKR & Co. L.P. Quarterly Report on Form 10-Q filed on November 2, 2012).
|
|
|
|
|
|
4.6
|
|
Indenture dated as of February 1, 2013 among KKR Group Finance Co. II LLC, KKR & Co. L.P., KKR Management Holdings L.P., KKR Fund Holdings L.P. and The Bank of New York Mellon Trust Company, N. A., as trustee (incorporated by reference to Exhibit 4.1 to the KKR & Co. L.P. Current Report on Form 8-K filed on February 1, 2013).
|
|
|
|
|
|
4.7
|
|
First Supplemental Indenture dated as of February 1, 2013 among KKR Group Finance Co. II LLC, KKR & Co. L.P., KKR Management Holdings L.P., KKR Fund Holdings L.P. and The Bank of New York Mellon Trust Company, N. A., as trustee (incorporated by reference to Exhibit 4.2 to the KKR & Co. L.P. Current Report on Form 8-K filed on February 1, 2013).
|
|
|
|
|
|
4.8
|
|
Second Supplemental Indenture dated as of August 5, 2014 among KKR Group Finance Co. II LLC, KKR & Co. L.P., KKR Management Holdings L.P., KKR Fund Holdings L.P., KKR International Holdings L.P. and The Bank of New York Mellon Trust Company, N.A., as trustee (incorporated by reference to Exhibit 4.2 to the KKR & Co. L.P. Quarterly Report on Form 10-Q filed on August 7, 2014).
|
|
|
|
|
|
4.9
|
|
Form of 5.500% Senior Note due 2043 (included in Exhibit 4.2 to the KKR & Co. L.P. Current Report on Form 8-K filed on February 1, 2013).
|
|
|
|
|
|
4.10
|
|
Registration Rights Agreement of KKR & Co. L.P. dated as of February 19, 2014, by and among KKR & Co. L.P. and the sellers of Avoca listed on the signature pages thereto (included in Exhibit 4.8 to the KKR & Co. L.P. Annual Report on Form 10-K filed on February 24, 2014).
|
|
|
|
|
|
4.11
|
|
Indenture dated as of May 29, 2014 among KKR Group Finance Co. III LLC, KKR & Co. L.P., KKR Management Holdings L.P., KKR Fund Holdings L.P. and The Bank of New York Mellon Trust Company, N. A., as trustee (incorporated by reference to Exhibit 4.1 to the KKR & Co. L.P. Current Report on Form 8-K filed on May 29, 2014).
|
|
|
|
|
|
4.12
|
|
First Supplemental Indenture dated as of May 29, 2014 among KKR Group Finance Co. III LLC, KKR & Co. L.P., KKR Management Holdings L.P., KKR Fund Holdings L.P. and The Bank of New York Mellon Trust Company, N. A., as trustee (incorporated by reference to Exhibit 4.2 to the KKR & Co. L.P. Current Report on Form 8-K filed on May 29, 2014).
|
|
|
|
|
|
4.13
|
|
Second Supplemental Indenture dated as of August 5, 2014 among KKR Group Finance Co. III LLC, KKR & Co. L.P., KKR Management Holdings L.P., KKR Fund Holdings L.P., KKR International Holdings L.P. and The Bank of New York Mellon Trust Company, N.A., as trustee (incorporated by reference to Exhibit 4.3 to the KKR & Co. L.P. Quarterly Report on Form 10-Q filed on August 7, 2014).
|
|
4.14
|
|
|
Form of 5.125% Senior Note due 2044 (included in Exhibit 4.2 to the KKR & Co. L.P. Current Report on Form 8-K filed on May 29, 2014).
|
|
|
|
|
|
|
4.15
|
|
|
Indenture, dated as of November 15, 2011, between the KKR Financial Holdings LLC and Wilmington Trust, National Association, as Trustee (incorporated by reference to Exhibit 4.1 to the KKR Financial Holdings LLC Current Report on Form 8-K filed on November 15, 2011).
|
|
|
|
|
|
269
|
4.16
|
|
|
Supplemental Indenture, dated as of November 15, 2011, between the KKR Financial Holdings LLC, Wilmington Trust, National Association, as Trustee and Citibank, N.A., Authenticating Agent, Paying Agent and Security Registrar (incorporated by reference to Exhibit 4.2 to the KKR Financial Holdings LLC Current Report on Form 8-K filed on November 15, 2011).
|
|
|
|
|
|
|
4.17
|
|
|
Form of 8.375% Senior Note due November 15, 2041 of KKR Financial Holdings LLC (included in Exhibit 4.2 to the KKR Financial Holdings LLC Current Report on Form 8-K filed on November 15, 2011).
|
|
|
|
|
|
|
4.18
|
|
|
Second Supplemental Indenture, dated as of March 20, 2012, between KKR Financial Holdings LLC, Wilmington Trust, National Association, as Trustee and Citibank, N.A., as Authenticating Agent, Paying Agent and Security Registrar (incorporated by reference to Exhibit 4.2 to the KKR Financial Holdings LLC Current Report on Form 8-K filed on March 20, 2012).
|
|
|
|
|
|
|
4.19
|
|
|
Form of 7.500% Senior Note due March 20, 2042 of KKR Financial Holdings LLC (incorporated by reference to Exhibit 4.2 to the KKR Financial Holdings LLC Current Report on Form 8-K filed on March 20, 2012).
|
|
|
|
|
|
|
4.20
|
|
|
Share Designation of the 7.375% Series A LLC Preferred Shares of KKR Financial Holdings LLC, dated as of January 17, 2013 (incorporated by reference to Exhibit 3.1 to the KKR Financial Holdings LLC Current Report on Form 8-K filed on January 17, 2013).
|
|
|
|
|
|
|
4.21
|
|
|
Registration Rights Agreement, dated as of November 2, 2015, by and among KKR & Co. L.P., MW Group (GP) LTD and the other persons listed on the signature pages thereto (incorporated by reference to Exhibit 4.2 of the Registration Statement on Form S-3 (No. 333-208019) filed on November 13, 2015).
|
|
10.1
|
|
|
Second Amended and Restated Limited Partnership Agreement of KKR Management Holdings L.P. (incorporated by reference to Exhibit 10.1 of the Registration Statement).
|
|
|
|
|
|
|
10.2
|
|
|
Second Amended and Restated Limited Partnership Agreement of KKR Fund Holdings L.P. (incorporated by reference to Exhibit 10.2 of the Registration Statement).
|
|
|
|
|
|
|
10.3
|
|
|
Amendment to Second Amended and Restated Limited Partnership Agreement of KKR Fund Holdings L.P. dated August 5, 2014 (incorporated by reference to Exhibit 10.3 to the KKR & Co. L.P. Quarterly Report on Form 10-Q filed on August 7, 2014).
|
|
|
|
|
|
|
10.4
|
|
|
Amended and Restated Limited Partnership Agreement of KKR International Holdings L.P., dated August 5, 2014 (incorporated by reference to Exhibit 10.1 to the KKR & Co. L.P. Quarterly Report on Form 10-Q filed on August 7, 2014).
|
|
|
|
|
|
|
10.5
|
|
|
Registration Rights Agreement dated July 14, 2010, by and among KKR & Co. L.P., KKR Holdings L.P. and the persons from time to time party thereto (incorporated by reference to Exhibit 10.2 to the KKR & Co. L.P. Current Report on Form 8-K filed on July 20, 2010).
|
|
|
|
|
|
|
10.6
|
|
*
|
Form of KKR & Co. L.P. 2010 Equity Incentive Plan (incorporated by reference to Exhibit 10.4 to Amendment No. 3 to the Registration Statement filed on June 3, 2010).
|
|
|
|
|
|
|
10.7
|
|
|
Tax Receivable Agreement (incorporated by reference to Exhibit 10.3 to the KKR & Co. L.P. Current Report on Form 8-K filed on July 20, 2010).
|
|
|
|
|
|
|
10.8
|
|
|
Amended and Restated Exchange Agreement (incorporated by reference to Exhibit 10.1 to the KKR & Co. L.P. Current Report on Form 8-K filed on November 3, 2010).
|
|
10.9
|
|
|
Amendment and Joinder Agreement to Exchange Agreement, dated as of August 5, 2014 among KKR Management Holdings L.P., KKR Fund Holdings L.P., KKR Holdings L.P., KKR & Co. L.P., KKR Group Holdings L.P., KKR Subsidiary Partnership L.P., KKR Group Limited, and KKR International Holdings L.P. (incorporated by reference to Exhibit 10.2 to the KKR & Co. L.P. Quarterly Report on Form 10-Q filed on August 7, 2014).
|
|
|
|
|
|
270
|
10.10
|
|
|
Credit Agreement, dated as of October 22, 2014, among Kohlberg Kravis Roberts & Co. L.P., KKR Fund Holdings L.P., KKR Management Holdings L.P. and KKR International Holdings L.P., the other borrowers from time to time party thereto, the guarantors from time to time party thereto, the lending institutions from time to time party thereto and HSBC Bank USA, National Association, as Administrative Agent. (incorporated by reference to Exhibit 10.1 to the KKR & Co. L.P. Current Report on Form 8-K filed October 24, 2014).
|
|
|
|
|
|
|
10.11
|
|
|
Amendment No. 1 to Credit Agreement, dated as of August 18, 2015 by and among Kohlberg Kravis Roberts & Co. L.P. and HSBC Bank USA, National Association (incorporated by reference to Exhibit 10.1 to the KKR & Co. L.P. Quarterly Report on Form 10-Q filed November 5, 2015).
|
|
|
|
|
|
|
10.12
|
|
*
|
Form of Confidentiality and Restrictive Covenant Agreement (Senior Principals) (incorporated by reference to Exhibit 10.9 of the Registration Statement).
|
|
|
|
|
|
|
10.13
|
|
*
|
Form of Confidentiality and Restrictive Covenant Agreement (Founders) (incorporated by reference to Exhibit 10.10 of the Registration Statement).
|
|
|
|
|
|
|
10.14
|
|
*
|
Form of Indemnification Agreement by and among each member of the Board of Directors of KKR Management LLC, KKR Management LLC and KKR & Co. L.P. (incorporated by reference to Exhibit 10.4 to the KKR & Co. L.P. Current Report on Form 8-K filed on July 20, 2010).
|
|
|
|
|
|
|
10.15
|
|
*
|
Independent Director Compensation Program (incorporated by reference to Exhibit 10.15 of the KKR & Co. L.P. Annual Report on Form 10-K filed on March 7, 2011).
|
|
|
|
|
|
|
10.16
|
|
*
|
Form of Grant Certificate (incorporated by reference to Exhibit 10.3 to the KKR & Co. L.P. Quarterly Report on Form 10-Q filed on May 5, 2011).
|
|
|
|
|
|
|
10.17
|
|
*
|
Form of Public Company Equity Unit Award Agreement of KKR & Co. L.P. (Directors) (incorporated by reference to Exhibit 10.1 of the KKR & Co. L.P. Quarterly Report on Form 10-Q filed on August 3, 2012).
|
|
|
|
|
|
|
10.18
|
|
*
|
Form of Public Company Holdings Unit Award Agreement of KKR & Co. L.P. (Executive Officers) (incorporated by reference to Exhibit 10.1 of the KKR & Co. L.P. Annual Report on Form 10-K filed on February 27, 2015).
|
|
|
|
|
|
|
10.19
|
|
*
|
Form of Public Company Holdings Unit Award Agreement of KKR & Co. L.P. (Executive Officers).
|
|
|
|
|
|
|
10.20
|
|
*
|
Form of Grant Certificate (Executive Officers).
|
|
10.21
|
|
**
|
KKR Financial Holdings LLC 2007 Share Incentive Plan (incorporated by reference to Exhibit 10.2 to the KKR Financial Holdings LLC Current Report on Form 8-K filed on May 4, 2007).
|
|
|
|
|
|
|
10.22
|
|
**
|
KKR Financial Holdings LLC Non-Employee Directors' Deferred Compensation and Share Award Plan (incorporated by reference to Exhibit 10.3 to the KKR Financial Holdings LLC Current Report on Form 8-K filed on May 4, 2007).
|
|
|
|
|
|
|
10.23
|
|
|
Development Agreement, dated as of October 28, 2015, by and between ERY Developer LLC and KKR HY LLC.
|
|
|
|
|
|
|
21.1
|
|
|
Subsidiaries of the Registrant
|
|
|
|
|
|
|
23.1
|
|
|
Consent of Independent Registered Public Accounting Firm Relating to the Financial Statements of KKR & Co. L.P.
|
|
|
|
|
|
|
31.1
|
|
|
Certification of Co-Chief Executive Officer pursuant to Rule 13a-14(a) and Rule 15d-14(a) of the Securities Exchange Act of 1934, as amended, as adopted pursuant to Section 302 of the Sarbanes-Oxley Act of 2002.
|
|
|
|
|
|
271
|
31.2
|
|
|
Certification of Co-Chief Executive Officer pursuant to Rule 13a-14(a) and Rule 15d-14(a) of the Securities Exchange Act of 1934, as amended, as adopted pursuant to Section 302 of the Sarbanes-Oxley Act of 2002.
|
|
31.3
|
|
Certification of Chief Financial Officer pursuant to Rule 13a-14(a) and Rule 15d-14(a) of the Securities Exchange Act of 1934, as amended, as adopted pursuant to Section 302 of the Sarbanes-Oxley Act of 2002
|
|
|
|
|
|
32.1
|
|
Certification of Co-Chief Executive Officer pursuant to 18 U.S.C. Section 1350, as adopted pursuant to Section 906 of the Sarbanes-Oxley Act of 2002.
|
|
|
|
|
|
32.2
|
|
Certification of Co-Chief Executive Officer pursuant to 18 U.S.C. Section 1350, as adopted pursuant to Section 906 of the Sarbanes-Oxley Act of 2002.
|
|
|
|
|
|
32.3
|
|
Certification of Chief Financial Officer pursuant to 18 U.S.C. Section 1350, as adopted pursuant to Section 906 of the Sarbanes-Oxley Act of 2002.
|
|
|
|
|
|
101
|
|
Interactive data files pursuant to Rule 405 of Regulation S-T: (i) the Consolidated Statements of Financial Condition as of December 31, 2015 and December 31, 2014, (ii) the Consolidated Statements of Operations for the years ended December 31, 2015, 2014 and 2013, (iii) the Consolidated Statements of Comprehensive Income (Loss) for the years ended December 31, 2015, 2014 and 2013, (iv) the Consolidated Statements of Changes in Equity for the years ended December 31, 2015, 2014 and 2013 (v) the Consolidated Statements of Cash Flows for the years ended December 31, 2015, 2014 and 2013, and (vi) the Notes to the Consolidated Financial Statements.
|
* Management contract or compensatory plan in which directors and/or executive officers are eligible to participate.
** Management contract or compensatory plan in which directors and/or executive officers of KKR Financial Holdings LLC are eligible to participate.
The agreements and other documents filed as exhibits to this report are not intended to provide factual information or other disclosure other than with respect to the terms of the agreements or other documents themselves, and you should not rely on them for that purpose. In particular, any representations and warranties made by us in these agreements or other documents were made solely within the specific context of the relevant agreement or document and may not describe the actual state of affairs as of the date they were made or at any other time.
272
SCHEDULE
|
SCHEDULE II—VALUATION AND QUALIFYING ACCOUNTS
|
|||||||||||||||
|
Valuation Allowance for Deferred Tax Assets
|
|||||||||||||||
|
(in thousands)
|
|||||||||||||||
|
Balance at Beginning of Period
|
Tax Valuation Allowance Charged to Income Tax Provision
|
Tax Valuation Allowance Credited to Income Tax Provision
|
Balance at End of Period
|
||||||||||||
|
Year Ended:
|
|||||||||||||||
|
December 31, 2013
|
$
|
—
|
|
$
|
—
|
|
$
|
—
|
|
$
|
—
|
|
|||
|
December 31, 2014
|
$
|
—
|
|
$
|
4,153
|
|
(a)
|
$
|
—
|
|
$
|
4,153
|
|
||
|
December 31, 2015
|
$
|
4,153
|
|
$
|
15,628
|
|
(a)
|
$
|
—
|
|
$
|
19,781
|
|
||
|
(a)
|
Includes an increase in valuation allowance due to foreign tax credits, the benefit of which is not currently recognizable due to uncertainty regarding realization.
|
||||||||||||||
273
SIGNATURES
Pursuant to requirements of Section 13 or 15(d) of the Securities Exchange Act of 1934, the registrant has duly caused this report to be signed on its behalf by the undersigned, thereunto duly authorized.
|
Date:
|
February 26, 2016
|
|||
|
|
KKR & CO. L.P.
|
|||
|
|
|
|||
|
|
By: KKR Management LLC,
|
|||
|
|
its General Partner
|
|||
|
|
||||
|
|
Name:
|
William J. Janetschek
|
||
|
|
Title:
|
Chief Financial Officer
|
||
|
|
|
|||
|
Pursuant to the requirements of the Exchange Act of 1934 this report has been signed below by the following persons on behalf of the registrant and in the capacities indicated below on the dates indicated below.
|
||||
|
Signature
|
Title
|
Date
|
||
|
/s/ HENRY R. KRAVIS
|
Co-Chairman and Co-Chief Executive Officer
|
|||
|
Henry R. Kravis
|
(principal executive officer) of KKR
|
February 26, 2016
|
||
|
Management LLC
|
||||
|
/s/ GEORGE R. ROBERTS
|
Co-Chairman and Co-Chief Executive Officer
|
|||
|
George R. Roberts
|
(principal executive officer) of KKR
|
February 26, 2016
|
||
|
Management LLC
|
||||
|
/s/ DAVID C. DRUMMOND
|
Director of KKR Management LLC
|
February 26, 2016
|
||
|
David C. Drummond
|
||||
|
/s/ JOSEPH A. GRUNDFEST
|
Director of KKR Management LLC
|
February 26, 2016
|
||
|
Joseph A. Grundfest
|
||||
|
/s/ JOHN. B. HESS
|
Director of KKR Management LLC
|
February 26, 2016
|
||
|
John. B. Hess
|
||||
|
/s/ PATRICK F. RUSSO
|
Director of KKR Management LLC
|
February 26, 2016
|
||
|
Patricia F. Russo
|
||||
|
/s/ THOMAS M. SCHOEWE
|
Director of KKR Management LLC
|
February 26, 2016
|
||
|
Thomas M. Schoewe
|
||||
|
/s/ ROBERT W. SCULLY
|
Director of KKR Management LLC
|
February 26, 2016
|
||
|
Robert W. Scully
|
||||
|
/s/ WILLIAM J. JANETSCHEK
|
Chief Financial Officer (principal financial and accounting officer) of KKR Management LLC
|
February 26, 2016
|
||
|
William J. Janetschek
|
||||
274
INDEX TO EXHIBITS
The following is a list of all exhibits filed or furnished as part of this report:
|
2.1
|
|
|
Amended and Restated Purchase and Sale Agreement (incorporated by reference to Exhibit 2.1 to Amendment No. 1 to the KKR & Co. L.P. registration statement on Form S-1 (File No. 133-165414) filed on April 16, 2010).
|
|
|
|
|
|
|
2.2
|
|
|
Amended and Restated Investment Agreement (incorporated by reference to Exhibit 2.2 to Amendment No. 1 to the KKR & Co. L.P. registration statement on Form S-1 (File No. 133-165414) filed on April 16, 2010).
|
|
|
|
|
|
|
2.3
|
|
|
Merger Agreement, dated as of December 16, 2013, among KKR & Co. L.P., KKR Fund Holdings L.P., Copal Merger Sub LLC, a Delaware limited liability company and KKR Financial Holdings LLC (incorporated by reference to Exhibit 2.1 to the KKR & Co. L.P. Current Report on Form 8-K filed on December 17, 2013).
|
|
|
|
|
|
|
3.1
|
|
|
Certificate of Limited Partnership of the Registrant (incorporated by reference to Exhibit 3.1 to the KKR & Co. L.P. registration statement on Form S-1 (File No. 133-165414) filed on March 12, 2010 (the "Registration Statement").
|
|
|
|
|
|
|
3.2
|
|
|
Amended and Restated Limited Partnership Agreement of the Registrant (incorporated by reference to Exhibit 3.1 to the KKR & Co. L.P. Current Report on Form 8-K filed on July 20, 2010).
|
|
|
|
|
|
|
3.3
|
|
|
Certificate of Formation of the Managing Partner of the Registrant (incorporated by reference to Exhibit 3.3 of the Registration Statement).
|
|
|
|
|
|
|
3.4
|
|
|
Amended and Restated Limited Liability Company Agreement of the Managing Partner of the Registrant (incorporated by reference to Exhibit 3.1 to the KKR & Co. L.P. Quarterly Report on Form 10-Q filed on August 5, 2011).
|
|
|
|
|
|
|
4.1
|
|
|
Indenture dated as of September 29, 2010 among KKR Group Finance Co. LLC, KKR & Co. L.P., KKR Management Holdings L.P., KKR Fund Holdings L.P. and The Bank of New York Mellon Trust Company, N. A., as trustee (incorporated by reference to Exhibit 4.1 to the KKR & Co. L.P. Current Report on Form 8-K filed on September 30, 2010).
|
|
|
|
|
|
|
4.2
|
|
|
First Supplemental Indenture dated as of September 29, 2010 among KKR Group Finance Co. LLC, KKR & Co. L.P., KKR Management Holdings L.P., KKR Fund Holdings L.P. and The Bank of New York Mellon Trust Company, N. A., as trustee (incorporated by reference to Exhibit 4.2 to the KKR & Co. L.P. Current Report on Form 8-K filed on September 30, 2010).
|
275
|
4.3
|
|
|
Second Supplemental Indenture dated as of August 5, 2014 among KKR Group Finance Co. LLC, KKR & Co. L.P., KKR Management Holdings L.P., KKR Fund Holdings L.P., KKR International Holdings L.P. and The Bank of New York Mellon Trust Company, N.A., as trustee (incorporated by reference to Exhibit 4.1 to the KKR & Co. L.P. Quarterly Report on Form 10-Q filed on August 7, 2014).
|
|
|
|
|
|
|
4.4
|
|
|
Form of 6.375% Senior Note due 2020 (included in Exhibit 4.2 to the KKR & Co. L.P. Current Report on Form 8-K filed on September 30, 2010).
|
|
|
|
|
|
|
4.5
|
|
|
Registration Rights Agreement of KKR & Co. L.P., dated as of October 1, 2012, by and among KKR & Co. L.P., AUSA Holding Company and the other persons listed on the signature page thereto (incorporated by reference to Exhibit 4.1 to the KKR & Co. L.P. Quarterly Report on Form 10-Q filed on November 2, 2012).
|
|
|
|
|
|
|
4.6
|
|
|
Indenture dated as of February 1, 2013 among KKR Group Finance Co. II LLC, KKR & Co. L.P., KKR Management Holdings L.P., KKR Fund Holdings L.P. and The Bank of New York Mellon Trust Company, N. A., as trustee (incorporated by reference to Exhibit 4.1 to the KKR & Co. L.P. Current Report on Form 8-K filed on February 1, 2013).
|
|
|
|
|
|
|
4.7
|
|
|
First Supplemental Indenture dated as of February 1, 2013 among KKR Group Finance Co. II LLC, KKR & Co. L.P., KKR Management Holdings L.P., KKR Fund Holdings L.P. and The Bank of New York Mellon Trust Company, N. A., as trustee (incorporated by reference to Exhibit 4.2 to the KKR & Co. L.P. Current Report on Form 8-K filed on February 1, 2013).
|
|
|
|
|
|
|
4.8
|
|
|
Second Supplemental Indenture dated as of August 5, 2014 among KKR Group Finance Co. II LLC, KKR & Co. L.P., KKR Management Holdings L.P., KKR Fund Holdings L.P., KKR International Holdings L.P. and The Bank of New York Mellon Trust Company, N.A., as trustee (incorporated by reference to Exhibit 4.2 to the KKR & Co. L.P. Quarterly Report on Form 10-Q filed on August 7, 2014).
|
|
|
|
|
|
|
4.9
|
|
|
Form of 5.500% Senior Note due 2043 (included in Exhibit 4.2 to the KKR & Co. L.P. Current Report on Form 8-K filed on February 1, 2013).
|
|
|
|
|
|
|
4.10
|
|
|
Registration Rights Agreement of KKR & Co. L.P. dated as of February 19, 2014, by and among KKR & Co. L.P. and the sellers of Avoca listed on the signature pages thereto (included in Exhibit 4.8 to the KKR & Co. L.P. Annual Report on Form 10-K filed on February 24, 2014).
|
|
|
|
|
|
|
4.11
|
|
|
Indenture dated as of May 29, 2014 among KKR Group Finance Co. III LLC, KKR & Co. L.P., KKR Management Holdings L.P., KKR Fund Holdings L.P. and The Bank of New York Mellon Trust Company, N. A., as trustee (incorporated by reference to Exhibit 4.1 to the KKR & Co. L.P. Current Report on Form 8-K filed on May 29, 2014).
|
|
|
|
|
|
|
4.12
|
|
|
First Supplemental Indenture dated as of May 29, 2014 among KKR Group Finance Co. III LLC, KKR & Co. L.P., KKR Management Holdings L.P., KKR Fund Holdings L.P. and The Bank of New York Mellon Trust Company, N. A., as trustee (incorporated by reference to Exhibit 4.2 to the KKR & Co. L.P. Current Report on Form 8-K filed on May 29, 2014).
|
|
|
|
|
|
|
4.13
|
|
|
Second Supplemental Indenture dated as of August 5, 2014 among KKR Group Finance Co. III LLC, KKR & Co. L.P., KKR Management Holdings L.P., KKR Fund Holdings L.P., KKR International Holdings L.P. and The Bank of New York Mellon Trust Company, N.A., as trustee (incorporated by reference to Exhibit 4.3 to the KKR & Co. L.P. Quarterly Report on Form 10-Q filed on August 7, 2014).
|
|
4.14
|
|
|
Form of 5.125% Senior Note due 2044 (included in Exhibit 4.2 to the KKR & Co. L.P. Current Report on Form 8-K filed on May 29, 2014).
|
|
|
|
|
|
|
4.15
|
|
|
Indenture, dated as of November 15, 2011, between the KKR Financial Holdings LLC and Wilmington Trust, National Association, as Trustee (incorporated by reference to Exhibit 4.1 to the KKR Financial Holdings LLC Current Report on Form 8-K filed on November 15, 2011).
|
276
|
|
|
|
|
|
4.16
|
|
|
Supplemental Indenture, dated as of November 15, 2011, between the KKR Financial Holdings LLC, Wilmington Trust, National Association, as Trustee and Citibank, N.A., Authenticating Agent, Paying Agent and Security Registrar (incorporated by reference to Exhibit 4.2 to the KKR Financial Holdings LLC Current Report on Form 8-K filed on November 15, 2011).
|
|
|
|
|
|
|
4.17
|
|
|
Form of 8.375% Senior Note due November 15, 2041 of KKR Financial Holdings LLC (included in Exhibit 4.2 to the KKR Financial Holdings LLC Current Report on Form 8-K filed on November 15, 2011).
|
|
|
|
|
|
|
4.18
|
|
|
Second Supplemental Indenture, dated as of March 20, 2012, between KKR Financial Holdings LLC, Wilmington Trust, National Association, as Trustee and Citibank, N.A., as Authenticating Agent, Paying Agent and Security Registrar (incorporated by reference to Exhibit 4.2 to the KKR Financial Holdings LLC Current Report on Form 8-K filed on March 20, 2012).
|
|
|
|
|
|
|
4.19
|
|
|
Form of 7.500% Senior Note due March 20, 2042 of KKR Financial Holdings LLC (incorporated by reference to Exhibit 4.2 to the KKR Financial Holdings LLC Current Report on Form 8-K filed on March 20, 2012).
|
|
|
|
|
|
|
4.20
|
|
|
Share Designation of the 7.375% Series A LLC Preferred Shares of KKR Financial Holdings LLC, dated as of January 17, 2013 (incorporated by reference to Exhibit 3.1 to the KKR Financial Holdings LLC Current Report on Form 8-K filed on January 17, 2013).
|
|
|
|
|
|
|
4.21
|
|
|
Registration Rights Agreement, dated as of November 2, 2015, by and among KKR & Co. L.P., MW Group (GP) LTD and the other persons listed on the signature pages thereto (incorporated by reference to Exhibit 4.2 of the Registration Statement on Form S-3 (No. 333-208019) filed on November 13, 2015).
|
|
|
|
|
|
|
10.1
|
|
|
Second Amended and Restated Limited Partnership Agreement of KKR Management Holdings L.P. (incorporated by reference to Exhibit 10.1 of the Registration Statement).
|
|
|
|
|
|
|
10.2
|
|
|
Second Amended and Restated Limited Partnership Agreement of KKR Fund Holdings L.P. (incorporated by reference to Exhibit 10.2 of the Registration Statement).
|
|
|
|
|
|
|
10.3
|
|
|
Amendment to Second Amended and Restated Limited Partnership Agreement of KKR Fund Holdings L.P. dated August 5, 2014 (incorporated by reference to Exhibit 10.3 to the KKR & Co. L.P. Quarterly Report on Form 10-Q filed on August 7, 2014).
|
|
|
|
|
|
|
10.4
|
|
|
Amended and Restated Limited Partnership Agreement of KKR International Holdings L.P., dated August 5, 2014 (incorporated by reference to Exhibit 10.1 to the KKR & Co. L.P. Quarterly Report on Form 10-Q filed on August 7, 2014).
|
|
|
|
|
|
|
10.5
|
|
|
Registration Rights Agreement dated July 14, 2010, by and among KKR & Co. L.P., KKR Holdings L.P. and the persons from time to time party thereto (incorporated by reference to Exhibit 10.2 to the KKR & Co. L.P. Current Report on Form 8-K filed on July 20, 2010).
|
|
|
|
|
|
|
10.6
|
|
*
|
Form of KKR & Co. L.P. 2010 Equity Incentive Plan (incorporated by reference to Exhibit 10.4 to Amendment No. 3 to the Registration Statement filed on June 3, 2010).
|
|
|
|
|
|
|
10.7
|
|
|
Tax Receivable Agreement (incorporated by reference to Exhibit 10.3 to the KKR & Co. L.P. Current Report on Form 8-K filed on July 20, 2010).
|
|
|
|
|
|
|
10.8
|
|
|
Amended and Restated Exchange Agreement (incorporated by reference to Exhibit 10.1 to the KKR & Co. L.P. Current Report on Form 8-K filed on November 3, 2010).
|
277
|
10.9
|
|
|
Amendment and Joinder Agreement to Exchange Agreement, dated as of August 5, 2014 among KKR Management Holdings L.P., KKR Fund Holdings L.P., KKR Holdings L.P., KKR & Co. L.P., KKR Group Holdings L.P., KKR Subsidiary Partnership L.P., KKR Group Limited, and KKR International Holdings L.P. (incorporated by reference to Exhibit 10.2 to the KKR & Co. L.P. Quarterly Report on Form 10-Q filed on August 7, 2014).
|
|
|
|
|
|
|
10.10
|
|
|
Credit Agreement, dated as of October 22, 2014, among Kohlberg Kravis Roberts & Co. L.P., KKR Fund Holdings L.P., KKR Management Holdings L.P. and KKR International Holdings L.P., the other borrowers from time to time party thereto, the guarantors from time to time party thereto, the lending institutions from time to time party thereto and HSBC Bank USA, National Association, as Administrative Agent. (incorporated by reference to Exhibit 10.1 to the KKR & Co. L.P. Current Report on Form 8-K filed October 24, 2014).
|
|
|
|
|
|
|
10.11
|
|
|
Amendment No. 1 to Credit Agreement, dated as of August 18, 2015 by and among Kohlberg Kravis Roberts & Co. L.P. and HSBC Bank USA, National Association (incorporated by reference to Exhibit 10.1 to the KKR & Co. L.P. Quarterly Report on Form 10-Q filed November 5, 2015).
|
|
|
|
|
|
|
10.12
|
|
*
|
Form of Confidentiality and Restrictive Covenant Agreement (Senior Principals) (incorporated by reference to Exhibit 10.9 of the Registration Statement).
|
|
|
|
|
|
|
10.13
|
|
*
|
Form of Confidentiality and Restrictive Covenant Agreement (Founders) (incorporated by reference to Exhibit 10.10 of the Registration Statement).
|
|
|
|
|
|
|
10.14
|
|
*
|
Form of Indemnification Agreement by and among each member of the Board of Directors of KKR Management LLC, KKR Management LLC and KKR & Co. L.P. (incorporated by reference to Exhibit 10.4 to the KKR & Co. L.P. Current Report on Form 8-K filed on July 20, 2010).
|
|
|
|
|
|
|
10.15
|
|
*
|
Independent Director Compensation Program (incorporated by reference to Exhibit 10.15 of the KKR & Co. L.P. Annual Report on Form 10-K filed on March 7, 2011).
|
|
|
|
|
|
|
10.16
|
|
*
|
Form of Grant Certificate (incorporated by reference to Exhibit 10.3 to the KKR & Co. L.P. Quarterly Report on Form 10-Q filed on May 5, 2011).
|
|
|
|
|
|
|
10.17
|
|
*
|
Form of Public Company Equity Unit Award Agreement of KKR & Co. L.P. (Directors) (incorporated by reference to Exhibit 10.1 of the KKR & Co. L.P. Quarterly Report on Form 10-Q filed on August 3, 2012).
|
|
|
|
|
|
|
10.18
|
|
*
|
Form of Public Company Holdings Unit Award Agreement of KKR & Co. L.P. (Executive Officers) (incorporated by reference to Exhibit 10.1 of the KKR & Co. L.P. Annual Report on Form 10-K filed on February 27, 2015).
|
|
|
|
|
|
|
10.19
|
|
*
|
Form of Public Company Holdings Unit Award Agreement of KKR & Co. L.P. (Executive Officers).
|
|
|
|
|
|
|
10.20
|
|
*
|
Form of Grant Certificate (Executive Officers).
|
|
10.21
|
|
**
|
KKR Financial Holdings LLC 2007 Share Incentive Plan (incorporated by reference to Exhibit 10.2 to the KKR Financial Holdings LLC Current Report on Form 8-K filed on May 4, 2007).
|
|
|
|
|
|
|
10.22
|
|
**
|
KKR Financial Holdings LLC Non-Employee Directors' Deferred Compensation and Share Award Plan (incorporated by reference to Exhibit 10.3 to the KKR Financial Holdings LLC Current Report on Form 8-K filed on May 4, 2007).
|
|
|
|
|
|
|
10.23
|
|
|
Development Agreement, dated as of October 28, 2015, by and between ERY Developer LLC and KKR HY LLC.
|
|
|
|
|
|
278
|
21.1
|
|
|
Subsidiaries of the Registrant
|
|
|
|
|
|
|
23.1
|
|
|
Consent of Independent Registered Public Accounting Firm Relating to the Financial Statements of KKR & Co. L.P.
|
|
|
|
|
|
|
31.1
|
|
|
Certification of Co-Chief Executive Officer pursuant to Rule 13a-14(a) and Rule 15d-14(a) of the Securities Exchange Act of 1934, as amended, as adopted pursuant to Section 302 of the Sarbanes-Oxley Act of 2002.
|
|
|
|
|
|
|
31.2
|
|
|
Certification of Co-Chief Executive Officer pursuant to Rule 13a-14(a) and Rule 15d-14(a) of the Securities Exchange Act of 1934, as amended, as adopted pursuant to Section 302 of the Sarbanes-Oxley Act of 2002.
|
|
31.3
|
|
|
Certification of Chief Financial Officer pursuant to Rule 13a-14(a) and Rule 15d-14(a) of the Securities Exchange Act of 1934, as amended, as adopted pursuant to Section 302 of the Sarbanes-Oxley Act of 2002
|
|
|
|
|
|
|
32.1
|
|
|
Certification of Co-Chief Executive Officer pursuant to 18 U.S.C. Section 1350, as adopted pursuant to Section 906 of the Sarbanes-Oxley Act of 2002.
|
|
|
|
|
|
|
32.2
|
|
|
Certification of Co-Chief Executive Officer pursuant to 18 U.S.C. Section 1350, as adopted pursuant to Section 906 of the Sarbanes-Oxley Act of 2002.
|
|
|
|
|
|
|
32.3
|
|
|
Certification of Chief Financial Officer pursuant to 18 U.S.C. Section 1350, as adopted pursuant to Section 906 of the Sarbanes-Oxley Act of 2002.
|
|
|
|
|
|
|
101
|
|
|
Interactive data files pursuant to Rule 405 of Regulation S-T: (i) the Consolidated Statements of Financial Condition as of December 31, 2015 and December 31, 2014, (ii) the Consolidated Statements of Operations for the years ended December 31, 2015, 2014 and 2013, (iii) the Consolidated Statements of Comprehensive Income (Loss) for the years ended December 31, 2015, 2014 and 2013, (iv) the Consolidated Statements of Changes in Equity for the years ended December 31, 2015, 2014 and 2013 (v) the Consolidated Statements of Cash Flows for the years ended December 31, 2015, 2014 and 2013, and (vi) the Notes to the Consolidated Financial Statements.
|
* Management contract or compensatory plan in which directors and/or executive officers are eligible to participate.
** Management contract or compensatory plan in which directors and/or executive officers of KKR Financial Holdings LLC are eligible to participate.
The agreements and other documents filed as exhibits to this report are not intended to provide factual information or other disclosure other than with respect to the terms of the agreements or other documents themselves, and you should not rely on them for that purpose. In particular, any representations and warranties made by us in these agreements or other documents were made solely within the specific context of the relevant agreement or document and may not describe the actual state of affairs as of the date they were made or at any other time.
279
TABLE OF CONTENTS
Part IItem 1. BusinessItem 1A. Risk FactorsItem 1B. Unresolved Staff CommentsItem 2. PropertiesItem 3. Legal ProceedingsItem 4. Mine Safety DisclosuresPart IIItem 5. Market For Registrant's Common Equity, Related Stockholder Matters and Issuer Purchases Of Equity SecuritiesItem 6. Selected Financial DataItem 7. Management S Discussion and Analysis Of Financial Condition and Results Of OperationsItem 7A. Quantitative and Qualitative Disclosures About Market RiskItem 8. Financial Statements and Supplementary DataItem 9. Changes in and Disagreements with Accountants on Accounting and Financial DisclosureItem 9A. Controls and ProceduresItem 9B. Other InformationPart IIIItem 10. Directors, Executive Officers and Corporate GovernanceItem 11. Executive CompensationItem 12. Security Ownership Of Certain Beneficial Owners and Management and Related Stockholder MattersItem 13. Certain Relationships and Related Transactions, and Director IndependenceItem 14. Principal Accounting Fees and ServicesPart IVItem 15. Exhibits, Financial Statement Schedules