KLA CORP
10-Ks and 10-Qs
|
|
|
|
|
|
|
|
|
|
|
|
|
|
|
|
|
|
|
|
|
|
|
|
|
|
|
|
|
|
|
|
|
|
|
|
|
|
|
|
|
|
|
|
|
|
|
|
|
|
|
|
|
|
|
|
|
|
|
UNITED STATES
SECURITIES AND EXCHANGE COMMISSION
Washington, D.C. 20549
|
FORM 10-K
|
(Mark One)
|
x
|
ANNUAL REPORT PURSUANT TO SECTION 13 OR 15(d) OF THE SECURITIES EXCHANGE ACT OF 1934
|
|
For the Fiscal Year Ended June 30, 2014
|
|
OR
|
o
|
TRANSITION REPORT PURSUANT TO SECTION 13 OR 15(d) OF THE SECURITIES EXCHANGE ACT OF 1934
|
|
For the Transition Period from to
|
|
Commission File Number 000-09992
KLA-TENCOR CORPORATION
(Exact name of registrant as specified in its charter)
|
Delaware
|
|
04-2564110
|
|
(State or other jurisdiction of
incorporation or organization)
|
|
(I.R.S. Employer
Identification Number)
|
|
One Technology Drive, Milpitas, California
|
|
95035
|
|
(Address of Principal Executive Offices)
|
|
(Zip Code)
|
Registrant’s Telephone Number, Including Area Code: (408) 875-3000
Securities Registered Pursuant to Section 12(b) of the Act:
|
Title of Each Class
|
|
Name of Each Exchange on Which Registered
|
|
Common Stock, $0.001 par value per share
|
|
The NASDAQ Global Select Market
|
|
Securities Registered Pursuant to Section 12(g) of the Act:
|
||
|
None
|
||
|
(Title of Class)
|
||
Indicate by check mark if the registrant is a well-known seasoned issuer, as defined in Rule 405 of the Securities Act. Yes
x
No
o
Indicate by check mark if the registrant is not required to file reports pursuant to Section 13 or Section 15(d) of the Act. Yes
o
No
x
Indicate by check mark whether the registrant (1) has filed all reports required to be filed by Section 13 or 15(d) of the Securities Exchange Act of 1934 during the preceding 12 months (or for such shorter period that the registrant was required to file such reports), and (2) has been subject to such filing requirements for the past 90 days. Yes
x
No
o
Indicate by check mark whether the registrant has submitted electronically and posted on its corporate website, if any, every Interactive Data File required to be submitted and posted pursuant to Rule 405 of Regulation S-T (§232.405 of this chapter) during the preceding 12 months (or for such shorter period that the registrant was required to submit and post such files). Yes
x
No
o
Indicate by check mark if disclosure of delinquent filers pursuant to Item 405 of Regulation S-K (§229.405 of this chapter) is not contained herein, and will not be contained, to the best of registrant’s knowledge, in definitive proxy or information statements incorporated by reference in Part III of this Form 10-K or any amendment to this Form 10-K.
x
Indicate by check mark whether the registrant is a large accelerated filer, an accelerated filer, a non-accelerated filer, or a smaller reporting company. See the definitions of “large accelerated filer,” “accelerated filer” and “smaller reporting company” in Rule 12b-2 of the Exchange Act.
|
Large accelerated filer
x
|
|
Accelerated filer
o
|
|
Non-accelerated filer
o
(Do not check if a smaller reporting company)
|
|
Smaller reporting company
o
|
Indicate by check mark whether the registrant is a shell company (as defined in Rule 12b-2 of the Exchange Act). Yes
o
No
x
The aggregate market value of the voting and non-voting common stock held by non-affiliates of the registrant based upon the closing price of the registrant’s stock, as of
December 31, 2013
, was approximately
$10.7 billion
.
The registrant had
165,368,152
shares of common stock outstanding as of
July 17, 2014
.
DOCUMENTS INCORPORATED BY REFERENCE
Portions of the Proxy Statement for the
2014
Annual Meeting of Stockholders to be held on
November 5, 2014
(“Proxy Statement”), and to be filed pursuant to Regulation 14A within 120 days after the registrant’s fiscal year ended
June 30, 2014
, are incorporated by reference into Part III of this report.
INDEX
|
|
|||
|
PART I
|
|||
|
Item 1.
|
|
||
|
Item 1A.
|
|
||
|
Item 1B.
|
|
||
|
Item 2.
|
|
||
|
Item 3.
|
|
||
|
Item 4.
|
|
||
|
PART II
|
|||
|
Item 5.
|
|
||
|
Item 6.
|
|
||
|
Item 7.
|
|
||
|
Item 7A.
|
|
||
|
Item 8.
|
|
||
|
|
|||
|
|
|||
|
|
|||
|
|
|||
|
|
|||
|
|
|||
|
Item 9.
|
|
||
|
Item 9A.
|
|
||
|
Item 9B.
|
|
||
|
PART III
|
|||
|
Item 10.
|
|
||
|
Item 11.
|
|
||
|
Item 12.
|
|
||
|
Item 13.
|
|
||
|
Item 14.
|
|
||
|
PART IV
|
|||
|
Item 15.
|
|
||
|
|
|||
|
|
|||
|
|
|||
i
SPECIAL NOTE REGARDING FORWARD-LOOKING STATEMENTS
This report contains certain forward-looking statements within the meaning of Section 27A of the Securities Act of 1933 and Section 21E of the Securities Exchange Act of 1934. All statements other than statements of historical fact may be forward-looking statements. You can identify these and other forward-looking statements by the use of words such as “may,” “will,” “could,” “would,” “should,” “expects,” “plans,” “anticipates,” “relies,” “believes,” “estimates,” “predicts,” “intends,” “potential,” “continue,” “thinks,” “seeks,” or the negative of such terms, or other comparable terminology. Forward-looking statements also include the assumptions underlying or relating to any of the foregoing statements. Such forward-looking statements include, among others, forecasts of the future results of our operations; orders for our products and capital equipment generally; sales of semiconductors; the allocation of capital spending by our customers (and, in particular, the percentage of spending that our customers allocate to process control); growth of revenue in the semiconductor industry, the semiconductor capital equipment industry and our business; technological trends in the semiconductor industry; future developments or trends in the global capital and financial markets; our future product offerings and product features; the success and market acceptance of new products; timing of shipment of backlog; our future product shipments and product and service revenues; our future gross margins; our future research and development expenses and selling, general and administrative expenses; our ability to successfully maintain cost discipline; international sales and operations; our ability to maintain or improve our existing competitive position; success of our product offerings; creation and funding of programs for research and development; attraction and retention of employees; results of our investment in leading edge technologies; the effects of hedging transactions; the effect of the sale of trade receivables and promissory notes from customers; our future income tax rate; future payments of dividends to our stockholders; the completion of any acquisitions of third parties, or the technology or assets thereof; benefits received from any acquisitions and development of acquired technologies; sufficiency of our existing cash balance, investments and cash generated from operations to meet our operating and working capital requirements; future changes in, and our future compliance with legal requirements; and the adoption and impact of new accounting pronouncements.
Our actual results may differ significantly from those projected in the forward-looking statements in this report. Factors that might cause or contribute to such differences include, but are not limited to, those discussed in Item 1A, “Risk Factors” in this Annual Report on Form 10-K, as well as in Item 1, “Business” and Item 7, “Management’s Discussion and Analysis of Financial Condition and Results of Operations” in this report. You should carefully review these risks and also review the risks described in other documents we file from time to time with the Securities and Exchange Commission, including the Quarterly Reports on Form 10-Q that we will file in the fiscal year ending
June 30, 2015
. You are cautioned not to place undue reliance on these forward-looking statements, and we expressly assume no obligation and do not intend to update the forward-looking statements in this report after the date hereof.
ii
|
ITEM 1.
|
BUSINESS
|
The Company
KLA-Tencor Corporation (“KLA-Tencor” or the “Company” and also referred to as “we” or “our”) is a leading supplier of process control and yield management solutions for the semiconductor and related nanoelectronics industries. Our products are also used in a number of other high technology industries, including the light emitting diode (“LED”) and data storage industries, as well as general materials research.
Within our primary area of focus, our comprehensive portfolio of defect inspection and metrology products, and related service, software and other offerings, helps integrated circuit (“IC” or “chip”) manufacturers manage yield throughout the entire semiconductor fabrication process—from research and development to final volume production. These products and solutions are designed to help customers accelerate their development and production ramp cycles, to achieve higher and more stable semiconductor die yields, and to improve overall profitability.
KLA-Tencor’s products and services are used by the vast majority of bare wafer, IC, lithography reticle (“reticle” or “mask”) and disk manufacturers around the world. These customers turn to us for inline wafer and IC defect monitoring, review and classification; reticle defect inspection and metrology; packaging and interconnect inspection; critical dimension (“CD”) metrology; pattern overlay metrology; film thickness, surface topography and composition measurements; measurement of in-chamber process conditions, wafer shape and stress metrology; computational lithography tools; and overall yield and fab-wide data management and analysis systems. Our advanced products, coupled with our unique yield management services, allow us to deliver the solutions our customers need to accelerate their yield learning rates and significantly reduce their risks and costs.
Certain industry and technical terms used in this section are defined in the subsection entitled “Glossary” found at the end of this Item 1.
KLA-Tencor was formed in April 1997 through the merger of KLA Instruments Corporation and Tencor Instruments, two long-time leaders in the semiconductor equipment industry that originally began operations in 1975 and 1976, respectively.
Additional information about KLA-Tencor is available on our website at www.kla-tencor.com. Our Annual Report on Form 10-K, our Quarterly Reports on Form 10-Q, Current Reports on Form 8-K and amendments to those reports filed or furnished pursuant to Section 13(a) or 15(d) of the Securities Exchange Act of 1934, as amended, are available free of charge on our website as soon as reasonably practicable after we electronically file them with or furnish them to the Securities and Exchange Commission (“SEC”). Information contained on our website is not part of this Annual Report on Form 10-K or our other filings with the SEC. Additionally, these filings may be obtained through the SEC’s website (www.sec.gov), which contains reports, proxy and information statements, and other information regarding issuers that file electronically. Documents that are not available through the SEC’s website may also be obtained by mailing a request to the U.S. Securities and Exchange Commission, Office of FOIA/PA Operations, 100 F Street N.E., Mail Stop 2736, Washington, DC 20549, by submitting an online request to the SEC at www.sec.gov or by sending a fax to the SEC at 1-202-772-9337.
Industry
General Background
The semiconductor industry is KLA-Tencor’s core focus. The semiconductor fabrication process begins with a bare silicon wafer—a round disk that is typically 150 millimeters, 200 millimeters or 300 millimeters in diameter, about as thick as a credit card and gray in color. The process of manufacturing wafers is in itself highly sophisticated, involving the creation of large ingots of silicon by pulling them out of a vat of molten silicon. The ingots are then sliced into wafers. Prime silicon wafers are then polished to a mirror finish. Other, more specialized wafers, such as epitaxial silicon (“epi”), silicon-on-insulator (“SOI”), gallium nitride (“GaN”) and silicon carbide (“SiC”), are also common in the semiconductor industry.
1
The manufacturing cycle of an IC is grouped into three phases: design, fabrication and testing. IC design involves the architectural layout of the circuit, as well as design verification and reticle generation. The fabrication of a chip is accomplished by depositing a series of film layers that act as conductors, semiconductors or insulators on bare wafers. The deposition of these film layers is interspersed with numerous other process steps that create circuit patterns, remove portions of the film layers, and perform other functions such as heat treatment, measurement and inspection. Most advanced chip designs require hundreds of individual steps, many of which are performed multiple times. Most chips consist of two main structures: the lower structure, typically consisting of transistors or capacitors which perform the “smart” functions of the chip; and the upper “interconnect” structure, typically consisting of circuitry which connects the components in the lower structure. When all of the layers on the wafer have been fabricated, each chip on the wafer is tested for functionality. The wafer is then cut into individual devices, and those chips that passed functional testing are packaged. Final testing is performed on all packaged chips.
Current Trends
The rapid growth of consumer demand for mobile devices, including smartphones, tablets and wearable devices, is currently driving the electronics industry and, as a result, the semiconductor industry as well. Contained within each of these latest consumer devices are advanced semiconductors that are helping enable the features consumers want in device performance, such as smaller product form factors, lower power requirements, bigger and brighter screens and speed, at a lower cost. Alongside this market growth, the industry continues to witness a high rate of change in technology, with the emergence of new techniques and architectures in production today, such as three-dimensional (
“
3-D
”
) transistors, advanced patterning lithography and semiconductors with critical dimensions at 28 nanometer and below. KLA-Tencor's inspection and measurement technologies play a key role in enabling the success of our customers' advanced semiconductor manufacturing processes.
Companies that anticipate future market demands by developing and refining new technologies and manufacturing processes are better positioned to lead in the semiconductor market. Accelerating the yield ramp and maximizing production yields of high-performance devices are key goals of modern semiconductor manufacturing. Ramping to high-volume production ahead of competitors can dramatically increase the revenue an IC manufacturer realizes for a given product. During past industry cycles, semiconductor manufacturers generally contended with a few key new technologies or market trends, such as a specific design rule shrink. In today’s market, driven by consumer demand for low-cost electronic goods, the leading semiconductor manufacturers are investing in simultaneous production integration of multiple new process technologies, some requiring new substrate and film materials, new geometries and advanced lithography techniques.
While many of these technologies have been adopted at the development and pilot production stages of chip manufacturing, significant challenges and risks associated with each technology have affected their adoption into full-volume production. For example, as design rules decrease, yields become more sensitive to the size and density of defects, while device performance characteristics (namely speed, capacity or power management) become more sensitive to parameters such as line width and film thickness variation. New process materials, such as high-k dielectrics, SOI wafers and immersion lithography-capable photoresists, require extensive characterization before they can be used in the manufacturing process. Moving several of these advanced technologies into production at once only adds to the risks that chipmakers face.
The continuing evolution of semiconductor devices to smaller geometries and more complex multi-level circuitry has significantly increased the performance and cost requirements of the capital equipment used to manufacture these devices. Construction of an advanced wafer fabrication facility today can cost over $5 billion, substantially more than previous-generation facilities. In addition, chipmakers are demanding increased productivity and higher returns from their manufacturing equipment and are also seeking ways to extend the performance of their existing equipment.
By developing new process control and yield management tools that help chipmakers accelerate the adoption of these new technologies into volume production, we enable our customers to better leverage these increasingly expensive facilities and significantly improve their return on investment (“ROI”). Once customers’ production lines are operating at high volume, our tools help ensure that yields are stable and process excursions are identified for quick resolution. In addition, the move to each new generation’s smaller design rules, coupled with new materials and device innovation, has increased in-process variability, which requires an increase in inspection and metrology sampling.
2
KLA-Tencor systems not only analyze defectivity and metrology issues at critical points in the wafer, reticle and IC manufacturing processes, but also provide information to our customers so that they can identify and address the underlying process problems. The ability to locate the source of defects and resolve the underlying process issues enables our customers to improve control over their manufacturing processes. This helps them increase their yield of high-performance parts and deliver their products to market faster—thus maximizing their profit. With our broad portfolio of application-focused technologies and our dedicated yield technology expertise, we are in position to be a key supplier of comprehensive yield management solutions for customers’ next-generation products, helping our customers respond to the challenges posed by shrinking device sizes, the transition to new production materials, new device and circuit architecture, more demanding lithography processes, and new back-end packaging techniques.
Products
KLA-Tencor is engaged primarily in the design, manufacture and marketing of process control and yield management solutions for the semiconductor and related nanoelectronics industries and provides a comprehensive portfolio of defect inspection and metrology products, and related service, software and other offerings.
KLA-Tencor’s defect inspection and metrology products and related offerings can be broadly categorized into the following groups: Chip Manufacturing, Wafer Manufacturing, Reticle Manufacturing, LED and Compound Semiconductor Manufacturing, Data Storage Media/Head Manufacturing, Microelectromechanical Systems (“MEMS”) Manufacturing, and General Purpose/Lab Applications. The more significant of these products are included in the product table at the end of this “Products” section. Every year, we introduce a number of new products; some of the new products we introduced in the fiscal year ended
June 30, 2014
are described below. We also provide refurbished KLA-Tencor tools as part of our K-T Certified
TM
program for customers manufacturing larger design-rule devices, as well as comprehensive service and support for our products.
Chip Manufacturing
KLA-Tencor’s comprehensive portfolio of defect inspection and metrology products, and related service, software and other offerings, helps chip manufacturers manage yield throughout the entire semiconductor fabrication process—from research and development to final volume production. These products and solutions are designed to help customers accelerate their development and production ramp cycles, to achieve higher and more stable semiconductor die yields, and to improve overall profitability.
Front-End Defect Inspection
KLA-Tencor’s front-end defect inspection tools cover a broad range of yield applications within the IC manufacturing environment, including: research and development; incoming wafer qualification; reticle qualification; and tool, process and line monitoring. Patterned and unpatterned wafer inspectors find particles, pattern defects and electrical issues on the front surface, back surface and edge of the wafer, allowing engineers to detect and monitor critical yield excursions. Fabs rely on our high sensitivity reticle inspection systems to identify defects in reticles at an early stage, to prevent reticle defects from printing on production wafers. The defect data generated by our inspectors is compiled and reduced to relevant root-cause and yield-analysis information with our suite of data management tools. By implementing our front-end defect inspection and analysis systems, chipmakers are able to take quick corrective action, resulting in faster yield improvement and better time to market.
During the fiscal year ended
June 30, 2014
, we launched several front-end defect inspection products that help accelerate yield for next-generation design node devices. In July 2013, we launched the 2910 Series broadband plasma patterned wafer inspection systems that are used to discover and monitor defects to support advanced IC development and ramp. This was followed in May 2014 with our launch of the Teron
TM
SL650, a reticle inspection system that utilizes 193nm illumination and multiple STAR
light
TM
technologies to assess incoming reticle quality, monitor reticle degradation and detect yield-critical reticle defects.
3
The products that we launched during the fiscal year ended
June 30, 2014
further strengthened our broad range of offerings that support the front-end defect inspection market. In the field of patterned wafer inspection, we offer our 2910 Series, 2900 Series, 2830 Series, 2820 Series and 2810 Series systems (for broadband plasma defect inspection); our Puma
TM
9650 Series and Puma 9500 Series systems (for laser scanning defect inspection); our eS805
TM
Series and eS800 Series systems (for electron-beam defect inspection); our 8900 system (for macro defect inspection); and our CIRCL
TM
cluster tool (for macro defect inspection and review of all wafer surfaces - front side, edge and back side). In the field of unpatterned wafer and surface inspection, we offer the Surfscan
®
SP3 Series (wafer defect inspection systems for process tool qualification and monitoring using blanket films and bare wafers); and the SURFmonitor
TM
(integrated on the Surfscan SP3 Series), which enables surface quality measurements and capture of low-contrast defects. For reticle inspection, we offer our X5.2
TM
and Teron SL650 Series products, which are photomask inspection systems that allow IC fabs to qualify incoming reticles and inspect production reticles for contaminants and other process-related changes. In addition, we offer a number of other products for the front-end defect inspection market, as reflected in the product table at the conclusion of this “Products” section.
Back-End Defect Inspection
KLA-Tencor offers standalone inspection systems for various applications in the field of semiconductor packaging (i.e., at the back-end of the semiconductor manufacturing process). Our Component Inspector (“CI”) products inspect various semiconductor components that are handled in a tray, such as microprocessors or memory chips. Component inspection capability includes 3-D coplanarity inspection, measurement of the evenness of the contacts and two-dimensional surface inspection. In October 2013, we introduced the ICOS
®
T640, which provides automated, optical inspection of back-end ICs. It offers dual tapers for fast output and scalability to support a wide range of packages and sizes.
Defect Review
KLA-Tencor’s defect review systems capture high resolution images of the defects detected by inspection tools. These images enable defect classification, helping chipmakers to identify and resolve yield issues. KLA-Tencor’s suite of defect inspectors, defect review and classification tools and data management systems form a broad solution for finding, identifying and tracking yield-critical defects and process issues. In July 2013, we introduced the eDR
TM
-7100, an electron-beam wafer defect review and classification system that utilizes a fourth-generation immersion column and an advanced stage to quickly and accurately re-locate, image and classify yield-critical defects.
Metrology
KLA-Tencor’s array of metrology solutions addresses IC, substrate and medical device manufacturing, as well as scientific research and other applications. Precise metrology and control of pattern dimensions, film thicknesses, layer-to-layer alignment, pattern placement, surface topography and electro-optical properties are important in many industries as critical dimensions narrow, film thicknesses shrink to countable numbers of atomic layers and devices become more complex.
KLA-Tencor offers a broad range of systems that support the metrology market. The Archer
TM
Series of overlay metrology tools enable characterization of overlay error on lithography process layers for advanced patterning technologies. The SpectraShape
TM
family of optical CD and shape metrology systems fully characterize and monitor the critical dimensions and 3-D shapes of geometrically complex features incorporated by some IC manufacturers in their latest generation devices. Finally, the Aleris
TM
family of film metrology tools provides reliable and precise measurement of film thickness, refractive index, stress and composition for a broad range of film layers. In addition, we offer a number of other products for the metrology market, as reflected in the product table at the conclusion of this “Products” section.
In-Situ Process Monitoring
KLA-Tencor’s SensArray
®
SensorWafers are a portfolio of advanced wireless and wired temperature monitoring wafers that capture the effect of the process environment on production wafers. These SensorWafers provide unique insight into thermal uniformity and profile temperature under real production conditions. SensArray products are used in many semiconductor and flat panel display fabrication processes, including lithography, etch and deposition. In August 2013, we introduced the SensArray HighTemp-350XP which provides in-situ wireless wafer temperature measurements for elevated temperature IC processes.
Lithography Modeling
KLA-Tencor’s PROLITH
TM
product line provides researchers at advanced IC manufacturers, lithography hardware suppliers, track companies and material providers with virtual lithography software to explore critical-feature designs, manufacturability and process-limited yield of proposed lithographic technologies without the time and expense of printing hundreds of test wafers using experimental materials and prototype process equipment.
4
In December 2013, we introduced PROLITH X5, which provides simulation capability for all lithography technologies with particular emphasis on 193nm immersion lithography, spacer-based Self-Aligned Double Patterning ("SADP") and thick resist lithography for 3-D interconnects and MEMS manufacturing.
Wafer Manufacturing
KLA-Tencor’s portfolio of products focused on the demands of wafer manufacturers includes inspection, metrology and data management systems. Specialized inspection tools assess surface quality and detect, count and bin defects during the wafer manufacturing process and as a critical part of outgoing inspection. Wafer geometry tools ensure that the wafer is extremely flat and uniform in thickness, with precisely controlled surface topography. Specifications for wafer defectivity, geometry and surface quality are tightening as the dimensions of transistors become so small that the geometry of the substrate can substantially affect transistor performance.
Our wafer inspection portfolio is anchored by the Surfscan SP3 Series defect inspection systems designed to enable development and production monitoring of polished wafers, epi wafers and engineered substrates. The SURFmonitor module characterizes wafer surface quality and captures the low-contrast defects. The WaferSight
TM
platform offers bare wafer geometry and nanotopography metrology capabilities. Other products that we offer for the wafer manufacturing market are highlighted in the product table at the conclusion of this “Products” section.
Reticle Manufacturing
Error-free reticles, or masks, are necessary to achieving high semiconductor device yields, since reticle defects can be replicated in every die on production wafers. KLA-Tencor offers high sensitivity reticle inspection and metrology systems for mask shops, designed to help them manufacture reticles that are free of pattern defects that could print on the wafers and meet pattern placement and critical dimension uniformity specifications.
Our reticle inspection portfolio includes the Teron 600 Series for development and manufacturing of advanced optical and extreme ultraviolet ("EUV") masks, the TeraScan
TM
500XR system for mask shop production of reticles for the 32nm node and above and our X5.2 and Teron SL650 products for reticle quality control capability for IC fabs. These products include the capability for mapping critical dimension uniformity across the reticle. In addition, we offer the LMS IPRO line of reticle metrology systems for measuring pattern placement error. If the pattern on the reticle is displaced from its intended location, overlay error can result on the wafer, which can lead to electrical continuity issues affecting yield, performance or reliability of the IC device.
LED and Compound Semiconductor Manufacturing
LEDs are becoming more commonly used in solid-state lighting, television and notebook backlighting, and automotive applications. As LED device makers target aggressive cost and performance targets, they place significant emphasis on improved process control and yield during the manufacturing process.
KLA-Tencor offers a portfolio of three systems to help LED manufacturers reduce production costs and increase product output: Candela
®
8620, Klarity
®
LED and WI-2280. The Candela 8620 substrate and epi wafer inspection system provides automated inspection and quality control of LED substrates, detecting defects that can impact device performance, yield and field reliability. Klarity LED is an automated defect data management and analysis system for LED yield enhancement. The WI-2280 system is a patterned wafer inspection tool that is designed specifically for defect inspection and two-dimensional metrology for LED applications.
Our primary products for compound semiconductor manufacturing include Candela CS20 and the P-Series Stylus Profiler, used for the inspection of substrates, epi-layers and process films. In addition, the Candela CS920, introduced in March 2014, is used by power device manufacturers for defect inspection and classification on SiC substrate and epi wafers.
5
Data Storage Media/Head Manufacturing
Advancements in data storage are being driven by a wave of innovative consumer electronics with small form factors and immense storage capacities, as well as an increasing need for high-volume storage options to back up modern methods of remote computing and networking (such as cloud computing). Our process control and yield management solutions are designed to enable customers to rapidly understand and resolve complex manufacturing problems, which can help improve time to market and product yields. In the front-end and back-end of thin-film head wafer manufacturing, we offer the same process control equipment that we serve to the semiconductor industry. In addition, we offer an extensive range of test equipment and surface profilers with particular strength in photolithography. In substrate and media manufacturing, we offer metrology and defect inspection solutions with KLA-Tencor’s optical surface analyzers.
MEMS Manufacturing
The increasing demand for MEMS technology is coming from diverse industries such as automotive, space and consumer electronics. MEMS have the potential to revolutionize nearly every product category by bringing together silicon-based microelectronics with micromachining technology, making possible the realization of complete systems-on-a-chip. KLA-Tencor offers tools and techniques for this emerging market, such as defect inspection and review, optical inspection and surface profiling, which were first developed for the integrated circuit industry.
General Purpose/Lab Applications
A range of industries, including general scientific and materials research and optoelectronics, require measurements of surface topography to either control their processes or research new material characteristics. Typical measurement parameters that our tools address include flatness, roughness, curvature, peak-to-valley, asperity, waviness, texture, volume, sphericity, slope, density, stress, bearing ratio and distance (mainly in the micron to nanometer range). In November 2013, we introduced the MicroXAM-800 optical interferometer designed for 3-D measurement of surface topography across a broad range of research and development ("R&D") and production applications.
K-T Certified
K-T Certified is our certified refurbished tools program that delivers fully refurbished and tested KLA-Tencor tools to our customers with guaranteed performance. In addition to high-quality pre-owned 300mm and sub-200mm tools for the integrated circuit, reticle, substrate, MEMS and data storage markets, K-T Certified also offers system software and hardware performance upgrades to extend the capabilities of existing equipment. When a customer needs to move to the next manufacturing node, K-T Certified can help maximize the value of the customer's existing assets through K-T Certified's repurchase, trade-in and redeployment services.
K-T Services
Our K-T Services program enables our customers in all business sectors to maintain the high performance and productivity of our products through a flexible portfolio of services. Whether a manufacturing site is producing integrated circuits, wafers or reticles, K-T Services delivers yield management expertise spanning advanced technology nodes, including collaboration with customers to determine the best products and services to meet technology requirements and optimize cost of ownership. Our comprehensive services include: proactive management of tools to identify and improve performance; expertise in optics, image processing and motion control with worldwide service engineers, technical support teams and knowledge management systems; and an extensive parts network to ensure worldwide availability of parts.
6
Product Table
The following table presents a representative list of the products that we offered during the course of the fiscal year ended
June 30, 2014
:
|
MARKETS
|
APPLICATIONS
|
PRODUCTS
|
|
Chip Manufacturing
|
|
|
|
Front-End Defect Inspection
|
Patterned Wafer
|
2910 Series, 2900 Series, 2830 Series, 2820 Series, 2810 Series
Puma
TM
9650, Puma 9500 Series,
eS805
TM
Series, eS800 Series
|
|
Macro and Edge
|
CIRCL
TM
with LDS-3400, CV310i, BDR300
TM
and INS modules
8900
|
|
|
Unpatterned Wafer/Surface
|
Surfscan
®
SP3 Series
SURFmonitor
TM
|
|
|
Reticle
|
X5.2
TM
Teron
TM
SL650
|
|
|
Data Management
|
Klarity
®
product family
|
|
|
Back-End Defect Inspection
|
Component Inspection
|
ICOS
®
CI product family
|
|
Defect Review
|
Electron-beam
|
eDR
TM
-7100 Series, eDR-7000 Series
|
|
Metrology
|
Overlay
|
Archer
TM
Series
|
|
Optical CD and Shape
|
SpectraShape
TM
product family
|
|
|
Film Thickness/Index
|
Aleris
TM
product family
|
|
|
Wafer Geometry and Topography
|
WaferSight
TM
Series
SURFmonitor
|
|
|
Ion Implant and Anneal
|
Therma-Probe
®
|
|
|
Surface Metrology
|
HRP
®
-350
P-Series product family
|
|
|
Resistivity
|
RS product family
|
|
|
Data Management
|
K-T Analyzer
®
|
|
|
In-Situ Process Monitoring
|
Lithography
|
SensArray
®
product family
|
|
Plasma Etch
|
SensArray product family
|
|
|
Implant and Wet
|
SensArray PlasmaSuite
|
|
|
Lithography Modeling
|
Virtual Lithography Software
|
PROLITH
TM
and related product families
|
7
|
MARKETS AND APPLICATIONS
|
PRODUCTS
|
|
Wafer Manufacturing
|
|
|
Surface and Defect Inspection
|
Surfscan
SP3 Series
SURFmonitor
|
|
Wafer Geometry and Nanotopography Metrology
|
WaferSight Series
SURFmonitor
|
|
Data Management
|
FabVision
TM
|
|
Reticle Manufacturing
|
|
|
Defect Inspection
|
TeraScan
TM
XR
Teron
600
Series
|
|
Pattern Placement Metrology
|
LMS IPRO Series
|
|
LED and Compound Semiconductor Manufacturing
|
|
|
Patterned Wafer Inspection
|
WI product family
|
|
Defect Inspection (substrates and epi wafers)
|
Candela
®
product family
|
|
Surface Metrology
|
P-Series product family
|
|
Data Management
|
Klarity LED
|
|
Data Storage Media/Head Manufacturing
|
|
|
Thin-Film Head Metrology and Inspection
|
Aleris product family
HRP
-250
K-T Analyzer
P-Series product family
|
|
Virtual Lithography
|
PROLITH
|
|
In-Situ Process Monitoring
|
SensArray product family
|
|
Transparent and Metal Substrate Inspection
|
Candela product family
|
|
Yield Management
|
Klarity Defect
|
|
MEMS Manufacturing
|
|
|
Surface Metrology: Stylus Profiling
|
P-Series product family
HRP product family
|
|
Surface Metrology: Optical Profiling
|
MicroXAM Series
|
|
Optical Inspection
|
WI product family
|
|
General Purpose/Lab Applications
|
|
|
Surface Metrology: Stylus Profiling
|
P-Series product family
Alpha-Step
®
product family
HRP product family
|
|
Surface Metrology: Optical Profiling
|
MicroXAM Series
|
|
Process Chamber Conditions
|
SensArray product family
|
The product information shown in the tables above excludes the products that were solely offered through our K-T Certified refurbished tools program.
8
Customers
To support our growing global customer base, we maintain a significant presence throughout Asia, the United States and Europe, staffed with local sales and applications engineers, customer and field service engineers and yield management consultants. We count among our largest customers the leading semiconductor manufacturers in each of these regions.
For the fiscal years ended
June 30, 2014
,
2013
and
2012
, the following customers each accounted for more than 10% of total revenues:
|
Year ended June 30,
|
||||
|
2014
|
2013
|
2012
|
||
|
Intel Corporation
|
Intel Corporation
|
Samsung Electronics Co., Ltd.
|
||
|
Samsung Electronics Co., Ltd.
|
Taiwan Semiconductor Manufacturing Company Limited
|
Taiwan Semiconductor Manufacturing Company Limited
|
||
|
Taiwan Semiconductor Manufacturing Company Limited
|
|
|
||
Our business depends upon the capital expenditures of semiconductor manufacturers, which in turn is driven by the current and anticipated market demand for ICs and products utilizing ICs. We do not consider our business to be seasonal in nature, but it is cyclical with respect to the capital equipment procurement practices of semiconductor manufacturers, and it is impacted by the investment patterns of such manufacturers in different global markets. Downturns in the semiconductor industry or slowdowns in the worldwide economy could have a material adverse effect on our future business and financial results.
Sales, Service and Marketing
Our sales, service and marketing efforts are aimed at building long-term relationships with our customers. We focus on providing a single and comprehensive resource for the full breadth of process control and yield management products and services. Our customers benefit from the simplified planning and coordination, as well as the increased equipment compatibility, that are realized as a result of dealing with a single supplier for multiple products and services. Our revenues are derived primarily from product sales, mostly through our direct sales force.
We believe that the size and location of our field sales, service and applications engineering, and marketing organizations represent a competitive advantage in our served markets. We have direct sales forces in Asia, the United States and Europe. We maintain an export compliance program that is designed to meet the requirements of the United States Departments of Commerce and State.
As of
June 30, 2014
, we employed approximately 2,411 sales and related personnel, service engineers and applications engineers. In addition to sales and service offices in the United States, we conduct sales, marketing and services out of wholly-owned subsidiaries or branches in other countries, including Belgium, China, France, Germany, Hong Kong, India, Israel, Italy, Japan, Singapore, South Korea, Taiwan and the United Kingdom. International revenues accounted for approximately
76%
,
70%
and
79%
of our total revenues in the fiscal years ended
June 30, 2014
,
2013
and
2012
, respectively. Additional information regarding our revenues from foreign operations for our last three fiscal years can be found in Note 17, “Segment Reporting and Geographic Information” to the Consolidated Financial Statements.
We believe that sales outside the United States will continue to be a significant percentage of our total revenues. Our future performance will depend, in part, on our ability to continue to compete successfully in Asia, one of the largest markets for our equipment. Our ability to compete in this area is dependent upon the continuation of favorable trading relationships between countries in the region and the United States, and our continuing ability to maintain satisfactory relationships with leading semiconductor companies in the region.
9
International sales and operations may be adversely affected by the imposition of governmental controls, restrictions on export technology, political instability, trade restrictions, changes in tariffs and the difficulties associated with staffing and managing international operations. In addition, international sales may be adversely affected by the economic conditions in each country and by fluctuations in currency exchange rates, and such fluctuations may negatively impact our ability to compete on price with local providers or the value of revenues we generate from our international business. Although we attempt to manage some of the currency risk inherent in non-U.S. dollar product sales through hedging activities, there can be no assurance that such efforts will be adequate. These factors, as well as any of the other risk factors related to our international business and operations that are described in Item 1A, “Risk Factors,” could have a material adverse effect on our future business and financial results.
Backlog
Our shipment backlog for systems and associated warranty totaled $977 million and $817 million as of
June 30, 2014
and
2013
, respectively, and primarily consists of sales orders where written customer requests have been received and the delivery is anticipated within the next 12 months. Orders for service contracts and unreleased products are excluded from shipment backlog. All orders are subject to cancellation or delay by the customer, often with limited or no penalties. We make adjustments for shipment backlog obtained from acquired companies, sales order cancellations, customer delivery date changes and currency adjustments. Shipment backlog is not subject to normal accounting controls for information that is either reported in or derived from our basic financial statements. In addition, the concept of shipment backlog is not defined in the accounting literature, making comparisons between periods and with other companies difficult and potentially misleading.
Our revenue backlog, which includes the gross value of sales orders where physical deliveries have been completed, but for which revenue has not been recognized pursuant to our policy for revenue recognition, totaled $269 million and $271 million as of
June 30, 2014
and
2013
, respectively. Orders for service contracts are excluded from revenue backlog.
Because customers can potentially change delivery schedules or delay or cancel orders, and because some orders are received and shipped within the same quarter, our shipment backlog at any particular date is not necessarily indicative of business volumes or actual sales for any succeeding periods. The cyclicality of the semiconductor industry combined with the lead times from our suppliers sometimes result in timing disparities between, on the one hand, our ability to manufacture, deliver and install products and, on the other, the requirements of our customers. In our efforts to balance the requirements of our customers with the availability of resources, management of our operating model and other factors, we often must exercise discretion and judgment as to the timing and prioritization of manufacturing, deliveries and installations of products, which may impact the timing of revenue recognition with respect to such products.
Research and Development
The market for yield management and process monitoring systems is characterized by rapid technological development and product innovation. These technical innovations are inherently complex and require long development cycles and appropriate professional staffing. We believe that continued and timely development of new products and enhancements to existing products are necessary to maintain our competitive position. Accordingly, we devote a significant portion of our human and financial resources to research and development programs and seek to maintain close relationships with customers to remain responsive to their needs. In addition, we may enter into certain strategic development and engineering programs whereby certain government agencies or other third parties fund a portion of our research and development costs. As of
June 30, 2014
, we employed approximately 1,537 research and development personnel.
Our key research and development activities during the fiscal year ended
June 30, 2014
involved the development of process control and yield management equipment aimed at addressing the challenges posed by shrinking device sizes, the transition to new production materials, new device and circuit architecture, more demanding lithography processes and new back-end packaging techniques. For information regarding our research and development expenses during the last three fiscal years, including costs offset by our strategic development and engineering programs, see Item 7, “Management’s Discussion and Analysis of Financial Condition and Results of Operations” in this Annual Report on Form 10-K.
10
The strength of our competitive positions in many of our existing markets is largely due to our leading technology, which is the result of our continuing significant investments in product research and development. Even during down cycles in the semiconductor industry, we have remained committed to significant engineering efforts toward both product improvement and new product development in order to enhance our competitive position. New product introductions, however, may contribute to fluctuations in operating results, since customers may defer ordering existing products, and, if new products have reliability or quality problems, those problems may result in reduced orders, higher manufacturing costs, delays in acceptance of and payment for new products, and additional service and warranty expenses. There can be no assurance that we will successfully develop and manufacture new products, or that new products introduced by us will be accepted in the marketplace. If we do not successfully introduce new products, our results of operations will be adversely affected.
Manufacturing, Raw Materials and Supplies
We perform system design, assembly and testing in-house and utilize an outsourcing strategy for the manufacture of components and major subassemblies. Our in-house manufacturing activities consist primarily of assembling and testing components and subassemblies that are acquired through third-party vendors and integrating those subassemblies into our finished products. Our principal manufacturing activities take place in the United States (Milpitas, California), Singapore, Israel, Germany and China. As of
June 30, 2014
, we employed approximately 1,010 manufacturing personnel.
Some critical parts, components and subassemblies (collectively, “parts”) that we use are designed by us and manufactured by suppliers in accordance with our specifications, while other parts are standard commercial products. We use numerous vendors to supply parts and raw materials for the manufacture and support of our products. Although we make reasonable efforts to ensure that these parts and raw materials are available from multiple suppliers, this is not always possible, and certain parts and raw materials included in our systems may be obtained only from a single supplier or a limited group of suppliers. Through our business interruption planning, we endeavor to minimize the risk of production interruption by, among other things, monitoring the financial condition of suppliers of key parts and raw materials, identifying (but not necessarily qualifying) possible alternative suppliers of such parts and materials, and ensuring adequate inventories of key parts and raw materials are available to maintain manufacturing schedules.
Although we seek to reduce our dependence on sole and limited source suppliers, in some cases the partial or complete loss of certain of these sources, or disruptions within our suppliers' often-complex supply chains, could disrupt scheduled deliveries to customers, damage customer relationships and have a material adverse effect on our results of operations.
Competition
The worldwide market for process control and yield management systems is highly competitive. In each of our product markets, we face competition from established and potential competitors, some of which may have greater financial, research, engineering, manufacturing and marketing resources than we have, such as Applied Materials, Inc., ASML Holding N.V. and Hitachi High-Technologies Corporation. We may also face future competition from new market entrants from other overseas and domestic sources. We expect our competitors to continue to improve the design and performance of their current products and processes and to introduce new products and processes with improved price and performance characteristics. We believe that, to remain competitive, we will require significant financial resources to offer a broad range of products, to maintain customer service and support centers worldwide, and to invest in product and process research and development.
We believe that, while price and delivery are important competitive factors, the customers’ overriding requirement is for systems that easily and effectively incorporate automated and highly accurate inspection and metrology capabilities into their existing manufacturing processes to enhance productivity. Significant competitive factors in the market for process control and yield management systems include system performance, ease of use, reliability, interoperability with the existing installed base and technical service and support, as well as overall cost of ownership.
Management believes that we are well positioned in the market with respect to both our products and services. However, any loss of competitive position could negatively impact our prices, customer orders, revenues, gross margins and market share, any of which would negatively impact our operating results and financial condition.
Acquisitions and Alliances
We continuously evaluate strategic acquisitions and alliances to expand our technologies, product offerings and distribution capabilities. Acquisitions involve numerous risks, including management issues and costs in connection with integration of the operations, technologies and products of the acquired companies, and the potential loss of key employees of the acquired companies. The inability to manage these risks effectively could negatively impact our operating results and financial condition.
11
Patents and Other Proprietary Rights
We protect our proprietary technology through reliance on a variety of intellectual property laws, including patent, copyright and trade secret. We have filed and obtained a number of patents in the United States and abroad and intend to continue pursuing the legal protection of our technology through intellectual property laws. In addition, from time to time we acquire license rights under United States and foreign patents and other proprietary rights of third parties, and we attempt to protect our trade secrets and other proprietary information through confidentiality and other agreements with our customers, suppliers, employees and consultants and through other security measures.
Although we consider patents and other intellectual property significant to our business, due to the rapid pace of innovation within the process control and yield management systems industry, we believe that our protection through patent and other intellectual property rights is less important than factors such as our technological expertise, continuing development of new systems, market penetration, installed base and the ability to provide comprehensive support and service to customers worldwide.
No assurance can be given that patents will be issued on any of our applications, that license assignments will be made as anticipated, or that our patents, licenses or other proprietary rights will be sufficiently broad to protect our technology. No assurance can be given that any patents issued to or licensed by us will not be challenged, invalidated or circumvented or that the rights granted thereunder will provide us with a competitive advantage. In addition, there can be no assurance that we will be able to protect our technology or that competitors will not be able to independently develop similar or functionally competitive technology.
Environmental Matters
We are subject to a variety of federal, state and local governmental laws and regulations related to the protection of the environment, including without limitation the management of hazardous materials that we use in our business operations. Compliance with these environmental laws and regulations has not had, and is not expected to have, a material effect on our capital expenditures, financial condition, results of operations or competitive position.
However, any failure to comply with environmental laws and regulations may subject us to a range of consequences, including fines, suspension of certain of our business activities, limitations on our ability to sell our products, obligations to remediate environmental contamination, and criminal and civil liabilities or other sanctions. In addition, changes in environmental laws and regulations could require us to invest in potentially costly pollution control equipment, alter our manufacturing processes or use substitute materials. Our failure to comply with these laws and regulations could subject us to future liabilities.
Employees
As of
June 30, 2014
, we employed approximately 6,060 people. Except for our employees in Belgium (where a trade union delegation recently came into being following a formal request thereto by the representative unions, which we did not challenge) and our employees in the German operations of our MIE business unit (who are represented by an employee work council), none of our employees are represented by a labor union. We have not experienced work stoppages and believe that our employee relations are good.
Competition is intense in the recruiting of personnel in the semiconductor and semiconductor equipment industry. We believe that our future success will depend, in part, on our continued ability to hire and retain qualified management, marketing and technical employees.
Glossary
This section provides definitions for certain industry and technical terms commonly used in our business, which are used elsewhere in this Item 1:
|
back-end
|
|
Process steps that make up the second half of the semiconductor manufacturing process, from contact through completion of the wafer prior to electrical test.
|
|
broadband
|
|
An illumination source with a wide spectral bandwidth.
|
|
critical dimension (CD)
|
|
The dimension of a specified geometry (such as the width of a patterned line or the distance between two lines) that must be within design tolerances in order to maintain semiconductor device performance consistency.
|
12
|
design rules
|
|
Rules that set forth the allowable dimensions of particular features used in the design and layout of integrated circuits.
|
|
die
|
|
The term for a single semiconductor chip on a wafer.
|
|
electron-beam
|
|
An illumination source comprised of a stream of electrons emitted by a single source.
|
|
epitaxial silicon (epi)
|
A substrate technology based on growing a crystalline silicon layer on top of a silicon wafer. The added layer, where the structure and orientation are matched to those of the silicon wafer, includes dopants (impurities) to imbue the substrate with special electronic properties.
|
|
|
excursion
|
|
For a manufacturing step or process, a deviation from normal operating conditions that can lead to decreased performance or yield of the final product.
|
|
fab
|
The main manufacturing facility for processing semiconductor wafers.
|
|
|
front-end
|
|
The processes that make up the first half of the semiconductor manufacturing process, from wafer start through final contact window processing.
|
|
in-situ
|
|
Refers to processing steps or tests that are done without moving the wafer. Latin for “in original position.”
|
|
interconnect
|
|
A highly conductive material, usually copper or aluminum, that carries electrical signals to different parts of a die.
|
|
lithography
|
|
A process in which a masked pattern is projected onto a photosensitive coating that covers a substrate.
|
|
mask shop
|
|
A manufacturer that produces the reticles used by semiconductor manufacturers.
|
|
metrology
|
|
The science of measurement to determine dimensions, quantity or capacity. In the semiconductor industry, typical measurements include critical dimension, overlay and film thickness.
|
|
microelectromechanical systems (MEMS)
|
|
Micron-sized mechanical devices powered by electricity, created using processes similar to those used to manufacture IC devices.
|
|
micron
|
|
A metric unit of linear measure that equals 1/1,000,000 meter (10
-6
m), or 10,000 angstroms (the diameter of a human hair is approximately 75 microns).
|
|
nanometer (nm)
|
|
One billionth (10
-9
) of a meter.
|
|
narrowband
|
|
An illumination source with a narrow spectral bandwidth, such as a laser.
|
|
patterned
|
|
For semiconductor manufacturing and industries using similar processing technologies, refers to substrates that have electronic circuits (transistors, interconnects, etc.) fabricated on the surface.
|
|
photoresist
|
|
A radiation-sensitive material that, when properly applied to a variety of substrates and then properly exposed and developed, masks portions of the substrate with a high degree of integrity.
|
|
process control
|
|
The ability to maintain specifications of products and equipment during manufacturing operations.
|
|
reticle
|
|
A very flat glass plate that contains the patterns to be reproduced on a wafer.
|
|
silicon-on-insulator (SOI)
|
A substrate technology comprised of a thin top silicon layer separated from the silicon substrate by a thin insulating layer of glass or silicon dioxide, used to improve performance and reduce the power consumption of IC circuits.
|
|
13
|
substrate
|
|
A wafer on which layers of various materials are added during the process of manufacturing semiconductor devices or circuits.
|
|
unpatterned
|
|
For semiconductor manufacturing and industries using similar processing technologies, refers to substrates that do not have electronic circuits (transistors, interconnects, etc.) fabricated on the surface. These can include bare silicon wafers, other bare substrates or substrates on which blanket films have been deposited.
|
|
yield management
|
|
The ability of a semiconductor manufacturer to oversee, manage and control its manufacturing processes so as to maximize the percentage of manufactured wafers or die that conform to pre-determined specifications.
|
__________________
The definitions above are from internal sources, as well as the SEMATECH Dictionary of Semiconductor Terms.
14
|
ITEM 1A.
|
RISK FACTORS
|
A description of factors that could materially affect our business, financial condition or operating results is provided below.
Risks Associated with Our Industry
Ongoing changes in the technology industry, as well as the semiconductor industry in particular, could expose our business to significant risks.
The semiconductor equipment industry and other industries that we serve are constantly developing and changing over time. Many of the risks associated with operating in these industries are comparable to the risks faced by all technology companies, such as the uncertainty of future growth rates in the industries that we serve, pricing trends in the end-markets for consumer electronics and other products (which place a growing emphasis on our customers' cost of ownership), changes in our customers' capital spending patterns and, in general, an environment of constant change and development, including decreasing product and component dimensions; use of new materials; and increasingly complex device structures, applications and process steps. If we fail to appropriately adjust our cost structure and operations to adapt to any of these trends, or, with respect to technological advances, if we do not timely develop new technologies and products that successfully anticipate and address these changes, we could experience a material adverse effect on our business, financial condition and operating results.
In addition, we face a number of risks specific to ongoing changes in the semiconductor industry, as the significant majority of our sales are made to semiconductor manufacturers. Some of the trends that our management monitors in operating our business include the following:
|
•
|
the increasing cost of building and operating fabrication facilities and the impact of such increases on our customers’ investment decisions;
|
|
•
|
differing market growth rates and capital requirements for different applications, such as memory, logic and foundry;
|
|
•
|
the emergence of disruptive technologies that change the prevailing semiconductor manufacturing processes (or the economics associated with semiconductor manufacturing) and, as a result, also impact the inspection and metrology requirements associated with such processes;
|
|
•
|
the possible introduction of integrated products by our larger competitors that offer inspection and metrology functionality in addition to managing other semiconductor manufacturing processes;
|
|
•
|
changes in semiconductor manufacturing processes that are extremely costly for our customers to implement and, accordingly, impact the amount of their budgets that are available for process control equipment;
|
|
•
|
the possibility that next-generation technological advances within the semiconductor manufacturing industry could actually reverse the historical trend of declining cost per transistor, and the impact that such reversal would have upon our industry and business;
|
|
•
|
the bifurcation of the semiconductor manufacturing industry into (a) leading edge manufacturers driving continued research and development into next-generation products and technologies and (b) other manufacturers that are content with existing (including previous generation) products and technologies;
|
|
•
|
the ever escalating cost of next-generation product development, which may result in joint development programs between us and our customers or government entities to help fund such programs that could restrict our control of, ownership of and profitability from the products and technologies developed through those programs;
|
|
•
|
the potential industry transition from 300mm to 450mm wafers; and
|
|
•
|
the entry by some semiconductor manufacturers into collaboration or sharing arrangements for capacity, cost or risk with other manufacturers, as well as increased outsourcing of their manufacturing activities, and greater focus only on specific markets or applications, whether in response to adverse market conditions or other market pressures.
|
Any of the changes described above may negatively affect our customers’ rate of investment in the capital equipment that we produce, which could result in downward pressure on our prices, customer orders, revenues and gross margins. If we do not successfully manage the risks resulting from any of these or other potential changes in our industries, our business, financial condition and operating results could be adversely impacted.
15
We are exposed to risks associated with a highly concentrated customer base.
Our customer base, particularly in the semiconductor industry, historically has been, and is becoming increasingly, highly concentrated. In this environment, orders from a relatively limited number of manufacturers have accounted for, and are expected to continue to account for, a substantial portion of our sales. This increasing concentration exposes our business, financial condition and operating results to a number of risks, including the following:
|
•
|
The mix and type of customers, and sales to any single customer, may vary significantly from quarter to quarter and from year to year, which exposes our business and operating results to increased volatility tied to individual customers.
|
|
•
|
New orders from our foundry customers in the past several years have constituted a significant portion of our total orders. This concentration increases the impact that future business or technology changes within the foundry industry may have on our business, financial condition and operating results.
|
|
•
|
In a highly concentrated business environment, if a particular customer does not place an order, or if they delay or cancel orders, we may not be able to replace the business. Furthermore, because our products are configured to customer specifications, any changes, delays or cancellations of orders may result in significant, non-recoverable costs.
|
|
•
|
In recent years, our customer base has become increasingly concentrated due to corporate consolidation, acquisitions and business closures. As a result of this consolidation, the customers that survive the consolidation represent a greater portion of our sales. Those surviving customers may have more aggressive policies regarding engaging alternative, second-source suppliers for the products we offer and, in addition, may seek, and on occasion receive, pricing, payment, intellectual property-related, or other commercial terms that are less favorable to us. Any of these changes could negatively impact our prices, customer orders, revenues and gross margins.
|
|
•
|
Certain customers have undergone significant ownership changes, created alliances with other companies, experienced management changes or have outsourced manufacturing activities, any of which may result in additional complexities in managing customer relationships and transactions.
|
|
•
|
The highly concentrated business environment also increases our exposure to risks related to the financial condition of each of our customers. For example, as a result of the challenging economic environment during fiscal year 2009, we were (and in some cases continue to be) exposed to additional risks related to the continued financial viability of certain of our customers. To the extent our customers experience liquidity issues in the future, we may be required to incur additional bad debt expense with respect to receivables owed to us by those customers. In addition, customers with liquidity issues may be forced to discontinue operations or may be acquired by one of our customers, and in either case such event would have the effect of further consolidating our customer base.
|
Any of these factors could have a material adverse effect on our business, financial condition and operating results.
The semiconductor equipment industry is highly cyclical. The purchasing decisions of our customers are highly dependent on the economies of both the local markets in which they are located and the semiconductor industry worldwide. If we fail to respond to industry cycles, our business could be seriously harmed.
The timing, length and severity of the up-and-down cycles in the semiconductor equipment industry are difficult to predict. The cyclical nature of the primary industry in which we operate is largely a function of our customers’ capital spending patterns and need for expanded manufacturing capacity, which in turn are affected by factors such as capacity utilization, consumer demand for products, inventory levels and our customers’ access to capital. This cyclicality affects our ability to accurately predict future revenue and, in some cases, future expense levels. During down cycles in our industry, the financial results of our customers may be negatively impacted, which could result not only in a decrease in, or cancellation or delay of, orders (which are generally subject to cancellation or delay by the customer with limited or no penalty) but also a weakening of their financial condition that could impair their ability to pay for our products or our ability to recognize revenue from certain customers. Our ability to recognize revenue from a particular customer may also be negatively impacted by the customer's funding status, which could be weakened not only by adverse business conditions or inaccessibility to capital markets for any number of macroeconomic or company-specific reasons, but also by funding limitations imposed by the customer's unique corporate structure. Any of these factors could negatively impact our business, operating results and financial condition.
16
When cyclical fluctuations result in lower than expected revenue levels, operating results may be adversely affected and cost reduction measures may be necessary in order for us to remain competitive and financially sound. During periods of declining revenues, as was experienced during fiscal year 2009, we must be in a position to adjust our cost and expense structure to prevailing market conditions and to continue to motivate and retain our key employees. If we fail to respond, or if our attempts to respond fail to accomplish our intended results, then our business could be seriously harmed. Furthermore, any workforce reductions and cost reduction actions that we adopt in response to down cycles may result in additional restructuring charges, disruptions in our operations and loss of key personnel. In addition, during periods of rapid growth, we must be able to increase manufacturing capacity and personnel to meet customer demand. We can provide no assurance that these objectives can be met in a timely manner in response to industry cycles. Each of these factors could adversely impact our operating results and financial condition.
In addition, our management typically provides quarterly forecasts for certain financial metrics, which, when made, are based on business and operational forecasts that are believed to be reasonable at the time. However, largely due to the cyclicality of our business and the industries in which we operate, and the fact that business conditions in our industries can change very rapidly as part of these cycles, our actual results may vary (and have varied in the past) from forecasted results. These variations can occur for any number of reasons, including, but not limited to, unexpected changes in the volume or timing of customer orders, product shipments or product acceptances; an inability to adjust our operations rapidly enough to adapt to changing business conditions; or a different than anticipated effective tax rate. The impact on our business of delays or cancellations of customer orders may be exacerbated by the short lead times that our customers expect between order placement and product shipment. This is because order delays and cancellations may lead not only to lower revenues, but also, due to the advance work we must do in anticipation of receiving a product order in order to meet the expected lead times, to significant inventory write-offs and manufacturing inefficiencies that decrease our gross margin. Any of these factors could materially and adversely affect our financial results for a particular quarter and could cause those results to differ materially from financial forecasts we have previously provided. We provide these forecasts with the intent of giving investors and analysts a better understanding of management's expectations for the future, but parties reviewing such forecasts must recognize that such forecasts are comprised of, and are themselves, forward-looking statements subject to the risks and uncertainties described in this Item 1A and elsewhere in this report and in our other public filings and public statements. If our operating or financial results for a particular period differ from our forecasts or the expectations of investment analysts, or if we revise our forecasts, the market price of our common stock could decline.
Risks Related to Our Business Model and Capital Structure
If we do not develop and introduce new products and technologies in a timely manner in response to changing market conditions or customer requirements, our business could be seriously harmed.
Success in the semiconductor equipment industry depends, in part, on continual improvement of existing technologies and rapid innovation of new solutions. For example, the size of semiconductor devices continues to shrink, and the industry is currently transitioning to the use of new materials and innovative fab processes. While we expect these trends will increase our customers’ reliance on diagnostic products such as ours, we cannot be sure that these trends will directly improve our business. These and other evolving customer needs require us to respond with continued development programs and to cut back or discontinue older programs, which may no longer have industry-wide support. Technical innovations are inherently complex and require long development cycles and appropriate staffing of highly qualified employees. Our competitive advantage and future business success depend on our ability to accurately predict evolving industry standards, to develop and introduce new products that successfully address changing customer needs, to win market acceptance of these new products and to manufacture these new products in a timely and cost-effective manner.
In this environment, we must continue to make significant investments in research and development in order to enhance the performance, features and functionality of our products, to keep pace with competitive products and to satisfy customer demands. Substantial research and development costs typically are incurred before we confirm the technical feasibility and commercial viability of a new product, and not all development activities result in commercially viable products. There can be no assurance that revenues from future products or product enhancements will be sufficient to recover the development costs associated with such products or enhancements. In addition, we cannot be sure that these products or enhancements will receive market acceptance or that we will be able to sell these products at prices that are favorable to us. Our business will be seriously harmed if we are unable to sell our products at favorable prices or if the market in which we operate does not accept our products.
17
In addition, the complexity of our products exposes us to other risks. We regularly recognize revenue from a sale upon shipment of the applicable product to the customer (even before receiving the customer's formal acceptance of that product) in certain situations, including sales of products for which installation is considered perfunctory, transactions in which the product is sold to an independent distributor and we have no installation obligations, and sales of products where we have previously delivered the same product to the same customer location and that prior delivery has been accepted. However, our products are very technologically complex and rely on the interconnection of numerous subcomponents (all of which must perform to their respective specifications), so it is conceivable that a product for which we recognize revenue upon shipment may ultimately fail to meet the overall product's required specifications. In such a situation, the customer may be entitled to certain remedies, which could materially and adversely affect our operating results for various periods and, as a result, our stock price.
Our success is dependent in part on our technology and other proprietary rights. If we are unable to maintain our lead or protect our proprietary technology, we may lose valuable assets.
Our success is dependent in part on our technology and other proprietary rights. We own various United States and international patents and have additional pending patent applications relating to some of our products and technologies. The process of seeking patent protection is lengthy and expensive, and we cannot be certain that pending or future applications will actually result in issued patents or that issued patents will be of sufficient scope or strength to provide meaningful protection or commercial advantage to us. Other companies and individuals, including our larger competitors, may develop technologies and obtain patents relating to our business that are similar or superior to our technology or may design around the patents we own, adversely affecting our business. In addition, we at times engage in collaborative technology development efforts with our customers and suppliers, and these collaborations may constitute a key component of certain of our ongoing technology and product research and development projects. The termination of any such collaboration, or delays caused by disputes or other unanticipated challenges that may arise in connection with any such collaboration, could significantly impair our research and development efforts, which could have a material adverse impact on our business and operations.
We also maintain trademarks on certain of our products and services and claim copyright protection for certain proprietary software and documentation. However, we can give no assurance that our trademarks and copyrights will be upheld or successfully deter infringement by third parties.
While patent, copyright and trademark protection for our intellectual property is important, we believe our future success in highly dynamic markets is most dependent upon the technical competence and creative skills of our personnel. We attempt to protect our trade secrets and other proprietary information through confidentiality and other agreements with our customers, suppliers, employees and consultants and through other security measures. We also maintain exclusive and non-exclusive licenses with third parties for strategic technology used in certain products. However, these employees, consultants and third parties may breach these agreements, and we may not have adequate remedies for wrongdoing. In addition, the laws of certain territories in which we develop, manufacture or sell our products may not protect our intellectual property rights to the same extent as do the laws of the United States. In any event, the extent to which we can protect our trade secrets through the use of confidentiality agreements is limited, and our success will depend to a significant extent on our ability to innovate ahead of our competitors.
Our future performance depends, in part, upon our ability to continue to compete successfully worldwide.
Our industry includes large manufacturers with substantial resources to support customers worldwide. Some of our competitors are diversified companies with greater financial resources and more extensive research, engineering, manufacturing, marketing, and customer service and support capabilities than we possess. We face competition from companies whose strategy is to provide a broad array of products and services, some of which compete with the products and services that we offer. These competitors may bundle their products in a manner that may discourage customers from purchasing our products, including pricing such competitive tools significantly below our product offerings. In addition, we face competition from smaller emerging semiconductor equipment companies whose strategy is to provide a portion of the products and services that we offer, using innovative technology to sell products into specialized markets. The strength of our competitive positions in many of our existing markets is largely due to our leading technology, which is the result of continuing significant investments in product research and development. However, we may enter new markets, whether through acquisitions or new internal product development, in which competition is based primarily on product pricing, not technological superiority. Further, some new growth markets that emerge may not require leading technologies. Loss of competitive position in any of the markets we serve, or an inability to sell our products on favorable commercial terms in new markets we may enter, could negatively affect our prices, customer orders, revenues, gross margins and market share, any of which would negatively affect our operating results and financial condition.
18
Our business would be harmed if we do not receive parts sufficient in number and performance to meet our production requirements and product specifications in a timely and cost-effective manner.
We use a wide range of materials in the production of our products, including custom electronic and mechanical components, and we use numerous suppliers to supply these materials. We generally do not have guaranteed supply arrangements with our suppliers. Because of the variability and uniqueness of customers’ orders, we do not maintain an extensive inventory of materials for manufacturing. Through our business interruption planning, we seek to minimize the risk of production and service interruptions and/or shortages of key parts by, among other things, monitoring the financial stability of key suppliers, identifying (but not necessarily qualifying) possible alternative suppliers and maintaining appropriate inventories of key parts. Although we make reasonable efforts to ensure that parts are available from multiple suppliers, key parts may be available only from a single supplier or a limited group of suppliers. Also, key parts we obtain from some of our suppliers incorporate the suppliers’ proprietary intellectual property; in those cases we are increasingly reliant on third parties for high-performance, high-technology components, which reduces the amount of control we have over the availability and protection of the technology and intellectual property that is used in our products. In addition, if certain of our key suppliers experience liquidity issues and are forced to discontinue operations, which is a heightened risk during economic downturns, that would affect their ability to deliver parts and could result in delays for our products. Similarly, especially with respect to suppliers of high-technology components, our suppliers themselves have increasingly complex supply chains, and delays or disruptions at any stage of their supply chains may prevent us from obtaining parts in a timely manner and result in delays for our products. Our operating results and business may be adversely impacted if we are unable to obtain parts to meet our production requirements and product specifications, or if we are only able to do so on unfavorable terms. Furthermore, a supplier may discontinue production of a particular part for any number of reasons, including the supplier's financial condition or business operational decisions, which would require us to purchase, in a single transaction, a large number of such discontinued parts in order to ensure that a continuous supply of such parts remains available to our customers. Such “end-of-life” parts purchases could result in significant expenditures by us in a particular period, and ultimately any unused parts may result in a significant inventory write-off in a future period, either of which could have a material and adverse impact on our financial condition and results of operations for the applicable periods.
If we fail to operate our business in accordance with our business plan, our operating results, business and stock price may be significantly and adversely impacted.
We attempt to operate our business in accordance with a business plan that is established annually, revised frequently (generally quarterly), and reviewed by management even more frequently (at least monthly). Our business plan is developed based on a number of factors, many of which require estimates and assumptions, such as our expectations of the economic environment, future business levels, our customers’ willingness and ability to place orders, lead-times, and future revenue and cash flow. Our budgeted operating expenses, for example, are based in part on our future revenue expectations. However, our ability to achieve our anticipated revenue levels is a function of numerous factors, including the volatile and cyclical nature of our primary industry, customer order cancellations, macroeconomic changes, operational matters regarding particular agreements, our ability to manage customer deliveries and resources for the installation and acceptance of our products (for products where customer acceptance is required before we can recognize revenue from such sales), our ability to manage delays or accelerations by customers in taking deliveries and the acceptance of our products (for products where customer acceptance is required before we can recognize revenue from such sales), our ability to operate our business and sales processes effectively, and a number of the other risk factors set forth in this Item 1A.
Because our expenses are in most cases relatively fixed in the short term, any revenue shortfall below expectations could have an immediate and significant adverse effect on our operating results. Similarly, if we fail to manage our expenses effectively or otherwise fail to maintain rigorous cost controls, we could experience greater than anticipated expenses during an operating period, which would also negatively affect our results of operations. If we fail to operate our business consistent with our business plan, our operating results in any period may be significantly and adversely impacted. Such an outcome could cause customers, suppliers or investors to view us as less stable, or could cause us to fail to meet financial analysts’ revenue or earnings estimates, any of which could have a material adverse impact on our business, financial condition or stock price.
In addition, our management is constantly striving to balance the requirements and demands of our customers with the availability of resources, the need to manage our operating model and other factors. In furtherance of those efforts, we often must exercise discretion and judgment as to the timing and prioritization of manufacturing, deliveries, installations and payment scheduling. Any such decisions may impact our ability to recognize revenue, including the fiscal period during which such revenue may be recognized, with respect to such products, which could have a material adverse effect on our business, financial condition or stock price.
19
There can be no assurance that we will continue to declare cash dividends at all or in any particular amounts.
Our Board of Directors first instituted a quarterly dividend during the fiscal year ended June 30, 2005. Since that time, we have announced a number of increases in the amount of our quarterly dividend level. We intend to continue to pay quarterly dividends subject to capital availability and periodic determinations by our Board of Directors that cash dividends are in the best interest of our stockholders and are in compliance with all laws and agreements applicable to the declaration and payment of cash dividends by us. Future dividends may be affected by, among other factors: our views on potential future capital requirements for investments in acquisitions and the funding of our research and development; legal risks; stock repurchase programs; changes in federal and state income tax laws or corporate laws; and changes to our business model. Our dividend payments may change from time to time, and we cannot provide assurance that we will continue to declare dividends at all or in any particular amounts. A reduction in our dividend payments could have a negative effect on our stock price.
There are risks associated with our outstanding indebtedness.
As of
June 30, 2014
, we had
$750 million
aggregate principal amount of outstanding indebtedness represented by our senior notes that will mature in 2018, and we may incur additional indebtedness in the future. Our ability to pay interest and repay the principal for our indebtedness is dependent upon our ability to manage our business operations and the other risk factors discussed in this section. There can be no assurance that we will be able to manage any of these risks successfully.
In addition, changes by any rating agency to our outlook or credit rating could negatively affect the value and liquidity of both our debt and equity securities. Factors that can affect our credit rating include changes in our operating performance, the economic environment, conditions in the semiconductor and semiconductor equipment industries, our financial position, and changes in our business strategy.
In certain circumstances involving a change of control followed by a downgrade of the rating of our senior notes, we will be required to make an offer to repurchase the senior notes at a purchase price equal to 101% of the aggregate principal amount of the notes repurchased, plus accrued and unpaid interest. We cannot make any assurance that we will have sufficient financial resources at such time or will be able to arrange financing to pay the repurchase price of the senior notes. Our ability to repurchase the senior notes in such event may be limited by law, by the indenture associated with the senior notes, or by the terms of other agreements to which we may be party at such time. If we fail to repurchase the senior notes as required by the indenture, it would constitute an event of default under the indenture governing the senior notes which, in turn, may also constitute an event of default under other of our obligations.
We are exposed to risks related to our commercial terms and conditions, including our indemnification of third parties, as well as the performance of our products.
Although our standard commercial documentation sets forth the terms and conditions that we intend to apply to commercial transactions with our business partners, counterparties to such transactions may not explicitly agree to our terms and conditions. In situations where we engage in business with a third party without an explicit master agreement regarding the applicable terms and conditions, or where the commercial documentation applicable to the transaction is subject to varying interpretations, we may have disputes with those third parties regarding the applicable terms and conditions of our business relationship with them. Such disputes could lead to a deterioration of our commercial relationship with those parties, costly and time-consuming litigation, or additional concessions or obligations being offered by us to resolve such disputes, or could impact our revenue or cost recognition. Any of these outcomes could materially and adversely affect our business, financial condition and results of operations.
In addition, in our commercial agreements, from time to time in the normal course of business we indemnify third parties with whom we enter into contractual relationships, including customers and lessors, with respect to certain matters. We have agreed, under certain conditions, to hold these third parties harmless against specified losses, such as those arising from a breach of representations or covenants, other third party claims that our products when used for their intended purposes infringe the intellectual property rights of such other third parties, or other claims made against certain parties. We may be compelled to enter into or accrue for probable settlements of alleged indemnification obligations, or we may be subject to potential liability arising from our customers’ involvements in legal disputes. In addition, notwithstanding the provisions related to limitations on our liability that we seek to include in our business agreements, the counterparties to such agreements may dispute our interpretation or application of such provisions, and a court of law may not interpret or apply such provisions in our favor, any of which could result in an obligation for us to pay material damages to third parties and engage in costly legal proceedings. It is difficult to determine the maximum potential amount of liability under any indemnification obligations, whether or not asserted, due to our limited history of prior indemnification claims and the unique facts and circumstances that are likely to be involved in any particular claim. Our business, financial condition and results of operations in a reported fiscal period could be materially and adversely affected if we expend significant amounts in defending or settling any purported claims, regardless of their merit or outcomes.
20
We are also exposed to potential costs associated with unexpected product performance issues. Our products and production processes are extremely complex and thus could contain unexpected product defects, especially when products are first introduced. Unexpected product performance issues could result in significant costs being incurred by us, including increased service or warranty costs, providing product replacements for (or modifications to) defective products, litigation related to defective products, reimbursement for damages caused by our products, product recalls, or product write-offs or disposal costs. These costs could be substantial and could have an adverse impact upon our business, financial condition and operating results. In addition, our reputation with our customers could be damaged as a result of such product defects, which could reduce demand for our products and negatively impact our business.
Furthermore, we occasionally enter into volume purchase agreements with our larger customers, and these agreements may provide for certain volume purchase incentives, such as credits toward future purchases. We believe that these arrangements are beneficial to our long-term business, as they are designed to encourage our customers to purchase higher volumes of our products. However, these arrangements could require us to recognize a reduced level of revenue for the products that are initially purchased, to account for the potential future credits or other volume purchase incentives. As a result, these volume purchase arrangements, while expected to be beneficial to our business over time, could materially and adversely affect our results of operations in near-term periods, including the revenue we can recognize on product sales and therefore our gross margins.
In addition, we may in limited circumstances enter into agreements that contain other types of customer-specific pricing, discount, rebate or credit commitments offered by us, which may adversely impact our revenues, margins or financial results. Furthermore, we may give these customers limited audit or inspection rights to enable them to confirm that we are complying with these commitments. If a customer elects to exercise its audit or inspection rights, we may be required to expend significant resources to support the audit or inspection, as well as to defend or settle any dispute with a customer that could potentially arise out of such audit or inspection. To date, we have made no accruals in our consolidated financial statements for this contingency. While we have not in the past incurred significant expenses for resolving disputes regarding these types of commitments, we cannot make any assurance that we will not incur any such liabilities in the future. One significant customer recently exercised its audit rights, but we cannot predict the outcome of that audit at this time. Our business, financial condition and results of operations in a reported fiscal period could be materially and adversely affected if we expend significant amounts in supporting an audit or inspection, or defending or settling any purported claims, regardless of their merit or outcomes.
There are risks associated with our receipt of government funding for research and development.
We are exposed to additional risks related to our receipt of external funding for certain strategic development programs from various governments and government agencies, both domestically and internationally. Governments and government agencies typically have the right to terminate funding programs at any time in their sole discretion, or a project may be terminated by mutual agreement if the parties determine that the project's goals or milestones are not being achieved, so there is no assurance that these sources of external funding will continue to be available to us in the future. In addition, under the terms of these government grants, the applicable granting agency typically has the right to audit the costs that we incur, directly and indirectly, in connection with such programs. Any such audit could result in modifications to, or even termination of, the applicable government funding program. For example, if an audit were to identify any costs as being improperly allocated to the applicable program, those costs would not be reimbursed, and any such costs that had already been reimbursed would have to be refunded. We do not know the outcome of any future audits. Any adverse finding resulting from any such audit could lead to penalties (financial or otherwise), termination of funding programs, suspension of payments, fines and suspension or prohibition from receiving future government funding from the applicable government or government agency, any of which could adversely impact our operating results, financial condition and ability to operate our business.
21
We have recorded significant restructuring, inventory write-off and asset impairment charges in the past and may do so again in the future, which could have a material negative impact on our business.
During the fiscal year ended June 30, 2009, we recorded material restructuring charges of $38.7 million related to our global workforce reduction, large excess inventory write-offs of $85.6 million, and material impairment charges of $446.7 million related to our goodwill and purchased intangible assets. If we again encounter challenging economic conditions, we may implement additional cost reduction actions, discontinue certain business operations or make other organizational changes, which would require us to take additional, potentially material, restructuring charges related to, among other things, employee terminations or exit costs. We may also be required to write-off additional inventory if our product build plans or usage of service inventory decline. Also, as our lead times from suppliers increase (due to the increasing complexity of the parts and components they provide) and the lead times demanded by our customers decrease (due to the time pressures they face when introducing new products or technology or bringing new facilities into production), we may be compelled to increase our commitments, and therefore our risk exposure, to inventory purchases to meet our customers' demands in a timely manner, and that inventory may need to be written-off if demand for the underlying product declines for any reason. Such additional write-offs could constitute material charges.
As noted above, we recorded a material charge during the fiscal year ended June 30, 2009 related to the impairment of our goodwill and purchased intangible assets. Goodwill represents the excess of costs over the net fair value of net assets acquired in a business combination. Goodwill is not amortized, but is instead tested for impairment at least annually in accordance with authoritative guidance for goodwill. Purchased intangible assets with estimable useful lives are amortized over their respective estimated useful lives using the straight-line method, and are reviewed for impairment in accordance with authoritative guidance for long-lived assets. The valuation of goodwill and intangible assets requires assumptions and estimates of many critical factors, including revenue and market growth, operating cash flows, market multiples, and discount rates. A substantial decline in our stock price, or any other adverse change in market conditions, particularly if such change has the effect of changing one of the critical assumptions or estimates we previously used to calculate the value of our goodwill or intangible assets (and, as applicable, the amount of any previous impairment charge), could result in a change to the estimation of fair value that could result in an additional impairment charge.
Any such additional material charges, whether related to restructuring or goodwill or purchased intangible asset impairment, may have a material negative impact on our operating results and related financial statements.
We are exposed to risks related to our financial arrangements with respect to receivables factoring and banking arrangements.
We enter into factoring arrangements with financial institutions to sell certain of our trade receivables and promissory notes from customers without recourse. In addition, we maintain bank accounts with several domestic and foreign financial institutions, any of which may prove not to be financially viable. If we were to stop entering into these factoring arrangements, our operating results, financial condition and cash flows could be adversely impacted by delays or failures in collecting trade receivables. However, by entering into these arrangements, and by engaging these financial institutions for banking services, we are exposed to additional risks. If any of these financial institutions experiences financial difficulties or is otherwise unable to honor the terms of our factoring or deposit arrangements, we may experience material financial losses due to the failure of such arrangements or a lack of access to our funds, any of which could have an adverse impact upon our operating results, financial condition and cash flows.
We are subject to the risks of additional government actions in the event we were to breach the terms of any settlement arrangement into which we have entered.
In connection with the settlement of certain government actions and other legal proceedings related to our historical stock option practices, we have explicitly agreed as a condition to such settlements that we will comply with certain laws, such as the books and records provisions of the federal securities laws. If we were to violate any such law, we might not only be subject to the significant penalties applicable to such violation, but our past settlements may also be impacted by such violation, which could give rise to additional government actions or other legal proceedings. Any such additional actions or proceedings may require us to expend significant management time and incur significant accounting, legal and other expenses, and may divert attention and resources from the operation of our business. These expenditures and diversions, as well as an adverse resolution of any such action or proceeding, could have a material adverse effect on our business, financial condition and results of operations.
22
General Commercial, Operational, Financial and Regulatory Risks
We are exposed to risks associated with a weakening in the condition of the financial markets and the global economy.
The severe tightening of the credit markets, turmoil in the financial markets and weakening of the global economy that were experienced during the fiscal year ended June 30, 2009 contributed to slowdowns in the industries in which we operate, which slowdowns could recur or worsen if economic conditions were to deteriorate again.
The markets for semiconductors, and therefore our business, are ultimately driven by the global demand for electronic devices by consumers and businesses. Economic uncertainty frequently leads to reduced consumer and business spending, which caused our customers to decrease, cancel or delay their equipment and service orders from us in the economic slowdown during fiscal year 2009. In addition, the tightening of credit markets and concerns regarding the availability of credit that accompanied that slowdown made it more difficult for our customers to raise capital, whether debt or equity, to finance their purchases of capital equipment, including the products we sell. Reduced demand, combined with delays in our customers’ ability to obtain financing (or the unavailability of such financing), has at times in the past adversely affected our product and service sales and revenues and therefore has harmed our business and operating results, and our operating results and financial condition may again be adversely impacted if economic conditions decline from their current levels.
In addition, a decline in the condition of the global financial markets could adversely impact the market values or liquidity of our investments. Our investment portfolio includes corporate and government securities, money market funds and other types of debt and equity investments. Although we believe our portfolio continues to be comprised of sound investments due to the quality and (where applicable) credit ratings and government guarantees of the underlying investments, a decline in the capital and financial markets would adversely impact the market value of our investments and their liquidity. If the market value of such investments were to decline, or if we were to have to sell some of our investments under illiquid market conditions, we may be required to recognize an impairment charge on such investments or a loss on such sales, either of which could have an adverse effect on our financial condition and operating results.
If we are unable to timely and appropriately adapt to changes resulting from difficult macroeconomic conditions, our business, financial condition or results of operations may be materially and adversely affected.
A majority of our annual revenues are derived from outside the United States, and we maintain significant operations outside the United States. We are exposed to numerous risks as a result of the international nature of our business and operations.
A majority of our annual revenues are derived from outside the United States, and we maintain significant operations outside the United States. We expect that these conditions will continue in the foreseeable future. Managing global operations and sites located throughout the world presents a number of challenges, including but not limited to:
|
•
|
managing cultural diversity and organizational alignment;
|
|
•
|
exposure to the unique characteristics of each region in the global semiconductor market, which can cause capital equipment investment patterns to vary significantly from period to period;
|
|
•
|
periodic local or international economic downturns;
|
|
•
|
potential adverse tax consequences, including withholding tax rules that may limit the repatriation of our earnings, and higher effective income tax rates in foreign countries where we do business;
|
|
•
|
government controls, either by the United States or other countries, that restrict our business overseas or the import or export of semiconductor products or increase the cost of our operations;
|
|
•
|
compliance with customs regulations in the countries in which we do business;
|
|
•
|
tariffs or other trade barriers (including those applied to our products or to parts and supplies that we purchase);
|
|
•
|
political instability, natural disasters, legal or regulatory changes, acts of war or terrorism in regions where we have operations or where we do business;
|
|
•
|
fluctuations in interest and currency exchange rates. Fluctuations in currency exchange rates may adversely impact our ability to compete on price with local providers or the value of revenues we generate from our international business. Although we attempt to manage near-term currency risks through the use of hedging instruments, there can be no assurance that such efforts will be adequate;
|
|
•
|
longer payment cycles and difficulties in collecting accounts receivable outside of the United States;
|
|
•
|
difficulties in managing foreign distributors (including monitoring and ensuring our distributors' compliance with all applicable United States and local laws); and
|
|
•
|
inadequate protection or enforcement of our intellectual property and other legal rights in foreign jurisdictions.
|
Any of the factors above could have a significant negative impact on our business and results of operations.
23
We might be involved in claims or disputes related to intellectual property or other confidential information that may be costly to resolve, prevent us from selling or using the challenged technology and seriously harm our operating results and financial condition.
As is typical in the semiconductor equipment industry, from time to time we have received communications from other parties asserting the existence of patent rights, copyrights, trademark rights or other intellectual property rights which they believe cover certain of our products, processes, technologies or information. In addition, we occasionally receive notification from customers who believe that we owe them indemnification or other obligations related to intellectual property claims made against such customers by third parties. With respect to intellectual property infringement disputes, our customary practice is to evaluate such infringement assertions and to consider whether to seek licenses where appropriate. However, we cannot ensure that licenses can be obtained or, if obtained, will be on acceptable terms or that costly litigation or other administrative proceedings will not occur. The inability to obtain necessary licenses or other rights on reasonable terms could seriously harm our results of operations and financial condition. Furthermore, we may potentially be subject to claims by customers, suppliers or other business partners, or by governmental law enforcement agencies, related to our receipt, distribution and/or use of third-party intellectual property or confidential information. Legal proceedings and claims, regardless of their merit, and associated internal investigations with respect to intellectual property or confidential information disputes are often expensive to prosecute, defend or conduct; may divert management's attention and other company resources; and/or may result in restrictions on our ability to sell our products, settlements on significantly adverse terms or adverse judgments for damages, injunctive relief, penalties and fines, any of which could have a significant negative effect on our business, results of operations and financial condition. There can be no assurance regarding the outcome of future legal proceedings, claims or investigations. The instigation of legal proceedings or claims, our inability to favorably resolve or settle such proceedings or claims, or the determination of any adverse findings against us or any of our employees in connection with such proceedings or claims could materially and adversely affect our business, financial condition and results of operations, as well as our business reputation.
We are exposed to various risks related to the legal (including environmental), regulatory and tax environments in which we perform our operations and conduct our business.
We are subject to various risks related to compliance with new, existing, different, inconsistent or even conflicting laws, rules and regulations enacted by legislative bodies and/or regulatory agencies in the countries in which we operate and with which we must comply, including environmental, safety, antitrust, anti-corruption/anti-bribery, unclaimed property and export control regulations. Our failure or inability to comply with existing or future laws, rules or regulations, or changes to existing laws, rules or regulations (including changes that result in inconsistent or conflicting laws, rules or regulations), in the countries in which we operate could result in violations of contractual or regulatory obligations that may adversely affect our operating results, financial condition and ability to conduct our business. From time to time, we may receive inquiries or audit notices from governmental or regulatory bodies, or we may participate in voluntary disclosure programs, related to legal, regulatory or tax compliance matters, and these inquiries, notices or programs may result in significant financial cost (including investigation expenses, defense costs, assessments and penalties), reputational harm and other consequences that could materially and adversely affect our operating results and financial condition.
Our properties and many aspects of our business operations are subject to various domestic and international environmental laws and regulations, including those that control and restrict the use, transportation, emission, discharge, storage and disposal of certain chemicals, gases and other substances. Any failure to comply with applicable environmental laws, regulations or requirements may subject us to a range of consequences, including fines, suspension of certain of our business activities, limitations on our ability to sell our products, obligations to remediate environmental contamination, and criminal and civil liabilities or other sanctions. In addition, changes in environmental regulations (including regulations relating to climate change and greenhouse gas emissions) could require us to invest in potentially costly pollution control equipment, alter our manufacturing processes or use substitute (potentially more expensive and/or rarer) materials. Further, we use hazardous and other regulated materials that subject us to risks of strict liability for damages caused by any release, regardless of fault. We also face increasing complexity in our manufacturing, product design and procurement operations as we adjust to new and prospective requirements relating to the materials composition of our products, including restrictions on lead and other substances and requirements to track the sources of certain metals and other materials. The cost of complying, or of failing to comply, with these and other regulatory restrictions or contractual obligations could adversely affect our operating results, financial condition and ability to conduct our business.
24
In addition, we may from time to time be involved in legal proceedings or claims regarding employment, contracts, product performance, product liability, antitrust, environmental regulations, securities, unfair competition and other matters (in addition to proceedings and claims related to intellectual property matters, which are separately discussed elsewhere in this Item 1A). These legal proceedings and claims, regardless of their merit, may be time-consuming and expensive to prosecute or defend, divert management’s attention and resources, and/or inhibit our ability to sell our products. There can be no assurance regarding the outcome of current or future legal proceedings or claims, which could adversely affect our operating results, financial condition and ability to operate our business.
Recent regulations related to “conflict minerals” may force us to incur additional expenses, may result in damage to our business reputation and may adversely impact our ability to conduct our business.
In August 2012, under the Dodd-Frank Wall Street Reform and Consumer Protection Act of 2010, the SEC adopted new requirements for companies that use certain minerals and derivative metals (referred to as “conflict minerals,” regardless of their actual country of origin) in their products. Some of these metals are commonly used in electronic equipment and devices, including our products. These new requirements require companies to annually investigate, disclose and report whether or not such metals originated from the Democratic Republic of Congo or adjoining countries. Our first report was filed on June 2, 2014 for the 2013 calendar year. We have an extremely complex supply chain, with numerous suppliers (many of whom are not obligated by the new law to investigate their own supply chains) for the components and parts used in each of our products. As a result, we may incur significant costs to comply with the diligence and disclosure requirements, including costs related to determining the source of any of the relevant metals used in our products. In addition, because our supply chain is so complex, we may not be able to sufficiently verify the origin of all the relevant metals used in our products through the due diligence procedures that we implement, which may harm our business reputation. Though we do not anticipate that our customers will need to know our conflict mineral status to satisfy their own SEC reporting obligations (if any), we may also face difficulties in satisfying customers if they nonetheless require that we prove or certify that our products are “conflict free.” Key components and parts that can be shown to be “conflict free” may not be available to us in sufficient quantity, or at all, or may only be available at significantly higher cost to us. If we are not able to meet customer requirements, customers may choose to disqualify us as a supplier. Any of these outcomes could adversely impact our business, financial condition or operating results.
We depend on key personnel to manage our business effectively, and if we are unable to attract, retain and motivate our key employees, our sales and product development could be harmed.
Our employees are vital to our success, and our key management, engineering and other employees are difficult to replace. We generally do not have employment contracts with our key employees. Further, we do not maintain key person life insurance on any of our employees. The expansion of high technology companies worldwide has increased demand and competition for qualified personnel. If we are unable to retain key personnel, or if we are not able to attract, assimilate and retain additional highly qualified employees to meet our needs in the future, our business and operations could be harmed.
We outsource a number of services to third-party service providers, which decreases our control over the performance of these functions. Disruptions or delays at our third-party service providers could adversely impact our operations.
We outsource a number of services, including our transportation and logistics management of spare parts and certain accounting functions, to domestic and overseas third-party service providers. While outsourcing arrangements may lower our cost of operations, they also reduce our direct control over the services rendered. It is uncertain what effect such diminished control will have on the quality or quantity of products delivered or services rendered, on our ability to quickly respond to changing market conditions, or on our ability to ensure compliance with all applicable domestic and foreign laws and regulations. In addition, many of these outsourced service providers, including certain hosted software applications that we use for confidential data storage, employ “cloud computing” technology for such storage (which refers to an information technology hosting and delivery system in which data is not stored within the user's physical infrastructure but instead is delivered to and consumed by the user as an Internet-based service). These providers' cloud computing systems may be susceptible to “cyber incidents,” such as intentional cyber attacks aimed at theft of sensitive data or inadvertent cyber-security compromises, that are outside of our control. If we do not effectively develop and manage our outsourcing strategies, if required export and other governmental approvals are not timely obtained, if our third-party service providers do not perform as anticipated or do not adequately protect our data from cyber-related security breaches, or if there are delays or difficulties in enhancing business processes, we may experience operational difficulties (such as limitations on our ability to ship products), increased costs, manufacturing or service interruptions or delays, loss of intellectual property rights or other sensitive data, quality and compliance issues, and challenges in managing our product inventory or recording and reporting financial and management information, any of which could materially and adversely affect our business, financial condition and results of operations.
25
We rely upon certain critical information systems for our daily business operations. Our inability to use or access these information systems at critical points in time could unfavorably impact the timeliness and efficiency of our business operations.
Our global operations are linked by information systems, including telecommunications, the internet, our corporate intranet, network communications, email and various computer hardware and software applications. Despite our implementation of network security measures, our tools and servers are vulnerable to computer viruses, break-ins and similar disruptions from unauthorized tampering with our computer systems and tools located at customer sites, or could be subject to system failures or malfunctions for other reasons. System failures or malfunctioning, such as difficulties with our customer relationship management (“CRM”) system, could disrupt our operations and our ability to timely and accurately process and report key components of our financial results. Our enterprise resource planning (“ERP”) system is integral to our ability to accurately and efficiently maintain our books and records, record transactions, provide critical information to our management, and prepare our financial statements. Any disruptions or difficulties that may occur in connection with our ERP system or other systems (whether in connection with the regular operation, periodic enhancements, modifications or upgrades of such systems or the integration of our acquired businesses into such systems) could adversely affect our ability to complete important business processes, such as the evaluation of our internal control over financial reporting pursuant to Section 404 of the Sarbanes-Oxley Act of 2002. Any such event could have an adverse effect on our business, operating results and financial condition.
Acquisitions are an important element of our strategy but, because of the uncertainties involved, we may not find suitable acquisition candidates and we may not be able to successfully integrate and manage acquired businesses. We are also exposed to risks in connection with strategic alliances into which we may enter.
In addition to our efforts to develop new technologies from internal sources, part of our growth strategy is to pursue acquisitions and acquire new technologies from external sources. As part of this effort, we may make acquisitions of, or significant investments in, businesses with complementary products, services and/or technologies. There can be no assurance that we will find suitable acquisition candidates or that acquisitions we complete will be successful. In addition, we may use equity to finance future acquisitions, which would increase our number of shares outstanding and be dilutive to current stockholders.
If we are unable to successfully integrate and manage acquired businesses or if acquired businesses perform poorly, then our business and financial results may suffer. It is possible that the businesses we have acquired, as well as businesses that we may acquire in the future, may perform worse than expected or prove to be more difficult to integrate and manage than anticipated. In addition, we may lose key employees of the acquired companies. As a result, risks associated with acquisition transactions may give rise to a material adverse effect on our business and financial results for a number of reasons, including:
|
•
|
we may have to devote unanticipated financial and management resources to acquired businesses;
|
|
•
|
the combination of businesses may cause the loss of key personnel or an interruption of, or loss of momentum in, the activities of our company and/or the acquired business;
|
|
•
|
we may not be able to realize expected operating efficiencies or product integration benefits from our acquisitions;
|
|
•
|
we may experience challenges in entering into new market segments for which we have not previously manufactured and sold products;
|
|
•
|
we may face difficulties in coordinating geographically separated organizations, systems and facilities;
|
|
•
|
the customers, distributors, suppliers, employees and others with whom the companies we acquire have business dealings may have a potentially adverse reaction to the acquisition;
|
|
•
|
we may have to write-off goodwill or other intangible assets; and
|
|
•
|
we may incur unforeseen obligations or liabilities in connection with acquisitions.
|
At times, we may also enter into strategic alliances with customers, suppliers or other business partners with respect to development of technology and intellectual property. These alliances typically require significant investments of capital and exchange of proprietary, highly sensitive information. The success of these alliances depends on various factors over which we may have limited or no control and requires ongoing and effective cooperation with our strategic partners. Mergers and acquisitions and strategic alliances are inherently subject to significant risks, and the inability to effectively manage these risks could materially and adversely affect our business, financial condition and operating results.
26
Disruption of our manufacturing facilities or other operations, or in the operations of our customers, due to earthquake, flood, other natural catastrophic events, health epidemics or terrorism could result in cancellation of orders, delays in deliveries or other business activities, or loss of customers and could seriously harm our business.
We have significant manufacturing operations in the United States, Singapore, Israel, Germany and China. In addition, our business is international in nature, with our sales, service and administrative personnel and our customers located in numerous countries throughout the world. Operations at our manufacturing facilities and our assembly subcontractors, as well as our other operations and those of our customers, are subject to disruption for a variety of reasons, including work stoppages, acts of war, terrorism, health epidemics, fire, earthquake, volcanic eruptions, energy shortages, flooding or other natural disasters. Such disruption could cause delays in, among other things, shipments of products to our customers, our ability to perform services requested by our customers, or the installation and acceptance of our products at customer sites. We cannot ensure that alternate means of conducting our operations (whether through alternate production capacity or service providers or otherwise) would be available if a major disruption were to occur or that, if such alternate means were available, they could be obtained on favorable terms.
In addition, as part of our cost-cutting actions, we have consolidated several operating facilities. Our California operations are now primarily centralized in our Milpitas facility. The consolidation of our California operations into a single campus could further concentrate the risks related to any of the disruptive events described above, such as acts of war or terrorism, earthquakes, fires or other natural disasters, if any such event were to impact our Milpitas facility.
We are predominantly uninsured for losses and interruptions caused by terrorist acts and acts of war. If international political instability continues or increases, our business and results of operations could be harmed.
The threat of terrorism targeted at, or acts of war in, the regions of the world in which we do business increases the uncertainty in our markets. Any act of terrorism or war that affects the economy or the semiconductor industry could adversely affect our business. Increased international political instability in various parts of the world, disruption in air transportation and further enhanced security measures as a result of terrorist attacks may hinder our ability to do business and may increase our costs of operations. We maintain significant manufacturing and research and development operations in Israel, an area that has historically experienced a high degree of political instability, and we are therefore exposed to risks associated with future instability in that region. Such instability could directly impact our ability to operate our business (or our customers' ability to operate their businesses) in the affected region, cause us to incur increased costs in transportation, make such transportation unreliable, increase our insurance costs, and cause international currency markets to fluctuate. Such instability could also have the same effects on our suppliers and their ability to timely deliver their products. If international political instability continues or increases in any region in which we do business, our business and results of operations could be harmed. We are predominantly uninsured for losses and interruptions caused by terrorist acts and acts of war.
We self-insure certain risks including earthquake risk. If one or more of the uninsured events occurs, we could suffer major financial loss.
We purchase insurance to help mitigate the economic impact of certain insurable risks; however, certain risks are uninsurable, are insurable only at significant cost or cannot be mitigated with insurance. Accordingly, we may experience a loss that is not covered by insurance, either because we do not carry applicable insurance or because the loss exceeds the applicable policy amount or is less than the deductible amount of the applicable policy. For example, we do not currently hold earthquake insurance. An earthquake could significantly disrupt our manufacturing operations, a significant portion of which are conducted in California, an area highly susceptible to earthquakes. It could also significantly delay our research and engineering efforts on new products, much of which is also conducted in California. We take steps to minimize the damage that would be caused by an earthquake, but there is no certainty that our efforts will prove successful in the event of an earthquake. We self-insure earthquake risks because we believe this is a prudent financial decision based on our large cash reserves and the high cost and limited coverage available in the earthquake insurance market. Certain other risks are also self-insured either based on a similar cost-benefit analysis, or based on the unavailability of insurance. If one or more of the uninsured events occurs, we could suffer major financial loss.
27
We are exposed to foreign currency exchange rate fluctuations. Although we hedge certain currency risks, we may still be adversely affected by changes in foreign currency exchange rates or declining economic conditions in these countries.
We have some exposure to fluctuations in foreign currency exchange rates, primarily the Euro and the Japanese Yen. We have international subsidiaries that operate and sell our products globally. In addition, an increasing proportion of our manufacturing activities are conducted outside of the United States, and many of the costs associated with such activities are denominated in foreign currencies. We routinely hedge our exposures to certain foreign currencies with certain financial institutions in an effort to minimize the impact of certain currency exchange rate fluctuations, but these hedges may be inadequate to protect us from currency exchange rate fluctuations. To the extent that these hedges are inadequate or if there are significant currency exchange rate fluctuations in currencies for which we do not have hedges in place, our reported financial results or the way we conduct our business could be adversely affected. Furthermore, if a financial counterparty to our hedges experiences financial difficulties or is otherwise unable to honor the terms of the foreign currency hedge, we may experience material financial losses.
We are exposed to fluctuations in interest rates and the market values of our portfolio investments; impairment of our investments could harm our earnings. In addition, we and our stockholders are exposed to risks related to the volatility of the market for our common stock.
Our investment portfolio primarily consists of both corporate and government debt securities that have a maximum effective maturity of three years. The longer the duration of these securities, the more susceptible they are to changes in market interest rates and bond yields. As market interest rates and bond yields increase, those securities with a lower yield-at-cost show a mark-to-market unrealized loss. We have the ability to realize the full value of all these investments upon maturity. However, an impairment of the fair market value of our investments, even if unrealized, must be reflected in our financial statements for the applicable period and may therefore have a material adverse effect on our results of operations for that period.
In addition, the market price for our common stock is volatile and has fluctuated significantly during recent years. The trading price of our common stock could continue to be highly volatile and fluctuate widely in response to various factors, including without limitation conditions in the semiconductor industry and other industries in which we operate, fluctuations in the global economy or capital markets, our operating results or other performance metrics, or adverse consequences experienced by us as a result of any of the risks described elsewhere in this Item 1A. Volatility in the market price of our common stock could cause an investor in our common stock to experience a loss on the value of their investment in us and could also adversely impact our ability to raise capital through the sale of our common stock or to use our common stock as consideration to acquire other companies.
We are exposed to risks in connection with tax and regulatory compliance audits in various jurisdictions.
We are subject to tax and regulatory compliance audits (such as related to customs or product safety requirements) in various jurisdictions, and such jurisdictions may assess additional income or other taxes, penalties, fines or other prohibitions against us. Although we believe our tax estimates are reasonable and that our products and practices comply with applicable regulations, the final determination of any such audit and any related litigation could be materially different from our historical income tax provisions and accruals related to income taxes and other contingencies. The results of an audit or litigation could have a material adverse effect on our operating results or cash flows in the period or periods for which that determination is made.
A change in our effective tax rate can have a significant adverse impact on our business.
We earn profits in, and are therefore potentially subject to taxes in, the U.S. and numerous foreign jurisdictions, including Singapore, Israel and the Cayman Islands, the countries in which we earn the majority of our non-U.S. profits. Due to economic, political or other conditions, tax rates in those jurisdictions may be subject to significant change. A number of factors may adversely impact our future effective tax rates, such as the jurisdictions in which our profits are determined to be earned and taxed; changes in the tax rates imposed by those jurisdictions; the resolution of issues arising from tax audits with various tax authorities; changes in the valuation of our deferred tax assets and liabilities; adjustments to estimated taxes upon finalization of various tax returns; increases in expenses not deductible for tax purposes, including write-offs of acquired in-process research and development and impairment of goodwill in connection with acquisitions; changes in available tax credits; changes in stock-based compensation expense; changes in tax laws or the interpretation of such tax laws (for example, proposals for fundamental United States international tax reform); changes in generally accepted accounting principles; and the repatriation of earnings from outside the United States for which we have not previously provided for United States taxes. A change in our effective tax rate can materially and adversely impact our results from operations.
28
Compliance with federal securities laws, rules and regulations, as well as NASDAQ requirements, is becoming increasingly complex, and the significant attention and expense we must devote to those areas may have an adverse impact on our business.
Federal securities laws, rules and regulations, as well as NASDAQ rules and regulations, require companies to maintain extensive corporate governance measures, impose comprehensive reporting and disclosure requirements, set strict independence and financial expertise standards for audit and other committee members and impose civil and criminal penalties for companies and their chief executive officers, chief financial officers and directors for securities law violations. These laws, rules and regulations have increased, and in the future are expected to continue to increase, the scope, complexity and cost of our corporate governance, reporting and disclosure practices, which could harm our results of operations and divert management’s attention from business operations.
A change in accounting standards or practices or a change in existing taxation rules or practices (or changes in interpretations of such standards, practices or rules) can have a significant effect on our reported results and may even affect reporting of transactions completed before the change is effective.
New accounting pronouncements and taxation rules and varying interpretations of accounting pronouncements and taxation rules have occurred and will continue to occur in the future. Changes to (or revised interpretations or applications of) existing tax or accounting rules or the questioning of current or past practices may adversely affect our reported financial results or the way we conduct our business.
|
ITEM 1B.
|
UNRESOLVED STAFF COMMENTS
|
None.
29
|
ITEM 2.
|
PROPERTIES
|
Information regarding our principal properties as of
June 30, 2014
is set forth below:
|
Location
|
Type
|
Principal Use
|
Square
Footage
|
Ownership
|
||||
|
Milpitas, CA
|
Office, plant and
warehouse
|
Principal Executive Offices, Research, Engineering, Marketing, Manufacturing, Service and Sales Administration
|
727,302
|
Owned
|
||||
|
Westwood, MA
(1)
|
Office and plant
|
Engineering, Marketing, Manufacturing and Service
|
116,908
|
Leased
|
||||
|
Leuven, Belgium
(1)
|
Office, plant and
warehouse
|
Engineering, Marketing and Service and Sales Administration
|
99,315
|
Owned
|
||||
|
Shenzhen, China
|
Office and plant
|
Sales, Service and Manufacturing
|
33,571
|
Leased
|
||||
|
Shanghai, China
|
Office
|
Research, Service and Sales Administration
|
41,184
|
Leased
|
||||
|
Weilburg, Germany
|
Office and plant
|
Engineering, Marketing, Manufacturing, Service and Sales Administration
|
138,119
|
Leased
|
||||
|
Chennai, India
|
Office
|
Engineering
|
33,366
|
Owned
|
||||
|
Migdal Ha’Emek, Israel
|
Office and plant
|
Research, Engineering, Marketing, Manufacturing, Service and Sales Administration
|
191,982
|
Owned
|
||||
|
Yokohama, Japan
|
Office and
warehouse
|
Sales and Service
|
37,418
|
Leased
|
||||
|
Serangoon, Singapore
(2)
|
Office and plant
|
Sales, Service and Manufacturing
|
248,155
|
Owned
|
||||
|
Hsinchu, Taiwan
|
Office
|
Sales and Service
|
73,676
|
Leased
|
||||
|
(1)
|
Portions of this property are sublet, are vacant and marketed to sublease, or are leased to third parties.
|
|
(2)
|
We own the building at our location in Serangoon, Singapore, but the land on which this building resides is leased.
|
As of
June 30, 2014
, we owned or leased a total of approximately 2.0 million square feet of space worldwide, including the locations listed above and office space for smaller sales and service offices in several locations throughout the world. Our operating leases expire at various times through December 31, 2021, subject to renewal, with some of the leases containing renewal option clauses at the fair market value, for additional periods up to five years. Additional information regarding these leases is incorporated herein by reference to Note 13, “Commitments and Contingencies” to the Consolidated Financial Statements. We believe our properties are adequately maintained and suitable for their intended use and that our production facilities have capacity adequate for our current needs.
30
|
ITEM 3.
|
LEGAL PROCEEDINGS
|
The information set forth below under Note 14, “Litigation and Other Legal Matters” to the Consolidated Financial Statements is incorporated herein by reference.
|
ITEM 4.
|
MINE SAFETY DISCLOSURES
|
Not applicable.
31
|
ITEM 5.
|
MARKET FOR REGISTRANT’S COMMON EQUITY, RELATED STOCKHOLDER MATTERS AND ISSUER PURCHASES OF EQUITY SECURITIES
|
Our common stock is listed and traded on the NASDAQ Global Select Market under the symbol “KLAC.”
The prices per share reflected in the following table represent the high and low closing prices for our common stock on the NASDAQ Global Select Market for the periods indicated:
|
|
Year ended June 30, 2014
|
Year ended June 30, 2013
|
|||||||||||||
|
|
High
|
Low
|
High
|
Low
|
|||||||||||
|
First Fiscal Quarter
|
$
|
62.01
|
|
$
|
54.67
|
|
$
|
53.59
|
|
$
|
45.49
|
|
|||
|
Second Fiscal Quarter
|
$
|
66.19
|
|
$
|
59.46
|
|
$
|
48.90
|
|
$
|
43.97
|
|
|||
|
Third Fiscal Quarter
|
$
|
70.02
|
|
$
|
59.73
|
|
$
|
57.02
|
|
$
|
47.37
|
|
|||
|
Fourth Fiscal Quarter
|
$
|
72.64
|
|
$
|
62.30
|
|
$
|
56.98
|
|
$
|
51.30
|
|
|||
We paid dividends to holders of our common stock during each of the quarters in the fiscal years ended
June 30, 2014
and
2013
. The total amount of dividends paid during the fiscal years ended
June 30, 2014
and
2013
was
$298.9 million
and
$265.9 million
, respectively, reflecting an increase of our quarterly dividend from $0.40 to $0.45 per share during the fiscal year ended
June 30, 2014
. On July 8, 2014, we announced that our Board of Directors had authorized a further increase in the level of our quarterly dividend from $0.45 to $0.50 per share. Following such announcement, during the first quarter of the fiscal year ending
June 30, 2015
, our Board of Directors approved a quarterly cash dividend of $0.50 per share, which was declared on
August 7, 2014
and will be paid on
September 2, 2014
to our stockholders of record as of the close of business on
August 18, 2014
.
As of
July 17, 2014
, there were
484
holders of record of our common stock.
Equity Repurchase Plans
The following is a summary of stock repurchases for each month during the fourth quarter of the fiscal year ended
June 30, 2014
(1)
:
|
Period
|
Total Number of
Shares Purchased (2) |
Average Price Paid
per Share |
Maximum Number of
Shares that May Yet Be Purchased Under the Plans or Programs (3) |
||||||
|
April 1, 2014 to April 30, 2014
|
308,700
|
|
$
|
67.62
|
|
2,616,545
|
|
||
|
May 1, 2014 to May 31, 2014
|
310,404
|
|
$
|
63.36
|
|
2,306,141
|
|
||
|
June 1, 2014 to June 30, 2014
|
289,819
|
|
$
|
67.68
|
|
2,016,322
|
|
||
|
Total
|
908,923
|
|
$
|
66.19
|
|
||||
__________________
|
(1)
|
Our Board of Directors has authorized a program for us to repurchase shares of our common stock. The total number and dollar amount of shares repurchased for the fiscal years ended June 30, 2014, 2013 and 2012 were 3.8 million shares ($240.8 million), 5.4 million shares ($273.3 million) and 5.8 million shares ($263.9 million), respectively. On July 8, 2014, we announced that our Board of Directors had authorized us to repurchase up to
13 million
additional shares under this program; for more information, refer to Note 19, "Subsequent Events" to the Consolidated Financial Statements.
|
|
(2)
|
All shares were purchased pursuant to the publicly announced repurchase program described in footnote 1 above. Shares are reported based on the settlement date of the applicable repurchase.
|
|
(3)
|
The stock repurchase program has no expiration date. Future repurchases of our common stock under our repurchase program may be effected through various different repurchase transaction structures, including isolated open market transactions or systematic repurchase plans.
|
32
Stock Performance Graph and Cumulative Total Return
The following graph compares the cumulative 5-year total return attained by stockholders on our common stock relative to the cumulative total returns of the S&P 500 Index (as required by SEC regulations) and the Philadelphia Semiconductor Index (PHLX). The graph tracks the performance of a $100 investment in our common stock and in each of the indices (with the reinvestment of all dividends) from June 30, 2009 to
June 30, 2014
.
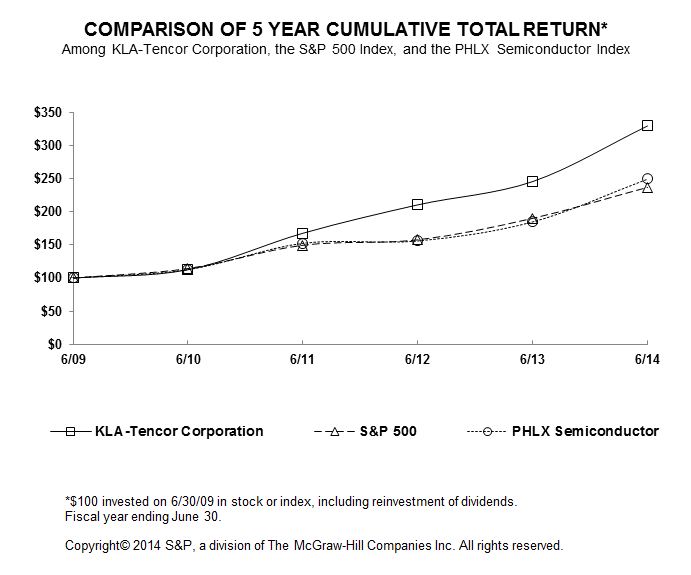
|
6/09
|
6/10
|
6/11
|
6/12
|
6/13
|
6/14
|
||||||
|
KLA-Tencor Corporation
|
$100.00
|
$112.53
|
$167.66
|
$210.45
|
$245.64
|
$329.57
|
|||||
|
S&P 500
|
$100.00
|
$114.43
|
$149.55
|
$157.70
|
$190.18
|
$236.98
|
|||||
|
PHLX Semiconductor
|
$100.00
|
$112.70
|
$152.41
|
$156.03
|
$184.76
|
$249.43
|
|||||
__________________
* Assumes $100 invested on June 30, 2009 in stock or index, including reinvestment of dividends.
Our fiscal year ends June 30. The comparisons in the graph above are based upon historical data and are not necessarily indicative of, nor intended to forecast, future stock price performance.
33
|
ITEM 6.
|
SELECTED FINANCIAL DATA
|
The following tables include selected consolidated summary financial data for each of our last five fiscal years. This data should be read in conjunction with Item 8, “Financial Statements and Supplementary Data,” and Item 7, “Management’s Discussion and Analysis of Financial Condition and Results of Operations” in this Annual Report on Form 10-K.
|
Year ended June 30,
|
|||||||||||||||||||
|
(In thousands, except per share data)
|
2014
|
2013
|
2012
|
2011
|
2010
|
||||||||||||||
|
Consolidated Statements of Operations:
|
|||||||||||||||||||
|
Total revenues
|
$
|
2,929,408
|
|
$
|
2,842,781
|
|
$
|
3,171,944
|
|
$
|
3,175,167
|
|
$
|
1,820,760
|
|
||||
|
Income from operations
|
$
|
772,070
|
|
$
|
729,685
|
|
$
|
1,016,325
|
|
$
|
1,160,330
|
|
$
|
314,166
|
|
||||
|
Net income
|
$
|
582,755
|
|
$
|
543,149
|
|
$
|
756,015
|
|
$
|
794,488
|
|
$
|
212,300
|
|
||||
|
Cash dividends declared per share
|
$
|
1.80
|
|
$
|
1.60
|
|
$
|
1.40
|
|
$
|
1.00
|
|
$
|
0.60
|
|
||||
|
Net income per share:
|
|||||||||||||||||||
|
Basic
|
$
|
3.51
|
|
$
|
3.27
|
|
$
|
4.53
|
|
$
|
4.75
|
|
$
|
1.24
|
|
||||
|
Diluted
|
$
|
3.47
|
|
$
|
3.21
|
|
$
|
4.44
|
|
$
|
4.66
|
|
$
|
1.23
|
|
||||
|
As of June 30,
|
|||||||||||||||||||
|
2014
|
2013
|
2012
|
2011
|
2010
|
|||||||||||||||
|
Consolidated Balance Sheets:
|
|||||||||||||||||||
|
Cash, cash equivalents and marketable securities
|
$
|
3,152,637
|
|
$
|
2,918,881
|
|
$
|
2,534,444
|
|
$
|
2,038,535
|
|
$
|
1,534,044
|
|
||||
|
Working capital
|
$
|
3,691,219
|
|
$
|
3,489,971
|
|
$
|
3,301,136
|
|
$
|
2,797,149
|
|
$
|
2,063,678
|
|
||||
|
Total assets
|
$
|
5,538,664
|
|
$
|
5,287,357
|
|
$
|
5,100,308
|
|
$
|
4,675,521
|
|
$
|
3,907,056
|
|
||||
|
Long-term debt
|
$
|
747,919
|
|
$
|
747,376
|
|
$
|
746,833
|
|
$
|
746,290
|
|
$
|
745,747
|
|
||||
|
Total stockholders’ equity
|
$
|
3,669,346
|
|
$
|
3,482,152
|
|
$
|
3,315,595
|
|
$
|
2,860,893
|
|
$
|
2,246,611
|
|
||||
34
|
ITEM 7.
|
MANAGEMENT'S DISCUSSION AND ANALYSIS OF FINANCIAL CONDITION AND RESULTS OF OPERATIONS
|
The following discussion of our financial condition and results of operations should be read in conjunction with our Consolidated Financial Statements and the related notes included in Item 8, “Financial Statements and Supplementary Data,” in this Annual Report on Form 10-K. This discussion contains forward-looking statements, which involve risks and uncertainties. Our actual results could differ materially from those anticipated in the forward-looking statements as a result of certain factors, including but not limited to those discussed in Item 1A, “Risk Factors” and elsewhere in this Annual Report on Form 10-K. (See “Special Note Regarding Forward-Looking Statements.”)
CRITICAL ACCOUNTING ESTIMATES AND POLICIES
The preparation of our consolidated financial statements in conformity with accounting principles generally accepted in the United States of America requires management to make estimates and assumptions in applying our accounting policies that affect the reported amounts of assets, liabilities, revenues and expenses, and related disclosure of contingent assets and liabilities. We base these estimates and assumptions on historical experience, and evaluate them on an on-going basis to ensure that they remain reasonable under current conditions. Actual results could differ from those estimates. We discuss the development and selection of the critical accounting estimates with the Audit Committee of our Board of Directors on a quarterly basis, and the Audit Committee has reviewed our related disclosure in this Annual Report on Form 10-K. The accounting policies that reflect our more significant estimates, judgments and assumptions and which we believe are the most critical to aid in fully understanding and evaluating our reported financial results include the following:
Revenue Recognition.
We recognize revenue when persuasive evidence of an arrangement exists, delivery has occurred or services have been rendered, the selling price is fixed or determinable, and collectibility is reasonably assured. We derive revenue from three sources—sales of systems, spare parts and services. In general, we recognize revenue for systems when the system has been installed, is operating according to predetermined specifications and is accepted by the customer. When a customer delays installation for delivered products for which we have demonstrated a history of successful installation and acceptance, we recognize revenue upon customer acceptance. Under certain circumstances, however, we recognize revenue prior to acceptance from the customer, as follows:
|
•
|
When the customer fab has previously accepted the same tool, with the same specifications, and when we can objectively demonstrate that the tool meets all of the required acceptance criteria.
|
|
•
|
When system sales to independent distributors have no installation requirement, contain no acceptance agreement, and 100% payment is due based upon shipment.
|
|
•
|
When the installation of the system is deemed perfunctory.
|
|
•
|
When the customer withholds acceptance due to issues unrelated to product performance, in which case revenue is recognized when the system is performing as intended and meets predetermined specifications.
|
In circumstances in which we recognize revenue prior to installation, the portion of revenue associated with installation is deferred based on estimated fair value, and that revenue is recognized upon completion of the installation.
In many instances, products are sold in stand-alone arrangements. Services are sold separately through renewals of annual maintenance contracts. We also allow for multiple element revenue arrangements in cases where certain elements of a sales arrangement are not delivered and accepted in one reporting period. To determine the relative fair value of each element in a revenue arrangement, we allocate arrangement consideration based on the selling price hierarchy. For substantially all of the arrangements with multiple deliverables pertaining to products and services, we use vendor-specific objective evidence (“VSOE”) or third-party evidence (“TPE”) to allocate the selling price to each deliverable. We determine TPE based on historical prices charged for products and services when sold on a stand-alone basis. When we are unable to establish relative selling price using VSOE or TPE, we use estimated selling price (“ESP”) in our allocation of arrangement consideration. The objective of ESP is to determine the price at which we would transact a sale if the product or service were sold on a stand-alone basis. ESP could potentially be used for new or customized products. We regularly review relative selling prices and maintain internal controls over the establishment and updates of these estimates. In a multiple element revenue arrangement, we defer revenue recognition associated with the relative fair value of each undelivered element until that element is delivered to the customer. To be considered a separate element, the product or service in question must represent a separate unit of accounting, which means that such product or service must fulfill the following criteria: (a) the delivered item(s) has value to the customer on a stand-alone basis; and (b) if the arrangement includes a general right of return relative to the delivered item(s), delivery or performance of the undelivered item(s) is considered probable and substantially in our control. If the arrangement does not meet all the above criteria, the entire amount of the sales contract is deferred until all elements are accepted by the customer.
35
Trade-in rights are occasionally granted to customers to trade in tools in connection with subsequent purchases. We estimate the value of the trade-in right and reduce the revenue recognized on the initial sale. This amount is recognized at the earlier of the exercise of the trade-in right or the expiration of the trade-in right.
Spare parts revenue is recognized when the product has been shipped, risk of loss has passed to the customer and collection of the resulting receivable is probable.
Service and maintenance contract revenue is recognized ratably over the term of the maintenance contract. Revenue from services performed in the absence of a maintenance contract, including consulting and training revenue, is recognized when the related services are performed and collectibility is reasonably assured.
We sell stand-alone software that is subject to the software revenue recognition guidance. We periodically review selling prices to determine whether VSOE exists, and in some situations where we are unable to establish VSOE for undelivered elements, such as post-contract service, revenue is recognized ratably over the term of the service contract.
We also defer the fair value of non-standard warranty bundled with equipment sales as unearned revenue. Non-standard warranty includes services incremental to the standard 40-hour per week coverage for
12
months. Non-standard warranty is recognized ratably as revenue when the applicable warranty term period commences.
The deferred system profit balance equals the amount of deferred system revenue that was invoiced and due on shipment, less applicable product and warranty costs. Deferred system revenue represents the value of products that have been shipped and billed to customers which have not met our revenue recognition criteria. Deferred system profit does not include the profit associated with product shipments to certain customers in Japan, to whom title does not transfer until customer acceptance. Shipments to such customers in Japan are classified as inventory at cost until the time of acceptance.
We enter into sales arrangements that may consist of multiple deliverables of our products and services where certain elements of the sales arrangement are not delivered and accepted in one reporting period. Judgment is required to properly identify the accounting units of the multiple deliverable transactions and to determine the manner in which revenue should be allocated among the accounting units. Additionally, judgment is required to interpret various commercial terms and determine when all criteria of revenue recognition have been met in order for revenue recognition to occur in the appropriate accounting period. While changes in the allocation of the estimated selling price between the accounting units will not affect the amount of total revenue recognized for a particular arrangement, any material changes in these allocations could impact the timing of revenue recognition, which could have a material effect on our financial position and results of operations.
Inventories.
Inventories are stated at the lower of cost (on a first-in, first-out basis) or market. Demonstration units are stated at their manufacturing cost and written down to their net realizable value. Our manufacturing overhead standards for product costs are calculated assuming full absorption of forecasted spending over projected volumes, adjusted for excess capacity. Abnormal inventory costs such as costs of idle facilities, excess freight and handling costs, and spoilage are recognized as current period charges. We write down product inventory based on forecasted demand and technological obsolescence and parts inventory based on forecasted usage. These factors are impacted by market and economic conditions, technology changes, new product introductions and changes in strategic direction and require estimates that may include uncertain elements. Actual demand may differ from forecasted demand, and such differences may have a material effect on recorded inventory values.
Warranty.
We provide standard warranty coverage on our systems for 40 hours per week for
12
months, providing labor and parts necessary to repair the systems during the warranty period. We account for the estimated warranty cost as a charge to costs of revenues when revenue is recognized. The estimated warranty cost is based on historical product performance and field expenses. Utilizing actual service records, we calculate the average service hours and parts expense per system and apply the actual labor and overhead rates to determine the estimated warranty charge. We update these estimated charges on a quarterly basis. The actual product performance and/or field expense profiles may differ, and in those cases we adjust our warranty accruals accordingly. See Note 13, “Commitments and Contingencies” to the Consolidated Financial Statements for a detailed description.
36
Allowance for Doubtful Accounts.
A majority of our trade receivables are derived from sales to large multinational semiconductor manufacturers throughout the world. In order to monitor potential credit losses, we perform ongoing credit evaluations of our customers’ financial condition. An allowance for doubtful accounts is maintained for probable credit losses based upon our assessment of the expected collectibility of the accounts receivable. The allowance for doubtful accounts is reviewed on a quarterly basis to assess the adequacy of the allowance. We take into consideration (1) any circumstances of which we are aware of a customer’s inability to meet its financial obligations; and (2) our judgments as to prevailing economic conditions in the industry and their impact on our customers. If circumstances change, such that the financial conditions of our customers are adversely affected and they are unable to meet their financial obligations to us, we may need to record additional allowances, which would result in a reduction of our net income.
Stock-Based Compensation.
We account for stock-based awards granted to employees for services based on the fair value of those awards. The fair value of stock-based awards is measured at the grant date and is recognized as expense over the employee’s requisite service period. The fair value is determined using a Black-Scholes valuation model for stock options and for purchase rights under our Employee Stock Purchase Plan. The Black-Scholes option-pricing model requires the input of assumptions, including the option’s expected term and the expected price volatility of the underlying stock. The expected stock price volatility assumption is based on the market-based historical implied volatility from traded options of our common stock. The fair value for restricted stock units granted without “dividend equivalent” rights is determined using the closing price of our common stock on the grant date for restricted stock units, adjusted to exclude the present value of dividends which are not accrued on the restricted stock units. The fair value for restricted stock units granted with “dividend equivalent” rights is determined using the closing price of our common stock on the grant date. The award holder is not entitled to receive payments under dividend equivalent rights unless the associated restricted stock unit award vests (i.e., the award holder is entitled to receive credits, payable in cash or shares of our common stock, equal to the cash dividends that would have been received on the shares of our common stock underlying the restricted stock units had the shares been issued and outstanding on the dividend record date, but such dividend equivalents are only paid subject to the recipient satisfying the vesting requirements of the underlying award). We have elected not to include the indirect tax effects of stock-based compensation deductions when calculating the windfall benefits and therefore recognize the full effect of these deductions in the income statement in the period in which the taxable event occurs.
Accounting for Cash-Based Long-Term Incentive Compensation.
Cash-based long-term incentive (“Cash LTI”) awards issued to employees under our Cash LTI program vest in
four
equal installments, with
25%
of the aggregate amount of the Cash LTI award vesting on each yearly anniversary of the grant date over a
four
-year period. In order to receive payments under a Cash LTI award, participants must remain employed by us as of the applicable award vesting date. Compensation expense related to the Cash LTI awards is recognized over the vesting term, which is adjusted for the impact of estimated forfeitures.
Contingencies and Litigation.
We are subject to the possibility of losses from various contingencies. Considerable judgment is necessary to estimate the probability and amount of any loss from such contingencies. An accrual is made when it is probable that a liability has been incurred or an asset has been impaired and the amount of loss can be reasonably estimated. We accrue a liability and recognize as expense the estimated costs expected to be incurred over the next twelve months to defend or settle asserted and unasserted claims existing as of the balance sheet date. See Note 13, “Commitments and Contingencies” and Note 14, “Litigation and Other Legal Matters” to the Consolidated Financial Statements for a detailed description.
Goodwill and Intangible Assets.
We assess goodwill for impairment annually as well as whenever events or changes in circumstances indicate that the carrying value may not be recoverable. Long-lived intangible assets are tested for recoverability whenever events or changes in circumstances indicate that their carrying amounts may not be recoverable. See Note 6, “Goodwill and Purchased Intangible Assets” to the Consolidated Financial Statements for a detailed description. Goodwill represents the excess of the purchase price over the fair value of the net tangible and identifiable intangible assets acquired in each business combination. We performed our annual qualitative assessment of the goodwill by reporting unit in our second quarter of fiscal year
2014
and concluded that there was no impairment. There have been no significant events or circumstances affecting the valuation of goodwill subsequent to our annual impairment test. The next annual evaluation of the goodwill by reporting unit will be performed in the second quarter of the fiscal year ending June 30,
2015
.
If we were to encounter challenging economic conditions, such as a decline in our operating results, an unfavorable industry or macroeconomic environment, a substantial decline in our stock price, or any other adverse change in market conditions, we may be required to perform the two-step quantitative goodwill impairment analysis. In addition, if such conditions have the effect of changing one of the critical assumptions or estimates we use to calculate the value of our goodwill or intangible assets, we may be required to record goodwill and/or intangible asset impairment charges in future periods. It is not possible at this time to determine if any such future impairment charge would occur or, if it does, whether such charge would be material to our results of operations.
37
Income Taxes.
We account for income taxes in accordance with the authoritative guidance, which requires that deferred tax assets and liabilities be recognized using enacted tax rates for the effect of temporary differences between the book and tax bases of recorded assets and liabilities. The guidance also requires that deferred tax assets be reduced by a valuation allowance if it is more likely than not that a portion of the deferred tax asset will not be realized. We have determined that a valuation allowance is necessary against a portion of the deferred tax assets, but we anticipate that our future taxable income will be sufficient to recover the remainder of our deferred tax assets. However, should there be a change in our ability to recover our deferred tax assets that are not subject to a valuation allowance, we could be required to record an additional valuation allowance against such deferred tax assets. This would result in an increase to our tax provision in the period in which we determine that the recovery is not probable.
On a quarterly basis, we provide for income taxes based upon an estimated annual effective income tax rate. The effective tax rate is highly dependent upon the geographic composition of worldwide earnings, tax regulations governing each region, availability of tax credits and the effectiveness of our tax planning strategies. We carefully monitor the changes in many factors and adjust our effective income tax rate on a timely basis. If actual results differ from these estimates, this could have a material effect on our financial condition and results of operations.
In addition, the calculation of our tax liabilities involves dealing with uncertainties in the application of complex tax regulations. In accordance with the authoritative guidance on accounting for uncertainty in income taxes, we recognize liabilities for uncertain tax positions based on the two-step process prescribed within the interpretation. The first step is to evaluate the tax position for recognition by determining if the weight of available evidence indicates that it is more likely than not that the position will be sustained in audit, including resolution of related appeals or litigation processes, if any. The second step is to measure the tax benefit as the largest amount that is more than 50% likely of being realized upon ultimate settlement. We reevaluate these uncertain tax positions on a quarterly basis. This evaluation is based on factors including, but not limited to, changes in facts or circumstances, changes in tax law, effectively settled issues under audit and new audit activity. Any change in these factors could result in the recognition of a tax benefit or an additional charge to the tax provision.
Valuation of Marketable Securities.
Our investments in available-for-sale securities are reported at fair value. Unrealized gains related to increases in the fair value of investments and unrealized losses related to decreases in the fair value are included in accumulated other comprehensive income (loss), net of tax, as reported on our Consolidated Statements of Stockholders’ Equity. However, changes in the fair value of investments impact our net income only when such investments are sold or an impairment charge is recognized. Realized gains and losses on the sale of securities are determined by specific identification of the security’s cost basis. We periodically review our investment portfolio to determine if any investment is other-than-temporarily impaired due to changes in credit risk or other potential valuation concerns, which would require us to record an impairment charge in the period during which any such determination is made. In making this judgment, we evaluate, among other things, the duration of the investment, the extent to which the fair value of an investment is less than its cost, the credit rating and any changes in credit rating for the investment, default and loss rates of the underlying collateral, structure and credit enhancements to determine if a credit loss may exist. Our assessment that an investment is not other-than-temporarily impaired could change in the future due to new developments or changes in our strategies or assumptions related to any particular investment.
Effects of Recent Accounting Pronouncements
Recently Adopted
In December 2011, the Financial Accounting Standards Board ("FASB") issued an accounting standard update requiring enhanced disclosure about certain financial instruments and derivative instruments that are offset in the balance sheet or subject to an enforceable master netting arrangement or similar agreement. We adopted the disclosure requirement in the first quarter of our fiscal year ended June 30, 2014, and it did not have an impact on our financial position, results of operations or cash flows.
In February 2013, the FASB issued an accounting standard update on the reporting of reclassifications out of accumulated other comprehensive income of various components, which was originally deferred by the FASB in December 2011. The February 2013 update did not change the then current requirements for reporting net income or other comprehensive income in financial statements. However, this update required an entity to present parenthetically (on the face of the financial statements, in the notes or, in some cases, cross-referenced to related footnote disclosures) significant amounts reclassified from each component of accumulated other comprehensive income and the income statement line items affected by the reclassification. The amendment reflected in the February 2013 update was adopted by us in the first quarter of our fiscal year ended June 30, 2014, and it did not have an impact on our financial position, results of operations or cash flows as it was disclosure-only in nature.
38
Updates Not Yet Effective
In July 2013, the FASB issued an accounting standard update that provides explicit guidance on the financial statement presentation of an unrecognized tax benefit when a net operating loss carryforward, a similar tax loss or a tax credit carryforward exists. Under the new standard update, in most circumstances, an unrecognized tax benefit, or a portion of an unrecognized tax benefit, should be presented in a company's financial statements as a reduction to a deferred tax asset for a net operating loss carryforward, a similar tax loss or a tax credit carryforward. This accounting standard update will be effective for our interim period ending September 30, 2014 and applied prospectively with early adoption permitted. We do not anticipate that this accounting standard update will have a significant impact on our consolidated financial statements upon adoption.
In May 2014, the FASB issued an accounting standard update regarding revenue from customer contracts to transfer goods and services or non-financial assets, unless the contracts are covered by other standards (for example, insurance or lease contracts). Under the new guidance, an entity should recognize revenue to depict the transfer of promised goods or services to customers in an amount that reflects the consideration to which the entity expects to be entitled in exchange for those goods or services. The updates are effective for us beginning the first quarter of our fiscal year ending June 30, 2018. Early adoption is not permitted. We are currently evaluating the impact of this accounting standard update on our consolidated financial statements.
In June 2014, the FASB issued an accounting standard update regarding stock-based compensation that clarifies the accounting when terms of an award provide that a performance target could be achieved after the requisite service period. The amendments require that a performance target that affects vesting which could be achieved after the requisite service period be treated as a performance condition. The update is effective for us beginning the first quarter of our fiscal year ending June 30, 2017, with early adoption permitted. We are currently evaluating the impact of this accounting standard update on our consolidated financial statements.
EXECUTIVE SUMMARY
KLA-Tencor Corporation is a leading supplier of process control and yield management solutions for the semiconductor and related nanoelectronics industries. Our broad portfolio of defect inspection and metrology products, and related service, software and other offerings, primarily supports IC manufacturers throughout the entire semiconductor fabrication process, from research and development to final volume production. We provide leading-edge equipment, software and support that enable IC manufacturers to identify, resolve and manage significant advanced technology manufacturing process challenges and obtain higher finished product yields at lower overall cost. In addition to serving the semiconductor industry, we also provide a range of technology solutions to a number of other high technology industries, including LED and data storage industries, as well as general materials research.
Our products and services are used by the vast majority of bare wafer, IC, lithography reticle (“reticle” or “mask”) and disk manufacturers around the world. Our products, services and expertise are used by our customers to measure and control nanometric-level manufacturing processes, and to detect, analyze and resolve critical product defects that arise in that environment. Our revenues are driven largely by our customers' spending on capital equipment and related maintenance services necessary to support key transitions in their underlying product technologies, or to increase their production volumes in response to market demand. Our semiconductor customers generally operate in one or more of the three major semiconductor markets -- memory, foundry and logic. All three of these markets are characterized by rapid technological changes and sudden shifts in end-user demand, which influence the level and pattern of our customers' spending on our products and services. Although capital spending in all three semiconductor markets has historically been very cyclical, the demand for more advanced and lower cost chips used in a growing number of consumer electronics, communications, data processing, and industrial and automotive products has resulted over the long term in a favorable demand environment for our process control and yield management solutions.
As we are a supplier to the global semiconductor and semiconductor-related industries, our customer base continues to become more highly concentrated over time, thereby increasing the potential impact of a sudden change in capital spending by a major customer on our revenues and profitability. As our customer base becomes increasingly more concentrated, large orders from a relatively limited number of customers account for a substantial portion of our sales, which potentially exposes us to more volatility for revenues and earnings. In addition, we are subject to the cyclical capital spending that has historically characterized the semiconductor and semiconductor-related industries. The timing, length, intensity and volatility of the capacity-oriented capital spending cycles of our customers are unpredictable.
39
However, in addition to these trends of consolidation and cyclicality, the semiconductor industry has also been significantly impacted by constant technological innovation. The growing use of increasingly sophisticated semiconductor devices has caused many of our customers to invest in additional semiconductor manufacturing capabilities and capacity. These investments have included process control and yield management equipment and services and have had a significant favorable impact on our revenues over the long term.
Over the past four years, we have experienced high levels of customer demand for our products, a result of growth in increasingly sophisticated mobile devices incorporating advanced ICs. The demand for our products is driven by our customers’ needs to solve the process challenges that they face as they adopt new technologies required to fabricate these advanced ICs. We cannot predict the duration and sustainability of the recent favorable business conditions, and our revenue levels in the next fiscal year will depend upon whether our customers maintain recent levels of investment in process control equipment. Our earnings for the next fiscal year will depend not only on our revenue levels, but also on the amount of research and development spending required to meet our customers' technology roadmaps. We have continued to scale our production volumes and capacity to meet anticipated customer requirements and remain at risk of incurring significant inventory-related and other restructuring charges if business conditions deteriorate. We believe that, over the long term, our customers will continue to invest in advanced technologies and new materials to enable smaller design rules and higher density applications, as well as to reduce cost. We expect, particularly among our foundry and logic customers, that this in turn will drive high levels of long-term adoption of process control equipment and services that reduce semiconductor defectivity and improve manufacturing yields, reinforcing the longer-term growth drivers in our industry.
The following table sets forth some of our key consolidated financial information for each of our last three fiscal years:
|
|
Year ended June 30,
|
||||||||||
|
(Dollar amounts in thousands)
|
2014
|
2013
|
2012
|
||||||||
|
Total revenues
|
$
|
2,929,408
|
|
$
|
2,842,781
|
|
$
|
3,171,944
|
|
||
|
Costs of revenues
|
$
|
1,232,962
|
|
$
|
1,237,452
|
|
$
|
1,330,016
|
|
||
|
Gross margin percentage
|
58
|
%
|
56
|
%
|
58
|
%
|
|||||
|
Net income
|
$
|
582,755
|
|
$
|
543,149
|
|
$
|
756,015
|
|
||
|
Diluted income per share
|
$
|
3.47
|
|
$
|
3.21
|
|
$
|
4.44
|
|
||
Total revenues during the fiscal year ended
June 30, 2014
increased by 3% compared to the fiscal year ended
June 30, 2013
, as our customers continued to invest in process control and services to improve manufacturing yields as they adopt advanced technologies and new materials to enable smaller design rules required to fabricate advanced ICs.
Total revenues during the fiscal year ended
June 30, 2013
decreased compared to the fiscal year ended June 30, 2012. Revenue decreases from sales of both our defect inspection and metrology products for the fiscal year ended
June 30, 2013
reflected typical cyclicality in capacity-oriented capital spending by logic and memory chip manufacturers, as well as delays in the procurement of next-generation equipment required to facilitate the transition to extreme ultraviolet lithography.
Revenues and Gross Margin
|
|
Year ended June 30,
|
|
|
|
|
||||||||||||||||||||
|
(Dollar amounts in thousands)
|
2014
|
2013
|
2012
|
FY14 vs. FY13
|
FY13 vs. FY12
|
||||||||||||||||||||
|
Revenues:
|
|||||||||||||||||||||||||
|
Product
|
$
|
2,286,437
|
|
$
|
2,247,147
|
|
$
|
2,597,755
|
|
$
|
39,290
|
|
2
|
%
|
$
|
(350,608
|
)
|
(13
|
)%
|
||||||
|
Service
|
642,971
|
|
595,634
|
|
574,189
|
|
47,337
|
|
8
|
%
|
21,445
|
|
4
|
%
|
|||||||||||
|
Total revenues
|
$
|
2,929,408
|
|
$
|
2,842,781
|
|
$
|
3,171,944
|
|
$
|
86,627
|
|
3
|
%
|
$
|
(329,163
|
)
|
(10
|
)%
|
||||||
|
Costs of revenues
|
$
|
1,232,962
|
|
$
|
1,237,452
|
|
$
|
1,330,016
|
|
$
|
(4,490
|
)
|
—
|
%
|
$
|
(92,564
|
)
|
(7
|
)%
|
||||||
|
Gross margin percentage
|
58
|
%
|
56
|
%
|
58
|
%
|
2
|
%
|
(2
|
)%
|
|||||||||||||||
Product revenues
Our business is affected by the increasingly concentrated nature of our semiconductor manufacturer customer base and the cyclicality of the capital equipment procurement practices of those manufacturers, with revenues directly impacted by their investment patterns. Our product revenues in any particular period are significantly impacted by the amount of new orders that we receive during that period and, due to the duration of manufacturing and installation cycles, in the preceding periods.
40
Product revenues increased by 2% in the fiscal year ended
June 30, 2014
compared to the fiscal year ended
June 30, 2013
, as our customers increased their investments in defect inspection capabilities to address the yield challenges caused by the introduction of new technologies and architectures, and added production capacity to meet the growing needs for advanced ICs demanded in an environment of rising global demand for mobile devices.
Product revenues decreased in the fiscal year ended
June 30, 2013
compared to the fiscal year ended
June 30, 2012
as a result of a decline in overall semiconductor industry capital spending. Revenue decreases from sales of both our defect inspection and metrology products reflected typical cyclicality in capacity-oriented capital spending by logic and memory chip manufacturers, as well as delays in the procurement of next-generation equipment required to facilitate the transition to extreme ultraviolet lithography.
Service revenues
Service revenues are generated from maintenance contracts, as well as billable time and material service calls made to our customers after the expiration of the warranty period. The amount of our service revenues is typically a function of the number of post-warranty systems installed at our customers’ sites and the utilization of those systems, but it is also impacted by other factors, such as our rate of service contract renewals, the types of systems being serviced and fluctuations in foreign exchange rates. Service revenues increased sequentially over the fiscal years ended June 30,
2012
,
2013
and
2014
as a result of an increase in the number of post-warranty systems installed at our customers' sites over that time period.
Revenues - Top Customers
The following customers each accounted for more than 10% of our total revenues for the indicated periods:
|
Year ended June 30,
|
||||
|
2014
|
2013
|
2012
|
||
|
Intel Corporation
|
Intel Corporation
|
Samsung Electronics Co., Ltd.
|
||
|
Samsung Electronics Co., Ltd.
|
Taiwan Semiconductor Manufacturing Company Limited
|
Taiwan Semiconductor Manufacturing Company Limited
|
||
|
Taiwan Semiconductor Manufacturing Company Limited
|
|
|
||
Revenues by region
Revenues by region for the periods indicated were as follows:
|
|
Year ended June 30,
|
|||||||||||||||||||
|
(Dollar amounts in thousands)
|
2014
|
2013
|
2012
|
|||||||||||||||||
|
North America
|
$
|
705,159
|
|
24
|
%
|
$
|
846,125
|
|
30
|
%
|
$
|
675,034
|
|
21
|
%
|
|||||
|
Taiwan
|
741,470
|
|
25
|
%
|
936,445
|
|
33
|
%
|
872,583
|
|
28
|
%
|
||||||||
|
Japan
|
334,653
|
|
11
|
%
|
310,204
|
|
11
|
%
|
415,475
|
|
13
|
%
|
||||||||
|
Europe & Israel
|
306,779
|
|
11
|
%
|
211,121
|
|
7
|
%
|
323,902
|
|
10
|
%
|
||||||||
|
Korea
|
371,139
|
|
13
|
%
|
292,724
|
|
10
|
%
|
611,462
|
|
19
|
%
|
||||||||
|
Rest of Asia
|
470,208
|
|
16
|
%
|
246,162
|
|
9
|
%
|
273,488
|
|
9
|
%
|
||||||||
|
Total
|
$
|
2,929,408
|
|
100
|
%
|
$
|
2,842,781
|
|
100
|
%
|
$
|
3,171,944
|
|
100
|
%
|
|||||
A significant portion of our revenues continues to be generated in Asia, where a substantial portion of the world’s semiconductor manufacturing capacity is located, and we expect that trend to continue.
Gross margin
Our gross margin fluctuates with revenue levels and product mix and is affected by variations in costs related to manufacturing and servicing our products, including our ability to scale our operations efficiently and effectively in response to prevailing business conditions.
41
The following table summarizes the major factors that contributed to the changes in gross margin percentage:
|
Gross Margin Percentage
|
||
|
Fiscal year ended June 30, 2012
|
58.1
|
%
|
|
Revenue volume of products and services
|
(1.9
|
)%
|
|
Mix of products and services sold
|
0.4
|
%
|
|
Manufacturing labor, overhead and efficiencies
|
(0.1
|
)%
|
|
Other service and manufacturing costs
|
—
|
%
|
|
Fiscal year ended June 30, 2013
|
56.5
|
%
|
|
Revenue volume of products and services
|
—
|
%
|
|
Mix of products and services sold
|
(0.3
|
)%
|
|
Manufacturing labor, overhead and efficiencies
|
0.2
|
%
|
|
Other service and manufacturing costs
|
1.5
|
%
|
|
Fiscal year ended June 30, 2014
|
57.9
|
%
|
Changes in gross margin percentage driven by revenue volume of products and services reflect our ability to leverage existing infrastructure to generate higher revenues. It also includes the effect of fluctuations in foreign exchange rates, average customer pricing and customer revenue deferrals associated with volume purchase agreements. Changes in gross margin percentage from mix of products and services sold reflect the impact of changes in the composition within product and service offerings. Changes in gross margin percentage from manufacturing labor, overhead and efficiencies reflect our ability to manage costs and drive productivity as we scale our manufacturing activity to respond to customer requirements; this includes the impact of capacity utilization, use of overtime and variability of cost structure. Changes in gross margin percentage from other service and manufacturing costs include the impact of customer support costs, including the efficiencies with which we deliver services to our customers, and the effectiveness with which we manage our production plans and inventory risk.
Our gross margin increased to
57.9%
during the fiscal year ended
June 30, 2014
from
56.5%
during the fiscal year ended
June 30, 2013
primarily due to lower charges for inventory obsolescence as well as manufacturing and service efficiencies, partially offset by a less favorable mix of products and services sold.
Our gross margin decreased to
56.5%
during the fiscal year ended
June 30, 2013
from
58.1%
during the fiscal year ended
June 30, 2012
primarily due to lower revenue volume, partially offset by a more favorable mix of products and certain manufacturing efficiencies.
Engineering, Research and Development (“R&D”)
|
|
Year ended June 30,
|
|
|
|
|
||||||||||||||||||||
|
(Dollar amounts in thousands)
|
2014
|
2013
|
2012
|
FY14 vs. FY13
|
FY13 vs. FY12
|
||||||||||||||||||||
|
R&D expenses
|
$
|
539,469
|
|
$
|
487,832
|
|
$
|
452,937
|
|
$
|
51,637
|
|
11
|
%
|
$
|
34,895
|
|
8
|
%
|
||||||
|
R&D expenses as a percentage of total revenues
|
18
|
%
|
17
|
%
|
14
|
%
|
1
|
%
|
3
|
%
|
|||||||||||||||
Our R&D expenses have generally increased over time, including significant increases over the past two fiscal years primarily due to higher costs associated with advanced product and technology development projects. We incur significant costs associated with these projects, including compensation for engineering talent, engineering material costs, and other expenses, as technological innovation is essential to our success. During certain periods, R&D expenses may fluctuate relative to product development phases and project timing.
R&D expenses during the fiscal year ended
June 30, 2014
were higher compared to the fiscal year ended
June 30, 2013
, primarily due to an increase in employee-related expenses of $41.8 million as a result of hiring additional engineering talent and an increase in travel expenses of $2.6 million, as well as a $4.2 million reduction in external funding used to offset the cost of R&D activities.
R&D expenses during the fiscal year ended
June 30, 2013
increased compared to the fiscal year ended
June 30, 2012
, primarily due to the stage and timing of our development projects, as described above. R&D expenses during the fiscal year ended
June 30, 2013
were impacted by an increase in engineering material and depreciation of $26.1 million and an increase in employee-related expenses of $9.0 million as a result of additional engineering headcount.
42
R&D expenses include the benefit of
$8.2 million
,
$12.4 million
and
$6.9 million
of external funding received during the fiscal years ended
June 30, 2014
,
2013
and
2012
, respectively, for certain strategic development programs, primarily from government grants.
Our future operating results will depend significantly on our ability to produce products and provide services that have a competitive advantage in our marketplace. To do this, we believe that we must continue to make substantial investments in our research and development. We remain committed to product development in new and emerging technologies as we address the yield challenges our customers face at future technology nodes.
Selling, General and Administrative (“SG&A”)
|
|
Year ended June 30,
|
|
|
|
|
||||||||||||||||||||
|
(Dollar amounts in thousands)
|
2014
|
2013
|
2012
|
FY14 vs. FY13
|
FY13 vs. FY12
|
||||||||||||||||||||
|
SG&A expenses
|
$
|
384,907
|
|
$
|
387,812
|
|
$
|
372,666
|
|
$
|
(2,905
|
)
|
(1
|
)%
|
$
|
15,146
|
|
4
|
%
|
||||||
|
SG&A expenses as a percentage of total revenues
|
13
|
%
|
14
|
%
|
12
|
%
|
(1
|
)%
|
2
|
%
|
|||||||||||||||
SG&A expenses during the fiscal year ended
June 30, 2014
were slightly lower compared to the fiscal year ended
June 30, 2013
, primarily due to lower levels of consulting expenses of $4.5 million and a decrease in amortization of intangible assets of $2.6 million as some intangible assets became fully amortized. This was partially offset by an increase in employee-related expenses of $4.4 million as a result of hiring additional personnel.
SG&A expenses during the fiscal year ended
June 30, 2013
were higher compared to the fiscal year ended
June 30, 2012
, primarily due to an increase of $5.7 million in support costs related to product demonstrations and evaluations of our product by customers, as well as depreciation expense, an increase of $3.6 million in travel expenses due to the increasingly global nature of our customers, operations and business, an increase of $2.1 million in employee-related compensation as a result of annual compensation adjustments and additional headcount and $3.1 million in goodwill impairment, severance and other expenses that we recognized during the three months ended September 30, 2012 in connection with our decision to exit from the solar inspection business.
Interest Income and Other, Net and Interest Expense
|
|
Year ended June 30,
|
||||||||||
|
(Dollar amounts in thousands)
|
2014
|
2013
|
2012
|
||||||||
|
Interest income and other, net
|
$
|
16,203
|
|
$
|
15,112
|
|
$
|
11,966
|
|
||
|
Interest expense
|
$
|
53,812
|
|
$
|
54,176
|
|
$
|
54,197
|
|
||
|
Interest income and other, net as a percentage of total revenues
|
1
|
%
|
1
|
%
|
—
|
%
|
|||||
|
Interest expense as a percentage of total revenues
|
2
|
%
|
2
|
%
|
2
|
%
|
|||||
Interest income and other, net is comprised primarily of interest income earned on our investment and cash portfolio, realized gains or losses on sales of marketable securities, gains or losses from revaluation of certain foreign currency denominated assets and liabilities as well as foreign currency contracts, impairments associated with equity investments in privately-held companies, and interest related accruals (such as interest and penalty accruals related to our tax obligations). The increase in interest income and other, net during the fiscal year ended
June 30, 2014
compared to the fiscal year ended
June 30, 2013
was primarily attributable to an increase of $3.7 million from the sale of an equity investment in a privately-held company, partially offset by an impairment charge of
$1.4 million
recognized during the three months ended December 31, 2013 related to an equity investment in a privately-held company that was deemed to be other-than-temporary impairment and a decrease in interest income of $1.3 million driven by lower interest rates.
The increase in interest income and other, net during the fiscal year ended
June 30, 2013
compared to the fiscal year ended
June 30, 2012
was primarily attributable to a decrease in impairment charges of
$2.9 million
for equity investments in privately-held companies, an increase in realized gains of marketable securities of $1.2 million and an increase in foreign exchange related gains of $1.9 million, partially offset by an increase of $4.2 million in interest and penalty accruals related to uncertain tax positions.
Interest expense is primarily attributable to the
$750 million
aggregate principal amount of senior fixed rate notes that we issued in the fourth quarter of the fiscal year ended June 30, 2008.
43
Provision for Income Taxes
The following table provides details of income taxes:
|
(Dollar amounts in thousands)
|
Year ended June 30,
|
||||||||||
|
|
2014
|
2013
|
2012
|
||||||||
|
Income before income taxes
|
$
|
734,461
|
|
$
|
690,621
|
|
$
|
974,094
|
|
||
|
Provision for income taxes
|
$
|
151,706
|
|
$
|
147,472
|
|
$
|
218,079
|
|
||
|
Effective tax rate
|
20.7
|
%
|
21.4
|
%
|
22.4
|
%
|
|||||
The provision for income taxes differs from the statutory U.S. federal rate primarily due to foreign income with lower tax rates, the tax effects of employee stock activity, tax credits and state taxes.
Tax expense as a percentage of income during the fiscal year ended
June 30, 2014
was
20.7%
compared to
21.4%
for the fiscal year ended
June 30, 2013
. Tax expense decreased primarily due to a decrease in tax reserves and an increase in the percentage of our revenues that were earned outside the U.S. in jurisdictions with lower tax rates, partially offset by a decrease in our research and development credits and an increase in tax expense related to employee stock activity.
Tax expense as a percentage of income during the fiscal year ended
June 30, 2013
was
21.4%
compared to
22.4%
for the fiscal year ended
June 30, 2012
. Tax expense decreased primarily due to a decrease in the tax effects of employee stock activity, an increase in tax credits and an increase in the domestic manufacturing benefit, offset by an increase in tax reserves.
Our future effective income tax rate depends on various factors, such as tax legislation, the geographic composition of our pre-tax income, the amount of our pre-tax income as business activities fluctuate, non-deductible expenses incurred in connection with acquisitions, research and development credits as a percentage of aggregate pre-tax income, the domestic manufacturing deduction, non-taxable or non-deductible increases or decreases in the assets held within our Executive Deferred Savings Plan, the tax effects of employee stock activity and the effectiveness of our tax planning strategies.
We had cumulative windfalls in excess of shortfalls of approximately
$23.4 million
and
$6.9 million
during each of the fiscal year ended
June 30, 2014
and
2013
. We incurred $11.9 million in additional tax expense during the fiscal years ended
June 30, 2012
, due to shortfalls from employee stock activity. Windfall tax benefits arise when a company's tax deduction for employee stock activity exceeds book compensation for the same activity. A shortfall arises when the tax deduction is less than book compensation. Windfalls are recorded as increases to capital in excess of par value. Shortfalls are recorded as decreases to capital in excess of par value to the extent that cumulative windfalls exceed cumulative shortfalls. Shortfalls in excess of cumulative windfalls are recorded as provision for income taxes.
For the fiscal year ending
June 30, 2015
, we do not expect shortfalls from employee stock activity to have an impact on our tax rate, because we do not expect shortfalls to be in excess of cumulative windfalls.
In the normal course of business, we are subject to tax audits in various jurisdictions, and such jurisdictions may assess additional income or other taxes against us. Although we believe our tax estimates are reasonable, the final determination of tax audits and any related litigation could be materially different from our historical income tax provisions and accruals. The results of an audit or litigation could have a material adverse effect on our results of operations or cash flows in the period or periods for which that determination is made.
44
Liquidity and Capital Resources
|
As of June 30,
|
|||||||||||
|
(Dollar amounts in thousands)
|
2014
|
2013
|
2012
|
||||||||
|
Cash and cash equivalents
|
$
|
630,861
|
|
$
|
985,390
|
|
$
|
751,294
|
|
||
|
Marketable securities
|
2,521,776
|
|
1,933,491
|
|
1,783,150
|
|
|||||
|
Total cash, cash equivalents and marketable securities
|
$
|
3,152,637
|
|
$
|
2,918,881
|
|
$
|
2,534,444
|
|
||
|
Percentage of total assets
|
57
|
%
|
55
|
%
|
50
|
%
|
|||||
|
|
Year ended June 30,
|
||||||||||
|
(In thousands)
|
2014
|
2013
|
2012
|
||||||||
|
Net cash provided by operating activities
|
$
|
778,886
|
|
$
|
913,188
|
|
$
|
941,617
|
|
||
|
Net cash used in investing activities
|
(676,109
|
)
|
(241,447
|
)
|
(528,891
|
)
|
|||||
|
Net cash used in financing activities
|
(458,887
|
)
|
(428,510
|
)
|
(364,103
|
)
|
|||||
|
Effect of exchange rate changes on cash and cash equivalents
|
1,581
|
|
(9,135
|
)
|
(8,658
|
)
|
|||||
|
Net increase (decrease) in cash and cash equivalents
|
$
|
(354,529
|
)
|
$
|
234,096
|
|
$
|
39,965
|
|
||
As of
June 30, 2014
, our cash, cash equivalents and marketable securities totaled
$3.2 billion
, which is an increase of
$234 million
from
June 30, 2013
. As of
June 30, 2014
,
$1.3 billion
of our
$3.2 billion
of cash, cash equivalents, and marketable securities were held by our foreign subsidiaries and branch offices. We currently intend to permanently reinvest $1.1 billion of the cash held by our foreign subsidiaries and branch offices. If, however, a portion of these funds were to be repatriated to the United States, we would be required to accrue and pay U.S. and foreign taxes of approximately 30%-50% of the funds repatriated. The amount of taxes due will depend on the amount and manner of the repatriation, as well as the location from where the funds are repatriated. We have accrued (but have not paid) U.S. taxes on the remaining cash of $152 million of the
$1.3 billion
held by our foreign subsidiaries and branch offices. As such, these funds can be returned to the U.S. without accruing any additional U.S. tax expense.
The total amount of dividends paid during the fiscal years ended
June 30, 2014
,
2013
and
2012
was
$299 million
,
$266 million
and
$234 million
, respectively. The increase in the amount of dividends paid during the fiscal year ended June 30,
2014
compared to the preceding fiscal year reflects the increase in the level of our quarterly dividend from
$0.40
to
$0.45
per share that was instituted during the three months ended September 30,
2013
. On July 8, 2014, we announced that our Board of Directors had authorized a further increase in the level of our quarterly dividend from
$0.45
to
$0.50
per share.
On July 8, 2014, we also announced that our Board of Directors had authorized us to repurchase up to
13 million
additional shares under our stock repurchase program.
The shares repurchased under our stock repurchase program have reduced our basic and diluted weighted-average shares outstanding. The decrease was partially offset by additional shares issued upon the exercise of employee stock options and the vesting of employee restricted stock units and in connection with stock purchases under our Employee Stock Purchase Plan.
We have historically financed our liquidity requirements through cash generated from operations.
Fiscal Year
2014
Compared to Fiscal Year
2013
Net cash provided by operating activities during the fiscal year ended June 30,
2014
decreased compared to the fiscal year ended June 30,
2013
from
$913 million
to
$779 million
primarily as a result of the following key factors:
|
•
|
An increase in payroll of approximately $44 million during the fiscal year ended June 30,
2014
compared to the fiscal year ended June 30,
2013
,
|
|
•
|
An increase in accounts payable payments of approximately $39 million during the fiscal year ended June 30,
2014
compared to the fiscal year ended June 30,
2013
,
|
|
•
|
An increase in tax payments of approximately $19 million during the fiscal year ended June 30,
2014
compared to the fiscal year ended June 30,
2013
, and
|
|
•
|
Payments of approximately $15 million upon vesting of cash-based long-term incentive ("Cash LTI") awards during the fiscal year ended June 30,
2014
under our Cash LTI employee compensation plan, whereas no such payments occurred during the fiscal year ended June 30,
2013
.
|
45
Net cash used in investing activities during the fiscal year ended June 30,
2014
increased compared to the fiscal year ended June 30,
2013
from
$241 million
to
$676 million
, primarily as a result of an increase in the use of cash for purchases of available-for-sale and trading securities, net of sales and maturities, of approximately $424 million during the fiscal year ended June 30,
2014
compared to the fiscal year ended June 30,
2013
. In addition, we acquired a privately-held company for a total purchase consideration of
$18 million
in cash during the fiscal year ended June 30,
2014
.
Net cash used in financing activities during the fiscal year ended June 30,
2014
increased compared to the fiscal year ended June 30,
2013
from
$429 million
to
$459 million
, primarily as a result of the following key factors:
|
•
|
An increase in dividend payments of
$33 million
during the fiscal year ended June 30,
2014
compared to the fiscal year ended June 30,
2013
, mainly due to an increase in the quarterly dividend payout amount that we announced in July
2013
, and
|
|
•
|
A decrease in proceeds from the exercise of stock options of
$14 million
during the fiscal year ended June 30,
2014
compared to the fiscal year ended June 30,
2013
, partially offset by
|
|
•
|
A decrease in common stock repurchases of
$32 million
during the fiscal year ended June 30,
2014
compared to the fiscal year ended June 30,
2013
.
|
Fiscal Year
2013
Compared to Fiscal Year
2012
Net cash provided by operating activities during the fiscal year ended June 30,
2013
decreased compared to the fiscal year ended June 30,
2012
from
$942 million
to
$913 million
primarily as a result of the following key factors:
|
•
|
An increase in tax payments of approximately $101 million compared to the fiscal year ended June 30,
2012
due to a change in the timing of when revenue is recognized for federal income tax purposes that resulted in lower tax payments during the fiscal year ended June 30, 2012 and
|
|
•
|
A decrease in cash collections of approximately $61 million primarily due to lower revenues during the fiscal year ended June 30,
2013
compared to the fiscal year ended June 30,
2012
, partially offset by
|
|
•
|
A decrease in accounts payable payments of approximately $116 million during the fiscal year ended June 30,
2013
compared to the fiscal year ended June 30,
2012
.
|
Net cash used in investing activities during the fiscal year ended June 30,
2013
decreased compared to the fiscal year ended June 30,
2012
from
$529 million
to
$241 million
, primarily as a result of a decrease in the use of cash for purchases of available-for-sale and trading securities, net of sales and maturities, of approximately $305 million during the fiscal year ended June 30,
2013
compared to the fiscal year ended June 30,
2012
.
Net cash used in financing activities during the fiscal year ended June 30,
2013
increased compared to the fiscal year ended June 30,
2012
from
$364 million
to
$429 million
, primarily as a result of the following key factors:
|
•
|
An increase in dividend payments of
$32 million
during the fiscal year ended June 30,
2013
compared to the fiscal year ended June 30,
2012
, mainly due to an increase in the quarterly dividend payout amount that we announced in July
2012
,
|
|
•
|
An increase in common stock repurchases of
$9 million
during the fiscal year ended June 30,
2013
compared to the fiscal year ended June 30,
2012
, and
|
|
•
|
A decrease in proceeds from the exercise of stock options of
$39 million
during the fiscal year ended June 30,
2013
compared to the fiscal year ended June 30,
2012
.
|
46
Contractual Obligations
The following is a schedule summarizing our significant obligations to make future payments under contractual obligations as of
June 30, 2014
:
|
|
Fiscal year ending June 30,
|
||||||||||||||||||||||||||||||
|
(In thousands)
|
Total
|
2015
|
2016
|
2017
|
2018
|
2019
|
2020 and thereafter
|
Other
|
|||||||||||||||||||||||
|
Long-term debt obligations
(1)
|
$
|
750,000
|
|
$
|
—
|
|
$
|
—
|
|
$
|
—
|
|
$
|
750,000
|
|
$
|
—
|
|
$
|
—
|
|
$
|
—
|
|
|||||||
|
Interest payment associated with long-term debt obligations
|
198,375
|
|
51,750
|
|
51,750
|
|
51,750
|
|
43,125
|
|
—
|
|
—
|
|
—
|
|
|||||||||||||||
|
Purchase commitments
|
214,355
|
|
212,032
|
|
2,323
|
|
—
|
|
—
|
|
—
|
|
—
|
|
—
|
|
|||||||||||||||
|
Non-current income taxes payable
(2)
|
66,247
|
|
—
|
|
—
|
|
—
|
|
—
|
|
—
|
|
—
|
|
66,247
|
|
|||||||||||||||
|
Operating leases
|
27,637
|
|
8,619
|
|
6,757
|
|
5,082
|
|
3,613
|
|
1,744
|
|
1,822
|
|
—
|
|
|||||||||||||||
|
Cash long-term incentive program
(3)
|
108,967
|
|
30,853
|
|
30,853
|
|
30,853
|
|
16,408
|
|
—
|
|
—
|
|
—
|
|
|||||||||||||||
|
Pension obligations
|
24,934
|
|
1,700
|
|
1,635
|
|
1,532
|
|
1,969
|
|
1,853
|
|
16,245
|
|
(4)
|
—
|
|
||||||||||||||
|
Total contractual cash obligations
|
$
|
1,390,515
|
|
$
|
304,954
|
|
$
|
93,318
|
|
$
|
89,217
|
|
$
|
815,115
|
|
$
|
3,597
|
|
$
|
18,067
|
|
$
|
66,247
|
|
|||||||
__________________
|
(1)
|
In April 2008, we issued $750 million aggregate principal amount of senior notes due in 2018.
|
|
(2)
|
Represents the non-current income taxes payable obligation and related accrued interest. We are unable to make a reasonably reliable estimate of the timing of payments in individual years beyond 12 months due to uncertainties in the timing of tax audit outcomes.
|
|
(3)
|
Represents the amount committed under our cash long-term incentive program as of
June 30, 2014
. Expected payment after estimated forfeitures is approximately $90 million.
|
|
(4)
|
Represents benefits expected to be paid in fiscal years 2020 through 2024.
|
Starting in fiscal year 2013 we adopted a cash-based long-term incentive (“Cash LTI”) program for many of our employees as part of our employee compensation program. Cash LTI awards issued to employees under the Cash Long-Term Incentive Plan (“Cash LTI Plan”) generally vest in four equal installments, with 25% of the aggregate amount of the Cash LTI award vesting on each yearly anniversary of the grant date over a four-year period. In order to receive payments under the Cash LTI Plan, participants must remain employed by us as of the applicable award vesting date.
We have agreements with financial institutions to sell certain of our trade receivables and promissory notes from customers without recourse. In addition, we periodically sell certain letters of credit (“LCs”), without recourse, received from customers in payment for goods.
The following table shows total receivables sold under factoring agreements and proceeds from sales of LCs for the indicated periods:
|
Year ended June 30,
|
|||||||||||
|
(In thousands)
|
2014
|
2013
|
2012
|
||||||||
|
Receivables sold under factoring agreements
|
$
|
116,292
|
|
$
|
144,307
|
|
$
|
368,894
|
|
||
|
Proceeds from sales of LCs
|
$
|
8,323
|
|
$
|
3,808
|
|
$
|
30,142
|
|
||
Factoring and LC fees for the sale of certain trade receivables were recorded in interest income and other, net and were not material for the periods presented.
We maintain guarantee arrangements available through various financial institutions for up to
$28.4 million
, of which
$26.3 million
had been issued as of
June 30, 2014
, primarily to fund guarantees to customs authorities for value-added tax (“VAT”) and other operating requirements of our subsidiaries in Europe and Asia.
47
We maintain certain open inventory purchase commitments with our suppliers to ensure a smooth and continuous supply for key components. Our liability under these purchase commitments is generally restricted to a forecasted time-horizon as mutually agreed upon between the parties. This forecasted time-horizon can vary among different suppliers. Our open inventory purchase commitments were approximately
$214.3 million
as of
June 30, 2014
and are primarily due within the next 12 months. Actual expenditures will vary based upon the volume of the transactions and length of contractual service provided. In addition, the amounts paid under these arrangements may be less in the event that the arrangements are renegotiated or canceled. Certain agreements provide for potential cancellation penalties.
We provide standard warranty coverage on our systems for 40 hours per week for 12 months, providing labor and parts necessary to repair the systems during the warranty period. We account for the estimated warranty cost as a charge to costs of revenues when revenue is recognized. The estimated warranty cost is based on historical product performance and field expenses. The actual product performance and/or field expense profiles may differ, and in those cases we adjust our warranty accruals accordingly. The difference between the estimated and actual warranty costs tends to be larger for new product introductions as there is limited historical product performance to estimate warranty expense; our warranty charge estimates for more mature products with longer product performance histories tend to be more stable. Non-standard warranty coverage generally includes services incremental to the standard 40-hours per week coverage for 12 months. See Note 13, “Commitments and Contingencies” to the Consolidated Financial Statements for a detailed description.
Working capital increased to
$3.7 billion
as of
June 30, 2014
, compared to
$3.5 billion
as of
June 30, 2013
. This increase is primarily due to higher levels of cash and marketable securities as we generated significant cash flow from operations during the fiscal year ended
June 30, 2014
, as well as a higher level of inventory that resulted from supporting elevated levels of business activity. As of
June 30, 2014
, our principal source of liquidity consisted of
$3.2 billion
of cash, cash equivalents and marketable securities. Our liquidity is affected by many factors, some of which are based on the normal ongoing operations of the business, and others of which relate to the uncertainties of global and regional economies and the semiconductor and the semiconductor equipment industries. Although cash requirements will fluctuate based on the timing and extent of these factors, we believe that cash generated from operations, together with the liquidity provided by existing cash and cash equivalents balances, will be sufficient to satisfy our liquidity requirements for at least the next 12 months.
Our credit ratings and outlooks as of
June 30, 2014
are summarized below:
|
Rating Agency
|
Rating
|
Outlook
|
|
|
Fitch
|
BBB
|
Stable
|
|
|
Moody’s
|
Baa1
|
Stable
|
|
|
Standard & Poor’s
|
BBB+
|
Stable
|
|
Factors that can affect our credit ratings include changes in our operating performance, the economic environment, conditions in the semiconductor and semiconductor equipment industries, our financial position, and changes in our business strategy.
48
Off-Balance Sheet Arrangements
Under our foreign currency risk management strategy, we utilize derivative instruments to protect our interests from unanticipated fluctuations in earnings and cash flows caused by volatility in currency exchange rates. This financial exposure is monitored and managed as an integral part of our overall risk management program, which focuses on the unpredictability of financial markets and seeks to reduce the potentially adverse effects that the volatility of these markets may have on our operating results. We continue our policy of hedging our current and forecasted foreign currency exposures with hedging instruments having tenors of up to 18 months (see Note 16, “Derivative Instruments and Hedging Activities” to the Consolidated Financial Statements for a detailed description). Our outstanding hedge contracts, with maximum maturity of 18 months, were as follows:
|
|
As of June 30,
|
||||||
|
(In thousands)
|
2014
|
2013
|
|||||
|
Cash flow hedge contracts
|
|||||||
|
Purchase
|
$
|
6,066
|
|
$
|
14,641
|
|
|
|
Sell
|
$
|
33,999
|
|
$
|
35,178
|
|
|
|
Other foreign currency hedge contracts
|
|||||||
|
Purchase
|
$
|
108,901
|
|
$
|
99,175
|
|
|
|
Sell
|
$
|
106,322
|
|
$
|
97,901
|
|
|
Indemnification Obligations.
Subject to certain limitations, we are obligated to indemnify our current and former directors, officers and employees with respect to certain litigation matters and investigations that arise in connection with their service to us. These obligations arise under the terms of our certificate of incorporation, our bylaws, applicable contracts, and Delaware and California law. The obligation to indemnify generally means that we are required to pay or reimburse the individuals’ reasonable legal expenses and possibly damages and other liabilities incurred in connection with these matters. For example, we have paid or reimbursed legal expenses incurred in connection with the investigation of our historical stock option practices and the related litigation and government inquiries by a number of our current and former directors, officers and employees. Although the maximum potential amount of future payments we could be required to make under the indemnification obligations generally described in this paragraph is theoretically unlimited, we believe the fair value of this liability, to the extent estimable, is appropriately considered within the reserve we have established for currently pending legal proceedings.
We are a party to a variety of agreements pursuant to which we may be obligated to indemnify the other party with respect to certain matters. Typically, these obligations arise in connection with contracts and license agreements or the sale of assets, under which we customarily agree to hold the other party harmless against losses arising from, or provide customers with other remedies to protect against, bodily injury or damage to personal property caused by our products, non-compliance with our product performance specifications, infringement of third-party intellectual property rights used in our products and a breach of warranties, representations and covenants related to matters such as title to assets sold, validity of certain intellectual property rights, non-infringement of third-party rights, and certain income tax-related matters. In each of these circumstances, payment by us is typically subject to the other party making a claim to and cooperating with us pursuant to the procedures specified in the particular contract. This usually allows us to challenge the other party’s claims or, in case of breach of intellectual property representations or covenants, to control the defense or settlement of any third-party claims brought against the other party. Further, our obligations under these agreements may be limited in terms of amounts, activity (typically at our option to replace or correct the products or terminate the agreement with a refund to the other party), and duration. In some instances, we may have recourse against third parties and/or insurance covering certain payments made by us.
In addition, we may in limited circumstances enter into agreements that contain customer-specific pricing, discount, rebate or credit commitments offered by us. Furthermore, we may give these customers limited audit or inspection rights to enable them to confirm that we are complying with these commitments. If a customer elects to exercise its audit or inspection rights, we may be required to expend significant resources to support the audit or inspection, as well as to defend or settle any dispute with a customer that could potentially arise out of such audit or inspection. To date, we have made no accruals in our consolidated financial statements for this contingency. While we have not in the past incurred significant expenses for resolving disputes regarding these types of commitments, we cannot make any assurance that we will not incur any such liabilities in the future. One significant customer recently exercised its audit rights, but we cannot predict the outcome of that audit at this time.
It is not possible to predict the maximum potential amount of future payments under these or similar agreements due to the conditional nature of our obligations and the unique facts and circumstances involved in each particular agreement. Historically, payments made by us under these agreements have not had a material effect on our business, financial condition, results of operations or cash flows.
49
|
ITEM 7A.
|
QUANTITATIVE AND QUALITATIVE DISCLOSURES ABOUT MARKET RISK
|
We are exposed to financial market risks, including changes in interest rates, foreign currency exchange rates and marketable equity security prices. To mitigate these risks, we utilize derivative financial instruments, such as foreign currency hedges. All of the potential changes noted below are based on sensitivity analyses performed on our financial position as of
June 30, 2014
. Actual results may differ materially.
As of
June 30, 2014
, we had an investment portfolio of fixed income securities of $2.7 billion. These securities, as with all fixed income instruments, are subject to interest rate risk and will fall in value if market interest rates increase. If market interest rates were to increase immediately and uniformly by 10% from levels as of
June 30, 2014
, the fair value of the portfolio would have declined by $1.4 million.
In April 2008, we issued
$750 million
aggregate principal amount of
6.90%
senior, unsecured long-term debt due in 2018. The fair market value of long-term fixed interest rate debt is subject to interest rate risk. Generally, the fair market value of fixed interest rate debt will increase as interest rates fall and decrease as interest rates rise. As of
June 30, 2014
, the book value and the fair value of our fixed rate debt were
$747.9 million
and
$893.7 million
, respectively. As of
June 30, 2013
, the book value and the fair value of our fixed rate debt were
$747.4 million
and
$872.3 million
, respectively.
See Note 4, “Marketable Securities” to the Consolidated Financial Statements in Part II, Item 8; Management’s Discussion and Analysis of Financial Condition and Results of Operations, “Liquidity and Capital Resources,” in Part II, Item 7; and Risk Factors in Part I, Item 1A of this Annual Report on Form 10-K for a description of recent market events that may affect the value of the investments in our portfolio that we held as of
June 30, 2014
.
As of
June 30, 2014
, we had net forward and option contracts to sell
$25.4 million
in foreign currency in order to hedge certain currency exposures (see Note 16, “Derivative Instruments and Hedging Activities” to the Consolidated Financial Statements for a detailed description). If we had entered into these contracts on
June 30, 2014
, the U.S. dollar equivalent would have been $25.6 million. A 10% adverse move in all currency exchange rates affecting the contracts would decrease the fair value of the contracts by $17.5 million. However, if this occurred, the fair value of the underlying exposures hedged by the contracts would increase by a similar amount. Accordingly, we believe that, as a result of the hedging of certain of our foreign currency exposure, changes in most relevant foreign currency exchange rates should have no material impact on our income or cash flows.
50
|
ITEM 8.
|
FINANCIAL STATEMENTS AND SUPPLEMENTARY DATA
|
51
KLA-TENCOR CORPORATION
|
|
As of June 30,
|
||||||
|
(In thousands, except par value)
|
2014
|
2013
|
|||||
|
ASSETS
|
|||||||
|
Current assets:
|
|||||||
|
Cash and cash equivalents
|
$
|
630,861
|
|
$
|
985,390
|
|
|
|
Marketable securities
|
2,521,776
|
|
1,933,491
|
|
|||
|
Accounts receivable, net
|
492,863
|
|
524,610
|
|
|||
|
Inventories
|
656,457
|
|
634,448
|
|
|||
|
Deferred income taxes
|
215,676
|
|
198,525
|
|
|||
|
Other current assets
|
69,197
|
|
75,039
|
|
|||
|
Total current assets
|
4,586,830
|
|
4,351,503
|
|
|||
|
Land, property and equipment, net
|
330,263
|
|
305,281
|
|
|||
|
Goodwill
|
335,355
|
|
326,635
|
|
|||
|
Purchased intangibles, net
|
27,697
|
|
34,515
|
|
|||
|
Other non-current assets
|
258,519
|
|
269,423
|
|
|||
|
Total assets
|
$
|
5,538,664
|
|
$
|
5,287,357
|
|
|
|
LIABILITIES AND STOCKHOLDERS’ EQUITY
|
|||||||
|
Current liabilities:
|
|||||||
|
Accounts payable
|
$
|
103,422
|
|
$
|
115,680
|
|
|
|
Deferred system profit
|
147,923
|
|
157,965
|
|
|||
|
Unearned revenue
|
59,176
|
|
60,838
|
|
|||
|
Other current liabilities
|
585,090
|
|
527,049
|
|
|||
|
Total current liabilities
|
895,611
|
|
861,532
|
|
|||
|
Non-current liabilities:
|
|||||||
|
Long-term debt
|
747,919
|
|
747,376
|
|
|||
|
Pension liabilities
|
59,908
|
|
57,959
|
|
|||
|
Income taxes payable
|
59,575
|
|
59,494
|
|
|||
|
Unearned revenue
|
57,500
|
|
42,228
|
|
|||
|
Other non-current liabilities
|
48,805
|
|
36,616
|
|
|||
|
Total liabilities
|
1,869,318
|
|
1,805,205
|
|
|||
|
Commitments and contingencies (Notes 13 and 14)
|
|
|
|||||
|
Stockholders’ equity:
|
|||||||
|
Preferred stock, $0.001 par value, 1,000 shares authorized, none outstanding
|
—
|
|
—
|
|
|||
|
Common stock, $0.001 par value, 500,000 shares authorized, 257,542 and 253,495 shares issued, 165,448 and 165,435 shares outstanding, as of June 30, 2014 and June 30, 2013, respectively
|
165
|
|
165
|
|
|||
|
Capital in excess of par value
|
1,220,339
|
|
1,159,400
|
|
|||
|
Retained earnings
|
2,479,113
|
|
2,359,233
|
|
|||
|
Accumulated other comprehensive income (loss)
|
(30,271
|
)
|
(36,646
|
)
|
|||
|
Total stockholders’ equity
|
3,669,346
|
|
3,482,152
|
|
|||
|
Total liabilities and stockholders’ equity
|
$
|
5,538,664
|
|
$
|
5,287,357
|
|
|
See accompanying notes to consolidated financial statements.
52
KLA-TENCOR CORPORATION
|
|
Year ended June 30,
|
||||||||||
|
(In thousands, except per share data)
|
2014
|
2013
|
2012
|
||||||||
|
Revenues:
|
|||||||||||
|
Product
|
$
|
2,286,437
|
|
$
|
2,247,147
|
|
$
|
2,597,755
|
|
||
|
Service
|
642,971
|
|
595,634
|
|
574,189
|
|
|||||
|
Total revenues
|
2,929,408
|
|
2,842,781
|
|
3,171,944
|
|
|||||
|
Costs and operating expenses:
|
|||||||||||
|
Costs of revenues
|
1,232,962
|
|
1,237,452
|
|
1,330,016
|
|
|||||
|
Engineering, research and development
|
539,469
|
|
487,832
|
|
452,937
|
|
|||||
|
Selling, general and administrative
|
384,907
|
|
387,812
|
|
372,666
|
|
|||||
|
Total costs and operating expenses
|
2,157,338
|
|
2,113,096
|
|
2,155,619
|
|
|||||
|
Income from operations
|
772,070
|
|
729,685
|
|
1,016,325
|
|
|||||
|
Interest income and other, net
|
16,203
|
|
15,112
|
|
11,966
|
|
|||||
|
Interest expense
|
53,812
|
|
54,176
|
|
54,197
|
|
|||||
|
Income before income taxes
|
734,461
|
|
690,621
|
|
974,094
|
|
|||||
|
Provision for income taxes
|
151,706
|
|
147,472
|
|
218,079
|
|
|||||
|
Net income
|
$
|
582,755
|
|
$
|
543,149
|
|
$
|
756,015
|
|
||
|
Net income per share:
|
|||||||||||
|
Basic
|
$
|
3.51
|
|
$
|
3.27
|
|
$
|
4.53
|
|
||
|
Diluted
|
$
|
3.47
|
|
$
|
3.21
|
|
$
|
4.44
|
|
||
|
Cash dividends declared per share
|
$
|
1.80
|
|
$
|
1.60
|
|
$
|
1.40
|
|
||
|
Weighted-average number of shares:
|
|||||||||||
|
Basic
|
166,016
|
|
166,089
|
|
166,795
|
|
|||||
|
Diluted
|
168,118
|
|
169,260
|
|
170,147
|
|
|||||
See accompanying notes to consolidated financial statements.
53
KLA-TENCOR CORPORATION
Consolidated Statements of Comprehensive Income
|
Year ended June 30,
|
|||||||||||
|
(In thousands)
|
2014
|
2013
|
2012
|
||||||||
|
Net income
|
$
|
582,755
|
|
$
|
543,149
|
|
$
|
756,015
|
|
||
|
Other comprehensive income (loss):
|
|||||||||||
|
Currency translation adjustments:
|
|||||||||||
|
Change in currency translation adjustments
|
6,428
|
|
(11,298
|
)
|
(15,289
|
)
|
|||||
|
Change in income tax benefit or expense
|
(1,232
|
)
|
(750
|
)
|
4,620
|
|
|||||
|
Net change related to currency translation adjustments
|
5,196
|
|
(12,048
|
)
|
(10,669
|
)
|
|||||
|
Cash flow hedges:
|
|||||||||||
|
Change in net unrealized gains or losses
|
1,641
|
|
4,929
|
|
(1,184
|
)
|
|||||
|
Reclassification adjustments for net gains or losses included in net income
|
(4,145
|
)
|
(1,483
|
)
|
210
|
|
|||||
|
Change in income tax benefit or expense
|
898
|
|
(1,233
|
)
|
347
|
|
|||||
|
Net change related to cash flow hedges
|
(1,606
|
)
|
2,213
|
|
(627
|
)
|
|||||
|
Net change related to unrecognized losses and transition obligations in connection with defined benefit plans
|
(617
|
)
|
(2,255
|
)
|
(6,350
|
)
|
|||||
|
Available-for-sale securities:
|
|||||||||||
|
Change in net unrealized gains or losses
|
7,212
|
|
(2,953
|
)
|
(1,220
|
)
|
|||||
|
Reclassification adjustments for net gains or losses included in net income
|
(2,084
|
)
|
(2,287
|
)
|
(638
|
)
|
|||||
|
Change in income tax benefit or expense
|
(1,726
|
)
|
1,827
|
|
760
|
|
|||||
|
Net change related to available-for-sale securities
|
3,402
|
|
(3,413
|
)
|
(1,098
|
)
|
|||||
|
Other comprehensive income (loss)
|
6,375
|
|
(15,503
|
)
|
(18,744
|
)
|
|||||
|
Total comprehensive income
|
$
|
589,130
|
|
$
|
527,646
|
|
$
|
737,271
|
|
||
See accompanying notes to consolidated financial statements.
54
KLA-TENCOR CORPORATION
Consolidated Statements of Stockholders’ Equity
|
|
Common Stock and
Capital in Excess of
Par Value
|
Retained
Earnings
|
Accumulated
Other
Comprehensive
Income (Loss)
|
Total
Stockholders’
Equity
|
||||||||||||||
|
(In thousands, except per share amount)
|
Shares
|
Amount
|
||||||||||||||||
|
Balances as of June 30, 2011
|
167,118
|
|
$
|
1,010,659
|
|
$
|
1,852,633
|
|
$
|
(2,399
|
)
|
$
|
2,860,893
|
|
||||
|
Net income
|
—
|
|
—
|
|
756,015
|
|
—
|
|
756,015
|
|
||||||||
|
Other comprehensive loss
|
(18,744
|
)
|
(18,744
|
)
|
||||||||||||||
|
Net issuance under employee stock plans
|
5,382
|
|
133,307
|
|
—
|
|
—
|
|
133,307
|
|
||||||||
|
Repurchase of common stock
|
(5,790
|
)
|
(133,321
|
)
|
(127,829
|
)
|
—
|
|
(261,150
|
)
|
||||||||
|
Cash dividends declared ($1.40 per share)
|
—
|
|
—
|
|
(233,561
|
)
|
—
|
|
(233,561
|
)
|
||||||||
|
Stock-based compensation expense
|
—
|
|
78,835
|
|
—
|
|
—
|
|
78,835
|
|
||||||||
|
Balances as of June 30, 2012
|
166,710
|
|
1,089,480
|
|
2,247,258
|
|
(21,143
|
)
|
3,315,595
|
|
||||||||
|
Net income
|
—
|
|
—
|
|
543,149
|
|
—
|
|
543,149
|
|
||||||||
|
Other comprehensive loss
|
(15,503
|
)
|
(15,503
|
)
|
||||||||||||||
|
Net issuance under employee stock plans
|
4,099
|
|
96,989
|
|
—
|
|
—
|
|
96,989
|
|
||||||||
|
Repurchase of common stock
|
(5,374
|
)
|
(107,973
|
)
|
(165,281
|
)
|
—
|
|
(273,254
|
)
|
||||||||
|
Cash dividends declared ($1.60 per share)
|
—
|
|
—
|
|
(265,893
|
)
|
—
|
|
(265,893
|
)
|
||||||||
|
Stock-based compensation expense
|
—
|
|
70,084
|
|
—
|
|
—
|
|
70,084
|
|
||||||||
|
Tax benefit for equity awards
|
—
|
|
10,985
|
|
—
|
|
—
|
|
10,985
|
|
||||||||
|
Balances as of June 30, 2013
|
165,435
|
|
1,159,565
|
|
2,359,233
|
|
(36,646
|
)
|
3,482,152
|
|
||||||||
|
Net income
|
—
|
|
—
|
|
582,755
|
|
—
|
|
582,755
|
|
||||||||
|
Other comprehensive income
|
6,375
|
|
6,375
|
|
||||||||||||||
|
Net issuance under employee stock plans
|
3,848
|
|
60,320
|
|
—
|
|
—
|
|
60,320
|
|
||||||||
|
Repurchase of common stock
|
(3,835
|
)
|
(76,839
|
)
|
(164,004
|
)
|
—
|
|
(240,843
|
)
|
||||||||
|
Cash dividends declared ($1.80 per share)
|
—
|
|
—
|
|
(298,871
|
)
|
—
|
|
(298,871
|
)
|
||||||||
|
Stock-based compensation expense
|
—
|
|
60,940
|
|
—
|
|
—
|
|
60,940
|
|
||||||||
|
Tax benefit for equity awards
|
—
|
|
16,518
|
|
—
|
|
—
|
|
16,518
|
|
||||||||
|
Balances as of June 30, 2014
|
165,448
|
|
$
|
1,220,504
|
|
$
|
2,479,113
|
|
$
|
(30,271
|
)
|
$
|
3,669,346
|
|
||||
See accompanying notes to consolidated financial statements.
55
KLA-TENCOR CORPORATION
|
|
Year Ended June 30,
|
||||||||||
|
(In thousands)
|
2014
|
2013
|
2012
|
||||||||
|
Cash flows from operating activities:
|
|||||||||||
|
Net income
|
$
|
582,755
|
|
$
|
543,149
|
|
$
|
756,015
|
|
||
|
Adjustments to reconcile net income to net cash provided by operating activities:
|
|||||||||||
|
Depreciation and amortization
|
83,072
|
|
87,534
|
|
92,133
|
|
|||||
|
Asset impairment charges
|
1,374
|
|
1,327
|
|
2,878
|
|
|||||
|
Net gain on sale of assets
|
—
|
|
(1,160
|
)
|
—
|
|
|||||
|
Non-cash stock-based compensation expense
|
60,940
|
|
70,084
|
|
78,835
|
|
|||||
|
Net gain on sale of marketable securities and other investments
|
(5,920
|
)
|
(2,287
|
)
|
(637
|
)
|
|||||
|
Deferred income taxes
|
17,176
|
|
4,532
|
|
193,412
|
|
|||||
|
Excess tax benefit from equity awards
|
(20,554
|
)
|
(14,198
|
)
|
—
|
|
|||||
|
Changes in assets and liabilities, net of impact of acquisition of business:
|
|||||||||||
|
Decrease (increase) in accounts receivable, net
|
32,591
|
|
159,245
|
|
(113,922
|
)
|
|||||
|
Decrease (increase) in inventories
|
(26,173
|
)
|
14,787
|
|
(93,145
|
)
|
|||||
|
Decrease (increase) in other assets
|
(26,265
|
)
|
6,035
|
|
58,041
|
|
|||||
|
Decrease in accounts payable
|
(12,333
|
)
|
(22,812
|
)
|
(3,732
|
)
|
|||||
|
Increase (decrease) in deferred system profit
|
(10,042
|
)
|
10,748
|
|
(45,121
|
)
|
|||||
|
Increase in other liabilities
|
102,265
|
|
56,204
|
|
16,860
|
|
|||||
|
Net cash provided by operating activities
|
778,886
|
|
913,188
|
|
941,617
|
|
|||||
|
Cash flows from investing activities:
|
|||||||||||
|
Acquisition of non-marketable securities
|
(1,345
|
)
|
—
|
|
—
|
|
|||||
|
Acquisition of business
|
(18,000
|
)
|
—
|
|
—
|
|
|||||
|
Capital expenditures, net
|
(67,502
|
)
|
(74,573
|
)
|
(57,596
|
)
|
|||||
|
Proceeds from sale of assets
|
3,836
|
|
1,838
|
|
2,228
|
|
|||||
|
Purchase of available-for-sale securities
|
(1,834,223
|
)
|
(1,588,093
|
)
|
(1,522,424
|
)
|
|||||
|
Proceeds from sale of available-for-sale securities
|
987,512
|
|
1,117,511
|
|
871,811
|
|
|||||
|
Proceeds from maturity of available-for-sale securities
|
251,876
|
|
300,209
|
|
174,854
|
|
|||||
|
Purchase of trading securities
|
(64,053
|
)
|
(40,850
|
)
|
(55,906
|
)
|
|||||
|
Proceeds from sale of trading securities
|
65,790
|
|
42,511
|
|
58,142
|
|
|||||
|
Net cash used in investing activities
|
(676,109
|
)
|
(241,447
|
)
|
(528,891
|
)
|
|||||
|
Cash flows from financing activities:
|
|||||||||||
|
Issuance of common stock
|
112,221
|
|
126,121
|
|
163,569
|
|
|||||
|
Tax withholding payments related to vested and released restricted stock units
|
(51,948
|
)
|
(29,682
|
)
|
(30,247
|
)
|
|||||
|
Payment of dividends to stockholders
|
(298,871
|
)
|
(265,893
|
)
|
(233,561
|
)
|
|||||
|
Excess tax benefit from equity awards
|
20,554
|
|
14,198
|
|
—
|
|
|||||
|
Common stock repurchases
|
(240,843
|
)
|
(273,254
|
)
|
(263,864
|
)
|
|||||
|
Net cash used in financing activities
|
(458,887
|
)
|
(428,510
|
)
|
(364,103
|
)
|
|||||
|
Effect of exchange rate changes on cash and cash equivalents
|
1,581
|
|
(9,135
|
)
|
(8,658
|
)
|
|||||
|
Net increase (decrease) in cash and cash equivalents
|
(354,529
|
)
|
234,096
|
|
39,965
|
|
|||||
|
Cash and cash equivalents at beginning of period
|
985,390
|
|
751,294
|
|
711,329
|
|
|||||
|
Cash and cash equivalents at end of period
|
$
|
630,861
|
|
$
|
985,390
|
|
$
|
751,294
|
|
||
|
Supplemental cash flow disclosures:
|
|||||||||||
|
Income taxes paid, net
|
$
|
117,348
|
|
$
|
120,342
|
|
$
|
20,018
|
|
||
|
Interest paid
|
$
|
52,474
|
|
$
|
53,693
|
|
$
|
54,523
|
|
||
|
Non-cash investing activities:
|
|||||||||||
|
Purchase of land, property and equipment
|
$
|
3,457
|
|
$
|
6,839
|
|
$
|
—
|
|
||
See accompanying notes to consolidated financial statements.
56
KLA-TENCOR CORPORATION
Notes to Consolidated Financial Statements
Description of Operations and Principles of Consolidation.
KLA-Tencor Corporation (“KLA-Tencor” or the “Company”) is a leading supplier of process control and yield management solutions for the semiconductor and related nanoelectronics industries. Headquartered in Milpitas, California, KLA-Tencor has subsidiaries both in the United States and in key markets throughout the world.
The Consolidated Financial Statements include the accounts of KLA-Tencor and its majority-owned subsidiaries. All significant intercompany balances and transactions have been eliminated.
Management Estimates.
The preparation of the Consolidated Financial Statements in conformity with accounting principles generally accepted in the United States of America requires management to make estimates and assumptions in applying the Company's accounting policies that affect the reported amounts of assets and liabilities (and related disclosure of contingent assets and liabilities) at the date of the Consolidated Financial Statements and the reported amounts of revenues and expenses during the reporting periods. Actual results could differ from those estimates.
Cash Equivalents and Marketable Securities.
All highly liquid debt instruments with original or remaining maturities of less than three months at the date of purchase are considered to be cash equivalents. Marketable securities are generally classified as available-for-sale for use in current operations, if required, and are reported at fair value, with unrealized gains and losses, net of tax, presented as a separate component of stockholders’ equity under the caption “Accumulated other comprehensive income (loss).” All realized gains and losses and unrealized losses resulting from declines in fair value that are other than temporary are recorded in earnings in the period of occurrence. The specific identification method is used to determine the realized gains and losses on investments. For all investments in debt and equity securities, the Company assesses whether the impairment is other than temporary. If the fair value of a debt security is less than its amortized cost basis, an impairment is considered other than temporary if (i) the Company has the intent to sell the security or it is more likely than not that the Company will be required to sell the security before recovery of its entire amortized cost basis, or (ii) the Company does not expect to recover the entire amortized cost of the security. If an impairment is considered other than temporary based on condition (i), the entire difference between the amortized cost and the fair value of the security is recognized in earnings. If an impairment is considered other than temporary based on condition (ii), the amount representing credit losses, defined as the difference between the present value of the cash flows expected to be collected and the amortized cost basis of the debt security, will be recognized in earnings, and the amount relating to all other factors will be recognized in other comprehensive income (loss). The Company evaluates both qualitative and quantitative factors such as duration and severity of the unrealized losses, credit ratings, default and loss rates of the underlying collateral, structure and credit enhancements to determine if a credit loss may exist.
Non-Marketable Equity Securities and Other Investments.
KLA-Tencor acquires certain equity investments for the promotion of business and strategic objectives, and, to the extent these investments continue to have strategic value, the Company typically does not attempt to reduce or eliminate the inherent market risks. Non-marketable equity securities and other investments are recorded at historical cost. Non-marketable equity securities and other investments are included in “Other non-current assets” on the balance sheet. Non-marketable equity securities are subject to a periodic impairment review; however, there are no open-market valuations, and the impairment analysis requires significant judgment. This analysis includes assessment of the investee’s financial condition, the business outlook for its products and technology, its projected results and cash flow, the likelihood of obtaining subsequent rounds of financing and the impact of any relevant contractual equity preferences held by the Company or others.
Variable Interest Entities.
KLA-Tencor uses a qualitative approach in assessing the consolidation requirement for variable interest entities. The approach focuses on identifying which enterprise has the power to direct the activities that most significantly impact the variable interest entity’s economic performance and which enterprise has the obligation to absorb losses or the right to receive benefits from the variable interest entity. In the event that the Company is the primary beneficiary of a variable interest entity, the assets, liabilities, and results of operations of the variable interest entity will be included in the Company’s Consolidated Financial Statements. The Company has concluded that none of the Company’s equity investments require consolidation as per the Company's most recent qualitative assessment.
57
Inventories.
Inventories are stated at the lower of cost (on a first-in, first-out basis) or market. Demonstration units are stated at their manufacturing cost and written down to their net realizable value. The Company reviews and sets standard costs semi-annually at current manufacturing costs in order to approximate actual costs. The Company’s manufacturing overhead standards for product costs are calculated assuming full absorption of forecasted spending over projected volumes, adjusted for excess capacity. Abnormal inventory costs such as costs of idle facilities, excess freight and handling costs, and spoilage are recognized as current period charges. The Company writes down product inventory based on forecasted demand and technological obsolescence and parts inventory based on forecasted usage. These factors are impacted by market and economic conditions, technology changes, new product introductions and changes in strategic direction and require estimates that may include uncertain elements. Actual demand may differ from forecasted demand, and such differences may have a material effect on recorded inventory values.
Allowance for Doubtful Accounts.
A majority of the Company’s trade receivables are derived from sales to large multinational semiconductor manufacturers throughout the world. In order to monitor potential credit losses, the Company performs ongoing credit evaluations of its customers’ financial condition. An allowance for doubtful accounts is maintained for probable credit losses based upon the Company’s assessment of the expected collectibility of the accounts receivable. The allowance for doubtful accounts is reviewed on a quarterly basis to assess the adequacy of the allowance.
Property and Equipment.
Property and equipment are recorded at cost, net of accumulated depreciation. Depreciation of property and equipment is based on the straight-line method over the estimated useful lives of the assets. The following table sets forth the estimated useful life for various asset categories:
|
Asset Category
|
Period
|
|
Buildings
|
30 to 35 years
|
|
Leasehold improvements
|
Shorter of 10 to 15 years or lease term
|
|
Machinery and equipment
|
2 to 5 years
|
|
Office furniture and equipment
|
5 to 7 years
|
Construction-in-process assets are not depreciated until the assets are placed in service. Depreciation expense for the fiscal years ended
June 30, 2014
,
2013
and
2012
was
$51.1 million
,
$49.3 million
and
$45.8 million
, respectively.
Business Combinations.
KLA-Tencor allocates the fair value of the purchase consideration of the Company's acquisitions to the tangible assets, liabilities, and intangible assets acquired, including in-process research and development (“IPR&D”), based on their estimated fair values. The excess of the fair value of purchase consideration over the fair values of these identifiable assets and liabilities is recorded as goodwill. IPR&D is initially capitalized at fair value as an intangible asset with an indefinite life and assessed for impairment thereafter. When a project underlying reported IPR&D is completed, the corresponding amount of IPR&D is reclassified as an amortizable purchased intangible asset and is amortized over the asset’s estimated useful life. Acquisition-related expenses and restructuring costs are recognized separately from the business combination and are expensed as incurred.
Goodwill and Intangible Assets.
KLA-Tencor assesses goodwill for impairment annually as well as whenever events or changes in circumstances indicate that the carrying value may not be recoverable. Long-lived intangible assets are tested for recoverability whenever events or changes in circumstances indicate that their carrying amounts may not be recoverable. See Note 6, “Goodwill and Purchased Intangible Assets” for a detailed description.
Impairment of Long-Lived Assets.
KLA-Tencor evaluates the carrying value of its long-lived assets whenever events or changes in circumstances indicate that the carrying value of the asset may be impaired. An impairment loss is recognized when estimated future cash flows expected to result from the use of the asset, including disposition, are less than the carrying value of the asset. Such an impairment charge would be measured as the excess of the carrying value of the asset over its fair value.
Concentration of Credit Risk.
Financial instruments that potentially subject KLA-Tencor to significant concentrations of credit risk consist primarily of cash equivalents, short-term marketable securities, trade accounts receivable and derivative financial instruments used in hedging activities. The Company invests in a variety of financial instruments, such as, but not limited to, certificates of deposit, corporate debt and municipal securities, United States Treasury and Government agency securities, and equity securities and, by policy, limits the amount of credit exposure with any one financial institution or commercial issuer. The Company has not experienced any material credit losses on its investments.
58
A majority of the Company's trade receivables are derived from sales to large multinational semiconductor manufacturers located throughout the world, with a majority located in Asia. In recent years, the Company's customer base has become increasingly concentrated due to corporate consolidation, acquisitions and business closures, and to the extent that these customers experience liquidity issues in the future, the Company may be required to incur additional bad debt expense with respect to trade receivables. The Company performs ongoing credit evaluations of its customers’ financial condition and generally requires no collateral to secure accounts receivable. The Company maintains an allowance for potential credit losses based upon expected collectibility risk of all accounts receivable. In addition, the Company may utilize letters of credit or non-recourse factoring to mitigate credit risk when considered appropriate.
The Company is exposed to credit loss in the event of non-performance by counterparties on the foreign exchange contracts that the Company uses in hedging activities and in certain factoring transactions. These counterparties are large international financial institutions, and to date no such counterparty has failed to meet its financial obligations to the Company under such contracts.
The following customers each accounted for more than
10%
of total revenues for the indicated periods:
|
Year ended June 30,
|
||||
|
2014
|
2013
|
2012
|
||
|
Intel Corporation
|
Intel Corporation
|
Samsung Electronics Co., Ltd.
|
||
|
Samsung Electronics Co., Ltd.
|
Taiwan Semiconductor Manufacturing Company Limited
|
Taiwan Semiconductor Manufacturing Company Limited
|
||
|
Taiwan Semiconductor Manufacturing Company Limited
|
|
|
||
The following customers each accounted for more than
10%
of net accounts receivable as of the dates indicated below:
|
As of June 30,
|
||
|
2014
|
2013
|
|
|
Intel Corporation
|
Intel Corporation
|
|
|
Taiwan Semiconductor Manufacturing Company Limited
|
Taiwan Semiconductor Manufacturing Company Limited
|
|
Foreign Currency.
The functional currencies of KLA-Tencor’s foreign subsidiaries are the local currencies, except as described below. Accordingly, all assets and liabilities of these foreign operations are translated to U.S. dollars at current period end exchange rates, and revenues and expenses are translated to U.S. dollars using average exchange rates in effect during the period. The gains and losses from foreign currency translation of these subsidiaries’ financial statements are recorded directly into a separate component of stockholders’ equity under the caption “Accumulated other comprehensive income (loss).”
The Company's manufacturing subsidiaries in Singapore, Israel, Germany and China use the U.S. dollar as their functional currency. Accordingly, monetary assets and liabilities in non-functional currency of these subsidiaries are remeasured using exchange rates in effect at the end of the period. Revenues and costs in local currency are remeasured using average exchange rates for the period, except for costs related to those balance sheet items that are remeasured using historical exchange rates. The resulting remeasurement gains and losses are included in the Consolidated Statements of Operations as incurred.
Derivative Financial Instruments.
KLA-Tencor uses financial instruments, such as forward exchange contracts and currency options, to hedge a portion of, but not all, existing and forecasted foreign currency denominated transactions. The purpose of the Company's foreign currency program is to manage the effect of exchange rate fluctuations on certain foreign currency denominated revenues, costs and eventual cash flows. The effect of exchange rate changes on forward exchange contracts is expected to offset the effect of exchange rate changes on the underlying hedged items. The Company believes these financial instruments do not subject the Company to speculative risk that would otherwise result from changes in currency exchange rates.
59
All of the Company's derivative financial instruments are recorded at fair value based upon quoted market prices for comparable instruments adjusted for risk of counterparty non-performance. For derivative instruments designated and qualifying as cash flow hedges of forecasted foreign currency denominated transactions expected to occur within twelve months, the effective portion of the gain or loss on these hedges is reported as a component of “Accumulated other comprehensive income (loss)” in stockholders’ equity, and is reclassified into earnings when the hedged transaction affects earnings. If the transaction being hedged fails to occur, or if a portion of any derivative is (or becomes) ineffective, the gain or loss on the associated financial instrument is recorded immediately in earnings. For derivative instruments used to hedge existing foreign currency denominated assets or liabilities, the gains or losses on these hedges are recorded immediately in earnings to offset the changes in the fair value of the assets or liabilities being hedged.
Warranty.
The Company provides standard warranty coverage on its systems for
40
hours per week for
12
months, providing labor and parts necessary to repair the systems during the warranty period. The Company accounts for the estimated warranty cost as a charge to costs of revenues when revenue is recognized. The estimated warranty cost is based on historical product performance and field expenses. Utilizing actual service records, the Company calculates the average service hours and parts expense per system and applies the actual labor and overhead rates to determine the estimated warranty charge. The Company updates these estimated charges on a quarterly basis. The actual product performance and/or field expense profiles may differ, and in those cases the Company adjusts its warranty accruals accordingly (see Note 13, “Commitments and Contingencies”).
Revenue Recognition.
The Company recognizes revenue when persuasive evidence of an arrangement exists, delivery has occurred or services have been rendered, the selling price is fixed or determinable, and collectibility is reasonably assured. The Company derives revenue from three sources—sales of systems, spare parts and services. In general, the Company recognizes revenue for systems when the system has been installed, is operating according to predetermined specifications and is accepted by the customer. When a customer delays installation for delivered products for which the Company has demonstrated a history of successful installation and acceptance, the Company recognizes revenue upon customer acceptance. Under certain circumstances, however, the Company recognizes revenue prior to acceptance from the customer, as follows:
|
•
|
When the customer fab has previously accepted the same tool, with the same specifications, and when the Company can objectively demonstrate that the tool meets all of the required acceptance criteria.
|
|
•
|
When system sales to independent distributors have no installation requirement, contain no acceptance agreement, and 100% payment is due based upon shipment.
|
|
•
|
When the installation of the system is deemed perfunctory.
|
|
•
|
When the customer withholds acceptance due to issues unrelated to product performance, in which case revenue is recognized when the system is performing as intended and meets predetermined specifications.
|
In circumstances in which the Company recognizes revenue prior to installation, the portion of revenue associated with installation is deferred based on estimated fair value, and that revenue is recognized upon completion of the installation.
In many instances, products are sold in stand-alone arrangements. Services are sold separately through renewals of annual maintenance contracts. The Company also allows for multiple element revenue arrangements in cases where certain elements of a sales arrangement are not delivered and accepted in one reporting period. To determine the relative fair value of each element in a revenue arrangement, the Company allocates arrangement consideration based on the selling price hierarchy. For substantially all of the arrangements with multiple deliverables pertaining to products and services, the Company uses vendor-specific objective evidence (“VSOE”) or third-party evidence (“TPE”) to allocate the selling price to each deliverable. The Company determines TPE based on historical prices charged for products and services when sold on a stand-alone basis. When the Company is unable to establish relative selling price using VSOE or TPE, the Company uses estimated selling price (“ESP”) in its allocation of arrangement consideration. The objective of ESP is to determine the price at which the Company would transact a sale if the product or service were sold on a stand-alone basis. ESP could potentially be used for new or customized products. The Company regularly reviews relative selling prices and maintains internal controls over the establishment and updates of these estimates.
In a multiple element revenue arrangement, the Company defers revenue recognition associated with the relative fair value of each undelivered element until that element is delivered to the customer. To be considered a separate element, the product or service in question must represent a separate unit of accounting, which means that such product or service must fulfill the following criteria: (a) the delivered item(s) has value to the customer on a stand-alone basis; and (b) if the arrangement includes a general right of return relative to the delivered item(s), delivery or performance of the undelivered
item(s) is considered probable and substantially in the control of the Company. If the arrangement does not meet all the above criteria, the entire amount of the sales contract is deferred until all elements are accepted by the customer.
60
Trade-in rights are occasionally granted to customers to trade in tools in connection with subsequent purchases. The Company estimates the value of the trade-in right and reduces the revenue recognized on the initial sale. This amount is recognized at the earlier of the exercise of the trade-in right or the expiration of the trade-in right.
Spare parts revenue is recognized when the product has been shipped, risk of loss has passed to the customer and collection of the resulting receivable is probable.
Service and maintenance contract revenue is recognized ratably over the term of the maintenance contract. Revenue from services performed in the absence of a maintenance contract, including consulting and training revenue, is recognized when the related services are performed and collectibility is reasonably assured.
The Company sells stand-alone software that is subject to the software revenue recognition guidance. The Company periodically reviews selling prices to determine whether VSOE exists, and in some situations where the Company is unable to establish VSOE for undelivered elements, such as post-contract service, revenue is recognized ratably over the term of the service contract.
The Company also defers the fair value of non-standard warranty bundled with equipment sales as unearned revenue. Non-standard warranty includes services incremental to the standard
40
-hour per week coverage for
12
months. Non-standard warranty is recognized ratably as revenue when the applicable warranty term period commences.
The deferred system profit balance equals the amount of deferred system revenue that was invoiced and due on shipment, less applicable product and warranty costs. Deferred system revenue represents the value of products that have been shipped and billed to customers which have not met the Company's revenue recognition criteria. Deferred system profit does not include the profit associated with product shipments to certain customers in Japan, to whom title does not transfer until customer acceptance. Shipments to such customers in Japan are classified as inventory at cost until the time of acceptance.
Research and Development Costs.
Research and development costs are expensed as incurred.
Strategic Development Agreements.
Gross engineering, research and development expenses were partially offset by
$8.2 million
,
$12.4 million
and
$6.9 million
in external funding received under certain strategic development programs, primarily from government grants, in the fiscal years ended
June 30, 2014
,
2013
and
2012
, respectively.
Shipping and Handling Costs.
Shipping and handling costs are included as a component of cost of sales.
Accounting for Stock-Based Compensation Plans.
The Company accounts for stock-based awards granted to employees for services based on the fair value of those awards. The fair value of stock-based awards is measured at the grant date and is recognized as expense over the employee’s requisite service period. The fair value is determined using a Black-Scholes valuation model for stock options and for purchase rights under the Employee Stock Purchase Plan. The Black-Scholes option-pricing model requires the input of assumptions, including the option’s expected term and the expected price volatility of the underlying stock. The expected stock price volatility assumption is based on the market-based historical implied volatility from traded options of the Company's common stock. The fair value for restricted stock units granted without “dividend equivalent” rights is determined using the closing price of the Company's common stock on the grant date, adjusted to exclude the present value of dividends which are not accrued on the restricted stock units. The fair value for restricted stock units granted with “dividend equivalent” rights is determined using the closing price of the Company's common stock on the grant date. The award holder is not entitled to received payments under dividend equivalent rights unless the associated restricted stock unit award vests (i.e., the award holder is entitled to receive credits, payable in cash or shares of the Company's common stock, equal to the cash dividends that would have been received on the shares of common stock underlying the restricted stock units had the shares been issued and outstanding on the dividend record date, but such dividend equivalents are only paid subject to the recipient satisfying the vesting requirements of the underlying award). The Company has elected not to include the indirect tax effects of stock-based compensation deductions when calculating the windfall benefits and therefore recognizes the full effect of these deductions in the income statement in the period in which the taxable event occurs.
Accounting for Cash-Based Long-Term Incentive Compensation.
Cash-based long-term incentive (“Cash LTI”) awards issued to employees under the Company's Cash LTI program vest in
four
equal installments, with
25%
of the aggregate amount of the Cash LTI award vesting on each yearly anniversary of the grant date over a
four
-year period. In order to receive payments under a Cash LTI award, participants must remain employed by the Company as of the applicable award vesting date. Compensation expense related to the Cash LTI awards is recognized over the vesting term, which is adjusted for the impact of estimated forfeitures.
61
Advertising Expenses.
Advertising costs are expensed as incurred.
Income Taxes.
The Company accounts for income taxes in accordance with the authoritative guidance, which requires that deferred tax assets and liabilities be recognized using enacted tax rates for the effect of temporary differences between the book and tax bases of recorded assets and liabilities. The guidance also requires that deferred tax assets be reduced by a valuation allowance if it is more likely than not that a portion of the deferred tax asset will not be realized. The Company has determined that a valuation allowance is necessary against a portion of the deferred tax assets, but it anticipates that its future taxable income will be sufficient to recover the remainder of its deferred tax assets. However, should there be a change in the Company’s ability to recover its deferred tax assets that are not subject to a valuation allowance, the Company could be required to record an additional valuation allowance against such deferred tax assets. This would result in an increase to the Company’s tax provision in the period in which the Company determines that the recovery is not probable.
The Company applies a two-step approach, based on authoritative guidance, to recognizing and measuring uncertain tax positions. The first step is to evaluate the tax position for recognition by determining if the weight of available evidence indicates that it is more likely than not that the position will be sustained in audit, including resolution of related appeals or litigation processes, if any. The second step is to measure the tax benefit as the largest amount that is more than 50% likely of being realized upon ultimate settlement. The Company reevaluates these uncertain tax positions on a quarterly basis. This evaluation is based on factors including, but not limited to, changes in facts or circumstances, changes in tax law, effectively settled issues under audit and new audit activity. Any change in these factors could result in the recognition of a tax benefit or an additional charge to the tax provision.
Earnings Per Share.
Basic earnings per share (“EPS”) is calculated by dividing net income available to common stockholders by the weighted-average number of common shares outstanding during the period. Diluted earnings per share is calculated by using the weighted-average number of common shares outstanding during the period increased to include the number of additional shares of common stock that would have been outstanding if the dilutive potential shares of common stock had been issued. The dilutive effect of outstanding options and restricted stock units is reflected in diluted earnings per share by application of the treasury stock method. The dilutive securities are excluded from the computation of diluted net loss per share when a net loss is recorded for the period as their effect would be anti-dilutive.
Contingencies and Litigation.
The Company is subject to the possibility of losses from various contingencies. Considerable judgment is necessary to estimate the probability and amount of any loss from such contingencies. An accrual is made when it is probable that a liability has been incurred or an asset has been impaired and the amount of loss can be reasonably estimated. The Company accrues a liability and recognizes as expense the estimated costs expected to be incurred over the next twelve months to defend or settle asserted and unasserted claims existing as of the balance sheet date. See Note 13, “Commitments and Contingencies” and Note 14, “Litigation and Other Legal Matters” for a detailed description.
Reclassifications.
Certain reclassifications have been made to prior year financial statements to conform to the current year presentation. The reclassifications had no effect on the Consolidated Statements of Operations or Cash Flows.
Recent Accounting Pronouncements
Recently Adopted
In December 2011, the Financial Accounting Standard Board ("FASB") issued an accounting standard update requiring enhanced disclosure about certain financial instruments and derivative instruments that are offset in the balance sheet or subject to an enforceable master netting arrangement or similar agreement. The Company adopted the disclosure requirement in the first quarter of fiscal year ended June 30, 2014 and it did not have an impact on the financial position, results of operations or cash flows.
In February 2013, the FASB issued an accounting standard update on the reporting of reclassifications out of accumulated other comprehensive income of various components, which was originally deferred by the FASB in December 2011. The February 2013 update does not change the current requirements for reporting net income or other comprehensive income in financial statements. However, this update requires an entity to present parenthetically (on the face of the financial statements, in the notes or, in some cases, cross-referenced to related footnote disclosures) significant amounts reclassified from each component of accumulated other comprehensive income and the income statement line items affected by the reclassification. The amendment reflected in the February 2013 update was adopted by the Company in the first quarter of fiscal year ended June 30, 2014 and it did not have an impact on the financial position, results of operations or cash flows as it is disclosure-only in nature.
62
Updates Not Yet Effective
In July 2013, the FASB issued an accounting standard update that provides explicit guidance on the financial statement presentation of an unrecognized tax benefit when a net operating loss carryforward, a similar tax loss or a tax credit carryforward exists. Under the new standard update, in most circumstances, an unrecognized tax benefit, or a portion of an unrecognized tax benefit, should be presented in the Company's financial statements as a reduction to a deferred tax asset for a net operating loss carryforward, a similar tax loss or a tax credit carryforward. This accounting standard update will be effective for our interim period ending September 30, 2014 and applied prospectively with early adoption permitted. The Company does not expect that the requirement will have an impact on its financial position, result of operation or cash flows as it is disclosure-only in nature.
In May 2014, the FASB issued an accounting standard update regarding revenue from customer contracts to transfer goods and services or enter into contracts for the transfer of non-financial assets (unless covered by other standards for example insurance or lease contracts). Under the new guidance, an entity should recognize revenue to depict the transfer of promised goods or services to customers in an amount that reflects the consideration which the entity expects to be entitled in exchange for those goods or services. The updates are effective for the Company beginning the first quarter of the fiscal year ending June 30, 2018. Early application is not permitted. The Company is currently evaluating the impact of this accounting standard update on the consolidated financial statements.
In June 2014, the FASB issued an accounting standard update regarding stock-based compensation that clarifies the accounting when terms of an award provide that a performance target could be achieved after the requisite service period. The amendments require that a performance target that affects vesting which could be achieved after the requisite service period be treated as a performance condition. The update is effective for the Company beginning in the first quarter of the Company's fiscal year ending June 30, 2017, with early adoption permitted. The Company is currently evaluating the impact of this accounting standard update on the consolidated financial statements.
The Company’s financial assets and liabilities are measured and recorded at fair value, except for equity investments in privately-held companies. These equity investments are generally accounted for under the cost method of accounting and are periodically assessed for other-than-temporary impairment when an event or circumstance indicates that an other-than-temporary decline in value may have occurred. The Company’s non-financial assets, such as goodwill, intangible assets, and land, property and equipment, are recorded at cost and are assessed for impairment when an event or circumstance indicates that an other-than-temporary decline in value may have occurred.
Fair Value of Financial Instruments.
KLA-Tencor has evaluated the estimated fair value of financial instruments using available market information and valuations as provided by third-party sources. The use of different market assumptions and/or estimation methodologies could have a significant effect on the estimated fair value amounts. The fair value of the Company's cash equivalents, accounts receivable, accounts payable and other current liabilities approximate their carrying amounts due to the relatively short maturity of these items.
Fair Value Hierarchy.
The authoritative guidance for fair value measurements establishes a fair value hierarchy that prioritizes the inputs to valuation techniques used to measure fair value. The hierarchy gives the highest priority to unadjusted quoted prices in active markets for identical assets or liabilities (Level 1 measurements) and the lowest priority to unobservable inputs (Level 3 measurements). The three levels of the fair value hierarchy are described below:
|
Level 1
|
|
Valuations based on quoted prices in active markets for identical assets or liabilities that the entity has the ability to access.
|
|
Level 2
|
|
Valuations based on quoted prices for similar assets or liabilities, quoted prices in markets that are not active, or other inputs that are observable or can be corroborated by observable data for substantially the full term of the assets or liabilities.
|
|
Level 3
|
|
Valuations based on inputs that are supported by little or no market activity and that are significant to the fair value of the assets or liabilities.
|
A financial instrument’s level within the fair value hierarchy is based on the lowest level of any input that is significant to the fair value measurement.
63
All of the Company’s financial instruments were classified within Level 1 or Level 2 of the fair value hierarchy as of
June 30, 2014
, because they were valued using quoted market prices, broker/dealer quotes or alternative pricing sources with reasonable levels of price transparency. As of
June 30, 2014
, the types of instruments valued based on quoted market prices in active markets included money market funds and certain U.S. Government agency securities, U.S. Treasury securities and sovereign securities. Such instruments are generally classified within Level 1 of the fair value hierarchy.
As of
June 30, 2014
, the types of instruments valued based on other observable inputs included corporate debt securities, municipal securities and certain U.S. Government agency securities, U.S. Treasury securities and sovereign securities. The market inputs used to value these instruments generally consist of market yields, reported trades and broker/dealer quotes. Such instruments are generally classified within Level 2 of the fair value hierarchy.
The principal market in which the Company executes its foreign currency contracts is the institutional market in an over-the-counter environment with a relatively high level of price transparency. The market participants usually are large commercial banks. The Company's foreign currency contracts’ valuation inputs are based on quoted prices and quoted pricing intervals from public data sources and do not involve management judgment. These contracts are typically classified within Level 2 of the fair value hierarchy.
Financial assets (excluding cash held in operating accounts and time deposits) and liabilities measured at fair value on a recurring basis as of the date indicated below were presented on the Company's Consolidated Balance Sheet as follows:
|
As of June 30, 2014 (In thousands)
|
Total
|
Quoted Prices in
Active Markets
for Identical
Assets (Level 1)
|
Significant Other
Observable Inputs
(Level 2)
|
||||||||
|
Assets
|
|||||||||||
|
Cash equivalents:
|
|||||||||||
|
U.S. Government agency securities
|
$
|
28,000
|
|
$
|
8,000
|
|
$
|
20,000
|
|
||
|
Municipal securities
|
2,891
|
|
—
|
|
2,891
|
|
|||||
|
Corporate debt securities
|
68,992
|
|
—
|
|
68,992
|
|
|||||
|
Money market and other
|
397,517
|
|
397,517
|
|
—
|
|
|||||
|
Marketable securities:
|
|||||||||||
|
U.S. Treasury securities
|
384,400
|
|
365,401
|
|
18,999
|
|
|||||
|
U.S. Government agency securities
|
839,843
|
|
811,841
|
|
28,002
|
|
|||||
|
Municipal securities
|
93,325
|
|
—
|
|
93,325
|
|
|||||
|
Corporate debt securities
|
1,155,176
|
|
—
|
|
1,155,176
|
|
|||||
|
Sovereign securities
|
42,264
|
|
9,253
|
|
33,011
|
|
|||||
|
Total cash equivalents and marketable securities
(1)
|
3,012,408
|
|
1,592,012
|
|
1,420,396
|
|
|||||
|
Other current assets:
|
|||||||||||
|
Derivative assets
|
666
|
|
—
|
|
666
|
|
|||||
|
Other non-current assets:
|
|||||||||||
|
Executive Deferred Savings Plan
|
159,995
|
|
105,311
|
|
54,684
|
|
|||||
|
Total financial assets
(1)
|
$
|
3,173,069
|
|
$
|
1,697,323
|
|
$
|
1,475,746
|
|
||
|
Liabilities
|
|||||||||||
|
Other current liabilities:
|
|||||||||||
|
Derivative liabilities
|
$
|
(898
|
)
|
$
|
—
|
|
$
|
(898
|
)
|
||
|
Total financial liabilities
|
$
|
(898
|
)
|
$
|
—
|
|
$
|
(898
|
)
|
||
__________________
(1) Excludes cash of
$106.7 million
held in operating accounts and time deposits of
$33.5 million
as of
June 30, 2014
.
64
Financial assets (excluding cash held in operating accounts and time deposits) and liabilities measured at fair value on a recurring basis as of the date indicated below were presented on the Company's Consolidated Balance Sheet as follows:
|
As of June 30, 2013 (In thousands)
|
Total
|
Quoted Prices in
Active Markets
for Identical
Assets (Level 1)
|
Significant Other
Observable Inputs
(Level 2)
|
||||||||
|
Assets
|
|||||||||||
|
Cash equivalents:
|
|||||||||||
|
Corporate debt securities
|
$
|
3,800
|
|
$
|
—
|
|
$
|
3,800
|
|
||
|
Money market and other
|
817,608
|
|
817,608
|
|
—
|
|
|||||
|
Marketable securities:
|
|||||||||||
|
U.S. Treasury securities
|
93,787
|
|
93,787
|
|
—
|
|
|||||
|
U.S. Government agency securities
|
598,031
|
|
598,031
|
|
—
|
|
|||||
|
Municipal securities
|
103,455
|
|
—
|
|
103,455
|
|
|||||
|
Corporate debt securities
|
1,099,525
|
|
—
|
|
1,099,525
|
|
|||||
|
Sovereign securities
|
33,805
|
|
13,559
|
|
20,246
|
|
|||||
|
Total cash equivalents and marketable securities
(1)
|
2,750,011
|
|
1,522,985
|
|
1,227,026
|
|
|||||
|
Other current assets:
|
|||||||||||
|
Derivative assets
|
4,016
|
|
—
|
|
4,016
|
|
|||||
|
Other non-current assets:
|
|||||||||||
|
Executive Deferred Savings Plan
|
136,461
|
|
96,180
|
|
40,281
|
|
|||||
|
Total financial assets
(1)
|
$
|
2,890,488
|
|
$
|
1,619,165
|
|
$
|
1,271,323
|
|
||
|
Liabilities
|
|||||||||||
|
Other current liabilities:
|
|||||||||||
|
Derivative liabilities
|
$
|
(2,173
|
)
|
$
|
—
|
|
$
|
(2,173
|
)
|
||
|
Total financial liabilities
|
$
|
(2,173
|
)
|
$
|
—
|
|
$
|
(2,173
|
)
|
||
__________________
(1) Excludes cash of
$125.5 million
held in operating accounts and time deposits of
$43.4 million
as of
June 30, 2013
.
There were no transfers in and out of Level 1 and Level 2 fair value measurements during the fiscal year ended June 30,
2014
or
2013
. The Company did not have any assets or liabilities measured at fair value on a recurring basis within Level 3 fair value measurements as of June 30,
2014
or
2013
.
65
Consolidated Balance Sheets
|
|
As of June 30,
|
||||||
|
(In thousands)
|
2014
|
2013
|
|||||
|
Accounts receivable, net:
|
|||||||
|
Accounts receivable, gross
|
$
|
514,690
|
|
$
|
546,745
|
|
|
|
Allowance for doubtful accounts
|
(21,827
|
)
|
(22,135
|
)
|
|||
|
$
|
492,863
|
|
$
|
524,610
|
|
||
|
Inventories:
|
|||||||
|
Customer service parts
|
$
|
203,194
|
|
$
|
180,749
|
|
|
|
Raw materials
|
221,612
|
|
229,233
|
|
|||
|
Work-in-process
|
171,249
|
|
176,704
|
|
|||
|
Finished goods
|
60,402
|
|
47,762
|
|
|||
|
$
|
656,457
|
|
$
|
634,448
|
|
||
|
Other current assets:
|
|||||||
|
Prepaid expenses
|
$
|
35,478
|
|
$
|
31,997
|
|
|
|
Income tax related receivables
|
27,452
|
|
25,825
|
|
|||
|
Other current assets
|
6,267
|
|
17,217
|
|
|||
|
$
|
69,197
|
|
$
|
75,039
|
|
||
|
Land, property and equipment, net:
|
|||||||
|
Land
|
$
|
41,848
|
|
$
|
41,850
|
|
|
|
Buildings and leasehold improvements
|
302,537
|
|
272,920
|
|
|||
|
Machinery and equipment
|
491,167
|
|
476,747
|
|
|||
|
Office furniture and fixtures
|
20,945
|
|
20,701
|
|
|||
|
Construction-in-process
|
8,945
|
|
16,604
|
|
|||
|
865,442
|
|
828,822
|
|
||||
|
Less: accumulated depreciation and amortization
|
(535,179
|
)
|
(523,541
|
)
|
|||
|
$
|
330,263
|
|
$
|
305,281
|
|
||
|
Other non-current assets:
|
|||||||
|
Executive Deferred Savings Plan
(1)
|
$
|
159,996
|
|
$
|
136,461
|
|
|
|
Deferred tax assets—long-term
|
75,138
|
|
114,833
|
|
|||
|
Other non-current assets
|
23,385
|
|
18,129
|
|
|||
|
$
|
258,519
|
|
$
|
269,423
|
|
||
|
Other current liabilities:
|
|||||||
|
Warranty
|
$
|
37,746
|
|
$
|
42,603
|
|
|
|
Executive Deferred Savings Plan
(1)
|
160,527
|
|
137,849
|
|
|||
|
Compensation and benefits
|
203,990
|
|
195,793
|
|
|||
|
Income taxes payable
|
15,283
|
|
11,076
|
|
|||
|
Interest payable
|
8,769
|
|
8,769
|
|
|||
|
Other accrued expenses
|
158,775
|
|
130,959
|
|
|||
|
$
|
585,090
|
|
$
|
527,049
|
|
||
66
__________________
|
(1)
|
KLA-Tencor has a non-qualified deferred compensation plan whereby certain executives and non-employee directors may defer a portion of their compensation. Participants are credited with returns based on their allocation of their account balances among measurement funds. The Company controls the investment of these funds, and the participants remain general creditors of KLA-Tencor. Distributions from the plan commence following a participant’s retirement or termination of employment or on a specified date allowed per the plan provisions, except in cases where such distributions are required to be delayed in order to avoid a prohibited distribution under Internal Revenue Code Section 409A. As of
June 30, 2014
, the Company had a deferred compensation plan related asset and liability included as a component of other non-current assets and other current liabilities on the Consolidated Balance Sheets. The plan assets are classified as trading securities.
|
Accumulated Other Comprehensive Income (Loss)
The components of accumulated other comprehensive income (loss) (“OCI”) as of the dates indicated below were as follows:
|
(In thousands)
|
Currency Translation Adjustments
|
Unrealized Gains (Losses) on Available-for-Sale Securities
|
Unrealized Gains (Losses) on Cash Flow Hedges
|
Unrealized Gains (Losses) on Defined Benefit Plans
|
Total
|
||||||||||||||
|
Balance as of June 30, 2013
|
$
|
(22,467
|
)
|
$
|
(602
|
)
|
$
|
1,594
|
|
$
|
(15,171
|
)
|
$
|
(36,646
|
)
|
||||
|
Balance as of June 30, 2014
|
$
|
(17,271
|
)
|
$
|
2,800
|
|
$
|
(12
|
)
|
$
|
(15,788
|
)
|
$
|
(30,271
|
)
|
||||
The effects on net income of amounts reclassified from accumulated OCI to the Consolidated Statements of Operations for the indicated periods were as follows (in thousands):
|
Location in the Consolidated Statements of Operations
|
Twelve months ended
June 30 |
Twelve months ended
June 30 |
||||||||
|
Accumulated OCI Components
|
2014
|
2013
|
||||||||
|
Gains (losses) on cash flow hedges from foreign exchange contracts
|
Revenues
|
$
|
3,851
|
|
$
|
2,124
|
|
|||
|
Costs of revenues
|
294
|
|
(641
|
)
|
||||||
|
Net gains reclassified from accumulated OCI
|
$
|
4,145
|
|
$
|
1,483
|
|
||||
|
Unrealized gains on available-for-sale securities
|
Interest income and other, net
|
$
|
2,084
|
|
$
|
2,287
|
|
|||
The amounts reclassified out of accumulated OCI related to the Company's defined pension plans were recognized as a component of net periodic cost for the fiscal years ended
June 30, 2014
and
2013
were
$1.3 million
and
$1.1 million
, respectively. For additional details refer to Note 11, “Employee Benefit Plans.”
Consolidated Statements of Operations
|
|
Year ended June 30,
|
||||||||||
|
(In thousands)
|
2014
|
2013
|
2012
|
||||||||
|
Interest income and other, net:
|
|||||||||||
|
Interest income
|
$
|
13,555
|
|
$
|
14,976
|
|
$
|
15,321
|
|
||
|
Foreign exchange losses, net
|
(514
|
)
|
(1,002
|
)
|
(2,864
|
)
|
|||||
|
Net realized gains on sale of investments
|
1,236
|
|
2,287
|
|
637
|
|
|||||
|
Other
|
1,926
|
|
(1,149
|
)
|
(1,128
|
)
|
|||||
|
$
|
16,203
|
|
$
|
15,112
|
|
$
|
11,966
|
|
|||
67
The amortized cost and fair value of marketable securities as of the dates indicated below were as follows:
|
As of June 30, 2014 (In thousands)
|
Amortized
Cost
|
Gross
Unrealized
Gains
|
Gross
Unrealized
Losses
|
Fair Value
|
|||||||||||
|
U.S. Treasury securities
|
$
|
384,165
|
|
$
|
287
|
|
$
|
(52
|
)
|
$
|
384,400
|
|
|||
|
U.S. Government agency securities
|
867,309
|
|
651
|
|
(117
|
)
|
867,843
|
|
|||||||
|
Municipal securities
|
96,198
|
|
93
|
|
(75
|
)
|
96,216
|
|
|||||||
|
Corporate debt securities
|
1,220,794
|
|
3,526
|
|
(152
|
)
|
1,224,168
|
|
|||||||
|
Money market and other
|
397,517
|
|
—
|
|
—
|
|
397,517
|
|
|||||||
|
Sovereign securities
|
42,227
|
|
46
|
|
(9
|
)
|
42,264
|
|
|||||||
|
Subtotal
|
3,008,210
|
|
4,603
|
|
(405
|
)
|
3,012,408
|
|
|||||||
|
Add: Time deposits
(1)
|
33,509
|
|
—
|
|
—
|
|
33,509
|
|
|||||||
|
Less: Cash equivalents
|
524,149
|
|
—
|
|
(8
|
)
|
524,141
|
|
|||||||
|
Marketable securities
|
$
|
2,517,570
|
|
$
|
4,603
|
|
$
|
(397
|
)
|
$
|
2,521,776
|
|
|||
|
As of June 30, 2013 (In thousands)
|
Amortized
Cost
|
Gross
Unrealized
Gains
|
Gross
Unrealized
Losses
|
Fair Value
|
|||||||||||
|
U.S. Treasury securities
|
$
|
93,940
|
|
$
|
53
|
|
$
|
(206
|
)
|
$
|
93,787
|
|
|||
|
U.S. Government agency securities
|
598,471
|
|
569
|
|
(1,009
|
)
|
598,031
|
|
|||||||
|
Municipal securities
|
103,686
|
|
71
|
|
(302
|
)
|
103,455
|
|
|||||||
|
Corporate debt securities
|
1,103,438
|
|
2,353
|
|
(2,466
|
)
|
1,103,325
|
|
|||||||
|
Money market and other
|
817,608
|
|
—
|
|
—
|
|
817,608
|
|
|||||||
|
Sovereign securities
|
33,799
|
|
25
|
|
(19
|
)
|
33,805
|
|
|||||||
|
Subtotal
|
2,750,942
|
|
3,071
|
|
(4,002
|
)
|
2,750,011
|
|
|||||||
|
Add: Time deposits
(1)
|
43,413
|
|
—
|
|
—
|
|
43,413
|
|
|||||||
|
Less: Cash equivalents
|
859,933
|
|
—
|
|
—
|
|
859,933
|
|
|||||||
|
Marketable securities
|
$
|
1,934,422
|
|
$
|
3,071
|
|
$
|
(4,002
|
)
|
$
|
1,933,491
|
|
|||
__________________
(1) Time deposits excluded from fair value measurements.
KLA-Tencor’s investment portfolio consists of both corporate and government securities that have a maximum maturity of three years. The longer the duration of these securities, the more susceptible they are to changes in market interest rates and bond yields. As yields increase, those securities with a lower yield-at-cost show a mark-to-market unrealized loss. All unrealized losses are due to changes in market interest rates, bond yields and/or credit ratings. The Company has the ability to realize the full value of all of these investments upon maturity. The following table summarizes the fair value and gross unrealized losses of the Company's investments that were in an unrealized loss position as of the date indicated below:
|
As of June 30, 2014 (In thousands)
|
Fair Value
|
Gross
Unrealized
Losses
(1)
|
|||||
|
U.S. Treasury securities
|
$
|
192,159
|
|
$
|
(52
|
)
|
|
|
U.S. Government agency securities
|
163,701
|
|
(117
|
)
|
|||
|
Municipal securities
|
38,243
|
|
(73
|
)
|
|||
|
Corporate debt securities
|
147,555
|
|
(146
|
)
|
|||
|
Sovereign securities
|
12,816
|
|
(9
|
)
|
|||
|
Total
|
$
|
554,474
|
|
$
|
(397
|
)
|
|
__________________
|
(1)
|
As of
June 30, 2014
, the amount of total gross unrealized losses that had been in a continuous loss position for
12
months or more was immaterial.
|
68
The contractual maturities of securities classified as available-for-sale, regardless of their classification on the Company's Consolidated Balance Sheet, as of the date indicated below were as follows:
|
As of June 30, 2014 (In thousands)
|
Amortized
Cost
|
Fair Value
|
|||||
|
Due within one year
|
$
|
827,823
|
|
$
|
829,098
|
|
|
|
Due after one year through three years
|
1,689,747
|
|
1,692,678
|
|
|||
|
$
|
2,517,570
|
|
$
|
2,521,776
|
|
||
Actual maturities may differ from contractual maturities, because borrowers may have the right to call or prepay obligations with or without call or prepayment penalties. Realized gains for the fiscal years ended June 30,
2014
,
2013
and
2012
were
$2.2 million
,
$2.5 million
and
$2.1 million
, respectively. Realized losses for the fiscal years ended June 30,
2014
,
2013
and
2012
were
$0.1 million
,
$0.2 million
and
$1.5 million
, respectively.
On
March 28, 2014
, the Company acquired certain assets and liabilities of a privately-held company that developed and sold software to mask manufacturers, semiconductor fabs and mask inspection and review equipment manufacturers, for a total purchase consideration of
$18 million
in cash.
The following table represents the preliminary purchase price allocation and summarizes the aggregate estimated fair values of the net assets acquired on the closing date of the acquisition:
|
(In thousands)
|
Preliminary Purchase Price Allocation
|
||
|
Intangibles
|
$
|
9,400
|
|
|
Goodwill
|
8,730
|
|
|
|
Liabilities assumed
|
(130
|
)
|
|
|
Cash consideration paid
|
$
|
18,000
|
|
Goodwill represents the excess of the purchase price over the fair value of the net tangible and identifiable intangible assets acquired. The
$8.7 million
of goodwill was assigned to the Defect Inspection reporting unit.
Goodwill
The following table presents goodwill balances and the movements during the fiscal years ended
June 30, 2014
and
2013
:
|
(In thousands)
|
|||
|
As of June 30, 2012
|
$
|
327,716
|
|
|
Impairments
|
(984
|
)
|
|
|
Adjustments
|
(97
|
)
|
|
|
As of June 30, 2013
|
326,635
|
|
|
|
Acquisition
|
8,730
|
|
|
|
Adjustments
|
(10
|
)
|
|
|
As of June 30, 2014
|
$
|
335,355
|
|
Goodwill represents the excess of the purchase price over the fair value of the net tangible and identifiable intangible assets acquired in each business combination. The Company has four reporting units: Defect Inspection, Metrology, Service and Other. As of June 30,
2014
, substantially all of the goodwill balance resided in the Defect Inspection reporting unit.
69
The changes in the gross goodwill balance during the fiscal year ended June 30,
2014
resulted from the acquisition of certain assets and liabilities of a privately-held company and foreign currency translation adjustments. The changes in the gross goodwill balance during the fiscal year ended June 30,
2013
resulted from goodwill impairment when the Company decided to exit the solar inspection business due to adverse market conditions in that industry and recognized a charge of approximately
$1.0 million
, as well as foreign currency translation adjustments.
The Company performed a qualitative assessment of the goodwill by reporting unit as of November 30,
2013
and concluded that it was more likely than not that the fair value of each of the reporting units exceeded its carrying amount. In assessing the qualitative factors, the Company considered the impact of key factors including change in industry and competitive environment, market capitalization, stock price, earnings multiples, budgeted-to-actual revenue performance from prior year, gross margin and cash flow from operating activities. As such, it was not necessary to perform the two-step quantitative goodwill impairment test at that time. In addition, there have been no significant events or circumstances affecting the valuation of goodwill subsequent to the qualitative assessment performed in the second quarter of the fiscal year ended June 30,
2014
. The next annual assessment of the goodwill by reporting unit will be performed in the second quarter of the fiscal year ending June 30,
2015
.
Purchased Intangible Assets
The components of purchased intangible assets as of the dates indicated below were as follows:
|
(In thousands)
|
As of June 30, 2014
|
As of June 30, 2013
|
|||||||||||||||||||||||
|
Category
|
Range of
Useful Lives
|
Gross
Carrying
Amount
|
Accumulated
Amortization and Impairment
|
Net
Amount
|
Gross
Carrying
Amount
|
Accumulated
Amortization and Impairment
|
Net
Amount
|
||||||||||||||||||
|
Existing technology
|
4-7 years
|
$
|
141,659
|
|
$
|
126,567
|
|
$
|
15,092
|
|
$
|
133,659
|
|
$
|
119,106
|
|
$
|
14,553
|
|
||||||
|
Patents
|
6-13 years
|
57,648
|
|
54,398
|
|
3,250
|
|
57,648
|
|
51,068
|
|
6,580
|
|
||||||||||||
|
Trade name/Trademark
|
4-10 years
|
19,893
|
|
17,427
|
|
2,466
|
|
19,893
|
|
15,928
|
|
3,965
|
|
||||||||||||
|
Customer relationships
|
6-7 years
|
54,680
|
|
48,915
|
|
5,765
|
|
54,680
|
|
45,263
|
|
9,417
|
|
||||||||||||
|
Other
|
0-1 year
|
17,599
|
|
16,475
|
|
1,124
|
|
16,200
|
|
16,200
|
|
—
|
|
||||||||||||
|
Total
|
$
|
291,479
|
|
$
|
263,782
|
|
$
|
27,697
|
|
$
|
282,080
|
|
$
|
247,565
|
|
$
|
34,515
|
|
|||||||
Intangible assets are reviewed for impairment whenever events or changes in circumstances indicate that the carrying amount of an asset or asset group may not be recoverable.
For the fiscal years ended June 30,
2014
,
2013
and
2012
, amortization expense for other intangible assets was
$16.2 million
,
$20.8 million
and
$30.3 million
, respectively. Based on the intangible assets recorded as of
June 30, 2014
, and assuming no subsequent additions to or impairment of the underlying assets, the remaining estimated annual amortization expense is expected to be as follows:
|
Year ending June 30:
|
Amortization
(In thousands)
|
||
|
2015
|
$
|
15,802
|
|
|
2016
|
7,564
|
|
|
|
2017
|
2,806
|
|
|
|
2018
|
1,525
|
|
|
|
Total
|
$
|
27,697
|
|
70
In April 2008, the Company issued
$750 million
aggregate principal amount of
6.90%
senior, unsecured long-term debt due in
2018
with an effective interest rate of
7.00%
. The discount on the debt amounted to
$5.4 million
and is being amortized over the life of the debt using the straight-line method as opposed to the interest method due to immateriality. Interest is payable
semi-annually
on November 1 and May 1. The debt indenture includes covenants that limit the Company’s ability to grant liens on its facilities and to enter into sale and leaseback transactions, subject to significant allowances under which certain sale and leaseback transactions are not restricted. The Company was in compliance with all of its covenants as of
June 30, 2014
.
In certain circumstances involving a change of control followed by a downgrade of the rating of the Company’s senior notes, the Company will be required to make an offer to repurchase the senior notes at a purchase price equal to
101%
of the aggregate principal amount of the notes, plus accrued and unpaid interest. The Company’s ability to repurchase the senior notes in such event may be limited by law, by the indenture associated with the senior notes, by the Company’s then-available financial resources or by the terms of other agreements to which the Company may be party at such time. If the Company fails to repurchase the senior notes as required by the indenture, it would constitute an event of default under the indenture governing the senior notes which, in turn, may also constitute an event of default under other obligations.
Based on the trading prices of the debt on the applicable dates, the fair value of the debt as of
June 30, 2014
and
2013
was
$893.7 million
and
$872.3 million
, respectively. While the debt is recorded at cost, the fair value of the long-term debt was determined based on quoted prices in markets that are not active; accordingly, the long-term debt is categorized as Level 2 for purposes of the fair value measurement hierarchy.
Equity Incentive Program
As of
June 30, 2014
, the Company had two plans under which the Company was able to issue equity incentive awards, such as restricted stock units and stock options, to its employees, consultants and members of its Board of Directors: the 2004 Equity Incentive Plan (the “2004 Plan”) and the 1998 Director Plan (the “Outside Director Plan”).
2004 Plan:
The 2004 Plan provides for the grant of options to purchase shares of the Company's common stock, stock appreciation rights, restricted stock units, performance shares, performance units and deferred stock units to the Company's employees, consultants and members of its Board of Directors. As of
June 30, 2014
,
7.1 million
shares were available for issuance under the 2004 Plan.
Any 2004 Plan awards of restricted stock units, performance shares, performance units or deferred stock units with a per share or unit purchase price lower than
100%
of fair market value on the grant date are counted against the total number of shares issuable under the 2004 Plan as follows, based on the grant date of the applicable award: (a) for any such awards granted before November 6, 2013, the awards counted against the 2004 Plan share reserve as
1.8
shares for every one share subject thereto; and (b) for any such awards granted on or after November 6, 2013, the awards count against the 2004 Plan share reserve as
2.0
shares for every
one share
subject thereto.
In addition, in November 2013, the Company's stockholders also approved amendments to the 2004 Plan that included, among other things, giving the plan administrator the ability to grant "dividend equivalent" rights in connection with awards of restricted stock units, performance shares, performance units and deferred stock units before they are fully vested. It allows the plan administrator, at its discretion, to grant a right to receive dividends on the aforementioned awards which may be settled in cash or Company stock at the discretion of the plan administrator subject to meeting the vesting requirement of the underlying awards. As of June 30, 2014, the Company had not granted any dividend equivalent rights in connection with any such awards.
Outside Director Plan
The Outside Director Plan only permits the issuance of stock options to the non-employee members of the Board of Directors. As of June 30, 2014,
1.7 million
shares were available for grant under the Outside Director Plan.
71
Equity Incentive Plans - General Information
The following table summarizes the combined activity under the Company's equity incentive plans for the indicated periods:
|
(In thousands)
|
Available
For Grant
|
|
|
Balances as of June 30, 2011
|
11,554
|
|
|
Restricted stock units granted
(1)
|
(4,145
|
)
|
|
Restricted stock units canceled
(1)
|
508
|
|
|
Options canceled/expired/forfeited
|
788
|
|
|
Plan shares expired
(2)
|
(736
|
)
|
|
Balances as of June 30, 2012
|
7,969
|
|
|
Restricted stock units granted
(1)(3)
|
(1,899
|
)
|
|
Restricted stock units canceled
(1)
|
466
|
|
|
Options canceled/expired/forfeited
|
207
|
|
|
Plan shares expired
(2)
|
(47
|
)
|
|
Balances as of June 30, 2013
|
6,696
|
|
|
Plan shares increased
|
2,900
|
|
|
Restricted stock units granted
(1)(3)
|
(1,268
|
)
|
|
Restricted stock units canceled
(1)
|
468
|
|
|
Options canceled/expired/forfeited
|
59
|
|
|
Plan shares expired
(2)
|
(51
|
)
|
|
Balances as of June 30, 2014
|
8,804
|
|
__________________
|
(1)
|
The number of restricted stock units provided in this row reflects the application of the award multiplier as described above (1.8x or 2.0x depending on the grant date of the applicable award).
|
|
(2)
|
Represents the portion of shares listed as “Options canceled/expired/forfeited” above that were issued under the Company’s equity incentive plans other than the 2004 Plan and the Outside Director Plan. Because the Company is only currently authorized to issue equity awards under the 2004 Plan and the Outside Director Plan, any equity awards that are canceled, expired or are forfeited under any other Company equity incentive plans do not result in additional shares being available to the Company for future grant.
|
|
(3)
|
Includes restricted stock units granted to senior management during the applicable fiscal year with performance-based vesting criteria (in addition to service-based vesting criteria for any of such restricted stock units that are deemed to have been earned). As of
June 30, 2014
, it had not yet been determined the extent to which (if at all) the performance-based vesting criteria of such restricted stock units had been satisfied. Therefore, this line item includes all such performance-based restricted stock units granted during such fiscal year, reported at the maximum possible number of shares that may ultimately be issuable under such restricted stock units if all applicable performance-based criteria are achieved at their maximum and all applicable service-based criteria are fully satisfied (i.e.,
0.6 million
shares for the fiscal year ended
June 30, 2013
and
0.6 million
shares for the fiscal year ended
June 30, 2014
, which in each case reflects the application of the 1.8x multiple described above that was in effect as of the applicable grant date).
|
The Company has granted only restricted stock units under its equity incentive program since October 2007. For the preceding several years until October 31, 2007, stock options were granted at the market price of the Company’s common stock on the date of grant generally with vesting term ranging from one to five years. Restricted stock units may be granted with varying criteria such as service-based and/or performance-based vesting.
72
The fair value of stock-based awards is measured at the grant date and is recognized as an expense over the employee’s requisite service period. The fair value is determined using a Black-Scholes valuation model for purchase rights under the Company’s Employee Stock Purchase Plan and, for restricted stock units granted without “dividend equivalent” rights, using the closing price of the Company’s common stock on the grant date, adjusted to exclude the present value of dividends which are not accrued on those restricted stock units. In November 2013, the Company's stockholders approved amendments to the 2004 Plan that included, among other things, giving the plan administrator the ability to grant dividend equivalent rights in connection with awards of restricted stock units, performance shares, performance units and deferred stock units before they are fully vested as discussed above.
As of June 30, 2014
, the Company had not any granted dividend equivalent rights in connection with any such awards. The following table shows pre-tax stock-based compensation expense for the indicated periods:
|
Year ended June 30,
|
|||||||||||
|
(In thousands)
|
2014
|
2013
|
2012
|
||||||||
|
Stock-based compensation expense by:
|
|||||||||||
|
Costs of revenues
|
$
|
9,101
|
|
$
|
11,433
|
|
$
|
13,710
|
|
||
|
Engineering, research and development
|
16,397
|
|
19,346
|
|
21,505
|
|
|||||
|
Selling, general and administrative
|
35,442
|
|
39,305
|
|
43,620
|
|
|||||
|
Total stock-based compensation expense
|
$
|
60,940
|
|
$
|
70,084
|
|
$
|
78,835
|
|
||
The following table shows stock-based compensation capitalized as inventory as of the dates indicated below:
|
(In thousands)
|
As of June 30,
|
||||||
|
2014
|
2013
|
||||||
|
Inventory
|
$
|
8,278
|
|
$
|
8,098
|
|
|
Stock Options
The following table summarizes the activity and weighted-average exercise price for stock options under all plans during the fiscal year ended
June 30, 2014
:
|
Stock Options
|
Shares
(In thousands)
|
Weighted-Average
Exercise Price
|
||||
|
Outstanding stock options as of June 30, 2013
|
1,663
|
|
$
|
48.97
|
|
|
|
Granted
|
—
|
|
$
|
—
|
|
|
|
Exercised
|
(1,463
|
)
|
$
|
49.61
|
|
|
|
Canceled/expired/forfeited
|
(59
|
)
|
$
|
52.76
|
|
|
|
Outstanding stock options as of June 30, 2014 (all outstanding and all vested and exercisable)
|
141
|
|
$
|
40.70
|
|
|
The Company has not issued any stock options since October 2007. As of
June 30, 2014
, the Company had no unrecognized stock-based compensation balance related to outstanding stock options. The weighted-average remaining contractual terms for total options outstanding under all plans and for total options vested and exercisable under all plans as of
June 30, 2014
were each
0.3 years
. The aggregate intrinsic value for total options outstanding under all plans (all of which were vested and exercisable as of
June 30, 2014
) was
$4.5 million
.
The following table shows the total intrinsic value of options exercised, total cash received from employees and non-employee Board members as a result of stock option exercises and tax benefits realized by the Company in connection with these stock option exercises for the indicated periods:
|
(In thousands)
|
Year ended June 30,
|
||||||||||
|
2014
|
2013
|
2012
|
|||||||||
|
Total intrinsic value of options exercised
|
$
|
18,022
|
|
$
|
15,884
|
|
$
|
23,395
|
|
||
|
Total cash received from employees and non-employee Board members as a result of stock option exercises
|
$
|
72,700
|
|
$
|
89,935
|
|
$
|
129,306
|
|
||
|
Tax benefits realized by the Company in connection with these exercises
|
$
|
5,708
|
|
$
|
5,223
|
|
$
|
7,867
|
|
||
73
The Company generally settles employee stock option exercises with newly issued common shares, except in certain tax jurisdictions where settling such exercises with treasury shares provides the Company or one of its subsidiaries with a tax benefit.
Restricted Stock Units
The following table shows the applicable number of restricted stock units and weighted-average grant date fair value for restricted stock units granted, vested and released, withheld for taxes, and forfeited during the fiscal year ended
June 30, 2014
and restricted stock units outstanding as of
June 30, 2014
and
2013
:
|
Restricted Stock Units
|
Shares
(In thousands)
(1)
|
Weighted-Average
Grant Date
Fair Value
|
||||
|
Outstanding restricted stock units as of June 30, 2013
(2)
|
5,374
|
|
$
|
34.39
|
|
|
|
Granted
(2)
|
702
|
|
$
|
53.28
|
|
|
|
Vested and released
|
(1,589
|
)
|
$
|
33.28
|
|
|
|
Withheld for taxes
|
(871
|
)
|
$
|
33.28
|
|
|
|
Forfeited
|
(260
|
)
|
$
|
37.15
|
|
|
|
Outstanding restricted stock units as of June 30, 2014
(2)
|
3,356
|
|
$
|
38.95
|
|
|
__________________
|
(1)
|
Share numbers reflect actual shares subject to awarded restricted stock units. As described above, under the terms of the 2004 Plan, the number of shares subject to each award reflected in this number is multiplied by either
1.8
or
2.0
(depending on the grant date of the award) to calculate the impact of the award on the share reserve under the 2004 Plan.
|
|
(2)
|
Includes restricted stock units granted to senior management during the applicable fiscal year with performance-based vesting criteria (in addition to service-based vesting criteria for any of such restricted stock units that are deemed to have been earned). As of
June 30, 2014
, it had not yet been determined the extent to which (if at all) the performance-based vesting criteria of such restricted stock units had been satisfied. Therefore, this line item includes all such performance-based restricted stock units granted during such fiscal year, reported at the maximum possible number of shares that may ultimately be issuable under such restricted stock units if all applicable performance-based criteria are achieved at their maximum and all applicable service-based criteria are fully satisfied (i.e.,
0.3 million
shares for each of the fiscal years ended June 30, 2013 and
June 30, 2014
).
|
The restricted stock units granted by the Company since the beginning of the fiscal year ended June 30, 2013 generally vest (a) with respect to awards with only service-based vesting criteria, in
four
equal installments on the first, second, third and fourth anniversaries of the grant date and (b) with respect to awards with both performance-based and service-based vesting criteria, in
two
equal installments on the third and fourth anniversaries of the grant date, in each case subject to the recipient remaining employed by the Company as of the applicable vesting date. The restricted stock units granted by the Company from the beginning of the fiscal year ended June 30, 2007 through the fiscal year ended June 30, 2012 generally vest in
two
equal installments on the second and fourth anniversaries of the grant date, subject to the recipient remaining employed by the Company as of the applicable vesting date.
The following table shows the weighted-average grant date fair value per unit for the restricted stock units granted and tax benefits realized by the Company in connection with vested and released restricted stock units for the indicated periods:
|
(In thousands, except for weighted-average grant date fair value)
|
Year ended June 30,
|
||||||||||
|
2014
|
2013
|
2012
|
|||||||||
|
Weighted-average grant date fair value per unit
|
$
|
53.28
|
|
$
|
47.71
|
|
$
|
32.19
|
|
||
|
Tax benefits realized by the Company in connection with vested and released restricted stock units
|
$
|
44,298
|
|
$
|
29,204
|
|
$
|
28,914
|
|
||
As of
June 30, 2014
, the unrecognized stock-based compensation expense balance related to restricted stock units was
$75.3 million
, excluding the impact of estimated forfeitures, and will be recognized over a weighted-average remaining contractual term and an estimated weighted-average amortization period of
1.1 years
. The intrinsic value of outstanding restricted stock units as of
June 30, 2014
was
$243.8 million
.
74
Cash-Based Long-Term Incentive Compensation
Starting in the fiscal year ended
June 30, 2013
, the Company adopted a cash-based long-term incentive ("Cash LTI") program for many of its employees as part of the Company's employee compensation program. During the fiscal year ended
June 30, 2014
, the Company approved Cash LTI awards of
$67.7 million
under the Company's Cash Long-Term Incentive Plan (“Cash LTI Plan”). Cash LTI awards issued to employees under the Cash LTI Plan vest in
four
equal installments, with
25%
of the aggregate amount of the Cash LTI award vesting on each yearly anniversary of the grant date over a
four
-year period. In order to receive payments under a Cash LTI award, participants must remain employed by the Company as of the applicable award vesting date. Executives and non-employee Board members are not participating in this program. During the fiscal years ended
June 30, 2014
and
2013
, the Company recognized
$26.2 million
and
$11.0 million
, respectively, in compensation expense under the Cash LTI Plan. As of
June 30, 2014
, the unrecognized compensation balance (excluding the impact of estimated forfeitures) related to the Cash LTI Plan was
$87.1 million
.
Employee Stock Purchase Plan
KLA-Tencor’s Employee Stock Purchase Plan (“ESPP”) provides that eligible employees may contribute up to
10%
of their eligible earnings toward the semi-annual purchase of KLA-Tencor’s common stock. The ESPP is qualified under Section 423 of the Internal Revenue Code. The employee’s purchase price is derived from a formula based on the closing price of the common stock on the first day of the offering period versus the closing price on the date of purchase (or, if not a trading day, on the immediately preceding trading day).
The offering period (or length of the look-back period) under the ESPP has a duration of six months, and the purchase price with respect to each offering period beginning on or after such date is, until otherwise amended, equal to
85%
of the lesser of (i) the fair market value of the Company’s common stock at the commencement of the applicable six-month offering period or (ii) the fair market value of the Company’s common stock on the purchase date. The Company estimates the fair value of purchase rights under the ESPP using a Black-Scholes valuation model.
The fair value of each purchase right under the ESPP was estimated on the date of grant using the Black-Scholes option valuation model and the straight-line attribution approach with the following weighted-average assumptions:
|
|
Year ended June 30,
|
|||||||
|
|
2014
|
2013
|
2012
|
|||||
|
Stock purchase plan:
|
||||||||
|
Expected stock price volatility
|
27.5
|
%
|
28.8
|
%
|
36.0
|
%
|
||
|
Risk-free interest rate
|
0.1
|
%
|
0.1
|
%
|
0.1
|
%
|
||
|
Dividend yield
|
2.9
|
%
|
3.2
|
%
|
3.2
|
%
|
||
|
Expected life (in years)
|
0.50
|
|
0.50
|
|
0.50
|
|
||
The following table shows total cash received from employees for the issuance of shares under the ESPP, the number of shares purchased by employees through the ESPP, the tax benefits realized by the Company in connection with the disqualifying dispositions of shares purchased under the ESPP and the weighted-average fair value per share for the indicated periods:
|
(In thousands, except for weighted-average fair value per share)
|
Year ended June 30,
|
||||||||||
|
2014
|
2013
|
2012
|
|||||||||
|
Total cash received from employees for the issuance of shares under the ESPP
|
$
|
39,675
|
|
$
|
36,186
|
|
$
|
34,263
|
|
||
|
Number of shares purchased by employees through the ESPP
|
796
|
|
877
|
|
918
|
|
|||||
|
Tax benefits realized by the Company in connection with the disqualifying dispositions of shares purchased under the ESPP
|
$
|
2,221
|
|
$
|
1,452
|
|
$
|
2,206
|
|
||
|
Weighted-average fair value per share based on Black-Scholes model
|
$
|
12.31
|
|
$
|
10.46
|
|
$
|
10.02
|
|
||
The ESPP shares are replenished annually on the first day of each fiscal year by virtue of an evergreen provision. The provision allows for share replenishment equal to the lesser of
2.0 million
shares or the number of shares which KLA-Tencor estimates will be required to be issued under the ESPP during the forthcoming fiscal year. As of
June 30, 2014
, after giving effect to the ESPP purchase that occurred on such date, a total of
0.9 million
shares were reserved and available for issuance under the ESPP. In August 2014, the Company added
2.0 million
additional shares to the ESPP pursuant to the plan's share replenishment provision with respect to the fiscal year ending June 30, 2015.
75
Our Board of Directors has authorized a program for the Company to repurchase shares of the Company's common stock. The intent of this program is to offset the dilution from KLA-Tencor’s equity incentive plans and employee stock purchase plan, as well as to return excess cash to the Company’s stockholders. Subject to market conditions, applicable legal requirements and other factors, the repurchases will be made from time to time in the open market in compliance with applicable securities laws, including the Securities Exchange Act of 1934 and the rules promulgated thereunder such as Rule 10b-18. As of
June 30, 2014
,
2.0 million
shares were available for repurchase under the Company’s repurchase program. Following the completion of the fiscal year ended
June 30, 2014
, the Company's Board of Directors authorized KLA-Tencor to repurchase additional shares under this program; for more information, refer to Note 19, "Subsequent Events" to the Consolidated Financial Statements.
Share repurchases for the indicated periods (based on the settlement date of the applicable repurchase) were as follows:
|
(In thousands)
|
Year ended June 30,
|
||||||
|
2014
|
2013
|
||||||
|
Number of shares of common stock repurchased
|
3,835
|
|
5,374
|
|
|||
|
Total cost of repurchases
|
$
|
240,843
|
|
$
|
273,254
|
|
|
The following table sets forth the computation of basic and diluted net income per share:
|
(In thousands, except per share amounts)
|
Year ended June 30,
|
||||||||||
|
2014
|
2013
|
2012
|
|||||||||
|
Numerator:
|
|||||||||||
|
Net income
|
$
|
582,755
|
|
$
|
543,149
|
|
$
|
756,015
|
|
||
|
Denominator:
|
|||||||||||
|
Weighted-average shares-basic, excluding unvested restricted stock units
|
166,016
|
|
166,089
|
|
166,795
|
|
|||||
|
Effect of dilutive options and restricted stock units
|
2,102
|
|
3,171
|
|
3,352
|
|
|||||
|
Weighted-average shares-diluted
|
168,118
|
|
169,260
|
|
170,147
|
|
|||||
|
Basic net income per share
|
$
|
3.51
|
|
$
|
3.27
|
|
$
|
4.53
|
|
||
|
Diluted net income per share
|
$
|
3.47
|
|
$
|
3.21
|
|
$
|
4.44
|
|
||
|
Anti-dilutive securities excluded from the computation of diluted net income per share
|
—
|
|
1,366
|
|
3,123
|
|
|||||
KLA-Tencor has a profit sharing program for eligible employees, which distributes, on a quarterly basis, a percentage of the Company’s pre-tax profits. In addition, the Company has an employee savings plan that qualifies as a deferred salary arrangement under Section 401(k) of the Internal Revenue Code. Since April 1, 2011, the employer match amount was
50%
of the first
$8,000
of an eligible employee's contribution (i.e., a maximum of
$4,000
) during each fiscal year.
The total expenses under the profit sharing and 401(k) programs aggregated
$15.4 million
,
$13.1 million
and
$12.6 million
in the fiscal years ended
June 30, 2014
,
2013
and
2012
, respectively. The Company has no defined benefit plans in the United States. In addition to the profit sharing plan and the United States 401(k), several of the Company's foreign subsidiaries have retirement plans for their full-time employees, several of which are defined benefit plans. Consistent with the requirements of local law, the Company deposits funds for certain of these plans with insurance companies, with third-party trustees or into government-managed accounts and/or accrues for the unfunded portion of the obligation. The assumptions used in calculating the obligation for the foreign plans depend on the local economic environment.
The Company applies authoritative guidance that requires an employer to recognize the funded status of each of its defined pension and post-retirement benefit plans as a net asset or liability in its statement of financial position. Additionally, the authoritative guidance requires an employer to measure the funded status of each of its plans as of the date of its year-end statement of financial position. The benefit obligations and related assets under the Company’s plans have been measured as of June 30,
2014
and
2013
.
76
Summary data relating to the Company's foreign defined benefit pension plans, including key weighted-average assumptions used, is provided in the following tables:
|
|
Year ended June 30,
|
||||||
|
(In thousands)
|
2014
|
2013
|
|||||
|
Change in projected benefit obligation:
|
|||||||
|
Projected benefit obligation as of the beginning of the fiscal year
|
$
|
71,276
|
|
$
|
65,426
|
|
|
|
Service cost
|
4,054
|
|
3,399
|
|
|||
|
Interest cost
|
1,401
|
|
1,320
|
|
|||
|
Contributions by plan participants
|
102
|
|
85
|
|
|||
|
Adjustment
|
—
|
|
(1,878
|
)
|
|||
|
Actuarial loss
|
1,927
|
|
8,792
|
|
|||
|
Benefit payments
|
(1,910
|
)
|
(767
|
)
|
|||
|
Foreign currency exchange rate changes
|
185
|
|
(5,101
|
)
|
|||
|
Projected benefit obligation as of the end of the fiscal year
|
$
|
77,035
|
|
$
|
71,276
|
|
|
|
|
Year ended June 30,
|
||||||
|
(In thousands)
|
2014
|
2013
|
|||||
|
Change in fair value of plan assets:
|
|||||||
|
Fair value of plan assets as of the beginning of the fiscal year
|
$
|
13,317
|
|
$
|
11,709
|
|
|
|
Actual return on plan assets
|
274
|
|
202
|
|
|||
|
Employer contributions
|
3,229
|
|
2,083
|
|
|||
|
Benefit and expense payments
|
(1,910
|
)
|
(767
|
)
|
|||
|
Foreign currency exchange rate changes
|
253
|
|
90
|
|
|||
|
Fair value of plan assets as of the end of the fiscal year
|
$
|
15,163
|
|
$
|
13,317
|
|
|
|
As of June 30,
|
|||||||
|
(In thousands)
|
2014
|
2013
|
|||||
|
Underfunded status
|
$
|
61,872
|
|
$
|
57,959
|
|
|
|
|
As of June 30,
|
||||||
|
(In thousands)
|
2014
|
2013
|
|||||
|
Plans with accumulated benefit obligations in excess of plan assets:
|
|||||||
|
Accumulated benefit obligation
|
$
|
47,122
|
|
$
|
45,181
|
|
|
|
Projected benefit obligation
|
$
|
77,035
|
|
$
|
71,276
|
|
|
|
Plan assets at fair value
|
$
|
15,163
|
|
$
|
13,317
|
|
|
|
|
Year ended June 30,
|
||||
|
|
2014
|
2013
|
2012
|
||
|
Weighted-average assumptions:
|
|||||
|
Discount rate
|
1.5%-3.5%
|
1.5%-3.5%
|
1.3%-5.5%
|
||
|
Expected rate of return on assets
|
1.8%-3.8%
|
1.8%-4.0%
|
1.8%-4.5%
|
||
|
Rate of compensation increases
|
3.0%-5.5%
|
3.0%-5.0%
|
3.0%-4.5%
|
||
The assumptions for expected rate of return on assets were developed by considering the historical returns and expectations of future returns relevant to the country in which each plan is in effect and the investments applicable to the corresponding plan. The discount rate for each plan was derived by reference to appropriate benchmark yields on high quality corporate bonds, allowing for the approximate duration of both plan obligations and the relevant benchmark index.
77
The following table presents losses recognized in accumulated other comprehensive income (loss) related to the Company's foreign defined benefit pension plans:
|
|
Year ended June 30,
|
||||||
|
(In thousands)
|
2014
|
2013
|
|||||
|
Unrecognized transition obligation
|
$
|
772
|
|
$
|
1,029
|
|
|
|
Unrecognized prior service cost
|
225
|
|
278
|
|
|||
|
Unrealized net loss
|
23,645
|
|
22,633
|
|
|||
|
Amount of losses recognized
|
$
|
24,642
|
|
$
|
23,940
|
|
|
Losses in accumulated other comprehensive income (loss) related to the Company's foreign defined benefit pension plans expected to be recognized as components of net periodic benefit cost over the fiscal year ending
June 30, 2015
are as follows:
|
(In thousands)
|
Year ending
June 30, 2015
|
||
|
Unrecognized transition obligation
|
$
|
262
|
|
|
Unrecognized prior service cost
|
51
|
|
|
|
Unrealized net loss
|
1,005
|
|
|
|
Amount of losses expected to be recognized
|
$
|
1,318
|
|
The components of the Company's net periodic cost relating to its foreign subsidiaries' defined pension plans are as follows:
|
|
Year ended June 30,
|
||||||||||
|
(In thousands)
|
2014
|
2013
|
2012
|
||||||||
|
Components of net periodic pension cost
|
|||||||||||
|
Service cost
|
$
|
4,054
|
|
$
|
3,399
|
|
$
|
3,355
|
|
||
|
Interest cost
|
1,401
|
|
1,320
|
|
1,406
|
|
|||||
|
Return on plan assets
|
(321
|
)
|
(315
|
)
|
(309
|
)
|
|||||
|
Amortization of transitional obligation
|
262
|
|
372
|
|
380
|
|
|||||
|
Amortization of prior service cost
|
52
|
|
58
|
|
64
|
|
|||||
|
Amortization of net loss
|
1,021
|
|
633
|
|
292
|
|
|||||
|
Adjustment
|
—
|
|
(1,436
|
)
|
—
|
|
|||||
|
Net periodic pension cost
|
$
|
6,469
|
|
$
|
4,031
|
|
$
|
5,188
|
|
||
Fair Value of Plan Assets
Fair value is the price that would be received from selling an asset or paid to transfer a liability in an orderly transaction between market participants at the measurement date. The three levels of inputs used to measure fair value of plan assets are described in Note 2, “Fair Value Measurements.”
The foreign plans’ investments are managed by third-party trustees consistent with the regulations or market practice of the country where the assets are invested. The Company is not actively involved in the investment strategy, nor does it have control over the target allocation of these investments. These investments made up
100%
of total foreign plan assets in the fiscal years ended
June 30, 2014
,
2013
and
2012
.
The expected aggregate employer contribution for the foreign plans during the fiscal year ending
June 30, 2015
is
$1.7 million
.
The total benefits to be paid from the foreign pension plans are not expected to exceed
$3.2 million
in any year through the fiscal year ending June 30,
2024
.
78
Foreign plan assets measured at fair value on a recurring basis consisted of the following investment categories as of
June 30, 2014
:
|
(In thousands)
|
Total
|
Quoted Prices in
Active Markets
for Identical
Assets (Level 1)
|
Significant Other
Observable Inputs
(Level 2)
|
||||||||
|
Cash and cash equivalents
|
$
|
11,061
|
|
$
|
11,061
|
|
$
|
—
|
|
||
|
Government and municipal securities and other investments
|
4,102
|
|
—
|
|
4,102
|
|
|||||
|
Total assets measured at fair value
|
$
|
15,163
|
|
$
|
11,061
|
|
$
|
4,102
|
|
||
Concentration of Risk
The Company manages a variety of risks, including market, credit and liquidity risks, across its plan assets through its investment managers. The Company defines a concentration of risk as an undiversified exposure to one of the above-mentioned risks that increases the exposure of the loss of plan assets unnecessarily. The Company monitors exposure to such risks in the foreign plans by monitoring the magnitude of the risk in each plan and diversifying the Company's exposure to such risks across a variety of instruments, markets and counterparties. As of June 30,
2014
, the Company did not have concentrations of plan asset investment risk in any single entity, manager, counterparty, sector, industry or country.
The components of income before income taxes are as follows:
|
|
Year ended June 30,
|
||||||||||
|
(In thousands)
|
2014
|
2013
|
2012
|
||||||||
|
Domestic income before income taxes
|
$
|
434,336
|
|
$
|
420,862
|
|
$
|
607,146
|
|
||
|
Foreign income before income taxes
|
300,125
|
|
269,759
|
|
366,948
|
|
|||||
|
Total income before income taxes
|
$
|
734,461
|
|
$
|
690,621
|
|
$
|
974,094
|
|
||
The provision for income taxes is comprised of the following:
|
(In thousands)
|
Year ended June 30,
|
||||||||||
|
2014
|
2013
|
2012
|
|||||||||
|
Current:
|
|||||||||||
|
Federal
|
$
|
98,937
|
|
$
|
118,888
|
|
$
|
(699
|
)
|
||
|
State
|
8,580
|
|
4,404
|
|
51
|
|
|||||
|
Foreign
|
27,867
|
|
25,112
|
|
24,383
|
|
|||||
|
135,384
|
|
148,404
|
|
23,735
|
|
||||||
|
Deferred:
|
|||||||||||
|
Federal
|
22,904
|
|
(2,552
|
)
|
188,882
|
|
|||||
|
State
|
(334
|
)
|
(1,036
|
)
|
3,721
|
|
|||||
|
Foreign
|
(6,248
|
)
|
2,656
|
|
1,741
|
|
|||||
|
16,322
|
|
(932
|
)
|
194,344
|
|
||||||
|
Provision for income taxes
|
$
|
151,706
|
|
$
|
147,472
|
|
$
|
218,079
|
|
||
For the fiscal year ended
June 30, 2014
, actual current tax liabilities were lower than reflected in the table above by
$16.5 million
primarily due to a benefit for a deduction related to employee stock activity, which was recorded as an increase to capital in excess of par value.
For the fiscal year ended
June 30, 2013
, actual current tax liabilities were lower than reflected in the table above by
$6.9 million
primarily due to a benefit for a deduction related to employee stock activity, which was recorded as an increase to capital in excess of par value.
For the fiscal years ended June 30, 2012, the Company did not recognize any benefit for a deduction related to employee stock activity. Therefore, the Company had not reduced actual current tax liabilities, or recorded any increases to capital in excess of par value.
79
The significant components of deferred income tax assets and liabilities are as follows:
|
(In thousands)
|
As of June 30,
|
||||||
|
2014
|
2013
|
||||||
|
Deferred tax assets:
|
|||||||
|
Tax credits and net operating losses
|
$
|
95,492
|
|
$
|
77,512
|
|
|
|
Employee benefits accrual
|
97,308
|
|
83,391
|
|
|||
|
Stock-based compensation
|
17,676
|
|
37,091
|
|
|||
|
Capitalized R&D expenses
|
12,051
|
|
34,791
|
|
|||
|
Inventory reserves
|
83,783
|
|
79,866
|
|
|||
|
Non-deductible reserves
|
41,469
|
|
42,256
|
|
|||
|
Depreciation and amortization
|
2,572
|
|
—
|
|
|||
|
Unearned revenue
|
13,937
|
|
12,010
|
|
|||
|
Other
|
29,483
|
|
25,454
|
|
|||
|
Gross deferred tax assets
|
393,771
|
|
392,371
|
|
|||
|
Valuation allowance
|
(76,328
|
)
|
(57,097
|
)
|
|||
|
Net deferred tax assets
|
$
|
317,443
|
|
$
|
335,274
|
|
|
|
Deferred tax liabilities:
|
|||||||
|
Unremitted earnings of foreign subsidiaries not permanently reinvested
|
$
|
(17,334
|
)
|
$
|
(20,636
|
)
|
|
|
Depreciation and amortization
|
—
|
|
(1,863
|
)
|
|||
|
Deferred profit
|
(16,358
|
)
|
(10,351
|
)
|
|||
|
Unrealized gain on investments
|
(1,168
|
)
|
(572
|
)
|
|||
|
Total deferred tax liabilities
|
(34,860
|
)
|
(33,422
|
)
|
|||
|
Total net deferred tax assets
|
$
|
282,583
|
|
$
|
301,852
|
|
|
As of
June 30, 2014
, the Company had U.S. federal, state and foreign net operating loss (“NOL”) carry-forwards of approximately
$28.5 million
,
$93.6 million
and
$51.5 million
, respectively. The U.S. federal NOL carry-forwards will expire at various dates beginning in
2023 through 2027
. The utilization of NOLs created by acquired companies is subject to annual limitations under Section 382 of the Internal Revenue Code. However, it is not expected that such annual limitation will impair the realization of these NOLs. The state NOLs will begin to expire in
2017
. State credits of
$102.6 million
will be carried over indefinitely. The foreign NOL carry-forwards will begin to expire in
2015
.
The net deferred tax asset valuation allowance was
$76.3 million
and
$57.1 million
as of June 30,
2014
and June 30,
2013
, respectively. The change was primarily due to an increase in the valuation allowance related to state credit carry-forwards generated in the fiscal year ended
June 30, 2014
. The valuation allowance is based on the Company’s assessment that it is more likely than not that certain deferred tax assets will not be realized in the foreseeable future. Of the valuation allowance as of June 30,
2014
,
$63.2 million
relates to state credit carry-forwards. The remainder of the valuation allowance relates primarily to foreign NOL carry-forwards.
As of
June 30, 2014
, U.S. income taxes were not provided for on a cumulative total of approximately
$1.5 billion
of undistributed earnings for certain non-U.S. subsidiaries. If these undistributed earnings were repatriated to the United States, they would generate foreign tax credits to reduce the federal tax liability associated with the foreign dividend. Assuming full utilization of the foreign tax credits, the potential deferred tax liability associated with undistributed earnings would be approximately
$497.1 million
.
KLA-Tencor benefits from several tax holidays in Israel and Singapore where it manufactures certain of its products. These tax holidays are on approved investments and are scheduled to expire at varying times within the next
one to seven
years. However, of the tax holidays whose expiration will have a material impact on the Company's tax obligations, the soonest that any such tax holiday is scheduled to expire is during the fiscal year ending June 30, 2020. The Company was in compliance with all of the terms and conditions of the tax holidays as of
June 30, 2014
. The net impact of these tax holidays was to decrease the Company’s tax expense by approximately
$25.8 million
,
$25.8 million
and
$53.1 million
in the fiscal years ended
June 30, 2014
,
2013
and
2012
, respectively. The benefits of the tax holidays on diluted net income per share were
$0.15
,
$0.15
and
$0.31
for the fiscal years ended
June 30, 2014
,
2013
and
2012
, respectively.
80
The reconciliation of the United States federal statutory income tax rate to KLA-Tencor’s effective income tax rate is as follows:
|
|
Year ended June 30,
|
|||||||
|
|
2014
|
2013
|
2012
|
|||||
|
Federal statutory rate
|
35.0
|
%
|
35.0
|
%
|
35.0
|
%
|
||
|
State income taxes, net of federal benefit
|
0.7
|
%
|
0.3
|
%
|
0.4
|
%
|
||
|
Effect of foreign operations taxed at various rates
|
(11.5
|
)%
|
(9.6
|
)%
|
(9.9
|
)%
|
||
|
Research and development tax credit
|
(1.5
|
)%
|
(3.1
|
)%
|
(1.1
|
)%
|
||
|
Net change in tax reserves
|
0.3
|
%
|
1.7
|
%
|
(2.8
|
)%
|
||
|
Domestic manufacturing benefit
|
(1.4
|
)%
|
(1.6
|
)%
|
(0.7
|
)%
|
||
|
Effect of stock-based compensation
|
0.4
|
%
|
(0.3
|
)%
|
1.3
|
%
|
||
|
Other
|
(1.3
|
)%
|
(1.0
|
)%
|
0.2
|
%
|
||
|
Effective income tax rate
|
20.7
|
%
|
21.4
|
%
|
22.4
|
%
|
||
As of
June 30, 2014
, KLA-Tencor had cumulative windfalls in excess of shortfalls of approximately
$23.4 million
. Windfall tax benefits arise when a company's tax deductions for employee stock activity exceeds book compensation for the same activity. A shortfall arises when the tax deduction is less than book compensation. Windfalls are recorded as increases to capital in excess of par value. Shortfalls are recorded as decreases to capital in excess of par value to the extent that cumulative windfalls exceed cumulative shortfalls. Shortfalls in excess of cumulative windfalls are recorded as income tax expense.
A reconciliation of gross unrecognized tax benefits is as follows:
|
|
Year ended June 30,
|
||||||||||
|
(In thousands)
|
2014
|
2013
|
2012
|
||||||||
|
Unrecognized tax benefits at the beginning of the period
|
$
|
59,494
|
|
$
|
50,839
|
|
$
|
78,337
|
|
||
|
Increases for tax positions taken in prior years
|
551
|
|
2,701
|
|
4,172
|
|
|||||
|
Decreases for tax positions taken in prior years
|
(764
|
)
|
(905
|
)
|
(1,002
|
)
|
|||||
|
Increases for tax positions taken in current year
|
11,585
|
|
12,709
|
|
15,663
|
|
|||||
|
Decreases for settlements with taxing authorities
|
(3,601
|
)
|
(3,907
|
)
|
(43,464
|
)
|
|||||
|
Decreases for lapsing of statutes of limitations
|
(7,690
|
)
|
(1,943
|
)
|
(2,867
|
)
|
|||||
|
Unrecognized tax benefits at the end of the period
|
$
|
59,575
|
|
$
|
59,494
|
|
$
|
50,839
|
|
||
The amount of unrecognized tax benefits that would impact the effective tax rate was
$59.6 million
as of
June 30, 2014
. KLA-Tencor’s policy is to include interest and penalties related to unrecognized tax benefits within interest income and other, net. The amount of interest and penalties accrued as of June 30,
2014
and
2013
was approximately
$6.7 million
and
$6.0 million
, respectively.
The Company is subject to federal income tax examinations for all years beginning from the fiscal year ended June 30, 2011. The Company is subject to state income tax examinations for all years beginning from the fiscal year ended June 30, 2010. The Company is also subject to examinations in other major foreign jurisdictions, including Singapore, for all years beginning from the fiscal year ended June 30, 2010. The Company believes that adequate amounts have been reserved for any adjustments that may ultimately result from any future examinations of these years.
It is possible that certain examinations may be concluded in the next twelve months. The Company believes it is possible that it may recognize up to
$11.6 million
of its existing unrecognized tax benefits within the next 12 months as a result of the lapse of statutes of limitations and the resolution of examinations with various tax authorities.
Factoring.
KLA-Tencor has agreements (referred to as “factoring agreements”) with financial institutions to sell certain of its trade receivables and promissory notes from customers without recourse. The Company does not believe it is at risk for any material losses as a result of these agreements. In addition, the Company periodically sells certain letters of credit (“LCs”), without recourse, received from customers in payment for goods.
81
The following table shows total receivables sold under factoring agreements and proceeds from sales of LCs for the indicated periods:
|
|
Year ended June 30,
|
||||||
|
(In thousands)
|
2014
|
2013
|
|||||
|
Receivables sold under factoring agreements
|
$
|
116,292
|
|
$
|
144,307
|
|
|
|
Proceeds from sales of LCs
|
$
|
8,323
|
|
$
|
3,808
|
|
|
Factoring and LC fees for the sale of certain trade receivables were recorded in interest income and other, net and were not material for the periods presented.
Facilities.
KLA-Tencor leases certain of its facilities under arrangements that are accounted for as operating leases. Rent expense was
$8.7 million
,
$9.2 million
and
$9.0 million
for the fiscal years ended
June 30, 2014
,
2013
and
2012
, respectively.
The following is a schedule of expected operating lease payments:
|
Fiscal year ending June 30,
|
Amount
(In thousands)
|
||
|
2015
|
$
|
8,619
|
|
|
2016
|
6,757
|
|
|
|
2017
|
5,082
|
|
|
|
2018
|
3,613
|
|
|
|
2019
|
1,744
|
|
|
|
2020 and thereafter
|
1,822
|
|
|
|
Total minimum lease payments
|
$
|
27,637
|
|
Purchase Commitments.
KLA-Tencor maintains certain open inventory purchase commitments with its suppliers to ensure a smooth and continuous supply for key components. The Company's liability under these purchase commitments is generally restricted to a forecasted time-horizon as mutually agreed upon between the parties. This forecasted time-horizon can vary among different suppliers. The Company’s open inventory purchase commitments were approximately
$214.3 million
as of June 30,
2014
and are primarily due within the next
12
months. Actual expenditures will vary based upon the volume of the transactions and length of contractual service provided. In addition, the amounts paid under these arrangements may be less in the event that the arrangements are renegotiated or canceled. Certain agreements provide for potential cancellation penalties.
Cash Long-Term Incentive Plan.
As of
June 30, 2014
, the Company had committed
$109.0 million
to future payment obligations under its Cash LTI Plan. The calculation of compensation expense related to the Cash LTI Plan includes estimated forfeiture rate assumptions. Cash LTI awards issued to employees under the Cash LTI Plan vest in
four
equal installments, with
25%
of the aggregate amount of the Cash LTI award vesting on each yearly anniversary of the grant date over a
four
-year period. In order to receive payments under a Cash LTI award, participants must remain employed by the Company as of the applicable award vesting date.
Warranties, Guarantees and Contingencies.
KLA-Tencor provides standard warranty coverage on its systems for
40
hours per week for
12
months, providing labor and parts necessary to repair the systems during the warranty period. The Company accounts for the estimated warranty cost as a charge to costs of revenues when revenue is recognized. The estimated warranty cost is based on historical product performance and field expenses. Utilizing actual service records, the Company calculates the average service hours and parts expense per system and applies the actual labor and overhead rates to determine the estimated warranty charge. The Company updates these estimated charges on a quarterly basis. The actual product performance and/or field expense profiles may differ, and in those cases the Company adjusts its warranty accruals accordingly.
82
The following table provides the changes in the product warranty accrual for the indicated periods:
|
|
Year ended June 30,
|
||||||
|
(In thousands)
|
2014
|
2013
|
|||||
|
Beginning balance
|
$
|
42,603
|
|
$
|
46,496
|
|
|
|
Accruals for warranties issued during the period
|
45,540
|
|
45,291
|
|
|||
|
Changes in liability related to pre-existing warranties
|
(8,462
|
)
|
2,507
|
|
|||
|
Settlements made during the period
|
(41,935
|
)
|
(51,691
|
)
|
|||
|
Ending balance
|
$
|
37,746
|
|
$
|
42,603
|
|
|
The Company maintains guarantee arrangements available through various financial institutions for up to
$28.4 million
, of which
$26.3 million
had been issued as of
June 30, 2014
, primarily to fund guarantees to customs authorities for value-added tax (“VAT”) and other operating requirements of the Company's subsidiaries in Europe and Asia.
KLA-Tencor is a party to a variety of agreements pursuant to which it may be obligated to indemnify the other party with respect to certain matters. Typically, these obligations arise in connection with contracts and license agreements or the sale of assets, under which the Company customarily agrees to hold the other party harmless against losses arising from, or provides customers with other remedies to protect against, bodily injury or damage to personal property caused by the Company's products, non-compliance with the Company's product performance specifications, infringement by the Company's products of third-party intellectual property rights and a breach of warranties, representations and covenants related to matters such as title to assets sold, validity of certain intellectual property rights, non-infringement of third-party rights, and certain income tax-related matters. In each of these circumstances, payment by the Company is typically subject to the other party making a claim to and cooperating with the Company pursuant to the procedures specified in the particular contract.
This usually allows the Company to challenge the other party’s claims or, in case of breach of intellectual property representations or covenants, to control the defense or settlement of any third-party claims brought against the other party. Further, the Company's obligations under these agreements may be limited in terms of amounts, activity (typically at the Company's option to replace or correct the products or terminate the agreement with a refund to the other party), and duration. In some instances, the Company may have recourse against third parties and/or insurance covering certain payments made by the Company.
Subject to certain limitations, the Company is obligated to indemnify its current and former directors, officers and employees with respect to certain litigation matters and investigations that arise in connection with their service to the Company. These obligations arise under the terms of the Company's certificate of incorporation, its bylaws, applicable contracts, and Delaware and California law. The obligation to indemnify generally means that the Company is required to pay or reimburse the individuals’ reasonable legal expenses and possibly damages and other liabilities incurred in connection with these matters.
In addition, the Company may in limited circumstances enter into agreements that contain customer-specific pricing, discount, rebate or credit commitments. Furthermore, the Company may give these customers limited audit or inspection rights to enable them to confirm that the Company is complying with these commitments. If a customer elects to exercise its audit or inspection rights, the Company may be required to expend significant resources to support the audit or inspection, as well as to defend or settle any dispute with a customer that could potentially arise out of such audit or inspection. To date, the Company has made no accruals in its consolidated financial statements for this contingency. While the Company has not in the past incurred significant expenses for resolving disputes regarding these types of commitments, the Company cannot make any assurance that it will not incur any such liabilities in the future.
It is not possible to predict the maximum potential amount of future payments under these or similar agreements due to the conditional nature of the Company's obligations and the unique facts and circumstances involved in each particular agreement. Historically, payments made by the Company under these agreements have not had a material effect on its business, financial condition, results of operations or cash flows.
83
Indemnification Obligations.
As a result of the Company's indemnification obligations in connection with the litigation and government inquiries related to the Company's historical stock option practices, the Company was, in early fiscal year 2012, still paying defense costs for one former officer and employee facing a SEC civil action to which the Company was not a party. That former officer and the SEC settled the civil action. As a result, during the three months ended December 31, 2011, the Company and the former officer entered into an agreement that released each other from liabilities stemming from the former officer's employment with the Company and materially concluded the Company's indemnification obligations to the former officer. The terms of that release agreement have been appropriately considered within the accrual the Company has established for currently pending legal proceedings.
Other Legal Matters.
The Company is named from time to time as a party to lawsuits and other types of legal proceedings and claims in the normal course of its business. Actions filed against the Company include commercial, intellectual property, customer, and labor and employment related claims, including complaints of alleged wrongful termination and potential class action lawsuits regarding alleged violations of federal and state wage and hour and other laws. In general, legal proceedings and claims, regardless of their merit, and associated internal investigations (especially those relating to intellectual property or confidential information disputes) are often expensive to prosecute, defend or conduct and may divert management's attention and other company resources. Moreover, the results of legal proceedings are difficult to predict, and the costs incurred in litigation can be substantial, regardless of outcome. The Company believes the amounts provided in its consolidated financial statements are adequate in light of the probable and estimated liabilities. However, because such matters are subject to many uncertainties, the ultimate outcomes are not predictable, and there can be no assurances that the actual amounts required to satisfy alleged liabilities from the matters described above will not exceed the amounts reflected in the Company's consolidated financial statements or will not have a material adverse effect on its results of operations, financial condition or cash flows.
The Company has in recent years undertaken a number of cost reduction activities, including workforce reductions, in an effort to lower its quarterly operating expense run rate. The program in the United States is accounted for in accordance with the authoritative guidance related to compensation for non-retirement post-employment benefits, whereas the programs in the Company's international locations are accounted for in accordance with the authoritative guidance for contingencies. During the fiscal year ended June 30,
2014
, the Company recorded a net restructuring charge of approximately
$7.0 million
, of which
$1.4 million
was recorded to costs of revenues,
$3.3 million
was recorded to engineering, research and development expense and
$2.3 million
was recorded to selling, general and administrative expense. These charges represent the estimated minimum liability associated with expected termination benefits to be provided to employees after employment.
The following table shows the activity primarily related to accrual for severance and benefits for the fiscal years ended
June 30, 2014
and
2013
:
|
Year ended June 30,
|
|||||||
|
(In thousands)
|
2014
|
2013
|
|||||
|
Beginning balance
|
$
|
3,947
|
|
$
|
2,795
|
|
|
|
Restructuring costs
|
6,662
|
|
6,633
|
|
|||
|
Adjustments
|
(459
|
)
|
(590
|
)
|
|||
|
Cash payments
|
(7,821
|
)
|
(4,891
|
)
|
|||
|
Ending balance
|
$
|
2,329
|
|
$
|
3,947
|
|
|
Substantially all of the remaining accrued restructuring balance related to the Company’s workforce reductions is expected to be paid out by the end of fiscal year
2015
.
The authoritative guidance requires companies to recognize all derivative instruments and hedging activities, including foreign currency exchange contracts, as either assets or liabilities at fair value on the balance sheet. Changes in the fair value of derivatives that do not qualify for hedge treatment, as well as the ineffective portion of any hedges, are recognized in interest income and other, net in the Consolidated Statements of Operations. In accordance with the guidance, the Company designates foreign currency forward exchange and option contracts as cash flow hedges of certain forecasted foreign currency denominated sales and purchase transactions.
84
KLA-Tencor’s foreign subsidiaries operate and sell KLA-Tencor’s products in various global markets. As a result, KLA-Tencor is exposed to risks relating to changes in foreign currency exchange rates. KLA-Tencor utilizes foreign currency forward exchange contracts and option contracts to hedge against future movements in foreign exchange rates that affect certain existing and forecasted foreign currency denominated sales and purchase transactions, such as the Japanese yen, the euro, the New Taiwan dollar and the Israeli new shekel. The Company routinely hedges its exposures to certain foreign currencies with various financial institutions in an effort to minimize the impact of certain currency exchange rate fluctuations. These currency forward exchange contracts and options, designated as cash flow hedges, generally have maturities of less than
18 months
. Cash flow hedges are evaluated for effectiveness monthly, based on changes in total fair value of the derivatives. If a financial counterparty to any of the Company’s hedging arrangements experiences financial difficulties or is otherwise unable to honor the terms of the foreign currency hedge, the Company may experience material losses.
For derivative instruments that are designated and qualify as cash flow hedges, the effective portion of the gains or losses on the derivative is reported as a component of accumulated other comprehensive income (loss) (“OCI”) and reclassified into earnings in the same period or periods during which the hedged transaction affects earnings. Changes in the fair value of currency forward exchange and option contracts due to changes in time value are excluded from the assessment of effectiveness. Gains and losses on the derivative representing either hedge ineffectiveness or hedge components excluded from the assessment of effectiveness are recognized in current earnings.
For derivative instruments that are not designated as accounting hedges, gains and losses are recognized in interest income and other, net. The Company uses foreign currency forward contracts to hedge certain foreign currency denominated assets or liabilities. The gains and losses on these derivatives are largely offset by the changes in the fair value of the assets or liabilities being hedged.
Derivatives in Cash Flow Hedging Relationships: Foreign Exchange Contracts
The locations and amounts of designated and non-designated derivative instruments’ gains and losses reported in the consolidated financial statements for the indicated periods were as follows:
|
(In thousands)
|
Location in Financial Statements
|
Year ended June 30,
|
||||||
|
2014
|
2013
|
|||||||
|
Derivatives Designated as Hedging Instruments
|
||||||||
|
Gains in accumulated OCI on derivatives (effective portion)
|
Accumulated OCI
|
$
|
1,641
|
|
$
|
4,929
|
|
|
|
Gains (losses) reclassified from accumulated OCI into income (effective portion):
|
Revenues
|
$
|
3,851
|
|
$
|
2,124
|
|
|
|
Costs of revenues
|
294
|
|
(641
|
)
|
||||
|
Net gains reclassified from accumulated OCI into income (effective portion)
|
$
|
4,145
|
|
$
|
1,483
|
|
||
|
Gains recognized in income on derivatives (ineffective portion and amount excluded from effectiveness testing)
|
Interest income and other, net
|
$
|
18
|
|
$
|
946
|
|
|
|
Derivatives Not Designated as Hedging Instruments
|
||||||||
|
Gains recognized in income
|
Interest income and other, net
|
$
|
2,856
|
|
$
|
14,275
|
|
|
The U.S. dollar equivalent of all outstanding notional amounts of hedge contracts, with maximum maturity of
13 months
, as of the dates indicated below was as follows:
|
(In thousands)
|
As of
June 30, 2014 |
As of
June 30, 2013 |
|||||
|
Cash flow hedge contracts
|
|||||||
|
Purchase
|
$
|
6,066
|
|
$
|
14,641
|
|
|
|
Sell
|
$
|
33,999
|
|
$
|
35,178
|
|
|
|
Other foreign currency hedge contracts
|
|||||||
|
Purchase
|
$
|
108,901
|
|
$
|
99,175
|
|
|
|
Sell
|
$
|
106,322
|
|
$
|
97,901
|
|
|
85
The locations and fair value amounts of the Company’s derivative instruments reported in its Consolidated Balance Sheets as of the dates indicated below were as follows:
|
|
Asset Derivatives
|
Liability Derivatives
|
|||||||||||||||||
|
|
Balance Sheet Location
|
June 30,
2014 |
June 30,
2013 |
Balance Sheet Location
|
June 30,
2014 |
June 30,
2013 |
|||||||||||||
|
(In thousands)
|
Fair Value
|
Fair Value
|
|||||||||||||||||
|
Derivatives designated as hedging instruments
|
|||||||||||||||||||
|
Foreign exchange contracts
|
Other current assets
|
$
|
120
|
|
$
|
362
|
|
Other current liabilities
|
$
|
100
|
|
$
|
384
|
|
|||||
|
Total derivatives designated as hedging instruments
|
120
|
|
362
|
|
100
|
|
384
|
|
|||||||||||
|
Derivatives not designated as hedging instruments
|
|||||||||||||||||||
|
Foreign exchange contracts
|
Other current assets
|
546
|
|
3,654
|
|
Other current liabilities
|
798
|
|
1,789
|
|
|||||||||
|
Total derivatives not designated as hedging instruments
|
546
|
|
3,654
|
|
798
|
|
1,789
|
|
|||||||||||
|
Total derivatives
|
$
|
666
|
|
$
|
4,016
|
|
$
|
898
|
|
$
|
2,173
|
|
|||||||
The following table provides the balances and changes in accumulated OCI, before taxes, related to derivative instruments for the indicated periods:
|
Year ended
June 30, 2014 |
||||||||
|
(In thousands)
|
2014
|
2013
|
||||||
|
Beginning balance
|
$
|
2,484
|
|
$
|
(962
|
)
|
||
|
Amount reclassified to income
|
(4,145
|
)
|
(1,483
|
)
|
||||
|
Net change
|
1,641
|
|
4,929
|
|
||||
|
Ending balance
|
$
|
(20
|
)
|
$
|
2,484
|
|
||
Offsetting of Derivative Assets and Liabilities
KLA-Tencor presents derivatives at gross fair values in the Condensed Consolidated Balance Sheets. The Company has entered into arrangements with each of its counterparties, which reduce credit risk by permitting net settlement of transactions with the same counterparty under certain conditions. As of
June 30, 2014
and
2013
, information related to the offsetting arrangements was as follows (in thousands):
|
As of June 30, 2014
|
Gross Amounts of Derivatives Not Offset in the Consolidated Balance Sheets
|
|||||||||||||||||||||||
|
Description
|
Gross Amounts of Derivatives
|
Gross Amounts of Derivatives Offset in the Consolidated Balance Sheets
|
Net Amount of Derivatives Presented in the Consolidated Balance Sheets
|
Financial Instruments
|
Cash Collateral Received
|
Net Amount
|
||||||||||||||||||
|
Derivatives - Assets
|
$
|
666
|
|
$
|
—
|
|
$
|
666
|
|
$
|
(423
|
)
|
$
|
—
|
|
$
|
243
|
|
||||||
|
Derivatives - Liabilities
|
$
|
(898
|
)
|
$
|
—
|
|
$
|
(898
|
)
|
$
|
423
|
|
$
|
—
|
|
$
|
(475
|
)
|
||||||
|
As of June 30, 2013
|
Gross Amounts of Derivatives Not Offset in the Consolidated Balance Sheets
|
|||||||||||||||||||||||
|
Description
|
Gross Amounts of Derivatives
|
Gross Amounts of Derivatives Offset in the Consolidated Balance Sheets
|
Net Amount of Derivatives Presented in the Consolidated Balance Sheets
|
Financial Instruments
|
Cash Collateral Received
|
Net Amount
|
||||||||||||||||||
|
Derivatives - Assets
|
$
|
4,016
|
|
$
|
—
|
|
$
|
4,016
|
|
$
|
(1,520
|
)
|
$
|
—
|
|
$
|
2,496
|
|
||||||
|
Derivatives - Liabilities
|
$
|
(2,173
|
)
|
$
|
—
|
|
$
|
(2,173
|
)
|
$
|
1,520
|
|
$
|
—
|
|
$
|
(653
|
)
|
||||||
86
KLA-Tencor reports one reportable segment in accordance with the provisions of the authoritative guidance for segment reporting. Operating segments are defined as components of an enterprise about which separate financial information is evaluated regularly by the chief operating decision maker in deciding how to allocate resources and in assessing performance. KLA-Tencor’s chief operating decision maker is the Chief Executive Officer.
The Company is engaged primarily in designing, manufacturing and marketing process control and yield management solutions for the semiconductor and related nanoelectronics industries. All operating segments have been aggregated due to their inter-dependencies, commonality of long-term economic characteristics, products and services, the production processes, class of customer and distribution processes. The Company’s service products are an extension of the system product portfolio and provide customers with spare parts and fab management services (including system preventive maintenance and optimization services) to improve yield, increase production uptime and throughput, and lower the cost of ownership. Since the Company operates in one reportable segment, all financial segment information required by the authoritative guidance can be found in the consolidated financial statements.
The Company's significant operations outside the United States include manufacturing facilities in Singapore, Israel, Germany and China, and sales, marketing and service offices in Western Europe, Japan and the Asia Pacific regions. For geographical revenue reporting, revenues are attributed to the geographic location in which the customer is located. Long-lived assets consist of land, property and equipment, net and are attributed to the geographic region in which they are located.
The following is a summary of revenues by geographic region, based on ship-to location, for the indicated periods (as a percentage of total revenues):
|
(Dollar amounts in thousands)
|
Year ended June 30,
|
|||||||||||||||||||
|
2014
|
2013
|
2012
|
||||||||||||||||||
|
Revenues:
|
||||||||||||||||||||
|
North America
|
$
|
705,159
|
|
24
|
%
|
$
|
846,125
|
|
30
|
%
|
$
|
675,034
|
|
21
|
%
|
|||||
|
Taiwan
|
741,470
|
|
25
|
%
|
936,445
|
|
33
|
%
|
872,583
|
|
28
|
%
|
||||||||
|
Japan
|
334,653
|
|
11
|
%
|
310,204
|
|
11
|
%
|
415,475
|
|
13
|
%
|
||||||||
|
Europe & Israel
|
306,779
|
|
11
|
%
|
211,121
|
|
7
|
%
|
323,902
|
|
10
|
%
|
||||||||
|
Korea
|
371,139
|
|
13
|
%
|
292,724
|
|
10
|
%
|
611,462
|
|
19
|
%
|
||||||||
|
Rest of Asia
|
470,208
|
|
16
|
%
|
246,162
|
|
9
|
%
|
273,488
|
|
9
|
%
|
||||||||
|
Total
|
$
|
2,929,408
|
|
100
|
%
|
$
|
2,842,781
|
|
100
|
%
|
$
|
3,171,944
|
|
100
|
%
|
|||||
The following is a summary of revenues by major products for the indicated periods (as a percentage of total revenues):
|
(Dollar amounts in thousands)
|
Year ended June 30,
|
|||||||||||||||||||
|
2014
|
2013
|
2012
|
||||||||||||||||||
|
Revenues:
|
||||||||||||||||||||
|
Defect inspection
|
$
|
1,685,114
|
|
58
|
%
|
$
|
1,594,128
|
|
56
|
%
|
$
|
1,827,077
|
|
58
|
%
|
|||||
|
Metrology
|
532,002
|
|
18
|
%
|
540,835
|
|
19
|
%
|
675,456
|
|
21
|
%
|
||||||||
|
Service
|
642,971
|
|
22
|
%
|
595,634
|
|
21
|
%
|
574,189
|
|
18
|
%
|
||||||||
|
Other
|
69,321
|
|
2
|
%
|
112,184
|
|
4
|
%
|
95,222
|
|
3
|
%
|
||||||||
|
Total
|
$
|
2,929,408
|
|
100
|
%
|
$
|
2,842,781
|
|
100
|
%
|
$
|
3,171,944
|
|
100
|
%
|
|||||
In the fiscal year ended
June 30, 2014
,
three
customers accounted for approximately
18%
,
14%
and
11%
of total revenues. In the fiscal year ended
June 30, 2013
,
two
customers accounted for approximately
23%
and
13%
of total revenues. In the fiscal year ended
June 30, 2012
,
two
customers accounted for approximately
17%
and
16%
of total revenues.
87
Long-lived assets by geographic region as of the dates indicated below were as follows:
|
|
As of June 30,
|
||||||
|
(In thousands)
|
2014
|
2013
|
|||||
|
Long-lived assets:
|
|||||||
|
United States
|
$
|
219,280
|
|
$
|
207,002
|
|
|
|
Europe
|
19,527
|
|
19,428
|
|
|||
|
Singapore
|
48,938
|
|
44,903
|
|
|||
|
Israel
|
33,388
|
|
27,137
|
|
|||
|
Rest of Asia
|
9,130
|
|
6,811
|
|
|||
|
Total
|
$
|
330,263
|
|
$
|
305,281
|
|
|
During the fiscal years ended
June 30, 2014
,
2013
and
2012
, the Company purchased from, or sold to, several entities, where one or more executive officers of the Company or members of the Company’s Board of Directors, or their immediate family members, also serves as an executive officer or board member, including JDS Uniphase Corporation, Cisco Systems, Inc., Freescale Semiconductor, Inc., Avago Technologies Ltd., NetApp, Inc. and SAP AG. The following table provides the transactions with these parties for the indicated periods (for the portion of such period that they were considered related):
|
Year ended June 30,
|
|||||||||||
|
(In thousands)
|
2014
|
2013
|
2012
|
||||||||
|
Total revenues
|
$
|
2,701
|
|
$
|
6,854
|
|
$
|
5,684
|
|
||
|
Total purchases
|
$
|
2,622
|
|
$
|
4,460
|
|
$
|
7,555
|
|
||
The Company had a receivable balance from these parties of
$1.8 million
and
$0.9 million
as of
June 30, 2014
and
2013
, respectively. Management believes that such transactions are at arm's length and on similar terms as would have been obtained from unaffiliated third parties.
On
July 8, 2014
, the Company announced that its Board of Directors had authorized a further increase in the level of the Company's quarterly dividend from
$0.45
to
$0.50
per share. On
August 7, 2014
, the Company declared a quarterly cash dividend of
$0.50
per share on the outstanding shares of the Company's common stock, to be paid on
September 2, 2014
to stockholders of record as of the close of business on
August 18, 2014
. Additionally, on
July 8, 2014
, the Company announced that its Board of Directors had also approved an increase in the Company's share repurchase program for up to
13 million
additional shares of the Company's common stock. This increase is in addition to the prior repurchase authorizations under which approximately
2 million
shares remained available for repurchase as of
June 30, 2014
.
88
The following is a summary of the Company’s quarterly consolidated results of operations (unaudited) for the fiscal years ended June 30,
2014
and
2013
.
|
(In thousands, except per share data)
|
First quarter
ended
September 30, 2013
|
Second quarter
ended
December 31, 2013
|
Third quarter
ended
March 31, 2014
|
Fourth quarter
ended
June 30, 2014
|
|||||||||||
|
Total revenues
|
$
|
658,337
|
|
$
|
705,129
|
|
$
|
831,599
|
|
$
|
734,343
|
|
|||
|
Total costs and operating expenses
|
$
|
508,426
|
|
$
|
517,147
|
|
$
|
570,436
|
|
$
|
561,329
|
|
|||
|
Gross margin
|
$
|
380,680
|
|
$
|
419,315
|
|
$
|
488,773
|
|
$
|
407,678
|
|
|||
|
Income from operations
|
$
|
149,911
|
|
$
|
187,982
|
|
$
|
261,163
|
|
$
|
173,014
|
|
|||
|
Net income
|
$
|
111,197
|
|
$
|
139,246
|
|
$
|
203,581
|
|
$
|
128,731
|
|
|||
|
Net income per share:
|
|||||||||||||||
|
Basic
(1)
|
$
|
0.67
|
|
$
|
0.84
|
|
$
|
1.22
|
|
$
|
0.78
|
|
|||
|
Diluted
(1)
|
$
|
0.66
|
|
$
|
0.83
|
|
$
|
1.21
|
|
$
|
0.77
|
|
|||
|
(In thousands, except per share data)
|
First quarter
ended
September 30, 2012
|
Second quarter
ended
December 31, 2012
|
Third quarter
ended
March 31, 2013
|
Fourth quarter
ended
June 30, 2013
|
|||||||||||
|
Total revenues
|
$
|
720,709
|
|
$
|
673,011
|
|
$
|
729,029
|
|
$
|
720,032
|
|
|||
|
Total costs and operating expenses
|
$
|
534,152
|
|
$
|
519,764
|
|
$
|
526,783
|
|
$
|
532,397
|
|
|||
|
Gross margin
|
$
|
403,484
|
|
$
|
369,096
|
|
$
|
419,521
|
|
$
|
413,228
|
|
|||
|
Income from operations
|
$
|
186,557
|
|
$
|
153,247
|
|
$
|
202,246
|
|
$
|
187,635
|
|
|||
|
Net income
|
$
|
135,367
|
|
$
|
106,630
|
|
$
|
166,382
|
|
$
|
134,770
|
|
|||
|
Net income per share:
|
|||||||||||||||
|
Basic
(1)
|
$
|
0.81
|
|
$
|
0.64
|
|
$
|
1.00
|
|
$
|
0.81
|
|
|||
|
Diluted
(1)
|
$
|
0.80
|
|
$
|
0.63
|
|
$
|
0.98
|
|
$
|
0.80
|
|
|||
__________________
|
(1)
|
Basic and diluted earnings per share are computed independently for each of the quarters presented based on the weighted-average basic and fully diluted shares outstanding for each quarter. Therefore, the sum of quarterly basic and diluted per share information may not equal annual basic and diluted earnings per share.
|
89
REPORT OF INDEPENDENT REGISTERED PUBLIC ACCOUNTING FIRM
To The Board of Directors and Stockholders of KLA-Tencor Corporation
In our opinion, the consolidated financial statements listed in the index appearing under Item 15(a)(1) present fairly, in all material respects, the financial position of KLA-Tencor Corporation and its subsidiaries at
June 30, 2014
and
June 30, 2013
, and the results of their operations and their cash flows for each of the three years in the period ended
June 30, 2014
in conformity with accounting principles generally accepted in the United States of America. In addition, in our opinion, the financial statement schedule listed in the index appearing under Item 15(a)(2) presents fairly, in all material respects, the information set forth therein when read in conjunction with the related consolidated financial statements. Also in our opinion, the Company maintained, in all material respects, effective internal control over financial reporting as of
June 30, 2014
based on criteria established in
Internal Control—Integrated Framework (1992)
issued by the Committee of Sponsoring Organizations of the Treadway Commission (COSO). The Company’s management is responsible for these financial statements and financial statement schedule, for maintaining effective internal control over financial reporting and for its assessment of the effectiveness of internal control over financial reporting, included in Management’s Report on Internal Control over Financial Reporting under Item 9A. Our responsibility is to express opinions on these financial statements, on the financial statement schedule, and on the Company’s internal control over financial reporting based on our integrated audits. We conducted our audits in accordance with the standards of the Public Company Accounting Oversight Board (United States). Those standards require that we plan and perform the audits to obtain reasonable assurance about whether the financial statements are free of material misstatement and whether effective internal control over financial reporting was maintained in all material respects. Our audits of the financial statements included examining, on a test basis, evidence supporting the amounts and disclosures in the financial statements, assessing the accounting principles used and significant estimates made by management, and evaluating the overall financial statement presentation. Our audit of internal control over financial reporting included obtaining an understanding of internal control over financial reporting, assessing the risk that a material weakness exists, and testing and evaluating the design and operating effectiveness of internal control based on the assessed risk. Our audits also included performing such other procedures as we considered necessary in the circumstances. We believe that our audits provide a reasonable basis for our opinions.
A company’s internal control over financial reporting is a process designed to provide reasonable assurance regarding the reliability of financial reporting and the preparation of financial statements for external purposes in accordance with generally accepted accounting principles. A company’s internal control over financial reporting includes those policies and procedures that (i) pertain to the maintenance of records that, in reasonable detail, accurately and fairly reflect the transactions and dispositions of the assets of the company; (ii) provide reasonable assurance that transactions are recorded as necessary to permit preparation of financial statements in accordance with generally accepted accounting principles, and that receipts and expenditures of the company are being made only in accordance with authorizations of management and directors of the company; and (iii) provide reasonable assurance regarding prevention or timely detection of unauthorized acquisition, use, or disposition of the company’s assets that could have a material effect on the financial statements.
Because of its inherent limitations, internal control over financial reporting may not prevent or detect misstatements. Also, projections of any evaluation of effectiveness to future periods are subject to the risk that controls may become inadequate because of changes in conditions, or that the degree of compliance with the policies or procedures may deteriorate.
/s/ PricewaterhouseCoopers LLP
San Jose, California
August 8, 2014
90
|
ITEM 9.
|
CHANGES IN AND DISAGREEMENTS WITH ACCOUNTANTS ON ACCOUNTING AND FINANCIAL DISCLOSURE
|
None.
|
ITEM 9A.
|
CONTROLS AND PROCEDURES
|
Evaluation of Disclosure Controls and Procedures
The Company conducted an evaluation of the effectiveness of the design and operation of its disclosure controls and procedures (as defined in Rules 13a-15(e) and 15d-15(e) under the Securities Exchange Act of 1934, as amended (the “Exchange Act”)) (“Disclosure Controls”) as of the end of the period covered by this Annual Report on Form 10-K (this “Report”) required by Exchange Act Rules 13a-15(b) or 15d-15(b). The controls evaluation was conducted under the supervision and with the participation of the Company’s management, including the Company’s Chief Executive Officer (“CEO”) and Chief Financial Officer (“CFO”). Based on this evaluation, the CEO and CFO have concluded that as of the end of the period covered by this Report the Company’s Disclosure Controls were effective at a reasonable assurance level.
Attached as exhibits to this Report are certifications of the CEO and CFO, which are required in accordance with Rule 13a-14 of the Exchange Act. This Controls and Procedures section includes the information concerning the controls evaluation referred to in the certifications, and it should be read in conjunction with the certifications for a more complete understanding of the topics presented.
Definition of Disclosure Controls
Disclosure Controls are controls and procedures designed to reasonably assure that information required to be disclosed in the Company’s reports filed under the Exchange Act, such as this Report, is recorded, processed, summarized and reported within the time periods specified in the SEC’s rules and forms. Disclosure Controls are also designed to reasonably assure that such information is accumulated and communicated to the Company’s management, including the CEO and CFO, as appropriate to allow timely decisions regarding required disclosure. The Company’s Disclosure Controls include components of its internal control over financial reporting, which consists of control processes designed to provide reasonable assurance regarding the reliability of its financial reporting and the preparation of financial statements in accordance with generally accepted accounting principles in the United States. To the extent that components of the Company’s internal control over financial reporting are included within its Disclosure Controls, they are included in the scope of the Company’s annual controls evaluation.
Management’s Report on Internal Control over Financial Reporting
The Company’s management is responsible for establishing and maintaining adequate internal control over financial reporting as defined in Rules 13a-15(f) and 15d-15(f) under the Exchange Act. Under the supervision and with the participation of the Company’s management, including the CEO and CFO, the Company conducted an evaluation of the effectiveness of its internal control over financial reporting based on criteria established in the framework in
Internal Control—Integrated Framework (1992)
issued by the Committee of Sponsoring Organizations of the Treadway Commission. Based on this evaluation, the Company’s management concluded that the Company’s internal control over financial reporting was effective as of
June 30, 2014
.
The effectiveness of the Company’s internal control over financial reporting as of
June 30, 2014
has been audited by PricewaterhouseCoopers LLP, an independent registered public accounting firm, as stated in their report which appears in Item 8, “Financial Statements and Supplementary Data” in this Annual Report on Form 10-K.
91
Limitations on the Effectiveness of Controls
The Company’s management, including the CEO and CFO, does not expect that the Company’s Disclosure Controls or internal control over financial reporting will prevent all error and all fraud. A control system, no matter how well designed and operated, can provide only reasonable, not absolute, assurance that the control system’s objectives will be met. Further, the design of a control system must reflect the fact that there are resource constraints, and the benefits of controls must be considered relative to their costs. Because of the inherent limitations in all control systems, no evaluation of controls can provide absolute assurance that all control issues and instances of fraud, if any, within the Company have been detected. These inherent limitations include the realities that judgments in decision making can be faulty and that breakdowns can occur because of simple error or mistake. Controls can also be circumvented by the individual acts of some persons, by collusion of two or more people, or by management override of the controls. The design of any system of controls is based in part on certain assumptions about the likelihood of future events, and there can be no assurance that any design will succeed in achieving its stated goals under all potential future conditions. Over time, controls may become inadequate because of changes in conditions or deterioration in the degree of compliance with policies or procedures. Because of the inherent limitations in a cost-effective control system, misstatements due to error or fraud may occur and not be detected.
Changes in Internal Control over Financial Reporting
There were no changes in the Company’s internal control over financial reporting that occurred during the fourth quarter of fiscal year
2014
that have materially affected, or are reasonably likely to materially affect, the Company’s internal control over financial reporting.
|
ITEM 9B.
|
OTHER INFORMATION
|
None.
92
|
ITEM 10.
|
DIRECTORS, EXECUTIVE OFFICERS AND CORPORATE GOVERNANCE
|
For the information required by this Item, see “Information About the Directors and the Nominees,” “Information About Executive Officers,” “Security Ownership of Certain Beneficial Owners and Management—Section 16(a) Beneficial Ownership Reporting Compliance,” “Our Corporate Governance Practices—Standards of Business Conduct; Whistleblower Hotline and Website” and “Information About the Board of Directors and Its Committees—Audit Committee” in the Proxy Statement, which is incorporated herein by reference.
|
ITEM 11.
|
EXECUTIVE COMPENSATION
|
For the information required by this Item, see “Executive Compensation and Other Matters,” “Director Compensation” and “Information About the Board of Directors and Its Committees—Compensation Committee—Risk Considerations in Our Compensation Programs” in the Proxy Statement, which is incorporated herein by reference.
|
ITEM 12.
|
SECURITY OWNERSHIP OF CERTAIN BENEFICIAL OWNERS AND MANAGEMENT AND RELATED STOCKHOLDER MATTERS
|
For the information required by this Item, see “Security Ownership of Certain Beneficial Owners and Management” and “Equity Compensation Plan Information” in the Proxy Statement, which is incorporated herein by reference.
|
ITEM 13.
|
CERTAIN RELATIONSHIPS AND RELATED TRANSACTIONS, AND DIRECTOR INDEPENDENCE
|
For the information required by this Item, see “Certain Relationships and Related Transactions” and “Information About the Board of Directors and Its Committees —The Board of Directors” in the Proxy Statement, which is incorporated herein by reference.
|
ITEM 14.
|
PRINCIPAL ACCOUNTING FEES AND SERVICES
|
For the information required by this Item, see “Proposal Two: Ratification of Appointment of PricewaterhouseCoopers LLP as Our Independent Registered Public Accounting Firm for the Fiscal Year Ending
June 30, 2015
” in the Proxy Statement, which is incorporated herein by reference.
93
|
ITEM 15.
|
EXHIBITS, FINANCIAL STATEMENT SCHEDULES
|
(a) The following documents are filed as part of this Annual Report on Form 10-K:
1. Financial Statements:
The following financial statements and schedules of the Registrant are contained in Item 8, “Financial Statements and Supplementary Data” of this Annual Report on Form 10-K:
2. Financial Statement Schedule:
The following financial statement schedule of the Registrant is filed as part of this Annual Report on Form 10-K and should be read in conjunction with the financial statements:
All other schedules are omitted because they are either not applicable or the required information is shown in the Consolidated Financial Statements or notes thereto.
3. Exhibits
The information required by this Item is set forth in the Exhibit Index following Schedule II included in this Annual Report.
94
SIGNATURES
Pursuant to the requirements of Section 13 or 15(d) of the Securities Exchange Act of 1934, the registrant has duly caused this report to be signed on its behalf by the undersigned, thereunto duly authorized.
|
|
KLA-Tencor Corporation
|
|||
|
August 8, 2014
|
By:
|
|
/
S
/ R
ICHARD
P. W
ALLACE
|
|
|
(Date)
|
|
Richard P. Wallace
|
||
|
|
President and Chief Executive Officer
|
|||
95
Pursuant to the requirements of the Securities Exchange Act of 1934, this report has been signed below by the following persons on behalf of the registrant and in the capacities and on the dates indicated.
|
Signature
|
|
Title
|
|
Date
|
|
/s/ R
ICHARD
P. W
ALLACE
|
|
President, Chief Executive Officer and Director (principal executive officer)
|
|
August 8, 2014
|
|
Richard P. Wallace
|
|
|
||
|
/s/ B
REN
D. H
IGGINS
|
|
Executive Vice President and Chief Financial Officer (principal financial officer)
|
|
August 8, 2014
|
|
Bren D. Higgins
|
|
|
||
|
/s/ V
IRENDRA
A. K
IRLOSKAR
|
|
Senior Vice President and Chief Accounting Officer (principal accounting officer)
|
|
August 8, 2014
|
|
Virendra A. Kirloskar
|
||||
|
/s/ E
DWARD
W. B
ARNHOLT
|
|
Chairman of the Board and Director
|
|
August 8, 2014
|
|
Edward W. Barnholt
|
||||
|
/s/ R
OBERT
T. B
OND
|
|
Director
|
|
August 8, 2014
|
|
Robert T. Bond
|
||||
|
/s/ R
OBERT
M. C
ALDERONI
|
|
Director
|
|
August 8, 2014
|
|
Robert M. Calderoni
|
||||
|
/s/ J
OHN
T. D
ICKSON
|
|
Director
|
|
August 8, 2014
|
|
John T. Dickson
|
||||
|
/s/ E
MIKO
H
IGASHI
|
Director
|
August 8, 2014
|
||
|
Emiko Higashi
|
||||
|
/s/ S
TEPHEN
P. K
AUFMAN
|
|
Director
|
|
August 8, 2014
|
|
Stephen P. Kaufman
|
||||
|
/s/ K
EVIN
J. K
ENNEDY
|
|
Director
|
|
August 8, 2014
|
|
Kevin J. Kennedy
|
||||
|
/s/ K
IRAN
M. P
ATEL
|
|
Director
|
|
August 8, 2014
|
|
Kiran M. Patel
|
||||
|
/s/ D
AVID
C. W
ANG
|
|
Director
|
August 8, 2014
|
|
|
David C. Wang
|
||||
96
SCHEDULE II
Valuation and Qualifying Accounts
|
(In thousands)
|
Balance at
Beginning
of Period
|
Charged to
Expense
|
Deductions/
Adjustments
|
Balance
at End
of Period
|
|||||||||||
|
Fiscal Year Ended June 30, 2012:
|
|||||||||||||||
|
Allowance for Doubtful Accounts
|
$
|
22,106
|
|
$
|
300
|
|
$
|
(79
|
)
|
$
|
22,327
|
|
|||
|
Allowance for Deferred Tax Assets
|
$
|
30,722
|
|
$
|
—
|
|
$
|
9,757
|
|
$
|
40,479
|
|
|||
|
Fiscal Year Ended June 30, 2013:
|
|||||||||||||||
|
Allowance for Doubtful Accounts
|
$
|
22,327
|
|
$
|
—
|
|
$
|
(192
|
)
|
$
|
22,135
|
|
|||
|
Allowance for Deferred Tax Assets
|
$
|
40,479
|
|
$
|
—
|
|
$
|
16,618
|
|
$
|
57,097
|
|
|||
|
Fiscal Year Ended June 30, 2014:
|
|
|
|||||||||||||
|
Allowance for Doubtful Accounts
|
$
|
22,135
|
|
$
|
—
|
|
$
|
(308
|
)
|
$
|
21,827
|
|
|||
|
Allowance for Deferred Tax Assets
|
$
|
57,097
|
|
$
|
—
|
|
$
|
19,231
|
|
$
|
76,328
|
|
|||
97
KLA-TENCOR CORPORATION
EXHIBIT INDEX
|
Exhibit
Number
|
Exhibit Description
|
Incorporated by Reference
|
||||||||
|
Form
|
File No.
|
Exhibit
Number
|
Filing Date
|
|||||||
|
3.1
|
Amended and Restated Certificate of Incorporation
|
10-Q
|
No. 000-09992
|
3.1
|
May 14, 1997
|
|||||
|
3.2
|
Certificate of Amendment of Amended and Restated Certificate of Incorporation
|
10-Q
|
No. 000-09992
|
3.1
|
February 14, 2001
|
|||||
|
3.3
|
Certificate of Amendment to Amended and Restated Certificate of Incorporation of the Company effective as of November 8, 2012
|
8-K
|
No. 000-09992
|
3.1
|
November 13, 2012
|
|||||
|
3.4
|
Amended and Restated Bylaws of the Company effective as of August 7, 2014
|
8-K
|
No. 000-09992
|
3.1
|
August 8, 2014
|
|||||
|
4.1
|
Indenture dated as of May 2, 2008 between the Company and Wells Fargo Bank, N.A., as trustee
|
8-K
|
No. 000-09992
|
4.1
|
May 6, 2008
|
|||||
|
4.2
|
Form of 6.900% Senior Notes Due 2018 (included in Exhibit 4.1)
|
8-K
|
No. 000-09992
|
4.2
|
May 6, 2008
|
|||||
|
10.1
|
1998 Outside Director Option Plan*
|
S-8
|
No. 333-68423
|
10.1
|
December 4, 1998
|
|||||
|
10.2
|
Form of Option Agreement under 1998 Outside Director Option Plan*
|
8-K
|
No. 000-09992
|
10.1
|
October 18, 2004
|
|||||
|
10.3
|
2000 Nonstatutory Stock Option Plan (as amended August 2, 2002)*
|
S-8
|
No. 333-100166
|
10.3
|
September 27, 2002
|
|||||
|
10.4
|
2004 Equity Incentive Plan (as amended and restated)*
|
8-K
|
No. 000-09992
|
10.46
|
October 8, 2009
|
|||||
|
10.5
|
2004 Equity Incentive Plan (as amended and restated (as of November 6, 2013))*
|
DEF14A
|
No. 000-09992
|
App. A
|
September 26, 2013
|
|||||
|
10.6
|
Rules of the Company’s 2004 Equity Incentive Plan for the Grant of Restricted Stock Units to Participants in France*
|
10-Q
|
No. 000-09992
|
10.50
|
January 30, 2009
|
|||||
|
10.7
|
Notice of Grant of Restricted Stock Units*
|
10-Q
|
No. 000-09992
|
10.18
|
May 4, 2006
|
|||||
|
10.8
|
Option Grant Notification Form*
|
8-K
|
No. 000-09992
|
10.1
|
September 29, 2005
|
|||||
|
10.9
|
Form of Restricted Stock Unit Award Notification (Performance-Vesting)*
|
8-K
|
No. 000-09992
|
10.19
|
September 20, 2006
|
|||||
|
10.10
|
Form of Restricted Stock Unit Award Notification (Performance-Vesting) (approved August 2012)*
|
8-K
|
No. 000-09992
|
10.2
|
August 2, 2012
|
|||||
|
10.11
|
Form of Restricted Stock Unit Award Notification (Service-Vesting)*
|
10-K
|
No. 000-09992
|
10.17
|
August 7, 2008
|
|||||
|
10.12
|
Form of Restricted Stock Unit Award Notification (Service-Vesting) (approved August 2012)*
|
8-K
|
No. 000-09992
|
10.1
|
August 2, 2012
|
|||||
|
10.13
|
Form of Restricted Stock Unit Agreement*
|
8-K
|
No. 000-09992
|
10.20
|
September 20, 2006
|
|||||
|
10.14
|
Form of Restricted Stock Unit Agreement for U.S. Employees (approved December 2008)*
|
10-Q
|
No. 000-09992
|
10.44
|
January 30, 2009
|
|||||
98
|
Exhibit
Number
|
Exhibit Description
|
Incorporated by Reference
|
||||||||
|
Form
|
File No.
|
Exhibit
Number
|
Filing Date
|
|||||||
|
10.15
|
Form of Restricted Stock Unit Agreement for French Participants (approved December 2008)*
|
10-Q
|
No. 000-09992
|
10.45
|
January 30, 2009
|
|||||
|
10.16
|
Form of Restricted Stock Unit Agreement for Non-U.S. Employees (approved December 2008)*
|
10-Q
|
No. 000-09992
|
10.46
|
January 30, 2009
|
|||||
|
10.17
|
Form of Stock Option Amendment and Special Bonus Agreement (with Chief Executive Officer)*
|
8-K
|
No. 000-09992
|
99.1
|
January 5, 2007
|
|||||
|
10.18
|
Form of Stock Option Amendment and Special Bonus Agreement*
|
8-K
|
No. 000-09992
|
99.1
|
November 13, 2007
|
|||||
|
10.19
|
Amended and Restated 1997 Employee Stock Purchase Plan (as amended February 11, 2011)*
|
10-Q
|
No. 000-09992
|
10.47
|
April 29, 2011
|
|||||
|
10.20
|
Amended and Restated 1997 Employee Stock Purchase Plan (as amended February 7, 2013)*
|
10-Q
|
No. 000-09992
|
10.46
|
April 26, 2013
|
|||||
|
10.21
|
Amended and Restated 1997 Employee Stock Purchase Plan (as amended May 8, 2014)*
|
|||||||||
|
10.22
|
KLA Instruments Corporation’s Restated 1982 Stock Option Plan (as amended November 18, 1996)*
|
S-8
|
No. 333-22941
|
10.74
|
March 7, 1997
|
|||||
|
10.23
|
Therma-Wave, Inc.’s 2000 Equity Incentive Plan*
|
(1)
|
(1)
|
(1)
|
(1)
|
|||||
|
10.24
|
Amendment No. 1 to Therma-Wave, Inc.’s 2000 Equity Incentive Plan*
|
(2)
|
(2)
|
(2)
|
(2)
|
|||||
|
10.25
|
Amendment No. 2 to Therma-Wave, Inc.’s 2000 Equity Incentive Plan*
|
(3)
|
(3)
|
(3)
|
(3)
|
|||||
|
10.26
|
Amendment No. 3 to Therma-Wave, Inc.’s 2000 Equity Incentive Plan*
|
(4)
|
(4)
|
(4)
|
(4)
|
|||||
|
10.27
|
Amendment No. 4 to Therma-Wave, Inc.’s 2000 Equity Incentive Plan*
|
(5)
|
(5)
|
(5)
|
(5)
|
|||||
|
10.28
|
ADE Corporation’s 1995 Stock Option Plan*
|
(6)
|
(6)
|
(6)
|
(6)
|
|||||
|
10.29
|
ADE Corporation’s 1997 Employee Stock Option Plan*
|
(7)
|
(7)
|
(7)
|
(7)
|
|||||
|
10.30
|
Amendment to ADE Corporation’s 1997 Employee Stock Option Plan dated April 7, 1999*
|
(8)
|
(8)
|
(8)
|
(8)
|
|||||
|
10.31
|
ADE Corporation’s 2000 Employee Stock Option Plan (as amended)*
|
(9)
|
(9)
|
(9)
|
(9)
|
|||||
|
10.32
|
Form of Indemnification Agreement for Directors and Executive Officers*
|
10-K
|
No. 000-09992
|
10.3
|
September 29, 1997
|
|||||
|
10.33
|
KLA-Tencor Corporation Performance Bonus Plan*
|
DEF 14A
|
No. 000-09992
|
App. B
|
September 26, 2013
|
|||||
|
10.34
|
Fiscal Year 2012 Executive Incentive Plan*+
|
10-Q
|
No. 000-09992
|
10.43
|
October 27, 2011
|
|||||
|
10.35
|
Fiscal Year 2013 Executive Incentive Plan*+
|
10-Q
|
No. 000-09992
|
10.41
|
October 26, 2012
|
|||||
|
10.36
|
Fiscal Year 2014 Executive Incentive Plan*+
|
10-Q
|
No. 000-09992
|
10.44
|
October 25, 2013
|
|||||
99
|
Exhibit
Number
|
Exhibit Description
|
Incorporated by Reference
|
||||||||
|
Form
|
File No.
|
Exhibit
Number
|
Filing Date
|
|||||||
|
10.37
|
Executive Deferred Savings Plan (as amended and restated effective November 2, 2011)*
|
10-Q
|
No. 000-09992
|
10.44
|
January 27, 2012
|
|||||
|
10.38
|
Executive Deferred Savings Plan (as amended and restated effective February 8, 2012)*
|
10-Q
|
No. 000-09992
|
10.45
|
April 27, 2012
|
|||||
|
10.39
|
Executive Deferred Savings Plan (as amended and restated effective November 7, 2012)*
|
10-Q
|
No. 000-09992
|
10.42
|
January 25, 2013
|
|||||
|
10.40
|
Executive Severance Plan (as amended and restated November 8, 2012)*
|
10-Q
|
No. 000-09992
|
10.43
|
January 25, 2013
|
|||||
|
10.41
|
2010 Executive Severance Plan (as amended and restated November 7, 2012)*
|
10-Q
|
No. 000-09992
|
10.44
|
January 25, 2013
|
|||||
|
10.42
|
Letter Agreement by and between the Company and Brian M. Martin*
|
10-Q
|
No. 000-09992
|
10.28
|
May 7, 2007
|
|||||
|
10.43
|
Letter Agreement by and between the Company and Mark Dentinger*
|
10-Q
|
No. 000-09992
|
10.43
|
October 31, 2008
|
|||||
|
10.44
|
Letter Agreement between the Company and Martk Dentinger*
|
10-Q
|
No. 000-09992
|
10.43
|
October 25, 2013
|
|||||
|
12.1
|
Computation of Ratio of Earnings to Fixed Charges
|
|||||||||
|
21.1
|
List of Subsidiaries
|
|||||||||
|
23.1
|
Consent of Independent Registered Public Accounting Firm
|
|||||||||
|
31.1
|
Certification of Chief Executive Officer under Rule 13a-14(a) of the Securities Exchange Act of 1934
|
|||||||||
|
31.2
|
Certification of Chief Financial Officer under Rule 13a-14(a) of the Securities Exchange Act of 1934
|
|||||||||
|
32
|
Certification of Chief Executive Officer and Chief Financial Officer Pursuant to 18 U.S.C. Section 1350
|
|||||||||
|
101.INS
|
XBRL Instance Document
|
|||||||||
|
101.SCH
|
XBRL Taxonomy Extension Schema Document
|
|||||||||
|
101.CAL
|
XBRL Taxonomy Extension Calculation Linkbase Document
|
|||||||||
|
101.DEF
|
XBRL Taxonomy Extension Definition Linkbase Document
|
|||||||||
|
101.LAB
|
XBRL Taxonomy Extension Label Linkbase Document
|
|||||||||
|
101.PRE
|
XBRL Taxonomy Extension Presentation Linkbase Document
|
|||||||||
100
|
*
|
Denotes a management contract, plan or arrangement.
|
|
+
|
Confidential treatment has been requested as to a portion of this exhibit.
|
|
(1)
|
Incorporated by reference to Exhibit 10.22 to Therma-Wave, Inc.’s Annual Report on Form 10-K for the fiscal year ended March 31, 2000 (Commission File No. 000-26911).
|
|
(2)
|
Incorporated by reference to Exhibit 99.2 to Therma-Wave, Inc.’s Registration Statement on Form S-8, filed February 22, 2002 (Commission File No. 333-83282).
|
|
(3)
|
Incorporated by reference to Exhibit 99.1 to Therma-Wave, Inc.’s Current Report on Form 8-K, filed August 27, 2004 (Commission File No. 000-26911).
|
|
(4)
|
Incorporated by reference to Exhibit 99.2 to Therma-Wave, Inc.’s Current Report on Form 8-K, filed August 27, 2004 (Commission File No. 000-26911).
|
|
(5)
|
Incorporated by reference to Exhibit 10.21 to Therma-Wave, Inc.’s Annual Report on Form 10-K for the fiscal year ended April 3, 2005 (Commission File No. 000-26911).
|
|
(6)
|
Incorporated by reference to Exhibit 10.2 to ADE Corporation’s Annual Report on Form 10-K for the fiscal year ended April 30, 2006 (Commission File No. 000-26714).
|
|
(7)
|
Incorporated by reference to Exhibit 10.3 to ADE Corporation’s Annual Report on Form 10-K for the fiscal year ended April 30, 1999 (Commission File No. 000-26714).
|
|
(8)
|
Incorporated by reference to Exhibit 4.3 to ADE Corporation’s Registration Statement on Form S-8, filed February 18, 1998 (Commission File No. 333-46505).
|
|
(9)
|
Incorporated by reference to Exhibit 10.4 to ADE Corporation’s Registration Statement on Form S-1 (Commission File No. 33-96408).
|
101
TABLE OF CONTENTS
Part IItem 1. BusinessItem 1A. Risk FactorsItem 1B. Unresolved Staff CommentsItem 2. PropertiesItem 3. Legal ProceedingsItem 4. Mine Safety DisclosuresPart IIItem 5. Market For Registrant S Common Equity, Related Stockholder Matters and Issuer Purchases Of Equity SecuritiesItem 6. Selected Financial DataItem 7. Management's Discussion and Analysis Of Financial Condition and Results Of OperationsItem 7A. Quantitative and Qualitative Disclosures About Market RiskItem 8. Financial Statements and Supplementary DataNote 1 Summary Of Significant Accounting PoliciesNote 2 Fair Value MeasurementsNote 3 Financial Statement ComponentsNote 4 Marketable SecuritiesNote 5 Business CombinationNote 6 Goodwill and Purchased Intangible AssetsNote 7 Long-term DebtNote 8 Equity and Long-term Incentive Compensation PlansNote 9 Stock Repurchase ProgramNote 10 Net Income Per ShareNote 11 Employee Benefit PlansNote 12 Income TaxesNote 13 Commitments and ContingenciesNote 14 Litigation and Other Legal MattersNote 15 Restructuring ChargesNote 16 Derivative Instruments and Hedging ActivitiesNote 17 Segment Reporting and Geographic InformationNote 18 Related Party TransactionsNote 19 Subsequent EventsNote 20 Quarterly Consolidated Results Of Operations (unaudited)Item 9. Changes in and Disagreements with Accountants on Accounting and Financial DisclosureItem 9A. Controls and ProceduresItem 9B. Other InformationPart IIIItem 10. Directors, Executive Officers and Corporate GovernanceItem 11. Executive CompensationItem 12. Security Ownership Of Certain Beneficial Owners and Management and Related Stockholder MattersItem 13. Certain Relationships and Related Transactions, and Director IndependenceItem 14. Principal Accounting Fees and ServicesPart IVItem 15. Exhibits, Financial Statement Schedules