CARMAX INC
10-Ks and 10-Qs
|
|
|
|
|
|
|
|
|
|
|
|
|
|
|
|
|
|
|
|
|
|
|
|
|
|
|
|
|
|
|
|
|
|
|
|
|
|
|
|
|
|
|
|
|
|
|
|
|
|
|
|
|
|
|
|
UNITED STATES
SECURITIES AND EXCHANGE COMMISSION
WASHINGTON, D.C. 20549
FORM 10-K
|
x
|
ANNUAL REPORT PURSUANT TO SECTION 13 OR 15(d) OF THE SECURITIES EXCHANGE ACT OF 1934
|
For the fiscal year ended February
28, 20
11
OR
|
¨
|
TRANSITION REPORT PURSUANT TO SECTION 13 OR 15(d) OF THE SECURITIES EXCHANGE ACT OF 1934
|
For the transition period from
to
Commission File Number: 1-31420
CARMAX, INC.
(Exact name of registrant as specified in its charter)
|
VIRGINIA
(State or other jurisdiction of
incorporation or organization)
|
54-1821055
(I.R.S. Employer
Identification No.)
|
|
12800 TUCKAHOE CREEK PARKWAY, RICHMOND, VIRGINIA
(Address of principal executive offices)
|
23238
(Zip Code)
|
Registrant’s telephone number, including area code: (804) 747-0422
Securities registered pursuant to Section 12(b) of the Act:
|
Title of each class
|
Name of each exchange on which registered
|
|
Common Stock, par value $0.50
|
New York Stock Exchange
|
|
Rights to Purchase Series A Preferred Stock,
|
New York Stock Exchange
|
|
par value $20.00
|
Securities registered pursuant to Section 12(g) of the Act:
None
Indicate by check mark if the registrant is a well-known seasoned issuer, as defined in Rule 405 of the Securities Act.
Yes
x
No
¨
Indicate by check mark if the registrant is not required to file reports pursuant to Section 13 or Section 15(d) of the Act.
Yes
¨
No
x
1
Indicate by check mark whether the registrant (1) has filed all reports required to be filed by Section 13 or 15(d) of the Securities Exchange Act of 1934 during the preceding 12 months (or for such shorter period that the registrant was required to file such reports), and (2) has been subject to such filing requirements for the past 90 days.
Yes
x
No
¨
Indicate by check mark whether the registrant has submitted electronically and posted on its corporate Web site, if any, every Interactive Data File required to be submitted and posted pursuant to Rule 405 of Regulation S-T during the preceding 12 months (or for such shorter period that the registrant was required to submit and post such files).
Yes
x
No
¨
Indicate by check mark if disclosure of delinquent filers pursuant to Item 405 of Regulation S-K is not contained herein, and will not be contained, to the best of the registrant’s knowledge, in definitive proxy or information statements incorporated by reference in Part III of this Form 10-K or any amendment to this Form 10-K.
¨
Indicate by check mark whether the registrant is a large accelerated filer, an accelerated filer or a non-accelerated filer or a smaller reporting company. See definitions of “large accelerated filer,” “accelerated filer” and “smaller reporting company in Rule 12b-2 of the Exchange Act. (Check one):
|
Large accelerated filer
x
|
Accelerated filer
¨
|
|
|
Non-accelerated filer
¨
(do not check if a smaller reporting company)
|
Smaller reporting company
¨
|
Indicate by check mark whether the registrant is a shell company (as defined in Rule 12b-2 of the Act).
Yes
¨
No
x
The aggregate market value of the registrant’s common stock held by non-affiliates as of August 31, 2010, computed by reference to the closing price of the registrant’s common stock on the New York Stock Exchange on that date, was $4.46 billion.
On March 31, 2011, there were 225,897,547 outstanding shares of CarMax, Inc. common stock.
DOCUMENTS INCORPORATED BY REFERENCE
Portions of the CarMax, Inc. Notice of 2011 Annual Meeting of Shareholders and Proxy Statement are incorporated by reference in Part III of this Form 10-K.
2
FORM 10-K
FOR FISCAL YEAR ENDED FEBRUARY 28, 2011
TABLE OF CONTENTS
|
|
|
|
Page
No.
|
|
|
PART I
|
||||
|
Item 1.
|
|
Business
|
|
4
|
|
Item 1A.
|
Risk Factors
|
|
11
|
|
|
Item 1B.
|
Unresolved Staff Comments
|
14
|
||
|
Item 2.
|
|
Properties
|
|
14
|
|
Item 3.
|
|
Legal Proceedings
|
|
15
|
|
Item 4.
|
|
Reserved
|
|
15
|
|
PART II
|
||||
|
Item 5.
|
|
Market for the Registrant’s Common Equity, Related Stockholder Matters and Issuer Purchases of Equity Securities
|
|
16
|
|
Item 6.
|
|
Selected Financial Data
|
|
18
|
|
Item 7.
|
|
Management’s Discussion and Analysis of Financial Condition and Results of Operations
|
|
19
|
|
Item 7A.
|
|
Quantitative and Qualitative Disclosures about Market Risk
|
|
37
|
|
Item 8.
|
|
Consolidated Financial Statements and Supplementary Data
|
|
38
|
|
Item 9.
|
|
Changes in and Disagreements with Accountants on Accounting and Financial Disclosure
|
|
76
|
|
Item 9A.
|
Controls and Procedures
|
76
|
||
|
Item 9B.
|
Other Information
|
76
|
||
|
PART III
|
||||
|
Item 10.
|
|
Directors, Executive Officers and Corporate Governance
|
|
77
|
|
Item 11.
|
|
Executive Compensation
|
|
78
|
|
Item 12.
|
|
Security Ownership of Certain Beneficial Owners and Management and Related Stockholder Matters
|
|
78
|
|
Item 13.
|
|
Certain Relationships and Related Transactions and Director Independence
|
|
78
|
|
Item 14.
|
|
Principal Accountant Fees and Services
|
|
78
|
|
PART IV
|
||||
|
Item 15.
|
|
Exhibits and Financial Statement Schedules
|
|
79
|
|
|
Signatures
|
|
80
|
|
3
In this document, “we,” “our,” “us,” “CarMax” and “the company” refer to CarMax, Inc. and its wholly owned subsidiaries, unless the context requires otherwise.
FORWARD-LOOKING AND CAUTIONARY STATEMENTS
This Annual Report on Form 10-K and, in particular, the description of our business set forth in Item 1 and our Management’s Discussion and Analysis of Financial Condition and Results of Operations set forth in Item 7 contain a number of forward-looking statements within the meaning of Section 27A of the Securities Act of 1933 and Section 21E of the Securities Exchange Act of 1934, including statements regarding:
|
·
|
|
·
|
Our expectations of factors that could affect CarMax Auto Finance income.
|
|
·
|
In addition, any statements contained in or incorporated by reference into this report that are not statements of historical fact should be considered forward-looking statements. You can identify these forward-looking statements by use of words such as “anticipate,” “believe,” “could,” “estimate,” “expect,” “intend,” “may,” “outlook,” “plan,” “predict,” “should,” “will” and other similar expressions, whether in the negative or affirmative. We cannot guarantee that we will achieve the plans, intentions or expectations disclosed in the forward-looking statements. There are a number of important risks and uncertainties that could cause actual results to differ materially from those indicated by our forward-looking statements. These risks and uncertainties include, without limitation, those set forth in Item 1A under the heading “Risk Factors.” We caution investors not to place undue reliance on any forward-looking statements as these statements speak only as of the date when made. We undertake no obligation to update any forward-looking statements made in this report.
BUSINESS OVERVIEW
CarMax Background.
CarMax, Inc. was incorporated under the laws of the Commonwealth of Virginia in 1996. CarMax, Inc. is a holding company and our operations are conducted through our subsidiaries. Our home office is located at 12800 Tuckahoe Creek Parkway, Richmond, Virginia.
Under the ownership of Circuit City Stores, Inc. (“Circuit City”), we began operations in 1993 with the opening of our first CarMax superstore in Richmond, Virginia. In 1997, Circuit City completed the initial public offering of a tracking stock that was intended to track separately the performance of the CarMax operations. On October 1, 2002, the CarMax business was separated from Circuit City through a tax-free transaction, becoming an independent, publicly traded company.
CarMax Business.
We are the nation’s largest retailer of used cars, based on the 396,181 used vehicles we retailed during the fiscal year ended February 28, 2011. As of the end of fiscal 2011, we operated 103 used car superstores in 49 metropolitan markets. In addition, we are one of the nation’s largest wholesale vehicle auction operators, based on the 263,061 wholesale vehicles we sold through our on-site auctions in fiscal 2011.
We were the first used vehicle retailer to offer a large selection of high quality used vehicles at competitively low, “no-haggle” prices using a customer-friendly sales process in an attractive, modern sales facility. The CarMax consumer offer provides customers the opportunity to shop for vehicles the same way they shop for items at other “big-box” retailers, and it is structured around four customer benefits: low, no-haggle prices; a broad selection; high quality vehicles; and a customer-friendly sales process. Our strategy is to revolutionize the
4
auto retailing market by addressing the major sources of customer dissatisfaction with traditional auto retailers and to maximize operating efficiencies through the use of standardized operating procedures and store formats enhanced by sophisticated, proprietary management information systems.
The CarMax consumer offer enables customers to evaluate separately each component of the sales process and to make informed decisions based on comprehensive information about the options, terms and associated prices of each component. The customer can accept or decline any individual element of the offer without affecting the price or terms of any other component of the offer. Our no-haggle pricing and our commission structure, which is generally based on a fixed dollars-per-unit standard, allow sales consultants to focus solely on meeting customer needs.
All of the used vehicles we retail are thoroughly reconditioned to meet our high standards, and each vehicle must pass a comprehensive inspection before being offered for sale. In fiscal 2011, approximately 85% of the used vehicles we retailed were 1 to 6 years old with fewer than 60,000 miles. We also offer a selection of used vehicles at each superstore that are more than 6 years old or have more than 60,000 miles, if they meet similar quality standards.
We also wholesale used vehicles. Vehicles purchased through our in-store appraisal process that do not meet our retail standards are sold to licensed dealers through our on-site wholesale auctions. As of February 28, 2011, we conducted weekly or bi-weekly auctions at 51 of our 103 used car superstores.
In addition, we sell new vehicles at five locations under franchise agreements with three new car manufacturers. In fiscal 2011, new vehicles comprised only 2% of our total retail vehicle unit sales.
We provide customers financing alternatives through CarMax Auto Finance (“CAF”), our own finance operation, and third-party financing providers. Our finance program provides access to credit for customers throughout the credit spectrum. We believe that our processes and systems, the transparency of our pricing and our vehicle quality provide a unique and ideal environment in which to originate and procure high quality auto loans. CAF focuses solely on originating loans through CarMax stores, customizing its offers to meet the customer’s risk profile and ensuring credit availability to support CarMax retail vehicle unit sales.
We provide customers with a full range of other related products and services, including the sale of extended service plans (“ESP”), guaranteed asset protection (“GAP”) and accessories; the appraisal and purchase of vehicles directly from consumers; and vehicle repair service.
We have separated the practice of trading in a used vehicle in conjunction with the purchase of another vehicle into two distinct and independent transactions. We will appraise a consumer’s vehicle and make an offer to buy that vehicle regardless of whether the owner is purchasing a vehicle from us. We acquire a significant percentage of our retail used vehicle inventory through this unique in-store appraisal process. We also acquire a large portion of our used vehicle inventory through wholesale auctions and, to a lesser extent, directly from other sources, including wholesalers, dealers and fleet owners.
Our proprietary inventory management and pricing system tracks each vehicle throughout the sales process. Using the information provided by this system and applying statistical modeling techniques, we are able to optimize our inventory mix, anticipate future inventory needs at each store, evaluate sales consultant and buyer performance and refine our vehicle pricing strategy. Because of the pricing discipline afforded by the inventory management and pricing system, generally more than 99% of the entire used car inventory offered at retail is sold at retail.
Industry and Competition.
The U.S. used car marketplace is highly fragmented and competitive. According to industry sources, as of December 31, 2010, there were approximately 17,700 franchised automotive dealerships, which sell both new and used vehicles. In addition, used vehicles were sold by approximately 37,500 independent used vehicle dealers, as well as millions of private individuals. Our primary competitors are the franchised auto dealers, who sell the majority of late-model used vehicles. Independent used car dealers predominantly sell older, higher mileage cars than we do. The number of franchised and independent auto dealers has gradually declined over the last decade. The rate of dealership closures accelerated in recent years due to a variety of factors, including the recessionary environment; the sharp decline in automotive industry sales; and franchise terminations resulting from the bankruptcy reorganizations of General Motors and Chrysler and the discontinuation of several brands by the major auto manufacturers. Despite the recent acceleration in dealership closures, the automotive retail environment remains highly fragmented.
5
Based on industry data, there were approximately 37 million used cars sold in the U.S. in calendar year 2010, of which approximately 16 million were estimated to be late-model, 1 to 6 year old vehicles. While we are the largest retailer of used vehicles in the U.S., selling more than two times as many used vehicles as the next largest retailer in calendar 2010, we still represented less than 3% of the total late-model used units sold. Over the last several years, competition has been affected by the increasing use of Internet-based marketing for both used vehicles and vehicle financing. In both the used and new vehicle markets, we seek to distinguish ourselves from traditional dealerships through our consumer offer, sales approach and other innovative operating strategies.
We believe that our principal competitive advantages in used vehicle retailing are our ability to provide a high degree of customer satisfaction with the car-buying experience by virtue of our competitively low prices; our breadth of selection of the most popular makes and models available both on site and via our website, carmax.com; the quality of our vehicles; our proprietary information systems; CAF; and the locations of our retail stores. Upon request by a customer, we will transfer virtually any used vehicle in our nationwide inventory to a local superstore. Transfer fees may apply, depending on the distance the vehicle needs to travel. In fiscal 2011, approximately 30% of our vehicles sold were transferred at customer request. Our Certified Quality Inspection assures that every vehicle we offer for sale meets our stringent standards. We back every vehicle with a 5-day, money-back guarantee and at least a 30-day limited warranty. We maintain an ability to offer or arrange customer financing with competitive terms. All of the finance offers by CAF and our third-party providers are backed by a 3-day free payoff offer whereby a customer can refinance their loan within three business days at no charge. Additionally, we offer comprehensive and competitively priced ESP and GAP products. We believe that we are competitive in all of these areas and that we enjoy advantages over competitors that employ traditional high-pressure, negotiation-oriented sales techniques.
Our sales consultants play a significant role in ensuring a customer-friendly sales process. A sales consultant is paid a commission, generally based on a fixed dollars-per-unit standard, thereby earning the same dollar sales commission regardless of the gross profit on the vehicle being sold. In addition, sales consultants do not receive commissions based on the number of credit approvals or the amount a customer finances. This ensures that the sales consultant’s primary objective is helping customers find the right vehicles for their needs at prices they can afford. In contrast, sales and finance personnel at traditional dealerships typically receive higher commissions for negotiating higher prices and interest rates, and for steering customers toward vehicles with higher gross profit.
In our wholesale auctions, we compete with other automotive auction houses. We believe our principal competitive advantages include our high vehicle sales rate, our conditional announcement and arbitration policies, our broad geographic distribution and our dealer-friendly practices. Because we own the cars that we auction, we generally sell 97% of the vehicles offered, which is substantially higher than the sales rate at most other auto auctions. Our policy of making conditional announcements, noting mechanical and other issues found during our appraisal process, is also not a typical practice used at other auctions of older, higher mileage vehicles. Together, these factors make our auctions attractive to dealers, resulting in a high dealer-to-car attendance ratio.
Marketing and Advertising.
Our marketing strategies are focused on developing awareness of the advantages of shopping at our stores and on attracting customers who are already considering buying or selling a vehicle. Our marketing strategies are implemented primarily through television and radio broadcasts, carmax.com, Internet search engines and online classified listings. Television and radio broadcast advertisements are designed to build consumer awareness of the CarMax name, carmax.com and key components of the CarMax offer. Broadcast and Internet advertisements are designed to drive customers to our stores and to carmax.com.
We continually adjust our marketing programs in response to the evolving media landscape. We have customized our marketing program based on awareness levels in each market. We are building awareness and driving traffic to our stores and carmax.com by listing retail vehicles on online classified sites, such as AutoTrader.com and cars.com. We believe using these online classified services allows our vehicles to appear on sites that are visited by a majority of buyers of late-model used vehicles who use the Internet in their shopping process. Our advertising on the Internet also includes advertisements on search engines, such as Google and Yahoo!
Our website, carmax.com, is a marketing tool for communicating the CarMax consumer offer in detail, a sophisticated search engine for finding the right vehicle and a sales channel for customers who prefer to complete a part of the shopping and sales process online. The website offers complete inventory and pricing search capabilities. Information on each of the thousands of cars available in our nationwide inventory is updated several times per day. Carmax.com includes detailed information, such as vehicle photos, prices, features, specifications and store locations, as well as advanced feature-based search capabilities, and sorting and comparison tools that allow consumers to easily compare vehicles. The site also includes features such as detailed vehicle reviews, payment calculators and email alerts when new inventory arrives. Virtually any used vehicle in our nationwide inventory can be
6
transferred at customer request to their local superstore. Customers can contact sales consultants online via carmax.com, by telephone or by fax. Customers can work with these sales consultants from the comfort of home, including applying for financing, and they need to visit the store only to complete the final steps of the transaction, such as signing the paperwork and picking up their vehicle. In response to the growing use of web-enabled phones, during fiscal 2011, we launched a mobile website application that allows customers to search for and view cars on their phones. Our survey data indicates that during fiscal 2011, approximately 75% of customers who purchased a vehicle from us had first visited our website.
We also maintain a website, carmaxauctions.com, that supports our wholesale auctions. This website, which is accessible only by authorized dealers, provides listings of all vehicles that will be available in upcoming auctions. It also has many features similar to our retail website, including vehicle photos, free vehicle history reports and vehicle search and alert capabilities.
Suppliers for Used Vehicles.
We acquire used vehicle inventory directly from consumers through our in-store appraisal process, our car-buying centers and through other sources, including local, regional and online auctions, wholesalers, franchised and independent dealers and fleet owners, such as leasing companies and rental companies. The supply of used vehicles is influenced by a variety of factors, including the total number of vehicles in operation; the rate of new vehicle sales, which in turn generate used-car trade-ins; and the number of used vehicles sold or remarketed through retail channels, wholesale transactions and at automotive auctions. According to industry data, there are approximately 240 million light vehicles in operation in the U.S. In recent years, generally between 10 million and 17 million new vehicles and between 35 million and 45 million used vehicles have been retailed annually and between 9 million and 10 million vehicles have been remarketed at wholesale auctions each year.
Our used vehicle inventory acquired directly from consumers through our appraisal process at our stores and car-buying centers, helps provide an inventory of makes and models that reflects the consumer preferences of each market. We currently operate five car-buying centers where we conduct appraisals and purchase, but do not sell, vehicles. We have replaced the traditional “trade-in” transaction with a process in which a CarMax-trained buyer appraises a customer’s vehicle and provides the owner with a written, guaranteed offer that is good for seven days.
An appraisal is available to every customer free of charge, whether or not the customer purchases a vehicle from us. Based on their age, mileage or condition, fewer than half of the vehicles acquired through this in-store appraisal process meet our high-quality retail standards. Those vehicles that do not meet our retail standards are sold to licensed dealers through our on-site wholesale auctions.
The inventory purchasing function is primarily performed at the store level and is the responsibility of the buyers, who handle both on-site appraisals and off-site auction purchases. Our buyers evaluate all used vehicles based on internal and external auction data and market sales, as well as estimated reconditioning costs and, for off-site purchases, transportation costs. Our buyers, in collaboration with our home office staff, utilize the extensive inventory and sales trend data available through the CarMax information system to decide which inventory to purchase at off-site auctions. Our inventory and pricing models help the buyers tailor inventories to the buying preferences at each superstore, recommend pricing adjustments and optimize inventory turnover to help maintain gross profit per unit.
Based on consumer acceptance of the in-store appraisal process, our experience and success to date in acquiring vehicles from auctions and other sources, and the large size of the U.S. auction market relative to our needs, we believe that sources of used vehicles will continue to be sufficient to meet our current and future needs.
Suppliers for New Vehicles.
Our new car operations are governed by the terms of the sales, service and dealer agreements. Among other things, these agreements generally impose operating requirements and restrictions, including inventory levels, working capital, monthly financial reporting, signage and cooperation with marketing strategies. A manufacturer may terminate a dealer agreement under certain circumstances. In addition to selling new vehicles using our low, no-haggle price strategy, the franchise and dealer agreements generally allow us to perform warranty work on these vehicles and sell related parts and services within a specified market area. Designation of specified market areas generally does not guarantee exclusivity within a specified territory.
Seasonality.
Historically, our business has been seasonal. Typically, our superstores experience their strongest traffic and sales in the spring and summer quarters. Sales are typically slowest in the fall quarter, when used vehicles generally experience proportionately more of their annual depreciation. We believe this is partly the result of a decline in customer traffic, as well as discounts on model year closeouts that can pressure pricing for late-model used vehicles. Customer traffic generally tends to slow in the fall as the weather changes and as customers shift their spending priorities. We typically experience an increase in subprime traffic and sales in our fourth quarter, coincident with tax refund season.
7
PRODUCTS AND SERVICES
Merchandising.
We offer customers a broad selection of makes and models of used vehicles, including both domestic and imported vehicles, at competitive prices. Our used car selection covers popular brands from manufacturers such as Chrysler, Ford, General Motors, Honda, Hyundai, Kia, Mazda, Nissan, Toyota and Volkswagen and luxury brands such as Acura, BMW, Infiniti, Lexus and Mercedes. Our primary focus is vehicles that are 1 to 6 years old, have fewer than 60,000 miles and generally range in price from $11,000 to $32,000. For the more cost-conscious consumer, we also offer used cars that are more than 6 years old or have 60,000 miles or more and that generally range in price from $8,000 to $23,000.
We have implemented an everyday low-price strategy under which we set no-haggle prices on both our used and new vehicles. We believe that our pricing is competitive with the best-negotiated prices in the market. Prices on all vehicles are clearly displayed on each vehicle’s information sticker; on carmax.com and on applicable online classified sites on which they are listed; and, where applicable, in our newspaper advertising. We extend our no-haggle philosophy to every component of the vehicle transaction, including vehicle appraisal offers, financing rates, accessories, and ESP and GAP pricing.
Reconditioning and Service.
An integral part of our used car consumer offer is the reconditioning process. This process includes a comprehensive Certified Quality Inspection of the engine and all major systems, including cooling, fuel, drivetrain, transmission, electronics, suspension, brakes, steering, air conditioning and other equipment, as well as the interior and exterior of the vehicle. Based on this quality inspection, we determine the reconditioning necessary to bring the vehicle up to our quality standards. Our technicians complete vehicle inspections. We perform most routine mechanical and minor body repairs in-house; however, for some reconditioning services, we engage third parties specializing in those services. Some superstores depend upon nearby, typically larger, superstores for reconditioning, which increases efficiency and reduces overhead.
All CarMax used car superstores provide vehicle repair service, including repairs of vehicles covered by our ESPs. We also provide factory-authorized service at all new car franchises. We have developed systems and procedures that are intended to ensure that our retail repair service is conducted in the same customer-friendly and efficient manner as our other operations.
We believe that the efficiency of our reconditioning and service operations is enhanced by our modern facilities, our information systems and our technician training and development process. The training and development process and our compensation programs are designed to increase the productivity of technicians, identify opportunities for waste reduction and achieve high-quality repairs. Our information systems provide the ability to track repair history and enable trend analysis, which serves as guidance for our continuous improvement efforts.
Wholesale Auctions.
Vehicles purchased through our in-store appraisal process that do not meet our retail standards are sold through on-site wholesale auctions. As of February 28, 2011, wholesale auctions were conducted at 51 of our 103 superstores and were generally held on a weekly or bi-weekly basis. Auction frequency at a given superstore is determined by the number of vehicles to be auctioned, which depends on the number of stores in that market and the consumer awareness of CarMax and our in-store appraisal offer. The typical wholesale vehicle is approximately 10 years old and has more than 100,000 miles. Participation in our wholesale auctions is restricted to licensed automobile dealers, the majority of whom are independent dealers. To participate in a CarMax auction, dealers must register with our centralized auction support group, at which time we determine the purchase limit available to each dealer. We make conditional announcements on each vehicle, including those for vehicles with major mechanical issues, possible frame or flood damage, branded titles, salvage history and unknown true mileage. Professional, licensed auctioneers conduct our auctions. The average auction sales rate was 97% in fiscal 2011. Dealers pay a fee to us based on the sales price of the vehicles they purchase.
Customer Credit.
We offer financing alternatives to customers throughout the credit spectrum through CAF and our arrangements with several industry-leading financial institutions. We believe our program enables us to capture additional sales and enhances the CarMax consumer offer. Credit applications are initially reviewed by CAF. Customers who are not approved by CAF may be evaluated by the other financial institutions. Having an array of finance sources increases discrete approvals, expands finance opportunities for our customers and mitigates risk to CarMax. In fiscal 2011, more than 80% of our applicants received an approval from one or more of our sources. We have tested, and will continue to test, other third-party financing providers.
8
Customers applying for financing provide credit information that is electronically submitted by sales consultants through our proprietary information system. A majority of applicants receive a response within five minutes. The vehicle financings are retail installment contracts secured by the vehicles financed. Customers are permitted to refinance or pay off their contract within three business days of a purchase without incurring any finance or related charges. The third-party providers who purchase subprime financings generally purchase these loans at a discount, and we collect fixed, prenegotiated fees per vehicle financed from the majority of the other providers. We have no recourse liability on retail installment contracts arranged with third-party providers.
CarMax Auto Finance.
We offer financing through CAF to qualified customers purchasing vehicles at CarMax. CAF utilizes proprietary scoring models based upon the credit history of the customer along with CAF’s historical experience to predict the likelihood of customer repayment. We offer customers an array of competitive rates and terms, allowing them to choose the one that best fits their needs. We randomly test different credit offers and closely monitor acceptance rates and 3-day payoffs to assess market competitiveness. After the effect of estimated 3-day payoffs and vehicle returns, CAF financed approximately 30% of our retail vehicle unit sales in fiscal 2011. As of February 28, 2011, CAF serviced more than 380,000 customers in its $4.33 billion portfolio.
Extended Service Plans and Guaranteed Asset Protection.
At the time of the sale, we offer the customer an ESP. We sell these plans on behalf of unrelated third parties that are the primary obligors. Under the third-party service plan programs, we have no contractual liability to the customer. The ESPs we offer on all used vehicles provide coverage up to 72 months (subject to mileage limitations) and include multiple mileage and deductible options, depending on the vehicle mileage, make and model. We offer ESPs at low, fixed prices, which are based primarily on the historical repair record of the vehicle make and model, the mileage option selected and the deductible chosen. All ESPs that we sell (other than manufacturer programs) have been designed to our specifications and are administered by the third parties through private-label arrangements. We receive a commission from the administrator at the time the ESP is sold. In fiscal 2011, more than 55% of the customers purchasing a used vehicle from CarMax also purchased an ESP.
Our ESP customers have access to vehicle repair service at each CarMax store and at thousands of independent and franchised service providers. We believe that the quality of the services provided by this network, as well as the broad scope of our ESPs, helps promote customer satisfaction and loyalty, and thus increases the likelihood of repeat and referral business.
In fiscal 2010, we introduced GAP that will pay the difference between the customer’s insurance settlement and the finance contract payoff amount on their vehicle in the case of a total loss or unrecovered theft. We sell this product on behalf of an unrelated third party that is the primary obligor and we have no contractual liability to the customer. GAP has been designed to our specifications and is administered by the third party through a private-label arrangement. We receive a commission from the administrator at the time of sale.
Systems
Our stores are supported by an advanced, proprietary information system that improves the customer experience, while providing tightly integrated automation of all operating functions. Using a computer or web-enabled phone, customers can search our entire vehicle inventory through our website, carmax.com. They can also print a detailed listing for any vehicle from a computer, which includes the vehicle’s features and specifications and its location on the display lot. Our integrated inventory management system tracks every vehicle through its life from purchase through reconditioning and test-drives to ultimate sale. Using radio frequency identification (“RFID”) tags, all vehicles are scanned and tracked daily as a loss prevention measure. Test-drive information is also captured on every vehicle using RFID tags, linking the specific vehicle and the sales consultant. We also capture data on vehicles we wholesale, which helps us track market pricing. A computerized finance application process and computer-assisted document preparation ensure rapid completion of the sales transaction. Behind the scenes, our proprietary store technology provides our management with real-time information about many aspects of store operations, such as inventory management, pricing, vehicle transfers, wholesale auctions and sales consultant productivity. In addition, our store system provides a direct link to our proprietary credit processing information system to facilitate the credit review and approval process of our in-house financing and third party providers.
Our proprietary inventory management and pricing system is centralized and allows us to buy the mix of makes, models, age, mileage and price points tailored to customer buying preferences at each superstore. This system also generates recommended initial retail price points, as well as retail price markdowns for specific vehicles based on complex algorithms that take into account factors including sales history, consumer interest and seasonal patterns. We believe this systematic approach to vehicle pricing allows us to optimize inventory turns, which minimizes the depreciation risk inherent in used cars and helps us to achieve our targeted gross profit dollars per unit.
9
In addition to inventory management, our Electronic Repair Order system (“ERO”) is used to sequence reconditioning procedures. ERO provides information that helps increase quality and reduce costs, which further enhances our customer service and profitability.
Through our centralized systems, we are able to quickly integrate new stores into our store network, allowing the new stores to rapidly achieve operating efficiency. We continue to enhance and refine our information systems, which we believe to be a core competitive advantage. The design of our information systems incorporates off-site backups, redundant processing and other measures to reduce the risk of significant data loss in the event of an emergency or disaster.
Associates
On February 28, 2011, we had a total of 15,565 full- and part-time associates, including 11,659 hourly and salaried associates and 3,906 sales associates, who worked on a commission basis. We employ additional associates during peak selling seasons. As of February 28, 2011, our location general managers averaged more than nine years of CarMax experience, in addition to prior retail management experience. We strive to staff each newly opened store with an experienced management team.
We believe we have created a unique corporate culture and maintain good employee relations. No associate is subject to a collective bargaining agreement. We focus on providing our associates with the information and resources they need to offer exceptional customer service. We reward associates whose behavior exemplifies our culture, and we believe that our favorable working conditions and compensation programs allow us to attract and retain highly qualified individuals. We have been recognized for the success of our efforts by a number of external organizations.
Training.
To further support our emphasis on attracting, developing and retaining qualified associates, we have made a commitment to providing exceptional training programs. Store associates receive many hours of structured, self-paced training that introduces them to company policies and their specific job responsibilities through KMX University – our intranet-based, on-premises Learning Management System. KMX University is comprised of customized applications hosted within a learning management system that allow us to author, deliver and track training events and to measure associate competency after training. KMXU also provides a variety of learning activities and collaborative discussions delivered through an integrated virtual classroom system. Most new store associates are also assigned mentors who provide on-the-job guidance and support.
We also provide comprehensive, facilitator-led classroom training courses at the associate and manager levels. All sales consultants go through a four-phase on-boarding process in which they are partnered with a mentor, combining self-paced online training with shadowing and role-playing. Our Professional Selling Skills training provides sales associates the opportunity to learn and practice customer-oriented selling techniques. This online training program contains modules on a variety of skill sets, including building confidence, connecting with the customer, and listening and persuasion techniques. We have also implemented a call recording and review program to provide constructive feedback to associates on how to improve their interactions with customers. Buyers-in-training undergo a 6- to 18-month apprenticeship under the supervision of experienced buyers, and they generally will assist with the appraisal of more than 1,000 cars before making their first independent purchase. Business office associates undergo a 3- to 6-month, four-phase on-the-job certification process in order to be fully cross-trained in all functional areas of the business office. All business office associates and managers also receive regular training through facilitated competency-based training courses. We utilize a mix of internal and external technical training programs in an effort to provide a stable future supply of qualified technicians. The technicians attend in-house and vendor-sponsored training programs designed to develop their skills in performing repairs on the diverse makes and models of vehicles we sell. Technicians at our new car franchises also attend manufacturer-sponsored training programs to stay abreast of current diagnostic, repair and maintenance techniques for those manufacturers’ vehicles. New managers attend an intensive week-long workshop at the home office where they meet with senior leaders and learn fundamental CarMax management skills.
Laws and Regulations
Vehicle Dealer and Other Laws and Regulations.
We operate in a highly regulated industry. In every state in which we operate, we must obtain various licenses and permits in order to conduct business, including dealer, service, sales and finance licenses issued by state and certain local regulatory authorities. A wide range of federal, state and local laws and regulations govern the manner in which we conduct business, including advertising, sales, financing and employment practices. These laws include consumer protection laws, privacy laws and state franchise laws, as well as other laws and regulations applicable to new and used motor vehicle dealers. These laws also include federal and state wage-hour, anti-discrimination and other employment practices laws. Our financing activities with customers are subject to federal truth-in-lending, consumer leasing, equal credit opportunity and fair
10
credit reporting laws and regulations, as well as state and local motor vehicle finance, collection, repossession and installment finance laws.
Claims arising out of actual or alleged violations of law could be asserted against us by individuals or governmental authorities and could expose us to significant damages or other penalties, including revocation or suspension of the licenses necessary to conduct business and fines.
Environmental
Laws and Regulations
.
We are subject to a variety of federal, state and local laws and regulations that pertain to the environment. Our business involves the use, handling and disposal of hazardous materials and wastes, including motor oil, gasoline, solvents, lubricants, paints and other substances. We are subject to compliance with regulations concerning the operation of underground and aboveground gasoline storage tanks, gasoline dispensing equipment, above-ground oil tanks and automotive paint booths.
AVAILABILITY OF REPORTS AND OTHER INFORMATION
The following items are available free of charge through the “Corporate Governance” link on our investor information home page at investor.carmax.com, as soon as reasonably practicable after filing or furnishing the material to the Securities and Exchange Commission (the “SEC”): annual reports on Form 10-K, quarterly reports on Form 10-Q, current reports on Form 8-K, proxy statements on Schedule 14A, and any amendments to those reports. In addition, the following documents are also available free of charge on our website: Corporate Governance Guidelines, Code of Business Conduct, and the charters of the Audit Committee, Nominating and Governance Committee, and Compensation and Personnel Committee. We publish any changes to these documents on our website. We also promptly disclose reportable waivers of the Code of Business Conduct on our website. The contents of our website are not, however, part of this report.
Printed copies of these documents are also available to any shareholder, without charge, upon written request to our corporate secretary at the address set forth on the cover page of this report.
We are subject to a variety of risks, the most significant of which are described below. Our business, results of operations and financial condition could be materially and adversely affected by any of these risks or additional risks.
Economic Conditions.
In the normal course of business, we are subject to changes in general or regional U.S. economic conditions, including, but not limited to, consumer credit availability, consumer credit delinquency and loss rates, interest rates, gasoline prices, inflation, personal discretionary spending levels, unemployment levels and consumer sentiment about the economy in general. Any significant deterioration in economic conditions could adversely affect consumer demand and/or increase costs.
Capital.
Changes in the availability or cost of capital and working capital financing, including the long-term financing to support our geographic expansion and financing of auto loan receivables, could adversely affect growth and operating strategies. Further, our current credit facility and certain securitization and sale-leaseback agreements contain covenants and/or performance triggers. Any failure to comply with these covenants and/or performance triggers could have a material adverse effect on our business, results of operations and financial condition.
We use and have historically relied upon a securitization program to fund substantially all of the auto loan receivables originated by CAF. Initially, we sell these receivables into our warehouse facilities. We periodically refinance the receivables through term securitizations. Changes in the condition of the asset-backed securitization market have led, and could in the future lead, us to incur higher costs to access funds in this market or we could be required to seek alternative means to finance our loan originations. In the event that this market ceased to exist and there were no immediate alternative funding sources available, we might be forced to curtail our lending practices for some period of time. The impact of reducing or curtailing CAF’s loan originations could have a material adverse impact on our business, sales and results of operations.
Disruptions in the capital and credit markets could adversely affect our ability to draw on our revolving credit facility. If our ability to secure funds from the facility were significantly
11
impaired, our access to working capital would be impacted, our ability to maintain appropriate inventory levels could be affected and these conditions could have a material adverse effect on our business, sales, results of operations and financial condition.
Third-Party Financing Providers.
CarMax provides financing to qualified customers through CAF and a number of third-party financing providers. In the event that one or more of these third-party providers could no longer, or choose not to, provide financing to our customers, could only provide financing to a reduced segment of our customers or could no longer provide financing at competitive rates of interest, it could have a material impact on our business, sales and results of operations. Additionally, if we were unable to replace the current third-party providers upon the occurrence of one or more of the foregoing events, it could also have a material impact on our business, sales and results of operations.
Competition.
Automotive retailing and wholesaling is a highly competitive business. Our competition includes publicly and privately owned new and used car dealers, as well as millions of private individuals. Competitors buy and sell the same or similar makes of vehicles that we offer in the same or similar markets at competitive prices. Further, new entrants to the market could result in increased acquisition costs for used vehicles and lower-than-expected retail and wholesale sales and margins. Competition could be affected by the increasing use of the Internet to market, buy and sell used vehicles and provide vehicle financing. The increasing use of the Internet in the automotive retail and wholesale business could reduce our sales and adversely affect our results of operations. In addition, CAF and our third-party financing providers are subject to competition from various financial institutions.
Retail Prices.
Any significant changes in retail prices for used and new vehicles could reduce sales and profits. If any of our competitors seek to gain or retain market share by reducing prices for used or new vehicles, we would likely reduce our prices in order to remain competitive, which could result in a decrease in our sales and results of operations and require a change in our operating strategies.
Inventory.
A reduction in the availability of or access to sources of inventory could adversely affect our business. A failure to adjust appraisal offers to stay in line with broader market trade-in offer trends, or a failure to recognize those trends, could negatively impact the ability to acquire inventory. Should we develop excess inventory, the inability to liquidate the excess inventory at prices that allow us to meet margin targets or to recover our costs would adversely affect our results of operations.
Regulatory and Legislative Environment.
We are subject to a wide range of federal, state and local laws and regulations, such as licensing requirements and laws regarding advertising, vehicle sales, financing and employment practices. Our facilities and business operations are also subject to laws and regulations relating to environmental protection and health and safety. The violation of these laws or regulations could result in administrative, civil or criminal penalties or in a cease-and-desist order against business operations. As a result, we have incurred and will continue to incur capital and operating expenses and other costs to comply with these laws and regulations. Further, private plaintiffs and federal, state and local regulatory and law enforcement authorities have increased their scrutiny of advertising, sales, financing and insurance activities in the sale and leasing of motor vehicles. If, as a result, other automotive retailers adopt more transparent, consumer-oriented business practices, our differentiation versus those retailers could be reduced.
Recent federal legislative and regulatory initiatives and reforms may result in an increase in expenses or a decrease in revenues. For example, the Patient Protection and Affordable Care Act of 2010, as it is phased in over time, significantly affects the provision of health care services and may impact the cost of providing our associates with health coverage. In addition, the Dodd-Frank Wall Street Reform and Consumer Protection Act of 2010 regulates, among other things, the provision of consumer financing, and may adversely affect our results of operations.
Growth.
Our inability to acquire or lease suitable real estate at favorable terms could limit our expansion and could adversely affect our business and results of operations. The expansion of our store base places significant demands on our management team, our associates and our systems. If we fail to effectively or efficiently manage our growth, it could adversely affect our business, sales and results of operations.
Management and Workforce.
Our success depends upon the continued contributions of our store, region and corporate management teams. Consequently, the loss of the services of key employees could have a material adverse effect on our business. In addition, we strive to staff each newly opened store with an experienced management team. An inability to build our management bench strength to support store growth could have a material adverse effect on our business. Our ability to meet our staffing needs while controlling related costs is subject to numerous external and internal factors, including unemployment levels, prevailing wage rates, changes in employment legislation, competition for qualified employees in the industry and regions in which we operate, and associate relations. An inability to retain qualified associates or a significant increase in labor costs could have a material adverse effect on our business, sales and results of operations.
12
Information Systems.
Our business is dependent upon the efficient operation of our information systems. In particular, we rely on our information systems to effectively manage sales, inventory, carmax.com, consumer financing and customer information. The failure of these systems to perform as designed or the failure to maintain and continually enhance or protect the integrity of these systems could disrupt our business operations, impact sales and results of operations, expose us to customer or third-party claims or result in adverse publicity.
Accounting Policies and Matters.
We have identified several accounting policies as being “critical” to the fair presentation of our financial condition and results of operations because they involve major aspects of our business and require management to make judgments about matters that are inherently uncertain. Materially different amounts could be recorded under different conditions or using different assumptions.
Additionally, the Financial Accounting Standards Board has proposed various rule changes including, but not limited to, accounting for leases. The SEC is also currently considering adopting rules that would require U.S. issuers to prepare their financial statements contained in SEC filings in accordance with International Financial Reporting Standards (“IFRS”), as issued by the International Accounting Standards Board. The implementation of these or other new accounting requirements or changes to U.S. generally accepted accounting principles could adversely affect our reported results of operations and financial condition.
Confidential Customer Information.
In the normal course of business, we collect, process and retain sensitive and confidential customer information. Despite the security measures we have in place, our facilities and systems, and those of third-party service providers, could be vulnerable to security breaches, acts of vandalism, computer viruses, misplaced or lost data, programming or human errors or other similar events. Any security breach involving the misappropriation, loss or other unauthorized disclosure of confidential information, whether by us or by third-party service providers, could damage our reputation, expose us to the risks of litigation and liability, disrupt our business or otherwise affect our results of operations.
Litigation.
We are subject to various litigation matters, which could adversely affect our business. Claims arising out of actual or alleged violations of law could be asserted against us by individuals, either individually or through class actions, or by governmental entities in civil or criminal investigations and proceedings. These actions could expose us to adverse publicity and to substantial monetary damages and legal defense costs, injunctive relief and criminal and civil fines and penalties, including suspension or revocation of licenses to conduct business.
Automotive Manufacturers.
Adverse conditions affecting one or more automotive manufacturers could impact our results of operations. Manufacturer recalls could also have an adverse effect on used vehicle sales or valuations and could impact our results of operations.
Weather.
The occurrence of severe weather events, such as rain, snow, wind, storms, hurricanes or other natural disasters, could cause store closures, adversely affecting consumer traffic, and could adversely affect our results of operations.
Seasonal Fluctuations.
Our business is subject to seasonal fluctuations. We generally realize a higher proportion of revenue and operating profit during the first and second fiscal quarters. If conditions arise that impair vehicle sales during the first or second fiscal quarters, these conditions could have a disproportionately large adverse effect on our annual results of operations.
Geographic Concentration.
Our performance is subject to local economic, competitive and other conditions prevailing in geographic areas where we operate. Since a large number of our superstores are located in the Southeastern U.S. and in the Chicago, Los Angeles and Washington, D.C./Baltimore markets, our results of operations depend substantially on general economic conditions and consumer spending habits in these markets. In the event that any of these geographic areas experienced a downturn in economic conditions, it could adversely affect our business and results of operations.
Other Material Events.
The occurrence of certain material events including acts of terrorism, the outbreak of war or other significant national or international events could adversely affect our business, results of operations or financial condition.
13
None.
We conduct our used vehicle operations in two basic retail formats – production and non-production superstores. Production superstores are those locations at which vehicle reconditioning is performed. In determining whether to construct a production or a non-production superstore on a given site, we take several factors into account, including the anticipated long-term reconditioning needs and the available acreage of the sites in that market. As a result, some superstores that are constructed to accommodate reconditioning activities may initially be operated as non-production superstores until we expand our presence in that market. As of February 28, 2011, we operated 61 production superstores and 42 non-production superstores. At that date, we also operated one new car store, which was located adjacent to our used car superstore in Laurel, Maryland. Our remaining four new car franchises are operated as part of our used car superstores.
Production superstores are generally 40,000 to 60,000 square feet on 10 to 25 acres, but a few range from approximately 70,000 to 95,000 square feet on 20 to 35 acres. Non-production superstores are generally 10,000 to 25,000 square feet on 4 to 12 acres.
Used Car Superstores as of February 28, 2011
|
Total
|
|
|
Alabama
|
2
|
|
Arizona
|
3
|
|
California
|
13
|
|
Colorado
|
1
|
|
Connecticut
|
2
|
|
Florida
|
10
|
|
Georgia
|
6
|
|
Illinois
|
6
|
|
Indiana
|
2
|
|
Kansas
|
2
|
|
Kentucky
|
1
|
|
Maryland
|
4
|
|
Mississippi
|
1
|
|
Missouri
|
1
|
|
Nebraska
|
1
|
|
Nevada
|
2
|
|
New Mexico
|
1
|
|
North Carolina
|
8
|
|
Ohio
|
4
|
|
Oklahoma
|
2
|
|
South Carolina
|
3
|
|
Tennessee
|
4
|
|
Texas
|
12
|
|
Utah
|
1
|
|
Virginia
|
8
|
|
Wisconsin
|
3
|
|
Total
|
103
|
We have financed the majority of our stores through sale-leaseback transactions. As of February 28, 2011, we leased 57 of our 103 used car superstores as well as our CAF office building in Atlanta, Georgia. We owned the remaining 46 stores currently in operation. We also owned our home office building in Richmond, Virginia, and land associated with planned future store openings.
14
Expansion
Since opening our first used car superstore in 1993, we have grown organically, through the construction and opening of company-operated stores. We do not franchise our operations. As of February 28, 2011, we operated 103 used car superstores in 49 U.S. markets, which represented approximately 48% of the U.S. population. We believe that further geographic expansion and additional fill-in opportunities in existing markets will provide a foundation for future sales and earnings growth.
In December 2008, as a result of the weak economic and sales environment, we temporarily suspended store growth. We resumed growth in fiscal 2011, opening three superstores that had been constructed in fiscal 2009, but which we chose not to open until market conditions improved. We expect to open five superstores in fiscal 2012 and between eight and ten superstores in fiscal 2013.
For additional details on our future expansion plans, see “
Fiscal 2012 Planned Superstore Openings
,” included in Part II, Item 7, of this Form 10-K.
On April 2, 2008, Mr. John Fowler filed a putative class action lawsuit against CarMax Auto Superstores California, LLC and CarMax Auto Superstores West Coast, Inc. in the Superior Court of California, County of Los Angeles. Subsequently, two other lawsuits, Leena Areso et al. v. CarMax Auto Superstores California, LLC and Justin Weaver v. CarMax Auto Superstores California, LLC, were consolidated as part of the Fowler case. The allegations in the consolidated case involved: (1) failure to provide meal and rest breaks or compensation in lieu thereof; (2) failure to pay wages of terminated or resigned employees related to meal and rest breaks and overtime; (3) failure to pay overtime; (4) failure to comply with itemized employee wage statement provisions; and (5) unfair competition. The putative class consisted of sales consultants, sales managers, and other hourly employees who worked for the company in California from April 2, 2004, to the present. On May 12, 2009, the court dismissed all of the class claims with respect to the sales manager putative class. On June 16, 2009, the court dismissed all claims related to the failure to comply with the itemized employee wage statement provisions. The court also granted CarMax's motion for summary adjudication with regard to CarMax's alleged failure to pay overtime to the sales consultant putative class. The plaintiffs have appealed the court's ruling regarding the sales consultant overtime claim. In addition to the plaintiffs' appeal of the overtime claim, the claims currently remaining in the lawsuit regarding the sales consultant putative class are: (1) failure to provide meal and rest breaks or compensation in lieu thereof; (2) failure to pay wages of terminated or resigned employees related to meal and rest breaks; and (3) unfair competition. On June 16, 2009, the court entered a stay of these claims pending the outcome of a California Supreme Court case involving unrelated third parties but related legal issues. The Fowler lawsuit seeks compensatory and special damages, wages, interest, civil and statutory penalties, restitution, injunctive relief and the recovery of attorneys’ fees. We are unable to make a reasonable estimate of the amount or range of loss that could result from an unfavorable outcome in these matters.
We are involved in various other legal proceedings in the normal course of business. Based upon our evaluation of information currently available, we believe that the ultimate resolution of any such proceedings will not have a material adverse effect, either individually or in the aggregate, on our financial condition or results of operations.
15
Our common stock is listed and traded on the New York Stock Exchange under the ticker symbol KMX. We are authorized to issue up to 350,000,000 shares of common stock and up to 20,000,000 shares of preferred stock. As of February 28, 2011, there were 225,885,693 shares of CarMax common stock outstanding and there were approximately 6,900 shareholders of record. As of that date, there were no preferred shares outstanding.
The following table presents the quarterly high and low sales prices per share for our common stock for each quarter during the last two fiscal years, as reported on the New York Stock Exchange composite tape.
|
1st
|
2nd
|
3rd
|
4th
|
|||||||||||||
|
Quarter
|
Quarter
|
Quarter
|
Quarter
|
|||||||||||||
|
Fiscal 2011
|
||||||||||||||||
|
High
|
$ | 26.50 | $ | 22.55 | $ | 34.37 | $ | 37.02 | ||||||||
|
Low
|
$ | 20.30 | $ | 18.62 | $ | 20.24 | $ | 31.10 | ||||||||
|
Fiscal 2010
|
||||||||||||||||
|
High
|
$ | 14.00 | $ | 17.60 | $ | 23.07 | $ | 24.75 | ||||||||
|
Low
|
$ | 8.40 | $ | 11.31 | $ | 16.64 | $ | 19.60 | ||||||||
To date, we have not paid a cash dividend on CarMax common stock. We believe it is prudent to retain our net earnings for use in operations and for geographic expansion, as well as to maintain maximum financial flexibility and liquidity for our business. Therefore, we do not anticipate paying any cash dividends in the foreseeable future.
During the fourth quarter of fiscal 2011, we sold no CarMax equity securities that were not registered under the Securities Act of 1933, as amended. In addition, we did not repurchase any CarMax equity securities during this period.
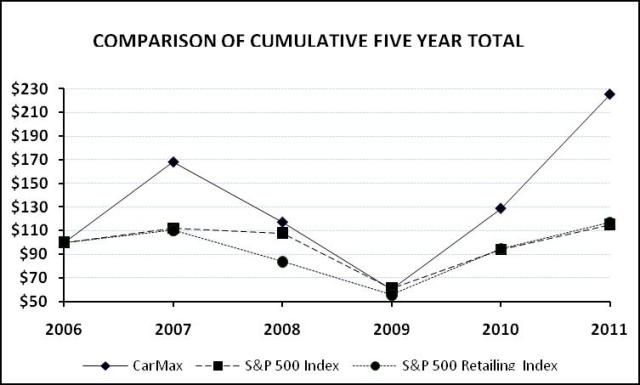
PERFORMANCE GRAPH
The following graph compares the cumulative total shareholder return (stock price appreciation plus dividends, as applicable) on our common stock for the last five fiscal years with the cumulative total return of the S&P 500 Index and the S&P 500 Retailing Index. The graph assumes an original investment of $100 in CarMax common stock and in each index on February 28, 2006, and the reinvestment of all dividends, as applicable.
16
|
As of February 28
|
||||||||||||||||||||||||
|
2006
|
2007
|
2008
|
2009
|
2010
|
2011
|
|||||||||||||||||||
|
CarMax
|
$ | 100.00 | $ | 167.73 | $ | 116.87 | $ | 60.03 | $ | 128.52 | $ | 225.14 | ||||||||||||
|
S&P 500 Index
|
$ | 100.00 | $ | 111.97 | $ | 107.94 | $ | 61.18 | $ | 93.98 | $ | 115.20 | ||||||||||||
|
S&P 500 Retailing Index
|
$ | 100.00 | $ | 110.21 | $ | 83.68 | $ | 55.70 | $ | 94.79 | $ | 116.85 | ||||||||||||
17
|
FY11
(1)
|
FY10
|
FY09
|
FY08
|
FY07
|
FY06
|
|||||||||||||||||||
|
Income statement information
(In millions)
|
||||||||||||||||||||||||
|
Used vehicle sales
|
$ | 7,210.0 | $ | 6,192.3 | $ | 5,690.7 | $ | 6,589.3 | $ | 5,872.8 | $ | 4,771.3 | ||||||||||||
|
New vehicle sales
|
198.5 | 186.5 | 261.9 | 370.6 | 445.1 | 502.8 | ||||||||||||||||||
|
Wholesale vehicle sales
|
1,301.7 | 844.9 | 779.8 | 985.0 | 918.4 | 778.3 | ||||||||||||||||||
|
Other sales and revenues
|
265.3 | 246.6 | 241.6 | 254.6 | 229.3 | 207.6 | ||||||||||||||||||
|
Net sales and operating revenues
|
8,975.6 | 7,470.2 | 6,974.0 | 8,199.6 | 7,465.7 | 6,260.0 | ||||||||||||||||||
|
Gross profit
|
1,301.2 | 1,098.9 | 968.2 | 1,072.4 | 971.1 | 790.7 | ||||||||||||||||||
|
CarMax Auto Finance income
|
220.0 | 175.2 | 15.3 | 85.9 | 132.6 | 104.3 | ||||||||||||||||||
|
SG&A
|
905.1 | 818.7 | 882.4 | 858.4 | 776.2 | 674.4 | ||||||||||||||||||
|
Earnings before income taxes
|
613.5 | 452.5 | 96.8 | 297.1 | 323.3 | 217.6 | ||||||||||||||||||
|
Income tax provision
|
232.6 | 170.8 | 37.6 | 115.0 | 124.8 | 83.4 | ||||||||||||||||||
|
Net earnings
|
380.9 | 281.7 | 59.2 | 182.0 | 198.6 | 134.2 | ||||||||||||||||||
|
Share and per share information
|
||||||||||||||||||||||||
|
(Shares in millions)
|
||||||||||||||||||||||||
|
Weighted average shares outstanding:
|
||||||||||||||||||||||||
|
Basic
|
223.4 | 219.5 | 217.5 | 216.0 | 212.5 | 209.3 | ||||||||||||||||||
|
Diluted
|
227.6 | 222.2 | 219.4 | 220.0 | 216.6 | 212.8 | ||||||||||||||||||
|
Net earnings per share:
|
||||||||||||||||||||||||
|
Basic
|
$ | 1.70 | $ | 1.27 | $ | 0.27 | $ | 0.84 | $ | 0.93 | $ | 0.64 | ||||||||||||
|
Diluted
|
$ | 1.67 | $ | 1.26 | $ | 0.27 | $ | 0.82 | $ | 0.91 | $ | 0.63 | ||||||||||||
|
Balance sheet information
(In millions)
|
||||||||||||||||||||||||
|
Total current assets
|
$ | 1,410.1 | $ | 1,556.4 | $ | 1,287.8 | $ | 1,356.9 | $ | 1,150.5 | $ | 941.7 | ||||||||||||
|
Auto loan receivables, net
|
4,320.6 | ― | ― | ― | ― | ― | ||||||||||||||||||
|
Total assets
|
6,839.9 | 2,556.2 | 2,379.2 | 2,333.2 | 1,885.6 | 1,509.6 | ||||||||||||||||||
|
Total current liabilities
|
508.2 | 477.4 | 490.8 | 490.0 | 512.0 | 344.9 | ||||||||||||||||||
|
Short-term debt
|
1.0 | 0.9 | 0.9 | 21.0 | 3.3 | 0.5 | ||||||||||||||||||
|
Current portion of long-term debt
|
0.8 | 122.3 | 158.1 | 79.7 | 148.4 | 59.8 | ||||||||||||||||||
|
Current portion of non-recourse notes payable
|
132.5 | ― | ― | ― | ― | ― | ||||||||||||||||||
|
Long-term debt, excluding current portion
|
28.4 | 27.4 | 178.1 | 227.2 | 33.7 | 134.8 | ||||||||||||||||||
|
Non-recourse notes payable, excluding
|
||||||||||||||||||||||||
|
current portion
|
3,881.1 | ― | ― | ― | ― | ― | ||||||||||||||||||
|
Total shareholders’ equity
|
2,291.6 | 1,933.6 | 1,593.1 | 1,488.9 | 1,247.4 | 980.1 | ||||||||||||||||||
|
Unit sales information
|
||||||||||||||||||||||||
|
Used vehicle units sold
|
396,181 | 357,129 | 345,465 | 377,244 | 337,021 | 289,888 | ||||||||||||||||||
|
New vehicle units sold
|
8,231 | 7,851 | 11,084 | 15,485 | 18,563 | 20,901 | ||||||||||||||||||
|
Wholesale vehicle units sold
|
263,061 | 197,382 | 194,081 | 222,406 | 208,959 | 179,548 | ||||||||||||||||||
|
Percent changes in
|
||||||||||||||||||||||||
|
Comparable store used vehicle unit sales
|
10 | 1 | (16 | ) | 3 | 9 | 4 | |||||||||||||||||
|
Total used vehicle unit sales
|
11 | 3 | (8 | ) | 12 | 16 | 15 | |||||||||||||||||
|
Total net sales and operating revenues
|
20 | 7 | (15 | ) | 10 | 19 | 19 | |||||||||||||||||
|
Net earnings
|
35 | 376 | (67 | ) | (8 | ) | 48 | 32 | ||||||||||||||||
|
Diluted net earnings per share
|
33 | 367 | (67 | ) | (10 | ) | 46 | 31 | ||||||||||||||||
|
Other year-end information
|
||||||||||||||||||||||||
|
Used car superstores
|
103 | 100 | 100 | 89 | 77 | 67 | ||||||||||||||||||
|
Associates
|
15,565 | 13,439 | 13,035 | 15,637 | 13,736 | 11,712 | ||||||||||||||||||
|
(1)
|
As discussed in Note 2(E), fiscal 2011 reflects the adoption of ASU Nos. 2009-16 and 2009-17 effective March 1, 2010.
|
18
The following Management’s Discussion and Analysis of Financial Condition and Results of Operations (“MD&A”) is provided as a supplement to, and should be read in conjunction with, our audited consolidated financial statements and the accompanying notes presented in Item 8, Consolidated Financial Statements and Supplementary Data. Note references are to the notes to consolidated financial statements included in Item 8. Certain prior year amounts have been reclassified to conform to the current year’s presentation. All references to net earnings per share are to diluted net earnings per share. Amounts and percentages may not total due to rounding.
As of March 1, 2010, we adopted new accounting rules related to securitizations that affected the timing of the recognition of CarMax Auto Finance (“CAF”) income and resulted in the consolidation of the auto loan receivables and related non-recourse notes payable that previously were reflected as off-balance sheet items. The new rules were adopted on a prospective basis and prior year balances have not been restated. See Notes 2(E), 3, 4 and 5 for additional information.
BUSINESS OVERVIEW
General
CarMax is the nation’s largest retailer of used vehicles. We pioneered the used car superstore concept, opening our first store in 1993. Our strategy is to revolutionize the auto retailing market by addressing the major sources of customer dissatisfaction with traditional auto retailers and to maximize operating efficiencies through the use of standardized operating procedures and store formats enhanced by sophisticated, proprietary management information systems. As of February 28, 2011, we operated 103 used car superstores in 49 markets, comprised of 37 mid-sized markets, 11 large markets and 1 small market. We define mid-sized markets as those with television viewing populations generally between 600,000 and 2.5 million people. We also operated five new car franchises. In fiscal 2011, we sold 396,181 used cars, representing 98% of the total 404,412 vehicles we sold at retail.
We believe the CarMax consumer offer is distinctive within the auto retailing marketplace. Our offer provides customers the opportunity to shop for vehicles the same way they shop for items at other big box retailers. Our consumer offer is structured around our four customer benefits: low, no-haggle prices; a broad selection; high quality vehicles; and a customer-friendly sales process. Our website, carmax.com, is a valuable tool for communicating the CarMax consumer offer, a sophisticated search engine and an efficient channel for customers who prefer to conduct their shopping online. We generate revenues, income and cash flows primarily by retailing used vehicles and associated items including vehicle financing, extended service plans (“ESP”), a guaranteed asset protection (“GAP”) product and vehicle repair service. GAP is designed to cover the unpaid balance on an auto loan in the event of a total loss of the vehicle or unrecovered theft.
We also generate revenues, income and cash flows from the sale of vehicles purchased through our appraisal process that do not meet our retail standards. These vehicles are sold through on-site wholesale auctions. Wholesale auctions are generally held on a weekly or bi-weekly basis, and as of February 28, 2011, we conducted auctions at 51 used car superstores. During fiscal 2011, we sold 263,061 wholesale vehicles. On average, the vehicles we wholesale are approximately 10 years old and have more than 100,000 miles. Participation in our wholesale auctions is restricted to licensed automobile dealers, the majority of whom are independent dealers and licensed wholesalers.
CarMax provides financing to qualified retail customers through CAF, our finance operation, and our arrangements with several industry-leading financial institutions. As of February 28, 2011, these third parties included Capital One Auto Finance, Santander Consumer USA and Wells Fargo Dealer Services. The third-party providers who purchase subprime financings generally purchase these loans at a discount, and we collect fixed, prenegotiated fees per vehicle financed from the majority of the other providers. We have tested, and will continue to test, other third-party financing providers. We have no recourse liability on retail installment contracts arranged with third-party providers.
We offer financing through CAF to qualified customers purchasing vehicles at CarMax. CAF utilizes proprietary customized scoring models based upon the credit history of the customer along with CAF’s historical experience to predict the likelihood of customer repayment. We offer customers an array of competitive rates and terms, allowing them to choose the one that best fits their needs. We randomly test different credit offers and closely monitor acceptance rates and 3-day payoffs to assess market competitiveness. After the effect of estimated 3-day payoffs and vehicle returns, CAF financed approximately 30% of our retail vehicle unit sales in fiscal 2011. As of February 28, 2011, CAF serviced more than 380,000 customers in its $4.33 billion portfolio.
19
We sell ESPs and GAP on behalf of unrelated third parties who are the primary obligors. As of February 28, 2011, the used vehicle third-party ESP providers were CNA National Warranty Corporation and The Warranty Group, and the third-party GAP provider was Safe-Guard Products International, LLC. We have no contractual liability to the customer under these third-party plans. ESP revenue represents commissions received on the sale of ESPs and GAP from the unrelated third parties.
Over the long term, we believe the primary drivers for earnings growth will be vehicle unit sales growth, from both new stores and stores included in our comparable store base, as well as improvements in margins resulting from operational efficiencies. We target a dollar range of gross profit per used unit sold. The gross profit dollar target for an individual vehicle is based on a variety of factors, including its probability of sale and its mileage relative to its age; however, it is not primarily based on the vehicle’s selling price.
As a result of the weak economic and sales environment, in December 2008, we temporarily suspended store growth. This suspension reduced our capital needs and growth-related costs. Based on improvements in our sales and profitability in fiscal 2010, as well as increased stability in the credit markets, we resumed store growth in fiscal 2011, opening three superstores. We plan to open five superstores in fiscal 2012 and between eight and ten superstores in fiscal 2013. We are in the process of the national rollout of our retail concept, and as of February 28, 2011, we had used car superstores located in markets that comprised approximately 48% of the U.S. population.
The principal challenges we face in expanding our store base include our ability to build our management bench strength to support our store growth and our ability to procure suitable real estate at favorable terms. We strive to staff each newly opened store with an experienced management team. Therefore, we must recruit, train and develop managers and associates to fill the pipeline necessary to support future store openings.
Fiscal 2011 Highlights
|
·
|
Net sales and operating revenues increased 20% to $8.98 billion from $7.47 billion in fiscal 2010, while net earnings increased 35% to $380.9 million, or $1.67 per share, from $281.7 million, or $1.26 per share.
|
|
·
|
Total used vehicle revenues increased 16% to $7.21 billion versus $6.19 billion in fiscal 2010. Total used vehicle unit sales rose 11%, reflecting the combination of a 10% increase in comparable store used unit sales and sales from newer stores not yet included in the comparable store base. The average used vehicle selling price climbed 5%, primarily reflecting increases in our acquisition costs, which were affected by a year-over-year increase in used vehicle wholesale values.
|
|
·
|
Total wholesale vehicle revenues increased 54% to $1.30 billion versus $844.9 million in fiscal 2010, reflecting the combination of a 33% increase in wholesale unit sales and a 16% rise in the average wholesale vehicle selling price. Wholesale unit sales benefited from increases in both appraisal traffic and a higher appraisal buy rate.
|
|
·
|
Total gross profit increased 18% to $1.30 billion compared with $1.10 billion in fiscal 2010, primarily reflecting the increases in used and wholesale unit sales. Gross profit also benefited from a 7% improvement in total gross profit retail per unit, which climbed $207 to $3,218 per unit from $3,011 per unit in fiscal 2010. Several factors contributed to the strength of our gross profit per unit, including our ongoing initiative to reduce waste in the vehicle reconditioning process; the support provided by the strong wholesale market valuations and a modest increase in the percentage of used vehicles sourced directly from consumers via our appraisal process.
|
|
·
|
CAF income was $220.0 million compared with $175.2 million in fiscal 2010. In fiscal 2011, CAF income reflected the historically high spreads between interest rates charged to consumers and CAF’s funding costs. In the first quarter of fiscal 2011, net charge-offs were significantly lower than our original projections. As a result, we reduced our estimate of future loan losses on our existing portfolio of managed receivables. The favorability in net charge-offs and the resulting adjustment to the allowance for loan losses positively affected net income by approximately $0.03 per share versus our expectations. In fiscal 2010, CAF income was increased by adjustments totaling $26.7 million, or $0.07 per share, related to loans originated in previous years.
|
|
·
|
Selling, general and administrative (“SG&A”) expenses increased 11% to $905.1 million from $818.7 million in fiscal 2010. The increase primarily reflected increases in sales commissions and other variable costs associated with the growth in unit sales and higher advertising expense, as well as costs associated with our resumption of store growth. In addition, fiscal 2010 SG&A expenses included the benefit of a favorable litigation settlement, which increased earnings by $0.02 per share. SG&A expenses as a percent of net sales and operating revenues (the “SG&A ratio”), fell to 10.1% from 11.0% in fiscal 2010 due to the leverage associated with the increases in unit sales and average selling prices.
|
20
|
·
|
In fiscal 2011, $17.2 million of cash was used in operating activities, while in fiscal 2010, $50.3 million of cash was provided by operating activities. In fiscal 2011, a $304.7 million increase in auto loan receivables more than offset the net cash generated by all other operating activities, resulting in the net use of cash. As discussed in Note 2(E), auto loan receivables and the related cash flows were not reported in the consolidated financial statements prior to fiscal 2011. The increase in auto loan receivables primarily reflected the amount by which CAF net loan originations exceeded loan repayments during the year. CAF auto loan receivables are funded through securitization transactions. As a result, the majority of the increases in auto loan receivables are accompanied by increases in non-recourse notes payable, which are reflected as cash provided by financing activities and not included in cash provided by operations.
|
CRITICAL ACCOUNTING POLICIES
Our results of operations and financial condition as reflected in the consolidated financial statements have been prepared in accordance with U.S. generally accepted accounting principles. Preparation of financial statements requires management to make estimates and assumptions affecting the reported amounts of assets, liabilities, revenues, expenses and the disclosures of contingent assets and liabilities. We use our historical experience and other relevant factors when developing our estimates and assumptions. We continually evaluate these estimates and assumptions. Note 2 includes a discussion of significant accounting policies. The accounting policies discussed below are the ones we consider critical to an understanding of our consolidated financial statements because their application places the most significant demands on our judgment. Our financial results might have been different if different assumptions had been used or other conditions had prevailed.
Financing and Securitization Transactions
We maintain a revolving securitization program comprised of two warehouse facilities (“warehouse facilities”) to fund substantially all of the auto loan receivables originated by CAF until they can be funded through a term securitization or alternative funding arrangement. As of March 1, 2010, we adopted Accounting Standards Update (“ASU”) Nos. 2009-16 and 2009-17 on a prospective basis. Pursuant to these pronouncements, we now recognize all transfers of auto loan receivables into either our warehouse facilities or term securitizations as secured borrowings, which results in recording the auto loan receivables and the related non-recourse notes payable on our consolidated balance sheets. Also pursuant to these pronouncements, beginning in fiscal 2011, CAF income included in the consolidated statements of earnings no longer includes a gain on the sale of loans through securitization transactions, but instead primarily reflects the interest and fee income associated with the auto loan receivables less the interest expense associated with the non-recourse notes payable issued to fund these receivables, direct CAF expenses and a provision for estimated loan losses.
Auto loan receivables include amounts due from customers primarily related to used retail vehicle sales financed through CAF and are presented net of an allowance for estimated loan losses. The allowance for loan losses represents an estimate of the amount of net losses inherent in the portfolio as of the applicable reporting date and anticipated to occur during the following 12 months. The allowance is primarily based on the credit quality of the underlying receivables, historical loss trends and forecasted forward loss curves. We also take into account recent trends in delinquencies and losses, recovery rates and the underlying economic environment. The provision for loan losses is the periodic cost of maintaining an adequate allowance.
See Notes 2(E), 2(H), 4 and 5 for additional information on auto loan receivables and securitizations.
Revenue Recognition
We recognize revenue when the earnings process is complete, generally either at the time of sale to a customer or upon delivery to a customer. We recognize used vehicle revenue when a sales contract has been executed and the vehicle has been delivered, net of a reserve for returns under our 5-day, money-back guarantee. A reserve for vehicle returns is recorded based on historical experience and trends, and results could be affected if future vehicle returns differ from historical averages.
We also sell ESPs and GAP on behalf of unrelated third parties to customers who purchase a vehicle. Because we are not the primary obligor under these plans, we recognize commission revenue at the time of sale, net of a reserve for returns. The reserve for cancellations is recorded based on historical experience and trends, and results could be affected if future cancellations differ from historical averages.
21
Income Taxes
Estimates and judgments are used in the calculation of certain tax liabilities and in the determination of the recoverability of certain deferred tax assets. In the ordinary course of business, transactions occur for which the ultimate tax outcome is uncertain at the time of the transactions. We adjust our income tax provision in the period in which we determine that it is probable that our actual results will differ from our estimates. Tax law and rate changes are reflected in the income tax provision in the period in which such changes are enacted. See Note 9 for additional information on income taxes.
We evaluate the need to record valuation allowances that would reduce deferred tax assets to the amount that will more likely than not be realized. When assessing the need for valuation allowances, we consider available carrybacks, future reversals of existing temporary differences and future taxable income. Except for a valuation allowance recorded for capital loss carryforwards that may not be utilized before their expiration, we believe that our recorded deferred tax assets as of February 28, 2011, will more likely than not be realized. However, if a change in circumstances results in a change in our ability to realize our deferred tax assets, our tax provision would be affected in the period when the change in circumstances occurs.
In addition, the calculation of our tax liabilities involves dealing with uncertainties in the application of complex tax regulations. We recognize potential liabilities for anticipated tax audit issues in the U.S. and other tax jurisdictions based on our estimate of whether, and the extent to which, additional taxes will be due. If payments of these amounts ultimately prove to be unnecessary, the reversal of the liabilities would result in tax benefits being recognized in the period when we determine the liabilities are no longer necessary. If our estimate of tax liabilities proves to be less than the ultimate assessment, a further charge to expense would result in the period of determination.
RESULTS OF OPERATIONS
Net Sales and Operating Revenues
|
Years Ended February 28
|
||||||||||||||||||||||||
|
(In millions)
|
2011
|
%
|
2010
|
%
|
2009
|
%
|
||||||||||||||||||
|
Used vehicle sales
|
$ | 7,210.0 | 80.3 | $ | 6,192.3 | 82.9 | $ | 5,690.7 | 81.6 | |||||||||||||||
|
New vehicle sales
|
198.5 | 2.2 | 186.5 | 2.5 | 261.9 | 3.8 | ||||||||||||||||||
|
Wholesale vehicle sales
|
1,301.7 | 14.5 | 844.9 | 11.3 | 779.8 | 11.2 | ||||||||||||||||||
|
Other sales and revenues:
|
||||||||||||||||||||||||
|
Extended service plan revenues
|
173.8 | 1.9 | 144.5 | 1.9 | 125.2 | 1.8 | ||||||||||||||||||
|
Service department sales
|
100.6 | 1.1 | 101.1 | 1.4 | 101.2 | 1.5 | ||||||||||||||||||
|
Third-party finance fees, net
|
(9.1 | ) | (0.1 | ) | 0.9 | ― | 15.3 | 0.2 | ||||||||||||||||
|
Total other sales and revenues
|
265.3 | 3.0 | 246.6 | 3.3 | 241.6 | 3.5 | ||||||||||||||||||
|
Total net sales and operating revenues
|
$ | 8,975.6 | 100.0 | $ | 7,470.2 | 100.0 | $ | 6,974.0 | 100.0 | |||||||||||||||
Unit Sales
|
Years Ended February 28
|
||||||||||||
|
2011
|
2010
|
2009
|
||||||||||
|
Used vehicles
|
396,181 | 357,129 | 345,465 | |||||||||
|
New vehicles
|
8,231 | 7,851 | 11,084 | |||||||||
|
Wholesale vehicles
|
263,061 | 197,382 | 194,081 | |||||||||
Average Selling Prices
|
Years Ended February 28
|
||||||||||||
|
2011
|
2010
|
2009
|
||||||||||
|
Used vehicles
|
$ | 18,019 | $ | 17,152 | $ | 16,291 | ||||||
|
New vehicles
|
$ | 23,989 | $ | 23,617 | $ | 23,490 | ||||||
|
Wholesale vehicles
|
$ | 4,816 | $ | 4,155 | $ | 3,902 | ||||||
22
Retail Vehicle Sales Changes
|
Years Ended February 28
|
||||||||||||
|
2011
|
2010
|
2009
|
||||||||||
|
Vehicle units:
|
||||||||||||
|
Used vehicles
|
11 | % | 3 | % | (8 | )% | ||||||
|
New vehicles
|
5 | % | (29 | )% | (28 | )% | ||||||
|
Total
|
11 | % | 2 | % | (9 | )% | ||||||
|
Vehicle dollars:
|
||||||||||||
|
Used vehicles
|
16 | % | 9 | % | (14 | )% | ||||||
|
New vehicles
|
6 | % | (29 | )% | (29 | )% | ||||||
|
Total
|
16 | % | 7 | % | (14 | )% | ||||||
Comparable store used unit sales growth is one of the key drivers of our profitability. A store is included in comparable store retail sales in the store’s fourteenth full month of operation.
Comparable Store Retail Vehicle Sales Changes
|
Years Ended February 28
|
||||||||||||
|
2011
|
2010
|
2009
|
||||||||||
|
Vehicle units:
|
||||||||||||
|
Used vehicles
|
10 | % | 1 | % | (16 | )% | ||||||
|
New vehicles
|
5 | % | (29 | )% | (25 | )% | ||||||
|
Total
|
10 | % | 0 | % | (17 | )% | ||||||
|
Vehicle dollars:
|
||||||||||||
|
Used vehicles
|
15 | % | 6 | % | (21 | )% | ||||||
|
New vehicles
|
7 | % | (29 | )% | (26 | )% | ||||||
|
Total
|
15 | % | 5 | % | (21 | )% | ||||||
Change in Used Car Superstore Base
|
Years Ended February 28
|
||||||||||||
|
2011
|
2010
|
2009
|
||||||||||
|
Used car superstores, beginning of year
|
100 | 100 | 89 | |||||||||
|
Superstore openings
|
3 | ― | 11 | |||||||||
|
Used car superstores, end of year
|
103 | 100 | 100 | |||||||||
|
Openings as a percent of the beginning-of-year store base
|
3 | % | ― | % | 12 | % | ||||||
Used Vehicle Sales
Fiscal 2011 Versus Fiscal 2010.
The 16% increase in used vehicle revenues in fiscal 2011 resulted from an 11% increase in unit sales and a 5% increase in average retail selling price. The 11% unit sales growth reflected a 10% increase in comparable store used unit sales combined with sales from newer superstores not yet included in the comparable store base. The increase in comparable store unit sales primarily reflected the benefit of the continuing gradual rebound in customer traffic, as well as an increase in the sales conversion rate. We believe the sales conversion rate benefited from increased customer access to credit.
The increase in the average retail selling price primarily reflected increases in our vehicle acquisition costs resulting from appreciation in wholesale industry used vehicle values. Used vehicle valuations remained strong during fiscal 2011, as the overall supply of used vehicles being remarketed continued to be somewhat constrained. Compared with pre-recession periods, declines in new vehicle sales and related used vehicle trade-ins, vehicle leasing activity and fleet sales contributed to a reduction in the supply of used vehicles being remarketed.
Our data indicated that we increased our share of the late-model used vehicle market by approximately 7% in fiscal 2011. We believe our ability to grow market share year after year is a testament to the strength of our consumer offer, the skill of our associates and the preference for our brand.
23
Fiscal 2010 Versus Fiscal 2009.
The 9% increase in used vehicle revenues in fiscal 2010 resulted from a 5% increase in average retail selling price and a 3% increase in unit sales. The increase in the average retail selling price primarily reflected the effect of higher used vehicle wholesale valuations on our vehicle acquisition costs. After falling sharply in fiscal 2009, wholesale vehicle values climbed during much of fiscal 2010, which we believe in part reflected tight supply conditions that occurred as vehicle trade-in activity slowed in tandem with the decline in new car industry sales.
The 3% unit sales growth reflected a 1% increase in comparable store used unit sales and sales from newer superstores not yet included in the comparable store base. We experienced a significant improvement in sales execution in fiscal 2010; however, the resulting increase in sales conversion rate was almost fully offset by a decline in customer traffic. The improvement in sales conversion occurred despite the tightening of lending standards by our third-party financing providers and CAF in fiscal 2010, which we estimate adversely affected our comparable store used unit sales growth by several percentage points. Continuing weak economic conditions caused our customer traffic to remain below the prior year level, despite the fact that the government’s Consumer Assistance to Recycle and Save Act (“CARS” or “cash for clunkers”) new car incentive program generated a spike in traffic in late July and August 2009. Similar to our experience with previous successful, broad-based new car incentive programs, we believe this program had a beneficial effect on our used car customer traffic and sales.
Our data indicated that we increased our share of the late-model used vehicle market by more than 10% in fiscal 2010, while the overall market contracted.
New Vehicle Sales
As of February 28, 2011, we had a total of five new car franchises representing the Chrysler, Nissan and Toyota brands. In June 2009, we were notified by General Motors that our Chevrolet franchise in Kenosha, Wisconsin, would be terminated. During the third quarter of fiscal 2011, we stopped selling new General Motors vehicles at this site, where we also have a used car superstore and a Toyota franchise. This franchise termination did not have a material effect on sales or earnings.
Fiscal 2011 Versus Fiscal 2010.
New vehicle revenues increased 6% in fiscal 2011 due to a 5% rise in unit sales and a 2% increase in average retail selling price. The growth in our unit sales was achieved against a backdrop of improving new vehicle industry sales. Based on industry data, new light vehicle industry sales increased 13% to 11.9 million units from 10.5 million units in fiscal 2010; although, they remained significantly below the 16 million to 17 million unit range routinely achieved between 2000 and 2007. The wind down of our Chevrolet franchise, which was one of many franchises terminated by General Motors, partially offset the growth in our new vehicle unit sales.
Fiscal 2010 Versus Fiscal 2009.
New vehicle revenues declined 29% in fiscal 2010. The decrease was entirely the result of a corresponding decline in unit sales, which primarily reflected the extremely soft new car industry sales trends for the brands we represent. Based on industry data, new light vehicle industry sales declined 15% to 10.5 million units from 12.3 million units in fiscal 2009. A reduction in sales volumes at our Chevrolet franchise following General Motors’ termination announcement also contributed to the decline in new vehicle unit sales. While new vehicle sales volumes in the second quarter of fiscal 2010 benefitted from the cash for clunkers program, we believe the effect on the full year was less material, as this program primarily shifted new vehicle demand into the second fiscal quarter from the first and third quarters.
Wholesale Vehicle Sales
Our operating strategy is to build customer satisfaction by offering high-quality vehicles. Fewer than half of the vehicles acquired from consumers through the appraisal purchase process meet our standards for reconditioning and subsequent retail sale. Those vehicles that do not meet our standards are sold through on-site wholesale auctions. Our wholesale auction prices usually reflect the trends in the general wholesale market for the types of vehicles we sell, although they can also be affected by changes in vehicle mix or the average age, mileage or condition of the vehicles wholesaled.
Fiscal 2011 Versus Fiscal 2010.
The 54% increase in wholesale vehicle revenues in fiscal 2011 resulted from a 33% increase in wholesale unit sales combined with a 16% increase in average wholesale vehicle selling price. The growth in unit sales reflected strong increases in both appraisal traffic and our appraisal buy rate. Our appraisal traffic benefited from the increase in customer traffic in our stores and from the lift in new car industry sales and related used vehicle trade-in activity in fiscal 2011. We believe the strong wholesale pricing environment and the resulting increases in our appraisal offers had a favorable effect on the appraisal buy rate.
24
Fiscal 2010 Versus Fiscal 2009.
The 8% increase in wholesale vehicle revenues in fiscal 2010 resulted from a 6% increase in average wholesale vehicle selling price combined with a 2% increase in wholesale unit sales. The increase in wholesale unit sales was mainly the result of a significant increase in our appraisal buy rate. We believe the strong industry-wide wholesale vehicle pricing environment and the resulting increases in our appraisal offers had a favorable effect on the appraisal buy rate. The benefit of the improvement in appraisal buy rate was largely offset, however, by a double-digit decline in appraisal traffic, particularly in the first half of the year. Appraisal traffic was adversely affected by both the slowdown in our customer traffic and by the reduction in new car industry sales and the related used vehicle trade-in activity in fiscal 2010.
Other Sales and Revenues
Other sales and revenues include commissions on the sale of ESPs and GAP (reported in ESP revenues), service department sales and net third-party finance fees. The fixed fees paid to us per vehicle financed by the majority of our third-party financing providers vary by provider, reflecting their differing levels of credit risk exposure. The third-party providers who purchase subprime financings generally purchase these loans at a discount, which is reflected as an offset to finance fee revenues received on other third-party financings.
Fiscal 2011 Versus Fiscal 2010.
Other sales and revenues increased 8% in fiscal 2011, primarily fueled by an increase in ESP revenues. ESP revenues climbed 20%, reflecting the 11% growth in used unit sales and an increase in ESP penetration, due in part to refinements in the plan design implemented in fiscal 2011. ESP revenues also benefited from a slowdown in the rate of ESP cancellations and from having a full year of GAP revenues in fiscal 2011 following the roll out of this product in the first quarter of fiscal 2010. Service department sales were similar to the prior year, as service resources were used primarily in reconditioning vehicles to support the retail unit sales growth. Net third-party finance fees declined as a result of a mix shift among providers. The total percent of sales financed by the third parties increased in fiscal 2011 due, in part, to current arrangements with these providers to purchase a portion of the loans that previously would have been originated by CAF. The increase in third-party penetration was more than offset, however, by the effect of an increase in the percentage of sales financed by our subprime financing providers. The subprime providers financed approximately 8% of retail unit sales in fiscal 2011 compared with approximately 6% in fiscal 2010.
Fiscal 2010 Versus Fiscal 2009.
Other sales and revenues increased 2% in fiscal 2010. The increase was comprised of a 15% increase in ESP revenues, largely offset by a 94% decline in net third-party finance fees. ESP revenues benefited from the 3% increase in used unit sales and the successful introduction of GAP in fiscal 2010. In addition, fiscal 2010 ESP revenues benefited from modifications in pricing made during the second half of fiscal 2009. The decline in net third-party finance fees primarily reflected a mix shift among providers, which increased the percentage of vehicle sales financed by the subprime provider. The subprime provider financed approximately 6% of retail unit sales in fiscal 2010 compared with approximately 3% in fiscal 2009. In addition, during the third quarter of fiscal 2010, we curtailed our temporary strategy of routing a larger percentage of credit applications directly to the third-party financing providers. We had originally implemented this practice in the third quarter of fiscal 2009 in order to slow the use of capacity in our warehouse facility during a period when the asset-backed securitization markets were severely disrupted. The warehouse facility is used to provide initial funding for substantially all of the auto loan receivables originated by CAF.
Gross Profit
|
Years Ended February 28
|
||||||||||||
|
(In millions)
|
2011
|
2010
|
2009
|
|||||||||
|
Used vehicle gross profit
|
$ | 854.0 | $ | 739.9 | $ | 644.4 | ||||||
|
New vehicle gross profit
|
5.4 | 6.7 | 9.0 | |||||||||
|
Wholesale vehicle gross profit
|
238.8 | 171.5 | 162.5 | |||||||||
|
Other gross profit
|
203.0 | 180.8 | 152.2 | |||||||||
|
Total
|
$ | 1,301.2 | $ | 1,098.9 | $ | 968.2 | ||||||
25
Gross Profit per Unit
|
Years Ended February 28
|
||||||||||||||||||||||||
|
2011
|
2010
|
2009
|
||||||||||||||||||||||
|
$ per unit
(1)
|
% | (2) |
$ per unit
(1)
|
% | (2) |
$ per unit
(1)
|
% | (2) | ||||||||||||||||
|
Used vehicle gross profit
|
$ | 2,156 | 11.8 | $ | 2,072 | 11.9 | $ | 1,865 | 11.3 | |||||||||||||||
|
New vehicle gross profit
|
$ | 659 | 2.7 | $ | 858 | 3.6 | $ | 814 | 3.4 | |||||||||||||||
|
Wholesale vehicle gross profit
|
$ | 908 | 18.3 | $ | 869 | 20.3 | $ | 837 | 20.8 | |||||||||||||||
|
Other gross profit
|
$ | 502 | 76.5 | $ | 495 | 73.3 | $ | 427 | 63.0 | |||||||||||||||
|
Total gross profit
|
$ | 3,218 | 14.5 | $ | 3,011 | 14.7 | $ | 2,715 | 13.9 | |||||||||||||||
|
(1)
|
Calculated as category gross profit divided by its respective units sold, except the other and total categories, which are divided by total retail units sold.
|
|
(2)
|
Calculated as a percentage of its respective sales or revenue.
|
Used Vehicle Gross Profit
We target a dollar range of gross profit per used unit sold. The gross profit dollar target for an individual vehicle is based on a variety of factors, including its anticipated probability of sale and its mileage relative to its age; however, it is not primarily based on the vehicle’s selling price. Our ability to quickly adjust appraisal offers to be consistent with the broader market trade-in trends and our rapid inventory turns reduce our exposure to the inherent continual fluctuation in used vehicle values and contribute to our ability to manage gross profit dollars per unit. We employ a volume-based strategy, and we systematically mark down individual vehicle prices based on proprietary pricing algorithms in order to appropriately balance sales trends, inventory turns and gross profit achievement. When customer traffic and sales are consistently strong, we generally take fewer pricing markdowns, which in turn benefits gross profit dollars per unit. When the sales pace slows, we may initially take more pricing markdowns, which could pressure gross profit dollars per unit. However, as we are successful in reducing inventories to align them with a slower sales pace, this may allow us to return to target levels of gross profit per unit. Over the past several years, we have continued to refine our car-buying strategies, which we believe has benefited used vehicle gross profit per unit.
Fiscal 2011 Versus Fiscal 2010.
Our used vehicle gross profit increased $114.2 million, or 15%, to $854.0 million from $739.9 million in fiscal 2010, reflecting the combination of the 11% increase in used unit sales and a 4% improvement in gross profit per unit. Used vehicle gross profit per unit increased $84 to $2,156 per unit compared with $2,072 per unit in fiscal 2010.
The improvement in gross profit per unit resulted from a combination of factors, including benefits realized from our ongoing initiatives to improve vehicle reconditioning efficiency and reduce waste, the support provided by the strong wholesale pricing environment and a modest increase in the percentage of retail vehicles sourced directly from consumers through our appraisal process. Vehicles purchased directly from consumers typically generate more gross profit per unit compared with vehicles purchased at auction. As of the end of fiscal 2011, we estimated our efforts to eliminate waste from our reconditioning processes in recent years have allowed us to achieve a sustainable reduction in average reconditioning costs of approximately $250 per vehicle, on a cumulative basis. This reduction was primarily accomplished through our emphasis on the consistent application of our reconditioning standards across our entire store base.
Fiscal 2010 Versus Fiscal 2009.
Our used vehicle gross profit increased $95.4 million, or 15%, to $739.9 million from $644.4 million in fiscal 2009, reflecting the combination of an 11% improvement in used vehicle gross profit per unit and the 3% increase in used unit sales. Used vehicle gross profit per unit increased $207 to $2,072 per unit compared with $1,865 per unit in fiscal 2009.
The improvement in gross profit per unit resulted from a combination of factors, including our initiative to reduce waste in the vehicle reconditioning process. As of the end of fiscal 2010, we estimated that we achieved a sustainable reduction in average reconditioning costs of approximately $200 per vehicle, on a cumulative basis. The benefit of the year-over-year appreciation in used vehicle wholesale values also contributed to our used vehicle gross profit. In addition, we believe continuing refinements to our proprietary inventory management systems and processes were contributing factors, as we were able to increase inventory turns in fiscal 2010, despite our aggressive reductions in inventory in the previous year. The improvement also reflected the below-average profitability reported early in fiscal 2009 when the initial slowdown in customer traffic and a rapid decline in underlying values of SUVs and trucks put pressure on our used vehicle margins.
26
New Vehicle Gross Profit
Fiscal 2011 Versus Fiscal 2010.
Our new vehicle gross profit declined 20% to $5.4 million from $6.7 million in fiscal 2010. The reduction occurred as the benefit of the 5% increase in new vehicle unit sales was more than offset by a $199 reduction in gross profit per unit to $659 per unit from $858 per unit in fiscal 2010.
Fiscal 2010 Versus Fiscal 2009.
Our new vehicle gross profit decreased 25% to $6.7 million from $9.0 million in fiscal 2009. The reduction primarily reflected the 29% decline in new vehicle unit sales, partially offset by a 5% increase in new vehicle gross profit per unit, which improved to $858 per unit from $814 per unit in fiscal 2009. The industry-wide reductions in new vehicle inventories and incentives related to the cash for clunkers program benefited the new vehicle gross profit dollars per unit in the second and third quarters of fiscal 2010.
Wholesale Vehicle Gross Profit
Our wholesale vehicle gross profit has steadily increased over the last several years reflecting, in part, the benefits realized from improvements and refinements in our car-buying strategies, appraisal delivery processes and in-store auction processes. We have made continuous improvements in these processes, which we believe have allowed us to become more efficient. Our in-store auctions have benefited from initiatives to increase our dealer-to-car ratio, which we believe has allowed us to achieve higher prices. In addition, the frequency of our auctions, which are generally held weekly or bi-weekly, minimizes the depreciation risk on these vehicles.
Fiscal 2011 Versus Fiscal 2010.
Our wholesale vehicle gross profit increased $67.3 million, or 39%, to $238.8 million from $171.5 million in fiscal 2010. The improvement reflected the 33% increase in wholesale unit sales combined with a 4% rise in wholesale vehicle gross profit per unit. Wholesale vehicle gross profit per unit increased $39 to $908 per unit from $869 per unit in fiscal 2010. The strength of our wholesale gross profit per unit reflected the strong demand for older, higher mileage vehicles, which are the mainstay of our auctions, as well as the continued strong dealer attendance and resulting high dealer-to-car ratios at our auctions.
Fiscal 2010 Versus Fiscal 2009.
Our wholesale vehicle gross profit increased $8.9 million, or 5%, to $171.5 million from $162.5 million in fiscal 2009, reflecting the combination of a 4% improvement in wholesale vehicle gross profit per unit and the 2% increase in wholesale unit sales. Wholesale gross profit per unit increased $32 to $869 per unit compared with $837 per unit in fiscal 2009. The improvement in the wholesale vehicle gross profit per unit primarily reflected the higher year-over-year wholesale pricing environment. We also achieved a new record dealer-to-car ratio at our auctions in fiscal 2010, with the resulting price competition among bidders contributing to the strong wholesale gross profit per unit.
Other Gross Profit
Other gross profit includes profits related to ESP and GAP revenues, net third-party finance fees and service department sales. We have no cost of sales related to ESP and GAP revenues or net third-party finance fees, as these represent commissions paid to us by certain third-party providers, net of the discount associated with the loans purchased by subprime providers. Accordingly, changes in the relative mix of the other gross profit components can affect the composition of other gross profit.
Fiscal 2011 Versus Fiscal 2010.
Other gross profit increased $22.1 million, or 12%, to $203.0 million from $180.8 million in fiscal 2010. Other gross profit per unit improved modestly to $502 per unit from $495 per unit in fiscal 2010. ESP and GAP gross profit increased $29.3 million, or 20%, benefiting from the 11% increase in used unit sales, the improved ESP penetration rate and the prior year roll out of the GAP product. Service department gross profit grew $2.9 million, or 8%. The increases in ESP and GAP and service department gross profits were partially offset by a $10.1 million reduction in net third-party finance fees, which were adversely affected by the mix shift among providers.
Fiscal 2010 Versus Fiscal 2009.
Other gross profit increased $28.6 million, or 19%, to $180.8 million from $152.2 million in fiscal 2009. Other gross profit per unit increased $68, or 16%, to $495 per unit from $427 per unit in fiscal 2009. ESP gross profit increased $19.3 million, or 15%, benefiting from the introduction of GAP, the modifications in pricing made during the second half of fiscal 2009 and the 3% increase in used unit sales. Service department gross profit grew $23.6 million, primarily because our retail vehicle sale growth outpaced fixed service overhead costs. The increases in ESP and service department gross profit were partially offset by a $14.3 million reduction in net third-party finance fees, which were adversely affected by the mix shift among providers and the termination of our temporary practice of reducing CAF originations by routing more credit applications to our third-party providers.
27
Impact of Inflation
Historically, inflation has not been a significant contributor to results. Profitability is primarily affected by our ability to achieve targeted unit sales and gross profit dollars per vehicle rather than on average retail prices. However, increases in average vehicle selling prices benefit the SG&A ratio and CAF income, to the extent the average amount financed also increases.
During fiscal 2011 and 2010, we experienced a period of appreciation in used vehicle wholesale pricing. We believe the appreciation resulted, in part, from a reduced supply of used vehicles in the market that was caused by the dramatic decline in new car industry sales and the associated slow down in used vehicle trade-in activity in fiscal 2010 and fiscal 2009. The appreciation also reflected a rebound in pricing compared with the severe depreciation experienced in fiscal 2009. The higher wholesale values increased both our vehicle acquisition costs and our average selling prices for used and wholesale vehicles.
During fiscal 2009, the weakness in the economy and the stresses on consumer spending contributed to the industry-wide slowdown in the sale of new and used vehicles and to the unprecedented decline in wholesale market prices for most vehicle classes during the first three quarters of the year. A sharp increase in gasoline prices particularly pressured wholesale valuations for SUVs and trucks. These lower wholesale values reduced our vehicle acquisition costs and contributed to the decline in our used and wholesale vehicle average selling price.
CarMax Auto Finance Income
CAF provides financing for a portion of our used and new car retail sales. Because the purchase of a vehicle is generally reliant on the consumer’s ability to obtain on-the-spot financing, it is important to our business that financing be available to creditworthy customers. While financing can also be obtained from third-party sources, we believe that total reliance on third parties can create unacceptable volatility and business risk. Furthermore, we believe that our processes and systems, the transparency of our pricing and our vehicle quality provide a unique and ideal environment in which to procure high quality auto loans, both for CAF and for the third-party financing providers. Generally, CAF has provided us the opportunity to capture additional profits and cash flows from auto loan receivables while managing our reliance on third-party financing sources. We also believe CAF enables us to capture additional sales.
CAF provides financing for qualified customers at competitive market rates of interest. The majority of CAF income has typically been generated by the spread between the interest rates charged to customers and the related cost of funds. Substantially all of the loans originated by CAF are sold in securitization transactions.
As described in the Critical Accounting Policies section of this MD&A, as of March 1, 2010, we adopted ASU Nos. 2009-16 and 2009-17 on a prospective basis. Beginning in fiscal 2011, CAF income no longer includes a gain on the sale of loans through securitization transactions, but instead primarily reflects the interest and fee income associated with owning and servicing the auto loan receivables less the interest expense associated with the non-recourse notes payable issued to fund these receivables, direct CAF expenses and a provision for estimated loan losses.
28
Components of CAF Income
|
Years Ended February 28
|
||||||||||||
|
(In millions)
|
2011
|
2010
|
2009
|
|||||||||
|
Managed portfolio income:
|
||||||||||||
|
Interest and fee income
|
$ | 419.1 | $ | ― | $ | ― | ||||||
|
Servicing fee income
|
0.9 | 41.9 | 41.3 | |||||||||
|
Interest income on retained interest in securitized receivables
|
1.6 | 68.5 | 48.3 | |||||||||
|
Total managed portfolio income
|
421.6 | 110.4 | 89.6 | |||||||||
|
Gain (loss):
|
||||||||||||
|
Gain on sales of loans originated and sold
|
― | 83.0 | 46.5 | |||||||||
|
Other gains
|
5.0 | 26.7 | (81.8 | ) | ||||||||
|
Total gain (loss)
|
5.0 | 109.7 | (35.3 | ) | ||||||||
|
Expenses:
|
||||||||||||
|
Interest expense
|
133.8 | ― | ― | |||||||||
|
Provision for loan losses
|
27.7 | ― | ― | |||||||||
|
Payroll and fringe benefit expense
|
20.6 | 20.2 | 19.2 | |||||||||
|
Other direct expenses
|
24.5 | 24.7 | 19.9 | |||||||||
|
Total expenses
|
206.6 | 44.9 | 39.1 | |||||||||
|
CarMax Auto Finance income
|
$ | 220.0 | $ | 175.2 | $ | 15.3 | ||||||
|
Total average managed receivables, principal only
|
$ | 4,229.9 | $ | 4,057.2 | $ | 3,998.4 | ||||||
CAF income does not include any allocation of indirect costs or income. We present this information on a direct basis to avoid making arbitrary decisions regarding the indirect benefits or costs that could be attributed to CAF. Examples of indirect costs not included are retail store expenses and corporate expenses such as human resources, administrative services, marketing, information systems, accounting, legal, treasury and executive payroll.
Fiscal 2011.
CAF reported income of $220.0 million in fiscal 2011, largely driven by the spread between interest and fee income charged to consumers and our funding costs. CAF income also reflected favorability in our provision for loan losses resulting from better-than-expected loss experience.
Net Interest Income
|
Year Ended
|
||||||||
|
February 28
|
||||||||
|
(In millions)
|
2011
|
% | (1) | |||||
|
Interest and fee income
|
$ | 419.1 | 9.9 | |||||
|
Interest expense
|
(133.8 | ) | (3.2 | ) | ||||
|
Net interest income
|
285.3 | 6.7 | ||||||
|
Provision for loan losses
|
(27.7 | ) | (0.7 | ) | ||||
|
Net interest income after provision for loan losses
|
$ | 257.6 | 6.1 | |||||
|
Total average managed receivables, principal only
|
$ | 4,229.9 | ||||||
|
(1)
|
Percent of total average managed receivables, principal only.
|
Net interest income before the provision for loan losses, which reflects the spread between the interest charged to consumers and our funding costs, was 6.7% of total average managed receivables, principal only, in fiscal 2011. This spread was favorably affected by the following factors:
29
|
·
|
The current managed portfolio reflects the historically wide spreads between the interest rates charged to consumers and our related funding costs. Over the last two years, our funding costs have decreased at a more rapid pace than consumer rates.
|
|
·
|
We typically use interest rate swaps to hedge our interest rate risk while the receivables are in the warehouse facilities and unwind these swaps when the receivables are refinanced in a term securitization. Prior to March 1, 2010, these interest rate swaps were not designated as hedges for accounting purposes. As a result, substantially all of the changes in the fair value of derivatives were offset by the changes in fair value of our retained interest in the related securitized receivables, which were also recorded in CAF income. Beginning in fiscal 2011, the interest expense associated with receivables originated prior to March 1, 2010, does not include amortization of the cost associated with hedge unwinds.
|
|
·
|
Prior to March 1, 2010, certain securitization costs such as underwriting, rating agency fees and legal expenses were expensed at the time of the securitizations. Under the new accounting pronouncements adopted March 1, 2010, these costs are being capitalized and amortized over the term of the related securitizations.
|
Additionally, as noted below, the fiscal 2011 provision for loan losses benefited from lower-than-anticipated net charge-offs and favorable adjustments to the allowance for loan losses.
Servicing fee income and interest income on retained interest in securitized receivables were related to receivables securitized through the warehouse facility prior to March 1, 2010. Other gains primarily reflected favorable derivative valuations.
Allowance for Loan Losses
|
Year Ended
|
||||||||
|
February 28
|
||||||||
|
(In millions)
|
2011
|
%
|
||||||
|
Balance as of beginning of year
|
$ | ― | ||||||
|
Impact of accounting change
(1)
|
58.6 | |||||||
|
Balance as of March 1
(2)
|
58.6 | 1.4 | ||||||
|
Net charge-offs
(3)
|
(47.5 | ) | (1.1 | ) | ||||
|
Provision for loan losses
(3)
|
27.7 | 0.7 | ||||||
|
Balance as of end of year
(4)
|
$ | 38.9 | 0.9 | |||||
|
Total average managed receivables, principal only
|
$ | 4,229.9 | ||||||
|
Ending managed receivables
|
$ | 4,334.6 | ||||||
|
(1)
See Note 2(E) for additional information on the effects of the accounting change.
|
Percent columns indicate:
|
(2)
|
Percent of ending managed receivables as of March 1, 2010, which was $4.11 billion.
|
|
(3)
|
Percent of total average managed receivables, principal only.
|
|
(4)
|
Percent of ending managed receivables.
|
The allowance for loan losses represents an estimate of the amount of net losses inherent in the portfolio as of the applicable reporting date and anticipated to occur during the following 12 months. The allowance is primarily based on the credit quality of the underlying receivables, historical loss trends and forecasted forward loss curves. We also take into account recent trends in delinquencies and losses, recovery rates and the underlying economic environment. The provision for loan losses is the periodic cost of maintaining an adequate allowance.
The decrease in the allowance from $58.6 million, or 1.4% of ending managed receivables, as of March 1, 2010, to $38.9 million, or 0.9% of ending managed receivables, as of February 28, 2011, reflected favorable trends in net charge-offs, the record high recovery rate relative to historical norms and the credit profile of new loan originations, which benefited from CAF’s tightening of lending standards beginning in fiscal 2010. In the first quarter of fiscal 2011, net charge-offs were significantly lower than our original projections. As a result, we reduced our estimate of future loan losses on our existing portfolio of managed receivables. The favorability in net charge-offs and the resulting adjustment to the allowance for loan losses positively affected fiscal 2011 net income by approximately $0.03 per share versus our expectations.
30
Past Due Account Information
|
As of February 28
|
||||||||||||
|
(In millions)
|
2011
|
2010
|
2009
|
|||||||||
|
Accounts 31+ days past due
|
$ | 121.3 | $ | 133.2 | $ | 118.1 | ||||||
|
Ending managed receivables
|
$ | 4,334.6 | $ | 4,112.7 | $ | 3,986.7 | ||||||
|
Past due accounts as a percentage of ending managed receivables
|
2.80 | % | 3.24 | % | 2.96 | % | ||||||
Credit Loss Information
|
Years Ended February 28
|
||||||||||||
|
(In millions)
|
2011
|
2010
|
2009
|
|||||||||
|
Net credit losses on managed receivables
|
$ | 47.5 | $ | 70.1 | $ | 69.8 | ||||||
|
Total average managed receivables, principal only
|
$ | 4,229.9 | $ | 4,057.2 | $ | 3,998.4 | ||||||
|
Net credit losses as a percentage of total average managed receivables, principal only
|
1.12 | % | 1.73 | % | 1.75 | % | ||||||
|
Average recovery rate
|
54.8 | % | 49.8 | % | 44.0 | % | ||||||
In fiscal 2011, we experienced improvements in both past due accounts as a percentage of ending managed receivables and net credit losses as a percentage of total average managed receivables, principal only. We believe the improvements were the result of several factors including our credit tightening implemented in fiscal 2010, the strong recovery rates and general industry trends for losses and delinquencies.
The average recovery rate represents the average percentage of the outstanding principal balance we receive when a vehicle is repossessed and liquidated at wholesale auction. Historically, the annual recovery rate has ranged from a low of 42% to a high of 55%, and it is primarily affected by changes in the wholesale market pricing environment.
CAF Supplemental Origination Information
|
Years Ended February 28
(1)
|
||||||||||||
|
2011
|
2010
|
2009
|
||||||||||
|
Net loans originated
(2)
|
$ | 2,147.4 | $ | 1,836.9 | $ | 1,905.4 | ||||||
|
Vehicle units financed
|
120,183 | 109,030 | 116,733 | |||||||||
|
Penetration rate
(3)
|
29.7 | % | 29.9 | % | 32.7 | % | ||||||
|
Weighted average contract rate
|
8.7 | % | 9.5 | % | 10.3 | % | ||||||
|
Weighted average term
(4)
|
64.5 | 64.2 | 63.8 | |||||||||
|
(1)
|
All information relates to loans originated net of estimated 3-day payoffs and vehicle returns.
|
|
(2)
|
In millions.
|
|
(3)
|
Vehicle units financed as a percentage of total retail units sold.
|
|
(4)
|
In months.
|
Fiscal 2010 and Prior Years
. Prior to March 1, 2010, securitization transactions were accounted for as sales. A gain, recorded at the time of securitization, resulted from recording a receivable approximately equal to the present value of the expected residual cash flows generated by the securitized receivables. The gain on sales of loans originated and sold included both the gain income recorded at the time of securitization and the effect of any subsequent changes in valuation assumptions or funding costs that were incurred in the same fiscal period that the loans were originated. Other gains or losses included the effects of changes in valuation assumptions or funding costs related to loans originated and sold during previous fiscal periods. In addition, other gains or losses included the effects of new term securitizations, changes in the valuation of retained subordinated bonds and the repurchase and resale of receivables in existing term securitizations, as applicable. Other income consisted of servicing fee income on securitized receivables and interest income. Interest income included the effective yield on the retained interest, as well as interest income earned on the retained subordinated bonds.
Between January 2008 and April 2009, we retained some or all of the subordinated bonds associated with our term securitizations. We retained these subordinated bonds because, at the applicable issue date, the economics of doing so were more favorable than selling them. Retained subordinated bonds were included in retained interest in securitized receivables on
31
our consolidated balance sheets, and their total fair value was $248.8 million as of February 28, 2010, and $87.4 million as of February 28, 2009. Changes in the fair value of the retained subordinated bonds were reflected in CAF income.
Fiscal 2010 Versus Fiscal 2009.
CAF income increased to $175.2 million from $15.3 million in fiscal 2009. In both periods, CAF results were affected by adjustments related to loans originated in previous fiscal years. In fiscal 2010, the adjustments increased CAF income by $26.7 million, or $0.07 per share, while in fiscal 2009, the adjustments reduced CAF income by $81.8 million, or $0.23 per share.
The fiscal 2010 adjustments included $64.0 million of favorable mark-to-market adjustments primarily on retained subordinated bonds and $18.9 million of net favorable valuation adjustments, partially offset by a $56.2 million increase in funding costs related to auto loans originated in prior fiscal years. The fiscal 2009 adjustments included $32.0 million of unfavorable mark-to-market adjustments on retained subordinated bonds, $31.8 million of net unfavorable valuation adjustments and an $18.0 million increase in funding costs related to auto loans originated in prior fiscal years.
Excluding these adjustments from both periods, CAF income increased to $148.6 million from $97.0 million in fiscal 2009. CAF’s gain on loans originated and sold climbed to $83.0 million from $46.5 million in fiscal 2009. Several factors contributed to this improvement. The spread between the rates charged customers and CAF’s funding costs increased, largely due to lower benchmark rates. In addition, CAF’s tightening of lending standards had a favorable effect on the expected net loss and discount rate assumptions used to value the related gain income and on the required credit enhancements. The volume of CAF loans originated declined 4% to $1.84 billion from $1.91 billion in fiscal 2009, mainly reflecting a decline in the percentage of sales financed by CAF. CAF’s penetration rate fell to 30% from 33% in fiscal 2009, primarily reflecting CAF’s tightening of lending standards.
The increases in servicing fee income and direct CAF expenses in fiscal 2010 were proportionate to the growth in average managed receivables, principal only. The interest income component of other CAF income, which increased to 1.7% of average managed receivables, principal only, from 1.2% in fiscal 2009, included the interest earned on the retained subordinated bonds. This growth in interest income primarily resulted from our increased holdings of retained subordinated bonds and higher yields on subordinated bonds retained in connection with the April 2009 securitization.
Selling, General and Administrative Expenses
SG&A expenses primarily include payroll expenses, other than payroll related to reconditioning and vehicle repair service, which is included in cost of sales; fringe benefits; rent and occupancy costs; advertising; and other general expenses.
Fiscal 2011 Versus Fiscal 2010.
SG&A expenses increased 11% to $905.1 million from $818.7 million in fiscal 2010. The increase in SG&A primarily reflected increases in sales commissions and other variable costs associated with the growth in unit sales and higher advertising costs, as well as costs associated with our resumption of store growth. The increase also reflected the absence of a favorable litigation settlement included in SG&A in the prior year, which increased fiscal 2010 net earnings by $0.02 per share. The SG&A ratio improved to 10.1% from 11.0% in fiscal 2010, reflecting the leverage associated with the increases in retail and wholesale unit sales and average selling prices.
Fiscal 2010 Versus Fiscal 2009.
SG&A expenses were reduced 7% to $818.7 million from $882.4 million in fiscal 2009, despite the increase in unit sales in fiscal 2010. Given the weak environment experienced in the previous two years, we felt it was prudent to take a particularly cautious approach to SG&A spending during fiscal 2010. Accordingly, we made significant curtailments in advertising, implemented a wage freeze for all salaried and hourly associates and a hiring freeze at our home office, reduced our management bench strength and deferred developmental and discretionary project spending. The SG&A expense reduction also reflected decreases in growth-related costs, including pre-opening and relocation costs, resulting from the suspension of store growth, as well as benefits from a variety of waste-reduction initiatives. The SG&A ratio fell to 11.0% from 12.7% in fiscal 2009 primarily due to the reduction in SG&A expenses and the leverage associated with the increases in average selling prices and unit sales.
The fiscal 2010 SG&A expenses included the benefit of a favorable litigation settlement, which increased net earnings by $0.02 per share, while the fiscal 2009 SG&A expenses included various non-recurring items, which in the aggregate reduced net earnings by a total of $0.04 per share.
32
Income Taxes
The effective income tax rate was 37.9% in fiscal 2011, 37.8% in fiscal 2010 and 38.8% in fiscal 2009. The fiscal 2011 effective tax rate benefited from favorable adjustments relating to prior years’ tax items. The fiscal 2010 effective tax rate was slightly reduced by the favorable settlement of prior year tax audits.
FISCAL 2012 PLANNED SUPERSTORE OPENINGS
|
Television Market
|
Market Status
|
Planned Opening Date
|
|
|
Baton Rouge, Louisiana
|
Baton Rouge
|
New
|
Q1 fiscal 2012
|
|
Lexington, Kentucky
|
Lexington
|
New
|
Q1 fiscal 2012
|
|
Escondido, California
|
San Diego
|
Existing
|
Q2 fiscal 2012
|
|
North Attleborough, Massachusetts
|
Providence
|
New
|
Q3 fiscal 2012
|
|
Chattanooga, Tennessee
|
Chattanooga
|
New
|
Q4 fiscal 2012
|
We estimate capital expenditures will total approximately $225.0 million in fiscal 2012. Compared with the $76.6 million of capital spending in fiscal 2011, the increase in planned fiscal 2012 expenditures primarily reflects real estate acquisitions and construction costs associated with store growth. We incurred no material construction costs in fiscal 2011 related to the three stores opened in that year. These stores were built in fiscal 2009, but we chose not to open them until economic conditions improved. We expect fiscal 2012 capital spending will include some costs for stores planned to be opened in the first half of fiscal 2013. We expect to open between eight and ten stores in fiscal 2013.
RECENT ACCOUNTING PRONOUNCEMENTS
See Note 2(X) for information on recent accounting pronouncements applicable to CarMax.
FINANCIAL CONDITION
Liquidity and Capital Resources
The combined effects of the adoption of ASU Nos. 2009-16 and 2009-17 and the March 1, 2010, amendment to our then existing warehouse facility agreement represent non-cash transactions, and thus the reported cash flow information for fiscal 2011 takes into account the effect of these and other related reclassifications and adjustments. See Note 2(E) for additional information on the effects of the accounting change.
Operating Activities.
In fiscal 2011, net cash used in operating activities totaled $17.2 million, while in fiscal 2010 and fiscal 2009, net cash provided by operating activities totaled $50.3 million and $264.6 million, respectively. In fiscal 2011, a $304.7 million increase in auto loan receivables more than offset the net cash generated by all other operating activities, resulting in the net use of cash. As discussed in Note 2(E), auto loan receivables and the related cash flows were not reported in the consolidated financial statements prior to fiscal 2011. The increase in auto loan receivables primarily reflected the amount by which CAF net loan originations exceeded loan repayments during the year. CAF auto loan receivables are funded through securitization transactions. As a result, the majority of the increases in auto loan receivables are accompanied by increases in non-recourse notes payable, which are reflected as cash provided by financing activities and not included in cash provided by operations.
Compared with the prior year, the $214.3 million decline in cash from operating activities in fiscal 2010 occurred despite the significant increase in net income. It primarily reflected the use of cash for increases in the retained interest in securitized receivables and inventory in fiscal 2010, while the prior year benefited from the generation of cash from a significant reduction in inventory.
After taking into account the effect of the change in accounting for securitized receivables, the $43.7 million of retained interest as of the end of fiscal 2010 was related to amounts securitized in the warehouse facility as of February 28, 2010, and this amount was either reclassified or eliminated during the first quarter of fiscal 2011 in conjunction with resecuritization activity. The $204.1 million increase in the retained interest in fiscal 2010 primarily resulted from retaining subordinated bonds in an April 2009 term securitization and favorable mark-to-market adjustments recognized during that fiscal year.
33
Inventory totaled $1.05 billion as of the end of fiscal 2011, $843.1 million as of the end of fiscal 2010 and $703.2 million as of the end of fiscal 2009. The 24% increase in inventory during fiscal 2011 was attributable to the combination of an 18% increase in used vehicle units in inventory and the rise in vehicle acquisition costs resulting from changes in wholesale vehicle valuations. The increase in units reflected the additional vehicles required to support recent sales trends, as well as the effect of the three stores opened during fiscal 2011. The 20% increase in inventory during fiscal 2010 was attributable to the increase in our vehicle acquisition costs caused by appreciation in wholesale vehicle values, combined with a 10% increase in used vehicle units in inventory. The increase in units reflected the additional vehicles required to support sales trends in the fourth quarter of fiscal 2010. The increases in used vehicle units in inventory in fiscal 2010 and 2011 also reflected a gradual return to more normalized levels of saleable inventory per store, following dramatic reductions made in fiscal 2009 in response to falling customer demand and sales levels during that year.
We utilize derivative instruments to manage exposures that arise from business activities that result in the receipt or payment of future known and uncertain cash amounts, the values of which are determined by interest rates. Prior to March 1, 2010, no derivative instruments were designated as accounting hedges, as we believed this treatment was best aligned with our use of gain-on-sale accounting. In conjunction with the adoption of the new accounting for securitized receivables as of the beginning of fiscal 2011, we have begun to designate certain derivative instruments as cash flow hedges of interest rate risk, as we believe this treatment is better aligned with our current accounting policies.
Investing Activities.
Net cash used in investing activities was $72.2 million in fiscal 2011, $21.3 million in fiscal 2010 and $155.3 million in fiscal 2009. Investing activities primarily consist of capital expenditures, which totaled $76.6 million in fiscal 2011, $22.4 million in fiscal 2010 and $185.7 million in fiscal 2009. During this three-year period, annual capital spending was lower than in the immediately preceding years, reflecting our decision in December 2008 to temporarily suspend store growth. In fiscal 2011, capital spending primarily included construction costs related to stores planned to be opened in fiscal 2012 and real estate acquisitions for future store openings. No material construction costs were incurred in fiscal 2011 related to the three stores opened that year, as these stores were built in fiscal 2009, but we chose not to open them until economic conditions improved. In fiscal 2010, capital spending primarily represented expenditures required to maintain our existing structures that were capital in nature, which were fairly modest because of the relatively young average age of our store base. During fiscal 2009, we opened 11 used car superstores and we completed construction of 3 additional stores that were subsequently opened in fiscal 2011.
Historically, capital expenditures have been funded with internally-generated funds, debt and sale-leaseback transactions. Net proceeds from the sale of assets totaled $0.7 million in fiscal 2010 and $34.3 million in fiscal 2009. During fiscal 2009, we completed sale-leaseback transactions for our two used car superstores in Austin, Texas.
As of February 28, 2011, we owned 46 of our 103 used car superstores and our home office in Richmond, Virginia. In addition, five existing superstores and one future superstore site were accounted for as capital leases.
Financing Activities.
During fiscal 2011, net cash provided by financing activities totaled $112.3 million, including a $187.3 million net increase in total non-recourse notes payable, partially offset by a $122.2 million net reduction in borrowings under the revolving credit facility and capital leases. The increase in non-recourse notes payable resulted from the increase in securitized auto loan receivables. During fiscal 2010, net cash used in financing activities totaled $151.3 million, including a $186.5 million reduction in borrowings under the revolving credit facility and capital leases. During fiscal 2009, net cash provided by financing activities totaled $18.4 million, including a $7.8 million increase in borrowings under the revolving credit facility and capital leases.
In fiscal 2011 and fiscal 2010, the reductions in borrowings under the revolving credit facility reflected the use of excess cash to pay down debt, as well as our relatively low levels of capital spending resulting from our temporary suspension of store growth. In fiscal 2009, total debt increased only modestly, as our significant reductions in inventory substantially offset the effects of the decline in net earnings and our increase in cash.
34
Total Debt and Cash and Cash Equivalents
|
As of February 28
|
||||||||||||
|
(In millions)
|
2011
|
2010
|
2009
|
|||||||||
|
Non-recourse notes payable
|
$ | 4,013.7 | $ | ― | $ | ― | ||||||
|
Borrowings under revolving credit facility
|
1.0 | 122.5 | 308.5 | |||||||||
|
Obligations under capital leases
|
29.1 | 28.1 | 28.6 | |||||||||
|
Total debt
|
$ | 4,043.8 | $ | 150.6 | $ | 337.0 | ||||||
|
Cash and cash equivalents
|
$ | 41.1 | $ | 18.3 | $ | 140.6 | ||||||
We have a $700 million revolving credit facility, which expires in December 2011. The credit facility is secured by vehicle inventory and contains customary representations and warranties, conditions and covenants. As of February 28, 2011, we were in compliance with the financial covenants. Borrowings under this credit facility are limited to 80% of qualifying inventory, and they are available for working capital and general corporate purposes. As of February 28, 2011, $1.0 million of short-term debt was outstanding under the credit facility and the remaining capacity was fully available to us. During fiscal 2011, excess cash flows were used to pay down this facility and to build a modest cash balance.
CAF auto loan receivables are primarily funded through securitization transactions. Our securitizations are structured to legally isolate the auto loan receivables, and we would not expect to be able to access the assets of our securitization vehicles, even in insolvency, receivership or conservatorship proceedings. Similarly, the investors in the non-recourse notes payable have no recourse to our assets beyond the securitized receivables, the amounts on deposit in reserve accounts and the restricted cash from collections on auto loan receivables. We do, however, continue to have the rights associated with the interest we retain in these securitization vehicles.
As of February 28, 2011, the combined warehouse facility limit was $1.6 billion. At that date, $943.0 million of auto loan receivables were funded in the warehouse facilities and unused warehouse capacity totaled $657.0 million. During fiscal 2011, we entered into a second warehouse facility in order to stagger the warehouse facility renewal dates, reduce risk and provide greater flexibility. In addition, we increased our combined warehouse facility capacity by $400 million. As of February 28, 2011, $800 million of the warehouse facility limit will expire in August 2011 and $800 million will expire in February 2012. The securitization agreements related to the warehouse facilities include various financial covenants. As of February 28, 2011, we were in compliance with the financial covenants. We anticipate that we will be able to enter into new, or renew or expand existing, funding arrangements to meet CAF’s future funding needs. However, based on conditions in the credit markets, the cost for these arrangements could be materially higher than historical levels and the timing and capacity of these transactions could be dictated by market availability rather than our requirements. Notes 5 and 11 include additional information on the warehouse facilities.
During fiscal 2011, we completed two term securitizations, funding a total of $1.30 billion of auto loan receivables. Despite the normalization of the credit markets, we took actions in fiscal 2011 that we believe will better position us to provide consumer financing in the event of future disruptions in the credit markets, should they occur. These steps included entering into the second warehouse facility with a staggered renewal date, increasing the overall warehouse facility capacity and entering into arrangements with several of our third-party financing providers where they are purchasing a portion of the auto loans that previously would have been originated by CAF. We believe by purchasing these loans, the third-party providers will gain a greater understanding of the advantages of our unique origination channel.
In fiscal 2009, we believed it was prudent to maintain a cash balance in excess of our operating requirements due to the unprecedented conditions in the credit markets during that time. Cash and cash equivalents as of February 28, 2009, reflected this decision.
Cash received on equity issuances, which primarily related to employee stock option exercises, was $38.3 million in fiscal 2011, $31.3 million in fiscal 2010 and $10.2 million in fiscal 2009. In fiscal 2011 and fiscal 2010 the receipts included exercises prompted by the increase in our stock price during those years.
We expect that cash generated by operations and proceeds from securitization transactions or other funding arrangements, sale-leaseback transactions and borrowings under existing, new or expanded credit facilities will be sufficient to fund capital expenditures and working capital for the foreseeable future.
35
Fair Value Measurements.
We reported money market securities, retained interest in securitized receivables and derivative instruments at fair value. See Note 7 for more information on fair value measurements.
Contractual Obligations
|
As of February 28, 2011
|
||||||||||||||||||||||||
|
Less Than
|
1 to 3
|
3 to 5
|
More Than
|
|||||||||||||||||||||
|
(In millions)
|
Total
|
1 Year
|
Years
|
Years
|
5 Years
|
Other
|
||||||||||||||||||
|
Revolving credit agreement
(1)
|
$ | 1.0 | $ | 1.0 | $ | ― | $ | ― | $ | ― | $ | ― | ||||||||||||
|
Capital leases
(
2)
|
59.6 | 3.9 | 7.9 | 8.6 | 39.2 | ― | ||||||||||||||||||
|
Operating leases
(2)
|
910.0 | 82.4 | 163.8 | 163.4 | 500.4 | ― | ||||||||||||||||||
|
Purchase obligations
(3)
|
77.3 | 58.0 | 14.6 | 4.7 | ― | ― | ||||||||||||||||||
|
Asset retirement obligations
(4)
|
1.1 | ― | ― | ― | 1.1 | ― | ||||||||||||||||||
|
Defined benefit retirement plans
(5)
|
36.1 | 0.4 | ― | ― | ― | 35.7 | ||||||||||||||||||
|
Unrecognized tax benefits
(6)
|
16.1 | 0.8 | ― | ― | ― | 15.3 | ||||||||||||||||||
|
Total
|
$ | 1,101.2 | $ | 146.5 | $ | 186.3 | $ | 176.7 | $ | 540.7 | $ | 51.0 | ||||||||||||
|
(1)
|
Due to the uncertainty of forecasting expected variable interest rate payments, those amounts are not included in the table.
See Note 11.
|
|
(2)
|
Excludes taxes, insurance and other costs payable directly by us. These costs vary from year to year and are incurred in the ordinary course of business. See Note 15.
|
|
(3)
|
Includes certain enforceable and legally binding obligations related to third-party outsourcing services.
|
|
(4)
|
Represents the liability to retire signage, fixtures and other assets at certain leased locations.
|
|
(5)
|
Represents the recognized funded status of our retirement plan, of which $35.7 million has no contractual payment schedule and we expect payments to occur beyond 12 months from February 28, 2011. See Note 10.
|
|
(6)
|
Represents the net unrecognized tax benefits related to uncertain tax positions. The timing of payments associated with $15.3 million of these tax benefits could not be estimated as of February 28, 2011. See Note 9.
|
36
Auto Loan Receivables
As of February 28, 2011 and 2010, all loans in our portfolio of auto loan receivables were fixed-rate installment loans. Financing for these auto loan receivables was achieved through asset securitization programs that, in turn, issued both fixed- and floating-rate securities. Our derivative instruments are used to manage differences in the amount of our known or expected cash receipts and our known or expected cash payments principally related to the funding of our auto loan receivables. Disruptions in the credit markets could impact the effectiveness of our hedging strategies. Other receivables are financed with working capital. Generally, changes in interest rates associated with underlying swaps will not have a material impact on earnings; however, they could have a material impact on cash and cash flows.
Credit risk is the exposure to nonperformance of another party to an agreement. We mitigate credit risk by dealing with highly rated bank counterparties. The market and credit risks associated with derivative instruments are similar to those relating to other types of financial instruments. Notes 6 and 7 provide additional information on derivative instruments.
Composition of Auto Loan Receivables
|
As of February 28
|
||||||||
|
(In millions)
|
2011
|
2010
|
||||||
|
Principal amount of:
|
||||||||
|
Fixed-rate securitizations
|
$ | 3,083.6 | $ | 3,432.9 | ||||
|
Floating-rate securitizations synthetically altered to fixed
(1)(2)
|
109.5 | 512.9 | ||||||
|
Floating-rate securitizations
(1)
|
943.0 | 0.8 | ||||||
|
Loans held for investment
(3)
|
― | 135.5 | ||||||
|
Loans held for sale
(4)
|
― | 30.6 | ||||||
|
Other receivables
(5)
|
198.5 | ― | ||||||
|
Total
|
$ | 4,334.6 | $ | 4,112.7 | ||||
|
(1)
|
Prior to March 1, 2010, we entered into interest rate swaps to manage interest rate exposure related to auto loan receivables securitized in the warehouse facility until they were refinanced in a term securitization. Beginning in fiscal 2011, we have entered into derivatives designated as cash flow hedges of forecasted interest payments in anticipation of permanent funding for these receivables in the term securitization market. The current notional amount of these derivatives as of February 28, 2011, was $972.0 million. See Note 6.
|
|
(2)
|
Includes variable-rate securities totaling $109.5 million as of February 28, 2011, and $182.7 million as of February 28, 2010, issued in connection with certain term securitizations that were synthetically altered to fixed at the bankruptcy-remote special purpose entity.
|
|
(3)
|
The majority is held by a bankruptcy-remote special purpose entity.
|
|
(4)
|
Held by a bankruptcy-remote special purpose entity.
|
|
(5)
|
Other receivables include required excess receivables and receivables not funded through the warehouse facilities.
|
INTEREST RATE EXPOSURE
We also have interest rate risk from changing interest rates related to our outstanding debt. Substantially all of our debt is floating-rate debt based on LIBOR. A 100-basis point increase in market interest rates would have decreased our fiscal 2011 net earnings per share by less than $0.01.
37
MANAGEMENT’S ANNUAL REPORT ON INTERNAL CONTROL
OVER FINANCIAL REPORTING
Management is responsible for establishing and maintaining adequate internal control over financial reporting for the company. Because of its inherent limitations, internal control over financial reporting may not prevent or detect misstatements. Accordingly, even effective internal control over financial reporting can provide only reasonable assurance regarding the reliability of financial reporting and the preparation of financial statements for external purposes in accordance with U.S. generally accepted accounting principles.
Management conducted an evaluation of the effectiveness of our internal control over financial reporting based on the framework and criteria established in
Internal Control—Integrated Framework
, issued by the Committee of Sponsoring Organizations of the Treadway Commission. Based on this evaluation, our management has concluded that our internal control over financial reporting was effective as of February 28, 2011.
KPMG LLP, the company's independent registered public accounting firm, has issued a report on our internal control over financial reporting. Their report is included herein.
/s/ Thomas J. Folliard
THOMAS J. FOLLIARD
PRESIDENT AND CHIEF EXECUTIVE OFFICER
/s/ Thomas W. Reedy
THOMAS W. REEDY
SENIOR VICE PRESIDENT AND
CHIEF FINANCIAL OFFICER
38
REPORT OF INDEPENDENT REGISTERED
PUBLIC ACCOUNTING FIRM
The Board of Directors and Shareholders
CarMax, Inc.:
We have audited the accompanying consolidated balance sheets of CarMax, Inc. and subsidiaries (the Company) as of February 28, 2011 and 2010, and the related consolidated statements of earnings, shareholders’ equity, and cash flows for each of the fiscal years in the three-year period ended February 28, 2011. In connection with our audits of the consolidated financial statements, we also have audited financial statement schedule II – valuation and qualifying accounts and reserves as of and for each of the fiscal years in the three-year period ended February 28, 2011. We also have audited the Company’s internal control over financial reporting as of February 28, 2011, based on criteria established in
Internal Control — Integrated Framework
issued by the Committee of Sponsoring Organizations of the Treadway Commission (COSO). The Company’s management is responsible for these consolidated financial statements and financial statement schedule, for maintaining effective internal control over financial reporting, and for its assessment of the effectiveness of internal control over financial reporting, included in the accompanying
Management’s Annual Report on Internal Control Over Financial Reporting
. Our responsibility is to express an opinion on these consolidated financial statements and financial statement schedule and an opinion on the Company’s internal control over financial reporting based on our audits.
We conducted our audits in accordance with the standards of the Public Company Accounting Oversight Board (United States). Those standards require that we plan and perform the audits to obtain reasonable assurance about whether the financial statements are free of material misstatement and whether effective internal control over financial reporting was maintained in all material respects. Our audits of the consolidated financial statements included examining, on a test basis, evidence supporting the amounts and disclosures in the financial statements, assessing the accounting principles used and significant estimates made by management, and evaluating the overall financial statement presentation. Our audit of internal control over financial reporting included obtaining an understanding of internal control over financial reporting, assessing the risk that a material weakness exists, and testing and evaluating the design and operating effectiveness of internal control based on the assessed risk. Our audits also included performing such other procedures as we considered necessary in the circumstances. We believe that our audits provide a reasonable basis for our opinions.
A company’s internal control over financial reporting is a process designed to provide reasonable assurance regarding the reliability of financial reporting and the preparation of financial statements for external purposes in accordance with generally accepted accounting principles. A company’s internal control over financial reporting includes those policies and procedures that (1) pertain to the maintenance of records that, in reasonable detail, accurately and fairly reflect the transactions and dispositions of the assets of the company; (2) provide reasonable assurance that transactions are recorded as necessary to permit preparation of financial statements in accordance with generally accepted accounting principles, and that receipts and expenditures of the company are being made only in accordance with authorizations of management and directors of the company; and (3) provide reasonable assurance regarding prevention or timely detection of unauthorized acquisition, use, or disposition of the company’s assets that could have a material effect on the financial statements.
Because of its inherent limitations, internal control over financial reporting may not prevent or detect misstatements. Also, projections of any evaluation of effectiveness to future periods are subject to the risk that controls may become inadequate because of changes in conditions, or that the degree of compliance with the policies or procedures may deteriorate.
In our opinion, the consolidated financial statements and financial statement schedule referred to above present fairly, in all material respects, the financial position of CarMax, Inc. and subsidiaries as of February 28, 2011 and 2010, and the results of their operations and their cash flows for each of the fiscal years in the three-year period ended February 28, 2011, in conformity with U.S. generally accepted accounting principles. Also in our opinion, the Company maintained, in all material respects, effective internal control over financial reporting as of February 28, 2011, based on criteria established in
Internal Control — Integrated Framework
issued by COSO.
39
As discussed in note 2 to the consolidated financial statements, the Company has changed its method of accounting for transfers of auto loan receivables due to the adoption of Financial Accounting Standards Board Accounting Standards Codification Topic 860,
Transfers and Servicing
, and Topic 810
Consolidation
, effective March 1, 2010.
/s/ KPMG LLP
Richmond, Virginia
April 28, 2011
40
CONSOLIDATED STATEMENTS OF EARNINGS
|
Years Ended February 28
|
||||||||||||||||||||||||
|
(In thousands except per share data)
|
2011
(1)
|
% | (2) | 2010 | % | (2) | 2009 | % | (2) | |||||||||||||||
|
SALES AND OPERATING REVENUES
:
|
||||||||||||||||||||||||
|
Used vehicle sales
|
$ | 7,210,017 | 80.3 | $ | 6,192,278 | 82.9 | $ | 5,690,658 | 81.6 | |||||||||||||||
|
New vehicle sales
|
198,532 | 2.2 | 186,481 | 2.5 | 261,940 | 3.8 | ||||||||||||||||||
|
Wholesale vehicle sales
|
1,301,703 | 14.5 | 844,868 | 11.3 | 779,785 | 11.2 | ||||||||||||||||||
|
Other sales and revenues
|
265,302 | 3.0 | 246,566 | 3.3 | 241,583 | 3.5 | ||||||||||||||||||
|
NET SALES AND OPERATING REVENUES
|
8,975,554 | 100.0 | 7,470,193 | 100.0 | 6,973,966 | 100.0 | ||||||||||||||||||
|
Cost of sales
|
7,674,326 | 85.5 | 6,371,323 | 85.3 | 6,005,796 | 86.1 | ||||||||||||||||||
|
GROSS PROFIT
|
1,301,228 | 14.5 | 1,098,870 | 14.7 | 968,170 | 13.9 | ||||||||||||||||||
|
CARMAX AUTO FINANCE INCOME
|
219,983 | 2.5 | 175,217 | 2.3 | 15,286 | 0.2 | ||||||||||||||||||
|
Selling, general and administrative
expenses
|
905,091 | 10.1 | 818,691 | 11.0 | 882,358 | 12.7 | ||||||||||||||||||
|
Interest expense
|
3,110 | ― | 3,460 | ― | 6,086 | 0.1 | ||||||||||||||||||
|
Interest income
|
480 | ― | 560 | ― | 1,786 | ― | ||||||||||||||||||
|
Earnings before income taxes
|
613,490 | 6.8 | 452,496 | 6.1 | 96,798 | 1.4 | ||||||||||||||||||
|
Income tax provision
|
232,612 | 2.6 | 170,828 | 2.3 | 37,585 | 0.5 | ||||||||||||||||||
|
NET EARNINGS
|
$ | 380,878 | 4.2 | $ | 281,668 | 3.8 | $ | 59,213 | 0.8 | |||||||||||||||
|
WEIGHTED AVERAGE COMMON SHARES:
|
||||||||||||||||||||||||
|
Basic
|
223,449 | 219,527 | 217,537 | |||||||||||||||||||||
|
Diluted
|
227,601 | 222,234 | 219,357 | |||||||||||||||||||||
|
NET EARNINGS PER SHARE:
|
||||||||||||||||||||||||
|
Basic
|
$ | 1.70 | $ | 1.27 | $ | 0.27 | ||||||||||||||||||
|
Diluted
|
$ | 1.67 | $ | 1.26 | $ | 0.27 | ||||||||||||||||||
|
(1)
|
As discussed in Note 2(E), fiscal 2011 reflects the adoption of ASU Nos. 2009-16 and 2009-17 effective March 1, 2010.
|
|
(2)
|
Percents are calculated as a percentage of net sales and operating revenues and may not equal totals due to rounding.
|
See accompanying notes to consolidated financial statements.
41
CONSOLIDATED BALANCE SHEETS
|
As of February 28
|
||||||||
|
(In thousands except share data)
|
2011
(1)
|
2010
|
||||||
|
ASSETS
|
||||||||
|
CURRENT ASSETS:
|
||||||||
|
Cash and cash equivalents
|
$ | 41,121 | $ | 18,278 | ||||
|
Restricted cash from collections on auto loan receivables
|
161,052 | ― | ||||||
|
Accounts receivable, net
|
119,597 | 99,434 | ||||||
|
Auto loan receivables held for sale
|
― | 30,578 | ||||||
|
Retained interest in securitized receivables
|
― | 552,377 | ||||||
|
Inventory
|
1,049,477 | 843,133 | ||||||
|
Deferred income taxes
|
5,191 | 5,595 | ||||||
|
Other current assets
|
33,660 | 7,017 | ||||||
|
TOTAL CURRENT ASSETS
|
1,410,098 | 1,556,412 | ||||||
|
Auto loan receivables, net
|
4,320,575 | ― | ||||||
|
Property and equipment, net
|
920,045 | 893,453 | ||||||
|
Deferred income taxes
|
92,278 | 57,234 | ||||||
|
Other assets
|
96,913 | 49,092 | ||||||
|
TOTAL ASSETS
|
$ | 6,839,909 | $ | 2,556,191 | ||||
|
LIABILITIES AND SHAREHOLDERS’ EQUITY
|
||||||||
|
CURRENT LIABILITIES:
|
||||||||
|
Accounts payable
|
$ | 269,763 | $ | 253,267 | ||||
|
Accrued expenses and other current liabilities
|
103,389 | 94,557 | ||||||
|
Accrued income taxes
|
772 | 6,327 | ||||||
|
Short-term debt
|
1,002 | 883 | ||||||
|
Current portion of long-term debt
|
772 | 122,317 | ||||||
|
Current portion of non-recourse notes payable
|
132,519 | ― | ||||||
|
TOTAL CURRENT LIABILITIES
|
508,217 | 477,351 | ||||||
|
Long-term debt, excluding current portion
|
28,350 | 27,371 | ||||||
|
Non-recourse notes payable, excluding current portion
|
3,881,142 | ― | ||||||
|
Other liabilities
|
130,570 | 117,887 | ||||||
|
TOTAL LIABILITIES
|
4,548,279 | 622,609 | ||||||
|
Commitments and contingent liabilities
|
||||||||
|
SHAREHOLDERS’ EQUITY:
|
||||||||
|
Common stock, $0.50 par value; 350,000,000 shares authorized; 225,885,693 and 223,065,542 shares issued and outstanding
|
||||||||
|
as of
February 28, 2011 and 2010, respectively
|
112,943 | 111,533 | ||||||
|
Capital in excess of par value
|
820,639 | 746,134 | ||||||
|
Accumulated other comprehensive loss
|
(25,057 | ) | (19,546 | ) | ||||
|
Retained earnings
|
1,383,105 | 1,095,461 | ||||||
|
TOTAL SHAREHOLDERS’ EQUITY
|
2,291,630 | 1,933,582 | ||||||
|
TOTAL LIABILITIES AND SHAREHOLDERS’ EQUITY
|
$ | 6,839,909 | $ | 2,556,191 | ||||
|
(1)
|
As discussed in Note 2(E), fiscal 2011 reflects the adoption of ASU Nos. 2009-16 and 2009-17 effective March 1, 2010.
|
See accompanying notes to consolidated financial statements.
42
CONSOLIDATED STATEMENTS OF CASH FLOWS
|
Years Ended February 28
|
||||||||||||
|
(In thousands)
|
2011
|
2010
|
2009
|
|||||||||
|
OPERATING ACTIVITIES:
|
||||||||||||
|
Net earnings
|
$ | 380,878 | $ | 281,668 | $ | 59,213 | ||||||
|
Adjustments to reconcile net earnings to net cash
|
||||||||||||
|
(used in) provided by operating activities:
|
||||||||||||
|
Depreciation and amortization
|
59,421 | 58,328 | 54,741 | |||||||||
|
Share-based compensation expense
|
43,606 | 37,858 | 35,436 | |||||||||
|
Provision for loan losses
|
27,749 | ― | ― | |||||||||
|
Loss on disposition of assets
|
1,143 | 372 | 10,728 | |||||||||
|
Deferred income tax provision (benefit)
|
19,393 | 29,761 | (41,502 | ) | ||||||||
|
Impairment of long-lived assets
|
― | 2,055 | ― | |||||||||
|
Net (increase) decrease in:
|
||||||||||||
|
Accounts receivable, net
|
(40,538 | ) | (23,558 | ) | (2,648 | ) | ||||||
|
Auto loan receivables held for sale, net
|
― | (20,830 | ) | (4,764 | ) | |||||||
|
Retained interest in securitized receivables
|
43,746 | (204,115 | ) | (77,501 | ) | |||||||
|
Inventory
|
(206,344 | ) | (139,976 | ) | 272,620 | |||||||
|
Other current assets
|
(27,403 | ) | 3,095 | 9,090 | ||||||||
|
Auto loan receivables, net
|
(304,729 | ) | ― | ― | ||||||||
|
Other assets
|
(6,790 | ) | 917 | 647 | ||||||||
|
Net (decrease) increase in:
|
||||||||||||
|
Accounts payable, accrued expenses and other current
|
||||||||||||
|
liabilities and accrued income taxes
|
(8,715 | ) | 33,818 | (40,276 | ) | |||||||
|
Other liabilities
|
1,385 | (9,103 | ) | (11,193 | ) | |||||||
|
NET CASH (USED IN) PROVIDED BY OPERATING ACTIVITIES
|
(17,198 | ) | 50,290 | 264,591 | ||||||||
|
INVESTING ACTIVITIES:
|
||||||||||||
|
Capital expenditures
|
(76,580 | ) | (22,434 | ) | (185,700 | ) | ||||||
|
Proceeds from sales of assets
|
8 | 662 | 34,341 | |||||||||
|
Insurance proceeds related to damaged property
|
― | 447 | ― | |||||||||
|
Decrease in restricted cash from collections on auto loan receivables
|
1,556 | ― | ― | |||||||||
|
Increase in restricted cash in reserve accounts
|
(12,631 | ) | ― | ― | ||||||||
|
Release of restricted cash from reserve accounts
|
11,434 | ― | ― | |||||||||
|
Sales (purchases) of money market securities, net
|
4,001 | (2,196 | ) | (3,987 | ) | |||||||
|
Sales of investments available-for-sale
|
― | 2,200 | ― | |||||||||
|
NET CASH USED IN INVESTING ACTIVITIES
|
(72,212 | ) | (21,321 | ) | (155,346 | ) | ||||||
|
FINANCING ACTIVITIES:
|
||||||||||||
|
Increase (decrease) in short-term debt, net
|
119 | 5 | (20,139 | ) | ||||||||
|
Issuances of long-term debt
|
243,300 | 606,500 | 789,800 | |||||||||
|
Payments on long-term debt
|
(365,605 | ) | (792,981 | ) | (761,827 | ) | ||||||
|
Issuances of non-recourse notes payable
|
3,348,000 | ― | ― | |||||||||
|
Payments on non-recourse notes payable
|
(3,160,749 | ) | ― | ― | ||||||||
|
Equity issuances, net
|
38,277 | 31,307 | 10,162 | |||||||||
|
Excess tax benefits from share-based payment arrangements
|
8,911 | 3,881 | 391 | |||||||||
|
NET CASH PROVIDED BY (USED IN) FINANCING ACTIVITIES
|
112,253 | (151,288 | ) | 18,387 | ||||||||
|
Increase (decrease) increase in cash and cash equivalents
|
22,843 | (122,319 | ) | 127,632 | ||||||||
|
Cash and cash equivalents at beginning of year
|
18,278 | 140,597 | 12,965 | |||||||||
|
CASH AND CASH EQUIVALENTS AT END OF YEAR
|
$ | 41,121 | $ | 18,278 | $ | 140,597 | ||||||
|
SUPPLEMENTAL DISCLOSURES OF CASH FLOW INFORMATION
|
||||||||||||
|
Cash paid for interest
|
$ | 521 | $ | 4,796 | $ | 10,171 | ||||||
|
Cash paid for income taxes
|
242,510 | $ | 163,324 | $ | 64,023 | |||||||
|
Non-cash investing and financing activities:
|
||||||||||||
|
Increase (decrease) in accrued capital expenditures
|
$ | 6,395 | $ | (5,823 | ) | $ | (12,861 | ) | ||||
|
Increase in capital lease obligations
|
$ | 1,739 | $ | ― | $ | 1,382 | ||||||
See accompanying notes to consolidated financial statements.
43
CONSOLIDATED STATEMENTS OF SHAREHOLDERS’ EQUITY
|
Accumulated
|
||||||||||||||||||||||||
|
Common
|
Capital in
|
Other
|
||||||||||||||||||||||
|
Shares
|
Common
|
Excess of
|
Retained
|
Comprehensive
|
||||||||||||||||||||
|
(
In thousands
)
|
Outstanding
|
Stock
|
Par Value
|
Earnings
|
Loss
|
Total
|
||||||||||||||||||
|
BALANCE AS OF FEBRUARY 29, 2008
|
218,616 | $ | 109,308 | $ | 641,766 | $ | 754,580 | $ | (16,728 | ) | $ | 1,488,926 | ||||||||||||
|
Comprehensive income:
|
||||||||||||||||||||||||
|
Net earnings
|
― | ― | ― | 59,213 | ― | 59,213 | ||||||||||||||||||
|
Retirement benefit plans,
|
||||||||||||||||||||||||
|
net of taxes of $176
|
― | ― | ― | ― | (132 | ) | (132 | ) | ||||||||||||||||
|
Total comprehensive income
|
59,081 | |||||||||||||||||||||||
|
Share-based compensation expense
|
― | ― | 34,854 | ― | ― | 34,854 | ||||||||||||||||||
|
Exercise of common stock options
|
817 | 408 | 9,778 | ― | ― | 10,186 | ||||||||||||||||||
|
Shares issued under stock
|
||||||||||||||||||||||||
|
incentive plans
|
1,119 | 560 | 40 | ― | ― | 600 | ||||||||||||||||||
|
Shares cancelled upon reacquisition
|
(160 | ) | (80 | ) | 40 | ― | ― | (40 | ) | |||||||||||||||
|
Tax effect from the exercise of
|
||||||||||||||||||||||||
|
common stock options
|
― | ― | (540 | ) | ― | ― | (540 | ) | ||||||||||||||||
|
BALANCE AS OF FEBRUARY 28, 2009
|
220,392 | 110,196 | 685,938 | 813,793 | (16,860 | ) | 1,593,067 | |||||||||||||||||
|
Comprehensive income:
|
||||||||||||||||||||||||
|
Net earnings
|
― | ― | ― | 281,668 | ― | 281,668 | ||||||||||||||||||
|
Retirement benefit plans,
|
||||||||||||||||||||||||
|
net of taxes of $1,556
|
― | ― | ― | ― | (2,686 | ) | (2,686 | ) | ||||||||||||||||
|
Total comprehensive income
|
278,982 | |||||||||||||||||||||||
|
Share-based compensation expense
|
― | ― | 31,589 | ― | ― | 31,589 | ||||||||||||||||||
|
Exercise of common stock options
|
3,086 | 1,543 | 33,680 | ― | ― | 35,223 | ||||||||||||||||||
|
Shares issued under stock
|
||||||||||||||||||||||||
|
incentive plans
|
45 | 23 | 542 | ― | ― | 565 | ||||||||||||||||||
|
Shares cancelled upon reacquisition
|
(457 | ) | (229 | ) | (3,687 | ) | ― | ― | (3,916 | ) | ||||||||||||||
|
Tax effect from the exercise of
|
||||||||||||||||||||||||
|
common stock options
|
― | ― | (1,928 | ) | ― | ― | (1,928 | ) | ||||||||||||||||
|
BALANCE AS OF FEBRUARY 28, 2010
|
223,066 | 111,533 | 746,134 | 1,095,461 | (19,546 | ) | 1,933,582 | |||||||||||||||||
|
Impact of accounting change
(1)
|
― | ― | ― | (93,234 | ) | ― | (93,234 | ) | ||||||||||||||||
|
Comprehensive income:
|
||||||||||||||||||||||||
|
Net earnings
|
― | ― | ― | 380,878 | ― | 380,878 | ||||||||||||||||||
|
Retirement benefit plans,
|
||||||||||||||||||||||||
|
net of taxes of $1,215
|
― | ― | ― | ― | 2,017 | 2,017 | ||||||||||||||||||
|
Cash flow hedges,
|
||||||||||||||||||||||||
|
net of taxes of $398
|
― | ― | ― | ― | (7,528 | ) | (7,528 | ) | ||||||||||||||||
|
Total comprehensive income
|
375,367 | |||||||||||||||||||||||
|
Share-based compensation expense
|
― | ― | 29,214 | ― | ― | 29,214 | ||||||||||||||||||
|
Exercise of common stock options
|
3,126 | 1,563 | 44,067 | ― | ― | 45,630 | ||||||||||||||||||
|
Shares issued under stock
|
||||||||||||||||||||||||
|
incentive plans
|
33 | 17 | 458 | ― | ― | 475 | ||||||||||||||||||
|
Shares cancelled upon reacquisition
|
(339 | ) | (170 | ) | (7,183 | ) | ― | ― | (7,353 | ) | ||||||||||||||
|
Tax effect from the exercise of
|
||||||||||||||||||||||||
|
common stock options
|
― | ― | 7,949 | ― | ― | 7,949 | ||||||||||||||||||
|
BALANCE AS OF FEBRUARY 28, 2011
|
225,886 | $ | 112,943 | $ | 820,639 | $ | 1,383,105 | $ | (25,057 | ) | $ | 2,291,630 | ||||||||||||
|
(1)
|
As discussed in Note 2(E), this reflects the adoption of ASU Nos. 2009-16 and 2009-17 effective March 1, 2010
|
See accompanying notes to consolidated financial statements.
44
NOTES TO CONSOLIDATED FINANCIAL STATEMENTS
|
1.
|
BUSINESS AND BACKGROUND
|
CarMax, Inc. (“we”, “our”, “us”, “CarMax” and “the company”), including its wholly owned subsidiaries, is the largest retailer of used vehicles in the United States. We were the first used vehicle retailer to offer a large selection of high quality used vehicles at competitively low, no-haggle prices using a customer-friendly sales process in an attractive, modern sales facility. At select locations we also sell new vehicles under various franchise agreements. We provide customers with a full range of related products and services, including the financing of vehicle purchases through CarMax Auto Finance (“CAF”), our own finance operation, and third-party financing providers; the sale of extended service plans (“ESP”), guaranteed asset protection (“GAP”) and accessories; the appraisal and purchase of vehicles directly from consumers; and vehicle repair service. Vehicles purchased through the appraisal process that do not meet our retail standards are sold to licensed dealers through on-site wholesale auctions.
|
2.
|
SUMMARY OF SIGNIFICANT ACCOUNTING POLICIES
|
|
(A)
|
Basis of Presentation and Use of Estimates
|
The consolidated financial statements include the accounts of CarMax and our wholly owned subsidiaries. All significant intercompany balances and transactions have been eliminated in consolidation. The preparation of financial statements in conformity with U.S. generally accepted accounting principles (“GAAP”) requires management to make estimates and assumptions that affect the reported amounts of assets, liabilities, revenues and expenses and the disclosure of contingent assets and liabilities. Actual results could differ from those estimates. Amounts and percentages may not total due to rounding.
|
(B)
|
Cash and Cash Equivalents
|
Cash equivalents of $23.9 million as of February 28, 2011, and $0.5 million as of February 28, 2010, consisted of highly liquid investments with original maturities of three months or less.
|
(C)
|
Restricted Cash from Collections on Auto Loan Receivables
|
Cash accounts totaling $161.1 million as of February 28, 2011, consisted of collections of principal and interest payments on securitized auto loan receivables that are restricted for payment to the securitization investors pursuant to the applicable securitization agreements.
|
(D)
|
Accounts Receivable, Net
|
Accounts receivable, net of an allowance for doubtful accounts, include certain amounts due from third-party finance companies and customers, from new car manufacturers for incentives, from third parties for warranty reimbursements and for other miscellaneous receivables. The allowance for doubtful accounts is estimated based on historical experience and trends.
|
(E)
|
Securitizations
|
As of March 1, 2010, we adopted Financial Accounting Standards Board (“FASB”) Accounting Standards Update (“ASU”) Nos. 2009-16 and 2009-17 (formerly Statements of Financial Accounting Standards Nos. 166 and 167, respectively) on a prospective basis. ASU No. 2009-16 amended FASB Accounting Standards Codification (“ASC”) Topic 860, “Transfers and Servicing,” and ASU No. 2009-17 amended FASB ASC Topic 810, “Consolidation.” ASU No. 2009-16 removed the concept of a qualifying special-purpose entity (“QSPE”) from
Topic 860 and removed the provision within Topic 810 exempting these entities from consolidation. These pronouncements also clarified the requirements for isolation and the limitations on the portions of financial assets that are eligible for sale accounting treatment.
Pursuant to these pronouncements, we recognize transfers of auto loan receivables into term securitizations as secured borrowings, which results in recording the auto loan receivables and the related non-recourse notes payable to the investors on our consolidated balance sheets. All transfers of receivables into our warehouse facilities on or after March 1, 2010, are also accounted for as secured borrowings. As of March 1, 2010, we amended our warehouse facility agreement in effect as of that date. As a result, auto loan receivables previously securitized through that warehouse facility no longer qualify for sale treatment because, under the amendment, CarMax now has effective control over the receivables. The receivables that were funded in the warehouse facility at that date were consolidated, at their fair value, along with the related non-recourse notes payable to the investors.
45
The table below shows the combined effects of the adoption of ASU Nos. 2009-16 and 2009-17 and the March 1, 2010, amendment to our existing warehouse facility agreement on our February 28, 2010, consolidated balance sheets:
|
(In thousands)
|
Increase
(Decrease)
|
|||
|
Current Assets:
|
||||
|
Restricted cash from collections on auto loan receivables
|
$ | 162,608 | ||
|
Accounts receivable, net
|
(20,375 | ) | ||
|
Auto loan receivables held for sale
|
(30,578 | ) | ||
|
Retained interest in securitized receivables
|
(508,631 | ) | ||
|
Total Current Assets
|
(396,976 | ) | ||
|
Auto loan receivables, net
(1)(2)
|
4,043,595 | |||
|
Deferred income taxes
|
54,850 | |||
|
Other assets
|
43,835 | |||
|
TOTAL ASSETS
|
$ | 3,745,304 | ||
|
Current Liabilities:
|
||||
|
Accounts payable
|
$ | 6,544 | ||
|
Accrued expenses and other current liabilities
|
5,584 | |||
|
Current portion of non-recourse notes payable
(1)
|
134,798 | |||
|
Total Current Liabilities
|
146,926 | |||
|
Non-recourse notes payable
(1)(2)
|
3,691,612 | |||
|
TOTAL LIABILITIES
|
3,838,538 | |||
|
TOTAL SHAREHOLDERS’ EQUITY
(3)
|
(93,234 | ) | ||
|
TOTAL LIABILITIES AND SHAREHOLDERS’ EQUITY
|
$ | 3,745,304 | ||
|
(1)
|
The assets and liabilities of the term securitization trusts are separately presented on the face of the consolidated balance sheets, as required by ASU No. 2009-17.
|
|
(2)
|
In addition to the accounting change, this line includes the impact from the amendment to our existing warehouse facility agreement resulting in $331.0 million of receivables, along with the related non-recourse notes payable, being consolidated.
|
|
(3)
|
This solely represents the net effect of adopting ASU Nos. 2009-16 and 2007-17.
|
The adjustments in the above table include the following items:
|
·
|
Consolidation of the auto loan receivables and the related non-recourse notes payable funded in existing term securitizations.
|
|
·
|
Consolidation of the auto loan receivables and the related non-recourse notes payable funded in the existing warehouse facility.
|
|
·
|
Recognition of an allowance for loan losses on the consolidated auto loan receivables.
|
|
·
|
Consolidation of customer loan payments received but not yet distributed by the term securitization trusts. These payments are included in restricted cash from collections on auto loan receivables.
|
|
·
|
Reclassification of auto loan receivables held for sale to auto loan receivables.
|
|
·
|
Reclassification of certain balances previously included in retained interest in securitized receivables that relate to existing term securitizations.
|
|
·
|
Write-off of the remaining interest-only strip receivables related to term securitizations, previously recorded in retained interest in securitized receivables, and the related deferred tax liability. These write-offs were charged against retained earnings.
|
|
·
|
Recording of a net deferred tax asset, primarily related to the establishment of the allowance for loan losses.
|
Beginning in fiscal 2011, CAF income no longer includes a gain on the sale of loans through securitization transactions, but instead primarily reflects the interest and certain other income associated with the auto loan receivables less the interest expense associated with the non-recourse notes payable issued to fund these receivables, direct CAF expenses and a provision for estimated loan losses. See Notes 3 and 5 for additional information on securitizations.
46
|
(F)
|
Fair Value of Financial Instruments
|
Due to the short-term nature and/or variable rates associated with these financial instruments, the carrying value of our cash and cash equivalents, accounts receivable, restricted cash and investments, accounts payable, short-term debt and long-term debt approximates fair value. Our derivative instruments are recorded at fair value. See Note 7 for additional information on fair value measurements.
|
(G)
|
Inventory
|
Inventory is primarily comprised of vehicles held for sale or currently undergoing reconditioning and is stated at the lower of cost or market. Vehicle inventory cost is determined by specific identification. Parts and labor used to recondition vehicles, as well as transportation and other incremental expenses associated with acquiring and reconditioning vehicles, are included in inventory. Certain manufacturer incentives and rebates for new car inventory, including holdbacks, are recognized as a reduction to new car inventory when we purchase the vehicles.
|
(H)
|
Auto Loan Receivables, Net
|
Auto loan receivables include amounts due from customers primarily related to used retail vehicle sales financed through CAF and are presented net of an allowance for estimated loan losses. The allowance for loan losses represents an estimate of the amount of net losses inherent in the portfolio as of the applicable reporting date and anticipated to occur during the following 12 months. The allowance is primarily based on the credit quality of the underlying receivables, historical loss trends and forecasted forward loss curves. We also take into account recent trends in delinquencies and losses, recovery rates and the underlying economic environment. The provision for loan losses is the periodic cost of maintaining an adequate allowance.
An account is considered delinquent when the related customer fails to make a substantial portion of a scheduled payment on or before the due date. When an account is 75 days past due, the related vehicle is automatically eligible for repossession. Accounts are charged-off on the last business day of the month during which the earliest of the following occurs: the receivable is 120 days or more delinquent, the related vehicle is repossessed and liquidated or the receivable is otherwise deemed uncollectible. For purposes of determining impairment, auto loans are evaluated collectively, as they represent a large group of smaller-balance homogeneous loans, and therefore, are not individually evaluated for impairment. See Note 4 for additional information on auto loan receivables.
Interest income and expenses related to auto loans are included in CAF income. Interest income on auto loan receivables is recognized when earned based on contractual loan terms. All loans continue to accrue interest until repayment or charge-off. Direct costs associated with loan originations are not considered material. See Note 3 for a summary of CAF income.
|
(I)
|
Property and Equipment
|
Property and equipment is stated at cost less accumulated depreciation and amortization. Depreciation and amortization are calculated using the straight-line method over the shorter of the asset's estimated useful life or the lease term, if applicable. Property held under capital lease is stated at the lesser of the present value of the future minimum lease payments at the inception of the lease or fair value. Amortization of capital lease assets is computed on a straight-line basis over the shorter of the initial lease term or the estimated useful life of the asset and is included in depreciation expense. Costs incurred during new store construction are capitalized as construction-in-progress and reclassified to the appropriate fixed asset categories when the store is completed.
Estimated Useful Lives
|
Life
|
||
|
Buildings
|
25 years
|
|
|
Capital leases
|
15 – 20 years
|
|
|
Leasehold improvements
|
8 – 15 years
|
|
|
Furniture, fixtures and equipment
|
3 – 15 years
|
|
We review long-lived assets for impairment when circumstances indicate the carrying amount of an asset may not be recoverable. We recognize impairment when the sum of undiscounted estimated future cash flows expected to result from the use of the asset is less than the carrying value of the asset. In fiscal 2010, we recognized an impairment of $2.1 million related to an asset within land held for sale. No impairment of long-lived assets resulted from our impairment tests in fiscal 2011 or fiscal 2009.
47
|
(J)
|
Other Assets
|
Computer Software Costs.
We capitalize external direct costs of materials and services used in, and payroll and related costs for employees directly involved in the development of, internal-use software. We amortize amounts capitalized on a straight-line basis over five years.
Goodwill and Intangible Assets.
Goodwill and other intangibles had a carrying value of $10.1 million as of February 28, 2011 and 2010. We review goodwill and intangible assets for impairment annually or when circumstances indicate the carrying amount may not be recoverable. No impairment of goodwill or intangible assets resulted from our annual impairment tests in fiscal 2011, fiscal 2010 or fiscal 2009.
Restricted Cash on Deposit in Reserve Accounts.
The restricted cash on deposit in reserve accounts is for the benefit of the securitization investors. In the event that the cash generated by the securitized receivables in a given period was insufficient to pay the interest, principal and other required payments, the balances on deposit in the reserve accounts would be used to pay those amounts. These funds are restricted for the benefit of holders of non-recourse notes payable and are not expected to be available to the company or its creditors. Restricted cash on deposit in reserve accounts was $45.0 million as of February 28, 2011. Prior to March 1, 2010, the amount on deposit in reserve accounts was a component of retained interest in securitized receivables. See Note 5 for additional information on securitizations.
Restricted Investments.
Restricted investments consist of money market securities associated with certain insurance programs. Due to the short-term nature and/or variable rates associated with these financial instruments, the carrying value approximates fair value. Restricted investments included $26.7 million in money market securities as of February 28, 2011, and $30.7 million as of February 28, 2010. For fiscal 2011, there were no proceeds from the sales of other debt securities. For fiscal 2010, proceeds from the sales of other debt securities totaled $2.2 million.
|
(K)
|
Other Accrued Expenses
|
As of February 28, 2011 and 2010, accrued expenses and other current liabilities included accrued compensation and benefits of $65.9 million and $62.1 million, respectively, and loss reserves for general liability and workers’ compensation insurance of $21.6 million and $23.9 million, respectively.
|
(L)
|
Defined Benefit Plan Obligations
|
The recognized funded status of defined benefit retirement plan obligations is included both in accrued expenses and other current liabilities and in other liabilities. The current portion represents benefits expected to be paid from our benefit restoration plan over the next 12 months. The defined benefit retirement plan obligations are determined by independent actuaries using a number of assumptions provided by CarMax. Key assumptions used in measuring the plan obligations include the discount rate, rate of return on plan assets and mortality rate.
|
(M)
|
Insurance Liabilities
|
Insurance liabilities are included in accrued expenses and other current liabilities. We use a combination of insurance and self-insurance for a number of risks including workers' compensation, general liability and employee-related health care costs, a portion of which is paid by associates. Estimated insurance liabilities are determined by considering historical claims experience, demographic factors and other actuarial assumptions.
|
(N)
|
Revenue Recognition
|
We recognize revenue when the earnings process is complete, generally either at the time of sale to a customer or upon delivery to a customer. As part of our customer service strategy, we guarantee the retail vehicles we sell with a 5-day, money-back guarantee. If a customer returns the vehicle purchased within the parameters of the guarantee, we will refund the customer's money. We record a reserve for returns based on historical experience and trends.
We sell ESPs and GAP on behalf of unrelated third parties. The ESPs we offer on all used vehicles provide coverage up to 72 months (subject to mileage limitations), while GAP covers the customer for the term of their finance contract. Because we are not the primary obligor under these plans, we recognize commission revenue at the time of sale, net of a reserve for estimated customer returns. The reserve for returns is based on historical experience and trends.
We collect sales taxes and other taxes from customers on behalf of governmental authorities at the time of sale. These taxes are accounted for on a net basis and are not included in net sales and operating revenues or cost of sales.
48
|
(O)
|
Cost of Sales
|
Cost of sales includes the cost to acquire vehicles and the reconditioning and transportation costs associated with preparing the vehicles for resale. It also includes payroll, fringe benefits and parts and repair costs associated with reconditioning and vehicle repair services. We recognize volume-based incentives related to new vehicles as a reduction to cost of sales when we determine the achievement of qualifying sales volumes is probable.
|
(P)
|
Selling, General and Administrative Expenses
|
Selling, general and administrative (“SG&A”) expenses primarily include payroll expenses, other than payroll related to reconditioning and vehicle repair services; fringe benefits; rent and occupancy costs; advertising; and other general expenses.
|
(Q)
|
Advertising Expenses
|
Advertising costs are expensed as incurred and are included in SG&A expenses. Advertising expenses were $96.2 million in fiscal 2011, $75.1 million in fiscal 2010 and $101.5 million in fiscal 2009. Advertising expenses were 1.1% of net sales and operating revenues for fiscal 2011, 1.0% for fiscal 2010 and 1.5% for fiscal year 2009.
|
(R)
|
Store Opening Expenses
|
Costs related to store openings, including preopening costs, are expensed as incurred and are included in SG&A expenses.
|
(S)
|
Share-Based Compensation
|
Share-based compensation represents the cost related to share-based awards granted to employees and non-employee directors. We measure share-based compensation cost at the grant date, based on the estimated fair value of the award, and we recognize the cost on a straight-line basis (net of estimated forfeitures) over the grantee’s requisite service period, which is generally the vesting period of the award. We estimate the fair value of stock options using a binomial valuation model. Key assumptions used in estimating the fair value of options are dividend yield, expected volatility, risk-free interest rate and expected term. The fair value of restricted stock is based on the volume-weighted average market value on the date of the grant. The fair value of stock-settled restricted stock units is determined using a Monte-Carlo simulation based on the expected market price of our common stock on the vesting date and the expected number of converted common shares. Cash-settled restricted stock units are liability awards with fair value measurement based on the market price of CarMax common stock as of the end of each reporting period. Share-based compensation expense is recorded in either cost of sales, CAF income or SG&A expenses based on the recipients’ respective function.
We record deferred tax assets for awards that result in deductions on our income tax returns, based on the amount of compensation expense recognized and the statutory tax rate in the jurisdiction in which we will receive a deduction. Differences between the deferred tax assets recognized for financial reporting purposes and the actual tax deduction reported on the income tax return are recorded in capital in excess of par value (if the tax deduction exceeds the deferred tax asset) or in the consolidated statements of earnings (if the deferred tax asset exceeds the tax deduction and no capital in excess of par value exists from previous awards).
|
(T)
|
Derivative Instruments and Hedging Activities
|
We enter into derivative instruments to manage exposures that arise from business activities that result in the future known receipt or payment of uncertain cash amounts, the values of which are determined by interest rates. We recognize the derivatives at fair value as either current assets or current liabilities on the consolidated balance sheets. Where applicable, such contracts covered by master netting agreements are reported net. Gross positive fair values are netted with gross negative fair values by counterparty. The accounting for changes in the fair value of derivatives depends on the intended use of the derivative, whether we have elected to designate a derivative in a hedging relationship and apply hedge accounting and whether the hedging relationship has satisfied the criteria necessary to apply hedge accounting. We may enter into derivative contracts that are intended to economically hedge certain risks, even though hedge accounting may not apply or we do not elect to apply hedge accounting. See Note 6 for additional information on derivative instruments and hedging activities.
|
(U)
|
Income Taxes
|
We file a consolidated federal income tax return for a majority of our subsidiaries. Certain subsidiaries are required to file separate partnership or corporate federal income tax returns. Deferred income taxes reflect the impact of temporary differences between the amounts of assets and liabilities recognized for financial reporting purposes and the amounts recognized for income tax purposes, measured by applying currently enacted tax laws. A deferred tax asset is recognized if it is more likely than not that a benefit will be realized. Changes in tax laws and tax rates are reflected in the income tax provision in the period in which the changes are enacted.
49
We recognize tax liabilities when, despite our belief that our tax return positions are supportable, we believe that certain positions may not be fully sustained upon review by tax authorities. Benefits from tax positions are measured at the highest tax benefit that is greater than 50% likely of being realized upon settlement. The current portion of these tax liabilities is included in accrued income taxes and any noncurrent portion is included in other liabilities. To the extent that the final tax outcome of these matters is different from the amounts recorded, the differences impact income tax expense in the period in which the determination is made. Interest and penalties related to income tax matters are included in SG&A expenses.
|
(V)
|
Net Earnings Per Share
|
Basic net earnings per share is computed by dividing net earnings, less earnings allocated to participating securities, by the weighted average number of shares of common stock outstanding. Diluted net earnings per share is computed by dividing net earnings, less earnings allocated to participating securities, by the sum of the weighted average number of shares of common stock outstanding and dilutive potential common stock. See Note 13 for additional information on net earnings per share.
|
(W)
|
Risks and Uncertainties
|
We sell used and new vehicles. The diversity of our customers and suppliers and the highly fragmented nature of the U.S. automotive retail market reduce the risk that near-term changes in our customer base, sources of supply or competition will have a severe impact on our business. However, unanticipated events could have an adverse effect on our business, results of operations and financial condition.
|
(X)
|
Recent Accounting Pronouncements
|
In January 2010, the FASB issued an additional accounting pronouncement related to fair value measurements (FASB ASC Topic 820), which requires fair value hierarchy disclosures to be further disaggregated by class of assets and liabilities. A class is often a subset of assets or liabilities within a line item on the consolidated balance sheets. In addition, significant transfers in and out of Levels 1 and 2 of the fair value hierarchy and the reasons for the transfers will be required to be disclosed. This provision of the pronouncement is effective for reporting periods beginning after December 15, 2009. Accordingly, we adopted the provision as of March 1, 2010, with no significant transfers other than the effects of adopting ASU Nos. 2009-16 and 2009-17. An additional provision, effective for reporting periods beginning after December 15, 2010, requires that the reconciliation of Level 3 activity present information about purchases, sales, issuances and settlements on a gross basis instead of as one net number. If applicable, we will include the additional required disclosures for our fiscal year beginning March 1, 2011.
In July 2010, the FASB issued an additional accounting pronouncement related to receivables (FASB ASC Topic 310), which requires additional disclosures about a company’s allowance for credit losses and the credit quality of the company’s financing receivables. For disclosures as of the end of a reporting period, this pronouncement is effective for reporting periods ending after December 15, 2010. We have included the additional required disclosures in our annual report for our fiscal year ending February 28, 2011. For disclosures about activity that occurs during a reporting period, this pronouncement is effective for reporting periods beginning after December 15, 2010. We will include additional required disclosures for our fiscal year beginning March 1, 2011.
In December 2010, the FASB issued an accounting pronouncement related to intangibles – goodwill and other (FASB ASC Topic 350), which requires a company to consider whether there are any adverse qualitative factors indicating that an impairment may exist in performing step 2 of the impairment test for reporting units with zero or negative carrying amounts. The provisions for this pronouncement are effective for fiscal years, and interim periods within those years, beginning after December 15, 2010, with no early adoption. We will adopt this pronouncement for our fiscal year beginning March 1, 2011. The adoption of this pronouncement is not expected to have an impact on our consolidated financial statements.
In December 2010, the FASB issued an accounting pronouncement related to business combinations (FASB ASC Topic 805), which requires a company to disclose revenue and earnings of the combined entity as though the business combination that occurred during the current year had occurred as of the beginning of the comparable prior annual reporting period only in comparative financial statements. The disclosure provisions are effective prospectively for business combinations for which the acquisition date is on or after the beginning of the first annual reporting period beginning on or after December 15, 2010, with early adoption permitted. If applicable, we will include the required disclosures for our fiscal year beginning March 1, 2011.
50
|
3.
|
CARMAX AUTO FINANCE INCOME
|
|
Years Ended February 28
|
||||||||||||
|
(In millions)
|
2011
|
2010
|
2009
|
|||||||||
|
Managed portfolio income:
|
||||||||||||
|
Interest and fee income
|
$ | 419.1 | $ | ― | $ | ― | ||||||
|
Servicing fee income
|
0.9 | 41.9 | 41.3 | |||||||||
|
Interest income on retained interest in securitized receivables
|
1.6 | 68.5 | 48.3 | |||||||||
|
Total managed portfolio income
|
421.6 | 110.4 | 89.6 | |||||||||
|
Gain (loss):
|
||||||||||||
|
Gain on sales of loans originated and sold
|
― | 83.0 | 46.5 | |||||||||
|
Other gains
|
5.0 | 26.7 | (81.8 | ) | ||||||||
|
Total gain (loss)
|
5.0 | 109.7 | (35.3 | ) | ||||||||
|
Expenses:
|
||||||||||||
|
Interest expense
|
133.8 | ― | ― | |||||||||
|
Provision for loan losses
|
27.7 | ― | ― | |||||||||
|
Payroll and fringe benefit expense
|
20.6 | 20.2 | 19.2 | |||||||||
|
Other direct expenses
|
24.5 | 24.7 | 19.9 | |||||||||
|
Total expenses
|
206.6 | 44.9 | 39.1 | |||||||||
|
CarMax Auto Finance income
|
$ | 220.0 | $ | 175.2 | $ | 15.3 | ||||||
|
Total average managed receivables, principal only
|
$ | 4,229.9 | $ | 4,057.2 | $ | 3,998.4 | ||||||
CAF provides financing for qualified customers at competitive market rates of interest. We securitize substantially all of the loans originated by CAF, as discussed in Note 5. Beginning in fiscal 2011, CAF income no longer includes a gain on the sale of loans through securitization transactions, but instead primarily reflects the interest and certain other income associated with the auto loan receivables less the interest expense associated with the non-recourse notes payable issued to fund these receivables, direct CAF expenses and a provision for estimated loan losses.
Prior to March 1, 2010, the majority of CAF income was typically generated by the spread between the interest rates charged to customers and the related funding cost for loans originated during the period. A gain, recorded at the time of securitization, resulted from recording a receivable approximately equal to the present value of the expected residual cash flows generated by the securitized receivables. The cash flows were calculated taking into account expected prepayments, losses and funding costs. The gain on sales of loans originated and sold included both the gain income recorded at the time of securitization and the effect of any subsequent changes in valuation assumptions or funding costs that were incurred in the same fiscal period that the loans were originated. Other gains or losses included the effects of changes in valuation assumptions or funding costs related to loans originated and sold during previous fiscal periods, the effects of new term securitizations and changes in the valuation of retained subordinated bonds, as applicable.
CAF income does not include any allocation of indirect costs or income. We present this information on a direct basis to avoid making arbitrary decisions regarding the indirect benefits or costs that could be attributed to CAF. Examples of indirect costs not included are retail store expenses and corporate expenses such as human resources, administrative services, marketing, information systems, accounting, legal, treasury and executive payroll.
51
|
4.
|
AUTO LOAN RECEIVABLES
|
Auto loan receivables include amounts due from customers primarily related to used retail vehicle sales financed through CAF and are presented net of an allowance for estimated loan losses. We use securitization warehouse facilities to fund auto loan receivables originated by CAF until they are funded through a term securitization or alternative funding arrangement. See Note 5 for additional information on securitizations.
Auto Loan Receivables, Net
|
As of February 28
|
||||||||||||
|
(In millions)
|
2011
|
2010
|
2009
|
|||||||||
|
Warehouse facilities
(1)
|
$ | 943.0 | $ | 331.0 | $ | 1,215.0 | ||||||
|
Term securitizations
(1)
|
3,193.1 | 3,615.6 | 2,616.9 | |||||||||
|
Loans held for investment
|
― | 135.5 | 145.1 | |||||||||
|
Loans held for sale
|
― | 30.6 | 9.7 | |||||||||
|
Other receivables
(2)
|
198.5 | ― | ― | |||||||||
|
Total ending managed receivables
|
4,334.6 | $ | 4,112.7 | $ | 3,986.7 | |||||||
|
Accrued interest and fees
|
20.9 | |||||||||||
|
Other
|
4.0 | |||||||||||
|
Less allowance for loan losses
|
(38.9 | ) | ||||||||||
|
Auto loan receivables, net
|
$ | 4,320.6 | ||||||||||
|
(1)
|
Amounts were off-balance sheet prior to March 1, 2010.
|
|
(2)
|
Other receivables includes required excess receivables and receivables not funded through the warehouse facilities.
|
Past Due Receivables
|
As of February 28
|
||||||||
|
(In millions)
|
2011
|
% | (1) | |||||
|
Total ending managed receivables
|
$ | 4,334.6 | 100.0 | |||||
|
Delinquent loans:
|
||||||||
|
31-60 days past due
|
$ | 86.6 | 2.0 | |||||
|
61-90 days past due
|
24.2 | 0.6 | ||||||
|
Greater than 90 days past due
|
10.5 | 0.2 | ||||||
|
Total past due
|
$ | 121.3 | 2.8 | |||||
|
(1)
|
Percent of total ending managed receivables.
|
Credit Quality.
When customers apply for financing, CAF uses proprietary scoring models that rely on the customers’ prior credit history and certain application information to evaluate and rank their risk. Prior credit history is obtained from credit bureau reporting agencies and includes information such as number, age, type of and payment history for prior or existing credit accounts. The application information that is used includes income, collateral value and down payment. Our scoring models yield credit grades that represent the relative likelihood of repayment. Customers assigned a grade of “A” are determined to have the highest probability of repayment, and customers assigned a lower grade are determined to have a lower probability of repayment. For loans that are approved, the credit grade influences the terms of the agreement, such as the required loan-to-value ratio and interest rate.
52
CAF uses a combination of the initial credit grades and historical performance to monitor the credit quality of the auto loan receivables on an ongoing basis. We validate the accuracy of the scoring models periodically. Loan performance is reviewed on a recurring basis to identify whether the assigned grades are adequately reflecting the customers’ likelihood of repayment.
Ending Managed Receivables by Major Credit Grade
|
As of February 28
|
|||||||||
|
(In millions)
|
2011
(1)
|
% | (2) | ||||||
| A | $ | 2,234.1 | 51.5 | ||||||
| B | 1,668.0 | 38.5 | |||||||
|
C and other
|
432.5 | 10.0 | |||||||
|
Total ending managed receivables
|
$ | 4,334.6 | 100.0 | ||||||
|
(1)
|
Classified based on credit grade assigned when customers were approved for financing.
|
|
(2)
|
Percent of total ending managed receivables.
|
|
5.
|
SECURITIZATIONS
|
Securitization Financing.
We maintain a revolving securitization program comprised of two warehouse facilities (“warehouse facilities”) that we use to fund auto loan receivables originated by CAF until they are funded through a term securitization or alternative funding arrangement. We sell the auto loan receivables to a wholly owned, bankruptcy-remote, special purpose entity that transfers an undivided percentage ownership interest in the receivables, but not the receivables themselves, to entities formed by third-party investors (“bank conduits”). The bank conduits issue asset-backed commercial paper supported by the transferred receivables, and the proceeds from the sale of the commercial paper are used to finance the securitized receivables.
The bank conduits may be considered variable interest entities, but are not consolidated because our interest does not constitute a variable interest in the entities. We hold a variable interest in specified assets transferred to the entities rather than interests in the entities themselves.
We typically use term securitizations to refinance the auto loan receivables previously securitized through the warehouse facilities. The purpose of term securitizations is to provide long-term funding for these receivables. In these transactions, a pool of auto loan receivables is sold to a bankruptcy-remote, special purpose entity that, in turn, transfers the receivables to a special purpose securitization trust. The securitization trust issues asset-backed securities, secured or otherwise supported by the transferred receivables, and the proceeds from the sale of the asset-backed securities are used to finance the securitized receivables. Refinancing receivables in a term securitization could have an impact on our results of operations depending on the transaction structure and market conditions.
The warehouse facilities and the term securitizations are governed by various legal documents that limit and specify the activities of the special purpose entities and term securitization trusts (collectively, “securitization vehicles”) used to facilitate the securitizations. The securitization vehicles are generally allowed to acquire the receivables being sold to them, issue asset-backed securities to investors to fund the acquisition of the receivables and enter into derivatives or other yield maintenance contracts to hedge or mitigate certain risks related to the pool of receivables or asset-backed securities. Additionally, the securitization vehicles are required to service the receivables they hold and the securities they have issued. These servicing functions are performed by CarMax, as appointed within the underlying legal documents. Servicing functions include, but are not limited to, collecting payments from borrowers, monitoring delinquencies, liquidating assets, investing funds until distribution, remitting payments to the trustee who in turn remits payments to the investors, and accounting for and reporting information to investors.
The securitized receivables can only be used as collateral to settle obligations of the securitization vehicles. The securitization vehicles and investors have no recourse to our assets beyond the securitized receivables, the amounts on deposit in reserve accounts and the restricted cash from collections on auto loan receivables. We have not provided financial or other support to the securitization vehicles or investors that was not previously contractually required. There are no additional arrangements, guarantees or other commitments that could require us to provide financial support to the securitization vehicles.
Financial Covenants and Performance Triggers.
The securitization agreements related to the warehouse facilities include various financial covenants and performance triggers. The financial covenants include a maximum total liabilities to tangible net worth ratio and a minimum fixed charge coverage ratio. Performance triggers require that the pools of securitized receivables in the warehouse facilities achieve specified thresholds related to loss and delinquency rates. If these financial covenants and/or thresholds are not met, we could be unable to continue to securitize receivables through the warehouse facilities. In addition, the warehouse facility investors would charge us a higher rate of interest and could have us replaced as servicer. Further, we could be required to deposit collections on the securitized receivables with the warehouse facility agents on a daily basis and deliver executed lockbox
53
agreements to the warehouse facility agents. As of February 28, 2011, we were in compliance with the financial covenants and the securitized receivables were in compliance with the performance triggers.
Continuing Involvement with Securitized Receivables.
We continue to manage the auto loan receivables that we securitize. We receive servicing fees of approximately 1% of the outstanding principal balance of the securitized receivables. We believe that the servicing fees specified in the securitization agreements adequately compensate us for servicing the securitized receivables. No servicing asset or liability has been recorded.
Transition.
Effective March 1, 2010, all transfers of auto loan receivables related to the warehouse facilities are accounted for as secured borrowings. These transfers represent only a portion of the auto loan receivables and this portion does not meet the definition of a participating interest because our interest in the transferred receivables is subordinate to the interest of the investors in the bank conduits.
As of March 1, 2010, we amended our warehouse facility agreement in effect as of that date. As a result, auto loan receivables previously securitized through that warehouse facility no longer qualify for sale treatment because, under the amendment, CarMax now has effective control over the receivables. The receivables that were funded in the warehouse facility at that date were consolidated, at their fair value, along with the related non-recourse notes payable to the investors.
With the removal of the QSPE consolidation exemption from FASB ASC Topic 810, effective March 1, 2010, we are required to evaluate existing and future term securitization trusts for consolidation. In our capacity as servicer, we have the power to direct the activities of the trusts that most significantly impact the economic performance of the receivables. In addition, we have the obligation to absorb losses (subject to limitations) and the rights to receive any returns of the trusts, which could be significant. Accordingly, we are the primary beneficiary of the trusts and are required to consolidate them, effective March 1, 2010. The auto loan receivables securitized through the term securitization trusts were consolidated at their unpaid principal balances as of that date, net of an allowance for loan losses, along with the related non-recourse notes payable to the investors.
See Note 2(E) for a summary of the combined effects of the adoption of ASU Nos. 2009-16 and 2009-17 and the March 1, 2010, amendment to our existing warehouse facility agreement.
As of February 28, 2011, $4.33 billion in ending managed receivables were reported in accordance with FASB ASC Topic 810. This amount serves as collateral for the related non-recourse notes payable of $4.01 billion as of the same date. See Notes 4 and 11 for additional information on auto loan receivables and non-recourse notes payable.
Retained Interest.
Prior to March 1, 2010, all transfers of auto loan receivables were accounted for as sales. When the receivables were securitized, we recognized a gain on the sale and retained an interest in the receivables that were securitized. The retained interest included the present value of the expected residual cash flows generated by the securitized receivables, or “interest-only strip receivables,” various reserve accounts, required excess receivables and retained subordinated bonds. As of February 28, 2011, there was no retained interest, as all transfers of auto loan receivables were accounted for as secured borrowings.
As part of the adoption of ASU Nos. 2009-16 and 2009-17, as of March 1, 2010, any retained interest related to term securitizations was either eliminated or reclassified, generally to auto loan receivables, accrued interest receivable or restricted cash. On March 1, 2010, we also amended our existing warehouse facility agreement. However, this did not result in the elimination or reclassification of the retained interest related to the receivables that were funded in the warehouse facility as of that date. In May 2010, we repurchased the remaining portion of those receivables and resecuritized them through our second warehouse facility established in the first quarter of fiscal 2011. As a result, the retained interest related to these receivables was either eliminated or reclassified at that time. See Note 11 for additional information on our warehouse facilities.
54
Fiscal 2010 Securitization Information
Except as noted, the following disclosures apply to our securitization activities prior to March 1, 2010, when transfers of auto loan receivables were accounted for as sales.
The fair value of the retained interest was $552.4 million as of February 28, 2010, and the receivables underlying the retained interest had a weighted average life of 1.5 years as of that date. The weighted average life in periods (for example, months or years) of prepayable assets was calculated by multiplying the principal collections expected in each future period by the number of periods until that future period, summing those products and dividing the sum by the initial principal balance.
Interest-Only Strip Receivables.
Interest-only strip receivables represented the present value of residual cash flows we expected to receive over the life of the securitized receivables. The value of these receivables was determined by estimating the future cash flows using our assumptions of key factors, such as finance charge income, loss rates, prepayment rates, funding costs and discount rates appropriate for the type of asset and risk. The value of interest-only strip receivables could have been affected by external factors, such as changes in the behavior patterns of customers, changes in the strength of the economy and developments in the interest rate and credit markets; therefore, actual performance could have differed from these assumptions. We evaluated the performance of the receivables relative to these assumptions on a regular basis. Any financial impact resulting from a change in performance was recognized in earnings in the period in which it occurred. Effective March 1, 2010, interest-only strip receivables are no longer reported on the consolidated balance sheets.
Reserve Accounts.
We are required to fund various reserve accounts established for the benefit of the securitization investors. In the event that the cash generated by the securitized receivables in a given period was insufficient to pay the interest, principal and other required payments, the balances on deposit in the reserve accounts would be used to pay those amounts. In general, each of our term securitizations requires that an amount equal to a specified percentage of the original balance of the securitized receivables be deposited in a reserve account on the closing date. An amount equal to a specified percentage of funded receivables is also required for our warehouse facilities. Any excess cash generated by the receivables must be used to fund the reserve account to the extent necessary to maintain the required amount. If the amount on deposit in the reserve account exceeds the required amount, the excess is released to us. In the term securitizations, the amount required to be on deposit in the reserve account must equal or exceed a specified floor amount. The reserve account remains funded until the investors are paid in full, at which time the remaining balance is released to us. As of February 28, 2010, the amount on deposit in reserve accounts was $47.4 million. Effective March 1, 2010, the amount on deposit in reserve accounts is reported as restricted cash within other assets on our consolidated balance sheets.
Required Excess Receivables.
The total value of the securitized receivables must exceed the principal amount owed to the investors by a specified amount. The required excess receivables balance represents this specified amount. Any cash flows generated by the required excess receivables are used, if needed, to make payments to the investors. Any remaining cash flows from the required excess receivables are released to us. As of February 28, 2010, the unpaid principal balance related to the required excess receivables was $129.5 million. Effective March 1, 2010, required excess receivables are included in auto loan receivables on our consolidated balance sheets.
Retained Subordinated Bonds.
Between January 2008 and April 2009, we retained some or all of the subordinated bonds associated with our term securitizations. We received periodic interest payments on certain bonds. The bonds were carried at fair value and changes in fair value were included in earnings as a component of CAF income. We based our valuation on observable market prices of the same or similar instruments when available; however, observable market prices were not consistently available for these assets. Therefore, our valuations were primarily based on an average of three non-binding, market spread quotes from third-party investment banks. By applying these average spreads to the bond benchmarks, as determined through the use of a widely accepted third-party bond pricing model, we measured a fair value. As of February 28, 2010, the fair value of retained subordinated bonds was $248.8 million. Effective March 1, 2010, the retained subordinated bonds are eliminated as a part of the consolidation of the term securitization trusts.
55
Past Due Account Information
|
As of February 28
|
||||||||
|
(In millions)
|
2010
|
2009
|
||||||
|
Accounts 31+ days past due
|
$ | 133.2 | $ | 118.1 | ||||
|
Ending managed receivables
|
$ | 4,112.7 | $ | 3,986.7 | ||||
|
Past due accounts as a percentage of ending managed
receivables
|
3.24 | % | 2.96 | % | ||||
Credit Loss Information
|
Years Ended February 28
|
||||||||
|
(In millions)
|
2010
|
2009
|
||||||
|
Net credit losses on managed receivables
|
$ | 70.1 | $ | 69.8 | ||||
|
Total average managed receivables, principal only
|
$ | 4,057.2 | $ | 3,998.4 | ||||
|
Net credit losses as a percentage of total average
managed receivables, principal only
|
1.73 | % | 1.75 | % | ||||
|
Average recovery rate
|
49.8 | % | 44.0 | % | ||||
Selected Cash Flows from Securitized Receivables
|
Years Ended February 28
|
||||||||
|
(In millions)
|
2010
|
2009
|
||||||
|
Proceeds from new securitizations
|
$ | 1,647.0 | $ | 1,622.8 | ||||
|
Proceeds from collections
|
$ | 779.2 | $ | 840.6 | ||||
|
Servicing fees received
|
$ | 41.8 | $ | 41.3 | ||||
|
Other cash flows received from the retained interest:
|
||||||||
|
Interest-only strip and excess receivables
|
$ | 131.0 | $ | 96.7 | ||||
|
Reserve account releases
|
$ | 16.6 | $ | 6.4 | ||||
|
Interest on retained subordinated bonds
|
$ | 9.5 | $ | 7.5 | ||||
Proceeds from New Securitizations.
Proceeds from new securitizations included proceeds from receivables that were newly securitized in or refinanced through the warehouse facility during the indicated period. Balances previously outstanding in term securitizations that were refinanced through the warehouse facility totaled $76.0 million in fiscal 2010 and $101.0 million in fiscal 2009. Proceeds received when we refinance receivables from the warehouse facility are excluded from this table as they are not considered new securitizations.
Proceeds from Collections.
Proceeds from collections represented principal amounts collected on receivables securitized through the warehouse facility that were used to fund new originations.
Servicing Fees Received.
Servicing fees received represented cash fees paid to us to service the securitized receivables.
Other Cash Flows Received from the Retained Interest.
Other cash flows received from the retained interest represented cash that we received from the securitized receivables other than servicing fees. It included cash collected on interest-only strip and excess receivables, amounts released to us from reserve accounts and interest on retained subordinated bonds.
|
6.
|
DERIVATIVE INSTRUMENTS AND HEDGING ACTIVITIES
|
Risk Management Objective of Using Derivatives.
We are exposed to certain risks arising from both our business operations and economic conditions, particularly with regard to future issuances of fixed-rate debt and existing and future issuances of floating-rate debt. Primary exposures include LIBOR and other rates used as benchmarks in our term securitizations. We enter into derivative instruments to manage exposures that arise from business activities that result in the future known receipt or payment of uncertain cash amounts, the value of which are determined by interest rates. Our derivative instruments are used to manage differences in the amount of our known or expected cash receipts and our known or expected cash payments principally related to the funding of our auto loan receivables.
We do not anticipate significant market risk from derivatives as they are predominantly used to match funding costs to the use of the funding. However, disruptions in the credit
56
markets could impact the effectiveness of our hedging strategies. Credit risk is the exposure to nonperformance of another party to an agreement. We mitigate credit risk by dealing with highly rated bank counterparties.
Cash Flow Hedges of Interest Rate Risk.
Our objectives in using interest rate derivatives are to add stability to interest expense, to manage our exposure to interest rate movements and to better match funding costs to the interest received on the fixed-rate receivables being securitized. To accomplish these objectives, we primarily use interest rate swaps. Interest rate swaps designated as cash flow hedges involve the receipt of variable amounts from a counterparty in exchange for our making fixed-rate payments over the life of the agreements
without exchange of the underlying notional amount. These interest rate swaps are designated as cash flow hedges of forecasted interest payments in anticipation of permanent funding in the term securitization market. Prior to March 1, 2010, no derivative instruments were designated as cash flow hedges.
For derivatives that are designated and qualify as cash flow hedges, the effective portion of changes in the fair value is initially recorded in accumulated other comprehensive loss (“AOCL”) and is subsequently reclassified into CAF income in the period that the hedged forecasted transaction affects earnings. The ineffective portion of the change in fair value of the derivatives is recognized directly in CAF income.
Amounts reported in AOCL related to derivatives will be reclassified to CAF income as interest expense is incurred on our future issuances of fixed-rate debt. During the next 12 months, we estimate that an additional $5.8 million will be reclassified as a decrease to CAF income.
During the year ended February 28, 2011, we entered into the following interest rate derivatives that were designated as cash flow hedges of interest rate risk:
|
Year Ended February 28, 2011
|
|||
|
Product
|
Number of Instruments
|
Initial Term
|
Initial Notional Amount
(in thousands)
|
|
Interest rate swaps
|
16
|
46 months
|
$1,936,000
|
As of February 28, 2011, we had the following outstanding derivatives that were designated as cash flow hedges:
|
As of February 28, 2011
|
|||
|
Product
|
Number of Instruments
|
Remaining Term
|
Current Notional Amount
(in thousands)
|
|
Interest rate swaps
|
8
|
46 months
|
$972,000
|
Non-designated Hedges.
Derivative instruments not designated as accounting hedges, including interest rate swaps and interest rate caps, are not speculative and are used to better match funding costs to the interest on fixed-rate receivables being securitized, to minimize the funding costs related to certain term securitization trusts and to limit risk for investors in the warehouse facilities. Changes in the fair value of derivatives not designated as accounting hedges are recorded directly in CAF income. Prior to March 1, 2010, substantially all of the changes in the fair value of derivatives were offset by the changes in fair value of our retained interest in the related securitized receivables, which were also recorded in CAF income. See Note 5 for additional information on retained interest.
Certain term securitization trusts have entered into derivative instruments, such as interest rate swaps, to mitigate their interest rate risk on a related financial instrument or to lock the interest rate on a portion of its asset-backed variable debt. Effective March 1, 2010, the derivative instruments of the term securitization trusts were consolidated on our consolidated balance sheets as part of the adoption of ASU Nos. 2009-16 and 2009-17.
57
During the year ended February 28, 2011, we entered into the following interest rate derivatives that were not designated as accounting hedges:
|
Year Ended February 28, 2011
|
|||||||||
|
Product
|
Number of Instruments
|
Initial Term
|
Initial Notional Amount
(in thousands)
|
||||||
|
Interest rate caps
(1)
|
4 |
47 to 53 months
|
$ | ― | |||||
|
(1)
|
Includes two asset derivatives and two liability derivatives with offsetting initial notional amounts of $31.6 million.
|
As of February 28, 2011, we had the following outstanding derivatives that were not designated as accounting hedges:
|
As of February 28, 2011
|
|||||||||
|
Product
|
Number of Instruments
|
Remaining Term
|
Current Notional Amount
(in thousands)
|
||||||
|
Interest rate swaps
|
6 |
19 to 30 months
|
$ | 147,363 | |||||
|
Interest rate caps
(1)
|
10 |
30 to 48 months
|
$ | ― | |||||
|
(1)
|
Includes five asset derivatives and five liability derivatives with offsetting notional amounts of $1.0 billion.
|
Fair Values of Derivative Instruments on the Consolidated Balance Sheets.
The tables below present the fair value of our derivative instruments as well as their classification on the consolidated balance sheets. See Note 7 for additional information on fair value measurements.
Derivatives Designated as Accounting Hedges
Derivatives Not Designated as Accounting Hedges
|
As of February 28
|
|||||||||
|
(In thousands)
|
Location
|
2011
|
2010
|
||||||
|
Asset derivatives:
|
|||||||||
|
Interest rate swaps
|
Other current assets
|
$ | 1,136 | $ | 1,279 | ||||
|
Interest rate caps
|
Other current assets
|
778 | 1,999 | ||||||
|
Liability derivatives:
|
|||||||||
|
Interest rate swaps
|
Accounts payable
|
(2,742 | ) | (7,171 | ) | ||||
|
Interest rate caps
|
Other current assets
|
(779 | ) | (1,982 | ) | ||||
|
Total
|
$ | (1,607 | ) | $ | (5,875 | ) | |||
Effect of Derivative Instruments on the Consolidated Statements of Earnings.
The tables below present the effect of the company’s derivative instruments on the consolidated statements of earnings for the years ended February 28, 2011, 2010 and 2009.
58
Derivatives Designated as Accounting Hedges
|
Years Ended February 28
|
||||||||||||
|
(In thousands)
|
2011
|
2010
|
2009
|
|||||||||
|
Interest rate swaps:
|
||||||||||||
|
Loss recognized in AOCL
(1)
|
$ | 10,376 | $ | ― | $ | ― | ||||||
|
Loss reclassified from AOCL into CAF Income
(1)
|
$ | 2,450 | $ | ― | $ | ― | ||||||
|
Loss recognized in CAF Income
(2)
|
$ | 4 | $ | ― | $ | ― | ||||||
|
(1)
|
Represents the effective portion.
|
|
(2)
|
Represents the ineffective portion and amount excluded from effectiveness testing.
|
Derivatives Not Designated as Accounting Hedges
|
Years Ended February 28
|
|||||||||||||
|
(In thousands)
|
Location
|
2011
|
2010
|
2009
|
|||||||||
|
Gain (loss) on interest rate swaps
(1)
|
CAF Income
|
$ | 3,661 | $ | (8,547 | ) | $ | (15,214 | ) | ||||
|
Net periodic settlements and accrued interest
|
CAF Income
|
(7,969 | ) | (20,128 | ) | (16,127 | ) | ||||||
|
Total
|
$ | (4,308 | ) | $ | (28,675 | ) | $ | (31,341 | ) | ||||
|
(1)
|
Prior to March 1, 2010, substantially all of the changes in the fair value of derivatives were offset by changes in fair value of our retained interest in the related securitized receivables, which were also recorded in CAF Income.
|
|
7.
|
FAIR VALUE MEASUREMENTS
|
Fair value is defined as the price that would be received to sell an asset or paid to transfer a liability in an orderly transaction between market participants in the principal market or, if none exists, the most advantageous market, for the specific asset or liability at the measurement date (referred to as the “exit price”). The fair value should be based on assumptions that market participants would use, including a consideration of nonperformance risk.
We assess the inputs used to measure fair value using the three-tier hierarchy. The hierarchy indicates the extent to which inputs used in measuring fair value are observable in the market.
|
|
Level 1
|
Inputs include unadjusted quoted prices in active markets for identical assets or liabilities that we can access at the measurement date.
|
|
|
Level 2
|
Inputs other than quoted prices included within Level 1 that are observable for the asset or liability, either directly or indirectly, including quoted prices for similar assets in active markets, quoted prices from identical or similar assets in inactive markets and observable inputs such as interest rates and yield curves.
|
|
|
Level 3
|
Inputs that are significant to the measurement that are not observable in the market and include management's judgments about the assumptions market participants would use in pricing the asset or liability (including assumptions about risk).
|
Our fair value processes include controls that are designed to ensure that fair values are appropriate. Such controls include model validation, review of key model inputs, analysis of period-over-period fluctuations and reviews by senior management.
VALUATION METHODOLOGIES
Money market securities.
Money market securities are cash equivalents, which are included in either cash and cash equivalents or other assets, and consist of highly liquid investments with original maturities of three months or less. We use quoted market prices for identical assets to measure fair value. Therefore, all money market securities are classified as Level 1.
Retained Interest in Securitized Receivables.
Prior to March 1, 2010, the retained interest in securitized receivables included interest-only strip receivables, various reserve accounts, required excess receivables and retained subordinated bonds. Excluding the retained subordinated bonds, we estimated the fair value of the retained interest using internal valuation models. These models included a combination of market inputs and our own assumptions. As the valuation models included significant unobservable inputs, we classified the retained interest as Level 3.
For the retained subordinated bonds, we based our valuation on observable market prices for similar assets when available. Otherwise, our valuations were based on input from independent third parties and internal valuation models. As the key assumption used in the valuation was based on unobservable inputs, we classified the retained subordinated bonds as Level 3. As described in Note 5, there was no retained interest as of February 28, 2011.
Derivative Instruments.
The fair values of our derivative instruments are included in either other current assets or accounts payable. As described in Note 6, as part of our risk management strategy, we utilize derivative instruments to manage differences in the amount of our known or expected cash receipts and our known or expected cash payments principally related to the funding of our auto loan receivables. Interest rate swaps are used to manage our exposure to interest rate movements, to better match funding costs to the interest on the fixed-rate receivables being securitized and to minimize the funding costs related to certain term securitization trusts. Interest rate caps are used to limit risk for investors
59
in the warehouse facilities. Our derivatives are not exchange-traded and are over-the-counter customized derivative instruments. All of our derivative exposures are with highly rated bank counterparties.
We measure derivative fair values assuming that the unit of account is an individual derivative instrument and that derivatives are sold or transferred on a stand-alone basis. We estimate the fair value of our derivatives using quotes determined by the derivative counterparties and third-party valuation services. We validate certain quotes using our own internal models. Quotes from third-party valuation services, quotes received from bank counterparties and our internal models project future cash flows and discount the future amounts to a present value using market-based expectations for interest rates and the contractual terms of the derivative instruments. Because model inputs can typically be observed in the liquid market and the models do not require significant judgment, these derivatives are classified as Level 2.
Our derivative fair value measurements consider assumptions about counterparty and our own nonperformance risk. We monitor counterparty and our own nonperformance risk and, in the event that we determine that a party is unlikely to perform under terms of the contract, we would adjust the derivative fair value to reflect the nonperformance risk.
Items Measured at Fair Value on a Recurring Basis
|
As of February 28, 2011
|
||||||||||||||||
|
(In millions)
|
Level 1
|
Level 2
|
Level 3
|
Total
|
||||||||||||
|
Assets:
|
||||||||||||||||
|
Money market securities
|
$ | 50.6 | $ | ― | $ | ― | $ | 50.6 | ||||||||
|
Derivative instruments
|
― | 3.2 | ― | 3.2 | ||||||||||||
|
Total assets at fair value
|
$ | 50.6 | $ | 3.2 | $ | ― | $ | 53.8 | ||||||||
|
Percent of total assets at fair value
|
94.0 | % | 6.0 | % | ― | % | 100.0 | % | ||||||||
|
Percent of total assets
|
0.7 | % | 0.0 | % | ― | % | 0.8 | % | ||||||||
|
Liabilities:
|
||||||||||||||||
|
Derivative instruments
|
$ | ― | $ | 3.8 | $ | ― | $ | 3.8 | ||||||||
|
Total liabilities at fair value
|
$ | ― | $ | 3.8 | $ | ― | $ | 3.8 | ||||||||
|
Percent of total liabilities
|
― | % | 0.1 | % | ― | % | 0.1 | % | ||||||||
|
As of February 28, 2010
|
||||||||||||||||
|
(In millions)
|
Level 1
|
Level 2
|
Level 3
|
Total
|
||||||||||||
|
Assets:
|
||||||||||||||||
|
Money market securities
|
$ | 31.2 | $ | ― | $ | ― | $ | 31.2 | ||||||||
|
Retained interest in securitized receivables
|
― | ― | 552.4 | 552.4 | ||||||||||||
|
Derivative instruments
|
― | 1.3 | ― | 1.3 | ||||||||||||
|
Total assets at fair value
|
$ | 31.2 | $ | 1.3 | $ | 552.4 | $ | 584.9 | ||||||||
|
Percent of total assets at fair value
|
5.3 | % | 0.3 | % | 94.4 | % | 100.0 | % | ||||||||
|
Percent of total assets
|
1.2 | % | 0.1 | % | 21.6 | % | 22.9 | % | ||||||||
|
Liabilities:
|
||||||||||||||||
|
Derivative instruments
|
$ | ― | $ | 7.2 | $ | ― | $ | 7.2 | ||||||||
|
Total liabilities at fair value
|
$ | ― | $ | 7.2 | $ | ― | $ | 7.2 | ||||||||
|
Percent of total liabilities
|
― | % | 1.2 | % | ― | % | 1.2 | % | ||||||||
60
Changes in Level 3 Assets Measured at Fair Value on a Recurring Basis
|
Years Ended February 28
|
||||||||
|
(In millions)
|
2011
|
2010
|
||||||
|
Balance at beginning of year
|
$ | 552.4 | $ | 348.3 | ||||
|
Impact of accounting change
(1)
|
(508.6 | ) | ― | |||||
|
Balance as of March 1
|
43.7 | 348.3 | ||||||
|
Total realized/unrealized gains
(2)
|
0.4 | 80.1 | ||||||
|
Purchases, sales, issuances and settlements, net
|
(44.2 | ) | 124.0 | |||||
|
Balance at end of year
|
$ | ― | $ | 552.4 | ||||
|
Change in unrealized gains on assets still held
(2)
|
$ | ― | $ | 71.9 | ||||
|
|
(1)
See Note 2(E) for additional information on the effects of the accounting change.
|
|
|
(2)
Reported in CarMax Auto Finance income in the consolidated statements of earnings.
|
|
8.
|
PROPERTY AND EQUIPMENT
|
|
As of February 28
|
||||||||
|
(In thousands)
|
2011
|
2010
|
||||||
|
Land
|
$ | 216,794 | $ | 211,132 | ||||
|
Land held for sale
|
8,693 | 11,945 | ||||||
|
Land held for development
|
72,168 | 38,464 | ||||||
|
Buildings
|
539,711 | 519,907 | ||||||
|
Capital leases
|
32,379 | 30,640 | ||||||
|
Leasehold improvements
|
83,287 | 85,955 | ||||||
|
Furniture, fixtures and equipment
|
248,944 | 236,194 | ||||||
|
Construction in progress
|
44,894 | 37,137 | ||||||
|
Total property and equipment
|
1,246,870 | 1,171,374 | ||||||
|
Less accumulated depreciation and amortization
|
326,825 | 277,921 | ||||||
|
Property and equipment, net
|
$ | 920,045 | $ | 893,453 | ||||
Land held for development represents land owned for potential expansion. Leased property meeting capital lease criteria is capitalized and the present value of the related lease payments is recorded as long-term debt. Accumulated amortization on capital lease assets was $11.4 million as of February 28, 2011, and $9.6 million as of February 28, 2010.
|
9.
|
INCOME TAXES
|
Income Tax Provision
|
Years Ended February 28
|
||||||||||||
|
(In thousands)
|
2011
|
2010
|
2009
|
|||||||||
|
Current:
|
||||||||||||
|
Federal
|
$ | 184,919 | $ | 123,215 | $ | 69,095 | ||||||
|
State
|
28,300 | 17,852 | 9,992 | |||||||||
|
Total
|
213,219 | 141,067 | 79,087 | |||||||||
|
Deferred:
|
||||||||||||
|
Federal
|
18,333 | 27,805 | (37,835 | ) | ||||||||
|
State
|
1,060 | 1,956 | (3,667 | ) | ||||||||
|
Total
|
19,393 | 29,761 | (41,502 | ) | ||||||||
|
Income tax provision
|
$ | 232,612 | $ | 170,828 | $ | 37,585 | ||||||
61
Effective Income Tax Rate Reconciliation
|
Years Ended February 28
|
||||||||||||
|
2011
|
2010
|
2009
|
||||||||||
|
Federal statutory income tax rate
|
35.0 | % | 35.0 | % | 35.0 | % | ||||||
|
State and local income taxes, net of federal benefit
|
3.3 | 3.0 | 2.7 | |||||||||
|
Nondeductible and other items
|
(0.2 | ) | (0.2 | ) | 0.3 | |||||||
|
Valuation allowance
|
(0.2 | ) | ― | 0.8 | ||||||||
|
Effective income tax rate
|
37.9 | % | 37.8 | % | 38.8 | % | ||||||
Temporary Differences Resulting in Deferred Tax Assets and Liabilities
|
As of February 28
|
||||||||
|
(In thousands)
|
2011
|
2010
|
||||||
|
Deferred tax assets:
|
||||||||
|
Accrued expenses
|
$ | 38,287 | $ | 33,795 | ||||
|
Partnership basis
|
47,798 | 15,286 | ||||||
|
Inventory
|
― | 1,960 | ||||||
|
Stock compensation
|
45,726 | 44,526 | ||||||
|
Capital loss carry forward
|
1,445 | 2,514 | ||||||
|
Total gross deferred tax assets
|
133,256 | 98,081 | ||||||
|
Less: valuation allowance
|
(1,445 | ) | (2,514 | ) | ||||
|
Net gross deferred tax assets
|
131,811 | 95,567 | ||||||
|
Deferred tax liabilities:
|
||||||||
|
Prepaid expenses
|
6,394 | 8,832 | ||||||
|
Inventory
|
3,668 | ― | ||||||
|
Depreciation and amortization
|
22,116 | 21,763 | ||||||
|
Other
|
2,164 | 2,143 | ||||||
|
Total gross deferred tax liabilities
|
34,342 | 32,738 | ||||||
|
Net deferred tax asset
|
$ | 97,469 | $ | 62,829 | ||||
As discussed in Note 2(E), as of March 1, 2010, we adopted FASB ASU Nos. 2009-16 and 2009-17 and amended our existing warehouse facility. As a result, we wrote-off the deferred tax liability applicable to the remaining interest-only strip receivables related to term securitizations, previously recorded in retained interest in securitized receivables, and we recorded a net deferred tax asset, primarily related to the establishment of the allowance for loan losses. The combined effect of these adjustments was $54.9 million.
Except for amounts for which a valuation allowance has been provided, we believe it is more likely than not that the results of future operations will generate sufficient taxable income to realize the deferred tax assets. The valuation allowance as of February 28, 2011, relates to capital loss carryforwards that are not more likely than not to be utilized prior to their expiration.
Reconciliation of Unrecognized Tax Benefits
|
Years Ended February 28
|
||||||||||||
|
(In thousands)
|
2011
|
2010
|
2009
|
|||||||||
|
Balance at beginning of year
|
$ | 21,952 | $ | 25,584 | $ | 32,669 | ||||||
|
Increases for tax positions of prior years
|
10,183 | 4,756 | 10,757 | |||||||||
|
Decreases for tax positions of prior years
|
(17,017 | ) | (5,114 | ) | (10,265 | ) | ||||||
|
Increases based on tax positions related to the current year
|
6,712 | 6,186 | 136 | |||||||||
|
Settlements
|
(3,168 | ) | (9,460 | ) | (7,713 | ) | ||||||
|
Balance at end of year
|
$ | 18,662 | $ | 21,952 | $ | 25,584 | ||||||
As of February 28, 2011, we had $18.7 million of gross unrecognized tax benefits, $3.5 million of which, if recognized, would affect our effective tax rate. It is reasonably possible that the amount of the unrecognized tax benefit with respect to certain of our uncertain tax positions will increase or decrease during the next 12 months; however, we do not expect the change
62
to have a significant effect on our results of operations, financial condition or cash flows. As of February 28, 2010, we had $22.0 million of gross unrecognized tax benefits, $1.7 million of which, if recognized, would affect our effective tax rate. As of February 28, 2009, we had $25.6 million of gross unrecognized tax benefits, $2.6 million of which, if recognized, would affect our effective tax rate.
Our continuing practice is to recognize interest and penalties related to income tax matters in SG&A expenses. Our accrual for interest decreased $2.6 million to $0.5 million as of February 28, 2011, from $3.1 million as of February 28, 2010. Our accrual for interest decreased $2.1 million to $3.1 million as of February 28, 2010, from $5.2 million as of February 28, 2009.
CarMax is subject to U.S. federal income tax as well as income tax of multiple states and local jurisdictions. With a few insignificant exceptions, we are no longer subject to U.S. federal, state and local income tax examinations by tax authorities for years prior to fiscal 2005.
|
10.
|
BENEFIT PLANS
|
|
(A)
|
Retirement Benefit Plans
|
We have a noncontributory defined benefit pension plan (the “pension plan”) covering the majority of full-time associates. We also have an unfunded nonqualified plan (the “restoration plan”) that restores retirement benefits for certain associates who are affected by Internal Revenue Code limitations on benefits provided under the pension plan. We use a fiscal year end measurement date for both the pension plan and the restoration plan.
Effective December 31, 2008, we froze both the pension plan and the restoration plan. No additional benefits have accrued under these plans since that date. These changes resulted in the recognition of a non-cash net curtailment gain of $7.4 million in fiscal 2009. In connection with benefits earned prior to the freeze, we have a continuing obligation to fund the pension plan and will continue to recognize net periodic pension expense for both plans.
Benefit Plan Information
|
Years Ended February 28
|
||||||||||||||||||||||||
|
Pension Plan
|
Restoration Plan
|
Total
|
||||||||||||||||||||||
|
(In thousands)
|
2011
|
2010
|
2011
|
2010
|
2011
|
2010
|
||||||||||||||||||
|
Change in projected benefit
obligation:
|
||||||||||||||||||||||||
|
Obligation at beginning of year
|
$ | 107,802 | $ | 83,766 | $ | 8,691 | $ | 8,930 | $ | 116,493 | $ | 92,696 | ||||||||||||
|
Service cost
|
― | ― | ― | ― | ― | ― | ||||||||||||||||||
|
Interest cost
|
6,541 | 5,710 | 520 | 605 | 7,061 | 6,315 | ||||||||||||||||||
|
Actuarial loss (gain)
|
5,620 | 19,540 | 67 | (671 | ) | 5,687 | 18,869 | |||||||||||||||||
|
Curtailment gain
|
― | ― | ― | ― | ― | ― | ||||||||||||||||||
|
Benefits paid
|
(1,451 | ) | (1,214 | ) | (173 | ) | (173 | ) | (1,624 | ) | (1,387 | ) | ||||||||||||
|
Obligation at end of year
|
118,512 | 107,802 | 9,105 | 8,691 | 127,617 | 116,493 | ||||||||||||||||||
|
Change in fair value of plan assets:
|
||||||||||||||||||||||||
|
Plan assets at beginning of year
|
77,723 | 42,789 | ― | ― | 77,723 | 42,789 | ||||||||||||||||||
|
Actual return on plan assets
|
15,220 | 21,112 | ― | ― | 15,220 | 21,112 | ||||||||||||||||||
|
Employer contributions
|
― | 15,036 | 173 | 173 | 173 | 15,209 | ||||||||||||||||||
|
Benefits paid
|
(1,451 | ) | (1,214 | ) | (173 | ) | (173 | ) | (1,624 | ) | (1,387 | ) | ||||||||||||
|
Plan assets at end of year
|
91,492 | 77,723 | ― | ― | 91,492 | 77,723 | ||||||||||||||||||
|
Funded status recognized
|
$ | (27,020 | ) | $ | (30,079 | ) | $ | (9,105 | ) | $ | (8,691 | ) | $ | (36,125 | ) | $ | (38,770 | ) | ||||||
|
Amounts recognized in the
|
||||||||||||||||||||||||
|
consolidated balance sheets:
|
||||||||||||||||||||||||
|
Current liability
|
$ | ― | $ | ― | $ | (381 | ) | $ | (406 | ) | $ | (381 | ) | $ | (406 | ) | ||||||||
|
Noncurrent liability
|
(27,020 | ) | (30,079 | ) | (8,724 | ) | (8,285 | ) | (35,744 | ) | (38,364 | ) | ||||||||||||
|
Net amount recognized
|
$ | (27,020 | ) | $ | (30,079 | ) | $ | (9,105 | ) | $ | (8,691 | ) | $ | (36,125 | ) | $ | (38,770 | ) | ||||||
|
Accumulated benefit obligation
|
$ | 118,512 | $ | 107,802 | $ | 9,105 | $ | 8,691 | $ | 127,617 | $ | 116,493 | ||||||||||||
63
Benefit Obligations.
Accumulated and projected benefit obligations (“ABO” and “PBO”) represent the obligations of the benefit plans for past service as of the measurement date. ABO is the present value of benefits earned to date with benefits computed based on current service and compensation levels. PBO is ABO increased to reflect expected future service and increased compensation levels. As a result of the freeze of plan benefits under our pension and restoration plans as of December 31, 2008, the ABO and PBO balances are equal to one another at all subsequent dates.
Assumptions Used to Determine Benefit Obligations
|
As of February 28
|
||||||||||||||||
|
Pension Plan
|
Restoration Plan
|
|||||||||||||||
|
2011
|
2010
|
2011
|
2010
|
|||||||||||||
|
Discount rate
|
5.80 | % | 6.10 | % | 5.80 | % | 6.10 | % | ||||||||
Plan Assets
. The fair value of plan assets is measured using current market values. Our pension plan assets are held in trust and management sets the investment policies and strategies. Long-term strategic investment objectives include asset preservation and appropriately balancing risk and return. We oversee the investment allocation process, which includes selecting investment managers, setting long-term strategic targets and monitoring asset allocations and performance. Target allocations for plan assets are guidelines, not limitations, and occasionally plan fiduciaries will approve allocations above or below the targets. We target allocating 75% of plan assets to equity and 25% to fixed income securities. Equity securities are currently composed of mutual funds that include highly diversified investments in large-, mid- and small-cap companies located in the United States and internationally. The fixed income securities are currently composed of mutual funds that include investments in debt securities, mortgage-backed securities, corporate bonds and other debt obligations primarily in the United States. We do not expect any plan assets to be returned to us during fiscal 2012.
Fair Value of Plan Assets
Quoted Prices in Active markets For identical Assets (Level 1)
|
As of February 28
|
||||||||
|
(In thousands)
|
2011
|
2010
|
||||||
|
Cash and cash equivalents
|
$ | 421 | $ | 861 | ||||
|
Investment income receivables, net
|
― | 3 | ||||||
|
Mutual funds:
|
||||||||
|
Equity securities
(1)
|
58,197 | 46,539 | ||||||
|
Equity securities – international
(2)
|
11,395 | 10,882 | ||||||
|
Fixed income securities
(3)
|
21,482 | 19,438 | ||||||
|
Investment payables, net
|
(3 | ) | ― | |||||
|
Total
|
$ | 91,492 | $ | 77,723 | ||||
|
(1)
|
Includes large-, mid- and small-cap companies primarily from diverse U.S. industries including pharmaceuticals, banks, computers, telecommunications, internet, media and commercial and business services sectors; approximately 85% of securities relate to U.S. entities and 15% of securities relate to non-U.S. entities.
|
|
(2)
|
Consists of equity securities of primarily foreign corporations from diverse industries including banks, oil and gas, mining, commercial and business services and financial services sectors; approximately 90% of securities relate to non-U.S. entities and 10% of securities relate to U.S. entities as February 28, 2011 (95% and 5%, respectively, as of February 28, 2010).
|
|
(3)
|
Includes debt securities of U.S. and foreign governments, their agencies and corporations, and diverse investments in mortgage-backed securities, corporate bonds, and other debt obligations; approximately 75% of securities relate to U.S. entities and 25% of securities relate to non-U.S. entities.
|
Funding Policy.
For the pension plan, we contribute amounts sufficient to meet minimum funding requirements as set forth in the employee benefit and tax laws, plus any additional amounts as we may determine to be appropriate. We expect to contribute $3.4 million to the pension plan in fiscal 2012. For the non-funded restoration plan, we contribute an amount equal to the benefit payments.
64
Estimated Future Benefit Payments
|
Pension
|
Restoration
|
|||||||
|
(In thousands)
|
Plan
|
Plan
|
||||||
|
Fiscal 2012
|
$ | 1,365 | $ | 381 | ||||
|
Fiscal 2013
|
$ | 1,649 | $ | 429 | ||||
|
Fiscal 2014
|
$ | 1,972 | $ | 465 | ||||
|
Fiscal 2015
|
$ | 2,297 | $ | 473 | ||||
|
Fiscal 2016
|
$ | 2,638 | $ | 482 | ||||
|
Fiscal 2017 to 2021
|
$ | 18,936 | $ | 2,628 | ||||
Components of Net Pension Expense
|
Years Ended February 28
|
||||||||||||||||||||||||||||||||||||
|
Pension Plan
|
Restoration Plan
|
Total
|
||||||||||||||||||||||||||||||||||
|
(In thousands)
|
2011
|
2010
|
2009
|
2011
|
2010
|
2009
|
2011
|
2010
|
2009
|
|||||||||||||||||||||||||||
|
Service cost
|
$ | ― | $ | ― | $ | 10,548 | $ | ― | $ | ― | $ | 832 | $ | ― | $ | ― | $ | 11,380 | ||||||||||||||||||
|
Interest cost
|
6,541 | 5,710 | 6,343 | 520 | 605 | 739 | 7,061 | 6,315 | 7,082 | |||||||||||||||||||||||||||
|
Expected return
on plan assets
|
(6,580 | ) | (6,487 | ) | (5,572 | ) | ― | ― | ― | (6,580 | ) | (6,487 | ) | (5,572 | ) | |||||||||||||||||||||
|
Amortization of
prior service cost
|
― | ― | 23 | ― | ― | 74 | ― | ― | 97 | |||||||||||||||||||||||||||
|
Recognized
actuarial
loss (gain)
|
280 | ― | (1,244 | ) | ― | ― | 247 | 280 | ― | (997 | ) | |||||||||||||||||||||||||
|
Pension expense
(benefit)
|
241 | (777 | ) | 10,098 | 520 | 605 | 1,892 | 761 | (172 | ) | 11,990 | |||||||||||||||||||||||||
|
Curtailment (gain)
loss
|
― | ― | (8,229 | ) | ― | ― | 800 | ― | ― | (7,429 | ) | |||||||||||||||||||||||||
|
Net pension
expense (benefit)
|
$ | 241 | $ | (777 | ) | $ | 1,869 | $ | 520 | $ | 605 | $ | 2,692 | $ | 761 | $ | (172 | ) | $ | 4,561 | ||||||||||||||||
Changes Not Recognized in Net Pension Expense but
Recognized in Other Comprehensive Income
|
Years Ended February 28
|
||||||||||||||||||||||||
|
Pension Plan
|
Restoration Plan
|
Total
|
||||||||||||||||||||||
|
(In thousands)
|
2011
|
2010
|
2011
|
2010
|
2011
|
2010
|
||||||||||||||||||
|
Net actuarial (gain) loss
|
$ | (3,020 | ) | $ | 4,914 | $ | 68 | $ | (671 | ) | $ | (2,952 | ) | $ | 4,243 | |||||||||
In fiscal 2012, we anticipate that $0.5 million in estimated actuarial losses of the pension plan will be amortized from accumulated other comprehensive loss. We do not anticipate that any estimated actuarial losses will be amortized from accumulated other comprehensive loss for the restoration plan.
Assumptions Used to Determine Net Pension Expense
|
Years Ended February 28
|
||||||||||||||||||||||||
|
Pension Plan
|
Restoration Plan
|
|||||||||||||||||||||||
|
2011
|
2010
|
2009
|
2011
|
2010
|
2009
|
|||||||||||||||||||
|
Discount rate
(1)
|
6.10 | % | 6.85 | % | 6.85 | % | 6.10 | % | 6.85 | % | 6.85 | % | ||||||||||||
|
Expected rate of return on plan assets
|
7.75 | % | 7.75 | % | 8.00 | % | ― | ― | ― | |||||||||||||||
|
Rate of compensation increase
|
― | ― | 5.00 | % | ― | ― | 7.00 | % | ||||||||||||||||
|
(1)
|
For fiscal 2009, a discount rate of 7.70% was used to determine the effects of the curtailment at October 21, 2008.
|
Assumptions.
Underlying both the calculation of the PBO and the net pension expense are actuarial calculations of each plan's liability. These calculations use participant-specific information such as salary, age and years of service, as well as certain assumptions, the most significant being the discount rate, rate of return on plan assets and mortality rate. We evaluate these assumptions at least once a year and make changes as necessary.
65
The discount rate used for retirement benefit plan accounting reflects the yields available on high-quality, fixed income debt instruments. For our plans, we review high quality corporate bond indices in addition to a hypothetical portfolio of corporate bonds with maturities that approximate the expected timing of the anticipated benefit payments.
To determine the expected long-term return on plan assets, we consider the current and anticipated asset allocations, as well as historical and estimated returns on various categories of plan assets. We apply the estimated rate of return to a market-related value of assets, which reduces the underlying variability in the asset values. The use of expected long-term rates of return on pension plan assets could result in recognized asset returns that are greater or less than the actual returns of those pension plan assets in any given year. Over time, however, the expected long-term returns are anticipated to approximate the actual long-term returns, and therefore, result in a pattern of income and expense recognition that more closely matches the pattern of the services provided by the employees. Differences between actual and expected returns, which are a component of unrecognized actuarial gains/losses, are recognized over the average future expected service of the active employees in the pension plan.
Given the frozen status of the pension and benefit restoration plans, the rate of compensation increases is not applicable for periods subsequent to December 31, 2008. Prior to this date, we determined the rate of compensation increases based upon our long-term plans for these increases. Mortality rate assumptions are based on the life expectancy of the population and were updated as of February 28, 2011, to account for increases in life expectancy.
|
(B)
|
Retirement Savings 401(k) Plan
|
We sponsor a 401(k) plan for all associates meeting certain eligibility criteria. In conjunction with the retirement benefit plan curtailments, enhancements were made to the 401(k) plan effective January 1, 2009. The enhancements increased the maximum salary contribution for eligible associates and increased our matching contribution. Additionally, an annual company-funded contribution regardless of associate participation was implemented, as well as an additional company-funded contribution to those associates meeting certain age and service requirements. The total cost for company contributions was $20.5 million in fiscal 2011, $20.1 million in fiscal 2010 and $5.7 million in fiscal 2009.
|
(C)
|
Retirement Restoration Plan
|
Effective January 1, 2009, we replaced the frozen restoration plan with a new non-qualified retirement plan for certain senior executives who are affected by Internal Revenue Code limitations on benefits provided under the Retirement Savings 401(k) Plan. Under this plan, these associates may continue to defer portions of their compensation for retirement savings. We match the associates’ contributions at the same rate provided under the 401(k) plan, and also provide the annual company-funded contribution made regardless of associate participation, as well as the additional company-funded contribution to the associates meeting the same age and service requirements. This plan is unfunded with lump sum payments to be made upon the associate’s retirement. The total cost for this plan was $1.0 million in fiscal 2011. The total cost for this plan was not material in fiscal 2010 or fiscal 2009.
|
(D)
|
Executive Deferred Compensation Plan
|
Effective January 1, 2011, we established an unfunded nonqualified deferred compensation plan to permit certain eligible key associates to defer receipt of a portion of their compensation to a future date. This plan also includes a restorative company contribution designed to compensate the plan participants for any loss of company contributions under the Retirement Savings 401(k) Plan and the Retirement Restoration Plan due to a reduction in their eligible compensation resulting from deferrals into the Executive Deferred Compensation Plan. The total cost for this plan was not material in fiscal 2011.
66
|
11.
|
DEBT
|
|
As of February 28
|
||||||||
|
(In thousands)
|
2011
|
2010
|
||||||
|
Revolving credit agreement
|
$ | 1,002 | $ | 122,483 | ||||
|
Non-recourse notes payable
|
4,013,661 | ― | ||||||
|
Obligations under capital leases
|
29,122 | 28,088 | ||||||
|
Total debt
|
4,043,785 | 150,571 | ||||||
|
Less short-term debt and current portion:
|
||||||||
|
Revolving credit agreement
|
1,002 | 122,483 | ||||||
|
Non-recourse notes payable
|
132,519 | ― | ||||||
|
Obligations under capital leases
|
772 | 717 | ||||||
|
Total debt, excluding current portion
|
$ | 3,909,492 | $ | 27,371 | ||||
Revolving Credit Facility.
We have a $700 million revolving credit facility (the “credit facility”) with Bank of America, N.A. and various other financial institutions. The credit facility is secured by vehicle inventory and contains certain representations and warranties, conditions and covenants. The financial covenants include a maximum total liabilities to tangible net worth ratio and a minimum fixed charge coverage ratio. Borrowings under this credit facility are limited to 80% of qualifying inventory, and they are available for working capital and general corporate purposes. Borrowings accrue interest at variable rates based on LIBOR, the federal funds rate, or the prime rate, depending on the type of borrowing. We pay a commitment fee on the used and unused portions of the available funds. All outstanding principal amounts will be due and payable in December 2011, and there are no penalties for prepayment.
As of February 28, 2011, $1.0 million of short-term debt was outstanding under the credit facility and the remaining capacity was fully available to us.
The weighted average interest rate on outstanding short-term and long-term debt was 1.6% in fiscal 2011, 1.6% in fiscal 2010 and 3.5% in fiscal 2009.
We capitalize interest in connection with the construction of certain facilities. Capitalized interest totaled $0.1 million in fiscal 2011, $0.3 million in fiscal 2010 and $1.9 million in fiscal 2009.
Capital Leases.
We have recorded six capital leases for current and future store facilities. The related capital lease assets are included in property and equipment. These leases were structured at varying interest rates with initial lease terms ranging from 15 to 20 years with payments made monthly. The present value of future minimum lease payments totaled $29.1 million as of February 28, 2011, and $28.1 million as of February 28, 2010.
Non-Recourse Notes Payable.
As of March 1, 2010, and as discussed in Notes 2 and 5, we adopted ASU Nos. 2009-16 and 2009-17 and amended our warehouse facility agreement in effect as of that date. As a result, we consolidated the auto loan receivables previously securitized through that warehouse facility and term securitizations, along with the related non-recourse notes payable, and they are now accounted for as secured borrowings. The timing of principal payments on the non-recourse notes payable are based on principal collections, net of losses, on the securitized auto loan receivables. The non-recourse notes payable accrue interest predominantly at fixed rates and mature between April 2011 and March 2017, but may mature earlier or later, depending upon the repayment rate of the underlying auto loan receivables. As of February 28, 2011, $4.01 billion of non-recourse notes payable were outstanding. The outstanding balance included $132.5 million classified as current portion of non-recourse notes payable, as this represents principal payments that have been collected, but will be distributed in the following period.
As of February 28, 2011, the combined warehouse facility limit was $1.6 billion. At that date, $943 million of auto loan receivables were funded in the warehouse facilities and unused warehouse capacity totaled $657 million. During the first quarter of fiscal 2011, we entered into a second warehouse facility agreement in order to stagger the warehouse facility renewal dates, reduce risk and provide greater flexibility. During the second quarter of fiscal 2011, we renewed our $800 million warehouse facility that was scheduled to expire in August 2010 for an additional 364-day term, and we increased the capacity of our second warehouse facility by $400 million. As of February 28, 2011, $800 million of the warehouse facility limit will expire in August 2011 and $800 million will expire in February 2012. The return requirements of investors in the bank conduits could fluctuate significantly depending on market conditions. At renewal, the cost, structure and capacity of the facilities could change. These changes could have a significant impact on our funding costs. See Notes 4 and 5 for additional information on the related securitized auto loan receivables.
67
|
12.
|
STOCK AND STOCK-BASED INCENTIVE PLANS
|
|
(A)
|
Shareholder Rights Plan and Undesignated Preferred Stock
|
In conjunction with our shareholder rights plan, shareholders received preferred stock purchase rights as a dividend at the rate of one right for each share of CarMax, Inc. common stock owned. The rights are exercisable only upon the attainment of, or the commencement of a tender offer to attain, a 15% or greater ownership interest in the company by a person or group. When exercisable, and as adjusted for our March 2007 2-for-1 stock split, each right would entitle the holder to buy one half of one one-thousandth of a share of Cumulative Participating Preferred Stock, Series A, $20 par value, at an exercise price of $140 per share, subject to adjustment. A total of 300,000 shares of such preferred stock, which has preferential dividend and liquidation rights, have been authorized and designated. No such shares are outstanding. In the event that an acquiring person or group acquires the specified ownership percentage of CarMax, Inc. common stock (except pursuant to a cash tender offer for all outstanding shares determined to be fair by the board of directors) or engages in certain transactions with the company after the rights become exercisable, each right will be converted into a right to purchase, for half the current market price at that time, shares of CarMax, Inc. common stock valued at two times the exercise price. We also have an additional 19,700,000 authorized shares of undesignated preferred stock of which no shares are outstanding.
|
(B)
|
Stock Incentive Plans
|
We maintain long-term incentive plans for management, key employees and the nonemployee members of our board of directors. The plans allow for the grant of equity-based compensation awards, including nonqualified stock options, incentive stock options, stock appreciation rights, restricted stock awards, stock- and cash-settled restricted stock units, stock grants or a combination of awards. To date, we have not awarded any incentive stock options.
Prior to fiscal 2007, the majority of associates who received share-based compensation awards primarily received nonqualified stock options. From fiscal 2007 through fiscal 2009, these associates primarily received restricted stock instead of stock options, and beginning in fiscal 2010, these associates primarily received cash-settled restricted stock units instead of restricted stock awards. Senior management and other key associates continue to receive awards of nonqualified stock options and, starting in fiscal 2010, stock-settled restricted stock units. Nonemployee directors continue to receive awards of nonqualified stock options and stock grants.
Nonqualified Stock Options
. Nonqualified stock options are awards that allow the recipient to purchase shares of our common stock at a fixed price. Stock options are granted at an exercise price equal to the fair market value of our common stock on the grant date. Substantially all of the stock options vest annually in equal amounts over periods of three to four years. These options are subject to forfeiture and expire no later than ten years after the date of the grant.
Restricted Stock
. Restricted stock awards are awards of our common stock that are subject to specified restrictions and a risk of forfeiture. The restrictions typically lapse three years from the grant date. Participants holding restricted stock are entitled to vote on matters submitted to holders of our common stock for a vote.
Stock-Settled Restricted Stock Units
. Also referred to as market stock units, or MSUs, these are awards to eligible key associates that are converted into between zero and two shares of common stock for each unit granted at the end of a three-year vesting period. The conversion ratio is calculated by dividing the average closing price of our stock during the final forty trading days of the three-year vesting period by our stock price on the grant date, with the resulting quotient capped at two. This quotient is then multiplied by the number of MSUs granted to yield the number of shares awarded. MSUs are subject to forfeiture and do not have voting rights.
Cash-Settled Restricted Stock Units
. Also referred to as restricted stock units, or RSUs, these are awards that entitle the holder to a cash payment equal to the fair market value of a share of our common stock for each unit granted at the end of a three-year vesting period. However, the cash payment per RSU will not be greater than 200% or less than 75% of the fair market value of a share of our common stock on the grant date. RSUs are liability awards that are subject to forfeiture and do not have voting rights.
As of February 28, 2011, a total of 39,200,000 shares of our common stock have been authorized to be issued under the long-term incentive plans. The number of unissued common shares reserved for future grants under the long-term incentive plans was 5,815,552 as of February 28, 2011.
68
|
(C)
|
Share-Based Compensation
|
Composition of ShareBased Compensation Expense
|
Years Ended February 28
|
||||||||||||
|
(In thousands)
|
2011
|
2010
|
2009
|
|||||||||
|
Cost of sales
|
$ | 2,081 | $ | 2,103 | $ | 2,136 | ||||||
|
CarMax Auto Finance income
|
1,603 | 1,334 | 1,181 | |||||||||
|
Selling, general and administrative expenses
|
40,996 | 35,407 | 33,201 | |||||||||
|
Share-based compensation expense, before income taxes
|
$ | 44,680 | $ | 38,844 | $ | 36,518 | ||||||
Composition of Share Based Compensation Expense – By Grant Type
|
Years Ended February 28
|
||||||||||||
|
(In thousands)
|
2011
|
2010
|
2009
|
|||||||||
|
Nonqualified stock options
|
$ | 17,302 | $ | 17,404 | $ | 19,031 | ||||||
|
Restricted stock
|
5,964 | 11,571 | 15,823 | |||||||||
|
Cash-settled restricted stock units
|
13,917 | 5,718 | ― | |||||||||
|
Stock-settled restricted stock units
|
5,948 | 2,614 | ― | |||||||||
|
Employee stock purchase plan
|
1,074 | 987 | 1,081 | |||||||||
|
Stock grants to non-employee directors
|
475 | 550 | 583 | |||||||||
|
Share-based compensation expense, before income taxes
|
$ | 44,680 | $ | 38,844 | $ | 36,518 | ||||||
We recognize compensation expense for stock options, restricted stock and MSUs on a straight-line basis (net of estimated forfeitures) over the requisite service period, which is generally the vesting period of the award. The variable expense associated with RSUs is recognized over their vesting period (net of expected forfeitures) and is calculated based on the volume-weighted average price of our common stock on the last trading day of each reporting period. The total costs for matching contributions for our employee stock purchase plan are included in share-based compensation expense. There were no capitalized share-based compensation costs as of the end of fiscal 2011, fiscal 2010 or fiscal 2009.
Stock Option Activity
|
Number of Shares
|
Weighted Average Exercise Price
|
Weighted Average Remaining Contractual Life (Years)
|
Aggregate Intrinsic Value
|
|||||||||||||
|
Outstanding as of March 1, 2010
|
13,741 | $ | 15.58 | |||||||||||||
|
Options granted
|
1,893 | $ | 25.29 | |||||||||||||
|
Options exercised
|
(3,125 | ) | $ | 14.60 | ||||||||||||
|
Options forfeited or expired
|
(65 | ) | $ | 14.24 | ||||||||||||
|
Outstanding as of February 28, 2011
|
12,444 | $ | 17.31 | 4.2 | $ | 224,720 | ||||||||||
|
Exercisable as of February 28, 2011
|
6,922 | $ | 16.12 | 3.4 | $ | 133,232 | ||||||||||
We granted nonqualified options to purchase 1,892,867 shares of common stock in fiscal 2011, 2,948,150 shares in fiscal 2010 and 2,219,857 in fiscal 2009. The total cash received as a result of stock option exercises was $45.6 million in fiscal 2011, $35.2 million in fiscal 2010 and $10.2 million in fiscal 2009. We settle stock option exercises with authorized but unissued shares of our common stock. The total intrinsic value of options exercised was $41.6 million for fiscal 2011, $25.8 million for fiscal 2010 and $5.7 million for fiscal 2009. We realized related tax benefits of $16.5 million for fiscal 2011, $10.1 million for fiscal 2010 and $2.2 million for fiscal 2009.
69
Outstanding Stock Options
|
As of February 28, 2011
|
||||||||||||||||||||||
|
Options Outstanding
|
Options Exercisable
|
|||||||||||||||||||||
|
(Shares in thousands)
Range of Exercise Prices
|
Number of Shares
|
Weighted Average Remaining Contractual Life (Years)
|
Weighted Average Exercise Price
|
Number of Shares
|
Weighted Average Exercise Price
|
|||||||||||||||||
| $ | 7.14 to $10.75 | 604 | 2.0 | $ | 7.38 | 604 | $ | 7.38 | ||||||||||||||
| $ | 11.43 | 2,527 | 5.1 | $ | 11.43 | 429 | $ | 11.43 | ||||||||||||||
| $ | 13.19 | 1,428 | 4.2 | $ | 13.19 | 1,428 | $ | 13.19 | ||||||||||||||
| $ | 14.13 to $14.81 | 1,544 | 3.2 | $ | 14.60 | 1,498 | $ | 14.60 | ||||||||||||||
| $ | 14.86 to $19.36 | 1,110 | 2.4 | $ | 17.05 | 1,049 | $ | 17.07 | ||||||||||||||
| $ | 19.82 | 1,845 | 4.1 | $ | 19.82 | 819 | $ | 19.82 | ||||||||||||||
| $ | 19.98 to $24.99 | 1,465 | 3.2 | $ | 24.80 | 1,028 | $ | 24.97 | ||||||||||||||
| $ | 25.39 to $32.05 | 1,921 | 6.0 | $ | 25.45 | 67 | $ | 25.71 | ||||||||||||||
|
Total
|
12,444 | 4.2 | $ | 17.31 | 6,922 | $ | 16.12 | |||||||||||||||
For all stock options granted prior to March 1, 2006, the fair value was estimated as of the date of grant using a Black-Scholes option-pricing model. For stock options granted to associates on or after March 1, 2006, the fair value of each award is estimated as of the date of grant using a binomial valuation model. In computing the value of the option, the binomial model considers characteristics of fair-value option pricing that are not available for consideration under the Black-Scholes model, such as the contractual term of the option, the probability that the option will be exercised prior to the end of its contractual life and the probability of termination or retirement of the option holder. For this reason, we believe that the binomial model provides a fair value that is more representative of actual experience and future expected experience than the value calculated using the Black-Scholes model. For grants to nonemployee directors prior to fiscal 2009, we used the Black-Scholes model to estimate the fair value of stock option awards. Beginning in fiscal 2009, we used the binomial model. Estimates of fair value are not intended to predict actual future events or the value ultimately realized by the recipients of share-based awards.
The weighted average fair values at the date of grant for options granted were $10.82 per share in fiscal 2011, $5.30 per share in fiscal 2010 and $7.16 per share in fiscal 2009. The unrecognized compensation costs related to nonvested options totaled $23.0 million as of February 28, 2011. These costs are expected to be recognized on a straight-line basis over a weighted average period of 2.0 years.
Assumptions Used to Estimate Option Values
|
Years Ended February 28
|
|||
|
2011
|
2010
|
2009
|
|
|
Dividend yield
|
0.0%
|
0.0%
|
0.0%
|
|
Expected volatility factor
(1)
|
34.6%-50.5%
|
52.2%-73.4%
|
34.8%-60.9%
|
|
Weighted average expected volatility
|
48.2%
|
57.3%
|
44.1%
|
|
Risk-free interest rate
(2)
|
0.1%-4.0%
|
0.2%-3.2%
|
1.5%-3.7%
|
|
Expected term (in years)
(3)
|
4.7
|
5.2-5.5
|
4.8-5.2
|
|
(1)
|
Measured using historical daily price changes of our stock for a period corresponding to the term of the option and the implied volatility derived from the market prices of traded options on our stock.
|
|
(2)
|
Based on the U.S. Treasury yield curve in effect at the time of grant.
|
|
(3)
|
Represents the estimated number of years that options will be outstanding prior to exercise.
|
70
Restricted Stock Activity
|
(Shares in thousands)
|
Number of Shares
|
Weighted Average Grant Date Fair Value
|
||||||
|
Outstanding as of March 1, 2010
|
1,663 | $ | 22.08 | |||||
|
Restricted stock granted
|
― | ― | ||||||
|
Restricted stock vested
|
(743 | ) | $ | 24.85 | ||||
|
Restricted stock cancelled
|
(57 | ) | $ | 20.30 | ||||
|
Outstanding as of February 28, 2011
|
863 | $ | 19.81 | |||||
We did not grant any shares of restricted stock to our employees in fiscal 2011 or 2010. The fair value of a restricted stock award is determined and fixed based on the fair market value of our stock on the grant date.
We realized related tax benefits of $7.7 million and $4.1 million from the vesting of restricted stock in fiscal 2011 and 2010, respectively. The realized tax benefits in fiscal 2009 were immaterial. The unrecognized compensation costs related to nonvested restricted stock awards totaled $0.6 million as of February 28, 2011. These costs are expected to be recognized on a straight-line basis over a weighted average period of 0.1 years.
Stock-Settled Restricted Stock Unit Activity
|
(Units in thousands)
|
Number of Units
|
Weighted Average Grant Date Fair Value
|
||||||
|
Outstanding as of March 1, 2010
|
395 | $ | 16.34 | |||||
|
Stock units granted
|
278 | $ | 36.28 | |||||
|
Stock units vested and converted
|
(5 | ) | $ | 19.00 | ||||
|
Stock units cancelled
|
(2 | ) | $ | 16.34 | ||||
|
Outstanding as of February 28, 2011
|
666 | $ | 24.66 | |||||
For the fiscal years ended February 28, 2011 and 2010, we granted MSUs of 278,445 units and 405,872 units, respectively. The weighted average fixed fair values per share at the date of the grant for MSUs granted in fiscal 2011 and 2010 were $36.28 and $16.34, respectively. The fair values were determined using a Monte-Carlo simulation and were based on the expected market price of our common stock on the vesting date and the expected number of converted common shares. The unrecognized compensation costs related to nonvested MSUs totaled $8.5 million as of February 28, 2011. These costs are expected to be recognized on a straight-line basis over a weighted average period of 1.5 years.
Cash-Settled Restricted Stock Unit Activity
|
(Units in thousands)
|
Number of Units
|
Weighted Average Grant Date Fair Value
|
||||||
|
Outstanding as of March 1, 2010
|
916 | $ | 11.43 | |||||
|
Stock units granted
|
689 | $ | 25.39 | |||||
|
Stock units vested and converted
|
(14 | ) | $ | 16.20 | ||||
|
Stock units cancelled
|
(90 | ) | $ | 16.53 | ||||
|
Outstanding as of February 28, 2011
|
1,501 | $ | 17.49 | |||||
During fiscal 2011 and 2010, we granted RSUs of 688,880 units and 1,005,505 units, respectively. The initial fair market values per share for the liability-classified RSUs granted during fiscal 2011 and 2010 were $25.39 and $11.43, respectively. The RSUs will be cash-settled upon vesting.
71
Expected Cash Settlement Range Upon Restricted Stock Unit Vesting
|
As of February 28, 2011
|
||||||||
|
(In thousands)
|
Minimum
(1)
|
Maximum
(1)
|
||||||
|
Fiscal 2013
|
$ | 6,926 | $ | 18,470 | ||||
|
Fiscal 2014
|
10,610 | 28,293 | ||||||
|
Total expected cash settlements
|
$ | 17,536 | $ | 46,763 | ||||
|
(1)
|
Net of estimated forfeitures
|
|
(D)
|
Employee Stock Purchase Plan
|
We sponsor an employee stock purchase plan for all associates meeting certain eligibility criteria. Associate contributions are limited to 10% of eligible compensation, up to a maximum of $7,500 per year. For each $1.00 contributed to the plan by associates, we match $0.15. We have authorized up to 8,000,000 shares of common stock for the employee stock purchase plan. Shares are acquired through open-market purchases.
As of February 28, 2011, a total of 4,426,064 shares remained available under the plan. Shares purchased on the open market on behalf of associates totaled 301,195 during fiscal 2011; 452,936 during fiscal 2010; and 677,944 during fiscal 2009. The average price per share for purchases under the plan was $25.80 in fiscal 2011, $16.71 in fiscal 2010 and $12.22 in fiscal 2009. The total costs for matching contributions are included in share-based compensation expense.
|
13.
|
NET EARNINGS PER SHARE
|
On March 1, 2009, the company adopted the accounting pronouncement related to participating securities, with retrospective application, which was subsequently integrated into the FASB ASC Topic 260, “Earnings Per Share.” This pronouncement addresses whether instruments granted in share-based payment transactions are “participating securities” prior to vesting, and therefore need to be included in the earnings allocation in computing net earnings per share under the two-class method, as described in this pronouncement. Nonvested share-based payment awards that contain nonforfeitable rights to dividends or dividend equivalents (whether paid or unpaid) are participating securities and should be included in the computation of net earnings per share pursuant to the two-class method. Our restricted stock awards are considered participating securities because they contain nonforfeitable rights to dividends and are included in the computation of earnings per share pursuant to the two-class method. Nonvested MSUs do not receive nonforfeitable dividend equivalent rights, and therefore, are not considered participating securities. RSUs are nonparticipating, non-equity instruments, and therefore, are excluded from net earnings per share calculations. The adoption had no impact on previously reported basic or diluted net earnings per share for fiscal 2009.
Basic and Dilutive Net Earnings per Share Reconciliations
|
Years Ended February 28
|
||||||||||||
|
(In thousands except per share data)
|
2011
|
2010
|
2009
|
|||||||||
|
Net earnings
|
$ | 380,878 | $ | 281,668 | $ | 59,213 | ||||||
|
Less net earnings allocable to restricted stock
|
1,638 | 2,377 | 703 | |||||||||
|
Net earnings available for basic common shares
|
379,240 | 279,291 | 58,510 | |||||||||
|
Adjustment for dilutive potential common shares
|
38 | 29 | 5 | |||||||||
|
Net earnings available for diluted common shares
|
$ | 379,278 | $ | 279,320 | $ | 58,515 | ||||||
|
Weighted average common shares outstanding
|
223,449 | 219,527 | 217,537 | |||||||||
|
Dilutive potential common shares:
|
||||||||||||
|
Stock options
|
3,540 | 2,415 | 1,820 | |||||||||
|
Stock-settled restricted stock units
|
612 | 292 | ― | |||||||||
|
Weighted average common shares and dilutive potential
common shares
|
227,601 | 222,234 | 219,357 | |||||||||
|
Basic net earnings per share
|
$ | 1.70 | $ | 1.27 | $ | 0.27 | ||||||
|
Diluted net earnings per share
|
$ | 1.67 | $ | 1.26 | $ | 0.27 | ||||||
Certain weighted-average options to purchase shares of common stock were outstanding and not included in the calculation of diluted net earnings per share because their inclusion
72
would be antidilutive. In fiscal 2011, options to purchase 1,656,658 shares were not included. In fiscal 2010, options to purchase 5,425,666 shares were not included. In fiscal 2009, options to purchase 8,340,996 shares were not included.
|
14.
|
COMPREHENSIVE INCOME
|
Components of Total Comprehensive Income
|
Years Ended February 28
|
||||||||||||
|
(In thousands, net of income taxes)
|
2011
|
2010
|
2009
|
|||||||||
|
Net earnings
|
$ | 380,878 | $ | 281,668 | $ | 59,213 | ||||||
|
Other comprehensive income (loss):
|
||||||||||||
|
Retirement plans:
|
||||||||||||
|
Amounts arising during the year
|
1,828 | (2,686 | ) | (20,363 | ) | |||||||
|
Amortization recognized in net pension expense
|
190 | ― | (539 | ) | ||||||||
|
Curtailment of retirement plans
|
― | ― | 20,770 | |||||||||
|
Cash flow hedges:
|
||||||||||||
|
Effective portion of changes in fair value
|
(9,856 | ) | ||||||||||
|
Reclassifications to net income
|
2,327 | |||||||||||
|
Total comprehensive income
|
$ | 375,367 | $ | 278,982 | $ | 59,081 | ||||||
Accumulated Other Comprehensive Loss
|
Years Ended February 28
|
||||||||||||||||
|
(In thousands, net of income taxes)
|
Unrecognized Actuarial (Losses) Gains
|
Unrecognized Prior Service Cost
|
Unrecognized Hedge Losses
|
Total Accumulated Other Comprehensive Loss
|
||||||||||||
|
Balance as of February 29, 2008
|
$ | (15,926 | ) | (802 | ) | $ | ― | $ | (16,728 | ) | ||||||
|
Amounts arising during the year
|
(20,363 | ) | ― | (20,363 | ) | |||||||||||
|
Amortization recognized in net pension expense
|
(604 | ) | 65 | (539 | ) | |||||||||||
|
Curtailment of retirement plans
|
20,033 | 737 | 20,770 | |||||||||||||
|
Balance as of February 28, 2009
|
(16,860 | ) | ― | ― | (16,860 | ) | ||||||||||
|
Amounts arising during the year
|
(2,686 | ) | ― | (2,686 | ) | |||||||||||
|
Balance as of February 28, 2010
|
(19,546 | ) | ― | ― | (19,546 | ) | ||||||||||
|
Amounts arising during the year
|
1,828 | ― | 1,828 | |||||||||||||
|
Amortization recognized in net pension expense
|
190 | ― | 190 | |||||||||||||
|
Effective portion of changes in fair value
|
(9,856 | ) | (9,856 | ) | ||||||||||||
|
Reclassifications to net income
|
2,327 | 2,327 | ||||||||||||||
|
Balance as of February 28, 2011
|
$ | (17,528 | ) | ― | $ | (7,529 | ) | $ | (25,057 | ) | ||||||
Changes in the funded status of our retirement plans and the effective portion of changes in the fair value of derivatives that are designated and qualify as cash flow hedges are recognized in accumulated other comprehensive loss. The cumulative balances are net of deferred tax of $10.7 million as of February 28, 2011, and $11.5 million as of February 28, 2010.
|
15.
|
LEASE COMMITMENTS
|
We conduct a majority of our business in leased premises. Our lease obligations are based upon contractual minimum rates. Most leases provide that we pay taxes, maintenance, insurance and operating expenses applicable to the premises. The initial term of most real property leases will expire within the next 20 years; however, most of the leases have options providing for renewal periods of 5 to 20 years at terms similar to the initial terms. For operating leases, rent is recognized on a straight-line basis over the lease term, including scheduled rent increases and rent holidays. Rent expense for all operating leases was $85.2 million in fiscal 2011, $85.3 million in fiscal 2010 and $82.1 million in fiscal 2009.
73
Future Minimum Lease Obligations
|
As of February 28, 2011
|
||||||||
|
(In thousands)
|
Capital Leases
(1)
|
Operating Lease Commitments
(1)
|
||||||
|
Fiscal 2012
|
$ | 3,911 | $ | 82,430 | ||||
|
Fiscal 2013
|
3,911 | 81,983 | ||||||
|
Fiscal 2014
|
3,947 | 81,860 | ||||||
|
Fiscal 2015
|
4,188 | 81,631 | ||||||
|
Fiscal 2016
|
4,392 | 81,724 | ||||||
|
Fiscal 2017 and thereafter
|
39,223 | 500,397 | ||||||
|
Total minimum lease payments
|
59,572 | $ | 910,025 | |||||
|
Less amounts representing interest
|
(30,450 | ) | ||||||
|
Present value of net minimum capital lease payments
|
$ | 29,122 | ||||||
|
(1)
|
Excludes taxes, insurance and other costs payable directly by us. These costs vary from year to year and are incurred in the ordinary course of business.
|
We did not enter into any sale-leaseback transactions in fiscal 2011 or fiscal 2010. We completed sale-leaseback transactions involving two superstores valued at approximately $31.3 million in fiscal 2009. All sale-leaseback transactions are structured at competitive rates. Gains or losses on sale-leaseback transactions are recorded as deferred rent and amortized over the lease term. Other than occupancy, we do not have continuing involvement under the sale-leaseback transactions. In conjunction with certain sale-leaseback transactions, we must meet financial covenants relating to minimum tangible net worth and minimum coverage of rent expense. We were in compliance with all such covenants as of February 28, 2011.
|
16.
|
CONTINGENT LIABILITIES
|
|
(A)
|
Litigation
|
On April 2, 2008, Mr. John Fowler filed a putative class action lawsuit against CarMax Auto Superstores California, LLC and CarMax Auto Superstores West Coast, Inc. in the Superior Court of California, County of Los Angeles. Subsequently, two other lawsuits, Leena Areso et al. v. CarMax Auto Superstores California, LLC and Justin Weaver v. CarMax Auto Superstores California, LLC, were consolidated as part of the Fowler case. The allegations in the consolidated case involved: (1) failure to provide meal and rest breaks or compensation in lieu thereof; (2) failure to pay wages of terminated or resigned employees related to meal and rest breaks and overtime; (3) failure to pay overtime; (4) failure to comply with itemized employee wage statement provisions; and (5) unfair competition. The putative class consisted of sales consultants, sales managers, and other hourly employees who worked for the company in California from April 2, 2004, to the present. On May 12, 2009, the court dismissed all of the class claims with respect to the sales manager putative class. On June 16, 2009, the court dismissed all claims related to the failure to comply with the itemized employee wage statement provisions. The court also granted CarMax's motion for summary adjudication with regard to CarMax's alleged failure to pay overtime to the sales consultant putative class. The plaintiffs have appealed the court's ruling regarding the sales consultant overtime claim. In addition to the plaintiffs' appeal of the overtime claim, the claims currently remaining in the lawsuit regarding the sales consultant putative class are: (1) failure to provide meal and rest breaks or compensation in lieu thereof; (2) failure to pay wages of terminated or resigned employees related to meal and rest breaks; and (3) unfair competition. On June 16, 2009, the court entered a stay of these claims pending the outcome of a California Supreme Court case involving unrelated third parties but related legal issues. The Fowler lawsuit seeks compensatory and special damages, wages, interest, civil and statutory penalties, restitution, injunctive relief and the recovery of attorneys’ fees. We are unable to make a reasonable estimate of the amount or range of loss that could result from an unfavorable outcome in these matters.
We are involved in various other legal proceedings in the normal course of business. Based upon our evaluation of information currently available, we believe that the ultimate resolution of any such proceedings will not have a material adverse effect, either individually or in the aggregate, on our financial condition or results of operations.
|
(B)
|
Other Matters
|
In accordance with the terms of real estate lease agreements, we generally agree to indemnify the lessor from certain liabilities arising as a result of the use of the leased premises, including environmental liabilities and repairs to leased property upon termination of the lease. Additionally, in accordance with the terms of agreements entered into for the sale of
74
properties, we generally agree to indemnify the buyer from certain liabilities and costs arising subsequent to the date of the sale, including environmental liabilities and liabilities resulting from the breach of representations or warranties made in accordance with the agreements. We do not have any known material environmental commitments, contingencies or other indemnification issues arising from these arrangements.
As part of our customer service strategy, we guarantee the used vehicles we retail with at least a 30-day limited warranty. A vehicle in need of repair within this period will be repaired free of charge. As a result, each vehicle sold has an implied liability associated with it. Accordingly, based on historical trends, we record a provision for estimated future repairs during the guarantee period for each vehicle sold. The liability for this guarantee was $3.2 million as of February 28, 2011, and $2.6 million as of February 28, 2010, and is included in accrued expenses and other current liabilities.
|
17.
|
SELECTED QUARTERLY FINANCIAL DATA (UNAUDITED)
|
|
1st Quarter
|
2nd Quarter
|
3rd Quarter
|
4th Quarter
|
Fiscal Year
|
||||||||||||||||
|
(In thousands, except per share data)
|
2011
|
2011
|
2011
|
2011
|
2011
|
|||||||||||||||
|
Net sales and operating revenues
|
$ | 2,261,912 | $ | 2,341,880 | $ | 2,119,129 | $ | 2,252,633 | $ | 8,975,554 | ||||||||||
|
Gross profit
|
$ | 333,548 | $ | 349,118 | $ | 297,910 | $ | 320,652 | $ | 1,301,228 | ||||||||||
|
CarMax Auto Finance income
|
$ | 57,495 | $ | 52,604 | $ | 55,745 | $ | 54,139 | $ | 219,983 | ||||||||||
|
Selling, general and administrative
expenses
|
$ | 226,692 | $ | 225,236 | $ | 219,707 | $ | 233,456 | $ | 905,091 | ||||||||||
|
Net earnings
|
$ | 101,119 | $ | 107,885 | $ | 82,364 | $ | 89,510 | $ | 380,878 | ||||||||||
|
Net earnings per share:
|
||||||||||||||||||||
|
Basic
|
$ | 0.45 | $ | 0.48 | $ | 0.37 | $ | 0.40 | $ | 1.70 | ||||||||||
|
Diluted
|
$ | 0.44 | $ | 0.48 | $ | 0.36 | $ | 0.39 | $ | 1.67 | ||||||||||
|
1st Quarter
|
2nd Quarter
|
3rd Quarter
|
4th Quarter
|
Fiscal Year
|
||||||||||||||||
|
(In thousands, except per share data)
|
2010
|
2010
|
2010
|
2010
|
2010
|
|||||||||||||||
|
Net sales and operating revenues
|
$ | 1,834,300 | $ | 2,076,671 | $ | 1,725,977 | $ | 1,833,245 | $ | 7,470,193 | ||||||||||
|
Gross profit
|
$ | 276,237 | $ | 314,549 | $ | 242,863 | $ | 265,221 | $ | 1,098,870 | ||||||||||
|
CarMax Auto Finance (loss) income
|
$ | (21,636 | ) | $ | 72,130 | $ | 65,806 | $ | 58,917 | $ | 175,217 | |||||||||
|
Selling, general and administrative
expenses
|
$ | 206,225 | $ | 218,122 | $ | 192,140 | $ | 202,204 | $ | 818,691 | ||||||||||
|
Net earnings
|
$ | 28,748 | $ | 102,971 | $ | 74,589 | $ | 75,360 | $ | 281,668 | ||||||||||
|
Net earnings per share:
|
||||||||||||||||||||
|
Basic
|
$ | 0.13 | $ | 0.47 | $ | 0.34 | $ | 0.34 | $ | 1.27 | ||||||||||
|
Diluted
|
$ | 0.13 | $ | 0.46 | $ | 0.33 | $ | 0.33 | $ | 1.26 | ||||||||||
75
None.
EVALUATION OF DISCLOSURE CONTROLS AND PROCEDURES
We maintain disclosure controls and procedures (“disclosure controls”) that are designed to ensure that information required to be disclosed in our reports filed under the Securities Exchange Act of 1934 is recorded, processed, summarized and reported within the time periods specified in the U.S. Securities and Exchange Commission’s rules and forms. Disclosure controls are also designed to ensure that this information is accumulated and communicated to management, including the chief executive officer (“CEO”) and the chief financial officer (“CFO”), as appropriate, to allow timely decisions regarding required disclosure.
As of the end of the period covered by this report, we evaluated the effectiveness of the design and operation of our disclosure controls. This evaluation was performed under the supervision and with the participation of management, including the CEO and CFO. Based upon that evaluation, the CEO and CFO concluded that our disclosure controls were effective as of the end of the period.
CHANGES IN INTERNAL CONTROL OVER FINANCIAL REPORTING
There was no change in our internal control over financial reporting that occurred during the quarter ended February 28, 2011, that has materially affected, or is reasonably likely to materially affect, our internal control over financial reporting.
MANAGEMENT'S REPORT ON INTERNAL CONTROL OVER FINANCIAL REPORTING
Management's annual report on internal control over financial reporting is included in Item 8, Consolidated Financial Statements and Supplementary Data, of this Form 10-K and is incorporated herein by reference.
None.
76
With the exception of the information incorporated by reference from our 2011 Proxy Statement in Items 10, 11, 12, 13 and 14 of Part III of this Annual Report on Form 10-K, our 2011 Proxy Statement is not to be deemed filed as a part of this Form 10-K.
The following table identifies our executive officers as of February 28, 2011. We are not aware of any family relationships among any of our executive officers or between any of our executive officers and any directors. All executive officers are elected annually and serve for one year or until their successors are elected and qualify. The next election of officers will occur in June 2011.
|
Name
|
Age
|
Office
|
|
Thomas J. Folliard
|
46
|
President, Chief Executive Officer and Director
|
|
Keith D. Browning
|
58
|
Executive Vice President, Finance and Director
|
|
Michael K. Dolan
|
61
|
Executive Vice President and Chief Administrative Officer
|
|
Joseph S. Kunkel
|
48
|
Senior Vice President, Marketing and Strategy
|
|
Eric M. Margolin
|
57
|
Senior Vice President, General Counsel and Corporate Secretary
|
|
Thomas W. Reedy
|
46
|
Senior Vice President and Chief Financial Officer
|
|
Richard M. Smith
|
53
|
Senior Vice President and Chief Information Officer
|
|
William C. Wood, Jr.
|
44
|
Senior Vice President, Sales
|
Mr. Folliard joined CarMax in 1993 as senior buyer and became director of purchasing in 1994. He was promoted to vice president of merchandising in 1996, senior vice president of store operations in 2000 and executive vice president of store operations in 2001. Mr. Folliard became president and chief executive officer and a director of CarMax in 2006.
Mr. Browning joined CarMax in 1996 as vice president and chief financial officer after spending 14 years at Circuit City, his last position being corporate controller and vice president. He has been involved in the development of accounting procedures, systems and internal controls for CarMax since its inception. Mr. Browning was promoted to executive vice president and chief financial officer in 2001, and in 2010, he was named executive vice president, finance. He has served as a director of CarMax since 1997.
Mr. Dolan joined CarMax in 1997 as vice president and chief information officer. He was named senior vice president in 2001 and was promoted to executive vice president and chief administrative officer in 2006. Mr. Dolan had prior executive experience in information systems with H.E. Butt Grocery Company, a privately held grocery retailer, where he was vice president and chief information officer.
Mr. Kunkel joined CarMax in 1998 as vice president, marketing and strategy. Mr. Kunkel was named senior vice president in 2001. Prior to joining CarMax, Mr. Kunkel was president of Wholesome Kidfoods, Inc. and a senior manager with McKinsey and Company.
Mr. Margolin joined CarMax in 2007 as senior vice president, general counsel and corporate secretary. Prior to joining CarMax, he was senior vice president, general counsel and corporate secretary with Advance Auto Parts, Inc. and vice president, general counsel and corporate secretary with Tire Kingdom, Inc.
Mr. Reedy joined CarMax in 2003 as its vice president and treasurer and, in January 2010, was promoted to senior vice president, finance. In October 2010, Mr. Reedy was promoted to senior vice president and chief financial officer. Prior to joining CarMax, Mr. Reedy was vice president, corporate development and treasurer of Gateway, Inc., a technology retail company.
Mr. Smith was the first full-time associate of CarMax, having worked on the original CarMax concept while at Circuit City in 1991. He has held various positions in technology and operations throughout his tenure with CarMax and was promoted to vice president, management information systems, in 2005. He was promoted to senior vice president and chief information officer in 2006.
77
Mr. Wood joined CarMax in 1993 as a buyer-in-training. He has served as buyer, purchasing manager, district manager, regional director and director of buyer development. He was named vice president, merchandising in 1998 and was promoted to vice president of sales operations in 2007. In January 2010, Mr. Wood was promoted to senior vice president, sales. Prior to joining CarMax, Mr. Wood worked at Circuit City from 1989 to 1993.
The information concerning our directors required by this Item is incorporated by reference to the section titled “Proposal One - Election of Directors” in our 2011 Proxy Statement.
The information concerning the audit committee of our board of directors and the audit committee financial expert required by this Item is incorporated by reference to the information included in the sub-section titled “Committees of the Board – Audit Committee” in our 2011 Proxy Statement.
The information concerning compliance with Section 16(a) of the Securities Exchange Act of 1934 required by this Item is incorporated by reference to the sub-section titled “Section 16(a) Beneficial Ownership Reporting Compliance” in our 2011 Proxy Statement.
The information concerning our code of ethics (“Code of Business Conduct”) for senior management required by this Item is incorporated by reference to the sub-section titled “Corporate Governance Policies and Practices” in our 2011 Proxy Statement.
We have made material changes to the procedures by which our shareholders may recommend nominees to our board of directors, which were previously reported and can be found in Part II, Item 5 of our Quarterly Report on Form 10-Q, filed January 7, 2011.
The information required by this Item is incorporated by reference to the section titled “Executive Compensation” appearing in our 2011 Proxy Statement. Additional information required by this Item is incorporated by reference to the sub-section titled “Non-Employee Director Compensation in Fiscal 2011” in our 2011 Proxy Statement.
The information required by this Item is incorporated by reference to the section titled “CarMax Share Ownership” and the sub-section titled “Equity Compensation Plan Information” in our 2011 Proxy Statement.
The information required by this Item is incorporated by reference to the section titled “Certain Relationships and Related Transactions” in our 2011 Proxy Statement.
The information required by this Item concerning director independence is incorporated by reference to the sub-section titled “Director Independence” in our 2011 Proxy Statement.
The information required by this Item is incorporated by reference to the sub-section titled “Auditor Information” in our 2011 Proxy Statement.
78
|
(a)
|
The following documents are filed as part of this report:
|
|
1.
|
Financial Statements.
All financial statements as set forth under Item 8 of this Form 10-K.
|
|
2.
|
Financial Statement Schedules.
“Schedule II – Valuation and Qualifying Accounts and Reserves” and the accompanying Report of Independent Registered Public Accounting Firm on CarMax, Inc. Financial Statement Schedule for the fiscal years ended February 28, 2011, 2010, and 2009, are filed as part of this Form 10-K and should be read in conjunction with the Consolidated Financial Statements of CarMax, Inc. and Notes thereto, included in Item 8 of this Form 10-K.
|
|
|
Schedules not listed above have been omitted because they are not applicable, are not required or the information required to be set forth therein is included in the Consolidated Financial Statements and Notes thereto.
|
|
3.
|
Exhibits.
The Exhibits listed on the accompanying Index to Exhibits immediately following the financial statement schedule are filed as part of, or incorporated by reference into, this Form 10-K.
|
|
(b)
|
Exhibits
|
|
|
See Item 15(a)(3) above.
|
|
(c)
|
Financial Statement Schedules
|
|
|
See Item 15(a)(2) above.
|
79
Signatures
Pursuant to the requirements of Section 13 or 15(d) of the Securities Exchange Act of 1934, the registrant has duly caused this report to be signed on its behalf by the undersigned, thereunto duly authorized.
|
CarMax, Inc.
|
|||||||
|
By:
|
/s/
Thomas J. Folliard
Thomas J. Folliard
President and Chief Executive Officer
April 28, 2011
|
By:
|
/s/
Thomas W. Reedy
Thomas W. Reedy
Senior Vice President and Chief Financial Officer
April 28, 2011
|
||||
Pursuant to the requirements of the Securities Exchange Act of 1934, this report has been signed by the following persons on behalf of the registrant and in the capacities and on the dates indicated:
|
/s/
Thomas J. Folliard
Thomas J. Folliard
President, Chief Executive Officer and Director
April 28, 2011
|
/s/
W. Robert Grafton *
W. Robert Grafton
Director
April 28, 2011
|
|
/s
/ Thomas W. Reedy
Thomas W. Reedy
Senior Vice President and Chief Financial Officer
April 28, 2011
|
/s/
Edgar H. Grubb *
Edgar H. Grubb
Director
April 28, 2011
|
|
/s/
K
im
D. O
rcutt
Kim D. Orcutt
Chief Accounting Officer
April 28, 2011
|
/s/
M
itchell
D. S
teenrod *
Mitchell D. Steenrod
Director
April 28, 2011
|
|
/s/
K
eith
D. B
rowning
Keith D. Browning
Director
April 28, 2011
|
/s/
T
homas
G. S
temberg
*
Thomas G. Stemberg
Director
April 28, 2011
|
|
/s/
R
onald
E. B
laylock *
Ronald E. Blaylock
Director
April 28, 2011
|
/s/
V
ivian
M. S
tephenson
*
Vivian M. Stephenson
Director
April 28, 2011
|
|
/s/
R
akesh
G
angwal
*
Rakesh Gangwal
Director
April 28, 2011
|
/s/
B
eth
A. S
tewart
*
Beth A. Stewart
Director
April 28, 2011
|
|
/s
/
J
effrey
E. G
arten
*
Jeffrey E. Garten
Director
April 28, 2011
|
/s/
William R. Tiefel *
William R. Tiefel
Director
April 28, 2011
|
|
/s/
S
hira
G
oodman
*
Shira Goodman
Director
April 28, 2011
|
|
*By:
|
/s/
Thomas J. Folliard
Thomas J. Folliard
Attorney-In-Fact
|
The original powers of attorney authorizing Thomas J. Folliard and Thomas W. Reedy, or either of them, to sign this annual report on behalf of certain directors and officers of the company are included as Exhibit 24.1.
80
Schedule II
CARMAX, INC. AND SUBSIDIARIES
Valuation and Qualifying Accounts and Reserves
|
(
In thousands
)
|
Balance at Beginning of Fiscal Year
|
Charged to Income
|
Charge-offs Less Recoveries
|
Balance at End of Fiscal Year
|
||||||||||||
|
Allowance for doubtful accounts
(1)
:
|
||||||||||||||||
|
Year ended February 28, 2009
|
$ | 4,571 | $ | 3,419 | $ | (3,553 | ) | $ | 4,437 | |||||||
|
Year ended February 28, 2010
|
$ | 4,437 | $ | 2,169 | $ | (2,637 | ) | $ | 3,969 | |||||||
|
Year ended February 28, 2011
(2)
|
$ | 2,872 | $ | 2,836 | $ | (2,274 | ) | $ | 3,434 | |||||||
|
Allowance for loan losses
(3)
:
|
||||||||||||||||
|
Year ended February 28, 2011
|
$ | 58,628 | $ | 27,749 | $ | (47,523 | ) | $ | 38,854 | |||||||
|
(1)
Certain prior year amounts have been adjusted to conform to the current year’s presentation with no net effect on the consolidated financial statements.
|
|
(2)
Balance at beginning of fiscal year reflects the impact of adopting ASU Nos. 2009-16 and 2009-17 effective March 1, 2010. See 2(E) for additional information.
|
|
(3)
See Notes 2(E) and 2(H) for additional information on the auto loan receivables and the allowance for loan losses.
|
81
INDEX TO EXHIBITS
|
3.1
|
CarMax, Inc. Amended and Restated Articles of Incorporation, effective June 6, 2002, filed as Exhibit 3.1 to CarMax’s Current Report on Form 8-K, filed October 3, 2002 (File No. 1-31420), is incorporated by this reference.
|
||
|
3.2
|
CarMax, Inc. Articles of Amendment to the Amended and Restated Articles of Incorporation, effective June 6, 2002, filed as Exhibit 3.2 to CarMax’s Current Report on Form 8-K, filed October 3, 2002 (File No. 1-31420), is incorporated by this reference.
|
||
|
3.3
|
CarMax, Inc. Bylaws, as amended and restated January 26, 2011, filed as Exhibit 3.1 to CarMax’s Current Report on Form 8-K, filed January 27, 2011 (File No. 1-31420), is incorporated by this reference.
|
||
|
4.1
|
Rights Agreement, dated as of May 21, 2002, between CarMax, Inc. and Wells Fargo Bank Minnesota, N.A., as Rights Agent, filed as Exhibit 4.1 to CarMax’s Registration Statement on Form S-4/A, filed June 6, 2002 (File No. 333-85240), is incorporated by this reference.
|
||
|
4.2
|
Appointment, Assignment and Assumption Agreement, dated as of November 28, 2008, between CarMax, Inc. and American Stock Transfer & Trust Company, LLC, as Rights Agent, filed as Exhibit 4.2 to CarMax’s Quarterly Report on Form 10-Q, filed January 8, 2009 (File No. 1-31420), is incorporated by this reference.
|
||
|
10.1
|
Employment Agreement between CarMax, Inc. and Thomas J. Folliard, filed as Exhibit 10.1 to CarMax’s Current Report on Form 8-K/A, filed October 23, 2006 (File No. 1-31420) is incorporated by this reference. *
|
||
|
10.2
|
Severance Agreement between CarMax, Inc. and Keith D. Browning, filed as Exhibit 10.1 to CarMax’s Current Report on Form 8-K, filed February 21, 2007 (File No. 1-31420) is incorporated by this reference. *
|
||
|
10.3
|
Severance Agreement between CarMax, Inc. and Michael K. Dolan, filed as Exhibit 10.2 to CarMax’s Current Report on Form 8-K, filed February 21, 2007 (File No. 1-31420) is incorporated by this reference. *
|
||
|
10.4
|
Severance Agreement between CarMax, Inc. and Joseph S. Kunkel, filed as Exhibit 10.3 to CarMax’s Current Report on Form 8-K, filed February 21, 2007 (File No. 1-31420) is incorporated by this reference. *
|
||
|
10.5
|
Severance Agreement between CarMax, Inc. and Thomas W. Reedy, filed as Exhibit 10.1 to CarMax’s Quarterly Report on Form 10-Q, filed January 7, 2011 (File No. 1-31420) is incorporated by this reference. *
|
||
|
10.6
|
Severance Agreement between CarMax, Inc. and William C. Wood, Jr., filed herewith. *
|
||
|
10.7
|
Form Amendment to CarMax, Inc. Employment/Severance Agreement for Executive Officer, dated as of November 3, 2008, filed as Exhibit 10.3 to CarMax’s Quarterly Report on Form 10-Q, filed January 8, 2009 (File No. 1-31420), is incorporated by this reference. *
|
||
|
10.8
|
CarMax, Inc. Benefit Restoration Plan, as amended and restated effective as of January 1, 2008, filed as Exhibit 10.2 to CarMax’s Quarterly Report on Form 10-Q, filed July 10, 2008 (File No. 1-31420), is incorporated by this reference. *
|
||
|
10.9
|
CarMax, Inc. Retirement Restoration Plan, effective as of January 1, 2009, filed as Exhibit 10.2 to CarMax’s Current Report on Form 8-K, filed October 23, 2008 (File No. 1-31420), is incorporated by this reference. *
|
||
82
|
10.10
|
Amendment to CarMax, Inc. Benefit Restoration Plan, effective as of January 1, 2009, filed as Exhibit 10.1 to CarMax’s Current Report on Form 8-K, filed October 23, 2008 (File No. 1-31420), is incorporated by this reference. *
|
|
|
10.11
|
CarMax, Inc. Executive Deferred Compensation Plan, effective as of January 1, 2011, filed as Exhibit 10.1 to CarMax’s Current Report on Form 8-K, filed August 11, 2010 (File No. 1-31420), is incorporated by this reference. *
|
|
|
10.12
|
CarMax, Inc. Non-Employee Directors Stock Incentive Plan, as amended and restated June 24, 2008, filed as Exhibit 10.1 to CarMax’s Quarterly Report on Form 10-Q, filed July 10, 2008 (File No. 1-31420), is incorporated by this reference. *
|
|
|
10.13
|
CarMax, Inc. 2002 Stock Incentive Plan, as amended and restated June 23, 2009, filed as Exhibit 10.1 to CarMax’s Current Report on Form 8-K, filed June 26, 2009 (File No. 1-31420), is incorporated by this reference. *
|
|
|
10.14
|
CarMax, Inc. Annual Performance-Based Bonus Plan, as amended and restated June 26, 2007, filed as Exhibit 10.1 to CarMax’s Current Report on Form 8-K, filed June 29, 2007 (File No. 1-31420), is incorporated by this reference. *
|
|
10.15
|
CarMax, Inc. 2002 Employee Stock Purchase Plan, as amended and restated June 23, 2009, filed as Exhibit 10.1 to CarMax’s Quarterly Report on Form 10-Q, filed July 9, 2009 (File No. 1-31420), is incorporated by this reference.
|
|
|
10.16
|
Credit Agreement, dated August 24, 2005, among CarMax Auto Superstores, Inc., CarMax, Inc., various subsidiaries of CarMax, various Lenders named therein and Bank of America N.A., as Administrative Agent, filed as Exhibit 10.1 to CarMax’s Quarterly Report on Form 10-Q, filed October 12, 2010 (File No. 1-31420), is incorporated by this reference.
|
|
|
10.17
|
Security Agreement, dated August 24, 2005, among CarMax, Inc., CarMax Auto Superstores, Inc., various subsidiaries of CarMax named therein and Bank of America N.A., as Administrative Agent, filed as Exhibit 10.2 to CarMax’s Quarterly Report on Form 10-Q, filed October 7, 2005 (File No. 1-31420), is incorporated by this reference.
|
|
|
10.18
|
Company Guaranty Agreement, dated August 24, 2005, between CarMax, Inc. and Bank of America N.A., as Administrative Agent, filed as Exhibit 10.3 to CarMax's Quarterly Report on Form 10-Q, filed October 7, 2005 (File No. 1-31420), is incorporated by this reference.
|
|
|
10.19
|
Amendment No. 1 to Credit Agreement and Joinder Agreement, dated December 8, 2006, among CarMax Auto Superstores, Inc., CarMax, Inc, various subsidiaries of CarMax, various Lenders named therein and Bank of America N.A., as Administrative Agent, filed as Exhibit 10.2 to CarMax’s Quarterly Report on Form 10-Q, filed October 12, 2010 (File No. 1-31420), is incorporated by this reference.
|
|
|
10.20
|
Amendment No. 2 to Credit Agreement and Joinder Agreement, dated as of July 17, 2008, among CarMax Auto Superstores, Inc., CarMax, Inc, various subsidiaries of CarMax, various Lenders named therein and Bank of America N.A., as Administrative Agent, filed as Exhibit 10.3 to CarMax’s Quarterly Report on Form 10-Q, filed October 12, 2010 (File No. 1-31420), is incorporated by this reference.
|
|
|
10.21
|
||
|
Amendment No. 3 to Credit Agreement and Joinder Agreement, dates as of May 12, 2010, among CarMax Auto Superstores, Inc., CarMax, Inc, various subsidiaries of CarMax, various Lenders named therein and Bank of America N.A., as Administrative Agent, filed as Exhibit 10.1 to CarMax’s Quarterly Report on Form 10-Q, filed July 12, 2010 (File No. 1-31420), is incorporated by this reference.
|
||
|
10.22
|
Form of Notice of Stock Option Grant between CarMax, Inc. and certain named and other executive officers, effective as of October 18, 2010, filed as Exhibit 10.1 to CarMax’s Current Report on Form 8-K, filed October 22, 2010 (File No. 1-31420), is incorporated by this reference. *
|
|
83
|
10.23
|
Form of Notice of Restricted Stock Grant between CarMax, Inc. and certain executive officers, effective as of January 1, 2009, filed as Exhibit 10.2 to CarMax’s Quarterly Report on Form
10-Q, filed January 8, 2009 (File No. 1-31420), is incorporated by this reference. *
|
||
|
10.24
|
Form of Notice of Market Stock Unit Grant between CarMax, Inc. and certain named and other executive officers, effective as of October 18, 2010, filed as Exhibit 10.1 to CarMax’s Current Report on Form 8-K, filed October 22, 2010 (File No. 1-31420), is incorporated by this reference. *
|
||
|
10.25
|
Form of Notice of Restricted Stock Unit Grant between CarMax, Inc. and certain executive officers, effective as of March 27, 2009, filed as Exhibit 10.3 to CarMax’s Current Report on Form 8-K, filed April 2, 2009 (File No. 1-31420), is incorporated by this reference. *
|
||
|
10.26
|
Form of Directors Stock Option Grant Agreement between CarMax, Inc. and certain non-employee directors of the CarMax, Inc. board of directors, filed as Exhibit 10.3 to CarMax’s Quarterly Report on Form 10-Q, filed July 10, 2008 (File No. 1-31420), is incorporated by this reference. *
|
||
|
10.27
|
Form of Stock Grant Notice Letter from CarMax, Inc. to certain non-employee directors of the CarMax, Inc. board of directors, filed as Exhibit 10.20 to CarMax’s Annual Report on Form 10-K, filed May 13, 2005 (File No. 1-31420), is incorporated by this reference. *
|
||
|
21.1
|
CarMax, Inc. Subsidiaries, filed herewith.
|
||
|
23.1
|
Consent of KPMG LLP, filed herewith.
|
|||
|
24.1
|
Powers of Attorney, filed herewith.
|
|||
|
31.1
|
Certification of the Chief Executive Officer Pursuant to Rule 13a-14(a), filed herewith.
|
|||
|
31.2
|
Certification of the Chief Financial Officer Pursuant to Rule 13a-14(a), filed herewith.
|
|||
|
32.1
|
Certification of the Chief Executive Officer Pursuant to 18 U.S.C. Section 1350, filed herewith.
|
|||
|
32.2
|
Certification of the Chief Financial Officer Pursuant to 18 U.S.C. Section 1350, filed herewith.
|
|||
|
101.INS
(1)
|
XBRL Instance Document.
|
|
|
101.SCH
(1)
|
XBRL Taxonomy Extension Schema Document.
|
|
|
101.CAL
(1)
|
XBRL Taxonomy Extension Calculation Linkbase Document.
|
|
|
101.DEF
(1)
|
XBRL Taxonomy Extension Definition Linkbase Document.
|
|
|
101.LAB
(1)
|
XBRL Taxonomy Extension Label Linkbase Document.
|
|
|
101.PRE
(1)
|
XBRL Taxonomy Extension Presentation Linkbase Document.
|
|
|
*
|
Indicates management contracts, compensatory plans or arrangements of the company required to be filed as an exhibit.
|
|
|
(1)
In accordance with Rule 406T of Regulation S-T, the XBRL related information in Exhibit 101 to this Annual Report on Form 10-K is deemed not filed or part of a registration statement or prospectus for purposes of Sections 11 or 12 of the Securities Act, is deemed not filed for purposes of Section 18 of the Exchange Act, and is otherwise not subject to liability under those sections.
|
84
TABLE OF CONTENTS
Part IItem 1. BusinessItem 1A. Risk FactorsItem 1B. Unresolved Staff CommentsItem 2. PropertiesItem 3. Legal ProceedingsItem 4. ReservedPart IIItem 5. Market For The Registrant S Common Equity, Related Stockholder Matters and Issuer Purchases Of Equity SecuritiesItem 6. Selected Financial DataItem 7. Man Ageme Nt S Discussion and Analysis Of Financial Condition and Results Of OperationsItem 7A. Quantitative and Qualitative Disclosures About Market RiskItem 8. Consolidated Financial Statements and Supplementary DataItem 9. Changes in and Disagreements with Accountants on Accounting and Financial DisclosureItem 9A. Controls and ProceduresItem 9B. Other InformationPart IIIItem 10. Directors, Executive Officers and Corporate GovernanceItem 11. Executive CompensationItem 12. Security Ownership Of Certain Beneficial Owners and Management and Related Stockholder MattersItem 13. Certain Relationships and Related Transactions and Director IndependenceItem 14. Principal Accountant Fees and ServicesPart IVItem 15. Exhibits and Financial Statement Schedules