KNOWLES CORP
10-Ks and 10-Qs
|
|
|
|
|
|
|
|
|
|
|
|
|
|
|
|
|
|
|
|
|
|
|
|
|
|
|
|
|
|
|
|
UNITED STATES
SECURITIES AND EXCHANGE COMMISSION
Washington, D.C. 20549
FORM 10-K
(Mark One)
x
ANNUAL REPORT PURSUANT TO SECTION 13 or 15(d) OF THE SECURITIES EXCHANGE ACT OF 1934
For the fiscal year ended December 31, 2014
.
or
o
TRANSITION REPORT PURSUANT TO SECTION 13 OR 15(d) OF THE SECURITIES EXCHANGE ACT
OF 1934
For the transition period from to
Commission File Number: 001-36102
Knowles Corporation
(Exact name of registrant as specified in its charter)
|
Delaware
|
90-1002689
|
|
(State or other jurisdiction of incorporation or organization)
|
(I.R.S. Employer Identification No.)
|
|
|
|
|
1151 Maplewood Drive
|
|
|
Itasca, Illinois
|
60143
|
|
(Address of principal executive offices)
|
(Zip Code)
|
(630) 250-5100
(Registrant’s telephone number, including area code)
|
Securities registered pursuant to Section 12(b) of the Act:
|
||
|
Title of each class
|
|
Name of each exchange on which registered
|
|
Common Stock, par value $0.01 per share
|
|
New York Stock Exchange
|
|
Securities registered pursuant to Section 12(g) of the Act: None
|
||
Indicate by check mark if the registrant is a well-known seasoned issuer, as defined in Rule 405 of the Securities Act. Yes
o
No
þ
Indicate by check mark if the registrant is not required to file reports pursuant to Section 13 or 15(d) of the Act. Yes
o
No
þ
Indicate by check mark whether the registrant: (1) has filed all reports required to be filed by Section 13 or 15(d) of the Securities Exchange Act of 1934 during the preceding 12 months (or for such shorter period that the registrant was required to file such reports) and (2) has been subject to such filing requirements for the past 90 days.
Yes
þ
No
o
Indicate by check mark whether the registrant has submitted electronically and posted on its corporate Web site, if any, every Interactive Data File required to be submitted and posted pursuant to Rule 405 of Regulation S-T (§232.405 of this chapter) during the preceding 12 months (or for such shorter period that the registrant was required to submit and post such files).
Yes
þ
No
o
Indicate by check mark if disclosure of delinquent filers pursuant to Item 405 of Regulation S-K (§229.405) is not contained herein, and will not be contained, to the best of registrant’s knowledge, in definitive proxy or information statements incorporated by reference in Part III of this Form 10-K or any amendment to this Form 10-K.
þ
Indicate by check mark whether the registrant is a large accelerated filer, an accelerated filer, a non-accelerated filer, or a smaller reporting company. See the definitions of “large accelerated filer,” “accelerated filer” and “smaller reporting company” in Rule 12b-2 of the Exchange Act. (Check one):
|
Large accelerated filer
þ
|
Accelerated filer
o
|
|
|
Non-accelerated filer
o
|
(Do not check if smaller reporting company)
|
Smaller reporting company
o
|
Indicate by check mark whether the registrant is a shell company (as defined in Rule 12b-2 of the Exchange Act).
Yes
o
No
þ
The aggregate market value of the voting and non-voting common stock held by non-affiliates of the registrant as of the close of business on
June 30, 2014
was
$2,614,095,909
. The registrant’s closing price as reported on the New York Stock Exchange-Composite Transactions for
June 30, 2014
was
$30.74
per share. The number of outstanding shares of the registrant’s common stock as of
February 18, 2015
was 85,069,974.
DOCUMENTS INCORPORATED BY REFERENCE
Certain information contained in the registrant's Proxy Statement for its
2015
Annual Meeting of Stockholders is incorporated by reference into Part III hereof.
Table of Contents
|
Page
|
||
Our Separation from Dover Corporation
On February 28, 2014, Knowles Corporation ("Knowles") became an independent, publicly-traded company as a result of the distribution by Dover Corporation ("Dover") of 100% of the outstanding common stock of Knowles to Dover’s stockholders. Dover’s Board of Directors approved the distribution of its shares of Knowles on February 6, 2014. Knowles’ Registration Statement on Form 10 was declared effective by the U.S. Securities and Exchange Commission on February 10, 2014. On February 28, 2014, Dover's stockholders of record as of the close of business on February 19, 2014 ("record date") received one share of Knowles common stock for every two shares of Dover common stock held as of the record date. Knowles' common stock began trading “regular-way” under the ticker symbol “KN” on the New York Stock Exchange on March 3, 2014.
Unless the context otherwise requires, references in this Annual Report on Form 10-K to (i) “Knowles,” the “Company,” “we,” “our” or “us” refer to Knowles Corporation and its consolidated subsidiaries, after giving effect to the spin-off of Knowles from Dover Corporation, (ii) “Former Parent” refer to Dover Corporation and (iii) the “Separation” or the “Distribution” refer to our spin-off from our Former Parent. Knowles was incorporated in Delaware on June 12, 2013 for the purpose of holding certain of Former Parent’s communication technologies businesses in connection with the Separation. The address of our principal executive offices is 1151 Maplewood Drive, Itasca, Illinois 60143. Our telephone number is 630-250-5100.
Our Company
We are a market leader and global supplier of advanced micro-acoustic solutions and specialty components serving the mobile communications, consumer electronics, medical technology, military, aerospace and industrial markets. We have a leading position in micro-electro-mechanical systems ("MEMS") microphones, speakers and receivers which are used in smartphones, tablets and mobile handsets. We are also a leading manufacturer of transducers used in hearing aids and other medical devices and have a strong position in oscillators (timing devices) and capacitor components which enable various types of communication. Our focus on the customer, combined with unique technology, rigorous testing and global scale, helps to deliver innovative solutions and consistently dependable and precise products.
Our Strategy
Knowles is committed to growing market leadership in our current business segments and potentially expanding into attractive adjacent markets. This will be accomplished by guiding our research and development efforts towards opportunities that exhibit the greatest potential for optimal long-term returns and through the expansion of our technology platforms, while maintaining the highest product quality and operational excellence in the business. Inorganic growth may also be part of our strategy. We will measure our success through revenue growth, margin expansion, market share gains, stockholder return and stakeholder satisfaction.
Our Business Segments
We are organized into two reportable segments based on how management analyzes performance, allocates capital and makes strategic and operational decisions. These segments were determined in accordance with the Financial Accounting Standards Board ("FASB") Accounting Standards Codification ("ASC") Topic 280-Segment Reporting and are comprised of (i) Mobile Consumer Electronics (“MCE”) and (ii) Specialty Components (“SC”). The segments are aligned around similar product applications serving our key end markets, to enhance focus on end market growth strategies.
|
•
|
MCE designs and manufactures innovative acoustic products, including microphones, speakers, receivers and integrated modules used in several applications that serve the handset, tablet and other consumer electronic markets. Locations include the corporate office in Itasca, Illinois; sales, support and engineering facilities in North America, Europe and Asia; and manufacturing facilities in Asia.
|
3
|
•
|
SC specializes in the design and manufacture of specialized electronic components used in medical and life science applications, as well as high-performance solutions and components used in communications infrastructure and a wide variety of other markets. SC’s transducer products are used principally in hearing aid applications within the commercial audiology markets, while its oscillator products predominantly serve the telecom infrastructure market and its capacitor products are used in applications including radio, radar, satellite, power supplies, transceivers and medical implants serving the defense, aerospace, telecommunication and life sciences markets. Operating facilities and sales, support and engineering facilities are located in North America, Europe and Asia.
|
We sell our products directly to original equipment manufacturers (“OEMs”) and to their contract manufacturers and suppliers and to a lesser extent through distributors worldwide.
The following table shows the percentage of total revenue generated by each of our segments for the years ended
December 31, 2014
,
2013
and
2012
:
|
|
Revenue
|
||||||||
|
Years Ended December 31,
|
|||||||||
|
2014
|
2013
|
2012
|
|||||||
|
Mobile Consumer Electronics
|
60
|
%
|
64
|
%
|
60
|
%
|
|||
|
Specialty Components
|
40
|
%
|
36
|
%
|
40
|
%
|
|||
The following table shows total assets by segment at
December 31, 2014
and
2013
:
|
(in millions)
|
December 31,
|
||||||
|
2014
|
2013
|
||||||
|
Mobile Consumer Electronics
|
$
|
1,474.1
|
|
$
|
1,638.2
|
|
|
|
Specialty Components
|
525.8
|
|
538.7
|
|
|||
|
Corporate / eliminations
|
(1.4
|
)
|
(6.8
|
)
|
|||
|
Total
|
$
|
1,998.5
|
|
$
|
2,170.1
|
|
|
Market Trends
Our products serve a variety of end markets, notably, consumer mobile devices, medical technology, aerospace and defense and telecommunications and can generally be divided into two categories: MCE and SC, as described below.
|
•
|
MCE-
Includes analog and digital microphones, MEMS microphones, surface mounted device microphones, receivers, speakers, integrated modules, multi-functional devices, ultrasonic sensors and integrated audio sub-systems.
|
|
•
|
SC-
Includes transducers, oscillators, capacitors and filters.
|
The markets served by MCE continue to be driven by trends in smartphone and tablet innovation and demand. Today, mobile device OEMs are facing ever-rising challenges to differentiate their products in the global marketplace while managing growing cost pressures and time-to-market expectations. However, mobile consumers and mobile carriers alike are expecting better quality voice calls, audio and video conferencing, capturing and playback, media content consumption and gaming, as well as extended battery life. To enable smart mobile devices to handle ever more demanding audio use cases, OEMs are increasingly adopting more intelligent active audio components (audio chipset) and higher performance passive acoustic components. Trends impacting the smartphone market today include:
|
•
|
Smartphone growth from feature phone substitution
. The smartphones segment within the handset device market has exhibited consistently strong unit growth over the past several years. There continues to be a positive mix shift from the proliferation of lower-end smartphone devices and the further cannibalization of feature phones (i.e., non-smartphones). The average smartphone continues to drive higher audio content including more microphones and higher value speakers than its feature phone counterpart, compounding the growth of acoustic content as mobile phone sales rise.
|
|
•
|
Smartphone OEM market share shifts are likely to remain volatile for some time
. Over the past several years, Nokia, Blackberry and Samsung have lost significant market share to other United States and Asian-based OEMs who have released smartphones that have been more readily accepted due to, among other factors, perceived feature sets
|
4
and price points. We expect the OEM market to continue to be dynamic over time, characterized by rapid market share shifts driven by new product introductions, price points and feature sets.
|
•
|
New OEM product line rollouts
. Smartphones continue to shift to Long Term Evolution (“LTE”), a standard for 4G wireless technology and the shift is expected to buoy unit growth in developed markets and drive the competitive landscape in high-end chipsets through 2015. Aggressive LTE deployments are happening in China, in addition to a build-out of deeper coverage profiles in the United States, Japan, Korea and Northern Europe. Deployments are also expected to accelerate in emerging markets. This will likely drive an increase in LTE smartphone units over the next several years, which should help maintain some level of high-end smartphone volume growth despite high market penetration.
|
|
•
|
Shortened smartphone upgrade plans at U.S. carriers
. Several U.S. carriers have recently introduced new smartphone plans which offer consumers the option of paying for their phone in monthly installments with no upfront lump sum payment and the ability to upgrade again in 12 months. Plans such as these could drive greater-than-expected unit growth (turnover) at the high end, as they are most likely to appeal to high-income consumers seeking to upgrade their phone more frequently.
|
|
•
|
High-end consumer elasticity
. Consumers are reluctant to downgrade from a high-end smartphone to a low-end smartphone in most circumstances. This is especially true as high-end smartphones will likely continue to offer significant performance advantages and new functionality compared to low-end smartphones.
|
|
•
|
Proliferation of premium acoustics
. Consumers are seeking improved acoustics solutions, regardless of the country they live in or the type of device they are using. As a result, acoustic dollar content is generally expanding per device for two primary reasons. First, many of the solutions we are introducing are higher performance and command higher value. Secondly, a majority of OEMs are increasing the number of acoustic components per device. Over the past several years, we have seen an increase in the number of microphones used in high end smartphones. The benefits to the user are substantial, including reduced background noise, improved voice recognition, better hands-free communication and enhanced audio recording and playback capabilities. OEMs and their customers recognize the importance of these features in their next-generation products. We believe an additional opportunity exists for these trends to proliferate to mid-range phones and tablets, as well as emerging wearable devices. Knowles can capitalize on these market demands by leveraging our acoustics expertise and proprietary process technologies to deliver solutions that improve the performance of our OEM customers’ devices.
|
Specialty Components products are sold across diverse end markets and relative to the Acoustic Components end markets, portions of this business face much greater exposure to capital investment cycles and government spending, both direct and indirect, as some of these end markets are largely dependent on project upgrades, expansion and government contracts. These products can be divided into the following categories:
|
•
|
Medical and life sciences products (i.e., transducers, hearing aids, capacitors).
Product sales are largely driven by aging demographics, healthcare spending, the rise of a middle class in emerging markets and government subsidies.
|
|
•
|
Aerospace and defense communications (i.e., capacitors, filters, oscillators).
Aerospace and defense spending and automation (largest end market), telecom regional coverage and bandwidth expansion and growing industrial power supply requirements are a few of the end market trends driving the product sales in this sector.
|
|
•
|
Telecom infrastructure (i.e., capacitors, filters, oscillators).
Sales are typically levered to the expansion of large telecom companies, looking to increase wireless signal in new or existing territories, although these products are also sold to aerospace and defense companies (i.e., airplane radio frequencies).
|
Geographic Trends
We strive to maintain our manufacturing facilities in close proximity to our direct customers. In the case of MCE, we operate eight facilities in Asia to serve the contract manufacturers who build OEM equipment on behalf of our end-customers. These contract manufacturers are largely based in China, Taiwan and India. Although end-user demand for consumer electronics is global and marketing activities occur globally, the majority of our manufacturing is located in Asia, primarily in China, Malaysia and the Philippines.
5
In the case of SC, we operate five facilities in Asia to serve the manufacturing sites of both hearing aid OEMs and the contract manufacturers who build OEM headsets on behalf of earphone makers. These OEM manufacturing sites are largely based in China, Singapore, Indonesia and Vietnam. Although marketing activities and end-user demand for hearing aid and specialty consumer components is global, manufacturing is primarily located in Asia for the purposes of being close to the point of assembly. We also operate six facilities in North America and three in Europe for the manufacturing of capacitors and oscillators that support our global telecom and military customers, as well as their suppliers and contract manufacturers.
As a majority of our manufacturing and sales occur outside the United States, we generate the majority of our profits and cash outside the United States. While no significant statutory limitation exists, a repatriation of profits from foreign markets to the United States is inherently inefficient.
Competitive Landscape
Success in the electronic components industry is primarily driven by innovation and flexibility as customers compete to gain a share of the growing consumer device market. We compete across handset, tablet and other consumer platforms to deliver superior acoustic performance through customized products. Our continuous investment in research and development enables us to capture new design wins across consumer OEMs. Flexibility in balancing full and semi-automation is key to achieving a superior cost structure. Additionally, it is important for suppliers to have flexibility and quick time-to-market to meet clients’ needs. Notably, according to industry estimates, the product cycle for handsets has shortened over recent years. Key competitors include:
|
•
|
MCE
- AAC Technologies, Goertek, ST Micro and Invensense; and
|
|
•
|
SC
- Sonion, Rakon, Kyocera, and Epson Electronics.
|
In the MCE segment, our investments in research and development enable us to continually introduce new products with higher performance. Our customers are adopting these higher value microphones, speakers and receivers to improve the overall audio performance of their devices which in turn improves the end user experience. Typically our new products have higher average selling prices than the products they are replacing. Once introduced, the pricing for these products follows a normal downward trend as typically seen in the consumer electronics market. Some OEMs are moving to our higher value integrated module and intelligent audio solutions to enable additional performance advantages.
For products that were introduced more than 18 months ago, we strive to offset anticipated price erosion through bill of material cost reductions, yield improvements, equipment efficiency and movement to lower-cost manufacturing locations.
In the SC segment, the end markets tend to be more stable. Within acoustics we see limited competition but continuously invest to improve acoustic performance for our hearing health and high end headset customers. In precision devices we see a highly fragmented set of competitors across capacitor and oscillator products for a diverse set of end markets including telecom infrastructure, military, aerospace and medical.
Customers, Sales and Distribution
We serve customers in the mobile consumer electronics, medical technology, defense/aerospace, telecommunication infrastructure and other industrial markets. Our customers include some of the largest operators in these markets. In addition, many of our OEM customers outsource their manufacturing to Electronic Manufacturing Services (“EMS”) companies. Other customers include global mobile phone and hearing aid manufacturers and many of the largest global EMS companies, particularly in China. For the year ended
December 31, 2014
,
Apple, Inc.
and
Samsung Group
accounted for approximately
20%
and
12%
, respectively, of our total revenue. For the year ended
December 31, 2013
,
Apple, Inc.
and
Samsung Group
accounted for approximately
25%
and
15%
, respectively, of our total revenue. For the year ended
December 31, 2012
,
Apple, Inc.
accounted for
18%
of our total revenue. No other customer accounted for more than 10% of total revenues during these periods.
6
The following table details our sales by geographic location for the years ended December 31,
2014
,
2013
and
2012
. These results do not necessarily indicate the geographies where our products are deployed or where end-customer demand is originated.
|
(in millions)
|
Years Ended December 31,
|
||||||||||
|
2014
|
2013
|
2012
|
|||||||||
|
Asia
|
$
|
879.0
|
|
$
|
950.4
|
|
$
|
855.5
|
|
||
|
Europe
|
120.4
|
|
120.8
|
|
110.6
|
|
|||||
|
Other Americas
|
12.4
|
|
14.5
|
|
15.2
|
|
|||||
|
Other
|
5.1
|
|
6.0
|
|
6.8
|
|
|||||
|
Subtotal non-United States
|
$
|
1,016.9
|
|
$
|
1,091.7
|
|
$
|
988.1
|
|
||
|
United States
|
124.4
|
|
123.1
|
|
129.9
|
|
|||||
|
Total
|
$
|
1,141.3
|
|
$
|
1,214.8
|
|
$
|
1,118.0
|
|
||
We own and conduct manufacturing operations through a network of facilities throughout the world. We also maintain quality assurance, manufacturing technology, supply chain and distribution departments. Our global distribution center is located in Penang, Malaysia. For our long-lived assets by geographic region, see
Note 14. Segment Information
of the notes to our Consolidated Financial Statements under Item 8, "Financial Statements and Supplementary Data."
Raw Materials
We use a wide variety of raw materials, primarily metals and semi-processed or finished components, which are generally available from a number of sources. As a result, shortages or the loss of any single supplier have not had and are not likely to have, a material impact on operating profits. While the required raw materials are generally available, commodity pricing for various precious metals, such as palladium and gold, and “rare earth” materials (dysprosium and neodymium), fluctuates. As a result, our operating results are exposed to such fluctuations. Although some cost increases may be recovered through increased prices to customers if commodity prices trend upward, we attempt to control such costs through fixed-price contracts with suppliers and various other programs.
We have established a Green Materials Policy, pursuant to which we have established a Green Materials Standard. Our products are in compliance with the European Union Restriction of Hazardous Substances ("EU RoHS") and Waste Electrical and Electronic Equipment ("WEEE") directives. This standard is based on the list of substances identified in the Joint Industry Guide-101 Standard which is endorsed by the Electronic Industry Association, the Joint Electronics Device Engineering Council and the Japan Green Procurement Survey Standardization Initiative associations as well as the Sony Standard-00259.
Research and Development
We conduct research worldwide to discover and develop new acoustic and related products around the world and refine our existing products. Our research is primarily conducted internally. We employ approximately 400 employees worldwide in research and development. Our research and development efforts continue to expand the technology platforms that support our customers’ product and business development. By applying interrelated technologies to the design processes, we strive to enhance and accelerate our customers’ initial concepts and design work, as well as provide for cost-effective component customization, manufacturing and subassembly. Research and development expenses are classified within Operating expenses. We spent
$83.0
million,
$82.6
million and
$77.3
million on research and development, or
7.3%
,
6.8%
and
6.9%
as a percentage of revenue, for the years ended
December 31, 2014
,
2013
and
2012
, respectively.
Intellectual Property and Intangible Assets
We own many patents, trademarks, licenses and other forms of intellectual property, which have been acquired or created over a number of years and, to the extent relevant, expire at various times. A large portion of our intellectual property consists of patents, unpatented technology and trade secrets. In addition, a significant portion of our intangible assets relate to customer relationships. We believe that our commitment to continuous engineering improvements, new product development and improved manufacturing techniques, as well as strong sales, marketing and service efforts, are significant to our leadership positions in the niche markets that we serve.
7
Seasonality
In general, our businesses, while not having significant seasonality, tend to have stronger revenue in the third and fourth quarters of each calendar year. This is particularly true of those businesses that serve the consumer electronics market. Our businesses tend to have short product cycles due to the highly technical nature of the industries they serve which can result in new OEM product launches that can impact quarterly revenues, earnings and cash flow.
Environmental Matters
Our operations are governed by a variety of international, national, state and local environmental laws. These regulations include limitations on discharge of pollutants to air, water and soil; manufacturing chemical use and handling restrictions; and requirements with respect to treatment, transport, storage and disposal of solid and hazardous wastes. We are committed to continued compliance and believe our operations generally are in substantial compliance with these laws.
We are dedicated to the preservation and improvement of our global environment. To help achieve this, we have established a Green Materials Policy pursuant to which we have established a Green Materials Standard. The products we offer are in compliance with the EU RoHS/WEEE regulations. The regulations aim to restrict of the use of certain hazardous substances in electrical and electronic equipment.
Employees
We currently employ approximately 13,000 persons across our facilities in 15 countries. Approximately 88%, 8% and 4% of these employees are located in Asia, North America and Europe, respectively. We are subject to various local, national and multi-national laws and regulations relating to our relationships with our employees. Our workforce in the United States is not unionized, however in the European Union, we have established workers councils composed of management and elected members of our workforce. We believe we generally have good relationships with employees and their representative organizations.
Regulation
It is our policy to maintain the highest ethical standards in the conduct of our affairs and in our relationship with customers, suppliers, employees and the communities in which our operations are located. In accordance with the Electronics Industry Citizenship Coalition, the Electronic Industry Code of Conduct and applicable laws in each country where we operate, including the U.S. Foreign Corrupt Practices Act, the U.K. Bribery Act and other countries’ anti-corruption laws, we strive to ensure that working conditions are safe, our employees are treated with respect and dignity and business operations are environmentally responsible and comply with all applicable laws. In addition, we proactively educate our suppliers and
carry out our commitment to seek out business partners who share our values and, in accordance with our Supplier Code of Conduct, specifically prohibit our suppliers from using forced, bonded, involuntary, prison, or indentured labor.
Other Information
We routinely post our annual reports on Form 10-K, quarterly reports on Form 10-Q, current reports on Form 8-K and any amendments to these reports on the “Financial Information” link on the Investor Relations section of our Internet website, www.knowles.com. We post each of these reports on the website as soon as reasonably practicable after the report is filed with the Securities and Exchange Commission ("SEC"). The information on our Internet website is not incorporated into this Form 10-K.
8
Cautionary Statement Concerning Forward-Looking Statements
This Annual Report on Form 10-K, as well as our Annual Report to Stockholders, quarterly reports and other filings with the SEC, press releases and other oral and written communications, contains certain statements regarding business strategies, market potential, future financial performance, future action, results and any other statements that do not directly relate to any historical or current fact which are “forward-looking” statements within the meaning of the Securities Act of 1933, as amended, the Securities Exchange Act of 1934, as amended, and the Private Securities Litigation Reform Act of 1995. The words “believe,” “expect,” “anticipate,” “project,” “estimate,” “budget,” “continue,” “could,” “intend,” “may,” “plan,” “potential,” “predict,” “seek,” “should,” “will,” “would,” “expect,” “objective,” “forecast,” “goal,” “guidance,” “outlook,” “effort,” “target” and similar expressions, among others, generally identify forward-looking statements, which speak only as of the date the statements were made. Additionally, forward-looking statements include, but are not limited to:
|
o
|
expectations as to future sales of products;
|
|
o
|
ability to protect intellectual property in the United States and abroad;
|
|
o
|
ability to manage new product ramp-ups and introductions for our customers;
|
|
o
|
estimates regarding capital requirements and needs for additional financing;
|
|
o
|
estimates of expenses, future revenues and profitability;
|
|
o
|
estimates of the size of the markets for products and services;
|
|
o
|
expectations related to the rate and degree of market acceptance of products; and
|
|
o
|
estimates of the success of other competing technologies that may become available.
|
In particular, information included under the sections entitled “Business,” “Risk Factors” and “Management’s Discussion and Analysis of Financial Condition and Results of Operations” contain forward-looking statements.
The matters discussed in these forward-looking statements are subject to risks, uncertainties and other factors that could cause actual results to differ materially from those projected, anticipated or implied in the forward-looking statements. Where, in any forward-looking statement, an expectation or belief as to future results or events is expressed, such expectation or belief is based on the current plans and expectations of management and expressed in good faith and believed to have a reasonable basis, but there can be no assurance that the expectation or belief will be achieved or accomplished. Many factors that could cause actual results or events to differ materially from those anticipated include those matters described under the sections entitled “Risk Factors” and “Management’s Discussion and Analysis of Financial Condition and Results of Operations.” Any forward-looking statement speaks of as of the date on which it is made and Knowles does not assume any obligation to update any forward-looking statement as a result of new information, future events, or otherwise, except as required by applicable law.
Risk Factors
Our business, financial condition, operating results, cash flows and stock price can be impacted by a number of factors which could cause our actual results to vary materially from recent results or from anticipated future results. In general, we are subject to the same general risks and uncertainties that impact many other companies such as general economic, industry and/or market conditions and growth rates; possible future terrorist threats and their effect on the worldwide economy; and changes in laws or accounting rules. The risk factors discussed in this section should be considered together with information included elsewhere in this Form 10-K and should not be considered the only risks to which we are exposed.
We depend on a limited number of customers for a substantial portion of our revenues and the loss of, or a significant reduction in orders from, any key customer could significantly reduce our revenues and adversely impact our operating results.
We rely on several key customers. For
2014
, our top ten customers accounted for approximately
61%
of total revenue. For the year ended
December 31, 2014
,
Apple, Inc.
and
Samsung Group
accounted for approximately
20%
and
12%
, respectively, of our total revenue. For the year ended
December 31, 2013
,
Apple, Inc.
and
Samsung Group
accounted for approximately
25%
and
15%
, respectively, of our total revenue. For the year ended
December 31, 2012
,
Apple, Inc.
accounted for
18%
of our total revenue. We expect that a substantial portion of our revenue will continue to be attributable to several key customers. If these customers decide not to buy our products or to purchase lower volumes from us because their own products are not commercially successful or for other reasons, our revenues could substantially decline, which could have a material adverse effect on our results of operations.
9
The markets we serve are concentrated, with a limited number of companies active in these markets. A concentrated market and reliance on a small number of customers gives those customers substantial purchasing power and leverage in negotiating contracts with us. In addition, we do not have long-term agreements or purchase orders with any of our customers, our customers have irregular and unpredictable ordering patterns and our customers may not have regular, predictable product introduction schedules. A decision by any of our major customers to decrease significantly the number of products purchased from us could substantially reduce sales and have a material adverse effect on our business, financial condition and results of operations.
Global markets for the Company’s products are highly competitive and subject to rapid technological change. If the Company is unable to develop new products and compete effectively in these markets, its financial condition and operating results could be materially adversely affected.
We compete in electronic and technology-based industries that are highly dynamic and constantly experiencing change as new technologies are developed. It is characteristic of such industries that sales prices for products decline over time following their introduction to market due to technological obsolescence and the introduction of new technologies. Downward pressure on product prices typically causes downward pressure on component prices as well. Our ability to compete depends on our ability to innovate successfully.
Our competitors may produce products that are more advanced than the products we produce. If our businesses are unable to anticipate our competitors’ development of new products and services, identify customer needs and preferences on a timely basis, or successfully introduce new products and services in response to such competitive factors, including new or enhanced products with higher margins to offset price declines, we may experience lower revenue, operating profits and cash flows. In addition, if we are unable to adapt to the rapid technological changes (which include hiring and retaining top engineering talent), or for those products which are subject to declining average selling prices, we are unable to increase our unit volumes, introduce new or enhanced products with higher margins and/or reduce manufacturing costs to offset price decreases in existing products, our products could become obsolete or commoditized and business and operating results may be materially adversely affected.
Our products must undergo lengthy and expensive qualification processes without any assurance of product sales. The costs associated with new product introductions and execution of related manufacturing ramp-ups could negatively impact our operating results and profits.
A significant portion of our revenue is derived from products that are required to go through extensive customer qualification processes before being selected by customers for inclusion in their products under development. We devote substantial resources, including design, engineering, sales, marketing and management efforts, to these qualification processes. In order to ensure availability of our products for some of our largest customers, we may begin manufacturing efforts based on forecasts provided by these customers, historical shipments and company estimates. Forecasts do not represent binding purchase commitments and we do not recognize sales for products until they are selected for inclusion in the customer’s product and are shipped to the customer. Our products may not be designed into a customer’s product despite our investment in the qualification process, which would result in loss of the associated investment, increased inventory risk and manufacturing costs and could adversely impact our operating results and profits.
Even if our products are designed into a customer’s product, the customer’s product may not be commercially successful, or the customer’s commercial plans for the product could change, which could adversely impact our sales and operating results. Similarly, a modification to the product or manufacturing process, or the selection of a new supplier by us, may require new qualification processes, which may result in delays, cause us to forego sales for the remainder of the life of the customer’s product and/or hold excess or obsolete inventory.
In addition, when our customers introduce new products, the time required and costs incurred by us to ramp-up production can be significant. Certain non-recurring costs and expenditures for tooling and other equipment may not be reusable in manufacturing products for other customers or different products for the same customer. Product ramp-ups typically involve greater volumes of scrap and risks to execution such as higher costs due to inefficiencies and delays in production, all of which can adversely impact our operating results and profits.
10
Our operating results and profits could be adversely affected if we are unable to balance customer demand for our products and capacity. If demand increases and we are unable to increase our production capacity to meet the demand, or if there are unforeseen costs associated with adjusting our capacity levels, we may not be able to achieve our financial targets. Conversely, if demand does not increase at the rate forecasted, we may not be able to adequately absorb manufacturing expenses or overhead costs which could negatively impact our product margins. Additionally, if product demand decreases or we fail to forecast demand accurately, we may be required to record impairments on our long-lived assets or record other charges.
Any of these developments could have a material adverse impact on our sales and operating results. In addition, to the extent a customer has a “dual source” strategy whereby customers may purchase products from more than one supplier, we may realize lower sales from our products that are designed into the customer’s products.
Our revenue, operating profits and cash flows could be adversely affected if our businesses are unable to protect or obtain patent and other intellectual property rights, or to do so at expected cost levels, or if intellectual property litigation is successful against us.
We own patents, trademarks, licenses and other forms of intellectual property related to our products, technology and manufacturing processes, which are critical to sustain market acceptance of our products. Therefore, we believe that the protection of our intellectual property rights is, and will continue to be, important to the success of our business.
We employ various measures to maintain, protect and defend our intellectual property, including enforcing our intellectual property rights in various jurisdictions and forums throughout the world. However, these measures may not prevent our intellectual property from being challenged, invalidated, copied or circumvented and our businesses may not be successful in litigation or other actions to enforce our intellectual property rights, particularly in countries where intellectual property rights are not highly developed or protected and may result in retaliatory legal proceedings alleging infringement by us of intellectual property owned by others. In addition, such proceedings may occur in multiple jurisdictions and forums and we may incur adverse judgments with regard to certain claims in certain jurisdictions and forums while still contesting other related claims against the same opposing party in other jurisdictions and forums.
We have and will continue to aggressively defend our intellectual property because unauthorized use of our intellectual property rights could adversely impact our competitive position and negatively impact our revenue, operating profits and cash flows. The expense of protecting, defending and enforcing our intellectual property, or defending claims that our products, technology or manufacturing processes infringe the intellectual property rights of others, can vary significantly period to period and, in any given period, could be material and divert the attention of management and key technical personnel. Further, regardless of the merits of any specific claim, we may not prevail in litigation because of the complex technical issues and uncertainties inherent in intellectual property litigation. If any litigation or claims, in which we were defending our products, technology or manufacturing processes were to result in an adverse ruling, we could be required to:
|
o
|
pay substantial damages;
|
|
o
|
cease the manufacture, import, use, sale or offer for sale of infringing products or processes;
|
|
o
|
discontinue the use of infringing technology;
|
|
o
|
expend significant resources to develop non-infringing technology; and
|
|
o
|
enter into royalty or license agreements from the third party claiming infringement, which license may not be available on commercially reasonable terms.
|
Our operating results or financial condition may be materially adversely affected if we, or one of our customers, were required to take any one or more of the foregoing actions. In addition, if one of our customers or another supplier to one of our customers were found to have infringed the intellectual property rights of a third party, the supplier or customer could be ordered to cease the manufacture, import, use, sale or offer for sale of its infringing product(s) or process(es), any of which could result, indirectly, in a decrease in demand for our products. Furthermore, we license third party intellectual property for use in some of our products and, if the licensor were found to have infringed the intellectual property rights of a third party, we may be ordered to cease the manufacture of the product containing the infringing intellectual property, which could result in a decrease in demand for our products. If any such decrease in demand for our products were to occur, it could have an adverse impact on our operating results and financial condition.
11
Our results may be impacted by domestic and international economic, legal, currency, political and compliance conditions and uncertainties.
Worldwide economic and capital market conditions are beyond our control, are highly unpredictable and can have an adverse effect on our revenue, earnings, cash flows and cost of capital. We have significant operations in China, Germany, Malaysia, the Philippines, the United Kingdom and the United States. Our businesses may be adversely affected by disruptions in the financial markets or declines in economic activity both domestically and internationally in the countries where we operate or from which we derive substantial revenues. These circumstances will also impact our suppliers and customers in various ways which could have an impact on our business operations, particularly if global credit markets are not operating efficiently and effectively to support industrial commerce.
Our domestic and international sales and operations are subject to risks associated with changes in local government laws (including environmental and import/export laws), regulations and policies. Failure to comply with any of these laws could result in civil and criminal, monetary and non-monetary penalties and damage to our reputation. In addition, we cannot provide assurance that our costs of complying with new and evolving regulatory reporting requirements and current or future laws, including environmental protection, employment and health and safety laws, will not exceed our estimates. In addition, we have invested in certain countries, including Malaysia, China and the Philippines, that carry high levels of currency, political, compliance and/or economic risk. While these risks or the impact of these risks are difficult to predict, any one or more of them could adversely affect our businesses and reputation.
In particular, economic regulation in China could materially and adversely affect our business and results of operations. We have significant manufacturing operations in China and, as a result, are subject to risks inherent in doing business in China. For example, in recent years, the Chinese economy has experienced periods of rapid expansion and wide fluctuations in the rate of inflation. In response to these factors, the Chinese government has, from time to time, adopted measures to regulate growth and contain inflation, including measures designed to restrict credit or to control prices. Such actions in the future could increase the cost of doing business in China or decrease the demand for our products in China, which could have a material adverse effect on our business and results of operations.
Failure to attract, retain and develop personnel or to provide adequate succession plans for key management could have an adverse effect on our operating results.
Our growth, profitability and effectiveness in conducting our operations and executing our strategic plans depend in part on our ability to attract, retain and develop qualified personnel, align them with appropriate opportunities and maintain adequate succession plans for key management positions. If we are unsuccessful in these efforts, our operating results could be adversely affected.
Our goodwill, other intangible assets or long-lived assets may become impaired, which could result in a significant charge to earnings.
We hold significant amounts of goodwill, other intangible assets and long-lived assets, and the balances of these assets could increase in the future if we were to acquire other businesses. As of December 31, 2014, the balance of our goodwill, other intangible assets and long-lived assets was $1,500.9 million. Under accounting principles generally accepted in the United States, we review our goodwill, other intangible assets and long-lived assets for impairment when events or changes in circumstances indicate the carrying value of such goodwill, other intangible assets or long-lived assets may not be recoverable. In addition, we test goodwill and other indefinite-lived intangible assets for impairment annually. Factors that may be considered a change in circumstances, indicating that the carrying value of our goodwill, other intangible assets or long-lived assets may not be recoverable, include, but are not limited to, a sustained decline in stock price and market capitalization, significant negative variances between actual and expected financial results, reduced future cash flow estimates, adverse changes in legal factors, failure to realize anticipated synergies from acquisitions and slower growth rates in our industry. We may be required to record a significant charge to earnings in our financial statements during the period in which any impairment of our goodwill, other intangible assets or long-lived assets is determined to exist, negatively impacting our results of operations.
We rely on sole source and limited source suppliers for certain supplies of critical components.
Our operations depend on obtaining sufficient supplies of components used in our manufacturing processes. In particular, certain of our businesses rely on wafer fabrication facilities or foundries which are limited source suppliers to provide silicon-based products that are critical components of our products and to provide such products in sufficient quantities to meet our production needs. Although we have long-term supply arrangements with these foundries, they may experience financial
12
difficulties, be unable to deliver product to us in a timely manner, have insufficient capacity to meet our requirements, or suffer business disruption resulting from damage to or destruction of their facilities due to natural disasters and we might not be able to secure an alternative source of supply in a timely manner. We rely on a variety of other material, component and sub-assembly suppliers (some of whom may be our sole qualified source), who, from time to time, may be unable to supply product. These events could have a material adverse impact on our results of operations.
A significant amount of our cash and cash equivalents are located outside of the United States and our ability to repatriate or access that cash is limited and subject to changes in domestic and foreign tax legislation.
We earn a significant amount of our operating income outside the United States. As of December 31, 2014,
$53.6 million
of our cash and cash equivalents and short-term investments were held in countries outside of the United States. Any repatriation of funds currently held in foreign jurisdictions to the United States may result in higher effective tax rates for us. In addition, there have been proposals from Congress and the President to change U.S. tax laws that would significantly impact how U.S. multinational corporations are taxed on foreign earnings. Although it is uncertain whether, or in what form, any proposed tax legislation may be enacted, if any such legislation were enacted it could have a material adverse impact on our tax expense and cash flows.
Our stock price may fluctuate significantly.
The market price of our common stock may fluctuate significantly due to a number of factors, some of which may be beyond our control, including:
|
o
|
our quarterly or annual earnings, or those of other companies in our industry;
|
|
o
|
the failure of securities analysts to cover our common stock;
|
|
o
|
actual or anticipated fluctuations in our operating results;
|
|
o
|
changes in earnings estimates by securities analysts or our ability to meet those estimates or our earnings guidance;
|
|
o
|
the operating and stock price performance of other comparable companies;
|
|
o
|
overall market fluctuations and domestic and worldwide economic conditions; and
|
|
o
|
other factors described in these “Risk Factors” and elsewhere in this Form 10-K.
|
Stock markets in general have experienced volatility that has often been unrelated to the operating performance of a particular company. These broad market fluctuations may adversely affect the trading price of our common stock.
Our indebtedness could adversely affect our financial condition and impair our ability to operate our business.
As of December 31, 2014, we had
$400.0 million
of total indebtedness, including
$300.0 million
outstanding under a term loan and
$100.0 million
outstanding under our revolving credit facility. For additional information about our indebtedness, see
Note 8. Borrowings and Lines of Credit
of the notes to our Consolidated Financial Statements under Item 8, "Financial Statements and Supplementary Data." This level of indebtedness could have important consequences to our financial condition, operating results and business, including the following:
|
o
|
limiting our ability to obtain additional debt or equity financing for working capital, capital expenditures, debt service requirements, acquisitions and general corporate or other purposes;
|
|
o
|
increase our cost of borrowing;
|
|
o
|
requiring that a substantial portion of our cash flows from operations be dedicated to payments on our indebtedness instead of other purposes, including operations, capital expenditures and future business opportunities;
|
|
o
|
making it more difficult for us to make payments on our indebtedness or satisfy other obligations;
|
|
o
|
exposing us to risk of increased interest rates because our borrowings under the term loan and revolving credit facility are at variable rates of interest;
|
|
o
|
limiting our ability to adjust to changing market conditions and placing us at a competitive disadvantage compared to our competitors that have less debt; and
|
|
o
|
increasing our vulnerability to a downturn in general economic conditions or in our business and making us unable to carry out capital spending that is important to our growth.
|
In addition, the agreement governing our term loan and revolving credit facility contains covenants requiring us to, among other things, maintain a minimum ratio of consolidated EBITDA to consolidated interest expense and a maximum ratio of consolidated total indebtedness to consolidated EBITDA.
13
Our ability to make payments on and to refinance our indebtedness and to meet the financial covenants related to our indebtedness will depend on our ability to generate cash in the future from operations, financings or asset sales and the tax consequences of our repatriation of overseas cash. Our ability to generate cash is subject to general economic, financial, competitive, legislative, regulatory and other factors that are beyond our control. If we are not able to repay or refinance our debt as it becomes due, we may be forced to sell assets or take other disadvantageous actions, including (i) reducing financing in the future for working capital, capital expenditures and general corporate purposes or (ii) dedicating an unsustainable level of our cash flow from operations to the payment of principal and interest on our indebtedness. In addition, our ability to withstand competitive pressures and to react to changes in our industry could be impaired. The lenders who hold such debt could also potentially accelerate amounts due, which could potentially trigger a default or acceleration of any of our other debt.
In addition, we may increase our debt or raise additional capital, subject to restrictions in our debt agreements. If our cash flow from operations is less than we anticipate, or if our cash requirements are more than we expect, we may require more financing. However, debt or equity financing may not be available to us on terms acceptable to us, if at all. If we incur additional debt or raise equity through the issuance of preferred stock, the terms of the debt or preferred stock issued may give the holders rights, preferences and privileges senior to those of holders of our common stock, particularly in the event of liquidation. The terms of the debt may also impose additional and more stringent restrictions on our operations than it currently has. If we are unable to raise additional capital when needed, it could affect our financial condition. Also, regardless of the terms of our debt or equity financing, the amount of our stock that we can issue may be limited because the issuance of our stock may cause the distribution to be a taxable event for our Former Parent under Section 355(e) of the Internal Revenue Code of 1986, as amended (the "Code"), and under the Tax Matters Agreement, we could be required to indemnify our Former Parent for the resulting tax. See the section entitled “Risk Factors—Risks Related to Our Recent Separation—We may not be able to engage in certain corporate transactions as a result of the Separation.”
We face risks arising from the restructuring of our operations globally.
We continuously evaluate our operations and cost structure relative to general economic conditions, market demands, tax rates, foreign currency fluctuations, cost competitiveness and our geographic footprint. As a result of this ongoing evaluation, we plan to reduce our 18 facilities worldwide to 11 by the end of 2016 and will engage in restructuring activities from time to time. The restructuring process includes moving production between facilities or to new facilities, closing facilities, reducing staff levels, realigning our business processes and reorganizing our management.
Restructurings present significant potential risks that could adversely affect our businesses, including delays in finalizing the scope of and implementing, the restructurings (including extensive consultations concerning potential workforce reductions and obtaining agreements from our affected customers for the relocation of our facilities in certain instances), the failure to achieve targeted cost savings, impacts on product quality and delivery interruptions, the failure to meet operational targets and customer requirements and the acceleration of obligations to fund pension liabilities. These risks are further complicated by our international footprint, which subject us to various legal and regulatory requirements that govern the extent and speed of our ability to restructure our operations.
14
We are subject to risks relating to our existing international operations and to expanding our global business.
Many of our manufacturing operations and suppliers are located outside the United States and we continue to focus on global markets as part of our growth strategy. Our international operations and global expansion strategy are subject to various risks, including:
|
o
|
political, social and economic instability and disruptions;
|
|
o
|
government embargoes or trade restrictions;
|
|
o
|
the imposition of duties and tariffs and other trade barriers;
|
|
o
|
import and export controls;
|
|
o
|
transportation delays and interruptions;
|
|
o
|
labor unrest and current and changing regulatory environments;
|
|
o
|
increased compliance costs, including costs associated with disclosure requirements and related due diligence;
|
|
o
|
the loss of one or more of our manufacturing facilities;
|
|
o
|
difficulties in staffing and managing multi-national operations;
|
|
o
|
limitations on our ability to enforce legal rights (including intellectual property rights) and remedies and the costs of such enforcement;
|
|
o
|
environmental liabilities arising from our current, historical and future operations and manufacturing sites; and
|
|
o
|
earthquakes, floods or other natural disasters or catastrophic events.
|
If we are unable to successfully manage the risks associated with our global business or adequately manage operational risks of our existing international operations, the risks could have a material adverse effect on our growth strategy involving expansion into new geographical markets or our results of operations and financial position.
We could lose customers or generate lower revenue, operating profits and cash flows if there are significant increases in the cost of raw materials or if we are unable to obtain raw materials.
We purchase raw materials, sub-assemblies and components for use in manufacturing operations, which exposes us to volatility in prices for certain commodities. Significant price increases for these commodities could adversely affect operating profits for certain of our businesses. Although the raw materials necessary for our products are generally available, commodity pricing for various precious metals, such as palladium and gold, fluctuates. As a result, our operating results are exposed to such fluctuations. While we generally attempt to mitigate the impact of increased raw material prices by passing along the increased costs to customers, there may be a time delay between the increased raw material prices and the ability to increase the prices of our products, or we may be unable to increase the prices of our products due to a competitor’s pricing pressure or other factors. In addition, the inability to obtain necessary raw materials could affect our ability to meet customer commitments and satisfy market demand for certain products. Consequently, a significant price increase in raw materials, including certain rare earth materials, or their unavailability, may result in a loss of customers and adversely impact revenue, operating profits and cash flows.
We and our suppliers rely upon certain rare earth materials (dysprosium and neodymium) that are necessary for the manufacturing of our products and our business could be harmed if we or our suppliers experience shortages or delays of these rare earth materials. We and/or our suppliers acquire these materials from a number of countries, including China. More than 95% of the world’s current supply of rare earth materials comes from China, which has enacted a policy to reduce its exports because of its rising domestic demand and new environmental restrictions. We cannot predict whether the government of China or any other nation will impose further regulations, quotas or embargoes upon these materials that would restrict their worldwide supply or increase their cost. If China or any other major supplier were to further restrict the supply available or increase the cost of the materials used in our products, we could experience a shortage in supply and an increase in production costs, which would harm our operating results.
Customer requirements and new regulations may increase our expenses and impact the availability of certain raw materials, which could adversely affect our revenue and operating profits.
Our businesses use parts or materials that are impacted by the Dodd-Frank Wall Street Reform and Consumer Protection Act requirement for disclosure of the use of “conflict minerals” mined in the Democratic Republic of the Congo and adjoining countries. Some of our customers require “conflict free” metals in products purchased from us. We have been following a process to comply with both regulatory and customer requirements. However, the supply chain due diligence and verification of sources require substantial periods of time to complete based on the current availability of origin information and the number of
15
vendors. We may not be able to complete the process in the time frame required because of the complexity of our supply chain. Other governmental social responsibility regulations also may impact our suppliers, manufacturing operations and operating profits.
The need to find alternative sources for certain raw materials or products because of customer requirements and regulations may impact our ability to secure adequate supplies of raw materials or parts, lead to supply shortages, or adversely impact the prices at which our businesses can procure compliant goods.
Our effective tax rate may fluctuate and it could be subject to additional tax liabilities, including in the event of repatriation of our overseas earnings to fund our liquidity needs.
Our effective tax rate may be adversely impacted by changes in the mix of our earnings among countries with differing statutory tax rates, changes in the valuation allowance of deferred tax assets and changes in tax laws. We cannot give any assurance as to what our effective tax rate will be in the future because of, among other things, uncertainty regarding the tax policies of the jurisdictions where we operate. Further, our tax returns are subject to periodic audits by domestic and international authorities. If these audits result in allocations of income or other tax assessments different from amounts estimated, then our financial results may be adversely affected by unfavorable tax adjustments.
Our effective tax rate is favorably impacted by a significant tax holiday granted to us by Malaysia. This tax holiday is subject to our satisfaction of certain conditions, including exceeding certain annual thresholds of operating expenses and gross sales. We expect to continue to satisfy all of the conditions to this tax holiday. If we fail to satisfy such conditions, our effective tax rate may be significantly adversely impacted. For additional detail, see
Note 9. Income Taxes
of the notes to our Consolidated Financial Statements under Item 8, "Financial Statements and Supplementary Data."
In addition, if we encounter a significant need for liquidity domestically or other location that we cannot fulfill through borrowings, equity offerings or other internal or external sources, we may experience unfavorable tax and earnings consequences due to cash repatriations. These adverse consequences would occur, for example, if the transfer of cash into the United States is taxed and no foreign tax credit is available to offset the U.S. tax liability, resulting in lower earnings. Foreign exchange ceilings imposed by local governments and the sometimes lengthy approval processes that foreign governments require for international cash transfers may delay our internal cash transfers from time to time. These factors may cause us to have an overall tax rate higher than other companies or higher than our tax rates have been in the past.
Our growth and results of operations may be adversely affected if we are unsuccessful in our capital allocation and acquisitions program.
We expect to pursue a strategy of acquiring value-creating add-on businesses that broaden our existing position and global reach as well as, in the right circumstances, strategically pursuing larger acquisitions that could have the potential to either complement our existing businesses or allow us to pursue a new growth opportunity. However, there can be no assurance that we will be able to find suitable businesses to purchase or that we will be able to acquire such businesses on acceptable terms. If we are unsuccessful in our acquisition efforts, then our ability to grow could be adversely affected. In addition, a completed acquisition may underperform relative to expectations, may be unable to achieve synergies originally anticipated, or may expose us to unexpected liabilities. Further, if we fail to allocate capital appropriately, in respect of either our acquisition program or organic growth in operations, we could be overexposed in certain markets and geographies.
We may face wage inflation and increased competition for our employees in the countries where we operate, which could increase our employment costs and our attrition.
Competition in Asia and other regions in which we operate for skilled-labor has increased and we expect this competition to continue as additional companies enter the market and expand their operations. For example, a considerable amount of our operations are located in China and there is substantial competition in China for qualified and capable personnel, particularly experienced engineers and technical personnel, which may make it difficult for us to recruit and retain qualified employees. If the availability of skilled-labor decreases, it could affect the availability and the cost of employees and increase our attrition rate, all of which may have an adverse effect on our operating results.
Our business operations may be adversely affected by information systems interruptions or intrusion.
Our businesses rely on a number of information technologies to manage, store and support business activities. We have put in place a number of systems, processes and practices designed to protect against intentional or unintentional misappropriation or corruption of our systems and information, disruption of operations or corruption of the software that supports our products.
16
Disruptions or cybersecurity attacks, such as unauthorized access, malicious software or other violations, may lead to exposure of proprietary or confidential information as well as potential data corruption. Any intrusion may cause operational stoppages, violations of applicable law, diminished competitive advantages or reputational harm and increased operational costs due to remedial activities. The theft or unauthorized use or publication of our trade secrets and other confidential business information resulting from a breach of our information systems could adversely affect our competitive position and the value of our investment in research and development.
Our reputation, ability to do business and results of operations may be impaired by improper conduct by any of our employees, agents or business partners.
While we strive to maintain high standards, we cannot provide assurance that our internal controls and compliance systems will always protect us from acts committed by employees, agents or business partners that would violate U.S. and/or non-U.S. laws or fail to protect our confidential information, including the laws governing payments to government officials, bribery, fraud, anti-kickback and false claims rules, competition, export and import compliance, money laundering and data privacy laws, as well as the improper use of proprietary information or social media. Any such violations of law or improper actions could subject us to civil or criminal investigations in the United States and in other jurisdictions, could lead to substantial civil or criminal, monetary and non-monetary penalties and related stockholder lawsuits and could damage our reputation. In addition, we have entered into non-disclosure agreements with several of our significant customers which grant us access to their product designs. Any misuse of confidential information with the terms of these agreements could result in harm to our reputation, penalties/fines and loss of orders with the affected customer and therefore could adversely affect our financial condition and results of operations.
Our exposure to exchange rate fluctuations on cross-border transactions and the translation of local currency results into U.S. dollars could negatively impact our results of operations.
We conduct business through our subsidiaries in many different countries and fluctuations in currency exchange rates could have a significant impact on the reported results of operations, which are presented in U.S. dollars. A significant and growing portion of our products are manufactured in lower-cost locations and sold in various countries. Cross-border transactions, both with external parties and intercompany relationships, result in increased exposure to changes in foreign exchange rates. Accordingly, significant changes in currency exchange rates, particularly the Malaysian ringgit, the euro, the Chinese renminbi (yuan) and the Philippine peso, could cause fluctuations in the reported results of our business operations that could negatively affect our results of operations. A weakening of the U.S. dollar could adversely impact the cost of materials, products and services purchased outside the United States and therefore adversely affect our results of operations. In addition, sales and expenses of our non-U.S. businesses are translated into U.S. dollars for reporting purposes and therefore any weakening of the U.S. dollar could result in unfavorable translation effects.
Some of our businesses are subject to the cycles inherent in the consumer electronics industry.
The consumer electronics industry is cyclical and characterized by continuous and rapid technological change, product obsolescence, price erosion, evolving standards, short product life cycles and significant fluctuations in product supply and demand. Markets or the markets for specific products incorporating our solutions may not continue to grow or may decline for a number of reasons outside of our control, including economic uncertainty, competition among companies and market saturation. For example, this industry experienced a significant downturn as part of the broader global recession in 2008 and 2009. Industry downturns have been characterized by diminished product demand, production overcapacity, high inventory levels and accelerated erosion of average selling prices. Future downturns could have a material adverse effect on our business and operating results.
In addition, our businesses, while not having significant seasonality, tend to have stronger revenue in the third and fourth quarters of each calendar year due, at least in part, to the timing of OEM product launches, over which we have no control. This is particularly true of those businesses that serve the consumer electronics market. If anticipated OEM product launches do not occur, we may experience decreased sales, which could have a material adverse effect on our business and operating results.
Costs related to product defects and errata may harm our results of operations and business.
Adverse consequences associated with unexpected product defects and errata (deviations from published specifications) due to, for example, unanticipated problems in our design and manufacturing processes, could include writing off or reserving the value of inventory of such products; disposing of products that cannot be fixed; recalling such products that have been shipped to customers; providing product replacements for, or modifications to, such products; and defending against litigation related to such products. The costs associated with these occurrences could be substantial and may temporarily increase our expenses and
17
lower our margins and profitability. In addition, our reputation could be damaged as a result of such product defects and errata and the demand for our products could be reduced.
Our products are typically sold to customers at prices that are significantly lower than the cost of the customer’s products in which they are incorporated. Because a defect in one of our products could give rise to failures in the products that incorporate them, we may face claims for damages that are disproportionate to the revenues we receive from the products involved. We may not have product liability insurance coverage in a sufficient amount to pay any or all such claims, which could adversely affect our financial position. Moreover, to the extent a defect in one of our products is caused by a defective component supplied to us by a third party, we may nonetheless be held liable to the customer and may be unable to seek or unsuccessful in seeking indemnification from our supplier.
We have limited history operating as an independent publicly-traded company and our historical financial information is not necessarily representative of the results that we would have achieved as a separate, publicly-traded company and therefore may not be a reliable indicator of our future results.
We were spun-off from our Former Parent on February 28, 2014 and have limited operating history as an independent publicly-traded company. The financial information in this Form 10-K for periods prior to the Separation reflects our business as part of our Former Parent. Accordingly, such financial information does not necessarily reflect the financial condition, results of operations or cash flows that we would have achieved as an independent publicly-traded company during the periods presented or those that we will achieve in the future primarily as a result of the factors described below:
|
o
|
We have made and will need to continue to make, investments to replicate or outsource certain systems, infrastructure and functional expertise as a result of the Separation. These initiatives to develop our independent ability to operate without access to our Former Parent’s existing operational and administrative infrastructure will be costly to implement. We may not be able to operate our business at comparable costs and our profitability may decline.
|
|
o
|
Prior to the Separation, we relied upon our Former Parent for working capital requirements and other cash requirements, including in connection with our previous acquisitions. As a result of the Separation, our Former Parent ceased providing us with funds to finance our working capital or other cash requirements. After the Separation, our access to and cost of debt financing may be different from the historical access to and cost of debt financing from our Former Parent. Differences in access to and cost of debt financing may result in differences in the interest rate charged to us on financings, as well as the amounts of indebtedness, types of financing structures and debt markets that may be available to us, which could have an adverse effect on our business, financial condition and results of operations and cash flows.
|
For additional information about the past financial performance of our business and the basis of presentation of the historical Consolidated Financial Statements of our business, see the sections entitled “Selected Financial Data” and “Management’s Discussion and Analysis of Financial Condition and Results of Operations” and the historical financial statements and accompanying notes under Item 8, “Financial Statements and Supplementary Data.”
Potential indemnification liabilities to our Former Parent pursuant to the Separation and Distribution Agreement could materially and adversely affect our business, financial condition, results of operations and cash flows.
The Separation and Distribution Agreement between us and our Former Parent, among other things, provides for indemnification obligations (for uncapped amounts) designed to make us financially responsible for substantially all liabilities that may exist relating to our business activities, whether incurred prior to or after the Separation. If we are required to indemnify our Former Parent under the circumstances set forth in the Separation and Distribution Agreement, we may be subject to substantial liabilities.
18
In connection with the Separation, our Former Parent has agreed to indemnify us for certain liabilities. However, there can be no assurance that the indemnity will be sufficient to insure us against the full amount of such liabilities, or that our Former Parent’s ability to satisfy its indemnification obligation will not be impaired in the future.
Pursuant to the Separation and Distribution Agreement and certain other agreements with our Former Parent, our Former Parent has agreed to indemnify us for certain liabilities. However, third parties could also seek to hold us responsible for any of the liabilities that our Former Parent has agreed to retain and there can be no assurance that the indemnity from our Former Parent will be sufficient to protect us against the full amount of such liabilities, or that our Former Parent will be able to fully satisfy its indemnification obligations. In addition, our Former Parent’s insurers may attempt to deny coverage to us for liabilities associated with certain occurrences of indemnified liabilities prior to the Separation. Moreover, even if we ultimately succeed in recovering from our Former Parent or such insurance providers any amounts for which we are held liable, we may be temporarily required to bear these losses. Each of these risks could negatively affect our business, financial position, results of operations and cash flows.
We are subject to continuing contingent liabilities of our Former Parent following the Separation.
After the Separation, there are several significant areas where the liabilities of our Former Parent may become our obligations. For example, under the Code and the related rules and regulations, each corporation that was a member of our Former Parent’s U.S. consolidated group during a taxable period or portion of a taxable period ending on or before the effective time of the distribution is jointly and severally liable for the U.S. federal income tax liability of the entire U.S. consolidated group of our Former Parent for that taxable period. Consequently, if our Former Parent is unable to pay the consolidated U.S. federal income tax liability for a prior period, we could be required to pay the entire amount of such tax which could be substantial and in excess of the amount allocated to us under the Tax Matters Agreement between us and our Former Parent. Other provisions of federal and state law establish similar liability for other matters, including laws governing tax-qualified pension plans as well as other contingent liabilities.
If the Distribution (as defined below), together with certain related transactions, does not qualify as a transaction that was generally tax-free for U.S. federal income tax purposes, we, our Former Parent and our stockholders could be subject to significant tax liability and, in certain circumstances, we could be required to indemnify our Former Parent for material taxes pursuant to indemnification obligations under the Tax Matters Agreement.
Our Former Parent received an opinion of Baker & McKenzie LLP, tax counsel to our Former Parent, substantially to the effect that, among other things, the distribution of all of the shares of our common stock owned by our Former Parent to stockholders of our Former Parent in connection with the Separation (the “Distribution”) will qualify as tax-free for U.S. federal income tax purposes under Sections 368(a)(1)(D) and 355 of the Code. In addition, in July 2014, the Internal Revenue Service (the “IRS”) issued a Private Letter Ruling to our Former Parent that the Distribution would qualify as tax-free for U.S. federal income tax purposes under Sections 368(a)(1)(D) and 355 of the Code. The opinion of tax counsel and the Private Letter Ruling relied on certain facts, assumptions, representations and undertakings from our Former Parent and us, including those regarding the past and future conduct of the companies’ respective businesses and other matters. If any of these facts, assumptions, representations or undertakings are incorrect or not satisfied, our Former Parent and its stockholders may not be able to rely on the opinion or the Private Letter Ruling and could be subject to significant tax liabilities. Notwithstanding the opinion of tax counsel and the Private Letter Ruling, the IRS could determine on audit that the Distribution is taxable if it determines that any of these facts, assumptions, representations or undertakings are not correct or have been violated or if it disagrees with the conclusions in the opinion. In addition, we and our Former Parent intend for certain related transactions to qualify for tax-free treatment under federal, state and local tax law and/or foreign tax law.
If the Distribution is determined to be taxable for U.S. federal income tax purposes, our Former Parent and its stockholders that are subject to U.S. federal income tax could incur significant U.S. federal income tax liabilities. For example, if the Distribution fails to qualify for tax-free treatment, our Former Parent would for U.S. federal income tax purposes be treated as if it had sold the Knowles common stock in a taxable sale for its fair market value and our Former Parent’s stockholders, who are subject to U.S. federal income tax, would be treated as receiving a taxable distribution in an amount equal to the fair market value of the Knowles common stock received in the Distribution. In addition, if certain related transactions fail to qualify for tax-free treatment under federal, state and local tax law and/or foreign tax law, our Former Parent (and, under the Tax Matters Agreement described below, Knowles) could incur significant tax liabilities under U.S. federal, state, local and/or foreign tax law.
Under the Tax Matters Agreement between our Former Parent and us, we are required to indemnify our Former Parent against taxes incurred by our Former Parent that arise as a result of our taking or failing to take, as the case may be, certain actions that result in the Distribution failing to meet the requirements of a tax-free distribution under Section 355 of the Code or of such
19
related transactions failing to qualify for tax-free treatment. Also, under the Tax Matters Agreement, we are required to indemnify our Former Parent for one-half of the taxes and other liabilities incurred by our Former Parent if the Distribution fails to meet the requirements of a tax-free distribution under Section 355 of the Code for reasons other than an act or failure to act on the part of us or our Former Parent and therefore we might be required to indemnify our Former Parent for such taxes and liabilities due to circumstances and events not within our control. Under the Tax Matters Agreement, we are also required to indemnify our Former Parent for one-half of certain taxes incurred as a result of the restructuring activities undertaken to effectuate the Distribution or as a result of the application of certain rules relating to consolidated federal income tax returns, whether payable upon filing tax returns related to the restructuring and Distribution or upon a subsequent audit of those returns. Our indemnification obligations to our Former Parent under the Tax Matters Agreement are not limited by a maximum amount. If we are required to indemnify our Former Parent under the circumstances set forth in the Tax Matters Agreement, we may be subject to substantial liabilities, which could materially adversely affect our financial position.
We may not be able to engage in certain corporate transactions as a result of the Separation.
To preserve the tax-free treatment to our Former Parent and its stockholders of Distribution and certain related transactions, under the Tax Matters Agreement between us and our Former Parent, we are restricted from taking any action following the Distribution that prevents the Distribution and related transactions from being tax-free for U.S. federal income tax purposes. Under the Tax Matters Agreement, for the two-year period following the Distribution, we will be prohibited, except in certain circumstances, from:
|
o
|
entering into any transaction resulting in the acquisition of 40% or more of our stock or substantially all of our assets, whether by merger or otherwise;
|
|
o
|
merging, consolidating or liquidating;
|
|
o
|
issuing equity securities beyond certain thresholds;
|
|
o
|
repurchasing our capital stock; and
|
|
o
|
ceasing to actively conduct our business.
|
These restrictions may limit our ability to pursue certain strategic transactions or other transactions that we may believe to be in the best interests of our stockholders or that might increase the value of our business. In addition, under the Tax Matters Agreement, we are required to indemnify our Former Parent against any such tax liabilities as a result of the acquisition of our stock or assets, even if we did not participate in or otherwise facilitate the acquisition.
The Separation and related internal restructuring transactions may expose us to potential liabilities arising out of state and federal fraudulent conveyance laws and legal dividend requirements.
If our Former Parent files for bankruptcy or is otherwise determined or deemed to be insolvent under federal bankruptcy laws, a court could deem the Separation or certain internal restructuring transactions undertaken by our Former Parent in connection with the Separation to be a fraudulent conveyance or transfer. Fraudulent conveyances or transfers are defined to include transfers made or obligations incurred with the actual intent to hinder, delay or defraud current or future creditors or transfers made or obligations incurred for less than reasonably equivalent value when the debtor was insolvent, or that rendered the debtor insolvent, inadequately capitalized or unable to pay its debts as they become due. A court could void the transactions or impose substantial liabilities upon us, which could adversely affect our financial condition and our results of operations. Among other things, the court could require our stockholders to return to our Former Parent some or all of the shares of our common stock issued in the Separation, or require us to fund liabilities of other companies involved in the restructuring transactions for the benefit of creditors.
We may have received better terms from unaffiliated third parties than the terms we will receive in our agreements with our Former Parent.
The agreements we entered into with our Former Parent in connection with the Separation, including the Separation and Distribution Agreement, Transition Services Agreement, Tax Matters Agreement and Employee Matters Agreement, were prepared in the context of our separation from our Former Parent while we were still a wholly owned subsidiary of our Former Parent. Accordingly, during the period in which the terms of those agreements were prepared, we did not have an independent Board of Directors or a management team that was independent of our Former Parent. As a result, the terms of those agreements may not reflect terms that would have resulted from arm’s-length negotiations between unaffiliated third parties. Arm’s-length negotiations between our Former Parent and an unaffiliated third party in another form of transaction, such as a buyer in a sale of a business transaction, may have resulted in more favorable terms to the unaffiliated third party.
20
Certain provisions in our amended and restated certificate of incorporation, amended and restated by-laws and Delaware law may prevent or delay an acquisition of the Company, which could decrease the trading price of our common stock.
Our amended and restated certificate of incorporation and amended and restated by-laws contain and the DGCL contains provisions that are intended to deter coercive takeover practices and inadequate takeover bids by making such practices or bids unacceptably expensive to the bidder and to encourage prospective acquirers to negotiate with our Board of Directors rather than to attempt a hostile takeover. These provisions include, among others:
|
o
|
the inability of our stockholders to call a special meeting or act by written consent;
|
|
o
|
rules regarding how stockholders may present proposals or nominate directors for election at stockholder meetings;
|
|
o
|
the right of our Board of Directors to issue preferred stock without stockholder approval;
|
|
o
|
the division of our Board of Directors into three approximately equal classes of directors, with each class serving a staggered three-year term;
|
|
o
|
a provision that stockholders may only remove directors for cause;
|
|
o
|
the ability of our directors, without a stockholder vote, to fill vacancies on our Board of Directors (including those resulting from an enlargement of the Board of Directors); and
|
|
o
|
the requirement that stockholders holding at least 80% of our voting stock are required to amend certain provisions in our amended and restated certificate of incorporation and our amended and restated by-laws.
|
In addition, we are subject to Section 203 of the DGCL. Section 203 provides that, subject to limited exceptions, persons that (without prior board approval) acquire, or are affiliated with a person that acquires, more than 15 percent of the outstanding voting stock of a Delaware corporation shall not engage in any business combination with that corporation, including by merger, consolidation or acquisitions of additional shares, for a three-year period following the date on which that person or its affiliate becomes the holder of more than 15 percent of the corporation’s outstanding voting stock.
We believe these provisions protect our stockholders from coercive or otherwise unfair takeover tactics by requiring potential acquirers to negotiate with our Board of Directors and by providing our Board of Directors with more time to assess any acquisition proposal. These provisions are not intended to make us immune from takeovers. However, these provisions will apply even if the offer may be considered beneficial by some stockholders and could delay or prevent an acquisition that our Board of Directors determines is not in the best interests of the Company and our stockholders. These provisions may also prevent or discourage attempts to remove and replace incumbent directors.
In addition, an acquisition or further issuance of our stock could trigger the application of Section 355(e) of the Code. Under the Tax Matters Agreement, we would be required to indemnify our Former Parent for the tax imposed under Section 355(e) of the Code resulting from an acquisition or issuance of our stock, even if we did not participate in or otherwise facilitate the acquisition and this indemnity obligation might discourage, delay or prevent a change of control that may be considered favorable.
Not applicable.
21
Our corporate headquarters is located in Itasca, Illinois. We maintain technical customer support offices and operating facilities in North America, Europe and Asia.
The number, type, location and size of the properties used by our continuing operations as of
December 31, 2014
are shown in the following charts:
|
Total
|
|||
|
Number and nature of facilities:
|
|||
|
Manufacturing and Distribution
|
20
|
|
|
|
Other Facilities (principally sales, research and development and headquarters)
|
19
|
|
|
|
Square footage (in 000s):
|
|||
|
Owned
|
923
|
|
|
|
Leased
(1)
|
1,250
|
|
|
|
Locations:
|
|||
|
Asia
|
20
|
|
|
|
North America
|
11
|
|
|
|
Europe
|
8
|
|
|
(1)
Expiration dates on leased facilities range from 1 to 10 years.
We believe that our owned and leased facilities are well-maintained and suitable for our operations.
We are involved in various legal proceedings and claims discussed below as well as certain other legal proceedings and claims that have not been fully resolved and that have arisen in the ordinary course of business, including those related to intellectual property, which may be owned by us or others. We own many patents covering products, technology and manufacturing processes. Some of these patents have been and may continue to be challenged by others. In appropriate cases, we have taken and will take steps to protect and defend our patents and other intellectual property, including through the use of legal proceedings in various jurisdictions around the world. Such steps have resulted in and may continue to result in retaliatory legal proceedings, including litigation or other legal proceedings in various jurisdictions and forums around the world alleging infringement by us of patents owned by others. The costs of investigations and legal proceedings, particularly multi-forum litigation, relating to the enforcement and defense of our intellectual property, may be material. Additionally, in multi-forum disputes, we may incur adverse judgments with regard to certain claims in certain jurisdictions and forums while still contesting other related claims against the same opposing party in other jurisdictions and forums. In the opinion of management, there was not at least a reasonable probability that we may have incurred a material loss, or a material loss in excess of a recorded accrual, with respect to loss contingencies. However, the outcome of legal proceedings and claims brought against us is subject to significant uncertainty. Therefore, although management considers the likelihood of such an outcome to be remote, if one or more of these legal matters were resolved against us in a reporting period for amounts in excess of management’s expectations or the amounts accrued, if any, our Consolidated Financial Statements for that reporting period could be materially adversely affected. See the risk factor “
Our revenue, operating profits and cash flows could be adversely affected if our businesses are unable to protect or obtain patent and other intellectual property rights, or to do so at expected cost levels, or if intellectual property litigation is successful against us
.” in Part I, Item 1A of this Form 10-K under the heading “Risk Factors.”
GoerTek IP Litigation
As previously reported, we have been involved in multi-forum, trans-continental, litigation with GoerTek, Inc. and GoerTek Electronics, Inc. (“GoerTek”), both in the United States, including before the U.S. International Trade Commission (“ITC”), the U.S. District Court for the Northern District of Illinois, and the U.S. Patent and Trademark Office, and before various courts and government intellectual property authorities in China. This litigation concerned the alleged infringement of patents directed to MEMS microphones and related technologies. On February 13, 2015, the parties reached a global settlement that resolved all pending litigation between them, including an ITC investigation brought by Knowles against GoerTek, regarding GoerTek’s
22
importation of MEMS microphone packages and finished products containing MEMS microphones, in which the Administrative Law Judge assigned to this investigation found that GoerTek had infringed certain patents asserted by Knowles. The ITC had been expected to issue its Final Determination no later than March 6, 2015; however, pursuant to the settlement, Knowles and GoerTek have filed a motion to terminate this investigation. The settlement further resolves two Chinese judgments against Knowles totaling approximately $12.0 million, which also ordered a Chinese subsidiary of Knowles to stop manufacturing and selling accused MEMS microphone products; both of these judgments had been on appeal. Knowles expects that certain validity challenges to its MEMS microphone patents initially brought by GoerTek and other third parties both in the United States and China will continue without GoerTek participating. The terms of the settlement are confidential, but include cross-licensing provisions relating to the companies’ MEMS microphone patent portfolios and establish the foundation for a commercial relationship between the parties.
Not applicable.
23
EXECUTIVE OFFICERS OF THE REGISTRANT
The following sets forth information regarding our executive officers, as of February 16, 2015.
|
Name
|
Age
|
Position
|
|
Jeffrey S. Niew
|
48
|
President & Chief Executive Officer
|
|
John S. Anderson
|
51
|
Senior Vice President & Chief Financial Officer
|
|
Michael A. Adell
|
44
|
Co-President, Mobile Consumer Electronics-Microphones
|
|
Christian U. Scherp
|
49
|
Co-President, Mobile Consumer Electronics-Speakers and Receivers
|
|
Gordon A. Walker
|
38
|
Co-President, Specialty Components-Acoustics & Hearing Health
|
|
David W. Wightman
|
60
|
Co-President, Specialty Components-Precision Devices
|
|
Alexis Bernard
|
41
|
Senior Vice President & Chief Technology Officer
|
|
Raymond D. Cabrera
|
48
|
Senior Vice President, Human Resources & Chief Administrative Officer
|
|
Paul M. Dickinson
|
43
|
Senior Vice President, Corporate Development
|
|
Daniel J. Giesecke
|
47
|
Senior Vice President & Chief Operating Officer
|
|
Thomas G. Jackson
|
49
|
Senior Vice President, General Counsel & Secretary
|
|
James F. Wynn
|
54
|
Senior Vice President, Global Supply Chain
|
|
Bryan E. Mittelman
|
44
|
Vice President, Controller
|
Jeffrey S. Niew has served as President & Chief Executive Officer since September 2013 and as a member of our Board of Directors since February 2014. From November 2011 until the Separation in February 2014, Mr. Niew served as a Vice President of Dover Corporation and as President and Chief Executive Officer of Dover Communication Technologies. Mr. Niew joined Knowles Electronics LLC (“Knowles Electronics”) in May 2000 and became Chief Operating Officer in January 2007, President in January 2008 and President and Chief Executive Officer in February 2010. Prior to joining Knowles Electronics, Mr. Niew was employed by Littelfuse, Inc., from 1995 to 2000, where he held various positions in product management, sales and engineering in the Electronic Products group and by Hewlett-Packard Company, from 1988 to 1994, where he served in various engineering and product management roles in the Optoelectronics Group in California.
John S. Anderson has served as Senior Vice President & Chief Financial Officer since December 2013. From January 2013 until the Separation in February 2014, Mr. Anderson served as Vice President and Chief Financial Officer of Dover Communication Technologies. Previously, Mr. Anderson served as Vice President and Chief Financial Officer of Dover Energy (from August 2010 to January 2013) and Vice President and Chief Financial Officer of Dover Fluid Management (from October 2009 to August 2010). Previous experience includes the roles of Corporate Controller and Director Financial Planning & Analysis for Sauer-Danfoss Inc. (from October 2004 to October 2009) and Director of Finance and Controller for Borg Warner Turbo Systems GmbH (from August 2002 to October 2004).
Michael A. Adell has served as Co-President, Mobile Consumer Electronics - Microphones since July 2011. Previously, Mr. Adell served as Vice President and General Manager in the Knowles Acoustics division of Knowles Electronics (“Knowles Acoustics”) (from January 2009 to July 2011), General Manager, Knowles Acoustics (from December 2006 to January 2009), Director, Product Management, Knowles Acoustics (from July 2004 to November 2006) and Product Manager for silicon microphone products, Knowles Acoustics (from November 2002 to July 2004).
Christian U. Scherp has served as Co-President, Mobile Consumer Electronics - Speakers and Receivers since September 2012. Prior to joining Knowles Electronics, Mr. Scherp served as the Global Head of Sales for the Consumer Devices business of TE Connectivity (from November 2011 to August 2012). Additional previous experience includes the following roles at Conexant Systems: Executive Vice President of Sales (from January 2011 to June 2011), Co-President, WW Sales, Marketing, Program Management (from July 2009 to December 2010) and President (from 2008 to 2009).
24
Gordon A. Walker has served as Co-President, Specialty Components - Acoustics & Hearing Health since July 2011. Previously, Mr. Walker served in the following roles in the Knowles Electronics division of Knowles Electronics: Vice President and General Manager (from December 2007 to July 2011), General Manager (from January 2006 to December 2007) and Director, Product Management (from September 2004 to December 2005). Prior to such positions, he held marketing, finance and operations roles after he joined Knowles Electronics in 1997.
David W. Wightman has served as Co-President, Specialty Components - Precision Devices since April 2013. Previously, Mr. Wightman held the position of President of Ceramic & Microwave Products (from August 2004 to April 2013) and President (from February 2000 to August 2004) of Dow-Key Microwave Corporation. Mr. Wightman’s experience also includes leadership roles at Danaher from February 1995 to February 2000.
Alexis Bernard has served as Chief Technology Officer since October 2014. Prior to joining Knowles, Mr. Bernard was the Chief Technology Officer at Audience (from 2013 to 2014). Previously, Mr. Bernard was Vice President of Technology Strategy and Business Development (from 2012 to 2013) and Head Chief Technology Officer, Operations and Chief of Staff, Nokia Chief Technology Officer & Executive Vice President (from 2010 to 2012) at Nokia and prior thereto Senior Engagement Manager at McKinsey & Company (from 2005 to 2010).
Raymond D. Cabrera has served as Senior Vice President, Human Resources & Chief Administrative Officer since February 2014. From November 2011 until the Separation in February 2014, Mr. Cabrera served as Vice President, Human Resources of Dover Communication Technologies. Previously, Mr. Cabrera served in the following capacities at Knowles: as Vice President, Human Resources and Chief Administrative Officer (from January 2004 to November 2011), Vice President, Human Resources (from March 2000 to January 2004) and Director, Human Resources (from June 1997 to March 2000) of Knowles Electronics.
Paul M. Dickinson has served as Senior Vice President, Corporate Development since February 2014 and Treasurer from February to November 2014. Mr. Dickinson started his career with Knowles in October 2013. Previously, Mr. Dickinson was the Chief Financial Officer for EPAY Systems, Inc., from 2012 until moving to Knowles. Additional previous experience includes the following roles at Littelfuse, Inc.: Vice President and General Manager, Semiconductor Business (from 2008 to 2012), Vice President, Corporate Development & Treasurer (from 2005 to 2008), Treasurer (from 2003 to 2005), Director of Accounting and International Finance (from 2000 to 2003) and other finance leadership roles since he joined Littelfuse in 1993.
Daniel J. Giesecke has served as Senior Vice President & Chief Operating Officer since February 2014. From January 2012 until the Separation in February 2014, Mr. Giesecke served as Vice President, Global Operations of Dover Communication Technologies. Previously, Mr. Giesecke served as Vice President, Advanced Manufacturing Engineering, Knowles Electronics (from February 2009 to January 2012), Senior Director, Advanced Manufacturing Engineering, Knowles Electronics (from January 2008 to February 2009), Director of Engineering Operations, Knowles Electronics (from November 2003 to January 2008) and various operations, supply chain and engineering positions since he joined Knowles Electronics in 1995.
Thomas G. Jackson has served as Senior Vice President, Secretary since February 2014 and, effective April 1, 2014, General Counsel. Prior to joining Knowles, Mr. Jackson served as Vice President and Assistant General Counsel at Jabil Circuit, Inc., a provider of electronic manufacturing services (from March 2012 to December 2013). In addition, he served as Vice President, General Counsel and Secretary at P.H. Glatfelter Company, a manufacturer of specialty papers and fiber-based engineered materials (from June 2008 to November 2011) and as its Assistant General Counsel, Assistant Secretary and Director of Compliance (from September 2006 to June 2008).
James F. Wynn has served as Senior Vice President Global Supply Chain since February 2014. From January 2013 until the Separation in February 2014, Mr. Wynn served as Vice President, Global Supply Chain of Dover Communication Technologies. Previously, Mr. Wynn served as Vice President, Global Supply Chain (from February 2009 to January 2013), Senior Director, Global Supply Chain (from March 2004 to February 2009) and Director, Global Supply Chain (from March 2002 to March 2004) of Knowles Electronics.
Bryan E. Mittelman has served as Vice President, Controller since February 2014. Mr. Mittelman started his career at Knowles in September 2013. Previously, Mr. Mittelman served as the Controller for Morningstar, Inc. from December 2011 to September 2013. Additional prior experience includes operating his consulting business from June 2010 to December 2011 and the following roles at Siemens Healthcare Diagnostics and Dade Behring (which was acquired by Siemens in 2007): Vice President, Finance, North America (from January 2008 to May 2010), Vice President, Finance, Americas (from January 2007 to December 2007), Vice President, Corporate Audit and Advisory Services (from March 2006 to December 2006), Assistant Corporate Controller (from April 2005 to February 2006) and Director of Financial Reporting (from July 2002 to April 2005).
25
Market Information
Our common stock is listed on the New York Stock Exchange (the “NYSE”) under the ticker symbol “KN.” A "when issued" trading market for our common stock began on the NYSE on February 14, 2014 and "regular way" trading of our common stock began on March 3, 2014. Prior to February 14, 2014, there was no public market for our common stock. The following table presents the high and low prices for common stock as reported on the NYSE since February 14, 2014.
|
2014
|
|||||||
|
Market Prices
|
|||||||
|
High
|
Low
|
||||||
|
First Quarter (February 14, 2014 through March 31, 2014)
|
$
|
33.66
|
|
$
|
27.58
|
|
|
|
Second Quarter
|
$
|
32.61
|
|
$
|
27.55
|
|
|
|
Third Quarter
|
$
|
33.82
|
|
$
|
25.62
|
|
|
|
Fourth Quarter
|
$
|
26.38
|
|
$
|
17.23
|
|
|
Dividends
Since the spin-off from Dover Corporation, we have not paid cash dividends and we do not anticipate paying a cash dividend on our common stock in the immediate future. Any determination to pay dividends in the future will be at the discretion of our Board of Directors and will depend on many factors, such as our financial condition, earnings, capital requirements, debt service obligations, industry practice, legal requirements, regulatory constraints and other factors that the Board of Directors deems relevant. Our ability to pay dividends will depend on our ongoing ability to generate cash from operations and access to the capital markets.
Holders
The number of holders of record of our common stock as of
February 18, 2015
was approximately
1,436
.
Securities Authorized for Issuance Under Equity Compensation Plans
For information regarding securities authorized for issuance under our equity compensation plans, see Part III, Item 12 of this Form 10-K.
Recent Sales of Unregistered Securities
On June 26, 2013, in connection with our formation, we issued 100 shares of common stock, par value $0.01 per share, to Dover Corporation for total consideration of $100 in cash. On February 28, 2014, we issued
85,019,059
shares of common stock, par value $0.01 per share, to Dover Corporation as a dividend to our sole stockholder. We did not register the issuance of these shares under the Securities Act of 1933, as amended (the “Securities Act”), because such issuance did not constitute a public offering and therefore was exempt from registration pursuant to Section 4(a)(2) of the Securities Act. All of these 85,019,159 shares were subsequently distributed on a pro rata basis to Dover’s stockholders in connection with the Separation.
Issuer Purchases of Equity Securities
None.
26
Performance Graph
This performance graph does not constitute soliciting material, is not deemed filed with the SEC and is not incorporated by reference in any of our filings under the Securities Act of 1933 or the Exchange Act of 1934, whether made before or after the date of this Annual Report on Form 10-K and irrespective of any general incorporation language in any such filing, except to the extent we specifically incorporate this performance graph by reference therein.
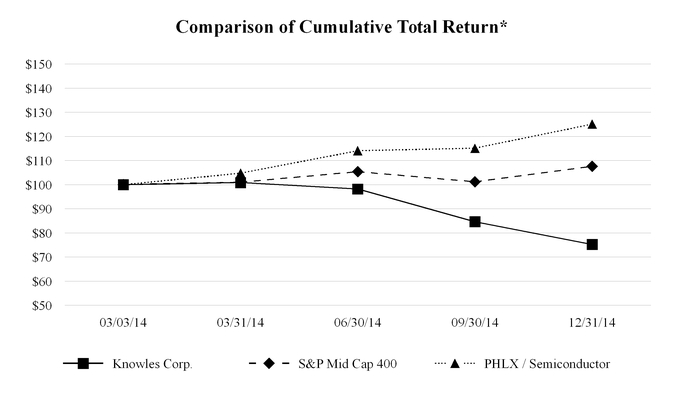
Data Source: NYSE
*Total return assumes reinvestment of dividends.
This graph assumes $100 invested on March 3, 2014 in Knowles Corporation common stock, the S&P Mid Cap 400
®
index and PHLX / Semiconductor Sector Index
SM
.
The foregoing performance graph is being furnished as part of this Annual Report on Form 10-K solely in accordance with the requirement under Rule 14a-3(b)(9) to furnish our stockholders with such information and therefore, shall not be deemed to be filed or incorporated by reference into any filings by the Company under the Securities Act of 1933, as amended, or the Securities Exchange Act of 1934, as amended.
27
The following table presents selected financial data. We derived the selected financial data as of December 31,
2014
and
2013
and for the years ended December 31,
2014
,
2013
and
2012
from the audited Consolidated Financial Statements and accompanying notes that are under Item 8, "Financial Statements and Supplementary Data." We derived the selected financial data as of December 31,
2012
and
2011
and for the years ended December 31,
2011
and
2010
from our audited Combined Financial Statements and accompanying notes that are not included in this report. We derived the data as of December 31,
2010
from our unaudited Combined Financial Statements that are not included in this report. In management’s opinion, our unaudited Combined Financial Statements for this date have been prepared on the same basis as our audited Consolidated Financial Statements and include all adjustments, consisting only of normal recurring adjustments and allocations, necessary for a fair statement of the information for the periods presented.
The selected financial data includes costs of Knowles’ businesses, which include the allocation of certain corporate expenses from Dover. We believe that these allocations were made on a reasonable basis. The selected historical financial data may not be indicative of our future performance as an independent publicly-traded company. The selected financial data should be read in conjunction with "
Management's Discussion and Analysis of Financial Condition and Results of Operations
" and the Consolidated Financial Statements and accompanying notes included under Item 8, "Financial Statements and Supplementary Data."
|
Years Ended December 31,
|
||||||||||||||||||||
|
Statement of Earnings Data
(in millions, except for share and per share amounts):
|
2014
|
|
2013
|
|
2012
|
|
2011
(1)
|
|
2010
|
|||||||||||
|
Revenue
|
$
|
1,141.3
|
|
$
|
1,214.8
|
|
$
|
1,118.0
|
|
$
|
983.3
|
|
$
|
730.4
|
|
|||||
|
Gross profit
|
232.7
|
|
427.9
|
|
407.0
|
|
378.0
|
|
334.6
|
|
||||||||||
|
Net (loss) earnings
|
$
|
(87.0
|
)
|
$
|
105.8
|
|
$
|
79.1
|
|
$
|
98.5
|
|
$
|
109.3
|
|
|||||
|
Adjusted for:
|
||||||||||||||||||||
|
Interest expense, net
(2)
|
6.6
|
|
42.0
|
|
56.5
|
|
39.9
|
|
20.3
|
|
||||||||||
|
Provision (benefit from) for income taxes
|
31.9
|
|
(4.3
|
)
|
(0.2
|
)
|
7.1
|
|
7.5
|
|
||||||||||
|
EBIT
(3)
|
$
|
(48.5
|
)
|
$
|
143.5
|
|
$
|
135.4
|
|
|
$
|
145.5
|
|
|
$
|
137.1
|
|
|||
|
Basic and diluted (loss) earnings per share
|
$
|
(1.02
|
)
|
$
|
1.24
|
|
$
|
0.93
|
|
$
|
1.16
|
|
$
|
1.29
|
|
|||||
|
Basic and diluted shares outstanding
(4)
|
85,046,042
|
|
85,019,159
|
|
85,019,159
|
|
85,019,159
|
|
85,019,159
|
|
||||||||||
|
As of December 31,
|
||||||||||||||||||||
|
Balance Sheet Data
(in millions):
|
2014
|
2013
|
2012
|
2011
(1)
|
2010 (unaudited)
|
|||||||||||||||
|
Total assets
|
$
|
1,998.5
|
|
$
|
2,170.1
|
|
$
|
2,051.1
|
|
$
|
2,000.7
|
|
$
|
1,034.3
|
|
|||||
|
Total third party debt and lease obligations
(5)(6)
|
407.0
|
|
1.6
|
|
2.3
|
|
—
|
|
—
|
|
||||||||||
|
Notes payable to Former Parent, net
|
N/A
|
|
N/A
|
|
528.8
|
|
1,419.4
|
|
440.5
|
|
||||||||||
|
Years Ended December 31,
|
||||||||||||||||||||
|
Other Data
(in millions):
|
2014
|
2013
|
2012
|
2011
(1)
|
2010
|
|||||||||||||||
|
Depreciation and amortization
|
$
|
169.9
|
|
$
|
130.9
|
|
$
|
114.9
|
|
$
|
84.8
|
|
$
|
54.4
|
|
|||||
|
Capital expenditures
|
92.3
|
|
91.3
|
|
145.6
|
|
96.3
|
|
32.9
|
|
||||||||||
(1)
On July 4, 2011, the Company completed the stock acquisition of the Sound Solutions business line from NXP Semiconductors N.V. (“NXP”). The Consolidated Statements of Earnings and Consolidated Balance Sheets include the results of operations, net assets acquired and depreciation and amortization expense related to Sound Solutions since the date of acquisition.
28
(2)
On January 27, 2014, we entered into five-year credit facilities totaling $500.0 million and borrowed $400.0 million on February 28, 2014 to finance a cash payment to Dover in connection with the Separation. The interest expense, net for the period ending
December 31, 2014
relates to these borrowings. The interest expense, net during all other periods presented relate to interest expense on the net notes payable to Dover that were settled during the fourth quarter of 2013 in anticipation of the Separation. See "Management's Discussion and Analysis of Financial Condition and Results of Operations—Borrowings and Lines of Credit section of Liquidity and Capital Resources" for additional information related to our post-Separation debt.
(3)
We use the term “EBIT” throughout this Form 10-K, defined as net earnings plus (i) interest expense and (ii) income taxes. EBIT is not presented in accordance with accounting principles generally accepted in the United States of America ("GAAP" or "U.S. GAAP") and may not be comparable to similarly titled measures used by other companies. We use EBIT as a supplement to our GAAP results of operations in evaluating certain aspects of our business and our Board of Directors and executive management team focus on EBIT as a key measure of our performance for business planning purposes. This measure assists us in comparing its performance between various reporting periods on a consistent basis, as this measure removes from operating results the impact of items that, in our opinion, do not reflect our core operating performance. We believe that our presentation of EBIT is useful because it provides investors and securities analysts with the same information that we use internally for purposes of assessing our core operating performance. For a reconciliation of EBIT to net earnings, the most directly related GAAP measure, please see the table above.
(4)
On February 28, 2014, the distribution date, Dover stockholders of record as of the close of business on February 19, 2014 received one share of Knowles common stock for every two shares of Dover's common stock held as of the record date. Basic and diluted earnings per common share and the average number of common shares outstanding were calculated using the number of Knowles common shares outstanding immediately following the distribution.
See Note 15. Earnings per Share
of the notes to our Consolidated Financial Statements under Item 8, "Financial Statements and Supplementary Data" for information regarding earnings per common share.
(5)
On January 27, 2014, we entered into a $200.0 million five-year senior secured revolving credit facility, as well as a $300.0 million five-year senior secured term loan facility pursuant to the Original Credit Agreement, which are referred to collectively as the “Credit Facilities.” In connection with the Separation, we incurred $100.0 million of borrowings under the revolving credit facility and $300.0 million of borrowings under the term loan facility, in each case to finance a cash payment to Dover immediately prior to the Separation. On December 31, 2014, we amended our Credit Facilities to increase the amount of the revolving credit facility in the Original Credit Agreement to
$350.0 million
but incurred no additional borrowings. See "Management's Discussion and Analysis of Financial Condition and Results of Operations—Borrowings and Lines of Credit section of Liquidity and Capital Resources" for additional information related to our post-Separation debt.
(6)
Also includes current portion of long-term debt and capital lease obligations.
29
The discussion and analysis presented below refer to and should be read in conjunction with the audited Consolidated Financial Statements and related notes under Item 8, "Financial Statements and Supplementary Data." The following discussion contains forward-looking statements. The matters discussed in these forward-looking statements are subject to risks, uncertainties and other factors that could cause actual results to differ materially from those made, projected or implied in the forward-looking statements. Factors that could cause or contribute to these differences include those discussed below and elsewhere in this Form 10-K, particularly in “Risk Factors” and “Cautionary Statement Concerning Forward-Looking Statements.” We believe the assumptions underlying the Consolidated Financial Statements are reasonable. However, the Consolidated Financial Statements included herein may not necessarily reflect our results of operations, financial position and cash flows in the future or what they would have been had we been an independent publicly-traded company during all of the periods presented.
Management’s discussion and analysis, which we refer to as “MD&A,” of our results of operations, financial condition and cash flows should be read together with the audited Consolidated Financial Statements and footnotes included under Item 8, "Financial Statements and Supplementary Data," to help provide an understanding of our financial condition, changes in financial condition and results of our operations.
Overview and Outlook
Our Business
On February 28, 2014, our former parent company, Dover Corporation, completed the spin-off of Knowles into an independent, publicly-traded company. We are a market leader and global supplier of advanced micro-acoustic solutions and specialty components serving the mobile communications, consumer electronics, medical technology, military, aerospace and industrial markets. We have a leading position in micro-electro-mechanical systems ("MEMS") microphones, speakers and receivers which are used in smartphones, tablets and mobile handsets. We are also a leading manufacturer of transducers used in hearing aids and other medical devices and have a strong position in oscillators (timing devices) and capacitor components which enable various types of communication. Our focus on the customer, combined with unique technology, rigorous testing and global scale, helps to deliver innovative solutions and consistently dependable and precise products.
Business Segments
We are organized into two reportable segments based on how management analyzes performance, allocates capital and makes strategic and operational decisions. These segments were determined in accordance with the Financial Accounting Standards Board ("FASB") Accounting Standards Codification ("ASC") Topic 280-Segment Reporting and are comprised of (i) Mobile Consumer Electronics (“MCE”) and (ii) Specialty Components (“SC”). The segments are aligned around similar product applications serving our key end markets, to enhance focus on end market growth strategies.
|
•
|
MCE designs and manufactures innovative acoustic products, including microphones, speakers, receivers and integrated modules used in several applications that serve the handset, tablet and other consumer electronic markets. Locations include the corporate office in Itasca, Illinois; sales, support and engineering facilities in North America, Europe and Asia; and manufacturing facilities in Asia.
|
|
•
|
SC specializes in the design and manufacture of specialized electronic components used in medical and life science applications, as well as high-performance solutions and components used in communications infrastructure and a wide variety of other markets. SC’s transducer products are used principally in hearing aid applications within the commercial audiology markets, while its oscillator products predominantly serve the telecom infrastructure market and its capacitor products are used in applications including radio, radar, satellite, power supplies, transceivers and medical implants serving the defense, aerospace, telecommunication and life sciences markets. Operating facilities and sales, support and engineering facilities are located in North America, Europe and Asia.
|
We sell our products directly to original equipment manufacturers (“OEMs”) and to their contract manufacturers and suppliers and to a lesser extent through distributors worldwide.
30
Results of Operations
Our Consolidated Financial Statements were derived principally from the consolidated financial statements of our Former Parent for the periods prior to the Separation. Prior to the Separation on February 28, 2014, our historical financial statements were prepared on a stand-alone basis and were derived from Dover's consolidated financial statements and accounting records. Accordingly, our financial statements prior to February 28, 2014 are presented herein on a consolidated basis and reflect our financial position, results of operations and cash flows as our business was operated as part of Dover prior to the Separation, in conformity with U.S. generally accepted accounting principles.
Results of Operations for the Year Ended December 31, 2014 compared with the Year Ended December 31, 2013
In addition to the GAAP financial measures included herein, we have presented certain non-GAAP financial measures. We use non-GAAP measures as supplements to our GAAP results of operations in evaluating certain aspects of our business and our Board of Directors and executive management team focus on non-GAAP items as key measures of our performance for business planning purposes. These measures assist us in comparing our performance between various reporting periods on a consistent basis, as these measures remove from operating results the impact of items that, in our opinion, do not reflect our core operating performance. We believe that our presentation of non-GAAP financial measures is useful because it provides investors and securities analysts with the same information that we use internally for purposes of assessing our core operating performance. For a reconciliation of these non-GAAP financial measures to the most directly comparable GAAP financial measures, see the reconciliation included herein.
|
|
Years Ended December 31,
|
|||||||
|
(in millions, except per share amounts)
|
2014
|
2013
|
||||||
|
Revenues
|
$
|
1,141.3
|
|
$
|
1,214.8
|
|
||
|
Gross profit
|
$
|
232.7
|
|
$
|
427.9
|
|
||
|
Non-GAAP gross profit
|
$
|
335.8
|
|
$
|
450.1
|
|
||
|
(Loss) earnings before interest and income taxes
|
$
|
(48.5
|
)
|
$
|
143.5
|
|
||
|
Adjusted earnings before interest and income taxes
|
$
|
113.4
|
|
$
|
222.3
|
|
||
|
Provision for (benefit from) income taxes
|
$
|
31.9
|
|
$
|
(4.3
|
)
|
||
|
Non-GAAP provision for income taxes
|
$
|
12.5
|
|
$
|
14.5
|
|
||
|
Net (loss) earnings
|
$
|
(87.0
|
)
|
$
|
105.8
|
|
||
|
Non-GAAP net earnings
|
$
|
94.3
|
|
$
|
165.8
|
|
||
|
Diluted (loss) earnings per share
(1)
|
$
|
(1.02
|
)
|
$
|
1.24
|
|
||
|
Non-GAAP diluted earnings per share
|
$
|
1.10
|
|
$
|
1.95
|
|
||
(1)
On February 28, 2014, Dover stockholders of record as of the close of business on February 19, 2014 received one share of Knowles common stock for every two shares of Dover's common stock held as of the record date. The computation of diluted earnings per common share for all periods through December 31, 2013 was calculated using the shares distributed on February 28, 2014.
See Note 15. Earnings per Share
of the notes to our Consolidated Financial Statements under Item 8, "Financial Statements and Supplementary Data
"
for information regarding earnings per share.
31
Revenues
Revenues for the
year ended December 31,
2014
were
$1,141.3 million
, compared with
$1,214.8 million
for the
year ended December 31,
2013
,
a decrease
of
$73.5 million
or
6.1%
. This was due to a decrease in MCE revenues of
$93.1 million
, partially offset by an increase in SC revenues of
$19.5 million
. MCE revenues were negatively impacted by a hold on production and shipments of one new version of our MEMS microphone for a specific platform at one key OEM customer due to a low level defect beginning in the third quarter of 2014. In February 2015, the OEM customer provided us notification that our microphone for this platform was requalified. We expect to resume production and related shipments no later than the second quarter of 2015. As a result, we expect this microphone issue will continue to negatively impact MCE revenues in 2015 due to lost shipments and price reductions on this microphone. The decrease in MCE revenues for the year ended December 31, 2014 compared to the year ended December 31, 2103 was also due to lower average selling prices on mature products, reduced shipments to three OEM customers in connection with their lower share of the handset market and a design change at one smartphone OEM customer. The decreases in MCE revenues were partially offset by an increase in revenues from other mobile customers, including Chinese OEMs, who gained market share year-over-year. The increase in SC revenues was primarily due to improved demand for precision devices as a result of strength in the wireless communication infrastructure market, particularly in China, as well as increased market penetration. In addition, SC revenues increased due to new product introductions and broad-based demand among our hearing health customers. These increases in SC revenues were partially offset by lower pricing. Foreign currency translation negatively impacted consolidated revenues by a negligible amount.
Cost of Goods Sold
Cost of goods sold for the
year ended December 31,
2014
were
$885.3 million
, compared with
$779.1 million
for the
year ended December 31,
2013
,
an increase
of
$106.2 million
or
13.6%
. The increase was primarily driven by higher fixed asset accelerated depreciation and related inventory charges of $32.6 million, mainly associated with the cessation of manufacturing operations at our Vienna, Austria facility and shorter product life cycles at our Beijing, China facility. The increase was also due to warranty and inventory charges, as well as unfavorable fixed overhead absorption related to the MEMS microphone that was placed on hold and ramp-up costs associated with new product introductions. Lastly, the increase was due to higher production transfer costs of
$15.6 million
to support the migration of operations into new and existing Asian lower-cost manufacturing facilities and a
$15.0 million
charge related to the resolution of customer claims for products no longer produced. These increases were partially offset by the impact of lost shipments of the MEMS microphone that was placed on hold and cost savings from restructuring actions.
Restructuring Charges
We undertake restructuring programs from time to time to better align our operations with current market conditions. Such activities include targeted facility consolidations, headcount reductions and other measures to further optimize operations. It is likely that we will have restructuring charges in the future as we execute on our strategy to consolidate our manufacturing footprint. Details regarding restructuring programs undertaken during the reporting period are as follows:
2014
During the
year ended December 31,
2014
, the Board of Directors authorized the cessation of manufacturing operations at our Vienna, Austria facility as part of our previously announced plan to consolidate our manufacturing footprint. As a result of the Vienna restructuring action, which was substantially complete by the end of the second quarter of 2014, we recorded restructuring charges of
$20.7 million
. This included
$16.0 million
related to severance pay and benefits and $
4.7 million
related to contract termination and other costs. Of the total
$20.7 million
in restructuring charges,
$14.5 million
were classified as Cost of goods sold and
$6.2 million
were classified as Operating expenses.
In conjunction with this restructuring action, we also accelerated depreciation on fixed assets and recorded inventory charges of
$18.8 million
and incurred production transfer costs of $6.2 million bringing the total recorded costs related to the Vienna restructuring action to $45.7 million. We anticipate incurring an additional $1 to $2 million of restructuring and related charges associated with this action, primarily during the first quarter of 2015. Of the total pre-tax costs of $47 to $48 million, we expect approximately $28 to $30 million will be cash expenditures, the majority of which was paid during 2014. We anticipate annual savings of
$25
to
$30
million associated with this action mainly due to reduced salary and fixed asset depreciation expenses.
32
In line with our previously announced plans to consolidate our manufacturing footprint, we also recorded restructuring charges of
$8.9 million
during
year ended December 31,
2014
related to other actions. These actions included programs to transfer our hearing health business and certain of our capacitor businesses into new and existing lower-cost Asian manufacturing facilities, as well as to reduce headcount in the consumer electronics business.
2013
In
2013
, we incurred restructuring charges of
$16.3 million
relating to programs to integrate activities within the consumer electronics business, to migrate the Company's U.K.-based capacitor production into our existing lower-cost Asian manufacturing facilities and to reduce in headcount within our German and North American operations that serve the telecom infrastructure market in order to better align the business with current market dynamics.
Gross Profit and Non-GAAP Gross Profit
Gross profit for the
year ended December 31,
2014
was
$232.7 million
, compared with
$427.9 million
for the
year ended December 31,
2013
,
a decrease
of
$195.2 million
or
45.6%
. Gross profit margin (gross profit as a percentage of revenues) for the
year ended December 31,
2014
was
20.4%
, compared with
35.2%
for the
year ended December 31,
2013
. The decline was primarily due to lower average selling prices on mature products and lost production and shipments, as well as warranty and inventory charges, related to the MEMS microphone that was placed on hold. Gross profit margin in 2015 is expected to be negatively impacted due to lost production, lower shipments and price reductions on this microphone. The decrease in gross profit margin for the year ended December 31, 2014 compared to the year ended December 31, 2103 was also driven by higher fixed asset accelerated depreciation and related inventory charges and restructuring charges of $48.1 million, mainly associated with the cessation of manufacturing operations at our Vienna, Austria facility and shorter product life cycles at our Beijing, China facility. Lastly, the decrease was due to ramp-up costs associated with new product introductions, higher production transfer costs of
$15.6 million
to support the migration of operations into new and existing Asian lower-cost manufacturing facilities and a
$15.0 million
charge related to the resolution of customer claims for products no longer produced. These decreases were partially offset by cost savings from overall restructuring actions.
Non-GAAP gross profit for the
year ended December 31,
2014
was
$335.8 million
, compared with
$450.1 million
for the
year ended December 31,
2013
,
a decrease
of
$114.3 million
or
25.4%
. Non-GAAP gross profit margin (non-GAAP gross profit as a percentage of revenues) for the
year ended December 31,
2014
was
29.4%
, as compared with
37.1%
for the
year ended December 31,
2013
. The decline was primarily due to lower average selling prices on mature products, the impacts of the MEMS microphone that was placed on hold and ramp-up costs associated with new product introductions. These decreases were partially offset by cost savings from overall restructuring actions.
Research and Development Expenses
Research and development expenses for the
years ended December 31,
2014
and
2013
were
$83.0 million
and
$82.6 million
, respectively. Research and development expenses as a percentage of revenues for the
years ended December 31,
2014
and
2013
were
7.3%
and
6.8%
, respectively.
Selling and Administrative Expenses
Selling and administrative expenses for the
year ended December 31,
2014
were
$196.5 million
, compared with
$193.0 million
for the
year ended December 31,
2013
,
an increase
of
$3.5 million
or
1.8%
. Selling and administrative expenses as a percentage of revenues for the
year ended December 31,
2014
were
17.2%
, compared with
15.9%
for the
year ended December 31,
2013
. Included in selling and administrative expenses were corporate allocations from our Former Parent of $3.4 million and $23.6 million for the years ended December 31, 2014 and 2013, respectively, which represent administration of treasury, employee compensation and benefits, public and investor relations, internal audit, corporate income tax, supply chain and legal services through the Separation date. In 2014, we also incurred our own costs related to such support functions as part of being an independent company for the majority of the year. The increase in selling and administrative expenses was mainly due to increased legal expenses primarily in connection with the GoerTek intellectual property litigation.
33
(Loss) Earnings Before Interest and Income Taxes and Adjusted Earnings Before Interest and Income Taxes
EBIT for the
year ended December 31,
2014
was
$(48.5) million
, compared with
$143.5 million
for the year ended December 31,
2013
,
a decrease
of
$192.0 million
. The decrease was primarily due to lower average selling prices on mature products, the impacts of the MEMS microphone that was placed on hold and higher fixed asset accelerated depreciation and related inventory charges and restructuring charges of
$45.9 million
, mainly associated with the cessation of manufacturing operations at our Vienna, Austria facility and shorter product life cycles at our Beijing, China facility. Additionally, the decrease was due to ramp-up costs associated with new product introductions, higher production transfer costs of $16.1 million to support the migration of operations into new and existing Asian lower-cost manufacturing facilities and a
$15.0 million
charge related to the resolution of customer claims for products no longer produced. These decreases were partially offset by cost savings from overall restructuring actions.
Adjusted EBIT for the
year ended December 31,
2014
were
$113.4 million
, compared with
$222.3 million
for the
year ended December 31,
2013
,
a decrease
of
$108.9 million
or
49.0%
. Adjusted EBIT margin (adjusted EBIT as a percentage of revenues) for the
year ended December 31,
2014
was
9.9%
, as compared with
18.3%
for the
year ended December 31,
2013
. The decrease was primarily due to lower average selling prices on mature products, the impacts of the MEMS microphone that was placed on hold and ramp-up costs associated with new product introductions. These decreases were partially offset by cost savings from overall restructuring actions.
Interest Expense, net
Interest expense, net for the
year ended December 31,
2014
was
$6.6 million
, compared with
$42.0 million
for the
year ended December 31,
2013
,
a decrease
of
$35.4 million
or
84.3%
. During the first quarter of 2014, we entered into five-year credit facilities totaling $500.0 million and borrowed $400.0 million on February 28, 2014 to finance a cash payment to Dover in connection with the Separation. The interest expense, net for the
year ended December 31,
2014
relates to these borrowings. The interest expense, net during the
year ended December 31,
2013
relates to interest expense on the net notes payable to Dover that were settled during the fourth quarter of 2013 in anticipation of the Separation.
Provision for Income Taxes and Non-GAAP Provision for Income Taxes
Prior to the Separation on February 28, 2014, our historical financial statements reflect income tax expense and deferred tax balances that have been calculated on a stand-alone basis although our operations have historically been included in the tax returns filed by our Former Parent.
The effective tax rate ("ETR") for the
year ended December 31,
2014
was a
57.9%
provision, compared with a
4.2%
benefit for the
year ended December 31,
2013
. The ETR for the
year ended December 31,
2014
was impacted by net discrete items of $38.2 million. The discrete items recorded during the
year ended December 31,
2014
were primarily due to the recognition of a valuation allowance on certain foreign subsidiaries' net deferred tax assets of
$36.8 million
, partially offset by a Malaysian tax holiday of $4.4 million. The discrete benefit from the Malaysian tax holiday relates to 2013; however, it was recorded in the second quarter of 2014 when we received approval from the relevant taxing authority. For additional information on this tax holiday, see
Note 9. Income Taxes
of the notes to our Consolidated Financial Statements under Item 8, "Financial Statements and Supplementary Data.
"
Absent the discrete items, the ETR for the
year ended December 31,
2014
was an 11.4% benefit, compared with a 6.4% benefit for the
year ended December 31,
2013
. The change in the ETR, excluding the discrete items, was due to the mix of earnings by taxing jurisdictions.
The non-GAAP ETR for the
year ended December 31,
2014
was an 11.7% provision, compared with an 8.0% provision for the
year ended December 31,
2013
. The change in the non-GAAP ETR was due to the mix of earnings by taxing jurisdictions.
The year-to-date ETR and non-GAAP ETR deviates from the statutory U.S. federal income tax rate, mainly due to the taxing jurisdictions in which we generate taxable income or loss and the favorable impact of our tax holidays in Malaysia. A significant portion of our pre-tax income is not subject to tax as a result of our tax holidays in Malaysia, subject to our satisfaction of certain conditions that we expect to continue to satisfy. Unless extended or otherwise renegotiated, our existing tax holidays in Malaysia will expire December 31, 2021.
34
Diluted (Loss) Earnings per Share and Non-GAAP Diluted Earnings per Share
Diluted (loss) earnings per share was
$(1.02)
for the
year ended December 31,
2014
, compared with
$1.24
for the
year ended December 31,
2013
. The decrease in diluted (loss) earnings per share was due to lower EBIT and the impact of a discrete tax expense resulting from the recognition of a valuation allowance on certain foreign subsidiaries' net deferred tax assets of
$36.8 million
, partially offset by lower interest expense of
$35.4 million
.
Non-GAAP diluted earnings per share for the
year ended December 31,
2014
was
$1.10
, compared with
$1.95
for the
year ended December 31,
2013
. Non-GAAP diluted earnings per share included $0.05 related to the discrete Malaysia tax holiday benefit recorded during the second quarter of 2014. Excluding the discrete tax benefit, the decrease in non-GAAP diluted earnings per share was mainly driven by lower adjusted EBIT, partially offset by a reduction in interest expense.
35
Reconciliation of GAAP Financial Measures to Non-GAAP Financial Measures
|
Years Ended December 31,
|
||||||||
|
(in millions, except share and per share amounts)
|
2014
|
2013
|
||||||
|
Gross profit
|
$
|
232.7
|
|
$
|
427.9
|
|
||
|
Stock-based compensation expense
|
0.8
|
|
—
|
|
||||
|
Fixed asset and related inventory charges
|
39.5
|
|
6.9
|
|
||||
|
Restructuring charges
|
23.3
|
|
7.8
|
|
||||
|
Production transfers costs
(1)
|
24.5
|
|
8.9
|
|
||||
|
Other
(2)
|
15.0
|
|
(1.4
|
)
|
||||
|
Non-GAAP gross profit
|
$
|
335.8
|
|
$
|
450.1
|
|
||
|
|
||||||||
|
Net (loss) earnings
|
$
|
(87.0
|
)
|
$
|
105.8
|
|
||
|
Interest expense, net
|
6.6
|
|
42.0
|
|
||||
|
Provision for (benefit from) income taxes
|
31.9
|
|
(4.3
|
)
|
||||
|
(Loss) earnings before interest and income taxes
|
(48.5
|
)
|
143.5
|
|
||||
|
Stock-based compensation expense
|
9.0
|
|
2.0
|
|
||||
|
Intangibles amortization expense
|
42.6
|
|
45.9
|
|
||||
|
Fixed asset and related inventory charges
|
39.5
|
|
6.9
|
|
||||
|
Restructuring charges
|
29.6
|
|
16.3
|
|
||||
|
Production transfers costs
(1)
|
25.2
|
|
9.1
|
|
||||
|
Other
(2)
|
16.0
|
|
(1.4
|
)
|
||||
|
Adjusted earnings before interest and income taxes
|
$
|
113.4
|
|
$
|
222.3
|
|
||
|
|
||||||||
|
Provision for (benefit from) income taxes
|
$
|
31.9
|
|
$
|
(4.3
|
)
|
||
|
Income tax effects of non-GAAP reconciling adjustments
|
19.4
|
|
(18.8
|
)
|
||||
|
Non-GAAP provision for income taxes
|
$
|
12.5
|
|
$
|
14.5
|
|
||
|
Net (loss) earnings
|
$
|
(87.0
|
)
|
$
|
105.8
|
|
||
|
Non-GAAP reconciling adjustments
|
161.9
|
|
78.8
|
|
||||
|
Income tax effects of non-GAAP reconciling adjustments
|
19.4
|
|
(18.8
|
)
|
||||
|
Non-GAAP net earnings
|
$
|
94.3
|
|
$
|
165.8
|
|
||
|
Non-GAAP diluted earnings per share
(3)
|
$
|
1.10
|
|
$
|
1.95
|
|
||
|
Diluted average shares outstanding
(3)
|
85,046,042
|
|
85,019,159
|
|
||||
|
Non-GAAP adjustment
(4)
|
539,734
|
|
—
|
|
||||
|
Non-GAAP diluted average shares outstanding
(3)(4)
|
85,585,776
|
|
85,019,159
|
|
||||
(1)
Production transfer costs represent one-time and duplicate costs incurred to migrate manufacturing to new or existing facilities in Asia. These amounts are included in the corresponding gross profit and earnings before interest and income taxes for each period presented.
(2)
Other primarily represents a charge in the third quarter of 2014 related to the resolution of customer claims for products no longer produced.
(3)
On February 28, 2014, Dover stockholders of record as of the close of business on February 19, 2014 received one share of Knowles common stock for every two shares of Dover's common stock held as of the record date. The computation of diluted earnings per common share for all periods through December 31, 2013 was calculated using the shares distributed on February 28, 2014.
(4)
The number of shares used in the diluted per share calculations on a non-GAAP basis excludes the impact of stock-based compensation expense expected to be incurred in future periods and not yet recognized in the financial statements, which would otherwise be assumed to be used to repurchase shares under the GAAP treasury stock method.
36
Results of Operations for the Year Ended December 31, 2013 compared with the Year Ended December 31, 2012
|
|
Years Ended December 31,
|
|||||||
|
(in millions, except per share amounts)
|
2013
|
2012
|
||||||
|
Revenues
|
$
|
1,214.8
|
|
$
|
1,118.0
|
|
||
|
Gross profit
|
$
|
427.9
|
|
$
|
407.0
|
|
||
|
Non-GAAP gross profit
|
$
|
450.1
|
|
$
|
408.0
|
|
||
|
Earnings before interest and income taxes
|
$
|
143.5
|
|
$
|
135.4
|
|
||
|
Adjusted earnings before interest and income taxes
|
$
|
222.3
|
|
$
|
195.1
|
|
||
|
Benefit from income taxes
|
$
|
(4.3
|
)
|
$
|
(0.2
|
)
|
||
|
Net earnings
|
$
|
105.8
|
|
$
|
79.1
|
|
||
|
Diluted earnings per share
(1)
|
$
|
1.24
|
|
$
|
0.93
|
|
||
(1)
On February 28, 2014, Dover stockholders of record as of the close of business on February 19, 2014 received one share of Knowles common stock for every two shares of Dover's common stock held as of the record date. The computation of diluted earnings per common share for all periods through December 31, 2013 was calculated using the shares distributed on February 28, 2014.
See Note 15. Earnings per Share
of the notes to our Consolidated Financial Statements under Item 8, "Financial Statements and Supplementary Data" for information regarding earnings per share.
Revenues
Revenues for the
year ended December 31,
2013
were
$1,214.8 million
, compared with
$1,118.0 million
for the
year ended December 31,
2012
,
an increase
of
$96.8 million
or
8.7%
. This was due to an increase in MCE revenues of
$106.8 million
, partially offset by a decrease in SC revenues of
$10.0 million
. MCE revenues increased primarily from strong demand for components serving the smartphone market, including the continued trend for multi-microphone product offerings, with key OEM customers incorporating up to three microphones per device. New smartphone product launches, as well as one OEM customer gaining share in the smartphone market drove a significant portion of the MCE volume growth. The increases in MCE revenues were partially offset by delays related to OEM smartphone releases, as well as the impact of market share losses by two other key smartphone OEM customers. The decrease in SC revenues was primarily due to weakness in the domestic military markets resulting from government funding uncertainties, reduced demand for acoustic components used in specialty headset applications due to overstock and inventory corrections by the OEM customers and lower pricing. These decreases in SC revenues were partially offset by higher demand from telecom customers serving the anticipated build out of wireless infrastructure, particularly in China. Foreign currency translation positively impacted consolidated revenues by a negligible amount.
Cost of Goods Sold
Cost of goods sold for the
year ended December 31,
2013
were
$779.1 million
, compared with
$710.6 million
for the
year ended December 31,
2012
,
an increase
of
$68.5 million
or
9.6%
. The increase was primarily driven by higher sales volume, higher production transfer costs related to migration of operations into existing Asian lower-cost manufacturing facilities of $8.3 million and higher asset impairment and inventory charges related to more mature product lines of $6.9 million. Partially offsetting this increase was the impact of productivity initiatives, primarily due to lower conversion costs within MCE.
37
Restructuring Charges
We undertake restructuring programs from time to time to better align our operations with current market conditions. Such activities include targeted facility consolidations, headcount reductions and other measures to further optimize operations. It is likely that we will have restructuring charges in the future as we execute on our strategy to consolidate our manufacturing footprint. Details regarding restructuring programs undertaken during the reporting period are as follows:
2013
In
2013
, we incurred restructuring charges of
$16.3 million
relating to programs to integrate activities within the consumer electronics business, to migrate the Company's U.K.-based capacitor production into our existing lower-cost Asian manufacturing facilities and to reduce in headcount within our German and North American operations that serve the telecom infrastructure market in order to better align the business with current market dynamics.
2012
In
2012
, we incurred restructuring charges of
$5.9 million
primarily related to a North American facility consolidation in the oscillator business in response to the weakened telecommunications market.
Gross Profit and Non-GAAP Gross Profit
Gross profit for the
year ended December 31,
2013
was
$427.9 million
, compared with
$407.0 million
for the
year ended December 31,
2012
,
an increase
of
$20.9 million
or
5.1%
. Gross profit margin (gross profit as a percentage of revenues) for the
year ended December 31,
2013
was
35.2%
, compared with
36.4%
for the
year ended December 31,
2012
. Gross profit margin decreased as operating leverage from the higher MEMS sales volumes was more than offset by higher production transfer costs of $8.3 million, higher restructuring charges of $7.4 million, asset impairment and inventory charges related to more mature product lines of $6.9 million and new product ramp-up inefficiencies.
Non-GAAP gross profit for the
year ended December 31,
2013
was
$450.1 million
, compared with
$408.0 million
for the
year ended December 31,
2012
,
an increase
of
$42.1 million
or
10.3%
. Non-GAAP gross profit margin (non-GAAP gross profit as a percentage of revenues) for the
year ended December 31,
2013
was
37.1%
, as compared with
36.5%
for the
year ended December 31,
2012
. The increase was primarily driven by higher MEMS volumes offset by new product ramp-up inefficiencies.
Research and Development Expenses
Research and development expenses for the
years ended December 31,
2013
and
2012
were
$82.6 million
and
$77.3 million
, respectively. Research and development expenses as a percentage of revenues for the
years ended December 31,
2013
and
2012
were
6.8%
and
6.9%
, respectively. Shorter product life cycles due to the technological nature of our business, as well as continued design efforts for new customers, drove continuous product innovation and improvement over these periods as evidenced by several new product introductions by our customers and the continued growth in the handset market.
Selling and Administrative Expenses
Selling and administrative expenses for the
year ended December 31,
2013
were
$193.0 million
, compared with
$188.1 million
for the
year ended December 31,
2012
,
an increase
of
$4.9 million
or
2.6%
. Selling and administrative expenses as a percentage of revenues for the
year ended December 31,
2013
were
15.9%
, compared with
16.8%
for the
year ended December 31,
2012
. The increase was mainly due to higher labor costs and an overall increase to support the higher sales volume. Included in selling and administrative expenses were corporate allocations of $23.6 million and $26.1 million for the years ended December 31, 2013 and 2012, respectively, which represents administration of treasury, employee compensation and benefits, public and investor relations, internal audit, corporate income tax, supply chain and legal services.
38
Earnings Before Interest and Income Taxes and Adjusted Earnings Before Interest and Income Taxes
EBIT for the
year ended December 31,
2013
was
$143.5 million
, compared with
$135.4 million
for the
year ended December 31,
2012
,
an increase
of
$8.1 million
or
6.0%
. The increase was primarily due to higher MEMS volumes, which more than offset higher restructuring charges of $10.4 million, higher production transfer costs related to migration of operations into existing Asian lower-cost manufacturing facilities of $7.4 million and higher asset impairment and inventory charges related to more mature product lines of $5.2 million.
Adjusted EBIT for the
year ended December 31,
2013
were
$222.3 million
, compared with
$195.1 million
for the
year ended December 31,
2012
,
an increase
of
$27.2 million
or
13.9%
. Adjusted EBIT margin (adjusted EBIT as a percentage of revenues) for the
year ended December 31,
2013
was
18.3%
, as compared with
17.5%
for the
year ended December 31,
2012
. The increase was primarily due to higher MEMS volumes.
Interest Expense, net
Interest expense, net for the
year ended December 31,
2013
was
$42.0 million
, compared with
$56.5 million
for the
year ended December 31,
2012
,
a decrease
of
$14.5 million
or
25.7%
. The interest expense, net during the
years ended December 31,
2013
and
2012
relate to interest expense on the net notes payable to Dover that were settled during the fourth quarter of 2013 in anticipation of the Separation.
Benefit from Income Taxes
The effective tax rate ("ETR") for the
year ended December 31,
2013
was a
4.2%
benefit, compared with a
0.2%
benefit for the
year ended December 31,
2012
.
Diluted Earnings per Share
Diluted earnings per share was
$1.24
for the
year ended December 31,
2013
, compared with
$0.93
for the
year ended December 31,
2012
. The increase in diluted earnings per share was primarily driven by higher gross profit as a result of the increased sales volumes. In addition, we incurred lower interest expense as compared to the prior year.
39
Reconciliation of GAAP Financial Measures to Non-GAAP Financial Measures
|
(in millions, except share and per share amounts)
|
2013
|
2012
|
||||||
|
Gross profit
|
$
|
427.9
|
|
$
|
407.0
|
|
||
|
Fixed asset and related inventory charges
|
6.9
|
|
—
|
|
||||
|
Restructuring charges
|
7.8
|
|
0.4
|
|
||||
|
Production transfers costs
(1)
|
8.9
|
|
0.6
|
|
||||
|
Other
|
(1.4
|
)
|
—
|
|
||||
|
Non-GAAP gross profit
|
$
|
450.1
|
|
$
|
408.0
|
|
||
|
Net earnings
|
$
|
105.8
|
|
$
|
79.1
|
|
||
|
Interest expense, net
|
42.0
|
|
56.5
|
|
||||
|
Benefit from income taxes
|
(4.3
|
)
|
(0.2
|
)
|
||||
|
Earnings before interest and income taxes
|
143.5
|
|
135.4
|
|
||||
|
Stock-based compensation expense
|
2.0
|
|
1.9
|
|
||||
|
Intangibles amortization expense
|
45.9
|
|
48.5
|
|
||||
|
Fixed asset and related inventory charges
|
6.9
|
|
1.7
|
|
||||
|
Restructuring charges
|
16.3
|
|
5.9
|
|
||||
|
Production transfers costs
(1)
|
9.1
|
|
1.7
|
|
||||
|
Other
|
(1.4
|
)
|
—
|
|
||||
|
Adjusted earnings before interest and income taxes
|
$
|
222.3
|
|
$
|
195.1
|
|
||
(1)
Production transfer costs represent one-time and duplicate costs incurred to migrate manufacturing to new or existing facilities in Asia. These amounts are included in the corresponding gross profit and earnings before interest and income taxes for each period presented.
40
Segment Results of Operations for the
Year
Ended
December 31, 2014
Compared with the
Year
Ended
December 31, 2013
and the
Year
Ended
December 31, 2012
Mobile Consumer Electronics
|
|
Years Ended December 31,
|
|||||||||||||||||
|
(in millions)
|
2014
|
Percent of Revenues
|
2013
|
Percent of Revenues
|
2012
|
Percent of Revenues
|
||||||||||||
|
Revenues
|
$
|
684.1
|
|
$
|
777.2
|
|
$
|
670.4
|
|
|||||||||
|
Operating (loss) earnings
|
$
|
(74.7
|
)
|
(10.9)%
|
$
|
122.5
|
|
15.8%
|
$
|
102.7
|
|
15.3%
|
||||||
|
Other (income) expense, net
|
(0.1
|
)
|
0.5
|
|
2.3
|
|
||||||||||||
|
(Loss) earnings before interest and income taxes
|
$
|
(74.6
|
)
|
(10.9)%
|
$
|
122.0
|
|
15.7%
|
$
|
100.4
|
|
15.0%
|
||||||
|
Stock-based compensation expense
|
1.6
|
|
0.3
|
|
0.2
|
|
||||||||||||
|
Intangibles amortization expense
|
31.0
|
|
31.3
|
|
34.5
|
|
||||||||||||
|
Fixed asset and related inventory charges
|
39.5
|
|
6.9
|
|
1.7
|
|
||||||||||||
|
Restructuring charges
|
22.0
|
|
7.3
|
|
1.3
|
|
||||||||||||
|
Production transfer costs
(1)
|
12.4
|
|
3.8
|
|
1.7
|
|
||||||||||||
|
Other
(2)
|
15.0
|
|
—
|
|
—
|
|
||||||||||||
|
Adjusted earnings before interest and income taxes
|
$
|
46.9
|
|
6.9%
|
$
|
171.6
|
|
22.1%
|
$
|
139.8
|
|
20.9%
|
||||||
|
(1)
Production transfer costs represent one-time and duplicate costs incurred to migrate manufacturing to new or existing facilities in Asia. These amounts are included in earnings before interest and income taxes for each period presented.
|
||||||||||||||||||
|
(2)
Other represents a charge related to the resolution of customer claims for products no longer produced.
|
||||||||||||||||||
Revenues
2014
Versus
2013
MCE revenues were
$684.1 million
for the
year ended December 31,
2014
, compared with
$777.2 million
for the
year ended December 31,
2013
,
a decrease
of
$93.1 million
or
12.0%
. Revenues were negatively impacted by a hold on production and shipments of one new version of our MEMS microphone for a specific platform at one key OEM customer due to a low level defect beginning in the third quarter of 2014. In February 2015, the OEM customer provided us notification that our microphone for this platform was requalified. We expect to resume production and related shipments no later than the second quarter of 2015. As a result, we expect this microphone issue will continue to negatively impact revenues in 2015 due to lost shipments and price reductions on this microphone. The decrease in revenues for the year ended December 31, 2014 compared to the year ended December 31, 2103 was also due to lower average selling prices on mature products, reduced shipments to three OEM customers in connection with their lower share of the handset market and a design change at one smartphone OEM customer. The decreases in revenues were partially offset by an increase in revenues from other mobile customers, including Chinese OEMs, who gained market share year-over-year.
2013
Versus
2012
MCE revenues were
$777.2 million
for the
year ended December 31,
2013
, compared with
$670.4 million
for the
year ended December 31,
2012
,
an increase
of
$106.8 million
or
15.9%
. Revenues increased primarily from strong demand for components serving the smartphone market, including the continued trend for multi-microphone product offerings, with key OEM customers incorporating up to three microphones per device. New smartphone product launches as well as one OEM customer gaining share in the smartphone market drove a significant portion of the MCE volume growth. Foreign currency translation also had a negligible favorable impact in the current year. The increases in revenues were partially offset by delays related to OEM smartphone releases, as well as the impact of market share losses by two other key smartphone OEM customers.
41
Operating (Loss) Earnings and Adjusted Earnings Before Interest and Income Taxes
2014
Versus
2013
MCE operating (loss) earnings was
$(74.7) million
for the
year ended December 31,
2014
, compared with
$122.5 million
for the
year ended December 31,
2013
,
a decrease
of
$197.2 million
. This decrease was primarily due to lower average selling prices on mature products and lost production and shipments, as well as warranty and inventory charges, related to the MEMS microphone that was placed on hold. Operating earnings in 2015 is expected to be negatively impacted due to lost production, lower shipments and pricing reductions on this microphone. The decrease in operating earnings for the year ended December 31, 2014 compared to the year ended December 31, 2103 was also driven by higher fixed asset accelerated depreciation and related inventory charges, restructuring charges and production transfer costs of
$55.9 million
, mainly associated with the cessation of manufacturing operations at our Vienna, Austria facility and shorter product life cycles at our Beijing, China facility. Lastly, the decrease was due to ramp-up costs associated with new product introductions, a
$15.0 million
charge related to the resolution of customer claims for products no longer produced and increased legal expenses primarily in conjunction with the GoerTek intellectual property litigation. These decreases were partially offset by cost savings from the Vienna restructuring action.
MCE adjusted EBIT was
$46.9 million
for the
year ended December 31,
2014
, compared with
$171.6 million
for the
year ended December 31,
2013
,
a decrease
of
124.7 million
. Adjusted EBIT margin for the
year ended December 31,
2014
was
6.9%
, compared with
22.1%
for the
year ended December 31,
2013
. The decrease was primarily due to lower average selling prices on mature products, the impacts of the MEMS microphone that was placed on hold, ramp-up costs associated with new product introductions and increased legal expenses primarily in conjunction with the GoerTek intellectual property litigation. These decreases were partially offset by cost savings from the Vienna restructuring action.
2013
Versus
2012
MCE operating earnings were
$122.5 million
for the
year ended December 31,
2013
, compared with
$102.7 million
for the
year ended December 31,
2012
,
an increase
of
$19.8 million
or
19.3%
. This increase was primarily driven by higher sales volumes, benefits from productivity initiatives and cost savings from restructuring actions. These increases more than offset the impacts of lower average selling prices on mature products, higher legal expenses, higher investment in research and development, higher restructuring charges relating to cost reduction actions in the speaker and receiver facilities of
$6.0 million
, higher fixed asset impairment and inventory charges related to more mature product lines totaling
$5.2 million
and higher labor costs due to inflation in China and Malaysia.
MCE adjusted EBIT was
$171.6 million
for the
year ended December 31,
2013
, compared with
$139.8 million
for the
year ended December 31,
2012
,
an increase
of
$31.8 million
. Adjusted EBIT margin for the
year ended December 31,
2013
was
22.1%
, compared with
20.9%
for the
year ended December 31,
2012
. This increase was primarily driven by higher sales volumes, benefits from productivity initiatives and cost savings from restructuring actions. These increases more than offset the impacts of lower average selling prices on mature products, higher legal expenses of $7.9 million, higher investment in research and development of $7.2 million and higher labor costs due to inflation in China and Malaysia.
42
Specialty Components
|
|
Years Ended December 31,
|
|||||||||||||||||
|
(in millions)
|
2014
|
Percent of Revenues
|
2013
|
Percent of Revenues
|
2012
|
Percent of Revenues
|
||||||||||||
|
Revenues
|
$
|
457.2
|
|
$
|
437.7
|
|
447.7
|
|
||||||||||
|
Operating earnings
|
$
|
69.5
|
|
15.2%
|
$
|
64.5
|
|
14.7%
|
77.2
|
|
17.2%
|
|||||||
|
Other (income) expense, net
|
—
|
|
(0.5
|
)
|
0.1
|
|
||||||||||||
|
Earnings before interest and income taxes
|
$
|
69.5
|
|
15.2%
|
$
|
65.0
|
|
14.9%
|
$
|
77.1
|
|
17.2%
|
||||||
|
Stock-based compensation expense
|
1.7
|
|
0.8
|
|
0.8
|
|
||||||||||||
|
Intangibles amortization expense
|
11.5
|
|
14.6
|
|
14.0
|
|
||||||||||||
|
Restructuring charges
|
7.6
|
|
9.0
|
|
4.6
|
|
||||||||||||
|
Production transfer costs
(1)
|
12.8
|
|
5.3
|
|
—
|
|
||||||||||||
|
Other
|
—
|
|
(1.4
|
)
|
—
|
|
||||||||||||
|
Adjusted earnings before interest and income taxes
|
$
|
103.1
|
|
22.6%
|
$
|
93.3
|
|
21.3%
|
$
|
96.5
|
|
21.6%
|
||||||
|
(1)
Production transfer costs represent one-time and duplicate costs incurred to migrate manufacturing to new or existing facilities in Asia. These amounts are included in earnings before interest and income taxes for each period presented.
|
||||||||||||||||||
Revenues
2014
Versus
2013
SC revenues were
$457.2 million
for the
year ended December 31,
2014
, compared with
$437.7 million
for the
year ended December 31,
2013
,
an increase
of
$19.5 million
or
4.5%
. The increase in revenues was primarily due to improved demand for precision devices as a result of strength in the wireless communication infrastructure market, particularly in China, as well as increased market penetration. In addition, revenues increased due to new product introductions and broad-based demand among our hearing health customers. These increases in revenues were partially offset by lower pricing.
2013
Versus
2012
SC revenues were
$437.7 million
for the
year ended December 31,
2013
, compared with
$447.7 million
for the
year ended December 31,
2012
,
a decrease
of
$10.0 million
or
2.2%
. The decrease in revenues was primarily due to weakness in the domestic military markets resulting from government funding uncertainties, reduced demand for acoustic components used in specialty headset applications due to overstock and inventory corrections by the OEM customers and lower pricing. These decreases in revenues were partially offset by higher demand from telecom customers serving the anticipated build out of wireless infrastructure, particularly in China.
Operating Earnings and Adjusted Earnings Before Interest and Income Taxes
2014
Versus
2013
SC operating earnings were
$69.5 million
for the
year ended December 31,
2014
, compared with
$64.5 million
for the
year ended December 31,
2013
,
an increase
of
$5.0 million
. The increase was primarily due to higher sales volumes, cost savings from restructuring actions taken in the prior year and lower intangibles amortization expense. These increases were partially offset by lower pricing and higher production transfer costs of
$7.5 million
, mainly driven by the transfer of our hearing health business into a new, lower-cost Asian manufacturing facility.
43
SC adjusted EBIT was
$103.1 million
for the
year ended December 31,
2014
, compared with
$93.3 million
for the
year ended December 31,
2013
,
an increase
of
$9.8 million
. Adjusted EBIT margin for the
year ended December 31,
2014
was
22.6%
, compared with
21.3%
for the
year ended December 31,
2013
. The increase was primarily due to higher sales volumes and cost savings from restructuring actions taken in the prior year and lower intangibles amortization expense, partially offset by lower pricing.
2013
Versus
2012
SC operating earnings were
$64.5 million
for the
year ended December 31,
2013
, compared with
$77.2 million
for the
year ended December 31,
2012
,
a decrease
of
$12.7 million
. The decrease was due to $9.7 million in higher restructuring and production transfer costs relating to the continued migration of the segment's U.K.-based capacitor production into existing Asian manufacturing facilities and headcount reductions within the segment's German and North American operations that serve the telecom infrastructure market to better align the operations with current market dynamics, lower volumes and lower pricing. These decreases were partially offset by productivity initiatives as well as cost savings from the aforementioned restructuring programs and other strategic initiatives.
SC adjusted EBIT was
$93.3 million
for the
year ended December 31,
2013
, compared with
$96.5 million
for the
year ended December 31,
2012
,
a decrease
of
$3.2 million
. Adjusted EBIT margin for the
year ended December 31,
2013
was
21.3%
, compared with
21.6%
for the
year ended December 31,
2012
. The decrease was due to lower volumes and lower pricing, partially offset by productivity initiatives as well as cost savings from the aforementioned restructuring programs and other strategic initiatives.
44
Financial Condition
Historically, we have generated and expect to continue to generate positive cash flow from operations. As a result of the Separation, we no longer participate in cash management and funding arrangements with our Former Parent. Historically, we have utilized these arrangements to fund significant expenditures, such as manufacturing capacity expansion and acquisitions. Our ability to fund our operations and capital needs will depend on our ongoing ability to generate cash from operations and access to capital markets. We believe that our future cash flow from operations and access to capital markets will provide adequate resources to fund our working capital needs, dividends (if any), capital expenditures and strategic investments. We have secured a revolving line of credit in the United States from a syndicate of commercial banks to provide additional liquidity. Furthermore, if we were to require additional cash in the United States above and beyond our domestic cash on the balance sheet, the free cash flow generated by the domestic businesses and availability under our revolving credit facility, we would most likely seek to raise long-term financing through the U.S. debt or bank markets.
Our ability to make payments on and to refinance our indebtedness, including third party debt incurred in connection with the Separation, as well as any debt that we may incur in the future, will depend on our ability in the future to generate cash from operations, financings or asset sales and the tax consequences of our repatriation of overseas cash. Due to the global nature of our operations, a significant portion of our cash is held outside the Unites States. Our cash and cash equivalents totaled
$55.2 million
and
$105.6 million
at
December 31, 2014
and
2013
, respectively. Of these amounts, cash held by our non-U.S. operations totaled
$53.6 million
and $95.0 million as of
December 31, 2014
and
2013
, respectively.
We hold the vast majority of our cash and operating cash flows outside the United States, since this cash is needed by our foreign subsidiaries to fund our capital expenditures and growth plans, as our manufacturing locations are primarily based outside of the United States. We have not provided for U.S. income taxes on
$1.8 billion
of undistributed earnings of foreign subsidiaries, because we intend to permanently reinvest these earnings outside the United States
We generate cash flow in the United States primarily through ongoing product sales, management fees and royalty income and we utilize cash in the United States primarily for expenses relating to operations and corporate functions, including management, administration and research and development. We have generated approximately $36.4 million, $43.7 million and $20.0 million of adjusted operating cash flow in the United States, as defined below, during the years ended
December 31, 2014
,
2013
and
2012
, respectively, which has been sufficient to meet our domestic cash needs in each such year, as most of our capital expenditures and expenses occurred outside of the United States during those years. Adjusted operating cash flow in the United States is not presented in accordance with GAAP and is defined as operating cash flow generated within the United States, net of corporate expense allocations, but excluding net U.S. interest expense related to intercompany notes payable to our Former Parent of $18.4 million and $22.1 million for the years ended December 31,
2013
and
2012
, respectively. The adjusted operating cash flow in the United States amounts exclude U.S. interest expense related to intercompany net notes payable to our Former Parent, as these notes were settled prior to the Separation and these amounts are not necessarily representative of interest payments related to our future debt. We project that our cash generation within the United States for the foreseeable future will be self-sustaining to meet all estimated U.S. expenditures and, as such, we do not anticipate the need to repatriate the earnings of our foreign subsidiaries in order to satisfy our domestic cash needs, including the service of any third party debt incurred in the United States.
Our management will continue to reassess our need to repatriate the earnings of our foreign subsidiaries.
45
Cash Flow Summary
Cash flows from operating, investing and financing activities as reflected in our Consolidated Statements of Cash Flows are summarized in the following table:
|
|
Years Ended December 31,
|
|||||||||||
|
(in millions)
|
2014
|
2013
|
2012
|
|||||||||
|
Net cash flows provided by (used in):
|
|
|
||||||||||
|
Operating activities
|
$
|
115.5
|
|
$
|
174.3
|
|
$
|
175.1
|
|
|||
|
Investing activities
|
(93.1
|
)
|
(108.6
|
)
|
(101.2
|
)
|
||||||
|
Financing activities
|
(71.4
|
)
|
29.3
|
|
(90.0
|
)
|
||||||
|
Effect of exchange rate changes on cash and cash equivalents
|
(1.4
|
)
|
0.3
|
|
0.1
|
|
||||||
|
Net (decrease) increase in cash and cash equivalents
|
$
|
(50.4
|
)
|
$
|
95.3
|
|
$
|
(16.0
|
)
|
|||
Operating Activities
Cash provided by operating activities decreased
$58.8 million
compared to 2013, primarily due to lower revenues and increased restructuring and production transfer related expenses. This was partially offset by a lower investment in adjusted working capital (a non-GAAP measure calculated as receivables, net of allowances, plus net inventories, less accounts payable) of
$32.2 million
. In addition, other changes in operating assets and liabilities, mainly deferred taxes and accrued other expenses, increased operating cash flows.
Cash provided by operating activities in 2013 decreased
$0.8 million
compared to 2012, due to higher investments in adjusted working capital (a non-GAAP measure calculated as receivables, net of allowances, plus net inventories, less accounts payable) of
$22.8 million
generally due to the impact of higher revenue levels and timing of vendor payments. In addition, other changes in operating assets and liabilities, mainly deferred taxes, decreased operating cash flows. These reductions in operating cash flows were mitigated by higher net earnings before depreciation and amortization of
$42.8 million
, which was the result of increased sales volumes during the year that more than offset higher restructuring and production transfer costs.
Investing Activities
Cash used in investing activities results primarily from cash outflows for capital expenditures, the capitalization of patent defense costs and acquiring non-controlling interests, partially offset by selling of non-controlling interests and proceeds from the sale of property, plant and equipment.
Capital spending.
Capital expenditures, primarily to support capacity expansion, innovation and cost savings, were
$83.9 million
,
$105.2 million
and
$132.1 million
, or
7.4%
,
8.7%
and
11.8%
as a percentage of revenue, for the years ended
December 31, 2014
,
2013
and
2012
, respectively. The large drivers of the capital expenditures have been ongoing investment in MEMS manufacturing capacity expansion to support growth in the handset market as well as manufacturing footprint optimization projects. Construction and customization of a new manufacturing facility in Cebu, Philippines started in 2012 and continued throughout 2013. Fully operational in 2014, this 215,000 square foot facility supports several growth and productivity initiatives for us.
Capitalization of patent defense costs.
We capitalize external legal costs incurred in the defense of our patents when it is believed that a significant, discernible increase in value will result from the defense and a successful outcome of the legal action is probable. These costs are amortized over the remaining estimated useful life of the patent, which is typically seven to ten years. During the year ended
December 31, 2014
,
2013
and
2012
we paid
$16.0 million
,
$8.6 million
and
$13.1 million
, respectively, in gross legal costs related to the defense of our patents. Capitalized patent defense costs increased in 2014 due primarily to legal expenses incurred in connection with the GoerTek intellectual property litigation.
Acquisitions and sales of investments.
We paid
$8.0 million
and
$5.0 million
during the years ended December 31, 2014 and 2012, respectively, to acquire a non-controlling interest in a MEMS timing device company and subsequently received proceeds of
$14.5 million
during the year ended December 31, 2014 from the sale of our non-controlling interest in the same MEMS timing device company.
46
Financing Activities
The cash used in financing activities during the
year
ended
December 31, 2014
was primarily due to cash payments to our Former Parent as a result of the Separation, partially offset by proceeds from entering into a debt agreement. For additional information on our debt,
see Note 8. Borrowings and Lines of Credit
of the notes to our Consolidated Financial Statements under Item 8, "Financial Statements and Supplementary Data."
Liquidity and Capital Resources
Free Cash Flow
In addition to measuring our cash flow generation and usage based upon the operating, investing and financing classifications included in the Consolidated Statements of Cash Flows, we also measure free cash flow and free cash flow as a percentage of revenue. Free cash flow is calculated as cash flow provided by operating activities less capital expenditures. Our management believes these measures are useful in measuring our cash generated from operations and cash generated from operations as a percentage of revenue, that is available to repay debt, pay dividends, fund acquisitions and repurchase Knowles’ common stock. Free cash flow and free cash flow as a percentage of revenue are not presented in accordance with GAAP and may not be comparable to similarly titled measures used by other companies in our industry. As such, free cash flow and free cash flow as a percentage of revenue should not be considered in isolation from, or as an alternative to, any other performance measures determined in accordance with GAAP.
Our businesses, while not having significant seasonality, tend to have stronger revenue in the third and fourth quarters of each fiscal year. This is particularly true of those businesses that serve the consumer electronics market. Our businesses tend to have short product cycles due to the highly technical nature of the industries they serve, which can result in new OEM product launches that can impact quarterly revenues, earnings and cash flow.
The following table reconciles our free cash flow to cash flow provided by operating activities:
|
(in millions)
|
Years Ended December 31,
|
|||||||||||
|
Free Cash Flow
|
2014
|
2013
|
2012
|
|||||||||
|
Cash flow provided by operating activities
|
$
|
115.5
|
|
$
|
174.3
|
|
$
|
175.1
|
|
|||
|
Less: Capital expenditures
|
(83.9
|
)
|
(105.2
|
)
|
(132.1
|
)
|
||||||
|
Free cash flow
|
$
|
31.6
|
|
$
|
69.1
|
|
$
|
43.0
|
|
|||
|
Free cash flow as a percentage of revenue
|
2.8
|
%
|
5.7
|
%
|
3.8
|
%
|
||||||
In
2014
, we generated free cash flow of
$31.6 million
, representing
2.8%
of revenue, compared to free cash flow in
2013
of
$69.1 million
, representing
5.7%
of revenue and free cash flow in
2012
of
$43.0 million
, or
3.8%
of revenue. The decrease in free cash flow in
2014
compared to
2013
and 2012 was primarily due to a reduction in earnings. The higher free cash flow in 2013 compared to 2012 is primarily due to lower capital expenditures in 2013. The capital expenditures in 2012 mainly related to spending at our Cebu, Philippines facility, as well as a higher level of investment to expand capacity and support new product designs to meet the demands in the acoustics market.
In
2015
, we expect capital expenditures to be in the range of 6.0% to 7.0% of revenue. Additionally, the interest expense related to our net notes payable to our Former Parent that were settled in connection with the Separation is reflected in historical net earnings, but is not necessarily representative of our post-Separation debt-related interest.
Contingent Obligations
We are involved in various legal proceedings, claims and investigations arising in the normal course of business. Legal contingencies are discussed in
Note 11. Commitments and Contingent Liabilities
of the notes to our Consolidated Financial Statements under Item 8, "Financial Statements and Supplementary Data."
47
Contractual Obligations and Off-Balance Sheet Arrangements
A summary of our contractual obligations and commitments as of
December 31, 2014
and the years when these obligations are expected to be due is as follows:
|
(in millions)
|
Payments Due by Period
|
|||||||||||||||||||
|
Total
|
Less than 1 Year
|
1-3 Years
|
3-5 Years
|
More than 5 Years
|
||||||||||||||||
|
Short-term and long-term debt
(1)
|
$
|
400.0
|
|
$
|
15.0
|
|
$
|
60.0
|
|
$
|
325.0
|
|
$
|
—
|
|
|||||
|
Operating leases
(2)
|
25.5
|
|
11.7
|
|
5.1
|
|
3.5
|
|
5.2
|
|
||||||||||
|
Purchase obligations
(3)
|
29.6
|
|
29.6
|
|
—
|
|
—
|
|
—
|
|
||||||||||
|
Rental commitments
(4)
|
28.2
|
|
3.1
|
|
5.9
|
|
5.4
|
|
13.8
|
|
||||||||||
|
Capital leases
(5)
|
8.9
|
|
1.2
|
|
1.9
|
|
1.8
|
|
4.0
|
|
||||||||||
|
Post-retirement benefits
(6)
|
3.5
|
|
3.3
|
|
—
|
|
—
|
|
0.2
|
|
||||||||||
|
Total obligations
(7)
|
$
|
495.7
|
|
$
|
63.9
|
|
$
|
72.9
|
|
$
|
335.7
|
|
$
|
23.2
|
|
|||||
|
(1)
Primarily relates to the maturity of indebtedness under our Revolving Credit Facility and Term Loan due in January 2019. Does not give effect to any early repayment of or future amounts which may be drawn under the Revolving Credit Facility.
|
|
(2)
Represents off-balance sheet commitments related to operating leases. See Note 11. Commitments and Contingent Liabilities of the notes to our Consolidated Financial Statements under Item 8, "Financial Statements and Supplementary Data" for additional information.
|
|
(3)
Represents off-balance sheet commitments for purchase obligations related to open purchase orders with our vendors.
|
|
(4)
Represents off-balance sheet rental commitments related to an operating and capital lease that was entered into in September 2013 but for which the lease term will not begin until the first quarter of 2015. See Note 11. Commitments and Contingent Liabilities of the notes to our Consolidated Financial Statements under Item 8, "Financial Statements and Supplementary Data" for additional information.
|
|
(5)
Represents obligations related to capital leases. See Note 11. Commitments and Contingent Liabilities of the notes to our Consolidated Financial Statements under Item 8, "Financial Statements and Supplementary Data" for additional information.
|
|
(6)
Amounts represent estimated benefit payments under our subsidiary's unfunded non-U.S. defined benefit pension plan. In addition, defined benefit plan contributions of $1.5 million were included for 2015 only as they cannot be determined beyond 2015. See Note 12. Employee Benefit Plans of the notes to our Consolidated Financial Statements under Item 8, "Financial Statements and Supplementary Data" for additional information.
|
|
(7)
The liability related to unrecognized tax benefits has been excluded from the contractual obligations table because a reasonable estimate of the timing and amount of cash out flows from future tax settlements cannot be determined. See Note 9. Income Taxes of the notes to our Consolidated Financial Statements under Item 8, "Financial Statements and Supplementary Data" for additional information.
|
Borrowings and Lines of Credit
On January 27, 2014, we entered into a
$200.0 million
five-year senior secured revolving credit facility, as well as a
$300.0 million
five-year senior secured term loan facility pursuant to the Original Credit Agreement, which are referred to collectively as the “Credit Facilities.” In connection with the Separation, we incurred
$100.0 million
of borrowings under the revolving credit facility and
$300.0 million
of borrowings under the term loan facility, in each case to finance a cash payment to Dover immediately prior to the Separation.
On December 31, 2014, we amended our Credit Facilities to (i) increase the amount of the revolving credit facility in the Original Credit Agreement to
$350.0 million
from
$200.0 million
, (ii) increase the amount of the letter of credit subfacility in the Original Credit Agreement to
$50.0 million
from
$25.0 million
, (iii) eliminated the swing line subfacility in the amount of up to
$35.0 million
in the Original Credit Agreement and (iv) reduced to
$100.0 million
from
$250.0 million
the amount of additional incremental revolving or term loans in the Original Credit Agreement. All other terms and conditions of the Credit Facilities remain essentially the same.
Up to $100.0 million of the revolving credit facility is available for borrowings in euros, British pounds sterling and other currencies requested by us and agreed to by the lenders.
48
Loans outstanding under the term facility will mature on January 27, 2019 and will amortize in equal quarterly installments in annual amounts (expressed as percentages of the loans made under the term facility on the initial funding date of the term facility, which was February 28, 2014) as set forth below, with the remaining balance due on the final maturity date of the term facility.
|
Year after debt execution date
|
Per Annum Amount
|
|
|
1
|
0.0%
|
|
|
2
|
5.0%
|
|
|
3
|
10.0%
|
|
|
4
|
10.0%
|
|
|
5
|
10.0%
|
|
We have the right to prepay borrowings under the facilities and to reduce the unutilized portion of the revolving credit facility, in each case, at any time without premium or penalty (except for Eurodollar breakage fees, if any). We are required to prepay borrowings under the term facility with 100% of the net cash proceeds of sales or dispositions of assets or other property (including, among others, the proceeds of issuances of equity interests by subsidiaries), subject to certain reinvestment rights and other exceptions. The interest rates under the facilities are variable based on LIBOR or an alternate base rate at the time of the borrowing and our leverage as measured by a consolidated total indebtedness to consolidated EBITDA ratio and initially are set at LIBOR plus 1.50%. A commitment fee will accrue on the average daily unused portion of the revolving facility at the rate of
0.2%
to
0.4%
, initially set at 0.25%. As we are exposed to market risk for changes in interest rates based on the structure of our Credit Facilities, we entered into an interest rate swap on November 12, 2014 to convert variable interest rate payments into a fixed rate on a notional amount of
$100.0 million
of debt for monthly interest payments starting in January 2016 and ending in July 2018.
The facilities contain customary covenants, which include, among others, limitations or restrictions on the incurrence of indebtedness, the incurrence of liens and entry into sales and leaseback transactions, mergers, transfers of all or substantially all assets, transactions with affiliates and certain transactions limiting the ability of subsidiaries to pay dividends, in each case, subject to certain exceptions. The facilities also include a requirement, to be tested quarterly, that we maintain both (i) a minimum ratio of consolidated EBITDA to consolidated interest expense of
3.25
to 1.0 and (ii) a maximum ratio of consolidated total indebtedness to consolidated EBITDA of
3.25
to 1.0. For these ratios, consolidated EBITDA and consolidated interest expense are calculated in a manner defined in the debt agreement. The facilities include customary events of defaults. We were in compliance with these covenants as of December 31, 2014.
Risk Management
We are exposed to certain market risks which exist as part of our ongoing business operations, including changes in currency exchange rates, the dependence on key customers and price volatility for certain commodities. We do not engage in speculative or leveraged transactions and do not hold or issue financial instruments for trading purposes.
Foreign Currency Exposure
We conduct business through our subsidiaries in many different countries and fluctuations in currency exchange rates could have a significant impact on the reported results of operations, which are presented in U.S. dollars. A significant and growing portion of our products are manufactured in lower-cost locations and sold in various countries. Cross-border transactions, both with external parties and intercompany relationships, could result in increased foreign exchange exposures. A weakening of foreign currencies relative to the U.S. dollar would adversely affect the U.S. dollar value of the Company’s foreign currency-denominated sales, but would be beneficial to the cost of materials, products and services purchased overseas. A strengthening of foreign currencies relative to the U.S. dollar would positively affect the U.S. dollar value of the Company’s foreign currency-denominated sales, but adversely would have a negative effect on the cost of materials, products and services purchased overseas. Our foreign currency exposure is primarily driven by changes in the Chinese renminbi (yuan), the euro, the Malaysian ringgit and the Philippine peso. Based on our current sales and manufacturing activity, a sustained 10% weakening of the U.S. dollar for a period of one year would reduce our operating results by approximately $40.8 million pre-tax.
49
Dependence on Key Customers; Concentration of Credit
The loss of any key customer and our inability to replace revenues provided by a key customer may have a material adverse effect on our business and financial condition. For the year ended December 31, 2014, Apple, Inc. and Samsung Group accounted for approximately
20%
and
12%
, respectively, of our total revenue. For the year ended December 31, 2013, Apple, Inc. and Samsung Group accounted for approximately
25%
and
15%
, respectively, of our total revenue. For the year ended December 31, 2012, Apple, Inc. accounted for approximately
18%
of our total revenue. No other customer accounted for more than 10% of total revenues during these periods. If a key customer fails to meet payment obligations, our operating results and financial condition could be adversely affected.
Commodity Pricing
We use a wide variety of raw materials, primarily metals and semi-processed or finished components, which are generally available from a number of sources. While the required raw materials are generally available, commodity pricing for various precious metals, such as palladium and gold, and “rare earth” materials (dysprosium and neodymium), fluctuates. As a result, our operating results are exposed to such fluctuations. Although some cost increases may be recovered through increased prices to customers if commodity prices trend upward, we attempt to control such costs through fixed-price contracts with suppliers and various other programs, such as our global supply chain activities.
Interest Rates
A hypothetical 100 basis point change in interest rates affecting our external variable rate borrowings as of December 31, 2014 would be $4.0 million on a pre-tax basis.
Critical Accounting Policies
Our Consolidated Financial Statements are based on the application of generally accepted accounting principles in the United States of America (“GAAP”). GAAP requires the use of estimates, assumptions, judgments and subjective interpretations of accounting principles that have an impact on the assets, liabilities, revenue and expense amounts we report. These estimates can also affect supplemental information contained in our public disclosures, including information regarding contingencies, risk and our financial condition. The significant accounting policies used in the preparation of our Consolidated Financial Statements are discussed in Note 1. Summary of Significant Accounting Policies of the notes to the Consolidated Financial Statements under Item 8, "Financial Statements and Supplementary Data." The accounting assumptions and estimates discussed in the section below are those that we consider most critical to an understanding of our financial statements because they inherently involve significant judgments and estimates. We believe our use of estimates and underlying accounting assumptions conforms to GAAP and is consistently applied. We review valuations based on estimates for reasonableness on a consistent basis.
Revenue Recognition:
Revenue is recognized when all of the following conditions are satisfied: a) persuasive evidence of an arrangement exists, b) price is fixed or determinable, c) collectability is reasonably assured and d) delivery has occurred or services have been rendered. The majority of our revenue is generated through the manufacture and sale of a broad range of specialized products and components, with revenue recognized upon transfer of title and risk of loss. We do not have significant service revenue, licensing income, or multiple deliverable arrangements. We recognize third-party licensing or royalty income as revenue over the related contract term. Revenue is recognized net of customer discounts, rebates and returns. Rebates are recognized over the contract period based on expected revenue levels. Sales discounts and rebates totaled
$14.3 million
,
$8.3 million
and
$14.2 million
for the years ended December 31,
2014
,
2013
and
2012
, respectively. Returns and allowances totaled
$10.3 million
,
$11.2 million
and
$4.6 million
for the years ended December 31,
2014
,
2013
and
2012
, respectively.
Inventories:
Inventories are stated at the lower of cost or market, determined on the first-in, first-out (FIFO) basis. The value of inventory may decline as a result of surplus inventory, price reductions, or technological obsolescence. It is our policy to carry reserves against the carrying value of inventory when items have no future demand (obsolete inventory) and additionally, where inventory items on hand have demand, yet have insufficient forecasted activity to consume the entire stock within a reasonable period. It is our policy to carry reserves against the carrying value of such at-risk inventory items after considering the nature of the risk and any mitigating factors.
50
Goodwill and Indefinite-Lived Assets:
Goodwill represents the excess of purchase consideration over the fair value of the net assets of businesses acquired. Goodwill and certain other intangible assets deemed to have indefinite lives (primarily trademarks) are not amortized. Instead, goodwill and indefinite-lived intangible assets are tested for impairment at least annually or more frequently if indicators of impairment exist. We conduct our annual impairment evaluation in the fourth quarter of each year and changed our annual impairment evaluation date to October 1 from December 31 during 2014. Recoverability of goodwill is measured at the reporting unit level and determined using a two-step process. We identified four reporting units for our annual goodwill impairment test. Step one of the test compares the fair value of each reporting unit using a discounted cash flow method to its book value. This method uses our market assumptions including projections of future cash flows, determinations of appropriate discount rates and other assumptions which are considered reasonable and inherent in the discounted cash flow analysis. The projections are based on historical performance and future estimated results. These assumptions require significant judgment and actual results may differ from assumed and estimated amounts. The fair value of all of our reporting units determined in step one exceeded the carrying values by at least 20%. A reduction in the estimated fair value of the reporting units could trigger an impairment in the future. We cannot predict the occurrence of certain events or changes in circumstances that might adversely affect the carrying value of goodwill and intangible assets. Step two, which compares the book value of the goodwill to its implied fair value, was not necessary since there were no indicators of potential impairment from step one during any of the periods presented.
Similar to goodwill, in testing its other indefinite lived intangible assets for impairment, we use a discounted cash flow method to calculate and compare the fair value of the intangible asset to its book value. This method uses our market assumptions which are considered reasonable and inherent in the discounted cash flow analysis. Any excess of carrying value over the estimated fair value is recognized as an impairment loss.
No
impairment of indefinite lived intangibles was indicated for the years ended
December 31, 2014
,
2013
or
2012
.
See Note 5. Goodwill and Other Intangible Assets
of the notes to our Consolidated Financial Statements under Item 8, "Financial Statements and Supplementary Data" for additional information on goodwill and indefinite-lived assets.
Other Intangible and Long-Lived Assets:
Other intangible assets with determinable lives consist primarily of customer relationships, unpatented technology, patents and trademarks and are amortized over their estimated useful lives, ranging from
5
to
15
years. We rely on patents and proprietary technology and seek patent protection for products and methods. We capitalize external legal costs incurred in the defense of our patents when it is believed that a significant, discernible increase in value will result from the defense and a successful outcome of the legal action is probable. These costs are amortized over the remaining estimated useful life of the patent, which is typically
7
to
10
years. We assess the future economic benefit and/or the successful outcome of legal action related to patent defense involves considerable management judgment and a different outcome could result in material write-offs of the carrying value of these assets. Other intangible assets with determinable lives at December 31,
2014
,
2013
and
2012
totaled $238.3 million, $286.3 million and $312.8 million, respectively. During the years ended December 31,
2014
,
2013
and
2012
, we capitalized
$12.7
million,
$11.4
million and
$13.9
million, respectively, in legal costs related to the defense of our patents.
Long-lived assets (including intangible assets with determinable lives) are reviewed for impairment whenever events or changes in circumstances indicate that the carrying amount of an asset may not be recoverable. If an indicator of impairment exists for any grouping of assets, an estimate of undiscounted future cash flows is produced and compared to its carrying value. If an asset is determined to be impaired, the loss is measured by the excess of the carrying amount of the asset over its fair value as determined by an estimate of discounted future cash flows. In the fourth quarter of
2013
, we recorded asset impairment charges related to more mature product lines totaling
$4.3 million
.
Income Taxes and Deferred Tax Balances:
For purposes of the Consolidated Financial Statements, our income tax expense and deferred tax balances have been estimated as if we filed income tax returns on a stand-alone basis separate from our Former Parent. As a stand-alone entity, our deferred taxes and effective tax rate may differ from those of our Former Parent in the historical periods.
We record a provision for income taxes for the anticipated tax consequences of the reported results of operations using the asset and liability method. Under this method, we recognize deferred tax assets and liabilities for the expected future tax consequences of temporary differences between the financial reporting and tax bases of assets and liabilities, as well as for operating loss and tax credit carryforwards. Deferred tax assets and liabilities are measured using the tax rates that are expected to apply to taxable income for the years in which those tax assets and liabilities are expected to be realized or settled. A valuation allowance is recorded to reduce deferred tax assets to the net amount that is more likely than not to be realized.
51
We establish valuation allowances for our deferred tax assets if, based on all available positive and negative evidence, it is more likely than not that some portion or all of the deferred tax assets will not be realized. In making such assessments, significant weight is given to evidence that can be objectively verified. The assessment of the need for a valuation allowance requires considerable judgment on the part of management with respect to the benefits that could be realized from future taxable income, as well as other positive and negative factors.
We have evaluated our deferred tax assets for each of the reporting periods, including an assessment of cumulative income over the prior three-year period. Since we are in a cumulative loss position in the United States, there is significant negative evidence that impairs the ability to rely on projections of future income. Due to a lack of significant positive evidence and cumulative losses in the respective prior three-year periods, a valuation allowance was required for the
2014
,
2013
and
2012
periods.
We recognize tax benefits from uncertain tax positions only if we believe that it is more likely than not that the tax position will be sustained on examination by the taxing authorities based on the technical merits of the position. Adjustments are made to these reserves when facts and circumstances change, such as the closing of a tax audit or the refinement of an estimate. To the extent that the final tax outcome of these matters is different than the amounts recorded, such differences will affect the provision for income taxes in the period in which such determination is made and could have a material impact on our financial condition and operating results. The provision for income taxes includes the effects of any reserves that are believed to be appropriate, as well as the related net interest and penalties. The effective tax rates for
2014
,
2013
and
2012
were
57.9%
,
(4.2)%
and
(0.2)%
, respectively.
We have not provided for any residual U.S. income taxes on the unremitted earnings of non-U.S. subsidiaries as such earnings are currently intended to be indefinitely reinvested outside the United States. It is not practicable to estimate the amount of tax that might be payable if some or all of such earnings were to be repatriated, or the amount of foreign tax credits that would be available to reduce or eliminate the resulting U.S. income tax liability.
Accruals and Reserves:
We have accruals and reserves that require the use of estimates and judgment with regard to risk exposure and ultimate liability. We estimate losses under these programs using certain factors, which include but are not limited to, actuarial assumptions, our experience and relevant industry data. We review these factors quarterly and consider the current level of accruals and reserves adequate relative to current market conditions and experience. Most recently, we have established liabilities for restructuring activities, in accordance with appropriate accounting principles. These liabilities, for both severance and exit costs, require the use of estimates. Though we believe that these estimates accurately reflect the anticipated costs, actual results may be different than the estimated amounts.
Stock-Based Compensation:
The principal awards issued under the stock-based compensation plans include stock options, restricted stock units and stock-settled stock appreciation rights ("SSARs"). The cost for such awards is measured at the grant date based on the fair value of the award. The value of the portion of the award that is expected to ultimately vest is recognized as expense on a straight-line basis, generally over the explicit service period and is included in Cost of goods sold, Research and development expenses and Selling and administrative expenses in the Consolidated Statements of Earnings, depending on the functional area of the underlying employees.
We use the Black-Scholes valuation model to estimate the fair value of SSARs and stock options granted to employees. The fair value of each restricted stock unit granted is equal to the share price at the date of the grant. At the time of grant, we estimate forfeitures, based on historical experience, in order to estimate the portion of the award that will ultimately vest.
See Note 10. Equity Incentive Program
of the notes to our Consolidated Financial Statements under Item 8, "Financial Statements and Supplementary Data" for additional information related to our stock-based compensation.
The information required by this section is incorporated by reference to the section “Risk Management,” included in Item 7 of this Form 10-K.
52
|
INDEX TO CONSOLIDATED FINANCIAL STATEMENTS AND
|
||
|
FINANCIAL STATEMENT SCHEDULE
|
||
|
Page
|
||
53
REPORT OF INDEPENDENT REGISTERED PUBLIC ACCOUNTING FIRM
To the Board of Directors and Stockholders of Knowles Corporation:
In our opinion, the consolidated financial statements
listed in the accompanying index present fairly, in all material respects, the financial position of Knowles Corporation and its subsidiaries
at December 31, 2014
and 2013, and the results of their operations and their cash flows for each of the three years in the period ended December 31, 2014
in conformity with accounting principles generally accepted in the United States of America. In addition, in our opinion, the financial statement schedule listed in the accompanying index
presents fairly, in all material respects, the information set forth therein when read in conjunction with the related consolidated financial statements. Also in our opinion, the Company maintained, in all material respects, effective internal control over financial reporting as of December 31, 2014, based on criteria established in
Internal Control - Integrated Framework
(2013)
issued by the Committee of Sponsoring Organizations of the Treadway Commission (COSO). The Company's management is responsible for these financial statements and financial statement schedule, for maintaining effective internal control over financial reporting and for its assessment of the effectiveness of internal control over financial reporting, included in
Management's Report on Internal Control over Financial Reporting appearing under Item 9A. Our responsibility is to express opinions on these financial statements, on the financial statement schedule, and on the Company's internal control over financial reporting based on our audits (which was an integrated audit in 2014). We conducted our audits in accordance with the standards of the Public Company Accounting Oversight Board (United States). Those standards require that we plan and perform the audits to obtain reasonable assurance about whether the financial statements are free of material misstatement and whether effective internal control over financial reporting was maintained in all material respects. Our audits of the financial statements included examining, on a test basis, evidence supporting the amounts and disclosures in the financial statements, assessing the accounting principles used and significant estimates made by management, and evaluating the overall financial statement presentation. Our audit of internal control over financial reporting included obtaining an understanding of internal control over financial reporting, assessing the risk that a material weakness exists, and testing and evaluating the design and operating effectiveness of internal control based on the assessed risk. Our audits also included performing such other procedures as we considered necessary in the circumstances. We believe that our audits provide a reasonable basis for our opinions.
A company’s internal control over financial reporting is a process designed to provide reasonable assurance regarding the reliability of financial reporting and the preparation of financial statements for external purposes in accordance with generally accepted accounting principles. A company’s internal control over financial reporting includes those policies and procedures that (i) pertain to the maintenance of records that, in reasonable detail, accurately and fairly reflect the transactions and dispositions of the assets of the company; (ii) provide reasonable assurance that transactions are recorded as necessary to permit preparation of financial statements in accordance with generally accepted accounting principles, and that receipts and expenditures of the company are being made only in accordance with authorizations of management and directors of the company; and (iii) provide reasonable assurance regarding prevention or timely detection of unauthorized acquisition, use, or disposition of the company’s assets that could have a material effect on the financial statements.
Because of its inherent limitations, internal control over financial reporting may not prevent or detect misstatements. Also, projections of any evaluation of effectiveness to future periods are subject to the risk that controls may become inadequate because of changes in conditions, or that the degree of compliance with the policies or procedures may deteriorate.
/s/ PricewaterhouseCoopers LLP
Chicago, Illinois
February 25, 2015
54
KNOWLES CORPORATION
(in millions, except share and per share amounts)
|
|
Years Ended December 31,
|
||||||||||
|
|
2014
|
2013
|
2012
|
||||||||
|
Revenues
|
$
|
1,141.3
|
|
$
|
1,214.8
|
|
$
|
1,118.0
|
|
||
|
Cost of goods sold
|
885.3
|
|
779.1
|
|
710.6
|
|
|||||
|
Restructuring charges - cost of goods sold
|
23.3
|
|
7.8
|
|
0.4
|
|
|||||
|
Gross profit
|
232.7
|
|
427.9
|
|
407.0
|
|
|||||
|
Research and development expenses
|
83.0
|
|
82.6
|
|
77.3
|
|
|||||
|
Selling and administrative expenses
|
196.5
|
|
193.0
|
|
188.1
|
|
|||||
|
Restructuring charges
|
6.3
|
|
8.5
|
|
5.5
|
|
|||||
|
Operating expenses
|
285.8
|
|
284.1
|
|
270.9
|
|
|||||
|
Operating (loss) earnings
|
(53.1
|
)
|
143.8
|
|
136.1
|
|
|||||
|
Interest expense, net
|
6.6
|
|
42.0
|
|
56.5
|
|
|||||
|
Other (income) expense, net
|
(4.6
|
)
|
0.3
|
|
0.7
|
|
|||||
|
(Loss) earnings before income taxes
|
(55.1
|
)
|
101.5
|
|
78.9
|
|
|||||
|
Provision for (benefit from) income taxes
|
31.9
|
|
(4.3
|
)
|
(0.2
|
)
|
|||||
|
Net (loss) earnings
|
$
|
(87.0
|
)
|
|
$
|
105.8
|
|
$
|
79.1
|
|
|
|
Basic (loss) earnings per share
(1)
|
$
|
(1.02
|
)
|
|
$
|
1.24
|
|
$
|
0.93
|
|
|
|
Diluted (loss) earnings per share
(1)
|
$
|
(1.02
|
)
|
$
|
1.24
|
|
$
|
0.93
|
|
||
|
Weighted average common shares outstanding:
|
|||||||||||
|
Basic
(1)
|
85,046,042
|
|
|
85,019,159
|
|
85,019,159
|
|
||||
|
Diluted
(1)
|
85,046,042
|
|
|
85,019,159
|
|
85,019,159
|
|
||||
(1)
On February 28, 2014, Dover stockholders of record as of the close of business on February 19, 2014 received
one
share of Knowles common stock for every
two
shares of Dover's common stock held as of the record date. The computation of basic and diluted earnings per common share for all periods through December 31, 2013 was calculated using the shares distributed on February 28, 2014.
See accompanying Notes to Consolidated Financial Statements
55
KNOWLES CORPORATION
CONSOLIDATED STATEMENTS OF COMPREHENSIVE EARNINGS
(in millions)
|
|
Years Ended December 31,
|
||||||||||
|
|
2014
|
2013
|
2012
|
||||||||
|
Net (loss) earnings
|
$
|
(87.0
|
)
|
$
|
105.8
|
|
$
|
79.1
|
|
||
|
Other comprehensive (loss) earnings, net of tax
|
|||||||||||
|
Foreign currency translation
|
(78.6
|
)
|
32.6
|
|
(82.2
|
)
|
|||||
|
Employee benefit plans:
|
|||||||||||
|
Actuarial losses arising during period
|
(4.5
|
)
|
—
|
|
(3.5
|
)
|
|||||
|
Amortization or settlement of actuarial losses included in net periodic pension cost
|
1.0
|
|
0.1
|
|
0.1
|
|
|||||
|
Net change in employee benefit plans
|
(3.5
|
)
|
0.1
|
|
(3.4
|
)
|
|||||
|
Changes in fair value of cash flow hedges:
|
|||||||||||
|
Unrealized net (losses) gains arising during period
|
(0.2
|
)
|
(0.1
|
)
|
0.9
|
|
|||||
|
Net losses (gains) reclassified into earnings
|
—
|
|
0.1
|
|
(0.1
|
)
|
|||||
|
Total cash flow hedges
|
(0.2
|
)
|
—
|
|
0.8
|
|
|||||
|
Other comprehensive (loss) earnings, net of tax
|
(82.3
|
)
|
32.7
|
|
(84.8
|
)
|
|||||
|
Comprehensive (loss) earnings
|
$
|
(169.3
|
)
|
$
|
138.5
|
|
$
|
(5.7
|
)
|
||
See accompanying Notes to Consolidated Financial Statements
56
KNOWLES CORPORATION
(in millions, except share and per share amounts)
|
|
December 31, 2014
|
December 31, 2013
|
|||||
|
Current assets:
|
|
|
|||||
|
Cash and cash equivalents
|
$
|
55.2
|
|
$
|
105.6
|
|
|
|
Receivables, net of allowances of $0.8 and $1.7
|
236.3
|
|
224.6
|
|
|||
|
Inventories, net
|
162.0
|
|
149.2
|
|
|||
|
Prepaid and other current assets
|
10.7
|
|
11.7
|
|
|||
|
Deferred tax assets
|
9.8
|
|
10.7
|
|
|||
|
Total current assets
|
474.0
|
|
501.8
|
|
|||
|
Property, plant and equipment, net
|
315.9
|
|
361.0
|
|
|||
|
Goodwill
|
914.7
|
|
961.9
|
|
|||
|
Intangible assets, net
|
270.3
|
|
318.3
|
|
|||
|
Other assets and deferred charges
|
23.6
|
|
27.1
|
|
|||
|
Total assets
|
$
|
1,998.5
|
|
$
|
2,170.1
|
|
|
|
Current liabilities:
|
|
|
|
|
|||
|
Current maturities of long-term debt
|
$
|
15.0
|
|
$
|
—
|
|
|
|
Accounts payable
|
172.1
|
|
143.9
|
|
|||
|
Accrued compensation and employee benefits
|
38.7
|
|
40.9
|
|
|||
|
Other accrued expenses
|
48.8
|
|
25.2
|
|
|||
|
Federal and other taxes on income
|
14.0
|
|
—
|
|
|||
|
Total current liabilities
|
288.6
|
|
210.0
|
|
|||
|
Long-term debt
|
385.0
|
|
—
|
|
|||
|
Deferred income taxes
|
49.2
|
|
45.9
|
|
|||
|
Other liabilities
|
39.5
|
|
27.1
|
|
|||
|
Commitments and contingencies (Note 11)
|
|
|
|
|
|||
|
Equity:
|
|
|
|
|
|||
|
Net Former Parent Company Investment in Knowles Corporation, prior to Separation
|
—
|
|
1,850.6
|
|
|||
|
Stockholders' equity:
|
|||||||
|
Preferred stock - $0.01 par value; 10,000,000 shares authorized; none issued
|
—
|
|
—
|
|
|||
|
Common stock - $0.01 par value; 400,000,000 shares authorized; 85,061,449 shares issued at December 31, 2014
|
0.9
|
|
—
|
|
|||
|
Additional paid-in capital
|
1,372.6
|
|
—
|
|
|||
|
Accumulated deficit
|
(84.0
|
)
|
—
|
|
|||
|
Accumulated other comprehensive (loss) earnings
|
(53.3
|
)
|
36.5
|
|
|||
|
Total stockholders' equity
|
1,236.2
|
|
36.5
|
|
|||
|
Total equity
|
1,236.2
|
|
1,887.1
|
|
|||
|
Total liabilities and equity
|
$
|
1,998.5
|
|
$
|
2,170.1
|
|
|
See accompanying Notes to Consolidated Financial Statements
57
KNOWLES CORPORATION
CONSOLIDATED STATEMENTS OF STOCKHOLDERS’ EQUITY
(in millions)
|
|
Common Stock
|
Additional Paid-In Capital
|
Accumulated Deficit
|
Accumulated Other Comprehensive Earnings (Loss)
|
Net Former Parent Company Investment
|
Total Equity
|
|||||||||||||||||
|
Balance at December 31, 2011
|
$
|
—
|
|
$
|
—
|
|
$
|
—
|
|
$
|
88.6
|
|
$
|
198.2
|
|
$
|
286.8
|
|
|||||
|
Net earnings
|
—
|
|
—
|
|
—
|
|
—
|
|
79.1
|
|
79.1
|
|
|||||||||||
|
Other comprehensive loss, net of tax
|
—
|
|
—
|
|
—
|
|
(84.8
|
)
|
—
|
|
(84.8
|
)
|
|||||||||||
|
Net transfers from Parent Company
|
—
|
|
—
|
|
—
|
|
—
|
|
907.1
|
|
907.1
|
|
|||||||||||
|
Balance at December 31, 2012
|
$
|
—
|
|
$
|
—
|
|
$
|
—
|
|
$
|
3.8
|
|
$
|
1,184.4
|
|
$
|
1,188.2
|
|
|||||
|
Net earnings
|
—
|
|
—
|
|
—
|
|
—
|
|
105.8
|
|
105.8
|
|
|||||||||||
|
Other comprehensive earnings, net of tax
|
—
|
|
—
|
|
—
|
|
32.7
|
|
—
|
|
32.7
|
|
|||||||||||
|
Net transfers from Parent Company
|
—
|
|
—
|
|
—
|
|
—
|
|
560.4
|
|
560.4
|
|
|||||||||||
|
Balance at December 31, 2013
|
$
|
—
|
|
$
|
—
|
|
$
|
—
|
|
$
|
36.5
|
|
$
|
1,850.6
|
|
$
|
1,887.1
|
|
|||||
|
Net loss
|
—
|
|
—
|
|
(84.0
|
)
|
—
|
|
(3.0
|
)
|
(87.0
|
)
|
|||||||||||
|
Net transfers to Former Parent Company
|
—
|
|
—
|
|
—
|
|
—
|
|
(471.1
|
)
|
(471.1
|
)
|
|||||||||||
|
Separation-related adjustments
|
—
|
|
—
|
|
—
|
|
(7.5
|
)
|
(11.8
|
)
|
(19.3
|
)
|
|||||||||||
|
Reclassification of Net Former Parent Company Investment in connection with the Separation
|
—
|
|
1,364.7
|
|
—
|
|
—
|
|
(1,364.7
|
)
|
—
|
|
|||||||||||
|
Issuance of common stock at Separation
|
0.9
|
|
(0.9
|
)
|
—
|
|
—
|
|
—
|
|
—
|
|
|||||||||||
|
Other comprehensive loss, net of tax
|
—
|
|
—
|
|
—
|
|
(82.3
|
)
|
—
|
|
(82.3
|
)
|
|||||||||||
|
Common stock issued for the exercise of stock options
|
—
|
|
0.1
|
|
—
|
|
—
|
|
—
|
|
0.1
|
|
|||||||||||
|
Stock-based compensation expense
|
—
|
|
8.7
|
|
—
|
|
—
|
|
—
|
|
8.7
|
|
|||||||||||
|
Balance at December 31, 2014
|
$
|
0.9
|
|
$
|
1,372.6
|
|
$
|
(84.0
|
)
|
$
|
(53.3
|
)
|
$
|
—
|
|
$
|
1,236.2
|
|
|||||
See accompanying Notes to Consolidated Financial Statements
58
KNOWLES CORPORATION
(in millions)
|
|
Years Ended December 31,
|
||||||||||
|
|
2014
|
2013
|
2012
|
||||||||
|
Operating Activities
|
|
|
|||||||||
|
Net (loss) earnings
|
$
|
(87.0
|
)
|
$
|
105.8
|
|
$
|
79.1
|
|
||
|
Adjustments to reconcile net (loss) earnings to cash from operating activities:
|
|||||||||||
|
Depreciation and amortization
|
151.6
|
|
130.9
|
|
114.9
|
|
|||||
|
Deferred income taxes
|
1.2
|
|
(30.0
|
)
|
(16.7
|
)
|
|||||
|
Non-cash restructuring related charges
|
18.8
|
|
—
|
|
—
|
|
|||||
|
Stock-based compensation
|
9.0
|
|
2.0
|
|
1.9
|
|
|||||
|
Impairment charges and gain/loss on disposal of assets, net
|
1.4
|
|
3.6
|
|
2.3
|
|
|||||
|
Other, net
|
(2.7
|
)
|
6.6
|
|
(4.4
|
)
|
|||||
|
Cash effect of changes in assets and liabilities (excluding effects of foreign exchange):
|
|||||||||||
|
Receivables, net
|
(24.3
|
)
|
(6.5
|
)
|
(20.2
|
)
|
|||||
|
Inventories, net
|
(18.2
|
)
|
(14.1
|
)
|
(15.5
|
)
|
|||||
|
Prepaid and other current assets
|
1.7
|
|
(3.2
|
)
|
8.3
|
|
|||||
|
Accounts payable
|
38.0
|
|
(16.1
|
)
|
21.8
|
|
|||||
|
Accrued compensation and employee benefits
|
(3.4
|
)
|
3.0
|
|
(1.2
|
)
|
|||||
|
Other accrued expenses
|
23.8
|
|
0.5
|
|
6.4
|
|
|||||
|
Accrued taxes
|
11.6
|
|
2.1
|
|
0.9
|
|
|||||
|
Other non-current assets and non-current liabilities
|
(6.0
|
)
|
(10.3
|
)
|
(2.5
|
)
|
|||||
|
Net cash provided by operating activities
|
115.5
|
|
174.3
|
|
175.1
|
|
|||||
|
Investing Activities
|
|
|
|
|
|||||||
|
Additions to property, plant and equipment
|
(83.9
|
)
|
(105.2
|
)
|
(132.1
|
)
|
|||||
|
Purchase price adjustments related to the acquisition of Sound Solutions
|
—
|
|
—
|
|
45.0
|
|
|||||
|
Proceeds from the sale of property, plant and equipment
|
0.3
|
|
5.2
|
|
4.0
|
|
|||||
|
Capitalized patent defense costs
|
(16.0
|
)
|
(8.6
|
)
|
(13.1
|
)
|
|||||
|
Proceeds from the sale of investment
|
14.5
|
|
—
|
|
—
|
|
|||||
|
Purchase of investment
|
(8.0
|
)
|
—
|
|
(5.0
|
)
|
|||||
|
Net cash used in investing activities
|
(93.1
|
)
|
(108.6
|
)
|
(101.2
|
)
|
|||||
|
Financing Activities
|
|
|
|
|
|||||||
|
Proceeds from debt
|
400.0
|
|
—
|
|
—
|
|
|||||
|
Debt issuance costs
|
(3.3
|
)
|
—
|
|
—
|
|
|||||
|
Net proceeds from exercise of stock-based awards
|
0.1
|
|
—
|
|
—
|
|
|||||
|
Change in Former Parent Company borrowings, net
|
—
|
|
(574.1
|
)
|
(886.8
|
)
|
|||||
|
Net transfers (to) from Former Parent Company
|
(468.2
|
)
|
603.4
|
|
796.8
|
|
|||||
|
Net cash (used in) provided by financing activities
|
(71.4
|
)
|
29.3
|
|
(90.0
|
)
|
|||||
|
Effect of exchange rate changes on cash and cash equivalents
|
(1.4
|
)
|
0.3
|
|
0.1
|
|
|||||
|
Net (decrease) increase in cash and cash equivalents
|
(50.4
|
)
|
95.3
|
|
(16.0
|
)
|
|||||
|
Cash and cash equivalents at beginning of period
|
105.6
|
|
10.3
|
|
26.3
|
|
|||||
|
Cash and cash equivalents at end of period
|
$
|
55.2
|
|
$
|
105.6
|
|
$
|
10.3
|
|
||
|
Supplemental information - cash paid during the year for:
|
|||||||||||
|
Income taxes
|
$
|
20.9
|
|
$
|
20.7
|
|
$
|
15.2
|
|
||
|
Interest
|
$
|
6.7
|
|
$
|
46.0
|
|
$
|
59.7
|
|
||
See accompanying Notes to Consolidated Financial Statements
59
|
NOTES TO CONSOLIDATED FINANCIAL STATEMENTS
|
||
1. Summary of Significant Accounting Policies
Background
- Knowles Corporation (the "Company") is engaged in the design and manufacture of innovative products and components which serve the mobile communications, consumer electronics, medical technology, telecommunications infrastructure, military, aerospace and industrial markets. The Company has a leading position in micro-electro-mechanical systems (“MEMS”) microphones, speakers and receivers which are used in mobile handsets, smartphones and tablets within the consumer electronics market. The Company is also a leading manufacturer of transducers used in the hearing health segment of the medical technology market and has a strong position in oscillators (timing devices) and capacitors which serve the telecommunication infrastructure, military, aerospace and industrial markets. The Company reports
two
business segments: Mobile Consumer Electronics (“MCE”) and Specialty Components (“SC”).
See Note 14. Segment Information
for additional information related to the Company’s segments. References to “Knowles,” “the Company,” “we,” “our” and “us” refer to Knowles Corporation and its consolidated subsidiaries.
On February 28, 2014, Knowles Corporation became an independent, publicly-traded company as a result of the distribution by Dover Corporation (“Dover” or “Former Parent”) of
100%
of the outstanding common stock of the Company to Dover’s stockholders (the "Separation"). Dover's Board of Directors approved the distribution of its shares of Knowles on February 6, 2014. Knowles' Registration Statement on Form 10 was declared effective by the U.S. Securities and Exchange Commission on February 10, 2014. On February 28, 2014, Dover's stockholders of record as of the close of business on February 19, 2014 ("record date") received one share of Knowles common stock for every two shares of Dover common stock held as of the record date. Knowles' common stock began trading "regular-way" under the ticker symbol "KN" on the New York Stock Exchange on March 3, 2014.
During the
year
ended
December 31, 2014
, certain Separation-related adjustments were recorded in stockholders' equity, principally due to the transfer of certain pension plan liabilities from Dover upon the legal split of those plans, as well as to adjust the Company's income tax balances to reflect the Company's post-Separation stand-alone income tax positions. In addition, because the historical financial statements were derived from Dover’s accounting records, included in the Separation-related adjustments were adjustments to foreign currency translation adjustments to reflect the appropriate opening balances related to Knowles' legal entities at the Separation date.
Financial Statement Presentation -
The Consolidated Financial Statements included in this Annual Report on Form 10-K were derived principally from the consolidated financial statements of the Company. Prior to the Separation on February 28, 2014, the historical financial statements of Knowles were prepared on a stand-alone basis and were derived from Dover's consolidated financial statements and accounting records. Accordingly, Knowles' financial statements prior to February 28, 2014 are presented herein on a combined basis and reflect Knowles' financial position, results of operations and cash flows as its business was operated as part of Dover prior to the Separation, in conformity with U.S. generally accepted accounting principles and include allocations of certain general corporate expenses of our Former Parent. These allocated expenses include costs associated with corporate human resources, finance and legal, including the costs of salaries, benefits and other related costs and are included in "Corporate" in the accompanying segment information. These expenses have been allocated to Knowles based on direct usage or benefit where identifiable, with the remainder allocated on the basis of revenues, headcount, or other measures. Knowles considers the expense allocation methodology reasonable. These allocations, which ceased as of the Separation date, totaled
$3.4 million
,
$23.6 million
and
$26.1 million
during the years ended
December 31, 2014
,
2013
and 2012, respectively. However, the allocations may not be indicative of the actual expenses had Knowles operated as an independent, publicly-traded company for all periods presented. The Consolidated Financial Statements included in this Annual Report on Form 10-K for periods prior to the Separation may not necessarily reflect the Company's results of operations, financial condition and cash flows had the Company been a stand-alone company during the periods presented.
During the three months ended March 31, 2014, the Company corrected its incentive compensation accrual to reflect the actual amounts paid for 2013 incentive compensation, which increased earnings before income taxes by
$1.4 million
(
$0.9 million
net of tax) and tax expense associated with foreign taxes due on 2012 royalty income, which decreased net earnings by
$1.1 million
. During the three months ended June 30, 2014, the Company corrected its severance accrual to include agreements executed in 2013, which decreased earnings before income taxes by
$2.1 million
(
$1.6 million
net of tax). During the three months ended September 30, 2014, the Company corrected its tax expense to properly reflect Chinese withholding taxes paid on 2013 royalty income, which decreased net earnings by
$1.7 million
. During the three months ended December 31, 2014, the Company corrected its tax expense to properly reflect a tax accrual for 2013 unremitted earnings of its foreign affiliate in Taiwan, which decreased net earnings by
$1.2 million
. These items are not material to the Consolidated Financial Statements for any impacted period.
60
|
NOTES TO CONSOLIDATED FINANCIAL STATEMENTS
|
||
Revision of Prior Period Financial Statements
-
During the fourth quarter of 2013, the Company identified a classification error in the Consolidated Statements of Cash Flows whereby accrued capital expenditures and accrued patent defense costs were incorrectly classified as Additions to property, plant and equipment and Capitalized patent defense costs, respectively, within investing activities. The Consolidated Statements of Cash Flows presented herein have been revised to reflect the correction of this error. The results of this correction were a decrease in net cash used in investing activities of
$14.4 million
in 2012, with an offsetting decrease to net cash provided by operating activities during the same period. This classification error is not considered material to the
year
ending
December 31, 2012
.
In addition, certain prior period amounts on the Consolidated Statements of Earnings and the Consolidated Statements of Cash Flows have been reclassified to conform to the current period presentation.
Use of Estimates
- The preparation of financial statements in conformity with accounting principles generally accepted in the United States of America requires management to make estimates and assumptions that affect the amounts reported in the accompanying financial statements and disclosures. These estimates may be adjusted due to changes in future economic, industry, or customer financial conditions, as well as changes in technology or demand. Estimates are used in accounting for, among other items, allowances for doubtful accounts receivable, inventory reserves, restructuring reserves, warranty reserves, pension and post-retirement plans, stock-based compensation, corporate allocations, useful lives for depreciation and amortization of long-lived assets, future cash flows associated with impairment testing for goodwill, indefinite-lived intangible assets and other long-lived assets, deferred tax assets, uncertain income tax positions and contingencies. Actual results may ultimately differ from estimates, although management does not believe such differences would materially affect the financial statements in any individual year. Estimates and assumptions are periodically reviewed and the effects of revisions are reflected in the Consolidated Financial Statements in the period that they are determined.
Cash and Cash Equivalents
- Cash and cash equivalents include cash on hand and demand deposits.
Allowance for Doubtful Accounts
– The Company maintains allowances for estimated losses as a result of customers' inability to make required payments. Management evaluates the aging of the accounts receivable balances, the financial condition of its customers, historical trends and the time outstanding of specific balances to estimate the amount of accounts receivable that may not be collected in the future and records the appropriate provision.
Inventories
– Inventories are stated at the lower of cost or market, determined on the first-in, first-out (FIFO) basis. The value of inventory may decline as a result of surplus inventory, price reductions, or technological obsolescence. It is the Company’s policy to carry reserves against the carrying value of inventory when items have no future demand (obsolete inventory) and additionally, where inventory items on hand have demand, yet have insufficient forecasted activity to consume the entire stock within a reasonable period. It is the Company’s policy to carry reserves against the carrying value of such at-risk inventory items after considering the nature of the risk and any mitigating factors.
Property, Plant and Equipment
- Property, plant and equipment includes the historic cost of land, buildings, equipment and significant improvements to existing plant and equipment or, in the case of acquisitions, a fair market value appraisal of such assets completed at the time of acquisition. Property, plant and equipment also includes the cost of purchased software. Expenditures for maintenance, repairs and minor renewals are expensed as incurred. When property or equipment is sold or otherwise disposed of, the related cost and accumulated depreciation is removed from the respective accounts and the gain or loss realized on disposition is reflected in earnings. The Company depreciates its assets on a straight-line basis over their estimated useful lives as follows: buildings and improvements
5
to
31.5
years; machinery and equipment
1.5
to
7
years; furniture and fixtures
3
to
7
years; vehicles
3
years; and software
3
to
7
years. Depreciation expense totaled
$127.3 million
in
2014
,
$85.0 million
in
2013
and
$66.4 million
in
2012
. During the year ended December 31,
2014
, the Company recorded accelerated depreciation on fixed assets related to the cessation of manufacturing at its Vienna, Austria facility totaling
$18.3 million
and shorter product life cycles at its Beijing, China facility totaling
$19.6 million
.
Derivative Instruments
- The Company periodically uses derivative financial instruments to hedge its exposures to various risks, including foreign currency exchange and interest rate risk. The Company does not enter into derivative financial instruments for speculative purposes. Derivative financial instruments used for hedging purposes must be designated an effective hedge of the identified risk exposure at inception and throughout the life of the contract. The Company recognizes all derivatives as either assets or liabilities on the Consolidated Balance Sheet and measures those instruments at fair value. For derivatives designated as cash flow hedges, the effective portion of changes in the fair value of the derivatives is recorded as a component of other comprehensive earnings and subsequently recognized in net earnings when the hedged items impact earnings.
61
|
NOTES TO CONSOLIDATED FINANCIAL STATEMENTS
|
||
Goodwill and Indefinite-Lived Intangible Assets
- Goodwill represents the excess of purchase consideration over the fair value of the net assets of businesses acquired. Goodwill and certain other intangible assets deemed to have indefinite lives (primarily trademarks) are not amortized. Instead, goodwill and indefinite-lived intangible assets are tested for impairment at least annually or more frequently if indicators of impairment exist. The Company conducts its annual impairment evaluation in the fourth quarter of each year and changed its annual impairment evaluation date to October 1 from December 31 during 2014. Recoverability of goodwill is measured at the reporting unit level and determined using a two-step process. The Company identified
four
reporting units for its annual goodwill impairment test. Step one of the test compares the fair value of each reporting unit using a discounted cash flow method to its book value. This method uses the Company’s market assumptions including projections of future cash flows, determinations of appropriate discount rates and other assumptions which are considered reasonable and inherent in the discounted cash flow analysis. The projections are based on historical performance and future estimated results. These assumptions require significant judgment and actual results may differ from estimated amounts. The fair value of all of the Company’s reporting units determined in step one exceeded the carrying values by at least
20%
. A reduction in the estimated fair value of the reporting units could trigger an impairment in the future. The Company cannot predict the occurrence of certain events or changes in circumstances that might adversely affect the carrying value of goodwill and intangible assets. Step two, which compares the book value of the goodwill to its implied fair value, was not necessary since there were no indicators of potential impairment from step one during any of the periods presented.
Similar to goodwill, in testing its other indefinite lived intangible assets for impairment, the Company uses a discounted cash flow method to calculate and compare the fair value of the intangible asset to its book value. This method uses the Company’s market assumptions which are considered reasonable and inherent in the discounted cash flow analysis. Any excess of carrying value over the estimated fair value is recognized as an impairment loss.
No
impairment of indefinite lived intangibles was indicated for the years ended
December 31, 2014
,
2013
or
2012
.
See Note 5. Goodwill and Other Intangible Assets
for additional information on goodwill and indefinite-lived intangible assets.
Other Intangible Assets -
Other intangible assets with determinable lives consist primarily of customer relationships, unpatented technology, patents and trademarks and are amortized over their estimated useful lives, ranging from
5
to
15
years. The Company relies on patents and proprietary technology and seeks patent protection for products and production methods. The Company capitalizes external legal costs incurred in the defense of its patents when it believes that a significant, discernible increase in value will result from the defense and a successful outcome of the legal action is probable. These costs are amortized over the remaining estimated useful life of the patent, which is typically
7
to
10
years. The Company’s assessment of future economic benefit and/or the successful outcome of legal action related to patent defense involves considerable management judgment and a different outcome could result in material write-offs of the carrying value of these assets. During the years ended December 31,
2014
,
2013
and
2012
, the Company capitalized
$12.7 million
,
$11.4 million
and
$13.9 million
, respectively, in legal costs related to the defense of its patents.
Long-Lived Assets
- Long-lived assets (including intangible assets with determinable lives) are reviewed for impairment whenever events or changes in circumstances indicate that the carrying amount of an asset may not be recoverable. If an indicator of impairment exists for any grouping of assets, an estimate of undiscounted future cash flows is produced and compared to its carrying value. If an asset is determined to be impaired, the loss is measured by the excess of the carrying amount of the asset over its fair value as determined by an estimate of discounted future cash flows. In the fourth quarter of
2013
, the Company recorded asset impairment charges related to more mature product lines totaling
$4.3 million
.
Foreign Currency
- Assets and liabilities of non-U.S. subsidiaries, where the functional currency is not the U.S. dollar, are translated into U.S. dollars at year-end exchange rates. Revenue and expense items are translated using weighted-average yearly exchange rates. Foreign currency translation gains and losses are included as a component of Accumulated other comprehensive earnings. Assets and liabilities of an entity that are denominated in currencies other than an entity’s functional currency are re-measured into the functional currency using end of period exchange rates or historical rates where applicable to certain balances. Gains and losses related to these re-measurements are recorded within the Consolidated Statement of Earnings as a component of Other expense, net.
Revenue Recognition
- Revenue is recognized when all of the following conditions are satisfied: a) persuasive evidence of an arrangement exists, b) price is fixed or determinable, c) collectability is reasonably assured and d) delivery has occurred or services have been rendered. The majority of the Company’s revenue is generated through the manufacture and sale of a broad range of specialized products and components, with revenue recognized upon transfer of title and risk of loss. The Company does not have significant service revenue, licensing income, or multiple deliverable arrangements. The Company recognizes third-party licensing or royalty income as revenue over the related contract term. Revenue is recognized net of customer
62
|
NOTES TO CONSOLIDATED FINANCIAL STATEMENTS
|
||
discounts, rebates and returns. Rebates are recognized over the contract period based on expected revenue levels. Sales discounts and rebates totaled
$14.3 million
,
$8.3 million
and
$14.2 million
for the years ended December 31,
2014
,
2013
and
2012
, respectively. Returns and allowances totaled
$10.3 million
,
$11.2 million
and
$4.6 million
for the years ended December 31,
2014
,
2013
and
2012
, respectively.
Stock-Based Compensation
– The principal awards issued under the stock-based compensation plans include stock options, restricted stock units and stock-settled stock appreciation rights ("SSARs"). The cost for such awards is measured at the grant date based on the fair value of the award. The value of the portion of the award that is expected to ultimately vest is recognized as expense on a straight-line basis, generally over the explicit service period and is included in Cost of goods sold, Research and development expenses and Selling and administrative expenses in the Consolidated Statements of Earnings, depending on the functional area of the underlying employees.
The Company uses the Black-Scholes valuation model to estimate the fair value of SSARs and stock options granted to employees. The fair value of each restricted stock unit granted is equal to the share price at the date of the grant. At the time of grant, the Company estimates forfeitures, based on historical experience, in order to estimate the portion of the award that will ultimately vest.
See Note 10. Equity Incentive Program
for additional information related to the Company’s stock-based compensation.
Income Taxes
- For purposes of the Consolidated Financial Statements, the Company's income tax expense and deferred tax balances prior to the Separation have been estimated as if it filed income tax returns on a stand-alone basis separate from our Former Parent. The calculation of income taxes on the separate return basis requires considerable judgment and the use of both estimates and allocations. As a result, the Company’s effective tax rate and deferred tax balances will differ significantly from those prior to the Separation. Additionally, the deferred tax balances as calculated on the separate return basis will differ from the deferred tax balances of the Company calculated as a separate, stand-alone entity.
The Company records a provision for income taxes for the anticipated tax consequences of the reported results of operations using the asset and liability method. Under this method, the Company recognizes deferred tax assets and liabilities for the expected future tax consequences of temporary differences between the financial reporting and tax bases of assets and liabilities, as well as for operating loss and tax credit carryforwards. Deferred tax assets and liabilities are measured using the tax rates that are expected to apply to taxable income for the years in which those tax assets and liabilities are expected to be realized or settled.
The Company establishes valuation allowances for its deferred tax assets if, based on all available positive and negative evidence, it is more likely than not that some portion or all of the deferred tax assets will not be realized. In making such assessments, significant weight is given to evidence that can be objectively verified. The assessment of the need for a valuation allowance requires considerable judgment on the part of management with respect to the benefits that could be realized from future taxable income, as well as other positive and negative factors. Management considers the scheduled reversal of deferred tax liabilities, projected future taxable income, and tax-planning strategies in making this assessment.
The Company recognizes tax benefits from uncertain tax positions only if it believes that it is more likely than not that the tax position will be sustained on examination by the taxing authorities based on the technical merits of the position. Adjustments are made to these reserves when facts and circumstances change, such as the closing of a tax audit or the refinement of an estimate. To the extent that the final tax outcome of these matters is different than the amounts recorded, such differences will affect the provision for income taxes in the period in which such determination is made and could have a material impact on the Company's financial condition and operating results. The provision for income taxes includes the effects of any reserves that are believed to be appropriate, as well as the related net interest and penalties.
The Company has not provided for any residual U.S. income taxes on the unremitted earnings of non-U.S. subsidiaries as such earnings are currently intended to be indefinitely reinvested outside the United States. It is not practicable to estimate the amount of tax that might be payable if some or all of such earnings were to be repatriated, or the amount of foreign tax credits that would be available to reduce or eliminate the resulting U.S. income tax liability.
See Note 9. Income Taxes
for additional information on the Company’s income taxes and unrecognized tax benefits.
Research and Development Costs –
Research and development costs, including qualifying engineering costs, are expensed when incurred.
63
|
NOTES TO CONSOLIDATED FINANCIAL STATEMENTS
|
||
Non-cash Investing Activities
- Purchases of property, plant and equipment included in accounts payable at
December 31, 2014
,
2013
and
2012
were
$10.8 million
,
$9.4 million
and
$23.4 million
, respectively. The Company also entered into a capital lease for new equipment in the fourth quarter of 2014 with a corresponding capital lease obligation at December 31, 2014 of
$7.0 million
. In addition, legal costs incurred in the defense of the Company's patents included in accounts payable at
December 31, 2014
,
2013
and
2012
were
$0.5 million
,
$3.8 million
and
$0.9 million
, respectively. These non-cash amounts are not reflected as outflows to Additions to property, plant and equipment or Capitalized patent defense costs within investing activities of the Consolidated Statements of Cash Flows for the respective periods.
Recently Issued Accounting Standards -
In August 2014, the Financial Accounting Standards Board ("FASB") issued Accounting Standards Update ("ASU") 2014-15 that requires management to evaluate, for each annual and interim reporting period, whether there are conditions and events, considered in the aggregate, that raise substantial doubt about an entity’s ability to continue as a going concern within one year after the date the financial statements are issued or are available to be issued. If substantial doubt is raised, additional disclosures around management’s plan to alleviate these doubts are required. This standard will become effective for fiscal years ending after December 15, 2016 and for all reporting periods thereafter. The Company does not expect the new guidance to have a significant impact on its Consolidated Financial Statements.
In May 2014, the FASB issued ASU 2014-09 that introduces a new five-step revenue recognition model in which an entity should recognize revenue to depict the transfer of promised goods or services to customers in an amount that reflects the consideration to which the entity expects to be entitled in exchange for those goods or services. This ASU also requires disclosures sufficient to enable users to understand the nature, amount, timing and uncertainty of revenue and cash flows arising from contracts with customers, including qualitative and quantitative disclosures about contracts with customers, significant judgments and changes in judgments and assets recognized from the costs to obtain or fulfill a contract. This standard will be effective for reporting periods beginning after December 15, 2016. The Company is currently evaluating the new guidance to determine the impact it will have on its Consolidated Financial Statements.
In April 2014, the FASB issued ASU 2014-08, which includes amendments that change the requirements for reporting discontinued operations and require additional disclosures about discontinued operations. Under the new guidance, only disposals representing a strategic shift in operations - that is, a major effect on the organization's operations and financial results should be presented as discontinued operations. Examples include a disposal of a major geographic area, a major line of business, or a major equity method investment. Additionally, the ASU requires expanded disclosures about discontinued operations that will provide financial statement users with more information about the assets, liabilities, income and expenses of discontinued operations. This standard will be effective for the Company in the first quarter of 2015. The Company does not expect the new guidance to have a significant impact on its Consolidated Financial Statements.
Recently Adopted Accounting Standards -
In July 2013, the FASB issued ASU 2013-11, which provides that an unrecognized tax benefit, or a portion thereof, should be presented in the financial statements as a reduction to a deferred tax asset for a net operating loss carryforward, a similar tax loss, or a tax credit carryforward, except to the extent that a net operating loss carryforward, a similar tax loss, or a tax credit carryforward is not available at the reporting date to settle any additional income taxes that would result from disallowance of a tax position, or the tax law does not require the entity to use and the entity does not intend to use, the deferred tax asset for such purpose, then the unrecognized tax benefit should be presented as a liability. This standard is effective for reporting periods beginning after December 15, 2013. The Company's adoption of this standard did not have a significant impact on its Consolidated Financial Statements.
In February 2013, the FASB issued ASU 2013-02, which requires additional disclosures regarding the reporting of reclassifications out of accumulated other comprehensive income. ASU 2013-02 requires an entity to present, either on the face of the statement where net income is presented or in the notes, significant amounts reclassified out of accumulated other comprehensive income by the respective line items of net income but only if the amount reclassified is required under U.S. GAAP to be reclassified to net income in its entirety in the same reporting period. This standard is effective for reporting periods beginning after December 15, 2012. The Company adopted this guidance effective January 1, 2013. The Company's adoption of this standard did not have a significant impact on its Consolidated Financial Statements.
In July 2012, the FASB issued ASU 2012-02, which allows an entity to first assess qualitative factors to determine whether it is necessary to perform a quantitative impairment test of an indefinite-lived intangible asset. Per the terms of this ASU, an entity would not be required to calculate the fair value of an indefinite-lived intangible asset unless the entity determines, based on qualitative assessment, that it is not more likely than not, the indefinite-lived intangible asset is impaired. The revised standard is effective for the Company for its annual and interim impairment tests performed for fiscal years beginning after September 15, 2012. The Company's adoption of this standard did not have a significant impact on its Consolidated Financial Statements.
64
|
NOTES TO CONSOLIDATED FINANCIAL STATEMENTS
|
||
2. Related Party Transactions
Prior to the Separation, Knowles had certain related party relationships with our Former Parent and its subsidiaries. Pursuant to the Separation and Distribution, Tax Matters, Employee Matters and certain other agreements entered into between the Company and our Former Parent in connection with the Separation, our Former Parent agreed to indemnify us from certain liabilities and we agreed to indemnify our Former Parent from certain liabilities. Indemnities that we may be required to provide our Former Parent may be significant and could negatively impact our business, particularly indemnities relating to our actions that could impact the tax-free nature of the distribution of all the shares of our common stock owned by our Former Parent to stockholders of our Former Parent as of February 28, 2014 (the “Distribution”). Third parties could also seek to hold us responsible for any of the liabilities that our Former Parent has agreed to retain. Even if we ultimately succeed in recovering from our Former Parent any amounts for which we are held liable, we may be temporarily required to bear these losses ourselves. In addition, Knowles entered into a Transition Services Agreement providing for the performance of certain services by our Former Parent on a temporary basis following the Separation.
Upon the Separation, our Former Parent ceased providing financing, cash management and treasury services to the Company. Immediately prior to the Separation, Knowles made a cash payment in the amount of
$400.0 million
to Dover. In addition, Knowles made a cash payment of
$1.7 million
to Dover in the fourth quarter of 2014 for the final settlement of a Tax Matters Agreement entered into with Dover as part of the Separation. These transactions are reflected in Net transfers (to) from Former Parent Company on the Consolidated Statements of Cash Flows and in Net transfers to Former Parent Company on the Consolidated Statements of Stockholders' Equity.
Notes due to Dover, net
Knowles had outstanding intercompany net notes payable with Dover and its affiliates, which were put in place to fund the business over a defined period of time. Although previously these financing arrangements were continually renewed with no intention to settle the obligations in cash, the Company settled the intercompany net notes payables as of December 31, 2013 in anticipation of the Distribution. These notes are reflected as a financing activity in Change in borrowings, net in the Consolidated Statements of Cash Flows for the years ended December 31, 2013 and 2012. Net interest expense on these notes totaled
$42.0 million
and
$56.6 million
for the years ended December 31, 2013 and 2012, respectively and is included in Interest expense, net in the Consolidated Statements of Earnings.
General and Administrative Services
Until consummation of the Separation, our Former Parent performed certain functions on behalf of the Company. See Note
1. Summary of Significant Accounting Policies
for additional information.
Intercompany transactions
Intercompany sales with Dover and its affiliates were
$1.2 million
and
$1.6 million
for the years ended December 31, 2013 and 2012, respectively. These amounts are included in Revenues on the Consolidated Statements of Earnings.
Transactions between Knowles and Dover, with the exception of sales transactions and intercompany net notes payable, are reflected in Net transfers (to) from Former Parent Company on the Consolidated Statements of Cash Flows and in Net transfers (to) from Former Parent Company on the Consolidated Statements of Stockholders' Equity.
65
|
NOTES TO CONSOLIDATED FINANCIAL STATEMENTS
|
||
3. Inventories, net
The following table details the major components of inventories, net (in millions):
|
|
December 31, 2014
|
December 31, 2013
|
|||||
|
Raw materials
|
$
|
69.9
|
|
$
|
55.9
|
|
|
|
Work in progress
|
35.8
|
|
29.9
|
|
|||
|
Finished goods
|
92.2
|
|
92.0
|
|
|||
|
Subtotal
|
197.9
|
|
177.8
|
|
|||
|
Less reserves
|
(35.9
|
)
|
(28.6
|
)
|
|||
|
Total
|
$
|
162.0
|
|
$
|
149.2
|
|
|
4. Property, Plant and Equipment, net
The following table details the major components of property, plant and equipment, net (in millions):
|
|
December 31, 2014
|
December 31, 2013
|
|||||
|
Land
|
$
|
11.9
|
|
$
|
12.2
|
|
|
|
Buildings and improvements
|
112.8
|
|
85.8
|
|
|||
|
Machinery, equipment and other
|
657.6
|
|
678.4
|
|
|||
|
Subtotal
|
782.3
|
|
776.4
|
|
|||
|
Less accumulated depreciation
|
(466.4
|
)
|
(415.4
|
)
|
|||
|
Total
|
$
|
315.9
|
|
$
|
361.0
|
|
|
5. Goodwill and Other Intangible Assets
The changes in the carrying value of goodwill by reportable segment for the years ended
December 31, 2014
and
2013
are as follows (in millions):
|
|
Mobile Consumer Electronics
|
Specialty Components
|
Total
|
||||||||
|
Balance at January 1, 2013
|
$
|
760.7
|
|
$
|
185.4
|
|
$
|
946.1
|
|
||
|
Foreign currency translation
|
15.6
|
|
0.2
|
|
15.8
|
|
|||||
|
Balance at December 31, 2013
|
776.3
|
|
185.6
|
|
961.9
|
|
|||||
|
Foreign currency translation
|
(47.2
|
)
|
—
|
|
(47.2
|
)
|
|||||
|
Balance at December 31, 2014
|
$
|
729.1
|
|
$
|
185.6
|
|
$
|
914.7
|
|
||
66
|
NOTES TO CONSOLIDATED FINANCIAL STATEMENTS
|
||
The gross carrying value and accumulated amortization for each major class of intangible asset are as follows (in millions):
|
December 31, 2014
|
December 31, 2013
|
||||||||||||||
|
Gross Carrying
Amount
|
Accumulated
Amortization
|
Gross Carrying
Amount
|
Accumulated
Amortization
|
||||||||||||
|
Amortized intangible assets:
|
|||||||||||||||
|
Trademarks
|
$
|
7.5
|
|
$
|
1.9
|
|
$
|
8.3
|
|
$
|
1.5
|
|
|||
|
Patents
|
50.0
|
|
12.3
|
|
47.5
|
|
17.5
|
|
|||||||
|
Customer Relationships
|
404.6
|
|
210.3
|
|
429.3
|
|
181.2
|
|
|||||||
|
Unpatented Technologies
|
65.5
|
|
64.8
|
|
65.8
|
|
64.6
|
|
|||||||
|
Other
|
1.6
|
|
1.6
|
|
1.6
|
|
1.4
|
|
|||||||
|
Total
|
529.2
|
|
290.9
|
|
552.5
|
|
266.2
|
|
|||||||
|
Unamortized intangible assets:
|
|||||||||||||||
|
Trademarks
|
32.0
|
|
32.0
|
|
|||||||||||
|
Total intangible assets, net
|
$
|
270.3
|
|
$
|
318.3
|
|
|||||||||
Total amortization expense for the years ended
December 31, 2014
,
2013
and
2012
was
$42.6 million
,
$45.9 million
and
$48.5 million
, respectively. Amortization expense is primarily recorded in Selling and administrative expenses in the Consolidated Statements of Earnings. Amortization expense for the next five years, based on current intangible balances, is estimated to be as follows (in millions):
|
2015
|
$
|
40.9
|
|
|
2016
|
38.2
|
|
|
|
2017
|
30.0
|
|
|
|
2018
|
30.0
|
|
|
|
2019
|
29.4
|
|
|
6. Accrued Expenses and Other Liabilities
The following table details the major components of other accrued expenses (in millions):
|
|
December 31, 2014
|
December 31, 2013
|
|||||
|
Warranty
|
$
|
15.5
|
|
$
|
3.7
|
|
|
|
Restructuring and exit
|
13.0
|
|
5.5
|
|
|||
|
Accrued short term capital leases
|
1.2
|
|
1.0
|
|
|||
|
Other
(1)
|
19.1
|
|
15.0
|
|
|||
|
Total
|
$
|
48.8
|
|
$
|
25.2
|
|
|
(1)
Primarily represents accrued taxes other than income taxes, accrued volume discounts and accrued commissions (non-employee), none of which are individually significant.
67
|
NOTES TO CONSOLIDATED FINANCIAL STATEMENTS
|
||
The following table details the major components of other liabilities (in millions):
|
|
December 31, 2014
|
December 31, 2013
|
|||||
|
Deferred compensation, principally defined benefit plans
|
$
|
24.3
|
|
$
|
18.1
|
|
|
|
Unrecognized tax benefits
|
6.1
|
|
6.4
|
|
|||
|
Long term capital leases
|
5.8
|
|
0.6
|
|
|||
|
Restructuring and exit
|
0.9
|
|
—
|
|
|||
|
Warranty
|
—
|
|
0.1
|
|
|||
|
Other
|
2.4
|
|
1.9
|
|
|||
|
Total
|
$
|
39.5
|
|
$
|
27.1
|
|
|
Warranty Accruals
Estimated warranty program claims are provided for at the time of sale. Amounts provided for are based on historical costs and adjusted for new claims. The changes in the carrying amount of product warranties through
December 31, 2014
and
2013
were as follows (in millions):
|
|
2014
|
2013
|
|||||
|
Beginning Balance, January 1
|
$
|
3.8
|
|
$
|
3.4
|
|
|
|
Provision for warranties
(2)
|
13.9
|
|
4.0
|
|
|||
|
Settlements made
|
(2.0
|
)
|
(3.6
|
)
|
|||
|
Other adjustments, including currency translation
|
(0.2
|
)
|
—
|
|
|||
|
Ending balance, December 31
|
$
|
15.5
|
|
$
|
3.8
|
|
|
(2)
The increase in the provision for warranties during the year ended December 31, 2014 was primarily driven by a charge related to a low level defect on one new version of a MEMS microphone for a specific platform at one key OEM customer.
7. Restructuring and Related Activities
Vienna action
On April 1, 2014, the Board of Directors authorized the cessation of manufacturing operations at the Company's Vienna, Austria facility as part of the Company's previously announced plan to consolidate its manufacturing footprint. This action was substantially complete by June 30, 2014. A summary of the pre-tax charge and remaining costs associated with the action is as follows (in millions):
|
Total Program
|
Recognized as of December 31, 2014
|
Remaining Costs to be Recognized
|
|||||||||
|
Severance pay and benefits
|
$
|
16.6
|
|
$
|
16.0
|
|
$
|
0.6
|
|
||
|
Contract termination and other costs
|
5.2
|
|
4.7
|
|
0.5
|
|
|||||
|
Total
|
$
|
21.8
|
|
$
|
20.7
|
|
$
|
1.1
|
|
||
Of the restructuring charges incurred to date,
$14.5 million
were classified as Cost of goods sold and
$6.2 million
were classified as Operating expenses on the respective Restructuring charges lines on the Consolidated Statements of Earnings. These charges all relate to cash expenditures, the majority of which were paid by the end of 2014.
In conjunction with this restructuring action, the Company also accelerated depreciation on fixed assets and recorded inventory charges related to product lines that were exited of
$18.8 million
for the year ended December 31, 2014. These non-cash costs were classified as Cost of goods sold on the Consolidated Statements of Earnings.
The Company anticipates annual savings of
$25.0 million
to
$30.0 million
associated with this action, mainly due to reduced salary and fixed asset depreciation expenses.
68
|
NOTES TO CONSOLIDATED FINANCIAL STATEMENTS
|
||
Other actions
In line with the Company's previously announced plans to consolidate its manufacturing footprint, the Company also had other actions during the
year
ended
December 31, 2014
. These actions were designed to better align the Company's operations with current market conditions through targeted facility consolidations, headcount reductions and other measures to further optimize operations. These actions included programs to transfer the Company's hearing health business and certain of its capacitor businesses into new and existing lower-cost Asian manufacturing facilities, as well as to reduce headcount in the consumer electronics business.
During the
year
ended
December 31, 2013
, the restructuring charges were related to programs to integrate activities within the consumer electronics business, to migrate the Company's U.K.-based capacitor production into our existing lower-cost Asian manufacturing facilities and to reduce in headcount within our German and North American operations that serve the telecom infrastructure market in order to better align the business with current market dynamics.
During the
year
ended
December 31, 2012
, the restructuring charges were primarily related to a North American facility consolidation in the oscillator business in response to the weakened telecommunications market.
The following table details restructuring charges incurred by reportable segment for the periods presented (in millions):
|
|
Years Ended December 31,
|
||||||||||
|
|
2014
|
|
2013
|
|
2012
|
||||||
|
Mobile Consumer Electronics
|
$
|
22.0
|
|
$
|
7.3
|
|
$
|
1.3
|
|
||
|
Specialty Components
|
7.6
|
|
9.0
|
|
4.6
|
|
|||||
|
Total
|
$
|
29.6
|
|
$
|
16.3
|
|
$
|
5.9
|
|
||
The following table details the Company’s severance and other restructuring accrual activity (in millions):
|
|
Severance Pay and Benefits
|
Contract Termination and Other Costs
|
Total
|
||||||||
|
Balance at January 1, 2012
|
$
|
—
|
|
$
|
0.1
|
|
$
|
0.1
|
|
||
|
Restructuring charges
|
3.8
|
|
2.1
|
|
5.9
|
|
|||||
|
Payments
|
(1.3
|
)
|
(1.7
|
)
|
(3.0
|
)
|
|||||
|
Balance at December 31, 2012
|
$
|
2.5
|
|
$
|
0.5
|
|
$
|
3.0
|
|
||
|
Restructuring charges
|
11.3
|
|
5.0
|
|
16.3
|
|
|||||
|
Payments
|
(8.7
|
)
|
(5.0
|
)
|
(13.7
|
)
|
|||||
|
Other, including foreign currency
|
(0.1
|
)
|
—
|
|
(0.1
|
)
|
|||||
|
Balance at December 31, 2013
|
$
|
5.0
|
|
$
|
0.5
|
|
$
|
5.5
|
|
||
|
Restructuring charges
|
24.7
|
|
4.9
|
|
29.6
|
|
|||||
|
Payments
|
(18.1
|
)
|
(2.0
|
)
|
(20.1
|
)
|
|||||
|
Other, including foreign currency
|
(0.7
|
)
|
(0.4
|
)
|
(1.1
|
)
|
|||||
|
Balance at December 31, 2014
|
$
|
10.9
|
|
$
|
3.0
|
|
$
|
13.9
|
|
||
The severance and restructuring accruals are recorded in the following accounts on the Consolidated Balance Sheet (in millions):
|
December 31, 2014
|
December 31, 2013
|
|||||||
|
Other accrued expenses
|
$
|
13.0
|
|
$
|
5.5
|
|
||
|
Other liabilities
(1)
|
0.9
|
|
—
|
|
||||
|
Total
|
$
|
13.9
|
|
$
|
5.5
|
|
||
(1)
This represents the long-term portion of the charges associated with lease obligations, net of reasonably obtainable sublease income.
69
|
NOTES TO CONSOLIDATED FINANCIAL STATEMENTS
|
||
8. Borrowings and Lines of Credit
On January 27, 2014, the Company entered into a
$200.0 million
five
-year senior secured revolving credit facility, as well as a
$300.0 million
five
-year senior secured term loan facility pursuant to the Original Credit Agreement, which are referred to collectively as the “Credit Facilities.” In connection with the Separation from Dover, the Company incurred
$100.0 million
of borrowings under the revolving credit facility and
$300.0 million
of borrowings under the term loan facility, in each case to finance a cash payment to Dover immediately prior to the Separation.
On December 31, 2014, the Company amended its Credit Facilities to (i) increase the amount of the revolving credit facility in the Original Credit Agreement to
$350.0 million
from
$200.0 million
, (ii) increase the amount of the letter of credit subfacility in the Original Credit Agreement to
$50.0 million
from
$25.0 million
, (iii) eliminated the swing line subfacility in the amount of up to
$35.0 million
in the Original Credit Agreement and (iv) reduced to
$100.0 million
from
$250.0 million
the amount of additional incremental revolving or term loans in the Original Credit Agreement. All other terms and conditions of the Credit Facilities remain essentially the same.
Borrowings at
December 31, 2014
consist of the following (in millions):
|
|
December 31, 2014
|
||
|
$300.0 million term loan due January 2019
|
$
|
300.0
|
|
|
$350.0 million revolving credit facility due January 2019
|
100.0
|
|
|
|
Total
|
400.0
|
|
|
|
Less: current maturities
|
15.0
|
|
|
|
Total long-term debt
|
$
|
385.0
|
|
The Credit Facilities contain customary covenants, which include, among others, limitations or restrictions on the incurrence of indebtedness, the incurrence of liens and entry into sales and leaseback transactions, mergers, transfers of all or substantially all assets, transactions with affiliates and certain transactions limiting the ability of subsidiaries to pay dividends, in each case, subject to certain exceptions. The facilities also include a requirement, to be tested quarterly, that the Company maintains both (i) a minimum ratio of consolidated EBITDA to consolidated interest expense of
3.25
to 1.0 and (ii) a maximum ratio of consolidated total indebtedness to consolidated EBITDA of
3.25
to 1.0. For these ratios, consolidated EBITDA and consolidated interest expense are calculated using the most recent four consecutive fiscal quarters in a manner defined in the credit agreement. The facilities include customary events of defaults. At
December 31, 2014
, the Company was in compliance with these covenants and it expects to remain in compliance with all of its debt covenants over the next twelve months.
The interest rate under the Credit Facilities is variable based on LIBOR at the time of the borrowing and the Company's leverage as measured by a total indebtedness to consolidated EBITDA ratio. Based upon the Company's total indebtedness to consolidated EBITDA ratio, the Company's borrowing rate could range from LIBOR +
1.25%
to LIBOR +
2.25%
. In addition, a commitment fee accrues on the average daily unused portion of the revolving facility at a rate of
0.2%
to
0.4%
. The weighted-average interest rate on the Company's borrowings under the Credit Facilities was
1.71%
for 2014. The weighted-average commitment fee on the revolving line of credit was
0.26%
for 2014.
Interest expense and interest income for the
years
ended
December 31, 2014
,
2013
and
2012
were as follows (in millions):
|
|
Years Ended December 31,
|
||||||||||
|
|
2014
|
2013
|
2012
|
||||||||
|
Interest expense
|
$
|
6.7
|
|
$
|
46.0
|
|
$
|
59.7
|
|
||
|
Interest income
|
(0.1
|
)
|
(4.0
|
)
|
(3.2
|
)
|
|||||
|
Interest expense, net
|
$
|
6.6
|
|
$
|
42.0
|
|
$
|
56.5
|
|
||
The interest expense, net for the
years
ended
December 31, 2013
and
2012
primarily relates to interest expense on the net notes payable with Dover that were settled during the fourth quarter of 2013 in anticipation of the Separation.
Term loan amortization payments due during the next five years as of December 31, 2014 are
$15.0 million
in 2015,
$30.0 million
in 2016,
$30.0 million
in 2017,
$30.0 million
in 2018 and the remaining
$195.0 million
in 2019.
70
|
NOTES TO CONSOLIDATED FINANCIAL STATEMENTS
|
||
Derivatives
The Company is exposed to market risk for changes in interest rates based on the structure of its Credit Facilities. In order to manage this risk, the Company entered into an interest rate swap on November 12, 2014 to convert variable interest rate payments into a fixed rate on a notional amount of
$100.0 million
of debt for monthly interest payments starting in January 2016 and ending in July 2018. The Company designated the swap as a cash-flow hedge with re-measurement gains and losses recorded through Accumulated Other Comprehensive Earnings. The fair value of the derivative liability was
$0.2 million
as of December 31, 2014.
9. Income Taxes
The components of (loss) earnings before income taxes were:
|
|
Years Ended December 31,
|
||||||||||
|
|
2014
|
2013
|
2012
|
||||||||
|
Domestic
|
$
|
(13.2
|
)
|
$
|
(2.9
|
)
|
$
|
(29.8
|
)
|
||
|
Foreign
|
(41.9
|
)
|
104.4
|
|
108.7
|
|
|||||
|
Total (loss) earnings before income taxes
|
$
|
(55.1
|
)
|
$
|
101.5
|
|
$
|
78.9
|
|
||
Income tax expense (benefit) for the years ended December 31,
2014
,
2013
and
2012
is comprised of the following:
|
|
Years Ended December 31,
|
||||||||||
|
|
2014
|
2013
|
2012
|
||||||||
|
Current:
|
|||||||||||
|
U.S. Federal
|
$
|
0.3
|
|
$
|
—
|
|
$
|
—
|
|
||
|
State and local
|
0.2
|
|
0.1
|
|
0.2
|
|
|||||
|
Foreign
|
30.2
|
|
25.6
|
|
16.7
|
|
|||||
|
Total current tax expense
|
30.7
|
|
25.7
|
|
16.9
|
|
|||||
|
Deferred:
|
|||||||||||
|
U.S. Federal
|
$
|
(10.3
|
)
|
$
|
0.5
|
|
$
|
0.5
|
|
||
|
State and local
|
(0.1
|
)
|
—
|
|
—
|
|
|||||
|
Foreign
|
11.6
|
|
(30.5
|
)
|
(17.6
|
)
|
|||||
|
Total deferred tax expense (benefit)
|
1.2
|
|
(30.0
|
)
|
(17.1
|
)
|
|||||
|
Total income tax expense (benefit)
|
$
|
31.9
|
|
$
|
(4.3
|
)
|
$
|
(0.2
|
)
|
||
The reconciliation of the U.S. federal income tax rate to the Company’s effective income tax rate was as follows:
|
|
Years Ended December 31,
|
|||||||
|
|
2014
|
2013
|
2012
|
|||||
|
U.S. Federal income tax rate
|
(35.0
|
)%
|
35.0
|
%
|
35.0
|
%
|
||
|
State and local taxes, net of Federal income tax benefit
|
(1.8
|
)%
|
0.1
|
%
|
0.1
|
%
|
||
|
Foreign operations tax effect
|
(2.7
|
)%
|
(41.4
|
)%
|
(49.8
|
)%
|
||
|
Research & experimentation tax credits
|
(3.9
|
)%
|
(0.8
|
)%
|
—
|
%
|
||
|
Valuation allowance
|
104.6
|
%
|
0.7
|
%
|
11.6
|
%
|
||
|
Tax contingencies
|
1.4
|
%
|
0.6
|
%
|
0.6
|
%
|
||
|
Other, principally non-tax deductible items
|
(12.2
|
)%
|
1.6
|
%
|
2.3
|
%
|
||
|
Prior period items
|
7.5
|
%
|
—
|
%
|
—
|
%
|
||
|
Effective income tax rate
|
57.9
|
%
|
(4.2
|
)%
|
(0.2
|
)%
|
||
71
|
NOTES TO CONSOLIDATED FINANCIAL STATEMENTS
|
||
The Company’s effective tax rate is favorably impacted by two tax holidays granted to us by Malaysia effective through December 31, 2021. These tax holidays are subject to the Company’s satisfaction of certain conditions, including investment or sales thresholds, which the Company expects to maintain. If the Company fails to satisfy such conditions, the Company’s effective tax rate may be significantly adversely impacted. The benefit of these incentives for the years ending December 31,
2014
,
2013
and
2012
is estimated to be
$16.8 million
,
$32.0 million
and
$45.1 million
, respectively. The benefit of the tax holidays on a per share basis for the years ending December 31,
2014
,
2013
and
2012
was
$0.20
,
$0.38
and
$0.53
, respectively.
The components of the Company’s deferred tax assets and liabilities included the following:
|
December 31, 2014
|
December 31, 2013
|
||||||
|
Deferred tax assets:
|
|||||||
|
Accrued compensation, principally post-retirement and other employee benefits
|
$
|
11.3
|
|
$
|
4.0
|
|
|
|
Accrued expenses, principally for state income taxes, interest and warranty
|
4.8
|
|
3.0
|
|
|||
|
Net operating loss and other carryforwards
|
101.3
|
|
139.4
|
|
|||
|
Inventories, principally due to reserves for financial reporting purposes and capitalization for tax purposes
|
6.9
|
|
6.0
|
|
|||
|
Accounts receivable, principally due to allowance for doubtful accounts
|
0.1
|
|
0.2
|
|
|||
|
Prepaid defined benefit plan assets
|
1.7
|
|
2.3
|
|
|||
|
Plant and equipment, principally due to differences in depreciation
|
6.3
|
|
0.2
|
|
|||
|
Total gross deferred tax assets
|
132.4
|
|
155.1
|
|
|||
|
Valuation allowance
|
(80.7
|
)
|
(71.5
|
)
|
|||
|
Total deferred tax assets
|
$
|
51.7
|
|
$
|
83.6
|
|
|
|
Deferred tax liabilities:
|
|||||||
|
Intangible assets, principally due to different tax and financial reporting bases and amortization lives
|
$
|
(79.4
|
)
|
$
|
(105.6
|
)
|
|
|
Other liabilities
|
(1.9
|
)
|
(3.2
|
)
|
|||
|
Total gross deferred tax liabilities
|
(81.3
|
)
|
(108.8
|
)
|
|||
|
Net deferred tax liability
|
$
|
(29.6
|
)
|
$
|
(25.2
|
)
|
|
|
Classified as follows in the consolidated balance sheets:
|
|||||||
|
Deferred tax assets (current deferred tax assets)
|
$
|
9.8
|
|
$
|
10.7
|
|
|
|
Federal and other taxes on income (current deferred tax liabilities)
|
(0.2
|
)
|
—
|
|
|||
|
Other assets and deferred charges (non-current deferred tax assets)
|
10.0
|
|
10.0
|
|
|||
|
Deferred income taxes (non-current deferred tax liabilities)
|
(49.2
|
)
|
(45.9
|
)
|
|||
|
Net deferred tax liability
|
$
|
(29.6
|
)
|
$
|
(25.2
|
)
|
|
The Company’s income tax balances were adjusted to reflect the Company’s post-Separation stand-alone income tax positions, including those related to tax loss and credit carryforwards, other deferred tax assets and valuation allowances. These Separation-related adjustments resulted in a
$10.1 million
increase to the net deferred tax liability, primarily due to a decrease in tax loss and credit carryforwards, partially offset by a decrease in the Company's valuation allowances. The increase in the net deferred tax liability was offset by a corresponding decrease in Net Former Parent Company Investment.
The Company recorded valuation allowances of
$80.7 million
and
$71.5 million
at December 31, 2014 and 2013, respectively, against deferred tax assets principally associated with certain tax net operating loss and tax credit carryforwards, as the Company believes it is more likely than not that these assets will not be realized. Of the
$80.7 million
valuation allowance at December 31, 2014,
$36.8 million
was related to a change in judgment regarding the realizability of the beginning of the year deferred tax assets. Management believes that it is more likely than not that the Company will realize the benefits of the remaining deferred tax assets. The amount of the deferred tax asset considered realizable, however, could be adjusted if estimates of future taxable income during the carryforward period are reduced or increased or if objective negative evidence in the form of cumulative losses is no longer present and additional weight may be given to subjective evidence such as our projections for growth.
72
|
NOTES TO CONSOLIDATED FINANCIAL STATEMENTS
|
||
At December 31,
2014
, the Company had
$45.3 million
of state net operating losses that are available between
2015
and
2032
. There are
$371.9 million
of non-U.S. net operating loss carryforwards, of which
$141.1 million
will expire between
2017
and
2019
and
$230.8 million
can be carried forward indefinitely.
The Company has
$1.0 million
of U.S. federal research and development credits that begin to expire in
2034
and
$3.5 million
of foreign tax credits that begin to expire in
2024
. In addition, the Company has
$2.2 million
of state credits, which will expire between
2015
and
2028
if unused.
The Company has not provided for U.S. federal income taxes on the undistributed earnings of its international subsidiaries totaling approximately
$1.8 billion
at
December 31, 2014
, because such earnings are reinvested in foreign jurisdictions, and it is currently intended that they will continue to be reinvested indefinitely. It is not practicable to estimate the amount of additional tax that might be payable on this foreign income if distributed.
Unrecognized Tax Benefits
The Company records interest and penalties associated with unrecognized tax benefits as a component of income tax expense. During the years ended December 31,
2014
,
2013
and
2012
, the Company recorded potential interest expense of
$0.6 million
,
$0.3 million
and
$0.3 million
, respectively. Total accrued interest at December 31,
2014
,
2013
and
2012
was
$1.3 million
,
$0.9 million
and
$0.5 million
, respectively, and was included in other liabilities.
The Company's tax returns are routinely audited by the tax authorities in the relevant jurisdictions. For tax years before
2010
, the Company is no longer subject to U.S. federal income tax examinations. For tax years before
2007
, the Company’s Malaysian subsidiaries are no longer subject to examination. It is reasonably possible that the gross amount of unrecognized tax benefits will decrease by
$0.8 million
during the next twelve months. Included in the balance of total unrecognized tax benefits at
December 31, 2014
, are potential benefits of
$5.0 million
, which if recognized, would affect the effective rate on income from continuing operations.
|
Unrecognized tax benefits at January 1, 2012
|
$
|
6.4
|
|
|
Additions based on tax positions related to the current year
|
0.1
|
|
|
|
Additions for tax positions of prior years
|
0.1
|
|
|
|
Unrecognized tax benefits at December 31, 2012
|
$
|
6.6
|
|
|
Additions based on tax positions related to the current year
|
0.2
|
|
|
|
Reductions for tax positions of prior years
|
(1.3
|
)
|
|
|
Unrecognized tax benefits at December 31, 2013
|
$
|
5.5
|
|
|
Additions based on tax positions related to the current year
|
0.1
|
|
|
|
Additions for tax positions of prior years
|
0.7
|
|
|
|
Reductions for tax positions of prior years
|
(1.3
|
)
|
|
|
Unrecognized tax benefits at December 31, 2014
|
$
|
5.0
|
|
10. Equity Incentive Program
The following table summarizes the compensation expense recognized by the Company for the periods presented (in millions):
|
|
Years Ended December 31,
|
||||||||||
|
|
2014
|
2013
|
2012
|
||||||||
|
Pre-tax compensation expense
|
$
|
9.0
|
|
$
|
2.0
|
|
$
|
1.9
|
|
||
|
Tax benefit
|
(3.1
|
)
|
(0.7
|
)
|
(0.6
|
)
|
|||||
|
Total stock-based compensation expense, net of tax
|
$
|
5.9
|
|
$
|
1.3
|
|
$
|
1.3
|
|
||
For 2014, stock-based compensation expense of
$7.9 million
was classified in Selling and administrative expenses,
$0.8 million
in Cost of goods sold and
$0.3 million
in Research and development expenses. For both 2013 and 2012, stock-based compensation expense was reported in Selling and administrative expenses.
73
|
NOTES TO CONSOLIDATED FINANCIAL STATEMENTS
|
||
Compensation expense for stock-based awards is measured based on the fair value of the awards, as of the date the stock-based awards are granted and adjusted to the estimated number of awards that are expected to vest. Forfeitures are estimated based on historical experience at the time of grant and revised in subsequent periods if actual forfeitures differ from those estimates. Compensation cost for stock-based awards are amortized over their service period.
Prior to the Separation, Knowles employees participated in Dover's incentive stock program. Stock-based compensation expense was allocated to Knowles based on the portion of Dover's equity incentive program in which Knowles employees participated. Adopted in connection with the Separation, Knowles' Equity and Cash Incentive Plan provides for the assumption of certain awards granted under Dover's equity incentive program and authorizes the grant of several different forms of benefits, including stock options, restricted stock units ("RSUs") and stock-settled stock appreciation rights ("SSARs").
In connection with the Separation, Dover equity awards previously granted to employees of the Company were converted to Knowles equity awards under the Company's Equity and Cash Incentive Plan. In general, each award is subject to the same terms and conditions as were in effect prior to the Separation, except that Dover performance shares converted to time-based RSUs. In addition, the Company made a grant comprised of both stock options and time-based RSUs that will vest
50%
on the third and fourth anniversaries from the date of the grant. The Company also made grants of both stock options and time-based RSUs that will vest evenly over the next
three
years. Lastly, the independent directors received a grant of Company shares that vested immediately in March 2014 and an annual grant for their service during the year ended December 31, 2014, receipt of which was deferred by some of the recipients. The Company has elected to use the straight-line method to attribute the expense over the service period of the awards.
SSARs and Stock Option
s
The fair value of stock options granted by the Company subsequent to the Separation and our Former Parent Company's SSARs and stock options granted to Knowles employees prior to the Separation was estimated on the date of grant using a Black-Scholes option-pricing model based on the assumptions shown in the table below.
|
Knowles Grants
|
Former Parent Grants
|
||||||
|
2014
|
2013
|
2012
|
|||||
|
Risk-free interest rate
|
1.32
|
%
|
to
|
1.70%
|
1.39%
|
1.05%
|
|
|
Dividend yield
|
—%
|
2.06%
|
2.03%
|
||||
|
Expected life (years)
|
4.5
|
|
to
|
5.3
|
7.1
|
5.7
|
|
|
Volatility
|
42.9
|
%
|
to
|
49.9%
|
33.8%
|
36.4%
|
|
|
Fair value at date of grant
|
$7.99
|
to
|
$13.50
|
$20.62
|
$18.51
|
||
For periods presented prior to the Separation, all stock-based compensation awards were made by our Former Parent and used our Former Parent assumptions for volatility, dividend yield and term.
Knowles' assumptions were utilized for grants made on or after February 28, 2014. The determination of expected volatility is based on a blended peer group volatility for companies in similar industries, stage of life and with similar market capitalization since there is not sufficient historical volatility data for Knowles common stock over the period commensurate with the expected term of stock options, as well as other relevant factors. The risk-free interest rate is based on U.S. government issues with a remaining term equal to the expected life of the stock options. The expected term is the period over which our employees are expected to hold their options. It is based on the simplified method from the Securities and Exchange Commission’s safe harbor guidelines. The Company does not anticipate paying dividends over the expected term.
The exercise price per share for the stock options granted by the Company was equal to the closing price of Knowles' stock on the New York Stock Exchange on the date of the grant. The period during which options granted by the Company were exercisable was fixed by Knowles' Compensation Committee at the time of grant. Generally, the stock options expire at the end of
seven
years.
The following table summarizes the Company's SSAR and stock option activity for the
year ended December 31,
2014
(in millions except share and per share amounts).
|
|
SSARs
|
Stock Options
|
|||||||||||||||||||||||
|
|
Number of Shares
|
Weighted-Average Exercise Price
|
Aggregate Intrinsic Value
|
Weighted-Average Remaining Contractual Term (Years)
|
Number of Shares
|
Weighted-Average Exercise Price
|
Aggregate Intrinsic Value
|
Weighted-Average Remaining Contractual Term (Years)
|
|||||||||||||||||
|
Outstanding at December 31, 2013
|
—
|
|
$
|
—
|
|
|
|
—
|
|
$
|
—
|
|
|
|
|||||||||||
|
Converted
|
1,085,643
|
|
20.85
|
|
13,680
|
|
12.65
|
|
|||||||||||||||||
|
Granted
|
—
|
|
—
|
|
1,354,923
|
|
29.34
|
|
|||||||||||||||||
|
Exercised
|
(7,219
|
)
|
22.17
|
|
(11,280
|
)
|
12.65
|
|
|||||||||||||||||
|
Forfeited
|
(14,041
|
)
|
22.79
|
|
(29,333
|
)
|
29.53
|
|
|||||||||||||||||
|
Outstanding at December 31, 2014
|
1,064,383
|
|
$
|
20.81
|
|
$
|
3.0
|
|
6.7
|
1,327,990
|
|
$
|
29.31
|
|
$
|
0.1
|
|
6.2
|
|||||||
|
Exercisable at December 31, 2014
|
386,308
|
|
$
|
17.24
|
|
$
|
2.4
|
|
5.2
|
2,400
|
|
$
|
12.65
|
|
$
|
—
|
|
0.1
|
|||||||
Unrecognized compensation expense related to SSARs and stock options not yet exercisable at
December 31, 2014
was
$0.9 million
and
$12.6 million
, respectively. This cost is expected to be recognized over a weighted-average period of
1.0
years for SSARs and
2.1
years for stock options.
The aggregate intrinsic value in the table above represents the difference between the Company's closing stock price on December 31, 2014 and the exercise price of each stock option, multiplied by the number of in-the-money stock options.
Other information regarding the exercise of SSARs and stock options is listed below (in millions):
|
Years Ended December 31,
|
|||||||||||
|
2014
|
2013
|
2012
|
|||||||||
|
SSARs
|
|||||||||||
|
Fair value of SSARs that became exercisable
|
$
|
1.1
|
|
$
|
1.2
|
|
$
|
0.8
|
|
||
|
Aggregate intrinsic value of SSARs exercised
|
$
|
0.1
|
|
$
|
7.0
|
|
$
|
3.1
|
|
||
|
Stock Options
|
|||||||||||
|
Cash received by Knowles for exercise of stock options
|
$
|
0.1
|
|
N/A
|
N/A
|
||||||
|
Cash received by the Former Parent for exercise of stock options
|
N/A
|
$
|
0.8
|
|
$
|
0.9
|
|
||||
|
Aggregate intrinsic value of options exercised
|
$
|
0.2
|
|
$
|
0.9
|
|
$
|
0.7
|
|
||
74
|
NOTES TO CONSOLIDATED FINANCIAL STATEMENTS
|
||
RSUs
The following table summarizes the Company's RSU balances for the
year ended December 31,
2014
.
|
|
Share units
|
Weighted-average grant date fair value
|
||||
|
Unvested at December 31, 2013
|
—
|
|
$
|
—
|
|
|
|
Converted
(1)
|
21,557
|
|
12.36
|
|
||
|
Granted
|
377,848
|
|
29.35
|
|
||
|
Forfeited
|
(8,466
|
)
|
29.53
|
|
||
|
Unvested at December 31, 2014
|
390,939
|
|
$
|
28.41
|
|
|
(1)
The weighted-average grant date fair value is equal to the fair value at the date of conversion as opposed to the fair value when originally issued under Dover's plan.
At
December 31, 2014
,
$8.6 million
of unrecognized compensation expense related to RSUs is expected to be recognized over a weighted-average period of
2.1
years.
Director Awards
The independent directors received one-time grants of shares that vested immediately upon issuance on March 7, 2014. Starting in 2014, stock awards were also issued during the fourth quarter of 2014 as part of the independent directors' annual compensation under Knowles' Equity and Cash Incentive Plan. Independent directors can elect to defer receipt of stock. During the year ended December 31, 2014, the Company awarded
58,750
shares of common stock to outside directors with a weighted average fair value on the date of the award of
$22.30
.
11. Commitments and Contingent Liabilities
The Company is involved in various legal proceedings and claims arising in the ordinary course of its business, including those related to intellectual property, which may be owned by it or others. The Company owns many patents covering products, technology and manufacturing processes. Some of these patents have been and may continue to be challenged by others. In appropriate cases, the Company has taken and will take steps to protect and defend its patents and other intellectual property, including through the use of legal proceedings in various jurisdictions around the world. Such steps have resulted in and may continue to result in retaliatory legal proceedings, including litigation or other legal proceedings in various jurisdictions and forums around the world alleging infringement by the Company of patents owned by others. The costs of investigations and legal proceedings, particularly multi-forum litigation, relating to the enforcement and defense of the Company’s intellectual property, may be material. Additionally, in multi-forum disputes, the Company may incur adverse judgments with regard to certain claims in certain jurisdictions and forums while still contesting other related claims against the same opposing party in other jurisdictions and forums. In the opinion of management, there was not at least a reasonable probability that the Company may have incurred a material loss, or a material loss in excess of a recorded accrual, with respect to loss contingencies. However, the outcome of legal proceedings and claims brought against the Company is subject to significant uncertainty. Therefore, although management considers the likelihood of such an outcome to be remote, if one or more of these legal matters were resolved against the Company in a reporting period for amounts in excess of management’s expectations or the amounts accrued, if any, the Company's Consolidated Financial Statements for that reporting period could be materially adversely affected.
In addition, the Company may, on a limited customer specific basis, provide contractual indemnities for certain losses that arise out of claims that its products infringe on the intellectual property of others. Historically, the Company has not made significant payments under such indemnity arrangements. At
December 31, 2014
and
2013
, the Company’s legal reserves were not significant.
75
|
NOTES TO CONSOLIDATED FINANCIAL STATEMENTS
|
||
Lease Commitments
The Company leases certain facilities and equipment under operating leases, many of which contain renewal options. Total rental expense, net of insignificant sublease rental income, for all operating leases was
$11.0 million
,
$11.3 million
and
$10.3 million
for the years ended
December 31, 2014
,
2013
and
2012
, respectively. Contingent rentals under the operating leases were not significant.
In September of 2013, the Company entered into an agreement for two new facilities and related equipment in China. The lease for one of the facilities and related equipment began in the fourth quarter of 2014. The second facility and related equipment remains under construction with occupancy anticipated for the first quarter of 2015. The expected operating lease payments of
$10.9 million
and capital lease payments of
$17.3 million
for the second facility and equipment are reflected in rental commitments in the table below.
The aggregate future minimum lease payments for capital leases, operating leases and rental commitments as of
December 31, 2014
are as follows (in millions):
|
Capital Leases
|
Operating Leases
|
Rental Commitments
|
|||||||||
|
2015
|
$
|
1.2
|
|
$
|
11.7
|
|
$
|
3.1
|
|
||
|
2016
|
1.1
|
|
3.0
|
|
3.2
|
|
|||||
|
2017
|
0.8
|
|
2.1
|
|
2.7
|
|
|||||
|
2018
|
0.9
|
|
1.9
|
|
2.7
|
|
|||||
|
2019
|
0.9
|
|
1.6
|
|
2.7
|
|
|||||
|
2020 and thereafter
|
4.0
|
|
5.2
|
|
13.8
|
|
|||||
|
Total
|
$
|
8.9
|
|
$
|
25.5
|
|
$
|
28.2
|
|
||
12. Employee Benefit Plans
Prior to the Separation, eligible U.S. employees and retirees of the Company participated in a defined benefit pension plan sponsored by Dover. Effective December 31, 2013, the Company’s participants in this plan no longer accrue benefits. The Company did not assume any funding requirements or obligations related to the U.S. defined benefit pension plan upon the distribution date as this obligation is being maintained and serviced by Dover. As a result, the portion of the Company’s liability associated with this U.S. plan is not reflected in the Company’s Consolidated Balance Sheets.
Dover also provided to certain management employees, through non-qualified plans, supplemental retirement benefits in excess of qualified plan limits imposed by federal tax law. Effective December 31, 2013, the Company’s participants no longer accrue benefits. In connection with the distribution from Dover on February 28, 2014, Dover transferred the corresponding liability to Knowles.
Dover provided a defined contribution plan to its eligible U.S. employees and retirees in which Knowles employees participated. Knowles adopted its own defined contribution plan effective January 1, 2014. The Company's expense relating to defined contribution plans was
$5.5 million
,
$3.8 million
and
$3.3 million
for the years ended December 31,
2014
,
2013
and
2012
, respectively.
Knowles sponsors
four
defined benefit pension plans to certain non-U.S. employees. All four plans are closed to new participants; however, all active participants in these plans continue to accrue benefits. These plans are considered direct obligations of the Company and have been recorded within the accompanying Consolidated Financial Statements.
The Company does not have any other post-retirement employee benefit plans other than those plans mentioned above.
76
|
NOTES TO CONSOLIDATED FINANCIAL STATEMENTS
|
||
Non-U.S. Defined Benefit Pension Plans
Obligations and Funded Status
The following tables summarize the balance sheet impact, including the benefit obligations, assets and funded status associated with the Company's four defined benefit plans for non-U.S. participants at
December 31, 2014
and
2013
. None of these plans are individually significant (in millions).
|
December 31,
|
|||||||
|
|
2014
|
2013
|
|||||
|
Change in benefit obligation:
|
|
|
|||||
|
Benefit obligation at beginning of year
|
$
|
59.8
|
|
$
|
58.3
|
|
|
|
Benefits earned during the year
|
0.5
|
|
0.6
|
|
|||
|
Interest cost
|
2.5
|
|
2.4
|
|
|||
|
Benefits paid
|
(2.0
|
)
|
(1.9
|
)
|
|||
|
Actuarial loss
|
6.3
|
|
2.3
|
|
|||
|
Settlement and curtailment gains
|
(4.7
|
)
|
(3.0
|
)
|
|||
|
Currency translation and other
|
(4.1
|
)
|
1.1
|
|
|||
|
Benefit obligation at end of year
|
58.3
|
|
59.8
|
|
|||
|
Change in plan assets:
|
|
|
|
|
|||
|
Fair value of plan assets at beginning of year
|
45.8
|
|
40.1
|
|
|||
|
Actual return on plan assets
|
4.0
|
|
4.4
|
|
|||
|
Company contributions
|
5.8
|
|
2.4
|
|
|||
|
Benefits paid
|
(2.0
|
)
|
(1.9
|
)
|
|||
|
Settlements and curtailments
|
(4.7
|
)
|
—
|
|
|||
|
Currency translation and other
|
(3.0
|
)
|
0.8
|
|
|||
|
Fair value of plan assets at end of year
|
45.9
|
|
45.8
|
|
|||
|
Funded status
|
$
|
(12.4
|
)
|
$
|
(14.0
|
)
|
|
|
Amounts recognized in the balance sheets consist of:
|
|
|
|
|
|||
|
Other assets and deferred charges
|
$
|
—
|
|
$
|
0.1
|
|
|
|
Accrued compensation and employee benefits
|
(1.8
|
)
|
(0.3
|
)
|
|||
|
Other liabilities
|
(10.6
|
)
|
(13.8
|
)
|
|||
|
Funded status
|
$
|
(12.4
|
)
|
$
|
(14.0
|
)
|
|
|
Accumulated Other Comprehensive Loss:
|
|||||||
|
Net actuarial losses
|
$
|
14.7
|
|
$
|
10.6
|
|
|
|
Deferred taxes
|
(3.6
|
)
|
(2.7
|
)
|
|||
|
Total Accumulated Other Comprehensive Loss, net of tax
|
11.1
|
|
7.9
|
|
|||
|
Net amount recognized at December 31,
|
$
|
(1.3
|
)
|
$
|
(6.1
|
)
|
|
|
Accumulated benefit obligations
|
$
|
56.2
|
|
$
|
56.4
|
|
|
Pension plans with accumulated benefit obligations in excess of plan assets consisted of the following at
December 31, 2014
and
2013
(in millions):
|
December 31,
|
|||||||
|
|
2014
|
2013
|
|||||
|
Projected benefit obligation
|
$
|
58.3
|
|
$
|
38.6
|
|
|
|
Accumulated benefit obligation
|
56.2
|
|
35.3
|
|
|||
|
Fair value of plan assets
|
45.9
|
|
24.5
|
|
|||
77
|
NOTES TO CONSOLIDATED FINANCIAL STATEMENTS
|
||
Net Periodic Benefit Cost
Components of the net periodic benefit cost were as follows (in millions):
|
|
Non-U.S. Plans
|
||||||||||
|
Years Ended December 31,
|
|||||||||||
|
|
2014
|
2013
|
2012
|
||||||||
|
Service cost
|
$
|
0.5
|
|
$
|
0.6
|
|
$
|
0.6
|
|
||
|
Interest cost
|
2.5
|
|
2.4
|
|
2.5
|
|
|||||
|
Expected return on plan assets
|
(2.8
|
)
|
(2.4
|
)
|
(2.4
|
)
|
|||||
|
Amortization of recognized actuarial loss
|
0.2
|
|
0.2
|
|
0.2
|
|
|||||
|
Settlement and curtailment loss
|
0.8
|
|
0.4
|
|
0.3
|
|
|||||
|
Total net periodic benefit cost
|
$
|
1.2
|
|
|
$
|
1.2
|
|
$
|
1.2
|
|
|
The Company expects to amortize an actuarial loss of
$0.4 million
from accumulated other comprehensive loss into net periodic benefit cost during the year ended December 31,
2015
.
Assumptions
The Company determines actuarial assumptions on an annual basis. The actuarial assumptions used for the Company’s four defined benefit plans for non-U.S. participants will vary depending on the applicable country and as such, the tables below include these assumptions by country, as well as in total.
The assumptions used in determining the benefit obligations were as follows:
|
Non-U.S. Plans
|
|||||
|
December 31,
|
|||||
|
|
2014
|
2013
|
|||
|
Discount rate
|
|||||
|
Austria
|
2.00
|
%
|
3.25
|
%
|
|
|
Taiwan
|
2.00
|
%
|
2.00
|
%
|
|
|
United Kingdom
|
3.75
|
%
|
4.50
|
%
|
|
|
Weighted average
|
3.59
|
%
|
4.24
|
%
|
|
|
Average wage increase
|
|||||
|
Austria
|
N/A
|
|
3.00
|
%
|
|
|
Taiwan
|
4.00
|
%
|
4.00
|
%
|
|
|
United Kingdom
|
4.25
|
%
|
4.40
|
%
|
|
|
Weighted average
|
4.23
|
%
|
4.05
|
%
|
|
78
|
NOTES TO CONSOLIDATED FINANCIAL STATEMENTS
|
||
The assumptions used in determining the net periodic benefit cost were as follows:
|
Years Ended December 31,
|
||||||||
|
|
2014
|
2013
|
2012
|
|||||
|
Discount rate
|
||||||||
|
Austria
|
3.25
|
%
|
3.25
|
%
|
5.25
|
%
|
||
|
Taiwan
|
2.00
|
%
|
1.75
|
%
|
1.75
|
%
|
||
|
United Kingdom
|
4.50
|
%
|
4.75
|
%
|
5.25
|
%
|
||
|
Weighted average
|
4.24
|
%
|
4.52
|
%
|
5.16
|
%
|
||
|
Average wage increase
|
||||||||
|
Austria
|
3.00
|
%
|
3.00
|
%
|
3.00
|
%
|
||
|
Taiwan
|
4.00
|
%
|
4.00
|
%
|
4.00
|
%
|
||
|
United Kingdom
|
4.40
|
%
|
4.00
|
%
|
4.00
|
%
|
||
|
Weighted average
|
4.05
|
%
|
3.21
|
%
|
3.30
|
%
|
||
|
Expected return on plan assets
|
||||||||
|
Austria
(1)
|
N/A
|
|
N/A
|
|
N/A
|
|
||
|
Taiwan
|
2.00
|
%
|
2.00
|
%
|
2.50
|
%
|
||
|
United Kingdom
|
6.51
|
%
|
6.50
|
%
|
6.63
|
%
|
||
|
Weighted average
|
6.35
|
%
|
6.46
|
%
|
6.56
|
%
|
||
(1)
This plan is unfunded; therefore, no assumption of an expected return on plan assets is factored into net periodic benefit cost.
The Company’s discount rate assumption is determined by developing a yield curve based on high quality corporate bonds with maturities matching the plans’ expected benefit payment streams. The plans’ expected cash flows are then discounted by the resulting year-by-year spot rates.
Plan Assets
The primary financial objective of the plans is to secure participant retirement benefits. Accordingly, the key objective in the plans’ financial management is to promote stability and, to the extent appropriate, growth in the funded status. Related and supporting financial objectives are established in conjunction with a review of current and projected plan financial requirements.
As it relates to the funded defined benefit pension plans, the Company’s funding policy is consistent with the funding requirements of applicable local non-U.S. laws. The Company is responsible for overseeing the management of the investments of the plans’ assets and otherwise ensuring that the plans’ investment programs are in compliance with applicable local law, other relevant legislation and related plan documents. Where relevant, the Company has retained professional investment managers to manage the plans’ assets and implement the investment process. The investment managers, in implementing their investment processes, have the authority and responsibility to select appropriate investments in the asset classes specified by the terms of their applicable prospectus or investment manager agreements with the plans.
The assets of the plans are invested to achieve an appropriate return for the plans consistent with a prudent level of risk. The asset return objective is to achieve, as a minimum over time, the passively managed return earned by market index funds, weighted in the proportions outlined by the asset class exposures identified in the plans’ strategic allocation. The expected return on assets assumption used for pension expense is developed through analysis of historical market returns, statistical analysis, current market conditions and the past experience of plan asset investments.
Fair Value Measurements
Accounting Standards Codification ("ASC") 820, “Fair Value Measurements and Disclosures,” establishes a fair value hierarchy that requires the Company to maximize the use of observable inputs and minimize the use of unobservable inputs when measuring fair value. A financial instrument’s categorization within the hierarchy is based on the lowest level of input that is significant to the fair value measurement. ASC 820 establishes three levels of inputs that may be used to measure fair value.
Level 1 inputs are quoted prices (unadjusted) in active markets for identical assets or liabilities.
79
|
NOTES TO CONSOLIDATED FINANCIAL STATEMENTS
|
||
Level 2 inputs include inputs other than Level 1 that are observable, either directly or indirectly, such as quoted prices in active markets for similar assets and liabilities, quoted prices for identical or similar assets or liabilities in markets that are not active, or other inputs that are observable or can be corroborated by observable market data for substantially the full term of assets or liabilities.
Level 3 inputs are unobservable inputs in which little or no market data exists, therefore requiring an entity to develop its own assumptions.
The fair values of plan assets by asset category within the ASC 820 hierarchy were as follows at
December 31, 2014
and
2013
(in millions):
|
|
December 31, 2014
|
December 31, 2013
|
|||||||||||||||||||||||||||||
|
|
Level 1
|
Level 2
|
Level 3
|
Total Fair Value
|
Level 1
|
Level 2
|
Level 3
|
Total Fair Value
|
|||||||||||||||||||||||
|
Asset category:
|
|
|
|
|
|
|
|
||||||||||||||||||||||||
|
Fixed income investments
|
$
|
—
|
|
$
|
14.6
|
|
$
|
—
|
|
$
|
14.6
|
|
$
|
—
|
|
$
|
13.3
|
|
$
|
—
|
|
$
|
13.3
|
|
|||||||
|
Common stock funds
|
—
|
|
24.3
|
|
—
|
|
24.3
|
|
—
|
|
29.3
|
|
—
|
|
29.3
|
|
|||||||||||||||
|
Cash and equivalents
|
1.1
|
|
—
|
|
—
|
|
1.1
|
|
1.0
|
|
—
|
|
—
|
|
1.0
|
|
|||||||||||||||
|
Other
|
—
|
|
5.9
|
|
—
|
|
5.9
|
|
—
|
|
2.2
|
|
—
|
|
2.2
|
|
|||||||||||||||
|
Total
|
$
|
1.1
|
|
$
|
44.8
|
|
$
|
—
|
|
$
|
45.9
|
|
$
|
1.0
|
|
$
|
44.8
|
|
$
|
—
|
|
$
|
45.8
|
|
|||||||
There were
no
significant transfers between Level 1 and Level 2 assets during the year ended
December 31, 2014
or
2013
.
Fixed income investments include government and municipal securities and corporate bonds, which are valued based on yields currently available on comparable securities of issuers with similar credit ratings.
Common stock funds consist of mutual funds and collective trusts. Mutual funds are valued by obtaining quoted prices from nationally recognized securities exchanges. Collective trusts are valued using Net Asset Value (the “NAV”) as of the last business day of the year. The NAV is based on the underlying value of the assets owned by the fund minus its liabilities and then divided by the number of shares outstanding. The value of the underlying assets is based on quoted prices in active markets.
The methods described above may produce a fair value calculation that may not be indicative of net realizable value or reflective of future fair values. Furthermore, while the Company believes its valuation methods are appropriate and consistent with other market participants, the use of different methodologies or assumptions to determine the fair value of certain financial instruments could result in a different fair value measurement at the reporting date.
Future Estimates
Benefit Payments
Estimated future benefit payments to retirees, which reflect expected future service, are as follows (in millions):
|
Non-U.S. Plans
|
|||
|
2015
|
$
|
3.4
|
|
|
2016
|
1.7
|
|
|
|
2017
|
1.7
|
|
|
|
2018
|
1.7
|
|
|
|
2019
|
1.9
|
|
|
|
2020 - 2024
|
11.0
|
|
|
80
|
NOTES TO CONSOLIDATED FINANCIAL STATEMENTS
|
||
Contributions
Generally, annual contributions are made at such times and in amounts as required by law and agreed with the trustees of the non-U.S. defined benefit plans. The Company estimates it will pay
$1.5 million
during the year ended December 31,
2015
related to contributions to these plans. This amount may vary based on updated funding agreements with the Trustees of these plans.
Non-qualified Supplemental Retirement Plan
In connection with the Separation from Dover on February 28, 2014, Dover transferred an unfunded non-qualified supplemental retirement plan liability to Knowles. The net amount recognized on the balance sheet at
December 31, 2014
is shown in the table below (in millions).
|
December 31, 2014
|
|||
|
Other liabilities
|
$
|
(3.6
|
)
|
|
Total Accumulated Other Comprehensive Loss, net of tax
|
0.6
|
|
|
|
Net amount recognized at December 31, 2014
|
$
|
(3.0
|
)
|
The actuarial loss arising during the year ended December 31, 2014 was
$0.6 million
(
$0.4 million
net of tax). The amortization of actuarial losses included in net periodic pension cost during the year ended December 31, 2014 was
$0.2 million
(
$0.1 million
net of tax).
13. Other Comprehensive (Loss) Earnings
The amounts recognized in other comprehensive (loss) earnings were as follows (in millions):
|
Year Ended
|
|||||||||||
|
|
December 31, 2014
|
||||||||||
|
|
Pre-tax
|
Tax
|
Net of tax
|
||||||||
|
Foreign currency translation
|
$
|
(78.6
|
)
|
$
|
—
|
|
$
|
(78.6
|
)
|
||
|
Employee benefit plans
|
(4.4
|
)
|
0.9
|
|
(3.5
|
)
|
|||||
|
Changes in fair value of cash flow hedges
|
(0.3
|
)
|
0.1
|
|
(0.2
|
)
|
|||||
|
Total other comprehensive loss
|
$
|
(83.3
|
)
|
$
|
1.0
|
|
$
|
(82.3
|
)
|
||
|
Year Ended
|
|||||||||||
|
|
December 31, 2013
|
||||||||||
|
|
Pre-tax
|
Tax
|
Net of tax
|
||||||||
|
Foreign currency translation adjustments
|
$
|
32.6
|
|
$
|
—
|
|
$
|
32.6
|
|
||
|
Employee benefit plans
|
0.2
|
|
(0.1
|
)
|
0.1
|
|
|||||
|
Total other comprehensive earnings
|
$
|
32.8
|
|
$
|
(0.1
|
)
|
$
|
32.7
|
|
||
|
Year Ended
|
|||||||||||
|
|
December 31, 2012
|
||||||||||
|
|
Pre-tax
|
Tax
|
Net of tax
|
||||||||
|
Foreign currency translation adjustments
|
$
|
(82.2
|
)
|
$
|
—
|
|
$
|
(82.2
|
)
|
||
|
Employee benefit plans
|
(4.5
|
)
|
1.1
|
|
(3.4
|
)
|
|||||
|
Changes in fair value of cash flow hedges
|
1.3
|
|
(0.5
|
)
|
0.8
|
|
|||||
|
Total other comprehensive loss
|
$
|
(85.4
|
)
|
$
|
0.6
|
|
$
|
(84.8
|
)
|
||
81
|
NOTES TO CONSOLIDATED FINANCIAL STATEMENTS
|
||
The following tables summarize the changes in balances of each component of accumulated other comprehensive (loss) earnings, net of tax during the years ended December 31, 2014 and 2013 (in millions).
|
Cash flow hedges
|
Employee benefit plans
|
Cumulative foreign currency translation adjustments
|
Total
|
|||||||||||||
|
Balance at December 31, 2012
|
$
|
—
|
|
$
|
(8.0
|
)
|
$
|
11.8
|
|
$
|
3.8
|
|
||||
|
Other comprehensive earnings
|
—
|
|
0.1
|
|
32.6
|
|
32.7
|
|
||||||||
|
Balance at December 31, 2013
|
—
|
|
(7.9
|
)
|
44.4
|
|
36.5
|
|
||||||||
|
Other comprehensive loss
|
(0.2
|
)
|
(3.5
|
)
|
(78.6
|
)
|
(82.3
|
)
|
||||||||
|
Separation-related adjustments
|
—
|
|
(0.3
|
)
|
(7.2
|
)
|
(7.5
|
)
|
||||||||
|
Balance at December 31, 2014
|
$
|
(0.2
|
)
|
$
|
(11.7
|
)
|
$
|
(41.4
|
)
|
$
|
(53.3
|
)
|
||||
The amounts amortized from accumulated other comprehensive (loss) earnings to earnings during the
year
s ended
December 31, 2014
,
2013
and
2012
were as follows (in millions):
|
Years Ended December 31,
|
|||||||||||
|
2014
|
2013
|
2012
|
|||||||||
|
Pension & post-retirement benefit plans:
|
|||||||||||
|
Amortization or settlement of actuarial losses
|
$
|
1.4
|
|
$
|
0.2
|
|
$
|
0.2
|
|
||
|
Tax benefit
|
(0.4
|
)
|
(0.1
|
)
|
(0.1
|
)
|
|||||
|
Net of tax
|
$
|
1.0
|
|
$
|
0.1
|
|
$
|
0.1
|
|
||
|
Cash flow hedges:
|
|||||||||||
|
Net losses (gains) reclassified into earnings
|
$
|
—
|
|
$
|
0.2
|
|
$
|
(0.1
|
)
|
||
|
Tax benefit
|
—
|
|
(0.1
|
)
|
—
|
|
|||||
|
Net of tax
|
$
|
—
|
|
$
|
0.1
|
|
$
|
(0.1
|
)
|
||
The Company recognizes net periodic pension cost, which includes amortization of net actuarial losses and prior service costs, in both Selling and administrative expenses and Cost of goods sold, depending on the functional area of the underlying employees included in the plans.
14. Segment Information
Knowles is organized into
two
reportable segments based on how management analyzes performance, allocates capital and makes strategic and operational decisions. These segments were determined in accordance with FASB Accounting Standards Codification Topic 280 - Segment Reporting and include (i) MCE and (ii) SC. The segments are aligned around similar product applications serving Knowles' key end markets to enhance focus on end market growth strategies.
|
•
|
MCE designs and manufactures innovative acoustic products, including microphones, speakers, receivers and integrated audio solutions, used in several applications that serve the handset, tablet and other consumer electronic markets.
|
|
•
|
SC specializes in the design and manufacture of specialized electronic components used in medical and life science applications, as well as high-performance solutions and components used in communications infrastructure and a wide variety of other markets. SC's transducer products are used principally in hearing aid applications within the commercial audiology markets, while its oscillator products predominantly serve the telecom infrastructure market and its capacitor products are used in applications including radio, radar, satellite, power supplies, transceivers and medical implants serving the defense, aerospace, telecommunication and life sciences markets.
|
The Company sells its products directly to original equipment manufacturers and to their contract manufacturers and suppliers and to a lesser extent through distributors worldwide.
82
|
NOTES TO CONSOLIDATED FINANCIAL STATEMENTS
|
||
Information regarding the Company's reportable segments is as follows (in millions):
|
|
Years Ended December 31,
|
||||||||||
|
|
2014
|
2013
|
2012
|
||||||||
|
Revenue:
|
|||||||||||
|
Mobile Consumer Electronics
|
$
|
684.1
|
|
$
|
777.2
|
|
$
|
670.4
|
|
||
|
Specialty Components
|
457.2
|
|
437.7
|
|
447.7
|
|
|||||
|
Intra-segment eliminations
|
—
|
|
(0.1
|
)
|
(0.1
|
)
|
|||||
|
Total consolidated revenue
|
$
|
1,141.3
|
|
$
|
1,214.8
|
|
$
|
1,118.0
|
|
||
|
(Loss) earnings before interest and income taxes:
(1)
|
|||||||||||
|
Mobile Consumer Electronics
|
$
|
(74.6
|
)
|
$
|
122.0
|
|
$
|
100.4
|
|
||
|
Specialty Components
|
69.5
|
|
65.0
|
|
77.1
|
|
|||||
|
Total segments
|
(5.1
|
)
|
187.0
|
|
177.5
|
|
|||||
|
Corporate expense / other
|
43.4
|
|
43.5
|
|
42.1
|
|
|||||
|
Interest expense, net
|
6.6
|
|
42.0
|
|
56.5
|
|
|||||
|
(Loss) earnings before income taxes
|
(55.1
|
)
|
101.5
|
|
78.9
|
|
|||||
|
Provision for (benefit from) income taxes
|
31.9
|
|
(4.3
|
)
|
(0.2
|
)
|
|||||
|
Net (loss) earnings
|
$
|
(87.0
|
)
|
$
|
105.8
|
|
$
|
79.1
|
|
||
|
Depreciation and amortization:
|
|||||||||||
|
Mobile Consumer Electronics
|
$
|
143.0
|
|
$
|
100.3
|
|
$
|
79.7
|
|
||
|
Specialty Components
|
24.8
|
|
28.8
|
|
33.4
|
|
|||||
|
Corporate
|
2.1
|
|
1.8
|
|
1.8
|
|
|||||
|
Total
|
$
|
169.9
|
|
$
|
130.9
|
|
$
|
114.9
|
|
||
|
Capital expenditures:
|
|||||||||||
|
Mobile Consumer Electronics
|
$
|
71.0
|
|
$
|
66.4
|
|
$
|
136.5
|
|
||
|
Specialty Components
|
16.6
|
|
21.7
|
|
7.4
|
|
|||||
|
Corporate
|
4.7
|
|
3.2
|
|
1.7
|
|
|||||
|
Total
|
$
|
92.3
|
|
$
|
91.3
|
|
$
|
145.6
|
|
||
|
Research and development:
|
|||||||||||
|
Mobile Consumer Electronics
|
$
|
55.1
|
|
$
|
53.5
|
|
$
|
46.2
|
|
||
|
Specialty Components
|
27.9
|
|
29.1
|
|
31.1
|
|
|||||
|
Total
|
$
|
83.0
|
|
$
|
82.6
|
|
$
|
77.3
|
|
||
(1)
During the first quarter of 2014, the Company began using earnings before interest and income taxes as the measure to make decisions about allocating resources to segments and assessing segment performance instead of earnings before interest, income taxes, depreciation and amortization.
Information regarding the Company's reportable segments (continued, in millions):
|
Total Assets
|
|||||||
|
As of December 31,
|
|||||||
|
2014
|
2013
|
||||||
|
Mobile Consumer Electronics
|
$
|
1,474.1
|
|
$
|
1,638.2
|
|
|
|
Specialty Components
|
525.8
|
|
538.7
|
|
|||
|
Corporate / eliminations
|
(1.4
|
)
|
(6.8
|
)
|
|||
|
Total
|
$
|
1,998.5
|
|
$
|
2,170.1
|
|
|
83
|
NOTES TO CONSOLIDATED FINANCIAL STATEMENTS
|
||
The following table details revenue by geographic location (in millions). Revenue is attributed to regions based on the location of the Company's direct customer, which in some instances is an intermediary and not necessarily the end user. Long-lived assets are comprised of net property, plant and equipment. These assets have been classified based on the geographic location of where they reside. The Company's businesses are based primarily in Asia, the United States and Europe.
|
|
Revenue
|
Long-Lived Assets
|
|||||||||||||||||
|
|
Years Ended December 31,
|
At December 31,
|
|||||||||||||||||
|
|
2014
|
2013
|
2012
|
2014
|
2013
|
||||||||||||||
|
Asia
|
$
|
879.0
|
|
$
|
950.4
|
|
$
|
855.5
|
|
$
|
219.3
|
|
$
|
213.1
|
|
||||
|
United States
|
124.4
|
|
123.1
|
|
129.9
|
|
70.9
|
|
77.4
|
|
|||||||||
|
Europe
|
120.4
|
|
120.8
|
|
110.6
|
|
25.7
|
|
70.5
|
|
|||||||||
|
Other Americas
|
12.4
|
|
14.5
|
|
15.2
|
|
—
|
|
—
|
|
|||||||||
|
Other
|
5.1
|
|
6.0
|
|
6.8
|
|
—
|
|
—
|
|
|||||||||
|
Total
|
$
|
1,141.3
|
|
$
|
1,214.8
|
|
$
|
1,118.0
|
|
$
|
315.9
|
|
$
|
361.0
|
|
||||
For the year ended
December 31, 2014
, revenues from
three
customers of the MCE segment represented approximately
34%
,
20%
and
10%
, respectively, of total segment revenues. For the year ended
December 31, 2013
, revenues from
three
customers of the MCE segment represented approximately
38%
,
23%
and
11%
, respectively, of total segment revenues. For the year ended
December 31, 2012
, revenues from
three
customers of the MCE segment represented approximately
34%
,
17%
and
12%
, respectively, of total segment revenues.
For the year ended December 31, 2014, no single customer represented 10% or more of SC segment revenues.
For the years
ended December 31, 2013 and 2012, revenues from
one
customer of the SC segment represented approximately
10%
of total segment revenues for both years.
15. Earnings per Share
Basic and diluted earnings per share was computed as follows (in millions except share and per share amounts):
|
|
Years Ended December 31,
|
||||||||||
|
|
2014
(1)
|
2013
(2)
|
2012
(2)
|
||||||||
|
Net (loss) earnings
|
$
|
(87.0
|
)
|
$
|
105.8
|
|
$
|
79.1
|
|
||
|
Basic (loss) earnings per common share:
|
|||||||||||
|
Basic weighted-average shares outstanding
|
85,046,042
|
|
85,019,159
|
|
85,019,159
|
|
|||||
|
Basic (loss) earnings per share
|
$
|
(1.02
|
)
|
$
|
1.24
|
|
$
|
0.93
|
|
||
|
Diluted (loss) earnings per common share:
|
|||||||||||
|
Basic weighted-average shares outstanding
|
85,046,042
|
|
85,019,159
|
|
85,019,159
|
|
|||||
|
Dilutive effect of stock-based awards
|
—
|
|
—
|
|
—
|
|
|||||
|
Diluted weighted-average shares outstanding
|
85,046,042
|
|
85,019,159
|
|
85,019,159
|
|
|||||
|
Diluted (loss) earnings per share
|
$
|
(1.02
|
)
|
$
|
1.24
|
|
$
|
0.93
|
|
||
(1)
For the year ended
December 31, 2014
, the weighted-average number of anti-dilutive potential common shares excluded from the calculation of diluted earnings per share above was
1,487,496
.
(2)
The denominator for basic and diluted EPS was based on the number of shares of Knowles common stock outstanding on the distribution date. On February 28, 2014, the distribution date, Dover stockholders of record as of the close of business on February 19, 2014 received one share of Knowles common stock for every two shares of Dover's common stock held as of the record date. The same number of shares was used to calculate basic and diluted earnings per share since no Knowles equity awards were outstanding prior to the Separation.
84
|
NOTES TO CONSOLIDATED FINANCIAL STATEMENTS
|
||
16. Quarterly Data (Unaudited)
|
(in millions except per share amounts)
|
|||||||||||||||
|
Quarter
|
Revenue
|
Gross Profit
|
Net Earnings (Loss)
|
Per Share - Basic & Diluted
(1)
|
|||||||||||
|
2014
|
|
|
|
||||||||||||
|
First
|
$
|
273.4
|
|
$
|
83.1
|
|
$
|
7.6
|
|
$
|
0.09
|
|
|||
|
Second
|
281.0
|
|
33.8
|
|
(78.9
|
)
|
(0.93
|
)
|
|||||||
|
Third
|
300.8
|
|
52.2
|
|
(14.6
|
)
|
(0.17
|
)
|
|||||||
|
Fourth
|
286.1
|
|
63.6
|
|
(1.1
|
)
|
(0.01
|
)
|
|||||||
|
|
$
|
1,141.3
|
|
$
|
232.7
|
|
$
|
(87.0
|
)
|
$
|
(1.02
|
)
|
|||
|
2013
|
|
|
|
||||||||||||
|
First
|
$
|
276.1
|
|
$
|
94.5
|
|
$
|
11.9
|
|
$
|
0.14
|
|
|||
|
Second
|
296.7
|
|
101.2
|
|
16.7
|
|
0.20
|
|
|||||||
|
Third
|
311.6
|
|
118.0
|
|
44.3
|
|
0.52
|
|
|||||||
|
Fourth
|
330.4
|
|
114.2
|
|
32.9
|
|
0.38
|
|
|||||||
|
|
$
|
1,214.8
|
|
$
|
427.9
|
|
$
|
105.8
|
|
$
|
1.24
|
|
|||
(1)
The computation of basic and diluted earnings per share for periods prior to the Separation was calculated using the shares distributed on February 28, 2014.
See Note 15. Earnings per Share
for additional information regarding the computation of basic and diluted earnings per common share.
85
SCHEDULE II
VALUATION AND QUALIFYING ACCOUNTS
Years Ended December 31,
2014
,
2013
and
2012
|
Allowance for Doubtful Accounts
(in millions)
|
Balance at
Beginning
of Year
|
Charged to Cost and
Expense
(1)
|
Accounts
Written Off
|
Balance at
End of Year
|
||||||||||
|
Year Ended December 31, 2014
|
||||||||||||||
|
Allowance for Doubtful Accounts
|
$
|
1.7
|
|
(0.8
|
)
|
(0.1
|
)
|
$
|
0.8
|
|
||||
|
Year Ended December 31, 2013
|
|
|||||||||||||
|
Allowance for Doubtful Accounts
|
$
|
1.8
|
|
0.3
|
|
(0.4
|
)
|
$
|
1.7
|
|
||||
|
Year Ended December 31, 2012
|
|
|
||||||||||||
|
Allowance for Doubtful Accounts
|
$
|
1.5
|
|
0.7
|
|
(0.4
|
)
|
$
|
1.8
|
|
||||
|
(1)
Net of recoveries on previously reserved or written-off balances.
|
|
|
|
|
||||||||||
|
Deferred Tax Valuation Allowance
(in millions)
|
Balance at
Beginning
of Year
|
Additions
|
Reductions
|
Balance at
End of Year
|
||||||||||
|
Year Ended December 31, 2014
|
||||||||||||||
|
Deferred Tax Valuation Allowance
|
$
|
71.5
|
|
80.7
|
|
(71.5
|
)
|
$
|
80.7
|
|
||||
|
Year Ended December 31, 2013
|
||||||||||||||
|
Deferred Tax Valuation Allowance
|
$
|
74.1
|
|
—
|
|
(2.6
|
)
|
$
|
71.5
|
|
||||
|
Year Ended December 31, 2012
|
||||||||||||||
|
Deferred Tax Valuation Allowance
|
$
|
64.5
|
|
9.6
|
|
—
|
|
$
|
74.1
|
|
||||
None.
(a) Evaluation of Disclosure Controls and Procedures
We conducted an evaluation, under the supervision and with the participation of management, including the chief executive officer (“CEO”) and chief financial officer (“CFO”), of the effectiveness of the Company’s disclosure controls and procedures as of the end of the period covered by this annual report.
These disclosure controls and procedures are designed to ensure that information required to be disclosed in our reports that are filed or submitted under the Securities Exchange Act of 1934 (the “Exchange Act”) is recorded, processed, summarized and reported within the time periods specified in the Securities and Exchange Commission’s rules and forms. Our disclosure controls and procedures include, without limitation, controls and procedures designed to ensure that this information is accumulated and communicated to management, including the principal executive and principal financial officers, or persons performing similar functions, as appropriate, to allow timely decisions regarding required disclosure.
Based on the evaluation, the CEO and CFO have concluded that these disclosure controls and procedures were effective as of December 31, 2014, the end of the period covered by this annual report.
86
(b) Management's Report on Internal Control Over Financial Reporting
Our management is responsible for establishing and maintaining adequate internal control over financial reporting (as defined in Rules 13a-15(f) and 15d-15(f) under the Exchange Act). Under management’s supervision, an evaluation of the effectiveness of the Company’s internal control over financial reporting was conducted based on the criteria set forth in
Internal Control - Integrated Framework
(2013) issued by the Committee of Sponsoring Organizations of the Treadway Commission (“COSO”). Based on our evaluation under the framework in
Internal Control - Integrated Framework
(2013) issued by the COSO, our management concluded that our internal control over financial reporting was effective as of December 31, 2014.
PricewaterhouseCoopers LLP, the Company’s independent registered public accounting firm, has audited the effectiveness of the Company’s internal control over financial reporting as of December 31, 2014, as stated in their report which appears herein.
(c) Changes in Internal Control Over Financial Reporting
There has been no change in our internal control over financial reporting that occurred during the fourth quarter of 2014 that has materially affected, or is reasonably likely to materially affect, our internal control over financial reporting.
(d) Inherent Limitations on Effectiveness of Controls
Our management, including the CEO and CFO, do not expect that our disclosure controls or our internal control over financial reporting will prevent or detect all errors and all fraud. A control system, no matter how well designed and operated, can provide only reasonable, not absolute, assurance that the control system’s objectives will be met. The design of a control system must reflect the fact that the benefits of controls must be considered relative to their costs. Further, because of the inherent limitations in all control systems, no evaluation of controls can provide absolute assurance that misstatements due to error or fraud will not occur or that all control issues and instances of fraud, if any, will be detected. These inherent limitations include the realities that judgments in decision making can be faulty and that breakdowns can occur because of simple error or mistake. Controls can also be circumvented by the individual acts of some persons, by intentionally falsified documentation, by collusion of two or more individuals within Knowles or third parties, or by management override of the controls. The design of any system of controls is based in part on certain assumptions about the likelihood of future events and there can be no assurance that any design will succeed in achieving its stated goals under all potential future conditions. Projections of any evaluation of controls effectiveness to future periods are subject to risks. Over time, controls may become inadequate because of changes in conditions or deterioration in the degree of compliance with policies or procedures.
Not applicable.
The information with respect to the directors and the board committees of the Company required to be included pursuant to this Item 10 will be included in the Proxy Statement for its 2015 Annual Meeting of Stockholders (the "2015 Proxy Statement") that will be filed with the Securities and Exchange Commission pursuant to Rule 14a-6 under the Exchange Act in accordance with applicable SEC deadlines and is incorporated in this Item 10 by reference.
The information with respect to the executive officers of the Company required to be included pursuant to this Item 10 is included under the caption “Executive Officers of the Registrant” in Part I of this Form 10-K and is incorporated in this Item 10 by reference.
The information with respect to Section 16(a) reporting compliance required to be included in this Item 10 will be included in our
2015
Proxy Statement and is incorporated in this Item 10 by reference.
The Company has adopted a code of ethics that applies to its chief executive officer and senior financial officers. A copy of this code of ethics can be found on our website at www.knowles.com. In the event of any amendment to, or waiver from, the code of ethics, we will publicly disclose the amendment or waiver by posting the information on our website or filing a Form 8-K with the SEC.
87
The information with respect to executive compensation and the compensation committee required to be included pursuant to this Item 11 will be included in our
2015
Proxy Statement and is incorporated in this Item 11 by reference.
The information regarding security ownership of certain beneficial owners and management that is required to be included pursuant to this Item 12 will be included in our
2015
Proxy Statement and is incorporated into this Item 12 by reference.
Equity Compensation Plans
The following table presents information regarding our equity compensation plans as of December 31, 2014:
|
(a)
|
(b)
|
(c)
|
|||||||
|
Plan Category
|
Number of Securities to be Issued Upon Exercise of Outstanding Options, Warrants and Rights
(1)
|
Weighted-Average Exercise Price of Outstanding Options, Warrants and Rights
|
Number of Securities Remaining Available for Future Issuance Under Equity Compensation Plans (Excluding Securities Reflected in Column (a))
(2)
|
||||||
|
Equity compensation plans approved by stockholders
|
2,783,312
|
|
$
|
25.53
|
|
8,240,061
|
|
||
|
Equity compensation plans not approved by stockholders
|
—
|
|
—
|
|
—
|
|
|||
|
Total
|
2,783,312
|
|
$
|
25.53
|
|
8,240,061
|
|
||
|
(1)
|
Column (a) consists of shares issuable pursuant to outstanding restricted stock unit, stock appreciation right (“SAR”) and stock option awards under the Company's 2014 Equity and Cash Incentive Plan (the "2014 Plan"). A portion of these awards were issued to our employees in substitution for such employees’ outstanding awards of our Former Parent. Restricted stock units are not reflected in the weighted exercise price in column (b).
|
|
(2)
|
Column (c) consists of shares available for future issuance under the 2014 Plan. The 2014 Plan provides for stock options and SAR grants, restricted stock awards, restricted stock unit awards, performance share awards, cash performance awards, directors’ shares and deferred stock units. Shares subject to stock options and SARs will reduce the shares available for awards under the 2014 Plan by one share for every one share granted. Performance share awards, restricted stock, restricted stock units that are settled in shares of common stock, directors’ shares and deferred stock units will reduce the shares available for awards under the 2014 Plan by three shares for every one share awarded. Cash performance awards do not count against the pool of available shares. The number of shares earned when an award is exercised, vests or is paid out will count against the pool of available shares, including shares withheld to pay taxes or an option’s exercise price. Shares subject to an award under the 2014 Plan that is cancelled, terminated or forfeited or that expires will be available for reissuance under the 2014 Plan.
|
The information with respect to any director independence, related party transaction policies and any reportable transaction, business relationship, or indebtedness between the Company and the beneficial owners of more than 5% of Knowles common stock, the directors or nominees for director of the Company, the executive officers of the Company, or the members of the immediate families of such individuals that are required to be included pursuant to this Item 13, will be included in our
2015
Proxy Statement and is incorporated in this Item 13 by reference.
88
The information with respect to the Company’s relationship with its independent registered public accounting firm and fees paid thereto required to be included pursuant to this Item 14 will be included in our
2015
Proxy Statement and is incorporated in this Item 14 by reference.
The information with respect to audit committee pre-approval policies and procedures required to be included pursuant to this Item 14 will be included in our
2015
Proxy Statement and is incorporated in this Item 14 by reference.
|
a)
|
The following documents are filed as part of this report:
|
|
(1)
|
Financial Statements:
|
|
•
|
The financial statements are set forth under “Item 8. Financial Statements and Supplementary Data” of this Form 10-K.
|
|
(2)
|
Financial Statement Schedules:
|
|
•
|
The following financial statement schedule is set forth under “Item 8. Financial Statements and Supplementary Data” of this Form 10-K. All other schedules have been omitted because they are not required, are not applicable or the required information is included in the financial statements or the notes thereto.
|
|
•
|
Schedule II – Valuation and Qualifying Accounts
|
|
(3)
|
Exhibits
|
|
•
|
The exhibits listed in the accompanying Exhibit Index are filed or incorporated by reference as part of this Form 10-K. The exhibits will be filed with the SEC but will not be included in the printed version of the Annual Report to Stockholders.
|
89
SIGNATURES
Pursuant to the requirements of Section 13 or 15(d) of the Securities Exchange Act of 1934, the registrant has duly caused this report to be signed on its behalf by the undersigned thereunto duly authorized.
|
|
KNOWLES CORPORATION
|
|
|
|
|
|
|
/s/ JEFFREY S. NIEW
|
||
|
|
Jeffrey S. Niew
|
|
|
President and Chief Executive Officer
|
||
|
Date:
|
February 25, 2015
|
|
Pursuant to the requirements of the Securities Exchange Act of 1934, this report has been signed below by the following persons on behalf of the registrant and in the capacities and on the dates indicated.
|
Signature
|
Title
|
Date
|
||
|
/s/ JEFFREY S. NIEW
|
Chief Executive Officer, President and Director
(Principal Executive Officer) |
February 25, 2015
|
||
|
Jeffrey S. Niew
|
||||
|
/s/ JOHN S. ANDERSON
|
Senior Vice President and Chief Financial Officer
(Principal Financial Officer) |
February 25, 2015
|
||
|
John S. Anderson
|
||||
|
/s/ BRYAN E. MITTELMAN
|
Vice President, Controller
(Principal Accounting Officer)
|
February 25, 2015
|
||
|
Bryan E. Mittelman
|
||||
|
/s/ JEAN-PIERRE M. ERGAS
|
Chairman, Board of Directors
|
February 25, 2015
|
||
|
Jean-Pierre M. Ergas
|
||||
|
/s/ KEITH L. BARNES
|
Director
|
February 25, 2015
|
||
|
Keith L. Barnes
|
||||
|
/s/ ROBERT W. CREMIN
|
Director
|
February 25, 2015
|
||
|
Robert W. Cremin
|
||||
|
/s/ DIDIER HIRSCH
|
Director
|
February 25, 2015
|
||
|
Didier Hirsch
|
||||
|
/s/ RONALD JANKOV
|
Director
|
February 25, 2015
|
||
|
Ronald Jankov
|
||||
|
/s/ RICHARD K. LOCHRIDGE
|
Director
|
February 25, 2015
|
||
|
Richard K. Lochridge
|
||||
|
/s/ DONALD MACLEOD
|
Director
|
February 25, 2015
|
||
|
Donald Macleod
|
||||
90
EXHIBIT INDEX
|
Exhibit Number
|
Description
|
|
|
2.1
|
Separation and Distribution Agreement dated February 28, 2014 by and between Dover Corporation and Knowles Corporation, filed as Exhibit 2.1 to Registrant's Current Report on Form 8-K dated February 28, 2014 and incorporated herein by reference thereto
|
|
|
3.1
|
Amended and Restated Certificate of Incorporation of Knowles Corporation, filed as Exhibit 3.1 to Registrant's Current Report on Form 8-K dated February 28, 2014 and incorporated herein by reference thereto
|
|
|
3.2
|
Amended and Restated By-laws of Knowles Corporation, filed as Exhibit 3.2 to Registrant's Current Report on Form 8-K dated February 28, 2014 and incorporated herein by reference thereto
|
|
|
10.1
|
Transition Services Agreement dated February 28, 2014 by and between Dover Corporation and Knowles Corporation, filed as Exhibit 10.3 to Registrant's Current Report on Form 8-K dated February 28, 2014 and incorporated herein by reference thereto
|
|
|
10.2
|
Tax Matters Agreement dated February 28, 2014 by and between Dover Corporation and Knowles Corporation, filed as Exhibit 10.2 to Registrant’s Current Report on Form 8-K dated February 28, 2014 and incorporated herein by reference thereto
|
|
|
10.3
|
Employee Matters Agreement dated February 28, 2014 by and between Dover Corporation and Knowles Corporation, filed as Exhibit 10.1 to Registrant’s Current Report on Form 8-K dated February 28, 2014 and incorporated herein by reference thereto
|
|
|
10.4†
|
Senior Executive Change-in-Control Severance Plan, filed as Exhibit 10.8 to Registrant’s Current Report on Form 8-K dated February 28, 2014 and incorporated herein by reference thereto
|
|
|
10.5†
|
2014 Equity and Cash Incentive Plan, filed as Exhibit 10.4 to Registrant’s Current Report on Form 8-K dated February 28, 2014 and incorporated herein by reference thereto
|
|
|
10.5.1†
|
Form of Restricted Stock Unit Award Agreement, filed as Exhibit 10.1 to Registrant’s Current Report on Form 8-K dated March 7, 2014 and incorporated herein by reference thereto
|
|
|
10.5.2†
|
Form of Award Grant Letter for Restricted Stock, filed as Exhibit 10.9 to Registrant’s Registration Statement on Form 10 (File No. 001-36102) and incorporated herein by reference thereto
|
|
|
10.5.3†
|
Form of Award Grant Letter for Stock Settled Appreciation Rights, filed as Exhibit 10.10 to Registrant’s Registration Statement on Form 10 (File No. 001-36102) and incorporated herein by reference thereto
|
|
|
10.5.4†
|
Form of Stock Option Award Agreement, filed as Exhibit 10.2 to Registrant’s Current Report on Form 8-K dated March 7, 2014 and incorporated herein by reference thereto
|
|
|
10.5.5†
|
Form of Replacement SSAR Award Agreement, filed as Exhibit 10.3 to Registrant’s Current Report on Form 8-K dated March 7, 2014 and incorporated herein by reference thereto
|
|
|
10.5.6†
|
Form of Replacement Restricted Stock Unit Award Agreement, filed as Exhibit 10.4 to Registrant’s Current Report on Form 8-K dated March 7, 2014 and incorporated herein by reference thereto
|
|
|
10.5.7†
|
Nonemployee Director Deferral Program, filed as Exhibit 10.5.7 to Registrant's Annual Report on Form 10-K for the year ended December 31, 2013 (File No. 001-36102) and incorporated herein by reference thereto
|
|
|
10.6†
|
Executive Deferred Compensation Plan, filed as Exhibit 10.6 to Registrant’s Current Report on Form 8-K dated February 28, 2014 and incorporated herein by reference thereto
|
|
|
10.7†
|
Executive Severance Plan, filed as Exhibit 10.7 to Registrant’s Current Report on Form 8-K dated February 28, 2014 and incorporated herein by reference thereto
|
|
|
10.8†
|
Executive Officer Annual Incentive Plan, filed as Exhibit 10.5 to Registrant’s Current Report on Form 8-K dated February 28, 2014 and incorporated herein by reference thereto
|
|
|
10.9†
|
Bonus Agreement between David Wightman and Dover Communication Technologies, dated March 21, 2013, filed as Exhibit 10.13 to Registrant’s Registration Statement on Form 10 (File No. 001-36102) and incorporated herein by reference thereto
|
|
|
10.10†
|
Executive Severance Agreement between David Wightman and Dover Corporation, dated as of February 21, 2000, filed as Exhibit 10.14 to Registrant’s Registration Statement on Form 10 (File No. 001-36102) and incorporated herein by reference thereto
|
|
|
10.11†
|
Relocation Agreements for Dave Wightman, filed as Exhibit 10.15 to Registrant’s Registration Statement on Form 10 (File No. 001-36102) and incorporated herein by reference thereto
|
|
|
10.12
|
Amended and Restated Credit Agreement, dated December 31, 2014, among Knowles Corporation, Knowles Luxembourg International S.à r.l. and certain other subsidiaries of Knowles Corporation, as borrowers, the lenders named therein and JPMorgan Chase Bank, N.A., as administrative agent, filed as Exhibit 10.1 to Registrant’s Current Report on Form 8-K dated January 6, 2015 and incorporated herein by reference thereto
|
|
91
|
21.1
|
Subsidiaries of Knowles Corporation
|
|
|
23.1
|
Consent of PricewaterhouseCoopers LLP
|
|
|
31.1
|
Certificate of Chief Executive Officer Required Under Section 302 of the Sarbanes-Oxley Act of 2002
|
|
|
31.2
|
Certificate of Chief Financial Officer Required Under Section 302 of the Sarbanes-Oxley Act of 2002
|
|
|
32.1
|
Joint Certificate of the Chief Executive Officer and Chief Financial Officer Required Under Section 906 of the Sarbanes-Oxley Act of 2002
|
|
|
101
|
The following materials from the Knowles Corporation Annual Report on Form 10-K for the year ended December 31, 2014 formatted in eXtensible Business Reporting Language (XBRL): (i) Consolidated Statements of Earnings, (ii) Consolidated Statements of Comprehensive Earnings, (iii) Consolidated Balance Sheets, (iv) Consolidated Statements of Equity, (v) Consolidated Statements of Cash Flows and (vi) Notes to the Consolidated Financial Statements
|
|
|
†
|
Indicates the exhibit is a management contract or compensatory plan or arrangement.
|
|
92
TABLE OF CONTENTS
Part IItem 1. BusinessNote 14. Segment InformationItem 1A. Risk FactorsNote 8. Borrowings and Lines Of CreditNote 9. Income TaxesItem 1B. Unresolved Staff CommentsItem 2. PropertiesItem 3. Legal ProceedingsItem 4. Mine Safety DisclosuresPart IIItem 5. Market For Registrant's Common Equity, Related Stockholder Matters and Issuer Purchases Of Equity SecuritiesItem 6. Selected Financial DataItem 7. Management's Discussion and Analysis Of Financial Condition and Results Of OperationsNote 11. Commitments and Contingent LiabilitiesItem 7A. Quantitative and Qualitative Disclosures About Market RiskItem 8. Financial Statements and Supplementary DataItem 9. Changes in and Disagreements with Accountants on Accounting and Financial DisclosureItem 9A. Controls and ProceduresItem 9B. Other InformationPart IIIItem 10. Directors, Executive Officers and Corporate GovernanceItem 11. Executive CompensationItem 12. Security Ownership Of Certain Beneficial Owners and Management and Related Stockholder MattersItem 13. Certain Relationships and Related Transactions and Director IndependenceItem 14. Principal Accountant Fees and ServicesPart IVItem 15. Exhibits and Financial Statement Schedules