KANDI TECHNOLOGIES GROUP, INC.
10-Ks and 10-Qs
|
|
|
|
|
|
|
|
|
|
|
|
|
|
|
|
|
|
|
|
|
|
|
|
|
|
|
|
|
|
|
|
|
|
|
|
|
|
|
|
|
UNITED STATES
SECURITIES AND EXCHANGE COMMISSION
Washington, D.C. 20549
FORM 10-Q
|
þ
|
QUARTERLY REPORT PURSUANT TO SECTION 13 OR 15(
d
) OF THE SECURITIES EXCHANGE ACT OF 1934
|
For the quarterly period ended September 30, 2011
or
|
¨
|
TRANSITION REPORT PURSUANT TO SECTION 13 OR 15(
d
) OF THE SECURITIES EXCHANGE ACT OF 1934
|
For the transition period from ______to______
Commission file number 001-52186
Kandi Technologies, Corp.
(Exact name of registrant as specified in charter)
|
Delaware
|
90-0363723
|
||
|
(State or other jurisdiction of
incorporation or organization)
|
(I.R.S. Employer
Identification No.)
|
Jinhua City Industrial Zone
Jinhua, Zhejiang Province
People’s Republic of China
Post Code 321016
(Address of principal executive offices)
(86 - 0579) 82239856
(Registrant’s telephone number, including area code)
Indicate by check mark whether the registrant (1) has filed all reports required to be filed by Section 13 or 15(d) of the Securities Exchange Act of 1934 during the preceding 12 months (or for such shorter period that the registrant was required to file such reports), and (2) has been subject to such filing requirements for the past 90 days.
Yes
þ
No
¨
Indicate by check mark whether the registrant has submitted electronically and posted on its corporate Web site, if any, every Interactive Data File required to be submitted and posted pursuant to Rule 405 of Regulation S-T during the preceding 12 months (or for such shorter period that the registrant was required to submit and post such files).
Yes
þ
No
¨
Indicate by check mark whether the registrant is a large accelerated filer, an accelerated filer, a non-accelerated filer, or a smaller reporting company. See definitions of “large accelerated filer,” “accelerated filer” and “smaller reporting company” in Rule 12b-2 of the Exchange Act. (Check one):
|
Large accelerated filer
¨
|
Accelerated filer
¨
|
|
Non-accelerated filer
¨
|
Smaller reporting company
þ
|
Indicate by check mark whether the registrant is a shell company (as defined in Rule 12b-2 of the Exchange Act).
Yes
o
No
þ
As of November 10, 2011 the registrant had issued and outstanding 27,445,600 shares of common stock, par value $0.001 per share.
TABLE OF CONTENTS
| Page | |||||
|
PART I-- FINANCIAL INFORMATION
|
|||||
|
Item 1.
|
Financial Statements
|
3 | |||
|
Condensed Consolidated Balance Sheets as of September 30, 2011 (unaudited) and December 31, 2010
|
3 | ||||
|
Condensed Consolidated Statements of Income (Loss) and Comprehensive Income (Loss) (unaudited)–Ended September 30, 2011 and September 30, 2010
|
5 | ||||
|
Condensed Consolidated Statements of Cash Flows (unaudited)–Nine months Ended September 30, 2011 and September 30, 2010
|
7 | ||||
|
Item 2.
|
Management’s Discussion and Analysis of Financial Condition and Results of Operations
|
34 | |||
|
Item 3.
|
Quantitative and Qualitative Disclosures about Market Risk
|
43 | |||
|
Item 4.
|
Controls and Procedures
|
43 | |||
|
PART II-- OTHER INFORMATION
|
|||||
|
Item 1
|
Legal Proceedings
|
44 | |||
|
Item 1A.
|
Risk Factors
|
44 | |||
|
Item 2.
|
Unregistered Sales of Equity Securities and Use of Proceeds
|
44 | |||
|
Item 3.
|
Defaults Upon Senior Securities
|
44 | |||
|
Item 4.
|
[Removed and Reserved]
|
44 | |||
|
Item 5.
|
Other information
|
44 | |||
|
Item 6.
|
Exhibits
|
45 | |||
2
KANDI TECHNOLOGIES, CORP.
AND SUBSIDIARIES
CONDENSED CONSOLIDATED BALANCE SHEETS
ASSETS
|
September 30,
|
December 31,
|
|||||||
|
2011
|
2010
|
|||||||
|
(Unaudited)
|
||||||||
|
CURRENT ASSETS
|
||||||||
|
Cash and cash equivalents
|
$
|
1,881,477
|
$
|
7,754,166
|
||||
|
Restricted cash
|
26,359,171
|
17,398,087
|
||||||
|
Accounts receivable
|
9,306,111
|
16,999,430
|
||||||
|
Inventories
|
8,675,723
|
5,886,506
|
||||||
|
Notes receivable
|
20,540,160
|
24,865,989
|
||||||
|
Other receivables
|
1,735,805
|
814,327
|
||||||
|
Prepayments and prepaid expenses
|
201,100
|
97,298
|
||||||
|
Due from employees
|
22,730
|
36,385
|
||||||
|
Advances to suppliers
|
3,436,136
|
188,585
|
||||||
|
Marketable securities (trading)
|
-
|
300,675
|
||||||
|
Due from related party
|
-
|
-
|
||||||
|
Total Current Assets
|
|
72,158,413
|
74,341,448
|
|||||
|
LONG-TERM ASSETS
|
||||||||
|
Plant and equipment, net
|
21,577,293
|
23,911,626
|
||||||
|
Land use rights, net
|
10,994,004
|
10,833,452
|
||||||
|
Construction in progress
|
6,117,082
|
-
|
||||||
|
Deferred taxes
|
204,397
|
255,948
|
||||||
|
Investment in associated companies
|
250,900
|
272,241
|
||||||
|
Total Long-Term Assets
|
39,143,676
|
35,273,267
|
||||||
|
TOTAL ASSETS
|
$
|
111,302,089
|
$
|
109,614,715
|
||||
See accompanying notes to condensed consolidated financial statements
3
KANDI TECHNOLOGIES, CORP.
AND SUBSIDIARIES
CONDENSED CONSOLIDATED BALANCE SHEETS
LIABILITIES AND STOCKHOLDERS’ EQUITY
|
September 30,
|
December 31,
|
|||||||
|
2011
|
2010
|
|||||||
|
(Unaudited)
|
||||||||
|
CURRENT LIABILITIES
|
||||||||
|
Accounts payable
|
$
|
5,209,813
|
$
|
6,452,652
|
||||
|
Other payables and accrued expenses
|
651,693
|
794,625
|
||||||
|
Short-term bank loans
|
32,272,173
|
28,434,012
|
||||||
|
Customer deposits
|
59,634
|
82,127
|
||||||
|
Notes payable (net of discount of $324 and $0 as of September 30, 2011and December 31, 2010 respectively)
|
13,858,029
|
19,039,898
|
||||||
|
Income tax payable
|
117,197
|
127,339
|
||||||
|
Due to employees
|
8,882
|
12,767
|
||||||
|
Due to related party
|
841,251
|
841,251
|
||||||
|
Deferred taxes
|
203,591
|
34,083
|
||||||
|
Financial derivative
|
75
|
-
|
||||||
|
Total Current Liabilities
|
53,222,338
|
55,818,754
|
||||||
|
LONG-TERM LIABILITIES
|
||||||||
|
Note payable, (net of discount of $0 and $730 as of September 30, 2011 and December 31, 2010 respectively)
|
-
|
270
|
||||||
|
Financial derivative
|
1,840,487
|
9,321,553
|
||||||
|
Total Long-Term Liabilities
|
1,840,487
|
9,321,823
|
||||||
|
TOTAL LIABILITIES
|
55,062,825
|
65,140,577
|
||||||
|
STOCKHOLDERS’ EQUITY
|
||||||||
|
Common stock, $0.001 par value; 100,000,000 shares authorized; 27,445,600 and 27,396,101 shares issued and outstanding at September 30, 2011 and December 31, 2010, respectively
|
27,446
|
27,396
|
||||||
|
Additional paid-in capital
|
31,386,164
|
31,090,100
|
||||||
|
Retained earnings (the restricted portion is $1,319,067 at September 30, 2011 and December 31, 2010)
|
20,040,161
|
10,095,560
|
||||||
|
Accumulated other comprehensive income
|
4,785,493
|
3,261,082
|
||||||
|
TOTAL STOCKHOLDERS’ EQUITY
|
56,239,264
|
44,474,138
|
||||||
|
TOTAL LIABILITIES AND STOCKHOLDERS’ EQUITY
|
$
|
111,302,089
|
$
|
109,614,715
|
||||
See accompanying notes to condensed consolidated financial statements
4
KANDI TECHNOLOGIES, CORP.
AND SUBSIDIARIES
CONDENSED CONSOLIDATED STATEMENTS OF INCOME (LOSS) AND
COMPREHENSIVE INCOME (LOSS)
(UNAUDITED)
|
Three Months Ended
|
Nine Months Ended
|
|||||||||||||||
|
September 30,
2011
|
September 30,
2010
|
September 30,
2011
|
September 30,
2010
|
|||||||||||||
|
REVENUES, NET
|
$ | 10,310,558 | $ | 10,478,224 | $ | 28,789,766 | $ | 28,637,863 | ||||||||
|
COST OF GOODS SOLD
|
(7,984,828 | ) | (8,140,771 | ) | (22,060,888 | ) | (22,098,905 | ) | ||||||||
|
GROSS PROFIT
|
2,325,730 | 2,337,453 | 6,728,878 | 6,538,958 | ||||||||||||
|
Research and development
|
(608,463 | ) | (459,935 | ) | (1,695,003 | ) | (1,203,270 | ) | ||||||||
|
Selling and distribution expenses
|
(85,239 | ) | (58,121 | ) | (234,854 | ) | (1,000,187 | ) | ||||||||
|
General and administrative expenses
|
(1,067,021 | ) | (516,929 | ) | (2,568,417 | ) | (2,315,088 | ) | ||||||||
|
INCOME (LOSS) FROM OPERATIONS
|
565,007 | 1,302,468 | 2,230,604 | 2,020,413 | ||||||||||||
|
Interest income (expense), net
|
117,353 | (572,032 | ) | 95,549 | (2,015,516 | ) | ||||||||||
|
Change in fair value of financial instruments
|
(271,780 | ) | (2,578,693 | ) | 7,480,992 | (802,884 | ) | |||||||||
|
Government grants
|
9,235 | 191,934 | 289,962 | 266,911 | ||||||||||||
|
Investment (loss) income
|
(12,905 | ) | - | (20,181 | ) | |||||||||||
|
Other income, net
|
95,067 | 33,249 | 262,299 | 91,088 | ||||||||||||
|
INCOME (LOSS) FROM OPERATIONS BEFORE INCOME TAXES
|
501,977 | (1,623,074 | ) | 10,339,225 | (439,988 | ) | ||||||||||
|
INCOME TAX (EXPENSE) BENEFIT
|
(117,119 | ) | (94,282 | ) | (394,624 | ) | (269,338 | ) | ||||||||
|
NET INCOME (LOSS)
|
384,858 | (1,717,356 | ) | 9,944,601 | (709,326 | ) | ||||||||||
See accompanying notes to condensed consolidated financial statements
5
KANDI TECHNOLOGIES, CORP.
AND SUBSIDIARIES
CONDENSED CONSOLIDATED STATEMENTS OF INCOME (LOSS) AND
COMPREHENSIVE INCOME (LOSS)
(UNAUDITED)
|
Three Months Ended
|
Nine Months Ended
|
|||||||||||||||
|
September 30,
2011
|
September 30,
2010
|
September 30,
2011
|
September 30,
2010
|
|||||||||||||
|
OTHER COMPREHENSIVE INCOME
|
||||||||||||||||
|
Foreign currency translation
|
377,991 | 595,771 | 1,524,411 | 726,711 | ||||||||||||
|
COMPREHENSIVE INCOME (LOSS)
|
762,849 | (1,121,585 | ) | 11,469,012 | 17,385 | |||||||||||
|
WEIGHTED AVERAGE SHARES OUTSTANDING BASIC
|
27,445,600 | 22,570,140 | 27,436,434 | 21,139,827 | ||||||||||||
|
WEIGHTED AVERAGE SHARES OUTSTANDING DILUTED
|
28,617,870 | 22,570,140 | 28,740,204 | 21,139,827 | ||||||||||||
|
NET INCOME (LOSS) PER SHARE, BASIC
|
$ | 0.01 | $ | (0.08 | ) | $ | 0.36 | $ | (0.03 | ) | ||||||
|
NET INCOME (LOSS) PER SHARE, DILUTED
|
$ | 0.01 | $ | (0.08 | ) | $ | 0.35 | $ | (0.03 | ) | ||||||
See accompanying notes to condensed consolidated financial statements
6
KANDI TECHNOLOGIES, CORP.
AND SUBSIDIARIES
CONDENSED CONSOLIDATED STATEMENTS OF CASH FLOWS
(UNAUDITED)
|
Nine Months Ended
September 30
|
||||||||
|
2011
|
2010
|
|||||||
|
CASH FLOWS FROM OPERATING ACTIVITIES:
|
||||||||
|
Net income (loss)
|
$ | 9,9,44,601 | $ | (709,326 | ) | |||
|
Adjustments to reconcile net (loss) income to net cash (used in) provided by operating activities:
|
||||||||
|
Depreciation and amortization
|
3,501,765 | 3,105,355 | ||||||
|
Deferred taxes
|
236,939 | (10,549 | ) | |||||
|
Option and warrant expense
|
195,474 | 2,198,961 | ||||||
|
Change of derivative instrument’s fair value
|
(7,480,992 | ) | 2,434,909 | |||||
|
Investment loss (income) in associated company
|
29,786 | - | ||||||
|
Changes in operating assets and liabilities:
|
||||||||
|
(Increase) Decrease In:
|
||||||||
|
Accounts receivable
|
8,118,796 | 1,014,365 | ||||||
|
Inventories
|
(2,554,537 | ) | (5,403,855 | ) | ||||
|
Other receivables
|
(880,750 | ) | (573,000 | ) | ||||
|
Due from employees
|
10,376 | (91,416 | ) | |||||
|
Prepayments and prepaid expenses
|
(3,290,026 | ) | 823,785 | |||||
|
Marketable equity securities (trading)
|
305,564 | - | ||||||
|
Increase (Decrease) In:
|
||||||||
|
Accounts payable
|
(1,431,210 | ) | 5,230,579 | |||||
|
Other payables and accrued liabilities
|
(156,970 | ) | (480,855 | ) | ||||
|
Customer deposits
|
(24,783 | ) | (35,308 | ) | ||||
|
Income tax payable
|
(14,090 | ) | (108,396 | ) | ||||
|
Net cash (used in) provided by operating activities
|
$ | 6,509,943 | $ | 7,395,249 | ||||
|
CASH FLOWS FROM INVESTING ACTIVITIES:
|
||||||||
|
Purchases of plant and equipment
|
(240,954 | ) | (750,553 | ) | ||||
|
Purchase of construction in progress
|
(6,019,101 | ) | - | |||||
|
Issuance of notes receivable
|
7,810,463 | (13,623,804 | ) | |||||
|
Repayments of notes receivable
|
(2,751,302 | ) | 2,274,519 | |||||
|
Net cash provided by (used in) investing activities
|
$ | (1,200,894 | ) | $ | (12,099,838 | ) | ||
See accompanying notes to condensed consolidated financial statements
7
|
KANDI TECHNOLOGIES, CORP.
AND SUBSIDIARIES
CONDENSED CONSOLIDATED STATEMENTS OF CASH FLOWS
(UNAUDITED)
|
|
Nine Months Ended
September 30
|
||||||||
|
2011
|
2010
|
|||||||
|
CASH FLOWS FROM FINANCING ACTIVITIES:
|
||||||||
|
Restricted cash
|
$ | (8,255,977 | ) | $ | (3,964,344 | ) | ||
|
Proceeds from short-term bank loans
|
25,607,093 | 23,619,506 | ||||||
|
Repayments of short-term bank loans
|
(22,748,197 | ) | (26,553,606 | ) | ||||
|
Proceeds from notes payable
|
33,309,509 | 23,860,959 | ||||||
|
Repayments of notes payable
|
(39,023,610 | ) | (7,955,742 | ) | ||||
|
Option exercise and other financing
|
65,544 | (932,425 | ) | |||||
|
Repayments of advances to related parties
|
- | - | ||||||
|
Net cash provided by financing activities
|
(11,045,638 | ) | 8,074,348 | |||||
|
NET INCREASE (DECREASE) IN CASH AND CASH EQUIVALENTS
|
(5,736,589 | ) | 3,369,759 | |||||
|
Effect of exchange rate changes on cash
|
(136,100 | ) | (176,124 | ) | ||||
|
Cash and cash equivalents at beginning of period
|
7,754,166 | 218,207 | ||||||
|
CASH AND CASH EQUIVALENTS AT END OF PERIOD
|
$ | 1,881,477 | $ | 3,411,842 | ||||
|
SUPPLEMENTARY CASH FLOW INFORMATION
|
||||||||
|
Income taxes paid
|
$ | 408,714 | $ | 388,351 | ||||
|
Interest paid
|
$ | 1,776,835 | $ | 1,331,792 | ||||
|
SUPPLEMENTAL NON-CASH DISCLOSURE:
|
||||||||
|
During the nine months ended September 30, 2011 and 2010, $0 and $0 were transferred from construction in progress to plant and equipment, respectively.
|
||||||||
See accompanying notes to condensed consolidated financial statements
8
KANDI TECHNOLOGIES, CORP.
AND SUBSIDIARIES
NOTES TO CONDENSED CONSOLIDATED FINANCIAL STATEMENTS
SEPTEMBER 30, 2011 (UNAUDITED)
Kandi Technologies, Corp. (the “Company” or “Kandi”, formally known as Stone Mountain Resources Inc.) was incorporated under the laws of the State of Delaware on March 31, 2004. On August 13, 2007, the Company changed its name from Stone Mountain Resources, Inc. to Kandi Technologies, Corp.
The company’s organizational chart is as follows:
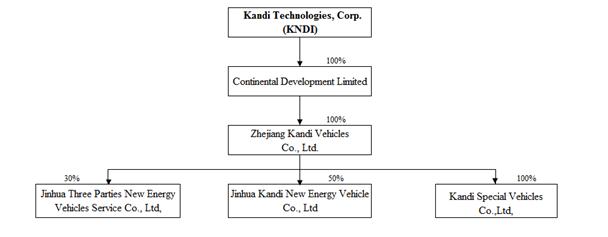
As the organizational chart reflects, Zhejiang Kandi Vehicles Co. Ltd. has a 50% ownership (voting) interest in Jinhua Kandi New Energy Vehicle Co. Ltd.; however, per the terms and conditions of its contractual arrangement with the other equity owner, Zhejiang Kandi Vehicles Co. Ltd. is entitled to 100% of the economic rights and interests (profits and loss absorption) in Jinhua Kandi New Energy Vehicle Co. Ltd.
The primary operations of the Company are the design, development, manufacturing, and commercializing of all-terrain vehicles, go-karts, and specialized automobiles such as Electric Vehicles (“EVs”) for the People’s Republic of China (“PRC”) and global export markets. Sales are mainly made to trading companies in China, then distributed throughout the world.
The Company had a working capital surplus of $18,936,075 at September 30, 2011, an improvement from a working capital surplus of $3,044,974 as of September 30, 2010, which was principally due to the Company’s additional equity offering in December 2010 and the conversion of the January 2010 convertible notes to common stock. The Company used part of these proceeds in the Company’s working capital and used part of these proceeds in the prepayment for purchasing fixed assets used for production.
As of September 30, 2011, the Company has credit lines from commercial banks for $44,050,111, of which $30,928,801 had been drawn as of September 30, 2011. The Company believes that its cash flows generated internally may not be sufficient to sustain operations and repay short term bank loans for the next twelve months. However, the Company believes its access to existing financing sources and established relationships with PRC banks will enable it to meet its obligations and fund its ongoing operations.
The Company has historically financed itself through short-term commercial bank loans from PRC banks. Normally, the term of these loans are for one year, and upon the repayment of all outstanding principal and interest in a respective loan, PRC banks roll the loans over for additional one-year terms, with adjustments made to the interest rate to reflect prevailing market rates. The Company believes this situation has not changed and the short-term bank loans will be available on normal trade terms if needed.
9
KANDI TECHNOLOGIES, CORP.
AND SUBSIDIARIES
NOTES TO CONDENSED CONSOLIDATED FINANCIAL STATEMENTS
SEPTEMBER 30, 2011 (UNAUDITED)
The Company maintains its general ledger and journals with the accrual method of accounting for financial reporting purposes. The financial statements and notes are representations of management.
These condensed consolidated financial statements have been prepared pursuant to the rules and regulations of the Securities and Exchange Commission (“SEC”).
Accounting policies adopted by the Company conform to U.S. generally accepted accounting principles (“GAAP”) and have been consistently applied in the presentation of financial statements.
The financial information included herein for the three and nine month periods ended September 30, 2011 and 2010 is unaudited; however, such information reflects all adjustments, consisting of normal recurring adjustments, that are, in the opinion of management, necessary for a fair presentation of the financial position, results of operations and cash flows of the Company for these interim periods.
The results of operations for the nine month period ended
September 30, 2011
are not necessarily indicative of the results expected for the entire fiscal year ending December 31, 2011.
The consolidated financial statements reflect the accounts of Kandi and its ownership in the following subsidiaries:
|
(i)
|
Continental Development, Ltd. (“Continental”) (a wholly-owned subsidiary of the Company)
|
|
(ii)
|
Zhejiang Kandi Vehicles Co., Ltd. (“Kandi Vehicles”) (a wholly-owned subsidiary of Continental)
|
|
(iii)
|
Kandi Special Vehicles Co., Ltd. (“KSV”) (a wholly-owned subsidiary of Kandi Vehicles)
|
|
(iv)
|
Jinhua Three Parties New Energy Vehicles Service Co., Ltd. (“Jinhua Service”) (a 30% owned subsidiary of Kandi Vehicles)
|
|
(v)
|
Jinhua Kandi New Energy Vehicles Co., Ltd. (“Kandi New Energy”) (a 50% owned subsidiary of Kandi Vehicles with 100% profits and loss absorption due to contractual agreement).
|
Certain information and footnote disclosures normally included in financial statements prepared in accordance with GAAP have been condensed or omitted pursuant to such regulations, although we believe that the disclosures provided are adequate to prevent the information presented from being misleading. Specifically, inter-company accounts and transactions have been eliminated in consolidation.
The preparation of financial statements in conformity with GAAP requires management to make estimates and assumptions that affect the reported amounts of assets and liabilities and disclosure of contingent assets and liabilities at the date of the consolidated financial statements, and the reported amounts of revenue and expenses during the reporting period. Management makes these estimates using the best information available at the time the estimates are made; however, actual results, when ultimately realized, could differ from management estimates.
(a) Economic; Exchange Rate; Political Risks
The Company’s operations are conducted in the PRC. Accordingly, the Company’s business, financial condition and results of operations may be influenced by the political, economic and legal environments in the PRC, and by the general state of the PRC economy.
Our operations are conducted mainly in the PRC. As such, our earnings are subject to movements in foreign currency exchange rates when transactions are denominated in Renminbi (“RMB”), which is our functional currency.
Accordingly, our operating results are affected by changes in the exchange rate between the U.S. dollar and those currencies.
The Company’s operations in the PRC are subject to special considerations and significant risks not typically associated with companies in North America and Western Europe. These include risks associated with, among
10
KANDI TECHNOLOGIES, CORP.
AND SUBSIDIARIES
NOTES TO CONDENSED CONSOLIDATED FINANCIAL STATEMENTS
SEPTEMBER 30, 2011 (UNAUDITED)
NOTE 6 – RISKS AND UNCERTAINTIES AND SUMMARY OF SIGNIFICANT ACCOUNTING POLICIES (CONTINUED)
others, the political, economic and legal environment and foreign currency exchange. The Company’s performance may be adversely affected by changes in the political and social conditions in the PRC, and by changes in governmental policies with respect to laws and regulations, anti-inflationary measures, currency conversion, remittances abroad, and rates and methods of taxation, among other things.
(b) Fair Value of Financial Instruments
ASC 820 establishes a three-tier fair value hierarchy, which prioritizes the inputs used in measuring fair value. The hierarchy prioritizes the inputs into three levels based on the extent to which inputs used in measuring fair value are observable in the market.
These tiers include:
|
·
|
Level 1—defined as observable inputs such as quoted prices in active markets;
|
|
·
|
Level 2—defined as inputs other than quoted prices in active markets that are either directly or indirectly observable; and
|
|
·
|
Level 3—defined as unobservable inputs in which little or no market data exists, therefore requiring an entity to develop its own assumptions.
|
The assets measured at fair value on a recurring basis subject to the disclosure requirements of ASC 820 as of September 30, 2011 are as follows:
|
Fair Value Measurements at Reporting Date
Using Quoted Prices in
|
||||||||||||||||
|
Carrying
value as of
September 30,
2011
|
Active Markets for Identical Assets
(Level 1)
|
Significant Other Observable Inputs
(Level 2)
|
Significant Unobservable Inputs
(Level 3)
|
|||||||||||||
|
Cash and cash equivalents
|
1,881,477 | 1,881,477 | - | |||||||||||||
|
Restricted cash
|
26,359,171 | 26,359,171 | - | |||||||||||||
|
Conversion features
|
75 | 75 | - | |||||||||||||
|
Warrants
|
1,840,487 | 1,840,487 | - | |||||||||||||
Cash and cash equivalents consist primarily of highly rated money market funds at a variety of well-known institutions with original maturities of three months or less. Restricted cash represents time deposits on account to secure short-term bank loans and notes payable. The original cost of these assets approximates fair value due to their short term maturity.
Warrants and conversion features embedded in the convertible notes, which are accounted as liabilities, are treated as derivative instruments, which will be measured at each reporting date for their fair value using Level 2 inputs. Also see Note 6 section (s) and (t).
The Company’s non-financial assets are measured on a recurring basis. These non-financial assets are measured for impairment annually on the Company’s measurement date at the reporting unit level using Level 3 inputs. For most assets, ASC 820 requires that the impact of changes resulting from its application be applied prospectively in the year in which the statement is initially applied.
The Company’s non-financial assets measured on a non-recurring basis include the Company’s property, plant and equipment and finite-use intangible assets which are measured for recoverability when indicators for impairment are present. ASC 820 requires companies to disclose assets and liabilities measured on a non-recurring basis in the period in which a fair value re-measurement is performed. The Company has reviewed its long-lived assets as of September 30, 2011 and determined that there are no significant assets to be tested for recoverability under ASC 360 and as such, no fair value measurements related to non-financial assets have been made during the nine months ended September 30, 2011.
11
KANDI TECHNOLOGIES, CORP.
AND SUBSIDIARIES
NOTES TO CONDENSED CONSOLIDATED FINANCIAL STATEMENTS
SEPTEMBER 30, 2011 (UNAUDITED)
NOTE 6 – RISKS AND UNCERTAINTIES AND SUMMARY OF SIGNIFICANT ACCOUNTING POLICIES (CONTINUED)
(c) Cash and Cash Equivalents
The Company considers highly liquid investments purchased with original maturities of three months or less to be cash equivalents.
Restricted cash on September 30, 2011 and December 31, 2010 represent time deposits on account to secure short-term bank loans and notes payable. Also see Notes 14 and 15.
(d) Inventories
Inventories are stated at the lower of cost or net realizable value (market value). The cost of raw materials is determined on the basis of weighted average. The cost of finished goods is determined on the weighted average basis and comprises direct materials, direct labor and an appropriate proportion of overhead.
Net realizable value is based on estimated selling prices less any further costs expected to be incurred for completion and selling expense.
(e) Accounts Receivable
Accounts receivable are recognized and carried at net realizable value. An allowance for doubtful accounts will be recorded in the period when a loss is probable based on an assessment of specific evidence indicating troubled collection, historical experience, accounts aging, ongoing business relation and other factors. Accounts are written off after exhaustive efforts at collection. If accounts receivable are to be provided for, or written off, they would be recognized in the consolidated statement of operations within operating expenses. At September 30, 2011 and December 31, 2010, the Company has an allowance for doubtful accounts of $0, as per the management's judgment based on their best knowledge.
As of each of September 30, 2011 and December 31, 2010, the longest credit term for certain customers was 120 days.
(f) Notes Receivable
Notes receivable represents short-term loans to third parties with the maximum term of one year. Interest income is recognized according to each agreement between a borrower and the Company on an accrual basis. If notes receivable are to be provided for, or written off, they are recognized in the relevant year if the loan default is probable, reasonably sure and the loss can be reasonably estimated. The Company recognizes income if the written-off loan is recovered at a future date. In case of foreclosure procedures or legal actions being taken, the Company provides accrual for the related foreclosure expense and related litigation expenses.
(g) Prepayments
Prepayments represent cash paid in advance to suppliers for raw materials used in the manufacturing process. For the fiscal quarter ended September 30, 2011, prepayments were primarily comprised of advances to mold manufactures. However, prepaid expenses, such as water and electricity fees, also contributed to the total number.
12
KANDI TECHNOLOGIES, CORP.
AND SUBSIDIARIES
NOTES TO CONDENSED CONSOLIDATED FINANCIAL STATEMENTS
SEPTEMBER 30, 2011 (UNAUDITED)
NOTE 6 – RISKS AND UNCERTAINTIES AND SUMMARY OF SIGNIFICANT ACCOUNTING POLICIES (CONTINUED)
(h) Plant and Equipment
Plant and equipment are carried at cost less accumulated depreciation. Depreciation is provided over the estimated useful lives of the assets, using the straight-line method. Leasehold improvements are amortized over the life of the asset or the term of the lease, whichever is shorter. Estimated useful lives are as follows:
|
Buildings
|
30 years
|
|
Machinery and equipment
|
10 years
|
|
Office equipment
|
5 years
|
|
Motor vehicles
|
5 years
|
|
Molds
|
5 years
|
The cost and related accumulated depreciation of assets sold or otherwise retired are eliminated from the accounts and any gain or loss is included in the statement of income. The cost of maintenance and repairs is charged to expense as incurred, whereas significant renewals and betterments are capitalized.
(i) Construction in Progress
Construction in progress represents direct costs of construction or the acquisition costs of buildings or machinery and design fees. Capitalization of these costs ceases and the construction in progress is transferred to plant and equipment when substantially all the activities necessary to prepare the assets for their intended use are completed. No depreciation is provided until the assets are completed and ready for their intended use.
(j) Land Use Rights
According to the laws of China, land in the PRC is owned by the government and cannot be sold to an individual or a company. However, the government grants the user a “land use right” to use the land. The land use rights granted to the Company are being amortized using the straight-line method over the lease term of fifty years.
(k) Accounting for the Impairment of Long-Lived Assets
The Company periodically evaluates the carrying value of long-lived assets to be held and used, including intangible assets subject to amortization, when events and circumstances warrant such a review, pursuant to the guidelines established in ASC No. 350. The carrying value of a long-lived asset is considered impaired when the anticipated undiscounted cash flow from such asset is separately identifiable and is less than its carrying value. In that event, a loss is recognized based on the amount by which the carrying value exceeds the fair market value of the long-lived asset. Fair market value is determined primarily using the anticipated cash flows discounted at a rate commensurate with the risk involved. Losses on long-lived assets to be disposed of are determined in a similar manner, except that fair market values are reduced for the cost to dispose. During the reporting period, there was no impairment loss.
(l) Revenue Recognition
Revenues represent the invoiced value of goods sold, recognized upon the shipment of goods to customers. Revenues are recognized when all of the following criteria are met:
·
Persuasive evidence of an arrangement exists;
·
Delivery has occurred or services have been rendered;
·
The seller’s price to the buyer is fixed or determinable; and
·
Collectability is reasonably assured.
13
KANDI TECHNOLOGIES, CORP.
AND SUBSIDIARIES
NOTES TO CONDENSED CONSOLIDATED FINANCIAL STATEMENTS
SEPTEMBER 30, 2011 (UNAUDITED)
NOTE 6 – RISKS AND UNCERTAINTIES AND SUMMARY OF SIGNIFICANT ACCOUNTING POLICIES (CONTINUED)
(m) Research and Development
Expenditures relating to the development of new products and processes, including significant improvement to existing products, are expensed as incurred. Research and development expenses were $1,695,003 and $1,203,270 for the nine months ended September 30, 2011 and 2010, respectively.
(n) Government Grants
Grants received from the PRC Government for assisting in the Company’s technical research and development efforts are netted against the relevant research and development costs incurred when the proceeds are received or collectible.
For the nine months ended September 30, 2011 and 2010, $289,962 and $266,911, respectively, was received from the PRC government for the Company’s contribution to the local economy.
(o) Income Taxes
The Company accounts for income tax using an asset and liability approach and allows for recognition of deferred tax benefits in future years. Under the asset and liability approach, deferred taxes are provided for the net tax effects of temporary differences between the carrying amounts of assets and liabilities for financial reporting purposes and the amounts used for income tax purposes. A valuation allowance is provided for deferred tax assets if it is more likely than not these items will either expire before the Company is able to realize their benefits, or that future realization is uncertain.
(p) Foreign Currency Translation
The accompanying consolidated financial statements are presented in United States dollars. The functional currency of the Company is the Renminbi (RMB). Capital accounts of the consolidated financial statements are translated into United States dollars from RMB at their historical exchange rates when the capital transactions occurred.
Assets and liabilities are translated at the exchange rates as of balance sheet date. Income and expenditures are translated at the average exchange rate of the reporting period, which was obtained from website: http://www.oanda.com
|
September 30,
2011
|
December 31,
2010
|
September 30,
2010
|
||||||||||
|
Period end RMB : USD exchange rate
|
6.4018 | 6.6118 | 6.6981 | |||||||||
|
Average period RMB : USD exchange rate
|
6.5060 | 6.7788 | 6.8164 | |||||||||
(q) Comprehensive Income
Comprehensive income is defined to include all changes in equity except those resulting from investments by owners and distributions to owners. Among other disclosures, all items that are required to be recognized under current accounting standards as components of comprehensive income are required to be reported in a financial statement that is presented with the same prominence as other financial statements. Comprehensive income includes net income and the foreign currency translation changes.
14
KANDI TECHNOLOGIES, CORP.
AND SUBSIDIARIES
NOTES TO CONDENSED CONSOLIDATED FINANCIAL STATEMENTS
SEPTEMBER 30, 2011 (UNAUDITED)
(r) Stock Option Cost
The Company’s stock option cost is recorded in accordance with ASC 718 and ASC 505.
The fair value of stock options is estimated using the Black-Scholes-Merton model. The Company’s expected volatility assumption is based on the historical volatility of the Company’s stock. The expected life assumption is primarily based on the expiration date of the option. The risk-free interest rate for the expected term of the option is based on the U.S. Treasury yield curve in effect at the time of grant.
Stock option expense recognized is based on awards expected to vest, and there were no estimated forfeitures. ASC standards require forfeitures to be estimated at the time of grant and revised in subsequent periods, if necessary, if actual forfeitures differ from those estimates.
The stock based compensation expense for the period ended September 30, 2011 is $195,474. Also see Note 17.
(s) Warrant Cost
The Company’s warrant costs are recorded in liabilities and equities respectively in accordance with ASC 480, ASC 505 and ASC 815.
The fair value of warrant is estimated using the Black-Scholes-Merton model. The Company’s expected volatility assumption is based on the historical volatility of the Company’s stock. The expected life assumption is primarily based on the expiration date of the warrant. The risk-free interest rate for the expected term of the option is based on the U.S. Treasury yield curve in effect at the time of measurement.
The Company determined that the equity based warrants are not considered derivatives under ASC 815, while the warrants, which are freestanding derivatives and are classified as liabilities on the balance sheet, will be measured at fair value on each reporting date.
(t) Fair Value of Conversion features
In accordance with ASC 815, the conversion feature of the Convertible Notes is separated from the debt instrument and accounted for separately as a derivative instrument. On the date the Convertible Notes are issued, the conversion feature was recorded as a liability at its fair value, and future decreases in fair value are recognized in earnings while increases in fair value are recognized in expenses.
The Company used the Black-Scholes-Merton option-pricing model to obtain the fair value of the conversion feature. The Company’s expected volatility assumption is based on the historical volatility of the Company’s stock. The expected life assumption is primarily based on the expiration date of the conversion features. The risk-free interest rate for the expected term of the conversion features is based on the U.S. Treasury yield curve in effect at the time of measurement.
Recent Accounting Pronouncements
In April 2011, the Financial Accounting Standard Board (“FASB”) issued Accounting Standard Update (“ASU”) ASU 2011-03, Consideration of Effective Control on Repurchase Agreements, which deals with the accounting for repurchase agreements and other agreements that both entitle and obligate a transferor to repurchase or redeem financial assets before their maturity. ASU 2011-03 changes the rules for determining when these transactions should be accounted for as financings, as opposed to sales. The guidance in ASU 2011-03 is effective for the first interim or annual period beginning on or after December 15, 2011. The guidance should be applied prospectively to transactions or modifications of existing transactions that occur on or after the effective date. Early adoption is not permitted. The adoption of ASU 2011-03 is not expected to have a material impact on the Company’s financial condition or results of operation.
15
KANDI TECHNOLOGIES, CORP.
AND SUBSIDIARIES
NOTES TO CONDENSED CONSOLIDATED FINANCIAL STATEMENTS
SEPTEMBER 30, 2011 (UNAUDITED)
In May 2011, the FASB issued ASU 2011-04, Fair Value Measurement (Topic 820): Amendments to Achieve Common Fair Value Measurement and Disclosure Requirements in U.S. GAAP and International Financial Reporting Standards (“IFRS”). ASU 2011-04 clarifies some existing concepts, eliminates wording differences between U.S. GAAP and IFRS, and in some limited cases, changes some principles to achieve convergence between U.S. GAAP and IFRS. ASU 2011-04 results in a consistent definition of fair value and common requirements for measurement of and disclosure about fair value between U.S. GAAP and IFRS. ASU 2011-04 also expands the disclosures for fair value measurements that are estimated using significant unobservable (Level 3) inputs. ASU 2011-04 will be effective for the Company beginning after December 15, 2011. The Company does not expect the adoption of ASU 2011-04 to have a material effect on its operating results or financial position.
In June 2011, FASB issued ASU 2011-05, Presentation of Comprehensive Income, which requires an entity to present the total of comprehensive income, the components of net income, and the components of other comprehensive income either in a single continuous statement of comprehensive income, or in two separate but consecutive statements. ASU 2011-05 eliminates the option to present components of other comprehensive income as part of the statement of equity. ASU 2011-05 will be effective for the Company beginning after December 15, 2011. The Company does not expect the adoption of ASU 2011-05 to have a material effect on its operating results or financial position. The Company is currently evaluating ASU 2011-05’s potential impact on its presentation of comprehensive income.
In September 2011, the FASB has issued Accounting Standards Update (ASU) No. 2011-08,
Intangibles—Goodwill and Other (Topic 350): Testing Goodwill for Impairment.
ASU 2011-08 is intended to simplify how entities, both public and nonpublic, test goodwill for impairment. ASU 2011-08 permits an entity to first assess qualitative factors to determine whether it is "more likely than not" that the fair value of a reporting unit is less than its carrying amount as a basis for determining whether it is necessary to perform the two-step goodwill impairment test described in Topic 350,
Intangibles-Goodwill and Other.
The more-likely-than-not threshold is defined as having a likelihood of more than 50%. ASU 2011-08 is effective for annual and interim goodwill impairment tests performed for fiscal years beginning after December 15, 2011. Early adoption is permitted, including for annual and interim goodwill impairment tests performed as of a date before September 15, 2011, if an entity’s financial statements for the most recent annual or interim period have not yet been issued or, for nonpublic entities, have not yet been made available for issuance.
(a) Customers
The Company’s major customers for the period ended September 30, 2011 accounted for the following percentages of total sales and accounts receivable as follows
:
|
Sales
|
Accounts Receivable
|
|||||||||||||||
|
Major Customers
|
Nine Months Ended
September 30,
2011
|
Nine Months Ended
September 30,
2010
|
September 30,
2011
|
December 31,
2010
|
||||||||||||
|
Company A
|
41 | % | 38 | % | 15 | % | 61 | % | ||||||||
|
Company B
|
19 | % | 13 | % | 31 | % | 14 | % | ||||||||
|
Company C
|
16 | % | 42 | % | 24 | % | 20 | % | ||||||||
|
Company D
|
9 | % | - | 7 | % | - | ||||||||||
|
Company E
|
7 | % | - | 9 | % | - | ||||||||||
16
KANDI TECHNOLOGIES, CORP.
AND SUBSIDIARIES
NOTES TO CONDENSED CONSOLIDATED FINANCIAL STATEMENTS
SEPTEMBER 30, 2011 (UNAUDITED)
(b) Suppliers
The Company’s major suppliers for the nine months ended September 30, 2011 accounted for the following percentage of total purchases and accounts payable as follows:
|
Purchases
|
Accounts Payable
|
|||||||||||||||
|
Major Suppliers
|
Nine Months Ended
September 30,
2011
|
Nine Months Ended
September 30,
2010
|
September 30,
2011
|
December 31,
2010
|
||||||||||||
|
Company F
|
66 | % | 82 | % | 3 | % | 26 | % | ||||||||
|
Company G
|
3 | % | - | 11 | % | 1 | % | |||||||||
|
Company H
|
2 | % | 2 | % | 1 | % | 4 | % | ||||||||
|
Company I
|
2 | % | - | - | 1 | % | ||||||||||
|
Company J
|
2 | % | - | 4 | % | - | ||||||||||
Because the Company is dependent on a small number of suppliers and customers, it is reasonably possible that a permanent or temporary disruption in these relationships could result in a severe impact on our results of operations.
The Company calculates earnings per share in accordance with ASC 260, Earnings Per Share, which requires a dual presentation of basic and diluted earnings per share. Basic earnings per share are computed using the weighted average number of shares outstanding during the fiscal year. Diluted earnings per share represents basic earnings per share adjusted to include the potentially dilutive effect of outstanding stock options, warrants and convertible note (using the if-converted method). For the nine months ended September 30, 2011, there are 1,304,091 potentially dilutive common shares. Also see Note 17.
The following table sets forth the computation of basic and diluted net income per common share:
|
Nine months Ended September 30,
|
2011
|
2010
|
||||||
|
Net income (loss)
|
$ | 9,944,601 | $ | (709,326 | ) | |||
|
Weighted – average shares of common stock outstanding
|
||||||||
|
Basic
|
27,436,434 | 21,139,827 | ||||||
|
Dilutive shares
|
1,303,770 | - | ||||||
|
Diluted
|
28,740,204 | 21,139,827 | ||||||
|
Basic income (loss) per share
|
$ | 0.36 | $ | (0.03 | ) | |||
|
Diluted income (loss) per share
|
$ | 0.35 | $ | (0.03 | ) | |||
17
KANDI TECHNOLOGIES, CORP.
AND SUBSIDIARIES
NOTES TO CONDENSED CONSOLIDATED FINANCIAL STATEMENTS
SEPTEMBER 30, 2011 (UNAUDITED)
Inventories are summarized as follows:
|
September 30,
2011
|
December 31,
2010
|
|||||||
|
(Unaudited)
|
||||||||
|
Raw material
|
$ | 1,566,100 | $ | 1,754,216 | ||||
|
Work-in-progress
|
5,367,801 | 3,668,104 | ||||||
|
Finished goods
|
1,741,822 | 464,186 | ||||||
| 8,675,723 | 5,886,506 | |||||||
|
Less: reserve for slow moving inventories
|
- | - | ||||||
|
Inventories, net
|
$ | 8,675,723 | $ | 5,886,506 | ||||
Net inventories increased $2,789,217 from December 31, 2010 to September 30, 2011. This increase resulted primarily
from the mass production of EV for the Chinese market.
Notes receivable are summarized as follows:
|
September 30,
2011
|
December 31,
2010
|
|||||||
|
(Unaudited)
|
||||||||
|
Notes receivable from unrelated companies:
|
||||||||
|
Due March 3, 2011, interest at 6.0% per annum
1
|
$ | - | $ | 1,205,026 | ||||
|
Due March 5, 2011, interest at 6.0% per annum
2
|
- | 423,168 | ||||||
|
Due April 13, 2011, interest at 9.6% per annum
3
|
- | 1,512,448 | ||||||
|
Due April 29, 2011, interest at 5.31% per annum
4
|
- | 756,224 | ||||||
|
Due September 30, 2011, interest at 9.6% per annum
5
|
- | 20,969,123 | ||||||
|
Due September 30, 2012, interest at 9.6% per annum
6
|
20,540,160 | - | ||||||
| 20,540,160 | 24,865,989 | |||||||
|
Bank acceptance notes:
|
||||||||
|
Bank acceptance notes
|
- | - | ||||||
|
Notes receivable
|
$ | 20,540,160 | $ | 24,865,989 | ||||
Details of Notes receivable from unrelated parties as of December 31, 2010
|
Index
|
Amount ($)
|
Counter party
|
Relationship
|
Purpose of Loan
|
Manner of settlement
|
|||||
|
1
|
1,205,026 |
Hangzhou YuanHai Property Co., Ltd.
|
No relationship beyond loan
|
Receive interest income
|
Repaid in cash
|
|||||
|
2
|
423,168 |
Hangzhou YuanHai Property Co., Ltd.
|
No relationship beyond loan
|
Receive interest income
|
Repaid in cash
|
|||||
|
3
|
1,512,448 |
Yongkang BoTao Trading Co., Ltd.
|
No relationship beyond loan
|
Receive interest income
|
Repaid in cash
|
|||||
|
4
|
756,224 |
JiangXi De’er Chemical Co., Ltd. (*)
|
No relationship beyond loan
|
Receive interest income
|
Repaid in cash
|
|||||
|
5
|
20,969,123 |
Yongkang HuiFeng Guarantee Co., Ltd.
|
No relationship beyond loan
|
Receive interest income
|
Repaid part in cash and renewed the rest
|
|
(*)
|
JiangXi De’er Chemical Co., Ltd. is 85% owned by Kandi Investment Group Co. (“KIGC”). KIGC is the guarantor of the Company’s bank loan of $4,234,853 and was also a lender of the note payable of $134,305 as of December 31, 2010. Also see note 15 and note 16 of Form 10-K, as amended, for fiscal year ended December 31, 2010. KIGC was a major shareholder of Kandi Vehicles but it transferred all its equity in Kandi Vehicles to Continental Development Limited in November 2006. Since then, KIGC has been unrelated to the Company or its affiliates.
|
18
KANDI TECHNOLOGIES, CORP.
AND SUBSIDIARIES
NOTES TO CONDENSED CONSOLIDATED FINANCIAL STATEMENTS
SEPTEMBER 30, 2011 (UNAUDITED)
Details of Notes receivable from unrelated parties as of September 30, 2011
|
Index
|
Amount ($)
|
Counter party
|
Relationship
|
Purpose of Loan
|
Manner of settlement
|
|||||
|
6
|
20,540,160 |
Yongkang HuiFeng Guarantee Co., Ltd.
|
No relationship beyond loan
|
Receive interest income
|
Not due
|
For the nine months ended September 30, 2011, the interest income generated from the notes receivable issued to third parties was $1,434,885.
Land use rights consist of the following:
|
September 30,
2011
|
December 31,
2010
|
|||||||
|
(Unaudited)
|
||||||||
|
Cost of land use rights
|
$ | 11,927,984 | $ | 11,549,134 | ||||
|
Less: Accumulated amortization
|
(933,980 | ) | (715,682 | ) | ||||
|
Land use rights, net
|
$ | 10,994,004 | $ | 10,833,452 | ||||
As of September 30, 2011 and December 31, 2010, the net book value of land use rights pledged as collateral for the Company’s bank loans was $4,058,024 and $3,998,555 respectively. Also see Note 15.
As of September 30, 2011 and December 31, 2010, the net book value of land use rights and plant and equipment pledged as collateral for bank loans borrowed by Zhejiang Mengdeli Electronic Co., Ltd. (“ZMEC”), an unrelated party of the Company was $6,935,980 and $4,640,069. Also see Note 19.
It is a common business practice among companies in the region of China where Kandi is located to exchange guarantees for bank debt with no consideration given. It is considered a “favor for favor” business practice and is commonly required by the lending banks as in these cases. ZMEC has provided a guarantee for certain of the Company’s bank loans. As of September 30, 2011, ZMEC guaranteed bank loans of the Company for a total of $12,496,485. In exchange, the Company guaranteed bank loans of ZMEC and allowed ZMEC to pledge the Company’s assets. Please see note 14.
The amortization expense for the nine months ended September 30, 2011 and 2010 was $191,700 and $186,203 respectively.
Amortization expense for the next five years and thereafter is as follows:
|
2011 (three months)
|
$ | 63,900 | ||
|
2012
|
255,600 | |||
|
2013
|
255,600 | |||
|
2014
|
255,600 | |||
|
2015
|
255,600 | |||
|
Thereafter
|
9,907,704 | |||
|
Total
|
$ | 10,994,004 |
19
KANDI TECHNOLOGIES, CORP.
AND SUBSIDIARIES
NOTES TO CONDENSED CONSOLIDATED FINANCIAL STATEMENTS
SEPTEMBER 30, 2011 (UNAUDITED)
Plant and equipment consist of the following:
|
September 30,
2011
|
December 31,
2010
|
|||||||
|
(Unaudited)
|
||||||||
|
At cost:
|
||||||||
|
Buildings
|
$ | 13,618,832 | $ | 13,073,777 | ||||
|
Machinery and equipment
|
10,055,798 | 9,733,241 | ||||||
|
Office equipment
|
181,331 | 153,441 | ||||||
|
Motor vehicles
|
243,957 | 188,277 | ||||||
|
Moulds
|
14,830,046 | 14,307,730 | ||||||
| 38,929,964 | 37,456,466 | |||||||
|
Less : Accumulated depreciation
|
||||||||
|
Buildings
|
$ | (1,824,464 | ) | $ | (1,437,172 | ) | ||
|
Machinery and equipment
|
(7,732,022 | ) | (6,755,599 | ) | ||||
|
Office equipment
|
(125,567 | ) | (108,034 | ) | ||||
|
Motor vehicles
|
(163,600 | ) | (129,113 | ) | ||||
|
Moulds
|
(7,507,018 | ) | (5,114,921 | ) | ||||
| (17,352,671 | ) | (13,544,840 | ) | |||||
|
Plant and equipment, net
|
$ | 21,577,293 | $ | 23,911,626 | ||||
As of September 30, 2011 and December 31, 2010, the net book value of plant and equipment pledged as collateral for the bank loans was $7,154,299 and $7,002,375, respectively. Also see Note 14.
As of September 30, 2011 and December 31, 2010, the net book value of plant and equipment pledged as collateral for bank loans borrowed by Zhejiang Mengdeli Electronic Co., Ltd. (“ZMEC”), a supplier but unrelated party of the Company was $4,640,069 and $4,634,487. Also see Note 19.
Depreciation expense for nine months ended September 30, 2011 and 2010 was $3,309,659 and $2,919,152 respectively.
Short-term loans are summarized as follows:
|
September 30,
2011
|
December 31,
2010
|
|||||||
|
(Unaudited)
|
||||||||
|
Loans from China
Communication Bank-Jinhua Branch
|
||||||||
|
Monthly interest only payments at 5.84% per annum, due February 4, 2011, guaranteed by Zhejiang Shuguang industrial Co., Ltd. Mr. Hu Xiaoming, and Mr. Yan Guanwei.
|
$ | - | $ | 756,224 | ||||
|
Monthly interest only payments at 7.87% per annum, due September 19, 2012, guaranteed by Kandi Investment Group Co.
|
781,030 | - | ||||||
|
Loans from Commercial Bank-Jiangnan Branch
|
||||||||
|
Monthly interest only payments at 5.84% per annum, due January 5, 2011, guaranteed by Zhejiang Kangli Metal Manufacturing Company, Mr. Hu Xiaoming, Lv Qingjiang, Lv Qingbo, and Ms. Ling Yueping. and pledged by the assets of Jingdezheng Changzhou Export & Import Company
|
- | 3,024,895 | ||||||
|
Monthly interest only payments at 5.84% per annum, due October 15, 2011, guaranteed by Mr. Hu Xiaoming, and Ms. Ling Yueping. and pledged by
Company’s assets. Also see Note 12 and Note 13.
|
1,562,061 | 1,512,447 | ||||||
20
KANDI TECHNOLOGIES, CORP.
AND SUBSIDIARIES
NOTES TO CONDENSED CONSOLIDATED FINANCIAL STATEMENTS
SEPTEMBER 30, 2011 (UNAUDITED)
NOTE 14 - SHORT TERM BANK LOANS (CONTINUED)
|
Monthly interest only payments at 5.84% per annum, due December 5, 2011, guaranteed by Mr. Hu Xiaoming, and Ms. Ling Yueping, and pledged by Company’s asset. Also see Note 12 and Note 13.
|
781,030 | 756,224 | ||||||
|
Monthly interest only payments at 5.81% per annum, due January 3, 2012, guaranteed by Zhejiang Kangli Metal Manufacturing Company, Mr. Hu Xiaoming, Lv Qingjiang, and Ms. Ling Yueping. and pledged by the assets of Jingdezheng De
’
er Investment Industrial Co. Ltd.
|
3,124,121 | - | ||||||
|
Loans from Huaxia Bank
|
||||||||
|
Monthly interest only payments at 5.73% per annum, due September 20, 2011, secured by the assets of the Company, guaranteed by Mr.Hu Xiaoming, Ms.Ling Yueping, Zhejiang Kangli Metal Manufacturing Company and Kandi Investment Group Co.
|
- | 4,234,853 | ||||||
|
Monthly interest only payments at 7.22% per annum, due September 23, 2012, secured by the assets of the Company, guaranteed by Zhejiang Kangli Metal Manufacturing Company and Kandi Investment Group Co.
|
4,373,771 | |||||||
|
Loans from China Ever-bright Bank
|
||||||||
|
Monthly interest only payments at 5.84% per annum, due April 7, 2011, secured by the assets of the Company, guaranteed by Mr. Hu Xiaoming, Ms. Ling Yueping, Nanlong Group Co., Ltd. and Zhejiang Mengdeli Electric Co., Ltd.
|
- | 4,537,342 | ||||||
|
Monthly interest only payments at 5.84% per annum, due October 11, 2011, secured by the assets of the Company, guaranteed by Mr. Hu Xiaoming, Ms. Ling Yueping, Nanlong Group Co., Ltd. and Zhejiang Mengdeli Electric Co., Ltd.
|
4,686,182 | 4,537,342 | ||||||
|
Monthly interest only payments at 5.10% per annum, due November 1, 2011, secured by the assets of the Company, guaranteed by Mr. Hu Xiaoming, Ms. Ling Yueping, Nanlong Group Co., Ltd. and Zhejiang Mengdeli Electric Co., Ltd.
|
- | 3,024,895 | ||||||
|
Monthly interest only payments at 5.10% per annum, due September 30, 2011, secured by the assets of the Company, guaranteed by Mr. Hu Xiaoming, Ms. Ling Yueping, Nanlong Group Co., Ltd. and Zhejiang Mengdeli Electric Co., Ltd.
|
- | - |
21
KANDI TECHNOLOGIES, CORP.
AND SUBSIDIARIES
NOTES TO CONDENSED CONSOLIDATED FINANCIAL STATEMENTS
SEPTEMBER 30, 2011 (UNAUDITED)
|
September 30,
2011
|
December 31,
2010
|
|||||||
|
(Unaudited)
|
||||||||
|
Monthly interest only payments at 6.16% per annum, due October 2, 2011, secured by the assets of the Company, guaranteed by Mr. Hu Xiaoming, Ms. Ling Yueping, Nanlong Group Co., Ltd. and Zhejiang Mengdeli Electric Co., Ltd.
|
4,686,182 | - | ||||||
|
Interest only payment at 6.71% per annum, due February 15, 2012.
|
1,343,372 | - | ||||||
|
Loans from Shanghai Pudong Development Bank
|
||||||||
|
Monthly interest only payments at 6.10% per annum, due December 28, 2011, secured by the property of Mr. Hu Xiaoming and Ms. Ling Yueping, guaranteed by Nanlong Group Co., Ltd. and Mr. Hu Xiaoming
|
3,124,121 | 3,024,895 | ||||||
|
Loans from Bank of Shanghai
|
||||||||
|
Monthly interest only payments at 6.1% per annum, due December 8, 2011, guaranteed by Mr. Hu Xiaoming, Zhejiang Kangli Metal Manufacturing Company and Zhejiang Taiping Shengshi Industrial Co., Ltd.
|
4,686,182 | |||||||
|
Loans from China Ever-growing Bank
|
||||||||
|
Monthly interest only payments at 5.61% per annum, due April 27, 2011, guaranteed by Zhejiang Shuguang industrial Co., Ltd. and Zhejiang Mengdeli Electric Company.
|
- | 3,024,895 | ||||||
|
Monthly interest only payments at 7.57% per annum, due April 27, 2012, guaranteed by Mr. Hu Xiaoming, Ms. Ling Yueping, Zhejiang Shuguang industrial Co., Ltd. and Zhejiang Mengdeli Electric Company.
|
3,124,121 | - | ||||||
|
Total
|
$ | 32,272,173 | $ | 28,434,012 | ||||
Short term bank loans interest expense for the nine months ended September 30, 2011 and 2010 was $1,416,698, and $1,128,437, respectively. As of September 30, 2011, the aggregate amount of short-term loans that are guaranteed by various third parties is $30,928,801.
Of this amount, $12,496,485 is guaranteed by Zhejiang Mengdeli Electric Co., Ltd. whose bank loans of $4,311,287 and bank note of $1,249,649 are guaranteed by the Company, or secured by the Company’s assets; the net book value of plant and equipment pledged as collateral is $4,640,069, and the net book value of land use right pledged as collateral is $6,935,980. Also see Note 19.
Of this amount, $12,184,074 is guaranteed by Zhejiang Kangli Metal Manufacturing Company, whose bank loans of $4,686,182 are guaranteed by the Company. Also see Note 19. $3,124,121 is guaranteed by Lv Qingjiang, the major shareholder of Zhejiang Kangli Metal Manufacturing Company.
Of this amount, $3,124,121 is guaranteed by Zhejiang Shuguang industrial Co., Ltd. whose bank loans of $3,124,121 are also guaranteed by the Company. Also see Note 19.
Of this amount, $4,686,182 is guaranteed by Zhejiang Taiping Shengshi Industrial Co., Ltd. whose bank loans of $3,124,121 are also guaranteed by the Company. Also see Note 19.
This is a common business practice among companies in the region of China where Kandi is located to exchange guarantees for bank debt with no consideration given. It is considered a “favor for favor” business practice and is commonly required by the lending banks as in these cases.
22
KANDI TECHNOLOGIES, CORP.
AND SUBSIDIARIES
NOTES TO CONDENSED CONSOLIDATED FINANCIAL STATEMENTS
SEPTEMBER 30, 2011 (UNAUDITED)
By issuing bank note payables rather than paying cash to suppliers, the Company can defer the payments until the date bank note payable is due. Simultaneously, the Company needs to deposit restricted cash in banks to back up the bank note payable, while the restricted cash deposited in banks at the rate of 3.05% annually for this reporting period will generate interest income
Notes payable are summarized as follows:
|
September 30,
2011
|
December 31,
2010
|
|||||||
| (Unaudited) | ||||||||
|
Bank acceptance notes:
|
||||||||
|
Due January 13, 2011
|
$ | - | $ | 1,512,447 | ||||
|
Due March 2, 2011
|
- | 1,209,958 | ||||||
|
Due March 13, 2011
|
- | 1,512,447 | ||||||
|
Due March 16, 2011
|
- | 1,209,958 | ||||||
|
Due April 18, 2011
|
- | 1,134,336 | ||||||
|
Due April 18, 2011
|
- | 930,155 | ||||||
|
Due April 18, 2011
|
- | 960,404 | ||||||
|
Due April 20, 2011
|
- | 1,361,203 | ||||||
|
Due April 26, 2011
|
- | 2,268,671 | ||||||
|
Due May 5, 2011
|
- | 756,224 | ||||||
|
Due May 10, 2011
|
- | 3,024,895 | ||||||
|
Due May 16, 2011
|
- | 3,024,895 | ||||||
|
Due October 18, 2011
|
3,124,121 | - | ||||||
|
Due October 20, 2011
|
1,562,061 | - | ||||||
|
Due October 21, 2011
|
2,343,091 | - | ||||||
|
Due November 20, 2011
|
3,124,121 | - | ||||||
|
Due January 19,2012
|
148,396 | - | ||||||
|
Due March 26, 2012
|
14,059 | - | ||||||
|
Due March 26, 2012
|
15,621 | - | ||||||
|
Due March 26, 2012
|
37,489 | - | ||||||
|
Due March 26, 2012
|
15,621 | |||||||
|
Due March 26, 2012
|
17,183 | |||||||
|
Due March 26, 2012
|
15,621 | |||||||
|
Due March 26, 2012
|
14,059 | - | ||||||
|
Due March 26, 2012
|
7,810 | - | ||||||
|
Due March 26, 2012
|
6,248 | |||||||
|
Due March 26, 2012
|
15,621 | |||||||
|
Due March 26, 2012
|
15,621 | |||||||
|
Due March 26, 2012
|
7,810 | |||||||
|
Due March 26, 2012
|
31,241 | |||||||
|
Due March 26, 2012
|
9,685 | |||||||
|
Due March 26, 2012
|
9,372 | |||||||
|
Due March 26, 2012
|
10,934 | |||||||
|
Due March 26, 2012
|
31,241 | |||||||
|
Due March 26, 2012
|
51,548 | |||||||
|
Due March 26, 2012
|
46,862 | |||||||
|
Due March 26, 2012
|
15,621 | |||||||
|
Due March 26, 2012
|
4,686 | |||||||
|
Due March 26, 2012
|
3,124 | |||||||
|
Due March 26, 2012
|
3,124 | |||||||
|
Due March 26, 2012
|
12,496 | |||||||
|
Due March 26, 2012
|
15,621 | |||||||
|
Due March 26, 2012
|
3,124 | |||||||
|
Due March 26, 2012
|
3,124,121 | - | ||||||
|
Subtotal
|
$ | 13,857,353 | $ | 18,905,593 | ||||
23
KANDI TECHNOLOGIES, CORP.
AND SUBSIDIARIES
NOTES TO CONDENSED CONSOLIDATED FINANCIAL STATEMENTS
SEPTEMBER 30, 2011 (UNAUDITED)
|
September 30,
2011
|
December 31,
2010
|
|||||||
| (Unaudited) | ||||||||
|
Notes payable to unrelated companies:
|
||||||||
|
Due April 24, 2011 (Interest rate 6.0% per annum)
|
$ | - | $ | 134,305 | ||||
|
Due January 20, 2012 (Interest rate 6.0% per annum)
|
1,000 | 1,000 | ||||||
|
Subtotal
|
1,000 | 135,305 | ||||||
|
Total
|
$ | 13,858,353 | $ | 19,040,898 | ||||
All the bank acceptance notes do not bear interest, but are subject to bank charges of 0.005% of the principal as commission on each transaction.
Restricted cash of $12,295,292 is held as collateral for the following notes payable at September 30, 2011:
|
Due October 18, 2011
|
$ | 3,124,121 | ||
|
Due October 20, 2011
|
1,562,061 | |||
|
Due October 21, 2011
|
2,343,091 | |||
|
Due November 20, 2011
|
3,124,121 | |||
|
Due January 19,2012
|
148,396 | |||
|
Due March 26, 2012
|
14,059 | |||
|
Due March 26, 2012
|
15,621 | |||
|
Due March 26, 2012
|
37,489 | |||
|
Due March 26, 2012
|
15,621 | |||
|
Due March 26, 2012
|
17,183 | |||
|
Due March 26, 2012
|
15,621 | |||
|
Due March 26, 2012
|
14,059 | |||
|
Due March 26, 2012
|
7,810 | |||
|
Due March 26, 2012
|
6,248 | |||
|
Due March 26, 2012
|
15,621 | |||
|
Due March 26, 2012
|
15,621 | |||
|
Due March 26, 2012
|
7,810 | |||
|
Due March 26, 2012
|
31,241 | |||
|
Due March 26, 2012
|
9,685 | |||
|
Due March 26, 2012
|
9,372 | |||
|
Due March 26, 2012
|
10,934 | |||
|
Due March 26, 2012
|
31,241 | |||
|
Due March 26, 2012
|
51,548 | |||
|
Due March 26, 2012
|
46,862 | |||
|
Due March 26, 2012
|
15,621 | |||
|
Due March 26, 2012
|
4,686 | |||
|
Due March 26, 2012
|
3,124 | |||
|
Due March 26, 2012
|
3,124 | |||
|
Due March 26, 2012
|
12,496 | |||
|
Due March 26, 2012
|
15,621 | |||
|
Due March 26, 2012
|
3,124 | |||
|
Due March 26, 2012
|
3,124,121 | |||
|
Subtotal
|
$ | 13,857,353 |
24
KANDI TECHNOLOGIES, CORP.
AND SUBSIDIARIES
NOTES TO CONDENSED CONSOLIDATED FINANCIAL STATEMENTS
SEPTEMBER 30, 2011 (UNAUDITED)
(a) Corporation Income Tax
On March 16, 2007, the National People’s Congress of China approved the Corporate Income Tax Law of the PRC (the “new CIT law”), which went into effect on January 1, 2008. In accordance with the relevant tax laws and regulations of the PRC, the applicable corporate income tax rate is 25%. Prior to January 1, 2008, the corporation income tax (“CIT”) rate applicable to the Company was 33%. As a foreign-invested company, the income tax rate of Kandi is entitled to a 50% tax holiday based on 25% for the years from 2009 through 2011. During the transition period, the above tax concession granted to the Company prior to the new CIT law will be grandfathered according to the interpretations of the new CIT law. KSV and KNE are subsidiaries of the Company and their applicable corporate income tax rates are both 25%.
According to the PRC CIT reporting system, the CIT sales cut-off base is concurrent with the value added tax (“VAT”) which will be reported to the State Administration of Taxation (“SAT”) on a quarterly basis. Since the VAT and CIT are accounted for on a VAT tax basis that recorded all sales on a “State provided official invoices” reporting system, the Company is reporting the CIT according to the SAT prescribed tax reporting rules. Under the VAT tax reporting system, sales cut-off did not take the accrual base but rather on a VAT taxable reporting basis. Therefore, when the company adopted US GAAP on accrual basis, the sales cut-off CIT timing difference which derived from the VAT reporting system will create a temporary sales cut-off timing difference and this difference is reflected in the deferred tax assets or liabilities calculations on the income tax estimation reported in the Company’s Annual Report on Form 10-K/A for the year ended December 31, 2010.
Effective January 1, 2007, the Company adopted ASC 740, Income Taxes. The interpretation addresses the determination of whether tax benefits claimed or expected to be claimed on a tax return should be recorded in the financial statements. Under ASC 740, the Company may recognize the tax benefit from an uncertain tax position only if it is more likely than not that the tax position will be sustained on examination by the taxing authorities, based on the technical merits of the position. The tax benefits recognized in the financial statements from such a position should be measured based on the largest benefit that has a greater than fifty percent likelihood of being realized upon ultimate settlement. ASC 740 also provides guidance on de-recognition, classification, interest and penalties on income taxes, accounting in interim periods and requires increased disclosures. As of September 30, 2011, the Company does not have a liability for unrecognized tax benefits. The Company files income tax returns with the Internal Revenue Service (“IRS”) and states on such returns where it has operations. The Company is subject to U.S. federal or state income tax examinations by IRS and relevant state tax authorities for years after 2006. During the periods open to examination, the Company has net operating loss carry forwards (“NOLs”) for U.S. federal and state tax purposes that have attributes from closed periods. Since these NOLs may be utilized in future periods, they remain subject to examination. The Company also files certain tax returns in China. As of September 30, 2011 the Company was not aware of any pending income tax examinations by China tax authorities. The Company's policy is to record interest and penalties on uncertain tax provisions as income tax expense. As of September 30, 2011, the Company has no accrued interest or penalties related to uncertain tax positions. The Company has not recorded a provision for U.S federal income tax for the nine months ended September 30, 2011 due to the net operating loss carry forward in the United States Under ASC 740, the Company may recognize the tax benefit from an uncertain tax position only if it is more likely than not that the tax position will be sustained on examination by the taxing authorities, based on the technical merits of the position. The tax benefits recognized in the financial statements from such a position should be measured based on the largest benefit that has a greater than fifty percent likelihood of being realized upon ultimate settlement. ASC 740 also provides guidance on de-recognition, classification, interest and penalties on income taxes, accounting in interim periods and requires increased disclosures. As of September 30, 2011, the Company does not have a liability for unrecognized tax benefits. The Company files income tax returns with the Internal Revenue Service (“IRS”) and states on such returns where it has operations. The Company is subject to U.S. federal or state income tax examinations by IRS and relevant state tax authorities for years after 2006. During the periods open to examination, the Company has net operating loss carry forwards (“NOLs”) for U.S. federal and state tax purposes that have attributes from closed periods. Since these NOLs may be utilized in future periods, they remain subject to examination. The Company also files certain tax returns in China. As of September 30, 2011 the Company was not aware of any pending income tax examinations by China tax authorities. The Company's policy is to record interest and penalties on uncertain tax provisions as income tax expense. As of September 30, 2011, the Company has no accrued interest or penalties related to uncertain tax positions. The Company has not recorded a provision for U.S federal income tax for the nine months ended September 30, 2011 due to the net operating loss carry forward in the United States.
25
KANDI TECHNOLOGIES, CORP.
AND SUBSIDIARIES
NOTES TO CONDENSED CONSOLIDATED FINANCIAL STATEMENTS
SEPTEMBER 30, 2011 (UNAUDITED)
NOTE 16 – TAX (CONTINUED)
Income tax expense (benefit) for the nine months ended September 30, 2011 and 2010 is summarized as follows:
|
For the Nine Months Ended
September 30,
|
||||||||
|
(Unaudited)
|
||||||||
|
2011
|
2010
|
|||||||
|
Current:
|
||||||||
|
Provision for CIT
|
$ | 394,624 | $ | 279,955 | ||||
|
Provision for Federal Income Tax
|
- | |||||||
|
Deferred:
|
||||||||
|
Provision for CIT
|
(10,617 | ) | ||||||
|
Income tax expense (benefit)
|
$ | 394,624 | $ | 269,338 | ||||
The Company’s income tax expense (benefit) differs from the “expected” tax expense for the nine months ended September 30, 2011 and 2010 (computed by applying the CIT rate of 25%, respectively, to income before income taxes) as follows:
|
For the Nine Months Ended
September 30,
|
||||||||
|
(Unaudited)
|
||||||||
|
2011
|
2010
|
|||||||
|
Computed "expected" (benefit) expense
|
$ | 551,691 | $ | (109,997 | ) | |||
|
Favorable tax rate
|
(394,624 | ) | 236,834 | |||||
|
Permanent differences
|
33,723 | 58,159 | ||||||
|
Valuation allowance
|
203,834 | 84,342 | ||||||
|
Income tax expense (benefit)
|
$ | 394,624 | $ | 269,338 | ||||
26
KANDI TECHNOLOGIES, CORP.
AND SUBSIDIARIES
NOTES TO CONDENSED CONSOLIDATED FINANCIAL STATEMENTS
SEPTEMBER 30, 2011 (UNAUDITED)
NOTE 16 – TAX (CONTINUED)
The tax effects of temporary differences that give rise to the Company’s net deferred tax assets and liabilities as of September 30, 2011 and December 31, 2010 are summarized as follows:
|
September 30, 2011
(Unaudited)
|
December 31,
2010
|
|||||||
|
Current portion:
|
||||||||
|
Deferred tax assets:
|
||||||||
|
Expense
|
$ | (9,422 | ) | $ | (10,042 | ) | ||
|
Subtotal
|
(9,422 | ) | (10,042 | ) | ||||
|
Deferred tax liabilities:
|
||||||||
|
Sales cut-off (CIT tax reporting on VAT tax system)
|
2,236 | (24,041 | ) | |||||
|
Other
|
(196,405 | ) | - | |||||
|
Subtotal
|
(194,169 | ) | (24,041 | ) | ||||
|
Total deferred tax liabilities – current portion
|
(203,591 | ) | (34,083 | ) | ||||
|
Non-current portion:
|
||||||||
|
Deferred tax assets:
|
||||||||
|
Depreciation
|
425,296 | 476,847 | ||||||
|
Loss carried forward
|
203,834 | 3,524,145 | ||||||
|
Valuation allowance
|
(203,834 | ) | (3,524,145 | ) | ||||
|
Subtotal
|
425,296 | 476,847 | ||||||
|
Deferred tax liabilities:
|
||||||||
|
Accumulated other comprehensive gain
|
(220,899 | ) | (220,899 | ) | ||||
|
Subtotal
|
(220,899 | ) | (220,899 | ) | ||||
|
Total deferred tax assets – non-current portion
|
204,397 | 255,948 | ||||||
|
Net deferred tax assets
|
$ | 806 | $ | 221,865 | ||||
27
KANDI TECHNOLOGIES, CORP.
AND SUBSIDIARIES
NOTES TO CONDENSED CONSOLIDATED FINANCIAL STATEMENTS
SEPTEMBER 30, 2011 (UNAUDITED)
(b) Tax Holiday Effect
For the nine months ended September 30, 2011 and 2010 the PRC corporate income tax rate was 25%. Certain subsidiaries of the Company are entitled to tax holidays for the nine months ended September 30, 2011 and 2010.
The combined effects of the income tax expense exemptions and reductions available to the Company for the nine months ended September 30, 2011 and 2010 are as follows:
|
For the Nine Months Ended
September 30
(Unaudited)
|
||||||||
|
2011
|
2010
|
|||||||
|
Tax holiday credit
|
$ | (394,624 | ) | $ | (236,834 | ) | ||
|
Basic net income per share effect
|
$ | (0.01 | ) | $ | (0.01 | ) | ||
(a) Stock Options
On February 11, 2009, the Compensation Committee of the Board of Directors of the Company approved the grant of stock options for 2,600,000 shares of common stock to ten of the Company's employees and directors. The stock options vest ratably over three years and expire in ten years from the grant date. The Company valued the stock options at $2,062,964 and amortizes the stock compensation expense using the straight-line method over the service period from February 11, 2009 through February 11, 2012. The value of the options was estimated using the Black Scholes Model with an expected volatility of 164%, expected life of 10 years, risk-free interest rate of 2.76% and expected dividend yield of 0.00%. On June 30, 2011, one of the Company’s directors resigned, and his 6,668 unexercised options were forfeited.
The following is a summary of the stock option activities of the Company:
|
Activity
|
Weighted Average
Exercise Price
|
|||||||
|
Outstanding as of January 1, 2011
|
1,833,304 | $ | 0.84 | |||||
|
Granted
|
- | - | ||||||
|
Exercised
|
39,999 | 0.80 | ||||||
|
Cancelled
|
6,668 | 0.80 | ||||||
|
Outstanding as of September 30, 2011
|
1,786,637 | 0.84 | ||||||
28
KANDI TECHNOLOGIES, CORP.
AND SUBSIDIARIES
NOTES TO CONDENSED CONSOLIDATED FINANCIAL STATEMENTS
SEPTEMBER 30, 2011 (UNAUDITED)
NOTE 17 - STOCK OPTIONS, WARRANTS AND CONVERTIBLE NOTES (CONTINUED)
The following table summarizes information about stock options outstanding as of September 30, 2011:
|
Options Outstanding
|
Options Exercisable
|
|||||||||||||||||
|
Number of shares
|
Exercise
Price
|
Remaining Contractual life
(in years)
|
Number of
shares
|
Exercise
Price
|
||||||||||||||
| 1,686,637 | $ | 0.80 | 7.50 | 1,686,637 | $ | 0.80 | ||||||||||||
| 100,000 | 1.50 | 8.00 | 100,000 | 1.50 | ||||||||||||||
The fair value per share of the 2,600,000 options issued to the employees and directors is $0.7934 per share. The fair value per share of the unexercised 100,000 options issued to Wang Rui and Li Qiwen, which became exercisable on June 6, 2010, is $3.44.
(b) Warrants and Convertible Notes
On September 21, 2009, the Company executed an agreement (“Consulting Agreement”) with a third-party consultant, whereby the consultant is to provide management consulting and advisory services for a period of 12 months, beginning on September 22, 2009, and ending on September 22, 2010. As compensation for the services provided, the Company agreed to issue 200,000 warrants to purchase the Company’s common stock, with 100,000 of these warrants issued at an exercise price of $2.00 per share and 100,000 of these warrants issued at an exercise price of $2.50 per share. All of the warrants have a five year contractual term and were granted on October 22, 2009. The warrants vested in full and became exercisable on January 21, 2010, upon the closing of an initial round of financing. The fair value per share of the 100,000 warrants issued under the Consulting Agreement with an exercise price of $2.00 is $4.56, and the fair value per share of the 100,000 warrants issued under the Consulting Agreement with an exercise price of $2.50 is $4.48. As of September 30, 2011, the consultant had cashless exercised the 100,000 warrants with the exercise price of $2.50 per share.
Under a Securities Purchase Agreement, dated as of January 21, 2010, by and among the Company and certain investors thereto, the Company issued a total of $10 million of senior secured convertible notes (the “Convertible Notes”) and warrants exercisable for an aggregate of 800,000 shares of the Company’s Common Stock (the “Investor Warrants”), for gross proceeds of $10 million. The Convertible Notes, which accrue interest at a rate of 6% per annum, will mature in two years following the closing date of the offering and are initially convertible, at the option of the holders, into shares of Common Stock at $6.25 per share. As of January 21, 2010, at the price of $6.25 per share, the Convertible Notes were convertible into 1,600,000 shares of Common Stock. The Investor Warrants, which are exercisable for a period of three years following the closing date, are initially exercisable for shares of Common Stock at an exercise price of $6.5625 per share as of January 21, 2010. Included in the associated issuance costs is the fair value of 80,000 warrants issued to placement agents. These warrants have the same terms and conditions as the Investor Warrants issued to the investors.
29
KANDI TECHNOLOGIES, CORP.
AND SUBSIDIARIES
NOTES TO CONDENSED CONSOLIDATED FINANCIAL STATEMENTS
SEPTEMBER 30, 2011 (UNAUDITED)
Pursuant to the terms of the Convertible Notes and the Investor Warrants, on May 18, 2010, the conversion price of the Convertible Notes was adjusted to $3.5924 per share and the exercise price of the Investor Warrants and warrants issued to the placement agent was adjusted to $4.3907 per share. On August 19, 2010, the conversion price of the Convertible Notes was adjusted to $3.1146 per share and the exercise price of the Investor Warrants and warrants issued to the placement agent was adjusted to $3.8067 per share. As a result, the number of Investor Warrants and warrants issued to the placement agent were adjusted to 1,379,147 and 137,915 respectively. As of September 30, 2011, the investors had converted $9,999,000 of the principal amount and $159,507 of accrued interest of the Convertible Notes into an aggregate of 3,120,795 shares of Common Stock.
As of September 30, 2011, the fair value of the Investor Warrants and the warrants issued to the placement agent is $0.64 per share, and the fair value of conversion features is $0.23 per share.
On December 21, 2010, the Company agreed to sell to certain institutional investors up to 3,027,272 shares of the Company’s common stock and warrants to purchase up to 1,210,912 shares of the Company’s common stock in fixed combination, with each combination consisting of one share of common stock and a warrant to purchase 0.40 shares of common stock in a registered direct public offering (“Second round warrants”). The warrants became exercisable immediately following the closing date of the offering and remain exercisable for three years thereafter at an exercise price of $6.30 per share. As of September 30, 2011, the fair value of Second round warrants is $0.72 per share.
According to that certain Consulting Agreement dated as of September 21, 2009, the Company agreed to issue the consultant 100,000 shares of Company’s Common Stock upon the achievement of certain conditions. Pursuant to the terms of the Consulting Agreement, the Company issued an aggregate of 100,000 restricted shares of Common Stock to the consultant and certain of its employees on April 14, 2010.
According to that certain consulting agreement dated as of March 1, 2010, between the Company and DGI Investor Relations, Inc., the Company agreed to compensate the consultant in payments of 2,000 shares of Company’s Common Stock per quarter for the term of the agreement in exchange for the consultant providing investor relations services. Pursuant to the terms of the agreement, as of September 30, 2011 the Company has issued 11,340 shares of Common Stock for services rendered from January 1, 2010 to the end of the agreement – May 31, 2011.
According to the employment agreement between the Company and Cathy Cao, Executive VP of Finance, as part of her compensation package, the Company agreed to compensate Cathy Cao’s service in payments of 2,500 shares of Common Stock per quarter until September 15, 2011.
The fair value of stock awarded is determined by the closing price of the common stock on the date of stock awarded.
30
KANDI TECHNOLOGIES, CORP.
AND SUBSIDIARIES
NOTES TO CONDENSED CONSOLIDATED FINANCIAL STATEMENTS
SEPTEMBER 30, 2011 (UNAUDITED)
(a)
Guarantees and Pledged collateral for third party bank loans
(1) Guarantees for third party bank loans
As of September 30, 2011, the Company provided guarantee for the following third parties:
|
Guarantee provided to
|
Amount
|
|||
|
Zhejiang Kangli Metal Manufacturing Company.
|
$ | 4,686,182 | ||
|
Zhejiang Shuguang industrial Co., Ltd.
|
3,124,121 | |||
|
Zhejiang Yiran Auto Sales Company
|
2,343,091 | |||
|
Zhejiang Taiping Shengshi Industrial Co., Ltd.
|
3,124,121 | |||
|
Zhejiang Taiping Trade Co., Ltd
|
3,592,740 | |||
|
Yongkang Angtai Trade Co., Ltd.
|
781,030 | |||
|
Total
|
$ | 17,651,285 | ||
On December 8, 2010, the Company entered into a guarantee contract to serve as the guarantor for the bank loan borrowed from Shanghai Bank Hangzhou branch in the amount of $4,686,182 by Zhejiang Kangli Metal Manufacturing Company. (“ZKMMC”) for the period from December 8, 2010 to December 8, 2011. ZKMMC is not related to the Company. Under this guarantee contract, the Company shall perform all obligations of ZKMMC under the loan contract if ZKMMC fails to perform its obligations as set forth in the loan contract.
On December 7, 2010, the Company entered into a guarantee contract to serve as the guarantor for the bank loans borrowed from Huaxia Bank Hangzhou branch in the amount of $3,124,121 by Zhejiang Shuguang industrial Co., Ltd. (“ZHICL”) for the period from December 7, 2010 to December 7, 2011. ZHICL is not related to the Company. Under these guarantee contracts, the Company shall perform all obligations of ZHICL under the loan contracts if ZHICL fails to perform its obligations as set forth in the loan contracts.
On September 29, 2010 and April 25, 2011, the Company entered into two guarantee contracts to serve as the guarantor for the bank loans borrowed from Bank of Hangzhou and Shanghai Pudong Development Bank Hangzhou branch in the amount of $781,030 and $1,562,061 by Zhejiang Yiran Auto Sales Company (“ZYASC”) for the period from September 29, 2010 to October 30, 2011 and from April 25, 2011 to April 25, 2012 respectively. ZYASC is not related to the Company. Under these guarantee contracts, the Company shall perform all obligations of ZYASC under the loan contracts if ZYASC fails to perform its obligations as set forth in the loan contracts.
31
KANDI TECHNOLOGIES, CORP.
AND SUBSIDIARIES
NOTES TO CONDENSED CONSOLIDATED FINANCIAL STATEMENTS
SEPTEMBER 30, 2011 (UNAUDITED)
NOTE 19 – COMMITMENTS AND CONTINGENCIES (CONTINUED)
On December 8, 2010, the Company entered into a guarantee contract to serve as the guarantor for the bank loans borrowed from Shanghai Bank Hangzhou branch in the amount of $3,124,121 by Zhejiang Taiping Shengshi Industrial Co., Ltd. (“ZTSICL”) for the period from December 8, 2010 to December 8, 2011. ZTSICL is not related to the Company. Under this guarantee contract, the Company shall perform all obligations of ZTSICL under the loan contract if ZTSICL fails to perform its obligations as set forth in the loan contract.
On August 9, 2011, the Company entered into a guarantee contract to serve as the guarantor for the bank loans borrowed from ICBC Wuyi branch in the amount of $3,592,740 by Zhejiang Taiping Trade Co., Ltd (“ZTTCL”) for the period from August 9, 2011 to August 9, 2013. ZTTCL is not related to the Company. Under this guarantee contract, the Company shall perform all obligations of ZTTCL under the loan contract if ZTTCL fails to perform its obligations as set forth in the loan contract.
On January 7, 2011, the Company entered into two guarantee contracts to serve as the guarantor for the bank loans borrowed from China Communication Bank Jinhua Branch in the amount of $156,206 and $624,824 respectively by Yongkang Angtai Trade Co., Ltd. (“YATCL”) for the period from January 7, 2011 to December 31, 2012. YATCL is not related to the Company. Under these guarantee contracts, the Company shall perform all obligations of YATCL under the loan contracts if YATCL fails to perform its obligations as set forth in the loan contracts.
(2) Guarantees for third party bank notes
|
Guarantee provided to
|
Amount
|
|||
|
Zhejiang Mengdeli Electric Co., Ltd.
|
$ | 1,249,649 | ||
|
Total
|
$ | 1,249,649 | ||
On August 24, 2010, the Company entered into a guarantee contract to serve as guarantor for the bank note borrowed from Huaxia Bank Hangzhou branch in the amount of $1,249,649 by Zhejiang Mengdeli Electric Co., Ltd. (“ZMEC”) for the period from August 24, 2010 to August 24, 2012. ZMEC is a supplier but not related to the Company. Under this guarantee contract, the Company shall perform all obligations of ZMEC under the loan contract if ZMEC fails to perform its obligations as set forth in the loan contract.
(3) Pledged collateral for a third party’s bank loans
As of September 30, 2011, the Company provided the land use rights and plant and equipment pledged as collateral for the following third party:
|
Zhejiang Mengdeli Electric Co., Ltd.
|
||||||||
|
Land use rights net book value
|
$ | $ | 6,935,980 | |||||
|
Plant and equipment net book value
|
$ | 4,640,069 | ||||||
32
KANDI TECHNOLOGIES, CORP.
AND SUBSIDIARIES
NOTES TO CONDENSED CONSOLIDATED FINANCIAL STATEMENTS
SEPTEMBER 30, 2011 (UNAUDITED)
It is a common business practice among companies in the region of China where Kandi is located to exchange guarantees for bank debt with no consideration given. It is considered a “favor for favor” business practice and is commonly required by the lending banks as in these cases. These companies provided guarantees for the Company’s bank loans as well. The banks involved in these guarantee transactions typically allow a maximum loan amount based on a 30% to 70% discount on the net book value of the pledged collateral. Also see Note 14.
(b)
Pending litigation
There are two lawsuits currently pending in state court in Ripley County, Missouri against the Company and its subsidiary, Kandi Vehicles, Kandi Investment Group, SunL Group and other third parties, in connection with the death of two individuals who died on March 3, 2006, while operating a go-cart that was allegedly manufactured by Kandi Vehicles. Kandi Investment Group was a major shareholder of Kandi Vehicles but it transferred all its equity in Kandi Vehicles to Continental Development Limited in November 2006. Since then, Kandi Investment Group has been unrelated to the Company or its affiliates.
The cases were filed in 2009 and are identified as Elder vs. SunL Group and Griffen vs. SunL Group. In March 2010, the local trial court entered two default judgments, each in the amount of $20,000,000, against our subsidiary, Kandi Vehicles, Kandi Investment and other parties. A default judgment was not entered against the Company. The lawsuit and default judgments were not brought to the Company’s or Kandi Vehicles’ attention until May or June 2010; the Company was not served with the complaint or notified of the lawsuits and only learned of their existence and of the default judgments in the course of commercial discussions with another of the defendants in the cases. The Company and Kandi Vehicles have filed answers to the complaint denying any culpability. In addition, the Company requested that the court set aside the default judgments against Kandi Vehicles, a request granted, by the court, on February 28, 2011. On March 3, 2011, the plaintiffs subsequently appealed the court order vacating the default judgments; however, the plaintiffs have since voluntarily withdrawn their appeal.
The Company intends to defend these cases vigorously and believes a favorable result is likely in this lawsuit since the Company including its subsidiaries did not manufacture the subject vehicle in the accident. The Company intends to propound discovery on the plaintiffs and will attempt to have the cases dismissed by summary judgment, if possible. At the present time, we believe that resolving the above matters will not have a material adverse effect on our financial position, our results of operations, or our cash flows; however, these matters are subject to inherent uncertainties and our view of these matters may change in the future.
(c)
Capital Commitment
During the first nine months of 2011, certain mold manufacturing contracts were executed. The total amount of executed mold contracts was $12,576,150, of which $9,978,473 had been paid as of September 30, 2011. Of the remaining balance of $2,597,677, we plan on paying $2,039,004 within the next twelve months and the rest in March of 2013.
Prior year comparative amounts have been reclassified to conform to the current year’s presentation. In the condensed consolidated statements of Income (loss) and comprehensive income (loss) (unaudited), the amount of change in fair value of financial instruments, which is included in Interest expense, net in 2010, has been separated in this reporting.
33
This Management’s Discussion and Analysis of Financial Condition and Results of Operations contains forward-looking statements within the meaning of the federal securities laws that relate to future events or our future financial performance. In some cases, you can identify forward-looking statements by terminology, such as "may," "will," "should," "could," "expect," "plan," "anticipate," "believe," "estimate," "project," "predict," "intend," "potential" or "continue" or the negative of such terms or other comparable terminology, although not all forward-looking statements contain such terms.
In addition, these forward-looking statements include, but are not limited to, statements regarding implementing our business strategy; development and marketing of our products; our estimates of future revenue and profitability; our expectations regarding future expenses, including research and development, sales and marketing, manufacturing and general and administrative expenses; difficulty or inability to raise additional financing, if needed, on terms acceptable to us; our estimates regarding our capital requirements and our needs for additional financing; attracting and retaining customers and employees; sources of revenue and anticipated revenue; and competition in our market.
Forward-looking statements are only predictions. Although we believe that the expectations reflected in these forward-looking statements are reasonable, we cannot guarantee future results, levels of activity, performance or achievements. All of our forward-looking information is subject to risks and uncertainties that could cause actual results to differ materially from the results expected. Although it is not possible to identify all factors, these risks and uncertainties include the risk factors and the timing of any of those risk factors described in the Company’s Form 10-K, as amended, for the year ended December 31, 2010 and those set forth from time to time in our filings with the SEC. These documents are available on the SEC’s Electronic Data Gathering and Analysis Retrieval System at http://www.sec.gov.
Critical Accounting Policies and Estimates
Policy affecting options, warrants and convertible notes
The Company’s stock option cost is recorded in accordance with ASC 718 and ASC 505.
The fair value of stock options is estimated using the Black-Scholes-Merton model. The Company’s expected volatility assumption is based on the historical volatility of the Company’s stock. The expected life assumption is primarily based on the expiration date of the option. The risk-free interest rate for the expected term of the option is based on the U.S. Treasury yield curve in effect at the time of grant. Stock option expense recognized is based on awards expected to vest, and there were no estimated forfeitures. ASC standards requires forfeitures to be estimated at the time of grant and revised in subsequent periods, if necessary, if actual forfeitures differ from those estimates.
The Company’s warrant costs are recorded in liabilities and equities, respectively, in accordance with ASC 480, ASC 505 and ASC 815.
The fair value of warrants, which is classified as a liability, is estimated using a Black-Scholes-Merton model. The Company’s expected volatility assumption is based on the historical volatility of the Company’s stock. The expected life assumption is primarily based on the expiration date of the warrant. The risk-free interest rate for the expected term of the warrant is based on the U.S. Treasury yield curve in effect at the time of measurement. The warrants, which are freestanding derivatives and are classified as liabilities on the balance sheet, will be measured at fair value on each reporting date, with decreases in fair value recognized in earnings and increases in fair value recognized in expenses.
The Company estimates the fair value of equity based warrants, which are not considered derivatives under ASC 815, using the Black-Scholes-Merton model. The Company’s expected volatility assumption is based on the historical volatility of the Company’s stock. The expected life assumption is primarily based on the expiration date of the warrant. The risk-free interest rate for the expected term of the option is based on the U.S. Treasury yield curve in effect at the time of the grant.
In accordance with ASC 815, the conversion feature of the Convertible Notes is separated from the debt instrument and accounted for separately as a derivative instrument. On the date the Convertible Notes are issued, the conversion feature was recorded as a liability at its fair value, and future decreases in fair value recognized in earnings while increases in fair values recognized in expenses. The Company used the Black-Scholes-Merton option-pricing model to obtain the fair value of the conversion feature. The Company’s expected volatility assumption is based on the historical volatility of the Company’s stock. The expected life assumption is primarily based on the expiration date of the conversion features. The risk-free interest rate for the expected term of the conversion features is based on the U.S. Treasury yield curve in effect at the time of measurement.
Estimates affecting accounts receivable and inventories
The preparation of our consolidated financial statements requires management to make estimates and assumptions that affect our reporting of assets and liabilities (and contingent assets and liabilities). These estimates are particularly significant where they affect the reported net realizable value of the Company’s accounts receivable and inventories.
34
Accounts receivable are recognized and carried at net realizable value. An allowance for doubtful accounts will be recorded in the period when a loss is probable based on an assessment of specific evidence indicating troubled collection, historical experience, accounts aging, ongoing business relation and other factors. Accounts are written off after exhaustive efforts at collection. If accounts receivable are to be provided for, or written off, they would be recognized in the consolidated statement of operations within operating expenses. At September 30, 2011 and December 31, 2010, the Company has an allowance for doubtful accounts of $0 and $0 respectively, as per management’s judgment and based on their best knowledge.
Inventories are stated at the lower of cost, determined on a weighted average basis, or net realizable value. Net realizable value is the estimated selling price in the ordinary course of business less the estimated cost of completion and the estimated costs necessary to make the sale. When inventories are sold, their carrying amount is charged to expense in the year in which the revenue is recognized. Write-downs for declines in net realizable value or for losses of inventories are recognized as an expense in the year the impairment or loss occurs. There were no declines in net realizable value of inventory for the nine months ended September 30, 2011.
While the Company currently believes that there is little likelihood that actual results will differ materially from these current estimates, if customer demand for our products decreases significantly in the near future, or if the financial condition of our customers deteriorates in the near future, the Company could realize significant write downs for slow-moving inventories or uncollectible accounts receivable.
Revenue Recognition
Revenues represent the invoiced value of goods sold, recognized upon the shipment of goods to customers. Revenues are recognized when all of the following criteria are met:
|
·
|
Persuasive evidence of an arrangement exists;
|
|
·
|
Delivery has occurred or services have been rendered;
|
|
·
|
The seller’s price to the buyer is fixed or determinable; and
|
|
·
|
Collectability is reasonably assured.
|
Results of Operations
Comparison of Nine Months Ended September 30, 2011 and 2010
The following table sets forth the amounts and percentage relationship to revenue of certain items in our condensed consolidated statements of income and comprehensive income
|
For Nine Months Ended
September 30,
2011
|
% Of
Revenue
|
For Nine Months Ended
September 30,
2010
|
% Of
Revenue
|
Change In
Amount
|
Change
In %
|
|||||||||||||||||||
|
REVENUES, NET
|
$ | 28,789,766 | 100.0 | % | $ | 28,637,863 | 100.0 | % | $ | 151,903 | 0.5 | % | ||||||||||||
|
COST OF GOODS SOLD
|
(22,060,888 | ) | (76.6 | %) | (22,098,905 | ) | (77.2 | %) | 38,017 | (0.2 | %) | |||||||||||||
|
GROSS PROFIT
|
6,728,878 | 23.4 | % | 6,538,958 | 22.8 | % | 189,920 | 2.9 | % | |||||||||||||||
|
Research and development
|
(1,695,003 | ) | (5.9 | %) | (1,203,270 | ) | (4.2 | %) | (491,733 | ) | 40.9 | % | ||||||||||||
|
Selling and distribution expenses
|
(234,854 | ) | (0.8 | %) | (1,000,187 | ) | (3.5 | %) | 765,333 | (76.5 | %) | |||||||||||||
|
General and administrative expenses
|
(2,568,417 | ) | (8.9 | %) | (2,315,088 | ) | (8.1 | %) | (253,329 | ) | 10.9 | % | ||||||||||||
|
INCOME (LOSS) FROM OPERATIONS
|
2,230,604 | 7.7 | % | 2,020,413 | 7.1 | % | 210,191 | 10.4 | % | |||||||||||||||
|
Interest income (expense), net
|
95,549 | 0.3 | % | (2,015,516 | ) | (7.0 | %) | 2,111,065 | (104.7 | %) | ||||||||||||||
|
Change in fair value of financial instruments
|
7,480,992 | 26.0 | % | (802,884 | ) | (2.8 | %) | 8,283,876 | (1,031.8 | %) | ||||||||||||||
|
Government grants
|
289,962 | 1.0 | % | 266,911 | 0.9 | % | 23,051 | 8.6 | % | |||||||||||||||
|
Investment (loss) income
|
(20,181 | ) | (0.1 | %) | - | 0.0 | % | (20,181 | ) | (100.0 | %) | |||||||||||||
|
Other income, net
|
262,299 | 0.9 | % | 91,088 | 0.3 | % | 171,211 | 188.0 | % | |||||||||||||||
|
INCOME (LOSS) FROM OPERATIONS BEFORE INCOME TAXES
|
10,339,225 | 35.9 | % | (439,988 | ) | (1.5 | %) | 10,779,213 | (2,449.9 | %) | ||||||||||||||
|
INCOME TAX BENEFIT (EXPENSE)
|
(394,624 | ) | (1.4 | %) | (269,338 | ) | (0.9 | %) | (125,286 | ) | 46.5 | % | ||||||||||||
|
NET INCOME (LOSS)
|
9,944,601 | 34.5 | % | (709,326 | ) | (2.5 | %) | 10,653,927 | (1,502.0 | %) | ||||||||||||||
35
(a) Net Revenue
For the nine months ended September 30, 2011, our net revenue increased by 0.5%, from $28,637,863 to $28,789,766 as compared to the nine months ended September 30, 2010. The increase in net revenues was primarily due to increased sales of the Company’s legacy product lines of ATVs and GoKarts, offset by decreases in sales of super mini cars, utility vehicles and three-wheeled motorcycles as described in more detail below.
The following table lists the number of vehicles sold and sales revenue, categorized by vehicle types, within the nine months ended September 30, 2011 and 2010:
|
Nine Months Ended September 30
|
||||||||||||||||
|
2011
|
2010
|
|||||||||||||||
|
Unit
|
Sales
|
Unit
|
Sales
|
|||||||||||||
|
ATV
|
4,695 | 2,770,356 | 2,756 | $ | 1,985,008 | |||||||||||
|
Super-Mini-Car
1
|
840 | 4,920,718 | 1,592 | 6,635,008 | ||||||||||||
|
GoKart
|
16,907 | 16,916,590 | 14,943 | 15,064,736 | ||||||||||||
|
Utility vehicles (“UTVs”)
|
853 | 1,854,771 | 1,397 | 2,970,300 | ||||||||||||
|
Three-wheeled motorcycle (“TT”)
|
678 | 1,433,049 | 862 | 1,982,811 | ||||||||||||
|
Refitted car
|
34 | 894,282 | - | - | ||||||||||||
|
Total
|
24,007 | 28,789,766 | 21,550 | 28,637,863 | ||||||||||||
1)
Includes the CoCo, EV and mini-car
Off-Road Vehicles
During the nine months ended September 30, 2011, the market condition for ATV products continues to recover. The Company developed some low price products to meet markets demands, which has caused good results and successfully increased the Company’s sales. Revenues from our ATVs experienced an increase of $785,348, or 40% in the nine months ended September 30, 2011 over the comparable period, which was attributable to 70% increase from 2,756 units in the first nine months of 2010 to 4,695 units in 2011, partially caused by an 18% unit price reduction.
In the first nine months of 2011, our Go-Karts experienced an increase in revenue of $1.9 million or 12% over the same period of last year, which was mainly attributable to a 13% increase in unit sales from 14,943 units in the nine months ended September 30, 2010 to 16,907 units in 2011. Because the Company successfully developed low price products to meet market demands and launched them in the first half of this year, the average sales price per unit of Go-Karts fell by about 1%..
The three-wheeled motorcycle (TT) is changing from a recreational vehicle that is not street legal to a formal vehicle subject to additional certification. This role-changing period caused the revenues from our TT to drop by $549,762, or 28%, from the nine months ended September 30, 2010 to 2011, which was attributable to a decrease in unit sales of 21% from 862 units in the nine months ended September 30, 2010 to 678 units in 2011. In responding to this market situation, the Company modified and improved the TT’s design and quality in the first half of 2011, which resulted in a good sales performance in the third quarter of 2011, but this is not enough to make up for the significant decrease caused in the first six months of 2011. Currently the Company is preparing for the above-mentioned certification and the Company believes obtaining certification will positively impact the Company’s future performance.
Utility vehicles (UTVs) experienced a significant decrease in revenues from $2,970,300 to $1,854,771. This 38% decrease is due to a 39% drop in unit sales from 1,397 units in the nine months ended September 30, 2010 to 853 units for the same period of 2011. This significant drop is primarily because of the continuing high competition in this UTV market. Additionally, the UTV manufactured by the Company is relatively high end and more expensive, which affected the sales. At this moment, the Company continues to develop new products and enhance existing products to meet the future demands in UTV markets. Those new products that have been introduced to the market have generated positive feedback. The UTV’s sales in the third quarter of 2011 have shown signs of reversing the decreasing trend of UTV sales.
Super-mini-Car Products
Because the Company has shifted its focus of super-mini cars from the overseas market to the domestic Chinese market, and as governments at different levels are still in the process of determining the supporting policies, the Company has not realized mass unit sales during this reporting period. For the nine months ended September 30, 2011, revenues from our super-mini car, dropped significantly by $1,714,290, or 26% from the same period of 2010, which was attributable to a decrease in unit sales of 47% from 1,592 units in the first nine months of 2010 to 840 units in 2011. For the nine months ended September 30, 2011, the average unit price increased 41%, primarily because the super-minicars the Company sold during this period have enhanced features. On June 3, 2011, the Zhejiang Province Government has publicly announced its support policy for EVs in Jinhua. Since October 12, 2011, the Zhejiang Province Government and Jinhua city government have formally begun to provide subsidies to the buyers for purchasing our super-mini cars. The Company remains optimistic about EV sales based on developments in Jinhua and Hangzhou, as well as in Europe.
36
Refitted car
For the nine months ended September 30, 2011, the Company also refitted other companies’ vehicles to meet special requirements for certain customers. The Company expects this new business to expand the Company’s business scope and stimulate the Company’s development.
The following table shows the breakdown of the Company’s revenues from its customers by geographical markets based on the location of the customer during the nine months ended September 30, 2011 and 2010:
|
Nine Months Ended September 30
|
||||||||||||||||
|
2011
|
2010
|
|||||||||||||||
|
Sales
|
Percentage
|
Sales
|
Percentage
|
|||||||||||||
|
North America
|
$ | 3,476,633 | 12 | % | $ | 3,391,508 | 12 | % | ||||||||
|
China
|
24,531,801 | 85 | % | 24,908,400 | 87 | % | ||||||||||
|
Europe
|
781,332 | 3 | % | 337,955 | 1 | % | ||||||||||
|
Total
|
$ | 28,789,766 | 100 | % | $ | 28,637,863 | 100 | % | ||||||||
For the nine months ended September 30, 2011, about 90% of sales to China are sales to Chinese export agents, who resell the company’s products to North America, Europe, and other regions.
(b) Cost of goods sold
Cost of goods sold during the nine months ended September 30, 2011 was $22,060,888, representing a 0.2% decrease from $22,098,905 for the nine months ended September 30, 2010, which is primarily attributable to the Company’s continued efforts toward implementing more efficient cost controls. Cost of goods sold was 76.6% of the total revenue for this reporting period as compared to 77.2% for the comparable period for the last year, primarily because of the Company’s increased operating efficiency and manufacturing cost management.
(c) Gross profit
Gross profit for the first nine months of 2011 increased 2.9%, from $6,538,958 for the same period in 2010 to $6,728,878, as a primary result of increase in our revenues and an increase in the sales of higher margin products. The Company has put more efforts and resources into developing and promoting products with higher gross margins, and more importantly, the Company has achieved more effective manufacturing cost management. As of September 30, 2011, the Company’s gross margin increased to 23.4%, compared to 22.8% for the same period of 2010.
(d) Selling and distribution expenses
Selling and distribution expenses were $234,854 for the nine months ended September 30, 2011, as compared to $1,000,187 from the same period in 2010, representing a 77% decrease. The significant decrease in these expenses was primarily attributable to the inclusion of expenses related to the options issued to consultants for their services assisting the Company in expanding within the Chinese market for the period ended September 30, 2010, which was not present in the corresponding 2011 period. Excluding the $808,223 option related expense, the net selling and distribution expenses for the nine months ended September 30, 2010 was $191,964, which represents a 22% increase in selling and distribution expenses for the period of 2011 compared to the same period of 2010, primarily attributable to the increases in our sales force, higher advertising fees and custom inspection fees.
(e) General and administrative expenses
General and administrative expenses were $2,568,417 for the nine months ended September 30, 2011, as compared to $2,315,088 for the same period in 2010, representing a 11% increase. For the nine months ended September 30, 2011, the general and administrative expenses included $30,530 of expenses for common stock awards granted to employees and consultants for financing and investor relations services, while for the same period of last year, this stock award expense was $527,139. In addition to the stock award expense, the general and administrative expenses also included $195,474 in stock-based compensation costs for the options issued to the Company’s executives and managerial level employees, while for the same period of last year, this stock based compensation cost was $487,089. Excluding the effect of stock award cost and option cost, the net general and administrative expenses for the nine months ended September 30, 2011 was $2,342,413, increased 80% from $1,300,860 for the same period in 2010. This increase was primarily due to the increase of expenses incurred by the Company’s increased activities in capital markets, such as legal fees and investor relations costs, and a land use tax charged by the government, which the Company began paying from the third quarter of 2011. In addition, some of the Company’s subsidiaries contributed to higher general and administrative expenses.
37
(f) Research and development
Research and development expenses were $1,695,003 for the nine months ended September 30, 2011, as compared to $1,203,270 from the same period in 2010, representing a 41% increase. This increase was primarily due to additional research and development efforts on new products and on quality improvement on existing products. In the first nine months of 2011, the Company strengthened its research and development for electric vehicles equipped with lithium batteries in order to seek the leading position in new energy vehicle market. In addition, the Company successfully developed new models of ATV, GoKart and other products.
(g) Government grants
Government grants totaled $289,962 for the nine months ended September 30, 2011, representing a 9% increase over the same period in 2010, primarily due to PRC’s subsidy for technology innovation. For the nine months ended September 30, 2011, the government grants included in $275,130 in subsidies for technology innovation and patent applications, and $14,832 export subsidies.
(h) Interest income (expense), Net
Net interest income was $95,549 for the nine months ended September 30, 2011, as compared to $2,015,516 net interest expenses for the corresponding period last year, representing a significant increase. For the nine months ended September 30, 2011, the interest expense for convertible notes was $123, and the interest incurred by the amortization of debt discount was $406 since only $1,000 of convertible notes were outstanding as of September 30, 2011. For the same period of last year, the interest for the convertible notes was $343,267, and the interest incurred by the amortization of debt discount was $799,128. Excluding the effects of interest expense related to convertible notes, the net interest income for this reporting period was $96,078, a significant change from $873,121 net interest expense for the same period in 2010, primarily due to the increase of interest income earned from the note receivables issued to third parties. For the nine months ended September 30, 2011, the interest income generated from the notes receivable issued to third parties was $1,434,885.
(i) Change in fair value of financial instruments
For the nine months ended September 30, 2011, the interest income, which was caused by the decrease of fair value of warrants issued to investors and placement agents, and the changes of fair value of conversion features embedded in convertible notes, was $7,480,992, while for the same period of last year, the interest expense, which was caused by the increase of fair value of financial instruments, was $802,884. This significant change was primarily due to the lower stock price as of September 30, 2011.
(j) Other income, Net
Net other income was $262,299 for the nine months ended September 30, 2011, an increase of 188.0% from $91,088 for the same period of 2010. This is primarily due to a fine award amount of $89,772 that the Company received in the second quarter of 2011 as a result of a contractor not completing a construction project on time.
(k)
Investment income (loss)
Investment loss was ($20,181) for the nine months ended September 30, 2011, compared to $0 for the corresponding period in 2010. For the nine months ended September 30, 2011, the investment loss included income of $9,605 from trading securities and a loss of ($29,786) as result of our 30% equity interest investment in Jinhua Service. During the first nine months of 2011, Jinhua Service was in the initial launching period, so the Jinhua Service recorded a net loss; however, the Company believes this situation will change, especially after the announcement of supporting policies from Zhejiang Province Government and Jinhua city government. With more and more EVs being used by public, the Company believes that Jinhua Service should, in the near future, generate a profit.
(l) Net income (loss)
For the nine months ended September 30, 2011, the Company generated a net income of $9,944,601, a significant improvement from net loss of $709,326 for the same period last year. The improvement was primarily due to the increase caused by the change of fair value of financial derivatives, the significant decreases in interest expense, and selling and distribution expenses, which included higher option related expenses in the first nine months of 2010.
Excluding the effects of option related expenses, which was $195,474 and $1,295,312 for the nine months ended September 30, 2011 and 2010 respectively, the stock award expense, which was $30,530 and $527,139 for the nine months ended September 30, 2011 and 2010 respectively, the Convertible Note’s interest expense, which was $123 and $343,267 for the nine months ended September 30, 2011 and 2010 respectively, the effect caused by amortization of discount on Convertible Notes, which was $406 and $799,128 for the nine months ended September 30, 2011 and 2010 respectively, and the change of the fair value of financial derivatives, which was $7,480,992 income and $802,884 expense for the nine months ended September 30, 2011 and 2010 respectively, the Company’s net income for the nine months ended September 30, 2011, was $2,690,142, a decrease of 12% as compared with net income of $3,058,404 for the same period of 2010 excluding the same effects. This decrease is primarily due to the increase of general and administrative expenses, and the increase of research and development expenses, although it was also offset by the increase of interest income generated from the notes receivable issued to third parties, and the increase of gross profits.
38
Comparison of Three Months Ended September 30, 2011 and 2010
The following table sets forth the amounts and percentage relationship to revenue of certain items in our condensed consolidated statements of income and comprehensive income
|
For Three Months Ended September 30,
2011
|
% Of
Revenue
|
For Three Months Ended
September 30,
2010
|
% Of
Revenue
|
Change In
Amount
|
Change
In %
|
|||||||||||||||||||
|
REVENUES, NET
|
$ | 10,310,558 | 100.0 | % | $ | 10,478,224 | 100.0 | % | $ | (167,666 | ) | (1.6 | %) | |||||||||||
|
COST OF GOODS SOLD
|
(7,984,828 | ) | (77.4 | %) | (8,140,771 | ) | (77.7 | %) | 155,943 | (1.9 | %) | |||||||||||||
|
GROSS PROFIT
|
2,325,730 | 22.6 | % | 2,337,453 | 22.3 | % | (11,723 | ) | (0.5 | %) | ||||||||||||||
|
Research and development
|
(608,463 | ) | (5.9 | %) | (459,935 | ) | (4.4 | %) | (148,528 | ) | 32.3 | % | ||||||||||||
|
Selling and distribution expenses
|
(85,239 | ) | (0.8 | %) | (58,121 | ) | (0.6 | )% | (27,118 | ) | 46.7 | % | ||||||||||||
|
General and administrative expenses
|
(1,067,021 | ) | (10.3 | %) | (516,929 | ) | (4.9 | %) | (550,092 | ) | 106.4 | % | ||||||||||||
|
INCOME FROM OPERATIONS
|
565,007 | 5.5 | % | 1,302,468 | 12.4 | % | (737,461 | ) | (56.6 | %) | ||||||||||||||
|
Interest income (expense), net
|
117,353 | 1.1 | % | (572,032 | ) | (5.5 | %) | 689,385 | (120.5 | %) | ||||||||||||||
|
Change in fair value of financial instruments
|
(271,780 | ) | (2.6 | %) | (2,578,693 | ) | (24.6 | %) | 2,306,913 | (89.5 | %) | |||||||||||||
|
Government grants
|
9,235 | 0.1 | % | 191,934 | 1.8 | % | (182,699 | ) | (95.2 | %) | ||||||||||||||
|
Investment (loss) income
|
(12,905 | ) | (0.1 | %) | 0 | 0.0 | % | (12,905 | ) | (100.0 | %) | |||||||||||||
|
Other income, net
|
95,067 | 0.9 | % | 33,249 | 0.3 | % | 61,818 | 185.9 | % | |||||||||||||||
|
(LOSS) INCOME FROM OPERATIONS BEFORE INCOME TAXES
|
501,977 | 4.9 | % | (1,623,074 | ) | (15.6 | %) | 2,125,051 | (130.9 | %) | ||||||||||||||
|
INCOME TAX (EXPENSE) BENEFIT
|
(117,119 | ) | (1.1 | %) | (94,282 | ) | (0.9 | %) | (22,837 | ) | 24.2 | % | ||||||||||||
|
NET (LOSS) INCOME
|
384,858 | 3.7 | % | (1,717,356 | ) | (16.4 | %) | 2,102,214 | (122.4 | %) | ||||||||||||||
(a) Revenue
For the three months ended September 30, 2011, our revenue decreased by 1.6% from $10,478,224 to $10,310,558 as compared to the three months ended September 30, 2010. The decrease in revenues was primarily due to decreased sales of the Company’s legacy GoKart product line, offset by increases in sales of ATVs, super mini cars, and three-wheeled motorcycles.
The following table lists the number of vehicles sold, categorized by vehicle types, within the three months ended September 30, 2011 and 2010:
|
Three Months Ended September 30
|
||||||||||||||||
|
2011
|
2010
|
|||||||||||||||
|
Unit
|
Sales
|
Unit
|
Sales
|
|||||||||||||
|
ATV
|
2,030 | $ | 1,044,602 | 572 | $ | 387,587 | ||||||||||
|
Super-mini car
1
|
298 | 1,512,861 | 215 | 812,996 | ||||||||||||
|
Go-Kart
|
5,513 | 5,763,275 | 8,556 | 8,182,472 | ||||||||||||
|
Utility vehicles (“UTVs”)
|
460 | 634,534 | 345 | 665,908 | ||||||||||||
|
Three wheeled motorcycle
|
394 | 751,126 | 184 | 429,261 | ||||||||||||
|
Refitted car
|
23 | 604,160 | - | - | ||||||||||||
|
Total
|
8,718 | 10,310,558 | 9,872 | 10,478,224 | ||||||||||||
|
1)
|
include the products called CoCo, EV and mini-car in the previous filing.
|
39
The following table shows the breakdown of Kandi’s revenues from its customers by geographical markets based on the location of the customer during the three months ended September 30, 2011 and 2010:
|
Three Months Ended September 30
|
||||||||||||||||
|
2011
|
2010
|
|||||||||||||||
|
Sales
|
Percentage
|
Sales
|
Percentage
|
|||||||||||||
|
North America
|
$ | 1,292,509 | 13 | % | $ | 1,027,131 | 10 | % | ||||||||
|
China
|
8,759,034 | 85 | % | 9,338,775 | 89 | % | ||||||||||
|
Europe & other region
|
259,015 | 2 | % | 121,318 | 1 | % | ||||||||||
|
Total
|
$ | 10,310,558 | 100 | % | $ | 10,478,224 | 100 | % | ||||||||
For the three months ended September 30, 2011, about 90% of sales in China are sales to Chinese export agents, who resell the company’s products to markets around the world.
(b) Cost of goods sold
Cost of goods sold during the three months ended September 30, 2011 was $7,984,828, representing a slight decrease of $155,943, or 1.9% from the three months ended September 30, 2010, which is in line with the decrease of revenue. Cost of goods sold was 77.4% of the total revenue for the period as compared to 77.7% for the comparable period.
(c) Gross profit
Gross profit for the third quarter of 2011 decreased 0.5% to $2,325,730 compared to the same period of last year, as a result of decreased revenue, which decreased 1.6% compared to the same period of 2010. Primarily because of the Company’s increased operating efficiency and manufacturing cost management, the gross margin for the third quarter of 2011 increased 0.3%
(d) Selling and distribution expenses
Selling and distribution expenses were $85,239 for the three months ended September 30, 2011, as compared to $58,121 from the same period in 2010, representing a 47% increase, primarily due to the increased sales force, higher advertising fees and transportation fees.
(e) General and administrative expenses
General and administrative expenses were $1,067,021 for the three months ended September 30, 2011, as compared to $516,929 for the same period in 2010, representing a 106% increase. For the three months ended September 30, 2011, the general and administrative expenses included $57,159 in stock-based compensation cost for the options issued to the Company’s executives and managerial level employees, while for the same period of last year, this stock based compensation cost was $143,262. In addition, the general and administrative expenses also included $1,704 in expenses for common stock awards to employees and consultants for financing and investor relations services, while for the same period of last year, this stock award cost was $0. Excluding the effect of stock based compensation cost and stock award cost, the net general and administrative expenses for the three months ended September 30, 2011 was $1,008,158, an increase of 170% from $373,667 for the same period of 2010. This increase was primarily due to the increase of expenses incurred by the Company’s increased activities in capital markets, and a land use tax charged by the government, which the Company began paying in the third quarter of 2011.
(f) Research and development
Research and development expenses were $608,463 for the three months ended September 30, 2011, as compared to $459,935 from the same period in 2010, representing a 32% increase. This increase is primarily attributable to the Company’s continuing efforts to generate new products and improve quality on existing products.
(g) Interest income (expense), Net
Net interest income was $117,353 for the three months ended September 30, 2011, as compared to $572,032 net interest expense for the same period last year. For the three months ended September 30, 2011, the interest expense for convertible notes was $93, and the interest incurred by the amortization of debt discount was $184. While for the same period of last year, the interest for the convertible notes was $89,842, and the interest incurred by the amortization of debt discount was $307,029. Excluding the effects of interest expense related to convertible notes, the net interest income for the three months ended September 30, 2011 was $117,630, a significant change from net interest expense of $175,161 for the same period of 2010, primarily due to the increase of interest income earned from the notes receivable issued to third parties.
40
(h) Change in fair value of financial instruments
For the three months ended September 30, 2011, the expense, which was caused by the changes of fair value of warrants issued to investors and placement agents, and the changes of fair value of conversion features embedded in convertible notes, was $271,780, while for the same period of last year, the expense, which was caused by the changes of fair value of financial instruments, was $2,578,693. This significant increase was due primarily to decreases in our stock price in the third quarter of 2011.
(i) Net income
For the three months ended September 30, 2011, the Company generated a net income of $384,858, a significant improvement from net loss of $1,717,356 for the same period of last year, primarily due to the changes of fair value of warrants issued to investors and placement agents.
Excluding the effects of option related expenses, which was $57,159 and $143,262 for the three months ended September 30, 2011 and 2010 respectively, the stock award expense, which was $1,704 and $0 for the three months ended September 30, 2011 and 2010 respectively, the Convertible Note’s interest expense, which was $93 and $89,842 for the three months ended September 30, 2011 and 2010 respectively, the effect caused by amortization of discount on Convertible Notes, which was $184 and $307,029 for the three months ended September 30, 2011 and 2010 respectively, and the change of the fair value of financial derivatives, which was $271,780 and $2,578,693 for the three months ended September 30, 2011 and 2010 respectively, for the three months ended September 30, 2011, the Company’s net income was $715,778, a 49% decrease compared to net income of $1,401,470 for the same period in 2010, excluding the same effects. This decrease is primarily due to the increase of research and development expense, and the general and administrative expense, which was offset by the increase in interest income.
As of the date of this Form 10-Q filing, all but $1,000 of the Convertible Notes have already been converted.
Financial Condition
Liquidity
The Company had a working capital surplus of $18,936,075 at September 30, 2011, an improvement from a working capital surplus of $3,044,974 as of September 30, 2010, which was principally due to the Company’s additional equity offering in December 2010 and the conversion of the January 2010 convertible notes to common stock. The Company used part of these proceeds in the Company’s working capital and used part of these proceeds in the prepayment for purchasing fixed assets used for production.
As of September 30, 2011, the Company has credit lines from commercial banks for $44,050,111, of which $30,928,801 had been drawn as of September 30, 2011. The Company believes that its cash flows generated internally may not be sufficient to sustain operations and repay short term bank loans for the next twelve months. However, the Company believes its access to existing financing sources and established relationships with PRC banks will enable it to meet its obligations and fund its ongoing operations.
The Company has historically financed itself through short-term commercial bank loans from PRC banks. Normally, the term of these loans are for one year, and upon the repayment of all outstanding principal and interest in a respective loan, PRC banks roll the loans over for additional one-year terms, with adjustments made to the interest rate to reflect prevailing market rates. The Company believes this situation has not changed and the short-term bank loans will be available on normal trade terms if needed.
Capital Requirements and Capital Provided
Capital requirements and capital provided for the nine months ended September 30, 2011 are as follows:
|
Capital requirements
|
Nine Months Ended September 30, 2011
(In thousands)
|
|||
|
Purchase of plant and equipment
|
$ | 241 | ||
|
Purchase of construction in progress
|
6,019 | |||
|
Issuance of notes receivable
|
2,751 | |||
|
Repayments of short-term bank loans
|
22,748 | |||
|
Repayments of notes payable
|
39,024 | |||
|
Increase in restricted cash
|
8,256 | |||
|
Total capital requirements
|
$ | 79,039 | ||
|
Capital provided
|
||||
|
Internal cash provided operations
|
6,510 | |||
|
Proceeds from short-term bank loan
|
25,607 | |||
|
Proceeds from notes payable
|
33,310 | |||
|
Repayments of notes receivable
|
7,810 | |||
|
Other financing activities
|
66 | |||
|
Decrease in cash
|
5,873 | |||
|
Total capital provided
|
$ | 79,176 | ||
41
For further information, see the Statement of Cash Flows.
The difference between capital provided and capital requirement is the effect of exchange rate changes over the past nine months.
Cash Flow
Net cash flow provided by operating activities was $6,509,943 for the nine months ended September 30, 2011, compared to $7,395,249 for the same period in 2010. The decrease of net cash flow by operating activities was mainly due to (1) changes in prepayments and prepaid expenses to cash outflow of $3,290,026 in the nine months ended September 30, 2011, compared to cash inflow of $823,785 for the same period of last year, caused mainly by the Company’s prepaying a portion of the model manufacturing payments primarily mold suppliers, a common business practice in the Company’s industry; and (2) changes in the Company’s accounts payable to cash outflow of $1,431,210 in the nine months ended September 30, 2011, compared to cash inflow of $5,230,579, for the same period last year, because the Company paid its suppliers more promptly in order to achieve a more competitive purchasing price.
Net cash flow used in investing activities was $1,200,894 for the nine months ended September 30, 2011, compared to $12,099,838 for the same reporting period in 2010. For the nine months ended September 30, 2011, the Company issued $2,751,302 in notes receivable, and collected $7,810,463 in repayment of note receivables, which resulted in a net cash inflow of $5,059,161 from notes receivable. For the same period of last year, the Company recorded a net cash outflow of $11,349,285 in notes receivable, due to the repayment of $2,274,519 of notes receivable and the issuance of $13,623,804 of notes receivable.
Net cash flow used in financing activities was $11,045,638 for the nine months ended September 30, 2011, as compared to net cash flow provided by financing activities of $8,074,348 for the nine months ended September 30, 2010. Cash flow used in financing activities in this quarter was primarily due to the cash outflow of $8,255,977 for the restricted cash. The increase of restricted cash is primarily due to the increase of bank issued note payables, while for the same period of last year, the $10,000,000 cash inflow caused by the issuing of convertible notes in January 2010 was not required to be secured by restricted cash, and therefore no corresponding restricted cash outflow was required. Please also refer to Note 15 of Condensed Consolidated Financial Statements.
Recent Development Activities:
On August 14, 2011, a team is formally formed in Hangzhou by Development Research Center of the State Council, Society of Automotive Engineers of China (SAEC), and Zhejiang University to begin the research of a subject proposed by the Company: the feasibility of building a 100 thousand pure EV renting network in Hangzhou and the related supporting policies required. The objective of this research is in order to resolve the problem of industrialization of pure EV, the traffic jam problem and parking difficulties in current Chinese cities. This research is planned to be finished by the end of 2011, and expected to help stimulate the Company’s development.
On October 12th, 2011,an inauguration ceremony for a new energy vehicle promotional campaign of Jinhua City was sponsored and held by Jinhua Municipal City at the facility of the Company. The ceremony was hosted by the Director and the Deputy Director of Economic and Information Technology Commission of Jinhua, Mr. Hongshen Jin and Mr. Zhongjun Li. The Deputy Mayor of Jinhua City, Mr. Zhongliang Jin, and the Chairman and CEO of Kandi, Mr. Xiaomin Hu, attended the ceremony and delivered keynote speeches. Other distinguished guests included the heads of the Municipal City Development and Reform Commission, the Economic and Information Technology Commission, the Public Security Bureau, the Finance Department, the Technology Department, and other relevant departments of the Jinhua Municipal City. The objective of the ceremony was to promote sales of our electric vehicles in Jinhua City through government financial subsidies to consumers who purchase the Kandi pure EV. A Kandi pure EV is priced at 43,000 RMB (approximately $6,750). To encourage consumers to purchase the electric vehicles, Zhejiang Provincial Government and Jinhua Municipal Government will provide subsidies of 32,000 RMB (approximately $5,024) to each the buyers for each of the first 500 Kandi pure EV, 20,000 RMB (approximately $3,140) to the buyers for each of the next 1,000 Kandi pure EV, and 16,000 RMB (approximately $2,512) to the buyers for each of the following 1,500 of Kandi pure EV.
On November 1, 2011, the Chairman and CEO of the Company, Mr. Xiaomin Hu, and the Chairman of Jiangxi RiJiu Electric Power Technology Co., Ltd., Mr. Limin Cheng, meet to discuss the possibility of developing a new style of battery for EVs. Both parties embraced the idea of deepening the business relationship between two companies moving forward and expressed optimism that the companies will be able to develop a new style battery that can better fit the pure EV. Both parties agreed to have further discussions on this issue.
On November 8, 2011, the Company held a meeting with the Hangzhou Pure Electric Vehicle Service Co., Ltd. and the China Aviation Technology Hangzhou Company to discuss the feasibility, and the further execution of the plan of bringing 20 thousand pure EVs in Hangzhou market.
42
On November 9, 2011, the Company signed a Framework Agreement on Cooperation with TongXu AoXing Vehicle Co., Ltd. for the purpose of brand building, enhancing competitive capability and exploring market quickly. Contents of this agreement include (1) the Company authorizes TongXu AoXing Vehicle Co., Ltd. to establish a sales company in TongXu County, KaiFeng City, HeNan Province to sell Kandi brand products in KaiFeng area; (2) when the cooperation comes to certain level, both parties agree to reorganize the assets to realize the sharing of resources if necessary.
Off-Balance Sheet Arrangements
We do not have any off-balance sheet arrangements that have, or are reasonably likely to have, a material current or future effect on our financial condition, results of operations, liquidity, capital expenditures or capital resources.
Exchange Rate Risk
Our operations are conducted mainly in the PRC. As such, our earnings are subject to movements in foreign currency exchange rates when transactions are denominated in RMB, which is our functional currency. Accordingly, our operating results are affected by changes in the exchange rate between the U.S. dollar and those currencies.
Evaluation of Disclosure Controls and Procedures
The Company maintains a system of disclosure controls and procedures that is designed to ensure that information required to be disclosed by the Company in this Form 10-Q, and in other reports required to be filed under the Securities Exchange Act of 1934 (the “Exchange Act”), is recorded, processed, summarized and reported within the time periods specified in the rules and forms for such filings. Management of the Company, under the direction of the Company's Chief Executive Officer and Chief Financial Officer, reviewed and performed an evaluation of the effectiveness of the Company's disclosure controls and procedures (as defined in Rules 13a-15a(e) and 15d-15(e) under the Exchange Act) as of September 30, 2011. Based on that review and evaluation, the Chief Executive Officer and Chief Financial Officer have concluded that our disclosure controls and procedures are effective to provide reasonable assurance that information required to be disclosed by us in reports that we file or submit under the Exchange Act is recorded, processed, summarized and reported within the time periods specified in SEC rules and forms and is accumulated and communicated to management, including our principal executive officer and principal financial officer, as appropriate to allow timely decisions regarding required disclosure.
Changes in Internal Control over Financial Reporting
There were no changes to our internal control over financial reporting (as defined in Rules 13a-15(f) and 15d-15(f) under the Exchange Act) that occurred during the period covered by this report that have materially affected, or are reasonably likely to materially affect, our internal control over financial reporting.
43
There are two lawsuits currently pending in state court in Ripley County, Missouri against the Company and its subsidiary, Kandi Vehicles, Kandi Investment Group, SunL Group and other third parties, in connection with the death of two individuals who died on March 3, 2006, while operating a go-cart that was allegedly manufactured by Kandi Vehicles. Kandi Investment Group was a major shareholder of Kandi Vehicles but it transferred all its equity in Kandi Vehicles to Continental Development Limited in November 2006. Since then, Kandi Investment Group has been unrelated to the Company or its affiliates.
The cases were filed in 2009 and are identified as Elder vs. SunL Group and Griffen vs. SunL Group. In March 2010, the local trial court entered two default judgments, each in the amount of $20,000,000, against our subsidiary, Kandi Vehicles, Kandi Investment and other parties. A default judgment was not entered against the Company. The lawsuit and default judgments were not brought to the Company or Kandi Vehicles’ attention until May or June 2010; the Company was not served with the complaint or notified of the lawsuits and only learned of their existence and of the default judgments in the course of commercial discussions with another of the defendants in the cases. The Company and Kandi Vehicles have filed answers to the complaint denying any culpability. In addition, the Company requested that the court set aside the default judgments against Kandi Vehicles, a request granted, by the court, on February 28, 2011. On March 3, 2011, the plaintiffs subsequently appealed the court order vacating the default judgments; however, the plaintiffs have since voluntarily withdrawn their appeal.
The Company intends to defend these cases vigorously and believes a favorable result is likely in this lawsuit since the Company including its subsidiaries did not manufacture the subject vehicle in the accident. The Company intends to propound discovery on the plaintiffs and will attempt to have the cases dismissed by summary judgment, if possible.
At the present time, we believe that resolving the above matters will not have a material adverse effect on our financial position, our results of operations, or our cash flows; however, these matters are subject to inherent uncertainties and our view of these matters may change in the future.
As of the date of this filing, there have been no material changes from the risk factors previously disclosed in our “Risk Factors” in the Form 10-K, as amended, for the period ended December 31, 2010. An investment in our common stock involves various risks. When considering an investment in our company, you should consider carefully all of the risk factors described in our most recent Form 10-K/A. If any of those risks, incorporated by reference in this Form 10-Q, occur, the market price of our shares of common stock could decline and investors could lose all or part of their investment. These risks and uncertainties are not the only ones facing us and there may be additional matters that we are unaware of or that we currently consider immaterial. All of these could adversely affect our business, financial condition, results of operations and cash flows and, thus, the value of an investment in our company.
None.
None.
None.
44
|
Exhibit Number
|
Description
|
|
|
Exhibit 10.1
|
Loan Agreement dated January 31, 2011, by and between Zhejiang Kandi Vehicles Co., Ltd. and Mr. Xiaoming Hu. *
|
|
|
Exhibit 31.1
|
Certification of Chief Executive Officer pursuant to 18 U.S.C. Section 1350, as adopted by Section 302 of the Sarbanes-Oxley Act of 2002. *
|
|
|
Exhibit 31.2
|
Certification of Chief Financial Officer pursuant to 18 U.S.C. Section 1350, as adopted by Section 302 of the Sarbanes-Oxley Act of 2002. *
|
|
|
Exhibit 32.1
|
Certification of Chief Executive Officer and Chief Financial Officer pursuant to 18 U.S.C. Section 1350, as adopted by Section 906 of the Sarbanes-Oxley Act of 2002. **
|
|
|
Exhibit 101.INS
|
XBRL Instance Document.**
|
|
|
Exhibit 101.SCH
|
XBRL Taxonomy Extension Schema Document.**
|
|
|
Exhibit 101.CAL
|
XBRL Taxonomy Extension Calculation Linkbase Document.**
|
|
|
Exhibit 101.LAB
|
XBRL Taxonomy Extension Label Linkbase Document.**
|
|
|
Exhibit 101.PRE
|
XBRL Taxonomy Extension Presentation Linkbase Document.**
|
|
|
Exhibit 101.DEF
|
XBRL Taxonomy Definitions Linkbase Document.**
|
|
*
|
Filed herewith
|
|
**
|
Furnished with the Company’s Quarterly Report on Form 10-Q for the fiscal quarter ended September 30, 2011
|
45
SIGNATURES
Pursuant to the requirements of the Securities Exchange Act of 1934, as amended, the registrant caused this report to be signed on its behalf by the undersigned, thereunto duly authorized.
| Kandi Technologies, Corp. | |||
|
Date: November 14, 2011
|
By:
|
/s/ Hu Xiaoming
|
|
|
Hu Xiaoming
|
|||
|
President and Chief Executive Officer
(Principal Executive Officer)
|
|||
|
Date: November 14, 2011
|
By:
|
/s/ Zhu Xiaoying
|
|
|
Zhu Xiaoying
|
|||
|
Chief Financial Officer
(Principal Financial and Accounting Officer)
|
|||
46
TABLE OF CONTENTS
Part I-- Financial InformationItem 1. Financial Statements. (unaudited)Note 1 - Organization and Principal ActivitiesNote 2 LiquidityNote 3 - Basis Of PresentationNote 4 Principles Of ConsolidationNote 5 Use Of EstimatesNote 6 Risks and Uncertainties and Summary Of Significant Accounting PoliciesNote 6 Risks and Uncertainties and Summary Of Significant Accounting Policies (continued)Note 7 New Accounting PronouncementsNote 8 ConcentrationsNote 9 Income (loss) Per ShareNote 10 - InventoriesNote 11 - Notes ReceivableNote 12 Land Use RightsNote 13 Plant and EquipmentNote 14 Short Term Bank LoansNote 14 - Short Term Bank Loans (continued)Note 15 Notes PayableNote 15 Notes Payable (continued)Note 16 TaxNote 16 Tax (continued)Note 17 - Stock Options, Warrants and Convertible NotesNote 17 - Stock Options, Warrants and Convertible Notes (continued)Note 18 Stock AwardsNote 19 Commitments and ContingenciesNote 19 Commitments and Contingencies (continued)Note 20 Comparative AmountsItem 2. Management S Discussion and Analysis Of Financial Condition and Results Of OperationsItem 3. Quantitative and Qualitative Disclosures About Market RiskItem 4. Controls and ProceduresPart II Other InformationItem 1. Legal ProceedingsItem 1A. Risk FactorsItem 2. Unregistered Sales Of Equity Securities and Use Of ProceedsItem 3. Defaults Upon Senior SecuritiesItem 4. Removed and ReservedItem 5. Other InformationItem 6. Exhibits