EASTMAN KODAK CO
10-Ks and 10-Qs
|
|
|
|
|
|
|
|
|
|
|
|
|
|
|
|
|
|
|
|
|
|
|
|
|
|
|
|
|
|
|
|
|
|
|
|
|
|
|
|
|
|
|
|
|
|
|
|
|
|
|
|
|
SECURITIES AND EXCHANGE COMMISSION
Washington, D.C. 20549
FORM 10-K
X Annual report pursuant to Section 13 or 15(d) of the
Securities Exchange Act of 1934
For the year ended December 31, 2010 or
Transition report pursuant to Section 13 or 15(d) of the Securities Exchange Act of 1934
For the transition period from to
Commission File Number 1-87
EASTMAN KODAK COMPANY
(Exact name of registrant as specified in its charter)
|
NEW JERSEY
|
16-0417150
|
|
(State of incorporation)
|
(IRS Employer Identification No.)
|
|
343 STATE STREET, ROCHESTER, NEW YORK
|
14650
|
|
(Address of principal executive offices)
|
(Zip Code)
|
Registrant’s telephone number, including area code: 585-724-4000
_____________
Securities registered pursuant to Section 12(b) of the Act:
|
Title of each Class
|
Name of each exchange on which registered
|
|
Common Stock, $2.50 par value
|
New York Stock Exchange
|
Securities registered pursuant to Section 12(g) of the Act: None
Indicate by check mark if the registrant is a well-known seasoned issuer, as defined in Rule 405 of the Securities Act.
Yes [X] No [ ]
Indicate by check mark if the registrant is not required to file reports pursuant to Section 13 or Section 15(d) of the Act.
Yes [ ] No [X]
Indicate by check mark whether the registrant (1) has filed all reports required to be filed by Section 13 or 15(d) of the Securities Exchange Act of 1934 during the preceding 12 months, and (2) has been subject to such filing requirements for the past 90 days.
Yes [X] No [ ]
Indicate by check mark whether the registrant has submitted electronically and posted on its corporate Website, if any, every Interactive Data File required to be submitted and posted pursuant to Rule 405 of Regulation S-T (§ 232.405 of this chapter) during the preceding 12 months (or for such shorter period that the registrant was required to submit and post such files).
Yes [X] No [ ]
Indicate by check mark if disclosure of delinquent filers pursuant to Item 405 of Regulation S-K (§ 229.405 of this chapter) is not contained herein, and will not be contained, to the best of registrant’s knowledge, in definitive proxy or information statements incorporated by reference in Part III of this Form 10-K or any amendment to this Form 10-K.[ ]
Indicate by check mark whether the registrant is a large accelerated filer, an accelerated filer, or a non-accelerated filer, or a smaller reporting company. See the definitions of "large accelerated filer,” “accelerated filer" and “smaller reporting company” in Rule 12b-2 of the Exchange Act.
Large accelerated filer [X] Accelerated filer [ ]
Non-accelerated filer [ ] Smaller reporting company [ ]
Indicate by check mark whether the registrant is a shell company (as defined in Rule 12b-2 of the Exchange Act).
Yes [ ] No [X]
The aggregate market value of the voting common equity held by non-affiliates computed by reference to the price at which the common equity was last sold, as of the last business day of the registrant's most recently completed second fiscal quarter, June 30, 2010 was approximately $1.2 billion. The registrant has no non-voting common stock.
The number of shares outstanding of the registrant's common stock as of February 11, 2011 was 268,882,900 shares of common stock.
DOCUMENTS INCORPORATED BY REFERENCE
PART III OF FORM 10-K
The following items in Part III of this Form 10-K incorporate by reference information from the Notice of 2011 Annual Meeting and Proxy Statement:
Item 10 - DIRECTORS, EXECUTIVE OFFICERS AND CORPORATE GOVERNANCE
Item 11 - EXECUTIVE COMPENSATION
Item 12 - SECURITY OWNERSHIP OF CERTAIN BENEFICIAL OWNERS AND
MANAGEMENT AND RELATED STOCKHOLDER MATTERS
Item 13 - CERTAIN RELATIONSHIPS AND RELATED TRANSACTIONS, AND DIRECTOR
INDEPENDENCE
Item 14 - PRINCIPAL ACCOUNTING FEES AND SERVICES
2
Eastman Kodak Company
Form 10-K
December 31, 2010
|
Table of Contents
|
||
|
Page
|
||
|
Item 1
.
|
Business
|
4
|
|
Risk Factors
|
9
|
|
|
Item 1B
.
|
Unresolved Staff Comments
|
16
|
|
Properties
|
16
|
|
|
Legal Proceedings
|
16
|
|
|
Executive Officers of the Registrant
|
18
|
|
|
Market for Registrant's Common Equity, Related Stockholder Matters and Issuer Purchases of Equity Securities
|
22
|
|
|
Item 6
.
|
Selected Financial Data
|
23
|
|
Management's Discussion and Analysis of Financial Condition and Results of Operations
|
24
|
|
|
Liquidity and Capital Resources
|
43
|
|
|
Quantitative and Qualitative Disclosures About Market Risk
|
50
|
|
|
Financial Statements and Supplementary Data
|
51
|
|
|
Consolidated Statement of Operations
|
52
|
|
|
Consolidated Statement of Financial Position
|
53
|
|
|
Consolidated Statement of Equity (Deficit)
|
54
|
|
|
Consolidated Statement of Cash Flows
|
57
|
|
|
Notes to Financial Statements
|
59
|
|
|
Changes in and Disagreements With Accountants on Accounting and Financial Disclosure
|
114
|
|
|
Controls and Procedures
|
114
|
|
|
Other Information
|
115
|
|
|
Directors, Executive Officers and Corporate Governance
|
115
|
|
|
Executive Compensation
|
115
|
|
|
Item 12
.
|
Security Ownership of Certain Beneficial Owners and Management and Related Stockholder Matters
|
116
|
|
Certain Relationships and Related Transactions, and Director Independence
|
117
|
|
|
Principal Accounting Fees and Services
|
117
|
|
|
Exhibits, Financial Statement Schedules
|
118
|
|
|
119
|
||
|
120
|
||
|
121
|
||
3
Eastman Kodak Company (the “Company” or “Kodak”) helps consumers, businesses, and creative professionals unleash the power of pictures and printing to enrich their lives. When used in this report, unless otherwise indicated, “we,” “our,” “us,” the “Company” and “Kodak” refer to Eastman Kodak Company. The Company’s products and services span:
|
·
|
Digital still and video cameras and related accessories
|
|
·
|
Consumer inkjet printers and media
|
|
·
|
Digital picture frames
|
|
·
|
Retail printing kiosks, APEX drylab systems, and related media and services
|
|
·
|
KODAK Gallery online imaging services
|
|
·
|
Imaging sensors
|
|
·
|
Prepress equipment and consumables
|
|
·
|
Workflow software and services
|
|
·
|
Electrophotographic printing equipment, consumables, and service
|
|
·
|
Commercial inkjet printing equipment, consumables, and service
|
|
·
|
Document scanners
|
|
·
|
Business process services
|
|
·
|
Origination and print films and special effects services for the entertainment industry
|
|
·
|
Consumer and professional photographic film
|
|
·
|
Photographic paper and processing chemicals
|
|
·
|
Industrial materials such as film for the production of printed circuit boards, and specialty chemicals
|
Kodak was founded by George Eastman in 1880 and incorporated in 1901 in the State of New Jersey. The Company is headquartered in Rochester, New York.
In 2010, competitive pricing and rising commodity costs negatively impacted results in Kodak’s more mature product lines, including Prepress Solutions, Digital Capture and Devices, and Entertainment Imaging. The Company continued its investment in its four growth initiatives – consumer inkjet, commercial inkjet, workflow software and services, and packaging solutions – and these product lines continue to gain scale and acceptance in the market. The Company continues to execute its intellectual property strategy and entered into three significant intellectual property arrangements during the year, recognizing revenue of $838 million.
The Company’s key goals for 2011 are:
|
·
|
Increase revenue from our digital growth initiative businesses –consumer inkjet, commercial inkjet, workflow software and services, and packaging solutions
|
|
·
|
Drive positive cash generation before restructuring payments, which is equal to net cash (used in)/provided by operating activities, as determined under Generally Accepted Accounting Principles in the United States of America (U.S. GAAP), minus capital expenditures, plus proceeds from the sale of assets and certain businesses and other settlements/agreements not otherwise included in U.S. GAAP cash (used in)/provided by operating activities, plus net cash flow generated by divested businesses through the date of divestiture to the extent such business divestitures would be categorized as discontinued operations, minus cash flow from the operations of significant acquisitions or strategic alliances completed during the year, plus cash restructuring payments
|
REPORTABLE SEGMENTS
The Company reports financial information for three reportable segments: Consumer Digital Imaging Group (“CDG”), Graphic Communications Group (“GCG”), and Film, Photofinishing and Entertainment Group (“FPEG”). The balance of the Company's operations, which individually and in the aggregate do not meet the criteria of a reportable segment, are reported in All Other.
The Company's sales, earnings and assets by reportable segment for these three reportable segments and All Other for each of the past three years are shown in Note 24, “Segment Information,” in the Notes to Financial Statements.
4
CONSUMER DIGITAL IMAGING GROUP (“CDG”) SEGMENT
CDG's mission is to enhance people’s lives and social interactions through the capabilities of digital imaging and printing technology. This focus has led to a full range of product and service offerings to the consumer. CDG’s strategy is to drive profitable revenue growth by leveraging a powerful brand, a deep knowledge of the consumer, and extensive digital imaging and materials science intellectual property.
Digital Capture and Devices
: Digital capture and devices includes digital still and pocket video cameras, digital picture frames, accessories, and branded licensed products. These products are sold directly to retailers or distributors, and are also available to customers through the Internet at the KODAK Store (
www.kodak.com
) and other online providers. Digital Capture and Devices also includes charged coupled devices (CCD) imaging sensors, and licensing activities related to the Company’s intellectual property in digital imaging products.
Net sales of Digital Capture and Devices accounted for 28%, 23%, and 24% of total consolidated revenue for the years ended December 31, 2010, 2009, and 2008, respectively.
Net revenues from licensing and royalties within the CDG segment accounted for 12%, 6%, and 5% of total consolidated revenue for the years ended December 31, 2010, 2009, and 2008, respectively.
Retail Systems Solutions
: Retail Systems Solutions’ product and service offerings to retailers include kiosks and consumables, Adaptive Picture Exchange (“APEX”) drylab systems and consumables, and after sale service and support. Consumers can create a wide variety of photo gifts including photo books, personal greeting cards, prints, posters, and collages. Kodak has the largest installed base of retail photo kiosks in the world.
Consumer Inkjet Systems
: Consumer Inkjet Systems encompasses Kodak All-in-One desktop inkjet printers, ink cartridges, and media. These products are sold directly to retailers or distributors, and are also available to customers through the Internet at the KODAK Store (
www.kodak.com
) and other online providers. Consumer Inkjet Systems is one of Kodak’s four digital growth initiative businesses, and in 2010, printer unit shipments grew 45% year-on-year. Also in 2010 the Company launched a new and low-cost platform of printers.
Consumer Imaging Services : Kodak Gallery is a leading online merchandise and photo sharing service. The www.Kodakgallery.com website provides consumers with a secure and easy way to view, store and share their images with friends and family, and to receive Kodak prints and other creative products from their pictures, such as photo books, frames, calendars, and other personalized merchandise.
Kodak also distributes KODAK EasyShare desktop software at no charge to consumers, which provides easy organization and editing tools, and unifies the experience between digital cameras, printers, and the KodakGallery services.
Marketing and Competition
CDG faces competition from consumer electronics and printer companies, and other online service companies in the markets in which it competes, generally competing on price, features, and technological advances.
The key elements of CDG’s marketing strategy emphasize ease of use, quality, total cost of ownership value proposition, and the complete solution offered by Kodak products and services. This is communicated through a combination of in-store presentation, an aggressive social media strategy, online marketing, advertising, customer relationship marketing and public relations. The Company's advertising programs actively promote the segment’s products and services in its various markets, and its principal trademarks, trade dress, and corporate symbol are widely used and recognized. Kodak is frequently noted by trade and business publications as one of the most recognized and respected brands in the world.
5
GRAPHIC COMMUNICATIONS GROUP (“GCG”) SEGMENT
GCG is committed to helping its customers grow their businesses by offering innovative, powerful solutions that enhance production efficiency, open new revenue opportunities, and improve return on marketing investment. To this end, the Company has developed a wide-ranging portfolio of digital products - workflow, equipment, media, and services - that combine to create a value-added complete solution to customers. GCG’s strategy is to transform large graphics markets with revolutionary technologies and customized services that grow our customers’ businesses and Kodak’s business with them.
Prepress Solutions:
Prepress Solutions is comprised of digital and traditional consumables, including plates, chemistry, and media, prepress output device equipment and related services, and proofing solutions. Prepress solutions also includes flexographic packaging solutions, which is one of Kodak’s four digital growth initiative businesses.
Innovative products within Prepress Solutions include high productivity TRILLIAN SP plates launched in 2010 and FLEXCEL NX packaging systems.
Net sales of Prepress Solutions accounted for 22% of total consolidated revenue for each of the years ended December 31, 2010, 2009, and 2008.
Digital Printing Solutions:
Digital Printing Solutions includes high-speed, high-volume commercial inkjet printing equipment, consumables, and related services, as well as color and black-and-white electrophotographic printing equipment, consumables, and related services. Commercial inkjet is one of Kodak’s four digital growth initiative businesses.
Innovative product offerings include PROSPER color and black-and-white presses, components and systems. These products utilize Kodak’s revolutionary Stream technology to deliver high-speed, high-quality variable data inkjet printing on a broad range of media at a low running cost.
Business Services and Solutions:
The Business Services and Solutions group’s product and service offerings are composed of high-speed production and workgroup document scanners, related services, and digital controllers for driving digital output devices, and workflow software and solutions. Workflow software and solutions, which includes consulting and professional business process services, can enable new opportunities for our customers to transform from a print service provider to a marketing service provider, and is one of Kodak’s four digital growth initiatives.
Marketing and Competition
Around the world, graphic communications products and services are sold through a variety of direct and indirect channels. The end users of these products include businesses in the creative, in-plant, data center, commercial printing, packaging, newspaper, and digital prepress market segments.
GCG faces competition from other companies who offer a range of commercial offset and digital printing equipment, consumables and service. The Company also faces competition from document scanning equipment manufacturers, software companies, and other service providers. Competitiveness is generally focused on technology, solutions and price.
FILM, PHOTOFINISHING AND ENTERTAINMENT GROUP (“FPEG”) SEGMENT
FPEG provides consumers, professionals, and the entertainment industry with film and paper for imaging and photography. Although the market for consumer and professional films, traditional photofinishing and certain industrial and aerial films are in decline and expected to continue to decline due to digital substitution, FPEG participates in large markets and enjoys number 1 or number 2 market share position in those markets. The strategy of FPEG is to provide sustainable cash generation by extending our materials science assets in traditional and new markets.
6
Entertainment Imaging
: Entertaining Imaging includes origination, intermediate, and color print motion picture films, special effects services, and other digital products and services for the entertainment industry.
Net sales of Entertainment Imaging accounted for 10%, 12%, and 11% of total consolidated revenue for the years ended December 31, 2010, 2009, and 2008, respectively.
Traditional Photofinishing:
Traditional Photofinishing includes color negative photographic paper, photochemicals, professional output systems, and event imaging services.
Net sales of Traditional Photofinishing accounted for 10%, 11%, and 12% of total consolidated revenue for the years ended December 31, 2010, 2009, and 2008, respectively.
Industrial Materials:
Industrial Materials encompasses aerial and industrial film products, film for the production of printed circuit boards, and specialty chemicals, and represents a key component of FPEG’s strategy of extending and repurposing our materials science assets.
Film Capture:
Film Capture includes consumer and professional photographic film and one-time-use cameras.
Marketing and Competition
Film products and services for the consumer and professional markets and traditional photofinishing are sold throughout the world, both directly to retailers, and increasingly through distributors. Price competition continues to exist in all marketplaces. To be more cost competitive with its traditional photofinishing and film offerings, and to shift towards a variable cost model, the Company has rationalized capacity and restructured its go-to-market models in many of its traditional market segments
Throughout the world, most Entertainment Imaging products are sold directly to studios, laboratories, independent filmmakers or production companies. Quality and availability are important factors for these products, which are sold in a price-competitive environment. The distribution of motion pictures to theaters is another important element of the Entertainment Imaging business, one in which the Company continues to be widely recognized as a market leader. Price competition is a bigger factor in this segment of the motion picture market, but the Company continues to maintain leading share position. As the industry continues to move to digital cinema formats, the Company anticipates that it will face new competitors, including some of its current customers and other electronics manufacturers.
FINANCIAL INFORMATION BY GEOGRAPHIC AREA
Financial information by geographic area for the past three years is shown in Note 24, “Segment Information,” in the Notes to Financial Statements.
RAW MATERIALS
The raw materials used by the Company are many and varied, and are generally readily available. Lithographic aluminum is the primary material used in the manufacture of offset printing plates. The Company procures lithographic aluminum coils from several suppliers on a spot basis or under contracts generally in place over the next one to three years. Silver is one of the essential materials used in the manufacture of films and papers. The Company purchases silver from numerous suppliers under annual agreements or on a spot basis. Paper base is an essential material in the manufacture of photographic papers. The Company has a contract to acquire paper base from a certified photographic paper supplier over the next several years. Electronic components are used in the manufacture of digital cameras and devices, consumer and commercial printers, and other electronic devices. Although most electronic components are generally available from multiple sources, certain key electronic components included in the finished goods manufactured by and purchased from the Company’s third party suppliers are obtained from single or limited sources, which may subject the Company to supply risks.
7
SEASONALITY OF BUSINESS
Sales and earnings of the CDG segment are linked to the timing of holidays, vacations and other leisure or gifting seasons. Digital capture and consumer inkjet printing products have experienced peak sales during the last four months of the year as a result of the December holidays. Sales are normally lowest in the first quarter due to the absence of holidays and fewer picture-taking and gift-giving opportunities during that time.
Sales and earnings of the GCG segment generally exhibit modestly higher levels in the fourth quarter, due to seasonal customer demand linked to commercial year-end advertising processes.
Sales and earnings of the FPEG segment are linked to the timing of holidays, vacations and other leisure activities. Sales and earnings of traditional film and photofinishing products are normally strongest in the second and third quarters as demand is high due to heavy vacation activity and events such as weddings and graduations. Sales of entertainment imaging film are typically strongest in the second quarter reflecting demand due to the summer motion picture season.
RESEARCH AND DEVELOPMENT
Through the years, the Company has engaged in extensive and productive efforts in research and development.
Research and development expenditures for the Company’s three reportable segments and All Other were as follows:
|
(in millions)
|
For the Year Ended December 31,
|
|||||||||||
|
2010
|
2009
|
2008
|
||||||||||
|
Consumer Digital Imaging Group
|
$ | 148 | $ | 146 | $ | 205 | ||||||
|
Graphic Communications Group
|
152 | 171 | 221 | |||||||||
|
Film, Photofinishing and Entertainment Group
|
19 | 33 | 49 | |||||||||
|
All Other
|
2 | 6 | 3 | |||||||||
|
Total
|
$ | 321 | $ | 356 | $ | 478 | ||||||
Research and development is headquartered in Rochester, New York. Other U.S. groups are located in Boston, Massachusetts; New Haven, Connecticut; Dayton, Ohio; and San Jose, Emeryville, and San Diego, California. Outside the U.S., groups are located in Canada, England, Israel, Germany, Japan, China, and Singapore. These groups work in close cooperation with manufacturing units and marketing organizations to develop new products and applications to serve both existing and new markets.
It has been the Company's general practice to protect its investment in research and development and its freedom to use its inventions by obtaining patents. The ownership of these patents contributes to the Company's ability to provide leadership products and to generate revenue from licensing. The Company holds portfolios of patents in several areas important to its business, including digital cameras and image sensors; network photo sharing and fulfillment; flexographic and lithographic printing plates and systems; digital printing workflow and color management proofing systems; color and black-and-white electrophotographic printing systems; commercial, and consumer inkjet printers; inkjet inks and media; thermal dye transfer and dye sublimation printing systems; digital cinema; and color negative films, processing and papers. Each of these areas is important to existing and emerging business opportunities that bear directly on the Company's overall business performance.
The Company's major products are not dependent upon one single, material patent. Rather, the technologies that underlie the Company's products are supported by an aggregation of patents having various remaining lives and expiration dates. There is no individual patent expiration or group of patents expirations which are expected to have a material impact on the Company's results of operations.
8
ENVIRONMENTAL PROTECTION
The Company is subject to various laws and governmental regulations concerning environmental matters. The U.S. federal environmental legislation and state regulatory programs having an impact on the Company include the Toxic Substances Control Act, the Resource Conservation and Recovery Act, the Clean Air Act, the Clean Water Act, the NY State Chemical Bulk Storage Regulations and the Comprehensive Environmental Response, Compensation and Liability Act of 1980, as amended (the “Superfund Law”).
It is the Company’s policy to carry out its business activities in a manner consistent with sound health, safety and environmental management practices, and to comply with applicable health, safety and environmental laws and regulations. The Company continues to engage in programs for environmental, health and safety protection and control.
Based upon information presently available, future costs associated with environmental compliance are not expected to have a material effect on the Company's capital expenditures, results of operations or competitive position, although costs could be material to a particular quarter or year, with the possible exception of matters related to the Passaic River, which are described in Note 10, "Commitments and Contingencies," in the Notes to Financial Statements.
EMPLOYMENT
At the end of 2010, the Company employed the full time equivalent of approximately 18,800 people, of whom approximately 9,600 were employed in the U.S. The actual number of employees may be greater because some individuals work part time.
AVAILABLE INFORMATION
The Company files many reports with the Securities and Exchange Commission (“SEC”), including annual reports on Form 10-K, quarterly reports on Form 10-Q and current reports on Form 8-K. These reports, and amendments to these reports, are made available free of charge as soon as reasonably practicable after being electronically filed with or furnished to the SEC. They are available through the Company's website at www.Kodak.com. To reach the SEC filings, follow the links to Investor Center, and then SEC Filings. The Company also makes available its annual report to shareholders and proxy statement free of charge through its website.
We have included the CEO and CFO certifications required by Section 302 of the Sarbanes-Oxley Act of 2002 as exhibits to this report. We have also included these certifications with the Form 10-K for the year ended December 31, 2009 filed on February 22, 2010. Additionally, we filed with the New York Stock Exchange (“NYSE”) the CEO certification, dated June 9, 2010, regarding our compliance with the NYSE's corporate governance listing standards pursuant to Section 303A.12(a) of the listing standards, and indicated that the CEO was not aware of any violations of the listing standards by the Company.
The competitive pressures we face could harm our revenue, gross margins and market share.
The markets in which we do business are highly competitive with large, entrenched, and well financed industry participants. In certain markets where Kodak is a relatively new entrant, we have not achieved the scale of distribution that our competitors have. In addition, we encounter aggressive price competition for all our products and services from numerous companies globally. Over the past several years, price competition in the market for digital products, film products and services has been particularly intense as competitors have aggressively cut prices and lowered their profit margins for these products. Our results of operations and financial condition may be adversely affected by these and other industry wide pricing pressures. If our products, services and pricing are not sufficiently competitive with current and future competitors, we could also lose market share, adversely affecting our revenue and gross margins.
9
If our commercialization and manufacturing processes fail to prevent product reliability and quality issues, our product launch plans may be delayed, our financial results may be adversely impacted, and our reputation may be harmed.
In developing, commercializing and manufacturing our products and services, we must adequately address reliability and other quality issues, including defects in our engineering, design and manufacturing processes, as well as defects in third-party components included in our products. Because our products are becoming increasingly sophisticated and complicated to develop and commercialize with rapid advances in technologies, the occurrence of defects may increase, particularly with the introduction of new product lines. Unanticipated issues with product performance may delay product launch plans which could result in additional expenses, lost revenue and earnings. Although we have established internal procedures to minimize risks that may arise from product quality issues, there can be no assurance that we will be able to eliminate or mitigate occurrences of these issues and associated liabilities. Product reliability and quality issues can impair our relationships with new or existing customers and adversely affect our brand image, and our reputation as a producer of high quality products could suffer, which could adversely affect our business as well as our financial results. Product quality issues can also result in recalls, warranty, or other service obligations and litigation.
If we are unsuccessful with our strategic investment decisions, our financial performance could be adversely affected.
We have made a decision to focus our investments on businesses in large growth markets that are positioned for technology and business model transformation, specifically, consumer inkjet, commercial inkjet (including our Prosper line of products based upon the Company’s Stream technology), packaging solutions, and workflow software and services. We believe each of these businesses has significant growth potential. The introduction of successful innovative products and the achievement of scale are necessary for us to grow these businesses, improve margins and achieve our financial objectives. If we are unsuccessful in growing our investment businesses as planned, our financial performance could be adversely affected.
If we cannot effectively anticipate technology trends and develop and market new products to respond to changing customer preferences, our revenue, earnings and cash flow, could be adversely affected.
We must develop and introduce new products and services in a timely manner to keep pace with technological developments and achieve customer acceptance. If we are unable to anticipate new technology trends, for example in consumer electronics, and develop improvements to our current technology to address changing customer preferences, this could adversely affect our revenue, earnings and cash flow. Due to changes in technology and customer preferences, the market for traditional film and paper products and services is in decline. Our success depends in part on our ability to manage the decline of the market for these traditional products by continuing to reduce our cost structure to maintain profitability.
Continued weakness or worsening of economic conditions could continue to adversely affect our financial performance and our liquidity.
The global economic recession and declines in consumption in our end markets have adversely affected sales of both commercial and consumer products and profitability for such products. Further, global financial markets have been experiencing volatility. Consumer discretionary spending may not return to pre-recession levels in certain geographies. Continued slower sales of consumer digital products due to the uncertain economic environment could lead to reduced sales and earnings while inventory increases. Economic conditions could also accelerate the continuing decline in demand for traditional products, which could also place pressure on our results of operations and liquidity. While the company is seeking to increase sales in markets that have already experienced an economic recovery such as Asia, there is no guarantee that anticipated economic growth levels in those markets will continue in the future, or that the company will succeed in expanding sales in these markets. In addition, accounts receivable and past due accounts could increase due to a decline in our customers’ ability to pay as a result of the economic downturn, and our liquidity, including our ability to use credit lines, could be negatively impacted by failures of financial instrument counterparties, including banks and other financial institutions. If the global economic weakness and tightness in the credit markets continue for a greater period of time than anticipated or worsen, our profitability and related cash generation capability could be adversely affected and, therefore, affect our ability to meet our anticipated cash needs, impair our liquidity or increase our costs of borrowing.
10
If we cannot attract, retain and motivate key employees, our revenue and earnings could be harmed.
In order for us to be successful, we must continue to attract, retain and motivate executives and other key employees, including technical, managerial, marketing, sales, research and support positions. Hiring and retaining qualified executives, research and engineering professionals, and qualified sales representatives, particularly in our targeted growth markets, is critical to our future. The market for experienced employees with digital skills is highly competitive and, therefore, our ability to attract such talent will depend on a number of factors, including compensation and benefits, work location and persuading potential employees that we are well positioned for success in the digital markets in which we are operating. Given that our compensation plans are highly performance based and given the potential impact of the global economy on our current and future performance, it may become more challenging to retain key employees. We also must keep employees focused on our strategic initiatives and goals in order to be successful. Our past restructuring actions harm our efforts to attract and retain key employees. If we cannot attract properly qualified individuals, retain key executives and employees or motivate our employees, our business could be harmed.
Our future pension and other postretirement plan costs and required level of contributions could be unfavorably impacted by changes in actuarial assumptions, future market performance of plan assets and obligations imposed by legislation or pension authorities which could adversely affect our financial position, results of operations, and cash flow.
We have significant defined benefit pension and other postretirement benefit obligations. The funded status of our U.S. and non U.S. defined benefit pension plans and other postretirement benefit plans, and the related cost reflected in our financial statements, are affected by various factors that are subject to an inherent degree of uncertainty, particularly in the current economic environment. Key assumptions used to value these benefit obligations, funded status and expense recognition include the discount rate for future payment obligations, the long term expected rate of return on plan assets, salary growth, healthcare cost trend rates, and other economic and demographic factors. Significant differences in actual experience, or significant changes in future assumptions or obligations imposed by legislation or pension authorities could lead to a potential future need to contribute cash or assets to our plans in excess of currently estimated contributions and benefit payments and could have an adverse effect on our consolidated results of operations, financial position or liquidity.
If we cannot continue to license or enforce the intellectual property rights on which our business depends, or if third parties assert that we violate their intellectual property rights, our revenue, earnings, expenses and liquidity may be adversely impacted.
We rely upon patent, copyright, trademark and trade secret laws in the United States and similar laws in other countries, and non-disclosure, confidentiality and other types of agreements with our employees, customers, suppliers and other parties, to establish, maintain and enforce our intellectual property rights. Despite these measures, any of our direct or indirect intellectual property rights could, however, be challenged, invalidated, circumvented, infringed or misappropriated, or such intellectual property rights may not be sufficient to permit us to take advantage of current market trends or otherwise to provide competitive advantages, which could result in costly product redesign efforts, discontinuance of certain product offerings or other competitive harm. Further, the laws of certain countries do not protect proprietary rights to the same extent as the laws of the United States. Therefore, in certain jurisdictions, we may be unable to protect our proprietary technology adequately against unauthorized third party copying, infringement or use, which could adversely affect our competitive position. Also, because of the rapid pace of technological change in the information technology industry, much of our business and many of our products rely on key technologies developed or licensed by third parties, and we may not be able to obtain or continue to obtain licenses and technologies from these third parties at all or on reasonable terms.
We have made substantial investments in new, proprietary technologies and have filed patent applications and obtained patents to protect our intellectual property rights in these technologies as well as the interests of our licensees. There can be no assurance that our patent applications will be approved, that any patents issued will adequately protect our intellectual property or that such patents will not be challenged by third parties.
The execution and enforcement of licensing agreements protects our intellectual property rights and provides a revenue stream in the form of up-front payments and royalties that enables us to further innovate and provide the marketplace with new products and services. Our ability to execute our intellectual property licensing strategies, including litigation strategies, such as our legal actions against Apple Inc. and Research in Motion Limited, could also affect our revenue and earnings. Additionally, the uncertainty around the timing, outcome and
11
magnitude of our intellectual property-related litigation (including our legal action against Apple Inc. and Research in Motion Limited before the International Trade Commission), judgments and settlements could have an adverse effect on our financial results and liquidity. Our failure to develop and properly manage new intellectual property could adversely affect our market positions and business opportunities. Furthermore, our failure to identify and implement licensing programs, including identifying appropriate licensees, could adversely affect the profitability of our operations.
In addition, third parties may claim that we, our customers, licensees or other parties indemnified by us are infringing upon their intellectual property rights. Such claims may be made by competitors seeking to block or limit our access to digital markets. Additionally, in recent years, individuals and groups have begun purchasing intellectual property assets for the sole purpose of making claims of infringement and attempting to extract settlements from large companies like ours. Even if we believe that the claims are without merit, the claims can be time consuming and costly to defend and distract management’s attention and resources. Claims of intellectual property infringement also might require us to redesign affected products, enter into costly settlement or license agreements or pay costly damage awards, or face a temporary or permanent injunction prohibiting us from marketing or selling certain of our products. Even if we have an agreement to indemnify us against such costs, the indemnifying party may be unable to uphold its contractual obligations. If we cannot or do not license the infringed technology at all, license the technology on reasonable terms or substitute similar technology from another source, our revenue and earnings could be adversely impacted. Finally, we use open source software in connection with our products and services. Companies that incorporate open source software into their products have, from time to time, faced claims challenging the ownership of open source software and/or compliance with open source license terms. As a result, we could be subject to suits by parties claiming ownership of what we believe to be open source software or noncompliance with open source licensing terms. Some open source software licenses require users who distribute open source software as part of their software to publicly disclose all or part of the source code to such software and/or make available any derivative works of the open source code on unfavorable terms or at no cost. Any requirement to disclose our source code or pay damages for breach of contract could be harmful to our business results of operations and financial condition.
Due to the nature of the products we sell and our worldwide distribution, we are subject to changes in currency exchange rates, interest rates and commodity costs that may adversely impact our results of operations and financial position.
As a result of our global operating and financing activities, we are exposed to changes in currency exchange rates and interest rates, which may adversely affect our results of operations and financial position. Exchange rates and interest rates in markets in which we do business tend to be volatile and at times, our sales can be negatively impacted across all of our segments depending upon the value of the U.S. dollar, the Euro and other major currencies. In addition, our products contain silver, aluminum, petroleum based or other commodity-based raw materials, the prices of which have been and may continue to be volatile. If the global economic situation remains uncertain or worsens, there could be further volatility in changes in currency exchange rates, interest rates and commodity prices, which could have negative effects on our revenue and earnings.
If we are unable to provide competitive financing arrangements to our customers or if we extend credit to customers whose creditworthiness deteriorates, this could adversely impact our revenues, profitability and financial position.
The competitive environment in which we operate may require us to provide financing to our customers in order to win a contract. Customer financing arrangements may include all or a portion of the purchase price for our products and services. We may also assist customers in obtaining financing from banks and other sources and may provide financial guarantees on behalf of our customers. Our success may be dependent, in part, upon our ability to provide customer financing on competitive terms and on our customers’ creditworthiness. The tightening of credit in the global financial markets has adversely affected the ability of our customers to obtain financing for significant purchases, which resulted in a decrease in, or cancellation of, orders for our products and services, and we can provide no assurance that this trend will not continue. If we are unable to provide competitive financing arrangements to our customers or if we extend credit to customers whose creditworthiness deteriorates, this could adversely impact our revenues, profitability and financial position.
12
Our sales are typically concentrated in the last four months of the fiscal year, therefore, lower than expected demand or increases in costs during that period may have a pronounced negative effect on our results of operations.
The demand for our consumer products is largely discretionary in nature, and sales and earnings of our consumer businesses are linked to the timing of holidays, vacations, and other leisure or gifting seasons. Accordingly, we have typically experienced greater net sales in the fourth fiscal quarter as compared to the other three quarters. Developments, such as lower-than-anticipated demand for our products, an internal systems failure, increases in materials costs, or failure of or performance problems with one of our key logistics, components supply, or manufacturing partners, could have a material adverse impact on our financial condition and operating results, particularly if such developments occur late in the third quarter or during the fourth fiscal quarter. Further, with respect to the Graphic Communications Group segment, equipment and consumable sales in the commercial marketplace peak in the fourth quarter based on increased commercial print demand. Tight credit markets that limit capital investments or a weak economy that decreases print demand could negatively impact equipment or consumable sales. In addition, our inability to achieve intellectual property licensing revenues in the timeframe and amount we anticipate could adversely affect our revenues, earnings and cash flow. These external developments are often unpredictable and may have an adverse impact on our business and results of operations.
If we fail to manage distribution of our products and services properly, our revenue, gross margins and earnings could be adversely impacted.
We use a variety of different distribution methods to sell and deliver our products and services, including third party resellers and distributors and direct and indirect sales to both enterprise accounts and customers. Successfully managing the interaction of direct and indirect channels to various potential customer segments for our products and services is a complex process. Moreover, since each distribution method has distinct risks and costs, our failure to implement the most advantageous balance in the delivery model for our products and services could adversely affect our revenue, gross margins and earnings. Due to changes in our go to market models, we are more reliant on fewer distributors than in past periods. This has concentrated our credit and operational risk and could result in an adverse impact on our financial performance.
We have outsourced a significant portion of our overall worldwide manufacturing, logistics and back office operations and face the risks associated with reliance on third party suppliers.
We have outsourced a significant portion of our overall worldwide manufacturing, logistics, customer support and administrative operations to third parties. To the extent that we rely on third party service providers, we face the risk that those third parties may not be able to:
|
·
|
develop manufacturing methods appropriate for our products;
|
|
·
|
maintain an adequate control environment;
|
|
·
|
quickly respond to changes in customer demand for our products;
|
|
·
|
obtain supplies and materials necessary for the manufacturing process; or
|
|
·
|
mitigate the impact of labor shortages and/or disruptions.
|
As a result of such risks, our costs could be higher than planned and the reliability of our products could be negatively impacted. Other supplier problems that we could face include electronic component shortages, excess supply, risks related to duration of our contracts with suppliers for components and materials and risks related to dependency on single source suppliers on favorable terms or at all. If any of these risks were to be realized, and assuming alternative third party relationships could not be established, we could experience interruptions in supply or increases in costs that might result in our inability to meet customer demand for our products, damage to our relationships with our customers, and reduced market share, all of which could adversely affect our results of operations and financial condition.
We may be required to recognize additional impairments in the value of our goodwill and/or other long-lived assets, which would increase expenses and reduce profitability.
Goodwill represents the excess of the amount we paid to acquire businesses over the fair value of their net assets at the date of the acquisition. We test goodwill for impairment annually or whenever events occur or circumstances change that would more likely than not reduce the fair value of a reporting unit below its carrying amount. Additionally, our other long-lived assets are evaluated for impairments whenever events or changes in circumstances indicate the carrying value may not be recoverable. Either of these situations may occur for
13
various reasons including changes in actual or expected income or cash. We continue to evaluate current conditions to assess whether any impairment exists. Impairments could occur in the future if market or interest rate environments deteriorate, expected future cash flows of our reporting units decline, silver prices increase significantly, or if reporting unit carrying values change materially compared with changes in respective fair values.
Our failure to implement plans to reduce our cost structure in anticipation of declining demand for certain products or delays in implementing such plans could negatively affect our consolidated results of operations, financial position and liquidity.
We recognize the need to continually rationalize our workforce and streamline our operations to remain competitive in the face of an ever-changing business and economic climate. If we fail to implement cost rationalization plans such as restructuring of manufacturing, supply chain, marketing sales and administrative resources ahead of declining demand for certain of our products and services, our operations results, financial position and liquidity could be negatively impacted. Additionally, if restructuring plans are not effectively managed, we may experience lost customer sales, product delays and other unanticipated effects, causing harm to our business and customer relationships. Finally, the timing and implementation of these plans require compliance with numerous laws and regulations, including local labor laws, and the failure to comply with such requirements may result in damages, fines and penalties which could adversely affect our business.
Our future results could be harmed if we are unsuccessful in our efforts to expand sales in emerging markets.
Because we are seeking to expand our sales and number of customer relationships outside the United States, and specifically in emerging markets in Asia, Latin America and Eastern Europe, our business is subject to risks associated with doing business internationally, such as:
|
·
|
supporting multiple languages;
|
|
·
|
recruiting sales and technical support personnel with the skills to design, manufacture, sell and support our products;
|
|
·
|
complying with governmental regulation of imports and exports, including obtaining required import or export approval for our products;
|
|
·
|
complexity of managing international operations;
|
|
·
|
exposure to foreign currency exchange rate fluctuations;
|
|
·
|
commercial laws and business practices that may favor local competition;
|
|
·
|
multiple, potentially conflicting, and changing governmental laws, regulations and practices, including differing export, import, tax, anti-corruption, labor, and employment laws;
|
|
·
|
difficulties in collecting accounts receivable;
|
|
·
|
limitations or restrictions on the repatriation of cash;
|
|
·
|
reduced or limited protection of intellectual property rights;
|
|
·
|
managing research and development teams in geographically disparate locations, including Canada, Israel, Japan, China, and Singapore;
|
|
·
|
complicated logistics and distribution arrangements; and
|
|
·
|
political or economic instability.
|
There can be no assurance that we will be able to market and sell our products in all of our targeted international markets. If our international efforts are not successful, our business growth and results of operations could be harmed.
We are subject to environmental laws and regulations and failure to comply with such laws and regulations or liabilities imposed as a result of such laws and regulations could have an adverse effect on our business, results of operations and financial condition.
We are subject to environmental laws and regulations in the jurisdictions in which we conduct our business, including laws regarding the discharge of pollutants, including greenhouse gases, into the air and water, the need for environmental permits for certain operations, the management and disposal of hazardous substances and wastes, the cleanup of contaminated sites, the content of our products and the recycling and treatment and disposal of our products. If we do not comply with applicable laws and regulations in connection with the use and management of hazardous substances, then we could be subject to liability and/or could be prohibited from operating certain facilities, which could have a material adverse effect on our business, results of operations and financial condition.
14
Our inability to effectively complete, integrate and manage acquisitions, divestitures and other significant transactions could adversely impact our business performance including our financial results.
As part of our business strategy, we frequently engage in discussions with third parties regarding possible investments, acquisitions, strategic alliances, joint ventures, divestitures and outsourcing transactions and enter into agreements relating to such transactions in order to further our business objectives. In order to pursue this strategy successfully, we must identify suitable candidates and successfully complete transactions, some of which may be large and complex, and manage post closing issues such as the integration of acquired companies or employees and the assessment of such acquired companies’ internal controls. Integration and other risks of transactions can be more pronounced for larger and more complicated transactions, or if multiple transactions are pursued simultaneously. If we fail to identify and complete successfully transactions that further our strategic objectives, we may be required to expend resources to develop products and technology internally, we may be at a competitive disadvantage or we may be adversely affected by negative market perceptions, any of which may have an adverse effect on our revenue, gross margins and profitability. In addition, unpredictability surrounding the timing of such transactions could adversely affect our financial results.
Our substantial leverage could adversely affect our ability to fulfill our debt obligations and may place us at a competitive disadvantage in our industry.
Our significant debt and debt service requirements could adversely affect our ability to operate our business and may limit our ability to take advantage of potential business opportunities. A breach of any of the covenants contained in our Credit Agreement or our other financing arrangements, or our inability to comply with the required financial ratio in our Credit Agreement, when applicable, could result in an event of default under the Credit Agreement or our other financing arrangements, subject to applicable grace and cure periods. If any event of default occurs and we are not able either to cure it or obtain a waiver from the requisite lenders under the Credit Agreement and noteholders under our other financing arrangements, the administrative agent of the Credit Agreement may, and at the request of the requisite lenders shall, and the trustee or the requisite noteholders under our other financing arrangements may, and at the request of the requisite noteholders shall, declare all of our outstanding obligations under the Credit Agreement and our other financing arrangements, respectively, together with accrued interest and fees, to be immediately due and payable, and the agent under the Credit Agreement may, and at the request of the requisite lenders shall, terminate the lenders' commitments under the Credit Agreement and cease making further loans, and if applicable, the agent and/or trustee could institute foreclosure proceedings against our pledged assets.
Continued investment, capital needs, restructuring payments and servicing our debt require a significant amount of cash and our ability to generate cash may be affected by factors beyond our control.
Our business may not generate cash flow in an amount sufficient to enable us to pay the principal of, or interest on, our indebtedness, or to fund our other liquidity needs, including working capital, capital expenditures, product development efforts, strategic acquisitions, investments and alliances, and other general corporate requirements.
Our ability to generate cash is subject to general economic, financial, competitive, litigation, regulatory and other factors that are beyond our control. We cannot assure you that:
|
·
|
our businesses will generate sufficient cash flow from operations;
|
|
·
|
our plans to generate cash proceeds through the sale of non-core assets will be successful;
|
|
·
|
we will be able to repatriate or move cash to locations where and when it is needed;
|
|
·
|
we will realize cost savings, revenue growth and operating improvements resulting from the execution of our long-term strategic plan; or
|
|
·
|
future sources of funding will be available to us in amounts sufficient to enable us to fund our liquidity needs.
|
If we cannot fund our liquidity needs, we will have to take actions such as raising additional capital; reducing or delaying capital expenditures, product development efforts, strategic acquisitions, and investments and alliances; selling assets; restructuring or refinancing our debt; or seeking additional equity capital. Such actions could further negatively impact our ability to generate cash flows. We cannot assure you that any of these remedies could, if necessary, be effected on commercially reasonable terms, or at all, or that they would permit us to meet our scheduled debt service obligations. Certain of our debt instruments limit the use of the proceeds from any disposition of assets and, as a result, we may not be allowed, under those instruments, to use the proceeds from such dispositions to satisfy all current debt service obligations. In addition, if we incur additional debt, the risks associated with our substantial leverage, including the risk that we will be unable to service our debt or generate enough cash flow to fund our liquidity needs, could intensify.
15
None.
The Company's worldwide headquarters is located in Rochester, New York.
Operations of the CDG segment are located in Rochester, New York; Atlanta, Georgia; Emeryville, California; San Diego, California; China; and Singapore. Many of CDG’s businesses rely on manufacturing assets, company-owned or through relationships with design and manufacturing partners, which are located close to end markets and/or supplier networks.
Products in the GCG segment are manufactured in the United States, primarily in Rochester, New York; Dayton, Ohio; Columbus, Georgia; and Weatherford, Oklahoma. Key manufacturing facilities outside the United States, either company-owned or through relationships with manufacturing partners, are located in the United Kingdom, Germany, Bulgaria, Mexico, China, and Japan.
The FPEG segment of Kodak’s business is centered in Rochester, New York, where film and photographic chemicals and related materials are manufactured. A manufacturing facility in the United Kingdom produces photographic paper. Additional manufacturing facilities supporting the business are located in Windsor, Colorado; China; Mexico; India; Brazil; and Russia. Entertainment Imaging has business operations in Hollywood, California and Rochester, New York.
Properties within a country may be shared by all segments operating within that country.
Regional distribution centers are located in various places within and outside of the United States. The Company owns or leases administrative, research and development, manufacturing, marketing, and processing facilities in various parts of the world. The leases are for various periods and are generally renewable.
The Company has been named as third-party defendant (along with approximately 200 other entities) in an action initially brought by the New Jersey Department of Environmental Protection (NJDEP) in the Supreme Court of New Jersey, Essex County against Occidental Chemical Corporation and several other companies that are successors in interest to Diamond Shamrock Corporation. The NJDEP seeks recovery of all costs associated with the investigation, removal, cleanup and damage to natural resources occasioned by Diamond Shamrock's disposal of various forms of chemicals in the Passaic River. The damages are alleged to potentially range "from hundreds of millions to several billions of dollars." Pursuant to New Jersey's Court Rules, the defendants were required to identify all other parties which could be subject to permissive joinder in the litigation based on common questions of law or fact. Third-party complaints seeking contribution from more than 200 entities, which have been identified as potentially contributing to the contamination in the Passaic, were filed on February 5, 2009. Based on currently available information, the potential monetary exposure is likely to be in excess of $100,000. Refer to Note 10, “Commitments and Contingencies,” in the Notes to Financial Statements for additional information.
On November 20, 2008, Research in Motion Ltd. and Research in Motion Corp. (collectively “RIM”) filed a declaratory judgment action against the Company in Federal District Court in the Northern District of Texas. The suit, Research in Motion Limited and Research in Motion Corporation v. Eastman Kodak Company, seeks to invalidate certain Company patents related to digital camera technology and software object linking, and seeks a determination that RIM handheld devices do not infringe such patents. On February 17, 2009, the Company filed its answer and counterclaims for infringement of each of these same patents. A Markman Hearing was held on March 23, 2010. The Court has not yet issued its Markman decision. The Court rescheduled to August 2011 a trial on merits which was originally scheduled for December 2010. The Company intends to vigorously defend itself.
On January 14, 2010 the Company filed a complaint with the International Trade Commission (ITC) against Apple Inc. and Research in Motion Limited (RIM) for infringement of patents related to digital camera technology. In the Matter of Certain Mobile Telephones and Wireless Communication Devices Featuring Digital Cameras and Components Thereof, the Company is seeking a limited exclusion order
16
preventing importation of infringing devices including iPHONES and camera enabled BLACKBERRY devices. On February 16, 2010, the ITC ordered that an investigation be instituted to determine whether importation or sale of the accused Apple and RIM devices constitutes violation of the Tariff Act of 1930. A Markman Hearing was held in May 2010 and an initial determination was issued by the Administrative Law Judge in June 2010, which determination is being reviewed by the Commission. A hearing on the merits occurred in September 2010. In December 2010, as a result of a re-examination proceeding initiated by RIM and other parties, the U.S. Patent and Trademark Office affirmed the validity of the same patent claim at issue in the ITC investigation. On January 24, 2011, the Company received notice that the Administrative Law Judge (ALJ) had issued an initial determination recommending that the Commission find the patent claim at issue invalid and not infringed. The Company has petitioned the Commission to review the initial determination of the ALJ. A final determination by the Commission is expected by May 23, 2011.
On January 14, 2010 the Company filed two suits against Apple Inc. in the Federal District Court in the Western District of New York (Eastman Kodak Company v. Apple Inc.) claiming infringement of patents related to digital cameras and certain computer processes. The Company is seeking unspecified damages and other relief. The case related to digital cameras has been stayed pending the ITC action referenced above. On April 15, 2010, Apple Inc. filed a counterclaim against Kodak claiming infringement of patents related to digital cameras and all-in-one printers. The Company intends to vigorously defend itself.
On April 15, 2010, Apple Inc. filed a complaint in the ITC against Kodak asserting infringement of patents related to digital cameras. In the Matter of Certain Digital Imaging Devices and Related Software, Apple is seeking a limited exclusion order preventing importation of infringing devices. A hearing on the merits before an Administrative Law Judge was concluded on February 2, 2011 and an initial determination is expected by May 18, 2011. On April 15, 2010 Apple also filed in Federal District Court in the Northern District of California (Apple Inc. v. Eastman Kodak Company) a complaint asserting infringement of the same patents asserted in the ITC. The Company intends to vigorously defend itself.
On August 26, 2010, Apple filed a claim in California State Court (Santa Clara) claiming ownership of the Kodak patent asserted by Kodak against Apple in the ITC action referenced above. This action has been removed to Federal District Court in the Northern District of California. The Court has subsequently stayed this action. The Company intends to vigorously defend itself.
The Company and its subsidiaries are involved in various lawsuits, claims, investigations and proceedings, including commercial, customs, employment, environmental, and health and safety matters, which are being handled and defended in the ordinary course of business. In addition, the Company is subject to various assertions, claims, proceedings and requests for indemnification concerning intellectual property, including patent infringement suits involving technologies that are incorporated in a broad spectrum of the Company’s products. These matters are in various stages of investigation and litigation, and are being vigorously defended. Although the Company does not expect that the outcome in any of these matters, individually or collectively, will have a material adverse effect on its financial condition or results of operations, litigation is inherently unpredictable. Therefore, judgments could be rendered or settlements entered, that could adversely affect the Company’s operating results or cash flows in a particular period. The Company routinely assesses all of its litigation and threatened litigation as to the probability of ultimately incurring a liability, and records its best estimate of the ultimate loss in situations where it assesses the likelihood of loss as probable.
17
EXECUTIVE OFFICERS OF THE REGISTRANT
Pursuant to General Instructions G (3) of Form 10-K, the following list is included as an unnumbered item in Part I of this report in lieu of being included in the Proxy Statement for the Annual Meeting of Shareholders.
|
Date First Elected
|
||||||
|
an
|
to
|
|||||
|
Executive
|
Present
|
|||||
|
Name
|
Age
|
Positions Held
|
Officer
|
Office
|
||
|
Robert L. Berman
|
53
|
Senior Vice President
|
2002
|
2005
|
||
|
Philip J. Faraci
|
55
|
President and Chief Operating Officer
|
2005
|
2007
|
||
|
Pradeep Jotwani
|
56
|
Senior Vice President
|
2010
|
2010
|
||
|
Brad W. Kruchten
|
50
|
Senior Vice President
|
2002
|
2009
|
||
|
Antoinette P. McCorvey
|
53
|
Chief Financial Officer and Senior Vice President
|
2007
|
2010
|
||
|
Gustavo Oviedo
|
58
|
Vice President
|
2007
|
2011
|
||
|
Antonio M. Perez
|
65
|
Chairman of the Board, Chief Executive Officer
|
2003
|
2005
|
||
|
Laura G. Quatela
|
53
|
General Counsel and Senior Vice President
|
2006
|
2011
|
||
|
Eric H. Samuels
|
43
|
Chief Accounting Officer and Corporate Controller
|
2009
|
2009
|
||
|
Terry R. Taber
|
56
|
Senior Vice President
|
2008
|
2010
|
||
Executive officers are elected annually in February.
All of the executive officers have been employed by Kodak in various executive and managerial positions for at least five years, except Mr. Jotwani, who joined the Company on September 29, 2010.
The executive officers' biographies follow:
Robert L. Berman
Mr. Berman was appointed to his current position in January 2002 and was elected a Vice President of the Company in February 2002. In March 2005, he was elected a Senior Vice President by the Board of Directors. He is a member of the Eastman Kodak Company Executive Council. He is responsible for the design and implementation of all human resources strategies, policies, and processes throughout the corporation. He works closely with Kodak’s CEO, Board of Directors, and Executive Compensation and Development Committee on all executive compensation and development processes for the corporation.
Prior to his current position, Mr. Berman was the Associate Director of Human Resources and the Director and divisional vice president of Human Resources for Global Operations, leading the delivery of strategic and operational human resources services to Kodak’s global manufacturing, supply chain, and regional operations around the world. He has held a variety of other key human resources positions for Kodak over his 28 year career, including the Director and divisional vice president of Human Resources for the global Consumer Imaging business and the Human Resources Director for Kodak Colorado Division.
Philip J. Faraci
Philip Faraci was named President and Chief Operating Officer, Eastman Kodak Company, in September 2007. As President and COO, Mr. Faraci is responsible for the day-to-day management of Kodak’s three major digital businesses: the Consumer Digital Imaging Group (CDG), the Graphic Communications Group (GCG), and the Film, Photofinishing and Entertainment Group (FPEG). He joined Kodak as Director, Inkjet Systems Program in December 2004. In February 2005, he was elected a Senior Vice President of the Company. In June 2005, he was also named Director, Corporate Strategy & Business Development.
18
Prior to Kodak, Mr. Faraci served as Chief Operating Officer of Phogenix Imaging and President and General Manager of Gemplus Corporation’s Telecom Business Unit. Prior to these roles, he spent 22 years at Hewlett-Packard, where he served as Vice President and General Manager of the Consumer Business Organization and Senior Vice President and General Manager for the Inkjet Imaging Solutions Group.
Pradeep Jotwani
Pradeep Jotwani joined Kodak in September 2010 as President, Consumer Digital Imaging Group, Chief Marketing Officer, and Senior Vice President.
As President, Consumer Digital Imaging Group, Mr. Jotwani is responsible for Kodak’s digital cameras, picture frames, pocket video cameras, kiosks, imaging sensors, consumer inkjet printers, and KODAK Gallery – the company’s online photo service. As Kodak’s CMO, Mr. Jotwani is responsible for customer relationship management, brand management, business-to-business and business-to-consumer marketing, communications and public affairs, online commerce, and the company’s website, www.kodak.com.
Mr. Jotwani left Hewlett-Packard Company in 2007 as Senior Vice President, Supplies, Imaging and Printing Group. Under his direction, the business was the industry-leading supplier. Prior to that assignment, he was President of HP’s Consumer Business Organization, which he formed. This organization represented HP’s first formal sales and marketing organization focused specifically on the consumer market. He also served as HP’s executive sponsor for Customer Relationship Management (CRM) and founded hpshopping.com, the company’s e-commerce store.
After 25 years at HP, and prior to joining Kodak, Mr. Jotwani served as an operating executive at a private equity firm, participated on several corporate boards, was a Leadership Fellow at Stanford University’s Graduate School of Business, and lent his time to a series of civic and non-profit organizations. He continues to serve on the board of RealNetworks, Inc., a pioneer of streaming media and the provider of network-delivered digital media products and services worldwide.
Brad W. Kruchten
Brad Kruchten is currently the President of the Film, Photofinishing & Entertainment Group (FPEG). In this capacity, he is responsible for profit and loss for all silver halide products. Mr. Kruchten was named Chief Operating Officer of FPEG in January 2009, and he was appointed President of FPEG in July 2009. The Board of Directors elected him a Senior Vice President in July 2009. In addition, Mr. Kruchten has responsibility for Event Imaging Solutions, which provides photo services to guests at theme parks and other attractions.
Prior to his current position, Mr. Kruchten was the worldwide General Manager for Retail Printing, and managed the products and services that enable retailers to offer an integrated retail solution to analog and digital photographers. These products and services included kiosks, paper, retail workflow software, service, and support. Before that, Mr. Kruchten was the General Manager for the Consumer and Professional film business. The Board of Directors elected him a Corporate Vice President in July 2002.
Kruchten's career at Kodak began in 1982 as a Quality Engineer. Over his first five years, he expanded his engineering experience in the Copy Products Division as a Manufacturing Engineer and a Development/Research Engineer. In 1986, he moved into a sales position for Copy Products, and over the next five years held a number of sales and marketing positions within Printer Products and Business Imaging Systems. In 1993, Kruchten became a product line manager for Business Imaging Systems. In this capacity, he had profit-and-loss responsibility for Retrieval products. In 1998, he was named Strategic Business Unit Manager and a divisional vice president of the Capture and Services business within the Document Imaging unit. During his tenure, Kodak introduced a number of scanners, which made the Company the world's leading seller of high-speed production scanning. In 2000, Kruchten was named Chief Operating Officer and vice president of the Document Imaging unit. As COO, he led the acquisition of the Imaging division of Bell & Howell. In 2001, Kruchten was named Site Manager, Kodak Colorado Division, and became a divisional vice president of Kodak's Global Manufacturing unit. In 2002, he was the Chief Executive Officer of Encad Inc., a wholly-owned Kodak subsidiary.
19
Prior to Kodak, Kruchten worked as a project engineer at Inland Steel and as a tool designer for General Motors Corp.
Antoinette P. McCorvey
Antoinette (Ann) McCorvey was elected Chief Financial Officer and Senior Vice President, Eastman Kodak Company, effective November 5, 2010.
Ms. McCorvey is responsible for worldwide financial operations, including Corporate Financial Planning and Analysis, Treasury, Audit, Controllership, Tax, Investor Relations, Aviation, Corporate Business Development, Worldwide Information Systems, and Global Purchasing.
Ms. McCorvey joined Kodak in December 1999 as Director, Finance, Imaging Materials Manufacturing. She has held assignments of increasing responsibility including Director, Finance, Global Manufacturing and Logistics; Director, Finance, Corporate Financial Planning and Analysis; and Director, Finance and Vice President, Consumer Digital Imaging Group. In March 2007, she was appointed Director & Vice President of Investor Relations. The Board of Directors elected her a Corporate Vice President in December 2007.
Prior to Kodak, Ms. McCorvey had a 20-year career with Monsanto/Solutia. Her last assignment at Solutia, Inc. (the former Chemical Company of Monsanto) was Vice President/General Manager of Nylon, Plastics, Polymers and Industrial Fibers.
Gustavo Oviedo
Gustavo Oviedo was named Chief Customer Officer and General Manager, Worldwide Regional Operations effective January 1, 2011.
Previously, Mr. Oviedo was General Manager, Worldwide Sales and Customer Operations, Consumer Digital Imaging and Graphic Communications Groups. In this role, he oversaw worldwide sales and customer support for the Company's Consumer Digital Imaging (CDG) and Graphic Communications (GCG) Groups. He was responsible for the United States and Canada, (US&C) European, African and Middle Eastern (EAMER) and Asia Pacific Regions (APR).
From March 2007 to December 2008, Mr. Oviedo was Asia Pacific Region Managing Director, Eastman Kodak Company. He also served as Managing Director, Asia Pacific Region for Kodak’s Graphic Communications Group, a position he assumed in 2006 following Kodak's acquisition of Kodak Polychrome Graphics (KPG). In this role, Mr. Oviedo was responsible for the entire Kodak business and strategic product portfolio in the region. The Board of Directors elected him a Corporate Vice President in December 2007.
Mr. Oviedo’s international career spans more than 25 years working in the United States, Latin America, Asia and Europe, and includes deep industrial operations management experience. Before joining Kodak (KPG), he spent over 20 years with Schneider Electric, a leader in electromechanical and electronic products, where he held positions of increasing responsibility in regional management and his portfolio included distribution, logistics, sales and marketing, business development, and strategic mergers & acquisitions.
Antonio M. Perez
Since joining the Company in April 2003, Kodak’s Chairman and Chief Executive Officer, Antonio M. Perez, has led the worldwide transformation of Kodak from a business based on film to one based primarily on digital technologies. In the past several years, Kodak introduced an array of new digital technologies and products for consumer and commercial applications that generated approximately $5.4 billion in revenue in 2010. Those include, among others, consumer inkjet printers, pocket video cameras, sensors for digital products, and dry labs for printing at retail, as well as offset-class commercial inkjet presses, high-volume digital production presses, digital controllers, workflow software solutions, and digital plates for commercial printing and packaging. The result is a new Kodak — a company where digital products account for 75 percent of revenue.
20
Mr. Perez brings to the task his experience from a 25-year career at Hewlett-Packard Company, where he was a corporate vice president and a member of the company’s Executive Council. As President of HP’s Consumer Business, Mr. Perez spearheaded the company’s efforts to build a business in digital imaging and electronic publishing, generating worldwide revenue of more than $16 billion.
Prior to that assignment, Mr. Perez served as President and CEO of HP’s inkjet imaging business for five years. During that time, the installed base of HP’s inkjet printers grew from 17 million to 100 million worldwide, with revenue totaling more than $10 billion.
After HP, Mr. Perez was President and CEO of Gemplus International, where he led the effort to take the company public. While at Gemplus, he transformed the company into the leading Smart Card-based solution provider in the fast-growing wireless and financial markets. In the first fiscal year, revenue at Gemplus grew 70 percent, from $700 million to $1.2 billion.
Laura G. Quatela
Laura G. Quatela was named General Counsel and elected a Senior Vice President effective January 1, 2011. Ms. Quatela was appointed Chief Intellectual Property Officer in January 2008 and retains this role in tandem with her new duties leading the Company's Legal organization. As Chief Intellectual Property Officer, she is responsible for IP strategy and policy, the Senior IP Strategy Council, and external IP affairs.
Previously, Ms. Quatela was Managing Director, Intellectual Property Transactions, and was responsible for directing strategic cross-licensing and royalty-bearing licensing activities for the Company, including developing licensing strategy, negotiating and structuring licenses, and managing IP valuations and investments. In August 2006, the Board of Directors elected Ms. Quatela a Vice President of the Company.
She joined Kodak in 1999 and held various positions in the Marketing, Antitrust, Trademark & Litigation staff in the Company’s Legal department. She was promoted to Director of Corporate Commercial Affairs, Vice President Legal and Assistant General Counsel in 2004.
From August 2002 to December 2003, Ms. Quatela served as Director, Finance Transformation and Vice President, Finance & Administration. In this position she led a team charged with planning and executing restructuring of Kodak’s finance functions.
Prior to joining Kodak, Ms. Quatela worked for Clover Capital Management, Inc., SASIB Railway GRS, and Bausch & Lomb Inc. In private law practice, she was a defense litigator specializing in mass tort cases.
Eric H. Samuels
Eric H. Samuels was appointed Corporate Controller and Chief Accounting Officer in July 2009. Mr. Samuels previously served as the Company’s Assistant Corporate Controller and brings to his position over 20 years of leadership experience in corporate finance and public accounting. He joined Kodak in 2004 as Director, Accounting Research and Policy.
Prior to joining Kodak, Mr. Samuels had a 14-year career in public accounting during which he served as a senior manager at KPMG LLP's Department of Professional Practice (National Office) in New York City. Prior to joining KPMG in 1996, he worked in Ernst & Young's New York City office.
Terry R. Taber
Terry R. Taber joined Kodak in 1980. In January 2009, he was named Chief Technical Officer. The Board of Directors elected him a Corporate Vice President in December 2008, and then a Senior Vice President in December 2010.
Mr. Taber was previously the Chief Operating Officer of Kodak’s Image Sensor Solutions (ISS) business, a leading developer of advanced CCD and CMOS sensors serving imaging and industrial markets. Prior to joining ISS in 2007, Mr. Taber held a series of senior positions
21
in Kodak’s research and development and product organizations. During his 30 years at Kodak, Mr. Taber has been involved in new materials research, product development and commercialization, manufacturing, and executive positions in R&D and business management.
Mr. Taber’s early responsibilities included research on new synthetic materials, an area in which he holds several patents. He then became a program manager for several film products before completing the Sloan Fellows program at the Massachusetts Institute of Technology. He returned from MIT to become the worldwide consumer film business product manager from 1999 to 2002, and then became an Associate Director of R&D from 2002 to 2005, followed by a position as the director of Materials & Media R&D from 2005 to 2007.
|
MARKET FOR REGISTRANT’S COMMON EQUITY, RELATED STOCKHOLDER MATTERS AND ISSUER PURCHASES OF EQUITY SECURITIES
|
Eastman Kodak Company common stock is traded on the New York Stock Exchange under the symbol "EK." There were 51,347 shareholders of record of common stock as of January 31, 2011.
MARKET PRICE DATA
|
2010
|
2009
|
|||||
|
Price per share:
|
High
|
Low
|
High
|
Low
|
||
|
1st Quarter
|
$6.94
|
$4.12
|
$7.66
|
$2.01
|
||
|
2nd Quarter
|
$9.08
|
$4.33
|
$4.57
|
$2.44
|
||
|
3rd Quarter
|
$5.11
|
$3.49
|
$6.82
|
$2.65
|
||
|
4th Quarter
|
$5.95
|
$3.84
|
$4.74
|
$3.26
|
||
DIVIDEND INFORMATION
On April 30, 2009, the Company announced that its Board of Directors decided to suspend future cash dividends on its common stock effective immediately. Consequently, there were no dividends paid during 2009 or 2010.
Dividends may be restricted under the Company’s debt agreements. Refer to Note 8, “Short-Term Borrowings and Long-Term Debt,” in the Notes to Financial Statements.
PERFORMANCE GRAPH - SHAREHOLDER RETURN
The following graph compares the performance of the Company's common stock with the performance of the Standard & Poor's 500 Composite Stock Price Index, the Standard & Poor’s Midcap 400 Composite Stock Price Index, and the Standard & Poor’s Consumer Discretionary Index by measuring the changes in common stock prices from December 31, 2005, plus reinvested dividends.
22
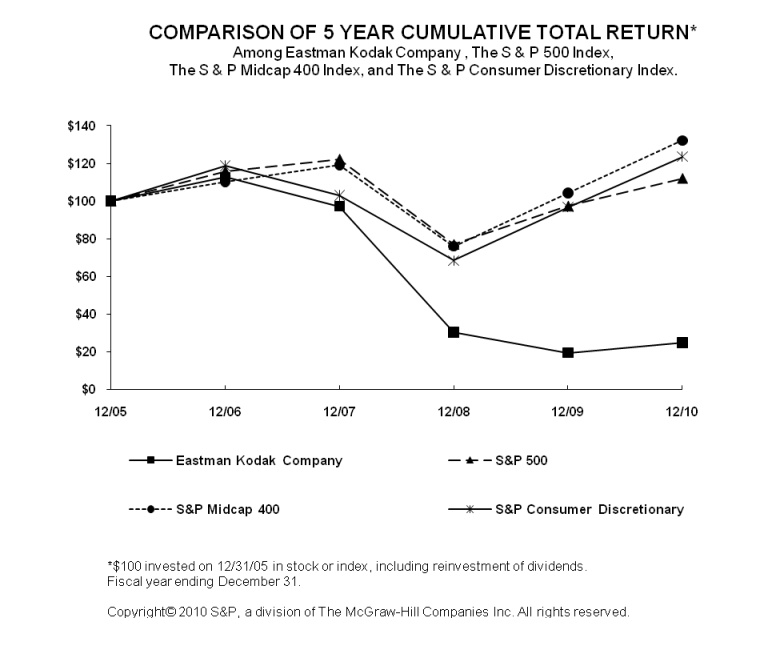
|
Copyright© 2010 Standard & Poor's, a division of The McGraw-Hill Companies Inc. All rights reserved.
|
|||||||
|
(www.researchdatagroup.com/S&P.htm)
|
|||||||
|
12/05
|
12/06
|
12/07
|
12/08
|
12/09
|
12/10
|
||
|
Eastman Kodak Company
|
100.00
|
112.58
|
97.22
|
30.45
|
19.53
|
24.81
|
|
|
S&P 500
|
100.00
|
115.80
|
122.16
|
76.96
|
97.33
|
111.99
|
|
|
S&P Midcap 400
|
100.00
|
110.32
|
119.12
|
75.96
|
104.36
|
132.16
|
|
|
S&P Consumer Discretionary
|
100.00
|
118.64
|
102.97
|
68.48
|
96.77
|
123.53
|
|
The Company has elected to include the S&P Consumer Discretionary index in the comparison, because it believes this index is more reflective of the industries in which the Company operates, and therefore provides a better comparison of returns than the Standard & Poor’s Midcap 400 Composite Stock Price Index or the Standard & Poor’s 500 Composite Stock Price Index.
Refer to Summary of Operating Data on page 112.
23
|
MANAGEMENT’S DISCUSSION AND ANALYSIS (“MD&A”) OF FINANCIAL CONDITION AND RESULTS OF OPERATIONS
|
The following Management’s Discussion and Analysis of Financial Condition and Results of Operations (“MD&A”) is intended to help the reader understand the results of operations and financial condition of Kodak for the three years ended December 31, 2010. All references to Notes relate to Notes to the Financial Statements in Item 8. “Financial Statements and Supplementary Data.”
OVERVIEW
Kodak is the world’s foremost imaging innovator and generates revenue and profits from the sale of products, technology, solutions and services to consumers, businesses and creative professionals. The Company’s portfolio is broad, including image capture and output devices, consumables and systems and solutions for consumer, business, and commercial printing applications. Kodak has three reportable business segments, which are more fully described later in this discussion in “Kodak Operating Model and Reporting Structure.” The three business segments are: Consumer Digital Imaging Group (“CDG”), Graphic Communications Group (“GCG”) and Film, Photofinishing and Entertainment Group (“FPEG”).
The Company’s digital growth strategy is centered around exploiting our competitive advantage at the intersection of materials science and digital imaging science. The Company has leading market positions in large markets including digital printing plates, scanners, digital still and video cameras, and kiosks. In addition, the Company has been introducing differentiated value propositions in new growth markets that are in need of transformation. The Company’s four growth initiatives are: consumer inkjet, within CDG, and commercial inkjet, workflow software and services, and packaging solutions within GCG.
While these four growth initiatives have largely been in an investment mode, revenue in these product lines grew 18% for the full year. The Company will continue to gain scale in these product lines to enable a more significant and profitable contribution from them.
Competitive pricing and rising commodity costs negatively impacted results in Kodak’s more mature product lines, including Prepress Solutions, Digital Capture and Devices, and Entertainment Imaging. The Company is addressing these challenges through a variety of means including the introduction of new differentiated products and pricing and hedging strategies.
Kodak entered into three significant intellectual property arrangements during the year. Each of these agreements was in line with the three fundamental objectives of the Company’s intellectual property licensing program, which are design freedom, gaining access to new markets and partnerships, and generating cash and earnings. The Company recognized revenue amounting to $838 million from these licenses in the year ended December 31, 2010.
Additionally, during 2009 and 2010, the Company took a number of financing actions designed to provide continued financial flexibility for the Company:
|
·
|
On March 31, 2009, the Company and its Canadian subsidiary entered into an Amended and Restated Credit Agreement (the “Amended Credit Agreement”) with its lenders, which provides for an asset-based revolving credit facility of up to $500 million, under certain conditions, including up to $250 million of availability for letters of credit.
|
|
·
|
In September of 2009, the Company issued $300 million of Senior Secured Notes due 2017, with detachable warrants, and $400 million of Convertible Senior Notes due 2017. The combined net proceeds of the two transactions, after transaction costs, discounts and fees, of approximately $650 million, were used to repurchase $563 million of the Company’s existing $575 million Convertible Senior Notes Due 2033 in October 2009, as well as for general corporate purposes. Therefore, the new debt issuances served as a refinancing of the debt structure of the Company.
|
|
·
|
In March of 2010, the Company issued $500 million of Senior Secured Notes due 2018. The proceeds from this issuance were used to repurchase all $300 million of the Senior Secured Notes due 2017, and $200 million of Senior Notes due 2013. This served as a further refinancing of the debt structure of the Company.
|
24
CRITICAL ACCOUNTING POLICIES AND ESTIMATES
The accompanying consolidated financial statements and notes to consolidated financial statements contain information that is pertinent to management’s discussion and analysis of the financial condition and results of operations. The preparation of financial statements in conformity with accounting principles generally accepted in the United States of America requires management to make estimates and assumptions that affect the reported amounts of assets, liabilities, revenue and expenses, and the related disclosure of contingent assets and liabilities.
The Company believes that the critical accounting policies and estimates discussed below involve the most complex management judgments due to the sensitivity of the methods and assumptions necessary in determining the related asset, liability, revenue and expense amounts. Specific risks associated with these critical accounting policies are discussed throughout this MD&A, where such policies affect our reported and expected financial results. For a detailed discussion of the application of these and other accounting policies, refer to the Notes to Financial Statements in Item 8.
REVENUE RECOGNITION
The Company's revenue transactions include sales of the following: products; equipment; software; services; integrated solutions, and intellectual property licensing. The Company recognizes revenue when it is realized or realizable and earned. The timing and the amount of revenue recognized from the licensing of intellectual property depend upon a variety of factors, including the specific terms of each agreement and the nature of the deliverables and obligations. For the sale of multiple-element arrangements, including whereby equipment or intellectual property is combined in a revenue generating transaction with other elements, the Company allocates to, and recognizes revenue from, the various elements based on their fair value. As of January 1, 2011, the Company will allocate to, and recognize revenue from, the various elements of multiple-element arrangements based on the best estimate of selling price of a deliverable, using: vendor-specific objective evidence, third-party evidence, and estimated selling price.
At the time revenue is recognized, the Company also records reductions to revenue for customer incentive programs. Such incentive programs include cash and volume discounts, price protection, promotional, cooperative and other advertising allowances and coupons. For those incentives that require the estimation of sales volumes or redemption rates, such as for volume rebates or coupons, the Company uses historical experience and both internal and customer data to estimate the sales incentive at the time revenue is recognized. In the event that the actual results of these items differ from the estimates, adjustments to the sales incentive accruals would be recorded.
VALUATION OF LONG-LIVED ASSETS, INCLUDING GOODWILL AND INTANGIBLE ASSETS
The Company tests goodwill for impairment annually on September 30, and whenever events occur or circumstances change that would more likely than not reduce the fair value of the reporting unit below its carrying amount.
The Company tests goodwill for impairment at a level of reporting referred to as a reporting unit. A reporting unit is an operating segment or one level below an operating segment (referred to as a component). A component of an operating segment is a reporting unit if the component constitutes a business for which discrete financial information is available and segment management regularly reviews the operating results of that component. When two or more components of an operating segment have similar economic characteristics, the components are aggregated and deemed a single reporting unit. An operating segment is deemed to be a reporting unit if all of its components are similar, if none of its components is a reporting unit, or if the segment comprises only a single component.
The components of the Film, Photofinishing and Entertainment Group (FPEG) operating segment are similar and, therefore, the segment meets the requirement of a reporting unit. Likewise, the components of the Consumer Digital Imaging Group (CDG) are similar and, therefore, the segment meets the definition of a reporting unit. The Graphic Communications Group (GCG) operating segment has two reporting units: the Business Services and Solutions Group (BSSG) reporting unit and the Commercial Printing reporting unit (consisting of the Prepress
25
Solutions and Digital Printing Solutions strategic product groups.) The Commercial Printing reporting unit consists of components that have similar economic characteristics and, therefore, have been aggregated into a single reporting unit.
The Company’s reporting units changed in 2010 as a result of organizational changes that became effective in the current year. Image Sensor Solutions (ISS) was a reporting unit in 2009. ISS no longer meets the definition of a component and, therefore, no longer qualifies as a reporting unit. ISS is now a part of the CDG reporting unit. The ISS reporting unit did not have any goodwill allocated to it in the prior year. In addition, within the GCG operating segment, the Enterprise Solutions strategic product group (SPG) was combined with the Document Imaging SPG to form a new SPG called BSSG, which meets the definition of a component and a reporting unit. The Document Imaging SPG was a reporting unit in the prior year. The remainder of the GCG operating segment represents the Commercial Printing reporting unit, as noted above. These 2010 reporting structure changes had no impact on the Company’s segment reporting.
Goodwill is tested by initially comparing the fair value of each of the Company’s reporting units to their related carrying values. If the fair value of the reporting unit is less than its carrying value, the Company must determine the implied fair value of the goodwill associated with that reporting unit. The implied fair value of goodwill is determined by first allocating the fair value of the reporting unit to all of its assets and liabilities and then computing the excess of the reporting unit’s fair value over the amounts assigned to the assets and liabilities. If the carrying value of goodwill exceeds the implied fair value of goodwill, such excess represents the amount of goodwill impairment charge that must be recognized.
Determining the fair value of a reporting unit involves the use of significant estimates and assumptions. The Company estimates the fair value of its reporting units utilizing income and market approaches through the application of discounted cash flow and market comparable methods, respectively. To estimate fair value utilizing the income approach, the Company established an estimate of future cash flows for each reporting unit and discounted those estimated future cash flows to present value. Key assumptions used in the income approach were: (a) expected cash flows for the period from October 1, 2010 to December 31, 2015; and (b) discount rates of 15% to 28%, which were based on the Company’s best estimates of the after-tax weighted-average cost of capital of each reporting unit. To estimate fair value utilizing the market comparable methodology, the Company applied valuation multiples, derived from publicly-traded benchmark companies, to operating data of each reporting unit. Benchmark companies are selected for each reporting unit based on comparability of the underlying business and economics, and if they could potentially purchase the reporting unit. Key assumptions used in the market approach include the selection of appropriate benchmark companies and the selection of an appropriate market value multiple for each reporting unit based on a comparison of the reporting unit with the benchmark companies as of the impairment testing date. Both the income and market approaches estimate fair values based on ability to generate earnings and are, therefore, meaningful in estimating the fair value of each of the Company’s reporting units. The use of each methodology also provides corroboration for the other methodology. Consistent with prior years, with the exception of the FPEG reporting unit, the Company determined fair value of each of its reporting units using 50% weighting for each valuation methodology as we believe that each methodology provides equally valuable information. The Company determined fair value for the FPEG reporting unit using only the income approach due to the unique circumstances of the film and photofinishing industry.
Based upon the results of the Company’s September 30, 2010 analysis, no impairment of goodwill was indicated.
A 20 percent change in estimated future cash flows or a 10 percentage point change in discount rate would not have caused a goodwill impairment to be recognized by the Company for any of its reporting units as of September 30, 2010. Impairment of goodwill could occur in the future if market or interest rate environments deteriorate, expected future cash flows decrease, or if reporting unit carrying values change materially compared with changes in respective fair values.
The Company’s long-lived assets other than goodwill are evaluated for impairment whenever events or changes in circumstances indicate the carrying value may not be recoverable.
When evaluating long-lived assets for impairment, the Company compares the carrying value of an asset group to its estimated undiscounted future cash flows. An impairment is indicated if the estimated future cash flows are less than the carrying value of the
26
asset group. The impairment is the excess of the carrying value over the fair value of the long-lived asset group.
In December 2010, the FASB issued ASU No. 2010-28, "When to Perform Step 2 of the Goodwill Impairment Test for Reporting Units with Zero or Negative Carrying amounts," which amends ASC Topic 350, "Intangibles - Goodwill and Other." ASU No. 2010-28 requires entities that have a reporting unit with a negative carrying value to assess whether qualitative factors indicate that it is more likely than not that an impairment of goodwill exists, and if an entity concludes that it is more likely than not that an impairment exists, the entity must measure the goodwill impairment. This update is effective January 1, 2011 for the Company. The FPEG reporting unit had a negative carrying amount as of September 30, 2010 for purposes of the annual goodwill impairment test.
Due to the continuing challenging business conditions facing FPEG including a sustained fourth quarter escalation in commodity prices (the price of silver increased 39%, or $8.56 per troy ounce from the September 30, 2010 closing price to $30.63 per troy ounce at the December 31, 2010 closing price), and ongoing declines in the FPEG business caused by digital substitution, the Company evaluated the long-lived assets of FPEG’s film business and paper and output systems business for impairment, and updated its goodwill impairment analysis of the FPEG reporting unit as of December 31, 2010. Based on this evaluation, with the exception of goodwill, the Company concluded that there were no impairments of FPEG’s long-lived assets.
Certain assumptions used to determine the fair value and carrying amount of the FPEG reporting unit for purposes of the goodwill impairment test were revised, as of December 31, to reflect: (1) reductions in future expected cash flows due to the actual results for the fourth quarter of 2010 and revised forecasts for 2011 and later years; and (2) revision of which liabilities would be considered in determining the fair value of the reporting unit, as the updated cash flows could no longer support all of the previously allocated liabilities. Based on its updated analysis, the Company concluded that there was an impairment of goodwill related to the FPEG reporting unit of $626 million as of December 31, 2010.
As a result of the updated goodwill impairment analysis and the impairment charge recorded in the fourth quarter of 2010 for FPEG, ASU No. 2010-28 will not have an impact on the Company.
In conjunction with the fourth quarter impairment analysis, the Company reviewed its estimates of the remaining useful lives of FPEG’s long-lived assets. This analysis indicated that overall the assets will continue to be used in these businesses for a longer period than anticipated in 2008, the last time that depreciable lives were adjusted for these assets. As a result, the Company revised the useful lives of certain existing production machinery and equipment, and manufacturing-related buildings effective January 1, 2011. These assets, many of which were previously set to fully depreciate by 2012 to 2013, were changed to depreciate with estimated useful lives ending from 2014 to 2017. This change in useful lives reflects the Company’s current estimate of future periods to be benefited from the use of the property, plant, and equipment.
The estimated effect of this change for the year ended December 31, 2011 is a reduction in depreciation expense of $38 million, $32 million of which will be recognized in Cost of sales as a benefit to earnings from continuing operations, and $6 million of which will be capitalized as a reduction in inventories. The estimated net impact of this change is an increase in fully diluted earnings per share of $.12.
INCOME TAXES
The Company recognizes deferred tax liabilities and assets for the expected future tax consequences of operating losses, credit carryforwards and temporary differences between the carrying amounts and tax basis of the Company’s assets and liabilities. The Company records a valuation allowance to reduce its net deferred tax assets to the amount that is more likely than not to be realized. The Company has considered forecasted earnings, future taxable income, the geographical mix of earnings in the jurisdictions in which the Company operates and prudent and feasible tax planning strategies in determining the need for these valuation allowances. As of December 31, 2010, the Company has net deferred tax assets before valuation allowances of approximately $3.1 billion and a valuation allowance related to those net deferred tax assets of approximately $2.3 billion, resulting in net deferred tax assets of approximately $0.8 billion. If the Company were to determine that it would not be able to realize a portion of its net deferred tax assets in the future, for which there is currently no valuation allowance, an adjustment to the net deferred tax assets would be charged to earnings in the period such determination was made. Conversely, if the Company were to make a determination that it is more likely than not that deferred tax assets, for which there is currently a valuation allowance, would be realized, the related valuation allowance would be reduced and a benefit to earnings would be recorded. During the fourth quarter of 2010, based on additional positive evidence regarding past earnings and projected future taxable income from operating activities, the Company determined that it is more likely than not that a portion of the deferred tax assets outside the U.S. would be realized and accordingly, recorded a tax benefit of $154 million associated with the release of the valuation allowance on those deferred tax assets.
The Company’s tax provision (benefit) considers the impact of undistributed earnings of subsidiary companies outside of the U.S. Deferred taxes have not been provided for the potential remittance of such undistributed earnings, as it is the Company's policy
27
to indefinitely reinvest its retained earnings. However, from time to time and to the extent that the Company can repatriate overseas earnings on essentially a tax-free basis, the Company's foreign subsidiaries will pay dividends to the U.S.
The Company operates within multiple taxing jurisdictions worldwide and is subject to audit in these jurisdictions. These audits can involve complex issues, which may require an extended period of time for resolution. Management’s ongoing assessments of the more-likely-than-not outcomes of these issues and related tax positions require judgment, and although management believes that adequate provisions have been made for such issues, there is the possibility that the ultimate resolution of such issues could have an adverse effect on the earnings of the Company. Conversely, if these issues are resolved favorably in the future, the related provisions would be reduced, thus having a positive impact on earnings.
PENSION AND OTHER POSTRETIREMENT BENEFITS
The Company’s defined benefit pension and other postretirement benefit costs and obligations are dependent on the Company's key assumptions. These assumptions, which are reviewed at least annually by the Company, include the discount rate, long-term expected rate of return on plan assets (“EROA”), salary growth, healthcare cost trend rate and other economic and demographic factors. Actual results that differ from our assumptions are recorded as unrecognized gains and losses and are amortized to earnings over the estimated future service period of the active participants in the plan or, if almost all of a plan’s participants are inactive, the average remaining lifetime expectancy of inactive participants, to the extent such total net unrecognized gains and losses exceed 10% of the greater of the plan's projected benefit obligation or the calculated value of plan assets. Significant differences in actual experience or significant changes in future assumptions would affect the Company’s pension and other postretirement benefit costs and obligations.
The EROA assumption is based on a combination of formal asset and liability studies that include forward-looking return expectations, given the current asset allocation. The EROA, once set, is applied to the calculated value of plan assets in the determination of the expected return component of the Company’s pension income or expense. The Company uses a calculated value of plan assets, which recognizes changes in the fair value of assets over a four-year period, to calculate expected return on assets. At December 31, 2010, the calculated value of the assets of the Company’s major U.S. and Non-U.S. defined benefit pension plans was approximately $8.1 billion and the fair value was approximately $7.5 billion. Asset gains and losses that are not yet reflected in the calculated value of plan assets are not included in amortization of unrecognized gains and losses.
The Company reviews its EROA assumption annually. To facilitate this review, every three years, or when market conditions change materially, the Company’s larger plans will undertake asset allocation or asset and liability modeling studies. The weighted average EROA for major U.S. and non-U.S. defined benefit pension plans used to determine net pension (income) expense was 8.73% and 7.76%, respectively, for the year ended December 31, 2010.
Generally, the Company bases the discount rate assumption for its significant plans on high quality corporate bond yields in the respective countries as of the measurement date. Specifically, for its U.S. and Canadian plans, the Company determines a discount rate using a cash flow model to incorporate the expected timing of benefit payments and an AA-rated corporate bond yield curve. For the Company's U.S. plans, the Citigroup Above Median Pension Discount Curve is used. For the Company’s other non-U.S. plans, the discount rates are determined by comparison to published local high quality bond yields or indices considering estimated plan duration and removing any outlying bonds, as warranted.
The salary growth assumptions are determined based on the Company’s long-term actual experience and future and near-term outlook. The healthcare cost trend rate assumptions are based on historical cost and payment data, the near-term outlook and an assessment of the likely long-term trends.
28
The following table illustrates the sensitivity to a change to certain key assumptions used in the calculation of expense for the year ending December 31, 2011 and the projected benefit obligation (“PBO”) at December 31, 2010 for the Company's major U.S. and non-U.S. defined benefit pension plans:
|
(in millions)
|
Impact on 2011
Pre-Tax Pension Expense Increase (Decrease)
|
Impact on PBO
December 31, 2010 Increase (Decrease)
|
||||
|
U.S.
|
Non-U.S.
|
U.S.
|
Non-U.S.
|
|||
|
Change in assumption:
|
||||||
|
25 basis point decrease in discount rate
|
$ 7
|
$ 4
|
$ 123
|
$ 126
|
||
|
25 basis point increase in discount rate
|
(7)
|
(4)
|
(118)
|
(119)
|
||
|
25 basis point decrease in EROA
|
13
|
7
|
N/A
|
N/A
|
||
|
25 basis point increase in EROA
|
(13)
|
(7)
|
N/A
|
N/A
|
||
Total pension income from continuing operations before special termination benefits, curtailments, and settlements for the major funded and unfunded defined benefit pension plans in the U.S. is expected to decrease from $158 million in 2010 to approximately $60 million in 2011, due primarily to an increase in amortization of actuarial losses. Pension expense from continuing operations before special termination benefits, curtailments and settlements for the major funded and unfunded non-U.S. defined benefit pension plans is projected to increase from $19 million in 2010 to approximately $40 million in 2011. Holding current assumptions constant, net pension income is expected to continue to decline into 2012.
Additionally, the Company expects the expense, before curtailment and settlement gains and losses of its major other postretirement benefit plans, to decrease to approximately $20 million in 2011 as compared with $25 million for 2010.
ENVIRONMENTAL COMMITMENTS
Environmental liabilities are accrued based on undiscounted estimates of known environmental remediation responsibilities. The liabilities include accruals for sites owned or leased by the Company, sites formerly owned or leased by the Company, and other third party sites where the Company was designated as a potentially responsible party (“PRP”). The amounts accrued for such sites are based on these estimates, which are determined using the ASTM Standard E 2137-06, “Standard Guide for Estimating Monetary Costs and Liabilities for Environmental Matters.” The overall method includes the use of a probabilistic model that forecasts a range of cost estimates for the remediation required at individual sites. The Company’s estimate includes equipment and operating costs for investigations, remediation and long-term monitoring of the sites. Such estimates may be affected by changing determinations of what constitutes an environmental liability or an acceptable level of remediation. The Company’s estimate of its environmental liabilities may also change if the proposals to regulatory agencies for desired methods and outcomes of remediation are viewed as not acceptable, or additional exposures are identified. The Company has an ongoing monitoring and identification process to assess how activities, with respect to the known exposures, are progressing against the accrued cost estimates, as well as to identify other potential remediation issues that are presently unknown.
Additionally, in many of the countries in which the Company operates, environmental regulations exist that require the Company to handle and dispose of asbestos in a special manner if a building undergoes major renovations or is demolished. The Company records a liability equal to the estimated fair value of its obligation to perform asset retirement activities related to the asbestos, computed using an expected present value technique, when sufficient information exists to calculate the fair value.
RECENTLY ISSUED ACCOUNTING PRONOUNCEMENTS
See Note 1, “Significant Accounting Policies,” in the Notes to Financial Statements in Item 8.
29
KODAK OPERATING MODEL AND REPORTING STRUCTURE
For 2010, the Company had three reportable segments: Consumer Digital Imaging Group (“CDG”), Graphic Communications Group (“GCG”), and Film, Photofinishing and Entertainment Group (“FPEG”). Within each of the Company’s reportable segments are various components, or Strategic Product Groups (“SPGs”). Throughout the remainder of this document, references to the segments’ SPGs are indicated in italics. The balance of the Company's continuing operations, which individually and in the aggregate do not meet the criteria of a reportable segment, are reported in All Other. A description of the segments is as follows:
Consumer Digital Imaging Group Segment (“CDG”):
This segment provides a full range of digital imaging products and service offerings to consumers. CDG encompasses the following SPGs. Products and services included within each SPG are identified below.
Digital Capture and Devices
includes digital still and pocket video cameras, digital picture frames, accessories, branded licensed products, imaging sensors, and licensing activities related to the Company’s intellectual property in digital imaging products.
Consumer Inkjet Systems
includes consumer inkjet printers and related ink and media consumables.
Retail Systems Solutions
includes kiosks, APEX drylab systems, and related consumables and services.
Consumer Imaging Services
includes Kodak Gallery products and photo sharing services.
Graphic Communications Group Segment (“GCG”):
GCG serves a variety of customers in the creative, in-plant, data center, commercial printing, packaging, newspaper and digital service bureau market segments with a range of software, media and hardware products that provide customers with a variety of solutions for prepress equipment, workflow software, analog and digital printing, and document scanning.
GCG encompasses the following SPGs. Products and services included within each SPG are identified below.
Prepress Solutions
includes digital and traditional prepress equipment, consumables including plates, chemistry and media, related services, and packaging solutions.
Digital Printing Solutions
includes high-speed, high-volume
commercial inkjet, and color and black-and-white electrophotographic printing equipment and related consumables and services
.
Business Services and Solutions
includes
workflow software and digital controllers, document scanning products and services and related maintenance offerings. Also included in this SPG are the activities related to the Company’s business solutions and consulting services.
Film, Photofinishing and Entertainment Group Segment (“FPEG”):
This segment provides consumers, professionals, cinematographers, and other entertainment imaging customers with film-related products and services. FPEG encompasses the following SPGs. Products and services included within each SPG are identified below.
Film Capture
includes consumer and professional film and one-time-use cameras.
Traditional Photofinishing
includes paper and output systems and photofinishing services.
Entertainment Imaging
includes entertainment imaging products and services.
Industrial Materials
includes aerial and industrial film products, film for the production of printed circuit boards, and specialty chemicals.
All Other:
This category included the results of the Company’s display business, up to the date of sale of assets of this business in the fourth quarter of 2009.
30
DETAILED RESULTS OF OPERATIONS
Net Sales from Continuing Operations by Reportable Segment and All Other (1)
|
For the Year Ended December 31,
|
||||||||||||||||||||||||||||
|
(in millions)
|
2010
|
Change
|
Foreign Currency Impact
|
2009
|
Change
|
Foreign Currency Impact
|
2008
|
|||||||||||||||||||||
|
Consumer Digital Imaging Group
|
||||||||||||||||||||||||||||
|
Inside the U.S.
|
$ | 1,781 | +10 | % | 0 | % | $ | 1,618 | -11 | % | 0 | % | $ | 1,811 | ||||||||||||||
|
Outside the U.S.
|
958 | -4 | -2 | 1,001 | -22 | -4 | 1,277 | |||||||||||||||||||||
|
Total Consumer Digital Imaging Group
|
2,739 | +5 | -1 | 2,619 | -15 | -2 | 3,088 | |||||||||||||||||||||
|
Graphic Communications Group
|
||||||||||||||||||||||||||||
|
Inside the U.S.
|
810 | -3 | 0 | 831 | -20 | 0 | 1,036 | |||||||||||||||||||||
|
Outside the U.S.
|
1,871 | -1 | 0 | 1,895 | -18 | -3 | 2,298 | |||||||||||||||||||||
|
Total Graphic Communications Group
|
2,681 | -2 | 0 | 2,726 | -18 | -2 | 3,334 | |||||||||||||||||||||
|
Film, Photofinishing and Entertainment
Group
|
||||||||||||||||||||||||||||
|
Inside the U.S.
|
397 | -22 | 0 | 508 | -39 | 0 | 835 | |||||||||||||||||||||
|
Outside the U.S.
|
1,370 | -22 | 0 | 1,749 | -19 | -4 | 2,152 | |||||||||||||||||||||
|
Total Film, Photofinishing and
Entertainment Group
|
1,767 | -22 | 0 | 2,257 | -24 | -3 | 2,987 | |||||||||||||||||||||
|
All Other
|
||||||||||||||||||||||||||||
|
Inside the U.S.
|
- | 5 | 7 | |||||||||||||||||||||||||
|
Outside the U.S.
|
- | (1 | ) | - | ||||||||||||||||||||||||
|
Total All Other
|
- | 4 | 7 | |||||||||||||||||||||||||
|
Consolidated
|
||||||||||||||||||||||||||||
|
Inside the U.S.
|
2,988 | +1 | 0 | 2,962 | -20 | 0 | 3,689 | |||||||||||||||||||||
|
Outside the U.S.
|
4,199 | -10 | -1 | 4,644 | -19 | -4 | 5,727 | |||||||||||||||||||||
|
Consolidated Total
|
$ | 7,187 | -6 | % | 0 | % | $ | 7,606 | -19 | % | -2 | % | $ | 9,416 | ||||||||||||||
(1) Sales are reported based on the geographic area of destination.
31
Earnings (Loss) from Continuing Operations Before Interest Expense, Other Income (Charges), Net and Income Taxes by Reportable Segment and All Other
|
For the Year Ended December 31,
|
||||||||||||||||||||
|
(in millions)
|
2010
|
Change
|
2009
|
Change
|
2008
|
|||||||||||||||
|
Consumer Digital Imaging Group
|
$ | 331 | +846 | % | $ | 35 | +120 | % | $ | (177 | ) | |||||||||
|
Graphic Communications Group
|
(26 | ) | +38 | (42 | ) | -235 | 31 | |||||||||||||
|
Film, Photofinishing and Entertainment Gr
oup
|
64 | -60 | 159 | -19 | 196 | |||||||||||||||
|
All Other
|
- | +100 | (13 | ) | +24 | (17 | ) | |||||||||||||
|
Total
|
369 | +165 | 139 | +321 | 33 | |||||||||||||||
|
Restructuring costs, rationalization and
other
|
(78 | ) | (258 | ) | (149 | ) | ||||||||||||||
|
Postemployment benefit changes
|
- | - | 94 | |||||||||||||||||
|
Other operating income (expenses), net
|
(619 | ) | 88 | (766 | ) | |||||||||||||||
|
Adjustments to contingencies and legal
reserves/settlements
|
(8 | ) | 3 | (33 | ) | |||||||||||||||
|
Interest expense
|
(149 | ) | (119 | ) | (108 | ) | ||||||||||||||
|
Loss on early extinguishment of debt
|
(102 | ) | - | - | ||||||||||||||||
|
Other income (charges), net
|
26 | 30 | 55 | |||||||||||||||||
|
Loss from continuing operations
before income taxes
|
$ | (561 | ) | -379 | % | $ | (117 | ) | +87 | % | $ | (874 | ) | |||||||
32
RESULTS OF OPERATIONS - CONTINUING OPERATIONS
CONSOLIDATED
|
(dollars in millions)
|
For the Year Ended
|
|||||||||||||||||||||||||||||||
|
December 31,
|
||||||||||||||||||||||||||||||||
|
|
2010
|
% of Sales
|
% Change
|
2009
|
% of Sales
|
% Change
|
2008
|
% of Sales
|
||||||||||||||||||||||||
|
Net sales
|
$ | 7,187 | -6 | % | $ | 7,606 | -19 | % | $ | 9,416 | ||||||||||||||||||||||
|
Cost of sales
|
5,236 | -10 | % | 5,838 | -19 | % | 7,247 | |||||||||||||||||||||||||
|
Gross profit
|
1,951 | 27.1 | % | 10 | % | 1,768 | 23.2 | % | -18 | % | 2,169 | 23.0 | % | |||||||||||||||||||
|
Selling, general and administrative expenses
|
1,277 | 18 | % | -2 | % | 1,302 | 17 | % | -19 | % | 1,606 | 17 | % | |||||||||||||||||||
|
Research and development costs
|
321 | 4 | % | -10 | % | 356 | 5 | % | -26 | % | 478 | 5 | % | |||||||||||||||||||
|
Restructuring costs, rationalization and other
|
70 | -69 | % | 226 | 61 | % | 140 | |||||||||||||||||||||||||
|
Other operating expenses (income), net
|
619 | 803 | % | (88 | ) | 111 | % | 766 | ||||||||||||||||||||||||
|
Loss from continuing operations before
interest expense, other income (charges), net and
income taxes
|
(336 | ) | -5 | % | (28 | ) | 0 | % | (821 | ) | -9 | % | ||||||||||||||||||||
|
Interest expense
|
149 | 25 | % | 119 | 10 | % | 108 | |||||||||||||||||||||||||
|
Loss on early extinguishment of debt, net
|
102 | - | - | |||||||||||||||||||||||||||||
|
Other income (charges), net
|
26 | -13 | % | 30 | -45 | % | 55 | |||||||||||||||||||||||||
|
Loss from continuing operations before
income taxes
|
(561 | ) | -379 | % | (117 | ) | 87 | % | (874 | ) | ||||||||||||||||||||||
|
Provision (benefit) for income taxes
|
114 | -1 | % | 115 | 178 | % | (147 | ) | ||||||||||||||||||||||||
|
Loss from continuing operations
|
(675 | ) | -9 | % | -191 | % | (232 | ) | -3 | % | 68 | % | (727 | ) | -8 | % | ||||||||||||||||
|
(Loss) earnings from discontinued operations, net of
income taxes
|
(12 | ) | 17 | 285 | ||||||||||||||||||||||||||||
|
Extraordinary item, net of tax
|
- | 6 | - | |||||||||||||||||||||||||||||
|
NET LOSS
|
(687 | ) | (209 | ) | (442 | ) | ||||||||||||||||||||||||||
|
Less: Net earnings
attributable to
noncontrolling
interests
|
- | (1 | ) | - | ||||||||||||||||||||||||||||
|
NET LOSS ATTRIBUTABLE TO EASTMAN KODAK COMPANY
|
$ | (687 | ) | -227 | % | $ | (210 | ) | 52 | % | $ | (442 | ) | |||||||||||||||||||
|
For the Year Ended
|
||||||||||||||||||||||||
|
December 31,
|
Change vs. 2009
|
|||||||||||||||||||||||
|
2010 Amount
|
Change vs. 2009
|
Volume
|
Price/Mix
|
Foreign Exchange
|
Manufacturing and Other Costs
|
|||||||||||||||||||
|
Total net sales
|
$ | 7,187 | -5.5 | % | -5.2 | % | 0.0 | % | -0.3 | % | n/a | |||||||||||||
|
Gross profit margin
|
27.1 | % |
3.9pp
|
n/a |
1.0pp
|
0.1pp
|
2.8pp
|
|||||||||||||||||
|
For the Year Ended
|
||||||||||||||||||||||||
|
December 31,
|
Change vs. 2008
|
|||||||||||||||||||||||
|
2009 Amount
|
Change vs. 2008
|
Volume
|
Price/Mix
|
Foreign Exchange
|
Manufacturing and Other Costs
|
|||||||||||||||||||
|
Total net sales
|
$ | 7,606 | -19.2 | % | -14.5 | % | -2.5 | % | -2.2 | % | n/a | |||||||||||||
|
Gross profit margin
|
23.2 | % |
0.2pp
|
n/a |
-3.6pp
|
-1.3pp
|
5.1pp
|
|||||||||||||||||
33
Revenues
For the year ended December 31, 2010, net sales decreased compared with the same period in 2009 primarily due to volume declines in the FPEG segment (-6%). Favorable price/mix in the CDG segment
(+2%) was largely offset by unfavorable price/mix in
the GCG segment
(-2%).
For the year ended December 31, 2009, net sales decreased compared with 2008 primarily due to volume declines within all three segments (FPEG: -6%, GCG: -5% and CDG: -3%) driven by lower demand as a result of the global economic slowdown which began in the fourth quarter of 2008 as well as continued secular declines in the FPEG segment. Unfavorable price/mix also impacted sales equally across all three segments (-3 %). Foreign exchange negatively impacted sales equally across all three segments due to a stronger U.S. dollar.
Included in revenues were non-recurring intellectual property licensing agreements in the CDG segment. These licensing agreements contributed $838 million, $435 million and $227 million to revenues in 2010, 2009 and 2008, respectively. The Company expects to secure other new licensing agreements, the timing and amounts of which are difficult to predict. These types of arrangements provide the Company with a return on portions of its R&D investments, and new licensing opportunities are expected to have a continuing positive impact on the results of operations.
Gross Profit
The increase in gross profit margin as a percentage of sales from 2009 to 2010 was primarily driven by manufacturing and other cost reductions within the CDG (+2 pp) and GCG (+1 pp) segments. Also contributing to the increase in gross profit margin was favorable price/mix in the CDG segment (+2 pp), partially offset by unfavorable price/mix in the GCG segment (-1 pp).
Gross profit margin as a percent of sales for 2009 was essentially flat as compared with 2008. Driving the slight increase in gross profit margin were cost improvements (+5 pp), largely driven by ongoing cost reduction efforts within CDG (+4 pp) and FPEG (+1 pp). Largely offsetting these increases were unfavorable price/mix (-4 pp), which impacted all segments, but was most prominent in CDG (-2 pp), and unfavorable foreign exchange (-1 pp).
Included in gross profit were non-recurring intellectual property licensing agreements in the CDG segment. These licensing agreements contributed $838 million, $435 million and $227 million to gross profit for non-recurring agreements in 2010, 2009 and 2008, respectively.
Selling, General and Administrative Expenses
The decrease in consolidated selling, general and administrative expenses (SG&A) from 2009 to 2010 of 2% was attributable to decreases in SG&A in the FPEG segment (-7%) primarily driven by cost reduction actions, partially offset by increases in SG&A in the CDG and GCG segments (5%) primarily due to increased advertising costs.
The decrease in consolidated SG&A expenses from 2008 to 2009 of 19% was primarily the result of company-wide cost reduction actions implemented in 2009 in response to economic conditions.
Research and Development Costs
The decrease in consolidated research and development (R&D) costs from 2009 to 2010 of 10% was primarily driven by the rationalization and refocusing of investments.
The decrease in consolidated R&D costs from 2008 to 2009 of 26% was primarily the result of focused cost reduction efforts.
34
Restructuring Costs, Rationalization and Other
These costs, as well as the restructuring and rationalization-related costs reported in cost of sales, are discussed under the "RESTRUCTURING COSTS, RATIONALIZATION AND OTHER" section.
Other Operating Expenses (Income), Net
The other operating expenses (income), net category includes gains and losses on sales of assets and businesses and certain impairment charges. The amount for 2010 primarily reflects a $626 million goodwill impairment charge related to the FPEG segment. The amount for 2009 primarily reflects a gain of approximately $100 million on the sale of assets of the Company’s organic light emitting diodes (OLED) group, as described further below. The amount for 2008 primarily reflects a $785 million goodwill impairment charge related to the GCG segment.
In November 2009, the Company agreed to terminate its patent infringement litigation with LG Electronics, Inc., LG Electronics USA, Inc., and LG Electronics Mobilecomm USA, Inc., entered into a technology cross license agreement with LG Electronics, Inc. and agreed to sell assets of its OLED group to Global OLED Technology LLC, an entity established by LG Electronics, Inc., LG Display Co., Ltd. and LG Chem, Ltd. As the transactions were entered into in contemplation of one another, in order to reflect the asset sale separately from the licensing transaction, the total consideration was allocated between the asset sale and the licensing transaction based on the estimated fair value of the assets sold. Fair value of the assets sold was estimated using other competitive bids received by the Company. Accordingly, $100 million of the proceeds was allocated to the asset sale. The remaining gross proceeds of $414 million were allocated to the licensing transaction and reported in net sales of the CDG segment for the year ended December 31, 2009.
Interest Expense
The increase in interest expense for 2010 as compared with 2009 was primarily attributable to higher weighted-average effective interest rates on the Company’s outstanding debt, resulting from the refinancing of a portion of the Company’s debt portfolio in the third quarter of 2009 (as discussed below) and first quarter of 2010.
The increase in interest expense in 2009 as compared with 2008 was primarily due to the issuances in the third quarter of 2009 of $300 million aggregate principal amount of 10.5% Senior Secured Notes due 2017 and $400 million aggregate principal amount of 7% Convertible Senior Notes due 2017.
Loss on Early Extinguishment of Debt, Net
On March 5, 2010, the Company issued $500 million of aggregate principal amount of 9.75% senior secured notes due March 1, 2018. The net proceeds of this issuance were used to repurchase all of the $300 million of 10.5% senior secured notes due 2017 previously issued to Kohlberg, Kravis, Roberts & Co. L.P. (the “KKR Notes”) and $200 million of 7.25% senior notes due 2013 (collectively the “Notes”). The Company recognized a net loss of $102 million on the early extinguishment of the Notes in the first quarter of 2010, representing the difference between the carrying values of the Notes and the costs to repurchase. This difference between the carrying values and costs to repurchase was primarily due to the original allocation of the proceeds received from the issuance of the KKR Notes to Additional paid-in-capital for the value of the detachable warrants issued to the holders of the KKR Notes.
Other Income (Charges), Net
The other income (charges), net category primarily includes interest income, income and losses from equity investments, and foreign exchange gains and losses. The decrease in other income (charges), net from 2008 to 2009 was primarily attributable to a decrease in interest income due to lower interest rates and lower cash balances in 2009 as compared with 2008, partially offset by the favorable impact of legal settlements in 2009. The change in other income (charges), net from 2009 to 2010 was not significant.
35
Income Tax Provision
|
(dollars in millions)
|
For the Year Ended
|
|||||||||||
|
December 31,
|
||||||||||||
|
2010
|
2009
|
2008
|
||||||||||
|
Loss from continuing operations before income taxes
|
$ | (561 | ) | $ | (117 | ) | $ | (874 | ) | |||
|
Provision (benefit) for income taxes
|
$ | 114 | $ | 115 | $ | (147 | ) | |||||
|
Effective tax rate
|
(20.3 | )% | (98.3 | )% | 16.8 | % | ||||||
The change in the Company’s effective tax rate from continuing operations for 2010 as compared with 2009 is primarily attributable to: (1) a pre-tax goodwill impairment charge of $626 million that resulted in a tax benefit of only $2 million due to the limited amount of tax deductible goodwill that existed as of December 31, 2010; (2) a benefit associated with the release of deferred tax asset valuation allowances in certain jurisdictions outside of the U.S. during 2010; (3) incremental withholding taxes related to non-recurring licensing agreements entered into during 2010 as compared with 2009; (4) changes to the geographical mix of earnings from operations outside the U.S.; (5) losses generated in the U.S. and in certain jurisdictions outside the U.S. for which no benefit was recognized due to management’s conclusion that it was more likely than not that the tax benefits would not be realized; and (6) changes in audit reserves and settlements.
The change in the Company’s effective tax rate from continuing operations for 2009 as compared with 2008 is primarily attributable to: (1) a benefit recognized upon the receipt in 2008 of the interest portion on an IRS tax refund; (2) a pre-tax goodwill impairment charge of $785 million that resulted in a tax benefit of only $4 million due to a full valuation allowance in the U.S. and limited amount of tax deductible goodwill that existed as of December 31, 2008; (3) losses generated in the U.S. and in certain jurisdictions outside the U.S. for which no benefit was recognized due to management’s conclusion that it was more likely than not that the tax benefits would not be realized; (4) the impact of previously established valuation allowances in jurisdictions with current earnings; (5) the geographical mix of earnings from operations outside the U.S.; (6) withholding taxes related to a non-recurring licensing agreement entered into in 2009; and (7) changes in audit reserves and settlements.
CONSUMER DIGITAL IMAGING GROUP
|
(dollars in millions)
|
For the Year Ended
|
|||||||||||||||||||||||||||||||
|
December 31,
|
||||||||||||||||||||||||||||||||
|
|
2010
|
% of Sales
|
% Change
|
2009
|
% of Sales
|
% Change
|
2008
|
% of Sales
|
||||||||||||||||||||||||
|
Total net sales
|
$ | 2,739 | 5 | % | $ | 2,619 | -15 | % | $ | 3,088 | ||||||||||||||||||||||
|
Cost of sales
|
1,729 | -12 | % | 1,955 | -22 | % | 2,495 | |||||||||||||||||||||||||
|
Gross profit
|
1,010 | 36.9 | % | 52 | % | 664 | 25.4 | % | 12 | % | 593 | 19.2 | % | |||||||||||||||||||
|
Selling, general and administrative expenses
|
531 | 19 | % | 10 | % | 483 | 18 | % | -15 | % | 565 | 18 | % | |||||||||||||||||||
|
Research and development costs
|
148 | 5 | % | 1 | % | 146 | 6 | % | -29 | % | 205 | 7 | % | |||||||||||||||||||
|
Earnings (loss) from continuing operations
before interest expense, other income
(charges), net and income taxes
|
$ | 331 | 12 | % | 846 | % | $ | 35 | 1 | % | 120 | % | $ | (177 | ) | -6 | % | |||||||||||||||
36
|
For the Year Ended
|
||||||||||||||||||||||||
|
December 31,
|
Change vs. 2009
|
|||||||||||||||||||||||
|
2010 Amount
|
Change vs. 2009
|
Volume
|
Price/Mix
|
Foreign Exchange
|
Manufacturing and Other Costs
|
|||||||||||||||||||
|
Total net sales
|
$ | 2,739 | 4.6 | % | -1.0 | % | 6.3 | % | -0.7 | % | n/a | |||||||||||||
|
Gross profit margin
|
36.9 | % |
11.5pp
|
n/a |
5.9pp
|
-0.1pp
|
5.7pp
|
|||||||||||||||||
|
For the Year Ended
|
||||||||||||||||||||||||
|
December 31,
|
Change vs. 2008
|
|||||||||||||||||||||||
|
2009 Amount
|
Change vs. 2008
|
Volume
|
Price/Mix
|
Foreign Exchange
|
Manufacturing and Other Costs
|
|||||||||||||||||||
|
Total net sales
|
$ | 2,619 | -15.2 | % | -10.6 | % | -2.9 | % | -1.7 | % | n/a | |||||||||||||
|
Gross profit margin
|
25.4 | % |
6.2pp
|
n/a |
-7.3pp
|
-1.4pp
|
14.9pp
|
|||||||||||||||||
Revenues
CDG’s 2010 revenue increase as compared with the same period in 2009 was primarily due to an increase in revenues from non-recurring intellectual property licensing agreements (+15%) as noted in more detail below, partially offset by unfavorable price/mix in the other components of
Digital Capture and Devices
due to pricing pressures in the industry (-7%). Volume improvements in
Consumer Inkjet Systems
(+3%) also contributed to the revenue increase which management believes is reflective of how the Company’s value proposition continues to resonate with customers.
Partially offsetting these increases were volume declines in
Retail Systems Solutions
(-4%), primarily due to the expiration of a significant customer contract in 2009.
CDG’s 2009 revenue declines as compared with 2008 reflect the global economic downturn which began in the fourth quarter of 2008. The decrease in revenue was primarily driven by volume declines within
Digital Capture and Devices
(-11%) as a result of weak consumer discretionary spending. Unfavorable price/mix within
Digital Capture and Devices
(-3%) also contributed to the CDG revenue decline, resulting from pricing pressures related to the overall economic conditions as noted above. Partially offsetting these declines was an increase in volumes for
Consumer Inkjet Systems
(+2%
),
which management believes is reflective of favorable consumer response to the Company’s unique value proposition. Unfavorable foreign exchange (-2%) also contributed to the decline.
Included in revenues were non-recurring intellectual property licensing agreements within
Digital Capture and Devices
. These licensing agreements contributed $838 million, $435 million and $227 million to revenues in 2010, 2009 and 2008, respectively.
Gross Profit
The increase in gross profit margin as a percentage of sales from 2009 to 2010 for CDG was primarily attributable to the increase in non-recurring intellectual property licensing revenues (+10 pp) included in price/mix within
Digital Capture and Devices,
as noted in more detail below
.
This was partially offset by unfavorable price/mix in the other components of
Digital Capture and Devices
(-2 pp), largely related to competitive pricing pressures, and by price/mix declines within
Retail Systems Solutions
(-1 pp) primarily due to the expiration of a significant customer contract in 2009. Cost improvements, primarily within
Digital Capture and Devices
(+4 pp) and
Consumer Inkjet Systems
(+2 pp), positively impacted gross profit margin as a percent of sales and were largely the result of supplier cost reductions and improved product life cycle management
.
37
The increase in gross profit margin as a percentage of sales from 2008 to 2009 for CDG was primarily attributable to significantly lower product costs, particularly within
Consumer Inkjet Systems
(+7 pp) as a result of new product platforms, and
Digital Capture and Devices
(+5 pp), resulting from supplier cost reductions and improved product life cycle management
.
Partially offsetting these improvements were unfavorable price/mix (-7 pp), largely attributable to the pricing pressures within
Digital Capture and Devices
as mentioned above, and unfavorable foreign exchange (-1 pp).
Included in gross profit were non-recurring intellectual property licensing agreements within
Digital Capture and Devices
. These licensing agreements contributed $838 million, $435 million and $227 million to gross profit in 2010, 2009 and 2008, respectively.
Selling, General and Administrative Expenses
The increase in SG&A expenses from 2009 to 2010 of 10% for CDG was primarily driven by increased advertising expense.
The decrease in SG&A expenses from 2008 to 2009 of 15% was primarily driven by focused cost reduction actions (-5%) implemented in 2009 to respond to the current economic conditions.
Research and Development Costs
The increase in R&D costs from 2009 to 2010 of 1% for CDG was not significant.
The decrease in R&D costs from 2008 to 2009 of 29% was primarily attributable to lower spending related to
Consumer Inkjet Systems
(-10%), resulting from the movement of product offerings from the development phase into the market introduction and growth phases, as well as portfolio rationalization within
Digital Capture and Devices
(-15%).
GRAPHIC COMMUNICATIONS GROUP
|
(dollars in millions)
|
For the Year Ended
|
|||||||||||||||||||||||||||||||
|
December 31,
|
||||||||||||||||||||||||||||||||
|
|
2010
|
% of Sales
|
% Change
|
2009
|
% of Sales
|
% Change
|
2008
|
% of Sales
|
||||||||||||||||||||||||
|
Total net sales
|
$ | 2,681 | -2 | % | $ | 2,726 | -18 | % | $ | 3,334 | ||||||||||||||||||||||
|
Cost of sales
|
2,012 | -3 | % | 2,073 | -15 | % | 2,445 | |||||||||||||||||||||||||
|
Gross profit
|
669 | 25.0 | % | 2 | % | 653 | 24.0 | % | -27 | % | 889 | 26.7 | % | |||||||||||||||||||
|
Selling, general and administrative expenses
|
543 | 20 | % | 4 | % | 524 | 19 | % | -18 | % | 637 | 19 | % | |||||||||||||||||||
|
Research and development costs
|
152 | 6 | % | -11 | % | 171 | 6 | % | -23 | % | 221 | 7 | % | |||||||||||||||||||
|
(Loss) earnings from continuing operations
before interest expense, other income
(charges), net and income taxes
|
$ | (26 | ) | -1 | % | 38 | % | $ | (42 | ) | -2 | % | -235 | % | $ | 31 | 1 | % | ||||||||||||||
38
|
For the Year Ended
|
||||||||||||||||||||||||
|
December 31,
|
Change vs. 2009
|
|||||||||||||||||||||||
|
2010 Amount
|
Change vs. 2009
|
Volume
|
Price/Mix
|
Foreign Exchange
|
Manufacturing and Other Costs
|
|||||||||||||||||||
|
Total net sales
|
$ | 2,681 | -1.7 | % | 3.2 | % | -4.7 | % | -0.2 | % | n/a | |||||||||||||
|
Gross profit margin
|
25.0 | % |
1.0pp
|
n/a |
-2.7pp
|
0.1pp
|
3.6pp
|
|||||||||||||||||
|
For the Year Ended
|
||||||||||||||||||||||||
|
December 31,
|
Change vs. 2008
|
|||||||||||||||||||||||
|
2009 Amount
|
Change vs. 2008
|
Volume
|
Price/Mix
|
Foreign Exchange
|
Manufacturing and Other Costs
|
|||||||||||||||||||
|
Total net sales
|
$ | 2,726 | -18.2 | % | -14.5 | % | -1.7 | % | -2.0 | % | n/a | |||||||||||||
|
Gross profit margin
|
24.0 | % |
-2.7pp
|
n/a |
-1.1pp
|
-0.8pp
|
-0.8pp
|
|||||||||||||||||
Revenues
The decrease in GCG net sales from 2009 to 2010 was primarily due to unfavorable price/mix in
Prepress Solutions
(-4%), partially offset by volume improvements across all SPGs (+3%). The unfavorable price/mix primarily reflects competitive pricing and overcapacity within the printing industry. The volume improvements were largely driven by growth in digital plates and computer-to-plate equipment within
Prepress Solutions
; commercial inkjet equipment, including PROSPER S10 imprinting systems within
Digital Printing Solutions
; and document imaging scanners, including the introduction of the new Kodak i4000 Series Scanners within
Business Services and Solutions
.
The decrease in GCG net sales from 2008 to 2009 reflected the impact of ongoing global economic uncertainties, which depressed global print demand and associated capital investments in the printing industry. The revenue decreases were primarily driven by volume declines in
Prepress Solutions
(-9%), volume declines in
Business Services and Solutions
(-4%), and unfavorable price/mix in
Prepress Solutions
(-2%), all related to the overall economic environment mentioned above. Also contributing to the decrease was unfavorable foreign exchange in the segment (-2%).
Gross Profit
The increase in gross profit margin as a percentage of sales from 2009 to 2010 for GCG was primarily due to reduced manufacturing cost, including aluminum cost (+4 pp). Partially offsetting this reduction in cost was unfavorable price/mix within
Prepress Solutions
(-3 pp) due to the reasons outlined in the Revenues discussion above.
The decrease in gross profit margin as a percent of sales from 2008 to 2009 was attributable to unfavorable price/mix within
Digital Printing Solutions
(-1 pp), higher manufacturing and other costs within
Prepress Solutions
(-1 pp), and unfavorable foreign exchange (-1 pp). The unfavorable price/mix in
Digital Printing Solutions
was primarily due to constrained demand driven by increased price pressures in the industry as capital investments continued to be depressed. As a result of the decline in global print demand, the Company reduced production levels, which resulted in lower levels of factory cost absorption and lower utilization of service personnel. This impact to manufacturing costs within
Prepress Solutions
(-2 pp) was partially offset by reduced aluminum commodity costs (+1 pp).
39
Selling, General and Administrative Expenses
The increase in SG&A expenses from 2009 to 2010 of 4% for GCG was primarily attributable to increased advertising costs.
The decrease in SG&A expenses from 2008 to 2009 of 18% was primarily attributable to focused cost reduction actions implemented in 2009 in response to economic conditions.
Research and Development Costs
The decreases in R&D costs for GCG from 2009 to 2010 and from 2008 to 2009 of 11% and 23%, respectively, were largely driven by the rationalization and refocusing of investments.
FILM, PHOTOFINISHING AND ENTERTAINMENT GROUP
|
(dollars in millions)
|
For the Year Ended
|
|||||||||||||||||||||||||||||||
|
December 31,
|
||||||||||||||||||||||||||||||||
|
|
2010
|
% of Sales
|
% Change
|
2009
|
% of Sales
|
% Change
|
2008
|
% of Sales
|
||||||||||||||||||||||||
|
Total net sales
|
$ | 1,767 | -22 | % | $ | 2,257 | -24 | % | $ | 2,987 | ||||||||||||||||||||||
|
Cost of sales
|
1,481 | -17 | % | 1,775 | -24 | % | 2,335 | |||||||||||||||||||||||||
|
Gross profit
|
286 | 16.2 | % | -41 | % | 482 | 21.4 | % | -26 | % | 652 | 21.8 | % | |||||||||||||||||||
|
Selling, general and administrative expenses
|
203 | 11 | % | -30 | % | 290 | 13 | % | -29 | % | 407 | 14 | % | |||||||||||||||||||
|
Research and development costs
|
19 | 1 | % | -42 | % | 33 | 1 | % | -33 | % | 49 | 2 | % | |||||||||||||||||||
|
Earnings from continuing operations before
interest expense, other income (charges),
net and income taxes
|
$ | 64 | 4 | % | -60 | % | $ | 159 | 7 | % | -19 | % | $ | 196 | 7 | % | ||||||||||||||||
|
For the Year Ended
|
||||||||||||||||||||||||
|
December 31,
|
Change vs. 2009
|
|||||||||||||||||||||||
|
2010 Amount
|
Change vs. 2009
|
Volume
|
Price/Mix
|
Foreign Exchange
|
Manufacturing and Other Costs
|
|||||||||||||||||||
|
Total net sales
|
$ | 1,767 | -21.7 | % | -20.2 | % | -1.5 | % | 0.0 | % | n/a | |||||||||||||
|
Gross profit margin
|
16.2 | % |
-5.2pp
|
n/a |
-1.2pp
|
0.3pp
|
-4.3pp
|
|||||||||||||||||
|
For the Year Ended
|
||||||||||||||||||||||||
|
December 31,
|
Change vs. 2008
|
|||||||||||||||||||||||
|
2009 Amount
|
Change vs. 2008
|
Volume
|
Price/Mix
|
Foreign Exchange
|
Manufacturing and Other Costs
|
|||||||||||||||||||
|
Total net sales
|
$ | 2,257 | -24.4 | % | -18.7 | % | -2.9 | % | -2.8 | % | n/a | |||||||||||||
|
Gross profit margin
|
21.4 | % |
-0.4pp
|
n/a |
-2.4pp
|
-1.9pp
|
3.9pp
|
|||||||||||||||||
40
Revenues
The decrease in net sales from 2009 to 2010 for FPEG was primarily driven by volume declines across all SPGs within the segment. These volume declines in Traditional Photofinishing (-5%) and Film Capture (-3%) were primarily driven by secular declines in the industry. The volume declines for Entertainment Imaging (-7%) were also largely attributable to secular declines, including the effects of digital substitution.
The decrease in net sales from 2008 to 2009 was primarily attributable to lower volumes across all SPGs within the segment. The lower volumes for Film Capture (-5%) were primarily driven by secular declines in the traditional film industry. Lower volumes for Traditional Photofinishing (-7%) were largely driven by the previously announced closure of the Qualex central lab operations in the U.S. and Canada at the end of March 2009. Volume declines within Entertainment Imaging (-3%) were due to (1) the uncertainty around the Screen Actors’ Guild contract, which expired in June 2008 and was not replaced until June 2009, (2) the impact of the current economic climate on film makers, resulting in lower film production and the use of digital technology, as expected, and (3) industry shifts in film release strategies and distribution.
Gross Profit
The decrease in FPEG gross profit margin as a percentage of sales from 2009 to 2010 was primarily driven by increased silver and other commodity costs (-4 pp).
The decrease in gross profit margin as a percentage of sales from 2008 to 2009 was primarily driven by unfavorable price/mix within
Entertainment Imaging
(-2 pp)
,
largely as a result of competitive pricing in the market, and unfavorable foreign exchange (-2 pp) across all SPGs. This was partially offset by lower benefit costs (+1 pp) as a result of amendments made in the third quarter of 2008 to certain of the Company’s U.S. postemployment benefit plans, as well as lower raw material costs (+2 pp)
.
Selling, General and Administrative Expenses
The decline in SG&A expenses from 2009 to 2010 of 30% for FPEG was primarily attributable to focused cost reduction actions completed in 2009 that resulted in lower SG&A expenses in 2010.
The decline in SG&A expenses from 2008 to 2009 of 29% was primarily attributable to focused cost reduction actions.
|
Research and Development Costs
|
The decrease in R&D costs from 2009 to 2010 of 42% for FPEG was primarily due to focused cost reductions.
The decrease in R&D costs from 2008 to 2009 of 33% was primarily due to focused cost reductions.
RESULTS OF OPERATIONS – DISCONTINUED OPERATIONS
The loss from discontinued operations in 2010 was primarily due to legal costs related to the 2008 tax refund referred to below.
Earnings from discontinued operations in 2009 were primarily driven by the reversal of certain foreign tax reserves which had been recorded in conjunction with the divestiture of the Health Group in 2007.
Earnings from discontinued operations in 2008 were primarily driven by a tax refund that the Company received from the U.S. Internal Revenue Service. The refund was related to the audit of certain claims filed for tax years 1993-1998. A portion of the refund related to past federal income taxes paid in relation to the 1994 sale of a subsidiary, Sterling Winthrop Inc., which was reported in discontinued operations. Refer to Note 15, “Income Taxes,” in the Notes to Financial Statements for further discussion of the tax refund.
For a detailed discussion of the components of discontinued operations, refer to Note 22, “Discontinued Operations,” in the Notes to Financial Statements.
41
EXTRAORDINARY GAIN
The terms of the purchase agreement of the 2004 acquisition of NexPress Solutions LLC called for additional consideration to be paid by the Company if sales of certain products exceeded a stated minimum number of units sold during a five-year period following the close of the transaction. In May 2009, the earn-out period lapsed with no additional consideration required to be paid by the Company. Negative goodwill, representing the contingent consideration obligation of $17 million, was therefore reduced to zero. The reversal of negative goodwill reduced Property, plant and equipment, net by $2 million and Research and development expense by $7 million and resulted in an extraordinary gain of $6 million, net of tax, during the year ended December 31, 2009.
NET LOSS ATTRIBUTABLE TO EASTMAN KODAK COMPANY
The Company’s consolidated net loss attributable to Eastman Kodak Company for 2010 was $687 million, or a loss of $2.56 per basic and diluted share.
The Company’s consolidated net loss attributable to Eastman Kodak Company for 2009 was $210 million, or a loss of $0.78 per basic and diluted share.
The Company’s consolidated net loss attributable to Eastman Kodak Company for 2008 of $442 million, or a loss of $1.57 per basic and diluted share,
These changes in net loss are attributable to the reasons outlined above.
RESTRUCTURING COSTS, RATIONALIZATION AND OTHER
2010
The Company recognizes the need to continually rationalize its workforce and streamline its operations in the face of ongoing business and economic changes. Charges for restructuring and ongoing rationalization initiatives are recorded in the period in which the Company commits to a formalized restructuring or ongoing rationalization plan, or executes the specific actions contemplated by the plans and all criteria for liability recognition under the applicable accounting guidance have been met.
The charges of $78 million recorded in 2010 included $6 million of charges for accelerated depreciation and $2 million for inventory write-downs, which were reported in Cost of sales in the accompanying Consolidated Statement of Operations for the year ended December 31, 2010. The remaining $70 million, including $49 million of severance costs, $14 million of exit costs, and $7 million of long-lived asset impairments, were reported in Restructuring costs, rationalization and other in the accompanying Consolidated Statement of Operations for the year ended December 31, 2010. Severance and exit costs reserves require the outlay of cash, while long-lived asset impairments, accelerated depreciation and inventory write-downs represent non-cash items. The Company expects to utilize the majority of the December 31, 2010 accrual balance in 2011.
During the year ended December 31, 2010, the Company made cash payments related to restructuring and rationalization of approximately $88 million.
The charges of $78 million recorded in the year ended December 31, 2010 included $38 million applicable to FPEG, $15 million applicable to GCG, $3 million applicable to CDG, and $22 million that was applicable to manufacturing/service, research and development, and administrative functions, which are shared across all segments.
The restructuring actions implemented in the year 2010 are expected to generate future annual cash savings of approximately $62 million. These savings are expected to reduce future Cost of sales, SG&A and R&D expenses by $35 million, $25 million, and $2 million, respectively. The Company began realizing these savings in the first quarter of 2010, and expects the majority of the savings to be realized by the second half of 2011 as most of the actions and severance payouts are completed.
42
2009
On December 17, 2008, the Company committed to a plan to implement a targeted cost reduction program (the 2009 Program) to more appropriately size the organization as a result of the current economic environment. The program involved rationalizing selling, administrative, research and development, supply chain and other business resources in certain areas and consolidating certain facilities. The execution of the 2009 Program began in January 2009.
For the year ended December 31, 2009, the
Company incurred restructuring and rationalization charges, net of reversals, of $258 million. The $258 million of restructuring and rationalization charges, net of reversals, included $22 million of costs related to accelerated depreciation, and $10 million of charges for inventory write-downs, which were reported in Cost of sales in the accompanying Consolidated Statement of Operations. The remaining costs incurred, net of reversals, of $226 million were reported as Restructuring costs, rationalization and other in the accompanying Consolidated Statement of Operations for the year ended December 31, 2009.
2008
For the year ended December 31, 2008, the Company incurred restructuring and rationalization charges, net of reversals, of $149 million. The $149 million of restructuring and rationalization charges, net of reversals, included $6 million of costs related to accelerated depreciation, and $3 million of charges for inventory write-downs, which were reported in Cost of sales in the accompanying Consolidated Statement of Operations. The remaining costs incurred, net of reversals, of $140 million were reported as Restructuring costs, rationalization and other in the accompanying Consolidated Statement of Operations for the year ended December 31, 2008.
LIQUIDITY AND CAPITAL RESOURCES
2010
Cash Flow Activity
|
For the Year Ended
|
||||||||||||
|
(in millions)
|
December 31,
|
|||||||||||
|
2010
|
2009
|
Change
|
||||||||||
|
Cash flows from operating activities:
|
||||||||||||
|
Net cash used in operating activities
|
$ | (219 | ) | $ | (136 | ) | $ | (83 | ) | |||
|
Cash flows from investing activities:
|
||||||||||||
|
Net cash used in investing activities
|
(112 | ) | (22 | ) | $ | (90 | ) | |||||
|
Cash flows from financing activities:
|
||||||||||||
|
Net cash (used in) provided by financing activities
|
(74 | ) | 33 | $ | (107 | ) | ||||||
|
Effect of exchange rate changes on cash
|
5 | 4 | 1 | |||||||||
|
Net decrease in cash and cash equivalents
|
$ | (400 | ) | $ | (121 | ) | $ | (279 | ) | |||
Operating Activities
Net cash used in operating activities increased $83 million for the year ended December 31, 2010 as compared with the prior year due to the combination of working capital changes and use of cash for settlement of other liabilities in the current year using more cash than those factors in the prior year.
Cash received in 2010 related to non-recurring licensing agreements, net of applicable withholding taxes, of $629 million, was $7 million higher than cash received in 2009 related to non-recurring licensing agreements of $622 million.
43
Investing Activities
Net cash used in investing activities increased $90 million for the year ended December 31, 2010 as compared with 2009 due primarily to a decline of $124 million in proceeds received from sales of assets and businesses. Approximately $100 million of this decline is due to proceeds received from the sale of assets of the Company’s OLED group in the prior year quarter. Partially offsetting this decline were a decrease in cash used for acquisitions of $17 million and a reduction in funding of restricted cash of $13 million.
Financing Activities
Net cash used in financing activities increased $107 million for the year ended December 31, 2010 as compared with 2009 due to lower proceeds received from borrowings in the current year, primarily due to the Company’s debt refinancing in the fourth quarter of 2009 for which it received approximately $100 million of net proceeds
. Partially offsetting this decrease was a reduction of debt issuance costs of $18 million, also primarily related to the fourth quarter 2009 debt refinancing.
Sources of Liquidity
The Company believes that its current cash balance, combined with cash flows from operating activities, borrowings, and proceeds from sales of businesses and assets, will be sufficient to meet its anticipated needs in 2011, including working capital, capital investments, scheduled debt repayments, restructuring payments, and employee benefit plan payments or required plan contributions. In addition to the sources of liquidity noted, the Company has financing arrangements, as described in more detail below under "Credit Facilities and Other Banking Arrangements," to compensate for unplanned timing differences between required expenditures and available cash or for unforeseen shortfalls in cash flows. The Company has not found it necessary to borrow against its revolving asset-based lending facility.
The Company does however face an uncertain business environment, particularly in North America and Europe, and a number of substantial challenges, including rapidly rising commodity costs and aggressive price competition, and short-term uncertainty relating to the Company’s intellectual property licensing activities with Apple, Inc. and Research in Motion Ltd. pending the outcome of the infringement litigation against these companies before the International Trade Commission. The Company is actively addressing these challenges through a variety of means, including hedge strategies and indexing of new contracts to commodity pricing, and the introduction of differentiated products.
The Company’s liquidity requirements may make it necessary to incur additional debt. Under the Company’s borrowing arrangements, additional debt can be incurred to support its ongoing operational needs including additional permitted senior debt of up to $200 million aggregate principal amount. A substantial portion of the Company’s assets are subject to liens securing indebtedness, which limits its ability to pledge remaining assets as security for additional secured indebtedness. In light of the above and the current activity in the capital markets, the Company is considering its alternatives.
Liens on assets under the Company’s borrowing arrangements are not expected to affect the Company’s strategy of divesting non-core assets.
Refer to Note 8, "Short-Term Borrowings and Long-Term Debt," in the Notes to Financial Statements for further discussion of sources of liquidity, presentation of long-term debt, related maturities and interest rates as of December 31, 2010 and 2009.
Short-Term Borrowings
As of December 31, 2010, the Company and its subsidiaries, on a consolidated basis, maintained $429 million in committed bank lines of credit, which include $410 million under the Amended Credit Agreement and $19 million of other committed bank lines of credit, and $131 million in uncommitted bank lines of credit to ensure continued financial support through letters of credit, bank guarantees, and similar arrangements, and short-term borrowing capacity.
Issuance of Senior Secured Notes due 2018
On March 5, 2010, the Company issued $500 million of aggregate principal amount of 9.75% senior secured notes due March 1, 2018 (the “2018 Senior Secured Notes”). The Company will pay interest at an annual rate of 9.75% of the principal amount at issuance, payable semi-annually in arrears on March 1 and September 1 of each year, beginning on September 1, 2010.
Upon issuance of the 2018 Senior Secured Notes, the Company received net proceeds of approximately $490 million ($500 million aggregate principal less $10 million stated discount). The proceeds were used to repurchase
all of the 10.5% Senior Secured Notes due 2017 and to fund the tender of $200 million of the 7.25% Senior Notes due 2013.
In connection with the 2018 Senior Secured Notes, the Company and the subsidiary guarantors entered into an indenture, dated as of March 5, 2010, with Bank of New York Mellon as trustee and collateral agent (the “Indenture”).
The Indenture contains covenants limiting, among other things, the Company’s ability and the ability of the Company’s restricted subsidiaries (as defined in the Indenture) to (subject to certain exceptions and qualifications): incur additional debt or issue certain preferred stock; pay dividends or make distributions in respect of capital stock or make other restricted payments; make principal payments on, or purchase or redeem subordinated indebtedness prior to any scheduled principal payment or maturity; make certain investments; sell certain assets; create liens on assets; consolidate, merge, sell or otherwise dispose of all or substantially all of the Company’s and its subsidiaries’ assets; enter into certain transactions with affiliates; and designate the Company’s subsidiaries as unrestricted subsidiaries. The Company was in compliance with these covenants as of December 31, 2010.
Refer to Note 8, “Short-Term Borrowings and Long-Term Debt,” in the Notes to Financial Statements for redemption provisions, guarantees, events of default, and subordination and ranking of the 2018 Senior Secured Notes.
Repurchase of Senior Secured Notes due 2017
On February 24, 2010, the Company entered into an agreement with affiliates of Kohlberg, Kravis, Roberts & Co. L.P. (“KKR”) to repurchase all $300 million aggregate principal amount of the Company’s 10.5% Senior Secured Notes due 2017 previously issued to KKR (the “KKR Notes”).
On March 5, 2010, the Company completed the private placement of the 2018 Senior Secured Notes and the repurchase of the KKR Notes. KKR received cash equal to 100% of the principal amount plus accrued and unpaid interest. The repurchase of the KKR Notes resulted in a loss on early debt extinguishment of $111 million, which is reported in Loss on early extinguishment of debt, net in the Consolidated Statement of Operations for the year ended December 31, 2010. This loss was primarily the result of the principal repayment of $300 million exceeding the carrying value of the debt of approximately $195 million as of the repurchase date.
Repurchase of Senior Notes due 2013
On March 10, 2010, the Company accepted for purchase $200 million aggregate principal amount of Senior Notes due 2013 (the “2013 Notes”) pursuant to the terms of a tender offer that commenced on February 3, 2010. Holders who validly tendered their 2013 Notes received cash equal to approximately 95% of the principal amount of the 2013 Notes accepted in the tender offer plus accrued and unpaid interest.
The repurchase of the 2013 Notes resulted in a gain on early debt extinguishment of approximately $9 million, reported in Loss on early extinguishment of debt, net in the Consolidated Statement of Operations for the year ended December 31, 2010. The gain was a result of the principal repayment of approximately $190 million being less than the carrying value of the repurchased debt of $200 million. $300 million of the 2013 Notes remain outstanding as of December 31, 2010.
Credit Facilities and Other Banking Arrangements
The Company has a revolving asset-based lending facility (the “Amended Credit Agreement”) that provides for a maximum borrowing availability of up to $500 million. On October 18, 2010, non-extending lender commitments expired capping the Company’s borrowing limit to the $410 million of extending lender commitments as of that date. The Company may add additional lender commitments to the Amended Credit Agreement up to the maximum borrowing availability. The termination date of the Amended Credit Agreement is March 31, 2012. Advances under the Amended Credit Agreement are available based on the Company’s respective borrowing base from time to time. The borrowing base is calculated based on designated percentages of eligible accounts receivable, inventory, machinery and equipment and, once mortgages are recorded, certain real property, subject to applicable reserves. As of December 31, 2010, based on this borrowing base calculation and after deducting the face amount of letters of credit outstanding of $122 million and $90 million of collateral to secure other banking arrangements, the Company had $192 million available to borrow under the amended Credit Agreement. As of December 31, 2010,
44
the Company had no debt for borrowed money outstanding under the Amended Credit Agreement.
Under the terms of the Amended Credit Agreement, the Company has agreed to certain affirmative and negative covenants customary in similar asset-based lending facilities. In the event the Company’s excess availability under the borrowing base formula under the Amended Credit Agreement falls below $100 million for three consecutive business days, among other things, the Company must maintain a fixed charge coverage ratio of not less than 1.1 to 1.0 until the excess availability is greater than $100 million for 30 consecutive days. For the year ended December 31, 2010, excess availability was greater than $100 million. The Company is also required to maintain cash and cash equivalents in the U.S. of at least $250 million. The negative covenants limit, under certain circumstances, among other things, the Company’s ability to incur additional debt or liens, make certain investments, make shareholder distributions or prepay debt, except as permitted under the terms of the Amended Credit Agreement. The Company was in compliance with all covenants under the Amended Credit Agreement as of December 31, 2010.
In addition to the Amended Credit Agreement, the Company has other committed and uncommitted lines of credit as of December 31, 2010 totaling $19 million and $131 million, respectively. These lines primarily support operational and borrowing needs of the Company’s subsidiaries, which include term loans, overdraft coverage, revolving credit lines, letters of credit, bank guarantees and vendor financing programs. Interest rates and other terms of borrowing under these lines of credit vary from country to country, depending on local market conditions. As of December 31, 2010, usage under these lines was approximately $51 million, all of which were supporting non-debt related obligations.
In addition to the lines of credit noted above, there were bank guarantees and letters of credit of $18 million and surety bonds of $23 million outstanding under other banking arrangements primarily to ensure payment of possible casualty and workers’ compensation claims, environmental liabilities, legal contingencies, rental payments, and to support various customs and trade activities.
Refer to Note 8, “Short-Term Borrowings and Long-Term Debt,” in the Notes to Financial Statements for additional information about the Company’s credit facilities and other banking arrangements.
Credit Quality
Moody's and Standard & Poor’s (“S&P”) ratings for the Company, including their outlooks, as of the filing date of this Form 10-K are as follows:
|
Senior
|
Most
|
||||
|
Corporate
|
Secured
|
Unsecured
|
Recent
|
||
|
Rating
|
Rating
|
Rating
|
Outlook
|
Update
|
|
|
Moody's
|
B3
|
Ba3
|
Caa1
|
Stable
|
February 24, 2010
|
|
S&P
|
B-
|
B-
|
CCC
|
Negative
|
January 26, 2011
|
On January 26, 2011, S&P placed its B- rating on the Company’s Corporate Rating and all related issue-level ratings, on CreditWatch with negative implications.
On February 24, 2010, Moody’s issued a rating of Ba3 on the Company’s $500 million 9.75% Senior Secured Notes due 2018.
The Company does not have any rating downgrade triggers that would accelerate the maturity dates of its debt. However, the Company could be required to increase the dollar amount of its letters of credit or provide other financial support up to an additional $10 million at the current credit ratings. As of the filing date of this Form 10-K, the Company has not been requested to materially increase its letters of credit or other financial support. Downgrades in the Company’s credit rating or disruptions in the capital markets could impact borrowing costs and the nature of its funding alternatives.
45
Contractual Obligations
The impact that contractual obligations are expected to have on the Company's cash flow in future periods is as follows:
|
As of December 31, 2010
|
||||||||||||||||||||||||||||
|
(in millions)
|
Total
|
2011
|
2012
|
2013
|
2014
|
2015
|
2016 | + | ||||||||||||||||||||
|
Long-term debt (1)
|
$ | 1,363 | $ | 50 | $ | 50 | $ | 350 | $ | - | $ | - | $ | 913 | ||||||||||||||
|
Interest payments on debt
|
600 | 100 | 100 | 97 | 78 | 78 | 147 | |||||||||||||||||||||
|
Operating lease obligations
|
292 | 75 | 66 | 45 | 27 | 21 | 58 | |||||||||||||||||||||
|
Purchase obligations (2)
|
717 | 340 | 271 | 40 | 18 | 16 | 32 | |||||||||||||||||||||
|
Total (3) (4) (5) (6)
|
$ | 2,972 | $ | 565 | $ | 487 | $ | 532 | $ | 123 | $ | 115 | $ | 1,150 | ||||||||||||||
|
(1)
|
Represents the maturity values of the Company's long-term debt obligations. See Note 8, "Short-Term Borrowings and Long-Term Debt," in the Notes to Financial Statements.
|
|
(2)
|
Purchase obligations include agreements related to raw materials, supplies, production and administrative services, as well as marketing and advertising, that are enforceable and legally binding on the Company and that specify all significant terms, including: fixed or minimum quantities to be purchased; fixed, minimum or variable price provisions; and the approximate timing of the transaction. Purchase obligations exclude agreements that are cancelable without penalty. The terms of these agreements cover the next one to eleven years.
|
|
(3)
|
Due to uncertainty regarding the completion of tax audits and possible outcomes, the remaining estimate of the timing of payments related to uncertain tax positions and interest cannot be made. See Note 15, “Income Taxes,” in the Notes to Financial Statements for additional information regarding the Company’s uncertain tax positions.
|
|
(4)
|
Kodak Limited, a wholly owned subsidiary of the Company, has agreed with the Trustees of the Kodak Pension Plan of the United Kingdom (the “Plan” or “KPP”) to make certain contributions to the Plan. Under the terms of this agreement, Kodak Limited is obligated to pay a minimum amount of $50 million to the KPP in each of the years 2011 through 2014, and a minimum amount of $90 million to the KPP in each of the years 2015 through 2022. The payment amounts for the years 2015 through 2022 could be lower, and the payment amounts for 2011 through 2022 could be higher by up to $5 million per year, based on the exchange rate between the U.S. dollar and British pound. The minimum amounts do not include certain potential contributions which could be required if Kodak Limited received a cash tax benefit as a result of the minimum contributed amount. These amounts of future contributions have not been included in the table above, as in total they are dependent on the funded status of the KPP as it fluctuates over the term of the agreement.
|
|
(5)
|
In addition to the pension contributions related to the KPP noted in (4) above, funding requirements for the Company's other major defined benefit retirement plans and other postretirement benefit plans have not been determined, therefore, they have not been included. In 2010, the Company made contributions to its major defined benefit retirement plans and benefit payments for its other postretirement benefit plans including the KPP of $112 million ($22 million relating to its U.S. defined benefit plans) and $159 million ($154 million relating to its U.S. other postretirement benefits plan), respectively. The Company expects to contribute approximately $110 million ($21 million relating to its U.S. defined benefit plans) and $133 million ($127 million relating to its U.S. other postretirement benefits plan), respectively, to its defined benefit plans and other postretirement benefit plans in 2011, including KPP contributions noted in (4) above.
|
|
(6)
|
Because their future cash outflows are uncertain, the other long-term liabilities presented in Note 9, “Other Long-Term Liabilities,” in the Notes to Financial Statements are excluded from this table.
|
46
Off-Balance Sheet Arrangements
The Company guarantees debt and other obligations of certain customers. The debt and other obligations are primarily due to banks and leasing companies in connection with financing of customers' purchases of equipment and product from the Company. At December 31, 2010, the maximum potential amount of future payments (undiscounted) that the Company could be required to make under these customer-related guarantees was $47 million and the carrying amount of the liability related to these customer guarantees was not material.
The customer financing agreements and related guarantees, which mature between 2011 and 2016, typically have a term of 90 days for product and short-term equipment financing arrangements, and up to five years for long-term equipment financing arrangements. These guarantees would require payment from the Company only in the event of default on payment by the respective debtor. In some cases, particularly for guarantees related to equipment financing, the Company has collateral or recourse provisions to recover and sell the equipment to reduce any losses that might be incurred in connection with the guarantees. However, any proceeds received from the liquidation of these assets may not cover the maximum potential loss under these guarantees.
Eastman Kodak Company (“EKC”) also guarantees potential indebtedness to banks and other third parties for some of its consolidated subsidiaries. The maximum amount guaranteed is $261 million, and the outstanding amount for those guarantees is $238 million. Of this outstanding amount, $109 million is recorded within Short-term borrowings and current portion of long-term debt, and Long-term debt, net of current portion. Additionally $12 million is recorded within Other current liabilities and Other long-term liabilities. The remaining $117 million of outstanding guarantees represent parent guarantees providing financial assurance to third parties that the Company’s subsidiaries will fulfill their future performance or financial obligations under various contracts, and do not represent recorded liabilities. These guarantees expire in 2011 through 2019. Pursuant to the terms of the Company's Amended Credit Agreement, obligations of the Borrowers to the Lenders under the Amended Credit Agreement, as well as secured agreements in an amount not to exceed $100 million, are guaranteed by the Company and the Company’s U.S. subsidiaries and included in the above amounts. As of December 31, 2010, these secured agreements totaled $90 million.
During the fourth quarter of 2007, EKC issued a guarantee to Kodak Limited (the “Subsidiary”) and the Trustees (the “Trustees”) of the Kodak Pension Plan of the United Kingdom (the “Plan”). Under that arrangement, EKC guaranteed to the Subsidiary and the Trustees the ability of the Subsidiary, only to the extent it becomes necessary to do so, to (1) make contributions to the Plan to ensure sufficient assets exist to make plan benefit payments, and (2) make contributions to the Plan such that it will achieve full funded status by the funding valuation for the period ending December 31, 2015. In October 2010, the 2007 guarantee was replaced by a new guarantee from EKC to the Subsidiary and the Trustees. The new guarantee continues to guarantee the Subsidiary’s ability to make contributions as set forth in the 2007 guarantee but extends the full funding date to December 31, 2022. The new guarantee expires (a) upon the conclusion of the funding valuation for the period ending December 31, 2022 if the Plan achieves full funded status or on payment of the balance if the Plan is underfunded by no more than 60 million British pounds by that date, (b) earlier in the event that the Plan achieves full funded status for two consecutive funding valuation cycles which are typically performed at least every three years, or (c) June 30, 2024 on payment of the balance in the event that the Plan is underfunded by more than 60 million British pounds upon conclusion of the funding valuation for the period ending December 31, 2022. The amount of potential future contributions is dependent on the funding status of the Plan as it fluctuates over the term of the guarantee and the United Kingdom Pension Regulator’s approval of a funding plan agreed to by the Subsidiary and the Trustees to close the funding gap identified by the Plan’s most recent local statutory funding valuation agreed to in March 2009. The funded status of the Plan (calculated in accordance with U.S. GAAP) is included in Pension and other postretirement liabilities presented in the Consolidated Statement of Financial Position.
The Company issues indemnifications in certain instances when it sells businesses and real estate, and in the ordinary course of business with its customers, suppliers, service providers and business partners. Further, the Company indemnifies its directors and
47
officers who are, or were, serving at the Company's request in such capacities. Historically, costs incurred to settle claims related to these indemnifications have not been material to the Company’s financial position, results of operations or cash flows. Additionally, the fair value of the indemnifications that the Company issued during the year ended December 31, 2010 was not material to the Company’s financial position, results of operations or cash flows.
2009
Cash Flow Activity
|
For the Year Ended
|
||||||||||||
|
(in millions)
|
December 31,
|
|||||||||||
|
2009
|
2008
|
Change
|
||||||||||
|
Cash flows from operating activities:
|
||||||||||||
|
Net cash used in continuing operations
|
$ | (136 | ) | $ | (128 | ) | $ | (8 | ) | |||
|
Net cash provided by discontinued operations
|
- | 296 | (296 | ) | ||||||||
|
Net cash (used in) provided by operating activities
|
(136 | ) | 168 | (304 | ) | |||||||
|
Cash flows from investing activities:
|
||||||||||||
|
Net cash used in investing activities
|
(22 | ) | (188 | ) | 166 | |||||||
|
Cash flows from financing activities:
|
||||||||||||
|
Net cash provided by (used in) financing activities
|
33 | (746 | ) | 779 | ||||||||
|
Effect of exchange rate changes on cash
|
4 | (36 | ) | 40 | ||||||||
|
Net decrease in cash and cash equivalents
|
$ | (121 | ) | $ | (802 | ) | $ | 681 | ||||
Operating Activities
Net cash used in continuing operations from operating activities increased $8 million for the year ended December 31, 2009 as compared with the prior year. Cash received in 2009 related to non-recurring licensing agreements, net of applicable withholding taxes, of $622 million, was $472 million higher than cash received in 2008 related to a non-recurring licensing agreement of $150 million. Additionally, cash expended in 2008 for 2007 bonus programs of $95 million had no comparable amount paid in 2009 for 2008 bonus programs. These benefits to cash flows from operating activities for 2009 were partially offset by the receipt of the interest portion of an IRS tax refund in 2008 of $275 million, with no comparable receipt in 2009. The combination of these and other factors led to the use of cash in operating activities of $136 million in 2009, as compared with cash used on the same basis of $128 million in 2008. Net cash provided by discontinued operations decreased $296 million in 2009 as compared with 2008 due primarily to the receipt of the refund of past federal income taxes referred to above.
Investing Activities
Net cash used in investing activities decreased $166 million for the year ended December 31, 2009 as compared with 2008 due primarily to a decline of $102 million in additions to properties and increased cash proceeds received from sales of assets and businesses of $64 million, primarily from the sale of assets of the Company’s OLED group.
Financing Activities
Net cash provided by financing activities increased $779 million for the year ended December 31, 2009 as compared with 2008 due primarily to approximately $650 million of net proceeds from two new debt issuances in 2009, of which $563 million was used to repurchase 2033 Convertible Senior Notes. Also, scheduled debt repayments in 2008 were $250 million higher than in 2009, share repurchases were $301 million in 2008, for which there were no comparable payments in 2009, and dividend payments were $139 million in 2008, for which there were no comparable payments in 2009.
48
OTHER
Refer to Note 10, "Commitments and Contingencies," in the Notes to Financial Statements for discussion regarding the Company's undiscounted liabilities for environmental remediation costs, and other commitments and contingencies, including legal matters.
CAUTIONARY STATEMENT PURSUANT TO SAFE HARBOR PROVISIONS OF THE PRIVATE SECURITIES LITIGATION REFORM ACT OF 1995
Certain statements in this report may be forward-looking in nature, or "forward-looking statements" as defined in the United States Private Securities Litigation Reform Act of 1995. For example, references to the Company's expectations regarding the following are forward-looking statements: economic conditions; revenue; revenue growth; cost of sales; savings from restructuring and rationalization; product pricing; gross margins; earnings; earnings growth; cash generation; emerging markets growth; demand for and performance of our products, consumables and services, including commercial inkjet, consumer inkjet, workflow software and services, and packaging printing solutions; commodity costs; potential revenue, cash and earnings from intellectual property licensing; liquidity; debt; potential cash proceeds from the sale of assets; credit ratings; capital markets; and currency exchange and rates.
Actual results may differ from those expressed or implied in forward-looking statements. Important factors that could cause actual results to differ materially from the forward-looking statements include, among others, the following risks, uncertainties, assumptions and factors as described in more detail under the heading “risk factors” in this Annual Report on Form 10-K for the year ended December 31, 2010, and under the headings "Risk Factors," "Management's Discussion and Analysis of Financial Condition and Results of Operations," and "Cautionary Statement Pursuant to Safe Harbor Provisions of the Private Litigation Reform Act of 1995" in this report and in the Company’s Quarterly Reports on Form 10-Q for the quarters ended September 30, 2010, June 30, 2010, and March 31, 2010, and in other filings the Company makes with the SEC from time to time:
|
·
|
Continued weakness or worsening of economic conditions which could continue to adversely impact our financial performance and our liquidity;
|
|
·
|
Whether we are successful with the strategic investment decisions we have made which could adversely affect our financial performance;
|
|
·
|
Whether we effectively anticipate technology trends and develop and market new products to respond to changing customer preferences which could adversely affect our revenue and earnings;
|
|
·
|
The competitive pressures we face which could adversely affect our revenue, earnings and market share;
|
|
·
|
Whether our commercialization and manufacturing processes prevent product reliability and quality issues which could adversely affect our revenue, earnings and market share;
|
|
·
|
Whether we are successful in licensing and enforcing our intellectual property rights or in defending against alleged infringement of the intellectual property rights of others which could adversely affect our revenue, earnings, expenses and liquidity;
|
|
·
|
Whether our pension and postretirement plan costs and contribution levels are impacted by changes in actuarial assumptions, future market performance of plan assets or obligations imposed by legislative or regulatory authorities which could adversely affect our financial position, results of operation and cash flow;
|
|
·
|
Whether we are successful in attracting, retaining and motivating key employees which could adversely affect our revenue and earnings;
|
|
·
|
Changes in currency exchange rates, interest rates and commodity costs which could adversely impact our results of operations and financial position;
|
|
·
|
Whether we are able to provide competitive financing arrangements or extend credit to customers which could adversely impact our revenue and earnings;
|
|
·
|
Our reliance on third party suppliers which could adversely affect our revenue, earnings and results of operations; and
|
49
|
·
|
Whether we can generate or raise sufficient cash to fund our continued investments, capital needs, restructuring payments and service our debt.
|
The Company cautions readers to carefully consider such factors. Many of these factors are beyond the Company’s control. In addition, any forward-looking statements represent the Company’s estimates only as of the date they are made, and should not be relied upon as representing the Company’s estimates as of any subsequent date. While the Company may elect to update forward-looking statements at some point in the future, the Company specifically disclaims any obligation to do so, even if its estimates change.
Any forward-looking statements in this report should be evaluated in light of the factors and uncertainties referenced above and should not be unduly relied upon.
SUMMARY OF OPERATING DATA
A summary of operating data for 2010 and for the four years prior is shown on page 112.
The Company, as a result of its global operating and financing activities, is exposed to changes in foreign currency exchange rates, commodity prices, and interest rates, which may adversely affect its results of operations and financial position. In seeking to minimize the risks associated with such activities, the Company may enter into derivative contracts. The Company does not utilize financial instruments for trading or other speculative purposes.
Foreign currency forward contracts are used to hedge existing foreign currency denominated assets and liabilities, especially those of the Company’s International Treasury Center, as well as forecasted foreign currency denominated intercompany sales. Silver forward contracts are used to mitigate the Company’s risk to fluctuating silver prices.
The Company’s exposure to changes in interest rates results from its investing and borrowing activities used to meet its liquidity needs. Long-term debt is generally used to finance long-term investments, while short-term debt is used to meet working capital requirements.
Using a sensitivity analysis based on estimated fair value of open foreign currency forward contracts using available forward rates, if the U.S. dollar had been 10% stronger at December 31, 2010 and 2009, the fair value of open forward contracts would have decreased $35 million and $17 million, respectively. Such changes in fair value would be substantially offset by the revaluation or settlement of the underlying positions hedged.
Using a sensitivity analysis based on estimated fair value of open silver forward contracts using available forward prices, if available forward silver prices had been 10% lower at December 31, 2010 and 2009, the fair value of open forward contracts would have decreased $1 million and $4 million, respectively. Such changes in fair value, if realized, would be offset by lower costs of manufacturing silver-containing products.
The Company is exposed to interest rate risk primarily through its borrowing activities and, to a lesser extent, through investments in marketable securities. The Company may utilize borrowings to fund its working capital and investment needs. The majority of short-term and long-term borrowings are in fixed-rate instruments. There is inherent roll-over risk for borrowings and marketable securities as they mature and are renewed at current market rates. The extent of this risk is not predictable because of the variability of future interest rates and business financing requirements.
Using a sensitivity analysis based on estimated fair value of short-term and long-term borrowings, if available market interest rates had been 10% (about 76 basis points) lower at December 31, 2010, the fair value of short-term and long-term borrowings would have increased less than $1 million and $50 million, respectively. Using a sensitivity analysis based on estimated fair value of short-term and long-term borrowings, if available market interest rates had been 10% (about 121 basis points) lower at December 31, 2009, the fair value of short-term and long-term borrowings would have increased less than $1 million and $59 million, respectively.
The Company’s financial instrument counterparties are high-quality investment or commercial banks with significant experience with such instruments. The Company manages exposure to counterparty credit risk by requiring specific minimum credit standards and diversification of counterparties. The Company has procedures to monitor the credit exposure amounts. The maximum credit exposure at December 31, 2010 was not significant to the Company.
50
REPORT OF INDEPENDENT REGISTERED PUBLIC ACCOUNTING FIRM
To
the Board of Directors and Shareholders of Eastman Kodak Company:
In our opinion, the consolidated financial statements listed in the index appearing under Item 15(a)(1) present fairly, in all material respects, the financial position of Eastman Kodak Company and its subsidiaries at December 31, 2010 and 2009, and the results of their operations and their cash flows for each of the three years in the period ended December 31, 2010 in conformity with accounting principles generally accepted in the United States of America. In addition, in our opinion, the financial statement schedule listed in the index appearing under Item 15(a)(2) presents fairly, in all material respects, the information set forth therein when read in conjunction with the related consolidated financial statements. Also in our opinion, the Company maintained, in all material respects, effective internal control over financial reporting as of December 31, 2010, based on criteria established in
Internal Control - Integrated Framework
issued by the Committee of Sponsoring Organizations of the Treadway Commission (COSO). The Company's management is responsible for these financial statements and financial statement schedule, for maintaining effective internal control over financial reporting and for its assessment of the effectiveness of internal control over financial reporting, included in Management's Report on Internal Control over Financial Reporting appearing under Item 9A. Our responsibility is to express opinions on these financial statements, on the financial statement schedule, and on the Company's internal control over financial reporting based on our integrated audits. We conducted our audits in accordance with the standards of the Public Company Accounting Oversight Board (United States). Those standards require that we plan and perform the audits to obtain reasonable assurance about whether the financial statements are free of material misstatement and whether effective internal control over financial reporting was maintained in all material respects. Our audits of the financial statements included examining, on a test basis, evidence supporting the amounts and disclosures in the financial statements, assessing the accounting principles used and significant estimates made by management, and evaluating the overall financial statement presentation. Our audit of internal control over financial reporting included obtaining an understanding of internal control over financial reporting, assessing the risk that a material weakness exists, and testing and evaluating the design and operating effectiveness of internal control based on the assessed risk. Our audits also included performing such other procedures as we considered necessary in the circumstances. We believe that our audits provide a reasonable basis for our opinions.
A company’s internal control over financial reporting is a process designed to provide reasonable assurance regarding the reliability of financial reporting and the preparation of financial statements for external purposes in accordance with generally accepted accounting principles. A company’s internal control over financial reporting includes those policies and procedures that (i) pertain to the maintenance of records that, in reasonable detail, accurately and fairly reflect the transactions and dispositions of the assets of the company; (ii) provide reasonable assurance that transactions are recorded as necessary to permit preparation of financial statements in accordance with generally accepted accounting principles, and that receipts and expenditures of the company are being made only in accordance with authorizations of management and directors of the company; and (iii) provide reasonable assurance regarding prevention or timely detection of unauthorized acquisition, use, or disposition of the company’s assets that could have a material effect on the financial statements.
Because of its inherent limitations, internal control over financial reporting may not prevent or detect misstatements. Also, projections of any evaluation of effectiveness to future periods are subject to the risk that controls may become inadequate because of changes in conditions, or that the degree of compliance with the policies or procedures may deteriorate.
/s/ PricewaterhouseCoopers LLP
PricewaterhouseCoopers LLP
Rochester, New York
February 24, 2011
51
Eastman Kodak Company
|
For the Year Ended December 31,
|
||||||||||||
|
(in millions, except per share data)
|
2010
|
2009
|
2008
|
|||||||||
|
Net sales
|
||||||||||||
|
Products
|
$ | 5,507 | $ | 6,323 | $ | 8,130 | ||||||
|
Services
|
776 | 788 | 793 | |||||||||
|
Licensing & royalties
|
904 | 495 | 493 | |||||||||
|
Total net sales
|
$ | 7,187 | $ | 7,606 | $ | 9,416 | ||||||
|
Cost of sales
|
||||||||||||
|
Products
|
$ | 4,638 | $ | 5,243 | $ | 6,647 | ||||||
|
Services
|
598 | 595 | 600 | |||||||||
|
Total cost of sales
|
$ | 5,236 | $ | 5,838 | $ | 7,247 | ||||||
|
Gross profit
|
$ | 1,951 | $ | 1,768 | $ | 2,169 | ||||||
|
Selling, general and administrative expenses
|
1,277 | 1,302 | 1,606 | |||||||||
|
Research and development costs
|
321 | 356 | 478 | |||||||||
|
Restructuring costs, rationalization and other
|
70 | 226 | 140 | |||||||||
|
Other operating expenses (income), net
|
619 | (88 | ) | 766 | ||||||||
|
Loss from continuing operations before interest
expense, other income (charges), net and income taxes
|
(336 | ) | (28 | ) | (821 | ) | ||||||
|
Interest expense
|
149 | 119 | 108 | |||||||||
|
Loss on early extinguishment of debt, net
|
102 | - | - | |||||||||
|
Other income (charges), net
|
26 | 30 | 55 | |||||||||
|
Loss from continuing operations before income
taxes
|
(561 | ) | (117 | ) | (874 | ) | ||||||
|
Provision (benefit) for income taxes
|
114 | 115 | (147 | ) | ||||||||
|
Loss from continuing operations
|
(675 | ) | (232 | ) | (727 | ) | ||||||
|
(Loss) earnings from discontinued operations, net of income
taxes
|
(12 | ) | 17 | 285 | ||||||||
|
Extraordinary item, net of tax
|
- | 6 | - | |||||||||
|
NET LOSS
|
(687 | ) | (209 | ) | (442 | ) | ||||||
|
Less: Net earnings attributable to noncontrolling interests
|
- | (1 | ) | - | ||||||||
|
NET LOSS ATTRIBUTABLE TO EASTMAN
KODAK COMPANY
|
$ | (687 | ) | $ | (210 | ) | $ | (442 | ) | |||
|
|
||||||||||||
|
Basic and diluted net (loss) earnings per share attributable to Eastman Kodak Company common shareholders:
|
||||||||||||
|
Continuing operations
|
$ | (2.51 | ) | $ | (0.87 | ) | $ | (2.58 | ) | |||
|
Discontinued operations
|
(0.05 | ) | 0.07 | 1.01 | ||||||||
|
Extraordinary item
|
- | 0.02 | - | |||||||||
|
Total
|
$ | (2.56 | ) | $ | (0.78 | ) | $ | (1.57 | ) | |||
The accompanying notes are an integral part of these consolidated financial statements.
52
Eastman Kodak Company
CONSOLIDATED STATEMENT OF FINANCIAL POSITION
|
(in millions, except share and per share data)
|
As of December 31,
|
|||||||
|
|
2010
|
2009
|
||||||
|
ASSETS
|
||||||||
|
CURRENT ASSETS
|
||||||||
|
Cash and cash equivalents
|
$ | 1,624 | $ | 2,024 | ||||
|
Receivables, net
|
1,259 | 1,395 | ||||||
|
Inventories, net
|
696 | 679 | ||||||
|
Deferred income taxes
|
120 | 121 | ||||||
|
Other current assets
|
100 | 84 | ||||||
|
Total current assets
|
3,799 | 4,303 | ||||||
|
Property, plant and equipment, net
|
1,037 | 1,254 | ||||||
|
Goodwill
|
294 | 907 | ||||||
|
Other long-term assets
|
1,109 | 1,227 | ||||||
|
TOTAL ASSETS
|
$ | 6,239 | $ | 7,691 | ||||
|
LIABILITIES AND EQUITY
|
||||||||
|
CURRENT LIABILITIES
|
||||||||
|
Accounts payable, trade
|
$ | 959 | $ | 919 | ||||
|
Short-term borrowings and current portion of long-term debt
|
50 | 62 | ||||||
|
Accrued income taxes
|
343 | 23 | ||||||
|
Other current liabilities
|
1,481 | 1,892 | ||||||
|
Total current liabilities
|
2,833 | 2,896 | ||||||
|
Long-term debt, net of current portion
|
1,195 | 1,129 | ||||||
|
Pension and other postretirement liabilities
|
2,661 | 2,694 | ||||||
|
Other long-term liabilities
|
625 | 1,005 | ||||||
|
Total liabilities
|
7,314 | 7,724 | ||||||
|
Commitments and Contingencies (Note 10)
|
||||||||
|
EQUITY (DEFICIT)
|
||||||||
|
Common stock, $2.50 par value, 950,000,000 shares authorized; 391,292,760 shares issued as of December 31, 2010 and 2009; 268,898,978 and 268,630,514 shares outstanding as of December 31, 2010 and 2009
|
978 | 978 | ||||||
|
Additional paid in capital
|
1,105 | 1,093 | ||||||
|
Retained earnings
|
4,969 | 5,676 | ||||||
|
Accumulated other comprehensive loss
|
(2,135 | ) | (1,760 | ) | ||||
|
|
4,917 | 5,987 | ||||||
|
Treasury stock, at cost;
122,393,782 shares as of December 31, 2010 and 122,662,246 shares as of December 31, 2009
|
(5,994 | ) | (6,022 | ) | ||||
|
Total Eastman Kodak Company shareholders’ (deficit) equity
|
(1,077 | ) | (35 | ) | ||||
|
Noncontrolling interests
|
2 | 2 | ||||||
|
Total (deficit) equity
|
(1,075 | ) | (33 | ) | ||||
|
TOTAL LIABILITIES AND EQUITY (DEFICIT)
|
$ | 6,239 | $ | 7,691 | ||||
The accompanying notes are an integral part of these consolidated financial statements.
53
Eastman Kodak Company
CONSOLIDATED STATEMENT OF EQUITY (DEFICIT)
(in millions, except share and per share data)
|
Eastman Kodak Company Shareholders
|
||||||||||||||||||||||||||||||||
|
Accumulated
|
||||||||||||||||||||||||||||||||
|
Additional
|
Other
|
|||||||||||||||||||||||||||||||
|
Common
|
Paid In
|
Retained
|
Comprehensive
|
Treasury
|
Noncontrolling
|
|||||||||||||||||||||||||||
|
Stock (1)
|
Capital
|
Earnings
|
(Loss) Income
|
Stock
|
Total
|
Interests
|
Total
|
|||||||||||||||||||||||||
|
Equity (deficit) as of December 31, 2007
|
$ | 978 | $ | 889 | $ | 6,498 | $ | 453 | $ | (5,764 | ) | $ | 3,054 | $ | 6 | $ | 3,060 | |||||||||||||||
|
Net loss
|
- | - | (442 | ) | - | - | (442 | ) | - | (442 | ) | |||||||||||||||||||||
|
Equity transactions with noncontrolling interests
|
- | - | - | - | - | - | (4 | ) | (4 | ) | ||||||||||||||||||||||
|
Other comprehensive loss:
|
||||||||||||||||||||||||||||||||
|
Unrealized gains arising
from hedging activity ($8
million
pre-tax)
|
- | - | - | (8 | ) | - | (8 | ) | - | (8 | ) | |||||||||||||||||||||
|
Reclassification
adjustment for hedging
related gains
included in
net earnings ($8 million
pre-tax)
|
- | - | - | (8 | ) | - | (8 | ) | - | (8 | ) | |||||||||||||||||||||
|
Currency translation
adjustments
|
- | - | - | (81 | ) | - | (81 | ) | 1 | (80 | ) | |||||||||||||||||||||
|
Pension and other
postretirement liability
adjustments
($1,147 million
pre-tax)
|
- | - | - | (1,105 | ) | - | (1,105 | ) | - | (1,105 | ) | |||||||||||||||||||||
|
Other comprehensive loss
|
- | - | - | (1,202 | ) | - | (1,202 | ) | 1 | (1,201 | ) | |||||||||||||||||||||
|
Comprehensive loss
|
(1,643 | ) | ||||||||||||||||||||||||||||||
|
Cash dividends declared ($.50 per common share)
|
- | - | (139 | ) | - | - | (139 | ) | - | (139 | ) | |||||||||||||||||||||
|
Recognition of equity-based compensation expense
|
- | 18 | - | - | - | 18 | - | 18 | ||||||||||||||||||||||||
|
Share repurchases (20,046,396 shares)
|
(301 | ) | (301 | ) | - | (301 | ) | |||||||||||||||||||||||||
|
Treasury stock issued, net (159,021 shares) (2)
|
- | (5 | ) | (12 | ) | - | 14 | (3 | ) | - | (3 | ) | ||||||||||||||||||||
|
Unvested stock issuances (56,600 shares)
|
- | (1 | ) | (2 | ) | - | 3 | - | - | - | ||||||||||||||||||||||
|
Equity (deficit) as of December 31, 2008
|
$ | 978 | $ | 901 | $ | 5,903 | $ | (749 | ) | $ | (6,048 | ) | $ | 985 | $ | 3 | $ | 988 | ||||||||||||||
54
Eastman Kodak Company
CONSOLIDATED STATEMENT OF EQUITY (DEFICIT) Cont’d.
(in millions, except share and per share data)
|
Eastman Kodak Company Shareholders
|
||||||||||||||||||||||||||||||||
|
Accumulated
|
||||||||||||||||||||||||||||||||
|
Additional
|
Other
|
|||||||||||||||||||||||||||||||
|
Common
|
Paid In
|
Retained
|
Comprehensive
|
Treasury
|
Noncontrolling
|
|||||||||||||||||||||||||||
|
Stock (1)
|
Capital
|
Earnings
|
(Loss) Income
|
Stock
|
Total
|
Interests
|
Total
|
|||||||||||||||||||||||||
|
Equity (deficit) as of December 31, 2008
|
$ | 978 | $ | 901 | $ | 5,903 | $ | (749 | ) | $ | (6,048 | ) | $ | 985 | $ | 3 | $ | 988 | ||||||||||||||
|
Net (loss) earnings
|
- | - | (210 | ) | - | - | (210 | ) | 1 | (209 | ) | |||||||||||||||||||||
|
Equity transactions with noncontrolling interests
|
- | - | - | - | - | - | (2 | ) | (2 | ) | ||||||||||||||||||||||
|
Other comprehensive loss:
|
||||||||||||||||||||||||||||||||
|
Unrealized gains arising
from hedging activity ($17
million
pre-tax)
|
- | - | - | 17 | - | 17 | - | 17 | ||||||||||||||||||||||||
|
Reclassification
adjustment for hedging
related gains
included in
net earnings ($5 million
pre-tax)
|
- | - | - | (5 | ) | - | (5 | ) | - | (5 | ) | |||||||||||||||||||||
|
Currency translation
adjustments
|
- | - | - | 4 | - | 4 | - | 4 | ||||||||||||||||||||||||
|
Pension and other
postretirement liability
adjustments
($1,111 million
pre-tax)
|
- | - | - | (1,027 | ) | - | (1,027 | ) | - | (1,027 | ) | |||||||||||||||||||||
|
Other comprehensive loss
|
- | - | - | (1,011 | ) | - | (1,011 | ) | - | (1,011 | ) | |||||||||||||||||||||
|
Comprehensive loss
|
(1,222 | ) | ||||||||||||||||||||||||||||||
|
Recognition of equity-based compensation expense
|
- | 20 | - | - | - | 20 | - | 20 | ||||||||||||||||||||||||
|
Equity component of debt issuances
|
- | 181 | - | - | - | 181 | - | 181 | ||||||||||||||||||||||||
|
Treasury stock issued, net (328,099 shares) (2)
|
- | (8 | ) | (10 | ) | - | 18 | - | - | - | ||||||||||||||||||||||
|
Unvested stock issuances (133,360 shares)
|
- | (1 | ) | (7 | ) | - | 8 | - | - | - | ||||||||||||||||||||||
|
Equity (deficit) as of December 31, 2009
|
$ | 978 | $ | 1,093 | $ | 5,676 | $ | (1,760 | ) | $ | (6,022 | ) | $ | (35 | ) | $ | 2 | $ | (33 | ) | ||||||||||||
55
Eastman Kodak Company
CONSOLIDATED STATEMENT OF EQUITY (DEFICIT) Cont'd.
(in millions, except share and per share data)
|
Eastman Kodak Company Shareholders
|
||||||||||||||||||||||||||||||||
|
Accumulated
|
||||||||||||||||||||||||||||||||
|
Additional
|
Other
|
|||||||||||||||||||||||||||||||
|
Common
|
Paid In
|
Retained
|
Comprehensive
|
Treasury
|
Noncontrolling
|
|||||||||||||||||||||||||||
|
Stock (1)
|
Capital
|
Earnings
|
(Loss) Income
|
Stock
|
Total
|
Interests
|
Total
|
|||||||||||||||||||||||||
|
Equity (deficit) as of December 31, 2009
|
$ | 978 | $ | 1,093 | $ | 5,676 | $ | (1,760 | ) | $ | (6,022 | ) | $ | (35 | ) | $ | 2 | $ | (33 | ) | ||||||||||||
|
Net loss
|
- | - | (687 | ) | - | - | (687 | ) | - | (687 | ) | |||||||||||||||||||||
|
Other comprehensive loss:
|
||||||||||||||||||||||||||||||||
|
Unrealized gains arising
from hedging activity ($4
million
pre-tax)
|
- | - | - | 4 | - | 4 | - | 4 | ||||||||||||||||||||||||
|
Reclassification
adjustment for hedging
related gains
included in
net earnings ($8 million
pre-tax)
|
- | - | - | (8 | ) | - | (8 | ) | - | (8 | ) | |||||||||||||||||||||
|
Currency translation
adjustments
|
- | - | - | 80 | - | 80 | - | 80 | ||||||||||||||||||||||||
|
Pension and other
postretirement liability
adjustments
($470 million
pre-tax)
|
- | - | - | (451 | ) | - | (451 | ) | - | (451 | ) | |||||||||||||||||||||
|
Other comprehensive loss
|
- | - | - | (375 | ) | - | (375 | ) | - | (375 | ) | |||||||||||||||||||||
|
Comprehensive loss
|
(1,062 | ) | ||||||||||||||||||||||||||||||
|
Recognition of equity-based compensation expense
|
- | 21 | - | - | - | 21 | - | 21 | ||||||||||||||||||||||||
|
Treasury stock issued, net (268,464 shares) (2)
|
- | (9 | ) | (20 | ) | - | 28 | (1 | ) | - | (1 | ) | ||||||||||||||||||||
|
Equity (deficit) as of December 31, 2010
|
$ | 978 | $ | 1,105 | $ | 4,969 | $ | (2,135 | ) | $ | (5,994 | ) | $ | (1,077 | ) | $ | 2 | $ | (1,075 | ) | ||||||||||||
(1) There are 100 million shares of $10 par value preferred stock authorized, none of which have been issued.
|
(2)
|
Includes stock awards issued, offset by shares surrendered for taxes.
|
The accompanying notes are an integral part of these consolidated financial statements.
56
Eastman Kodak Company
(in millions)
|
For the Year Ended December 31,
|
||||||||||||
|
2010
|
2009
|
2008
|
||||||||||
|
Cash flows from operating activities:
|
||||||||||||
|
Net loss
|
$ | (687 | ) | $ | (209 | ) | $ | (442 | ) | |||
|
Adjustments to reconcile to net cash provided by operating activities:
|
||||||||||||
|
Loss (earnings) from discontinued operations, net of income taxes
|
12 | (17 | ) | (285 | ) | |||||||
|
Earnings from extraordinary items, net of income taxes
|
- | (6 | ) | - | ||||||||
|
Depreciation and amortization
|
378 | 427 | 500 | |||||||||
|
Gain on sales of businesses/assets
|
(8 | ) | (100 | ) | (14 | ) | ||||||
|
Loss on early extinguishment of debt, net
|
102 | - | - | |||||||||
|
Non-cash restructuring and rationalization costs, asset impairments and
other
charges
|
635 | 28 | 801 | |||||||||
|
(Benefit) provision for deferred income taxes
|
(91 | ) | (99 | ) | 16 | |||||||
|
Decrease in receivables
|
118 | 363 | 148 | |||||||||
|
(Increase) decrease in inventories
|
(28 | ) | 276 | (20 | ) | |||||||
|
Decrease in liabilities excluding borrowings
|
(580 | ) | (821 | ) | (720 | ) | ||||||
|
Other items, net
|
(70 | ) | 22 | (112 | ) | |||||||
|
Total adjustments
|
468 | 73 | 314 | |||||||||
|
Net cash used in continuing operations
|
(219 | ) | (136 | ) | (128 | ) | ||||||
|
Net cash provided by discontinued operations
|
- | - | 296 | |||||||||
|
Net cash (used in) provided by operating activities
|
(219 | ) | (136 | ) | 168 | |||||||
|
Cash flows from investing activities:
|
||||||||||||
|
Additions to properties
|
(149 | ) | (152 | ) | (254 | ) | ||||||
|
Proceeds from sales of businesses/assets
|
32 | 156 | 92 | |||||||||
|
Acquisitions, net of cash acquired
|
- | (17 | ) | (38 | ) | |||||||
|
Use (funding) of restricted cash and investment accounts
|
1 | (12 | ) | - | ||||||||
|
Marketable securities - sales
|
74 | 39 | 162 | |||||||||
|
Marketable securities - purchases
|
(70 | ) | (36 | ) | (150 | ) | ||||||
|
Net cash used in investing activities
|
(112 | ) | (22 | ) | (188 | ) | ||||||
|
Cash flows from financing activities:
|
||||||||||||
|
Stock repurchases
|
- | - | (301 | ) | ||||||||
|
Proceeds from borrowings
|
503 | 712 | 140 | |||||||||
|
Repayment of borrowings
|
(565 | ) | (649 | ) | (446 | ) | ||||||
|
Debt issuance costs
|
(12 | ) | (30 | ) | - | |||||||
|
Dividends to shareholders
|
- | - | (139 | ) | ||||||||
|
Net cash (used in) provided by financing activities
|
(74 | ) | 33 | (746 | ) | |||||||
|
Effect of exchange rate changes on cash
|
5 | 4 | (36 | ) | ||||||||
|
Net decrease in cash and cash equivalents
|
(400 | ) | (121 | ) | (802 | ) | ||||||
|
Cash and cash equivalents, beginning of year
|
2,024 | 2,145 | 2,947 | |||||||||
|
Cash and cash equivalents, end of year
|
$ | 1,624 | $ | 2,024 | $ | 2,145 | ||||||
57
Eastman Kodak Company
CONSOLIDATED STATEMENT OF CASH FLOWS (Continued)
SUPPLEMENTAL CASH FLOW INFORMATION
(in millions)
|
For the Year Ended December 31,
|
||||||||||||
|
2010
|
2009
|
2008
|
||||||||||
|
Cash paid for interest and income taxes was:
|
||||||||||||
|
Interest, net of portion capitalized of $1, $2 and $3
|
$ | 115 | $ | 70 | $ | 85 | ||||||
|
Income taxes (1)
|
197 | 225 | 145 | |||||||||
|
The following non-cash items are not reflected in the Consolidated
Statement of Cash Flows:
|
||||||||||||
|
Pension and other postretirement benefits liability adjustments
|
$ | 451 | $ | 1,027 | $ | 1,105 | ||||||
|
Liabilities assumed in acquisitions
|
- | 4 | 2 | |||||||||
|
Issuance of unvested stock, net of forfeitures
|
- | - | 1 | |||||||||
(1) Includes payments related to discontinued operations.
The accompanying notes are an integral part of these consolidated financial statements.
58
Eastman Kodak Company
NOTES TO FINANCIAL STATEMENTS
ACCOUNTING PRINCIPLES
The consolidated financial statements and accompanying notes are prepared in accordance with accounting principles generally accepted in the United States of America. The following is a description of the significant accounting policies of Eastman Kodak Company.
BASIS OF CONSOLIDATION
The consolidated financial statements include the accounts of Eastman Kodak Company, its wholly owned subsidiaries, and its majority owned subsidiaries (collectively “the Company”). The Company consolidates variable interest entities if the Company has a controlling financial interest and is determined to be the primary beneficiary of the entity. The Company accounts for investments in companies over which it has the ability to exercise significant influence, but does not hold a controlling interest, under the equity method of accounting, and the Company records its proportionate share of income or losses in Other income (charges), net in the accompanying Consolidated Statements of Operations. The Company accounts for investments in companies over which it does not have the ability to exercise significant influence under the cost method of accounting. These investments are carried at cost and are adjusted only for other-than-temporary declines in fair value. The Company has eliminated all significant intercompany accounts and transactions, and net earnings are reduced by the portion of the net earnings of subsidiaries applicable to noncontrolling interests.
USE OF ESTIMATES
The preparation of financial statements in conformity with accounting principles generally accepted in the United States of America requires management to make estimates and assumptions that affect the reported amounts of assets and liabilities and disclosure of contingent assets and liabilities at year end, and the reported amounts of revenues and expenses during the reporting period. Actual results could differ from those estimates.
FOREIGN CURRENCY
For most subsidiaries and branches outside the U.S., the local currency is the functional currency. The financial statements of these subsidiaries and branches are translated into U.S. dollars as follows: assets and liabilities at year-end exchange rates; income, expenses and cash flows at average exchange rates; and shareholders’ equity at historical exchange rates. For those subsidiaries for which the local currency is the functional currency, the resulting translation adjustment is recorded as a component of Accumulated other comprehensive (loss) income in the accompanying Consolidated Statement of Financial Position. Translation adjustments related to investments that are permanent in nature are not tax-effected.
For certain other subsidiaries and branches, operations are conducted primarily in U.S. dollars, which is therefore the functional currency. Monetary assets and liabilities of these foreign subsidiaries and branches, which are recorded in local currency, are remeasured at year-end exchange rates, while the related revenue, expense, and gain and loss accounts, which are recorded in local currency, are remeasured at average exchange rates. Non-monetary assets and liabilities, and the related revenue, expense, and gain and loss accounts, are remeasured at historical rates. Adjustments that result from the remeasurement of the assets and liabilities of these subsidiaries are included in Net (loss) earnings in the accompanying Consolidated Statement of Operations.
The effects of foreign currency transactions, including related hedging activities, are included in Other income (charges), net, in the accompanying Consolidated Statement of Operations.
59
CONCENTRATION OF CREDIT RISK
Financial instruments that potentially subject the Company to significant concentrations of credit risk consist principally of cash and cash equivalents, receivables, and derivative instruments. The Company places its cash and cash equivalents with high-quality financial institutions and limits the amount of credit exposure to any one institution. With respect to receivables, such receivables arise from sales to numerous customers in a variety of industries, markets, and geographies around the world. Receivables arising from these sales are generally not collateralized. The Company performs ongoing credit evaluations of its customers’ financial conditions, and maintains reserves for potential credit losses and such losses, in the aggregate, have not exceeded management’s expectations. With respect to the derivative instruments, the counterparties to these contracts are major financial institutions. The Company has not experienced non-performance by any of its derivative instruments counterparties.
DERIVATIVE FINANCIAL INSTRUMENTS
All derivative instruments are recognized as either assets or liabilities and are measured at fair value. Certain derivatives are designated and accounted for as hedges. The Company does not use derivatives for trading or other speculative purposes. See Note 12, “Financial Instruments.”
CASH EQUIVALENTS
All highly liquid investments with a remaining maturity of three months or less at date of purchase are considered to be cash equivalents.
INVENTORIES
Inventories are stated at the lower of cost or market. The cost of all of the Company’s inventories is determined by either the “first in, first out” (“FIFO”) or average cost method, which approximates current cost. The Company provides inventory reserves for excess, obsolete or slow-moving inventory based on changes in customer demand, technology developments or other economic factors.
PROPERTIES
Properties are recorded at cost, net of accumulated depreciation. The Company capitalizes additions and improvements. Maintenance and repairs are charged to expense as incurred. The Company calculates depreciation expense using the straight-line method over the assets’ estimated useful lives, which are as follows:
|
Years
|
|
|
Buildings and building improvements
|
5-40
|
|
Land improvements
|
20
|
|
Leasehold improvements
|
3-20
|
|
Equipment
|
3-15
|
|
Tooling
|
1-3
|
|
Furniture and fixtures
|
5-10
|
The Company depreciates leasehold improvements over the shorter of the lease term or the asset’s estimated useful life. Upon sale or other disposition, the applicable amounts of asset cost and accumulated depreciation are removed from the accounts and the net amount, less proceeds from disposal, is charged or credited to net (loss) earnings.
GOODWILL
Goodwill represents the excess of purchase price of an acquisition over the fair value of net assets acquired. Goodwill is not amortized, but is required to be assessed for impairment at least annually. The Company has elected September 30 as the annual impairment assessment date for all of its reporting units, and will perform additional impairment tests when events or changes in circumstances occur that would more likely than not reduce the fair value of the reporting unit below its carrying amount. A reporting unit is defined as an operating segment or one level below an operating segment. The Company estimates the fair value of its reporting units utilizing income and market approaches through the application of discounted cash flow and market comparable methods, respectively. The assessment
60
is required to be performed in two steps, step one to test for a potential impairment of goodwill and, if potential losses are identified, step two to measure the impairment loss. Determining the fair value of a reporting unit involves the use of significant estimates and assumptions.
The Company recorded pre-tax goodwill impairment charges of $626 million in the fourth quarter of 2010 and $785 million in the fourth quarter of 2008. See Note 5, “Goodwill and Other Intangible Assets.”
REVENUE
The Company’s revenue transactions include sales of the following: products; equipment; software; services; integrated solutions; and intellectual property licensing. The Company recognizes revenue when realized or realizable and earned, which is when the following criteria are met: persuasive evidence of an arrangement exists; delivery has occurred; the sales price is fixed or determinable; and collectability is reasonably assured. If the Company determines that collection of a fee is not reasonably assured, the fee is deferred and revenue is recognized at the time collection becomes reasonably assured, which is generally upon receipt of payment. At the time revenue is recognized, the Company provides for the estimated costs of customer incentive programs, warranties and estimated returns and reduces revenue accordingly.
For product sales, the revenue recognition criteria are generally met when title and risk of loss have transferred from the Company to the buyer, which may be upon shipment or upon delivery to the customer site, based on contract terms or legal requirements in certain jurisdictions. Service revenues are recognized as such services are rendered.
For equipment sales, the recognition criteria are generally met when the equipment is delivered and installed at the customer site. Revenue is recognized for equipment upon delivery as opposed to upon installation when there is objective and reliable evidence of fair value for the installation, and the amount of revenue allocable to the equipment is not legally contingent upon the completion of the installation. In instances in which the agreement with the customer contains a customer acceptance clause, revenue is deferred until customer acceptance is obtained, provided the customer acceptance clause is considered to be substantive. For certain agreements, the Company does not consider these customer acceptance clauses to be substantive because the Company can and does replicate the customer acceptance test environment and performs the agreed upon product testing prior to shipment. In these instances, revenue is recognized upon installation of the equipment.
Revenue for the sale of software licenses is recognized when: (1) the Company enters into a legally binding arrangement with a customer for the license of software; (2) the Company delivers the software; (3) customer payment is deemed fixed or determinable and free of contingencies or significant uncertainties; and (4) collection from the customer is reasonably assured. Software maintenance and support revenue is recognized ratably over the term of the related maintenance period.
Revenue from services includes extended warranty, customer support and maintenance agreements, consulting, business process services, training and education. Service revenue is recognized over the contractual period or as services are performed. In service arrangements where final acceptance of a system or solution by the customer is required, revenue is deferred until all acceptance criteria have been met.
The Company's transactions may involve the sale of equipment, software, and related services under multiple element arrangements. The Company allocates revenue to the various elements based on their fair value. Revenue allocated to an individual element is recognized when all other revenue recognition criteria are met for that element.
The timing and the amount of revenue recognized from the licensing of intellectual property depend upon a variety of factors, including the specific terms of each agreement and the nature of the deliverables and obligations. Revenue is only recognized after all of the following criteria are met: (1) the Company enters into a legally binding arrangement with a licensee of Kodak’s intellectual property, (2) the Company delivers the technology or intellectual property rights, (3) licensee payment is deemed fixed or determinable and free of contingencies or significant uncertainties, and (4) collection from the licensee is reasonably assured.
61
When the Company has continuing obligations related to a licensing arrangement, including extending the rights to currently undeveloped intellectual property, revenue related to the ongoing arrangement is recognized over the period of the obligation. The Company ascribes revenue on these arrangements over the period of the obligation, beginning when the Company is first entitled to past due royalties (for example, the date the licensee was notified of infringement) through the end of the obligation period.
At the time revenue is recognized, the Company also records reductions to revenue for customer incentive programs. Such incentive programs include cash and volume discounts, price protection, promotional, cooperative and other advertising allowances, and coupons. For those incentives that require the estimation of sales volumes or redemption rates, such as for volume rebates or coupons, the Company uses historical experience and internal and customer data to estimate the sales incentive at the time revenue is recognized.
In instances where the Company provides slotting fees or similar arrangements, this incentive is recognized as a reduction in revenue when payment is made to the customer (or at the time the Company has incurred the obligation, if earlier) unless the Company receives a benefit over a period of time, in which case the incentive is recorded as an asset and is amortized as a reduction of revenue over the term of the arrangement. Arrangements in which the Company receives an identifiable benefit include arrangements that have enforceable exclusivity provisions and those that provide a clawback provision entitling the Company to a pro rata reimbursement if the customer does not fulfill its obligations under the contract.
The Company may offer customer financing to assist customers in their acquisition of Kodak’s products. At the time a financing transaction is consummated, which qualifies as a sales-type lease, the Company records equipment revenue equal to the total lease receivable net of unearned income. Unearned income is recognized as finance income using the effective interest method over the term of the lease. Leases not qualifying as sales-type leases are accounted for as operating leases. The Company recognizes revenue from operating leases on an accrual basis as the rental payments become due.
RESEARCH AND DEVELOPMENT COSTS
Research and development (“R&D”) costs, which include costs incurred in connection with new product development, fundamental and exploratory research, process improvement, product use technology and product accreditation, are expensed in the period in which they are incurred. In connection with business combinations entered into prior to January 1, 2009, the purchase price allocated to R&D projects that had not yet reached technological feasibility and for which no alternative future use existed was expensed in the period of acquisition. Effective January 1, 2009, the acquisition-date fair value of research and development assets acquired in a business combination are capitalized.
ADVERTISING
Advertising costs are expensed as incurred and included in selling, general and administrative expenses in the accompanying Consolidated Statement of Operations. Advertising expenses amounted to $301 million, $271 million, and $350 million for the years ended December 31, 2010, 2009, and 2008, respectively.
SHIPPING AND HANDLING COSTS
Amounts charged to customers and costs incurred by the Company related to shipping and handling are included in net sales and cost of sales, respectively.
IMPAIRMENT OF LONG-LIVED ASSETS
The Company reviews the carrying values of its long-lived assets, other than goodwill and purchased intangible assets with indefinite useful lives, for impairment whenever events or changes in circumstances indicate that the carrying values may not be recoverable. The Company assesses the recoverability of the carrying values of long-lived assets by first grouping its long-lived assets with other assets and liabilities at the lowest level for which identifiable cash flows are largely independent of the cash flows of other assets and liabilities (the asset group) and, secondly, by estimating the undiscounted future cash flows that are directly associated with and that are expected to arise from the use of and eventual disposition of such asset group. The Company estimates the undiscounted cash flows over the
62
remaining useful life of the primary asset within the asset group. If the carrying value of the asset group exceeds the estimated undiscounted cash flows, the Company records an impairment charge to the extent the carrying value of the long-lived asset exceeds its fair value. The Company determines fair value through quoted market prices in active markets or, if quoted market prices are unavailable, through the performance of internal analyses of discounted cash flows.
In connection with its assessment of recoverability of its long-lived assets and its ongoing strategic review of the business and its operations, the Company continually reviews the remaining useful lives of its long-lived assets. If this review indicates that the remaining useful life of the long-lived asset has changed significantly, the Company adjusts the depreciation on that asset to facilitate full cost recovery over its revised estimated remaining useful life.
INCOME TAXES
The Company recognizes deferred tax liabilities and assets for the expected future tax consequences of operating losses, credit carryforwards and temporary differences between the carrying amounts and tax basis of the Company’s assets and liabilities. The Company records a valuation allowance to reduce its net deferred tax assets to the amount that is more likely than not to be realized. For discussion of the amounts and components of the valuation allowances as of December 31, 2010 and 2009, see Note 15, “Income Taxes.”
EARNINGS PER SHARE
Basic earnings per share computations are based on the weighted-average number of shares of common stock outstanding during the year. As a result of the net loss from continuing operations presented for the years ended December 31, 2010, 2009, and 2008, the Company calculated diluted earnings per share using weighted-average basic shares outstanding for each period, as utilizing diluted shares would be anti-dilutive to loss per share. Weighted-average basic shares outstanding for the years ended December 31, 2010, 2009, and 2008 were 268.5 million, 268.0 million, and 281.8 million shares, respectively.
If the Company had reported earnings from continuing operations for the years ended December 31, 2010, 2009, and 2008, the following potential shares of the Company’s common stock would have been dilutive in the computation of diluted earnings per share:
|
(in millions of shares)
|
For the Year Ended December 31,
|
|||||||||||
|
2010
|
2009
|
2008
|
||||||||||
|
Unvested share-based awards
|
2.7 | 0.5 | 0.2 | |||||||||
The computation of diluted earnings per share for the years ended December 31, 2010, 2009, and 2008 also excluded the assumed conversion of outstanding employee stock options and detachable warrants to purchase common shares, because the effects would be anti-dilutive. The following table sets forth the total amount of outstanding employee stock options and detachable warrants to purchase common shares as of December 31 for each reporting period:
|
(in millions of shares)
|
For the Year Ended December 31,
|
|||||||||||
|
2010
|
2009
|
2008
|
||||||||||
|
Employee stock options
|
18.0 | 23.5 | 25.2 | |||||||||
|
Detachable warrants to purchase common shares
|
40.0 | 40.0 | - | |||||||||
|
Total
|
58.0 | 63.5 | 25.2 | |||||||||
Diluted earnings per share calculations could also reflect shares related to the assumed conversion of approximately $305 million of convertible senior notes due 2017, if dilutive. The Company’s diluted (loss) earnings per share excludes the effect of these convertible securities, as they were anti-dilutive for all periods presented. Refer to Note 8, “Short-Term Borrowings and Long-Term Debt.”
63
RECENTLY ADOPTED ACCOUNTING PRONOUNCEMENTS
In January 2010, the Financial Accounting Standards Board (FASB) issued Accounting Standards Update (ASU) No. 2010-06, “Improving Disclosures about Fair Value Measurements,” which amends the Accounting Standards Codification (ASC) Topic 820, “Fair Value Measures and Disclosures.” ASU No. 2010-06 amended the ASC to require disclosure of transfers into and out of Level 1 and Level 2 fair value measurements, and also will require more detailed disclosure about the activity within Level 3 fair value measurements. The Company adopted the guidance in ASU No. 2010-06 on January 1, 2010, except for the requirements related to Level 3 disclosures, which will be effective for annual and interim reporting periods beginning after December 15, 2010 (January 1, 2011 for the Company). This guidance requires new disclosures only.
In June 2009, the FASB issued authoritative guidance establishing two levels of U.S. generally accepted accounting principles (GAAP) – authoritative and nonauthoritative – and making the ASC the source of authoritative, nongovernmental GAAP, except for rules and interpretive releases of the Securities and Exchange Commission. This guidance, which was incorporated into ASC Topic 105, “Generally Accepted Accounting Principles,” was effective for financial statements issued for interim and annual periods ending after September 15, 2009. The adoption changed certain disclosure references to U.S. GAAP, but did not have any other impact on the Company’s Consolidated Financial Statements.
In June 2009, the FASB issued revised authoritative guidance related to variable interest entities, which requires entities to perform a qualitative analysis to determine whether a variable interest gives the entity a controlling financial interest in a variable interest entity. The guidance also requires an ongoing reassessment of variable interests and eliminates the quantitative approach previously required for determining whether an entity is the primary beneficiary. This guidance, which was reissued by the FASB in December 2009 as ASU No. 2009-17, “Improvements to Financial Reporting by Enterprises Involved with Variable Interest Entities,” amends ASC Topic 810, “Consolidation,” and will be effective as of the beginning of an entity’s first annual reporting period that begins after November 15, 2009 (January 1, 2010 for the Company). The adoption of this guidance did not have a significant impact on the Company’s Consolidated Financial Statements.
RECENTLY ISSUED ACCOUNTING PRONOUNCEMENTS
In December 2010, the FASB issued ASU No. 2010-28, “When to Perform Step 2 of the Goodwill Impairment
Test for Reporting Units with Zero or Negative Carrying Amounts”, which amends ASC Topic 350, “Intangibles – Goodwill and Other”. ASU No. 2010-28 amends the ASC to require entities that have a reporting unit with a zero or negative carrying value to assess whether qualitative factors indicate that it is more likely than not that an impairment of goodwill exists, and if an entity concludes that it is more likely than not that an impairment exists, the entity must measure the goodwill impairment. The changes to the ASC as a result of this update are effective for annual and interim reporting periods beginning after December 15, 2010 (January 1, 2011 for the Company), and any impairment identified at the time of adoption will be recognized as a cumulative-effect adjustment to beginning retained earnings. The adoption of this guidance does not have any impact on the Company’s Consolidated Financial Statements.
In October 2009, the FASB issued ASU No. 2009-13, "Multiple-Deliverable Revenue Arrangements," which amends ASC Topic 605, "Revenue Recognition." ASU No. 2009-13 amends the ASC to eliminate the residual method of allocation for multiple-deliverable revenue arrangements, and requires that arrangement consideration be allocated at the inception of an arrangement to all deliverables using the relative selling price method. The ASU also establishes a selling price hierarchy for determining the selling price of a deliverable, which includes: (1) vendor-specific objective evidence if available, (2) third-party evidence if vendor-specific objective evidence is not available, and (3) estimated selling price if neither vendor-specific nor third-party evidence is available. Additionally, ASU No. 2009-13 expands the disclosure requirements related to a vendor's multiple-deliverable revenue arrangements. The changes to the ASC as a result of this update are effective prospectively for revenue arrangements entered into or materially modified in fiscal years beginning on or after June 15, 2010 (January 1, 2011 for the Company). The Company does not expect that the adoption of this guidance will have a significant impact on its Consolidated Financial Statements.
In October 2009, the FASB issued ASU No. 2009-14, "Certain Revenue Arrangements That Include Software Elements," which amends ASC Topic 985, "Software." ASU No. 2009-14 amends the ASC to change the accounting model for revenue arrangements that include both tangible products and software elements, such that tangible products containing both software and non-software components that
64
function together to deliver the tangible product's essential functionality are no longer within the scope of software revenue guidance. The changes to the ASC as a result of this update are effective prospectively for revenue arrangements entered into or materially modified in fiscal years beginning on or after June 15, 2010 (January 1, 2011 for the Company). The Company does not expect that the adoption of this guidance will have a significant impact on its Consolidated Financial Statements.
|
As of December 31,
|
||||||||
|
(in millions)
|
2010
|
2009
|
||||||
|
Trade receivables
|
$ | 1,137 | $ | 1,238 | ||||
|
Miscellaneous receivables
|
122 | 157 | ||||||
|
Total (net of allowances of $77 and $98 as of December 31, 2010 and 2009, respectively)
|
$ | 1,259 | $ | 1,395 | ||||
Approximately $224 million and $218 million of the total trade receivable amounts as of December 31, 2010 and 2009, respectively, are expected to be settled through customer deductions in lieu of cash payments. Such deductions represent rebates owed to the customer and are included in Other current liabilities in the accompanying Consolidated Statement of Financial Position at each respective balance sheet date.
|
(in millions)
|
As of December 31,
|
|||||||
|
2010
|
2009
|
|||||||
|
|
||||||||
|
Finished goods
|
$ | 421 | $ | 409 | ||||
|
Work in process
|
154 | 164 | ||||||
|
Raw materials
|
121 | 106 | ||||||
|
Total
|
$ | 696 | $ | 679 | ||||
|
(in millions)
|
As of December 31,
|
|||||||
|
2010
|
2009
|
|||||||
|
Land
|
$ | 43 | $ | 64 | ||||
|
Buildings and building improvements
|
1,413 | 1,512 | ||||||
|
Machinery and equipment
|
4,494 | 4,792 | ||||||
|
Construction in progress
|
72 | 64 | ||||||
| 6,022 | 6,432 | |||||||
|
Accumulated depreciation
|
(4,985 | ) | (5,178 | ) | ||||
|
Net properties
|
$ | 1,037 | $ | 1,254 | ||||
Depreciation expense was $318 million, $354 million, and $420 million for the years 2010, 2009, and 2008, respectively, of which approximately $6 million, $22 million, and $6 million, respectively, represented accelerated depreciation in connection with restructuring actions.
65
Goodwill was $294 million and $907 million as of December 31, 2010 and 2009, respectively. The changes in the carrying amount of goodwill by reportable segment for 2010 and 2009 were as follows:
|
(in millions)
|
|
Film,
|
||||||||||||||
|
Consumer
|
|
Photofinishing
|
||||||||||||||
|
Digital Imaging
|
Graphic Communications
|
and Entertainment
|
Consolidated
|
|||||||||||||
|
Group
|
Group
|
Group
|
Total
|
|||||||||||||
|
Balance as of December 31, 2008:
|
||||||||||||||||
|
Goodwill
|
$ | 195 | $ | 873 | $ | 613 | $ | 1,681 | ||||||||
|
Accumulated impairment losses
|
- | (785 | ) | - | (785 | ) | ||||||||||
| $ | 195 | $ | 88 | $ | 613 | $ | 896 | |||||||||
|
Additions
|
- | 4 | - | 4 | ||||||||||||
|
Purchase accounting adjustments
|
- | (1 | ) | - | (1 | ) | ||||||||||
|
Currency translation adjustments
|
- | 3 | 5 | 8 | ||||||||||||
|
Balance as of December 31, 2009:
|
||||||||||||||||
|
Goodwill
|
195 | 879 | 618 | 1,692 | ||||||||||||
|
Accumulated impairment losses
|
- | (785 | ) | - | (785 | ) | ||||||||||
| $ | 195 | $ | 94 | $ | 618 | $ | 907 | |||||||||
|
Impairment
|
- | - | (626 | ) | (626 | ) | ||||||||||
|
Currency translation adjustments
|
6 | (1 | ) | 8 | 13 | |||||||||||
|
Balance as of December 31, 2010:
|
||||||||||||||||
|
Goodwill
|
201 | 878 | 626 | 1,705 | ||||||||||||
|
Accumulated impairment losses
|
- | (785 | ) | (626 | ) | (1,411 | ) | |||||||||
| $ | 201 | $ | 93 | $ | - | $ | 294 | |||||||||
As of December 31, 2008, due to the continuing challenging business conditions and the significant decline in its market capitalization during the fourth quarter of 2008, the Company concluded there was an indication of possible impairment. Based on its updated analysis, the Company concluded that there was an impairment of goodwill related to the Graphic Communications Group (GCG) segment and, thus, recorded a pre-tax impairment charge of $785 million in the fourth quarter of 2008 that was included in Other operating expenses (income), net in the Consolidated Statement of Operations. The fair values of reporting units within the Company’s Consumer Digital Imaging Group (CDG) and Film, Photofinishing and Entertainment Group (FPEG) segments, and one of the two GCG reporting units were greater than their respective carrying values as of December 31, 2008, so no goodwill impairment was recorded for these reporting units. Reasonable changes in the assumptions used to determine these fair values would not have resulted in goodwill impairments in any of these reporting units.
On September 1, 2009, the Company completed the acquisition of the scanner division of BÖWE BELL + HOWELL, a global supplier of documents scanners to value-added resellers, system integrators, and end-users. The acquired scanner division is now a part of the Company’s GCG segment. As a result of the acquisition, the Company recorded $4 million and $8 million of goodwill and intangible assets, respectively.
As of December 31, 2010, due to continuing challenging business conditions driven, in part, by rising commodity prices and a continuation of significant declines in the FPEG business caused by digital substitution, the Company concluded there was an indication of a possible goodwill impairment related to the FPEG segment. Based on its updated goodwill analysis, including an updated forecast reflecting certain operational changes to manage the impact of these conditions, the Company concluded that there was an impairment of goodwill related to the FPEG segment as of December 31, 2010. The Company recorded a pre-tax impairment charge of $626 million in the fourth quarter of 2010 that was included in Other operating expenses (income), net in the Consolidated Statement of Operations.
66
The gross carrying amount and accumulated amortization by major intangible asset category as of December 31, 2010 and 2009 were as follows:
|
As of December 31, 2010
|
|||||||||||||
|
Gross Carrying
|
Accumulated
|
Weighted-Average
|
|||||||||||
|
(in millions)
|
Amount
|
Amortization
|
Net
|
Amortization Period
|
|||||||||
|
Technology-based
|
$ | 168 | $ | 135 | $ | 33 |
7 years
|
||||||
|
Customer-related
|
256 | 177 | 79 |
11 years
|
|||||||||
|
Other
|
29 | 17 | 12 |
14 years
|
|||||||||
|
Total
|
$ | 453 | $ | 329 | $ | 124 |
10 years
|
||||||
|
As of December 31, 2009
|
|||||||||||||
|
Gross Carrying
|
Accumulated
|
Weighted-Average
|
|||||||||||
|
(in millions)
|
Amount
|
Amortization
|
Net
|
Amortization Period
|
|||||||||
|
Technology-based
|
$ | 309 | $ | 241 | $ | 68 |
7 years
|
||||||
|
Customer-related
|
273 | 173 | 100 |
10 years
|
|||||||||
|
Other
|
64 | 48 | 16 |
11 years
|
|||||||||
|
Total
|
$ | 646 | $ | 462 | $ | 184 |
9 years
|
||||||
Amortization expense related to intangible assets was $60 million, $73 million, and $80 million for the years ended December 31, 2010, 2009, and 2008, respectively.
Estimated future amortization expense related to purchased intangible assets as of December 31, 2010 was as follows (in millions):
|
2011
|
$ | 39 | |||
|
2012
|
26 | ||||
|
2013
|
13 | ||||
|
2014
|
10 | ||||
|
2015
|
10 | ||||
| 2016+ | 26 | ||||
|
Total
|
$ | 124 |
|
As of December 31,
|
||||||||
|
(in millions)
|
2010
|
2009
|
||||||
|
Overfunded pension plans
|
$ | 48 | $ | 169 | ||||
|
Deferred income taxes, net of valuation allowance
|
695 | 607 | ||||||
|
Intangible assets
|
124 | 184 | ||||||
|
Other
|
242 | 267 | ||||||
|
Total
|
$ | 1,109 | $ | 1,227 | ||||
The Other component above consists of other miscellaneous long-term assets that, individually, were less than 5% of the Company’s total assets in the accompanying Consolidated Statement of Financial Position, and therefore, have been aggregated in accordance with Regulation S-X.
67
|
As of December 31,
|
||||||||
|
(in millions)
|
2010
|
2009
|
||||||
|
Accrued employment-related liabilities
|
$ | 420 | $ | 501 | ||||
|
Accrued customer rebates, advertising and promotional expenses
|
322 | 369 | ||||||
|
Deferred revenue
|
178 | 275 | ||||||
|
Accrued restructuring liabilities
|
42 | 95 | ||||||
|
Other
|
519 | 652 | ||||||
|
Total
|
$ | 1,481 | $ | 1,892 | ||||
The Other component above consists of other miscellaneous current liabilities that, individually, were less than 5% of the Total current liabilities component within the Consolidated Statement of Financial Position, and therefore, have been aggregated in accordance with Regulation S-X.
SHORT-TERM BORROWINGS AND CURRENT PORTION OF LONG-TERM DEBT
The Company’s current portion of long-term debt was $50 million and $62 million as of December 31, 2010 and 2009, respectively. There were no amounts outstanding under short-term bank borrowings as of December 31, 2010 and 2009.
LONG-TERM DEBT, INCLUDING LINES OF CREDIT
Long-term debt and related maturities and interest rates were as follows:
|
As of December 31,
|
|||||||||||||||||||||
|
(in millions)
|
2010
|
2009
|
|||||||||||||||||||
|
Weighted-Average
|
Weighted-Average
|
||||||||||||||||||||
|
Effective Interest
|
Amount
|
Effective Interest
|
Amount
|
||||||||||||||||||
|
Country
|
Type
|
Maturity
|
Rate
|
Outstanding
|
Rate
|
Outstanding
|
|||||||||||||||
|
U.S.
|
Convertible
|
2010
|
- | $ | - | 3.38 | % | $ | 12 | ||||||||||||
|
U.S.
|
Term note
|
2010-2013 | 6.16 | % | 27 | 6.16 | % | 35 | |||||||||||||
|
Germany
|
Term note
|
2010-2013 | 6.16 | % | 109 | 6.16 | % | 141 | |||||||||||||
|
U.S.
|
Term note
|
2013 | 7.25 | % | 300 | 7.25 | % | 500 | |||||||||||||
|
U.S.
|
Secured term note
|
2017 | - | - | 19.36 | % | 195 | ||||||||||||||
|
U.S.
|
Secured term note
|
2018 | 10.11 | % | 491 | - | - | ||||||||||||||
|
U.S.
|
Convertible
|
2017 | 12.75 | % | 305 | 12.75 | % | 295 | |||||||||||||
|
U.S.
|
Term note
|
2018 | 9.95 | % | 3 | 9.95 | % | 3 | |||||||||||||
|
U.S.
|
Term note
|
2021 | 9.20 | % | 10 | 9.20 | % | 10 | |||||||||||||
| 1,245 | 1,191 | ||||||||||||||||||||
|
Current portion of long-term debt
|
(50 | ) | (62 | ) | |||||||||||||||||
|
Long-term debt, net of current portion
|
$ | 1,195 | $ | 1,129 | |||||||||||||||||
68
Annual maturities (in millions) of long-term debt outstanding at December 31, 2010 were as follows:
|
Carrying
|
Principal
|
|||||||
|
Value
|
Amount
|
|||||||
|
2011
|
$ | 50 | $ | 50 | ||||
|
2012
|
45 | 50 | ||||||
|
2013
|
341 | 350 | ||||||
|
2014
|
- | - | ||||||
|
2015
|
- | - | ||||||
|
2016 and thereafter
|
809 | 913 | ||||||
|
Total
|
$ | 1,245 | $ | 1,363 | ||||
Senior Secured Notes due 2018
On March 5, 2010, the Company issued $500 million of aggregate principal amount of 9.75% senior secured notes due March 1, 2018 (the “2018 Senior Secured Notes”). The Company will pay interest at an annual rate of 9.75% of the principal amount at issuance, payable semi-annually in arrears on March 1 and September 1 of each year, beginning on September 1, 2010.
Upon issuance of the 2018 Senior Secured Notes, the Company received net proceeds of approximately $490 million ($500 million aggregate principal less $10 million stated discount). The proceeds were used to repurchase all of the Senior Secured Notes due 2017 and to fund the tender of $200 million of the 7.25% Senior Notes due 2013.
In connection with the 2018 Senior Secured Notes, the Company and the subsidiary guarantors (as defined below) entered into an indenture, dated as of March 5, 2010, with Bank of New York Mellon as trustee and collateral agent (the “Indenture”).
At any time prior to March 1, 2014, the Company will be entitled at its option to redeem some or all of the 2018 Senior Secured Notes at a redemption price of 100% of the principal plus accrued and unpaid interest and a “make-whole” premium (as defined in the Indenture). On and after March 1, 2014, the Company may redeem some or all of the 2018 Senior Secured Notes at certain redemption prices expressed as percentages of the principal plus accrued and unpaid interest. In addition, prior to March 31, 2013, the Company may redeem up to 35% of the 2018 Senior Secured Notes at a redemption price of 109.75% of the principal plus accrued and unpaid interest using proceeds from certain equity offerings, provided the redemption takes place within 120 days after the closing of the related equity offering and not less than 65% of the original aggregate principal remains outstanding immediately thereafter.
Upon the occurrence of a change of control, each holder of the 2018 Senior Secured Notes has the right to require the Company to repurchase some or all of such holder’s 2018 Senior Secured Notes at a purchase price in cash equal to 101% of the principal amount thereof, plus accrued and unpaid interest, if any, to the repurchase date.
The Indenture contains covenants limiting, among other things, the Company’s ability and the ability of the Company’s restricted subsidiaries (as defined in the Indenture) to (subject to certain exceptions and qualifications): incur additional debt or issue certain preferred stock; pay dividends or make distributions in respect of capital stock or make other restricted payments; make principal payments on, or purchase or redeem subordinated indebtedness prior to any scheduled principal payment or maturity; make certain investments; sell certain assets; create liens on assets; consolidate, merge, sell or otherwise dispose of all or substantially all of the Company’s and its subsidiaries’ assets; enter into certain transactions with affiliates; and designate the Company’s subsidiaries as unrestricted subsidiaries. The Company was in compliance with these covenants as of December 31, 2010.
The 2018 Senior Secured Notes are fully and unconditionally guaranteed (the “guarantees”) on a senior secured basis by each of the Company’s existing and future direct or indirect 100% owned domestic subsidiaries, subject to certain exceptions (the “Subsidiary Guarantors”). The 2018 Senior Secured Notes and guarantees are secured by second-priority liens, subject to permitted liens, on substantially all of the Company’s domestic assets and substantially all of the domestic assets of the Subsidiary Guarantors pursuant to a security agreement entered into with Bank of New York Mellon as second lien collateral agent on March 5, 2010. The carrying value of the assets pledged as collateral at December 31, 2010 was approximately $2 billion.
69
The 2018 Senior Secured Notes are the Company’s senior secured obligations and rank senior in right of payment to any future subordinated indebtedness; rank equally in right of payment with all of the Company’s existing and future senior indebtedness; are effectively senior in right of payment to the Company’s existing and future unsecured indebtedness, are effectively subordinated in right of payment to indebtedness under the Company’s Amended Credit Agreement (as defined below) to the extent of the collateral securing such indebtedness on a first-priority basis; and effectively are subordinated in right of payment to all existing and future indebtedness and other liabilities of the Company’s non-guarantor subsidiaries.
Certain events are considered events of default and may result in the acceleration of the maturity of the 2018 Senior Secured Notes including, but not limited to: default in the payment of principal or interest when it becomes due and payable; subject to applicable grace periods, failure to purchase Senior Secured Notes tendered when and as required; events of bankruptcy; and non-compliance with other provisions and covenants and the acceleration or default in the payment of principal of other forms of debt. If an event of default occurs, the aggregate principal amount and accrued and unpaid interest may become due and payable immediately.
2017 Convertible Senior Notes
On September 23, 2009, the Company issued $400 million of aggregate principal amount of 7% convertible senior notes due April 1, 2017 (the “2017 Convertible Notes”). The Company will pay interest at an annual rate of 7% of the principal amount at issuance, payable semi-annually in arrears on April 1 and October 1 of each year, beginning on April 1, 2010.
The 2017 Convertible Notes are convertible at an initial conversion rate of 134.9528 shares of the Company’s common stock per $1,000 principal amount of convertible notes (representing an initial conversion price of approximately $7.41 per share of common stock) subject to adjustment in certain circumstances. Holders may surrender their 2017 Convertible Notes for conversion at any time prior to the close of business on the business day immediately preceding the maturity date for the notes. Upon conversion, the Company shall deliver or pay, at its election, solely shares of its common stock or solely cash. Holders of the 2017 Convertible Notes may require the Company to purchase all or a portion of the convertible notes at a price equal to 100% of the principal amount of the convertible notes to be purchased, plus accrued and unpaid interest, in cash, upon occurrence of certain fundamental changes involving the Company including, but not limited to, a change in ownership, consolidation or merger, plan of dissolution, or common stock delisting from a U.S. national securities exchange.
The Company may redeem the 2017 Convertible Notes in whole or in part for cash at any time on or after October 1, 2014 and before October 1, 2016 if the closing sale price of the common stock for at least 20 of the 30 consecutive trading days ending within three trading days prior to the date the Company provides notice of redemption exceeds 130% of the conversion price in effect on each such trading day, or at any time on or after October 1, 2016 and prior to maturity regardless of the sale price of the Company’s common stock. The redemption price will equal 100% of the principal amount of the Notes to be redeemed, plus any accrued and unpaid interest.
In accordance with U.S. GAAP, the principal amount of the 2017 Convertible Notes was allocated to debt at the estimated fair value of the debt component of the notes at the time of issuance, with the residual amount allocated to the equity component. Approximately $293 million and $107 million of the principal amount were initially allocated to the debt and equity components respectively, and reported as Long-term debt, net of current portion and Additional paid-in capital, respectively. The initial carrying value of the debt of $293 million will be accreted up to the $400 million stated principal amount using the effective interest method over the 7.5 year term of the notes. Accretion of the principal will be reported as a component of interest expense. Accordingly, the Company will recognize annual interest expense on the debt at an effective interest rate of 12.75%.
The 2017 Convertible Notes are the Company’s senior unsecured obligations and rank: (i) senior in right of payment to the Company’s existing and future indebtedness that is expressly subordinated in right of payment to the 2017 Convertible Notes; (ii) equal in right of payment to the Company’s existing and future unsecured indebtedness that is not so subordinated; (iii) effectively subordinated in right of payment to any of the Company’s secured indebtedness to the extent of the value of the assets securing such indebtedness; and (iv) structurally subordinated to all existing and future indebtedness and obligations incurred by the Company’s subsidiaries including guarantees of the Company’s obligations by such subsidiaries.
70
Certain events are considered events of default and may result in the acceleration of the maturity of the 2017 Convertible Notes including, but not limited to: default in the payment of principal or interest when it becomes due and payable; failure to comply with an obligation to convert the 2017 Convertible Notes; not timely reporting a fundamental change; events of bankruptcy; and non-compliance with other provisions and covenants and other forms of indebtedness for borrowed money. If an event of default occurs, the aggregate principal amount and accrued and unpaid interest may become due and payable immediately.
Senior Notes due 2013
On October 10, 2003, the Company completed the offering and sale of $500 million aggregate principal amount of Senior Notes due 2013 (the “2013 Notes”), which was made pursuant to the Company's shelf registration statement on Form S-3 effective September 19, 2003. Interest on the 2013 Notes will accrue at the rate of 7.25% per annum and is payable semiannually. The 2013 Notes are not redeemable at the Company's option or repayable at the option of any holder prior to maturity. The 2013 Notes are unsecured and unsubordinated obligations, and rank equally with all of the Company's other unsecured and unsubordinated indebtedness.
On March 10, 2010, the Company accepted for purchase $200 million aggregate principal amount of the 2013 Notes pursuant to the terms of a tender offer that commenced on February 3, 2010. Holders who validly tendered their 2013 Notes received cash equal to approximately 95% of the principal amount of the 2013 Notes accepted in the tender offer plus accrued and unpaid interest.
The repurchase of the 2013 Notes resulted in a gain on early debt extinguishment of approximately $9 million, reported in Loss on early extinguishment of debt, net in the Consolidated Statement of Operations for the year ended December 31, 2010. The gain was a result of the principal repayment of approximately $190 million being less than the carrying value of the repurchased debt of $200 million. As of December 31, 2010, $300 million of the 2013 Notes remain outstanding.
Repurchase of Senior Secured Notes due 2017
On February 24, 2010, the Company entered into an agreement with affiliates of Kohlberg, Kravis, Roberts & Co. L.P. (“KKR”) to repurchase all $300 million aggregate principal amount of the Company’s 10.5% Senior Secured Notes due 2017 previously issued to KKR (the “KKR Notes”).
On March 5, 2010, the Company completed the repurchase of the KKR Notes. KKR received cash equal to 100% of the principal amount plus accrued and unpaid interest. The repurchase of the KKR Notes resulted in a loss on early debt extinguishment of $111 million, which was reported in Loss on early extinguishment of debt, net in the Consolidated Statement of Operations for the year ended December 31, 2010. This loss was primarily the result of the principal repayment of $300 million exceeding the carrying value of the KKR Notes of approximately $195 million as of the repurchase date.
Amended Credit Agreement
On March 31, 2009, the Company and its subsidiary, Kodak Canada Inc. (together, the “Borrowers”), together with the Company’s U.S. subsidiaries as guarantors (the “Guarantors”), entered into an Amended and Restated Credit Agreement, with the named lenders (the “Lenders”) and Citicorp USA, Inc. as agent, in order to amend and extend its Credit Agreement dated as of October 18, 2005 (the “Secured Credit Agreement”).
On September 17, 2009, the Borrowers, together with the Guarantors, further amended the Amended and Restated Credit Agreement with the Lenders and Citicorp USA, Inc. as agent, in order to allow collateral under this agreement to be pledged on a second-lien basis and for the Company to issue $700 million in aggregate principal amount of debt, the net proceeds of which were used to repurchase its then existing $575 million Convertible Senior Notes due 2033 as well as for other general corporate purposes. The Amended and Restated Credit Agreement and Amendment No. 1 to the Amended and Restated Credit Agreement dated September 17, 2009 are collectively hereinafter referred to as the “Amended Credit Agreement.”
On February 10, 2010, the Borrowers, together with the Guarantors, agreed to amend the Amended Credit Agreement with the named lenders and Citicorp, USA, Inc., as agent, in order to allow the Company to incur additional permitted senior debt of up to $200 million aggregate principal amount, and debt that refinances existing debt and permitted senior debt so long as the refinancing debt meets certain requirements. In connection with the amendment, the Company reduced the commitments of its non-extending lenders by approximately $125 million. This change did not reduce the maximum borrowing availability of up to $500 million under the Amended Credit Agreement at that time. On October 18, 2010, the non-extending lender commitments expired capping the Company's borrowing limit to the $410 million of
71
extending lender commitments as of that date. The Company may add additional lender commitments to the Amended Credit Agreement up to the maximum borrowing availability of $500 million. The termination date of the Amended Credit Agreement is March 31, 2012.
Advances under the Amended Credit Agreement are available based on the Borrowers’ respective borrowing base from time to time. The borrowing base is calculated based on designated percentages of eligible accounts receivable, inventory, machinery and equipment and, once mortgages are recorded, certain real property, subject to applicable reserves. As of December 31, 2010, based on this borrowing base calculation and after deducting the face amount of letters of credit outstanding of $122 million and $90 million of collateral to secure other banking arrangements, the Company had $192 million available to borrow under the Amended Credit Agreement.
The Amended Credit Agreement provides that advances made from time to time will bear interest at applicable margins over the Base Rate, as defined, or the Eurodollar Rate. The Company pays, on a quarterly basis, an annual fee ranging from 0.50% to 1.00% to the Lenders based on the unused commitments.
Under the terms of the Amended Credit Agreement, the Company has agreed to certain affirmative and negative covenants customary in similar asset-based lending facilities. In the event the Company’s excess availability under the borrowing base formula under the Amended Credit Agreement falls below $100 million for three consecutive business days, among other things, the Company must maintain a fixed charge coverage ratio of not less than 1.1 to 1.0 until the excess availability is greater than $100 million for 30 consecutive days. For the year ended December 31, 2010, excess availability was greater than $100 million. The Company is also required to maintain cash and cash equivalents in the U.S. of at least $250 million. The negative covenants limit, under certain circumstances, among other things, the Company’s ability to incur additional debt or liens, make certain investments, make shareholder distributions or prepay debt, except as permitted under the terms of the Amended Credit Agreement. The Company was in compliance with all covenants under the Amended Credit Agreement as of December 31, 2010.
The Amended Credit Agreement contains customary events of default, including without limitation, payment defaults (subject to grace and cure periods in certain circumstances), breach of representations and warranties, breach of covenants (subject to grace and cure periods in certain circumstances), bankruptcy events, ERISA events, cross defaults to certain other indebtedness, certain judgment defaults and change of control. If an event of default occurs and is continuing, the Lenders may decline to provide additional advances, impose a default rate of interest, declare all amounts outstanding under the Amended Credit Agreement immediately due and payable, and require cash collateralization or similar arrangements for outstanding letters of credit.
The obligations of the Borrowers are secured by liens on substantially all of their non-real estate assets and by a pledge of 65% of the stock of certain of the Company’s material non-U.S. subsidiaries, pursuant to Amended and Restated U.S. and Canadian Security Agreements. In addition, the Company may mortgage certain U.S. real property for inclusion in the borrowing base for advances under the Amended Credit Agreement. The security interests are limited to the extent necessary so that they do not trigger the cross-collateralization requirements under the Company’s indenture with Bank of New York as trustee, dated as of January 1, 1988, as amended by various supplemental indentures.
As of December 31, 2010, the Company had no debt for borrowed money outstanding under the Amended Credit Agreement, but had outstanding letters of credit under the Amended Credit Agreement of $122 million. In addition to these letters of credit, there were bank guarantees and letters of credit of $18 million and surety bonds of $23 million outstanding under other banking arrangements primarily to ensure payment of possible casualty and workers’ compensation claims, environmental liabilities, legal contingencies, rental payments, and to support various customs and trade activities.
In addition to the Amended Credit Agreement, the Company has other committed and uncommitted lines of credit as of December 31, 2010 totaling $19 million and $131 million, respectively. These lines primarily support operational and borrowing needs of the Company’s subsidiaries, which include term loans, overdraft coverage, revolving credit lines, letters of credit, bank guarantees and vendor financing programs. Interest rates and other terms of borrowing under these lines of credit vary from country to country, depending on local market conditions. As of December 31, 2010, usage under these lines was approximately $51 million all of which were supporting non-debt related obligations.
72
|
As of December 31,
|
||||||||
|
(in millions)
|
2010
|
2009
|
||||||
|
Non-current tax-related liabilities
|
$ | 160 | $ | 477 | ||||
|
Environmental liabilities
|
103 | 102 | ||||||
|
Asset retirement obligations
|
57 | 62 | ||||||
|
Deferred compensation
|
29 | 39 | ||||||
|
Other
|
276 | 325 | ||||||
|
Total
|
$ | 625 | $ | 1,005 | ||||
The Other component above consists of other miscellaneous long-term liabilities that, individually, were less than 5% of the total liabilities component in the accompanying Consolidated Statement of Financial Position, and therefore, have been aggregated in accordance with Regulation S-X.
Environmental
Cash expenditures for pollution prevention and waste treatment for the Company's current facilities were as follows:
|
For the Year Ended December 31,
|
||||||||||||
|
(in millions)
|
2010
|
2009
|
2008
|
|||||||||
|
Recurring costs for pollution
prevention and waste treatment
|
$ | 34 | $ | 37 | $ | 48 | ||||||
|
Capital expenditures for pollution
prevention and waste treatment
|
1 | 3 | 2 | |||||||||
|
Site remediation costs
|
2 | 2 | 3 | |||||||||
|
Total
|
$ | 37 | $ | 42 | $ | 53 | ||||||
Environmental expenditures that relate to an existing condition caused by past operations and that do not provide future benefits are expensed as incurred. Costs that are capital in nature and that provide future benefits are capitalized. Liabilities are recorded when environmental assessments are made or the requirement for remedial efforts is probable, and the costs can be reasonably estimated. The timing of accruing for these remediation liabilities is generally no later than the completion of feasibility studies. The Company has an ongoing monitoring and identification process to assess how the activities, with respect to the known exposures, are progressing against the accrued cost estimates, as well as to identify other potential remediation sites that are presently unknown.
At December 31, 2010 and 2009, the Company’s undiscounted accrued liabilities for environmental remediation costs amounted to $103 million and $102 million, respectively. These amounts were reported in Other long-term liabilities in the accompanying Consolidated Statement of Financial Position.
The Company is currently implementing a Corrective Action Program required by the Resource Conservation and Recovery Act (“RCRA”) at Eastman Business Park (formerly known as Kodak Park) in Rochester, NY. The Company is currently in the process of completing, and in many cases has completed, RCRA Facility Investigations (“RFI”), Corrective Measures Studies (CMS) and Corrective Measures Implementation (“CMI”) for areas at the site. At December 31, 2010, estimated future investigation and remediation costs of $53 million were accrued for this site, the majority of which relates to long-term operation, maintenance of remediation systems and monitoring costs.
In addition, the Company has accrued for obligations with estimated future investigation, remediation and monitoring costs of $11 million relating to other operating sites, $20 million at sites associated with former operations, and $19 million of retained obligations for environmental remediation and Superfund matters related to certain sites associated with the non-imaging health businesses sold in 1994.
73
Cash expenditures for the aforementioned investigation, remediation and monitoring activities are expected to be incurred over the next twenty-five to thirty years for most of the sites. For these known environmental liabilities, the accrual reflects the Company’s best estimate of the amount it will incur under the agreed-upon or proposed work plans. The Company’s cost estimates were determined using the ASTM Standard E 2137-06, "Standard Guide for Estimating Monetary Costs and Liabilities for Environmental Matters," and have not been reduced by possible recoveries from third parties. The overall method includes the use of a probabilistic model which forecasts a range of cost estimates for the remediation required at individual sites. The projects are closely monitored and the models are reviewed as significant events occur or at least once per year. The Company’s estimate includes investigations, equipment and operating costs for remediation and long-term monitoring of the sites.
The Company is presently designated as a potentially responsible party (“PRP”) under the Comprehensive Environmental Response, Compensation and Liability Act of 1980, as amended (the “Superfund Law”), or under similar state laws, for environmental assessment and cleanup costs as the result of the Company’s alleged arrangements for disposal of hazardous substances at eight Superfund sites. With respect to each of these sites, the Company’s liability is minimal. In addition, the Company has been identified as a PRP in connection with the non-imaging health businesses in two active Superfund sites. Numerous other PRPs have also been designated at these sites. Although the law imposes joint and several liability on PRPs, the Company’s historical experience demonstrates that these costs are shared with other PRPs. Settlements and costs paid by the Company in Superfund matters to date have not been material.
The Company has been named as third-party defendant (along with approximately 200 other entities) in an action initially brought by the New Jersey Department of Environmental Protection (NJDEP) in the Supreme Court of New Jersey, Essex County against Occidental Chemical corporation and several other companies that are successors in interest to Diamond Shamrock Corporation. The NJDEP seeks recovery of all costs associated with the investigation, removal, cleanup and damage to natural resources occasioned by Diamond Shamrock’s disposal of various forms of chemicals in the Passaic River. The damages are alleged to potentially range “from hundreds of millions to several billions of dollars.” Pursuant to New Jersey’s Court Rules, the defendants were required to identify all other parties which could be subject to permissive joinder in the litigation based on common questions of law or fact. Third-party complaints seeking contribution from more than 200 entities, which have been identified as potentially contributing to the contamination in the Passaic, were filed on February 5, 2009. Based on currently available information, the Company is unable to determine the likelihood or reasonably estimate a range of loss pertaining to this matter at this time.
Uncertainties associated with environmental remediation contingencies are pervasive and often result in wide ranges of outcomes. Estimates developed in the early stages of remediation can vary significantly. A finite estimate of costs does not normally become fixed and determinable at a specific time. Rather, the costs associated with environmental remediation become estimable over a continuum of events and activities that help to frame and define a liability, and the Company continually updates its cost estimates. The Company has an ongoing monitoring and identification process to assess how the activities, with respect to the known exposures, are progressing against the accrued cost estimates, as well as to identify other potential remediation issues.
Estimates of the amount and timing of future costs of environmental remediation requirements are by their nature imprecise because of the continuing evolution of environmental laws and regulatory requirements, the availability and application of technology, the identification of presently unknown remediation sites and the allocation of costs among the potentially responsible parties. Based on information presently available, the Company does not believe it is reasonably possible that losses for known exposures could exceed current accruals by material amounts, although costs could be material to a particular quarter or year, with the possible exception of matters related to the Passaic River, which are described above.
A Consent Decree was signed in 1994 in settlement of a civil complaint brought by the U.S. Environmental Protection Agency (“EPA”) and the U.S. Department of Justice. In connection with the Consent Decree, the Company performed various activities, and submitted a certification stating that it has completed the requirements of the Consent Decree. The Company received an acknowledgement of completion from the EPA on February 5, 2010, and the Consent Decree was terminated by the court overseeing this matter on October 26, 2010.
74
Asset Retirement Obligations
As of December 31, 2010 and 2009, the Company has recorded approximately $57 million and $62 million, respectively, of asset retirement obligations within Other long-term liabilities in the accompanying Consolidated Statement of Financial Position. The Company’s asset retirement obligations primarily relate to asbestos contained in buildings that the Company owns. In many of the countries in which the Company operates, environmental regulations exist that require the Company to handle and dispose of asbestos in a special manner if a building undergoes major renovations or is demolished. Otherwise, the Company is not required to remove the asbestos from its buildings. The Company records a liability equal to the estimated fair value of its obligation to perform asset retirement activities related to the asbestos, computed using an expected present value technique, when sufficient information exists to calculate the fair value. The Company does not have a liability recorded related to every building that contains asbestos because the Company cannot estimate the fair value of its obligation for certain buildings due to a lack of sufficient information about the range of time over which the obligation may be settled through demolition, renovation or sale of the building.
The following table provides asset retirement obligation activity:
|
For the Year Ended December 31,
|
||||||||||||
|
(in millions)
|
2010
|
2009
|
2008
|
|||||||||
|
Asset retirement obligations as of January 1
|
$ | 62 | $ | 67 | $ | 64 | ||||||
|
Liabilities incurred in the current period
|
- | 4 | 9 | |||||||||
|
Liabilities settled in the current period
|
(8 | ) | (13 | ) | (9 | ) | ||||||
|
Accretion expense
|
3 | 3 | 3 | |||||||||
|
Other
|
- | 1 | - | |||||||||
|
Asset retirement obligations as of December 31
|
$ | 57 | $ | 62 | $ | 67 | ||||||
Other Commitments and Contingencies
The Company has entered into noncancelable agreements with several companies, which provide Kodak with products and services to be used in its normal operations. These agreements are related to raw materials, supplies, production and administrative services, as well as marketing and advertising. The terms of these agreements cover the next one to eleven years. The minimum payments for obligations under these agreements are approximately $340 million in 2011, $271 million in 2012, $40 million in 2013, $18 million in 2014, $16 million in 2015 and $32 million in 2016 and thereafter.
Rental expense, net of minor sublease income, amounted to $96 million, $108 million, and $117 million in 2010, 2009, and 2008, respectively. The approximate amounts of noncancelable lease commitments with terms of more than one year, principally for the rental of real property, reduced by minor sublease income, are $75 million in 2011, $66 million in 2012, $45 million in 2013, $27 million in 2014, $21 million in 2015 and $58 million in 2016 and thereafter.
In December 2003, the Company sold a property in France for approximately $65 million, net of direct selling costs, and then leased back a portion of this property for a nine-year term. The entire gain on the property sale of approximately $57 million was deferred and no gain was recognizable upon the closing of the sale as the Company's continuing involvement in the property is deemed to be significant. As a result, the Company is accounting for the transaction as a financing transaction. Future minimum lease payments under this noncancelable lease commitment are approximately $5 million per year for 2010 through 2012.
The Company’s Brazilian operations are involved in governmental assessments of indirect and other taxes in various stages of litigation, primarily related to federal and state value-added taxes. The Company is disputing these matters and intends to vigorously defend its position. Based on the opinion of legal counsel and current reserves already recorded for those matters deemed probable of loss, management does not believe that the ultimate resolution of these matters will materially impact the Company’s results of operations or financial position. The Company routinely assesses all these matters as to the probability of ultimately incurring a liability in its Brazilian operations and records its best estimate of the ultimate loss in situations where it assesses the likelihood of loss as probable. As of December 31, 2010, the unreserved portion of these contingencies, inclusive of any related interest and penalties, for which there was at least a reasonable possibility that a loss may be incurred, amounted to approximately $69 million.
75
In 2008, the Company recorded a contingency accrual of approximately $21 million related to employment litigation matters in the U.S. The employment litigation matters related to a number of cases, which had similar fact patterns related to legacy equal employment opportunity issues. On April 27, 2009, the plaintiffs filed an unopposed motion for preliminary approval of a settlement in this action pursuant to which the Company established a settlement fund in the amount of $21 million that will be used for payments to plaintiffs and class members, as well as attorney's fees, litigation costs, and claims administration costs. The settlement has been approved by the court, and as of January 2011, all amounts related to these matters have been paid.
The Company and its subsidiaries are involved in various lawsuits, claims, investigations and proceedings, including commercial, customs, employment, environmental, and health and safety matters, which are being handled and defended in the ordinary course of business. In addition, the Company is subject to various assertions, claims, proceedings and requests for indemnification concerning intellectual property, including patent infringement suits involving technologies that are incorporated in a broad spectrum of the Company’s products. These matters are in various stages of investigation and litigation and are being vigorously defended. Although the Company does not expect that the outcome in any of these matters, individually or collectively, will have a material adverse effect on its financial condition or results of operations, litigation is inherently unpredictable. Therefore, judgments could be rendered or settlements entered that could adversely affect the Company’s operating results or cash flow in a particular period. The Company routinely assesses all its litigation and threatened litigation as to the probability of ultimately incurring a liability, and records its best estimate of the ultimate loss in situations where it assesses the likelihood of loss as probable.
The Company guarantees debt and other obligations of certain customers. The debt and other obligations are primarily due to banks and leasing companies in connection with financing of customers’ purchases of equipment and product from the Company. At December 31, 2010, the maximum potential amount of future payments (undiscounted) that the Company could be required to make under these customer-related guarantees was $47 million. At December 31, 2010, the carrying amount of any liability related to these customer guarantees was not material.
The customer financing agreements and related guarantees, which mature between 2011 and 2016, typically have a term of 90 days for product and short-term equipment financing arrangements, and up to five years for long-term equipment financing arrangements. These guarantees would require payment from the Company only in the event of default on payment by the respective debtor. In some cases, particularly for guarantees related to equipment financing, the Company has collateral or recourse provisions to recover and sell the equipment to reduce any losses that might be incurred in connection with the guarantees. However, any proceeds received from the liquidation of these assets may not cover the maximum potential loss under these guarantees.
Eastman Kodak Company (“EKC”) also guarantees potential indebtedness to banks and other third parties for some of its consolidated subsidiaries. The maximum amount guaranteed is $261 million, and the outstanding amount for those guarantees is $238 million with $109 million recorded within the Short-term borrowings and current portion of long-term debt, and Long-term debt, net of current portion components in the accompanying Consolidated Statement of Financial Position. These guarantees expire in 2010 through 2019. Pursuant to the terms of the Company's Amended Credit Agreement, obligations of the Borrowers to the Lenders under the Amended Credit Agreement, as well as secured agreements in an amount not to exceed $100 million, are guaranteed by the Company and the Company’s U.S. subsidiaries and included in the above amounts. These secured agreements totaled $90 million as of December 31, 2010.
During the fourth quarter of 2007, EKC issued a guarantee to Kodak Limited (the “Subsidiary”) and the Trustees (the “Trustees”) of the Kodak Pension Plan of the United Kingdom (the “Plan”). Under that arrangement, EKC guaranteed to the Subsidiary and the Trustees the ability of the Subsidiary, only to the extent it becomes necessary to do so, to (1) make contributions to the Plan to ensure sufficient assets exist to make plan benefit payments, and (2) make contributions to the Plan such that it will achieve full funded status by the funding valuation for the period ending December 31, 2015. On October 12, 2010, the 2007 guarantee was replaced by a new guarantee from EKC to the Subsidiary and the Trustees. The new guarantee continues to guarantee the Subsidiary’s ability to make contributions as set forth in the 2007 guarantee but extends the full funding date to December 31, 2022. The new guarantee expires (a) upon the conclusion of the funding valuation for the period ending December 31, 2022 if the Plan achieves full funded status or on payment of the balance if the Plan is underfunded by no more than
76
60 million British pounds by that date, (b) earlier in the event that the Plan achieves full funded status for two consecutive funding valuation cycles which are typically performed at least every three years, or (c) June 30, 2024 on payment of the balance in the event that the Plan is underfunded by more than 60 million British pounds upon conclusion of the funding valuation for the period ending December 31, 2022. The amount of potential future contributions is dependent on the funding status of the Plan as it fluctuates over the term of the guarantee and the United Kingdom Pension Regulator's approval of a funding plan agreed to by the Subsidiary and the Trustees to close the funding gap identified by the Plan’s most recent local statutory funding valuation agreed to in March 2009. The funded status of the Plan (calculated in accordance with U.S. GAAP) is included in Pension and other postretirement liabilities presented in the Consolidated Statement of Financial Position.
Indemnifications
The Company issues indemnifications in certain instances when it sells businesses and real estate, and in the ordinary course of business with its customers, suppliers, service providers and business partners. Further, the Company indemnifies its directors and officers who are, or were, serving at the Company's request in such capacities. Historically, costs incurred to settle claims related to these indemnifications have not been material to the Company’s financial position, results of operations or cash flows. Additionally, the fair value of the indemnifications that the Company issued during the year ended December 31, 2010 was not material to the Company’s financial position, results of operations or cash flows.
Warranty Costs
The Company has warranty obligations in connection with the sale of its products and equipment. The original warranty period is generally one year or less. The costs incurred to provide for these warranty obligations are estimated and recorded as an accrued liability at the time of sale. The Company estimates its warranty cost at the point of sale for a given product based on historical failure rates and related costs to repair. The change in the Company's accrued warranty obligations balance, which is reflected in Other current liabilities in the accompanying Consolidated Statement of Financial Position, was as follows:
|
(in millions)
|
||||
|
Accrued warranty obligations as of December 31, 2008
|
$ | 65 | ||
|
Actual warranty experience during 2009
|
(92 | ) | ||
|
2009 warranty provisions
|
88 | |||
|
Accrued warranty obligations as of December 31, 2009
|
$ | 61 | ||
|
Actual warranty experience during 2010
|
(72 | ) | ||
|
2010 warranty provisions
|
54 | |||
|
Accrued warranty obligations as of December 31, 2010
|
$ | 43 | ||
77
The Company also offers its customers extended warranty arrangements that are generally one year, but may range from three months to three years after the original warranty period. The Company provides repair services and routine maintenance under these arrangements. The Company has not separated the extended warranty revenues and costs from the routine maintenance service revenues and costs, as it is not practicable to do so. Therefore, these revenues and costs have been aggregated in the discussion that follows. The change in the Company's deferred revenue balance in relation to these extended warranty and maintenance arrangements, which is reflected in Other current liabilities in the accompanying Consolidated Statement of Financial Position, was as follows:
|
(in millions)
|
||||
|
Deferred revenue as of December 31, 2008
|
$ | 153 | ||
|
New extended warranty and maintenance arrangements in 2009
|
413 | |||
|
Recognition of extended warranty and maintenance
arrangement revenue in 2009
|
(436 | ) | ||
|
Deferred revenue as of December 31, 2009
|
$ | 130 | ||
|
New extended warranty and maintenance arrangements in 2010
|
438 | |||
|
Recognition of extended warranty and maintenance
arrangement revenue in 2010
|
(438 | ) | ||
|
Deferred revenue as of December 31, 2010
|
$ | 130 | ||
Costs incurred under these extended warranty and maintenance arrangements for the years ended December 31, 2010 and 2009 amounted to $172 million and $193 million, respectively.
78
The following table presents the carrying amounts, estimated fair values, and location in the Consolidated Statement of Financial Position for the Company’s financial instruments:
|
Assets
|
|||||||||||||||||
|
(in millions)
|
December 31, 2010
|
December 31, 2009
|
|||||||||||||||
|
|
Carrying Amount
|
Fair Value
|
Carrying Amount
|
Fair Value
|
|||||||||||||
|
Marketable securities:
|
|||||||||||||||||
|
Available-for-sale (1)
|
Other current assets and Other long-term assets
|
$ | 10 | $ | 10 | $ | 7 | $ | 7 | ||||||||
|
Held-to-maturity (2)
|
Other current assets and Other long-term assets
|
8 | 8 | 8 | 9 | ||||||||||||
|
Derivatives designated as hedging instruments:
|
|||||||||||||||||
|
Commodity contracts (1)
|
Receivables, net
|
2 | 2 | 1 | 1 | ||||||||||||
|
Derivatives not designated as hedging instruments:
|
|||||||||||||||||
|
Foreign exchange contracts (1)
|
Receivables, net
|
11 | 11 | 7 | 7 | ||||||||||||
|
Foreign exchange contracts (1)
|
Other long-term assets
|
1 | 1 | - | - | ||||||||||||
|
Liabilities
|
|||||||||||||||||
|
(in millions)
|
December 31, 2010
|
December 31, 2009
|
|||||||||||||||
|
Balance Sheet Location
|
Carrying Amount
|
Fair Value
|
Carrying Amount
|
Fair Value
|
|||||||||||||
|
Long-term borrowings, net of current portion (2)
|
Long-term debt, net of current portion
|
$ | 1,195 | $ | 1,242 | $ | 1,129 | $ | 1,142 | ||||||||
|
Derivatives not designated as hedging instruments:
|
|||||||||||||||||
|
Foreign exchange contracts (1)
|
Other current liabilities
|
8 | 8 | 11 | 11 | ||||||||||||
|
Foreign exchange contracts (1)
|
Other long-term liabilities
|
- | - | 6 | 6 | ||||||||||||
(1) Recorded at fair value.
(2) Recorded at historical cost.
Long-term debt is generally used to finance long-term investments, while short-term borrowings (excluding the current portion of long-term debt) are used to meet working capital requirements. The carrying value of the current portion of long-term debt, which is not shown in the table above, approximates its fair value as of December 31, 2010 and 2009. The Company does not utilize financial instruments for trading or other speculative purposes.
Fair value
The fair values of marketable securities are determined using quoted prices in active markets for identical assets (Level 1 fair value measurements). Fair values of the Company’s forward contracts are determined using other observable inputs (Level 2 fair value measurements), and are based on the present value of expected future cash flows (an income approach valuation technique) considering the risks involved and using discount rates appropriate for the duration of the contracts. Transfers between levels of the fair value hierarchy are recognized based on the actual date of the event or change in circumstances that caused the transfer. There were no transfers between levels of the fair value hierarchy during the year 2010.
Fair values of long-term borrowings are determined by reference to quoted market prices, if available, or by pricing models based on the value of related cash flows discounted at current market interest rates. The carrying values of cash and cash equivalents, trade
79
receivables, short-term borrowings and payables (which are not shown in the table above) approximate their fair values.
Foreign exchange
Foreign exchange gains and losses arising from transactions denominated in a currency other than the functional currency of the entity involved are included in Other income (charges), net in the accompanying Consolidated Statement of Operations. The net effects of foreign currency transactions, including changes in the fair value of foreign exchange contracts, are shown below:
|
(in millions)
|
For the Year Ended
|
|||||||||||
|
December 31,
|
||||||||||||
|
2010
|
2009
|
2008
|
||||||||||
|
Net gain (loss)
|
$ | (5 | ) | $ | (2 | ) | $ | 7 | ||||
Derivative financial instruments
The Company, as a result of its global operating and financing activities, is exposed to changes in foreign currency exchange rates, commodity prices, and interest rates, which may adversely affect its results of operations and financial position. The Company manages such exposures, in part, with derivative financial instruments.
Foreign currency forward contracts are used to mitigate currency risk related to foreign currency denominated assets and liabilities, especially those of the Company’s International Treasury Center. Silver forward contracts are used to mitigate the Company’s risk to fluctuating silver prices. The Company’s exposure to changes in interest rates results from its investing and borrowing activities used to meet its liquidity needs.
The Company’s financial instrument counterparties are high-quality investment or commercial banks with significant experience with such instruments. The Company manages exposure to counterparty credit risk by requiring specific minimum credit standards and diversification of counterparties. The Company has procedures to monitor the credit exposure amounts. The maximum credit exposure at December 31, 2010 was not significant to the Company.
In the event of a default under the Company’s Amended Credit Agreement, or a default under any derivative contract or similar obligation of the Company, the derivative counterparties would have the right, although not the obligation, to require immediate settlement of some or all open derivative contracts at their then-current fair value, but with liability positions netted against asset positions with the same counterparty. At December 31, 2010 and 2009, the Company had open derivative contracts in liability positions with a total fair value of $8 million and $17 million, respectively.
80
The location and amounts of gains and losses related to derivatives reported in the Consolidated Statement of Operations are shown in the following tables:
|
Derivatives in Cash Flow Hedging Relationships
|
Gain (Loss) Recognized in OCI on Derivative (Effective Portion)
|
Gain (Loss) Reclassified from Accumulated OCI Into Cost of Goods Sold (Effective Portion)
|
Gain (Loss) Recognized in Income on Derivative (Ineffective Portion and Amount Excluded from Effectiveness Testing)
|
|||||||||||||||||||||||||||||||||
|
(in millions)
|
For the Year Ended
December 31,
|
For the Year Ended
December 31,
|
For the Year Ended
December 31,
|
|||||||||||||||||||||||||||||||||
|
2010
|
2009
|
2008
|
2010
|
2009
|
2008
|
2010
|
2009
|
2008
|
||||||||||||||||||||||||||||
|
Commodity contracts
|
$ | 6 | $ | 12 | $ | (16 | ) | $ | 10 | $ | 7 | $ | 8 | $ | - | $ | - | $ | - | |||||||||||||||||
|
Foreign exchange contracts
|
(2 | ) | - | - | (2 | ) | (2 | ) | - | - | - | - | ||||||||||||||||||||||||
|
Derivatives Not Designated as Hedging Instruments
|
Location of Gain or (Loss) Recognized in Income on Derivative
|
Gain (Loss) Recognized in Income on Derivative
|
|||||||||||
|
(in millions)
|
For the Year Ended
December 31,
|
||||||||||||
|
2010
|
2009
|
2008
|
|||||||||||
|
Foreign exchange contracts
|
Other income (charges), net
|
$ | 32 | $ | 29 | $ | (75 | ) | |||||
Foreign currency forward contracts
Certain of the Company’s foreign currency forward contracts used to mitigate currency risk related to existing foreign currency denominated assets and liabilities are not designated as hedges, and are marked to market through net (loss) earnings at the same time that the exposed assets and liabilities are remeasured through net (loss) earnings (both in Other income (charges), net). The notional amount of such contracts open at December 31, 2010 was approximately $1,281 million. The majority of the contracts of this type held by the Company are denominated in euros, British pounds and Hong Kong dollars.
A subsidiary of the Company entered into intercompany foreign currency forward contracts that were designated as cash flow hedges of exchange rate risk related to forecasted foreign currency denominated intercompany sales. By December 31, 2010, all such contracts had been dedesignated as hedges according to the hedge strategy and there were no related amounts remaining in accumulated other comprehensive (loss) income. During 2010, a gain of $1 million was reclassified into cost of sales. Hedge ineffectiveness was insignificant. The fair value of the remaining open contracts as of December 31, 2010 was a net gain of less than $1 million and the notional amount was $3 million.
A subsidiary of the Company entered into intercompany foreign currency forward contracts that were designated as cash flow hedges of exchange rate risk related to forecasted foreign currency denominated purchases. By December 31, 2010, all such contracts had been dedesignated as hedges according to the hedge strategy and there were no related amounts remaining in accumulated other comprehensive (loss) income. During 2010, a loss of $3 million was reclassified into cost of sales. Hedge ineffectiveness was insignificant. The fair value of the remaining open contracts as of December 31, 2010 was a net loss of less than $1 million and the notional amount was $6 million.
Silver forward contracts
The Company enters into silver forward contracts that are designated as cash flow hedges of commodity price risk related to forecasted purchases of silver. The value of the notional amounts of such contracts open at December 31, 2010 was $7 million. Hedge gains and losses related to these silver forward contracts are reclassified into cost of sales as the related silver-containing products are sold to third parties. These gains or losses transferred to cost of sales are generally offset by increased or decreased costs of silver purchased in the open market. The amount of existing gains and losses at December 31, 2010 to be reclassified into earnings within the next 12 months is a net gain of $2 million. At December 31, 2010, the Company had hedges of forecasted purchases through March 2011.
81
|
For the Year Ended December 31,
|
||||||||||||
|
(in millions)
|
2010
|
2009
|
2008
|
|||||||||
|
Expenses (income):
|
||||||||||||
|
Goodwill impairments (1)
|
$ | 626 | $ | - | $ | 785 | ||||||
|
Long-lived asset impairments
|
- | 8 | 4 | |||||||||
|
Gains related to the sales of assets and businesses (2)
|
(8 | ) | (100 | ) | (25 | ) | ||||||
|
Other
|
1 | 4 | 2 | |||||||||
|
Total
|
$ | 619 | $ | (88 | ) | $ | 766 | |||||
|
(1)
|
Refer to Note 5, “Goodwill and Other Intangible Assets,” in the Notes to Financial Statements.
|
|
(2)
|
In November 2009, the Company agreed to terminate its patent infringement litigation with LG Electronics, Inc., LG Electronics USA, Inc., and LG Electronics Mobilecomm USA, Inc., entered into a technology cross license agreement with LG Electronics, Inc. and agreed to sell assets of its OLED group to Global OLED Technology LLC, an entity established by LG Electronics, Inc., LG Display Co., Ltd. and LG Chem, Ltd. As the transactions were entered into in contemplation of one another, in order to reflect the asset sale separately from the licensing transaction, the total consideration was allocated between the asset sale and the licensing transaction based on the estimated fair value of the assets sold. Fair value of the assets sold was estimated using other competitive bids received by the Company. Accordingly, $100 million of the proceeds was allocated to the asset sale. The remaining gross proceeds of $414 million were allocated to the licensing transaction and reported in net sales of the CDG segment.
|
|
For the Year Ended December 31,
|
||||||||||||
|
(in millions)
|
2010
|
2009
|
2008
|
|||||||||
|
Income (charges):
|
||||||||||||
|
Interest income
|
$ | 11 | $ | 12 | $ | 71 | ||||||
|
(Loss) gain on foreign exchange transactions
|
(5 | ) | (2 | ) | 7 | |||||||
|
Support for an educational institution
|
- | - | (10 | ) | ||||||||
|
Legal settlements
|
- | 19 | - | |||||||||
|
Gain on sale of investee
|
10 | - | - | |||||||||
|
MUTEC equity method investment impairment
|
- | - | (4 | ) | ||||||||
|
Other
|
10 | 1 | (9 | ) | ||||||||
|
Total
|
$ | 26 | $ | 30 | $ | 55 | ||||||
82
The components of earnings (loss) from continuing operations before income taxes and the related provision (benefit) for U.S. and other income taxes were as follows:
|
For the Year Ended December 31,
|
||||||||||||
|
(in millions)
|
2010
|
2009
|
2008
|
|||||||||
|
(Loss) earnings from continuing
operations before income taxes:
|
||||||||||||
|
U.S.
|
$ | (487 | ) | $ | (410 | ) | $ | (382 | ) | |||
|
Outside the U.S.
|
(74 | ) | 293 | (492 | ) | |||||||
|
Total
|
$ | (561 | ) | $ | (117 | ) | $ | (874 | ) | |||
|
U.S. income taxes:
|
||||||||||||
|
Current (benefit) provision
|
$ | (2 | ) | $ | 8 | $ | (278 | ) | ||||
|
Deferred provision (benefit)
|
2 | (7 | ) | 15 | ||||||||
|
Income taxes outside the U.S.:
|
||||||||||||
|
Current provision
|
192 | 113 | 72 | |||||||||
|
Deferred (benefit) provision
|
(76 | ) | - | 38 | ||||||||
|
State and other income taxes:
|
||||||||||||
|
Current (benefit) provision
|
(2 | ) | (1 | ) | 7 | |||||||
|
Deferred provision (benefit)
|
- | 2 | (1 | ) | ||||||||
|
Total provision (benefit)
|
$ | 114 | $ | 115 | $ | (147 | ) | |||||
The differences between income taxes computed using the U.S. federal income tax rate and the provision (benefit) for income taxes for continuing operations were as follows:
|
For the Year Ended December 31,
|
||||||||||||
|
(in millions)
|
2010
|
2009
|
2008
|
|||||||||
|
Amount computed using the statutory
rate
|
$ | (196 | ) | $ | (41 | ) | $ | (306 | ) | |||
|
Increase (reduction) in taxes resulting from:
|
||||||||||||
|
State and other income taxes, net of
federal
|
1 | 1 | 4 | |||||||||
|
Impact of goodwill impairment
|
217 | - | 229 | |||||||||
|
Operations outside the U.S.
|
140 | 45 | 31 | |||||||||
|
Valuation allowance
|
(46 | ) | 117 | 146 | ||||||||
|
Tax settlements and adjustments,
including interest
|
3 | (4 | ) | (248 | ) | |||||||
|
Other, net
|
(5 | ) | (3 | ) | (3 | ) | ||||||
|
Provision (benefit) for income taxes
|
$ | 114 | $ | 115 | $ | (147 | ) | |||||
During the fourth quarter of 2010, based on additional positive evidence regarding past earnings and projected future taxable income from operating activities, the Company determined that it is more likely than not that a portion of the deferred tax assets outside the U.S. would be realized and accordingly, recorded a tax benefit of $154 million associated with the release of the valuation allowance on those deferred tax assets.
83
In June 2008, the Company received a tax refund from the U.S. Internal Revenue Service (“IRS”) of $581 million. The refund is related to the audit of certain claims filed for tax years 1993-1998, and is composed of a refund of past federal income taxes paid of $306 million and $275 million of interest earned on the refund. The federal tax refund claim related primarily to a 1994 loss recognized on the Company’s sale of stock of a subsidiary, Sterling Winthrop Inc., which was originally disallowed under IRS regulations in effect at that time. The IRS subsequently issued revised regulations that served as the basis for this refund.
The refund had a positive impact of $565 million on the Company’s net earnings for the year ended December 31, 2008. Of the $565 million increase in net earnings, $295 million related to the 1994 sale of Sterling Winthrop Inc., which was reflected in earnings from discontinued operations, net of income taxes. The balance of $270 million, which represents interest, net of state income tax, was reflected in loss from continuing operations and is included in the “Tax settlements and adjustments, including interest” line item above. The difference between the cash refund received of $581 million and the positive net earnings impact of $565 million represented incremental state tax expense incurred and the release of an existing income tax receivable related to the refund.
Deferred Tax Assets and Liabilities
The significant components of deferred tax assets and liabilities were as follows:
|
As of December 31,
|
||||||||
|
(in millions)
|
2010
|
2009
|
||||||
|
Deferred tax assets
|
||||||||
|
Pension and postretirement
obligations
|
$ | 809 | $ | 803 | ||||
|
Restructuring programs
|
7 | 16 | ||||||
|
Foreign tax credit
|
477 | 350 | ||||||
|
Inventories
|
23 | 15 | ||||||
|
Investment tax credit
|
160 | 159 | ||||||
|
Employee deferred compensation
|
80 | 91 | ||||||
|
Depreciation
|
28 | - | ||||||
|
Research and development costs
|
184 | 146 | ||||||
|
Tax loss carryforwards
|
1,181 | 931 | ||||||
|
Other deferred revenue
|
- | 32 | ||||||
|
Other
|
423 | 486 | ||||||
|
Total deferred tax assets
|
$ | 3,372 | $ | 3,029 | ||||
|
Deferred tax liabilities
|
||||||||
|
Depreciation
|
- | 26 | ||||||
|
Leasing
|
47 | 51 | ||||||
|
Other deferred debt
|
15 | - | ||||||
|
Other
|
175 | 143 | ||||||
|
Total deferred tax liabilities
|
237 | 220 | ||||||
|
Net deferred tax assets before valuation
allowance
|
3,135 | 2,809 | ||||||
|
Valuation allowance
|
2,335 | 2,092 | ||||||
|
Net deferred tax assets
|
$ | 800 | $ | 717 | ||||
84
Deferred tax assets (liabilities) are reported in the following components within the Consolidated Statement of Financial Position:
|
As of December 31,
|
||||||||
|
(in millions)
|
2010
|
2009
|
||||||
|
Deferred income taxes (current)
|
$ | 120 | $ | 121 | ||||
|
Other long-term assets
|
695 | 607 | ||||||
|
Accrued income taxes
|
(7 | ) | - | |||||
|
Other long-term liabilities
|
(8 | ) | (11 | ) | ||||
|
Net deferred tax assets
|
$ | 800 | $ | 717 | ||||
As of December 31, 2010, the Company had available domestic and foreign net operating loss carryforwards for income tax purposes of approximately $3,690 million, of which approximately $609 million have an indefinite carryforward period. The remaining $3,081 million expire between the years 2011 and 2030. Utilization of these net operating losses may be subject to limitations in the event of significant changes in stock ownership of the Company. As of December 31, 2010, the Company had unused foreign tax credits and investment tax credits of $477 million and $160 million, respectively, with various expiration dates through 2030.
The Company has been granted a tax holiday in certain jurisdictions in China. The Company is eligible for a 50% reduction of the income tax rate as a tax holiday incentive. The tax rate currently varies by jurisdiction, due to the tax holiday, and will be 25% in all jurisdictions within China in 2013.
Retained earnings of subsidiary companies outside the U.S. were approximately $2,398 million and $1,842 million as of December 31, 2010 and 2009, respectively. Deferred taxes have not been provided on such undistributed earnings, as it is the Company’s policy to indefinitely reinvest its retained earnings. Further, it is not practicable to determine the related deferred tax liability. However, the Company periodically repatriates a portion of these earnings to the extent that it can do so tax-free, or at minimal cost.
The Company’s valuation allowance as of December 31, 2010 was $2,335 million. Of this amount, $280 million was attributable to the Company’s net deferred tax assets outside the U.S. of $849 million, and $2,055 million related to the Company’s net deferred tax assets in the U.S. of $2,286 million, for which the Company believes it is not more likely than not that the assets will be realized. The net deferred tax assets in excess of the valuation allowance of $800 million relate primarily to net operating loss carryforwards, certain tax credits, and pension related tax benefits for which the Company believes it is more likely than not that the assets will be realized.
The valuation allowance as of December 31, 2009 was $2,092 million. Of this amount, $445 million was attributable to the Company’s net deferred tax assets outside the U.S. of $910 million, and $1,647 million related to the Company’s net deferred tax assets in the U.S. of $1,899 million, for which the Company believes it is not more likely than not that the assets will be realized. The net deferred tax assets in excess of the valuation allowance of $717 million related primarily to net operating loss carryforwards and certain tax credits for which the Company believes it is more likely than not that the assets will be realized.
85
Accounting for Uncertainty in Income Taxes
A reconciliation of the beginning and ending amount of the Company’s liability for income taxes associated with unrecognized tax benefits is as follows:
(in millions)
|
2010
|
2009
|
2008
|
||||||||||
|
Balance as of January 1
|
$ | 256 | $ | 296 | $ | 303 | ||||||
|
Tax positions related to the current year:
|
||||||||||||
|
Additions
|
1 | 10 | 54 | |||||||||
|
Tax positions related to prior years:
|
||||||||||||
|
Additions
|
- | 8 | 16 | |||||||||
|
Reductions
|
(11 | ) | (58 | ) | (74 | ) | ||||||
|
Settlements with taxing authorities
|
- | - | (3 | ) | ||||||||
|
Lapses in statutes of limitations
|
(1 | ) | - | - | ||||||||
|
Balance as of December 31
|
$ | 245 | $ | 256 | $ | 296 | ||||||
The Company’s policy regarding interest and/or penalties related to income tax matters is to recognize such items as a component of income tax (benefit) expense. During the years ended December 31, 2010, 2009 and 2008, the Company recognized interest and penalties of approximately $5 million, $8 million and $10 million, respectively, in income tax (benefit) expense. Additionally, the Company had approximately $74 million and $69 million of interest and penalties associated with uncertain tax benefits accrued as of December 31, 2010 and 2009, respectively.
If the unrecognized tax benefits were recognized, they would favorably affect the effective income tax rate in the period recognized. The Company has classified certain income tax liabilities as current or noncurrent based on management’s estimate of when these liabilities will be settled. These current liabilities are recorded in Accrued income and other taxes in the Consolidated Statement of Financial Position. Noncurrent income tax liabilities are recorded in Other long-term liabilities in the Consolidated Statement of Financial Position.
It is reasonably possible that the liability associated with the Company’s unrecognized tax benefits will increase or decrease within the next twelve months. These changes may be the result of settling ongoing audits or the expiration of statutes of limitations. Such changes to the unrecognized tax benefits could range from $100 to $200 million based on current estimates. Audit outcomes and the timing of audit settlements are subject to significant uncertainty. Although management believes that adequate provision has been made for such issues, there is the possibility that the ultimate resolution of such issues could have an adverse effect on the earnings of the Company. Conversely, if these issues are resolved favorably in the future, the related provision would be reduced, thus having a positive impact on earnings. It is anticipated that audit settlements will be reached during 2011 that could have a significant earnings impact. Due to the uncertainty of amounts and in accordance with its accounting policies, the Company has not recorded any potential impact of these settlements.
The Company files numerous consolidated and separate income tax returns in the U.S. federal jurisdiction and in many state and foreign jurisdictions. The Company has substantially concluded all U.S. federal income tax matters for years through 2000. The Company’s U.S. tax matters for the years 2001 through 2009 remain subject to examination by the IRS. Substantially all material state, local, and foreign income tax matters have been concluded for years through 2000. The Company’s tax matters for the years 2001 through 2009 remain subject to examination by the respective state, local, and foreign tax jurisdiction authorities.
The Company recognizes the need to continually rationalize its workforce and streamline its operations in the face of ongoing business and economic changes. Charges for restructuring and ongoing rationalization initiatives are recorded in the period in which the Company commits to a formalized restructuring or ongoing rationalization plan, or executes the specific actions comtemplated by the plans and all
86
criteria for liability recognition under the applicable accounting guidance have been met.
Restructuring and Ongoing Rationalization Reserve Activity
The activity in the accrued balances and the non-cash charges and credits incurred in relation to restructuring programs and ongoing rationalization activities during the three years ended December 31, 2010 were as follows:
|
Long-lived Asset
|
||||||||||||||||||||
|
Exit
|
Impairments
|
|||||||||||||||||||
|
Severance
|
Costs
|
and Inventory
|
Accelerated
|
|||||||||||||||||
|
(in millions)
|
Reserve
|
Reserve
|
Write-downs
|
Depreciation
|
Total
|
|||||||||||||||
|
Balance at December 31, 2007
|
129 | 35 | - | - | 164 | |||||||||||||||
|
2008 charges - continuing operations (1)
|
122 | 14 | 16 | 6 | 158 | |||||||||||||||
|
2008 reversals - continuing operations
|
(6 | ) | (3 | ) | - | - | (9 | ) | ||||||||||||
|
2008 cash payments/utilization (2)
|
(111 | ) | (22 | ) | (16 | ) | (6 | ) | (155 | ) | ||||||||||
|
2008 other adjustments & reclasses (3)
|
(25 | ) | (3 | ) | - | - | (28 | ) | ||||||||||||
|
Balance at December 31, 2008
|
109 | 21 | - | - | 130 | |||||||||||||||
|
2009 charges - continuing operations (4)
|
193 | 27 | 16 | 22 | 258 | |||||||||||||||
|
2009 cash payments/utilization (5)
|
(154 | ) | (23 | ) | (16 | ) | (22 | ) | (215 | ) | ||||||||||
|
2009 other adjustments & reclasses (6)
|
(80 | ) | 2 | - | - | (78 | ) | |||||||||||||
|
Balance at December 31, 2009
|
68 | 27 | - | - | 95 | |||||||||||||||
|
2010 charges - continuing operations (7)
|
49 | 14 | 9 | 6 | 78 | |||||||||||||||
|
2010 cash payments/utilization (8)
|
(67 | ) | (21 | ) | (9 | ) | (6 | ) | (103 | ) | ||||||||||
|
2010 other adjustments & reclasses (9)
|
(28 | ) | - | - | - | (28 | ) | |||||||||||||
|
Balance at December 31, 2010 (10)
|
$ | 22 | $ | 20 | $ | - | $ | - | $ | 42 | ||||||||||
|
(1)
|
Severance reserve activity includes charges of $139 million, offset by net curtailment gains related to these actions of $17 million.
|
|
(2)
|
During the year ended December 31, 2008, the Company made cash payments of approximately $143 million related to restructuring and rationalization. Of this amount, $133 million was paid out of restructuring liabilities, while $10 million was paid out of Pension and other postretirement liabilities.
|
|
(3)
|
Includes $23 million of severance related charges for pension plan curtailments, settlements, and special termination benefits, which are reflected in Pension and other postretirement liabilities and Other long-term assets in the Consolidated Statement of Financial Position. The remaining amounts are primarily related to foreign currency translation adjustment.
|
|
(4)
|
Severance reserve activity includes charges of $191 million, and net curtailment and settlement losses related to these actions of $2 million.
|
|
(5)
|
During the year ended December 31, 2009, the Company made cash payments of approximately $177 million related to restructuring and rationalization, all of which was paid out of restructuring liabilities.
|
|
(6)
|
Includes $84 million of severance related charges for pension plan curtailments, settlements, and special termination benefits, which are reflected in Pension and other postretirement liabilities and Other long-term assets in the Consolidated Statement of Financial Position, partially offset by foreign currency translation adjustments.
|
87
|
(7)
|
Severance reserve activity includes charges of $49 million.
|
|
(8)
|
During the year ended December 31, 2010, the Company made cash payments of approximately $88 million related to restructuring and rationalization, all of which was paid out of restructuring liabilities.
|
|
(9)
|
Includes $28 million of severance related charges for pension plan curtailments, settlements, and special termination benefits, which are reflected in Pension and other postretirement liabilities and Other long-term assets in the Consolidated Statement of Financial Position.
|
|
(10)
|
The Company expects to utilize the majority of the December 31, 2010 accrual balance in 2011.
|
2008 Activity
The Company recognizes the need to continually rationalize its workforce and streamline its operations to remain competitive in the face of an ever-changing business and economic climate. For 2008, these initiatives were referred to as ongoing rationalization activities.
The Company recorded $149 million of charges, net of reversals, including $6 million of charges for accelerated depreciation and $3 million of charges for inventory write-downs, which were reported in Cost of sales in the accompanying Consolidated Statement of Operations for the year ended December 31, 2008. The remaining costs incurred, net of reversals, of $140 million were reported as Restructuring costs, rationalization and other in the accompanying Consolidated Statement of Operations for the year ended December 31, 2008. The severance and exit costs reserves require the outlay of cash, while long-lived asset impairments, accelerated depreciation and inventory write-downs represent non-cash items.
The severance costs related to the elimination of approximately 2,350 positions, including approximately 375 photofinishing, 1,050 manufacturing, 175 research and development, and 750 administrative positions. The geographic composition of the positions eliminated includes approximately 1,450 in the United States and Canada, and 900 throughout the rest of the world.
The charges, net of reversals, of $149 million recorded in 2008 included $36 million applicable to the FPEG segment, $42 million applicable to the CDG segment, $49 million applicable to the GCG segment, and $22 million that was applicable to manufacturing, research and development, and administrative functions, which are shared across all segments.
As a result of these initiatives, severance payments were paid during periods through 2009 since, in many instances, the employees whose positions were eliminated can elect or are required to receive their payments over an extended period of time. In addition, certain exit costs, such as long-term lease payments, will continue to be paid over periods beyond 2009.
2009 Activity
On December 17, 2008, the Company committed to a plan to implement a targeted cost reduction program (the 2009 Program) to more appropriately size the organization as a result of economic conditions. The program involved rationalizing selling, administrative, research and development, supply chain and other business resources in certain areas and consolidating certain facilities.
The Company recorded $258 million of charges, including $22 million of charges for accelerated depreciation and $10 million of charges for inventory write-downs, which were reported in Cost of sales in the accompanying Consolidated Statement of Operations for the year ended December 31, 2009. The remaining costs incurred of $226 million were reported as Restructuring costs, rationalization and other in the accompanying Consolidated Statement of Operations for the year ended December 31, 2009. The severance and exit costs reserves require the outlay of cash, while long-lived asset impairments, accelerated depreciation and inventory write-downs represent non-cash items.
The severance costs related to the elimination of approximately 3,225 positions, including approximately 1,475 manufacturing, 750 research and development, and 1,000 administrative positions. The geographic composition of the positions eliminated includes
88
approximately 1,950 in the United States and Canada, and 1,275 throughout the rest of the world.
The charges of $258 million recorded in 2009 included $69 million applicable to the FPEG segment, $34 million applicable to the CDG segment, $112 million applicable to the GCG segment, and $43 million that was applicable to manufacturing, research and development, and administrative functions, which are shared across all segments.
As a result of these initiatives, severance payments will be paid during periods through 2010 since, in many instances, the employees whose positions were eliminated can elect or are required to receive their payments over an extended period of time. In addition, certain exit costs, such as long-term lease payments, will be paid over periods throughout 2010 and beyond.
2010 Activity
The $78 million of charges for the year 2010 includes $6 million of charges for accelerated depreciation and $2 million for inventory write-downs, which were reported in Cost of sales in the accompanying Consolidated Statement of Operations. The remaining costs incurred of $70 million, including $49 million of severance costs, $14 million of exit costs, and $7 million of long-lived asset impairments, were reported as Restructuring costs, rationalization and other in the accompanying Consolidated Statement of Operations. The severance and exit costs reserves require the outlay of cash, while long-lived asset impairments, accelerated depreciation and inventory write-downs represent non-cash items.
The 2010 severance costs related to the elimination of approximately 800 positions, including approximately 550 manufacturing/service, 225 administrative, and 25 research and development positions. The geographic composition of these positions includes approximately 475 in the United States and Canada, and 325 throughout the rest of the world.
The charges of $78 million recorded in 2010 included $38 million applicable to FPEG, $15 million applicable to GCG, $3 million applicable to CDG, and $22 million that was applicable to manufacturing/service, research and development, and administrative functions, which are shared across all segments.
As a result of these initiatives, severance payments will be paid during periods through 2011 since, in many instances, the employees whose positions were eliminated can elect or are required to receive their payments over an extended period of time. In addition, certain exit costs, such as long-term lease payments, will be paid over periods throughout 2011 and beyond.
Substantially all
U.S. employees are covered by a noncontributory defined benefit plan, the Kodak Retirement Income Plan (“KRIP”), which is funded by Company contributions to an irrevocable trust fund. The funding policy for KRIP is to contribute amounts sufficient to meet minimum funding requirements as determined by employee benefit and tax laws plus any additional amounts the Company determines to be appropriate. Generally, benefits are based on a formula recognizing length of service and final average earnings. Assets in the trust fund are held for the sole benefit of participating employees and retirees. They are comprised of corporate equity and debt securities, U.S. government securities, partnership investments, interests in pooled funds, commodities, real estate, and various types of interest rate, foreign currency, debt, and equity market financial instruments.
In March 1999, the Company amended the KRIP to include a separate cash balance formula for all U.S. employees hired after February 1999. All U.S. employees hired prior to that date were granted the option to choose the traditional KRIP plan or the Cash Balance plan. Written elections were made by employees in 1999, and were effective January 1, 2000. The Cash Balance plan credits employees' accounts with an amount equal to 4% of their pay, plus interest based on the 30-year treasury bond rate. In addition, for employees participating in the Cash Balance plan and the Company's defined contribution plan, the Savings and Investment Plan (“SIP”), the Company matches dollar-for-dollar on the first 1% contributed to SIP and $.50 for each dollar on the next 4% contributed. Company contributions to SIP were $11 million and $13 million for 2010 and 2008, respectively. The Company suspended its matching contribution
89
for 2009, but resumed it in 2010.
The Company also sponsors unfunded defined benefit plans for certain U.S. employees, primarily executives. The benefits of these plans are obtained by applying KRIP provisions to all compensation, including amounts being deferred, and without regard to the legislated qualified plan maximums, reduced by benefits under KRIP. Employees covered by the Cash Balance plan also receive an additional benefit equal to 3% of their annual pensionable earnings. The Company suspended this additional benefit for 2009, but resumed it in 2010.
Many subsidiaries and branches operating outside the U.S. have defined benefit retirement plans covering substantially all employees. Contributions by the Company for these plans are typically deposited under government or other fiduciary-type arrangements. Retirement benefits are generally based on contractual agreements that provide for benefit formulas using years of service and/or compensation prior to retirement. The actuarial assumptions used for these plans reflect the diverse economic environments within the various countries in which the Company operates.
The measurement date used to determine the pension obligation for all funded and unfunded U.S. and Non-U.S. defined benefit plans is December 31.
Information regarding the major funded and unfunded U.S. and Non-U.S. defined benefit plans follows:
|
(in millions)
|
2010
|
2009
|
||||||||||||||
|
U.S.
|
Non-U.S.
|
U.S.
|
Non-U.S.
|
|||||||||||||
|
Change in Benefit Obligation
|
||||||||||||||||
|
Projected benefit obligation at January 1
|
$ | 4,842 | $ | 3,527 | $ | 4,602 | $ | 2,958 | ||||||||
|
Acquisitions/divestitures/other transfers
|
- | - | (1 | ) | 2 | |||||||||||
|
Service cost
|
48 | 14 | 52 | 14 | ||||||||||||
|
Interest cost
|
263 | 177 | 293 | 178 | ||||||||||||
|
Participant contributions
|
- | 3 | - | 9 | ||||||||||||
|
Plan amendments
|
- | 45 | - | 3 | ||||||||||||
|
Benefit payments
|
(511 | ) | (218 | ) | (663 | ) | (235 | ) | ||||||||
|
Actuarial loss
|
402 | 181 | 500 | 374 | ||||||||||||
|
Curtailments
|
- | (5 | ) | (19 | ) | (3 | ) | |||||||||
|
Settlements
|
- | (2 | ) | - | (1 | ) | ||||||||||
|
Special termination benefits
|
27 | 1 | 78 | 5 | ||||||||||||
|
Currency adjustments
|
- | (87 | ) | - | 223 | |||||||||||
|
Projected benefit obligation at December 31
|
$ | 5,071 | $ | 3,636 | $ | 4,842 | $ | 3,527 | ||||||||
|
Change in Plan Assets
|
||||||||||||||||
|
Fair value of plan assets at January 1
|
$ | 4,758 | $ | 2,502 | $ | 5,098 | $ | 2,317 | ||||||||
|
Acquisitions/divestitures
|
- | - | - | 4 | ||||||||||||
|
Actual gain on plan assets
|
592 | 320 | 292 | 151 | ||||||||||||
|
Employer contributions
|
22 | 90 | 31 | 88 | ||||||||||||
|
Participant contributions
|
- | 3 | - | 9 | ||||||||||||
|
Settlements
|
- | (2 | ) | - | (1 | ) | ||||||||||
|
Benefit payments
|
(511 | ) | (218 | ) | (663 | ) | (235 | ) | ||||||||
|
Currency adjustments
|
- | (61 | ) | - | 169 | |||||||||||
|
Fair value of plan assets at December 31
|
$ | 4,861 | $ | 2,634 | $ | 4,758 | $ | 2,502 | ||||||||
|
Under Funded Status at December 31
|
$ | (210 | ) | $ | (1,002 | ) | $ | (84 | ) | $ | (1,025 | ) | ||||
|
Accumulated benefit obligation at December 31
|
$ | 4,881 | $ | 3,545 | $ | 4,683 | $ | 3,436 | ||||||||
90
As a result of a legislative change in November 2010, a French defined benefit pension plan was amended to reflect a change in the Social Security retirement age. The legislative change requires the minimum retirement age be extended up to 2 years, phasing in at a rate of 4 months per year until 2018. This amendment increased the projected benefit obligation in 2010 by $33 million, which is reflected in the plan amendments line in the table above.
Amounts recognized in the Consolidated Statement of Financial Position for all major funded and unfunded U.S. and Non-U.S. defined benefit plans were as follows:
|
As of December 31,
|
||||||||||||||||
|
(in millions)
|
2010
|
2009
|
||||||||||||||
|
U.S.
|
Non-U.S.
|
U.S.
|
Non-U.S.
|
|||||||||||||
|
Other long-term assets
|
$ | 18 | $ | 21 | $ | 131 | $ | 15 | ||||||||
|
Accounts payable and other current
liabilities
|
(19 | ) | - | (21 | ) | - | ||||||||||
|
Pension and other postretirement liabilities
|
(209 | ) | (1,023 | ) | (194 | ) | (1,040 | ) | ||||||||
|
Net amount recognized
|
$ | (210 | ) | $ | (1,002 | ) | $ | (84 | ) | $ | (1,025 | ) | ||||
Information with respect to the major funded and unfunded U.S. and Non-U.S. defined benefit plans with an accumulated benefit obligation in excess of plan assets follows:
|
As of December 31,
|
||||||||||||||||
|
(in millions)
|
2010
|
2009
|
||||||||||||||
|
U.S.
|
Non-U.S.
|
U.S.
|
Non-U.S.
|
|||||||||||||
|
Projected benefit obligation
|
$ | 383 | $ | 3,210 | $ | 351 | $ | 2,660 | ||||||||
|
Accumulated benefit obligation
|
378 | 3,124 | 349 | 2,594 | ||||||||||||
|
Fair value of plan assets
|
154 | 2,187 | 136 | 1,631 | ||||||||||||
Amounts recognized in Accumulated other comprehensive loss for all major funded and unfunded U.S. and Non-U.S. defined benefit plans consisted of:
|
As of December 31,
|
||||||||||||||||
|
(in millions)
|
2010
|
2009
|
||||||||||||||
|
U.S.
|
Non-U.S.
|
U.S.
|
Non-U.S.
|
|||||||||||||
|
Prior service cost (credit)
|
$ | 7 | $ | 38 | $ | 8 | $ | (3 | ) | |||||||
|
Net actuarial loss
|
1,790 | 1,423 | 1,509 | 1,406 | ||||||||||||
|
Total
|
$ | 1,797 | $ | 1,461 | $ | 1,517 | $ | 1,403 | ||||||||
91
Changes in plan assets and benefit obligations recognized in other comprehensive income (loss) during 2010 for all major funded and unfunded U.S. and Non-U.S. defined benefit plans follows:
|
2010
|
2009
|
|||||||||||||||
|
(in millions)
|
U.S.
|
Non-U.S.
|
U.S.
|
Non-U.S.
|
||||||||||||
|
Newly established loss
|
$ | 286 | $ | 71 | $ | 695 | $ | 429 | ||||||||
|
Newly established prior service cost
|
- | 42 | - | 2 | ||||||||||||
|
Amortization of:
|
||||||||||||||||
|
Prior service cost
|
(1 | ) | (1 | ) | (2 | ) | - | |||||||||
|
Net actuarial loss
|
(5 | ) | (37 | ) | (5 | ) | (13 | ) | ||||||||
|
Prior service cost recognized due to
curtailment
|
- | 1 | (1 | ) | - | |||||||||||
|
Net curtailment gain not recognized in
expense
|
- | - | (19 | ) | (3 | ) | ||||||||||
|
Net loss recognized in expense due to
settlements
|
- | (1 | ) | - | (4 | ) | ||||||||||
|
Transfers
|
- | 2 | - | - | ||||||||||||
|
Total amount recognized in Other
comprehensive loss
|
$ | 280 | $ | 77 | $ | 668 | $ | 411 | ||||||||
The actuarial loss and prior service cost estimated to be amortized from Accumulated other comprehensive loss into net periodic pension cost over the next year for all major plans is $122 million and $4 million, respectively.
Pension (income) expense from continuing operations for all defined benefit plans included:
|
For the Year Ended December 31,
|
||||||||||||||||||||||||
|
(in millions)
|
2010
|
2009
|
2008
|
|||||||||||||||||||||
|
U.S.
|
Non-U.S.
|
U.S.
|
Non-U.S.
|
U.S.
|
Non-U.S.
|
|||||||||||||||||||
|
Major defined benefit plans:
|
||||||||||||||||||||||||
|
Service cost
|
$ | 48 | $ | 14 | $ | 52 | $ | 14 | $ | 54 | $ | 19 | ||||||||||||
|
Interest cost
|
263 | 177 | 293 | 178 | 307 | 215 | ||||||||||||||||||
|
Expected return on plan assets
|
(475 | ) | (210 | ) | (486 | ) | (206 | ) | (545 | ) | (257 | ) | ||||||||||||
|
Amortization of:
|
||||||||||||||||||||||||
|
Prior service cost
|
1 | 1 | 2 | - | 1 | - | ||||||||||||||||||
|
Actuarial loss
|
5 | 37 | 5 | 13 | 4 | 47 | ||||||||||||||||||
|
Pension (income) expense before special
termination benefits, curtailments and
settlements
|
(158 | ) | 19 | (134 | ) | (1 | ) | (179 | ) | 24 | ||||||||||||||
|
Special termination benefits
|
27 | 1 | 78 | 5 | 36 | 4 | ||||||||||||||||||
|
Curtailment gains
|
- | (7 | ) | - | (1 | ) | (13 | ) | (4 | ) | ||||||||||||||
|
Settlement losses
|
- | 1 | - | 1 | - | - | ||||||||||||||||||
|
Net pension (income) expense for
major
defined benefit plans
|
(131 | ) | 14 | (56 | ) | 4 | (156 | ) | 24 | |||||||||||||||
|
Other plans including unfunded plans
|
- | 11 | - | 6 | - | 11 | ||||||||||||||||||
|
Net pension (income) expense from
continuing operations
|
$ | (131 | ) | $ | 25 | $ | (56 | ) | $ | 10 | $ | (156 | ) | $ | 35 | |||||||||
The special termination benefits of $28 million, $83 million, and $40 million for the years ended December 31, 2010, 2009, and 2008, respectively, were incurred as a result of the Company's restructuring actions and, therefore, have been included in Restructuring costs, rationalization and other in the Consolidated Statement of Operations for those respective periods. In addition, curtailment gains for the major funded and unfunded U.S. and Non-U.S. defined benefit plans totaling $14 million for 2008 were also incurred as a result of the Company's restructuring actions and, therefore, have been included in Restructuring costs, rationalization and other in the Consolidated
92
Statement of Operations for those respective periods. There were no impacts of curtailments or settlements incurred as a result of the Company’s restructuring actions in 2009 and 2010.
The weighted-average assumptions used to determine the benefit obligation amounts as of the end of the year for all major funded and unfunded U.S. and Non-U.S. defined benefit plans were as follows:
|
As of December 31,
|
||||||||||||||||
|
2010
|
2009
|
|||||||||||||||
|
U.S.
|
Non-U.S.
|
U.S.
|
Non-U.S.
|
|||||||||||||
|
Discount rate
|
5.24 | % | 4.92 | % | 5.75 | % | 5.40 | % | ||||||||
|
Salary increase rate
|
3.81 | % | 3.88 | % | 3.89 | % | 3.87 | % | ||||||||
The weighted-average assumptions used to determine net pension (income) expense for all the major funded and unfunded U.S. and Non-U.S. defined benefit plans were as follows:
|
For the Year Ended December 31,
|
||||||||||||||||||||||||
|
2010
|
2009
|
2008
|
||||||||||||||||||||||
|
U.S.
|
Non-U.S.
|
U.S.
|
Non-U.S.
|
U.S.
|
Non-U.S.
|
|||||||||||||||||||
|
Discount rate
|
5.75 | % | 5.17 | % | 6.76 | % | 5.90 | % | 6.52 | % | 5.75 | % | ||||||||||||
|
Salary increase rate
|
3.88 | % | 3.87 | % | 3.99 | % | 3.45 | % | 4.51 | % | 3.93 | % | ||||||||||||
|
Expected long-term rate of return on plan
assets
|
8.73 | % | 7.76 | % | 8.49 | % | 7.30 | % | 8.99 | % | 7.74 | % | ||||||||||||
Plan Asset Investment Strategy
The investment strategy underlying the asset allocation for the pension assets is to achieve an optimal return on assets with an acceptable level of risk while providing for the long-term liabilities, and maintaining sufficient liquidity to pay current benefits and other cash obligations of the plans. This is primarily achieved by investing in a broad portfolio constructed of various asset classes including equity and equity-like investments, debt and debt-like investments, real estate, private equity and other assets and instruments. Long duration bonds are used to partially match the long-term nature of plan liabilities. Other investment objectives include maintaining broad diversification between and within asset classes and fund managers, and managing asset volatility relative to plan liabilities.
Every three years, or when market conditions have changed materially, each of the Company’s major pension plans will undertake an asset allocation or asset and liability modeling study. The asset allocation and expected return on the plans’ assets are individually set to provide for benefits and other cash obligations and within each country’s legal investment constraints.
Actual allocations may vary from the target asset allocations due to market value fluctuations, the length of time it takes to implement changes in strategy, and the timing of cash contributions and cash requirements of the plans. The asset allocations are monitored, and are rebalanced in accordance with the policy set forth for each plan.
Of the total plan assets attributable to the major U.S. defined benefit plans at December 31, 2010 and 2009, 97% relate to KRIP. The expected long-term rate of return on plan assets assumption (“EROA”) is based on a combination of formal asset and liability studies that include forward-looking return expectations given the current asset allocation. During 2009, an asset and liability study was completed and resulted in an 8.75% EROA for KRIP. A review of the EROA as of December 2010 based upon the current asset allocation and forward-looking expected returns for the various asset classes in which KRIP invests resulted in an EROA of 8.50%.
The annual expected return on plan assets for the major non-U.S. pension plans range from 3.64% to 8.75% for 2010. EROA assumptions for 2009 for those plans were based on their respective asset allocations as of the end of the year. As with the KRIP, the EROA assumptions for certain of the Company’s other pension plans were reassessed as of December 2010. EROA assumptions for those plans were updated accordingly.
93
Plan Asset Risk Management
The Company evaluates its defined benefit plans’ asset portfolios for the existence of significant concentrations of risk. Types of concentrations that are evaluated include, but are not limited to, investment concentrations in a single entity, type of industry, foreign country, and individual fund. As of December 31, 2010 and 2009, there were no significant concentrations (defined as greater than 10 percent of plan assets) of risk in the Company’s defined benefit plan assets.
The Company's weighted-average asset allocations for its major U.S. defined benefit pension plans, by asset category, are as follows:
|
As of December 31,
|
||||||||||||
|
Asset Category
|
2010
|
2009
|
2010 Target
|
|||||||||
|
Equity securities
|
20 | % | 21 | % | 18%-27 | % | ||||||
|
Debt securities
|
45 | % | 45 | % | 41%-47 | % | ||||||
|
Real estate
|
5 | % | 6 | % | 4%-10 | % | ||||||
|
Cash
|
3 | % | 2 | % | 0%-3 | % | ||||||
|
Other
|
27 | % | 26 | % | 24%-30 | % | ||||||
|
Total
|
100 | % | 100 | % | ||||||||
The Company's weighted-average asset allocations for its major non-U.S. defined benefit pension plans, by asset category are as follows:
|
As of December 31,
|
||||||||||||
|
Asset Category
|
2010
|
2009
|
2010 Target
|
|||||||||
|
Equity securities
|
19 | % | 15 | % | 12%-19 | % | ||||||
|
Debt securities
|
43 | % | 46 | % | 44%-52 | % | ||||||
|
Real estate
|
3 | % | 4 | % | 0%-9 | % | ||||||
|
Cash
|
7 | % | 4 | % | 0%-6 | % | ||||||
|
Other
|
28 | % | 31 | % | 27%-37 | % | ||||||
|
Total
|
100 | % | 100 | % | ||||||||
The Other asset category in the tables above is primarily composed of private equity, venture capital, and other investments.
Fair Value Measurements
The Company’s asset allocations by level within the fair value hierarchy at December 31, 2010 and 2009 are presented in the tables below for the Company’s major defined benefit plans. The Company’s plan assets were accounted for at fair value and are classified in their entirety based on the lowest level of input that is significant to the fair value measurement. The Company’s assessment of the significance of a particular input to the fair value measurement requires judgment, and may affect the valuation of fair value of assets and their placement within the fair value hierarchy levels.
94
Major U.S. Plans
December 31, 2010
|
(in millions)
|
Quoted Prices in Active Markets for Identical Assets
(Level 1)
|
Significant Observable Inputs
(Level 2)
|
Significant Unobservable Inputs
(Level 3)
|
Total
|
||||||||||||
|
Cash and cash equivalents
|
$ | - | $ | 126 | $ | - | $ | 126 | ||||||||
|
Equity Securities
|
436 | 534 | 19 | 989 | ||||||||||||
|
Debt Securities:
|
||||||||||||||||
|
Government Bonds
|
- | 749 | - | 749 | ||||||||||||
|
Inflation-Linked Bonds
|
- | 667 | 221 | 888 | ||||||||||||
|
Investment Grade Bonds
|
- | 409 | - | 409 | ||||||||||||
|
Global High Yield & Emerging Market Debt
|
- | 122 | - | 122 | ||||||||||||
|
Other:
|
||||||||||||||||
|
Absolute Return
|
- | 287 | - | 287 | ||||||||||||
|
Real Estate
|
- | - | 240 | 240 | ||||||||||||
|
Private Equity
|
- | - | 1,063 | 1,063 | ||||||||||||
|
Derivatives with unrealized gains
|
7 | 7 | - | 14 | ||||||||||||
|
Derivatives with unrealized losses
|
- | (26 | ) | - | (26 | ) | ||||||||||
| $ | 443 | $ | 2,875 | $ | 1,543 | $ | 4,861 | |||||||||
95
Major U.S. Plans
December 31, 2009
|
(in millions)
|
Quoted Prices in Active Markets for Identical Assets
(Level 1)
|
Significant Observable Inputs
(Level 2)
|
Significant Unobservable Inputs
(Level 3)
|
Total
|
||||||||||||
|
Cash and cash equivalents
|
$ | - | $ | 82 | $ | - | $ | 82 | ||||||||
|
Equity Securities
|
260 | 732 | 7 | 999 | ||||||||||||
|
Debt Securities:
|
||||||||||||||||
|
Government Bonds
|
- | 799 | - | 799 | ||||||||||||
|
Inflation-Linked Bonds
|
- | 648 | 172 | 820 | ||||||||||||
|
Investment Grade Bonds
|
- | 370 | - | 370 | ||||||||||||
|
Global High Yield & Emerging Market Debt
|
- | 144 | - | 144 | ||||||||||||
|
Other:
|
||||||||||||||||
|
Absolute Return
|
- | 328 | - | 328 | ||||||||||||
|
Real Estate
|
- | - | 293 | 293 | ||||||||||||
|
Private Equity
|
- | - | 958 | 958 | ||||||||||||
|
Insurance Contracts
|
- | 2 | - | 2 | ||||||||||||
|
Derivatives with unrealized gains
|
- | 2 | - | 2 | ||||||||||||
|
Derivatives with unrealized losses
|
(1 | ) | (38 | ) | - | (39 | ) | |||||||||
| $ | 259 | $ | 3,069 | $ | 1,430 | $ | 4,758 | |||||||||
For the Company’s major U.S. defined benefit pension plans, equity investments are invested broadly in U.S. equity, developed international equity, and emerging markets. Fixed income investments are comprised primarily of long duration U.S. Treasuries and global government bonds, as well as U.S. and emerging market companies’ debt securities diversified by sector, geography, and through a wide range of market capitalizations. Real estate investments include investments in office, industrial, retail and apartment properties. Other investments include private equity, hedge funds and natural resource investments. Private equity investments are primarily comprised of limited partnerships and fund-of-fund investments that invest in distressed investments, venture capital, leveraged buyout and special situation funds. Natural resource investments in oil and gas partnerships and timber funds are also included in this category. Absolute return investments are comprised of hedge funds that use equity long-short strategies.
96
Major Non-U.S. Plans
December 31, 2010
|
(in millions)
|
Quoted Prices in Active Markets for Identical Assets
(Level 1)
|
Significant Observable Inputs
(Level 2)
|
Significant Unobservable Inputs
(Level 3)
|
Total
|
||||||||||||
|
Cash and cash equivalents
|
$ | - | $ | 173 | $ | - | $ | 173 | ||||||||
|
Equity securities
|
77 | 420 | - | 497 | ||||||||||||
|
Debt securities:
|
||||||||||||||||
|
Government Bonds
|
- | 413 | - | 413 | ||||||||||||
|
Inflation-Linked Bonds
|
- | 338 | 65 | 403 | ||||||||||||
|
Investment Grade Bonds
|
- | 111 | - | 111 | ||||||||||||
|
Global High Yield & Emerging Market Debt
|
- | 203 | - | 203 | ||||||||||||
|
Other:
|
||||||||||||||||
|
Absolute Return
|
- | 76 | - | 76 | ||||||||||||
|
Real Estate
|
- | 4 | 77 | 81 | ||||||||||||
|
Private Equity
|
- | 2 | 301 | 303 | ||||||||||||
|
Insurance Contracts
|
- | 378 | - | 378 | ||||||||||||
|
Derivatives with unrealized gains
|
1 | 3 | - | 4 | ||||||||||||
|
Derivatives with unrealized losses
|
- | (8 | ) | - | (8 | ) | ||||||||||
| $ | 78 | $ | 2,113 | $ | 443 | $ | 2,634 | |||||||||
97
Major Non-U.S. Plans
December 31, 2009
|
(in millions)
|
Quoted Prices in Active Markets for Identical Assets
(Level 1)
|
Significant Observable Inputs
(Level 2)
|
Significant Unobservable Inputs
(Level 3)
|
Total
|
||||||||||||
|
Cash and cash equivalents
|
$ | - | $ | 98 | $ | - | $ | 98 | ||||||||
|
Equity securities
|
71 | 312 | - | 383 | ||||||||||||
|
Debt securities:
|
||||||||||||||||
|
Government Bonds
|
- | 526 | - | 526 | ||||||||||||
|
Inflation-Linked Bonds
|
- | 290 | 57 | 347 | ||||||||||||
|
Investment Grade Bonds
|
- | 107 | - | 107 | ||||||||||||
|
Global High Yield & Emerging Market Debt
|
- | 180 | - | 180 | ||||||||||||
|
Other:
|
||||||||||||||||
|
Absolute Return
|
- | 78 | - | 78 | ||||||||||||
|
Real Estate
|
- | 4 | 99 | 103 | ||||||||||||
|
Private Equity
|
- | 2 | 242 | 244 | ||||||||||||
|
Insurance Contracts
|
- | 448 | - | 448 | ||||||||||||
|
Derivatives with unrealized gains
|
- | 3 | - | 3 | ||||||||||||
|
Derivatives with unrealized losses
|
- | (15 | ) | - | (15 | ) | ||||||||||
| $ | 71 | $ | 2,033 | $ | 398 | $ | 2,502 | |||||||||
For the Company’s major non-U.S. defined benefit pension plans, equity investments are invested broadly in local equity, developed international and emerging markets. Fixed income investments are comprised primarily of long duration government and corporate bonds with some emerging market debt. Real estate investments include investments in primarily office, industrial, and retail properties. Other investments include private equity, hedge funds, and insurance contracts. Private equity investments are comprised of limited partnerships and fund-of-fund investments that invest in distressed investments, venture capital and leveraged buyout funds. Absolute return investments are comprised of hedge funds that use equity long-short strategies.
Cash and cash equivalents are valued utilizing cost approach valuation techniques. Equity securities and debt securities are valued using a market approach based on the closing price on the last business day of the year (if the securities are traded on an active market), or based on the proportionate share of the estimated fair value of the underlying assets (net asset value). Other investments are valued using a combination of market, income, and cost approaches, based on the nature of the investment. Absolute return investments are primarily valued based on net asset value derived from observable market inputs. Real estate investments are valued primarily based on independent appraisals and discounted cash flow models, taking into consideration discount rates and local market conditions. Private equity investments are valued primarily based on independent appraisals, discounted cash flow models, cost, and comparable market transactions, which include inputs such as discount rates and pricing data from the most recent equity financing. Insurance contracts are primarily valued based on contract values, which approximate fair value.
Some of the plans’ assets, primarily absolute return, real estate, and private equity, do not have readily determinable market values due to the nature of these investments. For these investments, fund manager or general partner estimates were used where available. The estimates for the absolute return assets are derived from observable inputs, based on the fair value of the underlying positions, which have readily available market prices. For investments with lagged pricing, the Company used the available net asset values, and also
98
considered expected return, subsequent cash flows and material events.
For all of the Company’s major defined benefit pension plans, investment managers are selected that are expected to provide best-in-class asset management for their particular asset class, and expected returns greater than those expected from existing salable assets, especially if this would maintain the aggregate volatility desired for each plan’s portfolio. Investment managers are retained for the purpose of managing specific investment strategies within contractual investment guidelines. Certain investment managers are authorized to invest in derivatives such as futures, swaps, and currency forward contracts. Investments in futures and swaps are used to obtain targeted exposure to a particular asset, index or bond duration and only require a portion of the cash to gain exposure to the notional value of the underlying investment. The remaining cash is available to be deployed and in some cases is invested in a diversified portfolio of various uncorrelated hedge fund strategies that provide added returns at a lower level of risk. Of the investments shown in the major U.S. plans table as of December 31, 2010 above, 11% and 15% of the total U.S. assets reported within equity securities and government bonds, respectively, are reflective of the exposures gained from the use of derivatives, and are invested in a diversified portfolio of hedge funds using equity, debt, commodity, and currency strategies. Of the investments shown in the major Non-U.S. plans table as of December 31, 2010 above, 6% and 11% of the total Non-U.S. assets reported within equity securities and government bonds, respectively, are reflective of the exposures gained from the use of derivatives, and are invested in a diversified portfolio of hedge funds using equity, debt, commodity, and currency strategies. Foreign currency contracts and swaps are used to partially hedge foreign currency risk. Additionally, the Company’s major defined benefit pension plans invest in government bond futures or local government bonds to partially hedge the liability risk of the plans.
The following is a reconciliation of the beginning and ending balances of level 3 assets of the Company’s major U.S. defined benefit pension plans (in millions):
|
U.S.
|
||||||||||||||||||||
|
Balance at
January 1, 2010
|
Net Realized and Unrealized Gains/(Losses)
|
Net Purchases
and Sales
|
Net Transfer Into/(Out of)
Level 3
|
Balance at
December 31, 2010
|
||||||||||||||||
|
Equity Securities
|
$ | 7 | $ | 5 | $ | 7 | $ | - | $ | 19 | ||||||||||
|
Inflation-Linked Bonds
|
172 | 49 | - | - | 221 | |||||||||||||||
|
Private Equity
|
958 | 135 | (30 | ) | - | 1,063 | ||||||||||||||
|
Real Estate
|
293 | (34 | ) | (19 | ) | - | 240 | |||||||||||||
|
Total
|
$ | 1,430 | $ | 155 | $ | (42 | ) | $ | - | $ | 1,543 | |||||||||
|
U.S.
|
||||||||||||||||||||
|
Balance at
January 1, 2009
|
Net Realized and Unrealized Gains/(Losses)
|
Net Purchases
and Sales
|
Net Transfer Into/(Out of)
Level 3
|
Balance at
December 31, 2009
|
||||||||||||||||
|
Equity Securities
|
$ | 5 | $ | 2 | $ | - | $ | - | $ | 7 | ||||||||||
|
Inflations-Linked Bonds
|
228 | 32 | (88 | ) | - | 172 | ||||||||||||||
|
Private Equity
|
926 | (5 | ) | 37 | - | 958 | ||||||||||||||
|
Real Estate
|
310 | (36 | ) | 19 | - | 293 | ||||||||||||||
|
Total
|
$ | 1,469 | $ | (7 | ) | $ | (32 | ) | $ | - | $ | 1,430 | ||||||||
The following is a reconciliation of the beginning and ending balances of level 3 assets of the Company’s major Non-U.S. defined benefit pension plans (in millions):
|
Non-U.S.
|
||||||||||||||||||||
|
Balance at
January 1, 2010
|
Net Realized and Unrealized Gains/(Losses)
|
Net Purchases
and Sales
|
Net Transfer Into/(Out of)
Level 3
|
Balance at
December 31, 2010
|
||||||||||||||||
|
Inflation-Linked Bonds
|
$ | 57 | $ | 8 | $ | - | $ | - | $ | 65 | ||||||||||
|
Private Equity
|
242 | 32 | 27 | - | 301 | |||||||||||||||
|
Real Estate
|
99 | (13 | ) | (9 | ) | - | 77 | |||||||||||||
|
Total
|
$ | 398 | $ | 27 | $ | 18 | $ | - | $ | 443 | ||||||||||
|
Non-U.S.
|
||||||||||||||||||||
|
Balance at
January 1, 2009
|
Net Realized and Unrealized Gains/(Losses)
|
Net Purchases
and Sales
|
Net Transfer Into/(Out of)
Level 3
|
Balance at
December 31, 2009
|
||||||||||||||||
|
Inflation-Linked Bonds
|
$ | 41 | $ | 16 | $ | - | $ | - | $ | 57 | ||||||||||
|
Private Equity
|
223 | (5 | ) | 24 | - | 242 | ||||||||||||||
|
Real Estate
|
140 | (15 | ) | (26 | ) | - | 99 | |||||||||||||
|
Total
|
$ | 404 | $ | (4 | ) | $ | (2 | ) | $ | - | $ | 398 | ||||||||
99
The Company expects to contribute approximately $21 million and $89 million in 2011 for U.S. and Non-U.S. defined benefit pension plans, respectively.
The following pension benefit payments, which reflect expected future service, are expected to be paid from the plans:
|
(in millions)
|
U.S.
|
Non-U.S.
|
||||||
|
2011
|
$ | 446 | $ | 209 | ||||
|
2012
|
417 | 206 | ||||||
|
2013
|
425 | 204 | ||||||
|
2014
|
404 | 202 | ||||||
|
2015
|
399 | 199 | ||||||
|
2016-2020
|
1,924 | 993 | ||||||
The Company provides healthcare, dental and life insurance benefits to U.S. eligible retirees and eligible survivors of retirees. Generally, to be eligible for the plan, individuals retiring prior to January 1, 1996 were required to be 55 years of age with ten years of service or their age plus years of service must have equaled or exceeded 75. For those retiring after December 31, 1995, the individuals must be 55 years of age with ten years of service or have been eligible as of December 31, 1995. Based on the eligibility requirements, these benefits are provided to U.S. retirees who are covered by the Company's KRIP plan and are funded from the general assets of the Company as they are incurred. However, those under the Cash Balance portion of the KRIP plan would be required to pay the full cost of their benefits under the plan.
The Company's subsidiaries in the United Kingdom and Canada offer similar postretirement benefits.
On August 1, 2008, the Company adopted and announced certain changes to its U.S. postretirement benefit plan affecting its post-September 1991 retirees beginning January 1, 2009. For affected participants, the terms of the amendment reduce the Company’s contribution toward retiree medical coverage from its 2008 level by one percentage point per year for a 10-year period, phase-out Company contributions for dependent medical coverage over the same 10-year period with access only coverage beginning in 2018, and discontinue retiree dental coverage and Company-paid life insurance.
The changes made to the plan resulted in the remeasurement of the plan’s obligations as of August 1, 2008, the date the changes were adopted and announced by the Company. This remeasurement reduced the Company’s other postretirement benefit obligation by $919 million, of which $772 million is attributable to the plan changes. In addition, the Company recognized a curtailment gain of $79 million
as a result of the amendment. The curtailment gain was included in Cost of sales, Selling, general and administrative expenses, and Research and development costs in the Consolidated Statement of Operations for the year ended December 31, 2008.
The Company’s benefits to U.S. long-term disability recipients were also amended as described above. These changes resulted in a reduction in Pension and other postretirement liabilities, and a corresponding gain of $15 million was included in the Cost of sales, Selling, general and administrative expenses, and Research and development costs in the Consolidated Statement of Operations for the year ended December 31, 2008.
On October 31, 2009, the Company adopted and announced certain changes to its U.S. postretirement benefit plans effective January 1, 2010. Modifications were made to certain retiree copays and prescription drug coverage. These changes resulted in the remeasurement of the plan’s obligations as of October 31, 2009.
On November 30, 2010, the Company adopted and announced certain changes to its U.S. postretirement benefit plans effective January 1, 2011. Modifications were made to dependent subsidy levels and prescription drug coverage. These changes resulted in the remeasurement of the plan’s obligations as of November 30, 2010.
100
The measurement date used to determine the net benefit obligation for the Company's other postretirement benefit plans is December 31.
Changes in the Company’s benefit obligation and funded status for the U.S., United Kingdom and Canada other postretirement benefit plans were as follows:
|
(in millions)
|
2010
|
2009
|
||||||
|
Net benefit obligation at beginning of year
|
$ | 1,404 | $ | 1,471 | ||||
|
Service cost
|
1 | 1 | ||||||
|
Interest cost
|
72 | 92 | ||||||
|
Plan participants’ contributions
|
9 | 25 | ||||||
|
Plan amendments
|
(29 | ) | (118 | ) | ||||
|
Actuarial loss
|
95 | 111 | ||||||
|
Curtailments
|
- | 3 | ||||||
|
Benefit payments
|
(168 | ) | (192 | ) | ||||
|
Currency adjustments
|
2 | 11 | ||||||
|
Net benefit obligation at end of year
|
$ | 1,386 | $ | 1,404 | ||||
|
Underfunded status at end of year
|
$ | (1,386 | ) | $ | (1,404 | ) | ||
Amounts recognized in the Consolidated Statement of Financial Position for the Company's U.S., United Kingdom, and Canada plans consisted of:
|
As of December 31,
|
||||||||
|
(in millions)
|
2010
|
2009
|
||||||
|
Other current liabilities
|
$ | (133 | ) | $ | (147 | ) | ||
|
Pension and other postretirement liabilities
|
(1,253 | ) | (1,257 | ) | ||||
| $ | (1,386 | ) | $ | (1,404 | ) | |||
Amounts recognized in Accumulated other comprehensive loss for the Company's U.S., United Kingdom, and Canada plans consisted of:
|
As of December 31,
|
||||||||
|
(in millions)
|
2010
|
2009
|
||||||
|
Prior service credit
|
$ | 829 | $ | 875 | ||||
|
Net actuarial loss
|
(535 | ) | (468 | ) | ||||
| $ | 294 | $ | 407 | |||||
101
Changes in benefit obligations recognized in other comprehensive loss during 2010 for the Company’s U.S., United Kingdom, and Canada plans follows:
|
(in millions)
|
As of December 31,
|
|||||||
|
2010
|
2009
|
|||||||
|
Newly established loss
|
$ | 95 | $ | 111 | ||||
|
Newly established prior service credit
|
(29 | ) | (118 | ) | ||||
|
Amortization of:
|
||||||||
|
Prior service credit
|
76 | 71 | ||||||
|
Net loss
|
(28 | ) | (22 | ) | ||||
|
Prior service credit recognized due to curtailment
|
- | 2 | ||||||
|
Total amount recognized in Other comprehensive loss
|
$ | 114 | $ | 44 | ||||
Other postretirement benefit cost from continuing operations for the Company's U.S., United Kingdom and Canada plans included:
|
For the Year Ended December 31,
|
||||||||||||
|
(in millions)
|
2010
|
2009
|
2008
|
|||||||||
|
Components of net postretirement benefit cost:
|
||||||||||||
|
Service cost
|
$ | 1 | $ | 1 | $ | 4 | ||||||
|
Interest cost
|
72 | 92 | 136 | |||||||||
|
Amortization of:
|
||||||||||||
|
Prior service credit
|
(76 | ) | (71 | ) | (53 | ) | ||||||
|
Actuarial loss
|
28 | 22 | 17 | |||||||||
|
Other postretirement benefit cost before curtailments and
settlements
|
25 | 44 | 104 | |||||||||
|
Curtailment losses (gains)
|
- | 1 | (86 | ) | ||||||||
|
Settlement gains
|
- | - | (2 | ) | ||||||||
|
Net other postretirement benefit cost from continuing
operations
|
$ | 25 | $ | 45 | $ | 16 | ||||||
Included in the curtailment gains of $86 million for the year ended December 31, 2008 was a $79 million curtailment gain related to changes to the Company’s U.S. postretirement benefit plan affecting its post-September 1991 retirees beginning January 1, 2009, as discussed above.
The prior service credit and net actuarial loss estimated to be amortized from Accumulated other comprehensive loss into net periodic benefit cost over the next year is $77 million and $33 million, respectively.
The U.S. plan represents approximately 93% of the total other postretirement net benefit obligation as of December 31, 2010 and 2009 and, therefore, the weighted-average assumptions used to compute the other postretirement benefit amounts approximate the U.S. assumptions.
The weighted-average assumptions used to determine the net benefit obligations were as follows:
|
As of December 31,
|
||||||||
|
2010
|
2009
|
|||||||
|
Discount rate
|
5.03 | % | 5.54 | % | ||||
|
Salary increase rate
|
3.84 | % | 3.90 | % | ||||
102
The weighted-average assumptions used to determine the net postretirement benefit cost were as follows:
|
For the Year Ended December 31,
|
||||||||||||
|
2010
|
2009
|
2008
|
||||||||||
|
Discount rate
|
5.93 | % | 6.59 | % | 7.23 | % | ||||||
|
Salary increase rate
|
3.90 | % | 3.96 | % | 4.48 | % | ||||||
The weighted-average assumed healthcare cost trend rates used to compute the other postretirement amounts were as follows:
|
2010
|
2009
|
|||||||
|
Healthcare cost trend
|
7.50 | % | 8.00 | % | ||||
|
Rate to which the cost trend rate is assumed to decline (the
ultimate trend rate)
|
5.00 | % | 5.00 | % | ||||
|
Year that the rate reaches the ultimate trend rate
|
2016 | 2013 | ||||||
A one-percentage point change in assumed healthcare cost trend rates would have the following effects:
|
(in millions)
|
1% increase
|
1% decrease
|
||||||
|
Effect on total service and interest cost
|
$ | 2 | $ | (1 | ) | |||
|
Effect on postretirement benefit obligation
|
29 | (25 | ) | |||||
The Company expects to make $133 million of benefit payments for its unfunded other postretirement benefit plans in 2011.
The following other postretirement benefits, which reflect expected future service, are expected to be paid:
|
(in millions)
|
||||
|
2011
|
$ | 133 | ||
|
2012
|
132 | |||
|
2013
|
121 | |||
|
2014
|
116 | |||
|
2015
|
111 | |||
|
2016-2020
|
492 | |||
The components of Accumulated other comprehensive (loss) income, net of tax, were as follows:
|
As of December 31,
|
||||||||||||
|
(in millions)
|
2010
|
2009
|
2008
|
|||||||||
|
Realized and unrealized gains (losses) from hedging activity, net of
tax
|
$ | 2 | $ | 6 | $ | (6 | ) | |||||
|
Currency translation adjustments
|
315 | 235 | 231 | |||||||||
|
Pension and other postretirement benefit plan obligation activity,
net of tax
|
(2,452 | ) | (2,001 | ) | (974 | ) | ||||||
|
Total
|
$ | (2,135 | ) | $ | (1,760 | ) | $ | (749 | ) | |||
See Note 17, “Retirement Plans,” and Note 18, “Other Postretirement Benefits,” regarding the pension and other postretirement plan obligation activity.
103
The Company recognized stock-based compensation expense in the amount of $21 million, $20 million and $18 million for the years ended December 31, 2010, 2009 and 2008, respectively. Stock-based compensation costs for employees related to manufacturing activities were included in the costs capitalized in inventory at period end. Proceeds from the issuance of common stock through stock option plans were not material for the years ended December 31, 2010, 2009, or 2008.
Of the expense amounts noted above, compensation expense related to stock options during the years ended December 31, 2010, 2009 and 2008 was $4 million, $5 million and $10 million, respectively. Compensation expense related to unvested stock and performance awards during the years ended December 31, 2010, 2009 and 2008 was $17 million, $15 million and $8 million, respectively.
The Company’s stock incentive plans consist of the 2005 Omnibus Long-Term Compensation Plan (the “2005 Plan”), the 2000 Omnibus Long-Term Compensation Plan (the “2000 Plan”), and the 1995 Omnibus Long-Term Compensation Plan (the “1995 Plan”). The Plans are administered by the Executive Compensation and Development Committee of the Board of Directors. Stock options are generally non-qualified and are at exercise prices not less than 100% of the per share fair market value on the date of grant. Stock-based compensation awards granted under the Company’s stock incentive plans are generally subject to a three-year vesting period from the date of grant.
Under the 2005 Plan, 11 million shares of the Company's common stock may be granted to employees between January 1, 2005 and December 31, 2014. This share reserve may be increased by: shares that are forfeited pursuant to awards made under the 1995, 2000, and 2005 Plans; shares retained for payment of tax withholding; shares delivered for payment or satisfaction of tax withholding; shares reacquired on the open market using cash proceeds from option exercises; and awards that otherwise do not result in the issuance of shares. The 2005 Plan is substantially similar to and is intended to replace the 2000 Plan, which expired on January 18, 2005. Options granted under the 2005 Plan generally expire seven years from the date of grant, but may be forfeited or canceled earlier if the optionee's employment terminates prior to the end of the contractual term. The 2005 Plan provides for, but is not limited to, grants of unvested stock, performance awards, and Stock Appreciation Rights (“SARs”), either in tandem with options or freestanding. SARs allow optionees to receive payment equal to the increase in the market price of the Company's stock from the grant date to the exercise date. As of December 31, 2010, 10,000 freestanding SARs were outstanding under the 2005 Plan at an option price of $7.50. Compensation expense recognized for the years ended December 31, 2010, 2009, and 2008 on those freestanding SARs was not material.
Under the 2000 Plan, 22 million shares of the Company's common stock were eligible for grant to a variety of employees between January 1, 2000 and December 31, 2004. The 2000 Plan was substantially similar to, and was intended to replace, the 1995 Plan, which expired on December 31, 1999. The options generally expire ten years from the date of grant, but may expire sooner if the optionee's employment terminates. The 2000 Plan provided for, but was not limited to, grants of unvested stock, performance awards, and SARs, either in tandem with options or freestanding. As of December 31, 2010, 27,527 freestanding SARs were outstanding under the 2000 Plan at option prices ranging from $23.25 to $40.97. Compensation expense recognized for the years ended December 31, 2010, 2009, and 2008 on those freestanding SARs was not material.
Under the 1995 Plan, 22 million shares of the Company’s common stock were eligible for grant to a variety of employees between February 1, 1995 and December 31, 1999. The options generally expire ten years from the date of grant, but may expire sooner if the optionee’s employment terminates. The 1995 Plan provided for, but was not limited to, grants of unvested stock, performance awards, and SARs, either in tandem with options or freestanding. As of December 31, 2010, no freestanding SARs were outstanding under the 1995 Plan.
104
Further information relating to stock options is as follows:
|
Shares
|
Weighted-Average
|
||||
|
Under
|
Range of Price
|
Exercise
|
|||
|
(Amounts in thousands, except per share amounts)
|
Option
|
Per Share
|
Price Per Share
|
||
|
Outstanding on December 31, 2007
|
30,893
|
$20.12 - $87.59
|
$39.70
|
||
|
Granted
|
2,813
|
$7.41 - $18.55
|
$7.60
|
||
|
Exercised
|
0
|
N/A
|
N/A
|
||
|
Terminated, Expired, Surrendered
|
8,499
|
$20.12 - $87.59
|
$52.78
|
||
|
Outstanding on December 31, 2008
|
25,207
|
$7.41 - $79.63
|
$31.71
|
||
|
Granted
|
1,229
|
$2.64 - $6.76
|
$4.61
|
||
|
Exercised
|
0
|
N/A
|
N/A
|
||
|
Terminated, Expired, Surrendered
|
2,916
|
$7.41 - $79.63
|
$45.73
|
||
|
Outstanding on December 31, 2009
|
23,520
|
$2.64 - $65.91
|
$28.55
|
||
|
Granted
|
300
|
$3.96 - $5.96
|
$4.17
|
||
|
Exercised
|
0
|
N/A
|
N/A
|
||
|
Terminated, Expired, Surrendered
|
5,790
|
$7.41 - $65.91
|
$37.68
|
||
|
Outstanding on December 31, 2010
|
18,030
|
$2.64 - $48.34
|
$25.22
|
||
|
Exercisable on December 31, 2008
|
20,772
|
$21.93 - $79.63
|
$35.56
|
||
|
Exercisable on December 31, 2009
|
20,018
|
$7.41 - $65.91
|
$31.96
|
||
|
Exercisable on December 31, 2010
|
16,036
|
$2.64 - $48.34
|
$27.64
|
||
The following table summarizes information about stock options as of December 31, 2010:
(Number of options in thousands)
|
Options Outstanding
|
Options Exercisable
|
||||
|
Range of Exercise
|
Weighted-Average
|
||||
|
Prices
|
Remaining
|
||||
|
At Less
|
Contractual Life
|
Weighted-Average
|
Weighted-Average
|
||
|
Least Than
|
Options
|
(Years)
|
Exercise Price
|
Options
|
Exercise Price
|
|
$ 2 - $20
|
4,075
|
5.02
|
$6.46
|
2,081
|
$7.18
|
|
$20 - $30
|
5,053
|
2.12
|
$25.41
|
5,053
|
$25.41
|
|
$30 - $40
|
8,347
|
1.18
|
$33.16
|
8,347
|
$33.16
|
|
$40 - $50
|
555
|
0.08
|
$41.65
|
555
|
$41.65
|
|
18,030
|
16,036
|
||||
At December 31, 2010, the weighted-average remaining contractual term of all options outstanding and exercisable was 2.28 years and 1.88 years respectively. There was no intrinsic value of options outstanding and exercisable due to the fact that the market price of the Company's common stock as of December 31, 2010 was below the weighted-average exercise price of options. There were no option exercises during 2008, 2009 or 2010.
The fair value of each option award is estimated on the date of grant using the Black-Scholes option valuation model that uses the assumptions noted in the following table. Expected volatilities are based on historical volatility of the Company's stock, management's estimate of implied volatility of the Company's stock, and other factors. The expected term of options granted is derived from the vesting period of the award, as well as historical exercise behavior, and represents the period of time that options granted are expected to be outstanding. The risk-free rate is calculated using the U.S. Treasury yield curve, and is based on the expected term of the option. The Company uses historical data to estimate forfeitures.
105
The Black-Scholes option pricing model was used with the following weighted-average assumptions for options issued in each year:
|
For the Year Ended
|
||||||
|
2010
|
2009
|
2008
|
||||
|
Weighted-average risk-free interest rate
|
1.50%
|
2.63%
|
1.83%
|
|||
|
Risk-free interest rates
|
1.5% - 2.9%
|
1.9% - 2.7%
|
1.8% - 2.9%
|
|||
|
Weighted-average expected option lives
|
6 years
|
6 years
|
6 years
|
|||
|
Expected option lives
|
6 years
|
6 years
|
4 - 6 years
|
|||
|
Weighted-average volatility
|
57%
|
45%
|
32%
|
|||
|
Expected volatilities
|
45% - 58%
|
45%
|
30% - 32%
|
|||
|
Weighted-average expected dividend yield
|
0.0%
|
0.4%
|
7.4%
|
|||
|
Expected dividend yields
|
0.0%
|
0.0% - 7.1%
|
3.1% - 7.4%
|
|||
The weighted-average fair value per option granted in 2010, 2009, and 2008 was $2.16, $2.06, and $0.93, respectively.
As of December 31, 2010, there was $2 million of total unrecognized compensation cost related to unvested options. The cost is expected to be recognized over a weighted-average period of 1.8 years.
2010
There were no significant acquisitions in 2010.
2009
In the third quarter of 2009, the Company acquired the scanner division of BÖWE BELL + HOWELL, which markets a portfolio of production document scanners that complements the products currently offered within the GCG segment. Through this acquisition, Kodak expects to expand customer value by providing a wider choice of production scanners. Since Kodak has provided field service to BÖWE BELL + HOWELL scanners since 2001, this acquisition is also expected to enhance global access to service and support for channel partners and end-user customers worldwide. This acquisition was immaterial to the Company’s financial position as of December 31, 2009, and its results of operations and cash flows for the year ended December 31, 2009.
2008
On April 4, 2008, the Company completed the acquisition of Design2Launch (“D2L”), a developer of collaborative end-to-end digital workflow solutions for marketers, brand owners and creative teams. D2L is part of the Company’s GCG segment.
On April 10, 2008, the Company completed the acquisition of Intermate A/S, a global supplier of remote monitoring and print connectivity solutions used extensively in transactional printing. Intermate A/S is part of the Company’s GCG segment.
The two acquisitions had an aggregate purchase price of approximately $37 million and were individually immaterial to the Company’s financial position as of December 31, 2008, and its results of operations and cash flows for the year ended December 31, 2008.
106
The components of earnings from discontinued operations, net of income taxes, are as follows:
|
For the Year Ended December 31,
|
||||||||||||
|
(in millions)
|
2010
|
2009
|
2008
|
|||||||||
|
(Provision) benefit for income taxes related to discontinued operations
|
$ | (10 | ) | $ | 8 | $ | 288 | |||||
|
All other items, net
|
(2 | ) | 9 | (3 | ) | |||||||
|
(Loss) earnings from discontinued operations, net of income taxes
|
$ | (12 | ) | $ | 17 | $ | 285 | |||||
In the second quarter of 2008, the Company received a tax refund from the U.S. Internal Revenue Service. The refund was related to the audit of certain claims filed for tax years 1993-1998. A portion of the refund related to past federal income taxes paid in relation to the 1994 sale of a subsidiary, Sterling Winthrop Inc., which was reported in discontinued operations. The refund had a positive impact on the Company’s earnings from discontinued operations, net of income taxes, for the year ended December 31, 2008 of $295 million. See Note 15, “Income Taxes,” in the Notes to Financial Statements for further discussion of the tax refund.
The terms of the purchase agreement of the 2004 acquisition of NexPress Solutions LLC called for additional consideration to be paid by the Company if sales of certain products exceeded a stated minimum number of units sold during a five-year period following the close of the transaction. In May 2009, the earn-out period lapsed with no additional consideration required to be paid by the Company. Negative goodwill, representing the contingent consideration obligation of $17 million, was therefore reduced to zero. The reversal of negative goodwill reduced Property, plant and equipment, net by $2 million and Research and development expense by $7 million and resulted in an extraordinary gain of $6 million, net of tax, during the year ended December 31, 2009.
Current Segment Reporting Structure
For 2010, the Company had three reportable segments: Consumer Digital Imaging Group (“CDG”), Graphic Communications Group (“GCG”), and Film, Photofinishing and Entertainment Group (“FPEG”). The balance of the Company's continuing operations, which individually and in the aggregate do not meet the criteria of a reportable segment, are reported in All Other. A description of the segments is as follows:
Consumer Digital Imaging Group Segment (“CDG”):
CDG encompasses digital still and video cameras, digital devices such as picture frames, kiosks, APEX drylab systems, and related consumables and services, consumer inkjet printing systems, Kodak Gallery products and services, and imaging sensors. CDG also includes the licensing activities related to the Company's intellectual property in digital imaging products.
Graphic Communications Group Segment (“GCG”):
GCG encompasses workflow software and digital controllers; digital printing, which includes commercial inkjet and electrophotographic products, including equipment, consumables and service; prepress consumables; prepress equipment and packaging solutions; business solutions and consulting services; and document scanners.
Film, Photofinishing and Entertainment Group Segment (“FPEG”):
FPEG encompasses consumer and professional film, one-time-use cameras, aerial and industrial materials, and entertainment imaging products and services. In addition, this segment also includes paper and output systems, and photofinishing services.
All Other:
This category includes the results of the Company’s display business, up to the date of sale of assets of this business in the fourth quarter of 2009.
107
Transactions between segments, which are immaterial, are made on a basis intended to reflect the market value of the products, recognizing prevailing market prices and distributor discounts. Differences between the reportable segments’ operating results and assets and the Company’s consolidated financial statements relate primarily to items held at the corporate level, and to other items excluded from segment operating measurements.
Segment financial information is shown below.
|
For the Year Ended December 31,
|
||||||||||||
|
(in millions)
|
2010
|
2009
|
2008
|
|||||||||
|
Net sales from continuing operations:
|
||||||||||||
|
Consumer Digital Imaging Group
|
$ | 2,739 | $ | 2,619 | $ | 3,088 | ||||||
|
Graphic Communications Group
|
2,681 | 2,726 | 3,334 | |||||||||
|
Film, Photofinishing and Entertainment Group
|
1,767 | 2,257 | 2,987 | |||||||||
|
All Other
|
- | 4 | 7 | |||||||||
|
Consolidated total
|
$ | 7,187 | $ | 7,606 | $ | 9,416 | ||||||
|
Earnings (loss) from continuing operations before
interest expense, other income (charges), net and
income taxes:
|
||||||||||||
|
Consumer Digital Imaging Group
|
$ | 331 | $ | 35 | $ | (177 | ) | |||||
|
Graphic Communications Group
|
(26 | ) | (42 | ) | 31 | |||||||
|
Film, Photofinishing and Entertainment Group
|
64 | 159 | 196 | |||||||||
|
All Other
|
- | (13 | ) | (17 | ) | |||||||
|
Total
|
369 | 139 | 33 | |||||||||
|
Restructuring costs, rationalization and other
|
(78 | ) | (258 | ) | (149 | ) | ||||||
|
Postemployment benefit changes
|
- | - | 94 | |||||||||
|
Other operating (expenses) income, net
|
(619 | ) | 88 | (766 | ) | |||||||
|
Adjustments to contingencies and legal
reserves/settlements
|
(8 | ) | 3 | (33 | ) | |||||||
|
Interest expense
|
(149 | ) | (119 | ) | (108 | ) | ||||||
|
Loss on early extinguishment of debt
|
(102 | ) | - | - | ||||||||
|
Other income (charges), net
|
26 | 30 | 55 | |||||||||
|
Consolidated loss from continuing operations before
income taxes
|
$ | (561 | ) | $ | (117 | ) | $ | (874 | ) | |||
|
As of December 31,
|
||||||||||||
|
(in millions)
|
2010
|
2009
|
2008
|
|||||||||
|
Segment total assets:
|
||||||||||||
|
Consumer Digital Imaging Group
|
$ | 1,133 | $ | 1,203 | $ | 1,647 | ||||||
|
Graphic Communications Group
|
1,570 | 1,737 | 2,190 | |||||||||
|
Film, Photofinishing and Entertainment Group
|
1,092 | 1,992 | 2,563 | |||||||||
|
Total of reportable segments
|
3,795 | 4,932 | 6,400 | |||||||||
|
Cash and marketable securities
|
1,628 | 2,031 | 2,155 | |||||||||
|
Deferred income tax assets
|
815 | 728 | 620 | |||||||||
|
All Other/ corporate items
|
1 | - | 4 | |||||||||
|
Consolidated total assets
|
$ | 6,239 | $ | 7,691 | $ | 9,179 | ||||||
108
|
For the Year Ended December 31,
|
||||||||||||
|
(in millions)
|
2010
|
2009
|
2008
|
|||||||||
|
Intangible asset amortization expense
from continuing operations:
|
||||||||||||
|
Consumer Digital Imaging Group
|
$ | - | $ | - | $ | 5 | ||||||
|
Graphic Communications Group
|
58 | 71 | 73 | |||||||||
|
Film, Photofinishing and Entertainment Group
|
2 | 2 | 2 | |||||||||
|
Consolidated total
|
$ | 60 | $ | 73 | $ | 80 | ||||||
|
Depreciation expense from continuing
operations:
|
||||||||||||
|
Consumer Digital Imaging Group
|
$ | 89 | $ | 86 | $ | 100 | ||||||
|
Graphic Communications Group
|
85 | 94 | 120 | |||||||||
|
Film, Photofinishing and Entertainment Group
|
136 | 151 | 191 | |||||||||
|
All Other
|
2 | 1 | 3 | |||||||||
|
Sub-total
|
312 | 332 | 414 | |||||||||
|
Restructuring-related depreciation
|
6 | 22 | 6 | |||||||||
|
Consolidated total
|
$ | 318 | $ | 354 | $ | 420 | ||||||
|
Capital additions from continuing
operations:
|
||||||||||||
|
Consumer Digital Imaging Group
|
$ | 59 | $ | 61 | $ | 96 | ||||||
|
Graphic Communications Group
|
64 | 67 | 118 | |||||||||
|
Film, Photofinishing and Entertainment Group
|
26 | 23 | 40 | |||||||||
|
All Other
|
- | 1 | - | |||||||||
|
Consolidated total
|
$ | 149 | $ | 152 | $ | 254 | ||||||
|
Net sales to external customers
attributed to (1):
|
||||||||||||
|
The United States
|
$ | 3,104 | $ | 3,083 | $ | 3,834 | ||||||
|
Europe, Middle East and Africa
|
$ | 2,039 | $ | 2,358 | $ | 3,089 | ||||||
|
Asia Pacific
|
1,240 | 1,298 | 1,500 | |||||||||
|
Canada and Latin America
|
804 | 867 | 993 | |||||||||
|
Foreign countries total
|
$ | 4,083 | $ | 4,523 | $ | 5,582 | ||||||
|
Consolidated total
|
$ | 7,187 | $ | 7,606 | $ | 9,416 | ||||||
(1) Sales are reported in the geographic area in which they originate.
|
As of December 31,
|
||||||||||||
|
(in millions)
|
2010
|
2009
|
2008
|
|||||||||
|
Property, plant and equipment, net
located in :
|
||||||||||||
|
The United States
|
$ | 664 | $ | 819 | $ | 1,079 | ||||||
|
Europe, Middle East and Africa
|
$ | 189 | $ | 219 | $ | 243 | ||||||
|
Asia Pacific
|
144 | 159 | 146 | |||||||||
|
Canada and Latin America
|
40 | 57 | 83 | |||||||||
|
Foreign countries total
|
$ | 373 | $ | 435 | $ | 472 | ||||||
|
Consolidated total
|
$ | 1,037 | $ | 1,254 | $ | 1,551 | ||||||
109
|
(in millions, except per share data)
|
4th Qtr.
|
3rd Qtr.
|
2nd Qtr.
|
1st Qtr.
|
||||||||||||||||||||||||||||
|
2010
|
||||||||||||||||||||||||||||||||
|
Net sales from continuing operations
|
$ | 1,927 | $ | 1,758 | $ | 1,569 | $ | 1,933 | ||||||||||||||||||||||||
|
Gross profit from continuing operations
|
377 | 476 | 303 | 795 | ||||||||||||||||||||||||||||
|
(Loss) earnings from continuing operations
|
(584 | ) | (4 | ) | (43 | ) | (3 | ) | (167 | ) | (2 | ) | 119 | (1 | ) | |||||||||||||||||
|
Loss from discontinued operations (9)
|
(11 | ) | - | (1 | ) | - | ||||||||||||||||||||||||||
|
Net (loss) earnings
|
(595 | ) | (43 | ) | (168 | ) | 119 | |||||||||||||||||||||||||
|
Less: Net earnings attributable to noncontrolling interests
|
- | - | - | - | ||||||||||||||||||||||||||||
|
Net (loss) earnings attributable to Eastman Kodak Company
|
(595 | ) | (43 | ) | (168 | ) | 119 | |||||||||||||||||||||||||
|
Basic net (loss) earnings per share attributable to Eastman Kodak Company common shareholders (11)
|
||||||||||||||||||||||||||||||||
|
Continuing operations
|
(2.17 | ) | (0.16 | ) | (0.62 | ) | 0.44 | |||||||||||||||||||||||||
|
Discontinued operations
|
(0.05 | ) | - | (0.01 | ) | - | ||||||||||||||||||||||||||
|
Total
|
(2.22 | ) | (0.16 | ) | (0.63 | ) | 0.44 | |||||||||||||||||||||||||
|
Diluted net (loss) earnings per share attributable to Eastman Kodak Company common shareholders (11)
|
||||||||||||||||||||||||||||||||
|
Continuing operations
|
(2.17 | ) | (0.16 | ) | (0.62 | ) | 0.40 | |||||||||||||||||||||||||
|
Discontinued operations
|
(0.05 | ) | - | (0.01 | ) | - | ||||||||||||||||||||||||||
|
Total
|
(2.22 | ) | (0.16 | ) | (0.63 | ) | 0.40 | |||||||||||||||||||||||||
|
2009
|
||||||||||||||||||||||||||||||||
|
Net sales from continuing operations
|
$ | 2,582 | $ | 1,781 | $ | 1,766 | $ | 1,477 | ||||||||||||||||||||||||
|
Gross profit from continuing operations
|
887 | 361 | 326 | 194 | ||||||||||||||||||||||||||||
|
Earnings (loss) from continuing operations
|
430 | (8 | ) | (111 | ) | (7 | ) | (191 | ) | (6 | ) | (360 | ) | (5 | ) | |||||||||||||||||
|
Earnings (loss) from discontinued operations (9)
|
14 | - | (4 | ) | 7 | |||||||||||||||||||||||||||
|
Extraordinary item, net of tax (10)
|
- | - | 6 | - | ||||||||||||||||||||||||||||
|
Net earnings (loss)
|
444 | (111 | ) | (189 | ) | (353 | ) | |||||||||||||||||||||||||
|
Less: Net earnings attributable to noncontrolling interests
|
(1 | ) | - | - | - | |||||||||||||||||||||||||||
|
Net earnings (loss) attributable to Eastman Kodak Company
|
443 | (111 | ) | (189 | ) | (353 | ) | |||||||||||||||||||||||||
|
Basic net earnings (loss) per share attributable to Eastman Kodak Company common shareholders (11)
|
||||||||||||||||||||||||||||||||
|
Continuing operations
|
1.60 | (0.41 | ) | (0.71 | ) | (1.34 | ) | |||||||||||||||||||||||||
|
Discontinued operations
|
0.05 | - | (0.01 | ) | 0.02 | |||||||||||||||||||||||||||
|
Extraordinary item
|
- | - | 0.02 | - | ||||||||||||||||||||||||||||
|
Total
|
1.65 | (0.41 | ) | (0.70 | ) | (1.32 | ) | |||||||||||||||||||||||||
|
Diluted net earnings (loss) per share attributable to Eastman Kodak Company common shareholders (11)
|
||||||||||||||||||||||||||||||||
|
Continuing operations
|
1.36 | (0.41 | ) | (0.71 | ) | (1.34 | ) | |||||||||||||||||||||||||
|
Discontinued operations
|
0.04 | - | (0.01 | ) | 0.02 | |||||||||||||||||||||||||||
|
Extraordinary item
|
- | - | 0.02 | - | ||||||||||||||||||||||||||||
|
Total
|
1.40 | (0.41 | ) | (0.70 | ) | (1.32 | ) | |||||||||||||||||||||||||
|
(footnotes on next page)
|
110
|
(1)
|
Includes pre-tax restructuring charges of $14 million ($1 million included in Cost of sales and $13 million included in Restructuring costs, rationalization and other), which decreased net earnings from continuing operations by $12 million; a pre-tax loss on early extinguishment of debt of $102 million, which decreased net earnings from continuing operations by $102 million; a pre-tax loss on asset sales of $4 million (included in Other operating expenses (income), net), which decreased net earnings from continuing operations by $4 million; and other discrete tax items, which decreased net earnings from continuing operations by $19 million.
|
|
(2)
|
Includes pre-tax restructuring charges of $11 million (included in Restructuring costs, rationalization and other), which increased net loss from continuing operations by $11 million; pre-tax legal contingencies and settlements of $19 million ($10 million included in Cost of sales, $3 million included in Interest expense, and $6 million included in Other income (charges), net), which increased net loss from continuing operations by $19 million; a pre-tax gain on asset sales of $2 million (included in Other operating expenses (income), net), which decreased net loss from continuing operations by $2 million; and other discrete tax items, which increased net loss from continuing operations by $3 million.
|
|
(3)
|
Includes pre-tax restructuring charges of $29 million ($5 million included in Cost of sales and $24 million included in Restructuring, rationalization and other), which increased net loss from continuing operations by $28 million; a pre-tax gain on asset sales of $3 million (included in Other operating expenses (income), net), which decreased net loss from continuing operations by $3 million; and other discrete tax items, which increased net loss from continuing operations by $13 million.
|
|
(4)
|
Includes a pre-tax goodwill impairment charge of $626 million (included in Other operating expenses (income), net), which increased net loss from continuing operations by $624 million, pre-tax restructuring charges of $24 million ($2 million included in Cost of sales and $22 million included in Restructuring costs, rationalization and other), which increased net loss from continuing operations by $24 million; a pre-tax foreign contingency of $6 million ($2 million included in Cost of sales, $2 million in Interest expense, and $2 million in Other income (charges), net), which decreased net loss from continuing operations by $6 million; a pre-tax gain on asset sales of $6 million (included in Other operating expenses (income), net), which decreased net loss from continuing operations by $6 million; and other discrete tax items, which decreased net loss from continuing operations by $144 million.
|
|
(5)
|
Includes pre-tax restructuring and rationalization charges of $116 million ($7 million included in Cost of sales and $109 million included in Restructuring costs, rationalization and other), which increased net loss from continuing operations by $108 million; a pre-tax legal contingency of $5 million (included in Cost of sales), which increased net loss from continuing operations by $5 million; a pre-tax loss on asset sales of $4 million (included in Other operating expenses (income), net), which increased net loss from continuing operations by $4 million; and other discrete tax items, which reduced net loss from continuing operations by $12 million.
|
|
(6)
|
Includes pre-tax restructuring and rationalization charges of $46 million ($9 million included in Cost of sales and $37 million included in Restructuring costs, rationalization and other), which increased net loss from continuing operations by $42 million; a pre-tax reversal of negative goodwill of $7 million (included in Research and development costs), which reduced net loss from continuing operations by $7 million; a pre-tax reversal of a value-added tax reserve of $5 million (included in Interest expense, and Other income (charges), net), which reduced net loss from continuing operations by $5 million; and other discrete tax items, which increased net loss from continuing operations by $45 million.
|
|
(7)
|
Includes pre-tax restructuring and rationalization charges of $35 million ($2 million included in Cost of sales and $33 million included in Restructuring, rationalization and other), which increased net loss from continuing operations by $32 million; a pre-tax loss on asset sales of $10 million (included in Other operating expenses (income), net), which increased net loss from continuing operations by $10 million; and other discrete tax items, which increased net loss from continuing operations by $6 million.
|
|
(8)
|
Includes pre-tax restructuring and rationalization charges of $61 million ($14 million included in Cost of sales and $47 million included in Restructuring, rationalization and other), which reduced net earnings from continuing operations by $55 million; a pre-tax asset impairment charge of $6 million (included in Other operating (income) expenses, net), which reduced net earnings from continuing operations by $6 million; pre-tax gains on sales of assets of $107 million, which increased net earnings from continuing operations by $107 million; a pre-tax reversal of a value-added tax reserve of $4 million ($2 million included in Cost of sales, $1 million in Interest expense, and $1 million in Other income (charges), net), which increased net earnings from continuing operations by $4 million; and other discrete tax items, which increased net earnings from continuing operations by $40 million.
|
|
(9)
|
Refer to Note 22, “Discontinued Operations,” in the Notes to Financial Statements for a discussion regarding earnings (loss) from discontinued operations.
|
(10) Refer to Note 23, “Extraordinary Item,” in the Notes to Financial Statements.
|
(11)
|
Each quarter is calculated as a discrete period and the sum of the four quarters may not equal the full year amount. The Company's diluted net earnings (loss) per share in the above table may include the effect of convertible debt instruments.
|
|
Changes in Estimates Recorded During the Fourth Quarter Ended December 31, 2010
|
During the fourth quarter ended December 31, 2010, the Company recorded a reduction of expense of approximately $27 million, net of tax, related to changes in estimates with respect to certain of its employee benefit and compensation accruals. These changes in estimates positively impacted results for the quarter by $.10 per share.
111
Eastman Kodak Company
SUMMARY OF OPERATING DATA - UNAUDITED
(in millions, except per share data, shareholders, and employees)
|
2010
|
2009
|
2008
|
2007
|
2006
|
||||||||||||||||||||||||||||||||||||
|
Net sales from continuing operations (9)
|
$ | 7,187 | $ | 7,606 | $ | 9,416 | $ | 10,301 | $ | 10,568 | ||||||||||||||||||||||||||||||
|
Loss from continuing operations before interest expense,
other income (charges), net and income taxes
|
(336 | ) | (28 | ) | (821 | ) | (230 | ) | (476 | ) | ||||||||||||||||||||||||||||||
|
(Loss) earnings from:
|
||||||||||||||||||||||||||||||||||||||||
|
Continuing operations
|
(675 | ) | (1 | ) | (232 | ) | (2 | ) | (727 | ) | (3 | ) | (206 | ) | (4 | ) | (796 | ) | (5 | ) | ||||||||||||||||||||
|
Discontinued operations
|
(12 | ) | (6 | ) | 17 | (6 | ) | 285 | (6 | ) | 884 | 209 | ||||||||||||||||||||||||||||
|
Extraordinary item, net of
tax
|
- | 6 | - | - | - | |||||||||||||||||||||||||||||||||||
|
Net (Loss) Earnings
|
(687 | ) | (209 | ) | (442 | ) | 678 | (587 | ) | |||||||||||||||||||||||||||||||
|
Less: Net earnings attributable to noncontrolling interests
|
- | (1 | ) | - | (2 | ) | (7 | ) | ||||||||||||||||||||||||||||||||
|
Net (Loss) Earnings Attributable to Eastman Kodak Company
|
(687 | ) | (210 | ) | (442 | ) | 676 | (594 | ) | |||||||||||||||||||||||||||||||
|
Earnings and Dividends
|
||||||||||||||||||||||||||||||||||||||||
|
(Loss) earnings from continuing operations
|
||||||||||||||||||||||||||||||||||||||||
|
- % of net sales from
continuing operations
|
-9.4 | % | -3.1 | % | -7.7 | % | -2.0 | % | -7.5 | % | ||||||||||||||||||||||||||||||
|
Net (loss) earnings
|
||||||||||||||||||||||||||||||||||||||||
|
- % return on average
equity
|
-124.0 | % | -44.0 | % | -21.8 | % | 30.2 | % | -31.3 | % | ||||||||||||||||||||||||||||||
|
Basic and diluted (loss) earnings per share attributable to Eastman Kodak Company common shareholders:
|
||||||||||||||||||||||||||||||||||||||||
|
Continuing operations
|
(2.51 | ) | (0.87 | ) | (2.58 | ) | (0.71 | ) | (2.78 | ) | ||||||||||||||||||||||||||||||
|
Discontinued operations
|
(0.05 | ) | 0.07 | 1.01 | 3.06 | 0.71 | ||||||||||||||||||||||||||||||||||
|
Extraordinary item, net of
tax
|
- | 0.02 | - | - | - | |||||||||||||||||||||||||||||||||||
|
Total
|
(2.56 | ) | (0.78 | ) | (1.57 | ) | 2.35 | (2.07 | ) | |||||||||||||||||||||||||||||||
|
Cash dividends declared and paid
|
||||||||||||||||||||||||||||||||||||||||
|
- on common shares
|
- | - | 139 | 144 | 144 | |||||||||||||||||||||||||||||||||||
|
- per comon share
|
- | - | 0.50 | 0.50 | 0.50 | |||||||||||||||||||||||||||||||||||
|
Common shares outstanding at year end
|
268.9 | 268.6 | 268.2 | 288.0 | 287.3 | |||||||||||||||||||||||||||||||||||
|
Shareholders at year end
|
51,802 | 54,078 | 56,115 | 58,652 | 63,193 | |||||||||||||||||||||||||||||||||||
|
Statement of Financial Position Data
|
||||||||||||||||||||||||||||||||||||||||
|
Working capital
|
966 | 1,407 | 1,566 | 1,631 | 1,027 | |||||||||||||||||||||||||||||||||||
|
Property, plant and equipment, net
|
1,037 | 1,254 | 1,551 | 1,811 | 2,602 | |||||||||||||||||||||||||||||||||||
|
Total assets
|
6,239 | 7,691 | 9,179 | 13,659 | 14,320 | |||||||||||||||||||||||||||||||||||
|
Short-term borrowings and current portion of long-term
debt
|
50 | 62 | 51 | 308 | 64 | |||||||||||||||||||||||||||||||||||
|
Long-term debt, net of current portion
|
1,195 | 1,129 | 1,252 | 1,289 | 2,714 | |||||||||||||||||||||||||||||||||||
| 2010 | 2009 | 2008 | 2007 | 2006 | ||||||||||||||||||||||||||||||||||||
|
Supplemental Information
|
||||||||||||||||||||||||||||||||||||||||
|
Net sales from continuing operations
|
||||||||||||||||||||||||||||||||||||||||
|
- CDG
|
$ | 2,739 | $ | 2,619 | $ | 3,088 | $ | 3,247 | $ | 3,013 | ||||||||||||||||||||||||||||||
|
- GCG
|
2,681 | 2,726 | 3,334 | 3,413 | 3,287 | |||||||||||||||||||||||||||||||||||
|
- FPEG
|
1,767 | 2,257 | 2,987 | 3,632 | 4,254 | |||||||||||||||||||||||||||||||||||
|
- All Other
|
- | 4 | 7 | 9 | 14 | |||||||||||||||||||||||||||||||||||
|
Research and development costs
|
321 | 356 | 478 | 525 | 573 | |||||||||||||||||||||||||||||||||||
|
Depreciation
|
318 | 354 | 420 | 679 | 1,075 | |||||||||||||||||||||||||||||||||||
|
Taxes (excludes payroll, sales and excise taxes) (7)
|
146 | 149 | (105 | ) | 5 | 320 | ||||||||||||||||||||||||||||||||||
|
Wages, salaries and employee benefits (8)
|
1,572 | 1,732 | 2,141 | 2,846 | 3,480 | |||||||||||||||||||||||||||||||||||
|
Employees as of year end
|
||||||||||||||||||||||||||||||||||||||||
|
- in the U.S. (7)
|
9,600 | 10,630 | 12,800 | 14,200 | 20,600 | |||||||||||||||||||||||||||||||||||
|
- worldwide (7)
|
18,800 | 20,250 | 24,400 | 26,900 | 40,900 | |||||||||||||||||||||||||||||||||||
(footnotes on next page)
112
SUMMARY OF OPERATING DATA
Eastman Kodak Company
(footnotes for previous page)
|
(1)
|
Includes a pre-tax goodwill impairment charge of $626 million; pre-tax restructuring charges of $78 million; a $102 million loss on early extinguishment of debt; $7 million of income related to gains on assets sales; $19 million of income related to legal contingencies and settlements; $6 million of charges related to foreign contingencies; and a net benefit of $109 million related to other discrete tax items. These items increased net loss from continuing operations by $698 million.
|
|
(2)
|
Includes pre-tax restructuring and rationalization charges of $258 million; a $5 million charge related to a legal settlement; $94 million of income related to gains on asset sales; $7 million of income related to the reversal of negative goodwill; $10 million of income related to reversals of value-added tax reserves; and a $6 million asset impairment charge. These items increased net loss from continuing operations by $138 million.
|
|
(3)
|
Includes a pre-tax goodwill impairment charge of $785 million; pre-tax restructuring and rationalization charges of $149 million, net of reversals; $21 million of income related to gains on sales of assets and businesses; $3 million of charges related to asset impairments; $41 million of charges for legal contingencies and settlements; $10 million of charges for support of an educational institution; $94 million of income related to postemployment benefit plans; $3 million of income for a foreign export contingency; $270 million of income related to an IRS refund; and charges of $27 million related to other discrete tax items. These items increased net loss from continuing operations by $610 million.
|
|
(4)
|
Includes pre-tax restructuring charges of $662 million, net of reversals; $157 million of income related to property and asset sales; $57 million of charges related to asset impairments; $6 million of charges for the establishment of a loan reserve; $9 million of charges for a foreign export contingency; and tax adjustments of $14 million. These items increased net loss from continuing operations by $464 million.
|
|
(5)
|
Includes pre-tax restructuring charges of $698 million, net of reversals; $2 million of income related to legal settlements; $46 million of income related to property and asset sales; and $11 million of charges related to asset impairments. These items increased net loss by $691 million. Also included is a valuation allowance of $89 million recorded against the Company's net deferred assets in certain jurisdictions outside the U.S., portions of which are reflected in the aforementioned net loss impact.
|
|
(6)
|
Refer to Note 22, “Discontinued Operations” in the Notes to Financial Statements for a discussion regarding the earnings from discontinued operations.
|
|
(7)
|
Amounts for 2006 and prior years have not been adjusted to remove amounts associated with the Health Group.
|
|
(8)
|
Amounts for 2007 and prior years have not been adjusted to remove wages, salaries and employee benefits associated with the Health Group.
|
|
(9)
|
Includes revenues from non-recurring intellectual property licensing agreements of $838 million in 2010, $435 million in 2009, $227 million in 2008, $236 million in 2007, and $180 million in 2006.
|
113
|
CHANGES IN AND DISAGREEMENTS WITH ACCOUNTANTS ON ACCOUNTING AND FINANCIAL DISCLOSURE
|
None.
Evaluation of Disclosure Controls and Procedures
The Company maintains disclosure controls and procedures that are designed to ensure that information required to be disclosed in the Company’s reports filed or submitted under the Exchange Act is recorded, processed, summarized and reported within the time periods specified in the SEC’s rules and forms, and that such information is accumulated and communicated to management, including the Company’s Chief Executive Officer and Chief Financial Officer, as appropriate, to allow timely decisions regarding required disclosure. The Company’s management, with participation of the Company’s Chief Executive Officer and Chief Financial Officer, has evaluated the effectiveness of the Company’s disclosure controls and procedures as of the end of the fiscal year covered by this Annual Report on Form 10-K. The Company’s Chief Executive Officer and Chief Financial Officer have concluded that, as of the end of the period covered by this Annual Report on Form 10-K, the Company’s disclosure controls and procedures (as defined in Rules 13a-15(e) and 15d-15(e) under the Exchange Act) were effective.
Management’s Report on Internal Control Over Financial Reporting
The management of the Company is responsible for establishing and maintaining adequate internal control over financial reporting. The Company’s internal control over financial reporting is designed to provide reasonable assurance regarding the reliability of financial reporting and the preparation of financial statements for external purposes in accordance with generally accepted accounting principles in the United States of America. The Company’s internal control over financial reporting includes those policies and procedures that: (i) pertain to the maintenance of records that, in reasonable detail, accurately and fairly reflect the transactions and dispositions of the assets of the Company; (ii) provide reasonable assurance that transactions are recorded as necessary to permit preparation of financial statements in accordance with generally accepted accounting principles in the United States of America, and that receipts and expenditures of the Company are being made only in accordance with authorizations of management and directors of the Company; and (iii) provide reasonable assurance regarding prevention or timely detection of unauthorized acquisition, use or disposition of the Company’s assets that could have a material effect on the financial statements.
Internal control over financial reporting cannot provide absolute assurance of achieving financial reporting objectives because of its inherent limitations. Internal control over financial reporting is a process that involves human diligence and compliance and is subject to lapses in judgment or breakdowns resulting from human failures. Internal control over financial reporting also can be circumvented by collusion or improper management override.
Because of such limitations, there is a risk that material misstatements may not be prevented or detected on a timely basis by internal control over financial reporting. However, these inherent limitations are known features of the financial reporting process. Therefore, it is possible to design into the process safeguards to reduce, though not eliminate, this risk. Because of its inherent limitations, internal control over financial reporting may not prevent or detect misstatements. Also, projections of any evaluation of effectiveness to future periods are subject to the risk that controls may become inadequate because of changes in conditions, or that the degree of compliance with the policies or procedures may deteriorate.
Management assessed the effectiveness of the Company’s internal control over financial reporting as of December 31, 2010. In making this assessment, management used the criteria set forth by the Committee of Sponsoring Organizations of the Treadway Commission (“COSO”) in "Internal Control-Integrated Framework.” Based on management’s assessment using the COSO criteria, management has concluded that the Company's internal control over financial reporting was effective as of December 31, 2010. The effectiveness of the Company’s internal control over financial reporting as of December 31, 2010 has been audited by PricewaterhouseCoopers LLP, the Company’s independent registered public accounting firm, as stated in their report which appears on page 51 of this Annual Report on Form 10-K.
114
Changes in Internal Control over Financial Reporting
In connection with the evaluation of disclosure controls and procedures described above, there was no change identified in the Company’s internal control over financial reporting that occurred during the Company’s fourth fiscal quarter that has materially affected, or is reasonably likely to materially affect, our internal control over financial reporting.
None.
The information required by Item 10 regarding directors is incorporated by reference from the information under the caption "Board Structure and Corporate Governance - Board of Directors" in the Company's Notice of 2010 Annual Meeting and Proxy Statement (the “Proxy Statement”), which will be filed within 120 days after December 31, 2010. The information required by Item 10 regarding audit committee financial expert disclosure is incorporated by reference from the information under the caption "Board Structure and Corporate Governance - Audit Committee Financial Qualifications" in the Proxy Statement. The information required by Item 10 regarding executive officers is contained in Part I under the caption "Executive Officers of the Registrant" on page 18. The information required by Item 10 regarding the Company's written code of ethics is incorporated by reference from the information under the captions "Board Structure and Corporate Governance - Corporate Governance Guidelines" and "Board Structure and Corporate Governance - Business Conduct Guide and Directors' Code of Conduct" in the Proxy Statement. The information required by Item 10 regarding compliance with Section 16(a) of the Securities Exchange Act of 1934 is incorporated by reference from the information under the caption "Reporting Compliance - Section 16(a) Beneficial Ownership Reporting Compliance" in the Proxy Statement.
The information required by Item 11 is incorporated by reference from the information under the following captions in the Proxy Statement: "Board Structure and Corporate Governance" and "Compensation Discussion and Analysis."
115
|
ITEM 12
.
|
SECURITY OWNERSHIP OF CERTAIN BENEFICIAL OWNERS AND MANAGEMENT AND RELATED STOCKHOLDER MATTERS
|
Most of the information required by Item 12 is incorporated by reference from the information under the captions "Beneficial Ownership" in the Proxy Statement. "Stock Options and SARs Outstanding under Shareholder and Non-Shareholder Approved Plans" is shown below:
STOCK OPTIONS AND SARS OUTSTANDING UNDER SHAREHOLDER AND NON-SHAREHOLDER APPROVED PLANS
As required by Item 201(d) of Regulation S-K, the Company's total options outstanding of 18,074,627, including total SARs outstanding of 44,459, have been granted under equity compensation plans that have been approved by security holders and that have not been approved by security holders as follows:
|
Plan Category
|
Number of Securities to be issued Upon Exercise of Outstanding Options,
Warrants and Rights
|
Weighted-Average Exercise Price of Outstanding Options,
Warrants and Rights
|
Number of Securities Remaining Available for Future Issuance Under Equity Compensation Plans (Excluding Securities Reflected in Column (a))
|
|
(a)
|
(b)
|
(c)
|
|
|
Equity compensation plans approved by security holders (1)
|
18,067,695
|
$25.21
|
11,082,356
|
|
Equity compensation plans not approved by security holders (2)
|
6,932
|
36.69
|
0
|
|
Total
|
18,074,627
|
$25.22
|
11,082,356
|
|
(1)
|
The Company's equity compensation plans approved by security holders include the 2005 Omnibus Long-Term Compensation Plan, the 2000 Omnibus Long-Term Compensation Plan, and the Eastman Kodak Company 1995 Omnibus Long-Term Compensation Plan.
|
|
(2)
|
The Company's equity compensation plans not approved by security holders include the Eastman Kodak Company 1997 Stock Option Plan and the Kodak Stock Option Plan.
|
The 1997 Stock Option Plan, a plan formerly maintained by the Company for the purpose of attracting and retaining senior executive officers, became effective on February 13, 1997, and expired on December 31, 2003. The Compensation Committee administered this plan and continues to administer these plan awards that remain outstanding. The plan permitted awards to be granted in the form of stock options, shares of common stock and restricted shares of common stock. The maximum number of shares that were available for grant under the plan was 3,380,000. The plan required all stock option awards to be non-qualified, have an exercise price not less than 100% of fair market value of the Company’s stock on the date of the option's grant and expire on the tenth anniversary of the date of grant. Awards issued in the form of shares of common stock or restricted shares of common stock were subject to such terms, conditions and restrictions as the Compensation Committee deemed appropriate.
The Kodak Stock Option Plan, an "all employee stock option plan" which the Company formerly maintained, became effective on March 13, 1998, and terminated on March 12, 2003. The plan was used in 1998 to grant an award of 100 non-qualified stock options or, in those countries where the grant of stock options was not possible, 100 freestanding stock appreciation rights, to almost all full-time and part-time employees of the Company and many of its domestic and foreign subsidiaries. In March of 2000, the Company made essentially an identical grant under the plan to generally the same category of employees. The Compensation Committee administered this plan and
116
continues to administer these plan awards that remain outstanding. A total of 16,600,000 shares were available for grant under the plan. All awards granted under the plan generally contained the following features: 1) a grant price equal to the fair market value of the Company's common stock on the date of grant; 2) a two-year vesting period; and 3) a term of 10 years.
On December 31, 2010, the equity overhang, or the percentage of outstanding shares (plus shares that could be issued pursuant to plans represented by all stock incentives granted and available for future grant under all plans) was 12.4%.
The following table sets forth information regarding awards granted and earned, the run rate for each of the last three fiscal years, and the average run rate over the last three years.
|
Run Rate for the Year Ended December 31,
|
||||||||||||||||
|
(shares in thousands)
|
2010
|
2009
|
2008
|
3-year Average
|
||||||||||||
|
Stock options granted
|
300 | 1,229 | 2,813 | 1,447 | ||||||||||||
|
Unvested service-based stock granted
|
336 | 7,585 | 796 | 2,906 | ||||||||||||
|
Actual performance-based stock awards earned
|
409 | 563 | 164 | 379 | ||||||||||||
|
Basic common shares outstanding at fiscal year end
|
268,899 | 268,631 | 268,169 | 268,566 | ||||||||||||
|
Run rate
|
0.39 | % | 3.49 | % | 1.41 | % | 1.76 | % | ||||||||
The Company continues to manage its run rate of awards granted over time to levels it believes are reasonable in light of changes in its business and number of outstanding shares while ensuring that our overall executive compensation program is competitive, relevant, and motivational.
|
|
The information required by Item 13 is incorporated by reference from the information under the captions "Compensation of Named Executive Officers - Employment and Retention Arrangements" and "Board Structure and Corporate Governance - Board Independence" in the Proxy Statement.
The information required by Item 14 regarding principal auditor fees and services is incorporated by reference from the information under the caption "Committee Reports - Report of the Audit Committee" in the Proxy Statement.
117
|
Page No.
|
|
|
(a) 1. Consolidated financial statements:
|
|
|
Report of independent registered public accounting firm
|
51
|
|
Consolidated statement of operations
|
52
|
|
Consolidated statement of financial position
|
53
|
|
Consolidated statement of equity (deficit)
|
54-56
|
|
Consolidated statement of cash flows
|
57-58
|
|
Notes to financial statements
|
59-111
|
|
2. Financial statement schedule:
|
|
|
II - Valuation and qualifying accounts
|
120
|
|
All other schedules have been omitted because they are not applicable or the information required is shown in the financial statements or notes thereto.
|
|
|
3.Additional data required to be furnished:
|
|
|
Exhibits required as part of this report are listed in the index appearing on pages 121 through 129.
|
118
Pursuant to the requirements of Section 13 or 15(d) of the Securities Exchange Act of 1934, the registrant has duly caused this report to be signed on its behalf by the undersigned, thereunto duly authorized.
EASTMAN KODAK COMPANY
(Registrant)
By:
/s/ Antonio M. Perez
Antonio M. Perez
Chairman & Chief Executive Officer
February 25, 2011
Pursuant to the requirements of the Securities Exchange Act of 1934, this report has been signed below by the following persons on behalf of the registrant and in the capacities and on the date indicated.
Signature Title
By:
/s/ Antonio M. Perez
Antonio M. Perez Chief Executive Officer and Director
(Principal Executive Officer)
By:
/s/ Antoinette P. McCorvey
Antoinette P. McCorvey Chief Financial Officer and Senior Vice President
(Principal Financial Officer)
By:
/s/ Eric H. Samuels
Eric H. Samuels Chief Accounting Officer and Corporate Controller
(Principal Accounting Officer)
By:
/s/ Richard S. Braddock
Richard S. Braddock Director
By:
/s/ Herald Y. Chen
Herald Y. Chen Director
By:
/s/ Adam H. Clammer
Adam H. Clammer Director
By:
/s/ Timothy M. Donahue
Timothy M. Donahue Director
By:
/s/ Michael J. Hawley
Michael J. Hawley Director
By:
/s/ William H. Hernandez
William H. Hernandez Director
By:
/s/ Douglas R. Lebda
Douglas R. Lebda Director
By:
/s/ Debra L. Lee
Debra L. Lee Director
By:
/s/ Kyle Prechtl Legg
Kyle Prechtl Legg Director
By:
/s/ Delano E. Lewis
Delano E. Lewis Director
By:
/s/ William G. Parrett
William G. Parrett Director
By:
/s/ Joel Seligman
Joel Seligman Director
By:
/s/ Dennis F. Strigl
Dennis F. Strigl Director
By:
/s/ Laura D’Andrea Tyson
Laura D’Andrea Tyson Director
Date: February 25, 2011
119
Eastman Kodak Company
Valuation and Qualifying Accounts
|
Balance at
|
Charges to
|
Amounts
|
Balance at
|
|||||||||||||
|
Beginning
|
Earnings
|
Written
|
End of
|
|||||||||||||
|
(in millions)
|
Of Period
|
and Equity
|
Off
|
Period
|
||||||||||||
|
Year ended December 31, 2010
|
||||||||||||||||
|
Deducted in the Statement of Financial Position:
|
||||||||||||||||
|
From Current Receivables:
|
||||||||||||||||
|
Reserve for doubtful accounts
|
$ | 79 | $ | 19 | $ | 35 | $ | 63 | ||||||||
|
Reserve for loss on returns and allowances
|
19 | 24 | 29 | 14 | ||||||||||||
|
Total
|
$ | 98 | $ | 43 | $ | 64 | $ | 77 | ||||||||
|
From Deferred Tax Assets:
|
||||||||||||||||
|
Valuation allowance
|
$ | 2,092 | $ | 460 | $ | 217 | $ | 2,335 | ||||||||
|
Year ended December 31, 2009
|
||||||||||||||||
|
Deducted in the Statement of Financial Position:
|
||||||||||||||||
|
From Current Receivables:
|
||||||||||||||||
|
Reserve for doubtful accounts
|
$ | 90 | $ | 23 | $ | 34 | $ | 79 | ||||||||
|
Reserve for loss on returns and allowances
|
23 | 25 | 29 | 19 | ||||||||||||
|
Total
|
$ | 113 | $ | 48 | $ | 63 | $ | 98 | ||||||||
|
From Deferred Tax Assets:
|
||||||||||||||||
|
Valuation allowance
|
$ | 1,665 | $ | 633 | $ | 206 | $ | 2,092 | ||||||||
|
Year ended December 31, 2008
|
||||||||||||||||
|
Deducted in the Statement of Financial Position:
|
||||||||||||||||
|
From Current Receivables:
|
||||||||||||||||
|
Reserve for doubtful accounts
|
$ | 83 | $ | 42 | $ | 35 | $ | 90 | ||||||||
|
Reserve for loss on returns and allowances
|
31 | 16 | 24 | 23 | ||||||||||||
|
Total
|
$ | 114 | $ | 58 | $ | 59 | $ | 113 | ||||||||
|
From Deferred Tax Assets:
|
||||||||||||||||
|
Valuation allowance
|
$ | 1,249 | $ | 542 | $ | 126 | $ | 1,665 | ||||||||
120
Eastman Kodak Company
Exhibit
Number
|
(3.1)
|
Certificate of Incorporation, as amended and restated May 11, 2005.
|
|
|
(Incorporated by reference to the Eastman Kodak Company Quarterly Report on Form 10-Q for the quarterly period ended June 30, 2005, Exhibit 3.)
|
|
(3.2)
|
By-laws, as amended and restated October 19, 2010.
|
|
|
(Incorporated by reference to the Eastman Kodak Company Quarterly Report on Form 10-Q for the quarterly period ended September 30, 2010, Exhibit 3.2.)
|
|
(4.1)
|
Indenture dated as of January 1, 1988 between Eastman Kodak Company and The Bank of New York as Trustee.
|
|
|
(Incorporated by reference to the Eastman Kodak Company Annual Report on Form 10-K for the fiscal year ended December 25, 1988, Exhibit 4.)
|
|
(4.2)
|
First Supplemental Indenture dated as of September 6, 1991 and Second Supplemental Indenture datedas of September 20, 1991, each between Eastman Kodak Company and The Bank of New York as Trustee, supplementing the Indenture described in (4.1).
|
|
|
(Incorporated by reference to the Eastman Kodak Company Annual Report on Form 10-K for the fiscal year ended December 31, 1991, Exhibit 4.)
|
|
(4.3)
|
Third Supplemental Indenture dated as of January 26, 1993, between Eastman Kodak Company and The Bank of New York as Trustee, supplementing the Indenture described in (4.1).
|
|
|
(Incorporated by reference to the Eastman Kodak Company Annual Report on Form 10-K for the fiscal year ended December 31, 1992, Exhibit 4.)
|
|
(4.4)
|
Fourth Supplemental Indenture dated as of March 1, 1993, between Eastman Kodak Company and The Bank of New York as Trustee, supplementing the Indenture described in (4.1).
|
(Incorporated by reference to the Eastman Kodak Company Annual Report on Form 10-K for the fiscal year ended
December 31, 1993, Exhibit 4.)
|
(4.5)
|
Form of the 7.25% Senior Notes due 2013.
|
|
|
(Incorporated by reference to the Eastman Kodak Company Current Report on Form 8-K for the date October 10, 2003 as filed on October 10, 2003, Exhibit 4.)
|
(4.7) Fifth Supplemental Indenture, dated October 10, 2003, between Eastman Kodak Company and The Bank of New York, as
Trustee.
|
|
(Incorporated by reference to the Eastman Kodak Company Current Report on Form 8-K for the date October 10, 2003 as filed on October 10, 2003, Exhibit 4.)
|
|
(4.8)
|
Secured Credit Agreement, dated as of October 18, 2005, among Eastman Kodak Company and Kodak Graphic Communications Canada Company, the banks named therein, Citigroup Global Markets Inc., as lead arranger and bookrunner, Lloyds TSB Bank PLC, as syndication agent, Credit Suisse, Cayman Islands Branch, Bank of America, N. A. and The CIT Group/Business Credit, Inc., as co-documentation agents, and Citicorp USA, Inc., as agent for the lenders.
|
(Incorporated by reference to the Eastman Kodak Company Current Report on Form 8-K, filed on October 24, 2005,
Exhibit 4.1.)
121
Eastman Kodak Company
Index to Exhibits (continued)
Exhibit
Number
Amendment No. 1 to the Credit Agreement (including Exhibit A – Amended and Restated Credit Agreement), dated as of
March 31, 2009, among Eastman Kodak Company, Kodak Graphic Communications Canada Company, and Kodak Canada
Inc., the lenders party thereto, and Citicorp USA, Inc. as agent.
|
|
(Incorporated by reference to the Eastman Kodak Company Current Report on Form 8-K for the date March 31, 2009, as filed on April 3, 2009, Exhibit 4.8.)
|
|
|
Amendment No. 1 to the Amended and Restated Credit Agreement, dated as of September 17, 2009.
|
|
|
(Incorporated by reference to the Eastman Kodak Company Current Report on Form 8-K for the date September 17, 2009, as filed on September 18, 2009, Exhibit 10.1.)
|
|
|
Amendment No. 2 to the Amended and Restated Credit Agreement, dated as of February 10, 2010, among Eastman Kodak Company, Kodak Canada Inc., the lenders party thereto and Citicorp USA, Inc., as Agent.
|
|
|
(Incorporated by reference to the Eastman Kodak Company Current Report on Form 8-K for the date February 10, 2010, as filed on February 12, 2010, Exhibit 10.1.)
|
|
(4.9)
|
Security Agreement, dated as of October 18, 2005, amended and restated as of March 31, 2009, from the grantors party thereto to Citicorp USA, Inc.
|
|
|
(Incorporated by reference to the Eastman Kodak Company Current Report on Form 8-K for the date March 31, 2009, as filed on April 3, 2009, Exhibit 4.9.)
|
|
|
Amendment No. 1 to the Security Agreement, dated October 18, 2005, amended and restated as of March 31, 2009, from the grantors party thereto to Citicorp USA, Inc.
|
|
|
(Incorporated by reference to the Eastman Kodak Company Quarterly Report on Form 10-Q for the quarterly period ended March 31, 2010, as filed on April 29, 2010, Exhibit 4.9 a.)
|
|
|
Amendment No. 2 to the Security Agreement, dated October 18, 2005, amended and restated as of March 31, 2009, from the grantors party thereto to Citicorp USA, Inc.
|
|
|
(Incorporated by reference to the Eastman Kodak Company Quarterly Report on Form 10-Q for the quarterly period ended March 31, 2010, as filed on April 29, 2010, Exhibit 4.9 b.)
|
|
(4.10)
|
Canadian Security Agreement, dated October 18, 2005, amended and restated as of March 31, 2009, from the grantors party thereto to Citicorp USA, Inc.
|
|
|
(Incorporated by reference to the Eastman Kodak Company Current Report on Form 8-K for the date March 31, 2009, as filed on April 3, 2009, Exhibit 4.10.)
|
|
|
Amendment No. 1 to the Canadian Security Agreement, dated October 18, 2005, amended and restated as of March 31, 2009, from the grantors party thereto to Citicorp USA, Inc.
|
|
|
(Incorporated by reference to the Eastman Kodak Company Quarterly Report on Form 10-Q for the quarterly period ended March 31, 2010, as filed on April 29, 2010, Exhibit 4.10 a.)
|
|
|
Amendment No. 2 to the Canadian Security Agreement, dated October 18, 2005, amended and restated as of March 31, 2009, from the grantors party thereto to Citicorp USA, Inc.
|
|
|
(Incorporated by reference to the Eastman Kodak Company Quarterly Report on Form 10-Q for the quarterly period ended March 31, 2010, as filed on April 29, 2010, Exhibit 4.10 b.)
|
122
Eastman Kodak Company
Index to Exhibits (continued)
Exhibit
Number
|
(4.11)
|
Indenture, dated as of September 23, 2009, between Eastman Kodak Company and The Bank of New York Mellon, as trustee.
|
(Incorporated by reference to the Eastman Kodak Company Current Report on Form 8-K for the date September 23, 2009,
as filed on September 23, 2009, Exhibit 4.1.)
|
(4.12) Indenture, dated as of September 29, 2009, between Eastman Kodak Company and The Bank of New York Mellon, as
trustee.
|
(Incorporated by reference to the Eastman Kodak Company Current Report on Form 8-K for the date September 29, 2009,
as filed on September 30, 2009, Exhibit 4.1.)
|
(4.13)
|
Form of Warrant
|
(Incorporated by reference to the Eastman Kodak Company Current Report on Form 8-K for the date September 29, 2009,
as filed on September 30, 2009, Exhibit 10.2.)
|
(4.14)
|
Registration Rights Agreement, dated as of September 29, 2009.
|
(Incorporated by reference to the Eastman Kodak Company Current Report on Form 8-K for the date September 29, 2009,
as filed on September 30, 2009, Exhibit 10.3.)
|
(4.15)
|
Purchase Agreement, dated as of September 16, 2009.
|
(Incorporated by reference to the Eastman Kodak Company Current Report on Form 8-K for the date September 29, 2009, as filed on September 30, 2009, Exhibit 10.1.)
|
(4.16)
|
Indenture, dated as of March 5, 2010, by and among the Company, the Subsidiary Guarantors and The Bank of New York Mellon, as trustee.
|
(Incorporated by reference to the Eastman Kodak Company Current Report on Form 8-K for the date March 5, 2010, as filed on March 10, 2010, Exhibit 4.1.)
|
(4.17)
|
Security Agreement, dated as of March 5, 2010, by and among the Company, the Subsidiary Guarantors and The Bank of New York Mellon, as collateral agent.
|
|
|
(Incorporated by reference to the Eastman Kodak Company Current Report on Form 8-K for the date March 5, 2010, as filed on March 10, 2010, Exhibit 10.1.)
|
|
(4.18)
|
Collateral Trust Agreement, dated as of March 5, 2010, by and among the Company, the Subsidiary Guarantors and the Bank of New York Mellon, as collateral agent.
|
|
|
(Incorporated by reference to the Eastman Kodak Company Current Report on Form 8-K for the date March 5, 2010, as filed on March 10, 2010, Exhibit 10.2.)
|
|
|
Eastman Kodak Company and certain subsidiaries are parties to instruments defining the rights of holders of long-term debt that was not registered under the Securities Act of 1933. Eastman Kodak Company has undertaken to furnish a copy of these instruments to the Securities and Exchange Commission upon request.
|
(10.1) Philip J. Faraci Agreement dated November 3, 2004.
(Incorporated by reference to the Eastman Kodak Company Annual Report on Form 10-K for the fiscal year ended December 31, 2005, Exhibit 10.)
Amendment, dated February 28, 2007, to Philip J. Faraci Letter Agreement dated November 3, 2004.
(Incorporated by reference to the Eastman Kodak Company Current Report on Form 8-K, filed on March 1, 2007, Exhibit 99.2.)
123
|
|
Eastman Kodak Company
|
Index to Exhibits (continued)
Exhibit
Number
Second Amendment, dated December 9, 2008, to Philip J. Faraci Letter Agreement Dated November 3, 2004.
(Incorporated by reference to the Eastman Kodak Company Annual Report on Form 10-K for the fiscal year ended December 31, 2008, Exhibit 10.1.)
|
(10.2)
|
Eastman Kodak Company Deferred Compensation Plan for Directors, as amended and restated effective January 1, 2009.
|
|
|
(Incorporated by reference to the Eastman Kodak Company Annual Report on Form 10-K for the fiscal year ended December 31, 2008, Exhibit 10.2.)
|
|
(10.3)
|
Eastman Kodak Company Non-Employee Director Annual Compensation Program. The equity portion of the retainer became effective December 11, 2007; the cash portion of the retainer became effective January 1, 2008.
|
|
|
(Incorporated by reference to the Eastman Kodak Company Annual Report on Form 10-K for the fiscal year ended December 31, 2007, Exhibit 10.)
|
|
(10.4)
|
1982 Eastman Kodak Company Executive Deferred Compensation Plan, as amended and restated effective January 1, 2009.
|
|
|
(Incorporated by reference to the Eastman Kodak Company Annual Report on Form 10-K for the fiscal year ended December 31, 2008, Exhibit 10.4.)
|
|
(10.5)
|
Eastman Kodak Company 2005 Omnibus Long-Term Compensation Plan, as amended and restated January 1, 2010.
|
|
|
(Incorporated by reference to the Eastman Kodak Company Notice of 2010 Annual Meeting and Proxy Statement, Exhibit I.)
|
|
|
Form of Notice of Award of Non-Qualified Stock Options pursuant to the 2005 Omnibus Long-Term Compensation Plan.
|
|
|
(Incorporated by reference to the Eastman Kodak Company Current Report on Form 8-K, filed on May 11, 2005, Exhibit 10.2.)
|
|
|
Form of Notice of Award of Restricted Stock, pursuant to the 2005 Omnibus Long-Term Compensation Plan.
|
|
|
(Incorporated by reference to the Eastman Kodak Company Current Report on Form 8-K, filed on May 11, 2005, Exhibit 10.3.)
|
|
|
Form of Notice of Award of Restricted Stock with a Deferral Feature, pursuant to the 2005 Omnibus Long-Term Compensation Plan.
|
(Incorporated by reference to the Eastman Kodak Company Quarterly Report on Form 10-Q for the quarterly period
ended
June 30, 2005, Exhibit 10.)
|
|
Form of Administrative Guide for Annual Officer Stock Options Grant under the 2005 Omnibus Long-Term Compensation Plan.
|
|
|
(Incorporated by reference to the Eastman Kodak Company Quarterly Report on Form 10-Q for the quarterly period ended September 30, 2005, Exhibit 10.)
|
124
Eastman Kodak Company
Index to Exhibits (continued)
Exhibit
Number
Form of Award Notice for Annual Director Stock Option Grant under the 2005 Omnibus Long-Term Compensation Plan.
|
|
(Incorporated by reference to the Eastman Kodak Company Quarterly Report on Form 10-Q for the quarterly period ended September 30, 2005, Exhibit 10.)
|
|
|
Form of Award Notice for Annual Director Restricted Stock Grant under the 2005 Omnibus Long-Term Compensation Plan.
|
|
|
(Incorporated by reference to the Eastman Kodak Company Quarterly Report on Form 10-Q for the quarterly period ended September 30, 2005, Exhibit 10.)
|
|
|
Form of Administrative Guide for Leadership Stock Program under the 2005 Omnibus Long-Term Compensation Plan.
|
(Incorporated by reference to the Eastman Kodak Company Quarterly Report on Form 10-Q for the quarterly period ended March 31, 2008, Exhibit 10.)
|
(10.6)
|
Administrative Guide for the 2010 Performance Stock Unit Program under Article 7 (Performance Awards) of the 2005 Omnibus Long-Term Compensation Plan, Granted to Antonio M. Perez.
|
|
|
(Incorporated by reference to the Eastman Kodak Company Quarterly Report on Form 10-Q for the quarterly period ended March 31, 2010, Exhibit 10.6.)
|
|
(10.8)
|
Administrative Guide for the 20__ Performance Cycle of the Leadership Stock Program under Article 7 (Performance Awards) of the 2005 Omnibus Long-Term Compensation Plan.
|
(Incorporated by reference to the Eastman Kodak Company Quarterly Report on Form 10-Q for the quarterly period ended June 30, 2009, Exhibit 10.6.)
|
(10.9)
|
Administrative Guide for September 16, 2008 Restricted Stock Unit Grant under the 2005 Omnibus Long-term Compensation Plan.
|
(Incorporated by reference to the Eastman Kodak Company Annual Report on Form 10-K for the fiscal year ended December 31, 2008, Exhibit 10.9.)
|
(10.10)
|
Form of Administrative Guide for Restricted Stock Unit Grant under the 2005 Omnibus Long-term Compensation Plan.
|
(Incorporated by reference to the Eastman Kodak Company Annual Report on Form 10-K for the fiscal year ended December 31, 2008, Exhibit 10.10.)
(10.11) Frank S. Sklarsky Agreement dated September 19, 2006.
|
|
(Incorporated by reference to the Eastman Kodak Company Quarterly Report on Form 10-Q for the quarterly period ended September 30, 2006, Exhibit 10.1.)
|
Amendment, dated September 26, 2006, to Frank S. Sklarsky Agreement dated September 19, 2006.
(Incorporated by reference to the Eastman Kodak Company Quarterly Report on Form 10-Q for the quarterly period
ended September 30, 2006, Exhibit 10.2.)
|
(10.12)
|
Eastman Kodak Company 1995 Omnibus Long-Term Compensation Plan, as amended, effective as of November 12, 2001.
|
(Incorporated by reference to the Eastman Kodak Company Annual Report on Form 10-K for the fiscal year ended December 31, 1996, the Quarterly Report on Form 10-Q for the quarterly period ended March 31, 1997, the Quarterly Report on Form 10-Q for the quarterly period ended March 31, 1998, the Quarterly Report on Form 10-Q for the quarterly period ended June 30, 1998, the Quarterly Report on Form 10-Q for the quarterly period ended September 30, 1998, the
125
|
|
Eastman Kodak Company
|
Index to Exhibits (continued)
Exhibit
Number
Quarterly Report on Form 10-Q for the quarterly period ended September 30, 1999, the Annual Report on Form 10-K for the fiscal year ended December 31, 1999, and the Annual Report on Form 10-K for the fiscal year ended December 31, 2001, Exhibit 10.)
|
(10.13)
|
Kodak Executive Financial Counseling Program.
|
(Incorporated by reference to the Eastman Kodak Company Annual Report on Form 10-K for the fiscal year ended December 31, 1992, Exhibit 10.)
|
(10.14)
|
Personal Umbrella Liability Insurance Coverage.
|
|
|
Eastman Kodak Company provides $5,000,000 personal umbrella liability insurance coverage to its approximately 160 key executives. The coverage, which is insured through The Mayflower Insurance Company, Ltd., supplements participants’ personal coverage. The Company pays the cost of this insurance. Income is imputed to participants.
|
(Incorporated by reference to the Eastman Kodak Company Annual Report on Form 10-K for the fiscal year ended December 31, 1995, Exhibit 10.)
|
(10.15)
|
Offer of employment for Pradeep Jotwani dated September 24, 2010.
|
|
|
(Incorporated by reference to the Eastman Kodak Company Quarterly Report on Form 10-Q for the quarterly period ended September 30, 2010, Exhibit 10.15.)
|
|
(10.16)
|
Kodak Stock Option Plan, as amended and restated August 26, 2002.
|
|
|
(Incorporated by reference to the Eastman Kodak Company Annual Report on Form 10-K for the fiscal year ended December 31, 2002, Exhibit 10.)
|
|
(10.17)
|
Eastman Kodak Company 1997 Stock Option Plan, as amended effective as of March 13, 2001.
|
|
|
(Incorporated by reference to the Eastman Kodak Company Annual Report on Form 10-K for the fiscal year ended December 31, 1999 and the Quarterly Report on Form 10-Q for thequarterly period ended March 31, 2001, Exhibit 10.)
|
|
(10.18)
|
Eastman Kodak Company 2000 Omnibus Long-Term Compensation Plan, as amended, effective January 1, 2009.
|
(Incorporated by reference to the Eastman Kodak Company Annual Report on Form 10-K for the fiscal year ended
December 31, 2008, Exhibit 10.18.)
|
|
Form of Notice of Award of Non-Qualified Stock Options Granted To ________, Pursuant to the 2000 Omnibus Long-Term Compensation Plan; andForm of Notice of Award of Restricted Stock Granted To ______, Pursuant to the 2000 Omnibus Long-Term Compensation Plan.
|
|
|
(Incorporated by reference to the Eastman Kodak Company Annual Report on Form 10-K for the fiscal year ended December 31, 2004, Exhibit 10.)
|
(10.19) Administrative Guide for the 2004-2005 Performance Cycle of the Leadership Program under Article 12 of the 2000
Omnibus Long-Term Compensation Plan, as amended January 1, 2009.
(Incorporated by reference to the Eastman Kodak Company Annual Report on Form 10-K for the fiscal year ended
December 31, 2008, Exhibit 10.19.)
|
(10.20)
|
Administrative Guide for the 2004-2005 Performance Cycle of the Leadership Program under Section 13 of the 2000 Omnibus Plan, as amended January 1, 2009.
|
(Incorporated by reference to the Eastman Kodak Company Annual Report on Form 10-K for the fiscal year ended
December 31, 2008, Exhibit 10.20.)
126
Eastman Kodak Company
Index to Exhibits (continued)
Exhibit
Number
|
(10.21)
|
Eastman Kodak Company Executive Compensation for Excellence and Leadership Plan, as amended and restated January 1, 2010.
|
|
|
(Incorporated by reference to the Eastman Kodak Company Notice of 2010 Annual Meeting and Proxy Statement, Exhibit II.)
|
|
Eastman Kodak Company Executive Protection Plan, as amended December 21, 2010, effective December 23, 2010.
|
|
(10.23)
|
Eastman Kodak Company Estate Enhancement Plan, as adopted effective March 6, 2000.
|
(Incorporated by reference to the Eastman Kodak Company Annual Report on Form 10-K for the fiscal year ended December 31, 1999, Exhibit 10.)
(10.24) Antonio M. Perez Agreement dated March 3, 2003.
|
|
(Incorporated by reference to the Eastman Kodak Company Quarterly Report on Form 10-Q for the quarterly period ended March 31, 2003, Exhibit 10 Z.)
|
Letter dated May 10, 2005, from the Chair, Executive Compensation and Development Committee, to Antonio M. Perez.
(Incorporated by reference to the Eastman Kodak Company Current Report on Form 8-K, filed on May 11, 2005, Exhibit 10.2.).
Notice of Award of Restricted Stock with a Deferral Feature Granted to Antonio M. Perez, effective June 1, 2005, pursuant to the 2005 Omnibus Long-Term Compensation Plan.
(Incorporated by reference to the Eastman Kodak Company Quarterly Report on Form 10-Q for the quarterly period ended June 30, 2005, Exhibit 10 CC.)
Amendment, dated February 27, 2007, to Antonio M. Perez Letter Agreement dated March 3, 2003.
(Incorporated by reference to the Eastman Kodak Company Current Report on Form 8-K, filed on March 1, 2007, Exhibit 99.1).
Second Amendment, dated December 9, 2008, to Antonio M. Perez Letter Agreement dated March 3, 2003.
(Incorporated by reference to the Eastman Kodak Company Annual Report on Form 10-K for the fiscal year ended December 31, 2008, Exhibit 10.24.)
Amendment, dated September 28, 2009, to Antonio M. Perez Letter Agreement dated March 3, 2003.
(Incorporated by reference to the Eastman Kodak Company Quarterly Report on Form 10-Q for the quarterly period ended September 30, 2009.)
|
Antoinette P. McCorvey Waiver Letter Re: Eastman Kodak Company Executive Protection Plan dated October 11, 2010.
|
|
(10.26)
|
Asset Purchase Agreement between Eastman Kodak Company and Onex Healthcare Holdings, Inc., dated as of January 9, 2007.
|
|
Amendment No. 1 To the Asset Purchase Agreement.
|
(Incorporated by reference to the Eastman Kodak Company Quarterly Report on Form 10-Q for the quarterly period ended March 31, 2007, Exhibit 10 CC.)
127
Eastman Kodak Company
Index to Exhibits (continued)
Exhibit
Number
|
(10.27)
|
Administrative Guide For September 28, 2009 Restricted Stock Unit (RSU) Grant under the 2005 Omnibus Long-Term
Compensation Plan (For Executives).
|
(Incorporated by reference to the Eastman Kodak Company Quarterly Report on Form 10-Q for the quarterly period
ended September 30, 2009.)
|
(10.28)
|
Administrative Guide For September 28, 2009 Restricted Stock Unit (RSU) Grant under the 2005 Omnibus Long-Term Compensation Plan (For Executive Council and Operations Council Members).
|
(Incorporated by reference to the Eastman Kodak Company Quarterly Report on Form 10-Q for the quarterly period
ended September 30, 2009.)
|
(10.29)
|
Administrative Guide For September 28, 2009 Restricted Stock Unit (RSU) Grant under the 2005 Omnibus Long-Term Compensation Plan (Hold Until Retirement Provision).
|
(Incorporated by reference to the Eastman Kodak Company Quarterly Report on Form 10-Q for the quarterly period ended September 30, 2009.)
|
Laura G, Quatela Waiver Letter Re: Eastman Kodak Company Executive Protection Plan dated November 8, 2010.
|
|
Gustavo Oviedo Waiver Letter Re: Eastman Kodak Company Executive Protection Plan dated December 13, 2010.
|
|
(10.34)
|
Note Purchase Agreement, dated as of February 24, 2010, by and among Eastman Kodak Company and KKR et al.
|
(Incorporated by reference to the Eastman Kodak Company Quarterly Report on Form 10-Q for the quarterly period ended March 31, 2010, Exhibit 4.16.)
(10.35)
Joyce P. Haag Separation Agreement dated November 11, 2010.
(12)
Statement Re Computation of Ratio of Earnings to Fixed Charges.
(21)
Subsidiaries of Eastman Kodak Company.
(23)
Consent of Independent Registered Public Accounting Firm.
(31.1)
Certification.
|
Certification.
|
|
Certification Pursuant to 18 U.S.C. Section 1350, as Adopted Pursuant to Section 906 of the Sarbanes-Oxley Act of 2002.
|
|
Certification Pursuant to 18 U.S.C. Section 1350, as Adopted Pursuant to Section 906 of the Sarbanes-Oxley Act of
2002.
|
128
Eastman Kodak Company
Index to Exhibits (continued)
Exhibit
Number
(101.CAL*) XBRL Taxonomy Extension Calculation Linkbase
(101.INS*) XBRL Instance Document
(101.LAB*) XBRL Taxonomy Extension Label Linkbase
(101.PRE*) XBRL Taxonomy Extension Presentation Linkbase
(101.SCH*) XBRL Taxonomy Extension Schema Linkbase
(101.DEF*) XBRL Taxonomy Extension Definition Linkbase
|
*
|
Pursuant to Rule 406T of Regulation S-T, these interactive data files are deemed not filed or part of a registration statement of prospectus for purposes of Sections 11 or 12 of the Securities Act of 1933 or Section 18 of the Securities Exchange Act of 1934 and otherwise are not subject to liability.
|
129
TABLE OF CONTENTS
Part IItem 1. BusinessItem 1A. Risk FactorsItem 1B. Unresolved Staff CommentsItem 2. PropertiesItem 3. Legal ProceedingsPart IIItem 5. Market For Registrant S Common Equity, Related Stockholder Matters and Issuer Purchases Of Equity SecuritiesItem 6. Selected Financial DataItem 7. Management S Discussion and Analysis ( Md&a ) Of Financial Condition and Results Of OperationsItem 7A. Quantitative and Qualitative Disclosures About Market RiskItem 8. Financial Statements and Supplementary DataNote 1: Significant Accounting PoliciesNote 2: Receivables, NetNote 3: Inventories, NetNote 4: Property, Plant and Equipment, NetNote 5: Goodwill and Other Intangible AssetsNote 6: Other Long-term AssetsNote 7: Other Current LiabilitiesNote 8: Short-term Borrowings and Long-term DebtNote 9: Other Long-term LiabilitiesNote 10: Commitments and ContingenciesNote 11: GuaranteesNote 12: Financial InstrumentsNote 13: Other Operating Expenses (income), NetNote 14: Other Income (charges), NetNote 15: Income TaxesNote 16: Restructuring and Rationalization LiabilitiesNote 17: Retirement PlansNote 18: Other Postretirement BenefitsNote 19: Accumulated Other Comprehensive (loss) IncomeNote 20: Stock Option and Compensation PlansNote 21: AcquisitionsNote 22: Discontinued OperationsNote 23: Extraordinary ItemNote 24: Segment InformationNote 25: Quarterly Sales and Earnings Data UnauditedItem 9. Changes in and Disagreements with Accountants on Accounting and Financial DisclosureItem 9A. Controls and ProceduresItem 9B. Other InformationPart IIIItem 10. Directors, Executive Officers and Corporate GovernanceItem 11. Executive CompensationItem 12 . Security Ownership Of Certain Beneficial Owners and Management and Related Stockholder MattersItem 13. Certain Relationships and Related Transactions, and Director IndependenceItem 14 . Principal Accounting Fees and ServicesPart IVItem 15 . Exhibits, Financial Statement Schedules