EASTMAN KODAK CO
10-Ks and 10-Qs
|
|
|
|
|
|
|
|
|
|
|
|
|
|
|
|
|
|
|
|
|
|
|
|
|
|
|
|
|
|
|
|
|
|
|
|
|
|
|
|
|
|
|
|
|
|
|
|
|
|
|
|
|
|
|
SECURITIES AND EXCHANGE COMMISSION
|
Washington, D.C. 20549
FORM 10-K
[X] Annual report pursuant to Section 13 or 15(d) of the
Securities Exchange Act of 1934
For the year ended December 31, 2014 or
Transition report pursuant to Section 13 or 15(d) of the Securities Exchange Act of 1934
For the transition period from_____to_____
Commission File Number 1-87
EASTMAN KODAK COMPANY
(Exact name of registrant as specified in its charter)
|
NEW JERSEY
|
16-0417150
|
|
(State of incorporation)
|
(IRS Employer Identification No.)
|
|
343 STATE STREET, ROCHESTER, NEW YORK
|
14650
|
|
(Address of principal executive offices)
|
(Zip Code)
|
Registrant’s telephone number, including area code: 585-724-4000
_____________
Securities registered pursuant to Section 12(b) of the Act:
|
Title of each class
|
Name of each exchange on which registered
|
||
|
Common Stock, $0.01 par value
|
New York Stock Exchange
|
||
Securities registered pursuant to Section 12(g) of the Act: None
_____________
Indicate by check mark if the registrant is a well-known seasoned issuer, as defined in Rule 405 of the Securities Act.
Yes [ ] No [X]
Indicate by check mark if the registrant is not required to file reports pursuant to Section 13 or Section 15(d) of the Act.
Yes [ ] No [X]
Indicate by check mark whether the registrant (1) has filed all reports required to be filed by Section 13 or 15(d) of the Securities Exchange Act of 1934 during the preceding 12 months, and (2) has been subject to such filing requirements for the past 90 days.
Yes [X] No [ ]
Indicate by check mark whether the registrant has submitted electronically and posted on its corporate Website, if any, every Interactive Data File required to be submitted and posted pursuant to Rule 405 of Regulation S-T (§ 232.405 of this chapter) during the preceding 12 months (or for such shorter period that the registrant was required to submit and post such files).
Yes [X] No [ ]
Indicate by check mark if disclosure of delinquent filers pursuant to Item 405 of Regulation S-K (§ 229.405 of this chapter) is not contained herein, and will not be contained, to the best of registrant’s knowledge, in definitive proxy or information statements incorporated by reference in Part III of this Form 10-K or any amendment to this Form 10-K.[ ]
Indicate by check mark whether the registrant is a large accelerated filer, an accelerated filer, or a non-accelerated filer, or a smaller reporting company. See the definitions of "large accelerated filer,” “accelerated filer" and “smaller reporting company” in Rule 12b-2 of the Exchange Act.
Large accelerated filer [ ] Accelerated filer [X] Non-accelerated filer [ ] Smaller reporting company [ ]
Indicate by check mark whether the registrant is a shell company (as defined in Rule 12b-2 of the Exchange Act)
Yes [ ] No [X]
The aggregate market value of the voting common equity held by non-affiliates computed by reference to the price at which the common equity was last sold, as of the last business day of the registrant's most recently completed second fiscal quarter, June 30, 2014 was approximately $240 million. The registrant has no non-voting common stock.
The number of shares outstanding of the registrant's common stock as of March 2, 2015 was 41,873,154 shares of common stock.
Eastman Kodak Company
Form 10-K
December 31, 2014
|
Table of Contents
|
||
|
Page
|
||
|
Item 1
.
|
Business
|
3
|
|
Risk Factors
|
8
|
|
|
Item 1B
.
|
Unresolved Staff Comments
|
16
|
|
Properties
|
17
|
|
|
Legal Proceedings
|
17
|
|
|
Item 4.
|
Mine Safety Disclosures
|
17
|
|
Executive Officers of the Registrant
|
18
|
|
|
Item
5.
|
Market for Registrant's Common Equity, Related Stockholder Matters and Issuer Purchases of Equity Securities
|
21
|
|
Item 6
.
|
Selected Financial Data
|
23
|
|
Management's Discussion and Analysis of Financial Condition and Results of Operations
|
26
|
|
|
Liquidity and Capital Resources
|
41
|
|
|
Quantitative and Qualitative Disclosures About Market Risk
|
44
|
|
|
Financial Statements and Supplementary Data
|
45
|
|
|
Consolidated Statement of Operations
|
47
|
|
| Consolidated Statement of Comprehensive (Loss) Income | 48 | |
|
Consolidated Statement of Financial Position
|
49
|
|
|
Consolidated Statement of Equity (Deficit)
|
50
|
|
|
Consolidated Statement of Cash Flows
|
52
|
|
|
Notes to Financial Statements
|
54
|
|
|
Changes in and Disagreements With Accountants on Accounting and Financial Disclosure
|
126
|
|
|
Controls and Procedures
|
126
|
|
|
Other Information
|
127
|
|
|
Directors, Executive Officers and Corporate Governance
|
127
|
|
|
Executive Compensation
|
127
|
|
|
Security Ownership of Certain Beneficial Owners and Management and Related Stockholder Matters
|
127
|
|
|
Certain Relationships and Related Transactions, and Director Independence
|
128
|
|
|
Principal Accounting Fees and Services
|
128
|
|
|
Exhibits, Financial Statement Schedules
|
128
|
|
|
Signatures
|
129
|
|
|
Schedule II - Valuation and Qualifying Accounts
|
130
|
|
|
Index to Exhibits
|
131
|
|
2
When used in this report, unless otherwise indicated by the context, “we,” “our,” “us,” and “Kodak” refer to the consolidated company on the basis of consolidation described in Note 1 to the consolidated financial statements in Part II, Item 8, “Financial Statements and Supplementary Data” of this Form 10-K Report. Also, unless otherwise indicated by the context, “EKC” means the parent company, Eastman Kodak Company (the “Company”).
Kodak is a technology company focused on imaging for business. Kodak provides commercial products and services built on its expertise in three core technologies: materials science; digital imaging science and software; and deposition processes. Kodak’s portfolio of products and services is designed to meet the needs of customers in different sectors and cycles of the commercial imaging and printing markets. Kodak leverages its core technology products and services to develop solutions for the product goods packaging and graphic communications markets, and is commercializing products for the functional printing market. Kodak also offers brand licensing and intellectual property opportunities, provides products and services for motion pictures and other commercial films, and sells ink to its existing installed consumer inkjet printer base.
The Company was founded by George Eastman in 1880 and incorporated in 1901 in the State of New Jersey. Kodak is headquartered in Rochester, New York.
EMERGENCE FROM VOLUNTARY REORGANIZATION UNDER CHAPTER 11 PROCEEDINGS
On January 19, 2012 (the “Petition Date”), the Company and its U.S. subsidiaries (collectively, the “Debtors”) filed voluntary petitions for relief (the “Bankruptcy Filing”) under chapter 11 of the United States Bankruptcy Code (the “Bankruptcy Code”) in the United States Bankruptcy Court for the Southern District of New York (the “Bankruptcy Court”). The cases (the “Chapter 11 Cases”) were jointly administered as Case No. 12-10202 (ALG) under the caption “In re Eastman Kodak Company.” The Debtors operated their businesses as “debtors-in-possession” under the jurisdiction of the Bankruptcy Court and in accordance with the applicable provisions of chapter 11 of the Bankruptcy Code and the orders of the Bankruptcy Court until their emergence from bankruptcy. The Company’s foreign subsidiaries (collectively, the “Non-Filing Entities”) were not part of the Chapter 11 Cases, and continued to operate in the ordinary course of business.
On August 23, 2013, the Bankruptcy Court entered an order (the “Confirmation Order”) confirming the revised First Amended Joint Chapter 11 Plan of Reorganization of Eastman Kodak Company and its Debtor Affiliates (the “Plan”). On September 3, 2013 (the “Effective Date”), the Plan became effective and the Debtors emerged from chapter 11 protection.
Fresh Start Accounting
Upon emergence from chapter 11, Kodak applied the provisions of fresh start accounting to its financial statements as of September 1, 2013. The adoption of fresh start accounting resulted in Kodak becoming a new entity for financial reporting purposes. Accordingly, the consolidated financial statements on or after September 1, 2013 are not comparable to the consolidated financial statements prior to that date. References to “Successor” or “Successor Company” relate to the reorganized Kodak subsequent to the Effective Date. References to “Predecessor” or “Predecessor Company” relate to Kodak prior to the Effective Date.
REPORTABLE SEGMENTS
Kodak reports financial information for two reportable segments: the Graphics, Entertainment and Commercial Films Segment and the Digital Printing and Enterprise Segment. The balance of Kodak’s continuing operations, which do not meet the criteria of a reportable segment, are reported in All Other and are composed of Kodak’s consumer film business in countries where that business has not yet transferred ownership to the KPP Purchasing Parties (as defined in Note 24, “Emergence From Voluntary Reorganization Under Chapter 11 Proceedings”, section “KPP Global Agreement” in the Notes to Financial Statements) and a utilities variable interest entity. Effective August 31, 2013, the Company sold certain utilities and related facilities and entered into utilities supply and servicing arrangements with RED-Rochester LLC, a variable interest entity.
Kodak's sales, earnings and assets by reportable segment for each of the past three years are shown in Note 23, “Segment Information,” in the Notes to Financial Statements.
3
Graphics, Entertainment and Commercial Films (“GECF”) Segment
The GECF segment provides digital and traditional product and service offerings to a variety of commercial industries, including commercial print, direct mail, book publishing, newspapers and magazines, offset packaging (which is packaging printed using offset printing plates), motion picture entertainment, printed electronics, and industrial film markets.
Graphics:
Kodak’s Graphics portfolio, covering the pre-press component of the offset printing market, includes digital plates, production workflow software, computer-to-plate equipment and digital front-end controllers. Kodak also provides services and support related to its Graphics
products. Graphics products and services are sold globally to customers both directly by Kodak and indirectly through dealers.
|
·
|
Kodak’s digital offset plate offerings include traditional digital offset plates and KODAK SONORA Process Free Plates. KODAK SONORA Process Free Plates are offset plates that are able to be prepared directly with a computer-to-plate thermal output device and do not require subsequent processing chemistry, processing equipment or chemical disposal. As a result, SONORA Process Free Plates deliver cost savings and efficiency for customers and promote environmental sustainability practices.
|
|
·
|
Production workflow software is used by customers to manage digital and conventional print content from file creation to output. Kodak’s production workflow software includes KODAK PRINERGY Workflow Software, KODAK PREPS Imposition Software, KODAK COLORFLOW Software and the KODAK INSITE Software family of products. The production workflow software manages content and color, reduces manual errors and helps customers manage the collaborative creative process.
|
|
·
|
Computer-to-plate thermal output devices are used by customers to transfer images onto aluminum offset printing plates, and provide a consistent and high quality image carrier for offset press applications. Kodak’s computer-to-plate products include the KODAK MAGNUS Platesetter and TRENDSETTER Platesetter with SQUARESPOT Imaging Technology, which provides high resolution, consistency and stability in thermal imaging. Kodak also offers the ACHIEVE Platesetter with TH5 imaging technology, which provides a highly efficient and cost-effective imaging solution at a lower price point.
|
|
·
|
Digital front-end controllers, which are branded as KODAK CREO Servers, are used by customers to drive personalized content to digital presses while controlling color and print consistency.
|
Net sales for Graphic
s
accounted for 54%, 52%, 49% and 49% of total net revenue for the year ended December 31, 2014, four months ended December 31, 2013, eight months ended August 31, 2013 and year ended December 31, 2012, respectively.
Entertainment Imaging & Commercial Films
:
Kodak’s Entertainment Imaging & Commercial Films group includes its motion picture film business serving the entertainment and advertising industries. Motion picture products are sold directly to studios, laboratories and independent filmmakers. The group also offers industrial films, including films used by the electronics industry to produce printed circuit boards. Entertainment Imaging & Commercial Films also includes related component businesses: Polyester Film, Specialty Chemicals, Inks & Dispersions, and Solvent Recovery.
In January 2015 Kodak finalized new film supply agreements with major Hollywood studios. Despite significant sales volume declines, the agreements make it possible for Kodak to continue to manufacture motion picture film while also pursuing new opportunities to leverage film production technologies in growth applications, such as touchscreens for smartphones and tablet computers.
Net sales of Entertainment Imaging and Commercial Films accounted for 10%, 11%, 13% and 14% of total net revenue for the year ended December 31, 2014, four months ended December 31, 2013, eight months ended August 31, 2013 and year ended December 31, 2012, respectively.
Intellectual Property and Brand Licensing
:
Intellectual Property and Brand Licensing includes licensing activities related to Kodak’s patents, proprietary technology and brand. With respect to Brand Licensing, Kodak currently licenses its brand for use with a range of consumer products, including batteries, cameras and camera accessories and recordable media. Kodak intends to continue efforts to grow its portfolio of consumer product licensees in order to generate both ongoing royalty streams and upfront payments. Additionally, Kodak actively seeks opportunities to leverage its patents and associated technology in licensing and/or cross-licensing deals to support both revenue growth and ongoing businesses.
Marketing and Competition:
The key imperatives and marketing focus for the Graphics business are: investing in process-free technology; driving a total, optimized prepress solution; delivering the next-generation print software portfolio; expanding in emerging markets; and driving operational excellence and profitability. Kodak faces competition from other companies that offer commercial offset and digital printing equipment, production software, consumables and service. Competitiveness is generally focused on a broad range of technology, solutions and price.
The motion picture business faces competition from electronic substitution with digital capture and digital cinema theater display.
Digital Printing and Enterprise (“DP&E”) Segment
DP&E serves a variety of customers in the commercial printing, packaging, newspaper, digital service bureau market, in-plant, and consumer printing market segments with a range of software, media and hardware products. DP&E products and services are sold both directly by Kodak and indirectly through dealers
.
4
Digital Printing
:
Digital Printing includes both Inkjet Printing Solutions and Electrophotographic Printing Solutions equipment and related consumables and service.
|
·
|
Kodak’s Inkjet Printing Solutions product offering includes the PROSPER Press and PROSPER System Hybrid Components, featuring ultrafast inkjet droplet generation.
|
|
·
|
The PROSPER Press features Stream Inkjet Technology, which delivers a continuous flow of ink that enables constant and consistent operation, with uniform ink droplet size and accurate placement, even at very high print speeds. Applications of the PROSPER Press include publishing, commercial print, direct mail, and packaging. The business also includes a large base of customers who continue to use KODAK VERSAMARK Products, the predecessor products to the PROSPER Press. Users of KODAK VERSAMARK Products continue to purchase ink and media consumables as well as service from Kodak.
|
|
·
|
PROSPER System Hybrid Components are also integrated into original equipment manufacturer partner portfolios where the manufacturer combines PROSPER Writing Systems with its press systems that transport webs of paper and other substrates through the press. Sales of equipment that incorporate the PROSPER Writing Systems result in recurring revenue from sales of ink and other consumables and equipment service. The level of recurring revenue depends on the application for which the equipment is used, which drives the total number of pages printed and ink usage.
|
|
·
|
Electrophotographic Printing Solutions encompasses the NEXPRESS Platform and the DIGIMASTER Production Platform. The NEXPRESS Platform offers high-quality, differentiated printing of short-run, personalized print applications such as direct mail, books, marketing collateral and photo products. The DIGIMASTER Production Platform uses monochrome electrophotographic printing technology to create high-quality printing of statements, short run books, corporate documentation, manuals and direct mail.
|
Net sales for Digital Printing accounted for 18%, 21%, 18% and 17%, of total net revenue for the year ended December 31, 2014, four months ended December 31, 2013, eight months ended August 31, 2013 and year ended December 31, 2012, respectively.
Packaging and Functional Printing
:
Packaging and Functional Printing
includes flexographic printing equipment and plates
and related consumables and services, as well as printed functional materials and components.
|
·
|
The Packaging business includes Kodak’s FLEXCEL NX System and FLEXCEL Direct Platform that offer digitization into the flexographic print market. The FLEXCEL NX System uses Kodak’s proprietary SQUAREspot laser imaging technology to produce high resolution imaging that reduces waste and ink usage. The FLEXCEL Direct Platform delivers process-less high productivity and the environmental benefits of a process-less solution. These print production capabilities leverage a portfolio of offset, flexographic, and digital products and services, which help enable customers to preserve brand equity, enhance shelf appeal, and drive efficiency from design to solution.
|
|
·
|
The Functional Printing business leverages Kodak’s expertise in imaging and materials science and deposition processes to create products using printing processes that have previously been manufactured using traditional techniques. Functional printing offers many advantages over traditional manufacturing, including cost and environmental impact. The Functional Printing business is in a start-up phase. Kodak’s first initiatives in Functional Printing are focusing on two separate solutions that will provide touch panel sensor films to the touchscreen industry. These solutions consist of a silver halide-based solution and an additive printing solution, which are both being commercialized in collaboration with business partners.
|
Enterprise Services & Solutions:
Enterprise Services & Solutions assists organizations
with challenges and opportunities created by the worldwide digital transformation. Enterprise Services & Solutions provides print and managed media services that provide customers with solutions for their printing requirements using Kodak technologies; brand protection technologies and services to help brand owners combat counterfeiters and diverters; and document management services, including expertise in the capture, archiving, retrieval and delivery of documents. Enterprise Services & Solutions serves enterprise customers in numerous sectors, including governments, pharmaceuticals and life sciences, consumer and luxury product goods and retail and financial services.
Consumer Inkjet Systems:
Consumer Inkjet Systems involves the sale of ink to an existing installed base of consumer inkjet printers.
Net sales for Consumer Inkjet Systems accounted for 6%, 7%, 9% and 11% of total net revenue for the year ended December 31, 2014, four months ended December 31, 2013, eight months ended August 31, 2013 and year ended December 31, 2012, respectively.
Marketing and Competition:
The key imperatives and marketing focus for the DP&E businesses are 1) to expand the company’s position in the high-growth markets of commercial inkjet, packaging and functional printing by leveraging Kodak’s success in developing and commercializing digital printing technologies, including the
SQUAREspot
laser writing imaging technology and continuous Stream Inkjet Technology and 2) to partner with and provide professional services to customers in the commercial printing and digital imaging markets, supporting new customer applications and business solutions. DP&E faces competition from other companies that offer a range of commercial offset and digital printing equipment, consumables and service. Competition is generally focused on technology, solutions and price.
5
2015 Segments
In 2015, Kodak implemented a new organizational structure to make the company faster-moving, more competitive and more entrepreneurial. Effective January 1, 2015, financial information will be reported for seven segments: Print Systems, Enterprise Inkjet Systems, Micro 3D Printing and Packaging, Software and Solutions, Consumer and Film, Intellectual Property Solutions and Eastman Business Park.
|
·
|
Print Systems will be comprised of Prepress Solutions, which includes Kodak’s digital offset plate offerings and computer to plate imaging solutions, and Electrophotographic Printing Solutions.
|
|
·
|
Enterprise Inkjet Systems will include commercial inkjet printing solutions and digital front-end controllers.
|
|
·
|
Micro 3D Printing and Packaging will be comprised of Packaging and Functional Printing.
|
|
·
|
Software and Solutions will be comprised of Kodak Technology Solutions, which includes enterprise services and solutions, and workflow software.
|
|
·
|
Consumer and Film will be comprised of Consumer Inkjet, Entertainment Imaging and Commercial Films, and Brand Licensing.
|
|
·
|
Intellectual Property Solutions will include licensing and research and development activities not directly related to the other segments.
|
DISCONTINUED OPERATIONS
Discontinued operations of Kodak include the Personalized Imaging and Document Imaging businesses, the digital capture and devices business, Kodak Gallery, and other miscellaneous businesses. For details, refer to Note 27, “Discontinued Operations” in the Notes to Financial Statements for additional information.
FINANCIAL INFORMATION BY GEOGRAPHIC AREA
Financial information by geographic area for the past three years is shown in Note 23, “Segment Information,” in the Notes to Financial Statements.
RAW MATERIALS
The raw materials used by Kodak are many and varied, and are generally readily available. Lithographic aluminum is the primary material used in the manufacture of offset printing plates. Kodak procures lithographic aluminum coils from several suppliers on a spot basis or under contracts generally in place over the next one to two years. Electronic components are used in the manufacturing of commercial printers and other electronic devices. Although most electronic components are generally available from multiple sources, certain key electronic components included in the finished goods manufactured by and purchased from Kodak’s third party suppliers are obtained from single or limited sources, which may subject Kodak to supply risks.
SEASONALITY OF BUSINESS
Equipment sales generally are higher in the fourth quarter, resulting from customer or industry budgeting practices.
RESEARCH AND DEVELOPMENT
Through the years, Kodak has engaged in extensive and productive efforts in research and development.
6
Research and development expenditures for Kodak’s two reportable segments were as follows:
|
(in millions)
|
Successor
|
Predecessor
|
||||||||||||||
|
Year Ended
December 31, 2014
|
Four Months Ended
December 31, 2013
|
Eight Months Ended
August 31, 2013
|
Year Ended
December 31, 2012
|
|||||||||||||
|
Graphics, Entertainment and Commercial Films
|
$ | 21 | $ | 7 | $ | 13 | $ | 40 | ||||||||
|
Digital Printing and Enterprise
|
88 | 33 | 55 | 132 | ||||||||||||
|
Impact of exclusion of certain components of pension and other postretirement benefit plan income from the segment measure of profitability
(1)
|
(15 | ) | (7 | ) | (2 | ) | (4 | ) | ||||||||
|
Total
|
$ | 94 | $ | 33 | $ | 66 | $ | 168 | ||||||||
(1)
Composed of interest cost, expected return on plan assets, amortization of actuarial gains and losses, amortization of prior service credits related to the U.S. Postretirement Benefit Plan and special termination benefits, curtailments and settlement components of pension and other postretirement benefit expenses, except for settlements in connection with the chapter 11 bankruptcy proceedings that are recorded in Reorganization items, net and curtailments and settlements included in Earnings (loss) from discontinued operations, net of income taxes in the Consolidated Statement of Operations.
Research and development is headquartered in Rochester, New York. Other U.S. groups are located in Stamford, Connecticut; Dayton, Ohio; Oakdale, Minnesota; and Columbus, Georgia. Outside the U.S., groups are located in Canada, England, Israel, Germany, Japan and China. These groups work in close cooperation with manufacturing units and marketing organizations to develop new products and applications to serve both existing and new markets.
Kodak's general practice is to protect its investment in research and development and its freedom to use its inventions by obtaining patents. The ownership of these patents contributes to Kodak's ability to provide industry-leading products. Kodak holds portfolios of patents in several areas important to its business, including the specific technologies previously discussed, such as flexographic and lithographic printing plates and systems; digital printing workflow and color management proofing systems; color and black-and-white electrophotographic printing systems; commercial and consumer inkjet writing systems, printers, and presses; inkjet inks and media; functional printing materials, formulations, and deposition modalities; dye sublimation (thermal transfer) printing systems; and color negative films, processing and papers. Each of these areas is important to existing and emerging business opportunities that bear directly on Kodak's overall business performance.
Kodak's major products are not dependent upon one single, material patent. Rather, the technologies that underlie Kodak's products are supported by an aggregation of patents having various remaining lives and expiration dates. There is no individual patent, or group of patents, whose expiration is expected to have a material impact on Kodak's results of operations.
ENVIRONMENTAL PROTECTION
Kodak is subject to various laws and governmental regulations concerning environmental matters. The U.S. federal environmental legislation and state regulatory programs having an impact on Kodak include the Toxic Substances Control Act, the Resource Conservation and Recovery Act, the Clean Air Act, the Clean Water Act, the NY State Chemical Bulk Storage Regulations and the Comprehensive Environmental Response, Compensation and Liability Act of 1980, as amended (the “Superfund Law”).
It is Kodak’s policy to carry out its business activities in a manner consistent with sound health, safety and environmental management practices, and to comply with applicable health, safety and environmental laws and regulations. Kodak continues to engage in programs for environmental, health and safety protection and control.
Based upon information presently available, future costs associated with environmental compliance are not expected to have a material effect on Kodak's capital expenditures or competitive position, although costs could be material to a particular quarter or year.
7
EMPLOYMENT
At the end of 2014, Kodak employed the full time equivalent of approximately 7,300 people globally, of whom approximately 3,200 were employed in the U.S. The actual number of employees may be greater because some individuals work part time.
AVAILABLE INFORMATION
Kodak files many reports with the Securities and Exchange Commission (“SEC”) (www.sec.gov), including annual reports on Form 10-K, quarterly reports on Form 10-Q and current reports on Form 8-K. These reports, and amendments to these reports, are made available free of charge as soon as reasonably practicable after being electronically filed with or furnished to the SEC. They are available through Kodak's website at www.Kodak.com. To reach the SEC filings, follow the links to About Kodak, Investor Center, Financial Information and then SEC Filings.
Risks Related to Our Business
The Company has significantly restructured its business and adopted a new business plan, including a new segment reporting structure. The restructured Company and new business plan have been in effect for a limited period of time and there are no assurances that the Company will be able to successfully implement its business plan or successfully operate as a restructured business.
The Company has focused its investments on imaging and printing for business, specifically, commercial inkjet, packaging and functional (Micro 3D) printing solutions, and enterprise services and solutions. Each of these businesses requires additional investment and may not be successful. The introduction of successful innovative products at market competitive prices and the achievement of scale are necessary for us to grow these businesses, improve margins and achieve our financial objectives. Additionally, our strategy is based on a number of factors and assumptions, some of which are not within our control, such as the actions of third parties. There can be no assurance that we will be able to successfully execute all or any elements of our strategy, or that our ability to successfully execute our strategy will be unaffected by external factors. If we are unsuccessful in growing the Company’s investment businesses as planned, or perceiving the needs of our target customers, our financial performance could be adversely affected.
If Kodak is not able to successfully implement its strategic business plans, or experiences implementation delays in cost structure reduction, the Company’s consolidated results of operations, financial position and liquidity could be negatively affected.
We recognize the need to rationalize Kodak’s workforce and streamline operations to a leaner and more focused organization aligned with the emerged businesses and operations. We have implemented such cost rationalization plans including a restructuring of manufacturing, supply chain, marketing, sales and administrative resources. There are no assurances that such measures will prove to be successful or that the results we achieve through these plans will be consistent with our expectations. As a result, our results of operations, financial position and liquidity could be negatively impacted. Additionally, if restructuring plans are not effectively managed, we may experience lost customer sales, product delays, additional costs and other unanticipated effects, causing harm to our business and customer relationships. The business plans are subject to a number of assumptions, projections, and analysis. If these assumptions prove to be incorrect, we may be unsuccessful in executing our business plan or achieving the projected results, which could adversely impact our financial results and liquidity. Finally, the timing and implementation of these plans require compliance with numerous laws and regulations, including local labor laws, and the failure to comply with such requirements may result in damages, fines and penalties which could adversely affect the Company’s business.
Kodak’s inability to effectively complete and manage partnerships and other significant transactions could adversely impact our business performance, including our financial results.
As part of the Company’s strategy, we may be engaged in discussions with third parties regarding possible divestitures, asset sales, spin-offs, investments, acquisitions, strategic alliances, joint ventures, and outsourcing transactions and may enter into agreements relating to such transactions in order to further our business objectives. In order to pursue this strategy successfully, we must identify suitable buyers, sellers and partners and successfully complete transactions, some of which may be large and complex, and manage post-closing issues such as the elimination of any remaining post-sale costs related to divested businesses. Transaction risk can be more pronounced for larger and more complicated transactions, or when multiple transactions are pursued simultaneously. If we fail to identify and successfully complete transactions that further the Company’s strategic objectives, we may be required to expend resources to develop products and technology internally, we may be at a competitive disadvantage or we may be adversely affected by negative market perceptions. Any of these factors could have an adverse effect on our revenue, gross margins and profitability. In addition, unpredictability surrounding the timing of such transactions could adversely affect our financial results.
8
We may pursue acquisitions or combinations that could fail or present unanticipated problems for our business in the future, which would adversely affect our ability to realize the anticipated benefits of those transactions or increase the price we would be required to pay.
We may seek to enter into transactions that may include acquiring or combining with other businesses. We may not be able to identify suitable acquisition or combination opportunities or finance and complete any particular acquisition or combination successfully. Furthermore, acquisitions and combinations involve a number of risks and challenges, including:
|
·
|
the ability to obtain required regulatory and other approvals;
|
|
·
|
the need to integrate acquired or combined operations with our operations;
|
|
·
|
potential loss of key employees;
|
|
·
|
difficulty in evaluating operating costs, infrastructure requirements, environmental and other liabilities and other factors beyond our control;
|
|
·
|
potential lack of operating experience in new geographic areas;
|
|
·
|
an increase in our expenses and working capital requirements;
|
|
·
|
management’s attention may be temporarily diverted; and
|
|
·
|
the possibility that we may be required to issue a substantial amount of additional equity or debt securities or assume additional debt in connection with any such transactions.
|
Any of these factors could adversely affect our ability to achieve anticipated levels of cash flows or realize synergies or other anticipated benefits from a strategic transaction. Furthermore, the market for transactions is highly competitive, which may adversely affect our ability to find transactions that fit our strategic objectives or increase the price we would be required to pay (which could decrease the benefit of the transaction or hinder our desire or ability to consummate the transaction). Strategic transactions may occur at any time and may be significant in size relative to our assets and operations.
If the Company is unable to successfully develop or commercialize new products, our business, financial position and operating results may suffer.
We generally sell our products in industries that are characterized by rapid technological changes, frequent new product and service introductions and changing industry standards. Without the timely introduction of new products, services and enhancements, our products and services will become technologically obsolete over time, in which case our revenue and operating results would suffer. Therefore, our future results of operations will depend to a significant extent upon our ability to successfully commercialize new products in a timely manner. The success of our new products and services will depend on several factors, including our ability to:
|
·
|
identify customer needs;
|
|
·
|
innovate and develop new technologies, services, and applications;
|
|
·
|
commercialize new technologies in a timely manner;
|
|
·
|
manufacture and deliver our products in sufficient volumes and on time;
|
|
·
|
differentiate our offerings from our competitors’ offerings;
|
|
·
|
price our products and services competitively;
|
|
·
|
anticipate our competitors’ development of new products, services or technological innovations;
|
|
·
|
work successfully alongside our partners, including UniPixel, Bobst and Kingsbury; and
|
|
·
|
control product quality in our manufacturing processes.
|
As a result of these and other factors, products currently in development by Kodak may or may not be successfully commercialized in a timely manner, or at all. If any of our key products cannot be successfully or timely commercialized, our operating results could be adversely affected. Moreover, we cannot guarantee that any investment we made in developing products will be recouped, even if we are successful in commercializing those products, which could have a material adverse effect on our business, financial position and operating results.
We may not be successful in commercializing technologies for micro 3D printing, one of our target markets, which could have a material adverse effect on our business, operating results and financial position.
We are in the process of commercializing technologies for micro 3D printing, one of our target markets. We may not be successful in developing and marketing products in some or all of the areas we seek to enter in micro 3D printing. Development, production, marketing or administrative costs may exceed expectations and operating cash flow generated from these products. Customers may favor other technologies or solutions, and our products may not be competitive on the basis of cost, functionality or other characteristics. In addition, our competitors may have better technologies to which we may not have access, and may have more financial or other resources to support development and marketing of their products. We rely on our partners, such as UniPixel and Kingsbury, for technology and other expertise that are key to our efforts to commercialize micro 3D printing products. Issues with either of these companies or in our relationship with them could adversely affect our plans with respect to commercialization of our technologies. The investment required to develop products may exceed our expectations. If any or all of these risks occurred, we may not realize benefits associated with our investments in micro 3D printing, and it could have a material adverse effect on our business, operating results and financial position.
9
If Kodak’s commercialization and manufacturing processes fail to prevent product reliability, yield and quality issues, our product launch plans may be delayed, our financial results may be adversely impacted, and our reputation may be harmed.
In developing, commercializing and manufacturing Kodak’s products and services, we must adequately address reliability, yield and other quality issues, including defects in our engineering, design and manufacturing processes, as well as defects in third-party components included in our products. Because Kodak’s products are sophisticated and complicated to develop and commercialize with rapid advances in technologies, the occurrence of defects may increase, particularly with the introduction of new product lines. Unanticipated issues with product performance may delay product launch plans which could result in additional expenses, lost revenue and earnings. Although we have established internal procedures to minimize risks that may arise from product quality issues, there can be no assurance that we will be able to eliminate or mitigate occurrences of these issues and associated liabilities. Product reliability, yield and quality issues can impair our relationships with new or existing customers and adversely affect our brand image, product quality issues can result in recalls, warranty, or other service obligations and litigation, and our reputation as a producer of high quality products could suffer, which could adversely affect our business as well as our financial results.
Our ability to generate positive operating cash flows will be necessary for us to continue to operate our business.
While Kodak has significantly reduced its rate of negative operating cash flow over the past two years, we continue to generate net negative operating cash flow. There is no assurance that Kodak will be able to generate positive cash flow from operations in the future, which could have a material adverse effect on Kodak’s liquidity and financial position.
Continued investment, capital needs, restructuring payments and servicing the Company’s debt require a significant amount of cash and we may not be able to generate cash necessary to finance these activities, which could adversely affect our business, operating results and financial condition.
Kodak’s business may not generate cash flow in an amount sufficient to enable us to pay the principal of, or interest on our indebtedness, or to fund Kodak’s other liquidity needs, including working capital, capital expenditures, product development efforts, strategic acquisitions, investments and alliances, restructuring actions and other general corporate requirements.
Kodak’s ability to generate cash is subject to general economic, financial, competitive, litigation, regulatory and other factors that are beyond our control. We cannot assure you that:
|
·
|
Kodak’s businesses will generate sufficient cash flow from operations;
|
|
·
|
Kodak will be able to repatriate or move cash to locations where and when it is needed;
|
|
·
|
Kodak will meet all the conditions associated with making borrowings or issuing letters of credit under the Asset Based Revolving Credit Agreement (the “ABL Credit Agreement”);
|
|
·
|
Kodak will realize cost savings, earnings growth and operating improvements resulting from the execution of our business and restructuring plan;
|
|
·
|
Kodak will not have to expend cash defending litigations regardless of the merits of any claims raised; or
|
|
·
|
future sources of funding will be available in amounts sufficient to enable funding of our liquidity needs.
|
If we cannot fund our liquidity needs, we will have to take actions, such as reducing or delaying capital expenditures, product development efforts, strategic acquisitions, and investments and alliances; selling additional assets; restructuring or refinancing the Company’s debt; or seeking additional equity capital. Such actions could increase the Company’s debt, negatively impact customer confidence in our ability to provide products and services, reduce the Company’s ability to raise additional capital and delay sustained profitability. We cannot assure you that any of these actions could, if necessary, be effected on commercially reasonable terms, or at all, or that they would permit us to meet the Company’s scheduled debt service obligations. In addition, if we incur additional debt, the risks associated with the Company’s substantial leverage, including the risk that we will be unable to service the Company’s debt, generate cash flow sufficient to fund our liquidity needs, or maintain compliance with the covenants in our various credit facilities, could intensify.
There can be no assurance that the Company will be able to comply with the terms of our various credit facilities.
A breach of any of the financial or other covenants contained in the Senior Secured First Lien Term Credit Agreement (the “First Lien Term Credit Agreement”), Senior Secured Second Lien Term Credit Agreement (the “Second Lien Term Credit Agreement”, and together with the First Lien Term Credit Agreement, the “Term Credit Agreements”) or the ABL Credit Agreement (and together with the Term Credit Agreements the “Credit Agreements”) could result in an event of default under these facilities. If any event of default occurs and we are not able to either cure it or obtain a waiver from the requisite lenders under each of these facilities, the administrative agent of each credit facility may, and at the request of the requisite lenders for that facility shall, declare all of our outstanding obligations under the applicable credit facility, together with accrued interest and fees, to be immediately due and payable and the agent under the ABL Credit Agreement may, and at the request of the requisite lenders shall, terminate the lenders’ commitments under that facility and cease making further loans, and if applicable, each respective agent could institute foreclosure proceedings against our pledged assets. Any of these outcomes could adversely affect our operations and our ability to satisfy our obligations as they come due.
10
Due to the nature of the products we sell and Kodak’s worldwide distribution, we are subject to changes in currency exchange rates, interest rates and commodity costs that may adversely impact our results of operations and financial position.
As a result of Kodak’s global operating and financing activities, we are exposed to changes in currency exchange rates and interest rates, which may adversely affect our results of operations and financial position. Exchange rates and interest rates in markets in which we do business tend to be volatile and, at times, our sales can be negatively impacted across all of the Company’s segments depending upon the value of the U.S. dollar, the Euro and other major currencies. In addition, the Company’s products contain aluminum, silver, petroleum based or other commodity based raw materials, the prices of which have been, and may continue to be, volatile. If the global economic situation remains uncertain or worsens, there could be further volatility in changes in currency exchange rates, interest rates and commodity prices, which could have negative effects on our revenue and earnings.
Weakness or worsening of global economic conditions could adversely affect our financial performance and liquidity.
The global economic environment may adversely affect sales of our products, profitability and liquidity. Global financial markets have been experiencing volatility. Economic conditions could accelerate any decline in demand for products, which could also place pressure on our results of operations and liquidity. There is no guarantee that anticipated economic growth levels in markets that have experienced some economic strength will continue in the future, or that we will succeed in expanding sales in these markets. In addition, accounts receivable and past due accounts could increase due to a decline in our customers’ ability to pay as a result of an economic downturn, and the Company’s liquidity, including our ability to use credit lines, could be negatively impacted by failures of financial instrument counterparties, including banks and other financial institutions. If global economic weakness and tightness in the credit markets exist, worsen or are attenuated, the Company’s profitability and related cash generation capability could be adversely affected and, therefore, affect the Company’s ability to meet the Company’s anticipated cash needs, impair the Company’s liquidity or increase the Company’s costs of borrowing.
The competitive pressures we face could harm Kodak’s revenue, gross margins and market share.
The markets in which we do business are highly competitive with large, entrenched, and well financed industry participants, many of which are larger than us. In addition, we encounter aggressive price competition for many of our products and services from numerous companies globally. Any of our competitors may foresee the course of market developments more accurately than we do; sell superior products and provide superior services or offer a broader variety of products and services; have the ability to produce or supply similar products and services at a lower cost; have better access to supplies and the ability to acquire supplies at a lower cost; develop stronger relationships with our suppliers or customers; or adapt more quickly to new technologies or evolving customer requirements than we do or have access to capital markets or other financing sources on more favorable terms than we can obtain. As a result, we may not be able to compete successfully with our competitors. Finally, we may not be able to maintain our operating costs or prices at levels that would allow us to compete effectively. Kodak’s results of operations and financial condition may be adversely affected by these and other industry-wide pricing pressures. If our products, services and pricing are not sufficiently competitive with current and future competitors, we could also lose market share, adversely affecting our revenue and gross margins.
An inability to provide competitive financing arrangements to Kodak’s customers or extension of credit to customers whose creditworthiness deteriorates could adversely impact our revenue, profitability and financial position.
The competitive environment in which we operate may require us to facilitate or provide financing to our customers in order to win a contract. Customer financing arrangements may cover all or a portion of the purchase price for the Company’s products and services. We may also assist customers in obtaining financing from banks and other sources. Our success may be dependent, in part, upon our ability to provide customer financing on competitive terms and on our customers’ creditworthiness. Tightening of credit in the global financial markets can adversely affect the ability of Kodak’s customers to obtain financing for significant purchases, which may result in a decrease in, or cancellation of, orders for our products and services. If we are unable to provide competitive financing solutions to our customers or if we extend credit to customers whose creditworthiness deteriorates, our revenues, profitability and financial position could be adversely impacted.
If the U.K. Kodak Pension Plan Purchasing Parties (“KPP Purchasing Parties”) are not able to successfully operate the Personalized Imaging and Document Imaging Business (the “PI/DI Business”) acquired from the Company or meet their commitments under supply, service and transition services and other agreements entered into with the Company, the Company’s brand, reputation and financial results could suffer.
The Amended and Restated Stock and Asset Purchase Agreement between Eastman Kodak Company, Qualex, Inc., Kodak (Near East), Inc., KPP Trustees Limited, as Trustee for the Kodak Pension Plan of the United Kingdom, and, solely for the purposes of Section 11.4, KPP Holdco Limited, dated August 30, 2013 (“Amended SAPA”) and certain related agreements permit the KPP Purchasing Parties to use the Kodak name and brand in its operations of the PI/DI Business on a going-forward basis. If the KPP Purchasing Parties are not successful in the operation of the PI/DI Business, the Company’s brand image and reputation as a producer of high quality products could be harmed, which could affect our financial results or operations. In addition, in connection with the closing under the Amended SAPA, on the Effective Date, the Company entered into certain supply and transition services agreements with the KPP Purchasing Parties under which the KPP Purchasing Parties are purchasing supplies and services from the Company. The inability of the KPP Purchasing Parties to make payments as they are due under the supply, service and transition service agreements could negatively affect our financial results. Further, with respect to a certain jurisdiction for which a deferred closing is expected to occur pursuant to the Amended SAPA in 2015, certain factors may delay the closing from occurring on the expected date, which could result in costs or operational impacts to Kodak.
11
If we cannot attract, retain and motivate key management and other key employees, Kodak’s revenue and earnings could be harmed.
In order for us to be successful, we must continue to attract, retain and motivate executives and other key employees, including technical, managerial, marketing, sales, research and support positions. Hiring and retaining qualified executives, research and engineering professionals, and qualified sales representatives, particularly in Kodak’s targeted growth markets, are critical to our future. We may be unable to attract and retain highly qualified management and employees, particularly if we do not offer employment terms competitive with the rest of the market. Failure to attract and retain qualified individuals, key leaders, executives and employees, or failure to develop and implement a viable succession plan, could result in inadequate depth of institutional knowledge or skill sets, which could adversely affect our business.
If we cannot effectively anticipate technology trends and develop and market new products to respond to changing customer preferences, our revenue, earnings and cash flow could be adversely affected.
We are a technology company serving imaging for business markets, including packaging, micro 3D printing, graphic communications and enterprise services. Our success in these markets depends on our ability to offer differentiated solutions to capture market share and grow scale. To enable this, we must continually develop and introduce new products and services in a timely manner to keep pace with technological developments and achieve customer acceptance. In addition, the services and products that we provide to customers may not or may no longer meet the needs of our customers as the business models of our customers evolve. Our customers may decide to outsource their imaging needs or may purchase imaging services and needs from other suppliers. In addition, it is difficult to predict successfully the products and services our customers will demand. The success of our business depends in part on our ability to identify and respond promptly to changes in customer preferences, expectations and needs. If we do not timely assess and respond to changing customer expectations, preferences and needs, our financial condition, results of operations or cash flows could be adversely affected.
We must also effectively communicate to our customers, investors, and other key stakeholders our new business model and successfully position our products for the markets we serve. If we are unable to anticipate new technology trends, develop improvements to the Company’s current technology to address changing customer preferences, and effectively communicate our businesses, products, and the markets we serve, our revenue, earnings and cash flow could be adversely affected.
We have outsourced a significant portion of Kodak’s overall worldwide manufacturing, logistics and back office operations and face the risks associated with reliance on third party suppliers.
We have outsourced a significant portion of our overall worldwide manufacturing, logistics, customer support and administrative operations to third parties. To the extent that we rely on third party service providers, we face the risk that those third parties may not be able to:
|
·
|
develop manufacturing methods appropriate for the Company’s products;
|
|
·
|
maintain an adequate control environment;
|
|
·
|
quickly respond to changes in customer demand for the Company’s products;
|
|
·
|
obtain supplies and materials necessary for the manufacturing process; or
|
|
·
|
mitigate the impact of labor shortages and/or disruptions.
|
Further, even if Kodak honors its payment and other obligations to its key suppliers of products, components and services, such suppliers may choose to unilaterally withhold products, components or services, or demand changes in payment terms. In addition, we may experience shortages in supply and disruptions in service as a result of unexpected demand, transportation and logistical limitations, and/or disruptions or production difficulties at our suppliers such as disruptions due to fires, other natural disasters or events outside of a supplier’s control. In addition, disruptions could result from a reduction in the number of our suppliers due to their own financial difficulties or a reduction in the products offered by such suppliers. As a result of the loss of any supplier, or a substantial decrease in the availability of products from our suppliers, we may be unable to meet our customer commitments, our costs could be higher than planned, and our cash flows and the reliability of the Company’s products could be negatively impacted. Kodak will vigorously enforce its contractual rights under such circumstances, but there is no guarantee we will be successful in preventing or mitigating the effects of unilateral actions by our suppliers. Other supplier problems that we could face include electronic component shortages, excess supply, risks related to the duration and termination of Kodak’s contracts with suppliers for components and materials and risks related to dependency on single source suppliers on favorable terms or at all. The realization of any of these risks should alternative third party relationships not be established, could cause interruptions in supply or increases in costs that might result in Kodak’s inability to meet customer demand for our products, damage to our relationships with Kodak’s customers, and reduced market share, all of which could adversely affect our results of operations and financial condition.
12
Business disruptions could seriously harm our future revenue and financial condition and increase our costs and expenses.
Our worldwide operations could be subject to earthquakes, power shortages, telecommunications failures, cyber-attacks, terrorism, water shortages, tsunamis, floods, hurricanes, typhoons, fires, extreme weather conditions, medical epidemics, political or economic instability, and other natural or manmade disasters or business interruptions, for which we are predominantly self-insured. The occurrence of any of these business disruptions could seriously harm our revenue and financial condition and increase our costs and expenses. In addition, some areas, including parts of the east and west coasts of the United States, have previously experienced, and may experience in the future, major power shortages and blackouts. These blackouts could cause disruptions to our operations or the operations of our suppliers, distributors and resellers, or customers. We have operations including research and development facilities in geographically disparate locations, such as Israel, Japan, China and Canada. The impact of these risks is greater in areas where products are manufactured at a sole or limited number of location(s), and where the sourcing of materials is limited to a sole or limited base of suppliers, since any material interruption in operations in such locations or suppliers could impact our ability to provide a particular product or service for a period of time. These events could seriously harm our revenue and financial condition, and increase our costs and expenses.
If we cannot protect the intellectual property rights on which the Company’s business depends, or if third parties assert that we violate their intellectual property rights, our revenue, earnings, expenses and liquidity may be adversely impacted.
A key differentiator for Kodak in many of our businesses is our technological advantage over competitors’ products and solutions. Our technological advantage is supported by Kodak’s intellectual property rights. Patent, copyright, trademark and trade secret laws in the United States and similar laws in other countries, and non-disclosure, confidentiality and other types of agreements with Kodak’s employees, customers, suppliers and other parties, may not be effective in establishing, maintaining and enforcing Kodak’s intellectual property rights. Any of Kodak’s direct or indirect intellectual property rights could be challenged, invalidated, circumvented, infringed or misappropriated, or such intellectual property rights may not be sufficient to permit us to take advantage of current market trends or otherwise to provide competitive advantages, which could result in costly product redesign efforts, discontinuance of certain product offerings or other competitive harm. Further, the laws of certain countries do not protect proprietary rights to the same extent as the laws of the United States. Therefore, in certain jurisdictions, we may be unable to protect Kodak’s proprietary technology adequately against unauthorized third party copying, infringement or use, which could adversely affect our competitive position. Also, because of the rapid pace of technological change in the information technology industry, much of Kodak’s business and many of Kodak’s products rely on key technologies developed or licensed by third parties, and we may not be able to obtain or continue to obtain licenses and technologies from these third parties at all or on reasonable terms.
We have made substantial investments in new, proprietary technologies and have filed patent applications and obtained patents to protect Kodak’s intellectual property rights in these technologies as well as the interests of Kodak’s licensees. There can be no assurance that Kodak’s patent applications will be approved, that any patents issued will adequately protect Kodak’s intellectual property or that such patents will not be challenged by third parties.
In addition, third parties may claim that Kodak’s customers, licensees or other parties indemnified by us are infringing upon their intellectual property rights. Such claims may be made by competitors seeking to block or limit our access to certain markets. Additionally, in recent years, individuals and groups have begun purchasing intellectual property assets for the sole purpose of making claims of infringement and attempting to extract settlements from large companies like ours. Even if we believe that the claims are without merit, these claims may have the following negative impacts on our business:
|
·
|
claims can be time consuming and costly to defend and may distract management’s attention and resources;
|
|
·
|
claims of intellectual property infringement may require us to redesign affected products, enter into costly settlement or license agreements or pay costly damage awards, or face a temporary or permanent injunction prohibiting us from marketing or selling certain of our products;
|
|
·
|
even if we have an agreement to indemnify us against such costs, the indemnifying party may be unable to uphold its contractual obligations; and
|
|
·
|
if we cannot or do not license the infringed technology at all, license the technology on reasonable terms or substitute similar technology from another source, our revenue and earnings could be adversely impacted.
|
Finally, we use open source software in connection with our products and services. Companies that incorporate open source software into their products have, from time to time, faced claims challenging the ownership of open source software and/or compliance with open source license terms. As a result, the Company could be subject to suits by parties claiming ownership of what we believe to be open source software or noncompliance with open source licensing terms. Some open source software licenses require users who distribute open source software as part of their software to publicly disclose all or part of the source code to such software and/or make available any derivative works of the open source code on unfavorable terms or at no cost; any requirement to disclose the Company’s source code or pay damages for breach of contract could be harmful to our business results of operations and financial condition.
13
Kodak’s future pension and other postretirement benefit plan costs and required level of contributions could be unfavorably impacted by changes in actuarial assumptions, market performance of plan assets and obligations imposed by legislation or pension authorities which could adversely affect our financial position, results of operations, and cash flow.
Kodak has significant defined benefit pension and other postretirement benefit obligations. The funded status of our U.S. and non U.S. defined benefit pension plans (and other postretirement benefit plans), and the related cost reflected in our financial statements, are affected by various factors that are subject to an inherent degree of uncertainty. Key assumptions used to value these benefit obligations, funded status and expense recognition include the discount rate for future payment obligations, the long term expected rate of return on plan assets, salary growth, healthcare cost trend rates, mortality trends, and other economic and demographic factors. Significant differences in actual experience, or significant changes in future assumptions or obligations imposed by legislation or pension authorities could lead to a potential future need to contribute cash or assets to Kodak’s plans in excess of currently estimated contributions and benefit payments and could have an adverse effect on Kodak’s consolidated results of operations, financial position or liquidity.
In past years, we have experienced increases in the costs of these defined benefit pension and postretirement benefit obligations as a result of macro-economic factors beyond our control, including increases in health care costs, declines in investment returns on pension plan assets and changes in discount rates and mortality rates used to calculate pension and related liabilities. At least some of these macro-economic factors may again put pressure on the cost of providing pension and medical benefits. There can be no assurance that we will succeed in limiting cost increases, and continued upward pressure, including any as a result of new legislation, could reduce the profitability of our businesses.
Kodak’s businesses experience seasonality of sales. Therefore, lower demand for Kodak’s products or increases in costs during periods that are expected to be at peak in seasonality may have a pronounced negative effect on our results of operations.
Equipment and consumables sales generally exhibit higher levels in the fourth quarter due to the seasonal nature of placements, resulting from customer or industry budgeting practices. As a result, a sequential quarter-to-quarter comparison is not a good indication of our performance or how we will perform in the future. In addition, adverse developments during what are expected to be peak periods in seasonality, such as lower-than-anticipated demand for Kodak’s products, an internal systems failure, increases in materials costs, or failure of or performance problems with one of our key logistics, components supply, or manufacturing partners, could have a material adverse impact on our financial condition and operating results. Tight credit markets that limit capital investments or a weak economy that decreases print demand could negatively impact equipment or consumable sales. These external developments are often unpredictable and may have an adverse impact on our business and results of operations.
If we fail to manage distribution of Kodak’s products and services properly, our revenue, gross margins and earnings could be adversely impacted.
We use a variety of different distribution methods to sell and deliver Kodak’s products and services, including third party resellers and distributors and direct and indirect sales to both enterprise accounts and customers. Successfully managing the interaction of direct and indirect channels to various potential customer segments for our products and services is a complex process. Moreover, since each distribution method has distinct risks and costs, Kodak’s failure to achieve the most advantageous balance in the delivery model for our products and services could adversely affect our revenue, gross margins and earnings. This has concentrated Kodak’s credit and operational risk and could result in an adverse impact on our financial performance.
Kodak’s future results could be harmed if we are unsuccessful in our efforts to expand sales in emerging markets.
Because we are seeking to expand our sales and number of customer relationships outside the United States, and specifically in emerging markets in Asia, Latin America and Eastern Europe, Kodak’s business is subject to risks associated with doing business internationally, such as:
|
·
|
support of multiple languages;
|
|
·
|
recruitment of sales and technical support personnel with the skills to design, manufacture, sell and supply products;
|
|
·
|
compliance with governmental regulation of imports and exports, including obtaining required import or export approval for our products;
|
|
·
|
complexity of managing international operations;
|
|
·
|
exposure to foreign currency exchange rate fluctuations;
|
|
·
|
commercial laws and business practices that may favor local competition;
|
|
·
|
multiple, potentially conflicting, and changing governmental laws, regulations and practices, including differing export, import, tax, anti-corruption, anti-dumping, economic sanction, labor, and employment laws;
|
|
·
|
difficulties in collecting accounts receivable;
|
|
·
|
limitations or restrictions on the repatriation of cash;
|
14
|
·
|
limitations or reductions in protection of intellectual property rights;
|
|
·
|
complications in logistics and distribution arrangements; and
|
|
·
|
political or economic instability.
|
There can be no assurance that we will be able to market and sell our products in all of Kodak’s targeted markets. If our efforts are not successful, our business growth and results of operations could be harmed. As a global company, Kodak is subject to regulatory requirements and laws in the jurisdictions in which we operate, and any alleged non-compliance with these requirements or laws could result in an adverse financial or reputational impact.
We are subject to environmental laws and regulations and failure to comply with such laws and regulations or liabilities imposed as a result of such laws and regulations could have an adverse effect on our business, results of operations and financial condition.
We are subject to environmental laws and regulations in the jurisdictions in which we conduct our business, including laws regarding the discharge of pollutants, including greenhouse gases, into the air and water, the need for environmental permits for certain operations, the management and disposal of hazardous substances and wastes, the cleanup of contaminated sites, the content of Kodak’s products and the recycling and treatment and disposal of our products. If we do not comply with applicable laws and regulations in connection with the use and management of hazardous substances, or otherwise incur liabilities under such laws which in some instances can impose liability without regard to fault, then we could incur liability and/or could be prohibited or limited in the operation of certain facilities, which could have a material adverse effect on our business, results of operations and financial condition. The cost of complying with such laws, and costs associated with the cleanup of contaminated sites, could have a material adverse effect on our business, results of operations and financial condition.
In addition, the Company, the New York State Department of Environmental Conservation and the New York State Urban Development Corporation have entered into a settlement agreement concerning certain of the Company’s historical environmental liabilities at Eastman Business Park through the establishment of a $49 million environmental remediation trust. Should historical liabilities exceed $49 million, New York State is responsible for payments of cost up to an additional $50 million. In the event the historical liabilities exceed $99 million, the Company will become liable for 50% of the portion above $99 million, which could have a material adverse effect on our financial condition. The implementation date of the settlement agreement occurred on May 20, 2014. The settlement agreement includes a covenant not to sue from the U.S. Environmental Protection Agency. Any uncertainties related to the Company’s environmental obligations may impact our ability to further develop and transform Eastman Business Park.
Our business, results of operations and financial condition may be negatively impacted by legal matters.
We have various contingencies that are not reflected on our balance sheet, including those arising as a result of being involved from time to time in a variety of claims, lawsuits, investigations and proceedings concerning: commercial, customs, employment, and intellectual property matters, as well as the Employee Retirement Income Security Act (ERISA) and other laws and regulations as discussed in the “Contingencies” note in the Consolidated Financial Statements. Should developments in any of these matters cause a change in our determination as to an unfavorable outcome and result in the need to recognize a material accrual, or should any of these matters result in a final adverse judgment or be settled for significant amounts, they could have a material adverse effect on our results of operations, cash flows and financial position in the period or periods in which such change in determination, judgment or settlement occurs.
Regulations related to “conflict minerals” will require Kodak to incur additional expenses and could limit the supply and increase the cost of certain metals used in manufacturing Kodak’s products.
The Dodd-Frank Wall Street Reform and Consumer Protection Act contains provisions to improve transparency and accountability concerning the supply of minerals originating from the conflict zones of the Democratic Republic of Congo (DRC) and adjoining countries. As a result, in August 2012, the SEC adopted rules requiring disclosure related to sourcing of specified minerals, known as “conflict minerals,” that are necessary to the functionality or production of products manufactured or contracted to be manufactured by public companies. Kodak has developed a framework and management system consistent with the guidance issued by the Organization for Economic Co-operation and Development (OECD), and is currently performing due diligence on our supply chain. We expect to incur additional costs to comply with these disclosure requirements, including costs related to determining the sources of the specified minerals used in our products, in addition to the cost of any changes to products, processes, or sources of supply as a consequence of such verification activities, which may adversely affect our business. In addition, the number of suppliers who provide “conflict-free” minerals may be limited, which may make it difficult to satisfy customers who require that all of the components of our products be certified as conflict-free, which could place us at a competitive disadvantage if we are unable to do so. Because Kodak’s supply chain is complex, we may also not be sufficiently able to verify the origins of the relevant minerals used in our products through the due diligence procedures that we implement, which may harm our reputation.
We have determined that certain of our products contain such specified minerals, and we have developed a process to identify where such minerals originated. We filed our Conflict Minerals Disclosure report on June 2, 2014. As of the date of our conflict minerals report for the 2013 calendar year, we were unable to determine whether or not such minerals originate from the DRC or adjoining country.
15
Risks Related to Our Level of Indebtedness and Access to Capital Markets
Our substantial monetary obligations require that a portion of our cash flow be used to pay interest and fund other obligations rather than be invested in the business and could adversely affect our ability to fund our operations.
Our indebtedness under our Credit Agreements and our other obligations could have important negative consequences to us and investors in our securities. These include the following:
|
·
|
we may not be able to satisfy all of our obligations, including, but not limited to, our obligations under the Credit Agreements, which may cause a cross-default or cross-acceleration on other debt we may have incurred;
|
|
·
|
we could have difficulties obtaining necessary financing in the future for working capital, capital expenditures, debt service requirements, refinancing or other purposes;
|
|
·
|
we will have to use a significant part of our cash flow to make payments on our debt and to satisfy the other obligations set forth above, which may reduce the capital available for operations and expansion; and
|
|
·
|
adverse economic or industry conditions may have more of a negative impact on us.
|
We cannot be sure that cash generated from our business will be as high as we expect or that our expenses will not be higher than we expect. Because a portion of our expenses are fixed in any given year, our operating cash flow margins are highly dependent on revenues, which are largely driven by customer demand. A lower amount of cash generated from our business or higher expenses than expected, when coupled with our debt obligations, could adversely affect our ability to fund our operations.
Our access to the capital markets may be limited.
Because of our emergence from bankruptcy in 2013, our current non-investment grade credit rating, and/or general conditions in the financial and credit markets, our access to the capital markets may be limited. Moreover, the urgency of a capital-raising transaction may require us to pursue additional capital at an inopportune time. Our ability to obtain capital and the costs of such capital are dependent on numerous factors, including:
|
·
|
covenants in our Credit Agreements;
|
|
·
|
investor confidence in us and the markets in which we operate;
|
|
·
|
our financial performance and the financial performance of our subsidiaries;
|
|
·
|
our levels of debt;
|
|
·
|
our ability to generate positive cash flow;
|
|
·
|
our requirements for posting collateral under various commercial agreements;
|
|
·
|
our credit ratings;
|
|
·
|
our cash flow;
|
|
·
|
our long-term business prospects; and
|
|
·
|
general economic and capital market conditions, including the timing and magnitude of any market recovery.
|
We may not be successful in obtaining additional capital for these or other reasons. An inability to access capital may limit our ability to meet our operating needs and, as a result, may have a material adverse effect on our financial condition, results of operations and cash flows.
Our current non-investment grade status may adversely impact our commercial operations, increase our liquidity requirements and increase the cost of refinancing opportunities. We may not have adequate liquidity to post required amounts of additional collateral.
Our corporate family credit rating is currently below investment grade and we cannot assure you that our credit ratings will improve, or that they will not decline, in the future. Our credit ratings may affect the evaluation of our creditworthiness by trading counterparties and lenders, which could put us at a disadvantage to competitors with higher or investment grade ratings.
In carrying out our commercial business strategy, our current non-investment grade credit ratings have resulted and will likely continue to result in requirements that we either prepay obligations or post significant amounts of collateral to support our business. Additionally, our current non-investment grade credit ratings may limit our ability to obtain additional sources of liquidity, refinance our debt obligations or access the capital markets at the lower borrowing costs that would presumably be available to competitors with higher or investment grade ratings. Should our ratings continue at their current levels, or should our ratings be further downgraded, we would expect these negative effects to continue and, in the case of a downgrade, become more pronounced.
None.
16
Kodak's worldwide headquarters is located in Rochester, New York.
Products in the DP&E Segment are manufactured in the United States in Rochester, New York; Dayton, Ohio; and Weatherford, Oklahoma. Manufacturing facilities outside the United States are located in China
,
Japan and Canada
.
Products in the GECF Segment are manufactured in the United States in Rochester, New York and Columbus, Georgia. Manufacturing facilities outside the United States are located in Germany, China, Japan, United Kingdom and Canada.
Properties within a country may be shared by all segments operating within that country.
Regional distribution centers are located in various places within and outside of the United States. Kodak owns or leases administrative, research and development, manufacturing, marketing, and processing facilities in various parts of the world. The leases are for various periods and are generally renewable.
Subsequent to the Company’s Bankruptcy Filing, between January 27, 2012 and March 22, 2012, several putative class action suits were filed in federal court in the Western District of New York against the committees of the Company’s Stock Ownership Plan (‘SOP’) and Savings and Investment Plan (“SIP”), and certain former and current executives of the Company. The suits have been consolidated into a single action brought under the Employee Retirement Income Security Act (“ERISA”), styled as In re Eastman Kodak ERISA Litigation. The allegations concern the decline in the Company’s stock price and its alleged impact on SOP and SIP. Plaintiffs seek the recovery of any losses to the applicable plans, a constructive trust, the appointment of an independent fiduciary, equitable relief, as applicable, and attorneys’ fees and costs. Defendants’ motion to dismiss the litigation was denied on December 17, 2014 and the case is proceeding. On behalf of the defendants in this case, the Company believes that the case is without merit and will vigorously defend the defendants on their behalf.
Kodak’s Brazilian operations are involved in various litigation matters and have received or been the subject of numerous governmental assessments related to indirect and other taxes in various stages of litigation, as well as civil litigation and disputes associated with former employees and contract labor. The tax matters, which comprise the majority of the litigation matters, are primarily related to federal and state value-added taxes and income taxes. Kodak’s Brazilian operations are disputing these matters and intend to vigorously defend their position. Kodak routinely assesses these matters as to the probability of ultimately incurring a liability in its Brazilian operations and records its best estimate of the ultimate loss in situations where it assesses the likelihood of loss as probable. As of December 31, 2014, Kodak maintained accruals of approximately $16 million for claims aggregating approximately $233 million inclusive of interest and penalties where appropriate. In connection with assessments and litigation in Brazil, local regulations may require Kodak to post security for a portion of the amounts in dispute. Generally, any encumbrances of the Brazilian assets would be removed to the extent the matter is resolved in Kodak’s favor.
Kodak is involved in various lawsuits, claims, investigations, remediations and proceedings, including, from time to time, commercial, customs, employment, environmental, and health and safety matters, which are being handled and defended in the ordinary course of business. Kodak is also subject, from time to time, to various assertions, claims, proceedings and requests for indemnification concerning intellectual property, including patent infringement suits involving technologies that are incorporated in a broad spectrum of our products. These matters are in various stages of investigation and litigation, and are being vigorously defended. Based on information currently available, we do not believe that it is probable that the outcomes in any of these matters, individually or collectively, will have a material adverse effect on Kodak’s financial condition or results of operations. Litigation is inherently unpredictable, and judgments could be rendered or settlements entered that could adversely affect Kodak’s operating results or cash flows in a particular period.
None.
17
EXECUTIVE OFFICERS OF THE REGISTRANT
Pursuant to General Instructions G (3) of Form 10-K, the following list is included as an unnumbered item in Part I of this report in lieu of being included in the Proxy Statement for the Annual Meeting of Shareholders.
|
Year First Elected
|
||||||
|
an
|
to
|
|||||
|
Executive
|
Present
|
|||||
|
Name
|
Age
|
Positions Held
|
Officer
|
Office
|
||
|
Jeffrey J. Clarke
|
53
|
Chief Executive Officer
|
2014
|
2014
|
||
|
Philip Cullimore
|
49
|
Senior Vice President
|
2015
|
2015
|
||
|
Brad W. Kruchten
|
55
|
Senior Vice President
|
2009
|
2015
|
||
|
Eric-Yves Mahe
|
52
|
Senior Vice President
|
2015
|
2015
|
||
|
John N. McMullen
|
56
|
Chief Financial Officer
|
2014
|
2014
|
||
|
Steven Overman
|
46
|
Senior Vice President
|
2015
|
2015
|
||
|
Eric H. Samuels
|
47
|
Chief Accounting Officer and Corporate Controller
|
2009
|
2009
|
||
|
Terry R. Taber
|
60
|
Senior Vice President
|
2009
|
2010
|
||
|
Sharon E. Underberg
|
53
|
General Counsel, Secretary, and Senior Vice President
|
2015
|
2015
|
||
The executive officers' biographies follow:
Jeffrey J. Clarke
Jeff Clarke is the Chief Executive Officer and a member of the Board of Directors of Kodak.
Prior to joining Kodak in March 2014, Clarke was a Managing Partner of Augusta Columbia Capital, a private investment firm he co-founded in 2012. From 2012 to 2014, Clarke was the Chairman of Travelport, Inc., a private, travel technology firm, where he served as CEO from 2006 to 2011, after leading its sale from Cendant Corporation to the Blackstone Group for $4.3 billion in 2006.
Clarke was the Chief Operating Officer of CA, Inc. (now called CA Technologies), an enterprise software company, from 2004 to 2006. At CA, he was responsible for sales, services, distribution, corporate finance, mergers & acquisitions, information technology, corporate strategy and planning.
From 2002 to 2003, Clarke was Executive Vice President of Global Operations at Hewlett Packard (“HP”). In this role, he was responsible for HP's worldwide supply chain, manufacturing, procurement and internet operations. He also co-led HP's merger integration with Compaq Computer. Prior to HP, Clarke was the Chief Financial Officer of Compaq Computer, which he joined in 1998 following the merger of Compaq with Digital Equipment Corporation (“DEC”). Clarke was with DEC from 1985 to 1998, serving in management roles in international operations, finance and manufacturing.
Clarke has served on the board of directors of Red Hat, Inc., an enterprise software company, since 2008. He served as Chairman of Orbitz Worldwide, a global online travel agency, after leading the company’s IPO in July 2007, until April 2014 and was also a director for the Compuware Corporation, an enterprise software company, from November 2013 until December 2014. Mr. Clarke served on the board of directors of Utstarcom, which designs and manufactures communications equipment, from 2005 to 2010.
Clarke earned an MBA from Northeastern University, where he serves as a Trustee. He holds a B.A. degree in Economics from SUNY Geneseo.
Philip Cullimore
Effective January 1, 2015, Philip Cullimore is President of the Enterprise Inkjet Systems Division, which serves existing and future commercial inkjet printing customers. He reports to Chief Executive Officer Jeff Clarke.
On an interim basis, effective January 1, 2015, Cullimore also is President of the Micro 3D Printing and Packaging Division, which serves packaging customers and display original equipment manufacturer (“OEM”) partners with products such as KODAK FLEXCEL NX Systems and Plates, legacy packaging solutions, and touch sensor films. The Board of Directors elected Cullimore a senior vice president effective January 2015.
From December 2010 to December 2014, Cullimore was Regional Managing Director, Europe, Africa and Middle East Region (EAMER) and Chairman Eastman Kodak Sàrl.
During Cullimore’s fourteen years at Kodak, he has directed Kodak’s strategy in the photographic printing market and taken responsibility for Kodak’s Wide Format Printer and Inks participation at ENCAD Inc, with assignments in the U.K., U.S., and Switzerland.
Prior to rejoining Kodak in 2000, Cullimore’s career included periods as U.K. Managing Director for Purup-Eskofot and Worldwide Business Director for Workflow Software at Fujifilm Electronic Imaging. He also founded, grew, and sold two software businesses during the 1990s.
Cullimore holds a B. S. Honours Degree in Physics and Environmental Sciences from the University of East Anglia.
18
Brad W. Kruchten
Effective January 1, 2015, Brad Kruchten is President of the Print Systems Division, which serves graphic arts and commercial print customers with printing plates, computer to plate imaging solutions, electrophotographic printing solutions, OEM toner, and all equipment services. He reports to Chief Executive Officer Jeff Clarke.
Prior to Kruchten’s current position, he was President of GECF. Formerly, Kruchten was the President of the Film, Photofinishing & Entertainment Group (“FPEG”). In this capacity, he was responsible for profit and loss for all silver halide products. Kruchten was named President of FPEG in 2009. The Board of Directors elected him a senior vice president in 2009 as well.
Previously, Kruchten was the worldwide General Manager for Retail Printing and managed the products and services that enable retailers to offer an integrated retail solution to analog and digital photographers. These products and services included kiosks, paper, retail workflow software, service, and support. Before that, Kruchten was the General Manager for the Consumer and Professional film business. The Board of Directors elected him a corporate vice president in July 2002.
Kruchten's career at Kodak began in 1982 as a Quality Engineer. In 1986, he moved into a sales position for Copy Products and over the next five years held a number of sales and marketing positions within Printer Products and Business Imaging Systems. In 1993, Kruchten became a product line manager for Business Imaging Systems. In 1998, he was named Strategic Business Unit Manager and a divisional vice president of the Capture and Services business within the Document Imaging unit. During his tenure, Kodak introduced a number of scanners which made the company the world's leading seller of high-speed production scanning. In 2000, Kruchten was named Chief Operating Officer and vice president of the Document Imaging unit. As COO, he led the acquisition of the Imaging division of Bell & Howell. In 2001, Kruchten was named Site Manager, Kodak Colorado Division, and became a divisional vice president of Kodak's Global Manufacturing unit. In 2002, he was the Chief Executive Officer of Encad Inc., a wholly-owned Kodak subsidiary.
Prior to Kodak, Kruchten worked as a project engineer at Inland Steel and as a tool designer for General Motors Corp.
A native of Flint, Michigan, Kruchten has a B.S. degree in Engineering from Michigan State University, an M.S. in Statistics and Quality Management from the Rochester Institute of Technology, and has attended the Executive Management Development program at Penn State University.
Eric-Yves Mahe
Effective January 1, 2015, Eric-Yves Mahe is President of Software and Solutions for Kodak. He is responsible for Kodak Technology Solutions, Kodak’s go-to-market engine to prioritize and monetize Kodak innovations in partnership with Kodak Research Labs. He reports to Chief Executive Officer Jeff Clarke.
Beginning April 2014, Mahe was Senior Vice President Kodak Technology solutions, sales strategy and sales operations. In that capacity, Mahe was responsible for formulating a strategy to drive and measure sales of Kodak’s unique and innovative portfolio of hardware, consumables, software and services. Mahe also advised Kodak’s senior management team on software, OEM partnerships and the sale of complex solutions. In April 2014, the Board of Directors elected Mahe a senior vice president.
Mahe has more than 25 years experience in the IT industry with several multinational companies. Prior to joining Kodak, he was based in Singapore with Pitney Bowes Inc., most recently as President, Global Growth Markets, with responsibility for the company’s operations in Latin America, Asia Pacific, Middle East, Africa and emerging markets, from July 2010 until March 2014. Mahe managed this innovation-centered business from inception, and in two years, it became Pitney Bowes’s best performing operation worldwide. Mahe joined Pitney Bowes in 2007 as President, Asia Pacific, Middle East and Africa.
Previously, Mahe was Vice President and General Manager of Asia North for CA, Inc. (now called CA Technologies), with responsibility for business operations and enterprise sales in China, Hong Kong and Taiwan. He also has held sales management positions with Sun Microsystems, where he focused on OEM partnerships; Siemens Nixdorf; and Xerox.
Mahe is active in the fight against human trafficking, serving as Chairman of Friends of Thai Daughters, an organization committed to protecting young girls, and is a Director of the Mekong Club, which is dedicated to fighting the business of slavery.
Mahe earned his MBA. in Marketing and International Trade from Ecole Superieure de Commerce et d’Administration des Enterprises in Bretagne, France, in 1986.
John N. McMullen
John McMullen is Chief Financial Officer and Executive Vice President of Kodak. The Board of Directors elected McMullen to this position effective June 2014. McMullen reports to Chief Executive Officer Jeff Clarke.
McMullen is responsible for Kodak’s financial strategy and all functions within Kodak’s Finance organization. Real estate, Eastman Business Park, credit and collections, and internal audit also report to the CFO office under McMullen.
McMullen has deep knowledge of the commercial imaging and printing industries, having held a series of senior financial roles during a 32-year career from 1981 to 2013 with HP and predecessor companies Compaq Computer and DEC. His positions included Senior Vice President of Finance and Corporate Treasurer of HP from March 2007 until July 2013; Chief Financial Officer of HP’s Imaging and
Printing Group from May 2002 until March 2007; Vice President of Finance and Strategy for Compaq’s Worldwide Sales and Services Group from March 2001 to May 2002; Compaq’s Director of Investor Relations; and Controller of DEC’s Worldwide Products Division.
Since 2011, McMullen has also been a member of the Board of Directors and Audit Committee Chair of Vocera Communications, where he has played an active role in helping the company to transition and scale its finance team and control environment, especially from the time Vocera went public in March 2012.
McMullen earned a B.A. degree in Finance with a concentration in Accounting from the University of Massachusetts in 1981.
19
Effective January 1, 2015, Steven Overman is President of the Consumer and Film Division and Kodak’s Chief Marketing Officer. He reports to Chief Executive Officer Jeff Clarke.
As President of the Consumer and Film Division, Overman leads Kodak’s most consumer-facing division, with responsibility for consumer inkjet solutions, motion picture and commercial films, synthetic chemicals, and brand licensing. This division is responsible for the exploration of other potential initiatives in the consumer space.
In his Chief Marketing Officer role, Overman is responsible for leading a global, company-wide renewal of the Kodak brand to increase its power, relevance and value. He leads the strategic development and coordination of Kodak‘s brand identity; global marketing programs and activities; and communication of Kodak’s vision, strategy and progress in an integrated way to all of the company’s stakeholders. The Board of Directors elected him a Senior Vice President effective January 2015.
Overman previously served as vice president and global head of brand strategy and marketing creation for Nokia from June 2010 until April 2013. He founded Match & Candle, a consultancy supporting startups and marketing service agencies with brand strategy development in September 2013 and was there until October 2014. He also held several different leadership roles in technology companies and marketing services agencies. In those roles, his responsibilities included corporate brand strategy and execution, product and service innovation, corporate strategic initiatives, product launches and sales development. He was among the first employees at
Wired.
Early in his career, Overman was a multimedia artist whose photographic and motion picture work was exhibited at leading international galleries. He also was the director’s assistant for the 1993 Academy Award-winning film
Philadelphia,
supporting all aspects of the film’s creative development and production.
Overman is the author of
The
Conscience Economy, How a Mass Movement for Good Is Great for Business
(Bibliomotion, October 2014).
Overman is a graduate of the Rhode Island School of Design.
Eric H. Samuels
Eric Samuels was appointed Corporate Controller and Chief Accounting Officer in July 2009. Samuels previously served as the Company’s Assistant Corporate Controller and brings to his position more than 20 years of leadership experience in corporate finance and public accounting. He joined Kodak in 2004 as Director, Accounting Research and Policy. He reports to Chief Financial Officer John McMullen.
Prior to joining Kodak, Samuels had a 14-year career in public accounting during which he served as a senior manager at KPMG LLP's Department of Professional Practice (National Office) in New York City. Prior to joining KPMG in 1996, he worked in Ernst & Young's New York City office.
Samuels has a B.S. degree in business economics from the State University of New York College at Oneonta. He is a Certified Public Accountant in New York and a member of the American Institute of Certified Public Accountants.
Terry Taber joined Kodak in 1980. In January 2009, he was named Chief Technical Officer, a position he currently holds. The Board of Directors elected him a corporate vice president in December 2008, and then a senior vice president in December 2010. Effective January 1, 2015, Taber also leads our new Intellectual Property Solutions segment. He reports to Chief Executive Officer Jeff Clarke.
Taber was previously the Chief Operating Officer of Kodak’s Image Sensor Solutions (“ISS”) business, a leading developer of advanced CCD and CMOS sensors serving imaging and industrial markets. Prior to joining ISS in 2007, Taber held a series of senior positions in Kodak’s research and development and product organizations. During his 30 plus years at Kodak, Taber has been involved in new materials research, product development and commercialization, manufacturing, and executive positions in R&D and business management.
Taber’s early responsibilities included research on new synthetic materials, an area in which he holds several patents. He then became a program manager for several film products before completing the Sloan Fellows program at the Massachusetts Institute of Technology (“MIT”). He returned from MIT to become the worldwide consumer film business product manager from 1999 to 2002, and then became an Associate Director of R&D from 2002 to 2005, followed by a position as the director of Materials & Media R&D from 2005 to 2007.
Taber received a B.S. degree in Chemistry from Purdue University and a Ph.D. in Organic Chemistry from the California Institute of Technology. He also received an M.S. in General Management from MIT as a Kodak Sloan Fellow. In 2003, he was elected to the Board of Trustees at Roberts Wesleyan College and Northeastern Seminary. Taber is a Board Member of the Innovation & Material Sciences Institute and serves on the Executive Advisory Board of FIRST Rochester (For Inspiration and Recognition of Science and Technology). He also serves on the Executive Committee of the Rochester Business Alliance, and the New York State Business Council.
20
Sharon E. Underberg
Sharon Underberg has served as General Counsel, Secretary and Senior Vice President since January 2015. She is responsible for leading the company's global legal function and for providing legal guidance to senior leadership. Underberg reports to Chief Executive Officer Jeff Clarke.
Underberg has been an attorney with Kodak for over 25 years, most recently serving as Deputy General Counsel and Vice President, Legal Department from September 2014 to January 2015. For much of her tenure with Kodak, she has specialized in global commercial transactions, particularly acquisitions, divestitures, joint ventures and corporate financings. Underberg has led the legal team on numerous deals, including the completion of the acquisitions of the Kodak Polychrome Graphics and NexPress joint ventures, the divestiture of the Health Imaging business, and the spinoff of the PI / DI Business. She has advised on every major financing transaction the Company has completed in the past 15 years. In addition, Underberg was an instrumental part of the team that led the Company through its chapter 11 restructuring, providing advice on a wide range of contractual, litigation, financing, and divestiture activities.
Underberg has been a manager in the Legal Department since 2006. During this time, she led legal teams in a wide variety of substantive areas, including corporate, transactional and commercial matters worldwide. From 2004 to 2006, Underberg served as Assistant Secretary, working with the Board of Directors on matters related to corporate governance, executive compensation, and SEC reporting and disclosure matters.
Prior to joining Kodak, Underberg was an attorney in the New York City office of international law firm Fulbright & Jaworski (currently Norton Rose Fulbright).
Underberg received a B.A. degree in political science from Brandeis University and a J.D. from the University of Pennsylvania School Of Law.
|
MARKET FOR REGISTRANT’S COMMON EQUITY, RELATED STOCKHOLDER MATTERS AND ISSUER PURCHASES OF EQUITY SECURITIES
|
The Company’s common stock is listed on the New York Stock Exchange (NYSE) under the symbol “KODK.” There were 4,860 shareholders of record of common stock on February 27, 2015.
MARKET PRICE DATA
The market price data below reflects the high and low sales price of the Company’s stock since September 23, 2013 (the date the Successor Company’s common stock commenced trading).
|
2014
|
2013
|
|||||||||||||||
|
Price per share:
|
High
|
Low
|
High
|
Low
|
||||||||||||
|
1st Quarter
|
$ | 37.73 | $ | 25.46 | n/a | n/a | ||||||||||
|
2nd Quarter
|
$ | 34.94 | $ | 23.71 | n/a | n/a | ||||||||||
|
3rd Quarter
|
$ | 26.57 | $ | 20.49 | $ | 26.50 | $ | 19.25 | ||||||||
|
4th Quarter
|
$ | 23.82 | $ | 17.40 | $ | 34.71 | $ | 22.00 | ||||||||
DIVIDEND INFORMATION
No dividends were paid during 2013 or 2014.
Dividends may be restricted under Kodak’s debt agreements. Refer to Note 8, “Short-Term Borrowings and Long-Term Debt,” in the Notes to Financial Statements.
PERFORMANCE GRAPH - SHAREHOLDER RETURN
The following graph compares the performance of the Company's common stock with the performance of the Standard & Poor's (S&P) Information Technology Index and the S&P Midcap 400 Composite Stock Price Index by measuring the quarterly changes in common stock prices from September 23, 2013, plus reinvested dividends.
21
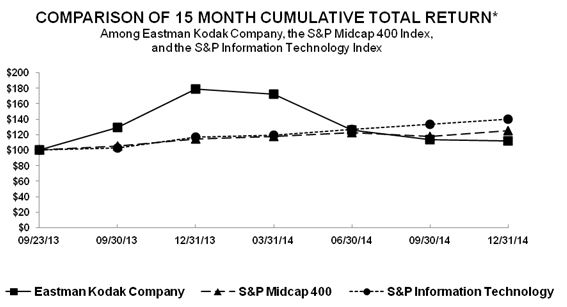
|
9/23/13
|
9/30/13
|
12/31/13
|
3/31/14
|
6/30/14
|
9/30/14
|
12/31/14
|
|
|
Eastman Kodak Company
|
100.00
|
128.87
|
178.92
|
172.16
|
126.13
|
113.25
|
111.91
|
|
S&P Midcap 400
|
100.00
|
105.21
|
113.98
|
117.44
|
122.52
|
117.64
|
125.11
|
|
S&P Information Technology
|
100.00
|
102.88
|
116.52
|
119.18
|
126.94
|
132.99
|
139.96
|
ISSUER PURCHASES OF EQUITY SECURITIES
During the third quarter of 2014, the Company purchased 44,911 shares of common stock for approximately $1 million to satisfy tax withholding obligations in connection with the vesting of restricted stock units issued to employees.
22
EASTMAN KODAK COMPANY
SUMMARY OF OPERATING DATA – UNAUDITED
|
Successor
|
Predecessor
|
||||||||||||||||||||||||||||
|
(in millions, except per share data, shareholders, and employees )
|
2014
|
September 1, 2013 through December 31, 2013
|
January 1, 2013 through August 31, 2013
(6)
|
2012
(6)
|
2011
(6)
|
2010
(6)
|
|||||||||||||||||||||||
|
Net sales from continuing operations
|
$ | 2,102 | $ | 807 | $ | 1,542 | $ | 2,719 | $ | 3,585 | $ | 4,438 | |||||||||||||||||
|
Loss (earnings) from continuing operations before interest expense, loss on extinguishment of debt, other income (charges), net, reorganization items, net, and income taxes
|
(16 | ) | (46 | ) | 457 | (642 | ) | (616 | ) | (263 | ) | ||||||||||||||||||
|
Loss (earnings) from:
|
|||||||||||||||||||||||||||||
|
Continuing operations
|
(122 | ) | (82 | ) | 2,201 | (1,337 | ) | (739 | ) | (560 | ) | ||||||||||||||||||
|
Discontinued operations
(5)
|
4 | 4 | (135 | ) | (42 | ) | (25 | ) | (128 | ) | |||||||||||||||||||
|
Net (Loss) earnings
|
(118 | ) | (78 | ) | 2,066 | (1) | (1,379 | ) | (2) | (764 | ) | (3) | (688 | ) | (4) | ||||||||||||||
|
Less: Net earnings attributable to noncontrolling interests
|
5 | 3 | - | - | - | - | |||||||||||||||||||||||
|
Net (Loss) earnings Attributable to Eastman Kodak Company
|
(123 | ) | (81 | ) | 2,066 | (1,379 | ) | (764 | ) | (688 | ) | ||||||||||||||||||
|
Earnings and Dividends
|
|||||||||||||||||||||||||||||
|
(Loss) earnings from continuing operations
|
|||||||||||||||||||||||||||||
|
- % of net sales from continuing operations
|
-5.8 | % | -10.2 | % | 142.7 | % | -49.2 | % | -20.6 | % | -12.6 | % | |||||||||||||||||
|
Net (loss) earnings
|
|||||||||||||||||||||||||||||
|
- % return on average equity
|
-25.9 | % | -12.7 | % | 70.6 | % | -45.8 | % | -44.6 | % | -124.0 | % | |||||||||||||||||
|
Basic and diluted (loss) earnings per share attributable to Eastman Kodak Company common shareholders:
|
|||||||||||||||||||||||||||||
|
Continuing operations
|
(3.05 | ) | (2.04 | ) | 8.08 | (4.92 | ) | (2.75 | ) | (2.08 | ) | ||||||||||||||||||
|
Discontinued operations
|
0.10 | 0.10 | (0.50 | ) | (0.15 | ) | (0.09 | ) | (0.48 | ) | |||||||||||||||||||
|
Total
|
(2.95 | ) | (1.94 | ) | 7.58 | (5.07 | ) | (2.84 | ) | (2.56 | ) | ||||||||||||||||||
|
Cash dividends declared and paid
|
|||||||||||||||||||||||||||||
|
- on common shares
|
- | - | - | - | - | - | |||||||||||||||||||||||
|
- per comon share
|
- | - | - | - | - | - | |||||||||||||||||||||||
|
Weighted average common shares outstanding at end of period
|
41.7 | 41.7 | 272.7 | 271.8 | 269.1 | 268.5 | |||||||||||||||||||||||
|
Shareholders at year end
|
4,860 | 1,511 | N/A | 48,656 | 49,760 | 51,802 | |||||||||||||||||||||||
|
Statement of Financial Position Data
|
|||||||||||||||||||||||||||||
|
Working capital
|
951 | 1,086 | 564 | (806 | ) | (60 | ) | 966 | |||||||||||||||||||||
|
Property, plant and equipment, net
|
524 | 684 | 507 | 607 | 796 | 1,037 | |||||||||||||||||||||||
|
Total assets
|
2,556 | 3,200 | 3,037 | 4,321 | 4,676 | 6,226 | |||||||||||||||||||||||
|
Short-term borrowings and current portion of long-term debt
|
5 | 4 | 681 | 699 | 152 | 50 | |||||||||||||||||||||||
|
Long-term debt, net of current portion
|
672 | 674 | 370 | 740 | 1,363 | 1,195 | |||||||||||||||||||||||
23
SUMMARY OF OPERATING DATA – UNAUDITED (CONT’D)
|
Successor
|
Predecessor
|
|||||||||||||||||||||||
|
2014
|
September 1, 2013 through December 31, 2013
|
January 1, 2013 through August 31, 2013
(6)
|
2012
(6)
|
2011
(6)
|
2010
(6)
|
|||||||||||||||||||
|
Supplemental Information
|
||||||||||||||||||||||||
|
Net sales from continuing operations
|
||||||||||||||||||||||||
|
Graphics, Entertainment and Commercial Films
|
$ | 1,434 | $ | 521 | $ | 987 | $ | 1,680 | $ | 2,341 | $ | 3,290 | ||||||||||||
|
Digital Printing and Enterprise
|
668 | 284 | 519 | 939 | 1,099 | 950 | ||||||||||||||||||
|
All Other
|
- | 2 | 36 | 100 | 145 | 198 | ||||||||||||||||||
|
Research and development costs
|
94 | 33 | 66 | 168 | 195 | 249 | ||||||||||||||||||
|
Depreciation
|
174 | 67 | 91 | 182 | 221 | 318 | ||||||||||||||||||
|
Employees as of year end
|
||||||||||||||||||||||||
|
- in the U.S.
|
3,200 | 3,600 | n/a | 5,980 | 8,350 | 9,600 | ||||||||||||||||||
|
- worldwide
|
7,300 | 8,800 | n/a | 13,100 | 17,100 | 18,800 | ||||||||||||||||||
* Historical results are not indicative of future results.
|
(1)
|
Includes proceeds of $535 million from the sale and licensing of certain intellectual property assets, pre-tax goodwill impairment charges of $77 million; income of $2,026 million in pre-tax reorganization items, net; and net charges of $84 million related to discrete tax items. These items increased after-tax income from continuing operations by $2.4 billion.
|
|
(2)
|
Includes $843 million in pre-tax reorganization items, net; and a net benefit of $320 million related to discrete tax items. These items increased net after-tax loss from continuing operations by $523 million.
|
|
(3)
|
Includes $69 million of income related to gains on asset sales which decreased after-tax loss from continuing operations by $69 million.
|
|
(4)
|
Includes a pre-tax goodwill impairment charge of $626 million; a $102 million loss on early extinguishment of debt; and a net benefit of $109 million related to discrete tax items. These items increased after-tax loss from continuing operations by $617 million.
|
|
(5)
|
Refer to Note 27, “Discontinued Operations” in the Notes to Financial Statements for a discussion regarding the earnings (loss) from discontinued operations.
|
|
(6)
|
Effective in the second quarter of 2013, due to the sale of the PI/DI Business to the KPP Purchasing Parties, results for 2011, 2012 and the eight months ending August 31, 2013 were restated to report the PI/DI Business as discontinued operations. Results for 2010 were not restated.
|
24
CAUTIONARY STATEMENT PURSUANT TO SAFE HARBOR PROVISIONS OF THE PRIVATE SECURITIES LITIGATION REFORM ACT OF 1995
This report on Form 10-K includes "forward–looking statements" as that term is defined under the Private Securities Litigation Reform Act of 1995.
Forward–looking statements include statements concerning Kodak’s plans, objectives, goals, strategies, future events, future revenue or performance, capital expenditures, liquidity, investments, financing needs, business trends, and other information that is not historical information. When used in this document, the words “estimates,” “expects,” “anticipates,” “projects,” “plans,” “intends,” “believes,” “predicts”, “forecasts,” or future or conditional verbs, such as “will,” “should,” “could,” or “may,” and variations of such words or similar expressions are intended to identify forward–looking statements. All forward–looking statements, including, without limitation, management’s examination of historical operating trends and data, are based upon Kodak’s expectations and various assumptions. Future events or results may differ from those anticipated or expressed in these forward-looking statements. Important factors that could cause actual events or results to differ materially from these forward-looking statements include, among others, the risks and uncertainties described in more detail in this report on Form 10–K under the headings “Business,” “Risk Factors,” “Legal Proceedings” and/or “Management’s Discussion and Analysis of Financial Condition and Results of Operations–Liquidity and Capital Resources,” and in other filings the Company makes with the SEC from time to time, as well as the following:
|
·
|
Kodak’s ability to improve and sustain its operating structure, financial results and profitability;
|
|
·
|
the ability of Kodak to achieve cash forecasts, financial projections, and projected growth;
|
|
·
|
our ability to achieve the financial and operational results contained in our business plans;
|
|
·
|
our ability to discontinue, sell or spin-off certain non-core businesses or operations;
|
|
·
|
Kodak’s ability to comply with the covenants in its credit facilities;
|
|
·
|
our ability to obtain additional financing if and as needed;
|
|
·
|
the potential adverse effects of the concluded Chapter 11 proceedings on Kodak’s brand or business prospects;
|
|
·
|
Kodak’s ability to fund continued investments, capital needs and restructuring payments and service its debt;
|
|
·
|
changes in foreign currency exchange rates, commodity prices and interest rates;
|
|
·
|
the resolution of claims against the Company;
|
|
·
|
our ability to attract and retain key executives, managers and employees;
|
|
·
|
our ability to maintain product reliability and quality and growth in relevant markets;
|
|
·
|
our ability to effectively anticipate technology trends and develop and market new products, solutions and technologies; and
|
|
·
|
the impact of the global economic environment on Kodak.
|
There may be other factors that may cause Kodak’s actual results to differ materially from the forward–looking statements. All forward–looking statements attributable to Kodak or persons acting on our behalf apply only as of the date of this report on Form 10-K and are expressly qualified in their entirety by the cautionary statements included in this document. Kodak undertakes no obligation to update or revise forward–looking statements to reflect events or circumstances that arise after the date made or to reflect the occurrence of unanticipated events.
25
The following Management’s Discussion and Analysis of Financial Condition and Results of Operations (“MD&A”) is intended to help the reader understand the results of operations and financial condition of Kodak for the year ended December 31, 2014, four months ended December 31, 2013, eight months ended August 31, 2013 and for the year ended December 31, 2012. All references to Notes relate to Notes to the Financial Statements in Item 8. “Financial Statements and Supplementary Data.”
OVERVIEW
Revenue declined $247 million (10.5%) compared to last year. The year over year revenue declines were primarily due to Entertainment Imaging and Commercial Films, as a result of lower demand due to digital substitution, and Consumer Inkjet Systems, as the size of the installed base of Kodak consumer inkjet printers continues to decline. Revenue for these businesses was 16% of the total company’s revenues in 2014 versus 21% in 2013 and 26% in 2012.
Kodak continues to invest in the growth of the Commercial Inkjet, Packaging, and Software and Solutions businesses, the commercialization of products in the Micro 3D Printing business and differentiating technologies within the price-competitive Graphics business. The Graphics business continues to represent roughly half of the company’s total revenue. A continued focus on cost reduction across the company augments investment in these growth areas to maintain improvements in sustainable profitability.
The January 1, 2015 reorganization into smaller
market-focused business divisions is intended to make the company faster-moving, more competitive and more entrepreneurial.
CRITICAL ACCOUNTING POLICIES AND ESTIMATES
The accompanying consolidated financial statements and notes to consolidated financial statements contain information that is pertinent to management’s discussion and analysis of the financial condition and results of operations. The preparation of financial statements in conformity with accounting principles generally accepted in the United States of America requires management to make estimates and assumptions that affect the reported amounts of assets, liabilities, revenue and expenses, and the related disclosure of contingent assets and liabilities.
Kodak believes that the critical accounting policies and estimates discussed below involve the most complex management judgments due to the sensitivity of the methods and assumptions necessary in determining the related asset, liability, revenue and expense amounts. Specific risks associated with these critical accounting policies are discussed throughout this MD&A, where such policies affect Kodak’s reported and expected financial results. For a detailed discussion of the application of these and other accounting policies, refer to the Notes to Financial Statements in Item 8.
Revenue Recognition
Kodak's revenue transactions include sales of products (such as components and consumables for use in Kodak and other manufacturers’ equipment, and film based products), equipment, software, services, integrated solutions, and intellectual property and brand licensing. The timing and the amount of revenue recognized depend upon a variety of factors, including the specific terms of each agreement and the nature of the deliverables and obligations. For equipment sales, revenue recognition may depend on completion of installation based on the type of equipment, level of customer specific customization and other contractual terms. In instances in which the agreement with the customer contains a customer acceptance clause, revenue is deferred until customer acceptance is obtained, provided the customer acceptance clause is considered to be substantive.
Kodak evaluates each deliverable in an arrangement to determine whether it represents a separate unit of accounting. A deliverable constitutes a separate unit of accounting when it has stand-alone value to the customer, and if the arrangement includes a general right of return relative to the delivered item(s), delivery or performance of the undelivered item(s) is considered probable and substantially in Kodak’s control. If these criteria are not met, the arrangement is accounted for as one unit of accounting and the recognition of revenue occurs upon delivery/completion or ratably as a single unit of accounting over the contractual service period.
For multiple-element arrangements, Kodak allocates to, and recognizes revenue from, the various elements based on their relative selling price, using vendor-specific objective evidence, third-party evidence, and best estimated selling price (“BESP”) in accordance with the selling price hierarchy. BESP is established by considering internal factors such as margin objectives, pricing practices and controls, customer segment pricing strategies and the product life cycle. Consideration is also given to geographies, market conditions such as competitor pricing strategies and industry technology life cycles.
Revenue allocated to an individual element is recognized when all revenue recognition criteria are met for that element. Kodak limits the amount of revenue recognized for delivered elements to the amount that is not contingent on the future delivery of products or services, future performance obligations or subject to customer-specified return or refund privileges.
At the time revenue is recognized, Kodak also records reductions to revenue for customer incentive programs. Such incentive programs include cash and volume discounts and promotional allowances. For those incentives that require the estimation of sales volumes or redemption rates, such as for volume rebates, Kodak uses historical experience and both internal and customer data to estimate the sales incentive at the time revenue is recognized. In the event that the actual results of these items differ from the estimates, adjustments to the sales incentive accruals would be recorded.
26
Valuation and Useful Lives of Long-Lived Assets, Including Goodwill and Intangible Assets
Kodak performs a test for goodwill impairment annually on October 1 and whenever events or changes in circumstances occur that would more likely than not reduce the fair value of the reporting unit below its carrying amount.
Kodak tests goodwill for impairment at a level of reporting referred to as a reporting unit. A reporting unit is an operating segment or one level below an operating segment (referred to as a component). A component of an operating segment is a reporting unit if the component constitutes a business for which discrete financial information is available and segment management regularly reviews the operating results of that component. When two or more components of an operating segment have similar economic characteristics, the components are aggregated and deemed a single reporting unit. An operating segment is deemed to be a reporting unit if all of its components are similar, if none of its components is a reporting unit, or if the segment comprises only a single component.
As of October 1, 2014, the Graphics, Entertainment and Commercial Films Segment had three goodwill reporting units: Graphics, Entertainment Imaging and Commercial Films, and Intellectual Property and Brand Licensing. The Digital Printing and Enterprise Segment had four goodwill reporting units: Digital Printing, Packaging and Functional Printing, Enterprise Services and Solutions, and Consumer Inkjet Systems.
As part of fresh start accounting, Kodak adjusted the carrying value of goodwill to $96 million which represents the reorganizational value of assets in excess of amounts allocated to identified tangible and intangible assets. Goodwill that was recorded as part of fresh start accounting was allocated to the Graphics, Packaging and Functional Printing, Intellectual Property and Brand Licensing and Consumer Inkjet Systems reporting units.
Goodwill is impaired if the fair value of a reporting unit is less than the related carrying value. Kodak may assess qualitative factors for some or all of its reporting units to determine whether it is more likely than not (that is, a likelihood of more than 50 %) that the fair value of a reporting unit is less than its carrying amount, including goodwill. If Kodak determines that it is more likely than not that a reporting unit’s fair value is less than its carrying amount, or if Kodak elects to bypass the qualitative assessment for any of its reporting units, then the fair value of that reporting unit is compared to its carrying value.
If the fair value of a reporting unit is less than its carrying value, Kodak must determine the implied fair value of the goodwill associated with that reporting unit. The implied fair value of goodwill is determined by first allocating the fair value of the reporting unit to all of its assets and liabilities and then computing the excess of the reporting unit’s fair value over the amounts assigned to the assets and liabilities. If the carrying value of goodwill exceeds the implied fair value of goodwill, such excess represents the amount of goodwill impairment charge that must be recognized.
Determining the fair value of a reporting unit involves the use of significant estimates and assumptions. The fair value of a reporting unit refers to the price that would be received to sell the unit as a whole in an orderly transaction between market participants at the measurement date. Quoted market prices in active markets are the best evidence of fair value, however the market price of an individual equity security may not be representative of the fair value of the reporting unit as a whole and, therefore need not be the sole measurement basis of the fair value of a reporting unit.
Kodak estimates the fair value of its reporting units using the guideline public company method and discounted cash flow method. To estimate fair value utilizing the guideline public company method, Kodak applies valuation multiples, derived from the operating data of publicly-traded benchmark companies, to the same operating data of the reporting units. The valuation multiples are based on financial measures of revenue and earnings before interest, taxes, depreciation and amortization (“EBITDA”). To estimate fair value utilizing the discounted cash flow method, Kodak establishes an estimate of future cash flows for each reporting unit and discounts those estimated future cash flows to present value.
Kodak estimated the fair value of each of its reporting units for its 2014 annual goodwill impairment test. Except for the Graphics reporting unit, Kodak did not use the guideline public company method because reporting unit EBITDA results were negative, which would have only allowed the application of a revenue multiple in determining fair value under the guideline public company method, and/or reporting units ranked below all the selected market participants for these financial measures. When using the guideline public company method, multiples should be derived from companies that exhibit a high degree of comparability to the business being valued. Kodak ultimately gave 100% weighting to the discounted cash flow method for these reporting units. For the Graphics reporting unit, Kodak selected equal weighting of the guideline public company method and the discounted cash flow method as the valuation approaches produced comparable ranges of fair value.
To estimate fair value utilizing the discounted cash flow method, Kodak established an estimate of future cash flows for the period ranging from October 1, 2014 to December 31, 2023 and discounted the estimated future cash flows to present value. The expected cash flows were derived from earnings forecasts and assumptions regarding growth and margin projections, as applicable. The discount rates are estimated based on an after-tax weighted average cost of capital (“WACC”) for each reporting unit reflecting the rate of return that would be expected by a market participant. The WACC also takes into consideration a company specific risk premium for each reporting unit reflecting the risk associated with the overall uncertainty of the financial projections. Discount rates of 20% to 32% were utilized in the valuation based on Kodak’s best estimates of the after-tax weighted-average cost of capital of each reporting unit.
27
A terminal value was included for all reporting units, except for the Consumer Inkjet Systems reporting unit, at the end of the cash flow projection period to reflect the remaining value that the reporting unit is expected to generate. The terminal value is calculated using the constant growth method (“CGM”) based on the cash flows of the final year of the discrete period.
Based upon the results of Kodak’s October 1, 2014 analysis, no impairment of goodwill was indicated. Impairment of goodwill could occur in the future if a reporting unit’s fair value changes significantly, if market or interest rate environments deteriorate, if a reporting unit’s carrying value changes materially compared with changes in its fair values, or as a result of changes in operating segments or reporting units.
Kodak recorded indefinite-lived intangible assets related to the Kodak trade name and in-process research and development in conjunction with fresh start accounting. The carrying values of the indefinite-lived intangible assets are evaluated for potential impairment annually on October 1 or whenever events or changes in circumstances indicate that it is more likely than not that the asset is impaired.
The fair value of the Kodak trade name, which has carrying value of $46 million, was valued using the income approach, specifically the relief from royalty method based on the following significant assumptions: (a) forecasted revenues ranging from October 1 2014 to December 31, 2023, including a terminal year with growth rates ranging from -1% to 3%; (b) royalty rates ranging from .5% to 1% of expected net sales determined with regard to comparable market transactions and profitability analysis; and (c) discount rates ranging from 23% to 41%, which were based on the after-tax weighted-average cost of capital.
Based on the results of Kodak’s October 1, 2014 assessment, no impairment of the Kodak trade name was indicated. Impairment of the Kodak trade name could occur in the future if expected revenues decline or if there are significant changes in the discount or royalty rates.
The fair value of the in-process research and development intangible asset, with a carrying value of $9 million, was valued using the income approach, specifically the multi-period excess earnings approach based on the following significant assumptions: (a) forecasted cash flows attributable to the respective research and development project for the period October 1, 2014 to December 31, 2024; and (b) discount rate of 50% based on the after-tax weighted average cost of capital adjusted for perceived risks inherent in the overall uncertainty of the financial projections.
Based on the results of Kodak’s October 1, 2014 assessment and due to the change in expected cash flows from the amounts estimated as part of fresh start accounting, Kodak concluded that the carrying value exceeded its fair value. In the fourth quarter of 2014, Kodak recorded a pre-tax impairment charge of $9 million that is included in Other operating expense (income), net in the Consolidated Statement of Operations.
Kodak’s long-lived assets other than goodwill and indefinite-lived intangible assets are evaluated for impairment whenever events or changes in circumstances indicate the carrying value may not be recoverable. When evaluating long-lived assets for impairment, Kodak compares the carrying value of an asset group to its estimated undiscounted future cash flows. An impairment is indicated if the estimated future cash flows are less than the carrying value of the asset group. The impairment is the excess of the carrying value over the fair value of the long-lived asset group.
Kodak depreciates the value of property, plant, and equipment over its expected useful life in such a way as to allocate it as equitably as possible to the periods during which services are obtained from their use, which aims to distribute the value over the remaining estimated useful life of the unit in a systematic and rational manner. An estimate of useful life not only considers the economic life of the asset, but also the remaining life of the asset to the entity. Impairment of long-lived assets other than goodwill and indefinite lived intangible assets could occur in the future if expected future cash flows decline or if there are significant changes in the estimated useful life of the assets.
Taxes
Kodak recognizes deferred tax liabilities and assets for the expected future tax consequences of operating losses, credit carry-forwards and temporary differences between the carrying amounts and tax basis of Kodak’s assets and liabilities. Kodak records a valuation allowance to reduce its net deferred tax assets to the amount that is more likely than not to be realized. Kodak has considered forecasted earnings, future taxable income, the geographical mix of earnings in the jurisdictions in which Kodak operates and prudent and feasible tax planning strategies in determining the need for these valuation allowances. As of December 31, 2014, Kodak has net deferred tax assets before valuation allowances of approximately $1,169 million and a valuation allowance related to those net deferred tax assets of approximately $1,127 million, resulting in net deferred tax assets of approximately $42 million. The net deferred tax assets can be used to offset taxable income in future periods and reduce Kodak’s income tax payable in those future periods. At this time, it is considered more likely than not that taxable income in the future will be sufficient to allow realization of these net deferred tax assets. However, if Kodak is unable to generate sufficient taxable income, then a valuation allowance to reduce net deferred tax assets may be required, which could materially increase expenses in the period the valuation allowance is recognized. Conversely, if Kodak were to make a determination that it is more likely than not that deferred tax assets, for which there is currently a valuation allowance, would be realized, the related valuation allowance would be reduced and a benefit to earnings would be recorded. Kodak considers both positive and negative evidence, in determining whether a valuation allowance is needed by territory, including, but not limited to, whether particular entities are in three year cumulative income positions.
In general, the amount of tax expense or benefit from continuing operations is determined without regard to the tax effects of other categories of income or loss, such as Other comprehensive (loss) income. However, an exception to this rule applies when there is
a loss from continuing operations and income from items outside of continuing operations that must be considered. This exception requires that income from discontinued operations, extraordinary items, and items charged or credited directly to other comprehensive income be considered in determining the amount of tax benefit that results from a loss in continuing operations. This exception affects the allocation of the tax provision amongst categories of income.
The undistributed earnings of Kodak’s foreign subsidiaries are not considered permanently reinvested. Kodak has a deferred tax liability (net of related foreign tax credits) of $159 million and $213 million on the foreign subsidiaries’ undistributed earnings as of December 31, 2014 and 2013, respectively. Kodak also has a deferred tax liability of $17 million and $23 million for the potential foreign withholding taxes on the undistributed earnings as of December 31, 2014 and 2013, respectively.
28
Kodak operates within multiple taxing jurisdictions worldwide and is subject to audit in these jurisdictions. These audits can involve complex issues, which may require an extended period of time for resolution. Management’s ongoing assessments of the outcomes of these issues and related tax positions require judgment, and although management believes that adequate provisions have been made for such issues, there is the possibility that the ultimate resolution of such issues could have an adverse effect on the earnings of Kodak. Conversely, if these issues are resolved favorably in the future, the related provisions would be reduced, thus having a positive impact on earnings.
Pension and Other Postretirement Benefits
Kodak’s defined benefit pension and other postretirement benefit costs and obligations are estimated using several key assumptions. These assumptions, which are reviewed at least annually by Kodak, include the discount rate, long-term expected rate of return on plan assets (“EROA”), salary growth, healthcare cost trend rate, mortality trends and other economic and demographic factors. Actual results that differ from Kodak’s assumptions are recorded as unrecognized gains and losses and are amortized to earnings over the estimated future service period of the active participants in the plan or, if the plan is almost entirely inactive, the average remaining lifetime expectancy of inactive participants, to the extent such total net unrecognized gains and losses exceed 10% of the greater of the plan's projected benefit obligation or the calculated value of plan assets. Significant differences in actual experience or significant changes in future assumptions would affect Kodak’s pension and other postretirement benefit costs and obligations.
Asset and liability modeling studies are utilized by Kodak to adjust asset exposures and review a liability hedging program through the use of forward-looking correlation, risk and return estimates. Those forward-looking estimates of correlation, risk and return generated from the modeling studies are also used to estimate the EROA. The EROA is estimated utilizing a forward-looking building block model factoring in the expected risk of each asset category, return and correlation over a five to seven year horizon, and weighting the exposures by the current asset allocation. Historical inputs are utilized in the forecasting model to frame the current market environment with adjustments made based on the forward-looking view. Kodak aggregates investments into major asset categories based on the underlying benchmark of the strategy. Kodak’s asset categories include broadly diversified exposure to U.S. and non-U.S. equities, U.S. and non-U.S. government and corporate bonds, inflation-linked bonds, commodities and absolute return strategies. Each allocation to these major asset categories is determined within the overall asset allocation to accomplish unique objectives, including enhancing portfolio return, providing portfolio diversification, or hedging plan liabilities.
The EROA, once set, is applied to the calculated value of plan assets in the determination of the expected return component of Kodak’s pension expense. Kodak uses a calculated value of plan assets, which recognizes gains and losses in the fair value of assets over a four-year period, to calculate expected return on assets. At December 31, 2014, the calculated value of the assets of Kodak’s major U.S. and non-U.S. defined benefit pension plans was approximately $4.6 billion and the fair value was approximately $5.0 billion. Asset gains and losses that are not yet reflected in the calculated value of plan assets are not included in amortization of unrecognized gains and losses.
Kodak reviews its EROA assumption annually. To facilitate this review, every three years, or when market conditions change materially, Kodak’s larger plans will undertake asset allocation or asset and liability modeling studies. The weighted average EROA used to determine the 2014 net pension expense for major U.S. and non-U.S. defined benefit pension plans was 7.63% and 4.88%, respectively.
Generally, Kodak bases the discount rate assumption for its significant plans on high quality corporate bond yields in the respective countries as of the measurement date. Specifically, for its U.S. and Canadian plans, Kodak determines a discount rate using a cash flow model to incorporate the expected timing of benefit payments and an AA-rated corporate bond yield curve. For Kodak's U.S. plans, the Citigroup Above Median Pension Discount Curve is used. For Kodak’s other non-U.S. plans, discount rates are determined by comparison to published local high quality bond yields or indices considering estimated plan duration and removing any outlying bonds, as warranted.
The salary growth assumptions are determined based on Kodak’s long-term actual experience and future and near-term outlook. The healthcare cost trend rate assumptions are based on historical cost and payment data, the near-term outlook and an assessment of the likely long-term trends.
29
The following table illustrates the sensitivity to a change to certain key assumptions used in the calculation of expense for the year ending December 31, 2015 and the projected benefit obligation (“PBO”) at December 31, 2014 for Kodak's major U.S. and non-U.S. defined benefit pension plans:
|
(in millions)
|
Impact on 2015
Pre-Tax Pension Expense Increase (Decrease)
|
Impact on PBO
December 31, 2014 Increase (Decrease)
|
||||||||||||||
|
U.S.
|
Non-U.S.
|
U.S.
|
Non-U.S.
|
|||||||||||||
|
Change in assumption:
|
||||||||||||||||
|
25 basis point decrease in discount rate
|
$ | 6 | $ | (1 | ) | $ | 109 | $ | 28 | |||||||
|
25 basis point increase in discount rate
|
6 | 1 | (104 | ) | (27 | ) | ||||||||||
|
25 basis point decrease in EROA
|
9 | 2 | n/a | n/a | ||||||||||||
|
25 basis point increase in EROA
|
(9 | ) | (2 | ) | n/a | n/a | ||||||||||
Total pension income from continuing operations before special termination benefits, curtailments and settlements for the major defined benefit pension plan in the U.S. was $104 million for 2014 and is expected to be approximately $115 million in 2015. Pension income from continuing operations before special termination benefits, curtailments and settlements for the major non-U.S. defined benefit pension plans was $4 million for 2014 and is projected to be approximately $15 million in 2015.
Total other postretirement benefit expense before curtailments and settlements for the major other postretirement benefit plans was $4 million in 2014 and is expected to be approximately $5 million in 2015.
Environmental Commitments
Environmental liabilities are accrued based on undiscounted estimates of known environmental remediation responsibilities. The liabilities include accruals for sites owned or leased by Kodak, sites formerly owned or leased by Kodak, and other third-party sites where Kodak was designated as a potentially responsible party (“PRP”). The amounts accrued for such sites are based on these estimates, which are determined using the ASTM Standard E 2137-06, “Standard Guide for Estimating Monetary Costs and Liabilities for Environmental Matters.” The overall method includes the use of a probabilistic model that forecasts a range of cost estimates for the remediation required at individual sites. Kodak’s estimate includes equipment and operating costs for investigations, remediation and long-term monitoring of the sites. Such estimates may be affected by changing determinations of what constitutes an environmental liability or an acceptable level of remediation. Kodak’s estimate of its environmental liabilities may also change if the proposals to regulatory agencies for desired methods and outcomes of remediation are viewed as not acceptable, or additional exposures are identified. Kodak has an ongoing monitoring process to assess how activities, with respect to the known exposures, are progressing against the accrued cost estimates.
Additionally, in many of the countries in which Kodak operates, environmental regulations exist that require Kodak to handle and dispose of asbestos in a special manner if a building undergoes major renovations or is demolished. Kodak records a liability equal to the estimated fair value of its obligation to perform asset retirement activities related to the asbestos, computed using an expected present value technique, when sufficient information exists to calculate the fair value.
Inventories
Kodak’s inventories are stated at the lower of cost or market. Carrying values of excess and obsolete inventories are reduced to net realizable value. Judgment is required to assess the ultimate demand for and realizable value of inventory. The analysis of inventory carrying values considers several factors including length of time inventory is on hand, historical sales, product shelf life, product life cycle, product category, and product obsolescence.
Accounts Receivable Reserves
Kodak establishes accounts receivable reserves based on historical collections experience as well as reserves for specific receivables deemed to be at risk for collection. The collectability of customer receivables is reviewed on an ongoing basis considering past due invoices and the current creditworthiness of each customer. Judgment is required in assessing the ultimate realization of accounts receivables.
RECENTLY ISSUED ACCOUNTING PRONOUNCEMENTS
See Note 1, “Basis of Presentation and Significant Accounting Policies,” in the Notes to Financial Statements in Item 8.
30
KODAK OPERATING MODEL AND REPORTING STRUCTURE
Kodak has two reportable segments: the Graphics, Entertainment and Commercial Films Segment and the Digital Printing and Enterprise Segment. The balance of Kodak’s continuing operations, which do not meet the criteria of a reportable segment, are reported in All Other. Within each of Kodak’s reportable segments are various components, or Strategic Product Groups (“SPGs”). Throughout the remainder of this document, references to the segments’ SPGs are indicated in italics.
Graphics, Entertainment and Commercial Films Segment (“GECF”):
The Graphics, Entertainment and Commercial Films Segment consists of three SPGs,
Graphics
,
Entertainment & Commercial Films,
and
Intellectual Property & Brand Licensing
.
Digital Printing and Enterprise Segment (“DP&E”):
The Digital Printing and Enterprise Segment consists of four SPGs,
Digital Printing
,
Packaging and Functional Printing
,
Enterprise Services & Solution
s
,
and
Consumer Inkjet Systems
.
All Other:
All Other is composed of Kodak’s consumer film business and a utilities variable interest entity. Effective August 31, 2013, the Company sold certain utilities and related facilities and entered into utilities supply and servicing arrangements with RED, a variable interest entity.
DETAILED RESULTS OF OPERATIONS
Net Sales from Continuing Operations by Reportable Segment
(1)
|
Successor
|
Predecessor
|
Predecessor
|
||||||||||||||||||||||||||||||
|
(in millions)
|
Year Ended
December 31, 2014
|
Four Months Ended December 31, 2013
|
Eight Months Ended August 31, 2013
|
2014 Change vs. 2013 (Combined)
|
Foreign Currency Impact*
|
Year Ended
December 31, 2012
|
2013 (Combined) Change vs. 2012
|
Foreign Currency Impact*
|
||||||||||||||||||||||||
|
Graphics, Entertainment and Commercial Films
|
||||||||||||||||||||||||||||||||
|
Inside the U.S.
|
$ | 413 | $ | 117 | $ | 265 | 8 | % | 0 | % | $ | 384 | (1 | %) | 0 | % | ||||||||||||||||
|
Outside the U.S.
|
1,021 | 404 | 722 | (9 | %) | (1 | %) | 1,296 | (13 | %) | (2 | %) | ||||||||||||||||||||
|
Total Graphics, Entertainment and Commercial Films
|
$ | 1,434 | $ | 521 | $ | 987 | (5 | %) | (1 | %) | $ | 1,680 | (10 | %) | (1 | %) | ||||||||||||||||
|
Digital Printing and Enterprise
|
||||||||||||||||||||||||||||||||
|
Inside the U.S.
|
$ | 299 | $ | 121 | $ | 239 | (17 | %) | 0 | % | $ | 431 | (16 | %) | 0 | % | ||||||||||||||||
|
Outside the U.S.
|
369 | 163 | 280 | (17 | %) | (1 | %) | 508 | (13 | %) | (2 | %) | ||||||||||||||||||||
|
Total Digital Printing and Enterprise
|
$ | 668 | $ | 284 | $ | 519 | (17 | %) | (1 | %) | $ | 939 | (14 | %) | (1 | %) | ||||||||||||||||
|
All Other
|
||||||||||||||||||||||||||||||||
|
Inside the U.S.
|
$ | - | $ | - | $ | 11 | (100 | %) | 0 | % | $ | 37 | (70 | %) | 0 | % | ||||||||||||||||
|
Outside the U.S.
|
- | 2 | 25 | (100 | %) | 0 | % | 63 | (57 | %) | (2 | %) | ||||||||||||||||||||
|
Total All Other
|
$ | - | $ | 2 | $ | 36 | (100 | %) | 0 | % | $ | 100 | (62 | %) | (1 | %) | ||||||||||||||||
|
Consolidated
|
||||||||||||||||||||||||||||||||
|
Inside the U.S.
|
$ | 712 | $ | 238 | $ | 515 | (5 | %) | 0 | % | $ | 852 | (12 | %) | 0 | % | ||||||||||||||||
|
Outside the U.S.
|
1,390 | 569 | 1,027 | (13 | %) | (1 | %) | 1,867 | (15 | %) | (2 | %) | ||||||||||||||||||||
|
Total Consolidated
|
$ | 2,102 | $ | 807 | $ | 1,542 | (11 | %) | (1 | %) | $ | 2,719 | (14 | %) | (1 | %) | ||||||||||||||||
(1)
Sales are reported based on the geographic area of destination.
* Represents the percentage change in segment net sales for the period that is attributable to foreign currency fluctuations.
31
Segment (Loss) Earnings and Consolidated (Loss) Earnings from Continuing Operations Before Income Taxes
|
Successor
|
Predecessor
|
Predecessor
|
||||||||||||||||||
|
(in millions)
|
Year Ended
December 31, 2014
|
Four Months Ended
December 31, 2013
|
Eight Months Ended
August 31, 2013
|
Change vs. 2013 (Combined)
|
Year Ended
December 31, 2012
|
|||||||||||||||
|
Graphics, Entertainment and Commercial Films
|
$ | 31 | $ | (35 | ) | $ | 5 | 203 | % | $ | (210 | ) | ||||||||
|
Digital Printing and Enterprise
|
(77 | ) | (59 | ) | (37 | ) | 20 | % | (280 | ) | ||||||||||
|
Total segment (loss) earnings
|
(46 | ) | (94 | ) | (32 | ) | 63 | % | (490 | ) | ||||||||||
|
All Other
|
(10 | ) | (3 | ) | - | (3 | ) | |||||||||||||
|
Restructuring costs and other
|
(61 | ) | (17 | ) | (49 | ) | (232 | ) | ||||||||||||
|
Corporate components of pension and OPEB income (expense)
(1)
|
110 | 67 | 43 | (2 | ) | |||||||||||||||
|
Other operating (expense) income, net
|
(9 | ) | (2 | ) | 495 | 86 | ||||||||||||||
|
Legal contingencies, settlements and other
|
(4 | ) | 3 | - | (1 | ) | ||||||||||||||
|
Loss on early extinguishment of debt, net
|
- | - | (8 | ) | (7 | ) | ||||||||||||||
|
Interest expense
|
(62 | ) | (22 | ) | (106 | ) | (139 | ) | ||||||||||||
|
Other (charges) income, net
|
(17 | ) | 10 | (13 | ) | 21 | ||||||||||||||
|
Reorganization items, net
|
(13 | ) | (16 | ) | 2,026 | (843 | ) | |||||||||||||
|
Consolidated (loss) earnings from continuing operations before income taxes
|
$ | (112 | ) | $ | (74 | ) | $ | 2,356 | (105 | %) | $ | (1,610 | ) | |||||||
|
(1)
|
Composed of interest cost, expected return on plan assets, amortization of actuarial gains and losses, amortization of prior service credits related to the U.S. Postretirement Benefit Plan and special termination benefits, curtailments and settlement components of pension and other postretirement benefit expenses, except for settlements in connection with the chapter 11 bankruptcy proceedings that are recorded in Reorganization items, net and curtailments and settlements included in Earnings (loss) from discontinued operations, net of income taxes in the Consolidated Statement of Operations.
|
32
RESULTS OF OPERATIONS
CONSOLIDATED
|
Successor
|
Predecessor
|
Predecessor
|
||||||||||||||||||||||||||||||||||
|
(in millions)
|
Year Ended
December 31, 2014
|
% of Sales
|
Four Months Ended December 31, 2013
|
Eight Months Ended August 31, 2013
|
% of Sales (Combined)
|
% Change vs. 2013 (Combined)
|
Year Ended
December 31, 2012
|
% of Sales
|
% Change vs. 2012 (2013 Combined)
|
|||||||||||||||||||||||||||
|
Net sales
|
$ | 2,102 | $ | 807 | $ | 1,542 | (11 | %) | $ | 2,719 | (14 | %) | ||||||||||||||||||||||||
|
Cost of sales
|
1,646 | 687 | 1,174 | 2,426 | ||||||||||||||||||||||||||||||||
|
Gross profit
|
456 | 22 | % | 120 | 368 | 21 | % | (7 | %) | 293 | 11 | % | 67 | % | ||||||||||||||||||||||
|
Selling, general and administrative expenses
|
310 | 15 | % | 114 | 297 | 17 | % | (25 | %) | 637 | 23 | % | (35 | %) | ||||||||||||||||||||||
|
Research and development costs
|
94 | 4 | % | 33 | 66 | 4 | % | (5 | %) | 168 | 6 | % | (41 | %) | ||||||||||||||||||||||
|
Restructuring costs and other
|
59 | 3 | % | 17 | 43 | 3 | % | (2 | %) | 215 | 8 | % | (72 | %) | ||||||||||||||||||||||
|
Other operating expense (income), net
|
9 | (0 | %) | 2 | (495 | ) | 21 | % | (102 | %) | (85 | ) | 3 | % | 480 | % | ||||||||||||||||||||
|
(Loss) earnings from continuing operations before interest expense, loss on early extinguishment of debt, net, other (charges) income, net, reorganization items, net and income taxes
|
(16 | ) | 1 | % | (46 | ) | 457 | 17 | % | (104 | %) | (642 | ) | (24 | %) | (164 | %) | |||||||||||||||||||
|
Interest expense
|
62 | 3 | % | 22 | 106 | 5 | % | (52 | %) | 139 | 5 | % | (8 | %) | ||||||||||||||||||||||
|
Loss on early extinguishment of debt, net
|
- | - | 8 | 0 | % | 7 | 0 | % | ||||||||||||||||||||||||||||
|
Other (charges) income, net
|
(21 | ) | 1 | % | 10 | (13 | ) | 0 | % | 600 | % | 21 | 1 | % | (114 | %) | ||||||||||||||||||||
|
Reorganization items, net
|
13 | 1 | % | 16 | (2,026 | ) | 86 | % | (101 | %) | 843 | 31 | % | (338 | %) | |||||||||||||||||||||
|
(Loss) earnings from continuing operations before income taxes
|
(112 | ) | (5 | %) | (74 | ) | 2,356 | 97 | % | (105 | %) | (1,610 | ) | (59 | %) | 242 | % | |||||||||||||||||||
|
Provision (benefit) for income taxes
|
10 | 0 | % | 8 | 155 | 7 | % | (94 | %) | (273 | ) | (10 | %) | (160 | %) | |||||||||||||||||||||
|
(Loss) earnings from continuing operations
|
(122 | ) | (6 | %) | (82 | ) | 2,201 | 90 | % | (106 | %) | (1,337 | ) | (49 | %) | 258 | % | |||||||||||||||||||
|
Earnings (loss) from discontinued operations, net of income taxes
|
4 | 0 | % | 4 | (135 | ) | (6 | %) | (103 | %) | (42 | ) | (2 | %) | 212 | % | ||||||||||||||||||||
|
NET (LOSS) EARNINGS
|
(118 | ) | (6 | %) | (78 | ) | 2,066 | 85 | % | (106 | %) | (1,379 | ) | (51 | %) | 244 | % | |||||||||||||||||||
|
Less: Net income attributable to noncontrolling interests
|
5 | 0 | % | 3 | - | 0 | % | - | - | - | ||||||||||||||||||||||||||
|
NET (LOSS) EARNINGS ATTRIBUTABLE TO EASTMAN KODAK COMPANY
|
$ | (123 | ) | (6 | %) | $ | (81 | ) | $ | 2,066 | 85 | % | (106 | %) | $ | (1,379 | ) | (51 | %) | 244 | % | |||||||||||||||
33
|
Year Ended December 31,
|
Percent Change vs. 2013 (Combined)
|
|||||||||||||||||||||||
|
(in millions)
|
2014
(Successor)
|
Change vs. 2013 (Combined)
|
Volume
|
Price/Mix
|
Foreign Exchange
|
Manufacturing and Other Costs
|
||||||||||||||||||
|
Net Sales
|
$ | 2,102 | -11 | % | -10 | % | 0 | % | -1 | % | n/a | |||||||||||||
|
Gross profit margin
|
22 | % |
1pp
|
n/a |
-1pp
|
0pp
|
2pp
|
|||||||||||||||||
|
Year Ended December 31,
|
Percent Change vs. 2012
|
|||||||||||||||||||||||
|
(in millions)
|
2013 (Combined)
|
Change vs. 2012 (Predecessor)
|
Volume
|
Price/Mix
|
Foreign Exchange
|
Manufacturing and Other Costs
|
||||||||||||||||||
|
Net Sales
|
$ | 2,349 | -14 | % | -17 | % | 4 | % | -1 | % | n/a | |||||||||||||
|
Gross profit margin
|
21 | % |
10pp
|
n/a |
8pp
|
-1pp
|
3pp
|
|||||||||||||||||
34
Revenues
Current Year
For the year ended December 31, 2014, revenues decreased approximately 11% compared with the same period in 2013, primarily due to volume declines in
Entertainment Imaging and Commercial Films
(-4%),
Consumer Inkjet Systems
(-3%) and
Digital Printing
(-2%). Also contributing to the decline was unfavorable foreign exchange (-1%) and unfavorable price/mix (-1%) within
Graphics
. Partially offsetting these declines was favorable price/mix within
Intellectual Property and Brand Licensing
(+1%). See segment discussions below for additional information.
Included in revenues were non-recurring intellectual property licensing agreements. Such agreements contributed approximately $70 million to revenues in 2014 and $40 million in 2013.
Prior Year
For the year ended December 31, 2013, net sales decreased approximately 14% compared with the same period in 2012 primarily due to volume declines in each segment, partially offset by favorable price/mix within
Intellectual Property and Brand Licensing (+3%)
and
Entertainment Imaging and Commercial Films
(+2%). The impact of the application of fresh start accounting was not material. See segment discussions below for additional information.
Included in revenues were non-recurring intellectual property licensing agreements. Such agreements contributed approximately $40 million to revenues in 2013. There were no significant non-recurring intellectual property licensing agreements in 2012. However, there was a $61 million license revenue reduction reflecting sharing, with licensees, of the withholding tax refund received in 2012 (refer to Note 14, “Income Taxes” for additional information).
Gross Profit
Current Year
The increase in gross profit percent from 2013 to 2014 was driven by favorable manufacturing and other costs due to the revaluation of inventory from the application of fresh start accounting impacting the prior year. Unfavorable price/mix within
Consumer Inkjet Systems
(-1pp) and
Graphics
(-1pp) was partially offset by favorable price/mix within
Intellectual Property and Brand Licensing
(+1pp). See segment discussions below for additional details.
Prior Year
The increase in gross profit percent from 2012 to 2013 was due to favorable price/mix in the Graphics, Entertainment and Commercial Films Segment (+4pp) primarily from intellectual property licensing and the Digital Printing and Enterprise Segment (+3pp). Also contributing to the increase was a reduction in pension and other postretirement benefit costs in the current year (+3pp) and other cost improvements from each segment (+3pp) partially offset by increased manufacturing and other costs due to the revaluation of inventory from the application of fresh start accounting (-3pp). See segment discussions below for additional details.
Selling, General and Administrative Expenses
The decreases in consolidated selling, general and administrative expenses (SG&A) from 2013 to 2014 and from 2012 to 2013 were the result of cost reduction actions. For 2012 to 2013 this included the change in strategy for
Consumer Inkjet Systems
.
Research and Development Costs
The decrease in consolidated R&D from 2013 to 2014 was driven by a reduction in pension and other postretirement benefit costs in the current year.
The decrease in consolidated research and development costs (R&D) from 2012 to 2013 was primarily attributable to cost reduction actions resulting from focusing development activities on core products and certain products reaching the commercialization stage.
Restructuring Costs and Other
These costs, as well as the restructuring costs reported in Cost of revenues, are discussed under the "RESTRUCTURING COSTS AND OTHER" section in this MD&A.
Other Operating Expense (Income), Net
For details, refer to Note 12, “Other Operating Expense (Income), Net.”
Other (Charges) Income, Net
For details, refer to Note 13, “Other (Charges) Income, Net.”
35
Reorganization Items, Net
For details, refer to Note 26, “Reorganization Items, Net.”
Income Tax Provision (Benefit)
|
(in millions)
|
Successor
|
Predecessor
|
||||||||||||||
|
Year Ended December 31, 2014
|
Four Months Ended December 31, 2013
|
Eight Months Ended
August 31,
2013
|
Year Ended December 31, 2012
|
|||||||||||||
|
(Loss) earnings from continuing operations before income taxes
|
$ | (112 | ) | $ | (74 | ) | $ | 2,356 | $ | (1,610 | ) | |||||
|
Provision (benefit) for income taxes
|
10 | 8 | 155 | (273 | ) | |||||||||||
|
Effective tax rate
|
(9 | %) | (11 | %) | 7 | % | 17 | % | ||||||||
|
(Benefit) provision for income taxes @ 35%
|
(39 | ) | (25 | ) | 825 | (564 | ) | |||||||||
|
Difference between tax @ effective vs statutory rate
|
49 | 33 | (670 | ) | 291 | |||||||||||
|
(in millions)
|
Year Ended December 31,
|
|||||||||||
|
2014
|
2013
(Combined)
|
2012
|
||||||||||
|
(Loss) earnings from continuing operations before income taxes
|
$ | (112 | ) | $ | 2,282 | $ | (1,610 | ) | ||||
|
Provision (benefit) for income taxes
|
10 | 163 | (273 | ) | ||||||||
|
Effective tax rate
|
(9 | %) | 7 | % | 17 | % | ||||||
|
(Benefit) provision for income taxes @ 35%
|
(39 | ) | 799 | (564 | ) | |||||||
|
Difference between tax @ effective vs statutory rate
|
49 | (636 | ) | 291 | ||||||||
Current Year
The change in Kodak’s effective tax rate from continuing operations for 2014 as compared to 2013 is primarily attributable to: (1) a provision as a result of losses generated within the U.S. for which no benefit was recognized, partially offset by a benefit as a result of income in certain jurisdictions outside the U.S. for which no provision was recognized due to management’s conclusion that it was more likely than not that the tax benefits would not be realized in the twelve months ending December 31, 2014, (2) a benefit as a result of income within the U.S. and in certain jurisdictions outside the U.S. for which no provision was recognized due to management’s conclusion that it was more likely than not that the tax benefits would not be realized in the combined year to date period ended December 31, 2013, (3) a provision as a result of the establishment of a deferred tax asset valuation allowance in certain jurisdictions outside the U.S. in the combined year to date period ended December 31, 2013, (4) a benefit as a result of tax accounting impacts related to items reported in Accumulated other comprehensive income in the Consolidated Statement of Financial Position as of December 31, 2013, (5) a benefit associated with the tax impact of the goodwill impairment recognized in the combined year to date period ended December 31, 2013, (6) a provision associated with withholding taxes on foreign dividends paid in the combined year to date period ended December 31, 2013, (7) an decrease associated with foreign withholding taxes on undistributed earnings, (8) a provision associated with withholding taxes on the sale of intellectual property in the combined year to date period ended December 31, 2013, (9) a benefit as a result of Kodak reaching a settlement with a taxing authority in a location outside the U.S. related to withholding taxes in the twelve months ended December 31, 2014 and (10) a benefit as a result of Kodak reaching an settlement in a location outside the U.S. for the period ended December 31, 2014.
36
Prior Year
The change in Kodak’s effective tax rate from continuing operations for 2013 as compared to 2012 is primarily attributable to: (1) a decrease as a result of income generated in the U.S., for which no provision was recognized, partially offset by an increase as a result of losses in certain jurisdictions outside the U.S. for which no benefit was recognized due to management’s conclusion that it was more likely than not that the tax benefits would not be realized, (2) a benefit as a result of Kodak reaching a settlement with a taxing authority in a location outside the U.S. in the twelve months ended December 31, 2012, (3) an increase as a result of the establishment of a deferred tax asset valuation allowance in certain jurisdictions outside the U.S., (4) a benefit associated with the tax impact of the impairment of goodwill and intangibles recognized in the twelve months ended December 31, 2013, (5) a decrease as a result of a legislative tax rate change in a jurisdiction outside the U.S., (6) a provision as a result of withholding taxes on foreign dividends in the twelve months ended December 31, 2013, (7) an increase as a result of tax accounting impacts related to items reported in Accumulated other comprehensive loss in the Consolidated Statement of Financial Position, (8) a provision as a result of withholding taxes on the sale of intellectual property in the twelve months ended December 31, 2013
,
(9) a decrease associated with foreign withholding taxes on undistributed earnings, and (10) a benefit as a result of Kodak reaching a settlement with taxing authorities outside the U.S. in the twelve months ended December 31, 2012
.
Discontinued Operations
Discontinued operations of Kodak include the Personalized and Document Imaging businesses, digital capture and devices business, Kodak Gallery, and other miscellaneous businesses. For details, refer to Note 27, “Discontinued Operations” for additional information.
37
GRAPHICS, ENTERTAINMENT AND COMMERCIAL FILMS
|
Successor
|
Predecessor
|
Predecessor
|
||||||||||||||||||||||||||||||||||
|
(in millions)
|
Year Ended December 31, 2014
|
% of Sales
|
Four Months Ended
December 31,
2013
|
Eight Months Ended August 31, 2013
|
% of Sales (Combined)
|
2014 Change vs. 2013 (Combined)
|
Year Ended December 31, 2012
|
% of Sales
|
2013 (Combined) Change vs. 2012
|
|||||||||||||||||||||||||||
|
Net sales
|
$ | 1,434 | $ | 521 | $ | 987 | (5 | %) | $ | 1,680 | (10 | %) | ||||||||||||||||||||||||
|
Cost of sales
|
1,192 | 472 | 805 | (7 | %) | 1,509 | (15 | %) | ||||||||||||||||||||||||||||
|
Gross profit
|
242 | 17 | % | 49 | 182 | 15 | % | 5 | % | 171 | 10 | % | 35 | % | ||||||||||||||||||||||
|
Selling, general and administrative expenses
|
190 | 13 | % | 77 | 164 | 16 | % | (21 | %) | 341 | 20 | % | (29 | %) | ||||||||||||||||||||||
|
Research and development costs
|
21 | 1 | % | 7 | 13 | 1 | % | 5 | % | 40 | 2 | % | (50 | %) | ||||||||||||||||||||||
|
Segment earnings (loss)
|
$ | 31 | 2 | % | $ | (35 | ) | $ | 5 | (2 | %) | 203 | % | $ | (210 | ) | (13 | %) | (86 | %) | ||||||||||||||||
|
Year Ended December 31,
|
Percent Change vs. 2013 (Combined)
|
|||||||||||||||||||||||
|
(in millions)
|
2014
(Successor)
|
Change vs. 2013 (Combined)
|
Volume
|
Price/Mix
|
Foreign Exchange
|
Manufacturing and Other Costs
|
||||||||||||||||||
|
Net Sales
|
$ | 1,434 | -5 | % | -5 | % | 1 | % | -1 | % | n/a | |||||||||||||
|
Gross profit margin
|
17 | % |
2pp
|
n/a |
0pp
|
0pp
|
2pp
|
|||||||||||||||||
|
Year Ended December 31,
|
Percent Change vs. 2012
|
|||||||||||||||||||||||
|
(in millions)
|
2013
(Combined)
|
Change vs. 2012 (Predecessor)
|
Volume
|
Price/Mix
|
Foreign Exchange
|
Manufacturing and Other Costs
|
||||||||||||||||||
|
Net Sales
|
$ | 1,508 | -10 | % | -16 | % | 7 | % | -1 | % | n/a | |||||||||||||
|
Gross profit margin
|
15 | % |
5pp
|
n/a |
6pp
|
-1pp
|
0pp
|
|||||||||||||||||
Revenues
Current Year
The decrease in the Graphics, Entertainment and Commercial Films Segment revenues of approximately 5% for the year ended December 31, 2014 reflected volume declines within
Entertainment Imaging & Commercial Films
driven by reduced demand for motion picture products (-9%) which was partially offset by increased revenues from third party manufacturing services performed under supply
agreements with Kodak Alaris (+3%). Higher revenues within
Intellectual Property and Brand Licensing
(+2%) were partially offset by unfavorable price/mix within
Graphics
(-2%), largely attributable to pricing pressures in the industry.
Included in revenues were non-recurring intellectual property licensing agreements. Such agreements contributed approximately $70 million to revenues in 2014 and $40 million in 2013.
38
Prior Year
The decrease in the Graphics, Entertainment and Commercial Films Segment net sales of approximately 10% for the year ended December 31, 2013 was primarily due to volume declines within
Entertainment Imaging & Commercial Films
(-9%), largely attributable to reduced demand from movie studios, and within
Graphics
(-7%), largely attributable to lower demand for digital plates. Also contributing to the decline was unfavorable price/mix within
Graphics
(-2%) due to pricing pressures in the industry. Partially offsetting these declines was favorable price/mix within
Intellectual Property and Brand Licensing
(+6%) due to non-recurring intellectual property licensing agreements and within
Entertainment Imaging and Commercial Films
(+3%) due to pricing actions impacting the current year. The impact of the application of fresh start accounting was not material.
Included in revenues were non-recurring intellectual property licensing agreements. Such agreements contributed approximately $40 million to revenues in 2013. There were no significant non-recurring intellectual property licensing agreements in 2012. However, there was a $61 million licensing revenue reduction reflecting sharing, with licensees, of the withholding tax refund received in 2012 (refer to Note 14, “Income Taxes” for additional information).
Gross Profit
Current Year
The increase in Graphics, Entertainment and Commercial Films Segment gross profit percent for the year ended December 31, 2014 was primarily driven by favorable manufacturing and other costs within
Graphics
(+5pp), due to the revaluation of inventory from the application of fresh start accounting impacting the prior year period (+2pp) with the remainder primarily due to productivity improvements (+1pp) and lower aluminum cost (+1pp). Partially offsetting this improvement was unfavorable manufacturing and other costs within Entertainment Imaging & Commercial Films (-3pp), primarily due to lower production volumes. Additionally, favorable price/mix within
Intellectual Property and Brand Licensing
(+2pp) due to the arrangements mentioned above offset unfavorable price/mix within
Graphics
(-2pp)
due to pricing pressures in the industry.
Prior Year
The increase in the Graphics, Entertainment and Commercial Films Segment gross profit percent for the year ended December 31, 2013 was primarily driven by favorable price/mix within
Intellectual Property and Brand Licensing
(+5pp). Also contributing to the improvement was favorable price/mix within
Entertainment Imaging & Commercial Films
(+2pp) driven by the impact of pricing actions as noted above, and manufacturing and other cost improvements within
Graphics
(+4pp) due to productivity improvement initiatives. Partially offsetting these improvements was unfavorable price/mix within
Graphics
(-2pp) due to pricing pressures in the industry, and increased manufacturing and others costs within
Entertainment Imaging & Commercial Films
(-2pp) driven by lower production volumes. Manufacturing and other costs were also negatively impacted by the revaluation of inventory from the application of fresh start accounting (-2pp).
Selling, General and Administrative Expenses
The decreases in SG&A from 2013 to 2014 and 2012 to 2013 were primarily the result of cost reduction actions.
Research and Development Costs
The decrease in R&D from 2012 to 2013 was primarily attributable to cost reduction actions resulting from focused development activities on core products.
DIGITAL PRINTING AND ENTERPRISE
|
Successor
|
Predecessor
|
Predecessor
|
||||||||||||||||||||||||||||||||||
|
(in millions)
|
Year Ended December 31, 2014
|
% of Sales
|
Four Months Ended
December 31,
2013
|
Eight Months Ended August 31,
2013
|
% of Sales (Combined)
|
2014 Change vs. 2013 (Combined)
|
Year Ended December 31, 2012
|
% of Sales
|
2013 (Combined) Change vs. 2012
|
|||||||||||||||||||||||||||
|
Net sales
|
$ | 668 | $ | 284 | $ | 519 | (17 | %) | $ | 939 | (14 | %) | ||||||||||||||||||||||||
|
Cost of sales
|
504 | 243 | 373 | (18 | %) | 813 | (24 | %) | ||||||||||||||||||||||||||||
|
Gross profit
|
164 | 25 | % | 41 | 146 | 23 | % | (12 | %) | 126 | 13 | % | 48 | % | ||||||||||||||||||||||
|
Selling, general and administrative expenses
|
153 | 23 | % | 67 | 128 | 24 | % | (22 | %) | 274 | 29 | % | (29 | %) | ||||||||||||||||||||||
|
Research and development costs
|
88 | 13 | % | 33 | 55 | 11 | % | - | 132 | 14 | % | (33 | %) | |||||||||||||||||||||||
|
Segment loss
|
$ | (77 | ) | (12 | %) | $ | (59 | ) | $ | (37 | ) | (12 | %) | 20 | % | $ | (280 | ) | (30 | %) | 66 | % | ||||||||||||||
|
Year Ended December 31,
|
Percent Change vs. 2013 (Combined)
|
|||||||||||||||||||||||
|
(in millions)
|
2014
(Successor)
|
Change vs. 2013 (Combined)
|
Volume
|
Price/Mix
|
Foreign Exchange
|
Manufacturing and Other Costs
|
||||||||||||||||||
|
Net Sales
|
$ | 668 | -17 | % | -15 | % | -1 | % | -1 | % | n/a | |||||||||||||
|
Gross profit margin
|
25 | % |
2pp
|
n/a |
-3pp
|
0pp
|
5pp
|
|||||||||||||||||
|
Year Ended December 31,
|
Percent Change vs. 2012
|
|||||||||||||||||||||||
|
(in millions)
|
2013 (Combined)
|
Change vs. 2012 (Predecessor)
|
Volume
|
Price/Mix
|
Foreign Exchange
|
Manufacturing and Other Costs
|
||||||||||||||||||
|
Net Sales
|
$ | 803 | -14 | % | -13 | % | 0 | % | -1 | % | n/a | |||||||||||||
|
Gross profit margin
|
23 | % |
10pp
|
n/a |
11pp
|
0pp
|
-1pp
|
|||||||||||||||||
Revenues
Current Year
The decrease in the Digital Printing and Enterprise Segment revenues of approximately 17% for the year ended December 31, 2014 was primarily attributable to volume declines within
Consumer Inkjet Systems
(-9%), driven by lower sales of ink to the existing installed base of printers, and within
Digital Printing
(-6%) driven by fewer placements of continuous inkjet components and electrophotographic units and related consumables. Also contributing to the decline was unfavorable price/mix within Digital Printing (-2pp) due to pricing declines on electrophotographic color annuities, and lower revenues within
Enterprise Services & Solution
s
(-2%) due to a reduction in government contracts as well as divested operations. Partially offsetting these declines were volume improvements within
Packaging and Functional Printing
(+2%) from increased sales of Flexcel NX plates largely attributable to a larger installed base of Flexcel NX equipment.
Prior Year
The decrease in the Digital Printing and Enterprise Segment net sales of approximately 14% for the year ended December 31, 2013 was primarily attributable to volume declines within
Consumer Inkjet Systems
, driven by lower consumer printer sales, due to the discontinuance of printer production (-7%), and lower sales of ink to the existing installed base of printers (-6%). The impact of the application of fresh start accounting was not material.
39
Gross Profit
Current Year
The increase in the Digital Printing and Enterprise Segment gross profit percent for the year ended December 31, 2014 was primarily due to improvements in manufacturing and other costs due to the prior year being adversely impacted by the revaluation of inventory from the application of fresh start accounting (+4pp). This was offset by consumer ink sales constituting a lower percentage of the segment’s gross profit dollars (-4pp).
Prior Year
The increase in the Digital Printing and Enterprise Segment gross profit percent for year ended December 31, 2013 was primarily due to favorable price/mix within
Consumer Inkjet Systems
due to a greater proportion of consumer ink sales in the current year (+10pp). Increased manufacturing and other costs due to the revaluation of inventory from the application of fresh start accounting (-5pp) was largely offset by cost reductions within
Digital Printing
(+3pp) due to increase in scale and productivity improvement initiatives.
Selling, General and Administrative Expenses
The decreases in SG&A from 2013 to 2014 and 2012 to 2013 were the result of cost reduction actions. For 2012 to 2013 this included the change in strategy for
Consumer Inkjet Systems
.
Research and Development Costs
The decrease in R&D from 2012 to 2013
was primarily attributable to cost reduction actions resulting from focusing development activities on core products and certain products reaching the commercialization stage.
RESTRUCTURING COSTS AND OTHER
2014
Restructuring actions taken in 2014 included steps toward exiting a plate manufacturing facility in the UK, as described in further detail below. In addition, actions were initiated to reduce Kodak’s cost structure as part of its commitment to drive sustainable profitability and included a workforce reduction in France, manufacturing capacity reductions in the U.S., a research and development site consolidation in the U.S., and various targeted reductions in service, sales, research and development and other administrative functions.
As a result of these actions, for the year ended December 31, 2014 Kodak recorded $61 million of charges, including $2 million for accelerated depreciation which were reported in Cost of revenues and $59 million which were reported as Restructuring costs and other in the accompanying Consolidated Statement of Operations.
The Company made cash payments related to restructuring of approximately $52 million for the year ended December 31, 2014.
The restructuring actions implemented in 2014 are expected to generate future annual cash savings of approximately $77 million. These savings are expected to reduce future annual Cost of revenues, SG&A and R&D expenses by $29 million, $38 million and $10 million, respectively. Kodak expects the majority of the annual savings to be in effect by the end of 2015 as actions are completed.
Leeds Plate Manufacturing Facility Exit
On March 3, 2014, Kodak announced a plan to exit its prepress plate manufacturing facility located in Leeds, England. This decision was pursuant to Kodak’s initiative to consolidate manufacturing operations globally, and is expected to result in a more efficient delivery of its products and solutions. Kodak began the exit of the facility in the second quarter of 2014, and expects to phase out production at the site from mid-to-late 2015 and to complete the exit of the facility by the second quarter of 2016.
As a result of the decision, Kodak originally expected to incur total charges of $30 to $40 million, including $8 to $10 million of charges related to separation benefits, $20 to $25 million of non-cash related charges for accelerated depreciation and asset write-offs and $2 to $5 million in other cash related charges associated with this action. Based on refinements in estimates, Kodak now expects to incur total charges of $20 to $30 million, including $10 to $15 million of non-cash related charges for accelerated depreciation and asset write-offs. The estimates for separation benefits and other cash related charges remain unchanged.
Kodak implemented certain actions under this program during 2014. As a result of these actions, Kodak recorded severance charges of $3 million, long-lived asset impairment charges of $2 million, and accelerated depreciation charges of $2 million.
2013
For the four months ended December 31, 2013, Kodak recorded $17 million of charges reported as Restructuring costs and other in the accompanying Consolidated Statement of Operations. For the eight months ended August 31, 2013, Kodak recorded $52 million of charges, including $4 million for accelerated depreciation and $2 million for inventory write-downs which were reported in Cost of revenues, $43 million reported as Restructuring costs and other and $3 million which were reported as Earnings (loss) from discontinued operations in the accompanying Consolidated Statement of Operations.
2012
For the year ended December 31, 2012, Kodak recorded $271 million of charges, including $13 million of charges for accelerated depreciation and $4 million of charges for inventory write-downs, which were reported in Cost of revenues, $39 million that was reported as Earnings (loss) from discontinued operations and $215 million of charges that were reported as Restructuring costs and other in the accompanying Consolidated Statement of Operations for the year ended December 31, 2012.
40
LIQUIDITY AND CAPITAL RESOURCES
2014
|
As of December 31,
|
||||||||
|
(in millions)
|
2014
|
2013
|
||||||
|
Cash and cash equivalents
|
$ | 712 | $ | 844 | ||||
Cash Flow Activity
|
(in millions)
|
Successor
|
Predecessor
|
||||||||||||||
|
Year Ended
December 31,
2014
|
Four Months Ended
December 31,
2013
|
Eight Months Ended
August 31,
2013
|
Computed Change vs 2013
(Combined)
|
|||||||||||||
|
Cash flows from operating activities:
|
||||||||||||||||
|
Net cash used in operating activities
|
$ | (128 | ) | $ | (102 | ) | $ | (565 | ) | $ | 539 | |||||
|
Cash flows from investing activities:
|
||||||||||||||||
|
Net cash provided by investing activities
|
41 | 81 | 679 | (719 | ) | |||||||||||
|
Cash flows from financing activities:
|
||||||||||||||||
|
Net cash used in financing activities
|
(7 | ) | (38 | ) | (328 | ) | 359 | |||||||||
|
Effect of exchange rate changes on cash
|
(38 | ) | 5 | (23 | ) | (20 | ) | |||||||||
|
Net (decrease) increase in cash and cash equivalents
|
$ | (132 | ) | $ | (54 | ) | $ | (237 | ) | $ | 159 | |||||
Operating Activities
Net cash used in operating activities improved by $539 million for the year ended December 31, 2014 as compared with the prior year primarily due to improved earnings impacting cash flow from operations, reflecting higher intellectual property licensing income, lower payments associated with the reorganization and lower interest payments. Higher interest payments in 2013 were due to payments made in that year for interest accrued but unpaid in 2012, higher outstanding debt balances and higher average interest rates prior to emergence. The improvements in cash flow from operations were partially offset by the $49 million funding of the Eastman Business Park Trust in the current year.
Investing Activities
Net cash provided by investing activities decreased $719 million for the year ended December 31, 2014 as compared with the prior year primarily due to the $820 million of proceeds from the 2013 sales of the digital imaging patent portfolio and the Personalized Imaging and Document Imaging businesses partially offset by the release of restricted cash accounts funded in 2013.
Financing Activities
Net cash used in financing activities decreased $359 million for the year ended December 31, 2014 as compared with the prior year due to the $811 million net pay-down of debt in 2013, partially offset by the $406 million proceeds from the rights offering and the $35 million contingent cash received with the sale of the Personalized Imaging and Document Imaging businesses.
41
Sources of Liquidity
Available liquidity includes cash balances and the unused portion of the ABL Credit Agreement. The ABL Credit Agreement had $29 million of net availability as of December 31, 2014. The amount of available liquidity is subject to fluctuations and includes cash balances held by various entities worldwide. At December 31, 2014 and December 31, 2013, approximately $214 million and $307 million, respectively, of cash and cash equivalents were held within the U.S. and approximately $498 million and $537 million, respectively, of cash and cash equivalents were held outside the U.S. Cash balances held outside of the U.S. are generally required to support local country operations, may have high tax costs, or other limitations that delay the ability to repatriate, and therefore may not be readily available for transfer to other jurisdictions. Additionally, in China, where approximately $241 million of cash and cash equivalents were held as of December 31, 2014, there are limitations related to net asset balances that impact the ability to make cash available to other jurisdictions in the world. Under the terms of the Company’s Credit Agreements, the Company is permitted to invest up to $100 million at any time in subsidiaries and joint ventures that are not party to the loan agreement.
Cash flows from investing activities included $43 million for capital expenditures for the year ended December 31, 2014. Kodak expects approximately $45 million of cash flows for investing activities from capital expenditures for the year ended December 31, 2015. Additionally, Kodak intends to utilize a variety of methods to finance customer equipment purchases in the future, including expansion of third party finance programs and internal financing through both leasing and installment loans.
Kodak believes that its liquidity position is adequate to fund its operating and investing needs and to provide the flexibility to respond to further changes in the business environment. See “Item 1A. Risk Factors” for a discussion of potential challenges to liquidity.
Refer to Note 8, "Short-Term Borrowings and Long-Term Debt," in the Notes to Financial Statements for further discussion of long-term debt, related maturities and interest rates as of December 31, 2014 and December 31, 2013.
Contractual Obligations
The impact that contractual obligations are expected to have on Kodak's cash flow in future periods is as follows:
|
As of December 31, 2014
|
||||||||||||||||||||||||||||
|
(in millions)
|
Total
|
2015
|
2016
|
2017
|
2018
|
2019
|
2020 | + | ||||||||||||||||||||
|
Long-term debt
(1)
|
$ | 689 | $ | 5 | $ | 4 | $ | 4 | $ | 4 | $ | 397 | $ | 275 | ||||||||||||||
|
Interest payments on debt
|
326 | 64 | 64 | 65 | 62 | 51 | 20 | |||||||||||||||||||||
|
Operating lease obligations
|
105 | 30 | 23 | 17 | 12 | 10 | 13 | |||||||||||||||||||||
|
Purchase obligations
(2)
|
31 | 15 | 6 | 3 | 3 | 2 | 2 | |||||||||||||||||||||
|
Total
(3) (4) (5)
|
$ | 1,151 | $ | 114 | $ | 97 | $ | 89 | $ | 81 | $ | 460 | $ | 310 | ||||||||||||||
|
(1)
|
Primarily represents the maturity values of Kodak's long-term debt obligations as of December 31, 2014. Annual amounts represent the minimum principal payments owed each year. The contractual obligations do not reflect any contingent mandatory annual principal repayments that may be required to be made upon achieving certain excess cash flow targets, as defined in the senior secured credit facility. Other prepayments may be required upon the occurrences of certain other events. Refer to Note 8, "Short-Term Borrowings and Long-Term Debt," in the Notes to Financial Statements.
|
|
(2)
|
Purchase obligations include agreements related to raw materials, supplies, production and administrative services, as well as marketing and advertising, that are enforceable and legally binding on Kodak and that specify all significant terms, including: fixed or minimum quantities to be purchased; fixed, minimum or variable price provisions; and the approximate timing of the transaction. Purchase obligations exclude agreements that are cancelable without penalty.
|
|
(3)
|
Due to uncertainty regarding the completion of tax audits and possible outcomes, an estimate of the timing of payments related to uncertain tax positions and interest cannot be made. See Note 14, “Income Taxes,” in the Notes to Financial Statements for additional information regarding Kodak’s uncertain tax positions.
|
|
(4)
|
Funding requirements for Kodak's major defined benefit retirement plans and other postretirement benefit plans have not been determined, therefore, they have not been included.
|
|
(5)
|
Because timing of their future cash outflows are uncertain, the other long-term liabilities presented in Note 7, “Other Long-Term Liabilities,” in the Notes to Financial Statements are excluded from this table.
|
42
Off-Balance Sheet Arrangements
EKC guarantees obligations to third parties for some of its consolidated subsidiaries. The maximum amount guaranteed is $34 million and the outstanding amount for those guarantees is $20 million.
Kodak issues indemnifications in certain instances when it sells businesses and real estate, and in the ordinary course of business with its customers, suppliers, service providers and business partners. Further, the Company indemnifies its directors and officers who are, or were, serving at the Company's request in such capacities. Historically, costs incurred to settle claims related to these indemnifications have not been material to Kodak’s financial position, results of operations or cash flows. Additionally, the fair value of the indemnifications that Kodak issued during the year ended December 31, 2014 was not material to Kodak’s financial position, results of operations or cash flows.
2013
Cash Flow Activity
|
As of December 31,
|
||||||||
|
Successor
|
Predecessor
|
|||||||
|
(in millions)
|
2013
|
2012
|
||||||
|
Cash and cash equivalents
|
$ | 844 | $ | 1,135 | ||||
Sources and uses of cash at emergence (including divesture of the Personalized Imaging and Document Imaging businesses) follow:
|
Sources:
|
||||||||
|
Net Proceeds from Emergence Credit Facilities
|
$ | 664 | ||||||
|
Proceeds from divestiture
|
325 | |||||||
|
Proceeds from Rights Offerings
|
406 | |||||||
|
Total sources
|
$ | 1,395 | ||||||
|
Uses:
|
||||||||
|
Repayment of Junior DIP Term Loans
|
$ | 844 | ||||||
|
Repayment of Second Lien Notes
|
375 | |||||||
|
Claims paid at emergence
|
94 | |||||||
|
Funding of escrow accounts
|
113 | |||||||
|
Other fees & expenses
|
16 | |||||||
|
Total uses
|
1,442 | |||||||
|
Net uses
|
$ | (47 | ) | |||||
|
(in millions)
|
Successor
|
Predecessor
|
Predecessor
|
|||||||||||||
|
Four Months Ended
December 31,
2013
|
Eight Months Ended
August 31,
2013
|
Year Ended
December 31, 2012
|
Computed Change vs 2012
(2013 Combined)
|
|||||||||||||
|
Cash flows from operating activities:
|
||||||||||||||||
|
Net cash used in operating activities
|
$ | (102 | ) | $ | (565 | ) | $ | (289 | ) | $ | (378 | ) | ||||
|
Cash flows from investing activities:
|
||||||||||||||||
|
Net cash provided by investing activities
|
81 | 679 | 52 | 708 | ||||||||||||
|
Cash flows from financing activities:
|
||||||||||||||||
|
Net cash (used in) provided by financing activities
|
(38 | ) | (328 | ) | 508 | (874 | ) | |||||||||
|
Effect of exchange rate changes on cash
|
5 | (23 | ) | 3 | (21 | ) | ||||||||||
|
Net (decrease) increase in cash and cash equivalents
|
$ | (54 | ) | $ | (237 | ) | $ | 274 | $ | (565 | ) | |||||
Operating Activities
Net cash used in operating activities increased $378 million for the year ended December 31, 2013 as compared with the prior year due to emergence related cash outflows and less cash being provided by working capital changes as compared to the prior year, partially offset by earnings improvement.
Investing Activities
Net cash provided by investing activities increased $708 million for the year ended December 31, 2013 as compared with the prior year, primarily due to the increase in proceeds from sales of businesses/assets of $746 million. The sale of the digital imaging patent portfolio contributed approximately $530 million and the sale of the Personalized Imaging and Document Imaging businesses contributed $290 million to investing activities. Partially offsetting these increases was the net funding of restricted cash and investment accounts of $41 million.
Financing Activities
Net cash used in financing activities increased $874 million for the year ended December 31, 2013 as compared with the prior year due to the net pay-down of debt in 2013 of approximately $811 million compared with borrowing under the Original Senior DIP Credit Agreement in 2012. Partially offsetting the increased cash used in financing activities were the proceeds from the Rights Offering of $406 million and $35 million of contingent cash received related to the sale of the Personalized Imaging and Document Imaging businesses in 2013.
43
SUMMARY OF OPERATING DATA
A summary of operating data for 2014 and for the four years prior is shown on page 23.
Kodak, as a result of its global operating and financing activities, is exposed to changes in foreign currency exchange rates, commodity prices, and interest rates, which may adversely affect its results of operations and financial position. In seeking to minimize the risks associated with such activities, Kodak may enter into derivative contracts. Kodak does not utilize financial instruments for trading or other speculative purposes. Foreign currency forward contracts are used to hedge existing foreign currency denominated assets and liabilities, especially those of Kodak’s International Treasury Center, as well as forecasted foreign currency denominated intercompany sales. Kodak’s exposure to changes in interest rates results from its investing and borrowing activities used to meet its liquidity needs. Long-term debt is generally used to finance long-term investments, while short-term debt is used to meet working capital requirements.
Using a sensitivity analysis based on estimated fair value of open foreign currency forward contracts using available forward rates, if the U.S. dollar had been 10% weaker at December 31, 2014 and 2013, the fair value of open forward contracts would have decreased $2 million and $13 million, respectively. Such changes in fair value would be substantially offset by the revaluation or settlement of the underlying positions hedged.
Kodak is exposed to interest rate risk primarily through its borrowing activities. Kodak may utilize borrowings to fund its working capital and investment needs. The majority of short-term and long-term borrowings are in variable-rate instruments. There is inherent roll-over risk for borrowings and marketable securities as they mature and are renewed at current market rates. The extent of this risk is not predictable because of the variability of future interest rates and business financing requirements.
Kodak’s borrowings are in variable-rate instruments with an interest rate floor. See Note 8, “Short-term borrowings and long-term debt” in the Notes to Financial Statements. At both December 31, 2014 and December 31, 2013, the one-month LIBOR rate was approximately 0.17%. If LIBOR rates were to rise above the 1% and 1.25% floors, interest expense would increase approximately $7 million for each 1% of LIBOR above the floor ($688 million face amount of debt times 1% at December 31, 2014).
Kodak’s financial instrument counterparties are high-quality investment or commercial banks with significant experience with such instruments. Kodak manages exposure to counterparty credit risk by requiring specific minimum credit standards and diversification of counterparties. Kodak has procedures to monitor the credit exposure amounts. The maximum credit exposure at December 31, 2014 was not significant to Kodak.
44
Report of Independent Registered Public Accounting Firm
To the Board of Directors and Shareholders of Eastman Kodak Company
In our opinion, the accompanying consolidated statement of financial position as of December 31, 2014 and 2013 and the related consolidated statements of operations, of comprehensive (loss) income, of equity (deficit) and of cash flows for the year ended December 31, 2014 and for the four months ended December 31, 2013 present fairly, in all material respects, the financial position of Eastman Kodak Company and its subsidiaries (Successor) at December 31, 2014 and 2013 and the results of their operations and their cash flows for the year ended December 31, 2014 and the four months ended December 31, 2013 in conformity with accounting principles generally accepted in the United States of America. In addition, in our opinion, the financial statement schedule of valuation and qualifying accounts appearing under Item 15 for the year ended December 31, 2014 and for the four months ended December 31, 2013 presents fairly, in all material respects, the information set forth therein when read in conjunction with the related consolidated financial statements. Also in our opinion, the Company maintained, in all material respects, effective internal control over financial reporting as of December 31, 2014, based on criteria established in
Internal Control—Integrated Framework
(2013) issued by the Committee of Sponsoring Organizations of the Treadway Commission (COSO). The Company’s management is responsible for these financial statements and financial statement schedule, for maintaining effective internal control over financial reporting and for its assessment of the effectiveness of internal control over financial reporting, included in Management’s Report on Internal Control over Financial Reporting appearing under Item 9A. Our responsibility is to express opinions on these financial statements, on the financial statement schedule, and on the Company’s internal control over financial reporting based on our integrated audits. We conducted our audits in accordance with the standards of the Public Company Accounting Oversight Board (United States). Those standards require that we plan and perform the audit to obtain reasonable assurance about whether the financial statements are free of material misstatement and whether effective internal control over financial reporting was maintained in all material respects. Our audits of the financial statements included examining, on a test basis, evidence supporting the amounts and disclosures in the financial statements, assessing the accounting principles used and significant estimates made by management, and evaluating the overall financial statement presentation. Our audit of internal control over financial reporting included obtaining an understanding of internal control over financial reporting, assessing the risk that a material weakness exists, and testing and evaluating the design and operating effectiveness of internal control based on the assessed risk. Our audits also included performing such other procedures as we considered necessary in the circumstances. We believe that our audits provide a reasonable basis for our opinions.
As discussed in Note 1 to the consolidated financial statements, the United States Bankruptcy Court for the Southern District of New York confirmed the Company’s revised First Amended Joint Chapter 11 Plan of Reorganization of Eastman Kodak Company and its Debtor Affiliates (as revised, the “Plan”) on August 23, 2013. Confirmation of the Plan resulted in the discharge of certain claims against the Company that arose before January 19, 2012 and substantially alters rights and interests of equity security holders as provided for in the Plan. The Plan was substantially consummated on September 3, 2013 and the Company emerged from bankruptcy. In connection with its emergence from bankruptcy, the Company adopted fresh start accounting as of September 1, 2013.
A company’s internal control over financial reporting is a process designed to provide reasonable assurance regarding the reliability of financial reporting and the preparation of financial statements for external purposes in accordance with generally accepted accounting principles. A company’s internal control over financial reporting includes those policies and procedures that (i) pertain to the maintenance of records that, in reasonable detail, accurately and fairly reflect the transactions and dispositions of the assets of the company; (ii) provide reasonable assurance that transactions are recorded as necessary to permit preparation of financial statements in accordance with generally accepted accounting principles, and that receipts and expenditures of the company are being made only in accordance with authorizations of management and directors of the company; and (iii) provide reasonable assurance regarding prevention or timely detection of unauthorized acquisition, use, or disposition of the company’s assets that could have a material effect on the financial statements.
Because of its inherent limitations, internal control over financial reporting may not prevent or detect misstatements. Also, projections of any evaluation of effectiveness to future periods are subject to the risk that controls may become inadequate because of changes in conditions, or that the degree of compliance with the policies or procedures may deteriorate.
/s/ PricewaterhouseCoopers LLP
Rochester, New York
March 16, 2015
45
Report of Independent Registered Public Accounting Firm
To the Board of Directors and Shareholders of Eastman Kodak Company
In our opinion, the accompanying consolidated statements of operations, of comprehensive (loss) income, of equity (deficit) and of cash flows for the eight months ended August 31, 2013 and for the year ended December 31, 2012 present fairly, in all material respects, the results of operations and cash flows of Eastman Kodak Company and its subsidiaries (Predecessor) for the eight months ended August 31, 2013 and for the year ended December 31, 2012 in conformity with accounting principles generally accepted in the United States of America. In addition, in our opinion, the financial statement schedule of valuation and qualifying accounts appearing under Item 15 for the eight months ended August 31, 2013 and for the year ended December 31, 2012 presents fairly, in all material respects, the information set forth therein when read in conjunction with the related consolidated financial statements. These financial statements and financial statement schedule are the responsibility of the Company’s management. Our responsibility is to express an opinion on these financial statements and financial statement schedule based on our audits. We conducted our audits of these statements in accordance with the standards of the Public Company Accounting Oversight Board (United States). Those standards require that we plan and perform the audit to obtain reasonable assurance about whether the financial statements are free of material misstatement. An audit includes examining, on a test basis, evidence supporting the amounts and disclosures in the financial statements, assessing the accounting principles used and significant estimates made by management, and evaluating the overall financial statement presentation. We believe that our audits provide a reasonable basis for our opinions.
As discussed in Note 1 to the consolidated financial statements, the Company filed a petition on January 19, 2012 with the United States Bankruptcy Court for the Southern District of New York for reorganization under the provisions of Chapter 11 of the Bankruptcy Code. The Company’s revised First Amended Joint Chapter 11 Plan of Reorganization of Eastman Kodak Company and its Debtor Affiliates (as revised, the “Plan”) was substantially consummated on September 3, 2013 and the Company emerged from bankruptcy. In connection with its emergence from bankruptcy, the Company adopted fresh start accounting.
/s/ PricewaterhouseCoopers LLP
Rochester, New York
March 19, 2014
46
EASTMAN KODAK COMPANY
(in millions, except per share data)
|
Successor
|
Predecessor
|
|||||||||||||||
|
Year Ended
December 31,
2014
|
Four Months Ended
December 31,
2013
|
Eight Months Ended
August 31,
2013
|
Year Ended
December 31,
2012
|
|||||||||||||
|
Revenues
|
||||||||||||||||
|
Sales
|
$ | 1,724 | $ | 674 | $ | 1,263 | $ | 2,265 | ||||||||
|
Services
|
378 | 133 | 279 | 454 | ||||||||||||
|
Total net revenues
|
2,102 | 807 | 1,542 | 2,719 | ||||||||||||
|
Cost of revenues
|
||||||||||||||||
|
Sales
|
1,362 | 581 | 955 | 2,039 | ||||||||||||
|
Services
|
284 | 106 | 219 | 387 | ||||||||||||
|
Total cost of revenues
|
1,646 | 687 | 1,174 | 2,426 | ||||||||||||
|
Gross profit
|
456 | 120 | 368 | 293 | ||||||||||||
|
Selling, general and administrative expenses
|
310 | 114 | 297 | 637 | ||||||||||||
|
Research and development costs
|
94 | 33 | 66 | 168 | ||||||||||||
|
Restructuring costs and other
|
59 | 17 | 43 | 215 | ||||||||||||
|
Other operating expense (income), net
|
9 | 2 | (495 | ) | (85 | ) | ||||||||||
|
(Loss) earnings from continuing operations before interest expense, loss on early extinguishment of debt, net, other (charges) income, net, reorganization items, net and income taxes
|
(16 | ) | (46 | ) | 457 | (642 | ) | |||||||||
|
Interest expense
|
62 | 22 | 106 | 139 | ||||||||||||
|
Loss on early extinguishment of debt, net
|
- | - | 8 | 7 | ||||||||||||
|
Other (charges) income, net
|
(21 | ) | 10 | (13 | ) | 21 | ||||||||||
|
Reorganization items, net
|
13 | 16 | (2,026 | ) | 843 | |||||||||||
|
(Loss) earnings from continuing operations before income taxes
|
(112 | ) | (74 | ) | 2,356 | (1,610 | ) | |||||||||
|
Provision (benefit) for income taxes
|
10 | 8 | 155 | (273 | ) | |||||||||||
|
(Loss) earnings from continuing operations
|
(122 | ) | (82 | ) | 2,201 | (1,337 | ) | |||||||||
|
Earnings (loss) from discontinued operations, net of income taxes
|
4 | 4 | (135 | ) | (42 | ) | ||||||||||
|
NET (LOSS) EARNINGS
|
(118 | ) | (78 | ) | 2,066 | (1,379 | ) | |||||||||
|
Less: Net income attributable to noncontrolling interests
|
5 | 3 | - | - | ||||||||||||
|
NET (LOSS) EARNINGS ATTRIBUTABLE TO EASTMAN KODAK COMPANY
|
$ | (123 | ) | $ | (81 | ) | $ | 2,066 | $ | (1,379 | ) | |||||
|
Basic and diluted (loss) earnings per share attributable to Eastman Kodak Company common shareholders:
|
||||||||||||||||
|
Continuing operations
|
$ | (3.05 | ) | $ | (2.04 | ) | $ | 8.08 | $ | (4.92 | ) | |||||
|
Discontinued operations
|
0.10 | 0.10 | (0.50 | ) | (0.15 | ) | ||||||||||
|
Total
|
$ | (2.95 | ) | $ | (1.94 | ) | $ | 7.58 | $ | (5.07 | ) | |||||
|
Number of common shares used in basic and diluted (loss) earnings per share
|
41.7 | 41.7 | 272.7 | 271.8 | ||||||||||||
The accompanying notes are an integral part of these consolidated financial statements.
47
EASTMAN KODAK COMPANY
CONSOLIDATED STATEMENT OF COMPREHENSIVE (LOSS) INCOME
(in millions)
|
Successor
|
Predecessor
|
|||||||||||||||
|
Year Ended
December 31,
2014
|
Four Months Ended
December 31,
2013
|
Eight Months Ended
August 31,
2013
|
Year Ended
December 31,
2012
|
|||||||||||||
|
NET (LOSS) EARNINGS
|
$ | (118 | ) | $ | (78 | ) | $ | 2,066 | $ | (1,379 | ) | |||||
|
Less: net income attributable to noncontrolling interests
|
5 | 3 | - | - | ||||||||||||
|
Net (loss) earnings attributable to Eastman Kodak Company
|
(123 | ) | (81 | ) | 2,066 | (1,379 | ) | |||||||||
|
Other comprehensive (loss) income, net:
|
||||||||||||||||
|
Currency translation adjustments
|
(33 | ) | 1 | 4 | (14 | ) | ||||||||||
|
Realized and unrealized losses from hedging activity
|
- | - | - | (1 | ) | |||||||||||
|
Reclassification adjustment for hedging - related gains included in net earnings, net
|
- | - | - | 5 | ||||||||||||
|
Pension and other postretirement benefit plan obligation activity, net
|
(202 | ) | 98 | 1,604 | 60 | |||||||||||
|
Other comprehensive (loss) income, net attributable to Eastman Kodak Company
|
(235 | ) | 99 | 1,608 | 50 | |||||||||||
|
COMPREHENSIVE (LOSS) INCOME, NET ATTRIBUTABLE TO EASTMAN KODAK COMPANY
|
$ | (358 | ) | $ | 18 | $ | 3,674 | $ | (1,329 | ) | ||||||
The accompanying notes are an integral part of these consolidated financial statements.
48
EASTMAN KODAK COMPANY
(in millions)
|
As of December 31,
|
||||||||
|
2014
|
2013
|
|||||||
|
ASSETS
|
||||||||
|
Current Assets
|
||||||||
|
Cash and cash equivalents
|
$ | 712 | $ | 844 | ||||
|
Receivables, net
|
414 | 571 | ||||||
|
Inventories, net
|
349 | 358 | ||||||
|
Deferred income taxes
|
31 | 48 | ||||||
|
Assets held for sale
|
14 | 95 | ||||||
|
Other current assets
|
30 | 55 | ||||||
|
Total current assets
|
1,550 | 1,971 | ||||||
|
Property, plant and equipment, net of accumulated depreciation of $231 and $67, respectively
|
524 | 684 | ||||||
|
Goodwill
|
96 | 88 | ||||||
|
Intangible assets, net
|
182 | 219 | ||||||
|
Restricted cash
|
37 | 79 | ||||||
|
Deferred income taxes
|
38 | 54 | ||||||
|
Other long-term assets
|
129 | 105 | ||||||
|
TOTAL ASSETS
|
$ | 2,556 | $ | 3,200 | ||||
|
LIABILITIES AND EQUITY
|
||||||||
|
Current Liabilities
|
||||||||
|
Accounts payable, trade
|
$ | 212 | $ | 281 | ||||
|
Short-term borrowings and current portion of long-term debt
|
5 | 4 | ||||||
|
Liabilities held for sale
|
10 | 38 | ||||||
|
Other current liabilities
|
372 | 562 | ||||||
|
Total current liabilities
|
599 | 885 | ||||||
|
Long-term debt, net of current portion
|
672 | 674 | ||||||
|
Pension and other postretirement liabilities
|
662 | 572 | ||||||
|
Other long-term liabilities
|
324 | 421 | ||||||
|
Total liabilities
|
2,257 | 2,552 | ||||||
|
Commitments and contingencies (Note 9)
|
||||||||
|
Equity
|
||||||||
|
Common stock, $0.01 par value
|
- | - | ||||||
|
Additional paid in capital
|
621 | 613 | ||||||
|
Treasury stock, at cost
|
(4 | ) | (3 | ) | ||||
|
Accumulated deficit
|
(204 | ) | (81 | ) | ||||
|
Accumulated other comprehensive (loss) income
|
(136 | ) | 99 | |||||
|
Total Eastman Kodak Company shareholders’ equity
|
277 | 628 | ||||||
|
Noncontrolling interests
|
22 | 20 | ||||||
|
Total equity
|
299 | 648 | ||||||
|
TOTAL LIABILITIES AND EQUITY
|
$ | 2,556 | $ | 3,200 | ||||
The accompanying notes are an integral part of these consolidated financial statements.
49
EASTMAN KODAK COMPANY
CONSOLIDATED STATEMENT OF EQUITY (DEFICIT)
(in millions, except share data)
Eastman Kodak Company Shareholders
|
Common Stock
|
Additional Paid in Capital
|
Retained Earnings (Accumulated Deficit)
|
Accumulated Other Comprehensive Income (Loss)
|
Treasury Stock
|
Total
|
Noncontrolling Interests
|
Total
|
|||||||||||||||||||||||||
|
Equity (deficit) as of December 31, 2011 (Predecessor)
|
$ | 978 | $ | 1,108 | $ | 4,071 | $ | (2,666 | ) | $ | (5,843 | ) | $ | (2,352 | ) | $ | 2 | $ | (2,350 | ) | ||||||||||||
|
Net income
|
- | - | (1,379 | ) | - | - | (1,379 | ) | - | (1,379 | ) | |||||||||||||||||||||
|
Other comprehensive income (net of tax):
|
||||||||||||||||||||||||||||||||
|
Unrealized loss arising from hedging activity
|
- | - | - | (1 | ) | - | (1 | ) | - | (1 | ) | |||||||||||||||||||||
|
Reclassification adjustment for hedging related losses included in net earnings
|
- | - | - | 5 | - | 5 | - | 5 | ||||||||||||||||||||||||
|
Currency translation adjustments
|
- | - | - | (14 | ) | - | (14 | ) | - | (14 | ) | |||||||||||||||||||||
|
Pension and other postretirement liability adjustments
|
- | - | - | 60 | - | 60 | - | 60 | ||||||||||||||||||||||||
|
Total other comprehensive income
|
- | - | - | 50 | - | 50 | - | 50 | ||||||||||||||||||||||||
|
Stock-based compensation
|
- | 2 | - | - | - | 2 | - | 2 | ||||||||||||||||||||||||
|
Issuance of treasury stock, net (994,037 shares)
(1)
|
- | (5 | ) | (92 | ) | - | 97 | - | - | - | ||||||||||||||||||||||
|
Equity (deficit) as of December 31, 2012 (Predecessor)
|
978 | 1,105 | 2,600 | (2,616 | ) | (5,746 | ) | (3,679 | ) | 2 | (3,677 | ) | ||||||||||||||||||||
|
Net income
|
- | - | 2,066 | - | - | 2,066 | - | 2,066 | ||||||||||||||||||||||||
|
Other comprehensive income (net of tax):
|
||||||||||||||||||||||||||||||||
|
Currency translation adjustments
|
- | - | - | 4 | - | 4 | - | 4 | ||||||||||||||||||||||||
|
Pension and other postretirement liability adjustments
|
- | - | - | 1,604 | - | 1,604 | - | 1,604 | ||||||||||||||||||||||||
|
Total other comprehensive income
|
- | - | - | 1,608 | - | 1,608 | - | 1,608 | ||||||||||||||||||||||||
|
Stock-based compensation
|
- | 3 | - | - | - | 3 | - | 3 | ||||||||||||||||||||||||
|
Issuance of treasury stock, net (446,501 shares)
(1)
|
- | (3 | ) | (32 | ) | - | 35 | - | - | - | ||||||||||||||||||||||
|
Equity as of August 31, 2013 (Predecessor)
|
978 | 1,105 | 4,634 | (1,008 | ) | (5,711 | ) | (2 | ) | 2 | - | |||||||||||||||||||||
|
Investment in variable interest entity
|
- | - | - | - | - | - | 8 | 8 | ||||||||||||||||||||||||
|
Cancellation of Predecessor Company equity
|
(978 | ) | (1,105 | ) | (4,634 | ) | 1,008 | 5,711 | 2 | - | 2 | |||||||||||||||||||||
|
Equity as of August 31, 2013 (Predecessor)
|
$ | - | $ | - | $ | - | $ | - | $ | - | $ | - | $ | 10 | $ | 10 | ||||||||||||||||
The accompanying notes are an integral part of these consolidated financial statements.
50
EASTMAN KODAK COMPANY
CONSOLIDATED STATEMENT OF EQUITY (DEFICIT) (Continued)
(in millions, except share data)
Eastman Kodak Company Shareholders
|
Common Stock
(2)
|
Additional Paid in Capital
|
Retained Earnings (Accumulated Deficit)
|
Accumulated Other Comprehensive Income (Loss)
|
Treasury Stock
|
Total
|
Noncontrolling Interests
|
Total
|
|||||||||||||||||||||||||
|
Equity as of August 31, 2013 (Predecessor)
|
$ | - | $ | - | $ | - | $ | - | $ | - | $ | - | $ | 10 | $ | 10 | ||||||||||||||||
|
Issuance of Successor Company common stock
|
- | 613 | - | - | - | 613 | - | 613 | ||||||||||||||||||||||||
|
Equity as of September 1, 2013 (Successor)
|
- | 613 | - | - | - | 613 | 10 | 623 | ||||||||||||||||||||||||
|
Equity transactions with noncontrolling interest
|
- | - | - | - | - | - | 7 | 7 | ||||||||||||||||||||||||
|
Net (loss) income
|
- | - | (81 | ) | - | - | (81 | ) | 3 | (78 | ) | |||||||||||||||||||||
|
Other comprehensive income (net of tax):
|
||||||||||||||||||||||||||||||||
|
Currency translation adjustments
|
- | - | - | 1 | - | 1 | - | 1 | ||||||||||||||||||||||||
|
Pension and other postretirement liability adjustments
|
- | - | - | 98 | - | 98 | 98 | |||||||||||||||||||||||||
|
Stock-based compensation
|
- | 1 | - | - | - | 1 | - | 1 | ||||||||||||||||||||||||
|
Purchases of treasury stock, net (152,746 shares)
(3)
|
- | (1 | ) | - | - | (3 | ) | (4 | ) | - | (4 | ) | ||||||||||||||||||||
|
Equity as of December 31, 2013 (Successor)
|
- | 613 | (81 | ) | 99 | (3 | ) | 628 | 20 | 648 | ||||||||||||||||||||||
|
Equity transactions with noncontrolling interest
|
- | - | - | - | - | - | (3 | ) | (3 | ) | ||||||||||||||||||||||
|
Net (loss) income
|
- | - | (123 | ) | - | - | (123 | ) | 5 | (118 | ) | |||||||||||||||||||||
|
Other comprehensive income (net of tax):
|
||||||||||||||||||||||||||||||||
|
Currency translation adjustments
|
- | - | - | (33 | ) | - | (33 | ) | - | (33 | ) | |||||||||||||||||||||
|
Pension and other postretirement liability adjustments
|
- | - | - | (202 | ) | - | (202 | ) | - | (202 | ) | |||||||||||||||||||||
|
Stock-based compensation
|
- | 8 | - | - | - | 8 | - | 8 | ||||||||||||||||||||||||
|
Purchases of treasury stock, (44,911 shares)
(3)
|
- | - | - | - | (1 | ) | (1 | ) | - | (1 | ) | |||||||||||||||||||||
|
Equity (deficit) as of December 31, 2014 (Successor)
|
$ | - | $ | 621 | $ | (204 | ) | $ | (136 | ) | $ | (4 | ) | $ | 277 | $ | 22 | $ | 299 | |||||||||||||
|
(1)
|
Includes stock awards issued, offset by shares surrendered for taxes.
|
|
(2)
|
There are 60 million shares of no par value preferred stock authorized, none of which have been issued.
|
|
(3)
|
Represents purchases of common stock and/ or warrants to satisfy tax withholding obligations.
|
The accompanying notes are an integral part of these consolidated financial statements.
51
EASTMAN KODAK COMPANY
(in millions)
|
Successor
|
Predecessor
|
|||||||||||||||
|
Year Ended
December 31,
2014
|
Four Months Ended
December 31,
2013
|
Eight Months Ended
August 31,
2013
|
Year Ended
December 31,
2012
|
|||||||||||||
|
Cash flows from operating activities:
|
||||||||||||||||
|
Net (loss) earnings
|
$ | (118 | ) | $ | (78 | ) | $ | 2,066 | $ | (1,379 | ) | |||||
|
Adjustments to reconcile to net cash used in operating activities:
|
||||||||||||||||
|
Depreciation and amortization
|
199 | 75 | 118 | 245 | ||||||||||||
|
Pension and other postretirement (income) expense
|
(78 | ) | (61 | ) | 145 | (27 | ) | |||||||||
|
Net gains on sales of businesses/assets
|
(23 | ) | (6 | ) | (407 | ) | (42 | ) | ||||||||
|
Foreign exchange loss from remeasurement of Venezuela monetary assets
|
16 | - | - | - | ||||||||||||
|
Loss on early extinguishment of debt
|
- | - | 8 | 7 | ||||||||||||
|
Non-cash restructuring costs, asset impairments and other charges
|
13 | 9 | 81 | 34 | ||||||||||||
|
Stock based compensation
|
8 | 1 | 3 | 7 | ||||||||||||
|
Reorganization items:
|
||||||||||||||||
|
Non-cash reorganization gain
|
- | - | (1,964 | ) | - | |||||||||||
|
Payment of claims
|
(2 | ) | - | (94 | ) | - | ||||||||||
|
Fresh start adjustments, net
|
- | - | (302 | ) | - | |||||||||||
|
Other non-cash reorganization items, net
|
8 | 3 | 119 | 717 | ||||||||||||
|
Provision (benefit) for deferred income taxes
|
5 | (2 | ) | 448 | (20 | ) | ||||||||||
|
Decrease (increase) in receivables
|
143 | (72 | ) | 105 | 319 | |||||||||||
|
Decrease (increase) in inventories
|
4 | 147 | (27 | ) | 60 | |||||||||||
|
Decrease in liabilities excluding borrowings
|
(307 | ) | (105 | ) | (595 | ) | (781 | ) | ||||||||
|
Other items, net
|
4 | (13 | ) | (269 | ) | 571 | ||||||||||
|
Total adjustments
|
(10 | ) | (24 | ) | (2,631 | ) | 1,090 | |||||||||
|
Net cash used in operating activities
|
(128 | ) | (102 | ) | (565 | ) | (289 | ) | ||||||||
|
Cash flows from investing activities:
|
||||||||||||||||
|
Additions to properties
|
(43 | ) | (21 | ) | (18 | ) | (42 | ) | ||||||||
|
Proceeds from sales of businesses/assets
|
18 | 9 | 827 | 90 | ||||||||||||
|
Use (funding) of restricted cash
|
68 | 93 | (134 | ) | - | |||||||||||
|
Marketable securities – sales
|
- | - | 21 | 95 | ||||||||||||
|
Marketable securities – purchases
|
(2 | ) | - | (17 | ) | (91 | ) | |||||||||
|
Net cash provided by investing activities
|
41 | 81 | 679 | 52 | ||||||||||||
|
Cash flows from financing activities:
|
||||||||||||||||
|
Proceeds from Emergence credit facilities
|
- | - | 664 | - | ||||||||||||
|
Proceeds from Senior and Junior DIP Credit Agreements
|
- | - | 450 | 686 | ||||||||||||
|
Proceeds from VIE credit facility
|
1 | - | - | - | ||||||||||||
|
Repayment of term loans under Original Senior DIP Credit Agreement
|
- | - | (664 | ) | (36 | ) | ||||||||||
|
Repayment of term loans under Junior DIP Credit Agreement
|
- | - | (844 | ) | - | |||||||||||
|
Repayment of emergence credit facilities
|
(4 | ) | (2 | ) | - | - | ||||||||||
|
Repayment of other borrowings
|
- | (40 | ) | (375 | ) | (142 | ) | |||||||||
|
Equity transactions of noncontrolling interests
|
(3 | ) | 7 | - | - | |||||||||||
|
Treasury stock purchases
|
(1 | ) | (3 | ) | - | - | ||||||||||
|
Proceeds from Rights Offerings
|
- | - | 406 | - | ||||||||||||
|
Contingent consideration received with sale of business
|
- | - | 35 | - | ||||||||||||
|
Reorganization items
|
- | - | - | (41 | ) | |||||||||||
|
Proceeds from sale and leaseback transaction
|
- | - | - | 41 | ||||||||||||
|
Net cash (used in) provided by financing activities
|
(7 | ) | (38 | ) | (328 | ) | 508 | |||||||||
|
Effect of exchange rate changes on cash
|
(38 | ) | 5 | (23 | ) | 3 | ||||||||||
|
Net (decrease) increase in cash and cash equivalents
|
(132 | ) | (54 | ) | (237 | ) | 274 | |||||||||
|
Cash and cash equivalents, beginning of period
|
844 | 898 | 1,135 | 861 | ||||||||||||
|
Cash and cash equivalents, end of period
|
$ | 712 | $ | 844 | $ | 898 | $ | 1,135 | ||||||||
The accompanying notes are an integral part of these consolidated financial statements.
52
EASTMAN KODAK COMPANY
CONSOLIDATED STATEMENT OF CASH FLOWS (Continued)
SUPPLEMENTAL CASH FLOW INFORMATION
|
(in millions)
|
Successor
|
Predecessor
|
||||||||||||||
|
Year Ended
December 31,
2014
|
Four Months Ended
December 31,
2013
|
Eight Months Ended
August 31,
2013
|
Year Ended
December 31,
2012
|
|||||||||||||
|
Cash paid for interest and income taxes was:
|
||||||||||||||||
|
Interest, net of portion capitalized of $3 as of December 31, 2014 , $0 as of December 31, 2013 and August 31, 2013, and $1 as of December 31, 2012.
|
$ | 65 | $ | 22 | $ | 179 | $ | 63 | ||||||||
|
Income taxes (net of refunds)
|
14 | 18 | 34 | (13 | ) | |||||||||||
The accompanying notes are an integral part of these consolidated financial statements.
53
EASTMAN KODAK COMPANY
NOTES TO FINANCIAL STATEMENTS
BASIS OF PRESENTATION
On January 19, 2012 (the “Petition Date”), Eastman Kodak Company (“EKC” or the “Company”) and its U.S. subsidiaries (collectively, the “Debtors”) filed voluntary petitions for relief (the “Bankruptcy Filing”) under chapter 11 of the United States Bankruptcy Code (the “Bankruptcy Code”) in the United States Bankruptcy Court for the Southern District of New York (the “Bankruptcy Court”). The cases (the “Chapter 11 Cases”) were jointly administered as Case No. 12-10202 (ALG) under the caption “In re Eastman Kodak Company.” The Debtors operated their businesses as “debtors-in-possession” under the jurisdiction of the Bankruptcy Court and in accordance with the applicable provisions of chapter 11 of the Bankruptcy Code and the orders of the Bankruptcy Court until their emergence from bankruptcy. The Company’s foreign subsidiaries (collectively, the “Non-Filing Entities”) were not part of the Chapter 11 Cases, and continued to operate in the ordinary course of business.
Upon emergence from bankruptcy on September 3, 2013, Kodak adopted fresh-start accounting which resulted in Kodak becoming a new entity for financial reporting purposes. Kodak applied fresh start accounting as of September 1, 2013. Accordingly, the consolidated financial statements on or after September 1, 2013 are not comparable to the consolidated financial statements prior to that date. Refer to Note 25, “Fresh Start Accounting” for additional information.
Subsequent to the Petition Date, all expenses, gains and losses directly associated with the reorganization proceedings are reported as Reorganization items, net in the accompanying Consolidated Statement of Operations. In addition, Liabilities subject to compromise during the chapter 11 proceedings were distinguished from liabilities of the Company’s foreign subsidiaries that were not part of the Chapter 11 Cases, fully-secured liabilities that were not expected to be compromised and from post-petition liabilities in the accompanying Consolidated Statement of Financial Position.
References to “Successor” or “Successor Company” relate to the reorganized Kodak subsequent to September 3, 2013. References to “Predecessor” or “Predecessor Company” relate to Kodak prior to September 3, 2013.
Certain amounts for prior periods have been reclassified to conform to the current period classification. In the first quarter of 2014, Kodak increased the value of goodwill determined as part of fresh start accounting by $8 million to correct for a liability that should have been recorded at emergence. Refer to Note 5, “Goodwill and Other Intangibles.”
ACCOUNTING PRINCIPLES
The consolidated financial statements and accompanying notes are prepared in accordance with accounting principles generally accepted in the United States of America. The following is a description of the significant accounting policies of Kodak.
BASIS OF CONSOLIDATION
The consolidated financial statements include the accounts of EKC and all companies directly or indirectly controlled by EKC, either through majority ownership or otherwise (collectively “Kodak”). Kodak consolidates variable interest entities if Kodak has a controlling financial interest and is determined to be the primary beneficiary of the entity. Kodak accounts for investments in companies over which it has the ability to exercise significant influence, but does not hold a controlling interest, under the equity method of accounting, and records its proportionate share of income or losses in Other (charges), income net in the accompanying Consolidated Statements of Operations. Kodak accounts for investments in companies over which it does not have the ability to exercise significant influence under the cost method of accounting. These investments are carried at cost and are adjusted only for other-than-temporary declines in fair value. Kodak has eliminated all significant intercompany accounts and transactions, and net earnings are reduced by the portion of the net earnings of subsidiaries applicable to non-controlling interests.
Effective August 31, 2013, Kodak sold certain utilities and related facilities and entered into utilities supply and servicing arrangements with RED-Rochester, LLC (“RED”), a variable interest entity (“VIE”). Kodak determined that it was the primary beneficiary of the VIE. Therefore, Kodak consolidates RED’s assets, liabilities and results of operations. Consolidated assets and liabilities of RED are $77 million and $11 million, respectively, as of December 31, 2014 and $85 million and $7 million, respectively, as of December 31, 2013. RED’s equity in those net assets as of December 31, 2014 and 2013 is $21 million and $18 million, respectively. The results of operations and cash flows of RED are immaterial to Kodak. RED’s results of operations are reflected in net income attributable to noncontrolling interest in the accompanying Consolidated Statement of Operations.
54
USE OF ESTIMATES
The preparation of financial statements in conformity with accounting principles generally accepted in the United States of America requires management to make estimates and assumptions that affect the reported amounts of assets and liabilities and disclosure of commitments and contingencies at year end, and the reported amounts of revenues and expenses during the reporting periods presented. Actual results could differ from these estimates.
FOREIGN CURRENCY
For most subsidiaries and branches outside the U.S., the local currency is the functional currency. The financial statements of these subsidiaries and branches are translated into U.S. dollars as follows: assets and liabilities at year-end exchange rates; revenue, expenses and cash flows at average exchange rates; and shareholders’ equity at historical exchange rates. For those subsidiaries for which the local currency is the functional currency, the resulting translation adjustment is recorded as a component of Accumulated other comprehensive (loss) income in the accompanying Consolidated Statement of Financial Position. Translation adjustments related to investments that are permanent in nature are not tax-effected.
For certain other subsidiaries and branches outside the U.S., operations are conducted primarily in U.S. dollars, which is therefore the functional currency. Monetary assets and liabilities of these foreign subsidiaries and branches, which are recorded in local currency, are remeasured at year-end exchange rates, while the related revenue, expense, and gain and loss accounts, which are recorded in local currency, are remeasured at average exchange rates. Non-monetary assets and liabilities, and the related revenue, expense, and gain and loss accounts, are remeasured at historical exchange rates. Adjustments that result from the remeasurement of the assets and liabilities of these subsidiaries are included in Other (charges) income, net in the accompanying Consolidated Statement of Operations.
The effects of foreign currency transactions, including related hedging activities, are included in Other (charges) income, net, in the accompanying Consolidated Statement of Operations.
Venezuela Currency
The Venezuelan government has maintained currency controls and a fixed official exchange rate since 2003. At December 31, 2014, the official exchange rate is 6.3 Venezuelan Bolivars Fuertes (“BsF”) to the U.S. dollar. Kodak has accounted for the Venezuelan economy as highly inflationary since 2010. Accordingly, Kodak’s Venezuelan subsidiary uses the U.S. dollar as its functional currency, and monetary assets and liabilities denominated in BsF generate income or expense for changes in value associated with foreign currency exchange rate fluctuations against the U.S. dollar. Kodak’s Venezuelan subsidiary does not have ongoing trading activity.
In 2013, the Venezuelan government announced the creation of a complementary currency exchange system, Sistema Complementario de Administracion de Divisas 1 (“SICAD 1”). SICAD 1 is determined by an auction process restricted to invited entities for designated uses. At December 31, 2014, the SICAD 1 exchange rate was 12.0 BsF to the U.S. Dollar. In 2014, the Venezuelan government created another currency exchange system, Sistema Complementario de Administracion de Divisas 2 (“SICAD 2”), indicating that all industry sectors and companies would be eligible to participate in SICAD 2. Transactions in SICAD 2 are regulated by the Venezuelan Central Bank. Entities must submit applications to convert BsF to U.S. dollars under SICAD 2. The exchange rate of SICAD 2 as of December 31, 2014 was 49.99 BsF to the U.S. dollar.
Given increased uncertainty in Venezuela, Kodak adopted the SICAD 2 rate to remeasure BsF denominated monetary assets and liabilities of its Venezuelan subsidiary to the U.S. dollar as of December 31, 2014. As a result of this change, Kodak recorded a charge of $16 million in other (charges), income net in the fourth quarter of 2014. As of December 31, 2014, Kodak’s Venezuelan subsidiary had approximately $2 million of BsF denominated net monetary assets, composed primarily of cash and cash equivalents .
Venezuelan government officials have recently indicated that the official primary exchange rate of 6.3 BsF to the U.S. dollar will remain available for importation of essential food and medicine, however the SICAD 1 and SICAD 2 rates will be merged and continue to be available on a limited basis while a new system will be created.
CONCENTRATION OF CREDIT RISK
Financial instruments that potentially subject Kodak to significant concentrations of credit risk consist principally of cash and cash equivalents, receivables, and derivative instruments. Kodak places its cash and cash equivalents with high-quality financial institutions and limits the amount of credit exposure to any one institution. With respect to receivables, such receivables arise from sales to numerous customers in a variety of industries, markets, and geographies around the world. Receivables arising from these sales are generally not collateralized. Kodak performs ongoing credit evaluations of its customers’ financial conditions, and maintains reserves for potential credit losses and such losses, in the aggregate, have not exceeded management’s expectations. Counterparties to the derivative instrument contracts are major financial institutions. Kodak has not experienced non-performance by any of its derivative instruments counterparties.
DERIVATIVE FINANCIAL INSTRUMENTS
All derivative instruments are recognized as either assets or liabilities and are measured at fair value. Kodak does not use derivatives for trading or other speculative purposes. See Note 11, “Financial Instruments.”
55
CASH EQUIVALENTS
All highly liquid investments with a remaining maturity of three months or less at date of purchase are considered to be cash equivalents.
INVENTORIES
Inventories are stated at the lower of cost or market. The cost of all of Kodak’s inventories is determined by the average cost method, which approximates current cost. Kodak provides inventory reserves for excess, obsolete or slow-moving inventory based on changes in customer demand, technology developments or other economic factors. In connection with fresh start accounting, Kodak adjusted the net book value of inventories to their estimated fair value as of September 1, 2013. Refer to Note 25, “Fresh Start Accounting.”
PROPERTY, PLANT AND EQUIPMENT
Property, plant and equipment are recorded at cost, net of accumulated depreciation with the exception of property, plant and equipment owned as of the application of fresh start accounting. Kodak capitalizes additions and improvements while maintenance and repairs are charged to expense as incurred. Upon sale or other disposition, the applicable amounts of asset cost and accumulated depreciation are removed from the accounts and the net amount, less proceeds from disposal, is charged or credited to net (loss) earnings. In connection with fresh start accounting, property, plant and equipment were adjusted to their estimated fair value and depreciable lives were revised as of September 1, 2013. Refer to Note 25, “Fresh Start Accounting.”
Kodak calculates depreciation expense using the straight-line method over the assets’ estimated useful lives, which are as follows:
|
Successor
Company
|
As of
September 1, 2013
|
|
|
Buildings and building improvements
|
5-40
|
1-38
|
|
Land improvements
|
20
|
1-20
|
|
Leasehold improvements
|
3-20
|
1-10
|
|
Equipment
|
3-15
|
1-20
|
|
Tooling
|
1-3
|
1-3
|
|
Furniture and fixtures
|
5-10
|
1-10
|
Kodak depreciates leasehold improvements over the shorter of the lease term or the asset’s estimated useful life.
GOODWILL
Goodwill reported in the Successor period represents the reorganizational value of assets in excess of amounts allocated to identified tangible and intangible assets. Goodwill reported in the Predecessor period represents the excess of purchase price of an acquisition over the fair value of net assets acquired. Goodwill is not amortized, but is required to be assessed for impairment at least annually. Kodak has historically performed its annual goodwill impairment assessment as of September 30. Upon application of fresh start accounting, Kodak elected October 1 as the annual goodwill impairment assessment date and will perform additional impairment tests when events or changes in circumstances occur that would more likely than not reduce the fair value of the reporting unit below its carrying amount.
When testing goodwill for impairment, Kodak may assess qualitative factors for some or all of its reporting units to determine whether it is more likely than not (that is, a likelihood of more than 50 percent) that the fair value of a reporting unit is less than its carrying amount, including goodwill. If Kodak determines based on this qualitative test of impairment that it is more likely than not that a reporting unit’s fair value is less than its carrying amount, or elects to bypass the qualitative assessment for some or all of its reporting units, then a two-step goodwill impairment test is performed to test for a potential impairment of goodwill (step 1) and if potential losses are identified, to measure the impairment loss (step 2). Determining the fair value of a reporting unit involves the use of significant estimates and assumptions. Refer to Note 5, “Goodwill and Other Intangible Assets” and Note 25, “Fresh Start Accounting.”
WORKERS COMPENSATION
Kodak self insures and participates in high-deductible insurance programs with retention and per occurrence deductible levels for claims related to workers compensation. The estimated liability for workers compensation is based on actuarially estimated, discounted cost of claims, including claims incurred but not reported. Historical loss development factors are utilized to project the future development of incurred losses, and the amounts are adjusted based on actual claim experience, settlements, claim development trends, changes in
state regulations and judicial interpretations. Amounts recoverable from insurance companies or third parties are estimated using historical experience and estimates of future recoveries. Estimated recoveries are not offset against the related accrual.
56
REVENUE
Kodak’s revenue transactions include sales of products (such as components and consumables for use in Kodak and other manufacturers’ equipment and film based products); equipment; software; services; integrated solutions; and intellectual property and brand licensing. Kodak recognizes revenue when realized or realizable and earned, which is when the following criteria are met: (1) persuasive evidence of an arrangement exists; (2) delivery has occurred; (3) the sales price is fixed or determinable; and (4) collectability is reasonably assured. At the time revenue is recognized, Kodak provides for the estimated costs of customer incentive programs, warranties and estimated returns and reduces revenue accordingly. For those incentives that require the estimation of sales volumes or redemption rates, such as for volume rebates, Kodak uses historical experience and internal and customer data to estimate the sales incentive at the time revenue is recognized. Kodak accrues the estimated cost of post-sale obligations, including basic product warranties, based on historical experience at the time Kodak recognizes revenue.
For product sales, the revenue recognition criteria are generally met when title and risk of loss have transferred from Kodak to the buyer, which may be upon shipment or upon delivery to the customer site, based on contract terms or legal requirements in certain jurisdictions.
For equipment sales, the recognition criteria are generally met when the equipment is delivered and installed at the customer site. Revenue is recognized for equipment upon delivery as opposed to upon installation when the equipment has stand-alone value to the customer, and the amount of revenue allocable to the equipment is not legally contingent upon the completion of the installation. In instances in which the agreement with the customer contains a customer acceptance clause, revenue is deferred until customer acceptance is obtained, provided the customer acceptance clause is considered to be substantive. For certain agreements, Kodak does not consider these customer acceptance clauses to be substantive because Kodak can and does replicate the customer acceptance test environment and performs the agreed upon product testing prior to shipment. In these instances, revenue is recognized upon installation of the equipment.
Revenue from the sale of software licenses is recognized when (1) Kodak enters into a legally binding arrangement with a customer for the license of software; (2) Kodak delivers the software; (3) customer payment is deemed fixed or determinable and free of contingencies or significant uncertainties; and (4) collection from the customer is probable. Software maintenance and support revenue is recognized ratably over the term of the related maintenance contract.
Revenue from services includes extended warranty, customer support and maintenance agreements, consulting, business process services, training and education. Service revenue is recognized over the contractual period or as services are performed. In service arrangements where final acceptance of a system or solution by the customer is required, revenue is deferred until all acceptance criteria have been met.
The timing and the amount of revenue recognized from the licensing of intellectual property depend upon a variety of factors, including the specific terms of each agreement and the nature of the deliverables and obligations. Revenue is only recognized after all of the following criteria are met: (1) Kodak enters into a legally binding arrangement with a licensee of Kodak’s intellectual property, (2) Kodak delivers the technology or intellectual property rights, (3) licensee payment is deemed fixed or determinable and free of contingencies or significant uncertainties, and (4) collection from the licensee is reasonably assured.
Kodak's transactions may involve the sale of equipment, software, and related services under multiple element arrangements. Kodak allocates revenue at the inception of an arrangement to the various elements based on available vendor specific objective evidence (“VSOE”), third-party evidence (“TPE”), or best estimated selling price (“BESP”) on the basis of the relative selling price. When applying the relative selling price method, the selling price for each deliverable is based on its VSOE if available, TPE if VSOE is not available, or BESP if neither VSOE nor TPE is available. Kodak establishes VSOE of selling price using the price charged for a deliverable when sold separately. TPE of selling price is established by evaluating largely similar and interchangeable competitor products or services in standalone sales to similarly situated customers. The BESP is established by considering internal factors such as margin objectives, pricing practices and controls, customer segment pricing strategies and the product life cycle. Consideration is also given to geographies, market conditions such as competitor pricing strategies and industry technology life cycles. Revenue allocated to an individual element is recognized when all revenue recognition criteria are met for that element. Kodak limits the amount of revenue recognition for delivered elements to the amount that is not contingent on the future delivery of products or services, future performance obligations or subject to customer-specified return or refund privileges.
Kodak evaluates each deliverable in an arrangement to determine whether they represent separate units of accounting. A deliverable constitutes a separate unit of accounting when it has stand-alone value to the customer, and if the arrangement includes a general right of return relative to the delivered item(s), delivery or performance of the undelivered item(s) is considered probable and substantially in Kodak’s control. If these criteria are not met, the arrangement is accounted for as one unit of accounting and the recognition of revenue occurs upon delivery/completion or ratably as a single unit of accounting over the contractual service period.
57
Most of Kodak’s equipment has both software and non-software components that function together to deliver the equipment’s essential functionality and therefore they are accounted for together as non-software deliverables. Non-essential software sold in connection with Kodak’s equipment sales is accounted for as separate deliverables or elements. In most cases, these software products sold as part of a multiple element arrangement include software maintenance agreements as well as unspecified upgrades or enhancements on a when-and-if-available basis. In multiple element arrangements where non-essential software deliverables are included, revenue is allocated to non-software and to software deliverables each as a group based on relative selling prices of each of the deliverables in the arrangement. The software deliverables are subject to software accounting whereby revenue is allocated based on relative VSOE or based on the residual method when VSOE exists for all undelivered software elements such as post-contract support. Revenue allocated to the software deliverables is deferred and amortized over the contract period if VSOE does not exist for post-contract support or at the completion of the contract for non-post-contract support undelivered elements such as specified up-grade rights. Revenue allocated to software licenses is recognized when all revenue recognition criteria have been met. Revenue generated from maintenance and unspecified upgrades or updates on a when-and-if-available basis is recognized over the contract period.
RESEARCH AND DEVELOPMENT COSTS
Research and development (“R&D”) costs, which include costs incurred in connection with new product development, fundamental and exploratory research, process improvement, product use technology and product accreditation, are expensed in the period in which they are incurred. The acquisition-date fair value of R&D assets acquired in a business combination is capitalized. In connection with fresh start accounting, Kodak capitalized the estimated fair value of certain in-process research and development projects. Refer to Note 5, “Goodwill and Other Intangible Assets” and Note 25, “Fresh Start Accounting.”
ADVERTISING
Advertising costs are expensed as incurred and are included in Selling, general and administrative expenses in the accompanying Consolidated Statement of Operations. Advertising expenses amounted to $13 million, $6 million, $14 million and $66 million for the year ended December 31, 2014, four months ended December 31, 2013, eight months ended August 31, 2013 and year ended December 31, 2012, respectively.
SHIPPING AND HANDLING COSTS
Amounts charged to customers and costs incurred by Kodak related to shipping and handling are included in net sales and cost of sales, respectively.
IMPAIRMENT OF LONG-LIVED ASSETS
Kodak reviews the carrying values of its long-lived assets, other than goodwill and intangible assets with indefinite useful lives, for impairment whenever events or changes in circumstances indicate that the carrying values may not be recoverable. In connection with fresh start accounting, the carrying values of long-lived assets were adjusted to estimated fair value as of September 1, 2013 and Kodak revised its estimates of the remaining useful lives of all long-lived assets. Refer to Note 25, “Fresh Start Accounting.”
Kodak assesses the recoverability of the carrying values of long-lived assets by first grouping its long-lived assets with other assets and liabilities at the lowest level for which identifiable cash flows are largely independent of the cash flows of other assets and liabilities (the asset group) and, secondly, by estimating the undiscounted future cash flows that are directly associated with and that are expected to arise from the use of and eventual disposition of such asset group. Kodak estimates the undiscounted cash flows over the remaining useful life of the primary asset within the asset group. If the carrying value of the asset group exceeds the estimated undiscounted cash flows, Kodak records an impairment charge to the extent the carrying value of the long-lived asset exceeds its fair value. Kodak determines fair value through quoted market prices in active markets or, if quoted market prices are unavailable, through the performance of internal analyses of discounted cash flows.
In connection with its assessment of recoverability of its long-lived assets and its ongoing strategic review of the business and its operations, Kodak continually reviews the remaining useful lives of its long-lived assets. If this review indicates that the remaining useful life of the long-lived asset has changed significantly, Kodak adjusts the depreciation on that asset to facilitate full cost recovery over its revised estimated remaining useful life.
Kodak recorded indefinite-lived intangible assets related to the Kodak trade name and in-process research and development in conjunction with fresh start accounting. The carrying values of indefinite-lived intangible assets are evaluated for potential impairment annually on October 1 or whenever events or changes in circumstances indicate that it is more likely than not that the asset is impaired. Refer to Note 5, “Goodwill and Other Intangible Assets.”
58
INCOME TAXES
Kodak recognizes deferred tax liabilities and assets for the expected future tax consequences of operating losses, credit carry-forwards and temporary differences between the carrying amounts and tax basis of Kodak’s assets and liabilities. Kodak records a
valuation allowance to reduce its net deferred tax assets to the amount that is more likely than not to be realized. For discussion of the amounts and components of the valuation allowances as of December 31, 2014 and 2013, see Note 14, “Income Taxes.”
The undistributed earnings of Kodak’s foreign subsidiaries are not considered permanently reinvested. Kodak has recognized a deferred tax liability (net of related foreign tax credits) on the foreign subsidiaries’ undistributed earnings.
RECENTLY ADOPTED ACCOUNTING PRONOUNCEMENTS
In March 2013, the FASB issued ASU No. 2013-05, “Foreign Currency Matters (Topic 830)—Parent’s Accounting for the Cumulative Translation Adjustment upon De-recognition of Certain Subsidiaries or Groups of Assets within a Foreign Entity or of an Investment in a Foreign Entity.” ASU No. 2013-05 clarifies when a cumulative translation adjustment should be released into earnings. The changes in the ASC are effective prospectively for annual and interim periods beginning after December 15, 2013 (January 1, 2014 for Kodak). This guidance did not have an impact on Kodak’s Consolidated Financial Statements.
In February 2013, the FASB issued ASU No. 2013-04, “Liabilities (Topic 405)—Obligations Resulting from Joint and Several Liability Arrangements for Which the Total Amount of the Obligation Is Fixed at the Reporting Date.” ASU No 2013-04 requires an entity to measure obligations resulting from joint and several liability arrangements for which the total amount of the obligation within the scope of this guidance is fixed at the reporting date, as the sum of the following: the amount the reporting entity agreed to pay on the basis of its arrangement among its co-obligors and any additional amount the reporting entity expects to pay on behalf of its co-obligors. The amendments in this update are effective retrospectively for fiscal years, and interim periods within those years, beginning after December 15, 2013 (January 1, 2014 for Kodak). This guidance did not have an impact on Kodak’s Consolidated Financial Statements.
RECENTLY ISSUED ACCOUNTING PRONOUNCEMENTS
In May 2014, the Financial Accounting Standards Board (“FASB”) issued Accounting Standards Update (“ASU”) No. 2014-09 (“ASU 2014-09”), “Revenue from Contracts with Customers (Topic 606).” ASU 2014-09 supersedes the revenue recognition requirements in Topic 605, “Revenue Recognition” and most industry-specific guidance. The core principle of ASU 2014-09 is that a company will recognize revenue when it transfers promised goods or services to customers in an amount that reflects the consideration to which the company expects to be entitled in exchange for those goods or services. ASU 2014-09 is effective for fiscal years, and interim periods within those years, beginning after December 15, 2016 (January 1, 2017 for Kodak) and allows either a full retrospective adoption to all periods presented or a modified retrospective adoption approach with the cumulative effect of initial application of the revised guidance recognized at the date of initial application. Kodak is currently evaluating the adoption alternatives and impact of this ASU.
In April 2014, the FASB issued ASU No. 2014-08 (“ASU 2014-08”), “Presentation of Financial Statements (Topic 205) and Property, Plant, and Equipment (Topic 360).” ASU 2014-08 defines a discontinued operation as a disposal of a component (or group of components) of an entity that was disposed of or is classified as held for sale and represents a strategic shift that has (or will have) a major effect on an entity’s operations and financial results. ASU 2014-08 expands the disclosures when an entity retains a significant continuing involvement with a discontinued operation as well as for disposals of individually material components that do not qualify as discontinued operations. The amendments in the update are effective prospectively for fiscal years, and interim periods within those years, beginning after December 15, 2014 (January 1, 2015 for Kodak) to new disposals and new disposal groups classified as held for sale after the effective date. Kodak does not expect the adoption of this guidance to have a material impact on its Consolidated Financial Statements.
59
|
As of
December 31, 2014
|
As of
December 31, 2013
|
|||||||
|
Trade receivables
|
$ | 361 | $ | 473 | ||||
|
Miscellaneous receivables
|
53 | 98 | ||||||
|
Total (net of allowances of $11 and $6 as of December 31, 2014 and December 31, 2013, respectively)
|
$ | 414 | $ | 571 | ||||
|
|
||||||||
Approximately $31 million and $39 million of the total trade receivable amounts as of December 31, 2014 and 2013, respectively, will potentially be settled through customer deductions in lieu of cash payments. Such deductions represent rebates owed to customers and are included in Other current liabilities in the accompanying Consolidated Statement of Financial Position.
|
(in millions)
|
As of
December 31, 2014
|
As of
December 31, 2013
|
||||||
|
Finished goods
|
$ | 204 | $ | 185 | ||||
|
Work in process
|
73 | 94 | ||||||
|
Raw materials
|
72 | 79 | ||||||
|
Total
|
$ | 349 | $ | 358 | ||||
|
(in millions)
|
As of
December 31, 2014
|
As of
December 31, 2013
|
||||||
|
Land
|
$ | 100 | $ | 117 | ||||
|
Buildings and building improvements
|
176 | 178 | ||||||
|
Machinery and equipment
|
432 | 414 | ||||||
|
Construction in progress
|
47 | 42 | ||||||
| 755 | 751 | |||||||
|
Accumulated depreciation
|
(231 | ) | (67 | ) | ||||
|
Property, plant and equipment, net
|
$ | 524 | $ | 684 | ||||
Depreciation expense was $174 million, $67 million, $91 million and $182 million for the year ended December 31, 2014, four months ended December 31, 2013, eight months ended August 31, 2013 and the year ended December 31, 2012, respectively, of which approximately $2 million, $0 million, $4 million and $13 million, respectively, represented accelerated depreciation in connection with restructuring actions.
60
The following table presents the changes in the carrying value of goodwill by reportable segment:
|
(in millions)
|
Graphics, Entertainment and Commercial Films Segment
|
Digital Printing and Enterprise Segment
|
Consolidated Total
|
|||||||||
|
Balance as of December 31, 2012 (Predecessor):
|
$ | 115 | $ | 17 | $ | 132 | ||||||
|
Impairment
|
(77 | ) | - | (77 | ) | |||||||
|
Currency translation adjustments
|
1 | - | 1 | |||||||||
|
Balance as of August 31, 2013 (Predecessor):
|
$ | 39 | $ | 17 | $ | 56 | ||||||
|
Impact of fresh start accounting
|
$ | 22 | $ | 10 | $ | 32 | ||||||
|
Balance as of December 31, 2013 (Successor):
|
$ | 61 | $ | 27 | $ | 88 | ||||||
|
Fresh start accounting adjustment
|
6 | 2 | 8 | |||||||||
|
Balance as of December 31, 2014 (Successor):
|
$ | 67 | $ | 29 | $ | 96 | ||||||
Gross goodwill and accumulated impairment losses were $1.543 billion and $1.411 billion, respectively, as of December 31, 2012 and $1.544 billion and $1.488 billion, respectively, as of August 31, 2013. As part of fresh start accounting, Kodak adjusted the carrying value of goodwill (see Note 25, “Fresh Start Accounting”).
Due to the sale of Kodak’s digital imaging patents during the first quarter of 2013, Kodak concluded that the carrying value of goodwill for its Intellectual Property and Brand Licensing reporting unit exceeded the implied fair value of goodwill. The fair value of the Intellectual Property and Brand Licensing reporting unit was estimated using an income approach in which the future cash flows, including a terminal value at the end of the projection period, were discounted to present value. Kodak recorded a pre-tax impairment charge of $77 million that is included in Other operating expense (income), net in the Consolidated Statement of Operations.
As of October 1, 2014, the Graphics, Entertainment and Commercial Films Segment had three goodwill reporting units: Graphics, Entertainment Imaging and Commercial Films and Intellectual Property and Brand Licensing. The Digital Printing and Enterprise Segment had four goodwill reporting units: Digital Printing, Packaging and Functional Printing, Enterprise Services and Solutions, and Consumer Inkjet Systems. Goodwill recorded as part of fresh start accounting was allocated to the Graphics, Packaging and Functional Printing, Intellectual Property and Brand Licensing and Consumer Inkjet Systems reporting units.
Based upon the results of Kodak’s October 1, 2014 annual impairment test, no impairment of goodwill was indicated.
As part of fresh start accounting, Kodak wrote-off existing intangibles and accumulated amortization and recorded an adjustment of $235 million to reflect the fair value of intangibles. Refer to Note 25, “Fresh Start Accounting.” Due to the change in expected cash flows from the amounts estimated as part of fresh start accounting, Kodak concluded the carrying value of the in-process research and development intangible asset exceeded its fair value based on its October 1, 2014 assessment. In the fourth quarter of 2014, Kodak recorded a pre-tax impairment charge of $9 million that is included in Other operating expense (income), net in the Consolidated Statement of Operations.
Based upon the results of Kodak’s October 1, 2014 annual impairment test, no impairment of the Kodak trade name was indicated. In the fourth quarter of 2013, Kodak concluded that the carrying value of the Kodak trade name, estimated as part of fresh start accounting, exceeded its fair value and Kodak recorded a pre-tax impairment charge of $8 million that is included in Other operating expense (income), net in the Consolidated Statement of Operations.
61
The gross carrying amount and accumulated amortization by major intangible asset category as of December 31, 2014 and 2013 were as follows:
|
As of December 31, 2014
|
|||||||||||||
|
(in millions)
|
Gross Carrying
|
Accumulated
|
Weighted-Average
|
||||||||||
|
Amount
|
Amortization
|
Net
|
Amortization Period
|
||||||||||
|
Technology-based
|
$ | 131 | $ | 27 | $ | 104 |
7 years
|
||||||
|
Kodak trade name
|
46 | - | 46 |
Indefinite life
|
|||||||||
|
Customer-related
|
36 | 6 | 30 |
8 years
|
|||||||||
|
Other
|
2 | - | 2 |
21 years
|
|||||||||
|
Total
|
$ | 215 | $ | 33 | $ | 182 | |||||||
|
As of December 31, 2013
|
|||||||||||||
|
(in millions)
|
Gross Carrying
|
Accumulated
|
Weighted-Average
|
||||||||||
|
Amount
|
Amortization
|
Net
|
Amortization Period
|
||||||||||
|
Technology-based
|
$ | 131 | $ | 6 | $ | 125 |
8 years
|
||||||
|
Kodak trade name
|
46 | - | 46 |
Indefinite life
|
|||||||||
|
Customer-related
|
39 | 2 | 37 |
9 years
|
|||||||||
|
In-process research and development
|
9 | - | 9 |
Indefinite life
|
|||||||||
|
Other
|
2 | - | 2 |
25 years
|
|||||||||
|
Total
|
$ | 227 | $ | 8 | $ | 219 | |||||||
Amortization expense related to intangible assets was $25 million, $8 million, $10 million and $26 million for the year ended December 31, 2014, four months ended December 31, 2013, eight months ended August 31, 2013 and year ended December 31, 2012, respectively.
Estimated future amortization expense related to intangible assets as of December 31, 2014 was as follows:
|
(in millions)
|
||||
|
2015
|
$ | 25 | ||
|
2016
|
25 | |||
|
2017
|
23 | |||
|
2018
|
18 | |||
|
2019
|
10 | |||
|
2020 and thereafter
|
35 | |||
|
Total
|
$ | 136 | ||
62
| (in millions) |
As of
December 31,
2014
|
As of
December 31,
2013
|
||||||
|
Accrued employment-related liabilities
|
$ | 132 | $ | 189 | ||||
|
Accrued customer rebates
|
34 | 52 | ||||||
|
Deferred revenue
|
48 | 48 | ||||||
|
Accrued restructuring liabilities
|
27 | 34 | ||||||
|
Deferred consideration on disposed businesses
|
11 | 62 | ||||||
|
Other
|
120 | 177 | ||||||
|
Total
|
$ | 372 | $ | 562 | ||||
The Other component above consists of other miscellaneous current liabilities that, individually, were less than 5% of the total current liabilities component within the Consolidated Statement of Financial Position, and therefore, have been aggregated in accordance with Regulation S-X.
|
(in millions)
|
As of
December 31,
2014
|
As of
December 31,
2013
|
||||||
|
Worker's compensation
|
$ | 123 | $ | 125 | ||||
|
Environmental liabilities
|
19 | 82 | ||||||
|
Asset retirement obligations
|
53 | 52 | ||||||
|
Other
|
129 | 162 | ||||||
|
Total
|
$ | 324 | $ | 421 | ||||
The Other component above consists of other miscellaneous long-term liabilities that, individually, were less than 5% of the total liabilities component in the accompanying Consolidated Statement of Financial Position, and therefore, have been aggregated in accordance with Regulation S-X.
63
Debt and related maturities and interest rates were as follows at December 31, 2014 and 2013:
|
(in million)
|
As of
December 31,
2014
|
As of
December 31,
2013
|
||||||||||||
|
Country
|
Type
|
Maturity
|
Weighted-Average Effective Interest Rate
|
Carrying Value
|
Carrying Value
|
|||||||||
|
Current portion:
|
||||||||||||||
|
U.S.
|
Term note
|
2015
|
7.54 | % | $ | 4 | $ | 4 | ||||||
|
U.S.
|
Credit line
|
2015
|
2.42 | % | 1 | - | ||||||||
| 5 | 4 | |||||||||||||
|
Non-current portion:
|
||||||||||||||
|
U.S.
|
Term note
|
2019
|
7.54 | % | 403 | 406 | ||||||||
|
U.S.
|
Term note
|
2020
|
11.01 | % | 269 | 268 | ||||||||
| 672 | 674 | |||||||||||||
| $ | 677 | $ | 678 | |||||||||||
Annual maturities of debt outstanding at December 31, 2014, were as follows:
|
(in millions)
|
Carrying Value
|
Maturity Value
|
||||||
|
2015
|
$ | 5 | $ | 5 | ||||
|
2016
|
4 | 4 | ||||||
|
2017
|
4 | 4 | ||||||
|
2018
|
4 | 4 | ||||||
|
2019
|
390 | 397 | ||||||
|
2020 and thereafter
|
270 | 275 | ||||||
|
Total
|
$ | 677 | $ | 689 | ||||
On September 3, 2013, the Company entered into (i) a Senior Secured First Lien Term Credit Agreement (the “First Lien Term Credit Agreement”) with the lenders party thereto (the “First Lien Lenders”), JPMorgan Chase Bank, N.A. as administrative agent, and J.P. Morgan Securities LLC, Barclays Bank PLC, and Merrill Lynch, Pierce, Fenner & Smith Inc. as joint lead arrangers and joint bookrunners, and (ii) a Senior Secured Second Lien Term Credit Agreement (the “Second Lien Term Credit Agreement,” and together with the First Lien Term Credit Agreement, the “Term Credit Agreements”), with the lenders party thereto (the “Second Lien Lenders,” and together with the First Lien Lenders, the “Term Credit Lenders”), Barclays Bank PLC as administrative agent, and J.P. Morgan Securities LLC, Barclays Bank PLC and Merrill Lynch, Pierce, Fenner & Smith Inc. as joint lead arrangers and joint bookrunners. Additionally, the Company and its U.S. subsidiaries (the “Subsidiary Guarantors”) entered into an Asset Based Revolving Credit Agreement (the “ABL Credit Agreement” and together with the Term Credit Agreements, the “Credit Agreements”) with the lenders party thereto (the “ABL Lenders” and together with the First Lien Lenders and the Second Lien Lenders, the “Lenders”) and Bank of America N.A. as administrative agent and collateral agent, Barclays Bank PLC as syndication agent and Merrill Lynch, Pierce, Fenner & Smith Inc., Barclays Bank PLC and J.P. Morgan Securities LLC as joint lead arrangers and joint bookrunners. Pursuant to the terms of the Credit Agreements, the Term Credit Lenders provided the Company with term loan facilities in an aggregate principal amount of $695 million, consisting of $420 million of first-lien term loans (the “First Lien Loans”) and $275 million of second-lien term loans (the “Second Lien Loans”). Net proceeds from the Term Credit Agreements were $664 million ($695 million aggregate principal less $15 million stated discount and $16 million in debt transaction costs). The ABL Lenders will make available asset-based revolving loans in an amount of up to $200 million (the “ABL Loans”). The maturity date of the loans made under the Term Credit Agreements is the earlier to occur of (i) September 3, 2019 (in case of First Lien Loans) or September 3, 2020 (in case of Second Lien Loans) and (ii) the acceleration of such loans due to an event of default (as defined in the Term Credit Agreements). The maturity date of the loans made under the ABL Credit Agreement is the earlier to occur of (i) September 3, 2018 and (ii) the date of termination of the commitments in accordance with the terms of the ABL Credit Agreement. The ABL Credit Agreement also provides for the issuance of letters of credit of up to a sublimit of $150 million. The Company has issued approximately $123 million of letters of credit under the ABL Credit Agreement as of December 31, 2014. Under the ABL Loan’s borrowing base calculation, the Company had approximately $29 million of Borrowing Base Availability (as defined in the ABL Credit Agreement) and Excess Availability (as defined in the ABL Credit Agreement) of $44 million under the revolving credit facility as of December 31, 2014. Availability is subject to the borrowing base calculation, reserves and other limitations.
64
The First Lien Loans bear interest at the rate of LIBOR plus 6.25% per annum, with a LIBOR floor of 1% or Alternate Base Rate (as defined in the First Lien Term Credit Agreement) plus 5.25%. The Second Lien Loans bear interest at the rate of LIBOR plus 9.5% per annum, with a LIBOR floor of 1.25% or Alternate Base Rate (as defined in the Second Lien Term Credit Agreement) plus 8.5%. The ABL Loans (other than initial borrowings) bear interest at the rate of LIBOR plus 2.75%-3.25% per annum or Base Rate (as defined in the ABL Credit Agreement) plus 1.75%-2.25% per annum, based on Excess Availability (as defined in the ABL Credit Agreement). Each existing and future direct or indirect U.S. subsidiary of the Company (other than immaterial subsidiaries, unrestricted subsidiaries and certain other subsidiaries) have agreed to provide unconditional guarantees of the obligations of the Company under the Credit Agreements. Subject to certain exceptions, obligations under the First Lien Term Credit Agreement and the Second Lien Term Credit Agreement are secured by: (i) a first lien and a second lien, respectively, on all assets of the Company and the Subsidiary Guarantors, other than the ABL Collateral (as defined below), including a first and a second lien, respectively, on 100% of the stock of material domestic subsidiaries and 65% of the stock of material first-tier foreign subsidiaries (the “Term Collateral”) and (ii) a second lien and a third lien, respectively, on the ABL Collateral (as defined below). Obligations under the ABL Credit Agreement are secured by: (i) a first lien on cash, accounts receivable, inventory, machinery and equipment (the “ABL Collateral”) and (ii) a third lien on the Term Collateral.
The Company may voluntarily prepay the First Lien Loan subject to a premium payable of 1% of the principal amount being prepaid if the prepayment is made after the first anniversary of the closing date but prior to the second anniversary of the closing date. The Company may prepay the Second Lien Loan after the first anniversary of the closing date and prior to the second anniversary date subject to a prepayment premium of 3% of the principal amount prepaid. On and after the second anniversary and prior to the third anniversary of the closing date a prepayment premium of 1% of the principal amount prepaid is required with respect to the Second Lien Loan.
As defined in each of the Term Credit Agreements, the Company is required to prepay loans with net proceeds from asset sales, recovery events or issuance of indebtedness, subject to, in the case of net proceeds received from asset sales or recovery events, reinvestment rights by the Company in assets used or usable by the business within certain time limits. On an annual basis, starting with the fiscal year ending on December 31, 2014, the Company will prepay on June 30 of the following fiscal year loans in an amount equal to a percentage of Excess Cash Flow (“ECF”) as defined in each of the Term Credit Agreements, provided no such prepayment is required if such prepayment would cause U.S. liquidity (as defined in each of the Term Credit Agreements) to be less than $100 million. For the year ended December 31, 2014, ECF was a negative amount, therefore, no prepayment is required in 2015. Any mandatory prepayments as described above shall be reduced by any mandatory prepayments of the First Lien Loan.
The Credit Agreements limit, among other things, the Company’s and the Subsidiary Guarantors’ ability to (i) incur indebtedness, (ii) incur or create liens, (iii) dispose of assets, (iv) make restricted payments (including dividend payments, et al.) and (v) make investments. Under the Term Credit Agreements, the Company is required to maintain minimum U.S. Liquidity (as defined therein) through 2014 and starting December 31, 2014, tested on a quarterly basis, Net Secured Leverage (as defined therein) not to exceed specified levels. Under the ABL Credit Agreement, if Excess Availability is less than 15% of commitments available, the Company would be required to maintain a minimum Fixed Charge Coverage Ratio (as defined therein). Kodak was in compliance with all covenants under the Term Credit Agreements and the ABL Credit Agreement as of December 31, 2014.
Events of default under the Credit Agreements include, among others, failure to pay any loan, interest or other amount due under the applicable credit agreement, breach of specific covenants and a change of control of the Company. Upon an event of default, the applicable lenders may declare the outstanding obligations under the applicable credit agreement to be immediately due and payable and exercise other rights and remedies provided for in such credit agreement.
65
Environmental
Kodak’s undiscounted accrued liabilities for future environmental investigation, remediation and monitoring costs are composed of the following items:
|
(in millions)
|
As of
December 31,
2014
|
As of
December 31,
2013
|
||||||
|
Eastman Business Park site, Rochester, NY
|
$ | - | $ | 49 | ||||
|
Other current operating sites
|
7 | 8 | ||||||
|
Sites associated with former operations
|
10 | 13 | ||||||
|
Sites associated with the non-imaging health businesses sold in 1994
|
11 | 12 | ||||||
|
Total
|
$ | 28 | $ | 82 | ||||
These amounts are reported in Other long-term liabilities and Current liabilities held for sale in the accompanying Consolidated Statement of Financial Position.
Cash expenditures for pollution prevention and waste treatment for Kodak's current facilities were as follows:
|
Successor
|
Predecessor
|
|||||||||||||||
|
(in millions)
|
For the Year Ended
December 31,
2014
|
For the Four Months Ended December 31,
2013
|
For the Eight
Months Ended
August 31,
2013
|
For the Year Ended
December 31,
2012
|
||||||||||||
|
Recurring costs for pollution
prevention and waste treatment
|
$ | 13 | $ | 5 | $ | 16 | $ | 28 | ||||||||
|
Capital expenditures for pollution
prevention and waste treatment
|
2 | 2 | - | 1 | ||||||||||||
|
Site remediation costs
|
- | - | - | 1 | ||||||||||||
|
Total
|
$ | 15 | $ | 7 | $ | 16 | $ | 30 | ||||||||
Environmental expenditures that relate to an existing condition caused by past operations and that do not provide future benefits are expensed as incurred. Costs that are capital in nature and that provide future benefits are capitalized. Liabilities are recorded when environmental assessments are made or the requirement for remedial efforts is probable, and the costs can be reasonably estimated. The timing of accruing for these remediation liabilities is generally no later than the completion of feasibility studies. Kodak has an ongoing monitoring and identification process to assess how the activities, with respect to the known exposures, are progressing against the accrued cost estimates.
Cash expenditures for the aforementioned investigation, remediation and monitoring activities are expected to be incurred over the next thirty years for most of the sites. For these known environmental liabilities, the accrual reflects Kodak’s best estimate of the amount it will incur under the agreed-upon or proposed work plans. Kodak’s cost estimates were determined using the ASTM Standard E 2137-06, "Standard Guide for Estimating Monetary Costs and Liabilities for Environmental Matters," and have not been reduced by possible recoveries from third parties. The overall method includes the use of a probabilistic model which forecasts a range of cost estimates for the remediation required at individual sites. The projects are closely monitored and the models are reviewed as significant events occur or at least once per year. Kodak’s estimate includes investigations, equipment and operating costs for remediation and long-term monitoring of the sites.
66
On June 17, 2013, the Company, the New York State Department of Environmental Conservation and the New York State Urban Development Corporation, d/b/a Empire State Development entered into a settlement agreement, subsequently amended on August 6, 2013 (the “Amended EBP Settlement Agreement”). The Amended EBP Settlement Agreement was subject to the satisfaction or waiver of certain conditions including a covenant not to sue from the U.S. Environmental Protection Agency (“EPA”). On May 13, 2014, the Bankruptcy Court approved the U.S. Environmental Settlement, which contained the EPA covenant not to sue, and on May 20, 2014 the Amended EBP Settlement Agreement was implemented and became effective. The Amended EBP Settlement Agreement included a settlement of certain of the Company’s historical environmental liabilities at Eastman Business Park (“EBP”) through the establishment of the EBP Trust as follows: (i) the EBP Trust is responsible for investigation and remediation at EBP arising from the Company’s historical subsurface environmental liabilities in existence prior to the effective date of the Amended EBP Settlement Agreement, (ii) the Company funded the EBP Trust on the effective date with a $49 million cash payment and transferred certain equipment and fixtures used for remediation at EBP and (iii) in the event the historical liabilities exceed $99 million, the Company will become liable for 50% of the portion above $99 million. Prior to the implementation of the Amended EBP Settlement Agreement, $49 million was already held in a separate trust and escrow account.
Prior to the bankruptcy filing, Kodak was designated as a potentially responsible party (“PRP”) under the Comprehensive Environmental Response, Compensation and Liability Act of 1980, as amended (the “Superfund Law”), or under similar state laws, for environmental assessment and cleanup costs as the result of Kodak’s alleged arrangements for disposal of hazardous substances at eight Superfund sites. In connection with the Bankruptcy Filing, the Debtors provided withdrawal notifications or entered into settlement negotiations with involved regulatory agencies. Each of these sites has been resolved.
In addition, the Company provided an indemnity as part of the 1994 sale of Sterling Corporation (now “STWB”), which covered a number of environmental sites including the Lower Passaic River Study Area (“LPRSA”) portion of the Diamond Alkali Superfund Site. STWB, now owned by Bayer Corporation, is a potentially responsible party at the LPRSA site based on alleged releases from facilities formerly owned by subsidiaries of Sterling. On February 29, 2012, the Company notified STWB and Bayer that, under the bankruptcy proceeding, it elected to discontinue funding and participation in remedial investigations of the LPRSA. STWB and its parent, Bayer, filed proofs of claim against the Debtors in the Chapter 11 Cases. These claims have been discharged pursuant to the Plan. Four sites that are owned by the Company were not resolved by the discharge.
On January 14, 2015, the Company sold its property in Middleway, West Virginia and transferred the related environmental liability to Commercial Liability Partners WV, LLC (CLP). As part of the transaction, the Company withdrew from its Voluntary Remediation Agreement with the West Virginia Department of Environmental Protection, received an indemnity from CLP regarding any environmental obligations, and was named insured in an environmental insurance policy for a period of ten years in the case of breach by CLP. As of December 31, 2014, the $2 million net book value of the Middleway property was classified in Current assets held for sale and the environmental liability of approximately $9 million was classified as Current liabilities held for sale. The Company released the environmental liability associated with the site and recognized a gain of approximately $3 million on the transaction in 2015.
Estimates of the amount and timing of future costs of environmental remediation requirements are by their nature imprecise because of the continuing evolution of environmental laws and regulatory requirements, the availability and application of technology, the identification of presently unknown remediation sites and the allocation of costs among the potentially responsible parties. Based on information presently available, Kodak does not believe it is reasonably possible that losses for known exposures could exceed current accruals by material amounts, although costs could be material to a particular quarter or year.
Asset Retirement Obligations
Kodak’s asset retirement obligations primarily relate to asbestos contained in buildings that Kodak owns. In many of the countries in which Kodak operates, environmental regulations exist that require Kodak to handle and dispose of asbestos in a special manner if a building undergoes major renovations or is demolished. Otherwise, Kodak is not required to remove the asbestos from its buildings. Kodak records a liability equal to the estimated fair value of its obligation to perform asset retirement activities related to the asbestos, computed using an expected present value technique, when sufficient information exists to calculate the fair value. Kodak does not have a liability recorded related to every building that contains asbestos because Kodak cannot estimate the fair value of its obligation for certain buildings due to a lack of sufficient information about the range of time over which the obligation may be settled through demolition, renovation or sale of the building.
67
The following table provides asset retirement obligation activity:
|
Successor
|
Predecessor
|
|||||||||||
|
(in millions)
|
For the Year Ended
December 31,
2014
|
For the Four Months Ended December 31,
2013
|
For the Eight Months Ended
August 31,
2013
|
|||||||||
|
Asset Retirement Obligations at start of period
|
$ | 52 | $ | 51 | $ | 63 | ||||||
|
Liabilities incurred in the current period
|
3 | - | 1 | |||||||||
|
Liabilities settled in the current period
|
(1 | ) | - | (5 | ) | |||||||
|
Accretion expense
|
2 | 1 | 1 | |||||||||
|
Revision in estimated cash flows
|
(2 | ) | - | (1 | ) | |||||||
|
Foreign exchange impact
|
(1 | ) | - | (1 | ) | |||||||
|
Impact of fresh start accounting
|
- | - | (7 | ) | ||||||||
|
Asset Retirement Obligations at end of period
|
$ | 53 | $ | 52 | $ | 51 | ||||||
Other Commitments and Contingencies
The Company and its subsidiaries have entered into operating leases for various real estate and equipment needs. Rental expense, net of minor sublease income, amounted to $38 million, $15 million, $36 million and $60 million in the year ended December 31, 2014, four months ending December 31, 2013, eight months ending August 31, 2013 and year ended December 31, 2012, respectively.
As of December 31, 2014, the Company had outstanding letters of credit of $123 million issued under the ABL Credit Agreement as well as bank guarantees and letters of credit of $5 million, surety bonds in the amount of $19 million, and restricted cash and deposits of $50 million, primarily to ensure the payment of possible casualty and workers’ compensation claims, environmental liabilities, legal contingencies, rental payments, and to support various customs, hedging, tax and trade activities. The restricted cash and deposits are recorded in Restricted cash, Other current assets and Other long-term assets in the Consolidated Statement of Financial Position.
Kodak’s Brazilian operations are involved in various litigation matters and have received or been the subject of numerous governmental assessments related to indirect and other taxes in various stages of litigation, as well as civil litigation and disputes associated with former employees and contract labor. The tax matters, which comprise the majority of the litigation matters, are primarily related to federal and state value-added taxes. Kodak is disputing these matters and intends to vigorously defend its position. Based on the opinion of legal counsel and current reserves already recorded for those matters deemed probable of loss, management does not believe that the ultimate resolution of these matters will materially impact Kodak’s results of operations or financial position. Kodak routinely assesses all these matters as to the probability of ultimately incurring a liability in its Brazilian operations and records its best estimate of the ultimate loss in situations where it assesses the likelihood of loss as probable. As of December 31, 2014, the unreserved portion of these contingencies, inclusive of any related interest and penalties, for which there was at least a reasonable possibility that a loss may be incurred, amounted to approximately $50 million.
In connection with assessments in Brazil, local regulations may require Kodak to post security for a portion of the amounts in dispute. As of December 31, 2014, Kodak has posted security composed of $8 million of pledged cash reported within Restricted cash in the Consolidated Statement of Financial Position and liens on certain Brazilian assets with a net book value of approximately $90 million. Generally, any encumbrances on the Brazilian assets would be removed to the extent the matter is resolved in Kodak's favor.
Kodak is involved in various lawsuits, claims, investigations, remediation and proceedings, including commercial, customs, employment, environmental, and health and safety matters, which are being handled and defended in the ordinary course of business. Kodak is also subject, from time to time, to various assertions, claims, proceedings and requests for indemnification concerning intellectual property, including patent infringement suits involving technologies that are incorporated in a broad spectrum of Kodak’s products. These matters are in various stages of investigation and litigation, and are being vigorously defended.
Based on information currently available Kodak does not believe that it is probable that the outcomes in any of these matters, individually or collectively, will have a material adverse effect on its financial condition or results of operations. Litigation is inherently unpredictable, and judgments could be rendered or settlements entered that could adversely affect Kodak’s operating results or cash flows in a particular period. Kodak routinely assesses all of its litigation and threatened litigation as to the probability of ultimately incurring a liability, and records its best estimate of the ultimate loss in situations where it assesses the likelihood of loss as probable.
68
EKC guarantees obligations to third parties for some of its consolidated subsidiaries. The maximum amount guaranteed is $34 million and the outstanding amount for those guarantees is $20 million.
In connection with the settlement of certain of the Company’s historical environmental liabilities at Eastman Business Park (“EBP”) and in accordance with the terms of the Amended EBP Settlement Agreement, in the event the historical liabilities exceed $99 million, the Company will become liable for 50% of the portion above $99 million with no limitation to the maximum potential future payments. There is no liability recorded for this guarantee.
Indemnifications
Kodak issues indemnifications in certain instances when it sells businesses and real estate, and in the ordinary course of business with its customers, suppliers, service providers and business partners. Further, Kodak indemnifies officers and directors who are, or were, serving at the Company’s request in such capacities. Historically, costs incurred to settle claims related to these indemnifications have not been material to Kodak’s financial position, results of operations or cash flows. Additionally, the fair value of the indemnifications that Kodak issued during the year ended December 31, 2014 was not material to Kodak’s financial position, results of operations or cash flows.
Warranty Costs
Kodak has warranty obligations in connection with the sale of its products and equipment. The original warranty period is generally one year or less. The costs incurred to provide for these warranty obligations are estimated and recorded as an accrued liability at the time of sale. Kodak estimates its warranty cost at the point of sale for a given product based on historical failure rates and related costs to repair. The change in Kodak's accrued warranty obligations balance, which is reflected in Other current liabilities in the accompanying Consolidated Statement of Financial Position, was as follows:
(in millions)
|
Accrued warranty obligations as of December 31, 2012 (Predecessor)
|
$ | 29 | ||
|
Actual warranty experience
|
(24 | ) | ||
|
Warranty provisions
|
13 | |||
|
Accrued warranty obligations as of August 31, 2013 (Predecessor)
|
$ | 18 | ||
|
Actual warranty experience
|
$ | (10 | ) | |
|
Warranty provisions
|
5 | |||
|
Accrued warranty obligations as of December 31, 2013 (Successor)
|
13 | |||
|
Actual warranty experience
|
(16 | ) | ||
|
Warranty provisions
|
8 | |||
|
Accrued warranty obligations as of December 31, 2014 (Successor)
|
$ | 5 | ||
69
Kodak also offers its customers extended warranty arrangements that are generally one year, but may range from three months to five years after the original warranty period. Kodak provides repair services and routine maintenance under these arrangements. Kodak has not separated the extended warranty revenues and costs from the routine maintenance service revenues and costs, as it is not practicable to do so. Therefore, these revenues and costs have been aggregated in the discussion that follows. The change in Kodak's deferred revenue balance in relation to these extended warranty and maintenance arrangements, which is reflected in Other current liabilities in the accompanying Consolidated Statement of Financial Position, was as follows:
(in millions)
|
Deferred revenue on extended warranties as of December 31, 2012 (Predecessor)
|
$ | 43 | ||
|
New extended warranty and maintenance arrangements
|
139 | |||
|
Recognition of extended warranty and maintenance arrangement revenue
|
(148 | ) | ||
|
Deferred revenue on extended warranties as of August 31, 2013 (Predecessor)
|
$ | 34 | ||
|
Impact of fresh start accounting
|
$ | (8 | ) | |
|
New extended warranty and maintenance arrangements
|
68 | |||
|
Recognition of extended warranty and maintenance arrangement revenue
|
(64 | ) | ||
|
Deferred revenue on extended warranties as of December 31, 2013 (Successor)
|
30 | |||
|
New extended warranty and maintenance arrangements
|
194 | |||
|
Recognition of extended warranty and maintenance arrangement revenue
|
(197 | ) | ||
|
Deferred revenue on extended warranties as of December 31, 2014 (Successor)
|
$ | 27 | ||
Costs incurred under these extended warranty and maintenance arrangements for the year ended December 31, 2014, four months ended December 31, 2013 and eight months ended August 31, 2013 amounted to $158 million, $56 million and $110 million, respectively.
70
The following table presents the carrying amounts, estimated fair values, and location in the Consolidated Statement of Financial Position for Kodak’s financial instruments:
|
Value Of Items Recorded At Fair Value
|
|||||||||||||||||
|
(in millions)
|
As of December 31, 2014
|
||||||||||||||||
|
Total
|
Level 1
|
Level 2
|
Level 3
|
||||||||||||||
|
ASSETS
|
|||||||||||||||||
|
Derivatives
|
|||||||||||||||||
|
Short-term foreign exchange contracts
|
Receivables, net
|
$ | 2 | $ | - | $ | 2 | $ | - | ||||||||
|
Marketable securities
|
|||||||||||||||||
|
Long-term available-for-sale securities
|
Other long-term assets
|
3 | 3 | - | - | ||||||||||||
|
LIABILITIES
|
|||||||||||||||||
|
Derivatives
|
|||||||||||||||||
|
Short-term foreign exchange contracts
|
Other current liabilities
|
1 | - | 1 | - | ||||||||||||
|
Value Of Items Not Recorded At Fair Value
|
||||||||||||||||||
|
As of December 31, 2014
|
||||||||||||||||||
|
Total
|
Level 1
|
Level 2
|
Level 3
|
|||||||||||||||
|
LIABILITIES
|
||||||||||||||||||
|
Debt
|
||||||||||||||||||
|
Short-term debt
|
Short-term borrowings and current portion of long-term debt
|
Carrying value
|
$ | 5 | $ | - | $ | 5 | $ | - | ||||||||
|
Fair value
|
5 | - | 5 | - | ||||||||||||||
|
Long-term debt
|
Long-term debt, net of current portion
|
Carrying value
|
672 | - | 672 | - | ||||||||||||
|
Fair value
|
681 | - | 681 | - | ||||||||||||||
|
Value Of Items Recorded At Fair Value
As of December 31, 2013
|
|||||||||||||||||
|
(in millions)
|
|||||||||||||||||
|
Total
|
Level 1
|
Level 2
|
Level 3
|
||||||||||||||
|
ASSETS
|
|||||||||||||||||
|
Derivatives
|
|||||||||||||||||
|
Short-term foreign exchange contracts
|
Receivables, net
|
$ | 1 | $ | - | $ | 1 | $ | - | ||||||||
| - | |||||||||||||||||
|
Marketable securities
|
|||||||||||||||||
|
Long-term available-for-sale
|
Other long-term assets
|
2 | 2 | - | - | ||||||||||||
|
LIABILITIES
|
|||||||||||||||||
|
Derivatives
|
|||||||||||||||||
|
Short-term foreign exchange contracts
|
Other current liabilities
|
3 | - | 3 | - | ||||||||||||
71
|
Value Of Items Not Recorded At Fair Value
As of December 31, 2013
|
||||||||||||||||||
|
(in millions)
|
||||||||||||||||||
|
Total
|
Level 1
|
Level 2
|
Level 3
|
|||||||||||||||
|
LIABILITIES
|
||||||||||||||||||
|
Debt
|
||||||||||||||||||
|
Short-term debt
|
Short-term borrowings and current portion of long-term debt
|
Carrying value
|
$ | 4 | $ | - | $ | 4 | $ | - | ||||||||
|
Fair value
|
4 | - | 4 | - | ||||||||||||||
|
Long-term debt
|
Long-term debt, net of current portion
|
Carrying value
|
674 | - | 674 | - | ||||||||||||
|
Fair value
|
687 | - | 687 | - | ||||||||||||||
Kodak does not utilize financial instruments for trading or other speculative purposes.
72
Fair Value
Fair values of marketable securities are determined using quoted prices in active markets for identical assets (Level 1 fair value measurements). Fair values of Kodak’s forward contracts are determined using observable inputs (Level 2 fair value measurements), and are based on the present value of expected future cash flows (an income approach valuation technique) considering the risks involved and using discount rates appropriate for the duration of the contracts. Transfers between levels of the fair value hierarchy are recognized based on the actual date of the event or change in circumstances that caused the transfer. There were no transfers between levels of the fair value hierarchy during the year ended December 31, 2014.
Fair values of long-term borrowings are determined by reference to quoted market prices, if available, or by pricing models based on the value of related cash flows discounted at current market interest rates. The carrying values of cash and cash equivalents and restricted cash (which are not shown in the table above) approximate their fair values.
Foreign Exchange
Foreign exchange gains and losses arising from transactions denominated in a currency other than the functional currency of the entity involved are included in Other (charges) income, net in the accompanying Consolidated Statement of Operations. The net effects of foreign currency transactions, including changes in the fair value of foreign exchange contracts, are shown below:
|
(in millions)
|
Successor
|
Predecessor
|
||||||||||||||
|
For the Year Ended
December 31,
2014
|
For the Four Months Ended
December 31,
2013
|
For the Eight Months Ended
August 31,
2013
|
For Year Ended
December 31,
2012
|
|||||||||||||
|
Net loss
|
$ | (22 | ) | $ | (5 | ) | $ | (7 | ) | $ | (14 | ) | ||||
Derivative Financial Instruments
Kodak, as a result of its global operating and financing activities, is exposed to changes in foreign currency exchange rates, commodity prices, and interest rates, which may adversely affect its results of operations and financial position. Kodak manages such exposures, in part, with derivative financial instruments.
Foreign currency forward contracts are used to mitigate currency risk related to foreign currency denominated assets and liabilities. Kodak’s exposure to changes in interest rates results from its investing and borrowing activities used to meet its liquidity needs.
Kodak’s financial instrument counterparties are high-quality investment or commercial banks with significant experience with such instruments. Kodak manages exposure to counterparty credit risk by requiring specific minimum credit standards and diversification of counterparties. Kodak has procedures to monitor the credit exposure amounts. The maximum credit exposure at December 31, 2014 was not significant to Kodak.
73
In the event of a default under the Company’s Term Credit Agreements, the ABL Credit Agreement, or a default under any derivative contract or similar obligation of Kodak, subject to certain minimum thresholds, the derivative counterparties would have the right, although not the obligation, to require immediate settlement of some or all open derivative contracts at their then-current fair value, but with liability positions netted against asset positions with the same counterparty. At December 31, 2014, Kodak had open derivative contracts in liability positions with a total fair value of $1 million.
The location and amounts of gains and losses related to derivatives reported in the Consolidated Statement of Operations are shown in the following tables:
|
Derivatives Not Designated as Hedging Instruments, Foreign Exchange Contracts
|
||||||||||||||||
|
Location of Gain or (Loss) Recognized in Income on Derivatives
|
Gain (Loss) Recognized in Income on Derivative
|
|||||||||||||||
|
Successor
|
Predecessor
|
|||||||||||||||
|
(in millions)
|
For the Year Ended
December 31,
2014
|
For the Four Months Ended
December 31,
2013
|
For the Eight Months Ended
August 31,
2013
|
For the Year Ended
December 31,
2012
|
||||||||||||
|
Other (charges) income, net
|
$ | 10 | $ | (14 | ) | $ | 2 | $ | - | |||||||
Foreign Currency Forward Contracts
Kodak’s foreign currency forward contracts used to mitigate currency risk related to existing foreign currency denominated assets and liabilities are not designated as hedges, and are marked to market through net (loss) earnings at the same time that the exposed assets and liabilities are re-measured through net (loss) earnings (both in Other (charges) income, net in the Consolidated Statement of Operations). The notional amount of such contracts open at December 31, 2014 and 2013 was approximately $334 million and $536 million, respectively. The majority of the contracts of this type held by Kodak are denominated in euros.
74
|
Successor
|
Predecessor
|
|||||||||||||||
|
(in millions)
|
Year Ended
December 31,
2014
|
Four Months Ended
December 31,
2013
|
Eight Months Ended
August 31,
2013
|
Year Ended
December 31,
2012
|
||||||||||||
|
Expense (income) :
|
||||||||||||||||
|
Gain on sale of digital imaging patent portfolio
(1)
|
$ | - | $ | - | $ | (535 | ) | $ | - | |||||||
|
Goodwill and intangible impairments
(2) (3) (4)
|
9 | 8 | 77 | - | ||||||||||||
|
Supply arrangement termination payment
(6)
|
- | - | - | (35 | ) | |||||||||||
|
Gains related to the sales of assets and businesses
(5) (7)
|
(3 | ) | (6 | ) | (34 | ) | (50 | ) | ||||||||
|
Other
|
3 | - | (3 | ) | - | |||||||||||
|
Total
|
$ | 9 | $ | 2 | $ | (495 | ) | $ | (85 | ) | ||||||
|
(1)
|
Refer to Note 24, “Emergence from Voluntary Reorganization under Chapter 11 Proceedings.
|
|
(2)
|
In the fourth quarter of 2014, Kodak recorded an impairment charge of $9 million related to in-process research and development. Refer to Note 5, “Goodwill and Other Intangible Assets.”
|
|
(3)
|
In the fourth quarter of 2013, Kodak recorded an impairment charge of $8 million related to the Kodak trade name. Refer to Note 5, “Goodwill and Other Intangible Assets.”
|
|
(4)
|
In the first quarter of 2013, Kodak recorded an impairment charge of $77 million related to the Intellectual Property and Brand Licensing reporting unit. Refer to Note 5, “Goodwill and Other Intangible Assets.”
|
|
(5)
|
In March 2012, Kodak sold a property in Mexico for approximately $41 million and leased back the property for a one-year term. The pre-tax gain on the property sale of approximately $34 million was deferred due to Kodak’s continuing involvement in the property for the remainder of the lease term. In March 2013, the deferred gain was recognized as the lease term expired.
|
|
(6)
|
In the fourth quarter of 2012, Kodak received cash proceeds of approximately $35 million associated with the termination of a supply arrangement.
|
|
(7)
|
In December 2003, Kodak sold a property in France for approximately $65 million, net of direct selling costs, and then leased back a portion of this property for a nine-year term. The entire gain on the property sale was deferred due to Kodak's significant continuing involvement in the property. In the fourth quarter of 2012, the lease term expired and Kodak’s continuing involvement in the property ended. As a result, Kodak recognized a gain of approximately $50 million.
|
|
Successor
|
Predecessor
|
|||||||||||||||
|
(in millions)
|
Year Ended
December 31,
2014
|
Four Months Ended
December 31,
2013
|
Eight Months Ended
August 31,
2013
|
Year Ended
December 31,
2012
|
||||||||||||
|
Income (charges):
|
||||||||||||||||
|
Interest income
|
$ | 6 | $ | 3 | $ | 3 | $ | 10 | ||||||||
|
Gain on sale of investment
|
- | - | - | 23 | ||||||||||||
|
Loss on foreign exchange transactions
(1)
|
(22 | ) | (5 | ) | (7 | ) | (14 | ) | ||||||||
|
Other
|
(5 | ) | 12 | (9 | ) | 2 | ||||||||||
|
Total
|
$ | (21 | ) | $ | 10 | $ | (13 | ) | $ | 21 | ||||||
|
(1)
|
In the fourth quarter of 2014, Kodak recorded a charge of $16 million from the remeasurement of its Venezuelan subsidiary’s monetary assets. Refer to Note 1, “Basis of Presentation and Significant Accounting Policies”, “Foreign Currency” section.
|
75
The components of (loss) earnings from continuing operations before income taxes and the related provision (benefit) for U.S. and other income taxes were as follows:
|
Successor
|
Predecessor
|
|||||||||||||||
|
(in millions)
|
Year Ended
December 31,
2014
|
Four Months Ended
December 31,
2013
|
Eight Months Ended
August 31,
2013
|
Year Ended
December 31,
2012
|
||||||||||||
|
(Loss) earnings from continuing
operations before income taxes:
|
||||||||||||||||
|
U.S.
|
$ | (208 | ) | $ | (119 | ) | $ | 2,243 | $ | (1,647 | ) | |||||
|
Outside the U.S.
|
96 | 45 | 113 | 37 | ||||||||||||
|
Total
|
$ | (112 | ) | $ | (74 | ) | $ | 2,356 | $ | (1,610 | ) | |||||
|
U.S. income taxes:
|
||||||||||||||||
|
Current (benefit) provision
|
$ | (2 | ) | $ | 3 | $ | - | $ | (409 | ) | ||||||
|
Deferred provision (benefit)
|
4 | 3 | (3 | ) | 13 | |||||||||||
|
Income taxes outside the U.S.:
|
||||||||||||||||
|
Current (benefit) provision
|
(1 | ) | 8 | 52 | 58 | |||||||||||
|
Deferred provision (benefit)
|
7 | (8 | ) | 105 | 65 | |||||||||||
|
State and other income taxes:
|
||||||||||||||||
|
Current provision
|
1 | 2 | 1 | - | ||||||||||||
|
Deferred provision
|
1 | - | - | - | ||||||||||||
|
Total provision (benefit)
|
$ | 10 | $ | 8 | $ | 155 | $ | (273 | ) | |||||||
76
The differences between income taxes computed using the U.S. federal income tax rate and the provision (benefit) for income taxes for continuing operations were as follows:
|
Successor
|
Predecessor
|
|||||||||||||||
|
(in millions)
|
Year Ended
December 31,
2014
|
Four Months Ended
December 31,
2013
|
Eight Months Ended
August 31,
2013
|
Year Ended
December 31,
2012
|
||||||||||||
|
Amount computed using the statutory rate
|
$ | (39 | ) | $ | (25 | ) | $ | 825 | $ | (564 | ) | |||||
|
Increase (reduction) in taxes
|
||||||||||||||||
|
resulting from:
|
||||||||||||||||
|
State and other income taxes, net of
federal
|
1 | 2 | - | 1 | ||||||||||||
|
Unremitted foreign earnings
|
4 | 36 | 32 | 35 | ||||||||||||
|
Impact of goodwill and intangible impairments
|
- | (3 | ) | (22 | ) | - | ||||||||||
|
Operations outside the U.S.
|
111 | 73 | (18 | ) | (90 | ) | ||||||||||
|
Legislative rate changes
|
- | - | 1 | 23 | ||||||||||||
|
Valuation allowance
|
(121 | ) | (100 | ) | 39 | 312 | ||||||||||
|
Tax settlements and adjustments,
including interest
|
(5 | ) | 1 | 5 | (11 | ) | ||||||||||
|
Discharge of debt and other reorganization related items
|
57 | 24 | (722 | ) | - | |||||||||||
|
Other, net
|
2 | - | 15 | 21 | ||||||||||||
|
Provision (benefit) for income taxes
|
$ | 10 | $ | 8 | $ | 155 | $ | (273 | ) | |||||||
During 2013, a substantial portion of the Company’s pre-petition debt securities, revolving credit facility and other obligations were extinguished. Absent an exception, a debtor recognizes cancellation of indebtedness income (“CODI”) upon discharge of its outstanding indebtedness for an amount of consideration that is less than its adjusted issue price. The Internal Revenue Code of 1986, as amended (“IRC”), provides that a debtor in a bankruptcy case may exclude CODI from taxable income but must reduce certain of its tax attributes by the amount of any CODI realized as a result of the consummation of a plan of reorganization. The amount of CODI realized by a taxpayer is the adjusted issue price of any indebtedness discharged less the sum of (i) the amount of cash paid, (ii) the issue price of any new indebtedness issued and (iii) the fair market value of any other consideration, including equity, issued. As a result of the market value of equity upon emergence from chapter 11 bankruptcy proceedings, the estimated amount of U.S. CODI was approximately $705 million, which reduced the value of Kodak’s U.S. net operating losses that had a value of $2,495 million. The actual reduction in tax attributes occurred on the first day of the Company’s tax year subsequent to the date of emergence, or January 1, 2014.
IRC Sections 382 and 383 provide an annual limitation with respect to the ability of a corporation to utilize its tax attributes, as well as certain built-in-losses, against future U.S. taxable income in the event of a change in ownership. The Debtors’ emergence from chapter 11 bankruptcy proceedings was considered a change in ownership for purposes of IRC Section 382. The limitation under the IRC is based on the value of the corporation as of the emergence date. However, the ownership changes and resulting annual limitation will result in the expiration of an estimated $711 million of net operating losses, $567 million of foreign tax credits and $21 million of research and expenditure credits generated prior to the emergence date. The expiration of these tax attributes was fully offset by a corresponding decrease in Kodak’s U.S. valuation allowance, which results in no net tax provision.
During 2013, the KPP Global Settlement provided for the acquisition by the KPP of certain assets, and the assumption by the KPP of certain liabilities of Kodak’s Personalized Imaging and Document Imaging businesses (the “Business”). The underfunded position of the U.K. Pension Plan was approximately $1.5 billion. Kodak Limited held a deferred tax asset related to the pension liability of $329 million. As a result of the KPP Global Settlement in the period ended December 31, 2013 and the release from the pension liability to the KPP, Kodak Limited reversed the corresponding deferred tax asset.
77
During the eight months ended August 31, 2013, Kodak determined that it was more likely than not that a portion of its deferred tax assets outside the U.S. would not be realized due to changes in the business resulting from the KPP Global Settlement and the related sale of the Business. As a result, Kodak recorded a tax provision of $100 million associated with the establishment of a valuation allowance on those deferred tax assets.
Additionally, during the eight months ended August 31, 2013, Kodak determined that it was more likely than not that a portion of the deferred tax assets outside the U.S. would not be realized due to the change in Kodak’s business as a result of restructuring associated with the emergence from bankruptcy and accordingly, recorded a provision of $46 million associated with the establishment of a valuation allowance on those deferred tax assets.
During 2012, Kodak determined that it was more likely than not that a portion of the deferred tax assets outside the U.S. would not be realized due to reduced manufacturing volumes negatively impacting profitability in a location outside the U.S. and accordingly, recorded a provision of $30 million, associated with the establishment of a valuation allowance on those deferred tax assets.
In March 2011, Kodak filed a Request for Competent Authority Assistance with the United States Internal Revenue Service (“IRS”). The request related to a potential double taxation issue with respect to certain patent licensing royalty payments received by Kodak in 2012 and 2011. In the twelve months ended December 31, 2012, Kodak received notification that the IRS had reached agreement with the Korean National Tax Service (“NTS”) with regards to Kodak’s March 2011 request. As a result of the agreement reached by the IRS and NTS, Kodak was due a partial refund of Korean withholding taxes in the amount of $123 million. Kodak had previously agreed with the licensees that made the royalty payments that any refunds of the related Korean withholding taxes would be shared equally between Kodak and the licensees. The licensees’ share ($61 million) of the Korean withholding tax refund has therefore been reported as a licensing revenue reduction in Sales in the Consolidated Statement of Operations.
|
As of December 31,
|
||||||||
|
(in millions)
|
2014
|
2013
|
||||||
|
Deferred tax assets
|
||||||||
|
Pension and postretirement
obligations
|
$ | 221 | $ | 219 | ||||
|
Restructuring programs
|
5 | 6 | ||||||
|
Foreign tax credit
|
258 | 101 | ||||||
|
Inventories
|
20 | 18 | ||||||
|
Investment tax credit
|
100 | 125 | ||||||
|
Employee deferred compensation
|
43 | 60 | ||||||
|
Depreciation
|
45 | - | ||||||
|
Research and development costs
|
232 | 276 | ||||||
|
Tax loss carryforwards
|
355 | 372 | ||||||
|
Other deferred revenue
|
13 | 13 | ||||||
|
Other
|
111 | 168 | ||||||
|
Total deferred tax assets
|
$ | 1,403 | $ | 1,358 | ||||
|
Deferred tax liabilities
|
||||||||
|
Depreciation
|
$ | - | $ | 17 | ||||
|
Leasing
|
7 | 23 | ||||||
|
Goodwill/Intangibles
|
51 | 49 | ||||||
|
Unremitted foreign earnings
|
176 | 236 | ||||||
|
Other
|
- | 25 | ||||||
|
Total deferred tax liabilities
|
234 | 350 | ||||||
|
Net deferred tax assets before valuation
allowance
|
1,169 | 1,008 | ||||||
|
Valuation allowance
|
1,127 | 953 | ||||||
|
Net deferred tax assets
|
$ | 42 | $ | 55 | ||||
78
Deferred tax assets (liabilities) are reported in the following components within the Consolidated Statement of Financial Position:
|
As of December 31,
|
||||||||
|
(in millions)
|
2014
|
2013
|
||||||
|
Deferred income taxes (current)
|
$ | 31 | $ | 48 | ||||
|
Deferred income taxes (non-current)
|
38 | 54 | ||||||
|
Other current liabilities
|
(1 | ) | (3 | ) | ||||
|
Other long-term liabilities
|
(26 | ) | (44 | ) | ||||
|
Net deferred tax assets
|
$ | 42 | $ | 55 | ||||
As of December 31, 2014, Kodak had available domestic and foreign net operating loss carry-forwards for income tax purposes of approximately $1,352 million, of which approximately $417 million have an indefinite carry-forward period. The remaining $935 million expire between the years 2015 and 2034. As of December 31, 2014, Kodak had unused foreign tax credits and investment tax credits of $258 million and $100 million, respectively, with various expiration dates through 2029. Utilization of post-emergence net operating losses and tax credits may be subject to limitations in the event of significant changes in stock ownership of the Company in the future.
The undistributed earnings of Kodak’s foreign subsidiaries are not considered permanently reinvested. Kodak has a deferred tax liability (net of related foreign tax credits) of $159 million and $213 million on the foreign subsidiaries’ undistributed earnings as of December 31, 2014 and 2013, respectively. Kodak has recorded a deferred tax liability of $17 million and $23 million for the potential foreign withholding taxes on the undistributed earnings as of December 31, 2014 and 2013, respectively.
Kodak’s valuation allowance as of December 31, 2014 was $1,127 million. Of this amount, $315 million was attributable to Kodak’s net deferred tax assets outside the U.S. of $400 million, and $812 million related to Kodak’s net deferred tax assets in the U.S. of $769 million, for which Kodak believes it is not more likely than not that the assets will be realized.
Kodak’s valuation allowance as of December 31, 2013 was $953 million. Of this amount, $373 million was attributable to Kodak’s net deferred tax assets outside the U.S. of $470 million, and $580 million related to Kodak’s net deferred tax assets in the U.S. of $538 million, for which Kodak believes it is not more likely than not that the assets will be realized.
The net deferred tax assets in excess of the valuation allowance of approximately $42 million and $55 million as of December 31, 2014 and December 31, 2013, respectively, relate primarily to net operating loss carry-forwards, certain tax credits, and pension related tax benefits for which Kodak believes it is more likely than not that the assets will be realized.
79
Accounting for Uncertainty in Income Taxes
A reconciliation of the beginning and ending amount of Kodak’s liability for income taxes associated with unrecognized tax benefits is as follows:
|
Successor
|
Predecessor
|
|||||||||||||||
|
(in millions)
|
Year Ended
December 31,
2014
|
Four Months Ended
December 31,
2013
|
Eight Months Ended
August 31,
2013
|
Year Ended
December 31,
2012
|
||||||||||||
|
Balance as of January 1
|
$ | 106 | $ | 107 | $ | 57 | $ | 76 | ||||||||
|
Tax positions related to the current year:
|
||||||||||||||||
|
Additions
|
2 | - | 68 | 4 | ||||||||||||
|
Tax Positions related to prior years:
|
||||||||||||||||
|
Additions
|
1 | 2 | 1 | 3 | ||||||||||||
|
Reductions
|
(14 | ) | (3 | ) | (17 | ) | (17 | ) | ||||||||
|
Settlements with taxing jurisdictions
|
(1 | ) | - | (2 | ) | (3 | ) | |||||||||
|
Lapses in Statute of limitations
|
(2 | ) | - | - | (6 | ) | ||||||||||
|
Balance as of December 31
|
$ | 92 | $ | 106 | $ | 107 | $ | 57 | ||||||||
Kodak’s policy regarding interest and/or penalties related to income tax matters is to recognize such items as a component of income tax (benefit) expense. Kodak had approximately $18 million of interest and penalties associated with uncertain tax benefits accrued as of both December 31, 2014 and 2013.
If the unrecognized tax benefits were recognized, they would favorably affect the effective income tax rate in the period recognized. Kodak has classified certain income tax liabilities as current or noncurrent based on management’s estimate of when these liabilities will be settled. The current liabilities are recorded in Other current liabilities in the Consolidated Statement of Financial Position. Noncurrent income tax liabilities are recorded in Other long-term liabilities in the Consolidated Statement of Financial Position.
It is reasonably possible that the liability associated with Kodak’s unrecognized tax benefits will increase or decrease within the next twelve months. These changes may be the result of settling ongoing audits or the expiration of statutes of limitations. Such changes to the unrecognized tax benefits could range from $0 to $10 million based on current estimates. Audit outcomes and the timing of audit settlements are subject to significant uncertainty. Although management believes that adequate provision has been made for such issues, there is the possibility that the ultimate resolution of such issues could have an adverse effect on the earnings of Kodak. Conversely, if these issues are resolved favorably in the future, the related provision would be reduced, thus having a positive impact on earnings.
During 2014, Kodak reached a settlement outside of the U.S. and settled an audit for calendar year 2003. Kodak originally recorded liabilities for uncertain tax positions (“UTPs”) totaling $8 million (plus interest of approximately $2 million). The settlement resulted in a reduction in Other current liabilities and the recognition of a $10 million tax benefit.
During 2013, Kodak paid $2 million associated with the resolution of $17 million of various state and local tax claims that were agreed upon through the bankruptcy process. In addition, Kodak established a $64 million liability for unrecognized tax benefits associated with the Company’s adoption of the Plan of Reorganization.
During 2012, Kodak agreed to terms with a tax authority outside of the U.S. and settled audits for calendar years 2002 through 2007. For these years, Kodak originally recorded liabilities for UTPs totaling $12 million (plus interest of approximately $4 million). The settlement resulted in a reduction in Other current liabilities and the recognition of a $16 million tax benefit.
Kodak files numerous consolidated and separate income tax returns in the U.S. federal jurisdiction and in many state and foreign jurisdictions. Kodak has substantially concluded all U.S. federal and state income tax matters for years through 2011. Substantially
all material foreign income tax matters have been concluded for years through 2008. Kodak’s tax matters for the years 2007 through 2013 remain subject to examination by the respective foreign tax jurisdiction authorities.
80
Kodak recognizes the need to continually rationalize its workforce and streamline its operations in the face of ongoing business and economic changes. Charges for restructuring initiatives are recorded in the period in which Kodak commits to a formalized restructuring plan, or executes the specific actions contemplated by the plan and all criteria for liability recognition under the applicable accounting guidance have been met.
The activity in the accrued balances and the non-cash charges and credits incurred in relation to restructuring programs during the three years ended December 31, 2014 were as follows:
|
(in millions)
|
Severance Reserve
(6)
|
Exit Costs Reserve
(6)
|
Long-lived Asset Impairments and Inventory Write-downs
(6)
|
Accelerated Depreciation
(6)
|
Total
|
|||||||||||||||
|
Balance as of December 31, 2011 (Predecessor):
|
$ | 38 | $ | 22 | $ | - | $ | - | $ | 60 | ||||||||||
|
2012 charges - continuing operations
(1)
|
158 | 35 | 26 | 13 | 232 | |||||||||||||||
|
2012 charges - discontinued operations
(1)
|
29 | 2 | 8 | - | 39 | |||||||||||||||
|
2012 utilization/cash payments
|
(86 | ) | (13 | ) | (34 | ) | (13 | ) | (146 | ) | ||||||||||
|
2012 other adjustments & reclasses
(2)
|
(101 | ) | (1 | ) | - | - | (102 | ) | ||||||||||||
|
Balance as of December 31, 2012 (Predecessor):
|
38 | 45 | - | - | 83 | |||||||||||||||
|
Eight months charges - continuing operations
|
38 | 3 | 4 | 4 | 49 | |||||||||||||||
|
Eight months charges - discontinued operations
|
3 | - | - | - | 3 | |||||||||||||||
|
Eight months utilization/cash payments
|
(48 | ) | (32 | ) | (4 | ) | (4 | ) | (88 | ) | ||||||||||
|
Eight months other adjustments & reclasses
(3)
|
(3 | ) | (9 | ) | - | - | (12 | ) | ||||||||||||
|
Balance as of August 31, 2013 (Predecessor):
|
$ | 28 | $ | 7 | $ | - | $ | - | $ | 35 | ||||||||||
|
Four months charges - continuing operations
|
$ | 13 | $ | 3 | $ | 1 | $ | - | $ | 17 | ||||||||||
|
Four months charges - discontinued operations
|
- | - | - | - | - | |||||||||||||||
|
Four months utilization/cash payments
|
(15 | ) | (3 | ) | (1 | ) | - | (19 | ) | |||||||||||
|
Four months other adjustments & reclasses
(4)
|
- | 1 | - | - | 1 | |||||||||||||||
|
Balance as of December 31, 2013 (Successor):
|
26 | 8 | - | - | 34 | |||||||||||||||
|
2014 charges - continuing operations
|
54 | 2 | 3 | 2 | 61 | |||||||||||||||
|
2014 utilization/cash payments
|
(47 | ) | (5 | ) | (3 | ) | (2 | ) | (57 | ) | ||||||||||
|
2014 other adjustments & reclasses
(5)
|
(11 | ) | - | - | - | (11 | ) | |||||||||||||
|
Balance as of December 31, 2014 (Successor):
|
$ | 22 | $ | 5 | $ | - | $ | - | $ | 27 | ||||||||||
|
(1)
|
Severance reserve activity includes termination benefit charges of $186 million, and net curtailment and settlement losses related to these actions of $1 million.
|
|
(2)
|
Includes $(100) million of severance related charges for pension plan curtailments, settlements, and special termination benefits, which were reclassified to Pension and other postretirement liabilities and Other long-term assets and $(2) million for amounts reclassified as Liabilities subject to compromise.
|
|
(3)
|
The $(12) million includes $(5) million for amounts reclassified as Liabilities subject to compromise, $(4) million of severance-related charges for pension plan curtailments, which were reclassified to Pension and other postretirement liabilities and $(3) million of reserve adjustments due to the application of fresh start accounting, which were recorded in Reorganization items.
|
|
(4)
|
The $1 million represents foreign currency translation adjustments.
|
|
(5)
|
The $(11) million includes $(8) million of severance related charges for pension plan special termination benefits, which were reclassified to Pension and other postretirement liabilities and $(3) million of foreign currency translation adjustments.
|
|
(6)
|
The severance and exit costs reserves require the outlay of cash, while long-lived asset impairments, accelerated depreciation and inventory write-downs represent non-cash items.
|
81
2012 Activity
The $271 million of charges for the year 2012 includes $13 million of charges for accelerated depreciation and $4 million for inventory write-downs, which were reported in Cost of revenues in the accompanying Consolidated Statement of Operations, and $39 million which was reported as Earnings (loss) from discontinued operations. The remaining costs incurred of $215 million, including $158 million of severance costs, $35 million of exit costs, and $22 million of long-lived asset impairments, were reported as Restructuring costs and other in the accompanying Consolidated Statement of Operations.
The 2012 severance costs related to the elimination of approximately 3,225 positions, including approximately 1,775 manufacturing/service, 1,050 administrative and 400 research and development positions. The geographic composition of these positions includes approximately 1,925 in the United States and Canada, and 1,300 throughout the rest of the world.
As a result of these initiatives, severance payments were paid during periods through 2014 since, in many instances, the employees whose positions were eliminated can elect or are required to receive their payments over an extended period of time. In addition, certain exit costs, such as long-term lease payments, will continue beyond 2014.
2013 Activity
The $17 million of charges for the four months ended December 31, 2013 were reported as Restructuring costs and other in the accompanying Consolidated Statement of Operations. The $52 million of charges for the eight months ended August 31, 2013 includes $4 million for accelerated depreciation and $2 million for inventory write-downs which were reported in Cost of revenues, $43 million reported as Restructuring costs and other and $3 million which were reported as Earnings (loss) from discontinued operations in the accompanying Consolidated Statement of Operations.
The 2013 severance costs related to the elimination of approximately 825 positions, including approximately 500 manufacturing/service, 300 administrative and 25 research and development positions. The geographic composition of these positions included approximately 375 in the U.S. and Canada, and 450 throughout the rest of the world.
As a result of these initiatives, severance payments were paid during periods through 2014 since, in many instances, the employees whose positions were eliminated can elect or are required to receive their payments over an extended period of time. In addition, certain exit costs, such as long-term lease payments, will continue beyond 2014.
2014 Activity
Restructuring actions taken in 2014 included steps toward exiting a plate manufacturing facility in the U.K., as described in further detail below. In addition, actions were initiated to reduce Kodak’s cost structure as part of its commitment to drive sustainable profitability and included a workforce reduction in France, manufacturing capacity reductions in the U.S., a research and development site consolidation in the U.S., and various targeted reductions in service, sales, research and development and other administrative functions.
As a result of these actions, for the year ended December 31, 2014 Kodak recorded $61 million of charges, including $2 million for accelerated depreciation which was reported in Cost of sales and $59 million which was reported as Restructuring costs and other in the accompanying Consolidated Statement of Operations.
The 2014 severance costs related to the elimination of approximately 775 positions, including approximately 325 manufacturing/service, 350 administrative and 100 research and development positions. The geographic composition of these positions included approximately 425 in the U.S. and Canada, and 350 throughout the rest of the world.
As a result of these initiatives, severance payments will be paid during periods through 2015 since, in many instances, the employees whose positions were eliminated can elect or are required to receive their payments over an extended period of time. In addition, certain exit costs, such as long-term lease payments, will be paid over periods throughout 2015 and beyond.
82
Leeds Plate Manufacturing Facility Exit
On March 3, 2014, Kodak announced a plan to exit its prepress plate manufacturing facility located in Leeds, England. This decision was pursuant to Kodak’s initiative to consolidate manufacturing operations globally, and is expected to result in a more efficient delivery of its products and solutions. Kodak began the exit of the facility in the second quarter of 2014, and expects to phase out production at the site from mid to late 2015 and to complete the exit of the facility by the second quarter of 2016.
As a result of the decision, Kodak originally expected to incur total charges of $30 to $40 million, including $8 to $10 million of charges related to separation benefits, $20 to $25 million of non-cash related charges for accelerated depreciation and asset write-offs and $2 to $5 million in other cash related charges associated with this action. Based on refinements in estimates, Kodak now expects to incur total charges of $20 to $30 million, including $10 to $15 million of non-cash related charges for accelerated depreciation and asset write-offs. The estimates for separation benefits and other cash related charges remain unchanged.
Kodak implemented certain actions under this program during 2014. As a result of these actions, Kodak recorded severance charges of $3 million, long-lived asset impairment charges of $2 million, and accelerated depreciation charges of $2 million.
Substantially all
U.S. employees are covered by a noncontributory defined benefit plan, the Kodak Retirement Income Plan (“KRIP”), which is funded by Company contributions to an irrevocable trust fund. The funding policy for KRIP is to contribute amounts sufficient to meet minimum funding requirements as determined by employee benefit and tax laws plus any additional amounts the Company determines to be appropriate. Assets in the trust fund are held for the sole benefit of participating employees and retirees. They are composed of corporate equity and debt securities, U.S. government securities, partnership investments, interests in pooled funds, commodities, real estate, and various types of interest rate, foreign currency, debt, and equity market financial instruments.
For U.S. employees hired prior to March 1999 KRIP’s benefits were generally based on a formula recognizing length of service and final average earnings. KRIP included a separate cash balance formula for all U.S. employees hired after February 1999, as well as employees hired prior to that date who opted in to the cash balance formula during a special election period. In July of 2014 the Company announced an amendment to KRIP, effective January 1, 2015, in which all participants will accrue benefits under a single, revised cash balance formula (the “Cash Balance Plan”). The Cash Balance Plan credits employees' hypothetical accounts with an amount equal to 7% of their pay, plus interest based on the 30-year Treasury bond rate. As part of the KRIP amendment, the Company match on contributions to the Savings and Investment Plan (“SIP”), a defined contribution plan, of up to 3% for employees participating under the previous 4% cash balance formula has been eliminated. The Company’s contributions to SIP were $5 million and $6 million for 2014 and 2013, respectively.
Many subsidiaries and branches operating outside the U.S. have defined benefit retirement plans covering substantially all employees. Contributions by Kodak for these plans are typically deposited under government or other fiduciary-type arrangements. Retirement benefits are generally based on contractual agreements that provide for benefit formulas using years of service and/or compensation prior to retirement. The actuarial assumptions used for these plans reflect the diverse economic environments within the various countries in which Kodak operates.
Information on the major funded and unfunded U.S. and Non-U.S. defined benefit pension plans is presented below. The composition of the major plans may vary from year to year. If the major plan composition changes, prior year data is conformed to ensure comparability.
The measurement date used to determine the pension obligation for all funded and unfunded U.S. and Non-U.S. defined benefit plans is December 31.
83
|
Successor
|
Predecessor
|
|||||||||||||||||||||||
|
(in millions)
|
Year Ended
December 31, 2014
|
Four Months Ended
December 31, 2013
|
Eight Months Ended
August 31, 2013
|
|||||||||||||||||||||
|
U.S.
|
Non-U.S.
|
U.S.
|
Non-U.S.
|
U.S.
|
Non-U.S.
|
|||||||||||||||||||
|
Change in Benefit Obligation
|
||||||||||||||||||||||||
|
Projected benefit obligation at beginning of period
|
$ | 4,361 | $ | 1,010 | $ | 4,969 | $ | 1,008 | $ | 5,415 | $ | 4,192 | ||||||||||||
|
Transfers
|
- | (31 | ) | - | - | (49 | ) | - | ||||||||||||||||
|
Service cost
|
18 | 4 | 7 | 2 | 19 | 6 | ||||||||||||||||||
|
Interest cost
|
176 | 30 | 67 | 11 | 120 | 95 | ||||||||||||||||||
|
Participant contributions
|
- | - | - | - | - | 1 | ||||||||||||||||||
|
Plan amendments
|
(61 | ) | - | - | (6 | ) | - | - | ||||||||||||||||
|
Benefit payments
|
(346 | ) | (76 | ) | (123 | ) | (29 | ) | (247 | ) | (138 | ) | ||||||||||||
|
Actuarial (gain) loss
|
574 | 99 | (27 | ) | 4 | (269 | ) | (104 | ) | |||||||||||||||
|
Curtailments
|
- | 1 | - | (1 | ) | (20 | ) | (7 | ) | |||||||||||||||
|
Settlements
|
(292 | ) | - | (532 | ) | - | - | (2,890 | ) | |||||||||||||||
|
Special termination benefits
|
8 | - | - | - | - | - | ||||||||||||||||||
|
Currency adjustments
|
- | (105 | ) | - | 21 | - | (147 | ) | ||||||||||||||||
|
Projected benefit obligation at end of period
|
$ | 4,438 | $ | 932 | $ | 4,361 | $ | 1,010 | $ | 4,969 | $ | 1,008 | ||||||||||||
|
Change in Plan Assets
|
||||||||||||||||||||||||
|
Fair value of plan assets at beginning of period
|
$ | 4,184 | $ | 848 | $ | 4,647 | $ | 832 | $ | 4,848 | $ | 2,417 | ||||||||||||
|
Transfers
|
- | (9 | ) | - | - | - | - | |||||||||||||||||
|
Gain on plan assets
|
614 | 116 | 192 | 26 | 46 | 77 | ||||||||||||||||||
|
Employer contributions
|
- | 12 | - | 4 | - | 20 | ||||||||||||||||||
|
Participant contributions
|
- | - | - | - | - | 1 | ||||||||||||||||||
|
Settlements
|
(292 | ) | - | (532 | ) | - | - | (1,463 | ) | |||||||||||||||
|
Benefit payments
|
(346 | ) | (76 | ) | (123 | ) | (29 | ) | (247 | ) | (138 | ) | ||||||||||||
|
Currency adjustments
|
- | (87 | ) | - | 15 | - | (82 | ) | ||||||||||||||||
|
Fair value of plan assets at end of period
|
$ | 4,160 | $ | 804 | $ | 4,184 | $ | 848 | $ | 4,647 | $ | 832 | ||||||||||||
|
Under Funded Status at end of period
|
$ | (278 | ) | $ | (128 | ) | $ | (177 | ) | $ | (162 | ) | $ | (322 | ) | $ | (176 | ) | ||||||
|
Accumulated benefit obligation at end of period
|
$ | 4,436 | $ | 921 | $ | 4,308 | $ | 990 | ||||||||||||||||
The Non-US transfers of $31 million of projected benefit obligation and $9 million of assets for the year ended December 31, 2014 relate to a plan split for a subset of participants into a non-major plan. The transfers of $49 million in the eight months ended August 31, 2013 represent pre-petition obligations related to U.S. non-qualified pension plans which were discharged pursuant to the terms of the Plan.
The settlement amounts above of $292 million and $532 million for the U.S. in the Successor periods are a result of lump sum payments from KRIP. The settlement amounts in the eight months ended August 31, 2013 are primarily a result of the Global Settlement.
The mortality assumption is the basis for determining the longevity of Kodak’s pension plan participants and the expected period over which those participants will receive pension benefits. A recent study released by the Society of Actuaries in the U.S. indicated that life expectancies have increased over the past several years and are longer than what was assumed by most existing mortality tables. Kodak’s projected benefit obligation in the U.S. as of December 31, 2014 reflects a change in the underlying mortality assumption, which reflects improvements in life expectancy consistent with the Society of Actuaries’ study and Kodak’s plan specific experience. Kodak’s projected benefit obligation in the U.S. also reflects an increase in the expected rate of future longevity improvement taking into consideration data from multiple sources including the Society of Actuaries’ study and plan specific data.
84
Amounts recognized in the Consolidated Statement of Financial Position for all major funded and unfunded U.S. and Non-U.S. defined benefit plans are as follows:
|
As of December 31,
|
||||||||||||||||
|
(in millions)
|
2014
|
2013
|
||||||||||||||
|
U.S.
|
Non-U.S.
|
U.S.
|
Non-U.S.
|
|||||||||||||
|
Other long-term assets
|
$ | - | $ | 29 | $ | - | $ | - | ||||||||
|
Other current liabilities
|
- | - | - | (1 | ) | |||||||||||
|
Pension and other postretirement liabilities
|
(278 | ) | (157 | ) | (177 | ) | (161 | ) | ||||||||
|
Net amount recognized
|
$ | (278 | ) | $ | (128 | ) | $ | (177 | ) | $ | (162 | ) | ||||
Information with respect to the major funded and unfunded U.S. and Non-U.S. defined benefit plans with an accumulated benefit obligation in excess of plan assets is as follows:
|
As of December 31,
|
||||||||||||||||
|
(in millions)
|
2014
|
2013
|
||||||||||||||
|
U.S.
|
Non-U.S.
|
U.S.
|
Non-U.S.
|
|||||||||||||
|
Projected benefit obligation
|
$ | 4,438 | $ | 637 | $ | 4,361 | $ | 1,010 | ||||||||
|
Accumulated benefit obligation
|
4,436 | 626 | 4,308 | 990 | ||||||||||||
|
Fair value of plan assets
|
4,160 | 480 | 4,184 | 848 | ||||||||||||
Amounts recognized in accumulated other comprehensive (loss) income for all major funded and unfunded U.S. and Non-U.S. defined benefit plans consist of:
|
As of December 31,
|
||||||||||||||||
|
(in millions)
|
2014
|
2013
|
||||||||||||||
|
U.S.
|
Non-U.S.
|
U.S.
|
Non-U.S.
|
|||||||||||||
|
Prior service credit
|
$ | 58 | $ | 4 | $ | - | $ | 6 | ||||||||
|
Net actuarial (loss) gain
|
(159 | ) | (11 | ) | 86 | 7 | ||||||||||
|
Total
|
$ | (101 | ) | $ | (7 | ) | $ | 86 | $ | 13 | ||||||
85
Other changes in plan assets and benefit obligations recognized in Other comprehensive income (expense) are as follows:
|
Successor
|
Predecessor
|
|||||||||||||||||||||||
|
Year Ended
December 31, 2014
|
Four Months Ended
December 31, 2013
|
Eight Months Ended
August 31, 2013
|
||||||||||||||||||||||
|
(in millions)
|
U.S.
|
Non-U.S.
|
U.S.
|
Non-U.S.
|
U.S.
|
Non-U.S.
|
||||||||||||||||||
|
Newly established (loss) gain
|
$ | (255 | ) | $ | (21 | ) | $ | 97 | $ | 7 | $ | 80 | $ | 75 | ||||||||||
|
Newly established prior service credit
|
61 | - | - | 6 | - | - | ||||||||||||||||||
|
Amortization of:
|
||||||||||||||||||||||||
|
Prior service (credit) cost
|
(3 | ) | - | - | - | 1 | 1 | |||||||||||||||||
|
Net actuarial loss
|
- | - | - | - | 120 | 55 | ||||||||||||||||||
|
Prior service cost recognized due to
curtailment
|
- | - | - | - | 1 | 13 | ||||||||||||||||||
|
Net curtailment (loss) gain not recognized in
expense
|
- | (1 | ) | - | - | 20 | 7 | |||||||||||||||||
|
Net loss (gain) recognized in expense due to settlements
|
10 | - | (11 | ) | - | - | 1,542 | |||||||||||||||||
|
Transfers
|
- | 1 | - | - | - | - | ||||||||||||||||||
|
Total Income (loss) recognized in Other
comprehensive income before fresh start accounting
|
$ | (187 | ) | $ | (21 | ) | $ | 86 | $ | 13 | $ | 222 | $ | 1,693 | ||||||||||
|
Effect of application of fresh start accounting
|
$ | 1,955 | $ | 436 | ||||||||||||||||||||
The Company expects to recognize $7 million of prior service credits and $3 million of net actuarial gains as components of net periodic benefit cost over the next year.
86
Pension (income) expense for all defined benefit plans included:
|
Successor
|
Predecessor
|
||||||||||||||||||||||||||||||
|
(in millions)
|
Year Ended
|
Four Months Ended
|
Eight Months Ended
|
Year Ended
|
|||||||||||||||||||||||||||
|
December 31, 2014
|
December 31, 2013
|
August 31, 2013
|
December 31, 2012
|
||||||||||||||||||||||||||||
|
U.S.
|
Non-U.S.
|
U.S.
|
Non-U.S.
|
U.S.
|
Non-U.S.
|
U.S.
|
Non-U.S.
|
||||||||||||||||||||||||
|
Major defined benefit plans:
|
|||||||||||||||||||||||||||||||
|
Service cost
|
$ | 18 | $ | 4 | $ | 7 | $ | 2 | $ | 19 | $ | 6 | $ | 46 | $ | 10 | |||||||||||||||
|
Interest cost
|
176 | 30 | 67 | 11 | 120 | 95 | 206 | 154 | |||||||||||||||||||||||
|
Expected return on plan assets
|
(295 | ) | (38 | ) | (122 | ) | (15 | ) | (236 | ) | (106 | ) | (389 | ) | (161 | ) | |||||||||||||||
|
Amortization of:
|
|||||||||||||||||||||||||||||||
|
Prior service credit
|
(3 | ) | - | - | - | 1 | 1 | 1 | 3 | ||||||||||||||||||||||
|
Actuarial loss
|
- | - | - | - | 120 | 55 | 166 | 64 | |||||||||||||||||||||||
|
Pension (income) expense before special
termination benefits, curtailments and
settlements
|
(104 | ) | (4 | ) | (48 | ) | (2 | ) | 24 | 51 | 30 | 70 | |||||||||||||||||||
|
Special termination benefits
|
8 | - | - | - | - | - | 97 | - | |||||||||||||||||||||||
|
Curtailment (gains) losses
|
- | - | - | (1 | ) | 1 | 13 | - | (1 | ) | |||||||||||||||||||||
|
Settlement (gains) losses
|
10 | - | (11 | ) | - | - | 114 | - | - | ||||||||||||||||||||||
|
Net pension (income) expense for major
defined benefit plans
|
(86 | ) | (4 | ) | (59 | ) | (3 | ) | 25 | 178 | 127 | 69 | |||||||||||||||||||
|
Other plans including unfunded plans
|
- | 8 | - | - | 4 | 7 | 11 | 15 | |||||||||||||||||||||||
|
Net pension (income) expense
|
$ | (86 | ) | $ | 4 | $ | (59 | ) | $ | (3 | ) | $ | 29 | $ | 185 | $ | 138 | $ | 84 | ||||||||||||
The pension (income) expense before special termination benefits, curtailments, and settlements reported above for the eight months ended August 31, 2013 and year ended December 31, 2012 (Predecessor) includes $38 million and $53 million respectively, which was reported as Earnings (loss) from discontinued operations.
The special termination benefits of $8 million for the year ended December 31, 2014 and $97 million for the year ended December 31, 2012 were incurred as a result of Kodak's restructuring actions and, therefore, have been included in Restructuring costs and other in the Consolidated Statement of Operations for those periods.
For the eight months ended August 31, 2013, $5 million of the Non-U.S. curtailment losses were incurred as a result of Kodak’s restructuring actions, and have been included in Restructuring costs and other in the Consolidated Statement of Operations. The remaining curtailment losses of $8 million have been included in Earnings (loss) from discontinued operations in the Consolidated Statement of Operations. The $114 million of settlement losses were incurred as a result of the Global Settlement, and have been included in Earnings (loss) from discontinued operations in the Consolidated Statement of Operations.
The weighted-average assumptions used to determine the benefit obligation amounts for all major funded and unfunded U.S. and Non-U.S. defined benefit plans were as follows:
|
Successor
|
Predecessor
|
|||||||||||||||||||||||
|
December 31, 2014
|
December 31, 2013
|
August 31, 2013
|
||||||||||||||||||||||
|
U.S.
|
Non-U.S.
|
U.S.
|
Non-U.S.
|
U.S.
|
Non-U.S.
|
|||||||||||||||||||
|
Discount rate
|
3.50 | % | 2.07 | % | 4.50 | % | 3.30 | % | 4.25 | % | 3.24 | % | ||||||||||||
|
Salary increase rate
|
3.34 | % | 1.95 | % | 3.37 | % | 2.77 | % | 3.39 | % | 2.80 | % | ||||||||||||
87
The weighted-average assumptions used to determine net pension (income) expense for all the major funded and unfunded U.S. and Non-U.S. defined benefit plans were as follows:
|
Successor
|
Predecessor
|
|||||||||||||||||||||||||||||||
|
Year Ended
|
Four Months Ended
|
Eight Months Ended
|
Year Ended
|
|||||||||||||||||||||||||||||
|
December 31, 2014
|
December 31, 2013
|
August 31, 2013
|
December 31, 2012
|
|||||||||||||||||||||||||||||
|
U.S.
|
Non-U.S.
|
U.S.
|
Non-U.S.
|
U.S.
|
Non-U.S.
|
U.S.
|
Non-U.S.
|
|||||||||||||||||||||||||
|
Discount rate
|
4.16 | % | 3.24 | % | 4.25 | % | 3.24 | % | 3.52 | % | 3.59 | % | 4.26 | % | 4.46 | % | ||||||||||||||||
|
Salary increase rate
|
3.37 | % | 2.66 | % | 3.39 | % | 2.80 | % | 3.40 | % | 2.83 | % | 3.45 | % | 2.98 | % | ||||||||||||||||
|
Expected long-term rate of return on plan
assets
|
7.63 | % | 4.88 | % | 8.20 | % | 5.51 | % | 8.12 | % | 6.63 | % | 8.52 | % | 7.11 | % | ||||||||||||||||
Plan Asset Investment Strategy
The investment strategy underlying the asset allocation for the pension assets is to achieve an optimal return on assets with an acceptable level of risk while providing for the long-term liabilities, and maintaining sufficient liquidity to pay current benefits and other cash obligations of the plans. This is primarily achieved by investing in a broad portfolio constructed of various asset classes including equity and equity-like investments, debt and debt-like investments, real estate, private equity and other assets and instruments. Long duration bonds and Treasury bond futures are used to partially match the long-term nature of plan liabilities. Other investment objectives include maintaining broad diversification between and within asset classes and fund managers, and managing asset volatility relative to plan liabilities.
Every three years, or when market conditions have changed materially, each of Kodak’s major pension plans will undertake an asset allocation or asset and liability modeling study. The asset allocation and expected return on the plans’ assets are individually set to provide for benefits and other cash obligations within each country’s legal investment constraints.
Actual allocations may vary from the target asset allocations due to market value fluctuations, the length of time it takes to implement changes in strategy, and the timing of cash contributions and cash requirements of the plans. The asset allocations are monitored, and are rebalanced in accordance with the policy set forth for each plan.
The total plan assets attributable to the major U.S. defined benefit plans at December 31, 2014 relate to KRIP. The expected long-term rate of return on plan assets assumption (“EROA”) is based on a combination of formal asset and liability studies that include forward-looking return expectations given the current asset allocation. A review of the EROA as of December 31, 2014, based upon the current asset allocation and forward-looking expected returns for the various asset classes in which KRIP invests, resulted in an EROA of 7.4%.
As with KRIP, the EROA assumptions for certain of Kodak’s other pension plans were reassessed as of December 31, 2014. The annual expected return on plan assets for the major non-U.S. pension plans range from 2.7% to 6.7% based on the plans’ respective asset allocations as of December 31, 2014.
Plan Asset Risk Management
Kodak evaluates its defined benefit plans’ asset portfolios for the existence of significant concentrations of risk. Types of concentrations that are evaluated include, but are not limited to, investment concentrations in a single entity, type of industry, foreign country, and individual fund. As of December 31, 2014 and 2013, there were no significant concentrations (defined as greater than 10 % of plan assets) of risk in Kodak’s defined benefit plan assets.
88
The Company's weighted-average asset allocations for its major U.S. defined benefit pension plans by asset category, are as follows:
|
As of December 31,
|
||||||||||||
|
2014
|
2013
|
2014 Target
|
||||||||||
|
Asset Category
|
||||||||||||
|
Equity securities
|
15 | % | 16 | % | 10-20 | % | ||||||
|
Debt securities
|
35 | % | 30 | % | 30-40 | % | ||||||
|
Real estate
|
3 | % | 5 | % | 2-8 | % | ||||||
|
Cash and cash equivalents
|
3 | % | 14 | % | 0-6 | % | ||||||
|
Global balanced asset allocation funds
|
14 | % | 13 | % | 10-20 | % | ||||||
|
Other
|
30 | % | 22 | % | 25-35 | % | ||||||
|
Total
|
100 | % | 100 | % | ||||||||
The Company's weighted-average asset allocations for its major Non-U.S. defined benefit pension plans by asset category, are as follows:
|
As of December 31,
|
||||||||||||
|
2014
|
2013
|
2014 Target
|
||||||||||
|
Asset Category
|
||||||||||||
|
Equity securities
|
6 | % | 18 | % | 2-12 | % | ||||||
|
Debt securities
|
27 | % | 27 | % | 22-32 | % | ||||||
|
Real estate
|
1 | % | 1 | % | 0-3 | % | ||||||
|
Cash and cash equivalents
|
4 | % | 3 | % | 0-8 | % | ||||||
|
Global balanced asset allocation funds
|
11 | % | 6 | % | 5-15 | % | ||||||
|
Other
|
51 | % | 45 | % | 45-55 | % | ||||||
|
Total
|
100 | % | 100 | % | ||||||||
Fair Value Measurements
Kodak’s asset allocations by level within the fair value hierarchy at December 31, 2014 and 2013 are presented in the tables below for Kodak’s major defined benefit plans. Kodak’s plan assets were accounted for at fair value and are classified in their entirety based on the lowest level of input that is significant to the fair value measurement. Kodak’s assessment of the significance of a particular input to the fair value measurement requires judgment, and may affect the valuation of fair value of assets and their placement within the fair value hierarchy levels.
89
Major U.S. Plans
December 31, 2014
|
U.S.
|
||||||||||||||||
|
(in millions)
|
Quoted Prices in Active Markets for Identical Assets
(Level 1)
|
Significant Observable Inputs
(Level 2)
|
Significant Unobservable Inputs
(Level 3)
|
Total
|
||||||||||||
|
Cash and cash equivalents
|
$ | - | $ | 114 | $ | - | $ | 114 | ||||||||
|
Equity Securities
|
- | 408 | 223 | 631 | ||||||||||||
|
Debt Securities:
|
||||||||||||||||
|
Government Bonds
|
- | 595 | 395 | 990 | ||||||||||||
|
Investment Grade Bonds
|
- | 442 | - | 442 | ||||||||||||
|
Real Estate
|
- | - | 139 | 139 | ||||||||||||
|
Global Balanced Asset Allocation Funds
|
- | 587 | - | 587 | ||||||||||||
|
Other:
|
||||||||||||||||
|
Absolute Return
|
- | 58 | 368 | 426 | ||||||||||||
|
Private Equity
|
- | - | 781 | 781 | ||||||||||||
|
Derivatives with unrealized gains
|
50 | - | - | 50 | ||||||||||||
| $ | 50 | $ | 2,204 | $ | 1,906 | $ | 4,160 | |||||||||
90
Major U.S. Plans
December 31, 2013
|
U.S.
|
||||||||||||||||
|
(in millions)
|
Quoted Prices in Active Markets for Identical Assets
(Level 1)
|
Significant Observable Inputs
(Level 2)
|
Significant Unobservable Inputs
(Level 3)
|
Total
|
||||||||||||
|
Cash and cash equivalents
|
$ | - | $ | 587 | $ | - | $ | 587 | ||||||||
|
Equity Securities
|
- | 481 | 183 | 664 | ||||||||||||
|
Debt Securities:
|
||||||||||||||||
|
Government Bonds
|
- | 224 | 205 | 429 | ||||||||||||
|
Inflation-Linked Bonds
|
- | 39 | 105 | 144 | ||||||||||||
|
Investment Grade Bonds
|
- | 234 | - | 234 | ||||||||||||
|
Global High Yield & Emerging Market Debt
|
- | 263 | 178 | 441 | ||||||||||||
|
Real Estate
|
- | - | 200 | 200 | ||||||||||||
|
Global Balanced Asset Allocation Funds
|
- | 540 | - | 540 | ||||||||||||
|
Other:
|
||||||||||||||||
|
Private Equity
|
- | - | 951 | 951 | ||||||||||||
|
Derivatives with unrealized gains
|
16 | - | - | 16 | ||||||||||||
|
Derivatives with unrealized losses
|
(22 | ) | - | - | (22 | ) | ||||||||||
| $ | (6 | ) | $ | 2,368 | $ | 1,822 | $ | 4,184 | ||||||||
For Kodak’s major U.S. defined benefit pension plans, equity investments are invested broadly in U.S. equity, developed international equity, and emerging markets. Fixed income investments are comprised primarily of long duration U.S. Treasuries and global government bonds, U.S. below investment-grade corporate bonds, as well as U.S. and emerging market companies’ debt securities diversified by sector, geography, and through a wide range of market capitalizations. Real estate investments include investments in office, industrial, retail and apartment properties. Private equity investments are primarily comprised of limited partnerships and fund-of-fund investments that invest in distressed investments, venture capital, leveraged buyout and special situation funds. Natural resource investments in oil and gas partnerships and timber funds are also included in this category. Absolute return investments are comprised of a diversified portfolio of hedge funds using equity, debt, commodity, and currency strategies held separate from the derivative-linked hedge funds described later in this footnote.
91
Major Non-U.S. Plans
December 31, 2014
|
Non - U.S.
|
||||||||||||||||
|
(in millions)
|
Quoted Prices in Active Markets for Identical Assets
(Level 1)
|
Significant Observable Inputs
(Level 2)
|
Significant Unobservable Inputs
(Level 3)
|
Total
|
||||||||||||
|
Cash and cash equivalents
|
$ | - | $ | 36 | $ | - | $ | 36 | ||||||||
|
Equity Securities
|
- | 33 | 13 | 46 | ||||||||||||
|
Debt Securities:
|
||||||||||||||||
|
Government Bonds
|
- | 124 | 38 | 162 | ||||||||||||
|
Inflation-Linked Bonds
|
- | 9 | - | 9 | ||||||||||||
|
Investment Grade Bonds
|
- | 37 | - | 37 | ||||||||||||
|
Global High Yield & Emerging Market Debt
|
- | 11 | - | 11 | ||||||||||||
|
Real Estate
|
- | 3 | - | 3 | ||||||||||||
|
Global Balanced Asset Allocation Funds
|
- | 91 | - | 91 | ||||||||||||
|
Other:
|
||||||||||||||||
|
Absolute Return
|
- | 11 | - | 11 | ||||||||||||
|
Private Equity
|
- | - | 55 | 55 | ||||||||||||
|
Insurance Contracts
|
- | 340 | - | 340 | ||||||||||||
|
Derivatives with unrealized gains
|
5 | - | - | 5 | ||||||||||||
|
Derivatives with unrealized losses
|
(2 | ) | - | - | (2 | ) | ||||||||||
| $ | 3 | $ | 695 | $ | 106 | $ | 804 | |||||||||
92
Major Non-U.S. Plans
December 31, 2013
|
Non - U.S.
|
||||||||||||||||
|
(in millions)
|
Quoted Prices in Active Markets for Identical Assets
(Level 1)
|
Significant Observable Inputs
(Level 2)
|
Significant Unobservable Inputs
(Level 3)
|
Total
|
||||||||||||
|
Cash and cash equivalents
|
$ | - | $ | 21 | $ | - | $ | 21 | ||||||||
|
Equity Securities
|
- | 137 | 15 | 152 | ||||||||||||
|
Debt Securities:
|
||||||||||||||||
|
Government Bonds
|
- | 101 | 32 | 133 | ||||||||||||
|
Inflation-Linked Bonds
|
- | 10 | - | 10 | ||||||||||||
|
Investment Grade Bonds
|
- | 62 | - | 62 | ||||||||||||
|
Global High Yield & Emerging Market Debt
|
- | 24 | - | 24 | ||||||||||||
|
Real Estate
|
- | 4 | 5 | 9 | ||||||||||||
|
Global Balanced Asset Allocation Funds
|
- | 53 | - | 53 | ||||||||||||
|
Other:
|
||||||||||||||||
|
Absolute Return
|
- | 36 | - | 36 | ||||||||||||
|
Private Equity
|
- | 2 | 54 | 56 | ||||||||||||
|
Insurance Contracts
|
- | 295 | - | 295 | ||||||||||||
|
Derivatives with unrealized gains
|
1 | - | - | 1 | ||||||||||||
|
Derivatives with unrealized losses
|
(4 | ) | - | - | (4 | ) | ||||||||||
| $ | (3 | ) | $ | 745 | $ | 106 | $ | 848 | ||||||||
For Kodak’s major non-U.S. defined benefit pension plans, equity investments are invested broadly in local equity, developed international and emerging markets. Fixed income investments are comprised primarily of long duration government and corporate bonds with some emerging market debt. Real estate investments include investments in primarily office, industrial, and retail properties. Private equity investments are comprised of limited partnerships and fund-of-fund investments that invest in distressed investments, venture capital and leveraged buyout funds. Absolute return investments are comprised of a diversified portfolio of hedge funds using equity, debt, commodity, and currency strategies held separate from the derivative-linked hedge funds described later in this footnote.
Cash and cash equivalents are valued utilizing cost approach valuation techniques. Equity and debt securities are valued using a market approach based on the closing price on the last business day of the year (if the securities are traded on an active market), or based on the proportionate share of the estimated fair value of the underlying assets (net asset value). Other investments are valued using a combination of market, income, and cost approaches, based on the nature of the investment. Absolute return investments are primarily valued based on net asset value derived from observable market inputs. Real estate investments are valued primarily based on independent appraisals and discounted cash flow models, taking into consideration discount rates and local market conditions. Private equity investments are valued primarily based on independent appraisals, discounted cash flow models, cost, and comparable market transactions, which include inputs such as discount rates and pricing data from the most recent equity financing. Insurance contracts are primarily valued based on contract values, which approximate fair value.
Some of the plans’ assets, primarily absolute return, real estate, and private equity, do not have readily determinable market values due to the nature of these investments. For these investments, fund manager or general partner estimates were used where available. The estimates for the absolute return assets are derived from observable inputs, based on the fair value of the underlying positions, which have readily available market prices. For investments with lagged pricing, Kodak used the available net asset values, and also considered expected return, subsequent cash flows and material events.
93
For all of Kodak’s major defined benefit pension plans, investment managers are selected that are expected to provide best-in-class asset management for their particular asset class, and expected returns greater than those expected from existing salable assets, especially if this would maintain the aggregate volatility desired for each plan’s portfolio. Investment managers are retained for the purpose of managing specific investment strategies within contractual investment guidelines. Certain investment managers are authorized to invest in derivatives such as futures, swaps, and currency forward contracts. Investments in futures and swaps are used to obtain targeted exposure to a particular asset, index or bond duration and only require a portion of the cash to gain exposure to the notional value of the underlying investment. The remaining cash is available to be deployed and in some cases is invested in a diversified portfolio of various uncorrelated hedge fund strategies that provide added returns at a lower level of risk. Of the investments shown in the major U.S. plans table above, 9% and 25% of the total pension assets as of December 31, 2014 reported in equity securities and government bonds, respectively, and 10%, 10%, and 3% of the total pension assets as of December 31, 2013 reported in equity securities, government bonds, and inflation-linked bonds, respectively, are reflective of the exposures gained from the use of derivatives, and are invested in a diversified portfolio of hedge funds using equity, debt, commodity, and currency strategies.
Of the investments shown in the major Non-U.S. plans table above, 1%, and 9% of the total pension assets as of December 31, 2014 reported in equity securities and government bonds, respectively, and 1%, and 10% of the total pension assets as of December 31, 2013 reported in equity securities and government bonds, respectively, are reflective of the exposures gained from the use of derivatives, and are invested in a diversified portfolio of hedge funds using equity, debt, commodity, and currency strategies.
Foreign currency contracts and swaps are used to partially hedge foreign currency risk. Additionally, Kodak’s major defined benefit pension plans invest in government bond futures or local government bonds to partially hedge the liability risk of the plans.
The following is a reconciliation of the beginning and ending balances of level 3 assets of Kodak’s major U.S. defined benefit pension plans:
(in millions)
|
Successor
|
||||||||||||||||||||
|
U.S.
|
||||||||||||||||||||
|
Balance at
January 1, 2014
|
Net Realized and Unrealized Gains/(Losses)
|
Net Purchases
and Sales
|
Net Transfer Into/(Out of)
Level 3
|
Balance at
December 31, 2014
|
||||||||||||||||
|
Equity Securities
|
$ | 183 | $ | 22 | $ | 18 | $ | - | $ | 223 | ||||||||||
|
Government Bonds
|
205 | 26 | 164 | - | 395 | |||||||||||||||
|
Inflation-Linked Bonds
|
105 | (1 | ) | (104 | ) | - | - | |||||||||||||
|
Global High Yield & Emerging Market Debt
|
178 | 25 | (203 | ) | - | - | ||||||||||||||
|
Absolute Return
|
- | (8 | ) | 293 | 83 | 368 | ||||||||||||||
|
Real Estate
|
200 | 22 | (83 | ) | - | 139 | ||||||||||||||
|
Private Equity
|
951 | 93 | (263 | ) | - | 781 | ||||||||||||||
|
Total
|
$ | 1,822 | $ | 179 | $ | (178 | ) | $ | 83 | $ | 1,906 | |||||||||
|
Successor
|
||||||||||||||||||||
|
U.S.
|
||||||||||||||||||||
|
Balance at
September 1, 2013
|
Net Realized and Unrealized Gains/(Losses)
|
Net Purchases
and Sales
|
Net Transfer Into/(Out of)
Level 3
|
Balance at
December 31, 2013
|
||||||||||||||||
|
Equity Securities
|
$ | 176 | $ | 9 | $ | (2 | ) | $ | - | $ | 183 | |||||||||
|
Government Bonds
|
204 | 5 | (4 | ) | - | 205 | ||||||||||||||
|
Inflation-Linked Bonds
|
111 | (4 | ) | (2 | ) | - | 105 | |||||||||||||
|
Global High Yield & Emerging Market Debt
|
140 | 38 | - | - | 178 | |||||||||||||||
|
Real Estate
|
204 | 6 | (10 | ) | - | 200 | ||||||||||||||
|
Private Equity
|
959 | 52 | (60 | ) | - | 951 | ||||||||||||||
|
Total
|
$ | 1,794 | $ | 106 | $ | (78 | ) | $ | - | $ | 1,822 | |||||||||
94
|
Predecessor
|
||||||||||||||||||||
|
U.S.
|
||||||||||||||||||||
|
Balance at
January 1, 2013
|
Net Realized and Unrealized Gains/(Losses)
|
Net Purchases
and Sales
|
Net Transfer Into/(Out of)
Level 3
|
Balance at
August 31, 2013
|
||||||||||||||||
|
Equity Securities
|
$ | 163 | $ | 16 | $ | 5 | $ | (8 | ) | $ | 176 | |||||||||
|
Government Bonds
|
201 | 17 | (15 | ) | 1 | 204 | ||||||||||||||
|
Inflation-Linked Bonds
|
104 | 12 | (5 | ) | - | 111 | ||||||||||||||
|
Absolute Return
|
201 | 27 | (5 | ) | (83 | ) | 140 | |||||||||||||
|
Real Estate
|
198 | 21 | (15 | ) | - | 204 | ||||||||||||||
|
Private Equity
|
1,002 | 39 | (82 | ) | - | 959 | ||||||||||||||
|
Total
|
$ | 1,869 | $ | 132 | $ | (117 | ) | $ | (90 | ) | $ | 1,794 | ||||||||
The following is a reconciliation of the beginning and ending balances of level 3 assets of Kodak’s major Non-U.S. defined benefit pension plans (in millions):
|
Successor
|
||||||||||||||||||||
|
Non-U.S.
|
||||||||||||||||||||
|
Balance at
January 1, 2014
|
Net Realized and Unrealized Gains/(Losses)
|
Net Purchases
and Sales
|
Net Transfer Into/(Out of)
Level 3
|
Balance at
December 31, 2014
|
||||||||||||||||
|
Equity Securities
|
$ | 15 | $ | 2 | $ | (4 | ) | $ | - | $ | 13 | |||||||||
|
Government Bonds
|
32 | 4 | 2 | - | 38 | |||||||||||||||
|
Real Estate
|
5 | - | (5 | ) | - | - | ||||||||||||||
|
Private Equity
|
54 | 9 | (8 | ) | - | 55 | ||||||||||||||
|
Total
|
$ | 106 | $ | 15 | $ | (15 | ) | $ | - | $ | 106 | |||||||||
95
|
Successor
|
||||||||||||||||||||
|
Non-U.S.
|
||||||||||||||||||||
|
Balance at
September 1, 2013
|
Net Realized and Unrealized Gains/(Losses)
|
Net Purchases
and Sales
|
Net Transfer Into/(Out of)
Level 3
|
Balance at
December 31, 2013
|
||||||||||||||||
|
Equity Securities
|
$ | 15 | $ | 1 | $ | (1 | ) | $ | - | $ | 15 | |||||||||
|
Government Bonds
|
30 | 2 | - | - | 32 | |||||||||||||||
|
Real Estate
|
7 | - | (2 | ) | - | 5 | ||||||||||||||
|
Private Equity
|
55 | 1 | (2 | ) | - | 54 | ||||||||||||||
|
Total
|
$ | 107 | $ | 4 | $ | (5 | ) | $ | - | $ | 106 | |||||||||
|
|
Predecessor
|
|||||||||||||||||||
|
Non-U.S.
|
||||||||||||||||||||
|
Balance at
January 1, 2013
|
Net Realized and Unrealized Gains/(Losses)
|
Net Purchases
and Sales
|
Net Transfer Into/(Out of)
Level 3
|
Balance at
August 31, 2013
|
||||||||||||||||
|
Equity Securities
|
$ | 13 | $ | 2 | $ | - | $ | - | $ | 15 | ||||||||||
|
Government Bonds
|
7 | 4 | 19 | - | 30 | |||||||||||||||
|
Inflation-Linked Bonds
|
251 | 21 | (272 | ) | - | - | ||||||||||||||
|
Real Estate
|
44 | (5 | ) | (32 | ) | - | 7 | |||||||||||||
|
Private Equity
|
322 | (26 | ) | (241 | ) | - | 55 | |||||||||||||
|
Total
|
$ | 637 | $ | (4 | ) | $ | (526 | ) | $ | - | $ | 107 | ||||||||
Kodak expects to contribute $15 million in 2015 for the major Non-U.S. defined benefit pension plans and does not expect to make a contribution to KRIP in 2015.
The following pension benefit payments, which reflect expected future service, are expected to be paid:
|
(in millions)
|
U.S.
|
Non-U.S.
|
||||||
|
2015
|
$ | 392 | $ | 61 | ||||
|
2016
|
354 | 57 | ||||||
|
2017
|
342 | 54 | ||||||
|
2018
|
331 | 53 | ||||||
|
2019
|
321 | 51 | ||||||
|
2020-2024
|
1,455 | 244 | ||||||
96
The Company provided U.S. medical, dental, life insurance, and survivor income benefits to eligible retirees, long-term disability recipients and their spouses, dependents and survivors. Generally, to be eligible for these benefits, former employees leaving the Company prior to January 1, 1996 were required to be 55 years of age with ten years of service or their age plus years of service must have equaled or exceeded 75. For those leaving the Company after December 31, 1995, former employees must be 55
years of age with ten years of service or have been eligible as of December 31, 1995. These benefits are paid from the general assets of the Company as they are incurred.
The Company's subsidiaries in Canada and the U.K. offer similar postretirement benefits.
On November 7, 2012, the Bankruptcy Court entered an order approving a settlement agreement between the Debtors and the Retiree Committee appointed by the U.S. Trustee which eliminated or reduced certain retiree benefits under the U.S. plan. The Company also eliminated all postretirement benefits for active employees in the U.S.
The measurement date used to determine the net benefit obligation for Kodak's other postretirement benefit plans is December 31.
Changes in Kodak’s benefit obligation and funded status for the U.S., Canada and U.K. other postretirement benefit plans were as follows:
|
Successor
|
Predecessor
|
|||||||||||
|
(in millions)
|
Year Ended
December 31,
2014
|
Four Months Ended
December 31,
2013
|
Eight Months Ended
August 31,
2013
|
|||||||||
|
Net benefit obligation at beginning of period
|
$ | 95 | $ | 98 | $ | 152 | ||||||
|
Interest cost
|
4 | 1 | 3 | |||||||||
|
Plan participants’ contributions
|
9 | 5 | 10 | |||||||||
|
Actuarial (gain) loss
|
2 | (2 | ) | (49 | ) | |||||||
|
Benefit payments
|
(18 | ) | (7 | ) | (14 | ) | ||||||
|
Currency adjustments
|
(6 | ) | - | (4 | ) | |||||||
|
Net benefit obligation at end of period
|
$ | 86 | $ | 95 | $ | 98 | ||||||
|
Underfunded status at end of period
|
$ | (86 | ) | $ | (95 | ) | $ | (98 | ) | |||
Amounts recognized in the Consolidated Statement of Financial Position for the Company's U.S., Canada and U.K. plans consist of:
|
As of December 31,
|
||||||||
|
(in millions)
|
2014
|
2013
|
||||||
|
Other current liabilities
|
$ | (8 | ) | $ | (10 | ) | ||
|
Pension and other postretirement liabilities
|
(78 | ) | (85 | ) | ||||
| $ | (86 | ) | $ | (95 | ) | |||
97
Pre-tax amounts recognized in accumulated other comprehensive loss for the Company's U.S., Canada and U.K. plans consist of:
|
As of December 31,
|
||||||||
|
(in millions)
|
2014
|
2013
|
||||||
|
Net actuarial gain
|
$ | - | $ | 2 | ||||
|
Total recorded in Accumulated other comprehensive income
|
$ | - | $ | 2 | ||||
Changes in benefit obligations recognized in Other comprehensive (loss) income consist of:
|
|
Successor
|
Predecessor
|
||||||||||
|
(in millions)
|
Year Ended
December 31,
2014
|
Four Months Ended
December 31,
2013
|
Eight Months Ended
August 31,
2013
|
|||||||||
|
Newly established (loss) gain
|
$ | (2 | ) | $ | 2 | $ | 49 | |||||
|
Amortization of:
|
||||||||||||
|
Prior service credit
|
- | - | (77 | ) | ||||||||
|
Net actuarial loss
|
- | - | 4 | |||||||||
|
Prior service credit recognized due to curtailment
|
- | - | (5 | ) | ||||||||
|
Total income (loss) recognized in Other comprehensive income (loss) before fresh start accounting
|
$ | (2 | ) | $ | 2 | $ | (29 | ) | ||||
|
Effect of application of fresh start accounting
|
$ | (1,031 | ) | |||||||||
Other postretirement benefit cost for the Company's U.S., Canada and U.K. plans included:
|
Successor
|
Predecessor
|
|||||||||||||||
|
(in millions)
|
Year Ended
December 31,
2014
|
Four Months Ended
December 31,
2013
|
Eight Months Ended
August 31,
2013
|
Year Ended
December 31,
2012
|
||||||||||||
|
Components of net postretirement benefit cost:
|
||||||||||||||||
|
Service cost
|
$ | - | $ | - | $ | - | $ | 1 | ||||||||
|
Interest cost
|
4 | 1 | 3 | 44 | ||||||||||||
|
Amortization of:
|
||||||||||||||||
|
Prior service credit
|
- | - | (75 | ) | (83 | ) | ||||||||||
|
Actuarial loss
|
- | - | 3 | 26 | ||||||||||||
|
Other postretirement benefit cost (income) before curtailments and settlements
|
$ | 4 | $ | 1 | $ | (69 | ) | $ | (12 | ) | ||||||
|
Curtailment gains
|
- | - | - | (9 | ) | |||||||||||
|
Settlement gains
|
- | - | - | (228 | ) | |||||||||||
|
Other postretirement benefit cost (income) from continuing operations
|
$ | 4 | $ | 1 | $ | (69 | ) | $ | (249 | ) | ||||||
98
The weighted-average assumptions used to determine the net benefit obligations were as follows:
|
Successor
|
Predecessor
|
|||||||||||
|
December 31,
|
December 31,
|
August 31,
|
||||||||||
|
2014
|
2013
|
2013
|
||||||||||
|
Discount rate
|
3.49 | % | 4.28 | % | 4.09 | % | ||||||
|
Salary increase rate
|
2.60 | % | 2.50 | % | 2.50 | % | ||||||
The weighted-average assumptions used to determine the net postretirement benefit cost were as follows:
|
Successor
|
Predecessor
|
|||||||||||||||
|
|
Year Ended
December 31,
2014
|
Four Months Ended
December 31,
2013
|
Eight Months Ended
August 31,
2013
|
Year Ended
December 31,
2012
|
||||||||||||
|
Discount rate
|
4.28 | % | 4.09 | % | 3.23 | % | 4.26 | % | ||||||||
|
Salary increase rate
|
2.50 | % | 2.50 | % | 2.50 | % | 3.41 | % | ||||||||
The weighted-average assumed healthcare cost trend rates used to compute the other postretirement amounts were as follows:
|
2014
|
2013
|
|||||||
|
Healthcare cost trend
|
6.47 | % | 6.51 | % | ||||
|
Rate to which the cost trend rate is assumed to decline (the ultimate trend rate)
|
4.65 | % | 5.00 | % | ||||
|
Year that the rate reaches the ultimate trend rate
|
2021 | 2020 | ||||||
A one-percentage point change in assumed healthcare cost trend rates would have the following effects:
|
(in millions)
|
1% increase
|
1% decrease
|
||||||
|
Effect on total service and interest cost
|
$ | - | $ | - | ||||
|
Effect on postretirement benefit obligation
|
7 | (5 | ) | |||||
Kodak expects to make $8 million of benefit payments for its U.S., Canada and U.K. unfunded other postretirement benefit plans in 2015.
The following other postretirement benefits, which reflect expected future service, are expected to be paid.
|
(in millions)
|
||||
|
2015
|
$ | 8 | ||
|
2016
|
7 | |||
|
2017
|
6 | |||
|
2018
|
6 | |||
|
2019
|
6 | |||
|
2020-2024
|
24 | |||
99
Basic earnings per share are calculated using the weighted-average number of shares of common stock outstanding during the period. Diluted earnings per share calculations include any dilutive effect of potential common shares. In periods with a net loss from continuing operations, diluted earnings per share are calculated using weighted-average basic shares for that period, as utilizing diluted shares would be anti-dilutive to loss per share.
Weighted-average basic and diluted shares outstanding were 41.7 million for both the year ended December 31, 2014 and the four months ended December 31, 2013 and 272.7 million and 271.8 million for the eight months ended August 31, 2013 and year ended December 31, 2012, respectively.
As a result of the net loss from continuing operations for the year ended December 31, 2014 and four months ended December 31, 2013, Kodak calculated diluted earnings per share using weighted-average basic shares outstanding for those periods. If Kodak had reported earnings from continuing operations for the year ended December 31, 2014 and four months ended December 31, 2013, the following potential shares of its common stock would have been dilutive in the computation of diluted earnings per share:
|
(in millions of shares)
|
Year Ended
|
Four Months Ended
|
||||||
|
December 31, 2014
|
December 31, 2013
|
|||||||
|
Unvested share-based awards
|
0.1 | 0.2 | ||||||
|
Warrants to purchase common shares
|
1.5 | 1.7 | ||||||
|
Total
|
1.6 | 1.9 | ||||||
The computation of diluted earnings per share for the year ended December 31, 2014 also excluded 0.1 million shares associated with the assumed conversion of outstanding employee stock options because the effects would have been anti-dilutive. There were no employee stock options outstanding for the four months ended December 31, 2013.
The Predecessor Company reported earnings from continuing operations for the eight months ended August 31, 2013. However, no additional shares of Kodak’s common stock from unvested share-based awards were included in the computation of diluted earnings per share as they were all anti-dilutive.
If Kodak had reported earnings from continuing operations for the year ended December 31, 2012, no shares of Kodak’s common stock would have been dilutive in the computation of diluted earnings per share.
The computation of diluted earnings per share for the eight months ended August 31, 2013 and the year ended December 31, 2012 also excluded the assumed conversion of outstanding employee stock options and detachable warrants to purchase common shares, and approximately $400 million of convertible senior notes due 2017 because the effects would have been anti-dilutive. The following table sets forth the total amount of outstanding employee stock options and detachable warrants to purchase common shares as of the end of each reporting period:
|
Predecessor
|
||||||
|
August 31,
|
December 31,
|
|||||
|
(in millions of shares)
|
2013
|
2012
|
||||
|
Employee stock options
|
7.0 | 7.9 | ||||
|
Detachable warrants to purchase common shares
|
40.0 | 40.0 | ||||
|
Total
|
47.0 | 47.9 | ||||
100
2013 Omnibus Incentive Plan
Kodak’s stock incentive plan consists of the 2013 Omnibus Incentive Plan (the “2013 Plan”) which replaces all prior stock-based employee benefit plans (including the 2005 Omnibus Long-Term Compensation Plan and the 2000 Omnibus Long-Term Compensation Plan). The 2013 Plan is administered by the Executive Compensation Committee of the Board of Directors, and the Board of Directors also has the authority and responsibility granted to the Executive Compensation Committee with respect to the 2013 Plan.
Awards under the 2013 Plan may be cash-based or stock-based. Officers, directors and employees of the Company and its consolidated subsidiaries are eligible to receive awards. Stock options are generally non-qualified, are at exercise prices not less than 100% of the per share fair market value on the date of grant and expire seven years after the grant date. Stock-based compensation awards granted under Kodak’s stock incentive plan are generally subject to a three-year vesting period from the date of grant. Unless sooner terminated by the Executive Compensation Committee, no awards may be granted under the 2013 Plan after the tenth anniversary of the Effective Date.
The maximum number of shares of common stock that may be issued under the 2013 Plan is approximately 4.8 million. In addition, under the 2013 Plan, the maximum number of shares available for the grant of incentive stock options is 2.0 million shares. The maximum number of shares as to which stock options or stock appreciation rights may be granted to any one person under the 2013 Plan in any calendar year is 2.0 million shares. The maximum number of performance-based compensation awards that may be granted to any one employee under the 2013 Plan in any calendar year is 1.0 million shares or, in the event such award is paid in cash, $2.5 million. The maximum number of awards that may be granted to any non-employee director under the 2013 Plan in any calendar year may not exceed a number of awards with a grant date fair value of $900,000, computed as of the grant date.
Compensation expense is recognized on a straight-line basis over the service or performance period for each separately vesting tranche of the award and is adjusted for actual forfeitures before vesting. Kodak assesses the likelihood that performance-based shares will be earned based on the probability of meeting the performance criteria. For those performance-based awards that are deemed probable of achievement, expense is recorded, and for those awards that are deemed not probable of achievement, no expense is recorded. Kodak assesses the probability of achievement each quarter.
For the year ended December 31, 2014, compensation expense related to unvested stock awards was $8 million, of which $7 million was associated with unvested restricted stock unit awards and $1 million was associated with unvested stock options. Compensation expense for the four months ended December 31, 2013 of $1 million was related to unvested restricted awards as Kodak did not issue any stock option awards during that period.
As of December 31, 2014 there was $9 million of total unrecognized compensation cost related to unvested restricted stock unit awards and $5 million of total unrecognized compensation cost related to unvested stock option awards. The unrecognized compensation cost related to unvested restricted stock unit awards is expected to be recognized over a weighted-average period of 1.7 years. The unrecognized compensation cost related to unvested stock option awards is expected to be recognized over a weighted-average period of 1.8 years.
101
Restricted Stock Units
Restricted stock units are payable in shares of the Company common stock upon vesting. The fair value is based on the closing market price of the Company’s stock on the grant date.
The following table summarizes information about restricted stock unit activity since emergence:
|
Number of
|
Weighted-Average
|
|||||||
|
Restricted
|
Grant Date
|
|||||||
|
Stock Units
|
Fair Values
|
|||||||
|
Outstanding on September 3, 2013
|
- | - | ||||||
|
Granted
|
426,503 | $ | 16.36 | |||||
|
Vested
|
53,043 | $ | 14.11 | |||||
|
Outstanding on December 31, 2013
|
373,460 | $ | 16.68 | |||||
|
Granted
|
465,491 | $ | 24.16 | |||||
|
Vested
|
126,649 | $ | 14.11 | |||||
|
Forfeited
|
26,872 | $ | 18.69 | |||||
|
Outstanding on December 31, 2014
|
685,430 | $ | 22.15 | |||||
Predecessor
Prior to the Effective Date, Kodak had shares or share-based awards outstanding under two share-based employee compensation plans consisting of the 2005 Omnibus Long-Term Compensation Plan (the “2005 Plan”), and the 2000 Omnibus Long-Term Compensation Plan (the “2000 Plan”). In conjunction with the Plan (see Note 24, “Emergence from Voluntary Reorganization under Chapter 11 Proceedings”), all shares, options, restricted shares and other share-based awards that were outstanding on the Effective Date were canceled.
Kodak recognized stock-based compensation expense in the amount of $3 million and $7 million for the eight months ended August 31, 2013, and year ended December 31, 2012, respectively. There were no proceeds from the issuance of common stock through stock option plans for the eight months ended August 31, 2013 or the year ended December 31, 2012.
.
102
In connection with the Company’s reorganization and emergence from bankruptcy, all shares of the Predecessor Company’s common stock were canceled. The Successor Company has 560 million shares of authorized stock, consisting of: (i) 500 million shares of common stock, par value $0.01 per share and (ii) 60 million shares of preferred stock, no par value, issuable in one or more series. As of December 31, 2014 and December 31, 2013 there were 41.9 million and 41.6 million shares of common stock outstanding, respectively, and no shares of preferred stock issued and outstanding.
On the Effective Date, the Company issued, to the holders of general unsecured claims and the retiree settlement unsecured claim, net-share settled warrants to purchase: (i) 2.1 million shares of common stock at an exercise price of $14.93 and (ii) 2.1 million shares of common stock at an exercise price of $16.12. The warrants are classified as equity instruments and reported within Additional paid in capital in the Consolidated Statement of Financial Position at their fair value as of the Effective Date ($24 million). As of December 31, 2014, there were warrants outstanding to purchase 3.6 million shares of common stock.
During the year ended December 31, 2014, the Company repurchased shares of common stock for approximately $1 million to satisfy tax withholding obligations in connection with the issuance of stock to employees under the 2013 Plan. During the four months ended December 31, 2013, the Company repurchased shares of common stock for approximately $3 million to satisfy tax withholding obligations in connection with the issuance of stock to employees under the Plan. Treasury stock consisted of approximately 0.2 million shares at both December 31, 2014 and December 31, 2013.
103
The changes in Other comprehensive (loss) income, by component, were as follows:
| (in millions) |
Successor
|
Predecessor
|
|||||||||||||||
|
Year Ended December 31, 2014
|
Four Months Ended December 31, 2013
|
Eight Months Ended
August 31, 2013
|
Year Ended December 31, 2012
|
||||||||||||||
|
Currency translation adjustments
|
$ | (33 | ) | $ | 1 | $ | 4 | $ | (14 | ) | |||||||
|
Unrealized (losses) gains
|
|||||||||||||||||
|
Unrealized loss arising from hedging activity before tax
|
- | - | - | (2 | ) | ||||||||||||
|
Tax provision (benefit)
|
- | - | - | (1 | ) | ||||||||||||
|
Unrealized loss arising from hedging activity net of tax
|
- | - | - | (1 | ) | ||||||||||||
|
Reclassification adjustment for hedging related gains included in net earnings, before tax
|
- | - | - | 5 | |||||||||||||
|
Tax provision
|
- | - | - | - | |||||||||||||
|
Reclassification adjustment for hedging related gains included in net earnings, net of tax
|
- | - | - | 5 | |||||||||||||
|
Pension and other postretirement benefit plan changes
|
|||||||||||||||||
|
Newly established prior service credit
|
61 | 6 | - | 460 | |||||||||||||
|
Newly established net actuarial (loss) gain
|
(278 | ) | 95 | 393 | (982 | ) | |||||||||||
|
Tax provision (benefit)
|
7 | 3 | 14 | (138 | ) | ||||||||||||
|
Newly established prior service credit and net actuarial (loss) gain, net of tax
|
(210 | ) | 98 | 379 | (384 | ) | |||||||||||
|
Reclassification adjustments:
|
|||||||||||||||||
|
Amortization of prior service credit
|
(a)
|
(3 | ) | - | (75 | ) | (82 | ) | |||||||||
|
Amortization of actuarial losses
|
(a)
|
1 | - | 185 | 268 | ||||||||||||
|
Recognition of prior service credit due to curtailments
|
(a)
|
- | - | - | (9 | ) | |||||||||||
|
Recognition of losses due to settlements and curtailments
|
(a)
|
10 | - | 1,563 | 551 | ||||||||||||
|
Total reclassification adjustments
|
8 | - | 1,673 | 728 | |||||||||||||
|
Tax provision
|
- | - | 448 | 284 | |||||||||||||
|
Reclassification adjustments, net of tax
|
8 | - | 1,225 | 444 | |||||||||||||
|
Pension and other postretirement benefit plan changes, net of tax
|
(202 | ) | 98 | 1,604 | 60 | ||||||||||||
|
Other comprehensive (loss) income
|
$ | (235 | ) | $ | 99 | $ | 1,608 | $ | 50 | ||||||||
(a)
Reclassified to Pension (income) expense - refer to Note 16, "Retirement Plans" and Note 17, "Other Postretirement Benefits" for additional information.
104
Accumulated other comprehensive (loss) income is composed of the following:
|
(in millions)
|
December 31, 2014
|
December 31, 2013
|
||||||
|
Currency translation adjustments
|
$ | (32 | ) | $ | 1 | |||
|
Pension and other postretirement benefit plan changes
|
(104 | ) | 98 | |||||
|
Ending balance
|
$ | (136 | ) | $ | 99 | |||
Current Segment Reporting Structure
Kodak has two reportable segments: the Graphics, Entertainment and Commercial Films Segment and the Digital Printing and Enterprise Segment. The balance of Kodak’s continuing operations, which do not meet the criteria of a reportable segment, are reported in All Other. A description of the segments follows.
Graphics, Entertainment and Commercial Films:
The Graphics, Entertainment and Commercial Films Segment provides digital and traditional product and service offerings to a variety of commercial industries, including commercial print, direct mail, book publishing, newspapers and magazines, packaging, motion picture entertainment, printed electronics, and the aerial and industrial film markets. The Graphics, Entertainment and Commercial Films Segment encompass Graphics, Entertainment Imaging & Commercial Films and Kodak’s intellectual property and brand licensing activities. Products and services offerings include digital plates, CTP output devices, digital controllers, unified workflow solutions and entertainment imaging and commercial films.
Digital Printing and Enterprise:
The Digital Printing and Enterprise Segment serves a variety of customers in the creative, in-plant, data center, consumer printing, commercial printing, packaging, newspaper and digital service bureau market segments with a range of software, media and hardware products that provide customers with a variety of solutions. The Digital Printing and Enterprise Segment encompasses Digital Printing, including PROSPER equipment and STREAM technology, Packaging and Functional Printing which includes the FLEXCEL NX and FLEXCEL direct platforms, Enterprise Services & Solutions, and Consumer Inkjet Systems. On September 28, 2012, Kodak announced a plan, starting in 2013, to focus its Consumer Inkjet business solely on the sale of ink to its installed printer base.
All Other:
All Other is composed of Kodak’s consumer film business in countries where that business has not yet transferred ownership to the KPP Purchasing Parties, and a utilities variable interest entity. Effective August 31, 2013 the Company sold certain utilities and related facilities and entered into utilities supply and servicing arrangements with RED-Rochester, LLC (“RED”), a variable interest entity of which Kodak is the primary beneficiary.
105
Segment financial information is shown below:
|
Successor
|
Predecessor
|
|||||||||||||||
|
Year Ended
December 31,
2014
|
Four Months Ended
December 31,
2013
|
Eight Months Ended
August 31,
2013
|
Year Ended
December 31,
2012
|
|||||||||||||
|
(in millions)
|
||||||||||||||||
|
Net sales from continuing operations:
|
||||||||||||||||
|
Graphics, Entertainment & Commercial Films
|
$ | 1,434 | $ | 521 | $ | 987 | $ | 1,680 | ||||||||
|
Digital Printing and Enterprise
|
668 | 284 | 519 | 939 | ||||||||||||
|
All Other
|
- | 2 | 36 | 100 | ||||||||||||
|
Consolidated total
|
$ | 2,102 | $ | 807 | $ | 1,542 | $ | 2,719 | ||||||||
|
Successor
|
Predecessor
|
|||||||||||||||
|
(in millions)
|
Year Ended
December 31,
2014
|
Four Months Ended
December 31,
2013
|
Eight Months Ended
August 31,
2013
|
Year Ended
December 31,
2012
|
||||||||||||
|
Segment (loss) earnings and Consolidated (loss) earnings from continuing operations before income taxes:
|
||||||||||||||||
|
Graphics, Entertainment and Commercial Films
|
$ | 31 | $ | (35 | ) | $ | 5 | $ | (210 | ) | ||||||
|
Digital Printing and Enterprise
|
(77 | ) | (59 | ) | (37 | ) | (280 | ) | ||||||||
|
Total segment (loss) earnings
|
(46 | ) | (94 | ) | (32 | ) | (490 | ) | ||||||||
|
All Other
|
(10 | ) | (3 | ) | - | (3 | ) | |||||||||
|
Restructuring costs and other
|
(61 | ) | (17 | ) | (49 | ) | (232 | ) | ||||||||
|
Corporate components of pension and OPEB income (expense)
(1)
|
110 | 67 | 43 | (2 | ) | |||||||||||
|
Other operating (expense) income, net
|
(9 | ) | (2 | ) | 495 | 86 | ||||||||||
|
Legal contingencies, settlements and other
|
(4 | ) | 3 | - | (1 | ) | ||||||||||
|
Loss on early extinguishment of debt, net
|
- | - | (8 | ) | (7 | ) | ||||||||||
|
Interest expense
|
(62 | ) | (22 | ) | (106 | ) | (139 | ) | ||||||||
|
Other (charges) income net
|
(17 | ) | 10 | (13 | ) | 21 | ||||||||||
|
Reorganization items, net
|
(13 | ) | (16 | ) | 2,026 | (843 | ) | |||||||||
|
Consolidated (loss) earnings from continuing operations before income taxes
|
$ | (112 | ) | $ | (74 | ) | $ | 2,356 | $ | (1,610 | ) | |||||
|
(1)
|
Composed of interest cost, expected return on plan assets, amortization of actuarial gains and losses, amortization of prior service credits related to the U.S. Postretirement Benefit Plan and special termination benefits, curtailments and settlement components of pension and other postretirement benefit expenses, except for settlements in connection with the chapter 11 bankruptcy proceedings that are recorded in Reorganization items, net and curtailments and settlements included in Earnings (loss) from discontinued operations, net of income taxes in the Consolidated Statement of Operations.
|
106
|
(in millions)
|
Successor
|
Predecessor
|
||||||||||
|
December 31,
|
December 31,
|
December 31,
|
||||||||||
|
2014
|
2013
|
2012
|
||||||||||
|
Segment total assets:
|
||||||||||||
|
Graphics, Entertainment and Commercial Films
|
$ | 1,049 | $ | 1,322 | $ | 1,350 | ||||||
|
Digital Printing and Enterprise
|
591 | 681 | 524 | |||||||||
|
Total of reportable segments
|
1,640 | 2,003 | 1,874 | |||||||||
|
All Other
|
121 | 156 | 189 | |||||||||
|
Cash and cash equivalents
|
712 | 844 | 1,135 | |||||||||
|
Deferred income tax assets
|
69 | 102 | 545 | |||||||||
|
Assets held for sale
|
14 | 95 | 578 | |||||||||
|
Consolidated total assets
|
$ | 2,556 | $ | 3,200 | $ | 4,321 | ||||||
|
(in millions)
|
Successor
|
Predecessor
|
||||||||||||||
|
Intangible asset amortization expense
from continuing operations:
|
Year Ended
December 31,
2014
|
Four Months Ended
December 31,
2013
|
Eight Months Ended
August 31,
2013
|
Year Ended
December 31,
2012
|
||||||||||||
|
Graphics, Entertainment and Commercial Films
|
$ | 8 | $ | 3 | $ | 7 | $ | 21 | ||||||||
|
Digital Printing and Enterprise
|
17 | 5 | 3 | 5 | ||||||||||||
|
Consolidated total
|
$ | 25 | $ | 8 | $ | 10 | $ | 26 | ||||||||
|
(in millions)
|
Successor
|
Predecessor
|
||||||||||||||
|
Depreciation expense from continuing
operations:
|
Year Ended
December 31,
2014
|
Four Months Ended
December 31,
2013
|
Eight Months Ended
August 31,
2013
|
Year Ended
December 31,
2012
|
||||||||||||
|
Graphics, Entertainment and Commercial Films
|
$ | 121 | $ | 46 | $ | 61 | $ | 100 | ||||||||
|
Digital Printing and Enterprise
|
36 | 13 | 20 | 41 | ||||||||||||
|
Sub-total
|
157 | 59 | 81 | 141 | ||||||||||||
|
Other
|
15 | 8 | 6 | 29 | ||||||||||||
|
Restructuring-related depreciation
|
2 | - | 4 | 12 | ||||||||||||
|
Consolidated total
|
$ | 174 | $ | 67 | $ | 91 | $ | 182 | ||||||||
107
|
(in millions)
|
Successor
|
Predecessor
|
||||||||||||||
|
Capital additions from continuing
operations:
|
Year Ended
December 31,
2014
|
Four Months Ended
December 31,
2013
|
Eight Months Ended
August 31,
2013
|
Year Ended
December 31,
2012
|
||||||||||||
|
Graphics, Entertainment and Commercial Films
|
$ | 22 | $ | 13 | $ | 10 | $ | 14 | ||||||||
|
Digital Printing and Enterprise
|
13 | 8 | 6 | 18 | ||||||||||||
|
Sub-total
|
35 | 21 | 16 | 32 | ||||||||||||
|
Other
|
8 | - | 2 | 1 | ||||||||||||
|
Consolidated total
|
$ | 43 | $ | 21 | $ | 18 | $ | 33 | ||||||||
|
(in millions)
|
Successor
|
Predecessor
|
||||||||||||||
|
Net sales to external customers
attributed to
(1)
:
|
Year Ended
December 31,
2014
|
Four Months Ended
December 31,
2013
|
Eight Months Ended
August 31,
2013
|
Year Ended
December 31,
2012
|
||||||||||||
|
The United States
|
$ | 737 | $ | 238 | $ | 515 | $ | 852 | ||||||||
|
Europe, Middle East and Africa
|
727 | 287 | 548 | 966 | ||||||||||||
|
Asia Pacific
|
451 | 207 | 330 | 660 | ||||||||||||
|
Canada and Latin America
|
187 | 75 | 149 | 241 | ||||||||||||
|
Non U.S. countries total
|
1,365 | 569 | 1,027 | 1,867 | ||||||||||||
|
Consolidated total
|
$ | 2,102 | $ | 807 | $ | 1,542 | $ | 2,719 | ||||||||
|
(1)
|
Sales are reported in the geographic area in which they originate. The Company’s operations in Japan generated more than 10% of net sales in the year ended December 31, 2012, totaling $274 million. No other non-U.S. country generated more than 10% of net sales in the year ended December 31, 2014, four months ended December 31, 2013, eight months ended August 31, 2013 or year ended December 31, 2012.
|
|
(in millions)
|
Successor
|
Predecessor
|
||||||||||
|
Property, plant and equipment, net located in:
|
December 31,
2014
|
December 31,
2013
|
December 31,
2012
|
|||||||||
|
The United States
|
$ | 271 | $ | 378 | $ | 395 | ||||||
|
Europe, Middle East and Africa
|
68 | 91 | 85 | |||||||||
|
Asia Pacific
|
75 | 83 | 96 | |||||||||
|
Canada and Latin America
|
110 | 132 | 31 | |||||||||
|
Non U.S. countries total
(1)
|
253 | 306 | 212 | |||||||||
|
Consolidated total
|
$ | 524 | $ | 684 | $ | 607 | ||||||
|
(1)
|
Of the total non U.S. property, plant and equipment in 2014, $95 million are located in Brazil and $59 million are located in China. Of the total non U.S. property, plant and equipment in 2013, $113 million are located in Brazil. No other non U.S. country had greater than 10% of property, plant and equipment in 2014, 2013 or 2012.
|
108
PLAN OF REORGANIZATION
On August 23, 2013, the Bankruptcy Court entered an order (the “Confirmation Order”) confirming the revised First Amended Joint Chapter 11 Plan of Reorganization of Eastman Kodak Company and its Debtor Affiliates (the “Plan”). On September 3, 2013 (the “Effective Date”), the Plan became effective and the Debtors emerged from the Chapter 11 Cases.
On or following the Effective Date and pursuant to the terms of the Plan, the following occurred:
|
|
•
|
The Debtors’ obligations under the second lien notes indentures, unsecured notes indentures, stock certificates, equity interests, and / or any other instrument or document directly or indirectly evidencing or creating any indebtedness or obligation of, or ownership interest in, the Debtors or giving rise to any claim or equity interest were cancelled, except as provided under the Plan;
|
|
|
•
|
The Company’s certificate of incorporation was amended and restated to authorize the issuance of 560 million shares of stock, consisting of 60 million shares of preferred stock, no par value, and 500 million shares of common stock, par value $0.01 per share;
|
|
|
•
|
The Company entered into a senior secured first lien term loan agreement and senior secured second lien term loan agreement for an aggregate principal amount of $695 million and a $200 million senior secured asset-based revolving credit facility;
|
|
|
•
|
The Company issued 34 million shares of common stock to unsecured creditors and the Backstop Parties (as defined below) at a per share price of $11.94, for an aggregate purchase price of approximately $406 million. In addition, the Company issued 1.7 million shares of common stock to the Backstop Parties in payment of fees pursuant to the Backstop Commitment Agreement (as defined below);
|
|
|
•
|
The Company issued 6 million shares of common stock and net-share settled warrants to purchase: (i) approximately 2.1 million shares of new common stock at an exercise price of $14.93 and (ii) approximately 2.1 million shares of new common stock at an exercise price of $16.12, to the holders of general unsecured and retiree committee unsecured claims;
|
|
|
•
|
The Debtors established a liquidating trust (the “Kodak GUC Trust”) for the benefit of holders of general unsecured and retiree committee unsecured claims, into which certain avoidance actions of the Debtors were transferred;
|
|
|
•
|
The Debtors paid approximately $94 million in administrative, priority or secured claims; and
|
|
|
•
|
The Debtors resolved claims held by the Kodak Pension Plan of the United Kingdom (the “U.K. Pension Plan”) pursuant to the terms of the Global Settlement (as defined below).
|
Backstop Commitment Agreement and Rights Offering
On June 26, 2013, the Bankruptcy Court approved the Company’s entry into a backstop commitment agreement (the “Backstop Commitment Agreement”) with GSO Capital Partners LP, on behalf of various managed funds, BlueMountain Capital Management, LLC, on behalf of various managed funds, George Karfunkel, United Equities Commodities Company, Momar Corporation and Contrarian Capital Management, LLC, on behalf of Contrarian Funds, LLC (collectively, the “Backstop Parties”), associated with rights offerings to offer eligible creditors, including the Backstop Parties, up to 34 million shares of common stock for the per share purchase price of $11.94, or an aggregate purchase price of approximately $406 million.
A portion of the shares issued in the rights offerings are restricted securities for purposes of Rule 144 under the Securities Act of 1933 and may not be offered, sold or otherwise transferred absent registration under the Securities Act of 1933 or an applicable exemption from registration requirements. The shares issued to participants in the rights offerings were issued in reliance upon the exemption from registration under the Securities Act of 1933 provided by Regulation D thereunder and/or Section 4(a)(2) thereof; or under Section 1145 of the Bankruptcy Code as securities of a debtor issued principally in exchange for claims against a debtor and partly in exchange for cash pursuant to a plan of reorganization.
109
Registration Rights Agreement
On the Effective Date, the Company and the Backstop Parties executed a registration rights agreement (the “Registration Rights Agreement”). The Registration Rights Agreement, among other rights, provides the Backstop Parties with certain registration rights with respect to the common stock.
Stockholders holding registrable securities representing 25% of the outstanding common stock as of the Effective Date may require the Company to facilitate a registered offering of registrable securities; provided that if such registration has not been consummated prior to the second anniversary of the Effective Date, stockholders holding registrable securities representing 10% of the outstanding common stock as of the Effective Date may require the Company to facilitate such an offering (such offering, the “Initial Registration”). The registrable securities requested to be sold in the Initial Registration must have an aggregate market value of at least $75 million.
Following the Initial Registration, stockholders holding 10% or more of the outstanding registrable securities may demand that the Company file a shelf registration statement and effectuate one or more takedowns off of such shelf, or, if a shelf is not available, effectuate one or more stand-alone registered offerings, provided that such non-shelf registered offerings or shelf takedowns may not be requested more than four times and, in each case, shall include shares having an aggregate market value of at least $75 million. Beginning on the second anniversary of the Effective Date, upon request of a stockholder, the Company shall amend its existing shelf registration statement to register additional registrable securities as set forth in the Registration Rights Agreement. Stockholders also have the right to include their registrable securities in the Initial Registration or any other non-shelf registered offering or shelf takedown of the common stock by the Company for its own account or for the account of any holders of common stock.
KPP Global Settlement
The Company had previously issued (pre-petition) a guarantee to Kodak Limited (the “Subsidiary”) and KPP Trustees Limited (“KPP” or the “Trustee”), as trustee for the U.K. Pension Plan. Under that arrangement, EKC guaranteed to the Subsidiary and the Trustee the ability of the Subsidiary, only to the extent it became necessary to do so, to (1) make contributions to the U.K. Pension Plan to ensure sufficient assets existed to make plan benefit payments, as they became due, if the Subsidiary otherwise would not have sufficient assets and (2) make contributions to the U.K. Pension Plan such that it would achieve fully funded status by the funding valuation for the period ending December 31, 2022.
The Subsidiary agreed to make certain contributions to the U.K. Pension Plan as determined by a funding plan agreed to by the Trustee. The Subsidiary did not pay the annual contributions due by the funding plan for 2012 or 2013. The Trustee asserted an unsecured claim against the Company of approximately $2.8 billion under the guarantee. The Subsidiary also asserted an unsecured claim under the guarantee for an unliquidated amount. The Trustee also asserted an unliquidated claim against all Debtors, as financial support direction and contribution notice claims.
On April 26, 2013, Eastman Kodak Company, the Trustee, Kodak Limited and certain other Kodak entities entered into a global settlement agreement (the “Global Settlement”) that resolved all liabilities of Kodak with respect to the U.K. Pension Plan. The Global Settlement also provided for the acquisition by KPP and/or its subsidiaries of certain assets, and the assumption by KPP and/or its subsidiaries of certain liabilities of Kodak’s Personalized Imaging and Document Imaging businesses (together the “Business”) under a Stock and Asset Purchase Agreement dated April 26, 2013 (the “SAPA”). The underfunded position of the U.K. Pension Plan of approximately $1.5 billion was included in Liabilities held for sale presented in the Consolidated Statement of Financial Position as of December 31, 2012.
On August 30, 2013, the Company entered into an agreement (the “Amended SAPA”) amending and restating the SAPA. The Amended SAPA provides for, among other things, a series of deferred closings that will take place in certain foreign jurisdictions following the initial closing under the Amended SAPA. The deferred closings will implement the legal transfer of the Business to KPP subsidiaries in the deferred closing foreign jurisdictions in accordance with local law. Pursuant to the Amended SAPA, Kodak will operate the Business relating to the deferred closing jurisdictions, subject to certain covenants, until the applicable deferred closing occurs, and will deliver to (or receive from) a KPP subsidiary at each deferred closing a payment reflecting the actual economic benefit (or detriment) to the Business in the applicable deferred closing jurisdiction(s) from September 1, 2013 through the time of the applicable deferred closing. Up to the time of the deferred closing, the results of the operations of the Business will be reported as Earnings (loss) from discontinued operations, net of income taxes in the Consolidated Statement of Operations and the assets and liabilities of the Business will be categorized as Assets held for sale or Liabilities held for sale in the Consolidated Statement of Financial Position, as appropriate.
110
On the Effective Date, the following occurred pursuant to the Amended SAPA and Global Settlement:
|
|
•
|
The acquisition by KPP Holdco Limited (“KPP Holdco”), a wholly owned subsidiary of KPP, and certain direct and indirect subsidiaries of KPP Holdco (together with KPP Holdco, the “KPP Purchasing Parties”), of certain assets of the Business, and the assumption by the KPP Purchasing Parties of certain liabilities of the Business, for a total purchase price, exclusive of the assumption of liabilities, of $650 million, of which a gross $525 million was paid in cash (net cash consideration of $325 million) and the balance of which was settled by a $125 million note issued by the KPP (the “KPP Note”).
|
|
|
•
|
The KPP Note was cancelled after being assigned by the Company to the Subsidiary and subsequently assigned by the Subsidiary to KPP as settlement, by way of setoff, of an equal amount of outstanding pension liabilities of the Subsidiary to KPP.
|
|
|
•
|
The cash consideration was comprised of $325 million sourced from assets of the U.K. Pension Plan and $200 million sourced from a payment by the Subsidiary to KPP as payment for outstanding pension liabilities of the Subsidiary to KPP.
|
|
|
•
|
Up to $35 million in aggregate of the purchase price is subject to repayment to KPP if the Business does not achieve certain annual adjusted EBITDA targets over the four-year period ending December 31, 2018.
|
SECTION 363 ASSET SALES
On February 1, 2013, Kodak entered into a series of agreements related to the monetization of certain of its intellectual property assets, including the sale of its digital imaging patents. Under these agreements, Kodak received approximately $530 million, a portion of which was paid by twelve licensees that received a license to the digital imaging patent portfolio and other patents owned by Kodak. Another portion was paid by Intellectual Ventures Fund 83 LLC (“Intellectual Ventures”) and Apple, Inc., each of which acquired a portion of the digital imaging patent portfolio, subject to the licenses granted to the twelve new licensees, and previously existing licenses. In addition, Kodak retained a license to the digital imaging patents for its own use. In connection with this transaction, the Company entered into a separate agreement with FUJIFILM Corporation (“Fuji”) whereby, among other things, Fuji granted Kodak the right to sub-license certain Fuji patents to businesses Kodak ultimately sold as part of the Plan. The Debtors also agreed to allow Fuji a general unsecured claim against the Debtors in the amount of $70 million that was discharged pursuant to the terms of the Plan.
EASTMAN BUSINESS PARK SETTLEMENT AGREEMENT
On June 17, 2013, the Company, the New York State Department of Environmental Conservation and the New York State Urban Development Corporation, d/b/a Empire State Development entered into a settlement agreement, subsequently amended on August 6, 2013 (the “Amended EBP Settlement Agreement”). The Amended EBP Settlement Agreement was subject to the satisfaction or waiver of certain conditions including a covenant not to sue from the EPA. On May 13, 2014, the Bankruptcy Court approved the U.S. Environmental Settlement, which contained the EPA covenant not to sue, and on May 20, 2014 the Amended EBP Settlement Agreement was implemented and became effective. The Amended EBP Settlement Agreement included the settlement of certain of the Company’s historical environmental liabilities at EBP through the establishment of the EBP Trust as follows: (i) the EBP Trust is responsible for investigation and remediation at EBP arising from the Company’s historical subsurface environmental liabilities in existence prior to the effective date of the Amended EBP Settlement Agreement, (ii) the Company funded the EBP Trust on the effective date with a $49 million cash payment and transferred certain equipment and fixtures used for remediation at EBP and (iii) in the event the historical liabilities exceed $99 million, the Company will become liable for 50% of the portion above $99 million. Prior to the implementation of the Amended EBP Settlement Agreement, $49 million was already held in a separate trust and escrow account.
OTHER POSTEMPLOYMENT BENEFITS
On November 7, 2012, the Bankruptcy Court entered an order approving a settlement agreement between the Debtors and the Official Committee of Retired Employees appointed by the U.S. Trustee under the chapter 11 proceedings (the “Retiree Committee”). Under the settlement agreement, the Debtors no longer provide retiree medical, dental, life insurance and survivor income benefits to current and future retirees after December 31, 2012 (other than COBRA continuation coverage of medical and/or dental benefits or conversion coverage as required by applicable benefit plans or applicable law), and the Retiree Committee established a trust from which some limited benefits for some retirees may be provided after December 31, 2012. The trust or related account was funded by the following contributions from the Debtors: $7.5 million in cash paid by the Company in the fourth quarter of 2012, an administrative claim against the Debtors in the amount of $15 million that was paid on the Effective Date, and a general unsecured claim against the Debtors in the amount of $635 million that was discharged upon emergence from chapter 11 pursuant to the terms of the Plan.
RETIREES’ SETTLEMENT
The Debtors’ estimated allowed claims for pre-petition obligations for the Kodak Excess Retirement Income Plan (the “KERIP”), the Kodak Unfunded Retirement Income Plan (the “KURIP”), the Kodak Company Global Pension Plan for International Employees, and individual letter agreements with certain current and former employees that provided for supplemental non-qualified pension benefits were reported as Liabilities subject to compromise in the accompanying Consolidated Statement of Financial Position.
On April 30, 2013, Eastman Kodak Retirees Association Ltd. and certain holders of KERIP and KURIP claims (together with the Debtors, the “Settlement Parties”) filed a motion (the “Motion”) requesting that the Bankruptcy Court appoint a committee pursuant to section
1102(a)(2) of the Bankruptcy Code, to represent the interests of the holders of the KERIP and KURIP claims, and asserted that they and certain other holders of the KERIP and KURIP claims disagreed with the underlying discount rates and mortality tables used by the Debtors to calculate the KERIP and KURIP estimated allowed claim amounts. Subsequent to the filing of the Motion, the Settlement Parties entered into a stipulation (the “Stipulation”) approved by an order of the Bankruptcy Court, which became effective on July 18, 2013, for a total allowed claim of approximately $244 million. During August 2013 a provision for expected allowed claims of approximately $27 million was reflected in Reorganization Items, net in the accompanying Consolidated Statement of Operations to increase the recorded liability to what was ultimately agreed to in the Stipulation.
On the Effective Date, the claim was discharged upon emergence pursuant to the terms of the Plan.
111
In connection with the Company’s emergence from chapter 11, Kodak applied the provisions of fresh start accounting to its financial statements as (i) the holders of existing voting shares of the Predecessor Company received less than 50% of the voting shares of the emerging entity and (ii) the reorganization value of Kodak’s assets immediately prior to confirmation was less than the post-petition liabilities and allowed claims. Kodak applied fresh start accounting as of September 1, 2013.
Upon the application of fresh start accounting, Kodak allocated the reorganization value to its individual assets based on their estimated fair values. Reorganization value represents the fair value of the Successor Company’s assets before considering liabilities. The excess reorganization value over the fair value of identified tangible and intangible assets is reported as goodwill.
Reorganization Value
In support of the Plan, the enterprise value of the Successor Company was estimated to be in the range of $875 million to $1.4 billion. As part of determining the reorganization value, Kodak estimated the enterprise value of the Successor Company to be $1 billion utilizing the guideline public company method and discounted cash flow method.
To estimate fair value utilizing the guideline public company method, Kodak applied valuation multiples, derived from the operating data of publicly-traded benchmark companies, to the same operating data of Kodak. The comparable public company analysis identified a group of comparable companies giving consideration to lines of business and markets served, size and geography. The valuation multiples were derived based on projected financial measures of revenue and earnings before interest, taxes, depreciation and amortization (“EBITDA”) and applied to projected operating data of Kodak. The range of multiples for the comparable companies was between .2x-.9x of revenue and 2.5x-8.0x of EBITDA.
To estimate fair value utilizing the discounted cash flow method, Kodak established an estimate of future cash flows for the period ranging from September 1, 2013 to December 31, 2022 and discounted the estimated future cash flows to present value. The expected cash flows for the period September 1, 2013 to December 31, 2017 were based on the financial projections and assumptions utilized in the disclosure statement. The expected cash flows for the period January 1, 2018 to December 31, 2022 were derived from earnings forecasts and assumptions regarding growth and margin projections, as applicable. A terminal value was included, calculated using the constant growth method, based on the cash flows of the final year of the forecast period.
The discount rate of 29% was estimated based on an after-tax weighted average cost of capital (“WACC”) reflecting the rate of return that would be expected by a market participant. The WACC also takes into consideration a company specific risk premium reflecting the risk associated with the overall uncertainty of the financial projections used to estimate future cash flows.
As the valuation approaches produced comparable ranges of enterprise value, Kodak selected equal weighting of the guideline public company method and discounted cash flow method to estimate the enterprise value.
112
The following table reconciles the enterprise value to the estimated fair value of Successor common stock as of the Effective Date:
|
(in millions, except share and per share value)
|
||||
|
Enterprise value
|
$ | 1,000 | ||
|
Plus: Cash and cash equivalents
|
898 | |||
|
Less: Other non-operating liabilities
|
18 | |||
|
Less: Fair value of debt and capitalized lease obligations
|
734 | |||
|
Less: Fair value of pension and other postretirement obligations
|
533 | |||
|
Less: Fair value of warrants
|
24 | |||
|
Fair value of Successor common stock
|
$ | 589 | ||
|
Shares outstanding at September 3, 2013
|
41,753,211 | |||
|
Per share value
|
$ | 14.11 | ||
The fair value of debt and capitalized lease obligations represents $44 million of short term borrowings, $14 million of capitalized lease obligations and $676 million of long-term debt. The fair value of long-term debt was determined based on a market approach utilizing market yields and was estimated to be approximately 97% of par value. The fair value of capitalized lease obligations was determined based on market rents while the fair value of short term debt approximated its carrying value.
The fair value of pension and other post retirement obligations was determined based on a discounted cash flow method of expected cash contributions/benefit payments for the period of September 1, 2013 to December 31, 2099. The expected cash contributions were discounted to present value using a discount rate of 3.5%.
The fair value of the warrants was estimated using a Black-Scholes pricing model with the following assumptions: implied stock price of $14.11; strike price of $14.93 for 125% warrants and $16.12 for 135% warrants; expected volatility of 47% for 125% warrants and 48% for 135% warrants; expected dividend rate of 0.0%; risk free interest rate of 1.67%; expiration date of five years.
The following table reconciles the enterprise value to the estimated reorganization value as of the Effective Date:
|
(in millions)
|
||||
|
Enterprise value
|
$ | 1,000 | ||
|
Plus: Cash and cash equivalents
|
898 | |||
|
Plus: Fair value of noncontrolling interests
|
10 | |||
|
Plus: Fair value of non-debt liabilities
|
2,088 | |||
|
Less: Fair value of pension and other postretirement obligations
|
533 | |||
|
Reorganization value of Successor assets
|
$ | 3,463 | ||
The fair value of non-debt liabilities represents total liabilities of the Successor Company on the Effective Date less Short term borrowings and current portion of long-term debt, Long-term debt, net of current portion, $14 million in capital lease obligations and $18 million in other non-operating liabilities.
Consolidated Statement of Financial Position
The adjustments set forth in the following consolidated Statement of Financial Position reflect the effect of the consummation of the transactions contemplated by the Plan (reflected in the column “Reorganization Adjustments”) as well as fair value adjustments as a result of the adoption of fresh start accounting (reflected in the column “Fresh Start Adjustments”). The explanatory notes highlight methods used to determine fair values or other amounts of the assets and liabilities as well as significant assumptions or inputs.
113
|
(in millions)
|
|||||||||||||||||||||
|
Predecessor Company (a)
|
Reorganization Adjustments
|
Fresh Start Adjustments
|
Successor Company
|
||||||||||||||||||
|
ASSETS
|
|||||||||||||||||||||
|
Current Assets
|
|||||||||||||||||||||
|
Cash and cash equivalents
|
$ | 1,070 | $ | (172 | ) | (1) | $ | - | $ | 898 | |||||||||||
|
Restricted cash
|
24 | 98 | (2) | - | 122 | ||||||||||||||||
|
Receivables, net
|
492 | - | - | 492 | |||||||||||||||||
|
Inventories, net
|
435 | - | 67 | (21) | 502 | ||||||||||||||||
|
Assets held for sale
|
109 | - | 8 | (22) | 117 | ||||||||||||||||
|
Other current assets
|
77 | 8 | (3) | (42 | ) | (23) | 42 | ||||||||||||||
| (1 | ) | (4) | |||||||||||||||||||
|
Total current assets
|
2,207 | (67 | ) | 33 | 2,173 | ||||||||||||||||
|
Property, plant & equipment, net
|
507 | - | 220 | (24) | 727 | ||||||||||||||||
|
Goodwill
|
56 | - | 32 | (25) | 88 | ||||||||||||||||
|
Intangible assets, net
|
43 | - | 192 | (26) | 235 | ||||||||||||||||
|
Deferred income taxes
|
22 | (21 | ) | (3) | 55 | (23) | 56 | ||||||||||||||
|
Other long-term assets
|
202 | 15 | (5) | (26 | ) | (27) | 184 | ||||||||||||||
| 8 | (6) | (8 | ) | (28) | |||||||||||||||||
| (8 | ) | (7) | 1 | (29) | |||||||||||||||||
|
TOTAL ASSETS
|
$ | 3,037 | $ | (73 | ) | $ | 499 | $ | 3,463 | ||||||||||||
|
LIABILITIES AND EQUITY (DEFICIT)
|
|||||||||||||||||||||
|
Current Liabilities
|
|||||||||||||||||||||
|
Accounts payable, trade
|
$ | 317 | $ | 6 | (8) | $ | - | $ | 339 | ||||||||||||
| 3 | (9) | ||||||||||||||||||||
| 13 | (10) | ||||||||||||||||||||
|
Short-term borrowings and current portion of long-term debt
|
681 | (641 | ) | (11) | - | 44 | |||||||||||||||
| 4 | (12) | ||||||||||||||||||||
|
Other current liabilities
|
600 | (17 | ) | (13) | (8 | ) | (30) | 586 | |||||||||||||
| (13 | ) | (3) | (14 | ) | (29) | ||||||||||||||||
| 38 | (14) | ||||||||||||||||||||
|
Liabilities held for sale
|
45 | - | (3 | ) | (22) | 42 | |||||||||||||||
|
Total current liabilities
|
1,643 | (607 | ) | (25 | ) | 1,011 | |||||||||||||||
|
Long-term debt, net of current portion
|
370 | (370 | ) | (15) | 11 | (31) | 676 | ||||||||||||||
| 665 | (16) | ||||||||||||||||||||
|
Pension and other postretirement liabilities
|
411 | 156 | (17) | 178 | (29) | 745 | |||||||||||||||
|
Other long-term liabilities
|
318 | 61 | (17) | 82 | (23) | 408 | |||||||||||||||
| (53 | ) | (32) | |||||||||||||||||||
|
Liabilities subject to compromise
|
2,475 | (2,475 | ) | (17) | - | - | |||||||||||||||
|
Total liabilities
|
5,217 | (2,570 | ) | 193 | 2,840 | ||||||||||||||||
|
Equity (Deficit)
|
|||||||||||||||||||||
|
Common stock (Successor)
|
- | - | (18) | - | - | ||||||||||||||||
|
Additional paid in capital (Successor)
|
- | 540 | (18) | 73 | (33) | 613 | |||||||||||||||
|
Common stock (Predecessor)
|
978 | (978 | ) | (19) | - | - | |||||||||||||||
|
Additional paid in capital (Predecessor)
|
1,105 | (1,105 | ) | (19) | - | - | |||||||||||||||
|
Retained earnings (deficit)
|
2,446 | (1,671 | ) | (20) | (775 | ) | (34) | - | |||||||||||||
|
Accumulated other comprehensive loss
|
(1,008 | ) | - | 1,008 | (34) | - | |||||||||||||||
| 3,521 | (3,214 | ) | 306 | 613 | |||||||||||||||||
|
Less: Treasury stock (Predecessor)
|
(5,711 | ) | 5,711 | (19) | - | - | |||||||||||||||
|
Total Eastman Kodak Company shareholders' (deficit) equity
|
(2,190 | ) | 2,497 | 306 | 613 | ||||||||||||||||
|
Noncontrolling interests
|
10 | - | - | 10 | |||||||||||||||||
|
Total equity (deficit)
|
(2,180 | ) | 2,497 | 306 | 623 | ||||||||||||||||
|
TOTAL LIABILITIES AND EQUITY (DEFICIT)
|
$ | 3,037 | $ | (73 | ) | $ | 499 | $ | 3,463 | ||||||||||||
|
(a)
|
On the Effective Date, Kodak completed the sale of substantially all of its assets constituting the Personalized Imaging and Document Imaging businesses to KPP Holdco Limited. This transaction has been reflected in the Predecessor Company period. Refer to Note 27, “Discontinued Operations” for additional information.
|
114
Reorganization adjustments
|
(1)
|
Reflects the net cash payments recorded as of the Effective Date from implementation of the Plan:
|
|
(in millions)
|
||||||||
|
Sources:
|
||||||||
|
Net proceeds from Emergence Credit Facilities
|
$ | 664 | ||||||
|
Proceeds from Rights Offerings
|
406 | |||||||
|
Total sources
|
$ | 1,070 | ||||||
|
Uses:
|
||||||||
|
Repayment of Junior DIP Term Loans
|
$ | 644 | ||||||
|
Repayment of Second Lien Notes
|
375 | |||||||
|
Claims paid at emergence
|
94 | |||||||
|
Funding of escrow accounts
|
113 | |||||||
|
Other fees and expenses
|
16 | |||||||
|
Total uses
|
1,242 | |||||||
|
Net uses
|
$ | (172 | ) | |||||
Other fees and expenses represent $7 million payment for accrued and unpaid interest related to the repayment of debt and $9 million payment for emergence and success fees, which is included in Reorganization items, net in the Consolidated Statement of Operations.
|
(2)
|
Reflects the funding of $80 million to the professional fee escrow account for professional fees accrued at emergence and $18 million related to the EBP Settlement Agreement. Refer to Note 24, “Emergence from Voluntary Reorganization under Chapter 11 Proceedings” for additional information regarding the EBP Settlement Agreement.
|
|
(3)
|
Reflects the expiration of tax attributes, which was fully offset by a corresponding decrease in Kodak’s U.S. valuation allowance, as a result of the Debtors’ emergence from chapter 11 bankruptcy proceedings. Refer to Note 14, “Income Taxes” for additional information.
|
|
(4)
|
Represents the write-off of unamortized debt issuance costs of $1 million related to the Junior DIP Credit Agreement upon repayment in full of all outstanding term loans on the Effective Date. This amount has been included in Reorganization items, net in the Consolidated Statement of Operations.
|
|
(5)
|
Represents the funding of $15 million in cash collateralization for letters of credit under the ABL Credit Facility.
|
|
(6)
|
Represents $8 million of debt issuance costs incurred related to the Emergence Credit Facilities.
|
|
(7)
|
Represents the write-off of $5 million of deferred debt issuance costs upon repayment in full of all loans outstanding under the 9.75% senior secured notes due 2018 and 10.625% senior secured notes due 2019 and the write-off of $3 million of deferred equity issuance costs. These amounts have been included in Reorganization items, net in the Consolidated Statement of Operations.
|
|
(8)
|
Represents $6 million in claims expected to be satisfied in cash that were reclassified from Liabilities subject to compromise.
|
|
(9)
|
Represents $3 million of accrued expenses related to the Emergence Credit Facilities that have been deferred and recorded as part of Other Current assets.
|
|
(10)
|
Represents $13 million in success fees accrued upon emergence that have been included in Reorganization items, net in the Consolidated Statement of Operations.
|
115
|
(11)
|
On the Effective Date, the Company repaid in full all term loans outstanding under the Junior DIP Credit Agreement for an aggregate remaining principal amount of approximately $644 million offset by $3 million of unamortized debt discount that was written off upon repayment of the debt and is included in Reorganization items, net in the Consolidated Statement of Operations.
|
|
(12)
|
Represents $4 million of principal amount recorded as short-term borrowings pursuant to the terms of the Emergence Credit Facility.
|
|
(13)
|
On the Effective Date, the Company paid $7 million of accrued and unpaid interest related to the repayment of debt and $10 million in administrative claims that was included within Other current liabilities.
|
|
(14)
|
Represents $29 million in claims expected to be settled in cash and $9 million of liabilities that have been retained by Kodak in accordance with the Plan that have been reclassified from Liabilities subject to compromise.
|
|
(15)
|
On the Effective Date, the Company repaid in full all loans outstanding under the 9.75% senior secured notes due 2018 and 10.625% senior secured notes due 2019 for an aggregate principal amount of approximately $375 million offset by $5 million of unamortized debt discount that was written off upon repayment of the debt and is included in Reorganization items, net in the Consolidated Statement of Operations.
|
|
(16)
|
Upon issuance of the Term Loans under the Emergence Credit Facility, the Company received net proceeds of approximately $669 million, of which $4 million of the principal amount of the loans is recorded as short-term borrowings pursuant to the terms of the Emergence Credit Facility.
|
|
(17)
|
Liabilities subject to compromise were settled as follows in accordance with the Plan:
|
|
(in millions)
|
||||||||
|
Liabilities subject to compromise of the Predecessor Company (LSTC)
|
$ | 2,475 | ||||||
|
Cash payments at emergence from LSTC
|
(84 | ) | ||||||
|
Claims expected to be satisfied in cash
|
(35 | ) | ||||||
|
Liabilities reinstated at emergence:
|
||||||||
|
Pension and other postretirement liabilities
|
(156 | ) | ||||||
|
Environmental obligations
|
(61 | ) | ||||||
|
Other current liabilities
|
(9 | ) | ||||||
|
Total liabilities reinstated at emergence
|
(226 | ) | ||||||
|
Fair value of equity issued to unsecured creditors
|
(85 | ) | ||||||
|
Fair value of warrants issued to unsecured creditors
|
(24 | ) | ||||||
|
Gain on settlement of liabilities subject to compromise
|
$ | 2,021 | ||||||
Refer to explanation #18 for the determination of fair value for equity issued to unsecured creditors.
|
(18)
|
Reflects the issuance of 34 million shares of common stock at a per share price of $11.94 in connection with the Rights Offering, 6 million shares of common stock issued to the holders of general unsecured and retiree committee unsecured claims valued at $14.11 per share, 1.7 million shares of common stock valued at $14.11 per share issued to the Backstop Parties in connection with the Backstop Commitment Agreement, 0.1 million shares of common stock issued under Kodak’s 2013 Omnibus Incentive Plan on the Effective Date, and issuance of warrants valued at $24 million.
|
|
(19)
|
Reflects the cancellation of Predecessor Company equity to retained earnings.
|
|
(20)
|
Reflects the cumulative impact of the reorganization adjustments discussed above:
|
|
(in millions)
|
||||
|
Gain on settlement of liabilities subject to compromise
|
$ | 2,021 | ||
|
Fair value of shares issued to Backstop Parties and employees
|
(25 | ) | ||
|
Write-off of unamortized debt discounts and debt issuance costs
|
(14 | ) | ||
|
Success fees accrued at emergence
|
(13 | ) | ||
|
Emergence and success fees paid at emergence
|
(9 | ) | ||
|
Write-off of deferred equity issuance costs
|
(3 | ) | ||
|
Net gain on reoganization adjustments
|
1,957 | |||
|
Cancellation of Predecessor Company equity
|
(3,628 | ) | ||
|
Net impact to Retained earnings (deficit)
|
$ | (1,671 | ) | |
The net gain on reorganization adjustments has been included in Reorganization items, net in the Consolidated Statement of Operations.
116
Fresh Start adjustments
|
(21)
|
An adjustment of $67 million was recorded to increase the net book value of inventories to their estimated fair value, which was determined as follows:
|
|
|
•
|
Fair value of finished goods inventory were determined based on the estimated selling price less costs to sell, including disposal and holding period costs, and a reasonable profit margin on the selling and disposal effort.
|
|
|
•
|
Fair value of work-in-process was determined based on the estimated selling price once completed less total costs to complete the manufacturing effort, costs to sell, including disposal and holding period costs, and a reasonable profit on the remaining manufacturing, selling and disposal effort.
|
|
|
•
|
Fair value of raw materials was determined based on current replacement costs.
|
The following table summarizes the components of inventory as of August 31, 2013, and the fair value at September 1, 2013:
|
Successor
|
Predecessor
|
|||||||
|
(in millions)
|
As of
September 1, 2013
|
As of
August 31,
2013
|
||||||
|
Finished goods
|
$ | 280 | $ | 235 | ||||
|
Work in process
|
120 | 99 | ||||||
|
Raw materials
|
102 | 101 | ||||||
|
Total
|
$ | 502 | $ | 435 | ||||
|
(22)
|
Represents fair value adjustment to the assets and liabilities of the Company’s Personalized Imaging and Document Imaging businesses in delayed close countries.
|
|
(23)
|
Represents the net decrease in tax assets and tax liabilities associated with adjustments for fresh start accounting.
|
|
(24)
|
An adjustment of $220 million was recorded to increase the net book value of property, plant and equipment to estimated fair value. Fair value was determined as follows:
|
|
|
•
|
The market, sales comparison or trended cost approach was utilized for land, buildings and building improvements. This approach relies upon recent sales, offerings of similar assets or a specific inflationary adjustment to original purchase price to arrive at a probable selling price.
|
|
|
•
|
The cost approach was utilized for machinery and equipment. This approach considers the amount required to construct or purchase a new asset of equal utility at current prices, with adjustments in value for physical deterioration, and functional and economic obsolescence. Physical deterioration is an adjustment made in the cost approach to reflect the real operating age of an asset with regard to wear and tear, decay and deterioration that is not prevented by maintenance. Functional obsolescence is the loss in value or usefulness of an asset caused by inefficiencies or inadequacies of the asset, as compared to a more efficient or less costly replacement asset with newer technology. Economic obsolescence is the loss in value or usefulness of an asset due to factors external to the asset, such as the economics of the industry, reduced demand, increased competition or similar factors.
|
117
The following table summarizes the components of property, plant and equipment, net as of August 31, 2013, and the fair value at September 1, 2013:
|
Successor
|
Predecessor
|
|||||||
|
(in millions)
|
As of
September 1,
2013
|
As of
August 31,
2013
|
||||||
|
Land
|
$ | 114 | $ | 35 | ||||
|
Buildings and building improvements
|
180 | 189 | ||||||
|
Machinery and equipment
|
402 | 252 | ||||||
|
Construction in progress
|
31 | 31 | ||||||
|
Total
|
$ | 727 | $ | 507 | ||||
For property, plant and equipment owned at September 1, 2013, the depreciable lives were revised to reflect the remaining estimated useful lives. Refer to Note 1, “Basis of Presentation and Significant Accounting Policies” for additional information.
118
(25)
This adjustment eliminated the Predecessor goodwill balance of $56 million and records Successor goodwill of $88 million, which represents the reorganizational value of assets in excess of amounts allocated to identified tangible and intangible assets, as follows:
|
Successor
|
||||
|
(in millions)
|
As of September 1, 2013
|
|||
|
Reorganization value of Successor assets
|
$ | 3,463 | ||
|
Less: Fair value of Successor assets (excluding goodwill)
|
3,375 | |||
|
Reorganization value of Successor assets in excess of fair value - Successor goodwill
|
$ | 88 | ||
Refer to Note 5, “Goodwill and Other Intangible Assets” for Successor goodwill by reportable segment.
|
(26)
|
The net adjustment of $192 million reflects the write-off of existing intangibles of $43 million and an adjustment of $235 million to record the fair value of intangibles, determined as follows:
|
|
|
a.
|
Trade names of $54 million were valued using the income approach, specifically the relief from royalty method based on the following significant assumptions:
|
|
|
i.
|
Forecasted revenues attributable to the trade names ranging from September 1, 2013 to December 31, 2023, including a terminal year with growth rates ranging from 0% to 3%;
|
|
|
ii.
|
Royalty rates ranging from .5% to 1% of expected net sales determined with regard to comparable market transactions and profitability analysis;
|
|
|
iii.
|
Discount rates ranging from 27% to 32%, which were based on the after-tax weighted-average cost of capital; and
|
|
|
iv.
|
Kodak anticipates using its trade name for an indefinite period.
|
|
|
b.
|
Technology based intangibles of $131 million were valued using the income approach, specifically the relief from royalty method based on the following significant assumptions:
|
|
|
i.
|
Forecasted revenues attributable to the respective technologies for the period ranging from September 1, 2013 to December 31, 2025;
|
|
|
ii.
|
Royalty rates ranging from 1% to 16% determined with regard to comparable market transactions and cash flows of the respective technologies;
|
|
|
iii.
|
Discount rates ranging from 29% to 34%, based on the after-tax weighted-average cost of capital; and
|
|
|
iv.
|
Economic lives ranging from 4 to 12 years.
|
|
|
c.
|
Customer related intangibles of $39 million were valued using the income approach, specifically the multi-period excess earnings approach based on the following significant assumptions:
|
|
|
i.
|
Forecasted revenues and profit margins attributable to the current customer base for the period ranging from September 1, 2013 to December 31, 2024;
|
|
|
ii.
|
Attrition rates ranging from 2.5% to 20%;
|
|
|
iii.
|
Discount rates ranging from 29% to 38%, based on the after-tax weighted-average cost of capital; and
|
|
|
iv.
|
Economic lives ranging from 3 to 10 years.
|
|
|
d.
|
In-process research and development of $9 million was determined using the income approach, specifically the multi-period excess earnings method based on the following significant assumptions:
|
|
|
i.
|
Forecasted revenues attributable to the respective research and development projects for the period of September 1, 2013 to December 31, 2019;
|
|
|
ii.
|
Discount rate of 40% based on the after-tax weighted-average cost of capital adjusted for perceived risks inherent in the individual assets; and
|
|
|
iii.
|
Economic life of 6 years.
|
|
|
e.
|
In addition, the Company recorded the fair value of other intangibles of $2 million primarily related to favorable contracts and leasehold improvements that were favorable relative to available market terms.
|
119
|
(27)
|
Represents the write-off of deferred costs under various licensing transactions now being reflected in intangible assets.
|
|
(28)
|
Represents the write-off of unamortized debt issuance costs related to the Emergence Credit Facilities.
|
|
(29)
|
Represents the revaluation of pension and other postretirement obligations. Refer to Note 16, “Retirement plans “and Note 17, ”Other postretirement benefits” for additional information.
|
|
(30)
|
Represents the revaluation of deferred revenues to the fair value of Kodak’s related future performance obligations.
|
|
(31)
|
Represents the write-off of unamortized debt discounts related to the Emergence Credit Facilities based on the fair value of debt.
|
|
(32)
|
Represents $38 million decrease in capitalized lease obligations determined based on market rents, $19 million decrease related to the remeasurement of employee benefit obligations offset by net $4 million increase in fair value adjustment related to asset retirement obligations and other miscellaneous liabilities.
|
|
(33)
|
Reflects the increase in fair value of the 34 million shares of common stock issued in connection with the Rights Offering from $11.94 to $14.11 per share.
|
|
(34)
|
Reflects the cumulative impact of fresh start adjustments as discussed above and the elimination of the Predecessor Company’s accumulated other comprehensive loss.
|
|
(in millions)
|
||||
|
Establishment of Successor goodwill
|
$ | 88 | ||
|
Elimination of Predecessor goodwill
|
(56 | ) | ||
|
Establishment of Successor intangibles
|
235 | |||
|
Elimination of Predecessor intangibles
|
(43 | ) | ||
|
Inventory fair value adjustment
|
67 | |||
|
Property, plant & equipment fair value adjustment
|
220 | |||
|
Pension and other postretirement obligations fair value adjustment
|
(178 | ) | ||
|
Rights offering fair value adjustment
|
(73 | ) | ||
|
Long-term debt fair value adjustment
|
(11 | ) | ||
|
Other assets and liabilities fair value adjustments
|
53 | |||
|
Net gain on fresh start adjustments
|
302 | |||
|
Tax impact on fresh start adjustments
|
(69 | ) | ||
|
Elimination of Predecessor accumulated other comprehensive loss
|
(1,008 | ) | ||
|
Net impact on Retained earnings (deficit)
|
$ | (775 | ) | |
The net gain on fresh start adjustments has been included in Reorganization items, net in the Consolidated Statement of Operations.
120
A summary of reorganization items, net is presented in the following table:
|
Successor
|
Predecessor
|
|||||||||||||||
|
(in millions)
|
Year Ended
December 31,
2014
|
Four Months Ended
December 31,
2013
|
Eight Months Ended
August 31,
2013
|
Year Ended
December 31,
2012
|
||||||||||||
|
Professional fees
|
$ | 10 | $ | 19 | $ | 114 | $ | 178 | ||||||||
|
DIP credit agreement financing costs
|
- | - | - | 47 | ||||||||||||
|
Provision for expected allowed claims
|
(1 | ) | - | 133 | 856 | |||||||||||
|
Gain on settlement of other postemployment liabilities
|
- | - | - | (238 | ) | |||||||||||
|
Net gain on reorganization adjustments
|
- | - | (1,957 | ) | - | |||||||||||
|
Net gain on fresh start adjustments
|
- | - | (302 | ) | - | |||||||||||
|
Other items, net
|
4 | (3 | ) | (14 | ) | - | ||||||||||
|
Reorganization items, net
|
$ | 13 | $ | 16 | $ | (2,026 | ) | $ | 843 | |||||||
|
Cash payments for reorganization items
|
$ | 21 | $ | 85 | $ | 210 | $ | 167 | ||||||||
Subsequent to the Effective Date, costs directly attributable to the implementation of the Plan are reported as Reorganization items, net. The cash payments for reorganization items for the eight months ended August 31, 2013 includes $84 million of claims related to liabilities subject to compromise paid on the Effective Date. Refer to Note 25, “Fresh Start Accounting” for additional information on the net gain on reorganization and fresh start adjustments.
121
On the Effective Date, as a part of the Global Settlement and pursuant to the Amended SAPA, Kodak consummated the sale of certain assets of the Business to the KPP Purchasing Parties for net cash consideration, in addition to the assumption by the KPP Purchasing Parties of certain liabilities of the Business, of $325 million. Up to $35 million in aggregate of the purchase price is subject to repayment to KPP if the Business does not achieve certain annual adjusted EBITDA targets over the four-year period ending December 31, 2018. Certain assets and liabilities of the Business in certain jurisdictions were not transferred at the initial closing, which took place on the Effective Date, but are being transferred at a series of deferred closings in accordance with the Amended SAPA, one of which has yet to close. Kodak has been and is operating the Business related to the deferred closing jurisdictions, subject to certain covenants, until the applicable deferred closing occurs, and delivers to (or receives from) a KPP subsidiary at each deferred closing a true-up payment reflecting the actual economic benefit (or detriment) to the Business in the applicable deferred closing jurisdiction(s) from the time of the initial closing through the time of the applicable deferred closing. Up to the time of the deferred closing, the results of the operations of the Business are being reported as Earnings (loss) from discontinued operations, net of income taxes in the Consolidated Statement of Operations and the assets and liabilities of the Business are being categorized as Assets held for sale or Liabilities held for sale in the Consolidated Statement of Financial Position, as appropriate.
Kodak recognized a pre-tax loss on the sale of the Business of approximately $163 million during the third quarter 2013 predecessor period. The pre-tax loss excluded recognition of $64 million of non-refundable consideration related to the delayed closings, which non-refundable consideration was received on the Effective Date, and $35 million of contingent consideration, subject to repayment to KPP which was also received by Kodak on the Effective Date. The pre-tax loss includes the recognition of approximately $1.5 billion of unamortized pension losses previously reported in Accumulated other comprehensive income.
On March 17, 2014, the KPP Purchasing Parties agreed to pay Kodak $20 million of incremental consideration ($13 million was paid in March 2014 and the remainder is owed within one year of March 2014) in lieu of working capital adjustments contemplated by the Amended SAPA.
122
The following table summarizes the major classes of assets and liabilities related to the disposition of the Business which have been segregated and reported as part of Current assets held for sale and Current liabilities held for sale in the Consolidated Statement of Financial Position:
|
(in millions)
|
As of
December 31,
2014
|
As of
December 31,
2013
|
||||||
|
Receivables, net
|
$ | - | $ | 16 | ||||
|
Inventories, net
|
2 | 62 | ||||||
|
Property, plant and equipment, net
|
4 | 10 | ||||||
|
Other assets
|
6 | 7 | ||||||
|
Current assets held for sale
|
$ | 12 | $ | 95 | ||||
|
Trade payables
|
$ | 1 | $ | 24 | ||||
|
Miscellaneous payables and accruals
|
- | 14 | ||||||
|
Current liabilities held for sale
|
$ | 1 | $ | 38 | ||||
Discontinued operations of Kodak include the Business (excluding the consumer film business, for which Kodak has entered into an ongoing supply arrangement with one or more KPP Purchasing Parties), digital capture and devices business (exited in the third quarter of 2012), Kodak Gallery (exited in the third quarter of 2012), and other miscellaneous businesses.
The significant components of revenues and earnings (loss) from discontinued operations, net of income taxes are as follows:
|
Successor
|
Predecessor
|
|||||||||||||||
|
Year Ended
December 31,
2014
|
Four Months Ended
December 31,
2013
|
Eight Months Ended
August 31,
2013
|
Year Ended
December 31,
2012
|
|||||||||||||
|
(in millions)
|
||||||||||||||||
|
Revenues from Personalized and Document Imaging
|
$ | 61 | $ | 77 | $ | 738 | $ | 1,350 | ||||||||
|
Revenues from Digital Capture and Devices operations
|
- | - | 6 | 36 | ||||||||||||
|
Revenues from Kodak Gallery operations
|
- | - | - | 29 | ||||||||||||
|
Revenues from other discontinued operations
|
- | 1 | 17 | 50 | ||||||||||||
|
Total revenues from discontinued operations
|
$ | 61 | $ | 78 | $ | 761 | $ | 1,465 | ||||||||
|
Pre-tax earnings (loss) from Personalized and Document Imaging
|
$ | 9 | $ | 5 | $ | (217 | ) | $ | 51 | |||||||
|
Pre-tax earnings (loss) from Digital Capture and Devices operations
|
- | 1 | 2 | (78 | ) | |||||||||||
|
Pre-tax earnings (loss) from Kodak Gallery operations
|
- | - | 1 | 4 | ||||||||||||
|
Pre-tax (loss) earnings from other discontinued operations
|
- | - | (17 | ) | (7 | ) | ||||||||||
|
(Provision) benefit for income taxes related to discontinued operations
|
(5 | ) | (2 | ) | 96 | (12 | ) | |||||||||
|
Earnings (loss) from discontinued operations, net of income taxes
|
$ | 4 | $ | 4 | $ | (135 | ) | $ | (42 | ) | ||||||
Kodak was required to use a portion of the proceeds from the divestiture of the Business to repay $200 million of the Junior DIP Credit Agreement. Interest expense on the debt that was required to be repaid as a result of the sale of the Business has therefore been allocated to discontinued operations ($14 million and $19 million for the eight months ended August 31, 2013 and year ended December 31, 2012, respectively).
Depreciation and amortization of long-lived assets of the Business included in discontinued operations ceased as of July 1, 2013.
Direct operating expenses of the discontinued operations are included in the results of discontinued operations. Indirect expenses that were historically allocated to the discontinued operations have been included in the results of continuing operations. Prior period results have been reclassified to conform to the current period presentation.
123
QUARTERLY SALES AND EARNINGS DATA (UNAUDITED)
|
Successor
|
|||||||||||||||||
|
(in millions, except per share data)
|
4th Qtr.
|
3rd Qtr.
|
2nd Qtr.
|
1st Qtr.
|
|||||||||||||
|
2014
|
|||||||||||||||||
|
Net sales from continuing operations
|
$ | 529 | $ | 564 | $ | 525 | $ | 484 | |||||||||
|
Gross profit from continuing operations
|
109 | 156 | 102 | 89 | |||||||||||||
|
(Loss) earnings from continuing operations
|
(40 | ) | 31 | (1) | (60 | ) | (53 | ) | |||||||||
|
(Loss) earnings from discontinued operations
(4)
|
(1 | ) | (12 | ) | (2 | ) | 19 | ||||||||||
|
Net (loss) earnings attributable to Eastman Kodak Company
|
(42 | ) | 17 | (62 | ) | (36 | ) | ||||||||||
|
Basic net (loss) earnings per share attributable to Eastman Kodak Company
|
|||||||||||||||||
|
Continuing operations
|
(0.98 | ) | 0.70 | (1.44 | ) | (1.32 | ) | ||||||||||
|
Discontinued operations
|
(0.02 | ) | (0.29 | ) | (0.05 | ) | 0.46 | ||||||||||
|
Total
|
$ | (1.00 | ) | $ | 0.41 | $ | (1.49 | ) | $ | (0.86 | ) | ||||||
|
Diluted net (loss) earnings per share attributable to Eastman Kodak Company
|
|||||||||||||||||
|
Continuing operations
|
(0.98 | ) | 0.67 | (1.44 | ) | (1.32 | ) | ||||||||||
|
Discontinued operations
|
(0.02 | ) | (0.28 | ) | (0.05 | ) | 0.46 | ||||||||||
|
Total
|
$ | (1.00 | ) | $ | 0.39 | $ | (1.49 | ) | $ | (0.86 | ) | ||||||
|
Successor
|
Predecessor
|
|||||||||||||||||||||
|
(in millions, except per share data)
|
4th Qtr.
|
September 1, 2013 through
September 30, 2013
|
July 1, 2013 through
August 31, 2013
|
2nd Qtr.
|
1st Qtr.
|
|||||||||||||||||
|
2013
|
||||||||||||||||||||||
|
Net sales from continuing operations
|
$ | 609 | $ | 198 | $ | 365 | $ | 583 | $ | 594 | ||||||||||||
|
Gross profit from continuing operations
|
98 | 22 | 85 | 133 | 150 | |||||||||||||||||
|
(Loss) earnings from continuing operations
|
(51 | ) | (31 | ) | 2,085 | (2) | (208 | ) | 324 | (3) | ||||||||||||
|
(Loss) earnings from discontinued operations
(4)
|
(6 | ) | 10 | (78 | ) | (16 | ) | (41 | ||||||||||||||
|
Net (loss) earnings attributable to Eastman Kodak Company
|
(63 | ) | (18 | ) | 2,007 | (224 | ) | 283 | ||||||||||||||
|
Basic and diluted net (loss) earnings per share
attributable to Eastman Kodak Company
|
||||||||||||||||||||||
|
Continuing operations
|
$ | (1.37 | ) | $ | (0.67 | ) | $ | 7.65 | $ | (0.76 | ) | $ | 1.19 | |||||||||
|
Discontinued operations
|
(0.14 | ) | 0.24 | (0.29 | ) | (0.06 | ) | (0.15 | ||||||||||||||
|
Total
|
$ | (1.51 | ) | $ | (0.43 | ) | $ | 7.36 | $ | (0.82 | ) | $ | 1.04 | |||||||||
124
|
(1)
|
Includes pre-tax licensing revenue of $51 million which increased net earnings from continuing operations by $51 million.
|
|
(2)
|
Includes income of $2,217 million from Reorganization items, net
|
|
(3)
|
Includes proceeds of $535 million from the sale and licensing of certain intellectual property assets which increased net earnings from continuing operations by $530 million; a pre-tax impairment charge of $77 million included in Other operating expense (income), net, which decreased net earnings from continuing operations by $55 million and $119 million of Reorganization items, net
|
|
(4)
|
Refer to Note 27, “Discontinued Operations”, in the Notes to Financial Statements for a discussion regarding discontinued operations.
|
125
None.
Evaluation of Disclosure Controls and Procedures
Kodak maintains disclosure controls and procedures that are designed to ensure that information required to be disclosed in Kodak’s reports filed or submitted under the Securities Exchange Act of 1934 is recorded, processed, summarized and reported within the time periods specified in the SEC’s rules and forms, and that such information is accumulated and communicated to management, including Kodak’s Chief Executive Officer and Chief Financial Officer, as appropriate, to allow timely decisions regarding required disclosure. Kodak’s management, with participation of Kodak’s Chief Executive Officer and Chief Financial Officer, has evaluated the effectiveness of Kodak’s disclosure controls and procedures as of the end of the fiscal year covered by this Annual Report on Form 10-K. Kodak’s Chief Executive Officer and Chief Financial Officer have concluded that, as of the end of the period covered by this Annual Report on Form 10-K, Kodak’s disclosure controls and procedures (as defined in Rules 13a-15(e) and 15d-15(e) under the Exchange Act) were effective.
Management’s Report on Internal Control Over Financial Reporting
The management of Kodak is responsible for establishing and maintaining adequate internal control over financial reporting. Kodak’s internal control over financial reporting is designed to provide reasonable assurance regarding the reliability of financial reporting and the preparation of financial statements for external purposes in accordance with generally accepted accounting principles in the United States of America. Kodak’s internal control over financial reporting includes those policies and procedures that: (i) pertain to the maintenance of records that, in reasonable detail, accurately and fairly reflect the transactions and dispositions of the assets of Kodak; (ii) provide reasonable assurance that transactions are recorded as necessary to permit preparation of financial statements in accordance with generally accepted accounting principles in the United States of America, and that receipts and expenditures of Kodak are being made only in accordance with authorizations of management and directors of Kodak; and (iii) provide reasonable assurance regarding prevention or timely detection of unauthorized acquisition, use or disposition of Kodak’s assets that could have a material effect on the financial statements.
Internal control over financial reporting cannot provide absolute assurance of achieving financial reporting objectives because of its inherent limitations. Internal control over financial reporting is a process that involves human diligence and compliance and is subject to lapses in judgment or breakdowns resulting from human failures. Internal control over financial reporting also can be circumvented by collusion or improper management override.
Because of such limitations, there is a risk that material misstatements may not be prevented or detected on a timely basis by internal control over financial reporting. However, these inherent limitations are known features of the financial reporting process. Therefore, it is possible to design into the process safeguards to reduce, though not eliminate, this risk. Because of its inherent limitations, internal control over financial reporting may not prevent or detect misstatements. Also, projections of any evaluation of effectiveness to future periods are subject to the risk that controls may become inadequate because of changes in conditions, or that the degree of compliance with the policies or procedures may deteriorate.
Management assessed the effectiveness of Kodak’s internal control over financial reporting as of December 31, 2014. In making this assessment, management used the criteria set forth by the Committee of Sponsoring Organizations of the Treadway Commission (“COSO”) in "Internal Control-Integrated Framework" (2013). Based on management’s assessment using the COSO criteria, management has concluded that Kodak's internal control over financial reporting was effective as of December 31, 2014. The effectiveness of Kodak’s internal control over financial reporting as of December 31, 2014 has been audited by PricewaterhouseCoopers LLP, Kodak’s independent registered public accounting firm, as stated in their report which appears on page 45 of this Annual Report on Form 10-K.
Changes in Internal Control over Financial Reporting
There was no change identified in Kodak’s internal control over financial reporting that occurred during Kodak’s fourth fiscal quarter that has materially affected, or is reasonably likely to materially affect, Kodak’s internal control over financial reporting.
126
Pursuant to Section 219 of the Iran Threat Reduction and Syria Human Rights Act of 2012, which added Section 13(r) to the Securities Exchange Act of 1934, as amended (the “Exchange Act”), Kodak hereby incorporates by reference herein Exhibit 99.1 to this report. Exhibit 99.1 includes disclosure publicly filed by an entity that may be considered an “affiliate” (as such term is defined in Rule 12b-2 of the Exchange Act) of Kodak.
The information required by Item 10 regarding directors is incorporated herein by reference from the information under the caption "Board Structure and Corporate Governance - Board of Directors" in the Company's Notice of 2015 Annual Meeting and Proxy Statement (the “Proxy Statement”), which will be filed within 120 days after December 31, 2014. The information required by Item 10 regarding audit committee composition and audit committee financial expert disclosure is incorporated by reference from the information under the caption "Board Structure and Corporate Governance - Committees of the Board - Audit and Finance Committee" in the Proxy Statement. The information required by Item 10 regarding executive officers is contained in Part I under the caption "Executive Officers of the Registrant" on page 18 of this report. The information required by Item 10 regarding compliance with Section 16(a) of the Securities Exchange Act of 1934 is incorporated herein by reference from the information under the caption "Security Ownership of Certain Beneficial Owners and Management - Section 16(a) Beneficial Ownership Reporting Compliance" in the Proxy Statement.
We have adopted a Business Conduct Guide that applies to all of our officers and employees, including our principal executive, principal financial and principal accounting officers, or persons performing similar functions, as well as a Directors’ Code of Conduct that applies to our directors and Board observers. Our Business Conduct Guide and Directors’ Code of Conduct are posted on our website located at
http://ek.client.shareholder.com/supporting.cfm
. We intend to disclose future amendments to certain provisions of the Business Conduct Guide or Directors’ Code of Conduct and waivers of the Business Conduct Guide or Directors’ Code of Conduct granted to executive officers or directors, on the website within four business days following the date of the amendment or waiver.
The information required by Item 11 is incorporated herein by reference from the information under the following captions in the Proxy Statement: "Executive Compensation."
Information required by Item 12 is incorporated by reference from the information under the captions "Security Ownership of Certain Beneficial Owners and Management" in the Proxy Statement. "Securities Authorized for Issuance Under Equity Compensation Plans" is shown below:
EQUITY COMPENSATION PLAN INFORMATION
As of December 31, 2014, information about the Company’s equity compensation plans is as follows:
|
Plan Category
|
Number of Securities to be Issued Upon Exercise of Outstanding Options,
and Restricted Stock Units
|
Weighted-Average Exercise Price of Outstanding Options
|
Number of Securities Remaining Available for Future Issuance Under Equity Compensation Plans (Excluding Securities Reflected in Column (a))
|
|
(a)
|
(b)
|
(c)
|
|
|
Equity compensation plans not approved by security holders
(1)
|
1,466,751
|
$22.56
|
3,146,037
|
127
The Company's equity compensation plan not approved by security holders is the 2013 Omnibus Long-Term Compensation Plan which was approved by the Bankruptcy Court pursuant to the Plan of Reorganization, the material terms of which were summarized in the Company’s Report on Form 8-K filed on September 10, 2013, and a copy of which was filed with the Report on Form 10-Q for the period ending September 30, 2013 and is incorporated herein by reference.
|
ITEM 13.
|
CERTAIN RELATIONSHIPS AND RELATED TRANSACTIONS, AND DIRECTOR INDEPENDENCE
|
The information required by Item 13 is incorporated by reference from the information under the captions "Certain Relationships and Related Transactions" and "Board Structure and Corporate Governance - Director Independence" in the Proxy Statement.
The information required by Item 14 regarding principal auditor fees and services is incorporated by reference from the information under the caption “Principal Accounting Fees and Services” in the Proxy Statement.
|
Page
|
|
|
(a) 1. Consolidated financial statements:
|
|
|
Report of independent registered public accounting firm
|
45
|
|
Consolidated statement of operations
|
47
|
|
Consolidated statement of comprehensive (loss) income
|
48
|
|
Consolidated statement of financial position
|
49
|
|
Consolidated statement of equity (deficit)
|
50
|
|
Consolidated statement of cash flows
|
52
|
|
Notes to financial statements
|
54
|
|
2. Financial statement schedule:
|
|
|
II - Valuation and qualifying accounts
|
130
|
|
All other schedules have been omitted because they are not applicable or the information required is shown in the financial statements or notes thereto.
|
|
|
3. Supplemental data:
|
|
|
Quarterly sales and earnings data (unaudited)
|
124
|
|
4. Exhibits required as part of this report are listed in the index appearing on pages 131 through 134.
|
|
128
SIGNATURES
Pursuant to the requirements of Section 13 or 15(d) of the Securities Exchange Act of 1934, the registrant has duly caused this report to be signed on its behalf by the undersigned, thereunto duly authorized.
EASTMAN KODAK COMPANY
(Registrant)
By: _________________________
/s/ Jeffrey J. Clarke
Chief Executive Officer
March 16, 2015
Pursuant to the requirements of the Securities Exchange Act of 1934, this report has been signed below by the following persons on behalf of the registrant and in the capacities and on the date indicated.
|
Signature
|
Title
|
|
|
By:
|
/s/ Jeffrey J. Clarke
|
Chief Executive Officer and Director
|
|
Jeffrey J. Clarke
|
(Principal Executive Officer)
|
|
|
By:
|
/s/ John N. McMullen
John N. McMullen
|
Chief Financial Officer
(Principal Financial Officer)
|
|
By:
|
/s/ Eric H. Samuels
|
Chief Accounting Officer and Corporate Controller
|
|
Eric H. Samuels
|
(Principal Accounting Officer)
|
|
|
By:
|
/s/ Mark S. Burgess
|
Director
|
|
Mark S. Burgess
|
||
|
By:
|
/s/ James V. Continenza
|
Chairman
|
|
James V. Continenza
|
||
|
By:
|
/s/ Matthew A. Doheny
|
Director
|
|
Matthew A. Doheny
|
||
|
By:
|
/s/ John A. Janitz
|
Director
|
|
John A. Janitz
|
||
|
By:
|
/s/ George Karfunkel
|
Director
|
|
George Karfunkel
|
||
|
By:
|
/s/ Jason New
|
Director
|
|
Jason New
|
||
| By: |
/s/ William G. Parrett
|
Director
|
|
|
William G. Parrett
|
|
|
By:
|
/s/ Derek Smith
|
Director
|
|
Derek Smith
|
||
Date: March 16, 2015
129
Schedule II
Eastman Kodak Company
Valuation and Qualifying Accounts
|
Balance at
|
Charges to
|
Amounts
|
Balance at
|
|||||||||||||
|
Beginning
|
Earnings
|
Written
|
End of
|
|||||||||||||
|
(in millions)
|
Of Period
|
and Equity
|
Off
|
Period
|
||||||||||||
|
Year ended December 31, 2014 (Successor)
|
||||||||||||||||
|
Deducted in the Statement of Financial Position:
|
||||||||||||||||
|
From Current Receivables:
|
||||||||||||||||
|
Reserve for doubtful accounts
|
$ | 6 | $ | 5 | $ | - | $ | 11 | ||||||||
|
Reserve for loss on returns and allowances
|
3 | 3 | 3 | 3 | ||||||||||||
|
Total
|
$ | 9 | $ | 8 | $ | 3 | $ | 14 | ||||||||
|
From Deferred Tax Assets:
|
||||||||||||||||
|
Valuation allowance
|
$ | 953 | $ | 257 | $ | 83 | $ | 1,127 | ||||||||
|
Four Months ended December 31, 2013 (Successor)
|
||||||||||||||||
|
From Current Receivables:
|
||||||||||||||||
|
Reserve for doubtful accounts
|
$ | - | $ | 6 | $ | - | $ | 6 | ||||||||
|
Reserve for loss on returns and allowances
|
3 | 2 | 2 | 3 | ||||||||||||
|
Total
|
$ | 3 | $ | 8 | $ | 2 | $ | 9 | ||||||||
|
In connection with the application of fresh start accounting on September 1, 2013, the carrying value of trade receivables was adjusted
to fair value, eliminating the reserve for doubtful accounts.
|
||||||||||||||||
|
From Deferred Tax Assets:
|
||||||||||||||||
|
Valuation allowance
|
$ | 1,273 | $ | 157 | $ | 477 | $ | 953 | ||||||||
|
Eight Months ended August 31, 2013 (Predecessor)
|
||||||||||||||||
|
Deducted in the Statement of Financial Position:
|
||||||||||||||||
|
From Current Receivables:
|
||||||||||||||||
|
Reserve for doubtful accounts
|
$ | 30 | $ | - | $ | 8 | $ | 22 | ||||||||
|
Reserve for loss on returns and allowances
|
5 | 3 | 5 | 3 | ||||||||||||
|
Total
|
$ | 35 | $ | 3 | $ | 13 | $ | 25 | ||||||||
|
From Deferred Tax Assets:
|
||||||||||||||||
|
Valuation allowance
|
$ | 2,838 | $ | 180 | $ | 1,745 | $ | 1,273 | ||||||||
|
Year ended December 31, 2012 (Predecessor)
|
||||||||||||||||
|
Deducted in the Statement of Financial Position:
|
||||||||||||||||
|
From Current Receivables:
|
||||||||||||||||
|
Reserve for doubtful accounts
|
$ | 27 | $ | 12 | $ | 9 | $ | 30 | ||||||||
|
Reserve for loss on returns and allowances
|
11 | 10 | 16 | 5 | ||||||||||||
|
Total
|
$ | 38 | $ | 22 | $ | 25 | $ | 35 | ||||||||
|
From Deferred Tax Assets:
|
||||||||||||||||
|
Valuation allowance
|
$ | 2,560 | $ | 807 | $ | 529 | $ | 2,838 | ||||||||
130
|
Eastman Kodak Company
|
|
|
Index to Exhibits
|
|
|
Exhibit
|
|
|
Number
|
|
|
(2.1)
|
Confirmation Order from the United States Bankruptcy Court for the Southern District of New York Confirming the First Amended Joint Chapter 11 Plan of Reorganization, dated August 23, 2013.
|
|
(Incorporated by reference to Exhibit 2.1 of the Company’s Current Report on Form 8-K as filed on August 29, 2013).
|
|
|
(2.2)
|
First Amended Joint Chapter 11 Plan of Reorganization of Eastman Kodak Company and its Debtor Affiliates.
|
|
(Incorporated by reference to Exhibit 2.2 of the Company’s Current Report on Form 8-K as filed on August 29, 2013).
|
|
|
(2.3)
|
Amended and Restated Stock and Asset Purchase Agreement between Eastman Kodak Company, Qualex, Inc., Kodak (Near East), Inc., KPP Trustees Limited, as Trustee for the Kodak Pension Plan of the United Kingdom, and, solely for purposes of Section 11.4, KPP Holdco Limited, dated August 30, 2013.
|
|
(Incorporated by reference to Exhibit 2.3 of the Company’s Quarterly Report on Form 10-Q for the quarterly period ended September 30, 2013 as filed on November 12, 2013).
|
|
|
(3.1)
|
Second Amended and Restated Certificate of Incorporation.
|
|
(Incorporated by reference to Exhibit 4.1 of the Company’s Registration Statement on Form S-8 as filed on September 3, 2013).
|
|
|
(3.2)
|
Third Amended and Restated By-Laws.
|
|
(Incorporated by reference to Exhibit 3.1 of the Company’s Quarterly Report on Form 10-Q for the quarterly period ended June 30, 2014 as filed on August 5, 2014).
|
|
|
(4.1)
|
Registration Rights Agreement between Eastman Kodak Company and certain stockholders listed on Schedule 1 thereto, dated September 3, 2013.
|
|
(Incorporated by reference to Exhibit 4.1 of the Company’s Registration Statement on Form 8-A as filed on September 3, 2013).
|
|
|
(4.2)
|
Warrant Agreement between Eastman Kodak Company and ComputerShare Trust Company, N.A. and ComputerShare Inc. as Warrant Agent, dated September 3, 2013.
|
|
(Incorporated by reference to Exhibit 4.2 of the Company’s Registration Statement on Form 8-A as filed on September 3, 2013).
|
|
|
*(10.1)
|
Eastman Kodak Company 2013 Omnibus Incentive Plan.
|
|
(Incorporated by reference to Exhibit 4.4 of the Company’s Registration Statement on Form S-8 as filed on September 3, 2013).
|
|
|
*(10.2)
|
Eastman Kodak 2013 Omnibus Incentive Plan Form of Executive Restricted Stock Unit Award Agreement.
|
|
(Incorporated by reference to Exhibit 10.2 of the Company’s Quarterly Report on Form 10-Q for the quarterly period ended September 30, 2013 as filed on November 12, 2013).
|
|
|
*(10.3)
|
Eastman Kodak Company 2013 Omnibus Incentive Plan Form of Director Restricted Stock Unit Award Agreement.
|
|
(Incorporated by reference to Exhibit 10.3 of the Company’s Annual Report on Form 10-K for the fiscal year ended December 31, 2013 as filed on March 19, 2014).
|
|
131
| Eastman Kodak Company | |
| Index to Exhibits | |
| Exhibit | (cont'd) |
| Number | |
|
#(10.4)
|
Credit Agreement dated September 3, 2013 among Eastman Kodak Company as Borrower, the guarantors named therein as Guarantors, the lenders named therein as Lenders, Bank of America, N.A. as Administrative and Collateral Agent, Barclays Bank PLC as Syndication Agent and Merrill Lynch, Pierce, Fenner & Smith Incorporated, Barclays Bank PLC and J.P. Morgan Securities LLC as Joint Lead Arrangers and Joint Bookrunners.
|
|
(Incorporated by reference to Exhibit 10.3 of the Company’s Quarterly Report on Form 10-Q for the quarterly period ended September 30, 2013 as filed on November 12, 2013).
|
|
|
#(10.5)
|
Security Agreement dated September 3, 2013 from the grantors referred to therein as Grantors to Bank of America, N.A. as Agent.
|
|
(Incorporated by reference to Exhibit 10.4 of the Company’s Quarterly Report on Form 10-Q for the quarterly period ended September 30, 2013 as filed on November 12, 2013).
|
|
|
(10.6)
|
Intercreditor Agreement dated September 3, 2013 among Bank of America, N.A. as Representative with respect to the ABL Credit Agreement, JPMorgan Chase Bank, N.A. as Representative with respect to the Senior Term Loan Agreement, Barclays Bank PLC, as Representative with respect to the Junior Term Loan Agreement, Eastman Kodak Company and the other grantors party thereto.
|
|
(Incorporated by reference to Exhibit 10.5 of the Company’s Quarterly Report on Form 10-Q for the quarterly period ended September 30, 2013 as filed on November 12, 2013).
|
|
|
#(10.7)
|
Senior Secured First Lien Term Credit Agreement dated September 3, 2013 among Eastman Kodak Company, as the Borrower, the lenders party hereto, JPMorgan Chase Bank, N.A. as Administrative Agent, and J.P. Morgan Securities LLC, Barclays Bank PLC and Merrill Lynch, Pierce, Fenner & Smith Incorporated, as Joint Lead Arrangers and Joint Bookrunners.
|
|
(Incorporated by reference to Exhibit 10.6 of the Company’s Quarterly Report on Form 10-Q for the quarterly period ended September 30, 2013 as filed on November 12, 2013).
|
|
|
#(10.8)
|
Guarantee and Collateral Agreement dated September 3, 2013 from the grantors referred to therein as Grantors to JPMorgan Chase Bank, N.A. as Administrative Agent.
|
|
(Incorporated by reference to Exhibit 10.7 of the Company’s Quarterly Report on Form 10-Q for the quarterly period ended September 30, 2013 as filed on November 12, 2013).
|
|
|
#(10.9)
|
Senior Secured Second Lien Term Credit Agreement dated September 3, 2013, among Eastman Kodak Company, as the Borrower and the lenders party thereto, Barclays Bank PLC, as Administrative Agent and J.P. Morgan Securities LLC, Barclays Bank PLC and Merrill Lynch, Pierce, Fenner & Smith Incorporated, as Joint Lead Arrangers and Joint Bookrunners.
|
|
(Incorporated by reference to Exhibit 10.8 of the Company’s Quarterly Report on Form 10-Q for the quarterly period ended September 30, 2013 as filed on November 12, 2013).
|
|
|
#(10.10)
|
Guarantee and Collateral Agreement dated September 3, 2013 from the grantors referred to therein as Grantors to Barclays Bank PLC as Administrative Agent.
|
|
(Incorporated by reference to Exhibit 10.9 of the Company’s Quarterly Report on Form 10-Q for the quarterly period ended September 30, 2013 as filed on November 12, 2013).
|
|
|
(10.11)
|
Amended and Restated Settlement Agreement (Eastman Business Park) between Eastman Kodak Company, the New York State Department of Environmental Conservation, and the New York State Urban Development Corporation d/b/a Empire State Development, dated August 6, 2013.
|
|
(Incorporated by reference to Exhibit 10.10 of the Company’s Quarterly Report on Form 10-Q for the quarterly period ended September 30, 2013 as filed on November 12, 2013).
|
|
|
*(10.12)
|
Employment Agreement between Eastman Kodak Company and John N. McMullen, dated May 16, 2014.
|
|
(Incorporated by reference to Exhibit 10.1 of the Company’s Quarterly Report on Form 10-Q for the quarterly period ended June 30, 2014 as filed on August 5, 2014).
|
|
|
*(10.13)
|
Employment Agreement between Eastman Kodak Company and Jeffrey J. Clarke, dated March 10, 2014.
(Incorporated by reference to Exhibit 10.1 of the Company’s Quarterly Report on Form 10-Q for the quarterly period ended March 31, 2014 as filed on May 6, 2014).
|
132
| Eastman Kodak Company | |
| Index to Exhibits | |
| (cont'd) | |
| Exhibit | |
| Number | |
|
*#(10.14)
|
Management Agreement with Douglas J. Edwards, dated September 3, 2013.
|
|
(Incorporated by reference to Exhibit 10.11 of the Company’s Quarterly Report on Form 10-Q for the quarterly period ended September 30, 2013 as filed on November 12, 2013).
|
|
|
*(10.15)
|
Management Agreement with Antonio M. Perez, dated September 3, 2013.
|
|
(Incorporated by reference to Exhibit 10.12 of the Company’s Quarterly Report on Form 10-Q for the quarterly period ended September 30, 2013 as filed on November 12, 2013).
|
|
|
*#(10.16)
|
Management Agreement with Laura G. Quatela, dated September 3, 2013.
|
|
(Incorporated by reference to Exhibit 10.13 of the Company’s Quarterly Report on Form 10-Q for the quarterly period ended September 30, 2013 as filed on November 12, 2013).
|
|
|
*#(10.17)
|
Management Agreement with Patrick M. Sheller, dated September 3, 2013.
|
|
(Incorporated by reference to Exhibit 10.14 of the Company’s Quarterly Report on Form 10-Q for the quarterly period ended September 30, 2013 as filed on November 12, 2013).
|
|
|
*(10.18)
|
Management Agreement with Brad Kruchten, dated September 3, 2013.
|
|
(Incorporated by reference to Exhibit 10.16 of the Company’s Annual Report on Form 10-K for the fiscal year ended December 31, 2013 as filed on March 19, 2014).
|
|
|
(10.19)
|
Settlement Agreement between Eastman Kodak Company, Kodak Limited, Kodak International Finance Limited, Kodak Polychrome Graphics Finance UK Limited, and the KPP Trustees Limited, as trustee for the Kodak Pension Plan of the United Kingdom, dated April 26, 2013.
|
|
(Incorporated by reference to Exhibit 10.1 of the Company’s Quarterly Report on Form 10-Q for the quarterly period ended June 30, 2013 as filed on August 7, 2013).
|
|
|
(10.20)
|
Backstop Commitment Agreement among Eastman Kodak Company and the Backstop Parties party thereto, dated June 18, 2013.
|
|
(Incorporated by reference to Exhibit 10.3 of the Company’s Quarterly Report on Form 10-Q for the quarterly period ended June 30, 2013 as filed on August 7, 2013).
|
|
|
*(10.21)
|
Eastman Kodak Company Executive Compensation for Excellence and Leadership Plan, dated January 1, 2014.
|
|
(Incorporated by reference to Exhibit 10.2 of the Company’s Quarterly Report on Form 10-Q for the quarterly period ended March 31, 2014 as filed on May 6, 2014).
|
|
|
*(10.22)
|
Eastman Kodak Company Administrative Guide for the 2014 Performance Period under the Executive Compensation for Excellence and Leadership Plan.
|
|
(Incorporated by reference to Exhibit 10.3 of the Company’s Quarterly Report on Form 10-Q for the quarterly period ended March 31, 2014 as filed on May 6, 2014).
|
|
|
*(10.23)
|
Eastman Kodak Company Deferred Compensation Plan for Directors dated December 26, 2013.
|
|
(Incorporated by reference to Exhibit 10.23 of the Company’s Annual Report on Form 10-K for the fiscal year ended December 31, 2013 as filed on March 19, 2014).
|
|
|
(12)
|
Statement regarding Computation of Ratio of Earnings to Fixed Charges, filed herewith.
|
|
(21)
|
Subsidiaries of Eastman Kodak Company, filed herewith.
|
|
(23)
|
Consents of Independent Registered Public Accounting Firm, filed herewith.
|
133
| Eastman Kodak Company | |
| Index to Exhibits | |
| (cont'd) | |
| Exhibit | |
| Number | |
|
(31.1)
|
Certification signed by Jeffrey J. Clarke, filed herewith.
|
|
(31.2)
|
Certification signed by John N. McMullen, filed herewith.
|
|
(32.1)
|
Certification Pursuant to 18 U.S.C. Section 1350, as Adopted Pursuant to Section 906 of the Sarbanes-Oxley Act of 2002, signed by Jeffrey J. Clarke, filed herewith.
|
|
(32.2)
|
Certification Pursuant to 18 U.S.C. Section 1350, as Adopted Pursuant to Section 906 of the Sarbanes-Oxley Act of 2002 signed by John N. McMullen, filed herewith.
|
|
(99.1)
|
Section 13(r) Disclosure, filed herewith.
|
|
(101.CAL)
|
XBRL Taxonomy Extension Calculation Linkbase.
|
|
|
|
|
(101.INS)
|
XBRL Instance Document.
|
|
(101.LAB)
|
XBRL Taxonomy Extension Label Linkbase.
|
|
(101.PRE)
|
XBRL Taxonomy Extension Presentation Linkbase.
|
|
(101.SCH)
|
XBRL Taxonomy Extension Scheme Linkbase.
|
|
(101.DEF)
|
XBRL Taxonomy Extension Definition Linkbase.
|
* Management contract or compensatory plan or arrangement.
# Eastman Kodak Company was granted confidential treatment for certain information contained in this exhibit. Such information was filed separately with the Securities and Exchange Commission pursuant to an application for confidential treatment under 17 C.F.R. §§ 200.80(b)(4) and 240.24b-2.
134
TABLE OF CONTENTS
Part IItem 1. BusinessItem 1A. Risk FactorsItem 1B. Unresolved Staff CommentsItem 2. PropertiesItem 3. Legal ProceedingsItem 4. Mine Safety DisclosuresPart IIItem 5. Market For Registrant S Common Equity, Related Stockholder Matters and Issuer Purchases Of Equity SecuritiesItem 6. Selected Financial DataItem 7. Management S Discussion and Analysis Of Financial Condition and Results Of OperationsItem 7A. Quantitative and Qualitative Disclosures About Market RiskItem 8. Financial Statements and Supplementary DataNote 1: Basis Of Presentation and Significant Accounting PoliciesNote 2: Receivables, NetNote 3: Inventories, NetNote 4: Property, Plant and Equipment, NetNote 5: Goodwill and Other Intangible AssetsNote 6: Other Current LiabilitiesNote 7: Other Long-term LiabilitiesNote 8: Short-term Borrowings and Long-term DebtNote 9: Commitments and ContingenciesNote 10: GuaranteesNote 11: Financial InstrumentsNote 12: Other Operating Expense (income), NetNote 13: Other (charges) Income, NetNote 14: Income TaxesNote 15: Restructuring Costs and OtherNote 16: Retirement PlansNote 17: Other Postretirement BenefitsNote 18: Earnings Per ShareNote 19: Stock-based CompensationNote 20: Shareholders EquityNote 21: Other Comprehensive (loss) IncomeNote 22: Accumulated Other Comprehensive (loss) IncomeNote 23: Segment InformationNote 24: Emergence From Voluntary Reorganization Under Chapter 11 ProceedingsNote 25: Fresh Start AccountingNote 26: Reorganization Items, NetNote 27: Discontinued OperationsItem 9. Changes in and Disagreements with Accountants on Accounting and Financial DisclosureItem 9A. Controls and ProceduresItem 9B. Other InformationPart IIIItem 10. Directors, Executive Officers and Corporate GovernanceItem 11. Executive CompensationItem 12. Security Ownership Of Certain Beneficial Owners and Management and Related Stockholder MattersItem 13. Certain Relationships and Related Transactions, and Director IndependenceItem 14. Principal Accounting Fees and ServicesPart IVItem 15. Exhibits, Financial Statement Schedules