KILROY REALTY CORP
10-Ks and 10-Qs
|
|
|
|
|
|
|
|
|
|
|
|
|
|
|
|
|
|
|
|
|
|
|
|
|
|
|
|
|
|
|
|
|
|
|
|
|
|
|
|
|
|
|
|
|
|
|
|
|
|
|
|
|
|
|
|
UNITED STATES
SECURITIES AND EXCHANGE COMMISSION
Washington, D.C. 20549
FORM 10-K
(MARK ONE)
|
x
|
ANNUAL REPORT PURSUANT TO SECTION 13 OR 15(d) OF THE SECURITIES EXCHANGE ACT OF 1934
|
For the fiscal year ended
December 31, 2017
OR
|
¨
|
TRANSITION REPORT PURSUANT TO SECTION 13 OR 15(d) OF THE SECURITIES EXCHANGE ACT OF 1934
|
For the transition period from
to
Commission file number 1-12675 (Kilroy Realty Corporation)
Commission file number 000-54005 (Kilroy Realty, L.P.)
KILROY REALTY CORPORATION
KILROY REALTY, L.P.
(Exact name of registrant as specified in its charter)
|
Kilroy Realty Corporation
|
Maryland
|
95-4598246
|
|
(State or other jurisdiction of incorporation or organization)
|
(I.R.S. Employer Identification No.)
|
|
|
Kilroy Realty, L.P.
|
Delaware
|
95-4612685
|
|
(State or other jurisdiction of incorporation or organization)
|
(I.R.S. Employer Identification No.)
|
|
|
12200 W. Olympic Boulevard, Suite 200, Los Angeles, California 90064
|
||
|
(Address of principal executive offices) (Zip Code)
|
||
|
Registrant’s telephone number, including area code: (310) 481-8400
|
||
|
Securities registered pursuant to Section 12(b) of the Act:
|
||
|
Registrant
|
Title of each class
|
Name of each exchange on which registered
|
|
Kilroy Realty Corporation
|
Common Stock, $.01 par value
|
New York Stock Exchange
|
Securities registered pursuant to Section 12(g) of the Act:
|
Registrant
|
Title of each class
|
|
Kilroy Realty, L.P.
|
Common Units Representing Limited Partnership Interests
|
Indicate by check mark if the registrant is a well-known seasoned issuer, as defined in Rule 405 of the Securities Act.
Kilroy Realty Corporation Yes
x
No
¨
Kilroy Realty, L. P. Yes
x
No
¨
Indicate by check mark if the registrant is not required to file reports pursuant to Section 13 or 15(d) of the Act.
Kilroy Realty Corporation Yes
¨
No
x
Kilroy Realty, L. P. Yes
¨
No
x
Indicate by check mark whether the registrant (1) has filed all reports required to be filed by Section 13 or 15(d) of the Securities Exchange Act of 1934 during the preceding 12 months (or for such shorter period that the registrant was required to file such reports), and (2) has been subject to such filing requirements for the past 90 days.
Kilroy Realty Corporation Yes
x
No
¨
Kilroy Realty, L. P. Yes
x
No
¨
Indicate by check mark whether the registrant has submitted electronically and posted on its corporate Web site, if any, every Interactive Data File required to be submitted and posted pursuant to Rule 405 of Regulation S-T (§232.405 of this chapter) during the preceding 12 months (or for such shorter period that the registrant was required to submit and post such files).
Kilroy Realty Corporation Yes
x
No
¨
Kilroy Realty, L. P. Yes
x
No
¨
Indicate by check mark if disclosure of delinquent filers pursuant to Item 405 of Regulation S-K (§229.405 of this chapter) is not contained herein, and will not be contained, to the best of registrant’s knowledge, in definitive proxy or information statements incorporated by reference in Part III of this Form 10-K or any amendment to this Form 10-K.
¨
Indicate by check mark whether the registrant is a large accelerated filer, an accelerated filer, a non-accelerated filer, or a smaller reporting company. See the definitions of “large accelerated filer,” “accelerated filer” and “smaller reporting company” in Rule 12b-2 of the Exchange Act.
|
Kilroy Realty Corporation
|
|||||||
|
x
|
Large accelerated filer
|
o
|
Accelerated filer
|
o
|
Non-accelerated filer
(Do not check if a smaller reporting company
)
|
o
|
Smaller reporting company
|
|
o
|
Emerging growth company
If an emerging growth company, indicate by check mark if the registrant has elected not to use the extended transition period for complying with any new or revised financial accounting standards provided pursuant to Section 13(a) of the Exchange Act.
o
|
||||||
|
Kilroy Realty, L.P.
|
|||||||
|
o
|
Large accelerated filer
|
o
|
Accelerated filer
|
x
|
Non-accelerated filer
(Do not check if a smaller reporting company)
|
o
|
Smaller reporting company
|
|
o
|
Emerging growth company
If an emerging growth company, indicate by check mark if the registrant has elected not to use the extended transition period for complying with any new or revised financial accounting standards provided pursuant to Section 13(a) of the Exchange Act.
o
|
||||||
Indicate by check mark whether the registrant is a shell company (as defined in Rule 12b-2 of the Act).
Kilroy Realty Corporation Yes
¨
No
x
Kilroy Realty, L. P. Yes
¨
No
x
The aggregate market value of the voting and non-voting shares of common stock held by non-affiliates of Kilroy Realty Corporation was approximately
$7,367,936,410
based on the quoted closing price on the New York Stock Exchange for such shares on June 30, 2017.
There is no public trading market for the common units of limited partnership interest of Kilroy Realty, L.P. As a result, the aggregate market value of the common units of limited partnership interest held by non-affiliates of Kilroy Realty, L.P. cannot be determined.
As of
February 9, 2017
,
98,721,228
shares of Kilroy Realty Corporation’s common stock, par value $.01 per share, were outstanding.
DOCUMENTS INCORPORATED BY REFERENCE
Portions of the Kilroy Realty Corporation’s Proxy Statement with respect to its
2018
Annual Meeting of Stockholders to be filed not later than 120 days after the end of the registrant’s fiscal year are incorporated by reference into Part III of this Form 10-K.
EXPLANATORY NOTE
This report combines the annual reports on Form 10-K for the year ended
December 31, 2017
of Kilroy Realty Corporation and Kilroy Realty, L.P. Unless stated otherwise or the context otherwise requires, references to “Kilroy Realty Corporation” or the “Company,” “we,” “our,” and “us” mean Kilroy Realty Corporation, a Maryland corporation, and its controlled and consolidated subsidiaries, and references to “Kilroy Realty, L.P.” or the “Operating Partnership” mean Kilroy Realty, L.P., a Delaware limited partnership, and its controlled and consolidated subsidiaries.
The Company is a real estate investment trust, or REIT, and the general partner of the Operating Partnership. As of
December 31, 2017
, the Company owned an approximate
97.9%
common general partnership interest in the Operating Partnership. The remaining approximate
2.1%
common limited partnership interests are owned by non-affiliated investors and certain directors and officers of the Company. As the sole general partner of the Operating Partnership, the Company exercises exclusive and complete discretion over the Operating Partnership’s day-to-day management and control and can cause it to enter into certain major transactions including acquisitions, dispositions, and refinancings and cause changes in its line of business, capital structure and distribution policies.
There are a few differences between the Company and the Operating Partnership that are reflected in the disclosures in this Form 10-K. We believe it is important to understand the differences between the Company and the Operating Partnership in the context of how the Company and the Operating Partnership operate as an interrelated, consolidated company. The Company is a REIT, the only material asset of which is the partnership interests it holds in the Operating Partnership. As a result, the Company generally does not conduct business itself, other than acting as the sole general partner of the Operating Partnership, issuing equity from time to time and guaranteeing certain debt of the Operating Partnership. The Company itself is not directly obligated under any indebtedness, but generally guarantees all of the debt of the Operating Partnership. The Operating Partnership owns substantially all of the assets of the Company either directly or through its subsidiaries, conducts the operations of the Company’s business and is structured as a limited partnership with no publicly-traded equity. Except for net proceeds from equity issuances by the Company, which the Company generally contributes to the Operating Partnership in exchange for units of partnership interest, the Operating Partnership generates the capital required by the Company’s business through the Operating Partnership’s operations, by the Operating Partnership’s incurrence of indebtedness or through the issuance of units of partnership interest.
Noncontrolling interests, stockholders’ equity and partners’ capital are the main areas of difference between the consolidated financial statements of the Company and those of the Operating Partnership. The common limited partnership interests in the Operating Partnership are accounted for as partners’ capital in the Operating Partnership’s financial statements and, to the extent not held by the Company, as noncontrolling interests in the Company’s financial statements. The Operating Partnership’s financial statements reflect the noncontrolling interest in Kilroy Realty Finance Partnership, L.P., a Delaware limited partnership (the “Finance Partnership”). This noncontrolling interest represents the Company’s 1% indirect general partnership interest in the Finance Partnership, which is directly held by Kilroy Realty Finance, Inc., a wholly owned subsidiary of the Company. The differences between stockholders’ equity, partners’ capital and noncontrolling interests result from the differences in the equity issued by the Company and the Operating Partnership, and in the Operating Partnership’s noncontrolling interest in the Finance Partnership.
We believe combining the annual reports on Form 10-K of the Company and the Operating Partnership into this single report results in the following benefits:
|
•
|
Combined reports better reflect how management and the analyst community view the business as a single operating unit;
|
|
•
|
Combined reports enhance investors’ understanding of the Company and the Operating Partnership by enabling them to view the business as a whole and in the same manner as management;
|
|
•
|
Combined reports are more efficient for the Company and the Operating Partnership and result in savings in time, effort and expense; and
|
|
•
|
Combined reports are more efficient for investors by reducing duplicative disclosure and providing a single document for their review.
|
1
To help investors understand the significant differences between the Company and the Operating Partnership, this report presents the following separate sections for each of the Company and the Operating Partnership:
|
•
|
Item 6. Selected Financial Data – Kilroy Realty Corporation;
|
|
•
|
Item 6. Selected Financial Data – Kilroy Realty, L.P.;
|
|
•
|
Item 7. Management’s Discussion and Analysis of Financial Condition and Results of Operations:
|
|
◦
|
—Liquidity and Capital Resources of the Company; and
|
|
◦
|
—Liquidity and Capital Resources of the Operating Partnership;
|
|
•
|
consolidated financial statements;
|
|
•
|
the following notes to the consolidated financial statements:
|
|
◦
|
Note 8, Secured and Unsecured Debt of the Company;
|
|
◦
|
Note 9, Secured and Unsecured Debt of the Operating Partnership;
|
|
◦
|
Note 11, Noncontrolling Interests on the Company’s Consolidated Financial Statements;
|
|
◦
|
Note 12, Noncontrolling Interests on the Operating Partnership’s Consolidated Financial Statements;
|
|
◦
|
Note 13, Stockholders’ Equity of the Company;
|
|
◦
|
Note 14, Partners' Capital of the Operating Partnership;
|
|
◦
|
Note 20, Net Income Available to Common Stockholders Per Share of the Company;
|
|
◦
|
Note 21, Net Income Available to Common Unitholders Per Unit of the Operating Partnership;
|
|
◦
|
Note 22, Supplemental Cash Flow Information of the Company;
|
|
◦
|
Note 23, Supplemental Cash Flow Information of the Operating Partnership;
|
|
◦
|
Note 25, Quarterly Financial Information of the Company (Unaudited); and
|
|
◦
|
Note 26, Quarterly Financial Information of the Operating Partnership (Unaudited).
|
This report also includes separate sections under Item 9A. Controls and Procedures and separate Exhibit 31 and Exhibit 32 certifications for each of the Company and the Operating Partnership to establish that the Chief Executive Officer and the Chief Financial Officer of each entity have made the requisite certifications and that the Company and Operating Partnership are compliant with Rule 13a-15 or Rule 15d-15 of the Securities Exchange Act of 1934, as amended (the “Exchange Act”), and 18 U.S.C. §1350.
2
TABLE OF CONTENTS
|
Page
|
|||
|
PART I
|
|||
|
Item 1.
|
|||
|
Item 1A.
|
|||
|
Item 1B.
|
|||
|
Item 2.
|
|||
|
Item 3.
|
|||
|
Item 4.
|
|||
|
PART II
|
|||
|
Item 5.
|
|||
|
Item 6.
|
|||
|
Item 7.
|
|||
|
Item 7A.
|
|||
|
Item 8.
|
|||
|
Item 9.
|
|||
|
Item 9A.
|
|||
|
Item 9B.
|
|||
|
PART III
|
|||
|
Item 10.
|
|||
|
Item 11.
|
|||
|
Item 12.
|
|||
|
Item 13.
|
|||
|
Item 14.
|
|||
|
PART IV
|
|||
|
Item 15.
|
|||
This document contains certain forward-looking statements within the meaning of Section 27A of the Securities Act of 1933, as amended, and Section 21E of the Securities Exchange Act of 1934, as amended, including, among other things, statements or information concerning our plans, objectives, capital resources, portfolio performance, results of operations, projected future occupancy and rental rates, lease expirations, debt maturities, potential investments, strategies such as capital recycling, development and redevelopment activity, projected construction costs, projected construction commencement and completion dates, projected square footage of space that could be constructed on undeveloped land that we own, projected rentable square footage of or number of units in properties under construction or in the development pipeline, anticipated proceeds from capital recycling activity or other dispositions and anticipated dates of those activities or dispositions, projected increases in the value of properties, dispositions, future executive incentive compensation, pending, potential or proposed acquisitions, plans to grow our net operating income and funds from operations, our ability to re-lease properties at or above current market rates, anticipated market conditions, demographics and other forward-looking financial data, as well as the discussion in “Item 7. Management’s Discussion and Analysis of Financial Condition and Results of Operations -Factors That May Influence Future Results of Operations.” Forward-looking statements are based on our current expectations, beliefs and assumptions, and are not guarantees of future performance. Forward-looking statements are inherently subject to uncertainties, risks, changes in circumstances, trends and factors that are difficult to predict, many of which are outside of our control. Accordingly, actual performance, results and events may vary materially from those indicated in the forward-looking statements, and you should not rely on the forward-looking statements as predictions of future performance, results or events. All forward-looking statements are based on information that was available and speak only as of the date on which they were made. We assume no obligation to update any forward-looking statement that becomes untrue because of subsequent events, new information or otherwise, except to the extent we are required to do so in connection with our ongoing requirements under federal securities laws.
In addition, this report contains information and statistics regarding, among other things, the industry, markets, submarkets and sectors in which we operate, the percentage by which certain leases are above or below applicable market rents and the number of square feet of office and other space that could be developed from specific parcels of undeveloped land. We obtained this information and these statistics from various third-party sources and our own internal estimates. We believe that these sources and estimates are reliable but have not independently verified them and cannot guarantee their accuracy or completeness.
4
|
ITEM 1.
|
BUSINESS
|
The Company
We are a self-administered REIT active in premier office and mixed-use submarkets along the West Coast. We own, develop, acquire and manage real estate assets, consisting primarily of Class A properties in the coastal regions of Los Angeles, Orange County, San Diego County, the San Francisco Bay Area and Greater Seattle, which we believe have strategic advantages and strong barriers to entry. Class A real estate encompasses attractive and efficient buildings of high quality that are attractive to tenants, are well-designed and constructed with above-average material, workmanship and finishes and are well-maintained and managed. We own our interests in all of our real estate assets through the Operating Partnership and the Finance Partnership and generally conduct substantially all of our operations through the Operating Partnership. We qualify as a REIT under the Internal Revenue Code of 1986, as amended (the “Code”).
Our stabilized portfolio of operating properties was comprised of the following properties at
December 31, 2017
:
|
Number of
Buildings
|
Rentable
Square Feet
|
Number of
Tenants
|
Percentage
Occupied
|
Percentage Leased
|
||||||||||
|
Stabilized Office Properties
|
101
|
|
13,720,597
|
|
511
|
|
95.2
|
%
|
96.9
|
%
|
||||
|
Number of
Buildings |
Number of Units
|
2017 Average Occupancy
|
||||||
|
Stabilized Residential Property
|
1
|
|
200
|
|
70.2
|
%
|
||
Our stabilized portfolio includes all of our properties with the exception of development and redevelopment properties currently under construction or committed for construction, “lease-up” properties, real estate assets held for sale and undeveloped land. We define redevelopment properties as those properties for which we expect to spend significant development and construction costs on the existing or acquired buildings pursuant to a formal plan, the intended result of which is a higher economic return on the property. We define “lease-up” properties as office and retail properties we recently developed or redeveloped that have not yet reached
95%
occupancy and are within one year following cessation of major construction activities. There were no operating properties in “lease-up” or held for sale as of
December 31, 2017
.
During the first quarter of
2017
, we added
one
development project to our stabilized office portfolio consisting of
365,359
rentable square feet in Hollywood, California. As of
December 31, 2017
, the following properties were excluded from our stabilized portfolio. We did not have any redevelopment properties at
December 31, 2017
.
|
Number of
Properties/Projects
|
Estimated Rentable
Square Feet
|
|||
|
Development projects under construction
(1)(2)
|
4
|
1,800,000
|
|
|
_______________
|
(1)
|
Estimated rentable square feet upon completion. See “Item 7. Management’s Discussion and Analysis of Financial Condition and Results of Operations —Factors That May Influence Future Results of Operations —Completed, In-Process and Future Development Pipeline” for more information.
|
|
(2)
|
Includes
86,000
square feet of Production, Distribution, and Repair (“PDR”) space. Development projects under construction also include
96,000
square feet of retail space and
237
residential units at One Paseo - Phase I in addition to the estimated rentable square feet noted above.
|
Our stabilized portfolio also excludes our near-term and future development pipeline, which as of
December 31, 2017
, was comprised of
six
potential development sites, representing approximately
48
gross acres of undeveloped land.
As of
December 31, 2017
, all of our properties and development projects were owned and all of our business was conducted in the state of California with the exception of
twelve
office properties and
one
development project under construction located in the state of Washington. As of
December 31, 2017
, we owned
100%
of all our properties and developments, excluding
four
office properties located in San Francisco, California owned by
three
consolidated property partnerships.
Two
of the
three
property partnerships, 100 First Street Member, LLC (“100 First LLC”) and 303 Second Street Member, LLC (“303 Second LLC”), in which the Company owns an approximate
56%
equity interest,
5
each owned
one
office property in San Francisco, California through subsidiary REITs (see Note 11 “Noncontrolling Interests on the Company’s Consolidated Financial Statements” and Note 12 “Noncontrolling Interests on the Operating Partnership’s Consolidated Financial Statements” to our consolidated financial statements included in this report for additional information). The remaining interests were owned by an unrelated third party. The third property partnership, in which the Company owns an approximate
93%
common equity interest, Redwood City Partners, LLC (“Redwood LLC”), owned
two
office properties in Redwood City, California.
The remaining interest was owned by an unrelated third party. All three property partnerships are consolidated entities.
We own our interests in all of our real estate assets through the Operating Partnership and the Finance Partnership and generally conduct substantially all of our operations through the Operating Partnership of which we owned a
97.9%
common general partnership interest as of
December 31, 2017
. The remaining
2.1%
common limited partnership interest in the Operating Partnership as of
December 31, 2017
was owned by non-affiliated investors and certain of our executive officers and directors. Kilroy Realty Finance, Inc., a wholly owned subsidiary of the Company, is the sole general partner of the Finance Partnership and owns a
1.0%
common general partnership interest. The Operating Partnership owns the remaining
99.0%
common limited partnership interest. With the exception of the Operating Partnership and our consolidated property partnerships, all of our subsidiaries are wholly-owned.
Available Information; Website Disclosure; Corporate Governance Documents
Kilroy Realty Corporation was incorporated in the state of Maryland on September 13, 1996 and Kilroy Realty, L.P. was organized in the state of Delaware on October 2, 1996. Our principal executive offices are located at 12200 W. Olympic Boulevard, Suite 200, Los Angeles, California 90064. Our telephone number at that location is (310) 481-8400. Our website is www.kilroyrealty.com. The information found on, or otherwise accessible through, our website is not incorporated into, and does not form a part of, this annual report on Form 10-K or any other report or document we file with or furnish to the SEC. All reports we will file with the SEC are available free of charge via EDGAR through the SEC website at www.sec.gov. In addition, the public may read and copy materials we file with the SEC at the SEC’s public reference room located at 100 F Street, N.E., Washington, D.C. 20549. All reports that we will file with the SEC will also be available free of charge on our website at www.kilroyrealty.com as soon as reasonably practicable after we file those materials with, or furnish them to, the SEC.
The following documents relating to corporate governance are also available free of charge on our website under “Investors —Overview —Corporate Governance” and available in print to any security holder upon request:
|
•
|
Corporate Governance Guidelines;
|
|
•
|
Code of Business Conduct and Ethics;
|
|
•
|
Audit Committee Charter;
|
|
•
|
Executive Compensation Committee Charter; and
|
|
•
|
Nominating / Corporate Governance Committee Charter.
|
You may request copies of any of these documents by writing to:
Attention: Investor Relations
Kilroy Realty Corporation
12200 West Olympic Boulevard, Suite 200
Los Angeles, California 90064
We intend to disclose on our website under “Investors —Overview —Corporate Governance” any amendment to, or waiver of, any provisions of our Code of Business Conduct and Ethics applicable to the directors and/or officers of the Company that would otherwise be required to be disclosed under the rules of the Securities and Exchange Commission or the New York Stock Exchange.
6
Business and Growth Strategies
Growth Strategies
. We believe that a number of factors and strategies will enable us to continue to achieve our objectives of long-term sustainable growth in Net Operating Income (defined below) and FFO (defined below) as well as maximization of long-term stockholder value. These factors and strategies include:
|
•
|
the quality, geographic location, physical characteristics and operating sustainability of our properties;
|
|
•
|
our ability to efficiently manage our assets as a low cost provider of commercial real estate through our seasoned management team possessing core capabilities in all aspects of real estate ownership, including property management, leasing, marketing, financing, accounting, legal, and construction and development management;
|
|
•
|
our access to development, redevelopment, acquisition and leasing opportunities as a result of our extensive experience and significant working relationships with major West Coast property owners, corporate tenants, municipalities and landowners given our over 70-year presence in the West Coast markets;
|
|
•
|
our active development program and our near-term and future development pipeline of undeveloped land sites (see “Item 7. Management’s Discussion and Analysis of Financial Condition and Results of Operations —Factors That May Influence Future Results of Operations” for additional information pertaining to the Company’s in-process, near-term and future development pipeline);
|
|
•
|
our capital recycling program (see “Item 7. Management’s Discussion and Analysis of Financial Condition and Results of Operations —Liquidity and Capital Resources of the Operating Partnership” for additional information pertaining to the Company’s capital recycling program and related property and land dispositions);
|
|
•
|
our ability to capitalize on inflection points in a real estate cycle to add quality assets to our portfolio at substantial discounts to long-term value, through either acquisition, development or redevelopment; and
|
|
•
|
our strong financial position that has and will continue to allow us to pursue attractive acquisition and development and redevelopment opportunities.
|
“Net Operating Income” is defined as consolidated operating revenues (rental income, tenant reimbursements and other property income) less consolidated operating expenses (property expenses, real estate taxes, provision for bad debts and ground leases). “FFO” is Funds From Operations available to common stockholders and common unitholders calculated in accordance with the white paper on FFO approved by the Board of Governors of the National Association of Real Estate Investment Trusts (“NAREIT”). (See “Item 7. Management’s Discussion and Analysis of Financial Condition and Results of Operations —Results of Operations” and “—Non-GAAP Supplemental Financial Measures: Funds From Operations” for a reconciliation of these measures to generally accepted accounting principles (“GAAP”) net income available to common stockholders.)
Operating Strategies
. We focus on enhancing long-term growth in Net Operating Income and FFO from our properties by:
|
•
|
maximizing cash flow from our properties through active leasing, early renewals and effective property management;
|
|
•
|
structuring leases to maximize returns;
|
|
•
|
managing portfolio credit risk through effective underwriting, including the use of credit enhancements and interests in collateral to mitigate portfolio credit risk;
|
|
•
|
managing operating expenses through the efficient use of internal property management, leasing, marketing, financing, accounting, legal, and construction and development management functions;
|
|
•
|
maintaining and developing long-term relationships with a diverse tenant base;
|
7
|
•
|
continuing to effectively manage capital improvements to enhance our properties’ competitive advantages in their respective markets and improve the efficiency of building systems;
|
|
•
|
continuing to expand our management team with individuals who have extensive regional and product-type experience and are highly knowledgeable in their respective markets and product types; and
|
|
•
|
attracting and retaining motivated employees by providing financial and other incentives to meet our operating and financial goals.
|
Development and Redevelopment Strategies
. We and our predecessors have developed office properties primarily located in California since 1947. As of
December 31, 2017
, we had
four
projects totaling approximately
1.8 million
square feet of office space,
237
residential units and
96,000
square feet of retail space under construction. As of
December 31, 2017
, our near-term and future development pipeline was comprised of
six
potential development sites, representing approximately
48
gross acres of undeveloped land on which we believe we have the potential to develop over
4.3 million
square feet of office and retail space, depending upon economic conditions. Our strategy with respect to development is to:
|
•
|
be the premier provider of modern and collaborative office and mixed-use projects on the West Coast with a focus on design and environment;
|
|
•
|
maintain a disciplined approach by commencing development when appropriate based on market conditions, favoring pre-leasing, developing in stages or phasing, and cost control;
|
|
•
|
reinvest capital from dispositions of selective assets into new state-of-the-market development and acquisition opportunities with higher cash flow and rates of return;
|
|
•
|
execute on our development projects under construction and our near-term and future development pipeline, including expanding entitlements; and
|
|
•
|
evaluate redevelopment opportunities in supply-constrained markets because such efforts generally achieve similar returns to new development with reduced entitlement risk and shorter construction periods.
|
We may engage in the additional development or redevelopment of office and mixed-use properties when market conditions support a favorable risk-adjusted return on such development or redevelopment. We expect that our significant working relationships with tenants, municipalities and landowners on the West Coast will give us further access to development and redevelopment opportunities. We cannot ensure that we will be able to successfully develop or redevelop any of our properties or that we will have access to additional development or redevelopment opportunities.
Acquisition Strategies.
We believe we are well positioned to acquire opportunistic properties and development and redevelopment opportunities as the result of our extensive experience, strong financial position and ability to access capital. We continue to focus on growth opportunities in West Coast markets populated by knowledge and creative based tenants in a variety of industries, including technology, media, healthcare, life sciences, entertainment and professional services. Against the backdrop of market volatility, we expect to manage a strong balance sheet, execute on our development program and selectively evaluate opportunities that add immediate Net Operating Income to our portfolio or play a strategic role in our future growth and that:
|
•
|
provide attractive yields and significant potential for growth in cash flow from property operations;
|
|
•
|
present growth opportunities in our existing or other strategic markets; and
|
|
•
|
demonstrate the potential for improved performance through intensive management, repositioning and leasing that should result in increased occupancy and rental revenues.
|
Financing Strategies
. Our financing policies and objectives are determined by our board of directors. Our goal is to limit our dependence on leverage and maintain a conservative ratio of debt-to-total market capitalization. As of
December 31, 2017
, our total debt as a percentage of total market capitalization was
23.9%
, which was calculated based on the quoted closing price per share of the Company’s common stock of
$74.65
on
December 31, 2017
(see “Item 7.
8
Management’s Discussion and Analysis of Financial Condition and Results of Operations —Liquidity and Capital Resources of the Company —Capitalization” for additional information). Our financing strategies include:
|
•
|
maintaining financial flexibility, including a low secured to unsecured debt ratio;
|
|
•
|
maximizing our ability to access a variety of both public and private capital sources;
|
|
•
|
maintaining a staggered debt maturity schedule in which the maturity dates of our debt are spread over several years to limit risk exposure at any particular point in the capital and credit market cycles;
|
|
•
|
completing financing in advance of the need for capital;
|
|
•
|
managing interest rate exposure by generally maintaining a greater amount of fixed-rate debt as compared to variable-rate debt; and
|
|
•
|
maintaining our credit ratings.
|
We utilize multiple sources of capital, including borrowings under our unsecured line of credit, unsecured term loan, proceeds from the issuance of public or private debt or equity securities and other bank and/or institutional borrowings and our capital recycling program, including strategic venture sources. There can be no assurance that we will be able to obtain capital as needed on terms favorable to us or at all. (See the discussion under the caption “Item 7. Management’s Discussion and Analysis of Financial Condition and Results of Operations —Factors That May Influence Future Results of Operations” and “Item 1A. Risk Factors.”)
Sustainability Strategies.
We make excellence in sustainability a core competence by:
|
•
|
managing our properties to offer the maximum degree of utility and operational efficiency to tenants. We offer tenant sustainability programs focused on helping our tenants reduce their energy and water consumption and increase their recycling diversion rates. Many of our assets are in zones that have been impacted by drought, and as such face the risk of increased water costs and fines for high consumption. We have mitigated these risks through comprehensive, proactive water reductions throughout our portfolio, including domestic fixture upgrades, cooling tower optimizations, a comprehensive leak detection program, and irrigation systems retrofits. We also incorporate green lease language into 100% of our new leases, including a cost recovery clause for resource-efficiency related capital in full-service gross leases, which align tenant and landlord interests on energy, water and waste efficiency. Green leases (also known as aligned leases, high performance leases or energy efficient leases) align the financial and energy incentives of building owners and tenants so they can work together to save money, conserve resources and ensure the efficient operation of buildings. We were honored in 2014 to be part of the inaugural class of Green Lease Leaders, the Institute for Market Transformation's (“IMT's”) program to encourage green leasing in real estate. In 2016, IMT honored us again with two Green Lease Leaders Team Transaction awards. Energy and water consumption data for the last three years audited by DNV GL Business Assurance USA, Inc. are as follows:
|
Energy consumption:
|
Year
(1)
|
Energy Consumption Data Coverage as % of Floor Area
(2)
|
Total Energy Consumed by Portfolio Area with Data Coverage (MWh)
(3)
|
% of Energy Generated From Renewable Resources
|
Like-for-Like Change in Energy Consumption of Portfolio Area with Data Coverage
(4)
|
% of Eligible Portfolio that has Obtained an Energy Rating and is Certified to ENERGY STAR
|
|||||
|
2016
|
97
|
%
|
281,675
|
|
3
|
%
|
(2
|
)%
|
68
|
%
|
|
2015
|
92
|
%
|
273,381
|
|
3
|
%
|
(5
|
)%
|
65
|
%
|
|
2014
|
88
|
%
|
267,391
|
|
5
|
%
|
(2
|
)%
|
56
|
%
|
9
Water consumption:
|
Year
(1)
|
Water Withdrawal Data Coverage as a % of Total Floor Area
(5)
|
Total Water Withdrawn by Portfolio Area (m
(3)
)
(6)
|
Like-for-like Change in Water Withdrawn for Portfolio Area with Data Coverage
(4)
|
|||
|
2016
|
94
|
%
|
829,503
|
|
(2
|
)%
|
|
2015
|
94
|
%
|
832,737
|
|
(11
|
)%
|
|
2014
|
92
|
%
|
950,357
|
|
(2
|
)%
|
________________________
|
(1)
|
Full 2017 calendar year energy and water data is not available until March 30, 2018. 2016 is the most recent year for which full energy and water data is available and verified by a third party.
|
|
(2)
|
Floor area is considered to have complete energy consumption data coverage when energy consumption data (i.e., energy types and amounts consumed) is obtained by the Company for all types of energy consumed in the relevant floor area during the fiscal year, regardless of when such data was obtained.
|
|
(3)
|
The scope of energy includes energy purchased from sources external to the Company and its tenants or produced by the Company or its tenants themselves (self-generated) and energy from all sources, including direct fuel usage, purchased electricity, and heating, cooling and steam energy.
|
|
(4)
|
Data reported in MWh on a like-for-like comparison excludes assets which have been acquired, disposed, under development or have been largely refurbished over the past twenty-four months.
|
|
(5)
|
Floor area is considered to have complete water withdrawal data coverage when water withdrawal data (i.e., amounts withdrawn) is obtained by the registrant in the relevant floor area during the fiscal year, regardless of when such data was obtained.
|
|
(6)
|
Water sources include surface water (including water from wetlands, rivers, lakes and oceans), groundwater, rainwater collected directly and stored by the registrant, wastewater obtained from other entities, municipal water supplies or supply from other water utilities.
|
|
•
|
building our current development projects to Leadership in Energy and Environmental Design (“LEED”) specifications. All of our office development projects are now designed to achieve LEED certification, either LEED Platinum or Gold;
|
|
•
|
actively pursuing LEED certification for approximately
1.8 million
square feet of office and/or mixed use space under construction. In addition, an analysis of energy performance is included in our standard due diligence process for acquisitions, and reducing energy use year over year is a comprehensive goal of our operational strategy. This is accomplished through systematic energy auditing, mechanical, lighting and other building upgrades, optimizing operations and engaging tenants. During the past few years we have significantly enhanced the sustainability profile of our portfolio, ending
2017
with 58% of our properties LEED certified and 72% of our properties ENERGY STAR certified. During
2017
, the Company was recognized for our sustainability efforts with multiple industry leadership awards, including NAREIT’s 2017 Office Leader in the Light Award for the fourth consecutive year, and the ENERGY STAR Partner of the Year Sustained Excellence Award. The Company was also recognized by GRESB as the North American office leader in sustainability for the fourth year in a row, and we became one of only three American real estate companies to be listed in the Dow Jones Sustainability World Index.
|
Significant Tenants
As of
December 31, 2017
, our 15 largest tenants in terms of annualized base rental revenues represented approximately
40.3%
of our total annualized base rental revenues, defined as annualized monthly contractual rents from existing tenants as of
December 31, 2017
. Annualized base rental revenue includes the impact of straight-lining rent escalations and the amortization of free rent periods and excludes the impact of the following: amortization of deferred revenue related tenant-funded tenant improvements, amortization of above/below market rents, amortization for lease incentives due under existing leases and expense reimbursement revenue.
For further information on our 15 largest tenants and the composition of our tenant base, see “Item 2. Properties —Significant Tenants.”
Competition
We compete with several developers, owners, operators and acquirers of office, undeveloped land and other commercial real estate, including mixed-use and residential real estate, many of which own properties similar to ours
10
in the same submarkets in which our properties are located. For further discussion of the potential impact of competitive conditions on our business, see “Item 1A. Risk Factors.”
Segment and Geographic Financial Information
During
2017
and
2016
, we had one reportable segment, our office properties segment. For information about our office property revenues and long-lived assets and other financial information, see “Item 7. Management’s Discussion and Analysis of Financial Condition and Results of Operations —Results of Operations.”
As of
December 31, 2017
, all of our properties and development projects were owned and all of our business was conducted in the state of California with the exception of
twelve
office properties and
one
development project under construction located in the state of Washington. As of
December 31, 2017
, all of our properties and development projects were 100% owned, excluding
four
office properties owned by
three
consolidated property partnerships, which have been consolidated for financial reporting purposes (see Note 2 “Basis of Presentation and Significant Accounting Policies” to our consolidated financial statements included in this report for further information).
Employees
As of
December 31, 2017
, we employed 251 people through the Operating Partnership, Kilroy Services, LLC, and Kilroy Realty TRS, Inc. We believe that relations with our employees are good.
Environmental Regulations and Potential Liabilities
Government Regulation Relating to the Environment.
Many laws and governmental regulations relating to the environment are applicable to our properties, and changes in these laws and regulations, or their interpretation by agencies and the courts, occur frequently and may adversely affect us.
Existing conditions at some of our properties
. Independent environmental consultants have conducted Phase I or similar environmental site assessments on all of our properties. We generally obtain these assessments prior to the acquisition of a property and may later update them as required for subsequent financing of the property, if a property is slated for disposition, or as requested by a tenant. Consultants are required to perform Phase I assessments to American Society for Testing and Materials standards then-existing for Phase I site assessments and typically include a historical review, a public records review, a visual inspection of the surveyed site, and the issuance of a written report. These assessments do not generally include any soil samplings or subsurface investigations; however, if a Phase I does recommend that soil samples be taken or other subsurface investigations take place, we generally perform such recommended actions. Depending on the age of the property, the Phase I may have included an assessment of asbestos-containing materials or a separate hazardous materials survey may have been conducted. For properties where asbestos-containing materials were identified or suspected, an operations and maintenance plan was generally prepared and implemented.
Historical operations at or near some of our properties, including the presence of underground or above ground storage tanks, the landfilling of hazardous substances and solid waste, and migration of contamination from other sites, may have caused soil or groundwater contamination. In some instances, the prior owners of the affected properties conducted remediation of known contamination in the soils on our properties, and we may be required to conduct further clean-up of the soil at these properties and residual contamination could pose environmental, health, and safety risks if not appropriately addressed. To protect the health and safety of site occupants and others, we may be required to implement and operate safeguards, including, for example, vapor intrusion mitigation systems and building protection systems to address methane. We may need to modify our methods of construction or face increased construction costs as a result of environmental conditions, and we may face obligations under agreements with governmental authorities with respect to the management of such environmental conditions. If releases from our sites migrate offsite, neighbors or others could make claims against us, such as for property damage, personal injury, or cost recovery.
As of
December 31, 2017
, we had accrued environmental remediation liabilities of approximately
$28.3 million
recorded on our consolidated balance sheets in connection with certain of our in-process and future development projects. The accrued environmental remediation liabilities represent the costs we estimate we will incur when we
11
commence development at various development acquisition sites. These estimates, which we developed with the assistance of third party experts, consist primarily of the removal of contaminated soil and other related costs since we are required to dispose of any existing contaminated soil when we develop new office properties as these sites. It is possible that we could incur additional environmental remediation costs in connection with these future development projects. However, given we are in the pre-development phase on these future development projects, potential additional environmental costs cannot be reasonably estimated at this time and certain changes in estimates could occur as the site conditions, final project timing, design elements, actual soil conditions and other aspects of the projects, which may depend upon municipal and other approvals beyond the control of the Company, are determined. See Note 18 “Commitments and Contingencies” to our consolidated financial statements included in this report for additional information.
Other than the accrued environmental liabilities recorded in connection with certain of our development projects, we are not aware of any such condition, liability, or concern by any other means that would give rise to material environmental liabilities. However, our assessments may have failed to reveal all environmental conditions, liabilities, or compliance concerns; there may be material environmental conditions, liabilities, or compliance concerns that arose at a property after the review was completed; future laws, ordinances, or regulations may impose material additional environmental liability; and environmental conditions at our properties may be affected in the future by tenants, third parties, or the condition of land or operations near our properties, such as the presence of underground storage tanks or migrating plumes. We cannot be certain that costs of future environmental compliance will not have an adverse effect on our financial condition, results of operations, cash flow, the quoted trading price of our securities, and our ability to satisfy our debt service obligations and to pay dividends and distributions to security holders.
Use of hazardous materials by some of our tenants
. Some of our tenants handle hazardous substances and wastes on our properties as part of their routine operations. Environmental laws and regulations may subject these tenants, and potentially us, to liability resulting from such activities. We generally require our tenants in their leases to comply with these environmental laws and regulations and to indemnify us for any related liabilities. As of
December 31, 2017
, other than routine cleaning materials, approximately 3-5% of our tenants handled hazardous substances and/or wastes on approximately 1-3% of the aggregate square footage of our properties as part of their routine operations. These tenants are primarily involved in the life sciences business. The hazardous substances and wastes are primarily comprised of diesel fuel for emergency generators and small quantities of lab and light manufacturing chemicals including, but not limited to, alcohol, ammonia, carbon dioxide, cryogenic gases, dichlorophenol, methane, naturalyte acid, nitrogen, nitrous oxide, and oxygen which are routinely used by life science companies. We are not aware of any material noncompliance, liability, or claim relating to hazardous or toxic substances or petroleum products in connection with any of our properties, and management does not believe that on-going activities by our tenants will have a material adverse effect on our operations.
Costs related to government regulation and private litigation over environmental matters
. Under applicable environmental laws and regulations, we may be liable for the costs of removal, remediation, or disposal of certain hazardous or toxic substances present or released on our properties. These laws could impose liability without regard to whether we are responsible for, or even knew of, the presence or release of the hazardous materials. Government investigations and remediation actions may have substantial costs, and the presence or release of hazardous substances on a property could result in governmental clean-up actions, personal injury actions, or similar claims by private plaintiffs.
Potential environmental liabilities may exceed our environmental insurance coverage limits, transactional indemnities or holdbacks
. We carry what we believe to be commercially reasonable environmental insurance. Our environmental insurance policies are subject to various terms, conditions and exclusions. Similarly, in connection with some transactions we obtain environmental indemnities and holdbacks that may not be honored by the indemnitors, may be less than the resulting liabilities or may otherwise fail to address the liabilities adequately. Therefore, we cannot provide any assurance that our insurance coverage or transactional indemnities will be sufficient or that our liability, if any, will not have a material adverse effect on our financial condition, results of operations, cash flows, quoted trading price of our securities, and our ability to satisfy our debt service obligations and to pay dividends and distributions to security holders.
12
Litigation
Lawsuits have been filed in San Francisco County Superior Court in connection with the settlement and differential settlement experienced at the Millennium Tower property located at 301 Mission Street in San Francisco, California, a building not owned by the Company but located in proximity to the Company’s property located at 350 Mission Street. Among the claims asserted in the complex lawsuits are claims that acts by various entities, including entities affiliated with other neighboring properties, contributed to the settlement that Millennium Tower has experienced. In October 2017, two defendants named in the lawsuits asserted cross-claims for equitable indemnification against certain of the Company’s entities in connection with the development and construction-related activities at our neighboring 350 Mission Street property. We dispute the allegations and intend to vigorously defend against these claims.
13
The following section sets forth material factors that may adversely affect our business and operations. The following factors, as well as the factors discussed in “Item 7. Management’s Discussion and Analysis of Financial Condition and Results of Operations —Factors That May Influence Future Results of Operations” and other information contained in this report, should be considered in evaluating us and our business.
Risks Related to our Business and Operations
Global market, economic and geopolitical conditions may adversely affect our business, results of operations, liquidity and financial condition and those of our tenants.
Our business may be adversely affected by global market, economic and geopolitical conditions, including general global economic and political uncertainty and dislocations in the credit markets. If these conditions become more volatile or worsen, our and our tenant’s business, results of operations, liquidity and financial condition and those of our tenants may be adversely affected as a result of the following consequences, among others:
|
•
|
the financial condition of our tenants, many of which are technology; life science and healthcare; finance, insurance and real estate; media and professional business and other service firms, may be adversely affected, which may result in tenant defaults under leases due to bankruptcy, lack of liquidity, operational failures or for other reasons;
|
|
•
|
significant job losses in the financial and professional services industries may occur, which may decrease demand for our office space, causing market rental rates and property values to be negatively impacted;
|
|
•
|
our ability to obtain financing on terms and conditions that we find acceptable, or at all, may be limited, which could reduce our ability to pursue acquisition and development opportunities and refinance existing debt, reduce our returns from our acquisition and development activities and increase our future interest expense;
|
|
•
|
reduced values of our properties may limit our ability to dispose of assets at attractive prices or to obtain debt financing secured by our properties and may reduce the availability of unsecured loans; and
|
|
•
|
one or more lenders under the Operating Partnership’s unsecured revolving credit facility could refuse to fund their financing commitment to us or could fail and we may not be able to replace the financing commitment of any such lenders on favorable terms, or at all.
|
All of our properties are located in California and greater Seattle, Washington and we may therefore be susceptible to adverse economic conditions and regulations, as well as natural disasters, in those areas.
Because all of our properties are concentrated in California and greater Seattle, we may be exposed to greater economic risks than if we owned a more geographically dispersed portfolio. Further, within California, our properties are concentrated in Los Angeles, Orange County, San Diego County and the San Francisco Bay Area, exposing us to risks associated with those specific areas. We are susceptible to adverse developments in the economic and regulatory environments of California and greater Seattle (such as periods of economic slowdown or recession, business layoffs or downsizing, industry slowdowns, relocations of businesses, increases in real estate and other taxes, costs of complying with governmental regulations or increased regulation and other factors), as well as adverse weather conditions and natural disasters that occur in those areas (such as earthquakes, wind, landslides, droughts, fires and other events). In addition, California is also regarded as more litigious and more highly regulated and taxed than many other states, which may reduce demand for office space in California.
Any adverse developments in the economy or real estate market in California and the surrounding region, or in greater Seattle or any decrease in demand for office space resulting from the California or greater Seattle regulatory or business environment could impact our ability to generate revenues sufficient to meet our operating expenses or other obligations, which would adversely impact our financial condition, results of operations, cash flows, the quoted trading price of our securities and our ability to satisfy our debt service obligations and to pay dividends and distributions to our security holders.
14
Our performance and the market value of our securities are subject to risks associated with our investments in real estate assets and with trends in the real estate industry
. Our economic performance and the value of our real estate assets and, consequently the market value of the Company’s securities, are subject to the risk that our properties may not generate revenues sufficient to meet our operating expenses or other obligations. A deficiency of this nature would adversely impact our financial condition, results of operations, cash flows, the quoted trading price of our securities, and our ability to satisfy our debt service obligations and to pay dividends and distributions to our security holders.
Events and conditions applicable to owners and operators of real estate that are beyond our control and could impact our economic performance and the value of our real estate assets may include:
|
•
|
local oversupply or reduction in demand for office, mixed-use or other commercial space, which may result in decreasing rental rates and greater concessions to tenants;
|
|
•
|
inability to collect rent from tenants;
|
|
•
|
vacancies or inability to rent space on favorable terms or at all;
|
|
•
|
inability to finance property development and acquisitions on favorable terms or at all;
|
|
•
|
increased operating costs, including insurance premiums, utilities and real estate taxes;
|
|
•
|
costs of complying with changes in governmental regulations;
|
|
•
|
the relative illiquidity of real estate investments;
|
|
•
|
declines in real estate asset valuations, which may limit our ability to dispose of assets at attractive prices or obtain or maintain debt financing;
|
|
•
|
changing submarket demographics;
|
|
•
|
changes in space utilization by our tenants due to technology, economic conditions and business culture;
|
|
•
|
the development of harmful mold or other airborne toxins or contaminants that could damage our properties or expose us to third-party liabilities; and
|
|
•
|
property damage resulting from seismic activity or other natural disasters.
|
We depend upon significant tenants, and the loss of a significant tenant could adversely affect our financial condition, results of operations, ability to borrow funds and cash flows.
As of
December 31, 2017
, our 15 largest tenants represented approximately
40.3%
of total annualized base rental revenues. See further discussion on the composition of our tenants by industry and our largest tenants under “Item 2. Properties —Significant Tenants.”
Our financial condition, results of operations, ability to borrow funds and cash flows would be adversely affected if any of our significant tenants fails to renew its lease(s), renew its lease(s) on terms less favorable to us, or becomes bankrupt or insolvent or otherwise unable to satisfy its lease obligations.
Downturn in tenants’ businesses may reduce our revenues and cash flows
. For the year ended
December 31, 2017
, we derived approximately
98.8%
of our revenues from rental income and tenant reimbursements. A tenant may experience a downturn in its business, which may weaken its financial condition and result in its failure to make timely rental payments or result in defaults under our leases. In the event of default by a tenant, we may experience delays in enforcing our rights as landlord and may incur substantial costs in protecting our investment.
The bankruptcy or insolvency of a major tenant also may adversely affect the income produced by our properties. If any tenant becomes a debtor in a case under federal bankruptcy law, we cannot evict the tenant solely because of the bankruptcy. In addition, the bankruptcy court might permit the tenant to reject and terminate its lease with us. Our claim against the tenant for unpaid and future rent could be subject to a statutory cap that might be substantially less
15
than the remaining rent actually owed under the lease. Therefore, our claim for unpaid rent would likely not be paid in full. Any losses resulting from the bankruptcy of any of our existing tenants could adversely impact our financial condition, results of operations, cash flows, the quoted trading price of our securities, and our ability to satisfy our debt service obligations and to pay dividends and distributions to our security holders.
A large percentage of our tenants operate in a concentrated group of industries and downturns in these industries could adversely affect our financial condition, results of operations and cash flows.
As of
December 31, 2017
, as a percentage of our annualized base rental revenue,
43%
of our tenants operated in the technology industry,
14%
in the life science and health care industries,
13%
in the finance, insurance and real estate industries,
12%
in the media industry,
8%
in the professional, business and other services industries and
10%
in other industries. As we continue our development and potential acquisition activities in markets populated by knowledge and creative based tenants in the technology and media industries, our tenant mix could become more concentrated, further exposing us to risks associated with those industries. For a further discussion of the composition of our tenants by industry, see “Item 2. Properties —Significant Tenants.” An economic downturn in any of these industries, or in any industry in which a significant number of our tenants currently or may in the future operate, could negatively impact the financial condition of such tenants and cause them to fail to make timely rental payments or default on lease obligations, fail to renew their leases or renew their leases on terms less favorable to us, become bankrupt or insolvent, or otherwise become unable to satisfy their obligations to us. As a result, a downturn in an industry in which a significant number of our tenants operate could adversely affect our financial conditions, result of operations and cash flows.
We may be unable to renew leases or re-lease available space.
Most of our income is derived from the rent earned from our tenants. We had office space representing approximately
4.8%
of the total square footage of our stabilized office properties that was not occupied as of
December 31, 2017
. In addition, leases representing approximately
9.0%
and
11.9%
of the leased rentable square footage of our properties are scheduled to expire in 2018 and 2019, respectively. Above market rental rates on some of our properties may force us to renew or re-lease expiring leases at rates below current lease rates. We cannot provide any assurance that leases will be renewed, available space will be re-leased or that our rental rates will be equal to or above the current rental rates. If the average rental rates for our properties decrease, existing tenants do not renew their leases, or available space is not re-leased, our financial condition, results of operations, cash flows, the quoted trading price of our securities, and our ability to satisfy our debt service obligations and to pay dividends and distributions to our security holders could be adversely affected. For additional information on our scheduled lease expirations, see “Item 7. Management’s Discussion and Analysis of Financial Condition and Results of Operations —Factors Factors That May Influence Future Results of Operations.”
We are subject to governmental regulations that may affect the development, redevelopment and use of our properties
. Our properties are subject to regulation under federal laws, such as the Americans with Disabilities Act of 1990 (the “ADA”), pursuant to which all public accommodations must meet federal requirements related to access and use by disabled persons, and state and local laws addressing earthquake, fire and life safety requirements. Although we believe that our properties substantially comply with requirements under applicable governmental regulations, none of our properties have been audited or investigated for compliance by any regulatory agency. If we were not in compliance with material provisions of the ADA or other regulations affecting our properties, we might be required to take remedial action, which could include making modifications or renovations to our properties. Federal, state, or local governments may also enact future laws and regulations that could require us to make significant modifications or renovations to our properties. If we were to incur substantial costs to comply with the ADA or any other regulations, our financial condition, results of operations, cash flows, the quoted trading price of our securities, and our ability to satisfy our debt service obligations and to pay dividends and distributions to our security holders could be adversely affected.
Our properties are subject to land use rules and regulations that govern our development, redevelopment and use of our properties, such as Title 24 of the California Code of Regulations (“Title 24”), which prescribes building energy efficiency standards for residential and nonresidential buildings in the State of California. If we were not in compliance with material provisions of Title 24 or other regulations affecting our properties, we might be required to take remedial action, which could include making modifications or renovations to our properties. Changes in the existing land use rules and regulations and approval process that restrict or delay our ability to develop, redevelop or use our properties (such as potential restrictions on the use and/or density of new developments, water use and other uses and activities) or that prescribe additional standards could have an adverse effect on our financial position, results of operations, cash
16
flows, the quoted trading price of our securities, and our ability to satisfy our debt service obligations and to pay dividends and distributions to our security holders.
We may not be able to meet our debt service obligations.
As of
December 31, 2017
, we had approximately
$2.4 billion
aggregate principal amount of indebtedness, of which
$3.6 million
in principal payments will be paid during the year ended December 31,
2018
. Our total debt at
December 31, 2017
represented
23.9%
of our total market capitalization (which we define as the aggregate of our long-term debt, and the market value of the Company’s common stock and the Operating Partnership’s common units of limited partnership interest, or common units). For the calculation of our market capitalization and additional information on debt maturities, see “Item 7. Management’s Discussion and Analysis of Financial Condition and Results of Operations —Liquidity and Capital Resources of the Company —Capitalization” and “Item 7. Management’s Discussion and Analysis of Financial Condition and Results of Operations —Liquidity and Capital Resources of the Operating Partnership —Liquidity Uses.”
The instruments and agreements governing some of our outstanding indebtedness (including borrowings under the Operating Partnership’s unsecured revolving credit facility, unsecured term loan facility and note purchase agreement) contain provisions that require us to repurchase for cash or repay that indebtedness under specified circumstances or upon the occurrence of specified events (including certain changes of control of the Company), and our future debt agreements and debt securities may contain similar provisions or may require that we offer to repurchase the applicable indebtedness for cash under specified circumstances or upon the occurrence of specified events. We may not have sufficient funds to pay our indebtedness when due (including upon any such required repurchase, repayment or offer to repurchase), and we may not be able to arrange for the financing necessary to make those payments on favorable terms or at all. In addition, our ability to make required payments on our indebtedness when due (including upon any such required repurchase, repayment or offer to repurchase) may be limited by the terms of other debt instruments or agreements. Our failure to pay amounts due in respect of any of our indebtedness when due may constitute an event of default under the instrument governing that indebtedness, which could permit the holders of that indebtedness to require the immediate repayment of that indebtedness in full and, in the case of secured indebtedness, could allow them to sell the collateral securing that indebtedness and use the proceeds to repay that indebtedness. Moreover, any acceleration of or default in respect of any of our indebtedness could, in turn, constitute an event of default under other debt instruments or agreements, thereby resulting in the acceleration and required repayment of that other indebtedness.
We cannot assure you that our business will generate sufficient cash flow from operations or that future sources of cash will be available to us in an amount sufficient to enable us to pay amounts due on our indebtedness or to fund our other liquidity needs, including cash distributions necessary to maintain the Company’s REIT qualification. Additionally, if we incur additional indebtedness in connection with future acquisitions or for any other purpose, our debt service obligations could increase.
We may need to refinance all or a portion of our indebtedness on or before maturity. Our ability to refinance our indebtedness or obtain additional financing will depend on, among other things:
•
our financial condition, results of operations and market conditions at the time; and
•
restrictions in the agreements governing our indebtedness.
As a result, we may not be able to refinance our indebtedness on commercially reasonable terms or at all. If we do not generate sufficient cash flow from operations, and additional borrowings or refinancings or proceeds of asset sales or other sources of cash are not available to us, we may not have sufficient cash to enable us to meet all of our obligations. Accordingly, if we cannot service our indebtedness, we may have to take actions such as seeking additional equity financing, delaying capital expenditures, or entering into strategic acquisitions and alliances. Any of these events or circumstances could have a material adverse effect on our financial condition, results of operations, cash flows, the trading price of our securities and our ability to satisfy our debt service obligations and to pay dividends and distributions to our security holders. In addition, foreclosures could create taxable income without accompanying cash proceeds, which could require us to borrow or sell assets to raise the funds necessary to meet the REIT distribution requirements discussed below, even if such actions are not on favorable terms.
17
The covenants in the agreements governing the Operating Partnership’s unsecured revolving credit facility, unsecured term loan facility and note purchase agreement may limit our ability to make distributions to the holders of our common stock.
The Operating Partnership’s
$750.0 million
unsecured revolving credit facility,
$150.0 million
unsecured term loan facility and note purchase agreement contain financial covenants that could limit the amount of distributions payable by us on our common stock and any preferred stock we may issue in the future. We rely on cash distributions we receive from the Operating Partnership to pay distributions on our common stock and any preferred stock we may issue in the future and to satisfy our other cash needs. The agreements governing the unsecured revolving credit facility, the unsecured term loan facility and the note purchase agreement provide that, if the Operating Partnership fails to pay any principal of, or interest on, any borrowings or other amounts payable under such agreement when due or during any other event of default under such unsecured revolving credit facility, unsecured term loan facility and the note purchase agreement, the Operating Partnership may make only those partnership distributions that result in distributions to us in an amount sufficient to permit us to make distributions to our stockholders that we reasonably believe are necessary to (a) maintain our qualification as a REIT for federal and state income tax purposes and (b) avoid the payment of federal or state income or excise tax. Any limitation on our ability to make distributions to our stockholders, whether as a result of these provisions in the unsecured revolving credit facility, the unsecured term loan facility, the note purchase agreement or otherwise, could have a material adverse effect on the market value of our common stock.
A downgrade in our credit ratings could materially adversely affect our business and financial condition.
The credit ratings assigned to the Operating Partnership’s debt securities and any preferred stock we may issue in the future could change based upon, among other things, our results of operations and financial condition. These ratings are subject to ongoing evaluation by credit rating agencies, and we cannot assure you that any rating will not be changed or withdrawn by a rating agency in the future if, in its judgment, circumstances warrant. Moreover, these credit ratings do not apply to our common stock and are not recommendations to buy, sell or hold our common stock or any other securities. If any of the credit rating agencies that have rated the Operating Partnership’s debt securities or any preferred stock we may issue in the future downgrades or lowers its credit rating, or if any credit rating agency indicates that it has placed any such rating on a so-called “watch list” for a possible downgrading or lowering or otherwise indicates that its outlook for that rating is negative, it could have a material adverse effect on our costs and availability of capital, which could in turn have a material adverse effect on our financial condition, results of operations, cash flows, the trading price of our securities, and our ability to satisfy our debt service obligations and to pay dividends and distributions to our security holders.
We face significant competition, which may decrease the occupancy and rental rates of our properties
. We compete with several developers, owners and operators of office, undeveloped land and other commercial real estate, including mixed-use and residential real estate, many of which own properties similar to ours in the same submarkets in which our properties are located but which have lower occupancy rates than our properties. Therefore, our competitors have an incentive to decrease rental rates until their available space is leased. If our competitors offer space at rental rates below the rates currently charged by us for comparable space, we may be pressured to reduce our rental rates below those currently charged in order to retain tenants when our tenant leases expire. As a result, our financial condition, results of operations, cash flow, the quoted trading price of our securities, and our ability to satisfy our debt service obligations and to pay dividends and distributions to our security holders may be adversely affected.
In order to maintain the quality of our properties and successfully compete against other properties, we must periodically spend money to maintain, repair and renovate our properties, which reduces our cash flows.
If our properties are not as attractive to current and prospective tenants in terms of rent, services, condition or location as properties owned by our competitors, we could lose tenants or suffer lower rental rates. As a result, we may from time to time be required to make significant capital expenditures to maintain the competitiveness of our properties. There can be no assurances that any such expenditure would result in higher occupancy or higher rental rates, or deter existing tenants from relocating to properties owned by our competitors.
Potential casualty losses, such as earthquake losses, may adversely affect our financial condition, results of operations and cash flows.
We carry comprehensive liability, fire, extended coverage, rental loss, and terrorism insurance covering all of our properties. Management believes the policy specifications and insured limits are appropriate given the relative risk of loss, the cost of the coverage and industry practice. We do not carry insurance for generally uninsurable losses such as loss from riots or acts of God. In addition, all of our properties are located in earthquake-prone areas. We carry earthquake insurance on our properties in an amount and with deductibles that
18
management believes are commercially reasonable. However, the amount of our earthquake insurance coverage may not be sufficient to cover losses from earthquakes. We may also discontinue earthquake insurance on some or all of our properties in the future if the cost of premiums for earthquake insurance exceeds the value of the coverage discounted for the risk of loss. If we experience a loss that is uninsured or which exceeds policy limits, we could lose the capital invested in the damaged properties as well as the anticipated future cash flows from those properties. Further, if the damaged properties are subject to recourse indebtedness, we would continue to be liable for the indebtedness, even if the properties were irreparable.
We may not be able to rebuild our existing properties to their existing specifications if we experience a substantial or comprehensive loss of such properties.
In the event that we experience a substantial or comprehensive loss of one of our properties, we may not be able to rebuild such property to its existing specifications. Further, reconstruction or improvement of such property could potentially require significant upgrades to meet zoning and building code requirements or be subject to environmental and other legal restrictions.
Climate change may adversely affect our business.
To the extent that climate change does occur, we may experience extreme weather and changes in precipitation and temperature, all of which may result in physical damage or a decrease in demand for our properties located in the areas affected by these conditions. Should the impact of climate change be material in nature or occur for lengthy periods of time, our financial condition or results of operations would be adversely affected. In addition, changes in federal and state legislation and regulation on climate change could result in increased capital expenditures to improve the energy efficiency of our existing properties in order to comply with such regulations.
We are subject to environmental and health and safety laws and regulations, and any costs to comply with, or liabilities arising under, such laws and regulations could be material.
As an owner, operator, manager, acquirer and developer of real properties, we are subject to environmental and health and safety laws and regulations. Certain of these laws and regulations impose joint and several liability, without regard to fault, for investigation and clean-up costs on current and former owners and operators of real property and persons who have disposed of or released hazardous substances into the environment. At some of our properties, there are asbestos-containing materials, or tenants routinely handle hazardous substances as part of their operations. In addition, historical operations and conditions, including the presence of underground storage tanks, the landfilling of hazardous substances and solid waste, and migration of contamination from other sites, have caused soil or groundwater contamination at or near some of our properties. Although we believe that the prior owners of the affected properties or other persons may have conducted remediation of known contamination at many of these properties, not all such contamination has been remediated, further clean-up at these properties may be required, and residual contamination could pose environmental, health, and safety risks if not appropriately addressed. To protect the health and safety of site occupants and others, we may be required to implement and operate safeguards, including, for example, vapor intrusion mitigation systems and building protection systems to address methane. We may need to modify our methods of construction or face increased construction costs as a result of environmental conditions, and we may face obligations under agreements with governmental authorities with respect to the management of such environmental conditions. If releases from our sites migrate offsite, neighbors or others could make claims against us, such as for property damage, personal injury, or cost recovery. As of
December 31, 2017
, we had accrued environmental remediation liabilities of approximately
$28.3 million
recorded on our consolidated balance sheets in connection with certain of our in-process and future development projects. The accrued environmental remediation liabilities represent the costs we estimate we will incur when we commence development at various development acquisition sites. These estimates, which we developed with the assistance of third party experts, consist primarily of the removal of contaminated soil and other related costs since we are required to dispose of any existing contaminated soil when we develop new office properties as these sites. It is possible that we could incur additional environmental remediation costs in connection with these future development projects. However, given we are in the pre-development phase on these future development projects, potential additional environmental costs cannot be reasonably estimated at this time and certain changes in estimates could occur as the site conditions, final project timing, design elements, actual soil conditions and other aspects of the projects, which may depend upon municipal and other approvals beyond the control of the Company, are determined. Unknown or unremediated contamination or compliance with existing or new environmental or health and safety laws and regulations could require us to incur costs or liabilities that could be material. See “Item 1. Business —Environmental Regulations and Potential Liabilities” and Note 18 “Commitments and Contingencies” to our consolidated financial statements included in this report.
19
We may be unable to complete acquisitions and successfully operate acquired properties
. We continually evaluate the market of available properties and may continue to acquire office or mixed use properties and undeveloped land when strategic opportunities exist. Our ability to acquire properties on favorable terms and successfully operate them is subject to various risks, including the following:
|
•
|
we may potentially be unable to acquire a desired property because of competition from other real estate investors with significant capital, including both publicly traded and private REITs, institutional investment funds and other real estate investors;
|
|
•
|
even if we are able to acquire a desired property, competition from other real estate investors may significantly increase the purchase price;
|
|
•
|
even if we enter into agreements for the acquisition of a desired property, we may be unable to complete such acquisitions because they remain subject to customary conditions to closing, including the completion of due diligence investigations to management’s satisfaction;
|
|
•
|
we may be unable to finance acquisitions on favorable terms or at all;
|
|
•
|
we may spend more than budgeted amounts in operating costs or to make necessary improvements or renovations to acquired properties;
|
|
•
|
we may lease acquired properties at economic lease terms different than projected;
|
|
•
|
we may acquire properties that are subject to liabilities for which we may have limited or no recourse; and
|
|
•
|
we may be unable to complete an acquisition after making a nonrefundable deposit and incurring certain other acquisition-related costs.
|
If we cannot finance property acquisitions on favorable terms or operate acquired properties to meet financial expectations, our financial condition, results of operations, cash flows, the quoted trading price of our securities and our ability to satisfy our debt service obligations and to pay dividends and distributions to our security holders could be adversely affected.
There are significant risks associated with property acquisition, development and redevelopment.
We may be unable to successfully complete and operate acquired, developed and redeveloped properties, and it is possible that:
|
•
|
we may be unable to lease acquired, developed or redeveloped properties on lease terms projected at the time of acquisition, development or redevelopment or within budgeted timeframes;
|
|
•
|
the operating expenses at acquired, developed or redeveloped properties may be greater than projected at the time of acquisition, development or redevelopment, resulting in our investment being less profitable than we expected;
|
|
•
|
we may not commence or complete development or redevelopment properties on schedule or within budgeted amounts or at all;
|
|
•
|
we may not be able to develop or redevelop the estimated square footage and other features of our development and redevelopment properties;
|
|
•
|
we may suspend development or redevelopment projects after construction has begun due to changes in economic conditions or other factors, and this may result in the write-off of costs, payment of additional costs or increases in overall costs when the development or redevelopment project is restarted;
|
|
•
|
we may expend funds on and devote management’s time to acquisition, development or redevelopment properties that we may not complete and as a result we may lose deposits or fail to recover expenses already incurred;
|
20
|
•
|
we may encounter delays or refusals in obtaining all necessary zoning, land use, and other required entitlements, and building, occupancy, and other required governmental permits and authorizations;
|
|
•
|
we may encounter delays, refusals, unforeseen cost increases and other impairments resulting from third-party litigation; and
|
|
•
|
we may fail to obtain the financial results expected from properties we acquire, develop or redevelop.
|
If one or more of these events were to occur in connection with our acquired properties, undeveloped land, or development or redevelopment properties under construction, we could be required to recognize an impairment loss. These events could also have an adverse impact on our financial condition, results of operations, cash flow, the quoted trading price of our securities, and our ability to satisfy our debt service obligations and to pay dividends and distributions to our security holders.
While we historically have acquired, developed and redeveloped office properties in California markets, over the past few years we have acquired properties in greater Seattle, where we currently have
twelve
properties and
one
development project under construction, and may in the future acquire, develop or redevelop properties for other uses and expand our business to other geographic regions where we expect the development or acquisition of property to result in favorable risk-adjusted returns on our investment. Presently, we do not possess the same level of familiarity with other outside markets, which could adversely affect our ability to acquire, develop or redevelop properties or to achieve expected performance.
We face risks associated with the development of mixed-use commercial properties
. We are currently developing, and in the future may develop, properties either alone or through joint ventures that are known as “mixed-use” developments. This means that in addition to the development of office space, the project may also include space for residential, retail or other commercial purposes. Generally, we have less experience developing and managing non-office real estate. As a result, if a development project includes non-office space, we may develop that space ourselves or seek to partner with a third-party developer with more experience. If we do not partner with such a developer, or if we choose to develop the space ourselves, we would be exposed to specific risks associated with the development and ownership of non-office real estate. In addition, if we elect to participate in the development through a joint venture, we may be exposed to the risks associated with the failure of the other party to complete the development as expected, which could require that we identify another joint venture partner and/or complete the project ourselves (including providing any necessary financing). In the case of residential properties, these risks include competition for prospective tenants from other operators whose properties may be perceived to offer a better location or better amenities or whose rent may be perceived as a better value given the quality, location and amenities that the tenant seeks. With residential properties, we will also compete against apartments, condominiums and single-family homes that are for sale or rent. Because we have less experience with residential properties, we may retain third parties to manage these properties. If we decide to wholly own a non-office project and hire a third-party manager, we could be dependent on that party and its key personnel to provide services to us, and we may not find a suitable replacement if the management agreement is terminated, or if key personnel leave or otherwise become unavailable to us.
Joint venture investments could be adversely affected by our lack of sole decision-making authority, our reliance on co-venturers' financial condition, and disputes between us and our co-venturers and could expose us to potential liabilities and losses.
In addition to the 100 First LLC and 303 Second LLC strategic ventures formed during 2016 and the Redwood City Partners, LLC venture formed during 2013, we may continue to co-invest in the future with third parties through partnerships, joint ventures or other entities, or through acquiring non-controlling interests in, or sharing responsibility for, managing the affairs of a property, partnership, joint venture or other entity, which may subject us to risks that may not be present with other methods of ownership, including the following:
|
•
|
we would not be able to exercise sole decision-making authority regarding the property, partnership, joint venture or other entity, which would allow for impasses on decisions that could restrict our ability to sell or transfer our interests in such entity or such entity’s ability to transfer or sell its assets;
|
|
•
|
partners or co-venturers might become bankrupt or fail to fund their share of required capital contributions, which could delay construction or development of a property or increase our financial commitment to the partnership or joint venture;
|
21
|
•
|
partners or co-venturers may pursue economic or other business interests, policies or objectives that are competitive or inconsistent with ours;
|
|
•
|
if we become a limited partner or non-managing member in any partnership or limited liability company, and such entity takes or expects to take actions that could jeopardize our status as a REIT or require us to pay tax, we may be forced to dispose of our interest in such entity;
|
|
•
|
disputes between us and partners or co-venturers may result in litigation or arbitration that would increase our expenses and prevent our officers and/or directors from focusing their time and effort on our business; and
|
|
•
|
we may, in certain circumstances, be liable for the actions of our third-party partners or co-venturers.
|
We own certain properties subject to ground leases and other restrictive agreements that limit our uses of the properties, restrict our ability to sell or otherwise transfer the properties and expose us to the loss of the properties if such agreements are breached by us, terminated or not renewed.
As of
December 31, 2017
, we owned
thirteen
office buildings, located on various land parcels and in various regions, which we lease individually on a long-term basis. As of
December 31, 2017
, we had approximately
2.0 million
aggregate rentable square feet, or
14.8%
of our total stabilized portfolio, of rental space located on these leased parcels and we may in the future invest in additional properties that are subject to ground leases or other similar restrictive arrangements. Many of these ground leases and other restrictive agreements impose significant limitations on our uses of the subject property, restrict our ability to sell or otherwise transfer our interests in the property or restrict our leasing of the property. These restrictions may limit our ability to timely sell or exchange the properties, impair the properties’ value or negatively impact our ability to find suitable tenants for the properties. In addition, if we default under the terms of any particular lease, we may lose the ownership rights to the property subject to the lease. Upon expiration of a lease, we may not be able to renegotiate a new lease on favorable terms, if at all. The loss of the ownership rights to these properties or an increase of rental expense could have an adverse effect on our financial condition, results of operations, cash flow, the quoted trading price of our securities, and our ability to satisfy our debt service obligations and to pay dividends and distributions to our security holders.
Real estate assets are illiquid, and we may not be able to sell our properties when we desire.
Our investments in our properties are relatively illiquid, limiting our ability to sell our properties quickly in response to changes in economic or other conditions. In addition, the Code generally imposes a 100% prohibited transaction tax on the Company on profits derived from sales of properties held primarily for sale to customers in the ordinary course of business, which effectively limits our ability to sell properties other than on a selected basis. These restrictions on our ability to sell our properties could have an adverse effect on our financial condition, results of operations, cash flow, the quoted trading price of our securities, and our ability to satisfy our debt service obligations and to pay dividends and distributions to our security holders.
We may invest in securities related to real estate, which could adversely affect our ability to pay dividends and distributions to our security holders.
We may purchase securities issued by entities that own real estate and may, in the future, also invest in mortgages. In general, investments in mortgages are subject to several risks, including:
|
•
|
borrowers may fail to make debt service payments or pay the principal when due;
|
|
•
|
the value of the mortgaged property may be less than the principal amount of the mortgage note securing the property; and
|
|
•
|
interest rates payable on the mortgages may be lower than our cost for the funds used to acquire these mortgages.
|
Owning these securities may not entitle us to control the ownership, operation and management of the underlying real estate. In addition, we may have no control over the distributions with respect to these securities, which could adversely affect our ability to pay dividends and distributions to our security holders.
We face risks associated with short-term liquid investments.
From time to time, we have significant cash balances that we invest in a variety of short-term investments that are intended to preserve principal value and maintain a high degree of liquidity while providing current income. These investments may include (either directly or indirectly):
22
|
•
|
direct obligations issued by the U.S. Treasury;
|
|
•
|
obligations issued or guaranteed by the U.S. government or its agencies;
|
|
•
|
taxable municipal securities;
|
|
•
|
obligations (including certificates of deposits) of banks and thrifts;
|
|
•
|
commercial paper and other instruments consisting of short-term U.S. dollar denominated obligations issued by corporations and banks;
|
|
•
|
repurchase agreements collateralized by corporate and asset-backed obligations;
|
|
•
|
both registered and unregistered money market funds; and
|
|
•
|
other highly rated short-term securities.
|
Investments in these securities and funds are not insured against loss of principal. Under certain circumstances we may be required to redeem all or part of our investment, and our right to redeem some or all of our investment may be delayed or suspended. In addition, there is no guarantee that our investments in these securities or funds will be redeemable at par value. A decline in the value of our investment or a delay or suspension of our right to redeem may have a material adverse effect on our results of operations or financial condition.
Future terrorist activity or engagement in war by the United States may have an adverse effect on our financial condition and operating results.
Terrorist attacks in the United States and other acts of terrorism or war, may result in declining economic activity, which could harm the demand for and the value of our properties. In addition, the public perception that certain locations are at greater risk for attack, such as major airports, ports and rail facilities, may decrease the demand for and the value of our properties near these sites. A decrease in demand could make it difficult for us to renew or re-lease our properties at these sites at lease rates equal to or above historical rates. Terrorist activities also could directly impact the value of our properties through damage, destruction, or loss, and the availability of insurance for these acts may be less, and cost more, which could adversely affect our financial condition. To the extent that our tenants are impacted by future attacks, their businesses similarly could be adversely affected, including their ability to continue to honor their existing leases.
Terrorist acts and engagement in war by the United States also may adversely affect the markets in which our securities trade and may cause further erosion of business and consumer confidence and spending, and may result in increased volatility in national and international financial markets and economies. Any one of these events may cause a decline in the demand for our office leased space, delay the time in which our new or renovated properties reach stabilized occupancy, increase our operating expenses, such as those attributable to increased physical security for our properties, and limit our access to capital or increase our cost of raising capital.
The enactment of the Dodd-Frank Wall Street Reform and Consumer Protection Act (“Dodd-Frank Act”) will subject us to substantial additional federal regulation
. There are significant corporate governance and executive compensation-related requirements that have been, and will in the future be, imposed on publicly-traded companies under the Dodd-Frank Act. Several of these provisions require the SEC to adopt additional rules and regulations in these areas. For example, the Dodd-Frank Act requires publicly-traded companies to give stockholders a non-binding vote on executive compensation and so-called “golden parachute” payments. Our efforts to comply with these requirements have resulted in, and are likely to continue to result in, an increase in expenses and a diversion of management’s time from other business activities. In addition, if stockholders do not vote to approve our executive compensation practices and/or our equity plan amendments, these actions may interfere with our ability to attract and retain key personnel who are essential to our future success. Provisions of the Dodd-Frank Act that directly affect other participants in the real estate and capital markets, such as banks, investment funds and interest rate hedge providers, could also have indirect, but material, impacts on our business that cannot now be predicted. In addition, in February 2017, the U.S. President ordered the Secretary of the U.S. Treasury to review certain existing rules and regulations, such as those promulgated under the Dodd-Frank Act; however, the implications of that review are not yet known and none of the rules and regulations promulgated under the Dodd-Frank Act have been modified or rescinded as of the
23
date of this report. Given the uncertainty associated with both the results of the existing Dodd-Frank Act requirements and the manner in which additional provisions of the Dodd-Frank Act will be implemented by various regulatory agencies and through regulations, the full extent of the impact of such requirements on our operations is unclear. Accordingly, the changes resulting from the Dodd-Frank Act may impact the profitability of business activities, require changes to certain business practices, or otherwise adversely affect our financial condition, results of operations, cash flows, the quoted trading price of our securities and our ability to satisfy our debt service obligations and to pay dividends and distributions to our security holders.
Our property taxes could increase due to reassessment or property tax rate changes.
We are required to pay state and local taxes on our properties. In addition, the real property taxes on our properties may increase as our properties are reassessed by taxing authorities or as property tax rates change. For example, under a current California law commonly referred to as “Proposition 13,” property tax reassessment generally occurs as a result of a “change in ownership” of a property, as specifically defined for purposes of those rules. Because the property taxing authorities may not determine whether there has been a “change in ownership” or the actual reassessed value of a property for a period of time after a transaction has occurred, we may not know the impact of a potential reassessment for a considerable amount of time following a particular transaction or construction of a new property. Therefore, the amount of property taxes we are required to pay could increase substantially from the property taxes we currently pay or have paid in the past, including on a retroactive basis. In addition, from time to time voters and lawmakers have announced initiatives to repeal or amend Proposition 13 to eliminate its application to commercial property and/or introduce split tax roll legislation. Such initiatives, if successful, would increase the assessed value and/or tax rates applicable to commercial property in California, including our properties. An increase in the assessed value of our properties or our property tax rates could adversely impact our financial condition, results of operations, cash flows, the quoted trading price of our securities, and our ability to satisfy our debt service obligations and to pay dividends and distributions to our security holders.
Unfavorable resolution of litigation matters and disputes could have a material adverse effect on our financial condition.
From time to time, we are involved in legal proceedings, lawsuits and other claims. We may also be named as defendants in lawsuits allegedly arising out of our actions or the actions of our operators and tenants in which such operators and tenants have agreed to indemnify, defend and hold us harmless from and against various claims, litigation and liabilities arising in connection with their respective businesses. An unfavorable resolution of any litigation could have an effect on our financial condition, results of operations, cash flow and the quoted trading price of our securities. Regardless of its outcome, litigation may result in substantial costs and expenses and significantly divert the attention of our management. There can be no assurance that we will be able to prevail in, or achieve a favorable settlement of, any litigation matters. In addition, litigation, government proceedings or environmental matters could lead to increased costs or interruption of our normal business operations.
Our business could be adversely impacted if there are deficiencies in our disclosure controls and procedures or internal control over financial reporting.
The design and effectiveness of our disclosure controls and procedures and internal control over financial reporting may not prevent all errors, misstatements or misrepresentations. While management will continue to review the effectiveness of our disclosure controls and procedures and internal control over financial reporting, there can be no guarantee that our internal control over financial reporting will be effective in accomplishing all control objectives all of the time. Deficiencies, including any material weakness, in our internal control over financial reporting that may occur in the future could result in misstatements of our results of operations, restatements of our financial statements, or otherwise adversely impact our financial condition, results of operations, cash flows, the quoted trading price of our securities, and our ability to satisfy our debt service obligations and to pay dividends and distributions to our security holders.
We face risks associated with security breaches through cyber attacks, cyber intrusions or otherwise, as well as other significant disruptions of our information technology (IT) networks and related systems.
We face risks associated with security breaches, whether through cyber attacks or cyber intrusions over the Internet, malware, computer viruses, attachments to e-mails, persons inside our organization or persons with access to systems inside our organization, and other significant disruptions of our IT networks and related systems. The risk of a security breach or disruption, particularly through cyber attack or cyber intrusion, including by computer hackers, foreign governments and cyber terrorists, has generally increased as the number, intensity and sophistication of attempted attacks and intrusions from around the world have increased. Our IT networks and related systems are essential to the operation of our business and our ability to perform day-to-day operations (including managing our building systems), and, in some cases, may
24
be critical to the operations of certain of our tenants. There can be no assurance that our efforts to maintain the security and integrity of these types of IT networks and related systems will be effective or that attempted security breaches or disruptions would not be successful or damaging. A security breach or other significant disruption involving our IT networks and related systems could, among other things:
|
•
|
result in unauthorized access to, destruction, loss, theft, misappropriation or release of proprietary, confidential, sensitive or otherwise valuable information of ours or others, including personally identifiable and account information that could be used to compete against us or for disruptive, destructive or otherwise harmful purposes and outcomes;
|
|
•
|
result in unauthorized access to or changes to our financial accounting and reporting systems and related data;
|
|
•
|
result in our inability to maintain building systems relied on by our tenants;
|
|
•
|
require significant management attention and resources to remedy any damage that results;
|
|
•
|
subject us to regulatory penalties or claims for breach of contract, damages, credits, penalties or terminations of leases or other agreements; or
|
|
•
|
damage our reputation among our tenants and investors.
|
These events could have an adverse impact on our financial condition, results of operations, cash flows, the quoted trading price of our securities, and our ability to satisfy our debt service obligations and to pay dividends and distributions to our security holders.
An increase in interest rates could increase our interest costs on variable rate debt and new debt and could adversely affect our ability to refinance existing debt, conduct development, redevelopment and acquisition activity and recycle capital.
As of
December 31, 2017
, we had an unsecured revolving credit facility and an unsecured term loan facility bearing interest at variable rates on any amounts drawn and outstanding, and we may incur additional variable rate debt in the future.
There were no amounts outstanding on both the unsecured revolving credit facility and unsecured term loan facility at
December 31, 2017
. If interest rates increase, so could our interest costs for any variable rate debt and for new debt. This increased cost could make the financing of any development, redevelopment and acquisition activity costlier. Rising interest rates could also limit our ability to refinance existing debt when it matures or cause us to pay higher interest rates upon refinancing and increase interest expense on refinanced indebtedness. In addition, an increase in interest rates could decrease the amount third parties are willing to pay for our assets, thereby limiting our ability to recycle capital and our portfolio promptly in response to changes in economic or other conditions.
We manage a portion of our exposure to interest rate risk by accessing debt with staggered maturities, and we may in the future mitigate this risk through the use of derivative instruments, including interest rate swap agreements or other interest rate hedging agreements, including swaps, caps and floors. While these agreements are intended to lessen the impact of rising interest rates on us, they also expose us to the risks that counter parties may fail to honor their obligations, that we could incur significant costs associated with the settlement of these agreements, that the amount of income we earn from hedging transactions may be limited by federal tax provisions governing REITs, that these agreements may cause us to pay higher interest rates on our debt obligations than would otherwise be the case and that underlying transactions could fail to qualify as highly-effective cash flow hedges under the accounting guidance. As a result, failure to hedge effectively against interest rate risk, if we choose to engage in such activities, could adversely affect our financial condition, results of operations, cash flows, the quoted trading price of our securities, and our ability to satisfy our debt service obligations and to pay dividends and distributions to our security holders.
The trading price of our common stock may fluctuate significantly.
The trading price of our common stock may fluctuate significantly. Between January 1, 2017 and February 9, 2018, the closing sale price of Company’s common stock on the New York Stock Exchange, or the NYSE, ranged from $63.72 to $77.91 per share. The trading price of our common stock may fluctuate in response to many factors, including:
|
•
|
actual or anticipated variations in our operating results, funds from operations, cash flows, liquidity or distributions;
|
25
|
•
|
our ability to successfully execute on our development program;
|
|
•
|
our ability to successfully complete acquisitions and operate acquired properties;
|
|
•
|
earthquakes;
|
|
•
|
changes in our earnings estimates or those of analysts;
|
|
•
|
publication of research reports about us, the real estate industry generally or the office and residential sectors in which we operate;
|
|
•
|
the failure to maintain our current credit ratings or comply with our debt covenants;
|
|
•
|
increases in market interest rates that lead purchasers of our common stock to demand a higher dividend yield;
|
|
•
|
actual or anticipated changes in tax laws and regulations;
|
|
•
|
changes in market valuations of similar companies;
|
|
•
|
adverse market reaction to any debt or equity securities we may issue or additional debt we incur in the future;
|
|
•
|
additions or departures of key management personnel;
|
|
•
|
actions by institutional stockholders;
|
|
•
|
speculation in the press or investment community;
|
|
•
|
high levels of volatility in the credit markets;
|
|
•
|
general market and economic conditions; and
|
|
•
|
the realization of any of the other risk factors included in this report.
|
Many of the factors listed above are beyond our control. These factors may cause the trading price of our common stock to decline, regardless of our financial performance and condition and prospects. It is impossible to provide any assurance that the trading price of our common stock or the amount of dividends we pay on our common stock will not decline in the future, and it may be difficult for holders to resell shares of our common stock at prices they find attractive or at all.
Changes in accounting pronouncements could adversely affect our operating results, in addition to the reported financial performance of our tenants
. Uncertainties posed by various initiatives of accounting standard-setting by the Financial Accounting Standards Board (“FASB”) and the SEC, which establish and govern accounting standards for U.S. companies, may change the financial accounting and reporting standards or their interpretation and application of these standards that govern the preparation of our financial statements, including the adoption of the lease accounting standard.
Proposed and/or future changes in accounting standards could have a material impact on our reported financial condition and results of operations. In some cases, we could be required to apply a new or revised standard retroactively, resulting in potentially material restatements of prior period financial statements. Similarly, these changes could have a material impact on our tenants’ reported financial condition or results of operations or could impact our tenants’ business decisions in leasing real estate.
We face risks associated with our tenants and contractual counterparties being designated “Prohibited Persons” by the Office of Foreign Assets Control
. Pursuant to Executive Order 13224 and other laws, the Office of Foreign Assets Control of the United States Department of the Treasury (“OFAC”) maintains a list of persons designated as terrorists or who are otherwise blocked or banned (“Prohibited Persons”). OFAC regulations and other laws prohibit conducting
26
business or engaging in transactions with Prohibited Persons (the “OFAC Requirements”). Certain of our loan and other agreements require us to comply with OFAC Requirements. Our leases and other agreements, in general, require the other party to comply with OFAC Requirements. If a tenant or other party with whom we contract is placed on the OFAC list, we may be required by the OFAC Requirements to terminate the lease or other agreement. Any such termination could result in a loss of revenue or a damage claim by the other party that the termination was wrongful.
The actual density of our undeveloped land holdings and/or any particular land parcel may not be consistent with our potential density estimates
. As of
December 31, 2017
, we estimate that our
six
near term and future potential development sites, representing approximately
48
gross acres of undeveloped land, provide more than
4.3 million
square feet of potential density. We caution you not to place undue reliance on the potential density estimates for our undeveloped land holdings and/or any particular land parcel because they are based solely on our estimates, using data currently available to us, and our business plans as of
December 31, 2017
. The actual density of our undeveloped land holdings and/or any particular land parcel may differ substantially from our estimates based on numerous factors, including our inability to obtain necessary zoning, land use and other required entitlements, as well as building, occupancy and other required governmental permits and authorizations, and changes in the entitlement, permitting and authorization processes that restrict or delay our ability to develop, redevelop or use undeveloped land holdings at anticipated density levels. Moreover, we may strategically choose not to develop, redevelop or use our undeveloped land holdings to their maximum potential density or may be unable to do so as a result of factors beyond our control, including our ability to obtain capital on terms that are acceptable to us, or at all, to fund our development and redevelopment activities. We can provide no assurance that the actual density of our undeveloped land holdings and/or any particular land parcel will be consistent with our potential density estimates. For additional information on our development program, see “Item 7. Management’s Discussion and Analysis of Financial Condition and Results of Operations —Factors That May Influence Future Results of Operations.”
Risks Related to Our Organizational Structure
Loss of our key personnel could harm our operations and financial performance and adversely affect the quoted trading price of our securities.
The leadership and performance of our executive and senior officers play a key role in the success of the Company. They are integral to the Company’s success for many reasons, including that each has a strong national or regional reputation in our industry and investment community. In addition, they have significant relationships with investors, lenders, tenants and industry personnel, which benefit the Company.
Our growth depends on external sources of capital that are outside of our control and the inability to obtain capital on terms that are acceptable to us, or at all, could adversely affect our financial condition and results of operations.
The Company is required under the Code to distribute at least 90% of its taxable income (subject to certain adjustments and excluding any net capital gain), and the Operating Partnership is required to make distributions to the Company to allow the Company to satisfy these REIT distribution requirements. Because of these distribution requirements, the Operating Partnership is required to make distributions to the Company, and we may not be able to fund future capital needs, including any necessary acquisition financing, from operating cash flow. Consequently, management relies on third-party sources of capital to fund our capital needs. We may not be able to obtain financing on favorable terms or at all. Any additional debt we incur will increase our leverage. Access to third-party sources of capital depends, in part, on general market conditions and the availability of credit, the market’s perception of our growth potential, our current and expected future earnings, our cash flows and cash distributions and the quoted trading price of our securities. If we cannot obtain capital from third-party sources, our financial condition, results of operations, cash flows, the quoted trading price of our securities, and our ability to satisfy our debt service obligations and to pay dividends and distributions to our security holders may be adversely affected.
27
Our
common limited partners have limited approval rights, which may prevent us from completing a change of control transaction that may be in the best interests of all our security holders.
The Company may not withdraw as the Operating Partnership’s general partner or transfer its general partnership interest in the Operating Partnership without the approval of the holders of at least 60% of the units representing common limited partnership interests, including the common units held by the Company in its capacity as the Operating Partnership’s general partner. In addition, the Company may not engage in a merger, consolidation or other combination or the sale of substantially all of its assets or such similar transaction, without the approval of the holders of 60% of the common units, including the common units held by the Company in its capacity as the Operating Partnership’s general partner. The right of our common limited partners to vote on these transactions could limit our ability to complete a change of control transaction that might otherwise be in the best interest of all our security holders.
In certain circumstances, our limited partners must approve our dissolution and the disposition of properties contributed by the limited partners.
For as long as limited partners own at least 5% of all of the Operating Partnership’s partnership interests, we must obtain the approval of limited partners holding a majority of the units representing common limited partnership interests before we may dissolve. As of
December 31, 2017
, limited partners owned approximately
2.1%
of the Operating Partnership’s partnership interests, of which
0.8%
was owned by John Kilroy. In addition, we agreed to use commercially reasonable efforts to minimize the tax consequences to certain common limited partners resulting from the repayment, refinancing, replacement, or restructuring of debt, or any sale, exchange, or other disposition of any of our other assets. The exercise of one or more of these approval rights by the limited partners could delay or prevent us from completing a transaction that may be in the best interest of all our security holders.
The Chairman of our board of directors and our President and Chief Executive Officer has substantial influence over our affairs.
John Kilroy is the Chairman of our board of directors and our President and Chief Executive Officer. John Kilroy beneficially owned, as of
December 31, 2017
, approximately
1.5%
of the total outstanding shares of our common stock. The percentage of outstanding shares of common stock beneficially owned includes
205,322
shares of common stock,
489,763
restricted stock units (“RSUs”) that were vested and held by John Kilroy at
December 31, 2017
, and assumes the exchange into shares of our common stock of the
783,192
common units of the Operating Partnership held by John Kilroy (which may be exchanged for an equal number of shares of our common stock).
Pursuant to the Company’s charter, no stockholder may own, actually or constructively, more than 7.0% (by value or by number of shares, whichever is more restrictive) of our outstanding common stock without obtaining a waiver from the board of directors. The board of directors has waived the ownership limits with respect to John Kilroy, members of his family and some of their affiliated entities. These named individuals and entities may own either actually or constructively, in the aggregate, up to 19.6% of our common stock, excluding Operating Partnership units that are exchangeable into shares of our common stock. Consequently, John Kilroy has substantial influence over the Company, and because the Company is the manager of the Operating Partnership, over the Operating Partnership, and could exercise his influence in a manner that is not in the best interest of our stockholders, noteholders or unitholders. Also, John Kilroy may, in the future, have a substantial influence over the outcome of any matters submitted to our stockholders or unitholders for approval.
There are restrictions on the ownership of the Company’s capital stock that limit the opportunities for a change of control at a premium to existing security holders.
Provisions of the Maryland General Corporation Law, the Company’s charter and bylaws and the Operating Partnership’s partnership agreement may delay, deter, or prevent a change of control of the Company, or the removal of existing management. Any of these actions might prevent our security holders from receiving a premium for their shares of common stock or common units over the then-prevailing market price of the shares of our common stock.
In order for the Company to qualify as a REIT under the Code, its stock must be beneficially owned by 100 or more persons during at least 335 days of a taxable year of 12 months (other than the first year for which an election to be a REIT has been made) or during a proportionate part of a shorter taxable year. Also, not more than 50% of the value of the outstanding shares of the Company’s stock may be owned, actually or constructively, by five or fewer individuals (as defined in the Code to include certain entities) during the last half of a taxable year (other than the first year for which an election to be a REIT has been made). The Company’s charter contains restrictions on the ownership and transfer of its capital stock that are intended to assist the Company in complying with these requirements and continuing to qualify as a REIT. No single stockholder may own, either actually or constructively, absent a waiver
28
from the board of directors, more than 7.0% (by value or by number of shares, whichever is more restrictive) of the Company’s outstanding common stock.
The constructive ownership rules under the Code are complex and may cause stock owned actually or constructively by a group of related individuals and/or entities to be owned constructively by one individual or entity. As a result, the acquisition of less than the applicable ownership limit of a particular class of the Company’s capital stock could, nevertheless, cause that individual or entity, or another individual or entity, to constructively own stock in excess of, and thereby subject such stock to, the applicable ownership limit.
The board of directors may waive the ownership limits if it is satisfied that the excess ownership would not jeopardize the Company’s REIT status and if it believes that the waiver would be in our best interest. The board of directors has waived the ownership limits with respect to John Kilroy, members of his family and some of their affiliated entities. These named individuals and entities may own either actually or constructively, in the aggregate, up to 19.6% of our outstanding common stock, excluding common units that are exchangeable into shares of common stock.
If anyone acquires shares in excess of any ownership limits without a waiver, the transfer to the transferee will be void with respect to the excess shares, the excess shares will be automatically transferred to a trust for the benefit of a qualified charitable organization, and the purported transferee or owner will have no rights with respect to those excess shares.
The Company’s charter contains provisions that may delay, deter or prevent a change of control transaction.
The following provisions of the Company’s charter may delay or prevent a change of control over us, even if a change of control might be beneficial to our security holders, deter tender offers that may be beneficial to our security holders, or limit security holders’ opportunity to receive a potential premium for their shares and/or units if an investor attempted to gain shares beyond the Company’s ownership limits or otherwise to effect a change of control:
|
•
|
the Company’s charter authorizes the board of directors to issue up to 30,000,000 shares of the Company’s preferred stock, including convertible preferred stock, without stockholder approval. The board of directors may establish the preferences, rights and other terms, including the right to vote and the right to convert into common stock any shares issued. The issuance of preferred stock could delay or prevent a tender offer or a change of control even if a tender offer or a change of control was in our security holders’ interest; and
|
|
•
|
the Company’s charter states that any director, or the entire board of directors, may be removed from office at any time, but only for cause and then only by the affirmative vote of the holders of at least two thirds of the votes of the Company’s capital stock entitled to be cast in the election of directors.
|
The board of directors may change investment and financing policies without stockholder or unitholder approval.
Our board of directors determines our major policies, including policies and guidelines relating to our acquisition, development and redevelopment activities, leverage, financing, growth, operations, indebtedness, capitalization and distributions to our security holders. Our board of directors may amend or revise these and other policies and guidelines from time to time without stockholder or unitholder approval. Accordingly, our stockholders and unitholders will have limited control over changes in our policies and those changes could adversely impact our financial condition, results of operations, cash flows, the quoted trading price of our securities, and our ability to satisfy our debt service obligations and to pay dividends and distributions to our security holders.
We are not limited in our ability to incur debt.
Our financing policies and objectives are determined by the board of directors. Our goal is to limit our dependence on leverage and maintain a conservative ratio of debt to total market capitalization. However, our organizational documents do not limit the amount or percentage of indebtedness, funded or otherwise, that we may incur. As of
December 31, 2017
, we had approximately
$2.4 billion
aggregate principal amount of indebtedness outstanding, which represented
23.9%
of our total market capitalization. See “Item 7. Management’s Discussion and Analysis of Financial Condition and Results of Operations —Liquidity and Capital Resources of the Company —Capitalization” for a calculation of our market capitalization. These ratios may be increased or decreased without the consent of our unitholders or stockholders. Increases in the amount of debt outstanding would result in an increase in our debt service, which could adversely affect cash flow and our ability to pay dividends and distributions to our security holders. Higher leverage also increases the risk of default on our obligations and limits our ability to obtain additional financing in the future.
29
We may issue additional common units and shares of capital stock without unitholder or stockholder approval, as applicable, which may dilute unitholder or stockholder investment.
The Company may issue shares of our common stock, preferred stock or other equity or debt securities without stockholder approval, including the issuance of shares to satisfy REIT dividend distribution requirements. Similarly, the Operating Partnership may offer its common or preferred units for contributions of cash or property without approval by our stockholders or the Operating Partnership’s unitholders. Existing security holders have no preemptive rights to acquire any of these securities, and any issuance of equity securities under these circumstances may dilute a unitholder's or stockholder's investment.
The market price of our common stock may be adversely affected by future offerings of debt and equity securities by us or the Operating Partnership.
In the future, we may increase our capital resources by offering our debt securities and preferred stock, the Operating Partnership’s debt securities and equity securities and our or the Operating Partnership’s other borrowings. Upon our liquidation, dissolution or winding-up, holders of such debt securities, our preferred stock and Operating Partnership’s equity securities, and lenders with respect to other borrowings by us and the Operating Partnership, will be entitled to receive distributions of our available assets prior to the holders of our common stock and it is possible that, after making distributions on these other securities and borrowings, no assets would be available for distribution to holders of our common stock. In addition, the Operating Partnership’s debt and equity securities and borrowings are structurally senior to our common stock, our debt securities and borrowings are senior in right of payment to our common stock, and any preferred stock we may issue in the future may have a preference over our common stock, and all payments (including dividends, principal and interest) and liquidating distributions on such securities and borrowings could limit our ability to pay dividends or make other distributions to the holders of our common stock. Because any decision to issue securities and make borrowings in the future will depend on market conditions and other factors, some of which may be beyond our control, we cannot predict or estimate the amount, timing or nature of our or the Operating Partnership’s future offerings or borrowings. Such future offerings or borrowings may reduce the market price of our common stock.
Sales of a substantial number of shares of the Company’s securities, or the perception that this could occur, could result in decreasing the quoted trading price per share of the Company’s common stock and of the Operating Partnership’s publicly-traded notes.
Management cannot predict whether future issuances of shares of the Company’s common stock, or the availability of shares for resale in the open market will result in decreasing the market price per share of the Company’s common stock. As of
December 31, 2017
,
98,620,333
shares of the Company’s common stock were issued and outstanding.
As of
December 31, 2017
, the Company had reserved for future issuance the following shares of common stock:
2,077,193
shares issuable upon the exchange, at the Company’s option, of the Operating Partnership’s common units; approximately
1.9 million
shares remained available for grant under our 2006 Incentive Award Plan (see Note 15 “Share-Based Compensation” to our consolidated financial statements included in this report); approximately
1.4 million
shares issuable upon settlement of time-based RSUs;
0.7 million
shares contingently issuable upon settlement of RSUs subject to the achievement of market and/or performance conditions; and
26,500
shares issuable upon exercise of outstanding options. The Company has a currently effective registration statement registering
9.2 million
shares of our common stock for possible issuance under our 2006 Incentive Award Plan. The Company has a currently effective registration statement registering
1,649,760
shares of our common stock for possible issuance to and resale by certain holders of the Operating Partnership’s common units. That registration statement also registers
94,441
shares of common stock held by John Kilroy for possible resale. Consequently, if and when the shares are issued, they may be freely traded in the public markets.
30
Risks Related to Taxes and the Company’s Status as a REIT
Loss of the Company’s REIT status would have significant adverse consequences to us and the value of the Company’s common stock.
The Company currently operates in a manner that is intended to allow it to qualify as a REIT for federal income tax purposes under the Code. If the Company were to lose its REIT status, the Company would face adverse tax consequences that would substantially reduce the funds available for distribution to its stockholders for each of the years involved because:
|
•
|
the Company would not be allowed a deduction for dividends paid to its stockholders in computing the Company’s taxable income and would be subject to federal income tax at regular corporate rates;
|
|
•
|
the Company could be subject to increased state and local taxes; and
|
|
•
|
unless entitled to relief under statutory provisions, the Company could not elect to be taxed as a REIT for four taxable years following the year during which the Company was disqualified.
|
In addition, if the Company failed to qualify as a REIT, it would not be required to make distributions to its stockholders. As a result of all these factors, the Company’s failure to qualify as a REIT also could impair our ability to expand our business and raise capital, and could adversely affect the value and quoted trading price of the Company’s common stock.
Qualification as a REIT involves the application of highly technical and complex Code provisions for which there are only limited judicial and administrative interpretations. The complexity of these provisions and of the applicable Treasury regulations that have been promulgated under the Code is greater in the case of a REIT that, like the Company, holds its assets through a partnership. The determination of various factual matters and circumstances not entirely within our control may affect the Company’s ability to continue to qualify as a REIT. For example, to qualify as a REIT, at least 95% of the Company’s gross income in any year must be derived from qualifying sources. Also, the Company must make distributions to its stockholders aggregating annually at least 90% of the Company’s net taxable income (subject to certain adjustments and excluding any net capital gains). In addition, legislation, new regulations, administrative interpretations or court decisions may adversely affect the Company’s security holders or the Company’s ability to qualify as a REIT for federal income tax purposes or the desirability of an investment in a REIT relative to other investments. Although management believes that we are organized and operate in a manner to permit the Company to continue to qualify as a REIT, we cannot provide assurances that the Company has qualified or will continue to qualify as a REIT for tax purposes. We have not requested and do not plan to request a ruling from the Internal Revenue Service (“IRS”) regarding the Company’s qualification as a REIT.
To maintain the Company’s REIT status, we may be forced to borrow funds during unfavorable market conditions.
To qualify as a REIT, the Company generally must distribute to its stockholders at least 90% of the Company’s net taxable income each year (subject to certain adjustments and excluding any net capital gains), and the Company will be subject to regular corporate income taxes to the extent that it distributes less than 100% of its net capital gains or distributes at least 90%, but less than 100%, of its net taxable income each year. In addition, the Company will be subject to a 4% nondeductible excise tax on the amount, if any, by which distributions it pays in any calendar year are less than the sum of 85% of its ordinary income, 95% of its net capital gains, and 100% of its undistributed income from prior years. To maintain the Company’s REIT status and avoid the payment of federal income and excise taxes, the Operating Partnership may need to borrow funds and distribute or loan the proceeds to the Company so it can meet the REIT distribution requirements even if the then-prevailing market conditions are not favorable for these borrowings. These borrowing needs could result from differences in timing between the actual receipt of income and inclusion of income for federal income tax purposes, or the effect of nondeductible capital expenditures, the creation of reserves or required debt or amortization payments.
If a transaction intended to qualify as a Section 1031 Exchange is later determined to be taxable or if we are unable to identify and complete the acquisition of a suitable replacement property to effect a Section 1031 Exchange, we may face adverse consequences, and if the laws applicable to such transactions are amended or repealed, we may not be able to dispose of properties on a tax deferred basis.
When possible, we dispose of properties in transactions that are intended to qualify as Section 1031 Exchanges. It is possible that the qualification of a transaction as a Section 1031 Exchange could be successfully challenged and determined to be currently taxable or that we may be unable to identify
31
and complete the acquisition of a suitable replacement property to effect a Section 1031 Exchange. In such case, our taxable income and earnings and profits would increase. This could increase the dividend income to our stockholders by reducing any return of capital they received. In some circumstances, we may be required to pay additional dividends or, in lieu of that, corporate income tax, possibly including interest and penalties. As a result, we may be required to borrow funds in order to pay additional dividends or taxes and the payment of such taxes could cause us to have less cash available to distribute to our stockholders. In addition, if a Section 1031 Exchange were later to be determined to be taxable, we may be required to amend our tax returns for the applicable year in question, including any information reports we sent our stockholders. Moreover, under the recently enacted Tax Cuts and Jobs Act (the “2017 Tax Legislation”), for exchanges completed after December 31, 2017, unless the property was disposed of or received in the exchange on or before such date, Section 1031 of the Code permits exchanges of real property only.
It is possible that additional legislation could be enacted that could further modify or repeal the laws with respect to Section 1031 Exchanges, which could make it more difficult or not possible for us to dispose of properties on a tax deferred basis.
Dividends payable by REITs, including us, generally do not qualify for the reduced tax rates available for some dividends.
“Qualified dividends” payable to U.S. stockholders that are individuals, trusts and estates generally are subject to tax at preferential rates. Subject to limited exceptions, dividends payable by REITs are not eligible for these reduced rates and are taxable at ordinary income tax rates. The more favorable rates applicable to regular corporate qualified dividends could cause investors who are individuals, trusts and estates to perceive investments in REITs to be relatively less attractive than investments in the stocks of non-REIT corporations that pay dividends, which could adversely affect the value of the shares of REITs, including the shares of our capital stock. However, non-corporate stockholders, including individuals, generally may deduct 20% of dividends from a REIT, other than capital gain dividends and dividends treated as qualified dividend income, for taxable years beginning after December 31, 2017 and before January 1, 2026.
The tax imposed on REITs engaging in “prohibited transactions” may limit our ability to engage in transactions which would be treated as sales for federal income tax purposes.
A REIT’s net income from prohibited transactions is subject to a 100% penalty tax. In general, prohibited transactions are sales or other dispositions of property, other than foreclosure property, held primarily for sale to customers in the ordinary course of business. Although we do not intend to hold any properties that would be characterized as held for sale to customers in the ordinary course of our business, unless a sale or disposition qualifies under certain statutory safe harbors, such characterization is a factual determination and no guarantee can be given that the IRS would agree with our characterization of our properties or that we will always be able to make use of the available safe harbors.
Complying with REIT requirements may cause us to forego otherwise attractive opportunities or liquidate otherwise attractive investments.
To qualify as a REIT for federal income tax purposes, we must continually satisfy tests concerning, among other things, the sources of our income, the nature and diversification of our assets, the amounts we distribute to our stockholders and the ownership of our capital stock. If we fail to comply with one or more of the asset tests at the end of any calendar quarter, we must correct the failure within 30 days after the end of the calendar quarter or qualify for certain statutory relief provisions to avoid losing our REIT qualification and suffering adverse tax consequences. In order to meet these tests, we may be required to forego investments we might otherwise make or to liquidate otherwise attractive investments. Thus, compliance with the REIT requirements may hinder our performance and reduce amounts available for distribution to our stockholders.
Legislative or regulatory action could adversely affect our stockholders or us.
In recent years, numerous legislative, judicial and administrative changes have been made to the federal income tax laws applicable to investments in REITs and similar entities. Additional changes to tax laws are likely to continue to occur in the future, and any such changes may adversely impact our ability to qualify as a REIT, our tax treatment as a REIT, our ability to comply with contractual obligations or the tax treatment of our stockholders and limited partners. Also, the law relating to the tax treatment of other entities, or an investment in other entities, could change, making an investment in such other entities more attractive relative to an investment in a REIT.
The 2017 Tax Legislation has significantly changed the U.S. federal income taxation of U.S. businesses and their owners, including REITs and their stockholders.
Changes made by the 2017 Tax Legislation that could affect us and our stockholders include:
32
|
•
|
temporarily reducing individual U.S. federal income tax rates on ordinary income; the highest individual U.S. federal income tax rate has been reduced from 39.6% to 37% for taxable years beginning after December 31, 2017 and before January 1, 2026;
|
|
•
|
permanently eliminating the progressive corporate tax rate structure, which previously imposed a maximum corporate tax rate of 35%, and replacing it with a flat corporate tax rate of 21%;
|
|
•
|
permitting a deduction for certain pass-through business income, including dividends received by our stockholders from us that are not designated by us as capital gain dividends or qualified dividend income, which will allow individuals, trusts, and estates to deduct up to 20% of such amounts for taxable years beginning after December 31, 2017 and before January 1, 2026;
|
|
•
|
reducing the highest rate of withholding with respect to our distributions to non-U.S. stockholders that are treated as attributable to gains from the sale or exchange of U.S. real property interests from 35% to 21%;
|
|
•
|
limiting our deduction for net operating losses arising in taxable years beginning after December 31, 2017 to 80% of REIT taxable income;
|
|
•
|
generally limiting the deduction for net business interest expense in excess of 30% of a business’ “adjusted taxable income,” except for taxpayers (including most equity REITs) that engage in certain real estate businesses and elect out of this rule (provided that such electing taxpayers must use an alternative depreciation system with longer depreciation periods);
|
|
•
|
eliminating the corporate alternative minimum tax, for taxable years after December 31, 2017;
|
|
•
|
requiring us to take into account certain income no later than when we take it into account on applicable financial statements, even if financial statements take such income into account before it accrues under otherwise applicable Code rules; and
|
|
•
|
repealing the performance-based compensation exception to the $1 million deduction limit on executive compensation and expanding the scope of employees to whom the limit applies.
|
Many of these changes are effective immediately, without any transition periods or grandfathering for existing transactions. The legislation is unclear in many respects and could be subject to potential amendments and technical corrections, as well as interpretations and implementing regulations by the U.S. Treasury Department and IRS, any of which could lessen or increase the impact of the legislation. In addition, it is unclear how these U.S. federal income tax changes will affect state and local taxation, which often uses federal taxable income as a starting point for computing state and local tax liabilities. While some of the changes made by the tax legislation may adversely affect us in one or more reporting periods and prospectively, other changes may be beneficial on a going forward basis. We continue to work with our tax advisors and auditors to determine the full impact that the recent tax legislation as a whole will have on us.
|
ITEM 1B.
|
UNRESOLVED STAFF COMMENTS
|
None.
33
General
Our stabilized portfolio of operating properties was comprised of the following properties at
December 31, 2017
:
|
Number of
Buildings
|
Rentable
Square Feet
|
Number of
Tenants
|
Percentage
Occupied
|
Percentage Leased
|
||||||||||
|
Stabilized Office Properties
|
101
|
|
13,720,597
|
|
511
|
|
95.2
|
%
|
96.9
|
%
|
||||
|
Number of
Buildings |
Number of Units
|
2017 Average Occupancy
|
||||||
|
Stabilized Residential Property
|
1
|
|
200
|
|
70.2
|
%
|
||
Our stabilized portfolio includes all of our properties with the exception of development and redevelopment properties currently under construction or committed for construction, “lease-up” properties, real estate assets held for sale and undeveloped land. We define redevelopment properties as those properties for which we expect to spend significant development and construction costs on the existing or acquired buildings pursuant to a formal plan, the intended result of which is a higher economic return on the property. We define “lease-up” properties as office and retail properties we recently developed or redeveloped that have not yet reached
95%
occupancy and are within one year following cessation of major construction activities.
During the first quarter of
2017
, we added
one
development project to our stabilized office portfolio consisting of
365,359
rentable square feet in Hollywood, California. As of
December 31, 2017
, the following properties were excluded from our stabilized portfolio. We did not have any redevelopment properties as of
December 31, 2017
. There were no operating properties in “lease-up” or held for sale as of
December 31, 2017
.
|
Number of
Properties/Projects
|
Estimated Rentable
Square Feet
|
|||
|
Development projects under construction
(1)(2)
|
4
|
1,800,000
|
|
|
_______________
|
(1)
|
Estimated rentable square feet upon completion. See “Item 7. Management’s Discussion and Analysis of Financial Condition and Results of Operations —Factors That May Influence Future Results of Operations —Completed, In-Process and Future Development Pipeline” for more information.
|
|
(2)
|
Includes
86,000
square feet of Production, Distribution, and Repair (“PDR”) space. Development projects under construction also include
96,000
square feet of retail space and
237
residential units at One Paseo - Phase I in addition to the estimated rentable square feet noted above.
|
Our stabilized portfolio also excludes our near-term and future development pipeline, which as of
December 31, 2017
, was comprised of
six
potential near term and future development sites, representing approximately
48
gross acres of undeveloped land on which we believe we have the potential to develop over
4.3 million
square feet of office space, depending upon economic conditions.
As of
December 31, 2017
, all of our properties and development projects were owned and all of our business was conducted in the state of California with the exception of
twelve
office properties and
one
development project under construction located in the state of Washington. As of
December 31, 2017
, we owned
100%
of all of our properties and developments, excluding
four
office properties located in San Francisco, California owned by
three
consolidated property partnerships (see “Item 1. Business” and Note 2 “Basis of Presentation and Significant Accounting Policies” to our consolidated financial statements included in this report).
We own our interests in all of our real estate assets through the Operating Partnership and the Finance Partnership. All our properties are held in fee, except for the
thirteen
office buildings that are held subject to long-term ground leases for the land (see Note 18 “Commitments and Contingencies” to our consolidated financial statements included in this report for additional information regarding our ground lease obligations).
In general, the office properties are leased to tenants on a full service gross, modified gross or triple net basis. Under a full service gross lease, we are obligated to pay the tenant’s proportionate share of real estate taxes, insurance
34
and operating expenses up to the amount incurred during the tenant’s first year of occupancy (“Base Year”) or a negotiated amount approximating the tenant’s pro-rata share of real estate taxes, insurance and operating expenses (“Expense Stop”). The tenant pays its pro-rata share of increases in expenses above the Base Year or Expense Stop. A modified gross lease is similar to a full service gross lease, except tenants are obligated to pay their proportionate share of certain operating expenses, usually electricity, directly to the service provider. In addition, some office properties, primarily in the greater Seattle region and certain properties in certain submarkets in San Francisco, are leased to tenants on a triple net basis, pursuant to which the tenants pay their proportionate share of real estate taxes, operating costs and utility costs.
We believe that all of our properties are well maintained and do not require significant capital improvements. As of
December 31, 2017
, we managed all of our office properties through internal property managers.
Office Properties
The following table sets forth certain information relating to each of the stabilized office properties owned as of
December 31, 2017
.
|
Property Location
|
No. of
Buildings
|
Year Built/
Renovated
|
Rentable
Square Feet
|
Percentage
Occupied at
12/31/2017
(1)
|
Annualized
Base Rent
(in $000’s)
(2)
|
Annualized Rent Per Square Foot
(2)
|
||||||||||||
|
Los Angeles and Ventura Counties
|
||||||||||||||||||
|
23925 Park Sorrento,
Calabasas, California |
(3)
|
1
|
2001
|
11,873
|
|
100.0
|
%
|
$
|
467
|
|
$
|
39.30
|
|
|||||
|
23975 Park Sorrento,
Calabasas, California |
(3)
|
1
|
2002
|
104,797
|
|
83.1
|
%
|
3,150
|
|
37.32
|
|
|||||||
|
24025 Park Sorrento,
Calabasas, California |
(7)
|
1
|
2000
|
108,670
|
|
88.7
|
%
|
3,538
|
|
36.73
|
|
|||||||
|
2829 Townsgate Road,
Thousand Oaks, California |
(3)
|
1
|
1990
|
84,098
|
|
96.2
|
%
|
2,306
|
|
28.50
|
|
|||||||
|
2240 E. Imperial Highway,
El Segundo, California |
(4)
|
1
|
1983/ 2008
|
122,870
|
|
100.0
|
%
|
3,950
|
|
32.15
|
|
|||||||
|
2250 E. Imperial Highway,
El Segundo, California |
(8)
|
1
|
1983
|
298,728
|
|
100.0
|
%
|
9,810
|
|
32.98
|
|
|||||||
|
2260 E. Imperial Highway,
El Segundo, California |
(4)
|
1
|
1983/ 2012
|
298,728
|
|
100.0
|
%
|
10,510
|
|
35.18
|
|
|||||||
|
909 Sepulveda Blvd.,
El Segundo, California |
(9)
|
1
|
1972/ 2005
|
244,136
|
|
94.5
|
%
|
6,808
|
|
29.86
|
|
|||||||
|
999 Sepulveda Blvd.,
El Segundo, California |
(10)
|
1
|
1962/ 2003
|
128,588
|
|
89.2
|
%
|
3,461
|
|
31.60
|
|
|||||||
|
6115 W. Sunset Blvd.,
Los Angeles, California |
(11)
|
1
|
1938/ 2015
|
26,105
|
|
75.2
|
%
|
1,321
|
|
67.28
|
|
|||||||
|
6121 W. Sunset Blvd.,
Los Angeles, California |
(5)
|
1
|
1938/ 2015
|
91,173
|
|
100.0
|
%
|
4,293
|
|
47.09
|
|
|||||||
|
1525 N. Gower St.,
Los Angeles, California |
(4)
|
1
|
2016
|
9,610
|
|
100.0
|
%
|
652
|
|
67.88
|
|
|||||||
|
1575 N. Gower St.,
Los Angeles, California |
(12)
|
1
|
2016
|
251,245
|
|
100.0
|
%
|
16,169
|
|
64.36
|
|
|||||||
|
1500 N. El Centro Ave.,
Los Angeles, California |
(3)
|
1
|
2016
|
104,504
|
|
83.6
|
%
|
5,894
|
|
67.46
|
|
|||||||
|
6255 Sunset Blvd,
Los Angeles, California |
(13)
|
1
|
1971/ 1999
|
323,920
|
|
93.0
|
%
|
11,594
|
|
39.90
|
|
|||||||
|
3750 Kilroy Airport Way,
Long Beach, California |
(14)
|
1
|
1989
|
10,457
|
|
100.0
|
%
|
158
|
|
47.28
|
|
|||||||
|
3760 Kilroy Airport Way,
Long Beach, California |
(3)
|
1
|
1989
|
165,278
|
|
89.7
|
%
|
4,638
|
|
31.28
|
|
|||||||
|
3780 Kilroy Airport Way,
Long Beach, California |
(3)
|
1
|
1989
|
219,745
|
|
78.2
|
%
|
4,814
|
|
29.00
|
|
|||||||
|
3800 Kilroy Airport Way,
Long Beach, California |
(3)
|
1
|
2000
|
192,476
|
|
96.1
|
%
|
5,908
|
|
31.95
|
|
|||||||
|
3840 Kilroy Airport Way,
Long Beach, California |
(3)
|
1
|
1999
|
136,026
|
|
100.0
|
%
|
4,882
|
|
35.89
|
|
|||||||
35
|
Property Location
|
No. of
Buildings
|
Year Built/
Renovated
|
Rentable
Square Feet
|
Percentage
Occupied at
12/31/2017
(1)
|
Annualized
Base Rent
(in $000’s)
(2)
|
Annualized Rent Per Square Foot
(2)
|
||||||||||||
|
3880 Kilroy Airport Way,
Long Beach, California |
(15)
|
1
|
1987/ 2013
|
96,035
|
|
100.0
|
%
|
2,839
|
|
29.56
|
|
|||||||
|
3900 Kilroy Airport Way,
Long Beach, California |
(3)
|
1
|
1987
|
129,893
|
|
100.0
|
%
|
3,090
|
|
23.82
|
|
|||||||
|
8560 West Sunset Blvd, West Hollywood, California
|
(3)
|
1
|
1963/ 2007
|
71,875
|
|
94.1
|
%
|
4,820
|
|
71.26
|
|
|||||||
|
8570 West Sunset Blvd, West Hollywood, California
|
(16)
|
1
|
2002/ 2007
|
43,603
|
|
92.3
|
%
|
2,719
|
|
67.58
|
|
|||||||
|
8580 West Sunset Blvd, West Hollywood, California
|
(5)
|
1
|
2002/ 2007
|
7,126
|
|
100.0
|
%
|
—
|
|
—
|
|
|||||||
|
8590 West Sunset Blvd, West Hollywood, California
|
(5)
|
1
|
2002/ 2007
|
56,095
|
|
96.1
|
%
|
1,731
|
|
33.83
|
|
|||||||
|
12100 W. Olympic Blvd.,
Los Angeles, California |
(3)
|
1
|
2003
|
152,048
|
|
100.0
|
%
|
7,631
|
|
50.19
|
|
|||||||
|
12200 W. Olympic Blvd.,
Los Angeles, California |
(3)
|
1
|
2000
|
150,832
|
|
91.0
|
%
|
6,930
|
|
67.45
|
|
|||||||
|
12233 W. Olympic Blvd.,
Los Angeles, California |
(17)
|
1
|
1980/ 2011
|
151,029
|
|
93.5
|
%
|
3,125
|
|
35.53
|
|
|||||||
|
12312 W. Olympic Blvd.,
Los Angeles, California |
(6)
|
1
|
1950/ 1997
|
76,644
|
|
100.0
|
%
|
4,096
|
|
53.44
|
|
|||||||
|
1633 26th Street,
Santa Monica, California |
(18)
|
1
|
1972/ 1997
|
43,857
|
|
—
|
%
|
—
|
|
—
|
|
|||||||
|
2100/2110 Colorado Avenue,
Santa Monica, California |
(3)
|
3
|
1992/ 2009
|
102,864
|
|
100.0
|
%
|
4,357
|
|
42.36
|
|
|||||||
|
3130 Wilshire Blvd.,
Santa Monica, California |
(3)
|
1
|
1969/ 1998
|
90,002
|
|
88.5
|
%
|
2,999
|
|
37.66
|
|
|||||||
|
501 Santa Monica Blvd.,
Santa Monica, California |
(19)
|
1
|
1974
|
76,803
|
|
84.5
|
%
|
4,111
|
|
65.77
|
|
|||||||
|
Subtotal/Weighted Average –
Los Angeles and Ventura Counties |
36
|
4,181,733
|
|
93.3
|
%
|
$
|
152,771
|
|
$
|
40.47
|
|
|||||||
|
Orange County
|
||||||||||||||||||
|
2211 Michelson,
Irvine, California
|
(20)
|
1
|
2007
|
271,556
|
|
86.6
|
%
|
$
|
8,556
|
|
$
|
36.92
|
|
|||||
|
Subtotal/Weighted Average –
Orange County
|
1
|
271,556
|
|
86.6
|
%
|
$
|
8,556
|
|
$
|
36.92
|
|
|||||||
|
San Diego County
|
||||||||||||||||||
|
12225 El Camino Real,
Del Mar, California
|
(4)
|
1
|
1998
|
58,401
|
|
100.0
|
%
|
$
|
2,041
|
|
$
|
34.95
|
|
|||||
|
12235 El Camino Real,
Del Mar, California
|
(4)
|
1
|
1998
|
53,751
|
|
88.9
|
%
|
2,225
|
|
46.57
|
|
|||||||
|
12340 El Camino Real,
Del Mar, California
|
(21)
|
1
|
2002
|
88,377
|
|
85.3
|
%
|
3,363
|
|
44.59
|
|
|||||||
|
12390 El Camino Real,
Del Mar, California
|
(4)
|
1
|
2000
|
72,332
|
|
100.0
|
%
|
3,069
|
|
42.44
|
|
|||||||
|
12770 El Camino Real,
Del Mar, California
|
(3)
|
1
|
2016
|
73,032
|
|
83.6
|
%
|
3,236
|
|
52.99
|
|
|||||||
|
12348 High Bluff Drive,
Del Mar, California
|
(22)
|
1
|
1999
|
38,806
|
|
100.0
|
%
|
1,314
|
|
33.86
|
|
|||||||
|
12400 High Bluff Drive,
Del Mar, California
|
(4)
|
1
|
2004
|
209,220
|
|
100.0
|
%
|
10,671
|
|
51.00
|
|
|||||||
|
3579 Valley Centre Drive,
Del Mar, California
|
(4)
|
1
|
1999
|
52,418
|
|
100.0
|
%
|
2,053
|
|
39.16
|
|
|||||||
|
3611 Valley Centre Drive,
Del Mar, California
|
(23)
|
1
|
2000
|
129,656
|
|
100.0
|
%
|
5,518
|
|
42.56
|
|
|||||||
|
3661 Valley Centre Drive,
Del Mar, California
|
(24)
|
1
|
2001
|
128,364
|
|
95.8
|
%
|
4,148
|
|
39.12
|
|
|||||||
|
3721 Valley Centre Drive,
Del Mar, California
|
(25)
|
1
|
2003
|
115,193
|
|
100.0
|
%
|
5,310
|
|
46.09
|
|
|||||||
|
3811 Valley Centre Drive,
Del Mar, California
|
(6)
|
1
|
2000
|
112,067
|
|
100.0
|
%
|
5,199
|
|
46.39
|
|
|||||||
|
12780 El Camino Real,
Del Mar, California |
(6)
|
1
|
2013
|
140,591
|
|
100.0
|
%
|
6,883
|
|
48.96
|
|
|||||||
36
|
Property Location
|
No. of
Buildings
|
Year Built/
Renovated
|
Rentable
Square Feet
|
Percentage
Occupied at
12/31/2017
(1)
|
Annualized
Base Rent
(in $000’s)
(2)
|
Annualized Rent Per Square Foot
(2)
|
||||||||||||
|
12790 El Camino Real,
Del Mar, California |
(26)
|
1
|
2013
|
78,836
|
|
100.0
|
%
|
3,275
|
|
41.55
|
|
|||||||
|
13280 Evening Creek Drive South,
I-15 Corridor, California |
(3)
|
1
|
2008
|
41,196
|
|
100.0
|
%
|
1,065
|
|
25.85
|
|
|||||||
|
13290 Evening Creek Drive South,
I-15 Corridor, California |
(4)
|
1
|
2008
|
61,180
|
|
100.0
|
%
|
1,453
|
|
23.75
|
|
|||||||
|
13480 Evening Creek Drive North,
I-15 Corridor, California |
(4)
|
1
|
2008
|
149,817
|
|
100.0
|
%
|
7,779
|
|
51.92
|
|
|||||||
|
13500 Evening Creek Drive North,
I-15 Corridor, California |
(4)
|
1
|
2004
|
147,533
|
|
100.0
|
%
|
6,286
|
|
42.61
|
|
|||||||
|
13520 Evening Creek Drive North,
I-15 Corridor, California |
(27)
|
1
|
2004
|
141,129
|
|
90.4
|
%
|
4,509
|
|
36.16
|
|
|||||||
|
2305 Historic Decatur Road,
Point Loma, California
|
(28)
|
1
|
2009
|
103,900
|
|
100.0
|
%
|
3,694
|
|
35.55
|
|
|||||||
|
4690 Executive Drive,
UTC, California
|
(3)
|
1
|
1999
|
47,846
|
|
91.4
|
%
|
1,424
|
|
32.58
|
|
|||||||
|
Subtotal/Weighted Average –
San Diego County
|
21
|
2,043,645
|
|
97.4
|
%
|
$
|
84,515
|
|
$
|
42.90
|
|
|||||||
|
San Francisco
|
||||||||||||||||||
|
4100 Bohannon Drive,
Menlo Park, California
|
(5)
|
1
|
1985
|
47,379
|
|
100.0
|
%
|
$
|
1,719
|
|
$
|
36.27
|
|
|||||
|
4200 Bohannon Drive,
Menlo Park, California
|
(5)
|
1
|
1987
|
45,451
|
|
71.5
|
%
|
1,332
|
|
40.97
|
|
|||||||
|
4300 Bohannon Drive,
Menlo Park, California
|
(5)
|
1
|
1988
|
63,079
|
|
100.0
|
%
|
3,203
|
|
50.78
|
|
|||||||
|
4400 Bohannon Drive,
Menlo Park, California
|
(5)
|
1
|
1988
|
48,146
|
|
96.9
|
%
|
1,624
|
|
37.18
|
|
|||||||
|
4500 Bohannon Drive,
Menlo Park, California
|
(5)
|
1
|
1990
|
63,078
|
|
100.0
|
%
|
2,041
|
|
32.35
|
|
|||||||
|
4600 Bohannon Drive,
Menlo Park, California
|
(29)
|
1
|
1990
|
48,147
|
|
93.0
|
%
|
2,603
|
|
58.16
|
|
|||||||
|
4700 Bohannon Drive,
Menlo Park, California
|
(5)
|
1
|
1989
|
63,078
|
|
100.0
|
%
|
2,275
|
|
36.07
|
|
|||||||
|
1290-1300 Terra Bella Avenue,
Mountain View, California
|
(5)
|
1
|
1961
|
114,175
|
|
100.0
|
%
|
3,841
|
|
33.64
|
|
|||||||
|
331 Fairchild Drive,
Mountain View, California |
(6)
|
1
|
2013
|
87,147
|
|
100.0
|
%
|
4,185
|
|
48.03
|
|
|||||||
|
680 E. Middlefield Road,
Mountain View, California
|
(6)
|
1
|
2014
|
170,090
|
|
100.0
|
%
|
7,729
|
|
45.44
|
|
|||||||
|
690 E. Middlefield Road,
Mountain View, California
|
(6)
|
1
|
2014
|
170,823
|
|
100.0
|
%
|
7,763
|
|
45.44
|
|
|||||||
|
1701 Page Mill Road,
Palo Alto, California
|
(5)
|
1
|
2015
|
128,688
|
|
100.0
|
%
|
8,461
|
|
65.75
|
|
|||||||
|
3150 Porter Drive,
Palo Alto, California
|
(6)
|
1
|
1998
|
36,897
|
|
100.0
|
%
|
2,051
|
|
55.59
|
|
|||||||
|
900 Jefferson Avenue,
Redwood City, California |
(5)
|
1
|
2015
|
228,505
|
|
100.0
|
%
|
13,670
|
|
59.82
|
|
|||||||
|
900 Middlefield Road,
Redwood City, California |
(5)
|
1
|
2015
|
118,764
|
|
97.3
|
%
|
6,835
|
|
59.38
|
|
|||||||
|
303 Second Street,
San Francisco, California
|
(30)
|
1
|
1988
|
740,047
|
|
88.2
|
%
|
35,287
|
|
54.11
|
|
|||||||
|
100 First Street,
San Francisco, California
|
(31)
|
1
|
1988
|
467,095
|
|
95.4
|
%
|
23,560
|
|
55.28
|
|
|||||||
|
250 Brannan Street,
San Francisco, California
|
(4)
|
1
|
1907/ 2001
|
95,008
|
|
100.0
|
%
|
5,413
|
|
56.98
|
|
|||||||
|
201 Third Street,
San Francisco, California
|
(32)
|
1
|
1983
|
346,538
|
|
82.2
|
%
|
18,797
|
|
67.09
|
|
|||||||
|
301 Brannan Street,
San Francisco, California
|
(4)
|
1
|
1909/ 1989
|
74,430
|
|
100.0
|
%
|
5,675
|
|
76.24
|
|
|||||||
|
360 Third Street,
San Francisco, California
|
(33)
|
1
|
2013
|
429,796
|
|
100.0
|
%
|
22,635
|
|
52.78
|
|
|||||||
|
333 Brannan Street,
San Francisco, California
|
(34)
|
1
|
2016
|
185,602
|
|
100.0
|
%
|
15,023
|
|
80.94
|
|
|||||||
37
|
Property Location
|
No. of
Buildings
|
Year Built/
Renovated
|
Rentable
Square Feet
|
Percentage
Occupied at
12/31/2017
(1)
|
Annualized
Base Rent
(in $000’s)
(2)
|
Annualized Rent Per Square Foot
(2)
|
||||||||||||
|
350 Mission Street,
San Francisco, California
|
(5)
|
1
|
2016
|
455,340
|
|
98.1
|
%
|
23,449
|
|
52.78
|
|
|||||||
|
1310 Chesapeake Terrace,
Sunnyvale, California
|
(5)
|
1
|
1989
|
76,244
|
|
100.0
|
%
|
2,369
|
|
31.08
|
|
|||||||
|
1315 Chesapeake Terrace,
Sunnyvale, California
|
(5)
|
1
|
1989
|
55,635
|
|
100.0
|
%
|
1,424
|
|
25.60
|
|
|||||||
|
1320-1324 Chesapeake Terrace,
Sunnyvale, California
|
(5)
|
1
|
1989
|
79,720
|
|
100.0
|
%
|
2,421
|
|
30.36
|
|
|||||||
|
1325-1327 Chesapeake Terrace,
Sunnyvale, California
|
(5)
|
1
|
1989
|
55,383
|
|
100.0
|
%
|
1,234
|
|
22.29
|
|
|||||||
|
505 N. Mathilda Avenue,
Sunnyvale, California
|
(5)
|
1
|
2014
|
212,322
|
|
100.0
|
%
|
9,449
|
|
44.50
|
|
|||||||
|
555 N. Mathilda Avenue,
Sunnyvale, California
|
(5)
|
1
|
2014
|
212,322
|
|
100.0
|
%
|
9,449
|
|
44.50
|
|
|||||||
|
605 N. Mathilda Avenue,
Sunnyvale, California
|
(5)
|
1
|
2014
|
162,785
|
|
100.0
|
%
|
7,244
|
|
44.50
|
|
|||||||
|
599 N. Mathilda Avenue,
Sunnyvale, California
|
(5)
|
1
|
2000
|
75,810
|
|
100.0
|
%
|
2,205
|
|
29.04
|
|
|||||||
|
Subtotal/Weighted Average –
San Francisco
|
31
|
5,157,524
|
|
96.1
|
%
|
$
|
254,966
|
|
$
|
51.76
|
|
|||||||
|
Greater Seattle
|
||||||||||||||||||
|
601 108th Avenue NE,
Bellevue, Washington
|
(35)
|
1
|
2000
|
488,470
|
|
98.1
|
%
|
$
|
17,219
|
|
$
|
36.31
|
|
|||||
|
10900 NE 4th Street,
Bellevue, Washington
|
(36)
|
1
|
1983
|
416,755
|
|
95.6
|
%
|
14,112
|
|
35.57
|
|
|||||||
|
10210 NE Points Drive,
Kirkland, Washington
|
(5)
|
1
|
1988
|
84,641
|
|
100.0
|
%
|
2,146
|
|
25.36
|
|
|||||||
|
10220 NE Points Drive,
Kirkland, Washington
|
(5)
|
1
|
1987
|
49,851
|
|
93.3
|
%
|
1,264
|
|
27.46
|
|
|||||||
|
10230 NE Points Drive,
Kirkland, Washington
|
(5)
|
1
|
1990
|
98,982
|
|
93.6
|
%
|
2,548
|
|
28.98
|
|
|||||||
|
3933 Lake Washington Blvd NE,
Kirkland, Washington
|
(5)
|
1
|
1993
|
46,450
|
|
100.0
|
%
|
1,302
|
|
28.03
|
|
|||||||
|
837 N. 34th Street,
Lake Union, Washington
|
(5)
|
1
|
2008
|
111,580
|
|
76.2
|
%
|
2,748
|
|
32.34
|
|
|||||||
|
701 N. 34th Street,
Lake Union, Washington
|
(5)
|
1
|
1998
|
138,994
|
|
77.9
|
%
|
4,098
|
|
37.84
|
|
|||||||
|
801 N. 34th Street,
Lake Union, Washington
|
(6)
|
1
|
1998
|
169,412
|
|
100.0
|
%
|
4,423
|
|
26.11
|
|
|||||||
|
320 Westlake Avenue North,
Lake Union, Washington
|
(5)
|
1
|
2007
|
184,644
|
|
100.0
|
%
|
6,821
|
|
36.94
|
|
|||||||
|
321 Terry Avenue North,
Lake Union, Washington
|
(5)
|
1
|
2013
|
135,755
|
|
100.0
|
%
|
5,648
|
|
41.61
|
|
|||||||
|
401 Terry Avenue North,
Lake Union, Washington
|
(6)
|
1
|
2003
|
140,605
|
|
100.0
|
%
|
6,207
|
|
44.15
|
|
|||||||
|
Subtotal/Weighted Average –
Greater Seattle
|
12
|
2,066,139
|
|
95.4
|
%
|
$
|
68,536
|
|
$
|
34.97
|
|
|||||||
|
TOTAL/WEIGHTED AVERAGE
|
101
|
13,720,597
|
|
95.2
|
%
|
$
|
569,344
|
|
$
|
44.27
|
|
|||||||
_________________
|
(1)
|
Based on all leases at the respective properties in effect as of
December 31, 2017
. Includes month-to-month leases as of
December 31, 2017
.
|
|
(2)
|
Annualized base rental revenue includes the impact of straight-lining rent escalations and the amortization of free rent periods and excludes the impact of the following: amortization of deferred revenue related tenant-funded tenant improvements, amortization of above/below market rents, amortization for lease incentives due under existing leases and expense reimbursement revenue. Excludes month-to-month leases and vacant space as of
December 31, 2017
. Includes 100% of annualized base rent of consolidated property partnerships.
|
|
(3)
|
For these properties, the leases are written on a full service gross basis.
|
|
(4)
|
For these properties, the leases are written on a modified gross basis.
|
|
(5)
|
For these properties, the leases are written on a triple net basis.
|
|
(6)
|
For these properties, the leases are written on a modified net basis.
|
|
(7)
|
For this property, leases of approximately 92,000 rentable square feet are written on a full service gross basis and approximately 4,000 rentable square feet are written on a modified gross basis.
|
|
(8)
|
For this property, leases of approximately 264,000 rentable square feet are written on a modified gross basis and approximately 35,000 rentable square feet are written on a full service gross basis.
|
38
|
(9)
|
For this property, leases of approximately 226,000 rentable square feet are written on a full service gross basis and approximately 5,000 rentable square feet are written on a triple net basis.
|
|
(10)
|
For this property, leases of approximately 106,000 rentable square feet are written on a full service gross basis and approximately 9,000 rentable square feet are written on a gross basis.
|
|
(11)
|
For this property, leases of approximately 14,000 rentable square feet are written on a triple net basis and approximately 6,000 rentable square feet are written on a gross basis.
|
|
(12)
|
For this property, leases of approximately 236,000 rentable square feet are written on a modified gross basis and approximately 15,000 rentable square feet are written on a full service gross basis.
|
|
(13)
|
For this property, leases of approximately 280,000 rentable square feet are written on a full service gross basis, approximately 16,000 rentable square feet are written on a triple net basis and approximately 5,000 rentable square feet are written on a modified gross basis.
|
|
(14)
|
For this property, leases of approximately 7,000 rentable square feet are written on a modified gross basis and approximately 3,000 rentable square feet are written on a full service gross basis.
|
|
(15)
|
For this property, leases of approximately 50,000 rentable square feet are written on a full service gross basis and approximately 46,000 rentable square feet are written on a modified net basis.
|
|
(16)
|
For this property, leases of approximately 32,000 rentable square feet are written on a full service gross basis and approximately 8,000 rentable square feet are written on a triple net basis.
|
|
(17)
|
For this property, leases of approximately 107,000 rentable square feet are written on a modified gross basis, approximately 25,000 rentable square feet are written on a gross basis and approximately 9,000 rentable square feet are written on a full service gross basis.
|
|
(18)
|
This property is vacant.
|
|
(19)
|
For this property, leases of approximately 61,000 rentable square feet are written on a full service gross basis, and approximately 4,000 rentable square feet are written on a triple net basis.
|
|
(20)
|
For this property, leases of approximately 227,000 rentable square feet are written on a full service gross basis and approximately 8,000 rentable square feet are written on a modified gross basis.
|
|
(21)
|
For this property, leases of approximately 72,000 rentable square feet are written on a modified gross basis and approximately 3,000 rentable square feet are written on a full service gross basis.
|
|
(22)
|
For this property, leases of approximately 36,000 rentable square feet are written on a full service gross basis and approximately 3,000 rentable square feet are written on a modified gross basis.
|
|
(23)
|
For this property, leases of approximately 125,000 rentable square feet are written on a modified gross basis and approximately 5,000 rentable square feet are written on a full service gross basis.
|
|
(24)
|
For this property, leases of approximately 80,000 rentable square feet are written on a modified gross basis, approximately 26,000 rentable square feet are written on a full service gross basis and approximately 17,000 rentable square feet are written on a gross basis.
|
|
(25)
|
For this property, leases of approximately 91,000 rentable square feet are written on a modified gross basis and approximately 24,000 rentable square feet are written on a full service gross basis.
|
|
(26)
|
For this property, leases of approximately 77,000 rentable square feet are written on a modified gross basis and approximately 2,000 rentable square feet are written on a full service gross basis.
|
|
(27)
|
For this property, leases of approximately 108,000 rentable square feet are written on a modified gross basis and approximately 20,000 rentable square feet are written on a full service gross basis.
|
|
(28)
|
For this property, leases of approximately 79,000 rentable square feet are written on a full service gross basis, approximately 22,000 rentable square feet are written on a gross basis and approximately 3,000 rentable square feet are written on a modified gross basis.
|
|
(29)
|
For this property, leases of approximately 25,000 rentable square feet are written on a triple net basis and approximately 20,000 rentable square feet are written on a gross basis.
|
|
(30)
|
For this property, leases of approximately 305,000 rentable square feet are written on a modified gross basis, approximately 286,000 rentable square feet are written on a full service gross basis, approximately 38,000 rentable square feet are written on a gross basis and approximately 24,000 rentable square feet are written on a triple net basis.
|
|
(31)
|
For this property, leases of approximately 353,000 rentable square feet are written on a full service gross basis, approximately 84,000 rentable square feet are written on a gross basis and approximately 8,000 rentable square feet are written on a triple net basis.
|
|
(32)
|
For this property, leases of approximately 254,000 rentable square feet are written on a full service gross basis, approximately 19,000 rentable square feet are written on a modified gross basis, approximately 11,000 rentable square feet are written on a triple net basis and approximately 1,000 rentable square feet are written on a gross basis.
|
|
(33)
|
For this property, leases of approximately 370,000 rentable square feet are written on a modified gross basis, approximately 57,000 rentable square feet are written on a full service gross basis and approximately 3,000 rentable square feet are written on a triple net basis.
|
|
(34)
|
For this property, leases of approximately 182,000 rentable square feet are written on a modified gross basis and approximately 4,000 rentable square feet are written on a triple net basis.
|
|
(35)
|
For this property, leases of approximately 472,000 rentable square feet are written on a triple net basis and approximately 7,000 rentable square feet are written on a modified gross basis.
|
|
(36)
|
For this property, leases of approximately 378,000 rentable square feet are written on a full service gross basis and approximately 20,000 rentable square feet are written on a triple net basis.
|
39
Completed Development Projects
During the year ended
December 31, 2017
, we added the following office development project to our stabilized portfolio of operating properties:
|
Construction Period
|
||||||||||||
|
Stabilized Office Projects
|
Start Date
|
Completion Date
|
Stabilization Date
|
Rentable Square Feet
|
Office % Leased
(1)
|
|||||||
|
Columbia Square Phase 2 - Office
Hollywood, California
|
3Q 2013
|
1Q 2016
|
1Q 2017
|
365,359
|
|
100.0
|
%
|
|||||
_______________________
|
(1)
|
This project was
95.3%
occupied at
December 31, 2017
.
|
In-Process, Near-Term and Future Development Pipeline
The following table sets forth certain information relating to our in-process development pipeline as of
December 31, 2017
.
|
Estimated Construction Period
|
Estimated Stabilization Date
(1)
|
Estimated Rentable Square Feet
|
Office % Leased
|
||||||||||
|
In-Process Development Projects
|
Location
|
Start Date
|
Completion Date
|
||||||||||
|
UNDER CONSTRUCTION:
|
|||||||||||||
|
Office
|
|||||||||||||
|
333 Dexter
|
South Lake Union
|
2Q 2017
|
3Q 2019
|
3Q 2020
|
650,000
|
|
—%
|
||||||
|
The Exchange on 16th
(2)
|
San Francisco
|
2Q 2015
|
2Q 2018
|
2Q 2019
|
750,000
|
|
100%
|
||||||
|
100 Hooper
(3)
|
San Francisco
|
4Q 2016
|
1Q 2018
|
1Q 2019
|
400,000
|
|
100%
|
||||||
|
SUBTOTAL:
|
1,800,000
|
|
62%
|
||||||||||
|
Mixed-Use
|
|||||||||||||
|
One Paseo - Phase I (Retail and Residential)
(4)
|
Del Mar
|
4Q 2016
|
3Q 2018 -
1Q 2019 |
1Q 2019 -
3Q 2019 |
96,000 Retail
237 Resi Units |
|
N/A
|
||||||
_______________________
|
(1)
|
Represents the earlier of the anticipated stabilization date or one year from building shell substantial completion.
|
|
(2)
|
During the year ended December 31, 2017, the Company signed a 15-year lease for 100% of the office space with Dropbox, Inc. The lease with Dropbox, Inc. will commence in phases beginning in the fourth quarter of 2018 through the fourth quarter of 2019. Estimated stabilization date represents one year from building shell completion.
|
|
(3)
|
This project is comprised of approximately
314,000
square feet of office and
86,000
square feet of Production, Distribution, and Repair (“PDR”) space. During the year ended December 31, 2017, the Company entered into a long term lease with Adobe for the entire
314,000
square feet of office space. The Company is developing an adjacent
59,000
square foot building located at 150 Hooper with a total estimated investment of approximately
$22.0 million
.
|
|
(4)
|
Development for this project will occur in phases. Phase I includes the project’s overall infrastructure and site work,
237
residential units and approximately
96,000
square feet of retail space.
|
40
The following table sets forth certain information relating to our near-term and future development pipeline as of
December 31, 2017
.
|
Location
|
Approx. Developable Square Feet
|
||||
|
NEAR-TERM DEVELOPMENT PIPELINE
:
(1)
|
|||||
|
Academy & Vine
|
Hollywood
|
545,000
|
|
||
|
2136-2174 Kettner Blvd.
(2)
|
Little Italy
|
175,000
|
|
||
|
One Paseo - Phases II and III (Office)
(3)
|
Del Mar
|
640,000
|
|
||
|
TOTAL:
|
1,360,000
|
|
|||
|
FUTURE DEVELOPMENT PIPELINE
:
|
|||||
|
Flower Mart
|
San Francisco
|
TBD
|
|
||
|
9455 Towne Centre Drive
|
San Diego
|
150,000
|
|
||
|
Santa Fe Summit – Phases II and III
|
56 Corridor
|
600,000
|
|
||
_______________________
|
(1)
|
Project timing, costs, developable square feet and scope could change materially from estimated data provided due to one or more of the following: any significant changes in the economy, market conditions, our markets, tenant requirements and demands, construction costs, new office supply, regulatory and entitlement processes or project design.
|
|
(2)
|
The Company acquired this development site located in the Little Italy submarket of San Diego during the fourth quarter of 2017.
|
|
(3)
|
Development for this project will occur in phases. Phases II and III, comprised of residential and office will commence subject to market conditions and economic factors.
|
Significant Tenants
The following table sets forth information about our 15 largest tenants based upon annualized base rental revenues, as defined below, as of
December 31, 2017
.
|
Tenant Name
|
Annualized Base Rental Revenue
(1)(2)
|
Percentage of Total Annualized Base Rental Revenue
(1)
|
Lease Expiration Date
|
|||||
|
(in thousands)
|
||||||||
|
LinkedIn Corporation
|
$
|
28,344
|
|
5.0%
|
Various
(3)
|
|||
|
salesforce.com, inc.
|
23,836
|
|
4.2%
|
Various
(4)
|
||||
|
DIRECTV, LLC
|
23,152
|
|
4.1%
|
September 2027
|
||||
|
Box, Inc.
|
22,441
|
|
3.9%
|
Various
(5)
|
||||
|
Dropbox, Inc.
|
20,502
|
|
3.6%
|
Various
(6)
|
||||
|
Synopsys, Inc.
|
15,492
|
|
2.7%
|
August 2030
|
||||
|
Bridgepoint Education, Inc.
|
14,064
|
|
2.5%
|
Various
(7)
|
||||
|
Viacom International, Inc.
|
13,718
|
|
2.4%
|
December 2028
|
||||
|
Riot Games, Inc.
|
12,828
|
|
2.3%
|
Various
(8)
|
||||
|
Concur Technologies
|
10,643
|
|
1.9%
|
Various
(9)
|
||||
|
Delta Dental of California
|
10,313
|
|
1.8%
|
May 2018
|
||||
|
Capital One, N.A.
|
9,170
|
|
1.6%
|
September 2024
|
||||
|
AMN Healthcare, Inc.
|
9,001
|
|
1.6%
|
July 2027
|
||||
|
Biotech/Healthcare Industry Tenant
|
8,461
|
|
1.5%
|
September 2029
|
||||
|
Neurocrine Biosciences, Inc.
|
6,883
|
|
1.2%
|
December 2029
|
||||
|
Total
|
$
|
228,848
|
|
40.3%
|
||||
_______________________________________
|
(1)
|
Annualized base rental revenue includes the impact of straight-lining rent escalations and the amortization of free rent periods and excludes the impact of the following: amortization of deferred revenue related tenant-funded tenant improvements, amortization of above/below market rents, amortization for lease incentives due under existing leases, and expense reimbursement revenue. Excludes month-to-month leases and vacant space as of
December 31, 2017
.
|
|
(2)
|
Includes 100% of the annualized base rental revenues of consolidated property partnerships.
|
|
(3)
|
The LinkedIn Corporation leases, which contribute $2.2 million and $26.1 million, expire in July 2019 and September 2026, respectively.
|
|
(4)
|
The salesforce.com, inc. leases, which contribute $0.4 million, $12.9 million, $5.7 million and $4.9 million, will expire in August 2018, March 2029, December 2030 and September 2032, respectively.
|
|
(5)
|
The Box, Inc. leases, which contribute $2.0 million and $20.4 million, expire in August 2021 and June 2028, respectively.
|
|
(6)
|
The Dropbox, Inc. leases, which contribute $5.7 million and $14.8 million, expire in September 2019 and August 2027, respectively.
|
|
(7)
|
The Bridgepoint Education Inc. leases, which contribute $6.3 million and $7.8 million, expire in July 2018 and September 2018, respectively.
|
41
|
(8)
|
The Riot Games, Inc. leases, which contribute $5.6 million, $2.1 million, and $5.1 million, expire in September 2020, November 2020, and November 2024, respectively.
|
|
(9)
|
The Concur Technologies leases, which contribute $1.8 million and $8.9 million, expire in April 2025 and December 2025, respectively.
|
The following pie chart sets forth the composition of our tenant base by industry and as a percentage of our annualized base rental revenue based on the North American Industry Classification System as of
December 31, 2017
.
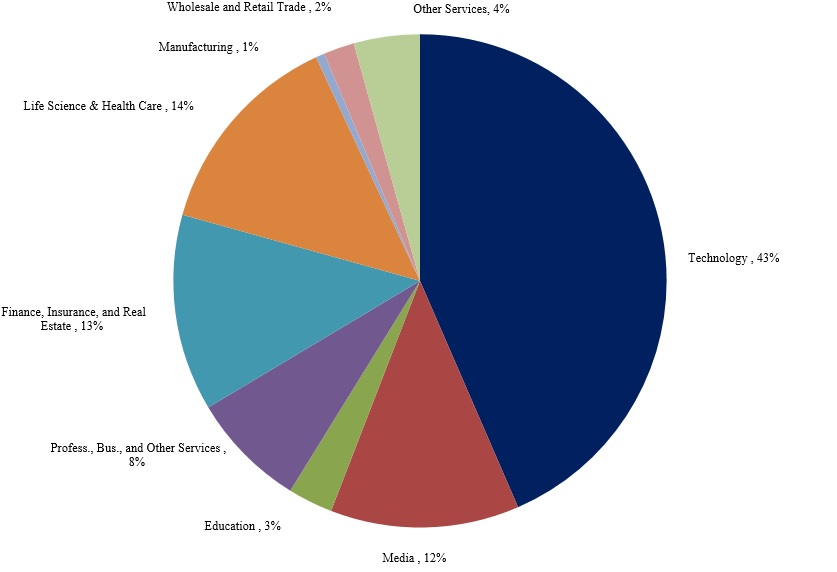
42
Lease Expirations
The following table sets forth a summary of our office lease expirations for each of the next ten years beginning with
2018
, assuming that none of the tenants exercise renewal options or termination rights. See further discussion of our lease expirations under “Item 1A. Risk Factors” and “Item 7. Management’s Discussion and Analysis of Financial Condition and Results of Operations —Factors that May Influence Future Results of Operations”.
Lease Expirations
|
Year of Lease Expiration
|
# of Expiring Leases
|
Total Square Feet
|
% of Total Leased Square Feet
|
Annualized Base
Rent (000’s)
(1) (2)
|
% of Total Annualized
Base Rent
(1)
|
Annualized Rent per Square Foot
(1)
|
|||||||||||||
|
2018
|
71
|
|
1,156,410
|
|
9.0
|
%
|
$
|
48,736
|
|
8.6
|
%
|
$
|
42.14
|
|
|||||
|
2019
|
101
|
|
1,527,185
|
|
11.9
|
%
|
59,046
|
|
10.4
|
%
|
38.66
|
|
|||||||
|
2020
|
108
|
|
1,865,026
|
|
14.5
|
%
|
72,896
|
|
12.8
|
%
|
39.09
|
|
|||||||
|
2021
|
88
|
|
1,031,097
|
|
8.0
|
%
|
45,156
|
|
7.9
|
%
|
43.79
|
|
|||||||
|
2022
|
57
|
|
576,364
|
|
4.5
|
%
|
23,636
|
|
4.1
|
%
|
41.01
|
|
|||||||
|
2023
|
57
|
|
1,074,566
|
|
8.4
|
%
|
53,820
|
|
9.5
|
%
|
50.09
|
|
|||||||
|
2024
|
31
|
|
844,477
|
|
6.6
|
%
|
37,200
|
|
6.5
|
%
|
44.05
|
|
|||||||
|
2025
|
19
|
|
297,164
|
|
2.3
|
%
|
13,013
|
|
2.3
|
%
|
43.79
|
|
|||||||
|
2026
|
19
|
|
1,239,822
|
|
9.7
|
%
|
48,977
|
|
8.6
|
%
|
39.50
|
|
|||||||
|
2027
|
16
|
|
1,198,566
|
|
9.3
|
%
|
56,932
|
|
10.0
|
%
|
47.50
|
|
|||||||
|
2028 and beyond
|
24
|
|
2,010,725
|
|
15.8
|
%
|
109,932
|
|
19.3
|
%
|
54.67
|
|
|||||||
|
Total
(3)
|
591
|
|
12,821,402
|
|
100.0
|
%
|
$
|
569,344
|
|
100.0
|
%
|
$
|
44.41
|
|
|||||
_______________________
|
(1)
|
Annualized base rent includes the impact of straight-lining rent escalations and the amortization of free rent periods and excludes the impact of the following: amortization of deferred revenue related tenant-funded tenant improvements, amortization of above/below market rents, amortization for lease incentives due under existing leases and expense reimbursement revenue. Additionally, the underlying leases contain various expense structures including full service gross, modified gross and triple net. Amounts represent percentage of total portfolio annualized contractual base rental revenue.
|
|
(2)
|
Includes 100% of annualized based rent of consolidated property partnerships.
|
|
(3)
|
For leases that have been renewed early with existing tenants, the expiration date and annualized base rent information presented takes into consideration the renewed lease terms. Excludes leases not commenced as of
December 31, 2017
, space leased under month-to-month leases, storage leases, vacant space and future lease renewal options not executed as of
December 31, 2017
.
|
As of
December 31, 2017
, the Operating Partnership had three outstanding mortgage notes payable which were secured by certain of our properties. Our secured debt represents an aggregate indebtedness of approximately
$339.4 million
.
See additional information regarding our secured debt in “Item 7. Management’s Discussion and Analysis of Financial Condition and Results of Operations—Liquidity and Capital Resources—Liquidity Sources,” Notes 8 and 9 to our consolidated financial statements and Schedule III—Real Estate and Accumulated Depreciation included with this report. Management believes that, as of
December 31, 2017
, the value of the properties securing the applicable secured obligations in each case exceeded the principal amount of the outstanding obligation.
|
ITEM 3.
|
LEGAL PROCEEDINGS
|
We and our properties are subject to routine litigation incidental to our business. These matters are generally covered by insurance. As of
December 31, 2017
, we are not a defendant in, and our properties are not subject to, any legal proceedings that we believe, if determined adversely to us, would have a material adverse effect upon our financial condition, results of operations, or cash flows.
|
ITEM 4.
|
MINE SAFETY DISCLOSURES
|
None.
43
|
ITEM 5.
|
MARKET FOR KILROY REALTY CORPORATION’S COMMON EQUITY, RELATED STOCKHOLDER MATTERS AND ISSUER PURCHASES OF EQUITY SECURITIES
|
The Company’s common stock is traded on the New York Stock Exchange (“NYSE”) under the symbol “KRC.” As of the date this report was filed, there were approximately 85 registered holders of the Company’s common stock. The following table illustrates high, low, and closing prices by quarter, as well as dividends declared, during
2017
and
2016
as reported on the NYSE.
|
2017
|
High
|
Low
|
Close
|
Per Share Common
Stock Dividends
Declared
|
|||||||||||
|
First quarter
|
$
|
77.91
|
|
$
|
70.84
|
|
$
|
72.08
|
|
$
|
0.3750
|
|
|||
|
Second quarter
|
77.09
|
|
70.06
|
|
75.15
|
|
0.4250
|
|
|||||||
|
Third quarter
|
75.69
|
|
67.47
|
|
71.12
|
|
0.4250
|
|
|||||||
|
Fourth quarter
|
76.18
|
|
70.17
|
|
74.65
|
|
0.4250
|
|
|||||||
|
2016
|
High
|
Low
|
Close
|
Per Share Common
Stock Dividends
Declared
|
|||||||||||
|
First quarter
|
$
|
62.94
|
|
$
|
47.38
|
|
$
|
61.87
|
|
$
|
0.3500
|
|
|||
|
Second quarter
|
66.29
|
|
59.89
|
|
66.29
|
|
0.3750
|
|
|||||||
|
Third quarter
|
73.73
|
|
66.06
|
|
69.35
|
|
0.3750
|
|
|||||||
|
Fourth quarter
(1)
|
76.88
|
|
66.73
|
|
73.22
|
|
2.2750
|
|
|||||||
_______________
|
(1)
|
Includes a special cash dividend of $1.90 per share of common stock that was paid on January 13, 2017.
|
The Company pays distributions to common stockholders quarterly each January, April, July and October, at the discretion of the board of directors. Distribution amounts depend on our FFO, financial condition, capital requirements, the annual distribution requirements under the REIT provisions of the Code and such other factors as the board of directors deems relevant.
The Company did not make any purchases of equity securities during the three month period leading up to
December 31, 2017
.
44
MARKET FOR KILROY REALTY, L.P.’S COMMON EQUITY, RELATED STOCKHOLDER MATTERS AND ISSUER PURCHASES OF EQUITY SECURITIES
There is no established public trading market for the Operating Partnership’s common units. As of the date this report was filed, there were 22 holders of record of common units (including through the Company’s general partnership interest).
The following table reports the distributions per common unit declared during the years ended
December 31, 2017
and
2016
.
|
2017
|
Per Unit Common
Unit Distribution
Declared
|
|
||
|
First quarter
|
$
|
0.3750
|
|
|
|
Second quarter
|
0.4250
|
|
||
|
Third quarter
|
0.4250
|
|
||
|
Fourth quarter
|
0.4250
|
|
||
|
2016
|
Per Unit Common
Unit Distribution
Declared
|
|
||
|
First quarter
|
$
|
0.3500
|
|
|
|
Second quarter
|
0.3750
|
|
||
|
Third quarter
|
0.3750
|
|
||
|
Fourth quarter
(1)
|
2.2750
|
|
||
_______________
|
(1)
|
Includes a special cash distribution of $1.90 per common unit that was paid on January 13, 2017.
|
During
2017
and
2016
, the Operating Partnership redeemed
304,350
and
250,933
common units, respectively, for the same number of shares of the Company’s common stock.
On March 11, 2016, the Operating Partnership issued 867,701 common units to an unrelated third party in connection with the Operating Partnership’s acquisition of the 610-620 Brannan St. project, a development opportunity in the SOMA submarket of San Francisco, California. Each common unit was valued at $55.36, which was based on a trailing ten-day average of the closing quoted price per share of the Company’s common stock, par value $.01 per share, as reported on the New York Stock Exchange, as calculated in accordance with the Partnership Agreement. Subject to certain limitations, the common units are redeemable for cash or, at the Company’s option, exchangeable for shares of the Company’s common stock beginning 12 months after the initial issuance of the common units. This issuance of the common units described above was exempt from registration under the Securities Act of 1933, as amended (the “Securities Act”), in reliance on Section 4(a)(2) of the Securities Act, as transactions by an issuer not involving a public offering.
45
PERFORMANCE GRAPH
The following line graph compares the change in cumulative stockholder return on shares of the Company’s common stock to the cumulative total return of the NAREIT All Equity REIT Index, the Standard & Poor’s 500 Stock Index, and the SNL REIT Office Index for the five-year period ended
December 31, 2017
. We include an additional index, the SNL REIT Office Index, to the performance graph since management believes it provides additional information to investors about our performance relative to a more specific peer group. The SNL REIT Office Index is a published and widely recognized index that comprises 26 office equity REITs, including us. The graph assumes the investment of $100 in us and each of the indices on December 31, 2012 and, as required by the SEC, the reinvestment of all distributions. The return shown on the graph is not necessarily indicative of future performance.
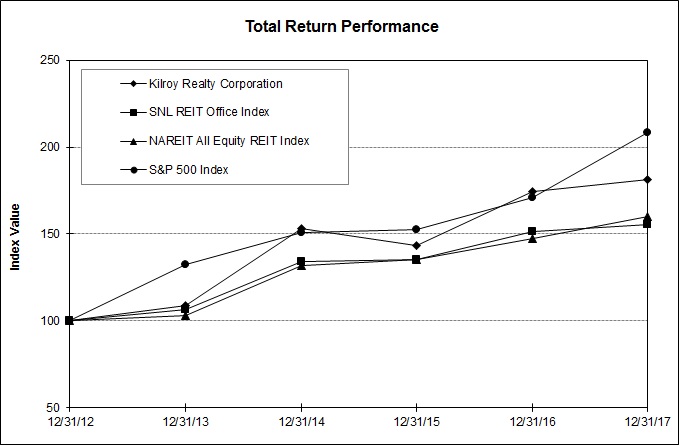
46
|
ITEM 6.
|
SELECTED FINANCIAL DATA – KILROY REALTY CORPORATION
|
The following tables set forth selected consolidated financial and operating data on an historical basis for the Company. The following data should be read in conjunction with our financial statements and notes thereto and “Item 7. Management’s Discussion and Analysis of Financial Condition and Results of Operations” included in this report.
The consolidated balance sheet data as of
December 31, 2017
,
2016
and
2015
, the consolidated statement of operations data for all periods presented, and the consolidated statement of cash flows data for the years ended
December 31, 2017
,
2016
and
2015
have been derived from the historical consolidated financial statements of Kilroy Realty Corporation audited by an independent registered public accounting firm. The consolidated balance sheet data as of December 31,
2014
and
2013
and the consolidated statement of cash flows data for the years ended December 31,
2014
and
2013
have been derived from the historical consolidated financial statements of Kilroy Realty Corporation and adjusted for the impact of subsequent accounting changes requiring retrospective application, if any.
Kilroy Realty Corporation Consolidated
(in thousands, except share, per share, square footage and occupancy data)
|
Year Ended December 31,
|
|||||||||||||||||||
|
2017
|
2016
|
2015
|
2014
|
2013
|
|||||||||||||||
|
Statements of Operations Data:
|
|||||||||||||||||||
|
Total revenues from continuing operations
|
$
|
719,001
|
|
$
|
642,572
|
|
$
|
581,275
|
|
$
|
521,725
|
|
$
|
457,111
|
|
||||
|
Income from continuing operations
|
180,615
|
|
303,798
|
|
238,604
|
|
59,313
|
|
14,935
|
|
|||||||||
|
Income from discontinued operations
(1)
|
—
|
|
—
|
|
—
|
|
124,495
|
|
29,630
|
|
|||||||||
|
Net income available to common stockholders
|
151,249
|
|
280,538
|
|
220,831
|
|
166,969
|
|
30,630
|
|
|||||||||
|
Per Share Data:
|
|||||||||||||||||||
|
Weighted average shares of common stock outstanding – basic
|
98,113,561
|
|
92,342,483
|
|
89,854,096
|
|
83,090,235
|
|
77,343,853
|
|
|||||||||
|
Weighted average shares of common stock outstanding – diluted
|
98,727,331
|
|
93,023,034
|
|
90,395,775
|
|
84,967,720
|
|
77,343,853
|
|
|||||||||
|
Income from continuing operations available to common stockholders per share of common stock – basic
|
$
|
1.52
|
|
$
|
3.00
|
|
$
|
2.44
|
|
$
|
0.52
|
|
$
|
0.00
|
|
||||
|
Income from continuing operations available to common stockholders per share of common stock – diluted
|
$
|
1.51
|
|
$
|
2.97
|
|
$
|
2.42
|
|
$
|
0.51
|
|
$
|
0.00
|
|
||||
|
Net income available to common stockholders per share – basic
|
$
|
1.52
|
|
$
|
3.00
|
|
$
|
2.44
|
|
$
|
1.99
|
|
$
|
0.37
|
|
||||
|
Net income available to common stockholders per share – diluted
|
$
|
1.51
|
|
$
|
2.97
|
|
$
|
2.42
|
|
$
|
1.95
|
|
$
|
0.37
|
|
||||
|
Dividends declared per share
(2)
|
$
|
1.650
|
|
$
|
3.375
|
|
$
|
1.400
|
|
$
|
1.400
|
|
$
|
1.400
|
|
||||
________________________
|
(1)
|
The Company adopted Financial Accounting Standards Board (“FASB”) Accounting Standards Update (“ASU”) No. 2014-08 effective January 1, 2015 (see Note 2 “Basis of Presentation and Significant Accounting Policies” to our consolidated financial statements included in this report for additional information). As a result, results of operations for properties classified as held for sale and/or disposed of subsequent to January 1, 2015 are presented in continuing operations. Prior to January 1, 2015, properties classified as held for sale and/or disposed of are presented in discontinued operations.
|
|
(2)
|
Dividends declared for the year ended December 31, 2016 includes a special dividend of $1.90 per share of common stock that was paid on January 13, 2017.
|
47
|
December 31,
|
|||||||||||||||||||
|
2017
|
2016
|
2015
|
2014
|
2013
|
|||||||||||||||
|
Balance Sheet Data:
|
|||||||||||||||||||
|
Total real estate held for investment, before accumulated depreciation and amortization
|
$
|
7,417,777
|
|
$
|
7,060,754
|
|
$
|
6,328,146
|
|
$
|
6,057,932
|
|
$
|
5,264,947
|
|
||||
|
Total assets
(1)
|
6,802,838
|
|
6,706,633
|
|
5,926,430
|
|
5,621,262
|
|
5,099,417
|
|
|||||||||
|
Total debt
(1)
|
2,347,063
|
|
2,320,123
|
|
2,225,469
|
|
2,456,939
|
|
2,193,327
|
|
|||||||||
|
Total preferred stock
|
—
|
|
192,411
|
|
192,411
|
|
192,411
|
|
192,411
|
|
|||||||||
|
Total noncontrolling interests
(2)
|
259,523
|
|
216,322
|
|
63,620
|
|
57,726
|
|
54,848
|
|
|||||||||
|
Total equity
(2)
|
3,960,316
|
|
3,759,317
|
|
3,234,586
|
|
2,723,936
|
|
2,516,160
|
|
|||||||||
|
Other Data:
|
|||||||||||||||||||
|
Funds From Operations
(3) (4)
|
$
|
346,787
|
|
$
|
333,742
|
|
$
|
316,612
|
|
$
|
250,744
|
|
$
|
218,621
|
|
||||
|
Cash flows provided by (used in):
|
|||||||||||||||||||
|
Operating activities
|
$
|
347,012
|
|
$
|
345,054
|
|
$
|
272,008
|
|
$
|
245,253
|
|
$
|
240,576
|
|
||||
|
Investing activities
(5)
|
(359,102
|
)
|
(579,420
|
)
|
(337,241
|
)
|
(476,031
|
)
|
(704,284
|
)
|
|||||||||
|
Financing activities
|
(171,241
|
)
|
427,291
|
|
23,471
|
|
244,587
|
|
284,621
|
|
|||||||||
|
Office Property Data:
|
|||||||||||||||||||
|
Rentable square footage
|
13,720,597
|
|
14,025,856
|
|
13,032,406
|
|
14,096,617
|
|
12,736,099
|
|
|||||||||
|
Occupancy
|
95.2
|
%
|
96.0
|
%
|
94.8
|
%
|
94.4
|
%
|
93.4
|
%
|
|||||||||
|
Residential Property Data:
|
|||||||||||||||||||
|
Number of units
|
200
|
|
200
|
|
N/A
|
|
N/A
|
|
N/A
|
|
|||||||||
|
Average occupancy
(6)
|
70.2
|
%
|
46.0
|
%
|
N/A
|
|
N/A
|
|
N/A
|
|
|||||||||
_______________________
|
(1)
|
On January 1, 2016, the Company adopted FASB ASU No. 2015-03 and 2015-15 which require deferred financing costs, except costs paid for the unsecured line of credit, to be reclassified as a reduction to the debt liability balance instead of being reported as an asset as historically presented. As a result, total assets and total debt have been adjusted from prior amounts reported to reflect this change for all periods presented.
|
|
(2)
|
Includes the noncontrolling interests of the common units of the Operating Partnership and consolidated property partnerships (see Note 2 “Basis of Presentation and Significant Accounting Policies” to our consolidated financial statements included in this report for additional information).
|
|
(3)
|
We calculate FFO in accordance with the White Paper on FFO approved by the Board of Governors of NAREIT. The White Paper defines FFO as net income or loss calculated in accordance with GAAP, excluding extraordinary items, as defined by GAAP, gains and losses from sales of depreciable real estate and impairment write-downs associated with depreciable real estate, plus real estate-related depreciation and amortization (excluding amortization of deferred financing costs and depreciation of non-real estate assets) and after adjustment for unconsolidated partnerships and joint ventures. Our calculation of FFO includes the amortization of deferred revenue related to tenant-funded tenant improvements and excludes the depreciation of the related tenant improvement assets. We also add back net income attributable to noncontrolling common units of the Operating Partnership because we report FFO attributable to common stockholders and common unitholders.
|
We believe that FFO is a useful supplemental measure of our operating performance. The exclusion from FFO of gains and losses from the sale of operating real estate assets allows investors and analysts to readily identify the operating results of the assets that form the core of our activity and assists in comparing those operating results between periods. Also, because FFO is generally recognized as the industry standard for reporting the operations of REITs, it facilitates comparisons of operating performance to other REITs. However, other REITs may use different methodologies to calculate FFO, and accordingly, our FFO may not be comparable to all other REITs.
Implicit in historical cost accounting for real estate assets in accordance with GAAP is the assumption that the value of real estate assets diminishes predictably over time. Since real estate values have historically risen or fallen with market conditions, many industry investors and analysts have considered presentations of operating results for real estate companies using historical cost accounting alone to be insufficient. Because FFO excludes depreciation and amortization of real estate assets, we believe that FFO along with the required GAAP presentations provides a more complete measurement of our performance relative to our competitors and a more appropriate basis on which to make decisions involving operating, financing and investing activities than the required GAAP presentations alone would provide.
However, FFO should not be viewed as an alternative measure of our operating performance because it does not reflect either depreciation and amortization costs or the level of capital expenditures and leasing costs necessary to maintain the operating performance of our properties, which are significant economic costs and could materially impact our results from operations.
Adjustments to arrive at FFO were as follows: net income attributable to noncontrolling common units of the Operating Partnership, net income attributable to noncontrolling interests in consolidated property partnerships, depreciation and amortization of real estate assets, gains on sales of depreciable real estate and FFO attributable to noncontrolling interests in consolidated property partnerships. For additional information, see “Item 7. Management’s Discussion and Analysis of Financial Condition and Results of Operations —Non-GAAP Supplemental Financial Measure: Funds From Operations” including a reconciliation of the Company’s GAAP net income available for common stockholders to FFO for the periods presented.
|
(4)
|
FFO includes amortization of deferred revenue related to tenant-funded tenant improvements of
$16.8 million
,
$13.2 million
,
$13.3 million
,
$11.0 million
and
$10.7 million
for the years ended
December 31, 2017
,
2016
,
2015
,
2014
and
2013
, respectively.
|
|
(5)
|
On January 1, 2017, the Company adopted FASB ASU No. 2016-18 which requires that a statement of cash flows explain the change during the period in the total cash, cash equivalents, and amounts generally described as restricted cash or restricted cash equivalents. As a result, cash flows provided by (used in) investing activities have been adjusted from prior amounts reported to reflect this change for all periods presented.
|
|
(6)
|
For the year ended December 31, 2016, represents occupancy at December 31, 2016.
|
48
SELECTED FINANCIAL DATA – KILROY REALTY, L.P.
The following tables set forth selected consolidated financial and operating data on an historical basis for the Operating Partnership. The following data should be read in conjunction with our financial statements and notes thereto and “Item 7. Management’s Discussion and Analysis of Financial Condition and Results of Operations” included in this report.
The consolidated balance sheet data as of
December 31, 2017
,
2016
and
2015
and the consolidated statement of operations data for all periods presented have been derived from the historical consolidated financial statements of Kilroy Realty, L.P. audited by an independent registered public accounting firm. The consolidated balance sheet data as of December 31,
2014
and
2013
have been derived from the historical consolidated financial statements of Kilroy Realty, L.P. and adjusted for the impact of subsequent accounting changes requiring retrospective application, if any.
Kilroy Realty, L.P. Consolidated
(in thousands, except unit, per unit, square footage and occupancy data)
|
Year Ended December 31,
|
|||||||||||||||||||
|
2017
|
2016
|
2015
|
2014
|
2013
|
|||||||||||||||
|
Statements of Operations Data:
|
|||||||||||||||||||
|
Total revenues from continuing operations
|
$
|
719,001
|
|
$
|
642,572
|
|
$
|
581,275
|
|
$
|
521,725
|
|
$
|
457,111
|
|
||||
|
Income from continuing operations
|
180,615
|
|
303,798
|
|
238,604
|
|
59,313
|
|
14,935
|
|
|||||||||
|
Income from discontinued operations
(1)
|
—
|
|
—
|
|
—
|
|
124,495
|
|
29,630
|
|
|||||||||
|
Net income available to common unitholders
|
154,077
|
|
286,813
|
|
224,887
|
|
170,298
|
|
31,091
|
|
|||||||||
|
Per Unit Data:
|
|||||||||||||||||||
|
Weighted average common units outstanding – basic
|
100,246,567
|
|
94,771,688
|
|
91,645,578
|
|
84,894,498
|
|
79,166,260
|
|
|||||||||
|
Weighted average common units outstanding – diluted
|
100,860,337
|
|
95,452,239
|
|
92,187,257
|
|
86,771,983
|
|
79,166,260
|
|
|||||||||
|
Income from continuing operations available to common unitholders per common unit – basic
|
$
|
1.52
|
|
$
|
2.99
|
|
$
|
2.44
|
|
$
|
0.52
|
|
$
|
0.00
|
|
||||
|
Income from continuing operations available to common unitholders per common unit – diluted
|
$
|
1.51
|
|
$
|
2.96
|
|
$
|
2.42
|
|
$
|
0.51
|
|
$
|
0.00
|
|
||||
|
Net income available to common unitholders per unit – basic
|
$
|
1.52
|
|
$
|
2.99
|
|
$
|
2.44
|
|
$
|
1.99
|
|
$
|
0.37
|
|
||||
|
Net income available to common unitholders per unit – diluted
|
$
|
1.51
|
|
$
|
2.96
|
|
$
|
2.42
|
|
$
|
1.94
|
|
$
|
0.37
|
|
||||
|
Distributions declared per common unit
(2)
|
$
|
1.650
|
|
$
|
3.375
|
|
$
|
1.400
|
|
$
|
1.400
|
|
$
|
1.400
|
|
||||
________________________
|
(1)
|
The Company adopted FASB ASU No. 2014-08 effective January 1, 2015 (see Note 2 “Basis of Presentation and Significant Accounting Policies” to our consolidated financial statements included in this report for additional information). As a result, results of operations for properties classified as held for sale and/or disposed of subsequent to January 1, 2015 are presented in continuing operations. Prior to January 1, 2015, properties classified as held for sale and/or disposed of are presented in discontinued operations.
|
|
(2)
|
The year ended December 31, 2016 includes a special distribution of $1.90 per common unit that was paid on January 13, 2017.
|
49
|
December 31,
|
|||||||||||||||||||
|
2017
|
2016
|
2015
|
2014
|
2013
|
|||||||||||||||
|
Balance Sheet Data:
|
|||||||||||||||||||
|
Total real estate held for investment, before accumulated depreciation and amortization
|
$
|
7,417,777
|
|
$
|
7,060,754
|
|
$
|
6,328,146
|
|
$
|
6,057,932
|
|
$
|
5,264,947
|
|
||||
|
Total assets
(1)
|
6,802,838
|
|
6,706,633
|
|
5,926,430
|
|
5,621,262
|
|
5,099,417
|
|
|||||||||
|
Total debt
(1)
|
2,347,063
|
|
2,320,123
|
|
2,225,469
|
|
2,456,939
|
|
2,193,327
|
|
|||||||||
|
Total preferred capital
|
—
|
|
192,411
|
|
192,411
|
|
192,411
|
|
192,411
|
|
|||||||||
|
Total noncontrolling interests
(2)
|
186,375
|
|
135,138
|
|
10,566
|
|
9,625
|
|
8,388
|
|
|||||||||
|
Total capital
(2)
|
3,960,316
|
|
3,759,317
|
|
3,234,586
|
|
2,723,936
|
|
2,516,160
|
|
|||||||||
|
Other Data:
|
|||||||||||||||||||
|
Cash flows provided by (used in):
|
|||||||||||||||||||
|
Operating activities
|
347,012
|
|
345,054
|
|
272,008
|
|
245,253
|
|
240,576
|
|
|||||||||
|
Investing activities
(3)
|
(359,102
|
)
|
(579,420
|
)
|
(337,241
|
)
|
(476,031
|
)
|
(704,284
|
)
|
|||||||||
|
Financing activities
|
(171,241
|
)
|
427,291
|
|
23,471
|
|
244,587
|
|
284,621
|
|
|||||||||
|
Office Property Data:
|
|||||||||||||||||||
|
Rentable square footage
|
13,720,597
|
|
14,025,856
|
|
13,032,406
|
|
14,096,617
|
|
12,736,099
|
|
|||||||||
|
Occupancy
|
95.2
|
%
|
96.0
|
%
|
94.8
|
%
|
94.4
|
%
|
93.4
|
%
|
|||||||||
|
Residential Property Data:
|
|||||||||||||||||||
|
Number of units
|
200
|
|
200
|
|
N/A
|
|
N/A
|
|
N/A
|
|
|||||||||
|
Average occupancy
(4)
|
70.2
|
%
|
46.0
|
%
|
N/A
|
|
N/A
|
|
N/A
|
|
|||||||||
_______________________
|
(1)
|
On January 1, 2016, the Company adopted FASB ASU No. 2015-03 and 2015-15 which require deferred financing costs, except costs paid for the unsecured line of credit, to be reclassified as a reduction to the debt liability balance instead of being reported as an asset as historically presented. As a result, total assets and total debt have been adjusted from prior amounts reported to reflect this change for all periods presented.
|
|
(2)
|
Includes the noncontrolling interests in consolidated property partnerships and subsidiaries (see Note 2 “Basis of Presentation and Significant Accounting Policies” to our consolidated financial statements included in this report for additional information).
|
|
(3)
|
On January 1, 2017, the Company adopted FASB ASU No. 2016-18 which requires that a statement of cash flows explain the change during the period in the total cash, cash equivalents, and amounts generally described as restricted cash or restricted cash equivalents. As a result, cash flows provided by (used in) investing activities have been adjusted from prior amounts reported to reflect this change for all periods presented.
|
|
(4)
|
For the year ended December 31, 2016, represents occupancy at December 31, 2016.
|
50
|
ITEM 7.
|
MANAGEMENT’S DISCUSSION AND ANALYSIS OF FINANCIAL CONDITION AND RESULTS OF OPERATIONS
|
The following discussion relates to our consolidated financial statements and should be read in conjunction with the financial statements and notes thereto appearing elsewhere in this report. The results of operations discussion are combined for the Company and the Operating Partnership because there are no material differences in the results of operations between the two reporting entities.
Forward-Looking Statements
Statements contained in this “Item 7. Management’s Discussion and Analysis of Financial Condition and Results of Operations” that are not historical facts may be forward-looking statements. Forward-looking statements include, among other things, statements or information concerning our plans, objectives, capital resources, portfolio performance, results of operations, projected future occupancy and rental rates, lease expirations, debt maturities, potential investments, strategies such as capital recycling, development and redevelopment activity, projected construction costs, projected construction commencement and completion dates, projected square footage of space that could be constructed on undeveloped land that we own, projected rentable square footage of or number of units in properties under construction or in the development pipeline, anticipated proceeds from capital recycling activity or other dispositions and anticipated dates of those activities or dispositions, projected increases in the value of properties, dispositions, future executive incentive compensation, pending, potential or proposed acquisitions,
plans to grow our Net Operating Income and FFO, our ability to re-lease properties at or above current market rates, anticipated market conditions and demographics and other forward-looking financial data, as well as the discussion in “—Factors That May Influence Future Results of Operations”, “—Liquidity and Capital Resource of the Company”, and “—Liquidity and Capital Resources of the Operating Partnership.” Forward-looking statements can be identified by the use of words such as “believes,” “expects,” “projects,” “may,” “will,” “should,” “seeks,” “approximately,” “intends,” “plans,” “pro forma,” “estimates” or “anticipates” and the negative of these words and phrases and similar expressions that do not relate to historical matters. Forward-looking statements are based on our current expectations, beliefs and assumptions, and are not guarantees of future performance. Forward-looking statements are inherently subject to uncertainties, risks, changes in circumstances, trends and factors that are difficult to predict, many of which are outside of our control. Accordingly, actual performance, results and events may vary materially from those indicated in the forward-looking statements, and you should not rely on the forward-looking statements as predictions of future performance, results or events. Numerous factors could cause actual future performance, results and events to differ materially from those indicated in the forward-looking statements, including, among others:
|
•
|
global market and general economic conditions and their effect on our liquidity and financial conditions and those of our tenants;
|
|
•
|
adverse economic or real estate conditions generally, and specifically, in the States of California and Washington;
|
|
•
|
risks associated with our investment in real estate assets, which are illiquid, and with trends in the real estate industry;
|
|
•
|
defaults on or non-renewal of leases by tenants;
|
|
•
|
any significant downturn in tenants’ businesses;
|
|
•
|
our ability to re-lease property at or above current market rates;
|
|
•
|
costs to comply with government regulations, including environmental remediations;
|
|
•
|
the availability of cash for distribution and debt service and exposure to risk of default under debt obligations;
|
|
•
|
increases in interest rates and our ability to manage interest rate exposure;
|
51
|
•
|
the availability of financing on attractive terms or at all, which may adversely impact our future interest expense and our ability to pursue development, redevelopment and acquisition opportunities and refinance existing debt;
|
|
•
|
a decline in real estate asset valuations, which may limit our ability to dispose of assets at attractive prices or obtain or maintain debt financing, and which may result in write-offs or impairment charges;
|
|
•
|
significant competition, which may decrease the occupancy and rental rates of properties;
|
|
•
|
potential losses that may not be covered by insurance;
|
|
•
|
the ability to successfully complete acquisitions and dispositions on announced terms;
|
|
•
|
the ability to successfully operate acquired, developed and redeveloped properties;
|
|
•
|
the ability to successfully complete development and redevelopment projects on schedule and within budgeted amounts;
|
|
•
|
delays or refusals in obtaining all necessary zoning, land use and other required entitlements, governmental permits and authorizations for our development and redevelopment properties;
|
|
•
|
increases in anticipated capital expenditures, tenant improvement and/or leasing costs;
|
|
•
|
defaults on leases for land on which some of our properties are located;
|
|
•
|
adverse changes to, or implementations of, applicable laws, regulations or legislation, as well as business and consumer reactions to such changes;
|
|
•
|
risks associated with joint venture investments, including our lack of sole decision-making authority, our reliance on co-venturers’ financial condition and disputes between us and our co-venturers;
|
|
•
|
environmental uncertainties and risks related to natural disasters; and
|
|
•
|
our ability to maintain our status as a REIT.
|
The factors included in this report are not exhaustive and additional factors could adversely affect our business and financial performance. For a discussion of additional factors that could materially adversely affect the Company's and the Operating Partnership's business and financial performance, see the discussion below as well as “Item 1A. Risk Factors,” and in our other filings with the SEC. All forward-looking statements are based on information that was available and speak only as of the date on which they were made. We assume no obligation to update any forward-looking statement that becomes untrue because of subsequent events, new information or otherwise, except to the extent we are required to do so in connection with our ongoing requirements under federal securities laws.
Company Overview
We are a self-administered REIT active in premier office and mixed-use submarkets along the West Coast. We own, develop, acquire and manage real estate assets, consisting primarily of Class A properties in the coastal regions of Los Angeles, Orange County, San Diego County, the San Francisco Bay Area and Greater Seattle, which we believe have strategic advantages and strong barriers to entry. We own our interests in all of our real properties through the Operating Partnership and the Finance Partnership and generally conduct substantially all of our operations through the Operating Partnership. We owned an approximate
97.9%
and
97.5%
general partnership interest in the Operating Partnership as of
December 31, 2017
and
2016
, respectively. All of our properties are held in fee except for the
thirteen
office buildings that are held subject to long-term ground leases for the land (see Note 18 “Commitments and
52
Contingencies” to our consolidated financial statements included in this report for additional information regarding our ground lease obligations).
2017
Operating and Development Highlights
2017
was another strong year of performance for the Company. We delivered strong results across all areas of our business and continued to create value in our operating and development platforms that we believe will drive future earnings and dividend growth.
Leasing.
During
2017
, we executed new and renewal leases totaling
2.0 million
square feet within our stabilized portfolio with an increase in GAAP rents of
25.0%
and an increase in cash rents of
11.2%
. The occupancy of our stabilized office portfolio was
95.2%
as of
December 31, 2017
. We also signed approximately 0.9 million square feet of leases in our development portfolio, securing long-term, high quality tenants for 62% of our three currently under construction office projects.
Development
. We continued to execute on our development program during
2017
, delivering one project, commencing construction on a new development project and acquiring a new future development site. In January 2017, we stabilized our Columbia Square Phase 2 - Office development project in Hollywood, California, with a total estimated investment of
$230.0 million
totaling
365,359
square feet of office space that is
100%
leased.
Also during
2017
, we commenced construction on 333 Dexter located in the South Lake Union district of Seattle, Washington, one of the strongest performing markets in the country. This project encompasses approximately
650,000
gross rentable square feet of office space at a total estimated investment of
$380.0 million
. Including 333 Dexter, as of
December 31, 2017
, the Company had
four
development projects under construction comprised of approximately
1.8 million
square feet of office space,
237
residential units, and
96,000
square feet of retail space, representing a total estimated investment of approximately
$1.5 billion
. The total estimated investment of the
four
projects includes lease commissions and excludes tenant improvement overages. Scheduled completion dates range through 2019. See “—Factors that May Influence Future Operations—Completed, In-Process and Future Development Pipeline” for additional information.
During the year ended
December 31, 2017
, the Company completed the acquisition of a
1.2
acre development site located in the Little Italy neighborhood of downtown San Diego, California for
$19.4 million
in cash (see Note 3 “Acquisitions” to our consolidated financial statements included in this report for more information).
Subsequent to December 31, 2017, in January 2018, we commenced construction on the first phase of the mixed-use Academy & Vine project in the Hollywood submarket of Los Angeles, including 306,000 square feet of office space and 24,000 square feet of retail space.
Capital Recycling Program
. We have continued to utilize our capital recycling program to provide additional capital to finance development expenditures, fund potential acquisitions, repay long-term debt and for other general corporate purposes. Our general strategy is to target the disposition of mature properties or those that have limited upside for us and redeploy the capital into acquisitions and/or development projects where we can create additional value to generate higher returns (see “—Factors that May Influence Future Operations” for additional information).
In connection with this strategy, during
2017
, we generated gross sales proceeds totaling approximately
$186.6 million
through the sale of
eleven
office buildings and
one
undeveloped land parcel.
2017
Financing Highlights
In addition to obtaining funding from our capital recycling program during
2017
, we successfully completed the following financing and capital raising activities to fund our continued growth. We continued to strengthen our balance sheet and lower our overall cost of capital. See “—Liquidity and Capital Resources of the Operating Partnership” for additional information.
53
|
•
|
Issued
4,427,500
shares of common stock for aggregate net proceeds of
$308.8 million
in an underwritten public offering;
|
|
•
|
Issued
235,077
shares of common stock for aggregate net proceeds of
$17.5 million
under the Company’s at-the-market (“ATM”) offering program;
|
|
•
|
Increased the size of the unsecured revolving credit facility from
$600.0 million
to
$750.0 million
and reduced the borrowing costs;
|
|
•
|
Repaid a $39.0 million unsecured term loan;
|
|
•
|
Redeemed
8,000,000
shares of
6.875%
Series G and
6.375%
Series H preferred stock at the contractual redemption price of
$25.00
per share for a total cost of
$200.0 million
in cash;
|
|
•
|
Completed the early redemption of all
$325.0 million
of the company’s
4.800%
unsecured senior notes due
July 2018
for a cash price of approximately
$330.0 million
, resulting in a loss on early extinguishment of debt;
|
|
•
|
Repaid a total of
$124.5 million
of secured debt at par, of which
$123.5 million
was a
mortgage note that was held by 303 Second LLC, a property partnership in which we have a 56% equity interest. NBREM
contributed
$54.4 million
to fund their proportionate share of the repayment of this mortgage debt;
|
|
•
|
Issued
$175.0 million
of 10-year
3.350%
unsecured senior notes (the “Series A Notes”) and
$75.0 million
of 12-year
3.450%
unsecured senior notes (the “Series B Notes” and, together with the Series A Notes, the “Series A and B Notes”) maturing in
February 2027
and
February 2029
, respectively, pursuant to a delayed draw option in connection with a private note placement in September 2016; and
|
|
•
|
Issued
$425.0 million
aggregate principal amount of 7-year,
3.450%
senior unsecured notes maturing in
December 2024
in an underwritten public offering.
|
Critical Accounting Policies
The preparation of financial statements in conformity with GAAP requires us to make estimates, assumptions, and judgments that affect the reported amounts of assets, liabilities, and the disclosure of contingent assets and liabilities at the date of the financial statements and the reported amounts of revenues and expenses for the reporting periods.
Certain accounting policies are considered to be critical accounting policies. Critical accounting policies are those policies that require our management team to make significant estimates and/or assumptions about matters that are uncertain at the time the estimates and/or assumptions are made or where we are required to make significant judgments and assumptions with respect to the practical application of accounting principles in our business operations. Critical accounting policies are by definition those policies that are material to our financial statements and for which the impact of changes in estimates, assumptions, and judgments could have a material impact to our financial statements.
The following critical accounting policies discussion reflects what we believe are the most significant estimates, assumptions, and judgments used in the preparation of our consolidated financial statements. This discussion of our critical accounting policies is intended to supplement the description of our accounting policies in the footnotes to our consolidated financial statements and to provide additional insight into the information used by management when evaluating significant estimates, assumptions, and judgments. For further discussion of our significant accounting policies, see Note 2 “Basis of Presentation & Significant Accounting Policies” to our consolidated financial statements included in this report.
54
Rental Revenue Recognition
Rental revenue for office operating properties is our principal source of revenue. The timing of when we commence rental revenue recognition for office properties depends largely on our conclusion as to whether we are or the tenant is the owner for accounting purposes of tenant improvements at the leased property. When we conclude that we are the owner of tenant improvements for accounting purposes, we record the cost to construct the tenant improvements as an asset, and we commence rental revenue recognition when the tenant takes possession of or controls the finished space, which is typically when the improvements being recorded as our asset are substantially complete.
The determination of whether we are or the tenant is the owner of tenant improvements for accounting purposes is subject to significant judgment. In making that determination, we consider numerous factors and perform a detailed evaluation of each individual lease. No one factor is determinative in reaching a conclusion. The factors we evaluate include but are not limited to the following:
|
•
|
whether the lease agreement requires landlord approval of how the tenant improvement allowance is spent prior to installation of the tenant improvements;
|
|
•
|
whether the lease agreement requires the tenant to provide evidence to the landlord supporting the cost and what the tenant improvement allowance was spent on prior to payment by the landlord for such tenant improvements;
|
|
•
|
whether the tenant improvements are unique to the tenant or reusable by other tenants;
|
|
•
|
whether the tenant is permitted to alter or remove the tenant improvements without the consent of the landlord or without compensating the landlord for any lost utility or diminution in fair value; and
|
|
•
|
whether the ownership of the tenant improvements remains with the landlord or remains with the tenant at the end of the lease term.
|
In addition, we also record the cost of certain tenant improvements paid for or reimbursed by tenants when we conclude that we are the owner of such tenant improvements using the factors discussed above. For these tenant-funded tenant improvements, we record the amount funded or reimbursed by tenants as deferred revenue, which is amortized and recognized as rental revenue over the term of the related lease beginning upon substantial completion of the leased premises. During the years ended
December 31, 2017
,
2016
, and
2015
, we capitalized
$22.0 million
,
$22.3 million
and
$22.8 million
, respectively, of tenant-funded tenant improvements. The amount of tenant-funded tenant improvements recorded in any given year varies based upon the mix of specific leases executed and/or commenced during the reporting period. For the years ended
December 31, 2017
,
2016
, and
2015
, we recognized
$16.8 million
,
$13.2 million
and
$13.3 million
, respectively, of non-cash rental revenue related to the amortization of deferred revenue recorded in connection with tenant-funded tenant improvements.
When we conclude that we are not the owner and the tenant is the owner of certain tenant improvements for accounting purposes, we record our contribution towards those improvements as a lease incentive, which is amortized as a reduction to rental revenue on a straight-line basis over the term of the related lease, and rental revenue recognition begins when the tenant takes possession of or controls the space.
Our determination as to whether we are or the tenant is the owner of tenant improvements for accounting purposes is made on a lease-by-lease basis and has a significant impact on the amount of non-cash rental revenue that we record related to the amortization of deferred revenue for tenant-funded tenant improvements, and also has a significant effect on the timing of commencement of revenue recognition.
For residential properties, we commence revenue recognition upon occupancy of the premises by the tenant. Residential rental revenue is recognized on a straight-line basis over the term of the related lease, net of any concessions.
55
Tenant Reimbursement Revenue
Reimbursements from tenants consist of amounts due from tenants for common area maintenance, real estate taxes, and other recoverable costs, including capital expenditures. Calculating tenant reimbursement revenue requires an in-depth analysis of the complex terms of each underlying lease. Examples of judgments and estimates used when determining the amounts recoverable include:
|
•
|
estimating the final expenses, net of accruals, that are recoverable;
|
|
•
|
estimating the fixed and variable components of operating expenses for each building;
|
|
•
|
conforming recoverable expense pools to those used in establishing the base year or base allowance for the applicable underlying lease; and
|
|
•
|
concluding whether an expense or capital expenditure is recoverable pursuant to the terms of the underlying lease.
|
During the year, we accrue estimated tenant reimbursement revenue in the period in which the tenant reimbursable costs are incurred based on our best estimate of the amounts to be recovered. Throughout the year, we perform analyses to properly match tenant reimbursement revenue with reimbursable costs incurred to date. Additionally, during the fourth quarter of each year, we perform preliminary reconciliations and accrue additional tenant reimbursement revenue or refunds. Subsequent to year end, we perform final detailed reconciliations and analyses on a lease-by-lease basis and bill or refund each tenant for any cumulative annual adjustments in the first and second quarters of each year for the previous year’s activity. Our historical experience for the years ended December 31,
2016
and
2015
has been that our final reconciliation and billing process resulted in final amounts that approximated the total annual tenant reimbursement revenues recognized.
Allowances for Uncollectible Current Tenant Receivables and Deferred Rent Receivables
Tenant receivables and deferred rent receivables are carried net of the allowances for uncollectible current tenant receivables and deferred rent receivables. Current tenant receivables consist primarily of amounts due for contractual lease payments and reimbursements of common area maintenance expenses, property taxes, and other costs recoverable from tenants. Deferred rent receivables represent the amount by which the cumulative straight-line rental revenue recorded to date exceeds cash rents billed to date under the lease agreement. As of
December 31, 2017
and
2016
, current receivables were carried net of an allowance for uncollectible tenant receivables of
$2.3 million
and
$1.7 million
, respectively, for each period and deferred rent receivables were carried net of an allowance for deferred rent of
$3.2 million
and
$1.5 million
, respectively.
Management’s determination of the adequacy of the allowance for uncollectible tenant receivables and the allowance for deferred rent receivables is performed using a methodology that incorporates a specific identification analysis and an aging analysis and considers the current economic and business environment. This determination requires significant judgment and estimates about matters that are uncertain at the time the estimates are made, including the creditworthiness of specific tenants, specific industry trends and conditions, and general economic trends and conditions. Since these factors are beyond our control, actual results can differ from our estimates, and such differences could be material.
With respect to the allowance for uncollectible tenant receivables, the specific identification methodology analysis relies on factors such as the age and nature of the receivables, the payment history and financial condition of the tenant, our assessment of the tenant’s ability to meet its lease obligations, and the status of negotiations of any disputes with the tenant. With respect to the allowance for deferred rent receivables, given the longer-term nature of these receivables, the specific identification methodology analysis evaluates each of our significant tenants and any tenants on our internal watchlist and relies on factors such as each tenant’s financial condition and its ability to meet its lease obligations. We evaluate our reserve levels quarterly based on changes in the financial condition of tenants and our assessment of the tenant’s ability to meet its lease obligations, overall economic conditions, and the current business environment.
56
For the years ended
December 31, 2017
,
2016
and
2015
, we recorded a total provision for bad debts for both current tenant receivables and deferred rent receivables of approximately
0.5%
,
0.0%
and
0.1%
, respectively, of rental revenue. Our historical experience has been that actual write-offs of current tenant receivables and deferred rent receivables has approximated the provision for bad debts recorded for the years ended
December 31, 2017
,
2016
and
2015
. In the event our estimates were not accurate and we had to change our allowances by 1% of revenue from continuing operations, the potential impact to our net income available to common stockholders would be approximately
$7.2 million
,
$6.4 million
and
$5.8 million
for the years ended
December 31, 2017
,
2016
and
2015
, respectively.
Acquisitions
Subsequent to our adoption of
Financial Accounting Standards Board (“FASB”) Accounting Standards Update (“ASU”) No. 2017-01 (“ASU 2017-01”) on January 1, 2017, which was adopted on a prospective basis, a
cquisitions of operating properties and development and redevelopment opportunities generally no longer meet the definition of a business and are accounted for as asset acquisitions. For these asset acquisitions, we record the acquired tangible and intangible assets and assumed liabilities based on each asset’s and liability’s relative fair value at the acquisition date of the total purchase price plus any capitalized acquisition costs. We record the acquired tangible and intangible assets and assumed liabilities of acquisitions of operating properties and development and redevelopment opportunities that meet the accounting criteria to be accounted for as business combinations at fair value at the acquisition date.
We assess and consider fair value based on estimated cash flow projections that utilize available market information and discount and/or capitalization rates that we deem appropriate. Estimates of future cash flows are based on a number of factors including historical operating results, known and anticipated trends, and market and economic conditions. The acquired assets and assumed liabilities for an operating property acquisition generally include but are not limited to: land and improvements, buildings and improvements, construction in progress and identified tangible and intangible assets and liabilities associated with in-place leases, including tenant improvements, leasing costs, value of above-market and below-market operating leases and ground leases, acquired in-place lease values and tenant relationships, if any.
The fair value of land and improvements is derived from comparable sales of land and improvements within the same submarket and/or region. The fair value of buildings and improvements, tenant improvements and leasing costs considers the value of the property as if it was vacant as well as current replacement costs and other relevant market rate information.
The fair value of the above-market or below-market component of an acquired in-place operating lease is based upon the present value (calculated using a market discount rate) of the difference between (i) the contractual rents to be paid pursuant to the lease over its remaining non-cancellable lease term and (ii) management’s estimate of the rents that would be paid using fair market rental rates and rent escalations at the date of acquisition measured over the remaining non-cancellable term of the lease for above-market operating leases and the initial non-cancellable term plus the term of any below-market fixed rate renewal options, if applicable, for below-market operating leases. The amounts recorded for above-market operating leases are included in deferred leasing costs and acquisition-related intangible assets, net on the balance sheet and are amortized on a straight-line basis as a reduction of rental income over the remaining term of the applicable leases. The amounts recorded for below-market operating leases are included in deferred revenue and acquisition-related liabilities, net on the balance sheet and are amortized on a straight-line basis as an increase to rental income over the remaining term of the applicable leases plus the term of any below-market fixed rate renewal options, if applicable. Our below-market operating leases generally do not include fixed rate or below-market renewal options. If a lease were to be terminated or if termination were determined to be likely prior to its contractual expiration (for example resulting from bankruptcy), amortization of the related above-market or below-market lease intangible would be accelerated.
The fair value of acquired in-place leases is derived based on management’s assessment of lost revenue and costs incurred for the period required to lease the “assumed vacant” property to the occupancy level when purchased. This fair value is based on a variety of considerations including, but not necessarily limited to: (1) the value associated with avoiding the cost of originating the acquired in-place leases; (2) the value associated with lost revenue related to tenant reimbursable operating costs estimated to be incurred during the assumed lease-up period; and (3) the value associated with lost rental revenue from existing leases during the assumed lease-up period. Factors we consider in performing
57
these analyses include an estimate of the carrying costs during the expected lease-up periods, current market conditions, and costs to execute similar leases. In estimating carrying costs, we include real estate taxes, insurance and other operating expenses, and estimates of lost rental revenue during the expected lease-up periods based on current market demand at market rates. In estimating costs to execute similar leases, we consider leasing commissions, legal and other related expenses. The amount recorded for acquired in-place leases is included in deferred leasing costs and acquisition-related intangible assets, net on the balance sheet and amortized as an increase to depreciation and amortization expense over the remaining term of the applicable leases. If a lease were to be terminated or if termination were determined to be likely prior to its contractual expiration (for example resulting from bankruptcy), amortization of the related unamortized in-place lease intangible would be accelerated.
The determination of the fair value of any debt assumed in connection with a property acquisition is estimated by discounting the future cash flows using interest rates available for the issuance of debt with similar terms and remaining maturities.
The determination of the fair value of the acquired tangible and intangible assets and assumed liabilities of acquisitions requires us to make significant judgments and assumptions about the numerous inputs discussed above. The use of different assumptions in these fair value calculations could significantly affect the reported amounts of the allocation of our acquisition related assets and liabilities and the related depreciation and amortization expense recorded for such assets and liabilities. In addition, because the value of above and below market leases are amortized as either a reduction or increase to rental income, respectively, our judgments for these intangibles could have a significant impact on our reported rental revenues and results of operations.
Subsequent to our adoption of “ASU 2017-01” on January 1, 2017,
transaction costs associated with our acquisitions are capitalized as part of the purchase price of the acquisition. Prior to our adoption of
“ASU 2017-01”, acquisition costs associated with all operating property acquisitions and those development and redevelopment acquisitions that met the criteria to be accounted for as business combinations were expensed as incurred and costs associated with development acquisitions accounted for as asset acquisitions were capitalized as part of the cost of the asset.
During the years ended
December 31, 2017
,
2016
, and
2015
, we capitalized
$4.6 million
,
$0.5 million
, and
$1.1 million
, respectively, of acquisition costs. During the years ended
December 31, 2016
and
2015
, we expensed
$1.9 million
and
$0.5 million
of acquisition costs respectively
Evaluation of Asset Impairment
We evaluate our real estate assets for potential impairment whenever events or changes in circumstances indicate that the carrying amount of a given asset may not be recoverable. We evaluate our real estate assets for impairment on a property-by-property basis. Indicators we use to determine whether an impairment evaluation is necessary include:
|
•
|
low occupancy levels, forecasted low occupancy levels or near term lease expirations at a specific property;
|
|
•
|
current period operating or cash flow losses combined with a historical pattern or future projection of potential continued operating or cash flow losses at a specific property;
|
|
•
|
deterioration in rental rates for a specific property as evidenced by sudden significant rental rate decreases or continuous rental rate decreases over numerous quarters, which could signal a continued decrease in future cash flow for that property;
|
|
•
|
deterioration of a given rental submarket as evidenced by significant increases in market vacancy and/or negative absorption rates or continuous increases in market vacancy and/or negative absorption rates over numerous quarters, which could signal a decrease in future cash flow for properties within that submarket;
|
|
•
|
significant increases in property sales yields, continuous increases in property sales yields over several quarters, or recent property sales at a loss within a given submarket, each of which could signal a decrease in the market value of properties;
|
58
|
•
|
significant change in strategy or use of a specific property or any other event that could result in a decreased holding period, including classifying a property as held for sale, or significant development delay;
|
|
•
|
evidence of material physical damage to the property; and
|
|
•
|
default by a significant tenant when any of the other indicators above are present.
|
When we evaluate for potential impairment our real estate assets to be held and used, we first evaluate whether there are any indicators of impairment. If any impairment indicators are present for a specific real estate asset, we then perform an undiscounted cash flow analysis and compare the net carrying amount of the real estate asset to the real estate asset’s estimated undiscounted future cash flow over the anticipated holding period. If the estimated undiscounted future cash flow is less than the net carrying amount of the real estate asset, we perform an impairment loss calculation to determine if the fair value of the real estate asset, less estimated costs to sell, is less than the net carrying value of the real estate asset. We also perform an impairment loss calculation for real estate assets held for sale to determine if the fair value of the real estate asset, less estimated costs to sell, is less than the net carrying value of the real estate asset. Our impairment loss calculation compares the net carrying amount of the real estate asset to the real estate asset’s estimated fair value, which may be based on estimated discounted future cash flow calculations or third-party valuations or appraisals. We recognize an impairment loss if the amount of the asset’s net carrying amount exceeds the asset’s estimated fair value less costs to sell. If we recognize an impairment loss, the estimated fair value of the asset becomes its new cost basis. For a depreciable long-lived asset, the new cost basis will be depreciated (amortized) over the remaining useful life of that asset.
Our undiscounted cash flow and fair value calculations contain uncertainties because they require management to make assumptions and to apply judgment to estimate future cash flow and property fair values, including selecting the discount or capitalization rate that reflects the risk inherent in future cash flow. Estimating projected cash flow is highly subjective as it requires assumptions related to future rental rates, tenant allowances, operating expenditures, property taxes, capital improvements, and occupancy levels. We are also required to make a number of assumptions relating to future economic and market events and prospective operating trends. Determining the appropriate capitalization rate also requires significant judgment and is typically based on many factors including the prevailing rate for the market or submarket, as well as the quality and location of the properties. Further, capitalization rates can fluctuate resulting from a variety of factors in the overall economy or within regional markets. If the actual net cash flow or actual market capitalization rates significantly differ from our estimates, the impairment evaluation for an individual asset could be materially affected.
For each property where such an indicator occurred and/or for properties within a given submarket where such an indicator occurred, we completed an impairment evaluation. After completing this process, we determined that for each of the operating properties evaluated, undiscounted cash flows over the holding period were in excess of carrying value and, therefore, we did not record any impairment losses for these properties.
Cost Capitalization and Depreciation
We capitalize costs associated with development and redevelopment activities, capital improvements, tenant improvements, and leasing activities, including internal compensation costs. In addition, for development and redevelopment projects, we also capitalize the following costs during periods in which activities necessary to prepare the project for its intended use are in progress: interest costs based on the weighted average interest rate of our outstanding indebtedness for the period, real estate taxes and insurance. For the years ended
December 31, 2017
,
2016
and
2015
, we capitalized
$23.2 million
,
$19.0 million
and
$15.2 million
, respectively, of internal costs to our qualifying development projects.
Amounts capitalized are depreciated or amortized over estimated useful lives determined by management. We depreciate buildings and improvements based on the estimated useful life of the asset, and we amortize tenant improvements and leasing costs over the shorter of the estimated useful life or estimated remaining life of the related lease. All capitalized costs are depreciated or amortized using the straight-line method.
59
Determining whether expenditures meet the criteria for capitalization and the assignment of depreciable lives requires management to exercise significant judgment. Expenditures that meet one or more of the following criteria generally qualify for capitalization:
|
•
|
provide benefit in future periods;
|
|
•
|
extend the useful life of the asset beyond our original estimates; and
|
|
•
|
increase the quality of the asset beyond our original estimates.
|
Our historical experience has demonstrated that we have not had material write-offs of assets and that our depreciation and amortization estimates have been reasonable and appropriate.
Share-Based Incentive Compensation Accounting
At
December 31, 2017
, the Company had one share-based incentive compensation plan, the Kilroy Realty 2006 Incentive Award Plan, which is described more fully in Note 15 “Share-Based Compensation” to our consolidated financial statements included in this report. The Executive Compensation Committee determines compensation for Executive Officers. Compensation cost for all share-based awards, including options, requires an estimate of fair value on the grant date and compensation cost is recognized on a straight-line basis over the service vesting period, which represents the requisite service period. The grant date fair value for compensation programs that contain market conditions, like modifiers based on total stockholder return (a “market condition”), are performed using complex pricing valuation models that require the input of assumptions, including judgments to estimate expected stock price volatility, expected life, and forfeiture rate. Specifically, the grant date fair value of share-based compensation programs that include market conditions are calculated using a Monte Carlo simulation pricing model and the grant date fair value of stock option grants are calculated using the Black-Scholes valuation model. Additionally, certain of our market condition share-based compensation programs also contain pre-defined financial performance conditions, including FFO per share, FAD per share growth, and debt to EBITDA ratio goals which can impact the number of restricted stock units ultimately earned. This variability relating to the level of the performance condition achieved requires management’s judgment and estimates, which impacts compensation cost recognized for these awards during the performance period. As of
December 31, 2017
, the performance condition for certain of our outstanding market condition share-based compensation programs has been met and compensation cost for these awards is no longer variable. For these awards, although the number of restricted stock units ultimately earned remains variable subject to the ultimate achievement level of the market condition, compensation cost is no longer variable for these awards as the market condition was already taken into consideration as part of the grant date fair value calculation. As of
December 31, 2017
, there are certain outstanding share-based compensation awards where the performance conditions have not all yet been met. For these awards, compensation cost and the number of restricted stock units ultimately earned remains variable.
For the years ended
December 31, 2017
,
2016
, and
2015
we recorded approximately
$14.5 million
,
$16.6 million
, and
$11.5 million
, respectively, of compensation cost related to programs that were subject to such valuation models. If the valuation of the grant date fair value for such programs changed by 10%, the potential impact to our net income available to common stockholders would be approximately
$1.1 million
,
$1.4 million
, and
$1.0 million
for the years ended
December 31, 2017
,
2016
, and
2015
, respectively.
Factors That May Influence Future Results of Operations
Development Program
We believe that a portion of our long-term future growth will continue to come from the completion of our in-process development projects and, subject to market conditions, executing on our near-term and future development pipeline, including expanding entitlements. Over the past several years, we increased our focus on development opportunities and expanded our near-term and future development pipeline through targeted acquisitions of development opportunities on the West Coast.
60
We have a proactive planning process by which we continually evaluate the size, timing, costs and scope of our development program and, as necessary, scale activity to reflect the economic conditions and the real estate fundamentals that exist in our submarkets. We expect to execute on our development program with prudence and will be pursuing opportunities with attractive economic returns in strategic locations with proximity to public transportation or transportation access and retail amenities and in markets with strong fundamentals and visible demand. We plan to develop in phases as appropriate and we generally favor starting projects that are pre-leased.
Stabilized Development Projects
In
2017
, we added the following project to our stabilized portfolio since the project had reached one year from building shell substantial completion:
|
•
|
Columbia Square Phase 2 - Office, located in the heart of Hollywood, California, two blocks from the corner of Sunset Boulevard and Vine Street. This project is comprised of three buildings totaling approximately
365,359
rentable square feet with a total estimated investment of approximately
$230.0 million
. The project was added to the stabilized portfolio during the first quarter of 2017 and was
95.3%
occupied and
100%
leased as of
December 31, 2017
.
|
Projects Under Construction
As of
December 31, 2017
, we had
four
projects in our in-process development pipeline that were under construction.
|
•
|
The Exchange on 16th, Mission Bay, San Francisco, California, which we acquired in May 2014 and commenced construction on in June 2015. This project is currently anticipated to encompass approximately
750,000
gross rentable square feet consisting of 736,000 square feet of office space and 14,000 square feet of retail space at a total estimated investment of
$570.0 million
. Construction is currently in progress and the building and core shell are currently estimated to be completed in the first half of 2018. The office space in the project is 100% leased to Dropbox, Inc. The lease with Dropbox, Inc. will commence in phases beginning in the fourth quarter of 2018 through the fourth quarter of 2019.
|
|
•
|
333 Dexter, South Lake Union, Washington, which we acquired in February 2015 and commenced construction on in June 2017. This project encompasses approximately
650,000
gross rentable square feet of office space at a total estimated investment of
$380.0 million
. Construction is currently in progress and the building core and shell are currently estimated to be completed in the second half of 2019.
|
|
•
|
100 Hooper, San Francisco, California, which we acquired in July 2015 and commenced construction on in November 2016. This project will encompass approximately
314,000
square feet of office and approximately
86,000
square feet of production, distribution and repair (“PDR”) space configured in two, four-story buildings. The total estimated cost for this project is approximately
$270.0 million
. Construction is currently in process and the core and shell of the project are currently expected to be completed in the first half of 2018. The office portion of the project is
100%
pre-leased to Adobe Systems Inc. In connection with 100 Hooper, the Company is also developing an adjacent 59,000 square foot PDR building located at 150 Hooper with a total estimated investment of approximately
$22.0 million
.
|
|
•
|
One Paseo - Phase I (Retail and Residential), San Diego, California, which we acquired in November 2007 and commenced construction on in December 2016. Phase I of this mixed-use project includes site work and related infrastructure for the entire project, as well as
237
residential units and approximately
96,000
square feet of retail space. The total estimated investment for this phase of the project is approximately
$235.0 million
. Construction is currently in process and is currently expected to be completed in phases beginning in the third quarter of 2018.
|
Near-Term and Future Development Pipeline
As of
December 31, 2017
, our near-term development pipeline included
three
future projects located in San Diego County and Los Angeles with an aggregate cost basis of approximately
$284.2 million
, at which we believe we could
61
develop approximately
1.4 million
rentable square feet at a total estimated investment of approximately
$990.0 million
, depending on market conditions.
The following table sets forth information about our near-term development pipeline.
|
Near-Term Development Pipeline
(1)
|
Location
|
Potential Start Date
(2)
|
Approx. Developable Square Feet
|
Total Estimated Investment
|
Total Costs as of 12/31/2017
(3)
(in millions)
|
|||||||||
|
Academy & Vine
(4)
|
Hollywood
|
2018
|
545,000
|
$
|
450
|
|
$
|
87.7
|
|
|||||
|
2136-2174 Kettner Blvd.
(5)
|
Little Italy
|
2018
|
175,000
|
110
|
|
21.9
|
|
|||||||
|
One Paseo - Phases II and III
(6)
|
Del Mar
|
TBD
|
640,000
|
430
|
|
174.6
|
|
|||||||
|
Total Near-Term Development Pipeline
|
1,360,000
|
$
|
990
|
|
$
|
284.2
|
|
|||||||
________________________
|
(1)
|
Project timing, costs, developable square feet and scope could change materially from estimated data provided due to one or more of the following: any significant changes in the economy, market conditions, our markets, tenant requirements and demands, construction costs, new office supply, regulatory and entitlement processes, and project design.
|
|
(2)
|
Actual commencement is subject to extensive evaluation and consideration of market conditions and economic factors.
|
|
(3)
|
Represents cash paid and costs incurred as of
December 31, 2017
.
|
|
(4)
|
In January 2018, we commenced construction on Phase I of this project.
|
|
(5)
|
The Company acquired this development site located in the Little Italy submarket of San Diego during the fourth quarter.
|
|
(6)
|
Development for this project will occur in phases. Phases II and III, comprised of residential and office, will commence subject to market conditions and economic factors.
|
As of
December 31, 2017
, our longer term future development pipeline included additional undeveloped land holdings located in the San Francisco Bay Area and two submarkets in San Diego county with an aggregate cost basis of approximately
$317.4 million
, at which we believe we could develop more than
2.5 million
rentable square feet, depending on successfully obtaining entitlements and market conditions.
Fluctuations in our development activities could cause fluctuations in the average development asset balances qualifying for interest and other carrying cost and internal cost capitalization in future periods. During the years ended
December 31, 2017
and
2016
, we capitalized interest on in-process development projects and development pipeline projects with an average aggregate cost basis of approximately
$1.0 billion
and
$1.1 billion
, respectively, as it was determined these projects qualified for interest and other carrying cost capitalization under GAAP. For the years ended
December 31, 2017
and
2016
, we capitalized
$46.5 million
and
$49.5 million
, respectively, of interest to our qualifying development projects. For the years ended
December 31, 2017
and
2016
, we capitalized
$23.2 million
and
$19.0 million
respectively, of internal costs to our qualifying redevelopment and development projects.
Capital Recycling Program
. We continuously evaluate opportunities for the potential disposition of properties and undeveloped land in our portfolio or the formation of strategic ventures with the intent of recycling the proceeds generated into capital used to fund new operating and development acquisitions, to finance development and redevelopment expenditures, to repay long-term debt and for other general corporate purposes. As part of this strategy, we attempt to enter into Section 1031 Exchanges and other tax deferred transaction structures, when possible, to defer some or all of the taxable gains on the sales, if any, for federal and state income tax purposes. See the “Liquidity and Capital Resources of the Operating Partnership – Liquidity Sources” section for further information regarding our capital recycling strategy.
In connection with our capital recycling strategy, during
2017
, we completed the sale of
eleven
office properties and
one
undeveloped land parcel to unaffiliated third parties for total gross sales proceeds of
$186.6 million
. During
2016
, we completed the sale of
six
office properties and
five
undeveloped land parcels to unaffiliated third parties for total gross sales proceeds of
$330.7 million
. During
2016
, we also entered into agreements with Norges Bank Real Estate Management (“NBREM”) whereby NBREM invested, through REIT subsidiaries, in two existing wholly-owned companies that each owned an office property located in San Francisco, California. Based on a gross valuation of the two properties of approximately
$1.2 billion
, NBREM contributed a total of
$452.9 million
for a
44%
common equity interest in the
two
companies, which was net of approximately
$55.3 million
of its proportionate share of the existing mortgage debt, as well as a working capital contribution of
$5.0 million
. (See Note 11 “Noncontrolling Interests on the Company’s Consolidated Financial Statements” to our consolidated financial statements included in this report for additional information.)
62
The timing of any potential future disposition or strategic venture transactions will depend on market conditions and other factors, including but not limited to our capital needs and our ability to defer some or all of the taxable gains on the sales. We cannot assure that we will dispose of any additional properties, enter into any additional strategic ventures, or that we will be able to identify and complete the acquisition of a suitable replacement property to effect a Section 1031 Exchange or be able to use other tax deferred structures in connection with our strategy. See the “Liquidity and Capital Resources of the Operating Partnership – Liquidity Sources” section for further information.
Acquisitions
. As part of our growth strategy, which is highly dependent on market conditions and business cycles, among other factors, we continue to evaluate strategic opportunities and remain a disciplined buyer of development and redevelopment opportunities as well as value-add operating properties. We continue to focus on growth opportunities in West Coast markets populated by knowledge and creative based tenants in a variety of industries, including technology, media, healthcare, life sciences, entertainment and professional services. Against the backdrop of market volatility, we expect to manage a strong balance sheet, execute on our development program and selectively evaluate opportunities that either add immediate Net Operating Income to our portfolio or play a strategic role in our future growth.
During the year ended
December 31, 2017
, we acquired a
1.2
acre development site in the Little Italy neighborhood of downtown San Diego, CA for
$19.4 million
in cash. During
2016
, we acquired
seven
buildings in three transactions for an aggregate purchase price of approximately
$394.6 million
, and one land parcel for
$31.0 million
in cash and the issuance of
867,701
common units in the Operating Partnership valued at approximately
$48.0 million
. We generally finance our acquisitions through proceeds from the issuance of debt and equity securities, borrowings under our unsecured revolving credit facility, proceeds from our capital recycling program, the assumption of existing debt and cash flows from operations.
We cannot provide assurance that we will enter into any agreements to acquire properties, or undeveloped land, or that the potential acquisitions contemplated by any agreements we may enter into in the future will be completed. In addition, acquisitions are subject to various risks and uncertainties and we may be unable to complete an acquisition after making a nonrefundable deposit or incurring acquisition-related costs. As of
December 31, 2017
, we had
$36.0 million
of refundable acquisition deposits, subject to closing conditions required to be met by the sellers, for potential future acquisitions.
Incentive Compensation
. Our Executive Compensation Committee determines compensation, including cash bonuses and equity incentives, for our executive officers. For
2017
, the annual cash bonus program was structured to allow the Executive Compensation Committee to evaluate a variety of key quantitative and qualitative metrics at the end of the year and make a determination based on the Company’s and management’s overall performance. Our Executive Compensation Committee also grants equity incentive awards from time to time that include performance-based and/or market-measure based vesting requirements and/or time-based vesting requirements. As a result, accrued incentive compensation and compensation expense for future awards may be affected by our operating and development performance, financial results, stock price, performance against applicable performance-based vesting goals, market conditions, liquidity measures, and other factors. Consequently, we cannot predict the amounts that will be recorded in future periods related to such incentive compensation.
As of
December 31, 2017
, there was approximately
$27.2 million
of total unrecognized compensation cost related to outstanding nonvested shares of restricted common stock and RSUs issued under share-based compensation arrangements. Those costs are expected to be recognized over a weighted-average period of
1.9
years. The
$27.2 million
of unrecognized compensation cost does not reflect the future compensation cost for any potential share-based awards that may be issued subsequent to
December 31, 2017
. Share-based compensation expense for potential future awards could be affected by our operating and development performance, financial results, stock price, performance against applicable performance-based vesting goals, market conditions and other factors.
Information on Leases Commenced and Executed
Leasing Activity and Changes in Rental Rates
. The amount of net rental income generated by our properties depends principally on our ability to maintain the occupancy rates of currently leased space and to lease currently available space, newly developed or redeveloped properties, newly acquired properties with vacant space, and space
63
available from unscheduled lease terminations. The amount of rental income we generate also depends on our ability to maintain or increase rental rates in our submarkets. Negative trends in one or more of these factors could adversely affect our rental income in future periods. The following tables set forth certain information regarding leasing activity for our stabilized portfolio during the
year
ended
December 31, 2017
.
For Leases Commenced
|
1st & 2nd Generation
(1)(2)
|
2nd Generation
(1)(2)
|
||||||||||||||||||||||||||
|
Number of
Leases
(3)
|
Rentable
Square Feet
(3)
|
TI/LC per
Sq. Ft.
(4)
|
Changes in
Rents
(5)(6)
|
Changes in
Cash Rents
(7)
|
Retention Rates
(8)
|
Weighted Average Lease Term (in months)
|
|||||||||||||||||||||
|
New
|
Renewal
|
New
|
Renewal
|
||||||||||||||||||||||||
|
Year Ended December 31, 2017
|
88
|
|
68
|
|
980,907
|
|
944,865
|
|
$
|
48.51
|
|
29.8
|
%
|
15.1
|
%
|
48.0
|
%
|
72
|
|
||||||||
For Leases Executed
(9)
|
1st & 2nd Generation
(1)(2)
|
2nd Generation
(1)(2)
|
|||||||||||||||||||||||
|
Number of Leases
(3)
|
Rentable Square Feet
(3)
|
TI/LC per Sq. Ft.
(4)
|
Changes in
Rents
(5)(6)
|
Changes in
Cash Rents
(7)
|
Weighted Average Lease Term
(in months)
|
|||||||||||||||||||
|
New
|
Renewal
|
New
|
Renewal
|
|||||||||||||||||||||
|
Year Ended December 31, 2017
|
96
|
|
68
|
|
1,075,182
|
|
944,865
|
|
$
|
46.90
|
|
25.0
|
%
|
11.2
|
%
|
64
|
|
|||||||
_______________________
|
(1)
|
Includes 100% of consolidated property partnerships.
|
|
(2)
|
First generation leasing includes space where we have made capital expenditures that result in additional revenue generated when the space is re-leased. Second generation leasing includes space where we have made capital expenditures to maintain the current market revenue stream.
|
|
(3)
|
Represents leasing activity for leases that commenced or were signed during the period, including first and second generation space, net of month-to-month leases. Excludes leasing on new construction.
|
|
(4)
|
Tenant improvements and leasing commissions per square foot exclude tenant-funded tenant improvements.
|
|
(5)
|
Calculated as the change between GAAP rents for new/renewed leases and the expiring GAAP rents for the same space. Excludes leases for which the space was vacant longer than one year or vacant when the property was acquired.
|
|
(6)
|
Excludes commenced and executed leases of approximately
260,775
and
497,423
rentable square feet, respectively, for the year ended
December 31, 2017
, for which the space was vacant longer than one year or being leased for the first time. Space vacant for more than one year is excluded from our change in rents calculations to provide a more meaningful market comparison.
|
|
(7)
|
Calculated as the change between stated rents for new/renewed leases and the expiring stated rents for the same space. Excludes leases for which the space was vacant longer than one year or vacant when the property was acquired.
|
|
(8)
|
Calculated as the percentage of space either renewed or expanded into by existing tenants or subtenants at lease expiration.
|
|
(9)
|
For the year ended
December 31, 2017
,
31
new leases totaling
587,450
rentable square feet were signed but not commenced as of
December 31, 2017
.
|
As of
December 31, 2017
, we believe that the weighted average cash rental rates for our total stabilized portfolio, are approximately
15%
below the current average market rental rates, which includes a projection that the weighted average cash rental rates for our San Diego stabilized portfolio are approximately
7%
above
current market rental rates. Individual properties within any particular submarket presently may be leased either above, below, or at the current market rates within that submarket, and the average rental rates for individual submarkets may be above, below, or at the average cash rental rate of our portfolio.
Our rental rates and occupancy are impacted by general economic conditions, including the pace of regional economic growth and access to capital. Therefore, we cannot give any assurance that leases will be renewed or that available space will be re-leased at rental rates equal to or above the current market rates. Additionally, decreased demand and other negative trends or unforeseeable events that impair our ability to timely renew or re-lease space could have further negative effects on our future financial condition, results of operations, and cash flows.
64
Scheduled Lease Expirations
. The following tables set forth certain information regarding our lease expirations for our stabilized portfolio for the next five years and by region for the next two years.
Lease Expirations
(1)
|
Year of Lease Expiration
|
Number of
Expiring
Leases
|
Total Square Feet
|
% of Total Leased Sq. Ft.
|
Annualized Base Rent
(2)(3)
|
% of Total Annualized Base Rent
(2)
|
Annualized Base Rent per Sq. Ft.
(2)
|
||||||||||||||
|
2018
|
71
|
|
1,156,410
|
|
9.0
|
%
|
$
|
48,736
|
|
8.6
|
%
|
$
|
42.14
|
|
||||||
|
2019
|
101
|
|
1,527,185
|
|
11.9
|
%
|
59,046
|
|
10.4
|
%
|
38.66
|
|
||||||||
|
2020
|
108
|
|
1,865,026
|
|
14.5
|
%
|
72,896
|
|
12.8
|
%
|
39.09
|
|
||||||||
|
2021
|
88
|
|
1,031,097
|
|
8.0
|
%
|
45,156
|
|
7.9
|
%
|
43.79
|
|
||||||||
|
2022
|
57
|
|
576,364
|
|
4.5
|
%
|
23,636
|
|
4.1
|
%
|
41.01
|
|
||||||||
|
Total
|
425
|
|
6,156,082
|
|
47.9
|
%
|
$
|
249,470
|
|
43.8
|
%
|
$
|
40.52
|
|
||||||
|
Year
|
Region
|
# of
Expiring Leases
|
Total
Square Feet
|
% of Total
Leased Sq. Ft.
|
Annualized
Base Rent
(2)(3)
|
% of Total
Annualized
Base Rent
(2)
|
Annualized Rent
per Sq. Ft.
(2)
|
|||||||||||||||
|
2018
|
Los Angeles
|
44
|
|
227,054
|
|
1.8
|
%
|
$
|
7,983
|
|
1.4
|
%
|
$
|
35.16
|
|
|||||||
|
Orange County
|
2
|
|
9,879
|
|
0.1
|
%
|
251
|
|
—
|
%
|
25.41
|
|
||||||||||
|
San Diego
|
9
|
|
444,949
|
|
3.4
|
%
|
20,356
|
|
3.6
|
%
|
45.75
|
|
||||||||||
|
San Francisco Bay Area
|
7
|
|
260,676
|
|
2.0
|
%
|
13,403
|
|
2.4
|
%
|
51.42
|
|
||||||||||
|
Greater Seattle
|
9
|
|
213,852
|
|
1.7
|
%
|
6,743
|
|
1.2
|
%
|
31.53
|
|
||||||||||
|
Total
|
71
|
|
1,156,410
|
|
9.0
|
%
|
$
|
48,736
|
|
8.6
|
%
|
$
|
42.14
|
|
||||||||
|
2019
|
Los Angeles
|
40
|
|
297,337
|
|
2.3
|
%
|
$
|
9,299
|
|
1.6
|
%
|
$
|
31.27
|
|
|||||||
|
Orange County
|
6
|
|
77,875
|
|
0.6
|
%
|
3,234
|
|
0.6
|
%
|
41.53
|
|
||||||||||
|
San Diego
|
15
|
|
195,661
|
|
1.5
|
%
|
7,209
|
|
1.3
|
%
|
36.84
|
|
||||||||||
|
San Francisco Bay Area
|
23
|
|
737,243
|
|
5.8
|
%
|
32,251
|
|
5.7
|
%
|
43.75
|
|
||||||||||
|
Greater Seattle
|
17
|
|
219,069
|
|
1.7
|
%
|
7,053
|
|
1.2
|
%
|
32.20
|
|
||||||||||
|
Total
|
101
|
|
1,527,185
|
|
11.9
|
%
|
$
|
59,046
|
|
10.4
|
%
|
$
|
38.66
|
|
||||||||
________________________
|
(1)
|
For leases that have been renewed early with existing tenants, the expiration date and annualized base rent information presented takes into consideration the renewed lease terms. Excludes leases not commenced as of
December 31, 2017
, space leased under month-to-month leases, storage leases, vacant space and future lease renewal options not executed as of
December 31, 2017
.
|
|
(2)
|
Annualized base rent includes the impact of straight-lining rent escalations and the amortization of free rent periods and excludes the impact of the following: amortization of deferred revenue related tenant-funded tenant improvements, amortization of above/below market rents, amortization for lease incentives due under existing leases, and expense reimbursement revenue. Additionally, the underlying leases contain various expense structures including full service gross, modified gross and triple net. Percentages represent percentage of total portfolio annualized contractual base rental revenue. For additional information on tenant improvement and leasing commission costs incurred by the Company for the current reporting period, please see further discussion under the caption “Information on Leases Commenced and Executed.”
|
|
(3)
|
Includes 100% of annualized base rent of consolidated property partnerships.
|
In addition to the
0.7 million
rentable square feet, or
4.8%
, of currently available space in our stabilized portfolio, leases representing approximately
9.0%
and
11.9%
of the occupied square footage of our stabilized portfolio are scheduled to expire during
2018
and
2019
, respectively. The leases scheduled to expire in
2018
and
2019
represent approximately
2.7 million
rentable square feet, or
19%
, of our total annualized base rental revenue. Individual properties within any particular submarket presently may be leased either above, below, or at the current quoted market rates within that submarket. Our ability to re-lease available space depends upon both general market conditions and the market conditions in the specific regions in which individual properties are located.
For the approximately
1.2 million
rentable square feet, or
8.6%
, of our total annualized base rental revenue scheduled to expire in
2018
, we believe that the weighted average cash rental rates for our overall portfolio are approximately
at current average market rental rates, except in our San Francisco and San Diego submarkets where we currently believe these expiring leases are approximately 25% below market and 30% above market, respectively.
For the approximately
1.5 million
rentable square feet, or
10.4%
, of our total annualized base rental revenue scheduled to expire in
2019
, we believe that the weighted average cash rental rates for our overall portfolio are
65
approximately 20% below current average market rental rates, primarily due our Los Angeles and San Francisco submarkets where we currently believe these expiring leases are approximately 25% below market and 30% below market, respectively.
Stabilized Portfolio Information
As of
December 31, 2017
, our stabilized portfolio was comprised of
101
office properties encompassing an aggregate of approximately
13.7 million
rentable square feet and
200
residential units. Our stabilized portfolio includes all of our properties with the exception of development and redevelopment properties currently under construction or committed for construction, “lease-up” properties, real estate assets held for sale and undeveloped land. We define redevelopment properties as those properties for which we expect to spend significant development and construction costs on the existing or acquired buildings pursuant to a formal plan, the intended result of which is a higher economic return on the property. We define “lease-up” properties as office and retail properties we recently developed or redeveloped that have not yet reached
95%
occupancy and are within one year following cessation of major construction activities. We did not have any “lease-up,” redevelopment or held for sale properties at December 31, 2017. Our stabilized portfolio also excludes our near-term and future development pipeline, which as of
December 31, 2017
was comprised of
six
potential development sites, representing approximately
48
gross acres of undeveloped land on which we believe we have the potential to develop over
4.3 million
square feet of office space, depending upon economic conditions.
As of
December 31, 2017
, the following properties were excluded from our stabilized portfolio:
|
Number of
Properties/Projects
|
Estimated Office Rentable
Square Feet
|
|||
|
Development projects under construction
(1) (2)
|
4
|
1,800,000
|
|
|
_______________
|
(1)
|
Estimated rentable square feet upon completion.
|
|
(2)
|
Development projects under construction also include
96,000
square feet of retail space and
237
residential units in addition to the estimated office rentable square feet noted above.
|
The following table reconciles the changes in the rentable square feet in our stabilized office portfolio of operating properties from
December 31, 2016
to
December 31, 2017
:
|
|
Number of
Buildings
|
Rentable
Square Feet
|
|||
|
Total as of December 31, 2016
|
108
|
|
14,025,856
|
|
|
|
Completed development properties placed in-service
|
3
|
|
365,359
|
|
|
|
Dispositions
(1)
|
(10
|
)
|
(675,143
|
)
|
|
|
Remeasurement
|
—
|
|
4,525
|
|
|
|
Total as of December 31, 2017
(2)
|
101
|
|
13,720,597
|
|
|
________________________
|
(1)
|
Excludes the disposition of a property reported as held for sale as of
December 31, 2016
.
|
|
(2)
|
Includes
four
properties owned by consolidated property partnerships (see Note 2 “Basis of Presentation and Significant Accounting Policies” to our consolidated financial statements included in this report for additional information).
|
66
Occupancy Information
The following table sets forth certain information regarding our stabilized portfolio:
Stabilized Portfolio Occupancy
|
Region
|
Number of
Buildings |
Rentable Square Feet
|
Occupancy at
(1)
|
|||||||||||
|
12/31/2017
|
12/31/2016
|
12/31/2015
|
||||||||||||
|
Los Angeles and Ventura Counties
|
36
|
|
4,181,733
|
|
93.3
|
%
|
95.0
|
%
|
95.1
|
%
|
||||
|
Orange County
|
1
|
|
271,556
|
|
86.6
|
%
|
97.8
|
%
|
94.0
|
%
|
||||
|
San Diego County
|
21
|
|
2,043,645
|
|
97.4
|
%
|
93.2
|
%
|
89.6
|
%
|
||||
|
San Francisco Bay Area
|
31
|
|
5,157,524
|
|
96.1
|
%
|
97.6
|
%
|
98.1
|
%
|
||||
|
Greater Seattle
|
12
|
|
2,066,139
|
|
95.4
|
%
|
97.2
|
%
|
95.1
|
%
|
||||
|
Total Stabilized Portfolio
|
101
|
|
13,720,597
|
|
95.2
|
%
|
96.0
|
%
|
94.8
|
%
|
||||
|
Average Occupancy
|
|||||
|
Year Ended December 31,
|
|||||
|
2017
|
2016
|
||||
|
Stabilized Portfolio
(1)
|
94.1
|
%
|
95.5
|
%
|
|
|
Same Store Portfolio
(2)
|
94.7
|
%
|
96.5
|
%
|
|
|
Residential Portfolio
(3)
|
70.2
|
%
|
46.0
|
%
|
|
__________________________________
|
(1)
|
Occupancy percentages reported are based on our stabilized office portfolio as of the end of the period presented and exclude occupancy percentages of properties held for sale.
|
|
(2)
|
Occupancy percentages reported are based on office properties owned and stabilized as of January 1,
2016
and still owned and stabilized as of
December 31, 2017
. See discussion under “Results of Operations” for additional information.
|
|
(3)
|
Our residential portfolio consists of our 200-unit residential tower located in Hollywood, California. For the year ended December 31, 2016, represents occupancy at December 31, 2016.
|
67
Results of Operations
Comparison of the Year Ended
December 31, 2017
to the Year Ended
December 31, 2016
Net Operating Income
Management internally evaluates the operating performance and financial results of our stabilized portfolio based on Net Operating Income. We define “Net Operating Income” as consolidated operating revenues (rental income, tenant reimbursements and other property income) less consolidated operating expenses (property expenses, real estate taxes, provision for bad debts and ground leases).
Net Operating Income is considered by management to be an important and appropriate supplemental performance measure to net income because we believe it helps both investors and management to understand the core operations of our properties excluding corporate and financing-related costs and non-cash depreciation and amortization. Net Operating Income is an unlevered operating performance metric of our properties and allows for a useful comparison of the operating performance of individual assets or groups of assets. This measure thereby provides an operating perspective not immediately apparent from GAAP income from operations or net income. In addition, Net Operating Income is considered by many in the real estate industry to be a useful starting point for determining the value of a real estate asset or group of assets. Other real estate companies may use different methodologies for calculating Net Operating Income, and accordingly, our presentation of Net Operating Income may not be comparable to other real estate companies. Because of the exclusion of the items shown in the reconciliation below, Net Operating Income should only be used as a supplemental measure of our financial performance and not as an alternative to GAAP income from operations or net income.
Management further evaluates Net Operating Income by evaluating the performance from the following property groups:
|
•
|
Same Store Properties – includes the consolidated results of all of the office properties that were owned and included in our stabilized portfolio for two comparable reporting periods, i.e., owned and included in our stabilized portfolio as of January 1,
2016
and still owned and included in the stabilized portfolio as of
December 31, 2017
;
|
|
•
|
Stabilized Development Properties – includes the results generated by the following:
|
|
◦
|
One office development project that was added to the stabilized portfolio in the first quarter of 2017;
|
|
◦
|
Two office development projects that were completed and stabilized in March 2016;
|
|
◦
|
Our residential project that was completed in June 2016; and
|
|
◦
|
One office development project that was added to the stabilized portfolio in the fourth quarter of 2016;
|
|
•
|
Acquisition Properties – includes the results, from the dates of acquisition through the periods presented, for the four office and three retail buildings we acquired in during 2016; and
|
|
•
|
Dispositions and Other Properties – includes the results of the
ten
properties disposed of in the third quarter of 2017, the
one
property disposed of during the first quarter of 2017, the
six
properties disposed of in 2016 and expenses for certain of our in-process, near-term and future development projects.
|
The following table sets forth certain information regarding the property groups within our stabilized office portfolio as of
December 31, 2017
.
|
Group
|
# of Buildings
|
Rentable
Square Feet
|
||||
|
Same Store Properties
|
88
|
|
12,182,805
|
|
||
|
Stabilized Development Properties
|
6
|
|
1,079,333
|
|
||
|
Acquisition Properties
|
7
|
|
458,459
|
|
||
|
Total Stabilized Portfolio
|
101
|
13,720,597
|
|
|||
68
The following table summarizes our Net Operating Income, as defined, for our total portfolio for the years ended
December 31, 2017
and
2016
.
|
|
Year Ended December 31,
|
Dollar
Change
|
Percentage
Change
|
|||||||||||
|
|
2017
|
2016
|
||||||||||||
|
|
($ in thousands)
|
|||||||||||||
|
Reconciliation of Net Income Available to Common Stockholders to Net Operating Income, as defined:
|
||||||||||||||
|
Net Income Available to Common Stockholders
|
$
|
151,249
|
|
$
|
280,538
|
|
$
|
(129,289
|
)
|
(46.1
|
)%
|
|||
|
Preferred dividends
|
5,774
|
|
13,250
|
|
(7,476
|
)
|
(56.4
|
)
|
||||||
|
Original issuance costs of redeemed preferred stock
|
7,589
|
|
—
|
|
7,589
|
|
100.0
|
|
||||||
|
Net income attributable to Kilroy Realty Corporation
|
164,612
|
|
293,788
|
|
(129,176
|
)
|
(44.0
|
)
|
||||||
|
Net income attributable to noncontrolling common units of the Operating Partnership
|
3,223
|
|
6,635
|
|
(3,412
|
)
|
(51.4
|
)
|
||||||
|
Net income attributable to noncontrolling interests in consolidated property partnerships
|
12,780
|
|
3,375
|
|
9,405
|
|
278.7
|
|
||||||
|
Net income
|
$
|
180,615
|
|
$
|
303,798
|
|
$
|
(123,183
|
)
|
(40.5
|
)%
|
|||
|
Unallocated expense (income):
|
|
|
||||||||||||
|
General and administrative expenses
|
60,581
|
|
57,029
|
|
3,552
|
|
6.2
|
|
||||||
|
Acquisition-related expenses
|
—
|
|
1,902
|
|
(1,902
|
)
|
(100.0
|
)
|
||||||
|
Depreciation and amortization
|
245,886
|
|
217,234
|
|
28,652
|
|
13.2
|
|
||||||
|
Interest income and other net investment gains
|
(5,503
|
)
|
(1,764
|
)
|
(3,739
|
)
|
212.0
|
|
||||||
|
Interest expense
|
66,040
|
|
55,803
|
|
10,237
|
|
18.3
|
|
||||||
|
Loss on early extinguishment of debt
|
5,312
|
|
—
|
|
5,312
|
|
100.0
|
|
||||||
|
Net (gain) loss on sales of land
|
(449
|
)
|
295
|
|
(744
|
)
|
(252.2
|
)
|
||||||
|
Gains on sales of depreciable operating properties
|
(39,507
|
)
|
(164,302
|
)
|
124,795
|
|
(76.0
|
)
|
||||||
|
Net Operating Income, as defined
|
$
|
512,975
|
|
$
|
469,995
|
|
$
|
42,980
|
|
9.1
|
%
|
|||
69
The following tables summarize our Net Operating Income, as defined, for our total portfolio for the years ended
December 31, 2017
and
2016
.
|
Year Ended December 31,
|
|||||||||||||||||||||||||||||||||||||||
|
|
2017
|
2016
|
|||||||||||||||||||||||||||||||||||||
|
Same
Store
|
Stabilized Develop-ment
|
Acquisitions
|
Disposi-tions & Other
|
Total
|
Same
Store
|
Stabilized Develop-ment
|
Acquisitions
|
Disposi-tions & Other
|
Total
|
||||||||||||||||||||||||||||||
|
(in thousands)
|
(in thousands)
|
||||||||||||||||||||||||||||||||||||||
|
Operating revenues:
|
|||||||||||||||||||||||||||||||||||||||
|
Rental income
|
$
|
520,312
|
|
$
|
72,411
|
|
$
|
29,358
|
|
$
|
11,815
|
|
$
|
633,896
|
|
$
|
515,813
|
|
$
|
36,737
|
|
$
|
4,250
|
|
$
|
17,613
|
|
$
|
574,413
|
|
|||||||||
|
Tenant reimbursements
|
57,411
|
|
10,027
|
|
7,687
|
|
1,434
|
|
76,559
|
|
50,472
|
|
7,363
|
|
922
|
|
2,322
|
|
61,079
|
|
|||||||||||||||||||
|
Other property income
|
6,093
|
|
345
|
|
821
|
|
1,287
|
|
8,546
|
|
1,499
|
|
93
|
|
53
|
|
5,435
|
|
7,080
|
|
|||||||||||||||||||
|
Total
|
583,816
|
|
82,783
|
|
37,866
|
|
14,536
|
|
719,001
|
|
567,784
|
|
44,193
|
|
5,225
|
|
25,370
|
|
642,572
|
|
|||||||||||||||||||
|
Property and related expenses:
|
|||||||||||||||||||||||||||||||||||||||
|
Property expenses
|
104,428
|
|
17,900
|
|
4,992
|
|
2,651
|
|
129,971
|
|
97,672
|
|
10,913
|
|
477
|
|
4,870
|
|
113,932
|
|
|||||||||||||||||||
|
Real estate taxes
|
47,543
|
|
10,553
|
|
6,321
|
|
2,032
|
|
66,449
|
|
45,468
|
|
6,408
|
|
446
|
|
2,884
|
|
55,206
|
|
|||||||||||||||||||
|
Provision for bad debts
|
1,755
|
|
(101
|
)
|
1,471
|
|
144
|
|
3,269
|
|
(124
|
)
|
116
|
|
50
|
|
(42
|
)
|
—
|
|
|||||||||||||||||||
|
Ground leases
|
3,927
|
|
—
|
|
2,410
|
|
—
|
|
6,337
|
|
3,356
|
|
—
|
|
83
|
|
—
|
|
3,439
|
|
|||||||||||||||||||
|
Total
|
157,653
|
|
28,352
|
|
15,194
|
|
4,827
|
|
206,026
|
|
146,372
|
|
17,437
|
|
1,056
|
|
7,712
|
|
172,577
|
|
|||||||||||||||||||
|
Net Operating Income, as defined
|
$
|
426,163
|
|
$
|
54,431
|
|
$
|
22,672
|
|
$
|
9,709
|
|
$
|
512,975
|
|
$
|
421,412
|
|
$
|
26,756
|
|
$
|
4,169
|
|
$
|
17,658
|
|
$
|
469,995
|
|
|||||||||
|
Year Ended December 31, 2017 as compared to the Year Ended December 31, 2016
|
||||||||||||||||||||||||||||||||||
|
Same Store
|
Stabilized Development
|
Acquisitions
|
Dispositions & Other
|
Total
|
||||||||||||||||||||||||||||||
|
Dollar Change
|
Percent Change
|
Dollar Change
|
Percent Change
|
Dollar Change
|
Percent Change
|
Dollar Change
|
Percent Change
|
Dollar Change
|
Percent Change
|
|||||||||||||||||||||||||
|
|
($ in thousands)
|
|||||||||||||||||||||||||||||||||
|
Operating revenues:
|
||||||||||||||||||||||||||||||||||
|
Rental income
|
$
|
4,499
|
|
0.9
|
%
|
$
|
35,674
|
|
97.1
|
%
|
$
|
25,108
|
|
590.8
|
%
|
$
|
(5,798
|
)
|
(32.9
|
)%
|
$
|
59,483
|
|
10.4
|
%
|
|||||||||
|
Tenant reimbursements
|
6,939
|
|
13.7
|
|
2,664
|
|
36.2
|
|
6,765
|
|
733.7
|
|
(888
|
)
|
(38.2
|
)
|
15,480
|
|
25.3
|
|
||||||||||||||
|
Other property income
|
4,594
|
|
306.5
|
|
252
|
|
271.0
|
|
768
|
|
NM*
|
|
(4,148
|
)
|
(76.3
|
)
|
1,466
|
|
20.7
|
|
||||||||||||||
|
Total
|
16,032
|
|
2.8
|
|
38,590
|
|
87.3
|
|
32,641
|
|
624.7
|
|
(10,834
|
)
|
(42.7
|
)
|
76,429
|
|
11.9
|
|
||||||||||||||
|
Property and related expenses:
|
||||||||||||||||||||||||||||||||||
|
Property expenses
|
6,756
|
|
6.9
|
|
6,987
|
|
64.0
|
|
4,515
|
|
946.5
|
|
(2,219
|
)
|
(45.6
|
)
|
16,039
|
|
14.1
|
|
||||||||||||||
|
Real estate taxes
|
2,075
|
|
4.6
|
|
4,145
|
|
64.7
|
|
5,875
|
|
NM*
|
|
(852
|
)
|
(29.5
|
)
|
11,243
|
|
20.4
|
|
||||||||||||||
|
Provision for bad debts
|
1,879
|
|
NM*
|
|
(217
|
)
|
(187.1
|
)
|
1,421
|
|
NM*
|
|
186
|
|
442.9
|
|
3,269
|
|
100.0
|
|
||||||||||||||
|
Ground leases
|
571
|
|
17.0
|
|
—
|
|
—
|
|
2,327
|
|
NM*
|
|
—
|
|
—
|
|
2,898
|
|
84.3
|
|
||||||||||||||
|
Total
|
11,281
|
|
7.7
|
|
10,915
|
|
62.6
|
|
14,138
|
|
NM*
|
|
(2,885
|
)
|
(37.4
|
)
|
33,449
|
|
19.4
|
|
||||||||||||||
|
Net Operating Income,
as defined
|
$
|
4,751
|
|
1.1
|
%
|
$
|
27,675
|
|
103.4
|
%
|
$
|
18,503
|
|
443.8
|
%
|
$
|
(7,949
|
)
|
(45.0
|
)%
|
$
|
42,980
|
|
9.1
|
%
|
|||||||||
________________________
* Percentage not meaningful
70
Net Operating Income increased
$43.0 million
, or
9.1%
, for the year ended
December 31, 2017
as compared to the year ended
December 31, 2016
primarily resulting from:
|
•
|
An increase of
$4.8 million
attributable to the Same Store Properties primarily resulting from:
|
|
•
|
An increase in rental income of
$4.5 million
primarily due to the following:
|
|
◦
|
$14.3 million increase due primarily to new leases and renewals at higher overall average rental rates in the San Francisco Bay Area, Los Angeles and Greater Seattle regions; partially offset by
|
|
◦
|
$9.8 million decrease due to lease expirations and early terminations primarily in the San Francisco Bay Area;
|
|
•
|
An increase in tenant reimbursements of
$6.9 million
primarily due to:
|
|
◦
|
$3.8 million increase due to higher recurring expenses related to utilities, security, parking, contract services, repairs and maintenance and property taxes at certain properties;
|
|
◦
|
$0.9 million increase due to higher reimbursable supplemental in 2017 at two properties related to supplemental property tax adjustments and $1.6 million increase due to lower reimbursable supplemental taxes in 2016 as a result of a change in estimate at one property;
|
|
◦
|
$1.1 million increase due to lower abated tenant reimbursements as compared to the prior year in addition to increased tenant reimbursements from tenants with 2016 base years; partially offset by
|
|
◦
|
$0.5 million decrease due to lower occupancy primarily for two properties in the Greater Seattle region that are 100% and 83% leased as of the date of this filing;
|
|
•
|
An increase in other property income of
$4.6 million
primarily due to early lease termination fees in the San Francisco Bay Area and San Diego regions, of which $2.3 million was attributed to one lease; partially offset by
|
|
•
|
An increase in property and related expenses of
$11.3 million
primarily resulting from:
|
|
•
|
An increase of
$6.8 million
in
property expenses primarily resulting from:
|
|
◦
|
$5.1 million increase in certain recurring operating costs due to increased demand and higher rates related to utilities, security, parking and contract services, as well as higher repairs and maintenance and various other reimbursable expenses;
|
|
◦
|
$1.2 million increase in non-reimbursable expenses primarily due to $0.5 million of non-recurring legal expenses and a $0.4 million increase due to non-recurring parking facility costs;
|
|
◦
|
$0.5 million increase in property management personnel costs;
|
|
•
|
An increase of
$2.1 million
in real estate taxes primarily due to:
|
|
◦
|
$1.8 million from regular annual property tax increases in 2017;
|
|
◦
|
$2.9 million of lower supplemental taxes at three properties in the San Francisco Bay Area region in 2016; partially offset by
|
|
◦
|
$2.6 million reduction in 2017 supplemental taxes at one property that was redeveloped in 2013;
|
71
|
•
|
An increase of
$1.9 million
in provision for bad debts primarily related to one tenant; and
|
|
•
|
An increase of
$0.6 million
in ground rent primarily due to higher percentage ground rent for one of our ground leases in the Greater Seattle Area due to higher operating revenues at the related property;
|
|
•
|
An increase of
$27.7 million
attributable to the Stabilized Development Properties;
|
|
•
|
An increase of
$18.5 million
attributable to the Acquisition Properties; and
|
|
•
|
A decrease of
$7.9 million
attributable to the Dispositions & Other Properties primarily due to the following:
|
|
◦
|
$5.0 million of other property income received in 2016 relating to a property damage settlement; and
|
|
◦
|
$2.9 million of lower Net Operating Income primarily due dispositions that occurred in the third quarter of 2017.
|
Other Expenses and Income
General and Administrative Expenses
General and administrative expenses increased by approximately
$3.6 million
, or
6.2%
, for the year ended
December 31, 2017
compared to the year ended
December 31, 2016
primarily due to the following:
|
•
|
An increase of approximately $2.3 million related to higher payroll costs and office expenses related to the growth of the company; and
|
|
•
|
An increase of $1.3 million attributable to compensation expense related to the mark-to-market adjustment for the Company’s deferred compensation plan. The compensation expense was offset by gains on the underlying marketable securities included in interest income and other net investment gains in the consolidated statements of operations.
|
Depreciation and Amortization
Depreciation and amortization increased by approximately
$28.7 million
, or
13.2%
, for the year ended
December 31, 2017
compared to the year ended
December 31, 2016
, primarily due to the following:
|
•
|
An increase of $3.9 million attributable to the Same Store Properties;
|
|
•
|
An increase of $9.7 million attributable to the Stabilized Development Properties;
|
|
•
|
An increase of $18.0 million attributable to the Acquisition Properties; partially offset by
|
|
•
|
A decrease of $2.9 million attributable to the Dispositions & Other Properties.
|
72
Interest Expense
The following table sets forth our gross interest expense, including debt discounts/premiums and deferred financing cost amortization and capitalized interest, including capitalized debt discounts/premiums and loan cost amortization for the years ended
December 31, 2017
and
2016
.
|
Year Ended December 31,
|
Dollar
Change
|
Percentage
Change
|
||||||||||||
|
2017
|
2016
|
|||||||||||||
|
($ in thousands)
|
||||||||||||||
|
Gross interest expense
|
$
|
112,577
|
|
$
|
105,263
|
|
$
|
7,314
|
|
6.9
|
%
|
|||
|
Capitalized interest and deferred financing costs
|
(46,537
|
)
|
(49,460
|
)
|
2,923
|
|
5.9
|
|
||||||
|
Interest expense
|
$
|
66,040
|
|
$
|
55,803
|
|
$
|
10,237
|
|
18.3
|
%
|
|||
Gross interest expense, before the effect of capitalized interest and deferred financing costs, increased
$7.3 million
, or
6.9%
, for the year ended
December 31, 2017
as compared to the year ended
December 31, 2016
, primarily due to an increase in the average outstanding debt balance for the year ended
December 31, 2017
. Our weighted average interest rate, including loan fee amortization, was 4.5% and 4.6% for the years ended
December 31, 2017
and
2016
, respectively.
Capitalized interest decreased
$2.9 million
, or
5.9%
, for the year ended
December 31, 2017
compared to the year ended
December 31, 2016
, primarily attributable to a decrease in the average development asset balances qualifying for interest capitalization during
2017
as compared to
2016
.
Loss on Early Extinguishment of Debt
In December 2017, we early redeemed the
$325.0 million
aggregate principal amount of our outstanding
4.800%
unsecured senior notes that were scheduled to mature on
July 15, 2018
. In connection with our early redemption, we incurred a loss on early extinguishment of debt of
$5.3 million
which was comprised of
$5.0 million
representing the premium paid to the note holders at the redemption date $0.3 million for the write-off of unamortized discount and deferred financing costs.
Net income attributable to noncontrolling interests in consolidated property partnerships
Net income attributable to noncontrolling interests in consolidated property partnerships increased
$9.4 million
for the year ended
December 31, 2017
compared to the year ended
December 31, 2016
. The amount reported for the years ended
December 31, 2017
and
2016
are comprised of the noncontrolling interest’s share of net income for 100 First Member, LLC (“100 First LLC”) and 303 Second Street Member, LLC (“303 Second LLC”) for the period subsequent to the transaction closing dates on August 30, 2016 and November 30, 2016, respectively (see Note 11 “Noncontrolling Interests on the Company's Consolidated Financial Statements” to our consolidated financial statements included in this report for additional information), in addition to the noncontrolling interest’s share of net income for Redwood LLC.
Comparison of the Year Ended
December 31, 2016
to the Year Ended
December 31, 2015
Management evaluated Net Operating Income for the year ended
December 31, 2016
compared to the year ended
December 31, 2015
by evaluating the performance from the following property groups:
|
•
|
Same Store Properties – includes the results of all of the office properties that were owned and included in our stabilized portfolio for two comparable reporting periods, i.e., owned and included in our stabilized portfolio as of January 1,
2015
and still owned and included in the stabilized portfolio as of
December 31, 2016
;
|
|
•
|
Stabilized Development Properties – includes the results generated by the following:
|
73
|
◦
|
One office development project that was added to the stabilized portfolio in the fourth quarter of 2016;
|
|
◦
|
Two office development projects that were completed and stabilized in March 2016; and
|
|
◦
|
Two office development projects comprising four office buildings that were completed and stabilized in the fourth quarter of 2015;
|
|
•
|
Acquisition Properties – includes the results, from the dates of acquisition through the periods presented, for the
four
office and
three
retail buildings we acquired in three transactions during 2016; and
|
|
•
|
2016 Held for Sale, Dispositions, and Other Properties – includes the results of the
six
properties disposed of in 2016, the
ten
properties disposed of in 2015,
one
property held for sale at December 31, 2016,
one
office project in “lease-up” at December 31, 2016, the residential property completed in June 2016, and expenses for certain of our in-process, near-term and future development projects.
|
The following table sets forth certain information regarding the property groups within our stabilized portfolio as of
December 31, 2016
:
|
Group
|
# of Buildings
|
Rentable
Square Feet
|
||||
|
Same Store Properties
|
94
|
|
12,388,876
|
|
||
|
Stabilized Development and Redevelopment Properties
|
7
|
|
1,178,521
|
|
||
|
Acquisition Properties
|
7
|
|
458,459
|
|
||
|
Total Stabilized Portfolio
|
108
|
14,025,856
|
|
|||
The following tables summarize our Net Operating Income, as defined, for our total portfolio for the year ended
December 31, 2016
and
2015
.
|
|
Year Ended December 31,
|
Dollar
Change
|
Percentage
Change
|
|||||||||||
|
|
2016
|
2015
|
||||||||||||
|
|
($ in thousands)
|
|||||||||||||
|
Reconciliation of Net Income Available to Common Stockholders to Net Operating Income, as defined:
|
||||||||||||||
|
Net Income Available to Common Stockholders
|
$
|
280,538
|
|
$
|
220,831
|
|
$
|
59,707
|
|
27.0
|
%
|
|||
|
Preferred dividends
|
13,250
|
|
13,250
|
|
—
|
|
—
|
|
||||||
|
Net income attributable to Kilroy Realty Corporation
|
293,788
|
|
234,081
|
|
59,707
|
|
25.5
|
|
||||||
|
Net income attributable to noncontrolling common units of the Operating Partnership
|
6,635
|
|
4,339
|
|
2,296
|
|
52.9
|
|
||||||
|
Net income attributable to noncontrolling interests in consolidated property partnerships
|
3,375
|
|
184
|
|
3,191
|
|
1,734.2
|
|
||||||
|
Net income
|
$
|
303,798
|
|
$
|
238,604
|
|
$
|
65,194
|
|
27.3
|
%
|
|||
|
Unallocated expense (income):
|
||||||||||||||
|
General and administrative expenses
|
57,029
|
|
48,265
|
|
8,764
|
|
18.2
|
|
||||||
|
Acquisition-related expenses
|
1,902
|
|
497
|
|
1,405
|
|
282.7
|
|
||||||
|
Depreciation and amortization
|
217,234
|
|
204,294
|
|
12,940
|
|
6.3
|
|
||||||
|
Interest income and other net investment (gains) losses
|
(1,764
|
)
|
(243
|
)
|
(1,521
|
)
|
625.9
|
|
||||||
|
Interest expense
|
55,803
|
|
57,682
|
|
(1,879
|
)
|
(3.3
|
)
|
||||||
|
Net loss (gain) on sales of land
|
295
|
|
(17,116
|
)
|
17,411
|
|
(101.7
|
)
|
||||||
|
Gains on sales of depreciable operating properties
|
(164,302
|
)
|
(109,950
|
)
|
(54,352
|
)
|
49.4
|
|
||||||
|
Net Operating Income, as defined
|
$
|
469,995
|
|
$
|
422,033
|
|
$
|
47,962
|
|
11.4
|
%
|
|||
74
The following tables summarize our Net Operating Income, as defined, for our total portfolio for the year ended
December 31, 2016
and
2015
.
|
Year Ended December 31,
|
|||||||||||||||||||||||||||||||||||||||
|
|
2016
|
2015
|
|||||||||||||||||||||||||||||||||||||
|
Same
Store
|
Stabilized Develop-ment
|
Acquisitions
|
2016 Held for Sale Dispositi-ons & Other
|
Total
|
Same
Store
|
Stabilized Develop-ment
|
Acquisitions
|
2016 Held for Sale Dispositi-ons & Other
|
Total
|
||||||||||||||||||||||||||||||
|
(in thousands)
|
(in thousands)
|
||||||||||||||||||||||||||||||||||||||
|
Operating revenues:
|
|||||||||||||||||||||||||||||||||||||||
|
Rental income
|
$
|
502,606
|
|
$
|
59,779
|
|
$
|
4,250
|
|
$
|
7,778
|
|
$
|
574,413
|
|
$
|
486,905
|
|
$
|
7,173
|
|
$
|
—
|
|
$
|
31,277
|
|
$
|
525,355
|
|
|||||||||
|
Tenant reimbursements
|
47,641
|
|
12,099
|
|
922
|
|
417
|
|
61,079
|
|
48,305
|
|
324
|
|
—
|
|
5,145
|
|
53,774
|
|
|||||||||||||||||||
|
Other property income
|
1,915
|
|
22
|
|
53
|
|
5,090
|
|
7,080
|
|
1,958
|
|
3
|
|
—
|
|
185
|
|
2,146
|
|
|||||||||||||||||||
|
Total
|
552,162
|
|
71,900
|
|
5,225
|
|
13,285
|
|
642,572
|
|
537,168
|
|
7,500
|
|
—
|
|
36,607
|
|
581,275
|
|
|||||||||||||||||||
|
Property and related expenses:
|
|||||||||||||||||||||||||||||||||||||||
|
Property expenses
|
98,649
|
|
7,413
|
|
477
|
|
7,393
|
|
113,932
|
|
100,045
|
|
617
|
|
—
|
|
4,716
|
|
105,378
|
|
|||||||||||||||||||
|
Real estate taxes
|
44,591
|
|
7,534
|
|
446
|
|
2,635
|
|
55,206
|
|
45,500
|
|
642
|
|
—
|
|
4,081
|
|
50,223
|
|
|||||||||||||||||||
|
Provision for bad debts
|
(179
|
)
|
116
|
|
51
|
|
12
|
|
—
|
|
598
|
|
—
|
|
—
|
|
(53
|
)
|
545
|
|
|||||||||||||||||||
|
Ground leases
|
3,356
|
|
—
|
|
83
|
|
—
|
|
3,439
|
|
3,096
|
|
—
|
|
—
|
|
—
|
|
3,096
|
|
|||||||||||||||||||
|
Total
|
146,417
|
|
15,063
|
|
1,057
|
|
10,040
|
|
172,577
|
|
149,239
|
|
1,259
|
|
—
|
|
8,744
|
|
159,242
|
|
|||||||||||||||||||
|
Net Operating Income, as defined
|
$
|
405,745
|
|
$
|
56,837
|
|
$
|
4,168
|
|
$
|
3,245
|
|
$
|
469,995
|
|
$
|
387,929
|
|
$
|
6,241
|
|
$
|
—
|
|
$
|
27,863
|
|
$
|
422,033
|
|
|||||||||
|
Year Ended December 31, 2016 as compared to the Year Ended December 31, 2015
|
||||||||||||||||||||||||||||||||||
|
Same Store
|
Stabilized Development
|
Acquisitions
|
2016 Held for Sale, Dispositions & Other
|
Total
|
||||||||||||||||||||||||||||||
|
Dollar Change
|
Percent Change
|
Dollar Change
|
Percent Change
|
Dollar Change
|
Percent Change
|
Dollar Change
|
Percent Change
|
Dollar Change
|
Percent Change
|
|||||||||||||||||||||||||
|
($ in thousands)
|
||||||||||||||||||||||||||||||||||
|
Operating revenues:
|
||||||||||||||||||||||||||||||||||
|
Rental income
|
$
|
15,701
|
|
3.2
|
%
|
$
|
52,606
|
|
733.4
|
%
|
$
|
4,250
|
|
100.0
|
%
|
$
|
(23,499
|
)
|
(75.1
|
)%
|
$
|
49,058
|
|
9.3
|
%
|
|||||||||
|
Tenant reimbursements
|
(664
|
)
|
(1.4
|
)
|
11,775
|
|
NM*
|
|
922
|
|
100.0
|
|
(4,728
|
)
|
(91.9
|
)
|
7,305
|
|
13.6
|
|
||||||||||||||
|
Other property income
|
(43
|
)
|
(2.2
|
)
|
19
|
|
633.3
|
|
53
|
|
100.0
|
|
4,905
|
|
NM*
|
|
4,934
|
|
229.9
|
|
||||||||||||||
|
Total
|
14,994
|
|
2.8
|
|
64,400
|
|
858.7
|
|
5,225
|
|
100.0
|
|
(23,322
|
)
|
(63.7
|
)
|
61,297
|
|
10.5
|
|
||||||||||||||
|
Property and related expenses:
|
||||||||||||||||||||||||||||||||||
|
Property expenses
|
(1,396
|
)
|
(1.4
|
)
|
6,796
|
|
NM*
|
|
477
|
|
100.0
|
|
2,677
|
|
56.8
|
|
8,554
|
|
8.1
|
|
||||||||||||||
|
Real estate taxes
|
(909
|
)
|
(2.0
|
)
|
6,892
|
|
NM*
|
|
446
|
|
100.0
|
|
(1,446
|
)
|
(35.4
|
)
|
4,983
|
|
9.9
|
|
||||||||||||||
|
Provision for bad debts
|
(777
|
)
|
(129.9
|
)
|
116
|
|
100.0
|
|
51
|
|
100.0
|
|
65
|
|
(122.6
|
)
|
(545
|
)
|
(100.0
|
)
|
||||||||||||||
|
Ground leases
|
260
|
|
8.4
|
|
—
|
|
—
|
|
83
|
|
100.0
|
|
—
|
|
—
|
|
343
|
|
11.1
|
|
||||||||||||||
|
Total
|
(2,822
|
)
|
(1.9
|
)
|
13,804
|
|
NM*
|
|
1,057
|
|
100.0
|
|
1,296
|
|
14.8
|
|
13,335
|
|
8.4
|
|
||||||||||||||
|
Net Operating Income,
as defined
|
$
|
17,816
|
|
4.6
|
%
|
$
|
50,596
|
|
810.7
|
%
|
$
|
4,168
|
|
100.0
|
%
|
$
|
(24,618
|
)
|
(88.4
|
)%
|
$
|
47,962
|
|
11.4
|
%
|
|||||||||
________________________
* Percentage not meaningful
Net Operating Income increased
$48.0 million
, or
11.4%
, for the year ended
December 31, 2016
as compared to the year ended
December 31, 2015
primarily resulting from:
|
•
|
An increase of
$17.8 million
attributable to the Same Store Properties primarily resulting from:
|
|
•
|
An increase in rental income of
$15.7 million
primarily due to the following:
|
|
◦
|
$14.0 million increase due to new leases at higher rates and increased occupancy;
|
|
◦
|
$0.9 million increase due to amortization of tenant-funded tenant improvements revenue; and
|
75
|
◦
|
$0.8 million increase in parking income resulting from increased occupancy and rates at certain of our buildings;
|
|
•
|
A partially offsetting decrease in tenant reimbursements of
$0.7 million
primarily due to:
|
|
◦
|
$2.1 million decrease due to reduced supplemental property taxes at three development properties;
|
|
◦
|
$0.5 million decrease due to base year resets and adjustments for a number of tenants across the portfolio;
|
|
◦
|
$1.4 million increase due to higher expenses at certain properties; and
|
|
◦
|
$0.5 million increase due to lower abatements;
|
|
•
|
A decrease in property and related expenses of
$2.8 million
primarily resulting from:
|
|
•
|
A decrease of
$1.4 million
in
property expenses primarily resulting from:
|
|
◦
|
A $1.0 million decrease in certain recurring operating costs related to electricity, insurance, repairs and maintenance, and various other reimbursable expenses; and
|
|
◦
|
A decrease of $0.4 million due to a $1.0 million decrease in non-recurring expenses as compared to the prior year, offset by the impact of $0.6 million of property damage insurance proceeds received in 2015;
|
|
•
|
A decrease of
$0.9 million
in real estate taxes primarily due to:
|
|
◦
|
A $3.1 million decrease in supplemental taxes primarily at three properties that we developed and stabilized in 2014 resulting from lower assessed values than previously estimated and successful appeals; partially offset by
|
|
◦
|
$2.2 million due to higher refunds received in 2015 as a result of successful property tax appeals;
|
|
•
|
A decrease of
$0.8 million
in provision for bad debts due to the evaluation of reserves at the end of each period; and
|
|
•
|
An increase of $0.3 million in ground rent primarily due to higher percentage rent as a result of one property that became fully leased in 2016;
|
|
•
|
An increase of
$50.6 million
attributable to the Stabilized Development Properties;
|
|
•
|
An increase of
$4.2 million
attributable to the Acquisition Properties; and
|
|
•
|
A decrease of
$24.6 million
attributable to the 2016 Held for Sale, Dispositions & Other Properties primarily due to the following:
|
|
◦
|
A net decrease of $28.4 million due to the sale of six buildings during the year ended
December 31, 2016
, the sale of ten buildings during the year ended December 31, 2015 and the one property held for sale as of
December 31, 2016
, partially offset by $5.0 million due to a property damage settlement received in
2017
for a property that was disposed of in
2016
;
|
|
◦
|
A net decrease of $4.0 million attributable to the residential property that was completed in June 2016, consisting of $2.1 million in rental income offset by $6.1 million in property expenses given that the residential property is still in the early stages of operations; offset by
|
76
|
◦
|
An increase of $2.8 million attributable to our one property in “lease-up” at December 31, 2016.
|
Other Expenses and Income
General and Administrative Expenses
General and administrative expenses increased by approximately
$8.8 million
, or
18.2%
, for the year ended
December 31, 2016
compared to the year ended
December 31, 2015
primarily due to the following:
|
•
|
An increase of $5.4 million attributable to share-based compensation expense related to the 2016 restricted stock unit grants;
|
|
•
|
An increase of approximately $1.7 million related to higher payroll costs and office expenses related to the growth of the company; and
|
|
•
|
An increase of $0.8 million attributable to compensation expense related to the mark-to-market adjustment for the Company’s deferred compensation plan. The compensation expense was offset by gains on the underlying marketable securities included in interest income and other net investment gains (losses) in the consolidated statements of operations.
|
Depreciation and Amortization
Depreciation and amortization increased by approximately
$12.9 million
, or
6.3%
, for the year ended
December 31, 2016
compared to the year ended
December 31, 2015
, primarily due to the following:
|
•
|
An increase of $13.7 million attributable to the Stabilized Development Properties;
|
|
•
|
An increase of $2.8 million attributable to the Same Store Properties;
|
|
•
|
An increase of $2.2 million attributable to the Acquisition Properties; partially offset by
|
|
•
|
A decrease of $5.8 million attributable to the 2016 Held for Sale, Dispositions & Other Properties.
|
Interest Expense
The following table sets forth our gross interest expense, including debt discounts/premiums and deferred financing cost amortization and, net of capitalized interest, including capitalized debt discounts/premiums and deferred financing cost amortization for the year ended
December 31, 2016
and
2015
.
|
Year Ended December 31,
|
Dollar
Change
|
Percentage
Change
|
||||||||||||
|
2016
|
2015
|
|||||||||||||
|
($ in thousands)
|
||||||||||||||
|
Gross interest expense
|
$
|
105,263
|
|
$
|
109,647
|
|
$
|
(4,384
|
)
|
(4.0
|
)%
|
|||
|
Capitalized interest and deferred financing costs
|
(49,460
|
)
|
(51,965
|
)
|
2,505
|
|
(4.8
|
)
|
||||||
|
Interest expense
|
$
|
55,803
|
|
$
|
57,682
|
|
$
|
(1,879
|
)
|
(3.3
|
)%
|
|||
Gross interest expense, before the effect of capitalized interest and deferred financing costs, decreased
$4.4 million
, or
4.0%
, for the year ended
December 31, 2016
compared to the year ended
December 31, 2015
primarily due to a decrease in the average outstanding debt balance for the year ended
December 31, 2016
. Our weighted average interest rate, including loan fee amortization, was 4.6% for both years ended
December 31, 2016
and
2015
.
Capitalized interest decreased
$2.5 million
, or
4.8%
, for the year ended
December 31, 2016
compared to the year ended
December 31, 2015
, primarily attributable to the addition of three development projects to our stabilized
77
portfolio during
2016
, resulting in lower average asset balances qualifying for interest capitalization during
2016
as compared to
2015
.
Net income attributable to noncontrolling interests in consolidated property partnerships
Net income attributable to noncontrolling interests in consolidated property partnerships increased
$3.2 million
for the year ended
December 31, 2016
compared to the year ended
December 31, 2015
. The amount reported for the year ended
December 31, 2016
is comprised of the noncontrolling interest’s share of net income for 100 First LLC and 303 Second LLC for the period subsequent to the transaction closing dates on August 30, 2016 and November 30, 2016, respectively (see Note 11 “Noncontrolling Interests on the Company's Consolidated Financial Statements” to our consolidated financial statements included in this report for additional information), in addition to the noncontrolling interest’s share of net income for Redwood LLC, which was added to the stabilized portfolio in the fourth quarter of 2015.
78
Liquidity and Capital Resources of the Company
In this “Liquidity and Capital Resources of the Company” section, the term the “Company” refers only to Kilroy Realty Corporation on an unconsolidated basis and excludes the Operating Partnership and all other subsidiaries.
The Company’s business is operated primarily through the Operating Partnership. Distributions from the Operating Partnership are the Company’s primary source of capital. The Company believes the Operating Partnership’s sources of working capital, specifically its cash flow from operations and borrowings available under its unsecured revolving credit facility and funds from its capital recycling program, including strategic ventures, are adequate for it to make its distribution payments to the Company and, in turn, for the Company to make its dividend payments to its common stockholders for the next twelve months. Cash flows from operating activities generated by the Operating Partnership for the year ended
December 31, 2017
were sufficient to cover the Company’s payment of cash dividends to its stockholders.
However, there can be no assurance that the Operating Partnership’s sources of capital will continue to be available at all or in amounts sufficient to meet its needs, including its ability to make distributions to the Company. The unavailability of capital could adversely affect the Operating Partnership’s ability to make distributions to the Company, which would in turn, adversely affect the Company’s ability to pay cash dividends to its stockholders.
The Company is a well-known seasoned issuer and the Company and the Operating Partnership have an effective shelf registration statement that provides for the public offering and sale from time to time by the Company of its preferred stock, common stock, depositary shares, warrants and guarantees of debt securities and by the Operating Partnership of its debt securities, in each case in unlimited amounts. The Company evaluates the capital markets on an ongoing basis for opportunities to raise capital, and, as circumstances warrant, the Company and the Operating Partnership may issue securities of all of these types in one or more offerings at any time and from time to time on an opportunistic basis, depending upon, among other things, market conditions, available pricing and capital needs. When the Company receives proceeds from the sales of its preferred or common stock, it generally contributes the net proceeds from those sales to the Operating Partnership in exchange for corresponding preferred or common partnership units of the Operating Partnership. The Operating Partnership may use these proceeds and proceeds from the sale of its debt securities to repay debt, including borrowings under its unsecured revolving credit facility, to develop new or existing properties, to make acquisitions of properties or portfolios of properties, or for general corporate purposes.
As the sole general partner with control of the Operating Partnership, the Company consolidates the Operating Partnership for financial reporting purposes, and the Company does not have significant assets other than its investment in the Operating Partnership. Therefore, the assets and liabilities and the revenues and expenses of the Company and the Operating Partnership are substantially the same on their respective financial statements. The section entitled “Liquidity and Capital Resources of the Operating Partnership” should be read in conjunction with this section to understand the liquidity and capital resources of the Company on a consolidated basis and how the Company is operated as a whole.
Distribution Requirements
The Company is required to distribute 90% of its taxable income (subject to certain adjustments and excluding net capital gains) on an annual basis to maintain qualification as a REIT for federal income tax purposes and is required to pay income tax at regular corporate rates to the extent it distributes less than 100% of its taxable income (including capital gains). As a result of these distribution requirements, the Operating Partnership cannot rely on retained earnings to fund its on-going operations to the same extent as other companies whose parent companies are not REITs. In addition, the Company may be required to use borrowings under the Operating Partnership’s revolving credit facility, if necessary, to meet REIT distribution requirements and maintain its REIT status. The Company may also need to continue to raise capital in the equity markets to fund the Operating Partnership’s working capital needs, as well as potential developments of new or existing properties or acquisitions.
The Company intends to continue to make, but has not committed to make, regular quarterly cash distributions to common stockholders, and through the Operating Partnership, common unitholders from the Operating Partnership’s cash flow from operating activities. All such distributions are at the discretion of the Board of Directors. In
2017
, the Company’s distributions exceeded 100% of its taxable income, resulting in a return of capital to its stockholders. As the Company intends to maintain distributions at a level sufficient to meet the REIT distribution requirements and
79
minimize its obligation to pay income and excise taxes, it will continue to evaluate whether the current levels of distribution are sufficient to do so for
2018
. In addition, in the event the Company is unable to identify and complete the acquisition of suitable replacement properties to effect Section 1031 Exchanges or is unable to successfully complete Section 1031 Exchanges to defer some or all of the taxable gains related to property dispositions, the Company may elect to distribute a special dividend to its common stockholders and common unitholders in order to minimize income taxes on such gains. The Company considers market factors and its performance in addition to REIT requirements in determining its distribution levels. Amounts accumulated for distribution to stockholders are invested primarily in interest-bearing accounts and short-term interest-bearing securities, which is consistent with the Company’s intention to maintain its qualification as a REIT. Such investments may include, for example, obligations of the Government National Mortgage Association, other governmental agency securities, certificates of deposit, and interest-bearing bank deposits.
On
December 12, 2017
, the Board of Directors declared a regular quarterly cash dividend of
$0.425
per share of common stock payable stockholders of record on
December 29, 2017
and caused a
$0.425
per Operating Partnership unit cash distribution to be paid in respect of the Operating Partnership’s common limited partnership interests, including those owned by the Company. The total cash quarterly dividends and distributions paid on
January 12, 2018
were
$42.8 million
.
On January 13, 2017, the Company and the Operating Partnership paid a special cash dividend and distribution, as applicable, of $1.90 per share of common stock and common unit, as applicable, to stockholders and unitholders, as applicable, of record on December 30, 2016. This special cash dividend was in addition to the regular quarterly cash dividend of $0.375 per share of common stock. The total amount of the regular quarterly cash dividend and the special cash dividend was approximately $35.9 million and $181.6 million, respectively.
Debt Covenants
The covenants contained within the unsecured revolving credit facility, unsecured term loan facility and Series A and B Notes generally prohibit the Company from paying dividends during an event of default in excess of an amount which results in distributions to us in an amount sufficient to permit us to pay dividends to our stockholders that we reasonably believe are necessary to (a) maintain our qualification as a REIT for federal and state income tax purposes and (b) avoid the payment of federal or state income or excise tax.
80
Capitalization
As of
December 31, 2017
, our total debt as a percentage of total market capitalization was
23.9%
, which was calculated based on the closing price per share of the Company’s common stock of
$74.65
on
December 31, 2017
as shown in the following table:
|
Shares/Units at
December 31, 2017
|
Aggregate
Principal
Amount or
$ Value
Equivalent
|
% of Total
Market
Capitalization
|
|||||||
|
($ in thousands)
|
|||||||||
|
Debt:
(1) (2)
|
|||||||||
|
Unsecured Senior Notes due 2020
|
$
|
250,000
|
|
2.5
|
%
|
||||
|
Unsecured Senior Notes due 2023
|
300,000
|
|
3.0
|
|
|||||
|
Unsecured Senior Notes due 2024
|
425,000
|
|
4.3
|
|
|||||
|
Unsecured Senior Notes due 2025
|
400,000
|
|
4.1
|
|
|||||
|
Unsecured Senior Notes due 2029
|
400,000
|
|
4.1
|
|
|||||
|
Unsecured Senior Notes Series A & B due 2027 & 2029
|
250,000
|
|
2.5
|
|
|||||
|
Secured debt
|
339,395
|
|
3.4
|
|
|||||
|
Total debt
|
2,364,395
|
|
23.9
|
|
|||||
|
Equity and Noncontrolling Interests in the Operating Partnership:
(3)
|
|||||||||
|
Common limited partnership units outstanding
(3)
|
2,077,193
|
|
155,062
|
|
1.6
|
|
|||
|
Shares of common stock outstanding
(4)
|
98,620,333
|
|
7,362,008
|
|
74.5
|
|
|||
|
Total Equity and Noncontrolling Interests in the Operating Partnership
|
7,517,070
|
|
76.1
|
|
|||||
|
Total Market Capitalization
|
$
|
9,881,465
|
|
100.0
|
%
|
||||
|
(1)
|
Represents gross aggregate principal amount due at maturity before the effect of the following at
December 31, 2017
:
$13.6 million
of unamortized deferred financing costs,
$6.3 million
of unamortized discounts for the unsecured senior notes and
$2.6 million
of unamortized premiums for the secured debt.
|
|
(2)
|
As of
December 31, 2017
, there were no outstanding balances on the unsecured revolving credit facility and the unsecured term loan facility. In January 2018, the Company borrowed
$75.0 million
under the unsecured term loan facility. The Company intends to borrow the remaining $75.0 million by July 2018.
|
|
(3)
|
Includes common units of the Operating Partnership not owned by the Company; does not include noncontrolling interests in consolidated property partnerships.
|
|
(4)
|
Value based on closing price per share of our common stock of
$74.65
as of
December 31, 2017
.
|
Liquidity and Capital Resources of the Operating Partnership
In this “Liquidity and Capital Resources of the Operating Partnership” section, the terms “we,” “our,” and “us” refer to the Operating Partnership or the Operating Partnership and the Company together, as the context requires.
General
Our primary liquidity sources and uses are as follows:
Liquidity Sources
|
•
|
Net cash flow from operations;
|
|
•
|
Borrowings under the Operating Partnership’s unsecured revolving credit facility and term loan facility;
|
|
•
|
Proceeds from our capital recycling program, including the disposition of nonstrategic assets and the formation of strategic ventures;
|
|
•
|
Proceeds from additional secured or unsecured debt financings; and
|
81
|
•
|
Proceeds from public or private issuance of debt or equity securities.
|
Liquidity Uses
|
•
|
Development and redevelopment costs;
|
|
•
|
Operating property or undeveloped land acquisitions;
|
|
•
|
Property operating and corporate expenses;
|
|
•
|
Capital expenditures, tenant improvement and leasing costs;
|
|
•
|
Debt service and principal payments, including debt maturities;
|
|
•
|
Distributions to common and preferred security holders;
|
|
•
|
Repurchases and redemptions of outstanding common or preferred stock of the Company; and
|
|
•
|
Outstanding debt repurchases, redemptions and repayments.
|
General Strategy
Our general strategy is to maintain a conservative balance sheet with a strong credit profile and to maintain a capital structure that allows for financial flexibility and diversification of capital resources. We manage our capital structure to reflect a long-term investment approach and utilize multiple sources of capital to meet our long-term capital requirements. We believe that our current projected liquidity requirements for the next twelve-month period, as set forth above under the caption “—Liquidity Uses,” will be satisfied using a combination of the liquidity sources listed above, although there can be no assurance in this regard. We believe our conservative leverage and staggered debt maturities provide us with financial flexibility and enhance our ability to obtain additional sources of liquidity if necessary, and, therefore, we are well-positioned to refinance or repay maturing debt and to pursue our strategy of seeking attractive acquisition opportunities, which we may finance, as necessary, with future public and private issuances of debt and equity securities.
2017
Capital and Financing Transactions
We continue to be active in the capital markets and our capital recycling program to finance our acquisition and development activity and our continued desire to extend our debt maturities. This was primarily a result of the following activity:
Capital Recycling Program
|
•
|
During the
year
ended
December 31, 2017
, we completed the sale of
eleven
office buildings and
one
undeveloped land parcel to unaffiliated third parties for gross sales proceeds totaling approximately
$186.6 million
.
|
Capital Markets / Debt Transactions
|
•
|
In
2017
, we raised approximately $764.8 million in new equity and debt, redeemed approximately $689.0 million in more expensive debt and preferred stock, and expanded our unsecured credit facility and unsecured term loan facility to $900.0 million. Refer to our 2017 Financing Highlights in “—Overview and Background” for a list of financing transactions completed in
2017
and Notes 9 and 13, “Secured and Unsecured Debt of the Operating Partnership” and “Stockholders’ Equity of the Company,” respectively, to our consolidated financial statements included in this report for additional information regarding our debt and capital market activity.
|
82
Liquidity Sources
Unsecured Revolving Credit Facility and Term Loan Facility
The following table summarizes the balance and terms of our unsecured revolving credit facility as of
December 31, 2017
and
2016
:
|
December 31, 2017
|
December 31, 2016
|
||||||
|
(in thousands)
|
|||||||
|
Outstanding borrowings
|
$
|
—
|
|
$
|
—
|
|
|
|
Remaining borrowing capacity
|
750,000
|
|
600,000
|
|
|||
|
Total borrowing capacity
(1)
|
$
|
750,000
|
|
$
|
600,000
|
|
|
|
Interest rate
(2)
|
2.56
|
%
|
1.82
|
%
|
|||
|
Facility fee-annual rate
(3)
|
0.200%
|
||||||
|
Maturity date
|
July 2022
|
July 2019
|
|||||
_______________
|
(1)
|
As of
December 31, 2017
, we may elect to borrow, subject to bank approval and obtaining commitments for any additional borrowing capacity, up to an additional
$600.0 million
under an accordion feature under the terms of the unsecured revolving credit facility and unsecured term loan facility. As of
December 31, 2016
, we had the option to borrow, subject to bank approval and obtaining commitments for any additional borrowing capacity, up to an additional $311.0 million under an accordion feature under the terms of the unsecured revolving credit facility and unsecured term loan facility.
|
|
(2)
|
Our unsecured revolving credit facility interest rate was calculated based on an annual rate of LIBOR plus
1.000%
and LIBOR plus
1.050%
as of
December 31, 2017
and
December 31, 2016
, respectively.
|
|
(3)
|
Our facility fee is paid on a quarterly basis and is calculated based on the total borrowing capacity. In addition to the facility fee, we incurred debt origination and legal costs. As of
December 31, 2017
and
2016
,
$6.0 million
and
$3.3 million
of unamortized deferred financing costs, respectively, which are included in prepaid expenses and other assets, net on our consolidated balance sheets, remained to be amortized through the respective maturity dates of our unsecured revolving credit facility.
|
We intend to borrow under the unsecured revolving credit facility as necessary for general corporate purposes, to finance development and redevelopment expenditures, to fund potential acquisitions and to potentially repay long-term debt.
The following table summarizes the balance and terms of our unsecured term loan facility as of
December 31, 2017
and
2016
:
|
December 31, 2017
|
December 31, 2016
|
||||||
|
(in thousands)
|
|||||||
|
Outstanding borrowings
(1)
|
$
|
—
|
|
$
|
150,000
|
|
|
|
Remaining borrowing capacity
|
150,000
|
|
—
|
|
|||
|
Total borrowing capacity
(2)
|
$
|
150,000
|
|
$
|
150,000
|
|
|
|
Interest rate
(3)
|
2.66
|
%
|
1.85
|
%
|
|||
|
Undrawn facility fee-annual rate
(4)
|
0.200
|
%
|
—
|
%
|
|||
|
Maturity date
|
July 2022
|
July 2019
|
|||||
|
(1)
|
In July 2017, the unsecured term loan facility was paid down and the Facility was amended to include a 12-month delayed draw option (subject to a specified reduction in commitments unless 50% drawn within six months) on the unsecured term loan facility. The Company may draw on the unsecured term loan facility through July 2018, at which time the outstanding balance will become the balance of the unsecured term loan facility and no additional draws may be made. In January 2018, the Company borrowed
$75.0 million
under the unsecured term loan facility.
|
|
(2)
|
As of
December 31, 2017
and
December 31, 2016
,
$1.2 million
and
$0.7 million
of unamortized deferred financing costs, respectively, remained to be amortized through the maturity date of our unsecured term loan facility.
|
|
(3)
|
Our unsecured term loan facility interest rate was calculated based on an annual rate of LIBOR plus
1.100%
and LIBOR plus
1.150%
as of
December 31, 2017
and
December 31, 2016
, respectively.
|
|
(4)
|
In July 2017, the Facility was amended to include a facility fee on the remaining borrowing capacity of the unsecured term loan facility.
|
83
Additionally, as of
December 31, 2016
the Operating Partnership had a
$39.0 million
unsecured term loan outstanding with an annual interest rate of LIBOR plus
1.150%
that was to mature in July 2019. Concurrently with the amendment of the Facility, the Operating Partnership repaid its
$39.0 million
unsecured term loan. As of
December 31, 2016
,
$0.2 million
of unamortized deferred financing costs remained to be amortized through the maturity date of our unsecured term loan.
Capital Recycling Program
In connection with our capital recycling strategy, through
December 31, 2017
, we completed the sale of
eleven
properties and
one
undeveloped land parcel located in San Diego, California to unaffiliated third parties for gross sales proceeds totaling approximately
$186.6 million
. During
2016
, we completed the sale of
six
office properties and
five
undeveloped land parcels to unaffiliated third parties for total gross sales proceeds of
$330.7 million
. See “—Factors that May Influence Future Operations” and Note 4 “Dispositions and Real Estate Held for Sale” to our consolidated financial statements included in this report for additional information.
In addition, in the second half of 2016, the Company entered into agreements with NBREM whereby NBREM invested in
two
existing previously wholly-owned companies that owned two office properties located in San Francisco, California. Based on a gross valuation of the two properties of approximately
$1.2 billion
, NBREM contributed a total of
$452.9 million
for a
44%
common equity interest in the two companies, which was net of its proportionate share of the existing mortgage debt secured by the property.
We currently anticipate that in
2018
we could raise additional capital through our dispositions program ranging from approximately $250 million to $750 million, with a midpoint of $500 million. However, any potential future disposition transactions will depend on market conditions and other factors including but not limited to our capital needs and our ability to defer some or all of the taxable gains on the sales. In addition, we cannot assure you that we will dispose of any additional properties or that we will be able to identify and complete the acquisition of suitable replacement properties to effect Section 1031 Exchanges to defer some or all of the taxable capital gains related to our capital recycling program.
At-The-Market Stock Offering Program
Since commencement of our at-the-market stock offering program in December 2014, through
December 31, 2017
, we have sold
2,694,242
shares of common stock having an aggregate gross sales price of
$200.1 million
and approximately
$99.9 million
remained available to be sold under this program. The following table sets forth information regarding sales of our common stock under our at-the-market offering program for the years ended
December 31, 2017
and
2016
:
|
Year Ended December 31,
|
|||||||
|
2017
|
2016
|
||||||
|
(in millions, except share and per share data)
|
|||||||
|
Shares of common stock sold during the year
|
235,077
|
|
451,398
|
|
|||
|
Weighted average price per share of common stock
|
$
|
75.40
|
|
$
|
71.50
|
|
|
|
Aggregate gross proceeds
|
$
|
17.7
|
|
$
|
32.3
|
|
|
|
Aggregate net proceeds after selling commissions
|
$
|
17.5
|
|
$
|
31.9
|
|
|
The proceeds from sales were used to fund development expenditures, acquisitions, and general corporate purposes, including repayment of borrowings under the unsecured revolving credit facility. Actual future sales will depend upon a variety of factors, including, but not limited to market conditions, the trading price of the Company’s common stock and our capital needs. We have no obligation to sell the remaining shares available for sale under this program.
January 2017 Common Stock Offering
In January 2017, the Company completed an underwritten public offering of
4,427,500
shares of its common stock. The net offering proceeds, after deducting underwriting discounts and offering expenses, were approximately
$308.8
84
million
. We used the proceeds to partially fund our 2016 special dividend, for general corporate uses, to fund development expenditures and to repay outstanding indebtedness.
Shelf Registration Statement
As discussed above under “—Liquidity and Capital Resources of the Company,” the Company is a well-known seasoned issuer and the Company and the Operating Partnership have an effective shelf registration statement that provides for the public offering and sale from time to time by the Company of its preferred stock, common stock, depository shares and guarantees of debt securities and by the Operating Partnership of its debt securities, in each case in unlimited amounts. The Company evaluates the capital markets on an ongoing basis for opportunities to raise capital, and, as circumstances warrant, the Company and the Operating Partnership may issue securities of all of these types in one or more offerings at any time and from time to time on an opportunistic basis, depending upon, among other things, market conditions, available pricing and capital needs. When the Company receives proceeds from the sales of its preferred or common stock, it generally contributes the net proceeds from those sales to the Operating Partnership in exchange for corresponding preferred or common partnership units of the Operating Partnership. The Operating Partnership may use these proceeds and proceeds from the sale of its debt securities to repay debt, including borrowings under its unsecured revolving credit facility, to develop new or existing properties, to make acquisitions of properties or portfolios of properties, or for general corporate purposes.
Unsecured Senior Notes - Private Placement
On February 17, 2017, the Operating Partnership issued the Series A and B Notes in a private placement pursuant to a delayed draw option under a Note Purchase Agreement entered into by the Operating Partnership on September 14, 2016. As of
December 31, 2017
, there was
$175.0 million
and
$75.0 million
issued and outstanding aggregate principal amount of Series A and B Notes, respectively. The Series A Notes mature on February 17, 2027, and the Series B Notes mature on February 17, 2029, in each case unless earlier redeemed or prepaid pursuant to the terms of the Note Purchase Agreement. Interest on the Series A and B Notes is payable semi-annually in arrears on February 17 and August 17 of each year.
Unsecured and Secured Debt
The aggregate principal amount of the unsecured and secured debt of the Operating Partnership outstanding as of
December 31, 2017
was as follows:
|
Aggregate Principal
Amount Outstanding
(1)
|
|||
|
(in thousands)
|
|||
|
Unsecured Senior Notes due 2020
|
$
|
250,000
|
|
|
Unsecured Senior Notes due 2023
|
300,000
|
|
|
|
Unsecured Senior Notes due 2024
|
425,000
|
|
|
|
Unsecured Senior Notes due 2025
|
400,000
|
|
|
|
Unsecured Senior Notes due 2029
|
400,000
|
|
|
|
Unsecured Senior Notes Series A & B due 2027 & 2029
|
250,000
|
|
|
|
Secured Debt
|
339,395
|
|
|
|
Total Unsecured and Secured Debt
|
2,364,395
|
|
|
|
Less: Unamortized Net Discounts and Deferred Financing Costs
|
(17,332
|
)
|
|
|
Total Debt, Net
|
$
|
2,347,063
|
|
________________________
|
(1)
|
As of
December 31, 2017
, there were no outstanding balances on both the unsecured revolving credit facility and the unsecured term loan facility. In January 2018, the Company borrowed
$75.0 million
under the unsecured term loan facility. The Company currently intends to borrow the remaining
$75.0 million
by July 2018.
|
85
Debt Composition
The composition of the Operating Partnership’s aggregate debt balances between secured and unsecured and fixed-rate and variable-rate debt as of
December 31, 2017
and
2016
was as follows:
|
|
Percentage of Total Debt
(1)
|
Weighted Average Interest Rate
(1)
|
|||||||||
|
|
December 31, 2017
|
December 31, 2016
|
December 31, 2017
|
December 31, 2016
|
|||||||
|
Secured vs. unsecured:
|
|||||||||||
|
Unsecured
(2)
|
85.6
|
%
|
79.9
|
%
|
4.2
|
%
|
4.4
|
%
|
|||
|
Secured
|
14.4
|
%
|
20.1
|
|
4.4
|
%
|
4.4
|
%
|
|||
|
Variable-rate vs. fixed-rate:
|
|||||||||||
|
Variable-rate
(3)
|
—
|
%
|
8.1
|
|
—
|
%
|
1.8
|
%
|
|||
|
Fixed-rate
(2)
|
100.0
|
%
|
91.9
|
|
4.2
|
%
|
4.6
|
%
|
|||
|
Stated rate
(2)
|
4.2
|
%
|
4.4
|
%
|
|||||||
|
GAAP effective rate
(4)
|
4.2
|
%
|
4.3
|
%
|
|||||||
|
GAAP effective rate including debt issuance costs
|
4.4
|
%
|
4.5
|
%
|
|||||||
________________________
|
(1)
|
As of the end of the period presented.
|
|
(2)
|
Excludes the impact of the amortization of any debt discounts/premiums and deferred financing costs
|
|
(3)
|
As of
December 31, 2017
, there were no outstanding balances on both the unsecured revolving credit facility and the unsecured term loan facility.
|
(4) Includes the impact of the amortization of any debt discounts/premiums, excluding deferred financing costs.
86
Liquidity Uses
Contractual Obligations
The following table provides information with respect to our contractual obligations as of
December 31, 2017
. The table: (i) indicates the maturities and scheduled principal repayments of our secured and unsecured debt outstanding as of
December 31, 2017
; (ii) indicates the scheduled interest payments of our fixed-rate debt as of
December 31, 2017
; (iii) provides information about the minimum commitments due in connection with our ground lease obligations and other lease and contractual commitments; and (iv) provides estimated development commitments as of
December 31, 2017
. Note that the table does not reflect our available debt maturity extension options and reflects gross aggregate principal amounts before the effect of unamortized discounts/premiums. We did not have any variable-rate debt outstanding as of
December 31, 2017
.
|
Payment Due by Period
|
|||||||||||||||||||
|
Less than
1 Year
(2018)
|
2-3 Years
(2019-2020)
|
4-5 Years
(2021-2022)
|
More than
5 Years
(After 2022)
|
Total
|
|||||||||||||||
|
(in thousands)
|
|||||||||||||||||||
|
Principal payments: secured debt
(1)
|
$
|
3,584
|
|
$
|
81,446
|
|
$
|
10,896
|
|
$
|
243,469
|
|
$
|
339,395
|
|
||||
|
Principal payments: unsecured debt
(2)
|
—
|
|
250,000
|
|
—
|
|
1,775,000
|
|
2,025,000
|
|
|||||||||
|
Interest payments: fixed-rate debt
(3)
|
100,333
|
|
183,443
|
|
157,342
|
|
267,102
|
|
708,220
|
|
|||||||||
|
Ground lease obligations
(4)
|
4,957
|
|
9,914
|
|
9,914
|
|
226,633
|
|
251,418
|
|
|||||||||
|
Lease and other contractual commitments
(5)
|
110,314
|
|
10,673
|
|
148
|
|
—
|
|
121,135
|
|
|||||||||
|
Development commitments
(6)
|
312,000
|
|
263,000
|
|
—
|
|
—
|
|
575,000
|
|
|||||||||
|
Total
|
$
|
531,188
|
|
$
|
798,476
|
|
$
|
178,300
|
|
$
|
2,512,204
|
|
$
|
4,020,168
|
|
||||
___________
|
(1)
|
Represents gross aggregate principal amount before the effect of the unamortized premium and deferred financing costs of approximately
$2.6 million
and
$1.2 million
as of
December 31, 2017
.
|
|
(2)
|
Represents gross aggregate principal amount before the effect of the unamortized discount and deferred financing costs of approximately
$6.3 million
and
$12.5 million
as of
December 31, 2017
.
|
|
(3)
|
As of
December 31, 2017
,
100.0%
of our debt was contractually fixed. The information in the table above reflects our projected interest rate obligations for these fixed-rate payments based on the contractual interest rates on an accrual basis and scheduled maturity dates.
|
|
(4)
|
Reflects minimum lease payments through the contractual lease expiration date before the impact of extension options. See Note 18 “Commitment and Contingencies” to our consolidated financial statements included in this report for further information.
|
|
(5)
|
Amounts represent cash commitments under signed leases and contracts for operating properties, excluding tenant-funded tenant improvements, and for other contractual commitments. The timing of these expenditures may fluctuate.
|
|
(6)
|
Amounts represent commitments under signed leases for pre-leased development projects and contractual commitments for projects under construction, as of
December 31, 2017
, and also includes
$15.0 million
for three recently completed office projects. The timing of these expenditures may fluctuate based on the ultimate progress of construction. We may start additional construction in
2018
(see “—Development” for additional information).
|
Other Liquidity Uses
Development
As of
December 31, 2017
, we had
four
development projects under construction. These projects have a total estimated investment of approximately
$1.5 billion
, of which we have incurred approximately
$801.3 million
and committed an additional $560.0 million. We expect we will incur additional tenant improvement costs based on leasing activity. Additionally, as of
December 31, 2017
, we have approximately
$15.0 million
in remaining trailing development and leasing costs for recently completed development projects. Furthermore, we currently believe we may spend up to an additional $100 - $300 million on potential near-term and future development pipeline projects that we expect we may commence construction on throughout
2018
. Ultimate timing of these expenditures may fluctuate given construction progress and leasing status of the projects. We expect that any material additional development activities will be funded with borrowings under the unsecured revolving credit facility, the public or private issuance of debt or equity securities or the disposition of assets under our capital recycling program.
87
6.875% Series G and 6.375% Series H Cumulative Redeemable Preferred Stock
On March 30, 2017, the Company redeemed all
4,000,000
shares of its Series G Preferred Stock. The shares of Series G Preferred Stock were redeemed at a redemption price of
$25.00
per share plus accumulated and unpaid dividends for a total cash outflow totaling approximately $100.8 million. We have no further distribution requirements with respect to the Series G Preferred Stock. In connection with the redemption of the Series G Preferred Stock, we incurred an associated non-cash charge of
$3.8 million
as a reduction to net income available to common stockholders for the related original issuance costs. On
August 15, 2017
, the Company redeemed all
4,000,000
shares of its Series H Preferred Stock. The shares of Series H Preferred Stock were redeemed at a redemption price of
$25.00
per share for a total cash outflow of $100.0 million. We have no further distribution requirements with respect to the Series H Preferred Stock. In connection with the redemption of the Series H Preferred Stock, we incurred an associated non-cash charge of
$3.7 million
as a reduction to net income available to common stockholders for the related original issuance costs.
Debt Maturities
We believe our conservative leverage and staggered debt maturities provide us with financial flexibility and enhance our ability to obtain additional sources of liquidity if necessary, and, therefore, we believe we are well-positioned to refinance or repay maturing debt and to pursue our strategy of seeking attractive acquisition opportunities, which we may finance, as necessary, with future public and private issuances of debt and equity securities. However, we can provide no assurance that we will have access to the public or private debt or equity markets in the future on favorable terms or at all. Our next debt maturity with a balance of
$76.3 million
at
December 31, 2017
occurs in June 2019.
Potential Future Acquisitions
During the
year
ended
December 31, 2017
, we acquired a
1.2
acre development site in the Little Italy neighborhood of San Diego, California for
$19.4 million
in cash
.
During
2016
, we acquired
seven
office & retail buildings and a
1.75
acre development site for a total purchase price of approximately
$476.0 million
. These transactions were funded through various capital raising activities and, in selected instances, the assumption of existing indebtedness and issuance of common stock.
As discussed in the section “—Factors That May Influence Future Results of Operations - Acquisitions,”
we continue to evaluate strategic opportunities and remain a disciplined buyer of development and redevelopment opportunities as well as value-add operating properties, dependent on market conditions and business cycles, among other factors. We continue to focus on growth opportunities in West Coast markets populated by knowledge and creative based tenants in a variety of industries, including technology, media, healthcare, life sciences, entertainment and professional services. Any material acquisitions will be funded with borrowings under the unsecured revolving credit facility, the public or private issuance of debt or equity securities, the disposition of assets under our capital recycling program, the formation of strategic ventures or through the assumption of existing debt. As of
December 31, 2017
, we had
$36.0 million
of refundable acquisition deposits, subject to closing conditions required to be met by the sellers, for potential future acquisitions. We cannot provide assurance that we will enter into any agreements to acquire properties, or undeveloped land, or that the potential acquisitions contemplated by any agreements we may enter into in the future will be completed.
Share Repurchases
On February 23, 2016, the Company’s Board of Directors approved a
4,000,000
share increase to the Company’s existing share repurchase program bringing the total current repurchase authorization to
4,988,025
shares. As of
December 31, 2017
,
4,935,826
shares remain eligible for repurchase under the Company’s share repurchase program. Under this program, repurchases may be made in open market transactions at prevailing prices or through privately negotiated transactions. We may elect to repurchase shares of our common stock under this program in the future depending upon various factors, including market conditions, the trading price of our common stock and our other uses of capital. This program does not have a termination date, and repurchases may be discontinued at any time. We intend to fund repurchases, if any, primarily with the proceeds from property dispositions.
88
Potential Future Leasing Costs and Capital Improvements
The amounts we incur for tenant improvements and leasing costs depend on leasing activity in each period. Tenant improvements and leasing costs generally fluctuate in any given period depending on factors such as the type and condition of the property, the term of the lease, the type of the lease, the involvement of external leasing agents and overall market conditions. Capital expenditures may fluctuate in any given period subject to the nature, extent and timing of improvements required to maintain our properties.
For properties within our stabilized portfolio, excluding our development properties, we believe we could spend approximately $60.0 million to $80.0 million in capital improvements, tenant improvements and leasing costs in
2018
, in addition to the lease and contractual commitments included in our contractual obligations table above. The amount we ultimately spend will depend on leasing activity during
2018
.
The following table sets forth our historical actual capital expenditures, and tenant improvements and leasing costs for deals commenced, excluding tenant-funded tenant improvements, for renewed and re-tenanted space within our stabilized portfolio for each of the years ended
December 31, 2017
,
2016
and
2015
on a per square foot basis.
|
Year Ended December 31,
|
|||||||||||
|
2017
|
2016
|
2015
|
|||||||||
|
Office Properties:
(1)
|
|||||||||||
|
Capital Expenditures:
|
|||||||||||
|
Capital expenditures per square foot
|
$
|
1.18
|
|
$
|
1.58
|
|
$
|
1.23
|
|
||
|
Tenant Improvement and Leasing Costs
(2)
|
|||||||||||
|
Replacement tenant square feet
(3)
|
825,653
|
|
583,461
|
|
797,560
|
|
|||||
|
Tenant improvements per square foot commenced
|
$
|
55.10
|
|
$
|
40.98
|
|
$
|
42.25
|
|
||
|
Leasing commissions per square foot commenced
|
$
|
16.36
|
|
$
|
14.30
|
|
$
|
14.53
|
|
||
|
Total per square foot
|
$
|
71.46
|
|
$
|
55.28
|
|
$
|
56.78
|
|
||
|
Renewal tenant square feet
|
944,865
|
|
476,011
|
|
627,783
|
|
|||||
|
Tenant improvements per square foot commenced
|
$
|
21.66
|
|
$
|
10.66
|
|
$
|
18.44
|
|
||
|
Leasing commissions per square foot commenced
|
$
|
6.80
|
|
$
|
7.90
|
|
$
|
9.36
|
|
||
|
Total per square foot
|
$
|
28.46
|
|
$
|
18.56
|
|
$
|
27.80
|
|
||
|
Total per square foot per year
|
$
|
8.09
|
|
$
|
7.05
|
|
$
|
7.34
|
|
||
|
Average remaining lease term (in years)
|
6.0
|
|
5.5
|
|
6.0
|
|
|||||
________________________
|
(1)
|
Excludes development properties and includes 100% of consolidated property partnerships.
|
|
(2)
|
Includes tenants with lease terms of 12 months or longer. Excludes leases for month-to-month and first generation tenants.
|
|
(3)
|
Excludes leases for which the space was vacant for longer than one year, or vacant when the property was acquired by the Company.
|
Capital expenditures per square foot decreased in
2017
as compared to
2016
due to a decrease in general building improvements during
2017
. We currently anticipate capital expenditures for
2018
to be more consistent with
2016
levels. Replacement tenant improvements and leasing commissions increased in 2017 as compared to 2016 and 2015 primarily due to the number of large leases commenced and related higher replacement costs in 2017. Renewal tenant improvements per square foot increased in
2017
as compared to
2016
primarily due to one lease for 140,591 rentable square feet in the San Diego submarket during
2017
. Excluding this specific lease, renewal tenant improvements per square foot were $10.43 for the year ended
December 31, 2017
. We currently anticipate tenant improvement and leasing commissions for
2018
to be generally consistent with
2017
levels, however ultimate costs incurred will depend upon market conditions in each of our submarkets and actual leasing activity.
Distribution Requirements
For a discussion of our dividend and distribution requirements, see “Liquidity and Capital Resources of the Company —Distribution Requirements.”
89
Factors That May Influence Future Sources of Capital and Liquidity of the Company and the Operating Partnership
We continue to evaluate sources of financing for our business activities, including borrowings under the unsecured revolving credit facility, issuance of public and private equity securities, unsecured debt and fixed-rate secured mortgage financing, proceeds from the disposition of selective assets through our capital recycling program, and the formation of strategic ventures. However, our ability to obtain new financing or refinance existing borrowings on favorable terms could be impacted by various factors, including the state of the macro economy, the state of the credit and equity markets, significant tenant defaults, a decline in the demand for office properties, a decrease in market rental rates or market values of real estate assets in our submarkets, and the amount of our future borrowings. These events could result in the following:
|
•
|
Decreases in our cash flows from operations, which could create further dependence on the unsecured revolving credit facility;
|
|
•
|
An increase in the proportion of variable-rate debt, which could increase our sensitivity to interest rate fluctuations in the future; and
|
|
•
|
A decrease in the value of our properties, which could have an adverse effect on the Operating Partnership’s ability to incur additional debt, refinance existing debt at competitive rates, or comply with its existing debt obligations.
|
In addition to the factors noted above, the Operating Partnership’s credit ratings are subject to ongoing evaluation by credit rating agencies and may be changed or withdrawn by a rating agency in the future if, in its judgment, circumstances warrant. In the event that the Operating Partnership’s credit ratings are downgraded, we may incur higher borrowing costs and may experience difficulty in obtaining additional financing or refinancing existing indebtedness.
Debt Covenants
The unsecured revolving credit facility, unsecured term loan facility, unsecured term loan, unsecured senior notes and certain other secured debt arrangements contain covenants and restrictions requiring us to meet certain financial ratios and reporting requirements. Key existing financial covenants and their covenant levels include:
|
Unsecured Credit Facility and Unsecured Term Loan Facility (as defined in the applicable Credit Agreements)
(1)
:
|
Covenant
|
Actual Performance
as of December 31, 2017
|
||
|
Total debt to total asset value
|
less than 60%
|
25%
|
||
|
Fixed charge coverage ratio
|
greater than 1.5x
|
3.4x
|
||
|
Unsecured debt ratio
|
greater than 1.67x
|
3.90x
|
||
|
Unencumbered asset pool debt service coverage
|
greater than 1.75x
|
4.54x
|
||
|
Unsecured Senior Notes due 2020, 2023, 2024, 2025 and 2029 (as defined in the applicable Indentures):
|
|
|||
|
Total debt to total asset value
|
less than 60%
|
31%
|
||
|
Interest coverage
|
greater than 1.5x
|
7.2x
|
||
|
Secured debt to total asset value
|
less than 40%
|
4%
|
||
|
Unencumbered asset pool value to unsecured debt
|
greater than 150%
|
336%
|
||
|
(1)
|
As of
December 31, 2017
, the covenant performance under the Unsecured Senior Notes Series A and B due 2027 and 2029 (“private placement notes”), was substantially similar to the Facility; however, the unsecured debt ratio under the private placement notes was
3.44x
reflecting definitional differences on unencumbered value. The Operating Partnership was in compliance under the credit agreement of the private placement notes as of
December 31, 2017
.
|
The Operating Partnership was in compliance with all of its debt covenants as of
December 31, 2017
. Our current expectation is that the Operating Partnership will continue to meet the requirements of its debt covenants in both the short and long term. However, in the event of an economic slowdown or continued volatility in the credit markets, there is no certainty that the Operating Partnership will be able to continue to satisfy all the covenant requirements.
90
Consolidated Historical Cash Flow Summary
The following summary discussion of our consolidated historical cash flow is based on the consolidated statements of cash flows in Item 15. “Exhibits and Financial Statement Schedules” and is not meant to be an all-inclusive discussion of the changes in our cash flow for the periods presented below. Changes in our cash flow include changes in cash and cash equivalents and restricted cash. Our historical cash flow activity for the year ended
December 31, 2017
as compared to the year ended
December 31, 2016
is as follows:
|
Year Ended December 31,
|
||||||||||||||
|
2017
|
2016
|
Dollar
Change
|
Percentage
Change
|
|||||||||||
|
($ in thousands)
|
||||||||||||||
|
Net cash provided by operating activities
|
$
|
347,012
|
|
$
|
345,054
|
|
$
|
1,958
|
|
0.6
|
%
|
|||
|
Net cash used in investing activities
|
(359,102
|
)
|
(579,420
|
)
|
220,318
|
|
(38.0
|
)%
|
||||||
|
Net cash (used in) provided by financing activities
|
(171,241
|
)
|
427,291
|
|
(598,532
|
)
|
(140.1
|
)%
|
||||||
|
Net (decrease) increase in cash and cash equivalents
|
$
|
(183,331
|
)
|
$
|
192,925
|
|
$
|
(376,256
|
)
|
(195.0
|
)%
|
|||
Operating Activities
Our cash flows from operating activities depends on numerous factors including the occupancy level of our portfolio, the rental rates achieved on our leases, the collectability of rent and recoveries from our tenants, the level of operating expenses, the impact of property acquisitions, completed development projects and related financing activities, and other general and administrative costs. Our net cash provided by operating activities increased by
$2.0 million
, or
0.6%
, for the year ended
December 31, 2017
compared to the year ended
December 31, 2016
primarily as a result of an increase in cash Net Operating Income generated from our Stabilized Development, Acquisition and Same Store Portfolios (see additional information under the caption “–Results of Operations”) offset by net changes in other assets and liabilities related to the timing of expenditures.
Investing Activities
Our cash flows from investing activities is generally used to fund development and operating property acquisitions, expenditures for development projects, and recurring and nonrecurring capital expenditures for our operating properties, net of proceeds received from dispositions of real estate assets. Our net cash used in investing activities decreased by
$220.3 million
, or
38.0%
, for the year ended
December 31, 2017
compared to the year ended
December 31, 2016
, primarily due to significantly lower acquisition activity during the year ended
December 31, 2017
as well as lower net proceeds received from dispositions during the year ended
December 31, 2017
as compared to the year ended
December 31, 2016
.
Financing Activities
Our cash flows from financing activities is principally impacted by our capital raising activities, net of dividends and distributions paid to common and preferred security holders. During the year ended
December 31, 2017
we had net cash used in financing activities of
$171.2 million
compared to net cash provided by financing activities during the year ended
December 31, 2016
of
$427.3 million
primarily due to the redemption of the Company’s Series G Preferred Stock and Series H Preferred Stock and the January 2017 payment of the special dividend declared in December 2016, partially offset by proceeds from the January 2017 common stock offering.
Off-Balance Sheet Arrangements
As of
December 31, 2017
and as of the date this report was filed, we did not have any off-balance sheet transactions, arrangements, or obligations, including contingent obligations.
91
Non-GAAP Supplemental Financial Measure: Funds From Operations
We calculate FFO in accordance with the White Paper on FFO approved by the Board of Governors of NAREIT. The White Paper defines FFO as net income or loss calculated in accordance with GAAP, excluding extraordinary items, as defined by GAAP, gains and losses from sales of depreciable real estate and impairment write-downs associated with depreciable real estate, plus real estate-related depreciation and amortization (excluding amortization of deferred financing costs and depreciation of non-real estate assets) and after adjustment for unconsolidated partnerships and joint ventures. Our calculation of FFO includes the amortization of deferred revenue related to tenant-funded tenant improvements and excludes the depreciation of the related tenant improvement assets. We also add back net income attributable to noncontrolling common units of the Operating Partnership because we report FFO attributable to common stockholders and common unitholders.
We believe that FFO is a useful supplemental measure of our operating performance. The exclusion from FFO of gains and losses from the sale of operating real estate assets allows investors and analysts to readily identify the operating results of the assets that form the core of our activity and assists in comparing those operating results between periods. Also, because FFO is generally recognized as the industry standard for reporting the operations of REITs, it facilitates comparisons of operating performance to other REITs. However, other REITs may use different methodologies to calculate FFO, and accordingly, our FFO may not be comparable to all other REITs.
Implicit in historical cost accounting for real estate assets in accordance with GAAP is the assumption that the value of real estate assets diminishes predictably over time. Since real estate values have historically risen or fallen with market conditions, many industry investors and analysts have considered presentations of operating results for real estate companies using historical cost accounting alone to be insufficient. Because FFO excludes depreciation and amortization of real estate assets, we believe that FFO along with the required GAAP presentations provides a more complete measurement of our performance relative to our competitors and a more appropriate basis on which to make decisions involving operating, financing and investing activities than the required GAAP presentations alone would provide.
However, FFO should not be viewed as an alternative measure of our operating performance because it does not reflect either depreciation and amortization costs or the level of capital expenditures and leasing costs necessary to maintain the operating performance of our properties, which are significant economic costs and could materially impact our results from operations.
The following table presents our FFO for the years ended
December 31, 2017
,
2016
,
2015
,
2014
and
2013
:
|
Year ended December 31,
|
|||||||||||||||||||
|
2017
|
2016
|
2015
|
2014
|
2013
|
|||||||||||||||
|
(in thousands)
|
|||||||||||||||||||
|
Net income available to common stockholders
|
$
|
151,249
|
|
$
|
280,538
|
|
$
|
220,831
|
|
$
|
166,969
|
|
$
|
30,630
|
|
||||
|
Adjustments:
|
|||||||||||||||||||
|
Net income attributable to noncontrolling common units of the Operating Partnership
|
3,223
|
|
6,635
|
|
4,339
|
|
3,589
|
|
685
|
|
|||||||||
|
Net income attributable to noncontrolling interests in consolidated property partnerships
|
12,780
|
|
3,375
|
|
184
|
|
—
|
|
—
|
|
|||||||||
|
Depreciation and amortization of real estate assets
|
241,862
|
|
213,156
|
|
201,480
|
|
202,108
|
|
199,558
|
|
|||||||||
|
Gains on sales of depreciable real estate
|
(39,507
|
)
|
(164,302
|
)
|
(109,950
|
)
|
(121,922
|
)
|
(12,252
|
)
|
|||||||||
|
Funds From Operations attributable to noncontrolling interests in consolidated property partnerships
|
(22,820
|
)
|
(5,660
|
)
|
(272
|
)
|
—
|
|
—
|
|
|||||||||
|
Funds From Operations
(1) (2)
|
$
|
346,787
|
|
$
|
333,742
|
|
$
|
316,612
|
|
$
|
250,744
|
|
$
|
218,621
|
|
||||
_______________________
|
(1)
|
Reported amounts are attributable to common stockholders, common unitholders and restricted stock unitholders.
|
|
(2)
|
FFO available to common stockholders and unitholders includes amortization of deferred revenue related to tenant-funded tenant improvements of
$16.8 million
,
$13.2 million
,
$13.3 million
,
$11.0 million
and
$10.7 million
for the years ended
December 31, 2017
,
2016
,
2015
,
2014
and
2013
, respectively.
|
92
The following table presents our weighted average shares of common stock and common units outstanding for the years ended
December 31, 2017
,
2016
,
2015
,
2014
and
2013
:
|
Year Ended December 31,
|
||||||||||||||
|
2017
|
2016
|
2015
|
2014
|
2013
|
||||||||||
|
Weighted average shares of common stock outstanding
|
98,113,561
|
|
92,342,483
|
|
89,854,096
|
|
83,090,235
|
|
77,343,853
|
|
||||
|
Weighted average common units outstanding
|
2,133,006
|
|
2,429,205
|
|
1,791,482
|
|
1,804,263
|
|
1,822,407
|
|
||||
|
Effect of participating securities – nonvested shares and restricted stock units
|
1,196,044
|
|
1,139,669
|
|
1,170,571
|
|
1,228,807
|
|
1,224,208
|
|
||||
|
Total basic weighted average shares / units outstanding
|
101,442,611
|
|
95,911,357
|
|
92,816,149
|
|
86,123,305
|
|
80,390,468
|
|
||||
|
Effect of dilutive securities – Exchangeable Notes, stock options and contingently issuable shares
|
613,770
|
|
680,551
|
|
541,679
|
|
1,877,485
|
|
1,765,025
|
|
||||
|
Total diluted weighted average shares / units outstanding
|
102,056,381
|
|
96,591,908
|
|
93,357,828
|
|
88,000,790
|
|
82,155,493
|
|
||||
Inflation
The majority of the Company’s leases require tenants to pay for recoveries and escalation charges based upon the tenant’s proportionate share of, and/or increases in, real estate taxes and certain operating costs, which reduce the Company’s exposure to increases in operating costs resulting from inflation.
New Accounting Pronouncements
For a discussion of new accounting pronouncements see Note 2 “Basis of Presentation and Significant Accounting Policies” to our consolidated financial statements included in this report.
93
|
ITEM 7A.
|
QUANTITATIVE AND QUALITATIVE DISCLOSURES ABOUT MARKET RISK
|
The primary market risk we face is interest rate risk. We seek to mitigate this risk by following established risk management policies and procedures. These policies include maintaining prudent amounts of debt, including a greater amount of fixed-rate debt as compared to variable-rate debt in our portfolio, and may include the periodic use of derivative instruments. As of
December 31, 2017
and
2016
, we did not have any interest-rate sensitive derivative assets or liabilities. Information about our changes in interest rate risk exposures from
December 31, 2016
to
December 31, 2017
is incorporated herein by reference from “Item 7. Management’s Discussion and Analysis of Financial Condition and Results of Operations —Liquidity and Capital Resources of the Operating Partnership.”
Market Risk
As of
December 31, 2017
,
100.0%
of our total outstanding debt of
$2.4 billion
(before the effects of debt discounts, premiums and deferred financing costs) bore interest at fixed rates since our only variable-rate debt instruments are our unsecured revolving credit facility and unsecured term loan facility, and both had no outstanding borrowings at
December 31, 2017
. All of our interest rate sensitive financial instruments are held for purposes other than trading purposes. In general, interest rate fluctuations applied to our variable-rate debt will impact our future earnings and cash flows. Conversely, interest rate fluctuations applied to our fixed-rate debt will generally not impact our future earnings and cash flows, unless such instruments mature or are otherwise terminated and need to be refinanced. However, interest rate fluctuations will impact the fair value of the fixed-rate debt instruments.
We generally determine the fair value of our secured debt, unsecured debt, and unsecured line of credit by performing discounted cash flow analyses using an appropriate market discount rate. We calculate the market rate by obtaining period-end treasury rates for maturities that correspond to the maturities of our fixed-rate debt and then adding an appropriate credit spread based on information obtained from third-party financial institutions. These credit spreads take into account factors, including but not limited to, our credit profile, the tenure of the debt, amortization period, whether the debt is secured or unsecured, and the loan-to-value ratio of the debt to the collateral. These calculations are significantly affected by the assumptions used, including the discount rate, credit spreads and estimates of future cash flow. We calculate the market rate of our unsecured line of credit and unsecured term loan facility by obtaining the period-end London Interbank Offered Rate (“LIBOR”) and then adding an appropriate credit spread based on our credit ratings, and the amended terms of our unsecured line of credit and unsecured term loan facility agreement. We determine the fair value of each of our publicly traded unsecured senior notes based on their quoted trading price at the end of the reporting period, if such prices are available. See Note 19 “Fair Value Measurements and Disclosures” and Note 2 “Basis of Presentation and Significant Accounting Policies” in the consolidated financial statements included in this report for additional information on the fair value of our financial assets and liabilities as of
December 31, 2017
and
December 31, 2016
.
At
December 31, 2017
, there were no outstanding balances on both our
$750.0 million
unsecured revolving credit facility and our
$150.0 million
unsecured term loan facility, but both were available for borrowing at the following variable rates: LIBOR plus a spread of
1.00%
(weighted average interest rate of
2.56%
) and LIBOR plus a spread of
1.10%
(weighted average interest rate of
2.66%
), respectively. As of
December 31, 2016
, the total outstanding balance of our variable-rate debt was comprised of borrowings on our unsecured term loan facility and unsecured term loan, together which totaled
$189.0 million
and were indexed to LIBOR plus a spread of
1.15%
(weighted average interest rate of
1.85%
). There were no borrowings on our unsecured line of credit facility as of
December 31, 2016
, which would have been indexed to LIBOR plus a spread of
1.05%
(weighted average interest rate of
1.82%
). Assuming no changes in the outstanding balance of our existing variable-rate debt as of
December 31, 2016
, a 100 basis point increase in the LIBOR rate would have increased our projected annual interest expense, before the effect of capitalization, by approximately $1.9 million.
The total carrying value of our fixed-rate debt was approximately
$2.3 billion
and
$2.1 billion
as of
December 31, 2017
and
2016
, respectively. The total estimated fair value of our fixed-rate debt was approximately
$2.4 billion
and
$2.2 billion
as of
December 31, 2017
and
2016
, respectively. For sensitivity purposes, a 100 basis point increase in the discount rate equates to a decrease in the total fair value of our fixed-rate debt of approximately $145.0 million, or 6.0%, as of
December 31, 2017
. Comparatively, a 100 basis point increase in the discount rate equates to a decrease in the total fair value of our fixed-rate debt of approximately $114.7 million, or 5.3%, as of
December 31, 2016
.
94
|
ITEM 8.
|
FINANCIAL STATEMENTS AND SUPPLEMENTARY DATA
|
See the index included at Item 15. “Exhibits and Financial Statement Schedules.”
|
ITEM 9.
|
CHANGES IN AND DISAGREEMENTS WITH ACCOUNTANTS ON ACCOUNTING AND FINANCIAL DISCLOSURE
|
Not applicable.
95
|
ITEM 9A.
|
CONTROLS AND PROCEDURES
|
Kilroy Realty Corporation
The Company maintains disclosure controls and procedures (as defined in Rule 13a-15(e) or Rule 15d-15(e) under the Exchange Act) that are designed to ensure that information required to be disclosed in the Company’s reports under the Exchange Act is processed, recorded, summarized, and reported within the time periods specified in the SEC’s rules and forms, and that such information is accumulated and communicated to management, including the Chief Executive Officer and Chief Financial Officer, as appropriate, to allow for timely decisions regarding required disclosure. In designing and evaluating the disclosure controls and procedures, management recognizes that any controls and procedures, no matter how well designed and operated, can provide only reasonable assurance of achieving the desired control objectives, and management is required to apply its judgment in evaluating the cost-benefit relationship of possible controls and procedures.
As required by SEC Rule 13a-15(b), the Company carried out an evaluation, under the supervision and with the participation of management, including the Chief Executive Officer and Chief Financial Officer, of the effectiveness of the design and operation of the disclosure controls and procedures as of
December 31, 2017
, the end of the period covered by this report. Based on the foregoing, the Company’s Chief Executive Officer and Chief Financial Officer concluded, as of that time, that our disclosure controls and procedures were effective at the reasonable assurance level.
Changes in Internal Control Over Financial Reporting
There have been no changes that occurred during the fourth quarter of the most recent year covered by this report in the Company’s internal control over financial reporting identified in connection with the evaluation referenced above that have materially affected, or are reasonably likely to materially affect, our internal control over financial reporting.
Management’s Report on Internal Control Over Financial Reporting
Internal control over financial reporting is a process designed by, or under the supervision of, our Chief Executive Officer and Chief Financial Officer and effected by our board of directors, management, and other personnel to provide reasonable assurance regarding the reliability of financial reporting and the preparation of financial statements for external purposes in accordance with GAAP. Internal control over financial reporting includes those policies and procedures that: (1) pertain to the maintenance of records that, in reasonable detail, accurately and fairly reflect the transactions and dispositions of our assets; (2) provide reasonable assurance that transactions are recorded as necessary to permit preparation of financial statements in accordance with GAAP, and that our receipts and expenditures are being made only in accordance with authorizations of management and directors; and (3) provide reasonable assurance regarding prevention or timely detection of unauthorized acquisition, use or disposition of assets that could have a material effect on the consolidated financial statements.
Management is responsible for establishing and maintaining adequate internal control over financial reporting. Our internal control over financial reporting is supported by written policies and procedures and by an appropriate segregation of responsibilities and duties. The Company has used the criteria set forth in the
Internal Control – Integrated Framework (2013)
issued by the Committee of Sponsoring Organizations of the Treadway Commission to assess our internal control over financial reporting. Based upon this assessment, management concluded that internal control over financial reporting operated effectively as of
December 31, 2017
.
Deloitte & Touche LLP, the Company’s independent registered public accounting firm, has audited the Company’s financial statements and has issued a report on the effectiveness of the Company’s internal control over financial reporting.
96
REPORT OF INDEPENDENT REGISTERED PUBLIC ACCOUNTING FIRM
To the Board of Directors and Stockholders of
Kilroy Realty Corporation
Los Angeles, California
Opinion on Internal Control over Financial Reporting
We have audited the internal control over financial reporting of Kilroy Realty Corporation (the “Company”) as of
December 31, 2017
, based on criteria established in
Internal Control — Integrated Framework (2013)
issued by the Committee of Sponsoring Organizations of the Treadway Commission (COSO). In our opinion, the Company maintained, in all material respects, effective internal control over financial reporting as of
December 31, 2017
, based on criteria established in
Internal Control — Integrated Framework (2013)
issued by COSO.
We have also audited, in accordance with the standards of the Public Company Accounting Oversight Board (United States) (PCAOB), the consolidated financial statements and financial statement schedules as of and for the year ended
December 31, 2017
, of the Company and our report dated
February 12, 2018
, expressed an unqualified opinion on those financial statements and financial statement schedules.
Basis for Opinion
The Company’s management is responsible for maintaining effective internal control over financial reporting and for its assessment of the effectiveness of internal control over financial reporting, included in the accompanying Management’s Report on Internal Control Over Financial Reporting. Our responsibility is to express an opinion on the Company’s internal control over financial reporting based on our audit. We are a public accounting firm registered with the PCAOB and are required to be independent with respect to the Company in accordance with the U.S. federal securities laws and the applicable rules and regulations of the Securities and Exchange Commission and the PCAOB.
We conducted our audit in accordance with the standards of the PCAOB. Those standards require that we plan and perform the audit to obtain reasonable assurance about whether effective internal control over financial reporting was maintained in all material respects. Our audit included obtaining an understanding of internal control over financial reporting, assessing the risk that a material weakness exists, testing and evaluating the design and operating effectiveness of internal control based on the assessed risk, and performing such other procedures as we considered necessary in the circumstances. We believe that our audit provides a reasonable basis for our opinion.
Definition and Limitations of Internal Control over Financial Reporting
A company’s internal control over financial reporting is a process designed to provide reasonable assurance regarding the reliability of financial reporting and the preparation of financial statements for external purposes in accordance with generally accepted accounting principles. A company’s internal control over financial reporting includes those policies and procedures that (1) pertain to the maintenance of records that, in reasonable detail, accurately and fairly reflect the transactions and dispositions of the assets of the company; (2) provide reasonable assurance that transactions are recorded as necessary to permit preparation of financial statements in accordance with generally accepted accounting principles, and that receipts and expenditures of the company are being made only in accordance with authorizations of management and directors of the company; and (3) provide reasonable assurance regarding prevention or timely detection of unauthorized acquisition, use, or disposition of the company’s assets that could have a material effect on the financial statements.
Because of its inherent limitations, internal control over financial reporting may not prevent or detect misstatements. Also, projections of any evaluation of effectiveness to future periods are subject to the risk that controls may become inadequate because of changes in conditions, or that the degree of compliance with the policies or procedures may deteriorate.
/s/
DELOITTE & TOUCHE LLP
Los Angeles, California
February 12, 2018
97
Kilroy Realty, L.P.
The Operating Partnership maintains disclosure controls and procedures (as defined in Rule 13a-15(e) or Rule 15d-15(e) under the Exchange Act) that are designed to ensure that information required to be disclosed in our reports under the Exchange Act, is processed, recorded, summarized and reported within the time periods specified in the SEC’s rules and forms, and that such information is accumulated and communicated to management, including the Chief Executive Officer and Chief Financial Officer of its general partner, as appropriate, to allow for timely decisions regarding required disclosure. In designing and evaluating the disclosure controls and procedures, management recognizes that any controls and procedures, no matter how well designed and operated, can provide only reasonable assurance of achieving the desired control objectives, and management is required to apply its judgment in evaluating the cost-benefit relationship of possible controls and procedures.
As required by SEC Rule 13a-15(b), the Operating Partnership carried out an evaluation, under the supervision and with the participation of management, including the Chief Executive Officer and Chief Financial Officer of its general partner, of the effectiveness of the design and operation of the disclosure controls and procedures as of
December 31, 2017
, the end of the period covered by this report. Based on the foregoing, the Chief Executive Officer and Chief Financial Officer of its general partner concluded, as of that time, that the Operating Partnership’s disclosure controls and procedures were effective at the reasonable assurance level.
Changes in Internal Control Over Financial Reporting
There have been no changes that occurred during the fourth quarter of the most recent year covered by this report in the Operating Partnership’s internal control over financial reporting identified in connection with the evaluation referenced above that have materially affected, or are reasonably likely to materially affect, the Operating Partnership’s internal control over financial reporting.
Management’s Report on Internal Control Over Financial Reporting
Internal control over financial reporting is a process designed by, or under the supervision of, the Chief Executive Officer and Chief Financial Officer of the Operating Partnership’s general partner and effected by the board of directors, management, and other personnel of its general partner to provide reasonable assurance regarding the reliability of financial reporting and the preparation of financial statements for external purposes in accordance with GAAP. Internal control over financial reporting includes those policies and procedures that: (1) pertain to the maintenance of records that, in reasonable detail, accurately and fairly reflect the transactions and dispositions of our assets; (2) provide reasonable assurance that transactions are recorded as necessary to permit preparation of financial statements in accordance with GAAP, and that our receipts and expenditures are being made only in accordance with authorizations of management and directors; and (3) provide reasonable assurance regarding prevention or timely detection of unauthorized acquisition, use or disposition of assets that could have a material effect on the consolidated financial statements.
Management is responsible for establishing and maintaining adequate internal control over financial reporting. Our internal control over financial reporting is supported by written policies and procedures and by an appropriate segregation of responsibilities and duties. The Operating Partnership has used the criteria set forth in the
Internal Control – Integrated Framework (2013)
issued by the Committee of Sponsoring Organizations of the Treadway Commission to assess our internal control over financial reporting. Based upon this assessment, management concluded that internal control over financial reporting operated effectively as of
December 31, 2017
.
Deloitte & Touche LLP, the Operating Partnership’s independent registered public accounting firm, has audited the Operating Partnership’s financial statements and has issued a report on the effectiveness of the Operating Partnership’s internal control over financial reporting.
98
REPORT OF INDEPENDENT REGISTERED PUBLIC ACCOUNTING FIRM
To the Partners of
Kilroy Realty, L.P.
Los Angeles, California
Opinion on Internal Control over Financial Reporting
We have audited the internal control over financial reporting of Kilroy Realty, L.P. (the “Operating Partnership”) as of
December 31, 2017
, based on criteria established in
Internal Control — Integrated Framework (2013)
issued by the Committee of Sponsoring Organizations of the Treadway Commission (COSO). In our opinion, the Operating Partnership maintained, in all material respects, effective internal control over financial reporting as of
December 31, 2017
, based on criteria established in
Internal Control — Integrated Framework (2013)
issued by COSO.
We have also audited, in accordance with the standards of the Public Company Accounting Oversight Board (United States) (PCAOB), the consolidated financial statements and financial statement schedules as of and for the year ended
December 31, 2017
, of the Operating Partnership and our report dated
February 12, 2018
, expressed an unqualified opinion on those financial statements and financial statement schedules.
Basis for Opinion
The Operating Partnership’s management is responsible for maintaining effective internal control over financial reporting and for its assessment of the effectiveness of internal control over financial reporting, included in the accompanying Management’s Report on Internal Control Over Financial Reporting. Our responsibility is to express an opinion on the Operating Partnership’s internal control over financial reporting based on our audit. We are a public accounting firm registered with the PCAOB and are required to be independent with respect to the Operating Partnership in accordance with the U.S. federal securities laws and the applicable rules and regulations of the Securities and Exchange Commission and the PCAOB.
We conducted our audit in accordance with the standards of the PCAOB. Those standards require that we plan and perform the audit to obtain reasonable assurance about whether effective internal control over financial reporting was maintained in all material respects. Our audit included obtaining an understanding of internal control over financial reporting, assessing the risk that a material weakness exists, testing and evaluating the design and operating effectiveness of internal control based on the assessed risk, and performing such other procedures as we considered necessary in the circumstances. We believe that our audit provides a reasonable basis for our opinion.
Definition and Limitations of Internal Control over Financial Reporting
A company’s internal control over financial reporting is a process designed to provide reasonable assurance regarding the reliability of financial reporting and the preparation of financial statements for external purposes in accordance with generally accepted accounting principles. A company’s internal control over financial reporting includes those policies and procedures that (1) pertain to the maintenance of records that, in reasonable detail, accurately and fairly reflect the transactions and dispositions of the assets of the company; (2) provide reasonable assurance that transactions are recorded as necessary to permit preparation of financial statements in accordance with generally accepted accounting principles, and that receipts and expenditures of the company are being made only in accordance with authorizations of management and directors of the company; and (3) provide reasonable assurance regarding prevention or timely detection of unauthorized acquisition, use, or disposition of the company’s assets that could have a material effect on the financial statements.
Because of its inherent limitations, internal control over financial reporting may not prevent or detect misstatements. Also, projections of any evaluation of effectiveness to future periods are subject to the risk that controls may become inadequate because of changes in conditions, or that the degree of compliance with the policies or procedures may deteriorate.
/s/
DELOITTE & TOUCHE LLP
Los Angeles, California
February 12, 2018
99
|
ITEM 9B.
|
OTHER INFORMATION
|
Not applicable.
|
ITEM 10.
|
DIRECTORS, EXECUTIVE OFFICERS AND CORPORATE GOVERNANCE
|
The information required by Item 10 is incorporated by reference from our definitive proxy statement for our annual stockholders’ meeting presently scheduled to be held in May
2018
.
|
ITEM 11.
|
EXECUTIVE COMPENSATION
|
The information required by Item 11 is incorporated by reference from our definitive proxy statement for our annual stockholders’ meeting presently scheduled to be held in May
2018
.
|
ITEM 12.
|
SECURITY OWNERSHIP OF CERTAIN BENEFICIAL OWNERS AND MANAGEMENT AND RELATED STOCKHOLDER MATTERS
|
The information required by Item 12 is incorporated by reference from our definitive proxy statement for our annual stockholders’ meeting presently scheduled to be held in May
2018
.
|
ITEM 13.
|
CERTAIN RELATIONSHIPS AND RELATED TRANSACTIONS, AND DIRECTOR INDEPENDENCE
|
The information required by Item 13 is incorporated by reference from our definitive proxy statement for our annual stockholders’ meeting presently scheduled to be held in May
2018
.
|
ITEM 14.
|
PRINCIPAL ACCOUNTANT FEES AND SERVICES
|
The information required by Item 14 is incorporated by reference from our definitive proxy statement for our annual stockholders’ meeting presently scheduled to be held in May
2018
.
100
|
ITEM 15.
|
EXHIBITS AND FINANCIAL STATEMENT SCHEDULES
|
(a)(1) and (2)
Financial Statements and Schedules
The following consolidated financial information is included as a separate section of this annual report on Form 10-K:
All other schedules are omitted because the required information is not present in amounts sufficient to require submission of the schedule or because the information required is included in the financial statements and notes thereto.
(3)
Exhibits
|
Exhibit
Number
|
Description
|
|
|
3.(i)1
|
||
|
3.(i)2
|
||
|
3.(i)3
|
||
|
3.(i)4
|
||
|
3.(i)5
|
||
|
3.(ii)1
|
||
101
|
Exhibit
Number
|
Description
|
|
|
3.(ii)2
|
||
|
4.1
|
||
|
4.2
|
||
|
4.3
|
||
|
4.4
|
||
|
4.5
|
||
|
4.6
|
||
|
4.7
|
||
|
4.8
|
||
|
4.9
|
||
|
4.10
|
||
|
4.11
|
||
|
4.12
|
The Company is party to agreements in connection with long-term debt obligations, none of which individually exceeds ten percent of the total assets of the Company on a consolidated basis. Pursuant to Item 601(b)(4)(iii)(A) of Regulation S-K, the Company agrees to furnish copies of these agreements to the Commission upon request
|
|
102
|
Exhibit
Number
|
Description
|
|
|
10.1
|
||
|
10.2†
|
||
|
10.3
|
||
|
10.4†
|
||
|
10.5†
|
||
|
10.6†
|
||
|
10.7†
|
||
|
10.8†
|
||
|
10.9†
|
||
|
10.10†
|
||
|
10.11†
|
||
|
10.12†
|
||
|
10.13†
|
||
|
10.14†
|
||
|
10.15†
|
||
|
10.16†
|
||
|
10.17
|
||
|
10.18
|
||
|
10.19
|
||
103
|
Exhibit
Number
|
Description
|
|
|
10.20
|
||
|
10.21
|
||
|
10.22
|
||
|
10.23†
|
||
|
10.24†
|
||
|
10.25†
|
||
|
10.26†
|
||
|
10.27†
|
||
|
10.28†
|
||
|
10.29†
|
||
|
10.30†
|
||
|
10.31
|
||
|
10.32
|
||
|
10.33
|
||
|
10.34
|
||
|
10.35
|
||
104
|
Exhibit
Number
|
Description
|
|
|
10.36
|
||
|
10.37
|
||
|
10.38
|
||
|
10.39*
|
||
|
10.40*
|
||
|
10.41*
|
||
|
10.42*
|
||
|
10.43*
|
||
|
10.44*
|
||
|
10.45†
|
||
|
10.46
|
||
|
10.47†
|
||
|
10.48
|
||
|
10.49
|
||
|
12.1*
|
||
|
12.2*
|
||
|
21.1*
|
||
|
21.2*
|
||
|
23.1*
|
||
|
23.2*
|
||
|
24.1*
|
||
|
31.1*
|
||
|
31.2*
|
||
|
31.3*
|
||
|
31.4*
|
||
|
32.1*
|
||
|
32.2*
|
||
|
32.3*
|
||
|
32.4*
|
||
105
|
Exhibit
Number
|
Description
|
|
|
101.1
|
The following Kilroy Realty Corporation and Kilroy Realty, L.P. financial information for the year ended December 31, 2017, formatted in XBRL (eXtensible Business Reporting Language): (i) Consolidated Balance Sheets, (ii) Consolidated Statements of Income, (iii) Consolidated Statements of Changes in Equity, (iv) Consolidated Statements of Capital, (v) Consolidated Statements of Cash Flows and (vi) Notes to the Consolidated Financial Statements.
(1)
|
|
|
*
|
Filed herewith
|
|
†
|
Management contract or compensatory plan or arrangement.
|
|
(1)
|
Pursuant to Rule 406T of Regulation S-T, these interactive data files are deemed not filed or part of a registration statement or prospectus for purposes of Sections 11 or 12 of the Securities Act of 1933 or Section 18 of the Securities Exchange Act of 1934 and otherwise are not subject to liability under these sections.
|
106
SIGNATURES
Pursuant to the requirements of Section 13 or 15(d) of the Securities Exchange Act of 1934, Kilroy Realty Corporation has duly caused this report to be signed on its behalf by the undersigned, thereunto duly authorized on
February 12, 2018
.
|
|
KILROY REALTY CORPORATION
|
||
|
|
|
|
|
|
By
|
/s/ Heidi R. Roth
|
||
|
Heidi R. Roth
Executive Vice President and Chief Accounting Officer
|
|||
POWER OF ATTORNEY
KNOW ALL PERSONS BY THESE PRESENTS, that we, the undersigned directors and officers of Kilroy Realty Corporation, do hereby severally constitute and appoint John Kilroy, Jeffrey C. Hawken, Tyler H. Rose and Heidi R. Roth, and each of them, as our true and lawful attorneys-in-fact and agents, each with full powers of substitution, to do any and all acts and things in our name and behalf in our capacities as directors and officers and to execute any and all instruments for us and in our names in the capacities indicated below, which said attorneys-in-fact and agents, or any of them, may deem necessary or advisable to enable Kilroy Realty Corporation to comply with the Securities Exchange Act of 1934, as amended, and any rules, regulations and requirements of the Securities and Exchange Commission, in connection with this Annual Report on Form 10-K, including specifically, but without limitation, the power and authority to sign for us or any of us, in our names in the capacities indicated below, any and all amendments hereto; and we do each hereby ratify and confirm all that said attorneys-in-fact and agents or their substitutes, or any one of them, shall do or cause to be done by virtue hereof.
Pursuant to the requirements of the Securities Exchange Act of 1934, this report has been signed below by the following persons on behalf of the registrant and in the capacities and on the dates indicated.
|
Name
|
Title
|
Date
|
|
|
/s/ John Kilroy
|
Chairman of the Board, President and Chief Executive Officer (Principal Executive Officer)
|
February 12, 2018
|
|
|
John Kilroy
|
|||
|
/s/ Tyler H. Rose
|
Executive Vice President and Chief Financial Officer (Principal Financial Officer)
|
February 12, 2018
|
|
|
Tyler H. Rose
|
|||
|
/s/ Heidi R. Roth
|
Executive Vice President and Chief Accounting Officer (Principal Accounting Officer)
|
February 12, 2018
|
|
|
Heidi R. Roth
|
|||
|
/s/ Edward F. Brennan, PhD
|
Director
|
February 12, 2018
|
|
|
Edward F. Brennan, PhD
|
|||
|
/s/ Jolie Hunt
|
Director
|
February 12, 2018
|
|
|
Jolie Hunt
|
|||
|
/s/ Scott S. Ingraham
|
Director
|
February 12, 2018
|
|
|
Scott S. Ingraham
|
|||
|
/s/ Gary R. Stevenson
|
Director
|
February 12, 2018
|
|
|
Gary R. Stevenson
|
|||
|
/s/ Peter B. Stoneberg
|
Director
|
February 12, 2018
|
|
|
Peter B. Stoneberg
|
|||
107
SIGNATURES
Pursuant to the requirements of Section 13 or 15(d) of the Securities Exchange Act of 1934, Kilroy Realty, L.P. has duly caused this report to be signed on its behalf by the undersigned, thereunto duly authorized on
February 12, 2018
.
|
|
KILROY REALTY, L.P.
|
||
|
|
|
|
|
|
By
|
/s/ Heidi R. Roth
|
||
|
Heidi R. Roth
Executive Vice President and Chief Accounting Officer
|
|||
POWER OF ATTORNEY
KNOW ALL PERSONS BY THESE PRESENTS, that we, the undersigned directors and officers of Kilroy Realty Corporation, as sole general partner and on behalf of Kilroy Realty, L.P., do hereby severally constitute and appoint John Kilroy, Jeffrey C. Hawken, Tyler H. Rose and Heidi R. Roth, and each of them, as our true and lawful attorneys-in-fact and agents, each with full powers of substitution, to do any and all acts and things in our name and behalf in our capacities as directors and officers and to execute any and all instruments for us and in our names in the capacities indicated below, which said attorneys-in-fact and agents, or any of them, may deem necessary or advisable to enable Kilroy Realty Corporation, as sole general partner and on behalf of Kilroy Realty, L.P., to comply with the Securities Exchange Act of 1934, as amended, and any rules, regulations and requirements of the Securities and Exchange Commission, in connection with this Annual Report on Form 10-K, including specifically, but without limitation, the power and authority to sign for us or any of us, in our names in the capacities indicated below, any and all amendments hereto; and we do each hereby ratify and confirm all that said attorneys-in-fact and agents or their substitutes, or any one of them, shall do or cause to be done by virtue hereof.
Pursuant to the requirements of the Securities Exchange Act of 1934, this report has been signed below by the following persons on behalf of the registrant and in the capacities and on the dates indicated.
|
Name
|
Title
|
Date
|
|
|
/s/ John Kilroy
|
Chairman of the Board, President and Chief Executive Officer (Principal Executive Officer)
|
February 12, 2018
|
|
|
John Kilroy
|
|||
|
/s/ Tyler H. Rose
|
Executive Vice President and Chief Financial Officer (Principal Financial Officer)
|
February 12, 2018
|
|
|
Tyler H. Rose
|
|||
|
/s/ Heidi R. Roth
|
Executive Vice President and Chief Accounting Officer (Principal Accounting Officer)
|
February 12, 2018
|
|
|
Heidi R. Roth
|
|||
|
/s/ Edward F. Brennan, PhD
|
Director
|
February 12, 2018
|
|
|
Edward F. Brennan, PhD
|
|||
|
/s/ Jolie Hunt
|
Director
|
February 12, 2018
|
|
|
Jolie Hunt
|
|||
|
/s/ Scott S. Ingraham
|
Director
|
February 12, 2018
|
|
|
Scott S. Ingraham
|
|||
|
/s/ Gary R. Stevenson
|
Director
|
February 12, 2018
|
|
|
Gary R. Stevenson
|
|||
|
/s/ Peter B. Stoneberg
|
Director
|
February 12, 2018
|
|
|
Peter B. Stoneberg
|
|
||
108
KILROY REALTY CORPORATION AND KILROY REALTY, L.P.
CONSOLIDATED FINANCIAL STATEMENTS AS OF
DECEMBER 31, 2017
AND
2016
AND FOR THE THREE YEARS ENDED
DECEMBER 31, 2017
TABLE OF CONTENTS
|
|
Page
|
|
FINANCIAL STATEMENTS OF KILROY REALTY CORPORATION:
|
|
|
F - 3
|
|
|
FINANCIAL STATEMENTS OF KILROY REALTY, L.P.:
|
|
F - 1
REPORT OF INDEPENDENT REGISTERED PUBLIC ACCOUNTING FIRM
To the Board of Directors and Stockholders of
Kilroy Realty Corporation
Los Angeles, California
Opinion on the Financial Statements
We have audited the accompanying consolidated balance sheets of Kilroy Realty Corporation (the “Company”) as of
December 31, 2017
and
2016
, the related consolidated statements of operations, equity, and cash flows, for each of the three years in the period ended
December 31, 2017
, and the related notes and the schedules listed in the Index at Item 15 (collectively referred to as the “financial statements”). In our opinion, the financial statements present fairly, in all material respects, the financial position of the Company as of
December 31, 2017
and
2016
, and the results of its operations and its cash flows for each of the three years in the period ended
December 31, 2017
, in conformity with accounting principles generally accepted in the United States of America.
We have also audited, in accordance with the standards of the Public Company Accounting Oversight Board (United States) (PCAOB), the Company’s internal control over financial reporting as of
December 31, 2017
, based on criteria established in
Internal Control — Integrated Framework (2013)
issued by the Committee of Sponsoring Organizations of the Treadway Commission and our report dated
February 12, 2018
, expressed an unqualified opinion on the Company's internal control over financial reporting.
Basis for Opinion
These financial statements are the responsibility of the Company’s management. Our responsibility is to express an opinion on the Company’s financial statements based on our audits. We are a public accounting firm registered with the PCAOB and are required to be independent with respect to the Company in accordance with the U.S. federal securities laws and the applicable rules and regulations of the Securities and Exchange Commission and the PCAOB.
We conducted our audits in accordance with the standards of the PCAOB. Those standards require that we plan and perform the audit to obtain reasonable assurance about whether the financial statements are free of material misstatement, whether due to error or fraud. Our audits included performing procedures to assess the risks of material misstatement of the financial statements, whether due to error or fraud, and performing procedures that respond to those risks. Such procedures included examining, on a test basis, evidence regarding the amounts and disclosures in the financial statements. Our audits also included evaluating the accounting principles used and significant estimates made by management, as well as evaluating the overall presentation of the financial statements. We believe that our audits provide a reasonable basis for our opinion.
/s/
DELOITTE & TOUCHE LLP
Los Angeles, California
February 12, 2018
We have served as the Company’s auditor since 1995.
F - 2
KILROY REALTY CORPORATION
(in thousands, except share data)
|
December 31, 2017
|
December 31, 2016
|
||||||
|
ASSETS
|
|||||||
|
REAL ESTATE ASSETS (Notes 2, 3 and 4):
|
|||||||
|
Land and improvements
|
$
|
1,076,172
|
|
$
|
1,108,971
|
|
|
|
Buildings and improvements
|
4,908,797
|
|
4,938,250
|
|
|||
|
Undeveloped land and construction in progress
|
1,432,808
|
|
1,013,533
|
|
|||
|
Total real estate assets held for investment
|
7,417,777
|
|
7,060,754
|
|
|||
|
Accumulated depreciation and amortization
|
(1,264,162
|
)
|
(1,139,853
|
)
|
|||
|
Total real estate assets held for investment, net
|
6,153,615
|
|
5,920,901
|
|
|||
|
REAL ESTATE ASSETS AND OTHER ASSETS HELD FOR SALE, NET (Note 4)
|
—
|
|
9,417
|
|
|||
|
CASH AND CASH EQUIVALENTS (Notes 4 and 22)
|
57,649
|
|
193,418
|
|
|||
|
RESTRICTED CASH (Notes 4 and 22)
|
9,149
|
|
56,711
|
|
|||
|
MARKETABLE SECURITIES (Notes 16 and 19)
|
20,674
|
|
14,773
|
|
|||
|
CURRENT RECEIVABLES, NET (Note 6)
|
16,926
|
|
13,460
|
|
|||
|
DEFERRED RENT RECEIVABLES, NET (Note 6)
|
246,391
|
|
218,977
|
|
|||
|
DEFERRED LEASING COSTS AND ACQUISITION-RELATED INTANGIBLE ASSETS, NET (Notes 3 and 5)
|
183,728
|
|
208,368
|
|
|||
|
PREPAID EXPENSES AND OTHER ASSETS, NET (Note 7)
|
114,706
|
|
70,608
|
|
|||
|
TOTAL ASSETS
|
$
|
6,802,838
|
|
$
|
6,706,633
|
|
|
|
LIABILITIES AND EQUITY
|
|||||||
|
LIABILITIES:
|
|||||||
|
Secured debt, net (Notes 8, 9 and 19)
|
$
|
340,800
|
|
$
|
472,772
|
|
|
|
Unsecured debt, net (Notes 8, 9 and 19)
|
2,006,263
|
|
1,847,351
|
|
|||
|
Accounts payable, accrued expenses and other liabilities (Note 18)
|
249,637
|
|
202,391
|
|
|||
|
Accrued dividends and distributions (Notes 13 and 27)
|
43,448
|
|
222,306
|
|
|||
|
Deferred revenue and acquisition-related intangible liabilities, net (Notes 3, 5 and 10)
|
145,890
|
|
150,360
|
|
|||
|
Rents received in advance and tenant security deposits
|
56,484
|
|
52,080
|
|
|||
|
Liabilities and deferred revenue of real estate assets held for sale (Note 4)
|
—
|
|
56
|
|
|||
|
Total liabilities
|
2,842,522
|
|
2,947,316
|
|
|||
|
COMMITMENTS AND CONTINGENCIES (Note 18)
|
|
|
|||||
|
EQUITY (Notes 11 and 13):
|
|||||||
|
Stockholders’ Equity:
|
|||||||
|
Preferred Stock, $.01 par value, 30,000,000 shares authorized,
|
|||||||
|
6.875% Series G Cumulative Redeemable Preferred stock, $.01 par value, no shares issued and outstanding at 12/31/2017, and 4,000,000 shares authorized, issued and outstanding ($100,000 liquidation preference) at 12/31/2016
|
—
|
|
96,155
|
|
|||
|
6.375% Series H Cumulative Redeemable Preferred stock, $.01 par value, no shares issued and outstanding at 12/31/2017, and 4,000,000 shares authorized, issued and outstanding ($100,000 liquidation preference) at 12/31/2016
|
—
|
|
96,256
|
|
|||
|
Common stock, $.01 par value, 150,000,000 shares authorized,
98,620,333 and 93,219,439 shares issued and outstanding, respectively
|
986
|
|
932
|
|
|||
|
Additional paid-in capital
|
3,822,492
|
|
3,457,649
|
|
|||
|
Distributions in excess of earnings
|
(122,685
|
)
|
(107,997
|
)
|
|||
|
Total stockholders’ equity
|
3,700,793
|
|
3,542,995
|
|
|||
|
Noncontrolling Interests (Note 11):
|
|||||||
|
Common units of the Operating Partnership
|
77,948
|
|
85,590
|
|
|||
|
Noncontrolling interests in consolidated property partnerships (Note 2)
|
181,575
|
|
130,732
|
|
|||
|
Total noncontrolling interests
|
259,523
|
|
216,322
|
|
|||
|
Total equity
|
3,960,316
|
|
3,759,317
|
|
|||
|
TOTAL LIABILITIES AND EQUITY
|
$
|
6,802,838
|
|
$
|
6,706,633
|
|
|
See accompanying notes to consolidated financial statements.
F - 3
KILROY REALTY CORPORATION
(in thousands, except share and per share data)
|
Year Ended December 31,
|
|||||||||||
|
2017
|
2016
|
2015
|
|||||||||
|
REVENUES:
|
|||||||||||
|
Rental income
|
$
|
633,896
|
|
$
|
574,413
|
|
$
|
525,355
|
|
||
|
Tenant reimbursements
|
76,559
|
|
61,079
|
|
53,774
|
|
|||||
|
Other property income (Note 18)
|
8,546
|
|
7,080
|
|
2,146
|
|
|||||
|
Total revenues
|
719,001
|
|
642,572
|
|
581,275
|
|
|||||
|
EXPENSES:
|
|||||||||||
|
Property expenses
|
129,971
|
|
113,932
|
|
105,378
|
|
|||||
|
Real estate taxes
|
66,449
|
|
55,206
|
|
50,223
|
|
|||||
|
Provision for bad debts
|
3,269
|
|
—
|
|
545
|
|
|||||
|
Ground leases (Notes 5 and 18)
|
6,337
|
|
3,439
|
|
3,096
|
|
|||||
|
General and administrative expenses
|
60,581
|
|
57,029
|
|
48,265
|
|
|||||
|
Acquisition-related expenses (Note 2)
|
—
|
|
1,902
|
|
497
|
|
|||||
|
Depreciation and amortization (Notes 2 and 5)
|
245,886
|
|
217,234
|
|
204,294
|
|
|||||
|
Total expenses
|
512,493
|
|
448,742
|
|
412,298
|
|
|||||
|
OTHER (EXPENSES) INCOME:
|
|||||||||||
|
Interest income and other net investment gains (Note 19)
|
5,503
|
|
1,764
|
|
243
|
|
|||||
|
Interest expense (Note 9)
|
(66,040
|
)
|
(55,803
|
)
|
(57,682
|
)
|
|||||
|
Loss on early extinguishment of debt (Note 9)
|
(5,312
|
)
|
—
|
|
—
|
|
|||||
|
Total other (expenses) income
|
(65,849
|
)
|
(54,039
|
)
|
(57,439
|
)
|
|||||
|
INCOME FROM OPERATIONS BEFORE GAINS (LOSSES) ON SALES OF REAL ESTATE
|
140,659
|
|
139,791
|
|
111,538
|
|
|||||
|
Net gain (loss) on sales of land (Note 4)
|
449
|
|
(295
|
)
|
17,116
|
|
|||||
|
Gains on sales of depreciable operating properties (Note 4)
|
39,507
|
|
164,302
|
|
109,950
|
|
|||||
|
NET INCOME
|
180,615
|
|
303,798
|
|
238,604
|
|
|||||
|
Net income attributable to noncontrolling common units of the Operating Partnership (Notes 2 and 11)
|
(3,223
|
)
|
(6,635
|
)
|
(4,339
|
)
|
|||||
|
Net income attributable to noncontrolling interests in consolidated property partnerships (Notes 2 and 11)
|
(12,780
|
)
|
(3,375
|
)
|
(184
|
)
|
|||||
|
Total income attributable to noncontrolling interests
|
(16,003
|
)
|
(10,010
|
)
|
(4,523
|
)
|
|||||
|
NET INCOME ATTRIBUTABLE TO KILROY REALTY CORPORATION
|
164,612
|
|
293,788
|
|
234,081
|
|
|||||
|
Preferred dividends (Note 13)
|
(5,774
|
)
|
(13,250
|
)
|
(13,250
|
)
|
|||||
|
Original issuance costs of redeemed preferred stock and preferred units (Note 13)
|
(7,589
|
)
|
—
|
|
—
|
|
|||||
|
Total preferred dividends
|
(13,363
|
)
|
(13,250
|
)
|
(13,250
|
)
|
|||||
|
NET INCOME AVAILABLE TO COMMON STOCKHOLDERS
|
$
|
151,249
|
|
$
|
280,538
|
|
$
|
220,831
|
|
||
|
Net income available to common stockholders per share – basic (Note 20)
|
$
|
1.52
|
|
$
|
3.00
|
|
$
|
2.44
|
|
||
|
Net income available to common stockholders per share – diluted (Note 20)
|
$
|
1.51
|
|
$
|
2.97
|
|
$
|
2.42
|
|
||
|
Weighted average shares of common stock outstanding – basic (Note 20)
|
98,113,561
|
|
92,342,483
|
|
89,854,096
|
|
|||||
|
Weighted average shares of common stock outstanding – diluted (Note 20)
|
98,727,331
|
|
93,023,034
|
|
90,395,775
|
|
|||||
See accompanying notes to consolidated financial statements.
F - 4
KILROY REALTY CORPORATION
CONSOLIDATED STATEMENTS OF EQUITY
(in thousands, except share and per share/unit data)
|
Preferred
Stock
|
Common Stock
|
Total
Stock-
holders’
Equity
|
Noncontrolling
Interests
|
Total
Equity
|
||||||||||||||||||||||||||
|
Number
of
Shares
|
Common
Stock
|
Additional
Paid-in
Capital
|
Distributions
in Excess of
Earnings
|
|||||||||||||||||||||||||||
|
BALANCE AS OF DECEMBER 31, 2014
|
$
|
192,411
|
|
86,259,684
|
|
$
|
863
|
|
$
|
2,635,900
|
|
$
|
(162,964
|
)
|
$
|
2,666,210
|
|
$
|
57,726
|
|
$
|
2,723,936
|
|
|||||||
|
Net income
|
234,081
|
|
234,081
|
|
4,523
|
|
238,604
|
|
||||||||||||||||||||||
|
Issuance of common stock
|
5,640,033
|
|
56
|
|
387,342
|
|
387,398
|
|
387,398
|
|
||||||||||||||||||||
|
Issuance of share-based compensation awards
|
|
|
|
|
1,692
|
|
1,692
|
|
1,692
|
|
||||||||||||||||||||
|
Non-cash amortization of share-based compensation
|
18,869
|
|
18,869
|
|
18,869
|
|
||||||||||||||||||||||||
|
Exercise of stock options
|
342,000
|
|
4
|
|
14,569
|
|
14,573
|
|
14,573
|
|
||||||||||||||||||||
|
Repurchase of common stock, stock options and restricted stock units
|
(101,389
|
)
|
(7,081
|
)
|
(7,081
|
)
|
(7,081
|
)
|
||||||||||||||||||||||
|
Settlement of restricted stock units for shares of common stock
|
78,937
|
|
(1
|
)
|
(1
|
)
|
(1
|
)
|
||||||||||||||||||||||
|
Exchange of common units of the Operating Partnership
|
39,425
|
|
1,223
|
|
1,223
|
|
(1,223
|
)
|
—
|
|
||||||||||||||||||||
|
Adjustment for noncontrolling interest in the Operating Partnership
|
(4,619
|
)
|
(4,619
|
)
|
4,619
|
|
—
|
|
||||||||||||||||||||||
|
Contribution by noncontrolling interest in consolidated property partnership
|
—
|
|
474
|
|
474
|
|
||||||||||||||||||||||||
|
Preferred dividends and distributions
|
(13,250
|
)
|
(13,250
|
)
|
(13,250
|
)
|
||||||||||||||||||||||||
|
Dividends declared per share of common stock and common unit ($1.40 per share/unit)
|
(128,129
|
)
|
(128,129
|
)
|
(2,499
|
)
|
(130,628
|
)
|
||||||||||||||||||||||
|
BALANCE AS OF DECEMBER 31, 2015
|
192,411
|
|
92,258,690
|
|
923
|
|
3,047,894
|
|
(70,262
|
)
|
3,170,966
|
|
63,620
|
|
3,234,586
|
|
||||||||||||||
|
Net income
|
293,788
|
|
293,788
|
|
10,010
|
|
303,798
|
|
||||||||||||||||||||||
|
Issuance of common stock
|
451,398
|
|
4
|
|
31,113
|
|
31,117
|
|
31,117
|
|
||||||||||||||||||||
|
Issuance of share-based compensation awards
|
1,827
|
|
1,827
|
|
1,827
|
|
||||||||||||||||||||||||
|
Non-cash amortization of share-based compensation
|
26,624
|
|
26,624
|
|
26,624
|
|
||||||||||||||||||||||||
|
Exercise of stock options
|
286,500
|
|
3
|
|
12,205
|
|
12,208
|
|
12,208
|
|
||||||||||||||||||||
|
Repurchase of common stock, stock options and restricted stock units
|
(137,126
|
)
|
(1
|
)
|
(8,874
|
)
|
(8,875
|
)
|
(8,875
|
)
|
||||||||||||||||||||
|
Settlement of restricted stock units for shares of common stock
|
109,044
|
|
1
|
|
(1
|
)
|
—
|
|
—
|
|
||||||||||||||||||||
|
Issuance of common units in connection with acquisition
|
—
|
|
48,033
|
|
48,033
|
|
||||||||||||||||||||||||
|
Exchange of common units of the Operating Partnership
|
250,933
|
|
2
|
|
8,891
|
|
8,893
|
|
(8,893
|
)
|
—
|
|
||||||||||||||||||
|
Initial contributions by noncontrolling interest in consolidated property partnership, net of transaction costs
|
328,997
|
|
328,997
|
|
124,452
|
|
453,449
|
|
||||||||||||||||||||||
|
Distributions to noncontrolling interests in consolidated property partnerships
|
—
|
|
(3,615
|
)
|
(3,615
|
)
|
||||||||||||||||||||||||
|
Adjustment for noncontrolling interest in the Operating Partnership
|
8,973
|
|
8,973
|
|
(8,973
|
)
|
—
|
|
||||||||||||||||||||||
|
Preferred dividends and distributions
|
(13,250
|
)
|
(13,250
|
)
|
(13,250
|
)
|
||||||||||||||||||||||||
|
Dividends declared per share of common stock and common unit ($3.375 per share/unit)
|
(318,273
|
)
|
(318,273
|
)
|
(8,312
|
)
|
(326,585
|
)
|
||||||||||||||||||||||
|
BALANCE AS OF DECEMBER 31, 2016
|
192,411
|
|
93,219,439
|
|
932
|
|
3,457,649
|
|
(107,997
|
)
|
3,542,995
|
|
216,322
|
|
3,759,317
|
|
||||||||||||||
|
Net income
|
164,612
|
|
164,612
|
|
16,003
|
|
180,615
|
|
||||||||||||||||||||||
|
Redemption of Series G & H Preferred stock (Note 13)
|
(192,411
|
)
|
(7,589
|
)
|
(200,000
|
)
|
(200,000
|
)
|
||||||||||||||||||||||
|
Issuance of common stock (Note 13)
|
4,662,577
|
|
46
|
|
326,012
|
|
326,058
|
|
326,058
|
|
||||||||||||||||||||
|
Issuance of share-based compensation awards (Note 15)
|
5,890
|
|
5,890
|
|
5,890
|
|
||||||||||||||||||||||||
|
Non-cash amortization of share-based compensation (Note 15)
|
26,319
|
|
26,319
|
|
26,319
|
|
||||||||||||||||||||||||
|
Exercise of stock options (Note 15)
|
285,000
|
|
4
|
|
12,175
|
|
12,179
|
|
12,179
|
|
||||||||||||||||||||
|
Settlement of restricted stock units for shares of common stock (Note 15)
|
317,848
|
|
3
|
|
(3
|
)
|
—
|
|
—
|
|
||||||||||||||||||||
|
Repurchase of common stock, stock options and restricted stock units (Note 15)
|
(168,881
|
)
|
(2
|
)
|
(12,984
|
)
|
(12,986
|
)
|
(12,986
|
)
|
||||||||||||||||||||
|
Exchange of common units of the Operating Partnership
|
304,350
|
|
3
|
|
10,936
|
|
10,939
|
|
(10,939
|
)
|
—
|
|
||||||||||||||||||
|
Contributions from noncontrolling interests in consolidated property partnerships (Note 11)
|
—
|
|
54,604
|
|
54,604
|
|
||||||||||||||||||||||||
|
Distributions to noncontrolling interests in consolidated property partnerships
|
—
|
|
(16,542
|
)
|
(16,542
|
)
|
||||||||||||||||||||||||
|
Adjustment for noncontrolling interest in the Operating Partnership (Note 2)
|
(3,502
|
)
|
(3,502
|
)
|
3,502
|
|
—
|
|
||||||||||||||||||||||
|
Preferred dividends and distributions
|
(5,774
|
)
|
(5,774
|
)
|
(5,774
|
)
|
||||||||||||||||||||||||
|
Dividends declared per share of common stock and common unit ($1.65 per share/unit) (Notes 13 and 27)
|
(165,937
|
)
|
(165,937
|
)
|
(3,427
|
)
|
(169,364
|
)
|
||||||||||||||||||||||
|
BALANCE AS OF DECEMBER 31, 2017
|
$
|
—
|
|
98,620,333
|
|
$
|
986
|
|
$
|
3,822,492
|
|
$
|
(122,685
|
)
|
$
|
3,700,793
|
|
$
|
259,523
|
|
$
|
3,960,316
|
|
|||||||
See accompanying notes to consolidated financial statements.
F - 5
KILROY REALTY CORPORATION
(in thousands)
|
Year Ended December 31,
|
|||||||||||
|
2017
|
2016
|
2015
|
|||||||||
|
CASH FLOWS FROM OPERATING ACTIVITIES:
|
|||||||||||
|
Net income
|
$
|
180,615
|
|
$
|
303,798
|
|
$
|
238,604
|
|
||
|
Adjustments to reconcile net income to net cash provided by operating activities:
|
|||||||||||
|
Depreciation and amortization of real estate assets and leasing costs
|
241,862
|
|
213,156
|
|
201,482
|
|
|||||
|
Depreciation of non-real estate furniture, fixtures and equipment
|
4,024
|
|
4,078
|
|
2,812
|
|
|||||
|
Increase in provision for bad debts
|
3,269
|
|
—
|
|
545
|
|
|||||
|
Non-cash amortization of share-based compensation awards (Note 15)
|
19,046
|
|
21,064
|
|
15,537
|
|
|||||
|
Non-cash amortization of deferred financing costs and debt discounts and premiums
|
3,247
|
|
2,720
|
|
1,853
|
|
|||||
|
Non-cash amortization of net below market rents (Note 5)
|
(8,528
|
)
|
(7,166
|
)
|
(8,449
|
)
|
|||||
|
Gains on sales of depreciable operating properties (Note 4)
|
(39,507
|
)
|
(164,302
|
)
|
(109,950
|
)
|
|||||
|
(Gain) loss on sales of land
|
(449
|
)
|
295
|
|
(17,116
|
)
|
|||||
|
Loss on early extinguishment of debt (Note 9)
|
5,312
|
|
—
|
|
—
|
|
|||||
|
Non-cash amortization of deferred revenue related to tenant-funded tenant improvements (Note 10)
|
(16,767
|
)
|
(13,244
|
)
|
(13,338
|
)
|
|||||
|
Straight-line rents
|
(33,275
|
)
|
(29,629
|
)
|
(44,383
|
)
|
|||||
|
Net change in other operating assets
|
(17,732
|
)
|
(5,214
|
)
|
(8,085
|
)
|
|||||
|
Net change in other operating liabilities
|
5,895
|
|
19,498
|
|
12,496
|
|
|||||
|
Net cash provided by operating activities
|
347,012
|
|
|
345,054
|
|
272,008
|
|
||||
|
CASH FLOWS FROM INVESTING ACTIVITIES:
|
|||||||||||
|
Expenditures for development properties and undeveloped land
|
(397,440
|
)
|
(351,012
|
)
|
(407,969
|
)
|
|||||
|
Expenditures for acquisitions of development properties and undeveloped land (Note 3)
|
(19,829
|
)
|
(33,513
|
)
|
(148,352
|
)
|
|||||
|
Expenditures for operating properties and other capital assets
|
(88,425
|
)
|
(111,961
|
)
|
(99,557
|
)
|
|||||
|
Expenditures for acquisitions of operating properties (Note 3)
|
—
|
|
(393,767
|
)
|
—
|
|
|||||
|
Net proceeds received from dispositions (Note 4)
|
182,492
|
|
325,031
|
|
319,639
|
|
|||||
|
(Increase) decrease in acquisition-related deposits
|
(35,900
|
)
|
1,902
|
|
1,998
|
|
|||||
|
Issuance of notes receivable
|
—
|
|
(16,100
|
)
|
(3,000
|
)
|
|||||
|
Net cash used in investing activities
|
(359,102
|
)
|
(579,420
|
)
|
(337,241
|
)
|
|||||
|
CASH FLOWS FROM FINANCING ACTIVITIES:
|
|||||||||||
|
Redemption of Series G and H Preferred stock (Note 13)
|
(200,000
|
)
|
—
|
|
—
|
|
|||||
|
Net proceeds from issuance of common stock (Note 13)
|
326,058
|
|
31,117
|
|
387,398
|
|
|||||
|
Net proceeds from the issuance of unsecured debt (Note 9)
|
674,447
|
|
—
|
|
397,776
|
|
|||||
|
Repayments of unsecured debt (Note 9)
|
(519,024
|
)
|
—
|
|
(325,000
|
)
|
|||||
|
Borrowings on unsecured revolving credit facility
|
270,000
|
|
305,000
|
|
250,000
|
|
|||||
|
Repayments on unsecured revolving credit facility
|
(270,000
|
)
|
(305,000
|
)
|
(390,000
|
)
|
|||||
|
Principal payments and repayments of secured debt (Note 9)
|
(130,371
|
)
|
(74,140
|
)
|
(159,766
|
)
|
|||||
|
Proceeds from the issuance of secured debt (Note 9)
|
—
|
|
170,000
|
|
—
|
|
|||||
|
Financing costs
|
(11,500
|
)
|
(2,159
|
)
|
(4,814
|
)
|
|||||
|
Repurchase of common stock and restricted stock units (Note 13)
|
(12,986
|
)
|
(8,875
|
)
|
(7,081
|
)
|
|||||
|
Proceeds from exercise of stock options (Note 15)
|
12,179
|
|
12,208
|
|
14,573
|
|
|||||
|
Contributions from noncontrolling interests in consolidated property partnerships (Note 11)
|
54,604
|
|
453,449
|
|
474
|
|
|||||
|
Distributions to noncontrolling interests in consolidated property partnerships
|
(16,542
|
)
|
(3,615
|
)
|
—
|
|
|||||
|
Dividends and distributions paid to common stockholders and common unitholders
|
(340,697
|
)
|
(137,444
|
)
|
(126,839
|
)
|
|||||
|
Dividends and distributions paid to preferred stockholders and preferred unitholders
|
(7,409
|
)
|
(13,250
|
)
|
(13,250
|
)
|
|||||
|
Net cash (used in) provided by financing activities
|
(171,241
|
)
|
427,291
|
|
23,471
|
|
|||||
|
Net (decrease) increase in cash and cash equivalents and restricted cash
|
(183,331
|
)
|
192,925
|
|
(41,762
|
)
|
|||||
|
Cash and cash equivalents and restricted cash, beginning of year
|
250,129
|
|
57,204
|
|
98,966
|
|
|||||
|
Cash and cash equivalents and restricted cash, end of year
|
$
|
66,798
|
|
$
|
250,129
|
|
$
|
57,204
|
|
||
See accompanying notes to consolidated financial statements.
F - 6
REPORT OF INDEPENDENT REGISTERED PUBLIC ACCOUNTING FIRM
To the Partners of
Kilroy Realty, L.P.
Los Angeles, California
Opinion on the Financial Statements
We have audited the accompanying consolidated balance sheets of Kilroy Realty, L.P. (the “Operating Partnership”) as of
December 31, 2017
and
2016
, the related consolidated statements of operations, capital, and cash flows, for each of the three years in the period ended
December 31, 2017
, and the related notes and the schedules listed in the Index at Item 15 (collectively referred to as the “financial statements”). In our opinion, the financial statements present fairly, in all material respects, the financial position of the Operating Partnership as of
December 31, 2017
and
2016
, and the results of its operations and its cash flows for each of the three years in the period ended
December 31, 2017
, in conformity with accounting principles generally accepted in the United States of America.
We have also audited, in accordance with the standards of the Public Company Accounting Oversight Board (United States) (PCAOB), the Operating Partnership’s internal control over financial reporting as of
December 31, 2017
, based on criteria established in
Internal Control — Integrated Framework (2013)
issued by the Committee of Sponsoring Organizations of the Treadway Commission and our report dated
February 12, 2018
, expressed an unqualified opinion on the Operating Partnership’s internal control over financial reporting.
Basis for Opinion
These financial statements are the responsibility of the Operating Partnership’s management. Our responsibility is to express an opinion on the Operating Partnership’s financial statements based on our audits. We are a public accounting firm registered with the PCAOB and are required to be independent with respect to the Operating Partnership in accordance with the U.S. federal securities laws and the applicable rules and regulations of the Securities and Exchange Commission and the PCAOB.
We conducted our audits in accordance with the standards of the PCAOB. Those standards require that we plan and perform the audit to obtain reasonable assurance about whether the financial statements are free of material misstatement, whether due to error or fraud. Our audits included performing procedures to assess the risks of material misstatement of the financial statements, whether due to error or fraud, and performing procedures that respond to those risks. Such procedures included examining, on a test basis, evidence regarding the amounts and disclosures in the financial statements. Our audits also included evaluating the accounting principles used and significant estimates made by management, as well as evaluating the overall presentation of the financial statements. We believe that our audits provide a reasonable basis for our opinion.
/s/
DELOITTE & TOUCHE LLP
Los Angeles, California
February 12, 2018
We have served as the Operating Partnership’s auditor since 2010.
F - 7
KILROY REALTY, L.P.
CONSOLIDATED BALANCE SHEETS
(in thousands, except unit data)
|
December 31, 2017
|
December 31, 2016
|
||||||
|
ASSETS
|
|||||||
|
REAL ESTATE ASSETS (Notes 2, 3 and 4):
|
|||||||
|
Land and improvements
|
$
|
1,076,172
|
|
$
|
1,108,971
|
|
|
|
Buildings and improvements
|
4,908,797
|
|
4,938,250
|
|
|||
|
Undeveloped land and construction in progress
|
1,432,808
|
|
1,013,533
|
|
|||
|
Total real estate assets held for investment
|
7,417,777
|
|
7,060,754
|
|
|||
|
Accumulated depreciation and amortization
|
(1,264,162
|
)
|
(1,139,853
|
)
|
|||
|
Total real estate assets held for investment, net
|
6,153,615
|
|
5,920,901
|
|
|||
|
REAL ESTATE ASSETS AND OTHER ASSETS HELD FOR SALE, NET (Note 4)
|
—
|
|
9,417
|
|
|||
|
CASH AND CASH EQUIVALENTS (Notes 4 and 23)
|
57,649
|
|
193,418
|
|
|||
|
RESTRICTED CASH (Notes 4 and 23)
|
9,149
|
|
56,711
|
|
|||
|
MARKETABLE SECURITIES (Notes 16 and 19)
|
20,674
|
|
14,773
|
|
|||
|
CURRENT RECEIVABLES, NET (Note 6)
|
16,926
|
|
13,460
|
|
|||
|
DEFERRED RENT RECEIVABLES, NET (Note 6)
|
246,391
|
|
218,977
|
|
|||
|
DEFERRED LEASING COSTS AND ACQUISITION-RELATED INTANGIBLE ASSETS, NET (Notes 3 and 5)
|
183,728
|
|
208,368
|
|
|||
|
PREPAID EXPENSES AND OTHER ASSETS, NET (Note 7)
|
114,706
|
|
70,608
|
|
|||
|
TOTAL ASSETS
|
$
|
6,802,838
|
|
$
|
6,706,633
|
|
|
|
LIABILITIES AND CAPITAL
|
|||||||
|
LIABILITIES:
|
|||||||
|
Secured debt, net (Notes 9 and 19)
|
$
|
340,800
|
|
$
|
472,772
|
|
|
|
Unsecured debt, net (Notes 9 and 19)
|
2,006,263
|
|
1,847,351
|
|
|||
|
Accounts payable, accrued expenses and other liabilities (Note 18)
|
249,637
|
|
202,391
|
|
|||
|
Accrued distributions (Notes 14 and 27)
|
43,448
|
|
222,306
|
|
|||
|
Deferred revenue and acquisition-related intangible liabilities, net (Notes 3, 5 and 10)
|
145,890
|
|
150,360
|
|
|||
|
Rents received in advance and tenant security deposits
|
56,484
|
|
52,080
|
|
|||
|
Liabilities and deferred revenue of real estate assets held for sale (Note 4)
|
—
|
|
56
|
|
|||
|
Total liabilities
|
2,842,522
|
|
2,947,316
|
|
|||
|
COMMITMENTS AND CONTINGENCIES (Note 18)
|
|
|
|||||
|
CAPITAL (Notes 12 and 14):
|
|||||||
|
Partners’ Capital:
|
|||||||
|
6.875% Series G Cumulative Redeemable Preferred units, no units issued and outstanding at 12/31/2017, 4,000,000 units issued and outstanding ($100,000 liquidation preference) at 12/31/2016
|
—
|
|
96,155
|
|
|||
|
6.375% Series H Cumulative Redeemable Preferred units, no units issued and outstanding at 12/31/2017, 4,000,000 units issued and outstanding ($100,000 liquidation preference) at 12/31/2016
|
—
|
|
96,256
|
|
|||
|
Common units, 98,620,333 and 93,219,439 held by the general partner and 2,077,193 and 2,381,543 held by common limited partners issued and outstanding,
respectively
|
3,773,941
|
|
3,431,768
|
|
|||
|
Total Partners’ Capital
|
3,773,941
|
|
3,624,179
|
|
|||
|
Noncontrolling interests in consolidated property partnerships and subsidiaries (Notes 2 and 12)
|
186,375
|
|
135,138
|
|
|||
|
Total capital
|
3,960,316
|
|
3,759,317
|
|
|||
|
TOTAL LIABILITIES AND CAPITAL
|
$
|
6,802,838
|
|
$
|
6,706,633
|
|
|
See accompanying notes to consolidated financial statements.
F - 8
KILROY REALTY, L.P.
CONSOLIDATED STATEMENTS OF OPERATIONS
(in thousands, except unit and per unit data)
|
Year Ended December 31,
|
|||||||||||
|
2017
|
2016
|
2015
|
|||||||||
|
REVENUES:
|
|||||||||||
|
Rental income
|
$
|
633,896
|
|
$
|
574,413
|
|
$
|
525,355
|
|
||
|
Tenant reimbursements
|
76,559
|
|
61,079
|
|
53,774
|
|
|||||
|
Other property income (Note 18)
|
8,546
|
|
7,080
|
|
2,146
|
|
|||||
|
Total revenues
|
719,001
|
|
642,572
|
|
581,275
|
|
|||||
|
EXPENSES:
|
|
|
|||||||||
|
Property expenses
|
129,971
|
|
113,932
|
|
105,378
|
|
|||||
|
Real estate taxes
|
66,449
|
|
55,206
|
|
50,223
|
|
|||||
|
Provision for bad debts
|
3,269
|
|
—
|
|
545
|
|
|||||
|
Ground leases (Notes 5 and 18)
|
6,337
|
|
3,439
|
|
3,096
|
|
|||||
|
General and administrative expenses
|
60,581
|
|
57,029
|
|
48,265
|
|
|||||
|
Acquisition-related expenses (Note 2)
|
—
|
|
1,902
|
|
497
|
|
|||||
|
Depreciation and amortization (Notes 2 and 5)
|
245,886
|
|
217,234
|
|
204,294
|
|
|||||
|
Total expenses
|
512,493
|
|
448,742
|
|
412,298
|
|
|||||
|
OTHER (EXPENSES) INCOME:
|
|
|
|||||||||
|
Interest income and other net investment gains (Note 19)
|
5,503
|
|
1,764
|
|
243
|
|
|||||
|
Interest expense (Note 9)
|
(66,040
|
)
|
(55,803
|
)
|
(57,682
|
)
|
|||||
|
Loss on early extinguishment of debt (Note 9)
|
(5,312
|
)
|
—
|
|
—
|
|
|||||
|
Total other (expenses) income
|
(65,849
|
)
|
(54,039
|
)
|
(57,439
|
)
|
|||||
|
INCOME FROM OPERATIONS BEFORE GAINS (LOSSES) ON SALES OF REAL ESTATE
|
140,659
|
|
139,791
|
|
111,538
|
|
|||||
|
Net gain (loss) on sales of land (Note 4)
|
449
|
|
(295
|
)
|
17,116
|
|
|||||
|
Gains on sales of depreciable operating properties (Note 4)
|
39,507
|
|
164,302
|
|
109,950
|
|
|||||
|
NET INCOME
|
180,615
|
|
303,798
|
|
238,604
|
|
|||||
|
Net income attributable to noncontrolling interests in consolidated property partnerships and subsidiaries (Notes 2 and 12)
|
(13,175
|
)
|
(3,735
|
)
|
(467
|
)
|
|||||
|
NET INCOME ATTRIBUTABLE TO KILROY REALTY, L.P.
|
167,440
|
|
300,063
|
|
238,137
|
|
|||||
|
Preferred distributions (Note 14)
|
(5,774
|
)
|
(13,250
|
)
|
(13,250
|
)
|
|||||
|
Original issuance costs of redeemed preferred units (Note 14)
|
(7,589
|
)
|
—
|
|
—
|
|
|||||
|
Total preferred distributions
|
(13,363
|
)
|
(13,250
|
)
|
(13,250
|
)
|
|||||
|
NET INCOME AVAILABLE TO COMMON UNITHOLDERS
|
$
|
154,077
|
|
$
|
286,813
|
|
$
|
224,887
|
|
||
|
Net income available to common unitholders per unit – basic (Note 21)
|
$
|
1.52
|
|
$
|
2.99
|
|
$
|
2.44
|
|
||
|
Net income available to common unitholders per unit – diluted (Note 21)
|
$
|
1.51
|
|
$
|
2.96
|
|
$
|
2.42
|
|
||
|
Weighted average common units outstanding – basic (Note 21)
|
100,246,567
|
|
94,771,688
|
|
91,645,578
|
|
|||||
|
Weighted average common units outstanding – diluted (Note 21)
|
100,860,337
|
|
95,452,239
|
|
92,187,257
|
|
|||||
See accompanying notes to consolidated financial statements.
F - 9
KILROY REALTY, L.P.
CONSOLIDATED STATEMENTS OF CAPITAL
(in thousands, except unit and per unit data)
|
Partners’ Capital
|
Total Partners’ Capital
|
Noncontrolling Interests in Consolidated Property Partnerships and Subsidiaries
|
||||||||||||||||||||
|
Preferred Units
|
Number of Common Units
|
Common Units
|
Total Capital
|
|||||||||||||||||||
|
BALANCE AS OF DECEMBER 31, 2014
|
$
|
192,411
|
|
88,063,884
|
|
$
|
2,521,900
|
|
$
|
2,714,311
|
|
$
|
9,625
|
|
$
|
2,723,936
|
|
|||||
|
Net income
|
238,137
|
|
238,137
|
|
467
|
|
238,604
|
|
||||||||||||||
|
Issuance of common units
|
5,640,033
|
|
387,398
|
|
387,398
|
|
387,398
|
|
||||||||||||||
|
Issuance of share-based compensation awards
|
1,692
|
|
1,692
|
|
1,692
|
|
||||||||||||||||
|
Non-cash amortization of share-based compensation
|
18,869
|
|
18,869
|
|
18,869
|
|
||||||||||||||||
|
Exercise of stock options
|
342,000
|
|
14,573
|
|
14,573
|
|
14,573
|
|
||||||||||||||
|
Repurchase of common units and restricted stock units
|
(101,389
|
)
|
(7,081
|
)
|
(7,081
|
)
|
(7,081
|
)
|
||||||||||||||
|
Settlement of restricted stock units
|
78,937
|
|
(1
|
)
|
(1
|
)
|
(1
|
)
|
||||||||||||||
|
Contribution by noncontrolling interest in consolidated subsidiary
|
474
|
|
474
|
|
||||||||||||||||||
|
Preferred distributions
|
(13,250
|
)
|
(13,250
|
)
|
(13,250
|
)
|
||||||||||||||||
|
Distributions declared per common unit ($1.40 per unit)
|
(130,628
|
)
|
(130,628
|
)
|
(130,628
|
)
|
||||||||||||||||
|
BALANCE AS OF DECEMBER 31, 2015
|
192,411
|
|
94,023,465
|
|
3,031,609
|
|
3,224,020
|
|
10,566
|
|
3,234,586
|
|
||||||||||
|
Net income
|
300,063
|
|
300,063
|
|
3,735
|
|
303,798
|
|
||||||||||||||
|
Issuance of common units
|
451,398
|
|
31,117
|
|
31,117
|
|
31,117
|
|
||||||||||||||
|
Issuance of common units in connection with acquisition
|
867,701
|
|
48,033
|
|
48,033
|
|
48,033
|
|
||||||||||||||
|
Issuance of share-based compensation awards
|
1,827
|
|
1,827
|
|
1,827
|
|
||||||||||||||||
|
Non-cash amortization of share-based compensation
|
26,624
|
|
26,624
|
|
26,624
|
|
||||||||||||||||
|
Exercise of stock options
|
286,500
|
|
12,208
|
|
12,208
|
|
12,208
|
|
||||||||||||||
|
Repurchase of common units and restricted stock units
|
(137,126
|
)
|
(8,875
|
)
|
(8,875
|
)
|
(8,875
|
)
|
||||||||||||||
|
Settlement of restricted stock units
|
109,044
|
|
—
|
|
—
|
|
—
|
|
||||||||||||||
|
Initial contributions from noncontrolling interest in consolidated property partnership, net of transaction costs
|
328,997
|
|
328,997
|
|
124,452
|
|
453,449
|
|
||||||||||||||
|
Distributions to noncontrolling interests in consolidated property partnerships
|
|
|
(3,615
|
)
|
(3,615
|
)
|
||||||||||||||||
|
Preferred distributions
|
(13,250
|
)
|
(13,250
|
)
|
(13,250
|
)
|
||||||||||||||||
|
Distributions declared per common unit ($3.375 per unit)
|
(326,585
|
)
|
(326,585
|
)
|
(326,585
|
)
|
||||||||||||||||
|
BALANCE AS OF DECEMBER 31, 2016
|
192,411
|
|
95,600,982
|
|
3,431,768
|
|
3,624,179
|
|
135,138
|
|
3,759,317
|
|
||||||||||
|
Net income
|
167,440
|
|
167,440
|
|
13,175
|
|
180,615
|
|
||||||||||||||
|
Redemption of Series G & H Preferred stock (Note 14)
|
(192,411
|
)
|
(7,589
|
)
|
(200,000
|
)
|
(200,000
|
)
|
||||||||||||||
|
Issuance of common units (Note 14)
|
4,662,577
|
|
326,058
|
|
326,058
|
|
326,058
|
|
||||||||||||||
|
Issuance of share-based compensation awards (Note 15)
|
5,890
|
|
5,890
|
|
5,890
|
|
||||||||||||||||
|
Non-cash amortization of share-based compensation
(Note 15)
|
26,319
|
|
26,319
|
|
26,319
|
|
||||||||||||||||
|
Exercise of stock options (Note 15)
|
285,000
|
|
12,179
|
|
12,179
|
|
12,179
|
|
||||||||||||||
|
Settlement of restricted stock units (Note 15)
|
317,848
|
|
—
|
|
—
|
|
—
|
|
||||||||||||||
|
Repurchase of common units and restricted stock units (Note 15)
|
(168,881
|
)
|
(12,986
|
)
|
(12,986
|
)
|
(12,986
|
)
|
||||||||||||||
|
Contributions from noncontrolling interest in consolidated property partnership (Note 12)
|
|
|
|
|
54,604
|
|
54,604
|
|
||||||||||||||
|
Distributions to noncontrolling interests in consolidated property partnerships
|
(16,542
|
)
|
(16,542
|
)
|
||||||||||||||||||
|
Preferred distributions
|
(5,774
|
)
|
(5,774
|
)
|
(5,774
|
)
|
||||||||||||||||
|
Distributions declared per common unit ($1.65 per unit) (Notes 14 and 27)
|
(169,364
|
)
|
(169,364
|
)
|
(169,364
|
)
|
||||||||||||||||
|
BALANCE AS OF DECEMBER 31, 2017
|
$
|
—
|
|
100,697,526
|
|
$
|
3,773,941
|
|
$
|
3,773,941
|
|
$
|
186,375
|
|
$
|
3,960,316
|
|
|||||
See accompanying notes to consolidated financial statements.
F - 10
KILROY REALTY, L.P.
CONSOLIDATED STATEMENTS OF CASH FLOWS
(in thousands)
|
Year Ended December 31,
|
|||||||||||
|
2017
|
2016
|
2015
|
|||||||||
|
CASH FLOWS FROM OPERATING ACTIVITIES:
|
|||||||||||
|
Net income
|
$
|
180,615
|
|
$
|
303,798
|
|
$
|
238,604
|
|
||
|
Adjustments to reconcile net income to net cash provided by operating activities:
|
|||||||||||
|
Depreciation and amortization of real estate assets and leasing costs
|
241,862
|
|
213,156
|
|
201,482
|
|
|||||
|
Depreciation of non-real estate furniture, fixtures and equipment
|
4,024
|
|
4,078
|
|
2,812
|
|
|||||
|
Increase in provision for bad debts
|
3,269
|
|
—
|
|
545
|
|
|||||
|
Non-cash amortization of share-based compensation awards (Note 15)
|
19,046
|
|
21,064
|
|
15,537
|
|
|||||
|
Non-cash amortization of deferred financing costs and debt discounts and premiums
|
3,247
|
|
2,720
|
|
1,853
|
|
|||||
|
Non-cash amortization of net below market rents (Note 5)
|
(8,528
|
)
|
(7,166
|
)
|
(8,449
|
)
|
|||||
|
Gains on sales of depreciable operating properties (Note 4)
|
(39,507
|
)
|
(164,302
|
)
|
(109,950
|
)
|
|||||
|
(Gain) loss on sales of land
|
(449
|
)
|
295
|
|
(17,116
|
)
|
|||||
|
Loss on early extinguishment of debt (Note 9)
|
5,312
|
|
—
|
|
—
|
|
|||||
|
Non-cash amortization of deferred revenue related to tenant-funded tenant improvements (Note 10)
|
(16,767
|
)
|
(13,244
|
)
|
(13,338
|
)
|
|||||
|
Straight-line rents
|
(33,275
|
)
|
(29,629
|
)
|
(44,383
|
)
|
|||||
|
Net change in other operating assets
|
(17,732
|
)
|
(5,214
|
)
|
(8,085
|
)
|
|||||
|
Net change in other operating liabilities
|
5,895
|
|
19,498
|
|
12,496
|
|
|||||
|
Net cash provided by operating activities
|
347,012
|
|
345,054
|
|
272,008
|
|
|||||
|
CASH FLOWS FROM INVESTING ACTIVITIES:
|
|||||||||||
|
Expenditures for development properties and undeveloped land
|
(397,440
|
)
|
(351,012
|
)
|
(407,969
|
)
|
|||||
|
Expenditures for acquisitions of development properties and undeveloped land (Note 3)
|
(19,829
|
)
|
(33,513
|
)
|
(148,352
|
)
|
|||||
|
Expenditures for operating properties and other capital assets
|
(88,425
|
)
|
(111,961
|
)
|
(99,557
|
)
|
|||||
|
Expenditures for acquisitions of operating properties (Note 3)
|
—
|
|
(393,767
|
)
|
—
|
|
|||||
|
Net proceeds received from dispositions (Note 4)
|
182,492
|
|
325,031
|
|
319,639
|
|
|||||
|
(Increase) decrease in acquisition-related deposits
|
(35,900
|
)
|
1,902
|
|
1,998
|
|
|||||
|
Issuance of notes receivable
|
—
|
|
(16,100
|
)
|
(3,000
|
)
|
|||||
|
Net cash used in investing activities
|
(359,102
|
)
|
(579,420
|
)
|
(337,241
|
)
|
|||||
|
CASH FLOWS FROM FINANCING ACTIVITIES:
|
|||||||||||
|
Redemption of Series G and H Preferred units (Note 14)
|
(200,000
|
)
|
—
|
|
—
|
|
|||||
|
Net proceeds from issuance of common units (Note 14)
|
326,058
|
|
31,117
|
|
387,398
|
|
|||||
|
Net proceeds from the issuance of unsecured debt (Note 9)
|
674,447
|
|
—
|
|
397,776
|
|
|||||
|
Repayments of unsecured debt (Note 9)
|
(519,024
|
)
|
—
|
|
(325,000
|
)
|
|||||
|
Borrowings on unsecured revolving credit facility
|
270,000
|
|
305,000
|
|
250,000
|
|
|||||
|
Repayments on unsecured revolving credit facility
|
(270,000
|
)
|
(305,000
|
)
|
(390,000
|
)
|
|||||
|
Principal payments and repayments of secured debt (Note 9)
|
(130,371
|
)
|
(74,140
|
)
|
(159,766
|
)
|
|||||
|
Proceeds from the issuance of secured debt (Note 9)
|
—
|
|
170,000
|
|
—
|
|
|||||
|
Financing costs
|
(11,500
|
)
|
(2,159
|
)
|
(4,814
|
)
|
|||||
|
Repurchase of common units and restricted stock units (Note 14)
|
(12,986
|
)
|
(8,875
|
)
|
(7,081
|
)
|
|||||
|
Proceeds from exercise of stock options (Note 15)
|
12,179
|
|
12,208
|
|
14,573
|
|
|||||
|
Contributions from noncontrolling interests in consolidated property partnerships (Note 12)
|
54,604
|
|
453,449
|
|
474
|
|
|||||
|
Distributions to noncontrolling interests in consolidated property partnerships
|
(16,542
|
)
|
(3,615
|
)
|
—
|
|
|||||
|
Distributions paid to common unitholders
|
(340,697
|
)
|
(137,444
|
)
|
(126,839
|
)
|
|||||
|
Distributions paid to preferred unitholders
|
(7,409
|
)
|
(13,250
|
)
|
(13,250
|
)
|
|||||
|
Net cash (used in) provided by financing activities
|
(171,241
|
)
|
427,291
|
|
23,471
|
|
|||||
|
Net (decrease) increase in cash and cash equivalents and restricted cash
|
(183,331
|
)
|
192,925
|
|
(41,762
|
)
|
|||||
|
Cash and cash equivalents and restricted cash, beginning of year
|
250,129
|
|
57,204
|
|
98,966
|
|
|||||
|
Cash and cash equivalents and restricted cash, end of year
|
$
|
66,798
|
|
$
|
250,129
|
|
$
|
57,204
|
|
||
See accompanying notes to consolidated financial statements.
F - 11
KILROY REALTY CORPORATION AND KILROY REALTY, L.P.
NOTES TO CONSOLIDATED FINANCIAL STATEMENTS
|
1.
|
Organization and Ownership
|
Kilroy Realty Corporation (the “Company”) is a self-administered real estate investment trust (“REIT”) active in premier office and mixed-use submarkets along the West Coast. We own, develop, acquire and manage real estate assets, consisting primarily of Class A properties in the coastal regions of Los Angeles, Orange County, San Diego County, the San Francisco Bay Area and Greater Seattle, which we believe have strategic advantages and strong barriers to entry. Class A real estate encompasses attractive and efficient buildings of high quality that are attractive to tenants, are well-designed and constructed with above-average material, workmanship and finishes and are well-maintained and managed. We qualify as a REIT under the Internal Revenue Code of 1986, as amended (the “Code”). The Company’s common stock is publicly traded on the New York Stock Exchange (“NYSE”) under the ticker symbol “KRC.”
We own our interests in all of our real estate assets through Kilroy Realty, L.P. (the “Operating Partnership”) and Kilroy Realty Finance Partnership, L.P. (the “Finance Partnership”). We generally conduct substantially all of our operations through the Operating Partnership. Unless stated otherwise or the context indicates otherwise, the terms “Kilroy Realty Corporation” or the “Company,” “we,” “our,” and “us” refer to Kilroy Realty Corporation and its consolidated subsidiaries and the term “Operating Partnership” refers to Kilroy Realty, L.P. and its consolidated subsidiaries. The descriptions of our business, employees, and properties apply to both the Company and the Operating Partnership.
Our stabilized portfolio of operating properties was comprised of the following properties at
December 31, 2017
:
|
Number of
Buildings
|
Rentable
Square Feet (unaudited)
|
Number of
Tenants
|
Percentage
Occupied
(unaudited)
|
Percentage Leased
(unaudited)
|
||||||||||
|
Stabilized Office Properties
|
101
|
|
13,720,597
|
|
511
|
|
95.2
|
%
|
96.9
|
%
|
||||
|
Number of
Buildings |
Number of Units
|
2017 Average Occupancy
(unaudited) |
||||||
|
Stabilized Residential Property
|
1
|
|
200
|
|
70.2
|
%
|
||
Our stabilized portfolio includes all of our properties with the exception of development and redevelopment properties currently under construction or committed for construction, “lease-up” properties, real estate assets held for sale and undeveloped land. We define redevelopment properties as those properties for which we expect to spend significant development and construction costs on the existing or acquired buildings pursuant to a formal plan, the intended result of which is a higher economic return on the property. We define “lease-up” properties as office and retail properties we recently developed or redeveloped that have not yet reached
95%
occupancy and are within one year following cessation of major construction activities. There were no operating properties in “lease-up” or held for sale as of
December 31, 2017
.
During the first quarter of
2017
, we added
one
development project to our stabilized office portfolio consisting of
365,359
rentable square feet in Hollywood, California. As of
December 31, 2017
, the following properties were excluded from our stabilized portfolio. We did not have any redevelopment properties at
December 31, 2017
.
|
Number of
Properties/Projects
|
Estimated Rentable
Square Feet (unaudited)
|
|||
|
Development projects under construction
(1)(2)
|
4
|
1,800,000
|
|
|
_______________
|
(1)
|
Estimated rentable square feet upon completion.
|
|
(2)
|
Includes
86,000
square feet of Production, Distribution, and Repair (“PDR”) space. Development projects under construction also include
96,000
square feet of retail space and
237
residential units at One Paseo - Phase I in addition to the estimated office rentable square feet noted above.
|
Our stabilized portfolio also excludes our near-term and future development pipeline, which as of
December 31, 2017
was comprised of
six
potential development sites, representing approximately
48
gross acres of undeveloped land.
F - 12
KILROY REALTY CORPORATION AND KILROY REALTY, L.P.
NOTES TO CONSOLIDATED FINANCIAL STATEMENTS – (Continued)
As of
December 31, 2017
, all of our properties and development projects were owned and all of our business was conducted in the state of California with the exception of
twelve
office properties and
one
development project under construction located in the state of Washington. All of our properties and development projects are
100%
owned, excluding
four
office properties owned by
three
consolidated property partnerships. Two of the three property partnerships, 100 First Street Member, LLC (“100 First LLC”) and 303 Second Street Member, LLC (“303 Second LLC”), each owned
one
office property in San Francisco, California through subsidiary REITs. As of
December 31, 2017
, the Company owned a
56%
common equity interest in both 100 First LLC and 303 Second LLC. The third property partnership, Redwood City Partners, LLC (“Redwood LLC”) owned
two
office properties in Redwood City, California. As of
December 31, 2017
, the Company owned an approximate
93%
common equity interest in Redwood LLC. The remaining interests in all
three
property partnerships were owned by unrelated third parties.
As of
December 31, 2017
, the Company owned an approximate
97.9%
common general partnership interest in the Operating Partnership. The remaining approximate
2.1%
common limited partnership interest in the Operating Partnership as of
December 31, 2017
was owned by non-affiliated investors and certain of our executive officers and directors. Both the general and limited common partnership interests in the Operating Partnership are denominated in common units. Generally, the number of common units held by the Company is equivalent to the number of outstanding shares of the Company’s common stock, and the rights of all the common units to quarterly distributions and payments in liquidation mirror those of the Company’s common stockholders. The common limited partners have certain redemption rights as provided in the Operating Partnership’s Seventh Amended and Restated Agreement of Limited Partnership, as amended, the “Partnership Agreement”.
Kilroy Realty Finance, Inc., which is a wholly-owned subsidiary of the Company, is the sole general partner of the Finance Partnership and owns a
1.0%
common general partnership interest in the Finance Partnership. The Operating Partnership owns the remaining
99.0%
common limited partnership interest. With the exception of the Operating Partnership and our consolidated property partnerships, all of our subsidiaries are wholly-owned.
|
2.
|
Basis of Presentation and Significant Accounting Policies
|
Basis of Presentation
The consolidated financial statements of the Company include the consolidated financial position and results of operations of the Company, the Operating Partnership, the Finance Partnership, Kilroy Services, LLC (“KSLLC”), 303 Second LLC, 100 First LLC, Redwood LLC and all of our wholly-owned and controlled subsidiaries. The consolidated financial statements of the Operating Partnership include the consolidated financial position and results of operations of the Operating Partnership, the Finance Partnership, KSLLC, 303 Second LLC, 100 First LLC, Redwood LLC and all of our wholly-owned and controlled subsidiaries. All intercompany balances and transactions have been eliminated in the consolidated financial statements.
Effective January 1, 2017, the Company adopted Financial Accounting Standards Board (“FASB”) Accounting Standards Update (“ASU”) No. 2016-18 (“ASU 2016-18”) which requires that a statement of cash flows explain the change during the period in the total of cash, cash equivalents, and amounts generally described as restricted cash or restricted cash equivalents. The Company adopted ASU 2016-18 on a retrospective basis. Therefore, amounts generally described as restricted cash and restricted cash equivalents are included with cash and cash equivalents when reconciling the beginning-of-period and end-of-period total amounts shown on the Company’s consolidated statements of cash flows for the years ended
December 31, 2017
,
2016
and
2015
. As a result of the adoption of ASU 2016-18, the change in restricted cash is no longer presented as a separate line item within cash flows from investing activities on the Company’s consolidated statements of cash flows since such balances are now included in total cash at both the beginning and end of the reporting period. As a result, for the year ended
December 31, 2016
, the Company had net cash used in investing activities of
$579.4 million
instead of net cash used in investing activities of
$635.4 million
as previously reported since the Company had an increase in restricted cash of
$56.0 million
during the year ended
December 31, 2016
primarily due to
$48.4 million
of restricted cash that was held at qualified intermediaries to facilitate potential future Section1031 Exchanges. For the year ended
December 31, 2015
, the Company had net cash used in investing activities of
$337.2 million
instead of net cash used in investing activities of
$262.8 million
as previously reported since the Company had a decrease in restricted cash of
$65.2 million
during the year ended
December 31, 2015
primarily due
F - 13
KILROY REALTY CORPORATION AND KILROY REALTY, L.P.
NOTES TO CONSOLIDATED FINANCIAL STATEMENTS – (Continued)
to the release of
$59.2 million
of cash proceeds related to the completion of Section 1031 Exchanges in January 2015. In addition, expenditures for acquisitions of development properties and undeveloped land during the year ended
December 31, 2015
increased by
$9.2 million
as a result of our adoption of ASU 2016-18 due to holdback funds released from escrow relating to previous year acquisitions.
Also effective January 1, 2017, the Company adopted FASB ASU No. 2017-01 (“ASU 2017-01”) which clarifies the framework for determining whether an integrated set of assets and activities meets the definition of a business. The revised framework provides a screen for determining whether an integrated set of assets is a business combination or an asset acquisition and clarifies that when substantially all of the fair value of the gross assets acquired is concentrated in a single identifiable asset or a group of similar assets, the set of assets and activities is deemed not to meet the definition of a business. As a result of our adoption of the guidance, which we adopted on a prospective basis, the Company expects that most of our future acquisitions of operating properties and development properties that were previously accounted for as business combinations will instead be accounted for as asset acquisitions under the new guidance. In addition, we expect that most of the transaction costs associated with these future acquisitions will be capitalized as part of the purchase price of the acquisition instead of being expensed as incurred to acquisition-related expenses. The Company did not have any acquisitions of operating properties during the year ended
December 31, 2017
.
In addition, effective January 1, 2017, the Company adopted FASB ASU No. 2016-09 (“ASU 2016-09”) which simplified several aspects of the accounting for share-based payment transactions, including the income tax consequences, classification of awards as either equity or liabilities, and classification on the statement of cash flows. The adoption of this guidance did not have an impact on our consolidated financial statements or notes to our consolidated financial statements.
Partially Owned Entities and Variable Interest Entities
Effective January 1, 2016, the Company adopted FASB ASU No. 2015-02 (“ASU 2015-02”), which amended certain guidance with respect to the evaluation of Variable Interest Entities (“VIEs”) and when a reporting entity is required to consolidate certain legal entities. Specifically, the amendments: (i) modify the evaluation of whether limited partnerships and similar legal entities are VIEs or voting interest entities, (ii) eliminate the presumption that a general partner should consolidate a limited partnership, (iii) affect the consolidation analysis of reporting entities that are involved with VIEs, and (iv) provide a scope exception for certain entities.
Under this guidance, effective January 1, 2016, the Operating Partnership was determined to be a VIE of the Company as the Operating Partnership is a limited partnership in which the common limited partners do not have substantive kick-out rights or participating rights. However, given that the Company was deemed to be the primary beneficiary of the Operating Partnership because the Company has the ability to control the activities that most significantly impact the Operating Partnership’s economic performance, the adoption of this new guidance and the conclusion that the Operating Partnership was a VIE did not have any impact on our consolidated financial statements since the conclusion to consolidate the Operating Partnership still applied. The Operating Partnership was the only new VIE identified as part of the adoption of the guidance as of January 1, 2016.
At
December 31, 2017
the consolidated financial statements of the Company included
two
VIEs in addition to the Operating Partnership: 100 First LLC and 303 Second LLC. At
December 31, 2017
, the Company and the Operating Partnership were determined to be the primary beneficiaries of these
two
VIEs since we had the ability to control the activities that most significantly impact each of the VIEs’ economic performance. As of
December 31, 2017
, the
two
VIEs’ total assets, liabilities and noncontrolling interests included on our consolidated balance sheet were approximately
$426.5 million
(of which
$382.1 million
related to real estate held for investment), approximately
$27.3 million
and approximately
$175.4 million
,
respectively. Revenues, income and net assets generated by 100 First LLC and 303 Second LLC may only be used to settle their contractual obligations, which primarily consist of operating expenses, capital expenditures and required distributions.
At
December 31, 2016
, the consolidated financial statements of the Company included
three
VIEs in addition to the Operating Partnership: 100 First LLC, 303 Second LLC and entity established during the fourth quarter of 2016 to facilitate a transaction intended to qualify as a like-kind exchange pursuant to Section 1031 of the Code (“Section 1031 Exchange”). In January 2017, the Section 1031 Exchange was successfully completed and the entity established for the 1031 Exchange was no longer a VIE. At
December 31, 2016
, the impact of consolidating the VIEs increased the
F - 14
KILROY REALTY CORPORATION AND KILROY REALTY, L.P.
NOTES TO CONSOLIDATED FINANCIAL STATEMENTS – (Continued)
Company’s total assets, liabilities and noncontrolling interests on our consolidated balance sheet by approximately
$654.3 million
(of which
$588.6 million
related to real estate held for investment on our consolidated balance sheet), approximately
$166.1 million
and approximately
$124.3 million
, respectively. The consolidated financial statements of the Operating Partnership included the same three VIEs at
December 31, 2016
.
Our accounting policy is to consolidate entities in which we have a controlling financial interest and significant decision making control over the entity's operations. In determining whether we have a controlling financial interest in a partially owned entity and the requirement to consolidate the accounts of that entity, we consider factors such as ownership interest, board representation, management representation, size of our investment (including loans), authority to control decisions, and contractual and substantive participating rights of the members. In addition to evaluating control rights, we consolidate entities in which the other members have no substantive kick-out rights to remove the Company as the managing member.
Entities in which the equity investors do not have sufficient equity at risk to finance their endeavors without additional financial support or the holders of the equity investment at risk do not have a controlling financial interest are VIEs. We evaluate whether an entity is a VIE and whether we are the primary beneficiary. We are deemed to be the primary beneficiary of a VIE when we have the power to direct the activities of the VIE that most significantly impact the VIEs’ economic performance and the obligation to absorb losses or receive benefits that could potentially be significant to the VIE.
If the requirements for consolidation are not met, the Company would account for investments under the equity method of accounting if we have the ability to exercise significant influence over the entity. Equity method investments would be initially recorded at cost and subsequently adjusted for our share of net income or loss and cash contributions and distributions each period. The Company did not have any equity method investments at
December 31, 2017
or
December 31, 2016
.
Significant Accounting Policies
Acquisitions
Subsequent to our adoption of ASU No. 2017-01 on January 1, 2017, which was adopted on a prospective basis, acquisitions of operating properties and development and redevelopment opportunities generally no longer meet the definition of a business and are accounted for as asset acquisitions. For these asset acquisitions, we record the acquired tangible and intangible assets and assumed liabilities based on each asset’s and liability’s relative fair value at the acquisition date of the total purchase price plus any capitalized acquisition costs. We record the acquired tangible and intangible assets and assumed liabilities of acquisitions of operating properties and development and redevelopment opportunities that meet the accounting criteria to be accounted for as business combinations at fair value at the acquisition date.
The acquired assets and assumed liabilities for an acquisition generally include but are not limited to (i) land and improvements, buildings and improvements, undeveloped land and construction in progress and (ii) identified tangible and intangible assets and liabilities associated with in-place leases, including tenant improvements, leasing costs, value of above-market and below-market operating leases and ground leases, acquired in-place lease values and tenant relationships, if any. Any debt assumed and equity (including common units of the Operating Partnership) issued in connection with a property acquisition is recorded at fair value on the date of acquisition.
The fair value of land and improvements is derived from comparable sales of land and improvements within the same submarket and/or region. The fair value of buildings and improvements, tenant improvements and leasing costs considers the value of the property as if it was vacant as well as current replacement costs and other relevant market rate information.
The fair value of the above-market or below-market component of an acquired in-place operating lease is based upon the present value (calculated using a market discount rate) of the difference between (i) the contractual rents to be paid pursuant to the lease over its remaining non-cancellable lease term and (ii) our estimate of the rents that would be paid using fair market rental rates and rent escalations at the date of acquisition measured over the remaining non-cancellable term of the lease for above-market operating leases and the initial non-cancellable term plus the term of
F - 15
KILROY REALTY CORPORATION AND KILROY REALTY, L.P.
NOTES TO CONSOLIDATED FINANCIAL STATEMENTS – (Continued)
any below-market fixed rate renewal options, if applicable, for below-market operating leases. Our below-market operating leases generally do not include fixed rate or below-market renewal options. The amounts recorded for above-market operating leases are included in deferred leasing costs and acquisition-related intangible assets, net on the balance sheet and are amortized on a straight-line basis as a reduction of rental income over the remaining term of the applicable leases. The amounts recorded for below-market operating leases are included in deferred revenue and acquisition-related intangible liabilities, net on the balance sheet and are amortized on a straight-line basis as an increase to rental income over the remaining term of the applicable leases plus the term of any below-market fixed rate renewal options, if applicable. The amortization of the below-market ground lease obligation is recorded as an increase to ground lease expense in the consolidated statements of operations for the periods presented. The amortization of the above-market ground lease obligation is recorded as a decrease to ground lease expense in the consolidations statements of operations for the periods presented.
The fair value of acquired in-place leases is derived based on our assessment of lost revenue and costs incurred for the period required to lease the “assumed vacant” property to the occupancy level when purchased. The amount recorded for acquired in-place leases is included in deferred leasing costs and acquisition-related intangible assets, net on the balance sheet and amortized as an increase to depreciation and amortization expense over the remaining term of the applicable leases. Fully amortized intangible assets are written off each quarter.
Subsequent to our adoption of “ASU 2017-01” on January 1, 2017,
transaction costs associated with our acquisitions are capitalized as part of the purchase price of the acquisition. Prior to our adoption of
“ASU 2017-01,” costs associated with all operating property acquisitions and those development and redevelopment acquisitions that met the criteria to be accounted for as business combinations were expensed as incurred and costs associated with development acquisitions accounted for as asset acquisitions were capitalized as part of the cost of the asset.
Operating Properties
Operating properties are generally carried at historical cost less accumulated depreciation. Properties held for sale are reported at the lower of the carrying value or the fair value less estimated cost to sell. The cost of operating properties includes the purchase price or development costs of the properties. Costs incurred for the renovation and betterment of the operating properties are capitalized to our investment in that property. Maintenance and repairs are charged to expense as incurred.
When evaluating properties to be held and used for potential impairment, we first evaluate whether there are any indicators of impairment for any of our properties. If any impairment indicators are present for a specific property, we then perform an undiscounted cash flow analysis and compare the net carrying amount of the property to the property’s estimated undiscounted future cash flow over the anticipated holding period. If the estimated undiscounted future cash flow is less than the net carrying amount of the property, we then perform an impairment loss calculation to determine if the fair value of the property is less than the net carrying value of the property. Our impairment loss calculation compares the net carrying amount of the property to the property’s estimated fair value, which may be based on estimated discounted future cash flow calculations or third-party valuations or appraisals. We would recognize an impairment loss if the asset’s net carrying amount exceeds the asset’s estimated fair value. If we were to recognize an impairment loss, the estimated fair value of the asset (less costs to sell for assets held for sale) would become its new cost basis. For a depreciable long-lived asset, the new cost basis would be depreciated (amortized) over the remaining useful life of that asset.
Cost Capitalization
All costs clearly associated with the development, redevelopment and construction of a property are capitalized as project costs, including internal compensation costs. In addition, the following costs are capitalized as project costs during periods in which activities necessary to prepare development and redevelopment properties for their intended use are in progress: pre-construction costs essential to the development of the property, interest, real estate taxes and insurance.
|
•
|
For office development and redevelopment properties that are pre-leased, we cease capitalization when revenue recognition commences, which is upon substantial completion of tenant improvements deemed to be the Company's asset for accounting purposes.
|
F - 16
KILROY REALTY CORPORATION AND KILROY REALTY, L.P.
NOTES TO CONSOLIDATED FINANCIAL STATEMENTS – (Continued)
|
•
|
For office development and redevelopment properties that are not pre-leased, we may not immediately build out the tenant improvements. Therefore, we cease capitalization when revenue recognition commences upon substantial completion of the tenant improvements deemed to be the Company's asset for accounting purposes, but in any event, no later than one year after the cessation of major construction activities. We also cease capitalization on a development or redevelopment property when activities necessary to prepare the property for its intended use have been suspended.
|
|
•
|
For office development or redevelopment properties with multiple tenants and staged leasing, we cease capitalization and begin depreciation on the portion of the development or redevelopment property for which revenue recognition has commenced.
|
|
•
|
For residential development properties, we cease capitalization when the property is substantially complete and available for occupancy.
|
Once major construction activity has ceased and the development or redevelopment property is in the lease-up phase, the costs capitalized to construction in progress are transferred to land and improvements, buildings and improvements, and deferred leasing costs on our consolidated balance sheets as the historical cost of the property.
Depreciation and Amortization of Buildings and Improvements
The costs of buildings and improvements and tenant improvements are depreciated using the straight-line method of accounting over the estimated useful lives set forth in the table below. Depreciation expense for buildings and improvements for the three years ended
December 31, 2017
,
2016
, and
2015
was
$190.5 million
,
$172.0 million
, and
$159.5 million
, respectively.
|
Asset Description
|
Depreciable Lives
|
|
|
Buildings and improvements
|
25 – 40 years
|
|
|
Tenant improvements
|
1 – 20 years
(1)
|
|
|
(1)
|
Tenant improvements are amortized over the shorter of the lease term or the estimated useful life.
|
Real Estate Assets Held for Sale, Dispositions and Discontinued Operations
A real estate asset is classified as held for sale when certain criteria are met, including but not limited to the availability of the asset for immediate sale, the existence of an active program to locate a buyer and the probable sale or transfer of the asset within one year. If such criteria are met, we present the applicable assets and liabilities related to the real estate asset held for sale, if material, separately on the balance sheet and we would cease to record depreciation and amortization expense. Real estate assets held for sale are reported at the lower of their carrying value or their estimated fair value less the estimated costs to sell. As of
December 31, 2017
, we did
not
have any properties classified as held for sale. As of
December 31, 2016
, we classified
one
operating property located in San Diego, California as held for sale.
Effective January 1, 2015, the Company adopted FASB ASU No. 2014-08 (“ASU 2014-08”), which changed the criteria for reporting discontinued operations while enhancing disclosures in this area. Under the guidance, only property disposals representing a strategic shift that has (or will have) a major effect on an entity’s operations and financial results, such as a major line of business, a major geographical area or a major equity investment, are required to be presented as discontinued operations. If we were to determine that the property disposition represents a strategic shift, the revenues, expenses and net gain (loss) on dispositions of the property would be recorded in discontinued operations for all periods presented through the date of the applicable disposition. The Company adopted and applied the new guidance on a prospective basis as required by ASU 2014-08. In accordance with this guidance, the operations of
eleven
,
six
and
ten
properties sold during the years ended
December 31, 2017
,
December 31, 2016
and
December 31, 2015
, respectively, are presented in continuing operations as they did not represent a strategic shift in the Company’s operations and financial results.
F - 17
KILROY REALTY CORPORATION AND KILROY REALTY, L.P.
NOTES TO CONSOLIDATED FINANCIAL STATEMENTS – (Continued)
The net gains (losses) on dispositions of non-depreciable real estate property, including land, are reported in the consolidated statements of operations as gains (losses) on sale of land within continuing operations in the period the land is sold.
Revenue Recognition
We recognize revenue from rent, tenant reimbursements, parking and other revenue once all of the following criteria are met: (i) the agreement has been fully executed and delivered, (ii) services have been rendered, (iii) the amount is fixed or determinable and (iv) the collectability of the amount is reasonably assured.
Minimum annual rental revenues are recognized in rental revenues on a straight-line basis over the non-cancellable term of the related lease. Rental revenue recognition commences when the tenant takes possession or controls the physical use of the leased space. In order for the tenant to take possession, the leased space must be substantially complete and ready for its intended use. In order to determine whether the leased space is substantially ready for its intended use, we begin by determining whether the Company or the tenant owns the tenant improvements. When we conclude that the Company is the owner of tenant improvements, rental revenue recognition begins when the tenant takes possession of the finished space, which is generally when Company owned tenant improvements are substantially complete. In certain instances, when we conclude that the Company is not the owner (the tenant is the owner) of tenant improvements, rental revenue recognition begins when the tenant takes possession of or controls the space.
When we conclude that the Company is the owner of tenant improvements, we record the cost to construct the tenant improvements, including costs paid for or reimbursed by the tenants, as a capital asset. For these tenant improvements, we record the amount funded by or reimbursed by the tenants as deferred revenue, which is amortized on a straight-line basis as additional rental income over the term of the related lease.
When we conclude that the tenant is the owner of tenant improvements for accounting purposes, we record our contribution towards those improvements as a lease incentive, which is included in deferred leasing costs and acquisition-related intangible assets, net on our consolidated balance sheets and amortized as a reduction to rental income on a straight-line basis over the term of the lease.
For residential properties, we commence revenue recognition upon occupancy of the units by the tenants. Residential rental revenue is recognized on a straight-line basis over the term of the related lease, net of any concessions.
Tenant Reimbursements
Reimbursements from tenants, consisting of amounts due from tenants for common area maintenance, real estate taxes and other recoverable costs, are recognized as revenue in the period the recoverable costs are incurred. Tenant reimbursements are recognized and recorded on a gross basis, as we are generally the primary obligor with respect to purchasing goods and services from third-party suppliers, have discretion in selecting the supplier, and have credit risk.
Other Property Income
Other property income primarily includes amounts recorded in connection with lease terminations, tenant bankruptcy settlement payments, broken deal income and property damage settlement related payments. Lease termination fees are amortized over the remaining lease term, if applicable. If there is no remaining lease term, they are recognized when received and realized. Other property income also includes miscellaneous income from tenants, such as fees related to the restoration of leased premises to their original condition and fees for late rental payments.
Allowances for Uncollectible Tenant and Deferred Rent Receivables
We carry our current and deferred rent receivables net of allowances for uncollectible amounts. Our determination of the adequacy of these allowances is based primarily upon evaluations of individual receivables, current economic conditions, and other relevant factors. The allowances are increased or decreased through the provision for bad debts on our consolidated statements of operations.
F - 18
KILROY REALTY CORPORATION AND KILROY REALTY, L.P.
NOTES TO CONSOLIDATED FINANCIAL STATEMENTS – (Continued)
Cash and Cash Equivalents
We consider all highly-liquid investments with original maturities of three months or less to be cash equivalents.
Restricted Cash
Restricted cash consists of cash proceeds from dispositions that are temporarily held at qualified intermediaries for purposes of facilitating potential Section 1031 Exchanges and cash held in escrow related to acquisition and disposition holdbacks. Restricted cash also includes cash held as collateral to provide credit enhancement for the Operating Partnership’s mortgage debt, including cash reserves for capital expenditures, tenant improvements and property taxes. As of
December 31, 2017
, we did
not
have any restricted cash held at qualified intermediaries for the purpose of facilitating Section 1031 Exchanges. As of
December 31, 2016
, we had
$48.4 million
restricted cash held at qualified intermediaries for the purpose of facilitating Section 1031 Exchanges. In January 2017, the Section 1031 Exchange was completed and the cash was released from the qualified intermediary.
Marketable Securities / Deferred Compensation Plan
Marketable securities reported in our consolidated balance sheets represent the assets held in connection with the Kilroy Realty Corporation 2007 Deferred Compensation Plan (the “Deferred Compensation Plan”) (see Note 16 “Employee Benefit Plans” for additional information). The Deferred Compensation Plan assets are held in a limited rabbi trust and invested in various mutual and money market funds. As a result, the marketable securities are treated as trading securities for financial reporting purposes and are adjusted to fair value at the end of each accounting period, with the corresponding gains and losses recorded in interest income and other net investment gains.
At the time eligible management employees (“Participants”) defer compensation or earn mandatory Company contributions, or if we were to make a discretionary contribution, we record compensation cost and a corresponding deferred compensation plan liability, which is included in accounts payable, accrued expenses, and other liabilities on our consolidated balance sheets. This liability is adjusted to fair value at the end of each accounting period based on the performance of the benchmark funds selected by each Participant, and the impact of adjusting the liability to fair value is recorded as an increase or decrease to compensation cost. The impact of adjusting the deferred compensation plan liability to fair value and the changes in the value of the marketable securities held in connection with the Deferred Compensation Plan generally offset and therefore do not significantly impact net income.
Deferred Leasing Costs
Costs incurred in connection with successful property leasing are capitalized as deferred leasing costs and classified as investing activities in the statement of cash flows. Deferred leasing costs consist primarily of leasing commissions and also include certain internal payroll costs and lease incentives, which are amortized using the straight-line method of accounting over the lives of the leases which generally range from
one
to
20
years. We reevaluate the remaining useful lives of leasing costs as the creditworthiness of our tenants and economic and market conditions change. If we determine that the estimated remaining life of a lease has changed, we adjust the amortization period accordingly. Fully amortized deferred leasing costs are written off each quarter.
Deferred Financing Costs
Financing costs related to the origination or assumption of long-term debt are deferred and generally amortized using the straight-line method of accounting, which approximates the effective interest method, over the contractual terms of the applicable financings. Fully amortized deferred financing costs are written off when the corresponding financing is repaid.
F - 19
KILROY REALTY CORPORATION AND KILROY REALTY, L.P.
NOTES TO CONSOLIDATED FINANCIAL STATEMENTS – (Continued)
Debt Discounts and Premiums
Original issuance debt discounts and discounts/premiums related to recording debt acquired in connection with operating property acquisitions at fair value are generally amortized and accreted on a straight-line basis, which approximates the effective interest method. Discounts are recorded as additional interest expense from date of issuance or acquisition through the contractual maturity date of the related debt. Premiums are recorded as a reduction to interest expense from the date of issuance or acquisition through the contractual maturity date of the related debt.
Noncontrolling Interests - Common Units of the Operating Partnership in the Company's Consolidated Financial Statements
Common units of the Operating Partnership within noncontrolling interests in the Company’s consolidated financial statements represent the common limited partnership interests in the Operating Partnership not held by the Company (“noncontrolling common units”). Noncontrolling common units are presented in the equity section of the Company’s consolidated balance sheets and are reported at their proportionate share of the net assets of the Operating Partnership. Noncontrolling interests with redemption provisions that permit the issuer to settle in either cash or shares of common stock must be further evaluated to determine whether equity or temporary equity classification on the balance sheet is appropriate. Since the common units contain such a provision, we evaluated the accounting guidance and determined that the common units qualify for equity presentation in the Company’s consolidated financial statements. Net income attributable to noncontrolling common units is allocated based on their relative ownership percentage of the Operating Partnership during the reported period. The noncontrolling interest ownership percentage is determined by dividing the number of noncontrolling common units by the total number of common units outstanding. The issuance or redemption of additional shares of common stock or common units results in changes to the noncontrolling interest percentage as well as the total net assets of the Company. As a result, all equity transactions result in an allocation between equity and the noncontrolling interest in the Company’s consolidated balance sheets and statements of equity to account for the changes in the noncontrolling interest ownership percentage as well as the change in total net assets of the Company.
Noncontrolling Interests in Consolidated Property Partnerships
Noncontrolling interests in consolidated property partnerships represent the equity interests held by unrelated third parties in our
three
consolidated property partnerships (see Note 11 “Noncontrolling Interests on the Company’s Consolidated Financial Statements” and see Note 12 “Noncontrolling Interests on the Operating Partnership’s Consolidated Financial Statements”). Noncontrolling interests in consolidated property partnerships are not redeemable and are presented as permanent equity in the Company's consolidated balance sheets. We account for the noncontrolling interests in consolidated property partnerships using the hypothetical liquidation at book value (“HLBV”) method to attribute the earnings or losses of the consolidated property partnerships between the controlling and noncontrolling interests. Under the HLBV method, the amounts reported as noncontrolling interests in consolidated property partnerships in the consolidated balance sheets represent the amounts the noncontrolling interests would hypothetically receive at each balance sheet reporting date under the liquidation provisions of the governing agreements assuming the net assets of the consolidated property partnerships were liquidated at recorded amounts and distributed between the controlling and noncontrolling interests in accordance with the governing documents. The net income attributable to noncontrolling interests in consolidated property partnerships in the consolidated statements of operations is associated with the increase or decrease in the noncontrolling interest holders’ contractual claims on the respective entities’ balance sheets assuming a hypothetical liquidation at the end of that reporting period when compared with their claims on the respective entities’ balance sheets assuming a hypothetical liquidation at the beginning of that reporting period, after removing any contributions or distributions.
F - 20
KILROY REALTY CORPORATION AND KILROY REALTY, L.P.
NOTES TO CONSOLIDATED FINANCIAL STATEMENTS – (Continued)
Preferred Stock on the Company’s Consolidated Balance Sheets
Preferred stock of the Company as of
December 31, 2016
represented the then publicly issued and outstanding
4,000,000
6.875%
Series G Cumulative Redeemable Preferred Stock (“Series G Preferred Stock”) and the
4,000,000
6.375%
Series H Cumulative Redeemable Preferred Stock (“Series H Preferred Stock”). As of
December 31, 2016
, the Series G and Series H Preferred Stock were presented in the permanent equity section of the Company’s consolidated balance sheets given that the Series G and Series H Preferred Units could only be redeemed at our option. The Company redeemed all
4,000,000
shares of the Series G Preferred Stock and all
4,000,000
shares of the Series H Preferred Stock on
March 30, 2017
and
August 15, 2017
, respectively (see Note 13 “Stockholders’ Equity of the Company”).
Preferred Partnership Interests on the Operating Partnership’s Consolidated Balance Sheets
Preferred partnership interests of the Operating Partnership as of
December 31, 2016
represented the then issued and outstanding
4,000,000
6.875%
Series G Cumulative Redeemable Preferred Units (“Series G Preferred Units”) and the
4,000,000
6.375%
Series H Cumulative Redeemable Preferred Units (“Series H Preferred Units”). As of
December 31, 2016
, the Series G and Series H Preferred Units were presented in the permanent equity section of the Operating Partnership’s consolidated balance sheets given that the Series G and Series H Preferred Units could only be redeemed at our option. The Company was the holder of both the Series G and Series H Preferred Units and for each Series G and Series H Preferred Unit the Company had an equivalent number of shares of the Company’s
6.875%
Series G Cumulative Redeemable Preferred Stock (“Series G Preferred Stock”) and shares of the Company’s
6.375%
Series H Cumulative Redeemable Preferred Stock (“Series H Preferred Stock”) publicly issued and outstanding. The Company redeemed all
4,000,000
shares of the Series G Preferred Stock and all
4,000,000
shares of the Series H Preferred Stock on
March 30, 2017
and
August 15, 2017
, respectively, resulting in the Operating Partnership redeeming the Series G and Series H Preferred Units on the same dates (see Note 14 “Preferred and Common Units of the Operating Partnership”).
Common Partnership Interests on the Operating Partnership’s Consolidated Balance Sheets
The common units held by the Company and the noncontrolling common units held by the common limited partners are both presented in the permanent equity section of the Operating Partnership’s consolidated balance sheets in partners’ capital. The redemption rights of the noncontrolling common units permit us to settle the redemption obligation in either cash or shares of the Company’s common stock at our option (see Note 11 “Noncontrolling Interests on the Company’s Consolidated Financial Statements” for additional information).
Noncontrolling Interests on the Operating Partnership’s Consolidated Financial Statements
Noncontrolling interests in the Operating Partnership’s consolidated financial statements include the noncontrolling interest in property partnerships (see Note 12 “Noncontrolling Interests on the Operating Partnership’s Consolidated Financial Statements”) and the Company’s
1.0%
general partnership interest in the Finance Partnership. The
1.0%
general partnership interest in the Finance Partnership noncontrolling interest is presented in the permanent equity section of the Operating Partnership’s consolidated balance sheets given that these interests are not convertible or redeemable into any other ownership interest of the Company or the Operating Partnership.
Equity Offerings
Underwriting commissions and offering costs incurred in connection with common equity offerings and our at-the-market stock offering program (see Note 13 “Stockholders’ Equity of the Company”) are reflected as a reduction of additional paid-in capital. Issuance costs incurred in connection with preferred equity offerings are reflected as a reduction of the carrying value of the preferred equity.
The Company records preferred stock issuance costs as a non-cash preferred equity distribution at the time we notify the holders of preferred stock or units of our intent to redeem such shares or units. Refer to Notes 13 “Stockholders’ Equity of the Company” and 14 “Partners’ Capital of the Operating Partnership” for details related to the redemption of the Series G and Series H Preferred Stock.
F - 21
KILROY REALTY CORPORATION AND KILROY REALTY, L.P.
NOTES TO CONSOLIDATED FINANCIAL STATEMENTS – (Continued)
The net proceeds from any equity offering of the Company are generally contributed to the Operating Partnership in exchange for a number of common or preferred units equivalent to the number of shares of common or preferred stock issued and are reflected in the Operating Partnership’s consolidated financial statements as an increase in partners’ capital.
Share-based Incentive Compensation Accounting
Compensation cost for all share-based awards, including options, requires measurement at estimated fair value on the grant date. Compensation cost is recognized on a straight-line basis over the service vesting period, which represents the requisite service period. The grant date fair value of market measure-based share-based compensation plans are calculated using a Monte Carlo simulation pricing model. The grant date fair value of stock option grants is calculated using the Black-Scholes valuation model. Equity awards settled in cash are valued at the fair value of our common stock on the period end date through the settlement date. Equity awards settled in cash are remeasured at each reporting period and are recognized as a liability in the consolidated balance sheet during the vesting period until settlement. Forfeitures of all share-based awards are recognized when they occur as forfeitures generally are not common or expected and have not historically been significant.
For share-based awards in which the performance period precedes the grant date, we recognize compensation cost over the requisite service period, which includes both the performance and service vesting periods, using the accelerated attribution expense method. The requisite service period begins on the date the Executive Compensation Committee authorizes the award and adopts any relevant performance measures.
For share-based awards with performance-based measures, the total estimated compensation cost is based on our most recent estimate of the probable achievement of the pre-established specific corporate performance measures. These estimates are based on our latest internal forecasts for each performance measure. For share-based awards with market measures, the total estimated compensation cost is based on the fair value of the award at the grant date. For share-based awards with performance-based measures and market measures, the total estimated compensation cost is based on the fair value per share at the grant date multiplied by our most recent estimate of the number of shares to be earned based on the probable achievement of the pre-established corporate performance measures based on our latest internal forecasts.
In accordance with the provisions of our share-based incentive compensation plan, we accept the return of shares of Company common stock, at the current quoted market price, from employees to satisfy minimum statutory tax-withholding requirements related to shares that vested during the period.
For share-based awards granted by the Company, the Operating Partnership issues a number of common units equal to the number of shares of common stock ultimately granted by the Company in respect of such awards.
Basic and Diluted Net Income Available to Common Stockholders per Share
Basic net income available to common stockholders per share is computed by dividing net income available to common stockholders, after preferred distributions and the allocation of income to participating securities, by the weighted-average number of shares of common stock outstanding for the period. Diluted net income available to common stockholders per share is computed by dividing net income available for common stockholders, after preferred distributions and the allocation of income to participating securities, by the sum of the weighted-average number of shares of common stock outstanding for the period plus the assumed exercise of all dilutive securities. The impact of the outstanding common units is considered in the calculation of diluted net income available to common stockholders per share. The common units are not reflected in the diluted net income available to common stockholders per share calculation because the exchange of common units into common stock is on a
one
for one basis, and the common units are allocated net income on a per share basis equal to the common stock (see Note 20 “Net Income Available to Common Stockholders Per Share of the Company”). Accordingly, any exchange would not have any effect on diluted net income (loss) available to common stockholders per share.
Nonvested share-based payment awards (including nonvested restricted stock units (“RSUs”), vested market-measure RSUs and vested dividend equivalents issued to holders of RSUs) containing nonforfeitable rights to dividends or dividend equivalents are accounted for as participating securities and included in the computation of basic and diluted
F - 22
KILROY REALTY CORPORATION AND KILROY REALTY, L.P.
NOTES TO CONSOLIDATED FINANCIAL STATEMENTS – (Continued)
net income available to common stockholders per share pursuant to the two-class method. The dilutive effect of stock options is reflected in the weighted average diluted outstanding shares calculation by application of the treasury stock method. The dilutive effect of the outstanding nonvested shares of common stock (“nonvested shares”) and RSUs that have not yet been granted but are contingently issuable under the share-based compensation programs is reflected in the weighted average diluted shares calculation by application of the treasury stock method at the beginning of the quarterly period in which all necessary conditions have been satisfied.
Basic and Diluted Net Income Available to Common Unitholders per Unit
Basic net income available to common unitholders per unit is computed by dividing net income available to common unitholders, after preferred distributions and the allocation of income to participating securities, by the weighted-average number of vested common units outstanding for the period. Diluted net income available to common unitholders per unit is computed by dividing net income available to common unitholders, after preferred distributions and the allocation of income to participating securities, by the sum of the weighted-average number of common units outstanding for the period plus the assumed exercise of all dilutive securities.
The dilutive effect of stock options, outstanding nonvested shares, RSUs, and awards containing nonforfeitable rights to dividend equivalents are reflected in diluted net income available to common unitholders per unit in the same manner as noted above for net income available to common stockholders per share.
Fair Value Measurements
The fair values of our financial assets and liabilities are disclosed in Note 19, “Fair Value Measurements and Disclosures,” to our consolidated financial statements. The only financial assets recorded at fair value on a recurring basis in our consolidated financial statements are our marketable securities. We elected not to apply the fair value option for any of our eligible financial instruments or other items.
We determine the estimated fair value of financial assets and liabilities utilizing a hierarchy of valuation techniques based on whether the inputs to a fair value measurement are considered to be observable or unobservable in a marketplace. Observable inputs reflect market data obtained from independent sources, while unobservable inputs reflect our market assumptions. This hierarchy requires the use of observable market data when available. The following is the fair value hierarchy:
|
•
|
Level 1 –
quoted prices for identical instruments in active markets;
|
|
•
|
Level 2 –
quoted prices for similar instruments in active markets; quoted prices for identical or similar instruments in markets that are not active and model-derived valuations in which significant inputs and significant value drivers are observable in active markets; and
|
|
•
|
Level 3 –
fair value measurements derived from valuation techniques in which one or more significant inputs or significant value drivers are unobservable.
|
We determine the fair value for the marketable securities using quoted prices in active markets for identical assets. Our other financial instruments, which are only disclosed at fair value, are comprised of secured debt, unsecured senior notes, unsecured line of credit and unsecured term loan facility.
We generally determine the fair value of our secured debt, unsecured debt, and unsecured line of credit by performing discounted cash flow analyses using an appropriate market discount rate. We calculate the market rate by obtaining period-end treasury rates for maturities that correspond to the maturities of our fixed-rate debt and then adding an appropriate credit spread based on information obtained from third-party financial institutions. These credit spreads take into account factors, including but not limited to, our credit profile, the tenure of the debt, amortization period, whether the debt is secured or unsecured, and the loan-to-value ratio of the debt to the collateral. These calculations are significantly affected by the assumptions used, including the discount rate, credit spreads and estimates of future cash flow. We calculate the market rate of our unsecured line of credit, unsecured term loan facility, and unsecured term loan by obtaining the period-end London Interbank Offered Rate (“LIBOR”) and then adding an appropriate credit spread based on our credit ratings, and the amended terms of our unsecured line of credit, unsecured term loan facility,
F - 23
KILROY REALTY CORPORATION AND KILROY REALTY, L.P.
NOTES TO CONSOLIDATED FINANCIAL STATEMENTS – (Continued)
and unsecured term loan agreement. We determine the fair value of each of our publicly traded unsecured senior notes based on their quoted trading price at the end of the reporting period, if such prices are available.
Carrying amounts of our cash and cash equivalents, restricted cash and accounts payable approximate fair value due to their short-term maturities.
Income Taxes
We have elected to be taxed as a REIT under Sections 856 through 860 of the Code. To qualify as a REIT, we must distribute annually at least
90%
of our adjusted taxable income, as defined in the Code, to our stockholders and satisfy certain other organizational and operating requirements. We generally will not be subject to federal income taxes if we distribute
100%
of our taxable income for each year to our stockholders. If we fail to qualify as a REIT in any taxable year, we will be subject to federal income taxes (including any applicable alternative minimum tax) on our taxable income at regular corporate rates and we may not be able to qualify as a REIT for four subsequent taxable years. Even if we qualify for taxation as a REIT, we may be subject to certain state and local taxes on our income and property and to federal income taxes and excise taxes on our undistributed taxable income. We believe that we have met all of the REIT distribution and technical requirements for the years ended
December 31, 2017
,
2016
and
2015
, and we were not subject to any federal income taxes (see Note 24 “Tax Treatment of Distributions” for additional information). We intend to continue to adhere to these requirements and maintain the Company’s REIT status. Accordingly, no provision for income taxes has been made in the accompanying financial statements.
In addition, any taxable income from our taxable REIT subsidiary, which was formed in 2002, is subject to federal, state, and local income taxes. For the years ended
December 31, 2017
,
2016
and
2015
the taxable REIT subsidiary had
de minimis
taxable income.
Uncertain Tax Positions
We include favorable tax positions in the calculation of tax liabilities if it is more likely than not that our adopted tax position will prevail if challenged by tax authorities.
We evaluated the potential impact of identified uncertain tax positions for all tax years still subject to audit under state and federal income tax law and concluded that we did not have any unrecognized tax benefits or any additional tax liabilities as of
December 31, 2017
or
2016
. As of
December 31, 2017
, the years still subject to audit are 2013 through 2017 under the California state income tax law and 2014 through 2017 under the federal income tax law.
Use of Estimates
The preparation of financial statements in conformity with GAAP requires us to make estimates and assumptions that affect the reported amounts of assets and liabilities and disclosure of contingent assets and liabilities at the date of the financial statements and the reported amounts of revenues and expenses during the reported periods. Actual results could differ from those estimates.
Segments
We currently operate in one operating segment, our office properties segment.
Concentration of Credit Risk
All of our properties and development and redevelopment projects are owned and all of our business is currently conducted in the state of California with the exception of the ownership and operation of
twelve
office properties and
one
development project under construction located in the state of Washington. The ability of tenants to honor the terms of their leases is dependent upon the economic, regulatory, and social factors affecting the communities in which our tenants operate.
As of
December 31, 2017
, our
15
largest tenants represented approximately
40.3%
of total annualized base rental revenues, of which
5.0%
was attributable to our largest tenant.
F - 24
KILROY REALTY CORPORATION AND KILROY REALTY, L.P.
NOTES TO CONSOLIDATED FINANCIAL STATEMENTS – (Continued)
We have deposited cash with financial institutions that is insured by the Federal Deposit Insurance Corporation (“FDIC”) up to
$250,000
per institution. As of
December 31, 2017
and
2016
, we had cash accounts in excess of FDIC insured limits.
Accounting Standards Issued But Not Yet Effective at December 31, 2017
Accounting Pronouncements Adopted January 1, 2018
Revenue From Contracts with Customers
Effective January 1, 2018, we adopted FASB ASU No. 2014-09 “Revenue From Contracts with Customers (Topic 606)” (“ASU 2014-09”) and the related FASB ASU Nos. 2016-12 and 2016-20, which provide practical expedients, technical corrections, and improvements for certain aspects of ASU 2014-09, on a modified retrospective basis. ASU 2014-09 establishes a single comprehensive model for entities to use in accounting for revenue from contracts with customers and supersedes most of the existing revenue recognition guidance.
In connection with our long term project on this standard, we evaluated each of the Company’s revenue streams to determine the sources of revenue that are impacted by ASU 2014-09 and concluded that only sales of real estate and certain of our multi-tenant parking arrangements fall under the scope of Topic 606. Specifically, we evaluated the impact of the guidance on timing of gain recognition for dispositions and concluded there was no impact to our consolidated financial statements given the simplicity of the Company’s historical disposition transactions and no pending sales of real estate as of December 31, 2017. In addition, we also evaluated the impact of the guidance on the timing and pattern of revenue recognition for certain of our multi-tenant parking arrangements that fall under the scope of Topic 606 and determined there was no change in the timing or pattern of revenue recognition for such arrangements as compared to current accounting practice. Therefore we have concluded that adoption of the new revenue recognition guidance did not have an impact on our consolidated financial statements or notes to our consolidated financial statements.
Other Pronouncements Adopted January 1, 2018
Effective January 1, 2018 we adopted FASB ASU No. 2017-09 “Compensation - Stock Compensation (Topic 718)” on a prospective basis. Under the guidance, an entity will not apply modification accounting to a share-based payment award if the award’s fair value, vesting conditions, and classification as an equity or liability instrument remain the same immediately before and after the change. The adoption of this guidance did not have an impact on our consolidated financial statements or notes to our consolidated financial statements.
Effective January 1, 2018 we adopted FASB ASU No. 2017-05 “Other Income - Gains and Losses from the Derecognition of Nonfinancial Assets (Subtopic 610-20)” (“ASU 2017-05”) on a retrospective basis. This standard clarifies the scope of the original guidance within Subtopic 610-20 “Gains and Losses from the Derecognition of Nonfinancial Assets” that was issued in connection with ASU 2014-09 “Revenue From Contracts with Customers” which provided guidance for recognizing gains and losses from the transfer of nonfinancial assets in transactions with noncustomers. Additionally, ASU 2017-05 adds guidance pertaining to the partial sales of real estate and clarifies that nonfinancial assets within the scope of Accounting Standards Codification Subtopic 610-20 may include nonfinancial assets transferred within a legal entity to a counterparty. For example, a parent may transfer control of nonfinancial assets by transferring ownership interests in a consolidated subsidiary. The adoption of this guidance did not have an impact on our consolidated financial statements or notes to our consolidated financial statements.
Effective January 1, 2018 we adopted FASB ASU No. 2016-15 (“ASU 2016-15”) which provides guidance where there is diversity in practice in how certain cash receipts and cash payments are presented and classified in the statement of cash flows, on a retrospective basis. The adoption of this guidance did not have an impact on our consolidated financial statements or notes to our consolidated financial statements.
Effective January 1, 2018 we adopted FASB ASU No. 2016-01 (“ASU 2016-01”) which amends the accounting guidance on the classification and measurement of financial instruments. The standard requires that all investments in equity securities, including other ownership interests, are reported at fair value with changes in fair value reported in net income. This requirement does not apply to investments that qualify for equity method accounting or to those that
F - 25
KILROY REALTY CORPORATION AND KILROY REALTY, L.P.
NOTES TO CONSOLIDATED FINANCIAL STATEMENTS – (Continued)
result in consolidation of the investee or for which the entity has elected the predictability exception to fair value measurement. Additionally, the standard requires that the portion of the total fair value change caused by a change in instrument-specific credit risk for financial liabilities for which the fair value option has been elected would be recognized in other comprehensive income. Any accumulated amount remaining in other comprehensive income is reclassified to earnings when the liability is extinguished. The adoption of this guidance did not have an impact on our consolidated financial statements or notes to our consolidated financial statements since our only financial assets are the marketable securities related to our deferred compensation plan which are recorded as trading securities which are reported at fair value and marked to market through earnings each reporting period.
Accounting Pronouncements Effective January 1, 2019
Leases
On February 25, 2016, the FASB issued ASU No. 2016-02 “Leases (Topic 842)” (“ASU 2016-02”) to amend the accounting guidance for leases. The accounting applied by a lessor is largely unchanged under ASU 2016-02. However, the standard requires lessees to recognize lease assets and lease liabilities for leases classified as operating leases on the balance sheet. Lessees will recognize in the statement of financial position a liability to make lease payments and a right-of-use asset representing its right to use the underlying asset for the lease term. For leases with a term of 12 months or less, a lessee is permitted to make an accounting policy election by class of underlying asset not to recognize lease assets and lease liabilities. If a lessee makes this election, it will recognize lease expense for such leases generally on a straight-line basis over the lease term. ASU 2016-02 is effective for fiscal years beginning after December 15, 2018 and early adoption is permitted.
In January 2018, the FASB released an exposure draft to ASU No. 2016-02 that if issued in its current form would (1) simplify transition requirements for both lessees and lessors by adding an option that would permit an organization to apply the transition provisions of the new standard at its adoption date instead of at the earliest comparative period presented in its financial statements and, (2) provide a practical expedient for lessors that would permit lessors to not be required to separate nonlease components from the associated lease components if certain conditions are met.
We continue to have an active project team, led by senior accounting management, that is proactively working to analyze and evaluate the impact of the guidance and the proposed exposure draft on our consolidated financial statements. For leases where we are the lessor, we currently believe that we would be able to elect the practical expedient proposed in the exposure draft and would not be required to separately bifurcate and report common area maintenance revenue for operating leases on our consolidated statements of operations. We also currently believe that such leases would be accounted for in a similar method to existing standards with the underlying leased asset being reported and recognized as a real estate asset.
ASU 2016-02 also specifies that upon adoption, lessors will no longer be able to capitalize and amortize certain leasing related costs and instead will only be permitted to capitalize and amortize incremental direct leasing costs. As a result, we have concluded that upon the adoption of the standard, we will be required to expense as incurred certain leasing costs we are currently able to capitalize and amortize as deferred leasing costs under existing guidance. We are currently in the process of analyzing the impact of this change in the guidance and we currently believe this change will have a material impact to the Company’s consolidated financial statements and results of operations upon adoption of the standard.
For leases where we are the lessee, specifically for our ground leases, we currently believe that the adoption of the standard will significantly change the accounting on our consolidated balance sheets since both existing ground leases and any future ground leases will be required to be recorded on the Company’s consolidated balance sheets as an obligation of the Company. We currently believe that existing ground leases executed before the January 1, 2019 adoption date will continue to be accounted for as operating leases and will not have a material impact on our recognition of ground lease expense or our results of operations. However, we believe that we will be required to recognize a right of use asset and a lease liability on our consolidated balance sheets equal to the present value of the minimum lease payments required in accordance with each ground lease. As of
December 31, 2017
, our future undiscounted minimum rental payments under these leases totaled
$251.4 million
, with several of the leases containing provisions for rental payments to fluctuate based on fair market value and operating income measurements with expirations through 2093. In addition, we currently believe that for new ground leases entered into after the adoption date of the new standard, such leases could be required to be accounted for as a financing type lease, resulting in ground lease expense recorded
F - 26
KILROY REALTY CORPORATION AND KILROY REALTY, L.P.
NOTES TO CONSOLIDATED FINANCIAL STATEMENTS – (Continued)
using the effective interest method instead of on a straight-line basis over the term of the lease. This could have a significant impact on our results of operations if we enter into material new ground leases after the date of adoption since ground lease expense calculated using the effective interest method results in an increased amount of ground lease expense in the earlier years of a ground lease as compared to the current straight-line method.
We currently expect to adopt ASU 2016-02 using the practical expedients proposed in the standard and the proposed exposure draft if issued in final form.
Accounting Pronouncements Effective 2020 and Beyond
On June 16, 2016, the FASB issued ASU No. 2016-13 (“ASU 2016-13”) to amend the accounting for credit losses for certain financial instruments. Under the new guidance, an entity recognizes its estimate of expected credit losses as an allowance, which the FASB believes will result in more timely recognition of such losses. ASU 2016-13 is effective for fiscal years beginning after December 15, 2019, including interim periods within those fiscal years. Early adoption is permitted for fiscal years beginning after December 15, 2018, including interim periods within those fiscal years. The Company does not currently anticipate that the guidance will have a material impact on our consolidated financial statements or notes to our consolidated financial statements.
F - 27
KILROY REALTY CORPORATION AND KILROY REALTY, L.P.
NOTES TO CONSOLIDATED FINANCIAL STATEMENTS – (Continued)
|
3.
|
Acquisitions
|
Operating Property Acquisitions
We did
not
acquire any operating properties during the year ended
December 31, 2017
. During the year ended
December 31, 2016
we acquired the
seven
operating properties listed below in
three
transactions with unrelated third parties.
|
Property
|
Date of Acquisition
|
Number of Buildings
|
Rentable Square Feet (unaudited)
|
Occupancy as of December 31, 2016 (unaudited)
|
Purchase Price (in millions)
(1)
|
||||||||
|
2016 Acquisitions
|
|||||||||||||
|
1290-1300 Terra Bella Avenue, Mountain View, CA
(2)
|
June 8, 2016
|
1
|
114,175
|
|
100.0%
|
$
|
55.4
|
|
|||||
|
8560-8590 West Sunset Blvd., West Hollywood, CA
(3)
|
December 7, 2016
|
4
|
178,699
|
|
87.5%
|
209.2
|
|
||||||
|
1701 Page Mill Rd. and 3150 Porter Dr., Palo Alto, CA
(4)
|
December 19, 2016
|
2
|
165,585
|
|
100.0%
|
130.0
|
|
||||||
|
Total
(5)
|
7
|
458,459
|
|
$
|
394.6
|
|
|||||||
|
(1)
|
Excludes acquisition-related costs and non-lease related accrued liabilities assumed. Includes assumed unpaid leasing commissions and tenant improvements.
|
|
(2)
|
In connection with this acquisition, the Company assumed
$0.2 million
in accrued liabilities that are not included in the purchase price above.
|
|
(3)
|
This acquisition encompasses a 10-story office tower, three retail buildings, a four-level subterranean parking structure and three billboards. In connection with this acquisition, the Company assumed
$0.1 million
in accrued liabilities that are not included in the purchase price above.
|
|
(4)
|
In connection with this acquisition, the Company entered into a long-term ground lease expiring in December 2067.
|
|
(5)
|
The results of operations for the properties acquired during 2016 contributed
$5.2 million
and
$1.7 million
to revenue and net income from continuing operations, respectively, for the year ended
December 31, 2016
.
|
The related assets, liabilities and results of operations of the acquired properties are included in the consolidated financial statements as of the date of acquisition. The following table summarizes the estimated fair values of the assets acquired and liabilities assumed at the respective acquisition dates for our
2016
operating property acquisitions:
|
Acquisitions
|
Total 2016
Acquisitions
(1)
|
||
|
Assets
|
(in thousands)
|
||
|
Land and improvements
|
$
|
120,110
|
|
|
Buildings and improvements
(2)
|
259,301
|
|
|
|
Deferred leasing costs and acquisition-related intangible assets
(3)
|
33,529
|
|
|
|
Total assets acquired
|
412,940
|
|
|
|
Liabilities
|
|||
|
Accounts payable, accrued expenses and other liabilities
|
1,122
|
|
|
|
Deferred revenue and acquisition-related intangible liabilities
(4)
|
18,050
|
|
|
|
Total liabilities assumed
|
19,172
|
|
|
|
Net assets and liabilities acquired
|
$
|
393,768
|
|
_______________
|
(1)
|
The purchase price of the three acquisitions completed during the year ended
December 31, 2016
were individually less than 5% and in aggregate less than 10% of the Company’s total assets as of
December 31, 2015
.
|
|
(2)
|
Represents buildings, building improvements and tenant improvements.
|
|
(3)
|
Represents in-place leases (approximately
$27.1 million
with a weighted average amortization period of
3.9
years), above-market leases (approximately
$0.6 million
with weighted average amortization period of
15.8
years) and leasing commissions (approximately
$5.8 million
with a weighted average amortization period of
5.1
years).
|
|
(4)
|
Represents below-market leases (approximately
$18.1 million
with a weighted average amortization period of
8.4
years)
|
Development Project Acquisitions
On
October 10, 2017
, the Company completed the acquisition of a
1.2
acre development site located in the Little Italy neighborhood of downtown San Diego, California in three separate transactions from separate unrelated third parties for a total purchase price of
$19.4 million
and the assumption of
$1.4 million
of accrued liabilities.
F - 28
KILROY REALTY CORPORATION AND KILROY REALTY, L.P.
NOTES TO CONSOLIDATED FINANCIAL STATEMENTS – (Continued)
During the year ended
December 31, 2016
we acquired an approximately
1.75
acre development site located at 610-620 Brannan Street in San Francisco, California from an unrelated third party. This land parcel is immediately adjacent to our Flower Mart project in the SOMA submarket of San Francisco. The acquisition was funded through
$31.0 million
in cash and the issuance of
867,701
common units in the Operating Partnership valued at approximately
$48.0 million
(see Note 14). In addition, the Company paid
$2.4 million
in seller transaction costs and recorded
$4.7 million
in accrued liabilities in connection with this acquisition.
Acquisition Costs
During the years ended
December 31, 2017
,
2016
, and
2015
, we capitalized
$4.6 million
,
$0.5 million
, and
$1.1 million
, respectively, of acquisition costs. During the years ended
December 31, 2016
and
2015
, we expensed
$1.9 million
and
$0.5 million
of acquisition costs, respectively.
4. Dispositions and Real Estate Assets Held for Sale
Operating Property Dispositions
The following table summarizes the operating properties sold during the years ended
December 31, 2017
,
2016
and
2015
:
|
Location
|
Month of Disposition
|
Number of Buildings
|
Rentable
Square Feet (unaudited)
|
Sales Price
(in millions)
(1)
|
|||||||
|
2017 Dispositions
|
|||||||||||
|
5717 Pacific Center Boulevard, San Diego, CA
(2)
|
January
|
1
|
67,995
|
|
$
|
12.1
|
|
||||
|
Sorrento Mesa and Mission Valley Properties
(3)
|
September
|
10
|
675,143
|
|
174.5
|
|
|||||
|
Total 2017 Dispositions
|
11
|
743,138
|
|
$
|
186.6
|
|
|||||
|
2016 Dispositions
|
|||||||||||
|
Torrey Santa Fe Properties
(4)
|
January
|
4
|
465,812
|
|
$
|
262.3
|
|
||||
|
4930, 4939 & 4955 Directors Place, San Diego, CA
(5)
|
July
|
2
|
136,908
|
|
49.0
|
|
|||||
|
Total 2016 Dispositions
|
6
|
602,720
|
|
$
|
311.3
|
|
|||||
|
2015 Dispositions
|
|||||||||||
|
15050 NE 36th Street, Redmond, WA
|
April
|
1
|
122,103
|
|
$
|
51.2
|
|
||||
|
San Diego Properties - Tranches 1 and 2
(6)
|
April/July
|
9
|
924,291
|
|
258.0
|
|
|||||
|
Total 2015 Dispositions
|
10
|
1,046,394
|
|
$
|
309.2
|
|
|||||
__________________
|
(1)
|
Represents gross sales price before the impact of broker commissions and closing costs.
|
|
(2)
|
This property was classified as held for sale at
December 31, 2016
.
|
|
(3)
|
The Sorrento Mesa and Mission Valley Properties includes the following properties: 10390, 10394, 10398, 10421, 10445 and 10455 Pacific Center Court, 2355, 2365, 2375 and 2385 Northside Drive and Pacific Corporate Center - Lot 8, a
5.0
acre undeveloped land parcel. We recognized a gain on sale of land of
$0.4 million
related to the sale of Pacific Corporate Center - Lot 8 during the year ended December 31, 2017.
|
|
(4)
|
The Torrey Santa Fe Properties include the following properties: 7525, 7535, 7545 and 7555 Torrey Santa Fe. These properties were classified as held for sale at
December 31, 2015
.
|
|
(5)
|
Includes two operating properties totaling
136,908
rentable square feet and a
7.0
acre undeveloped land parcel.
|
|
(6)
|
The San Diego Properties - Tranche 1 includes the following properties: 10770 Wateridge Circle, 6200 and 6220 Greenwich Drive. The San Diego Properties - Tranche 2 includes the following properties: 6260, 6290, 6310, 6340, 6350 Sequence Drive and 4921 Directors Place.
|
The total gains on the sales of the properties sold during the years ended
December 31, 2017
,
2016
and
2015
were
$39.5 million
,
$164.3 million
and
$110.0 million
, respectively.
F - 29
KILROY REALTY CORPORATION AND KILROY REALTY, L.P.
NOTES TO CONSOLIDATED FINANCIAL STATEMENTS – (Continued)
Operating Properties Held for Sale
We did not have any properties classified as held for sale as of
December 31, 2017
. As of
December 31, 2016
, the property listed below was classified as held for sale.
|
Properties
|
Submarket
|
Property Type
|
Number of Buildings
|
Rentable Square Feet (unaudited)
|
|||||
|
2016 Held for Sale
|
|||||||||
|
5717 Pacific Center Drive
(1)
|
Sorrento Mesa
|
Office
|
1
|
67,995
|
|
||||
__________________
|
(1)
|
In January 2017, the Company completed the sale of this property for a total sales price of
$12.1 million
as indicated on the table above.
|
The major classes of assets and liabilities of the property held for sale as of
December 31, 2016
were as follows:
|
December 31, 2016
|
|||
|
Real estate assets and other assets held for sale
|
(in thousands)
|
||
|
Land and improvements
|
$
|
2,693
|
|
|
Buildings and improvements
|
10,500
|
|
|
|
Total real estate held for sale
|
13,193
|
|
|
|
Accumulated depreciation and amortization
|
(3,900
|
)
|
|
|
Total real estate held for sale, net
|
9,293
|
|
|
|
Prepaid expenses and other assets, net
|
124
|
|
|
|
Real estate and other assets held for sale, net
|
$
|
9,417
|
|
|
Liabilities of real estate assets held for sale
|
|||
|
Accounts payable, accrued expenses and other liabilities
|
$
|
56
|
|
|
Liabilities of real estate assets held for sale
|
$
|
56
|
|
Land Dispositions
The following table summarizes the land dispositions completed during the years ended
December 31, 2016
and
2015
:
|
Properties
|
Submarket
|
Month of Disposition
|
Gross Site Acreage
(unaudited)
|
Sales Price
(1)
(in millions)
|
||||||
|
2016 Land Dispositions
|
||||||||||
|
Carlsbad Oaks - Lot 7
(2)
|
Carlsbad
|
January
|
7.6
|
$
|
4.5
|
|
||||
|
Carlsbad Oaks - Lots 4 & 5
|
Carlsbad
|
June
|
11.2
|
6.0
|
|
|||||
|
Carlsbad Oaks - Lot 8
|
Carlsbad
|
June
|
13.2
|
8.9
|
|
|||||
|
Total 2016 Land Dispositions
(3)(4)
|
32.0
|
$
|
19.4
|
|
||||||
|
2015 Land Disposition
|
||||||||||
|
17150 Von Karman
(4)
|
Irvine
|
January
|
8.5
|
$
|
26.0
|
|
||||
__________________
|
(1)
|
Represents gross sales price before the impact of commissions and closing costs.
|
|
(2)
|
This land parcel was classified as held for sale as of December 31, 2015.
|
|
(3)
|
In connection with these land dispositions,
$2.3 million
of secured debt was assumed by the buyers.
|
|
(4)
|
The 2016 land dispositions resulted in a net loss on sales of
$0.3 million
and the 2015 land disposition resulted in gain on sale of
$17.3 million
.
|
Restricted Cash Related to Dispositions
We did
not
have any restricted cash related to dispositions or Section 1031 Exchanges as of
December 31, 2017
.
As of
December 31, 2016
approximately
$48.4 million
of net proceeds related to the land and operating property dispositions during the year ended
December 31, 2016
was temporarily held at a qualified intermediary, at our direction, for the purpose of facilitating Section 1031 Exchanges. During January 2017, the Section 1031 Exchange was successfully completed and the cash proceeds were released from the qualified intermediary.
F - 30
KILROY REALTY CORPORATION AND KILROY REALTY, L.P.
NOTES TO CONSOLIDATED FINANCIAL STATEMENTS – (Continued)
|
5.
|
Deferred Leasing Costs and Acquisition-related Intangible Assets and Liabilities, net
|
The following table summarizes our deferred leasing costs and acquisition-related intangible assets (acquired value of leasing costs, above-market operating leases, in-place leases and below-market ground lease obligation) and intangible liabilities (acquired value of below-market operating leases and above-market ground lease obligation) as of
December 31, 2017
and
2016
:
|
December 31, 2017
|
December 31, 2016
|
||||||
|
(in thousands)
|
|||||||
|
Deferred Leasing Costs and Acquisition-related Intangible Assets, net:
|
|||||||
|
Deferred leasing costs
|
$
|
248,598
|
|
$
|
239,958
|
|
|
|
Accumulated amortization
|
(101,917
|
)
|
(89,633
|
)
|
|||
|
Deferred leasing costs, net
|
146,681
|
|
150,325
|
|
|||
|
Above-market operating leases
|
4,199
|
|
10,304
|
|
|||
|
Accumulated amortization
|
(3,068
|
)
|
(6,933
|
)
|
|||
|
Above-market operating leases, net
|
1,131
|
|
3,371
|
|
|||
|
In-place leases
|
82,097
|
|
94,813
|
|
|||
|
Accumulated amortization
|
(46,625
|
)
|
(40,593
|
)
|
|||
|
In-place leases, net
|
35,472
|
|
54,220
|
|
|||
|
Below-market ground lease obligation
|
490
|
|
490
|
|
|||
|
Accumulated amortization
|
(46
|
)
|
(38
|
)
|
|||
|
Below-market ground lease obligation, net
|
444
|
|
452
|
|
|||
|
Total deferred leasing costs and acquisition-related intangible assets, net
|
$
|
183,728
|
|
$
|
208,368
|
|
|
|
Acquisition-related Intangible Liabilities, net:
(1)
|
|||||||
|
Below-market operating leases
|
$
|
65,440
|
|
$
|
69,472
|
|
|
|
Accumulated amortization
|
(40,495
|
)
|
(33,689
|
)
|
|||
|
Below-market operating leases, net
|
24,945
|
|
35,783
|
|
|||
|
Above-market ground lease obligation
|
6,320
|
|
6,320
|
|
|||
|
Accumulated amortization
|
(626
|
)
|
(525
|
)
|
|||
|
Above-market ground lease obligation, net
|
5,694
|
|
5,795
|
|
|||
|
Total acquisition-related intangible liabilities, net
|
$
|
30,639
|
|
$
|
41,578
|
|
|
_______________
|
(1)
|
Included in deferred revenue and acquisition-related intangible liabilities, net in the consolidated balance sheets.
|
The following table sets forth amortization related to deferred leasing costs and acquisition-related intangibles for the years ended
December 31, 2017
,
2016
and
2015
.
|
Year Ended December 31,
|
|||||||||||
|
2017
|
2016
|
2015
|
|||||||||
|
(in thousands)
|
|||||||||||
|
Deferred leasing costs
(1)
|
$
|
31,675
|
|
$
|
28,639
|
|
$
|
27,866
|
|
||
|
Above-market operating leases
(2)
|
2,240
|
|
1,509
|
|
2,532
|
|
|||||
|
In-place leases
(1)
|
18,650
|
|
11,676
|
|
14,622
|
|
|||||
|
Below-market ground lease obligation
(3)
|
8
|
|
8
|
|
8
|
|
|||||
|
Below-market operating leases
(4)
|
(10,768
|
)
|
(8,674
|
)
|
(10,980
|
)
|
|||||
|
Above-market ground lease obligation
(5)
|
(101
|
)
|
(101
|
)
|
(101
|
)
|
|||||
|
Total
|
$
|
41,704
|
|
$
|
33,057
|
|
$
|
33,947
|
|
||
_______________
|
(1)
|
The amortization of deferred leasing costs and in-place leases is recorded to depreciation and amortization expense and the amortization of lease incentives is recorded as a reduction to rental income in the consolidated statements of operations for the periods presented.
|
|
(2)
|
The amortization of above-market operating leases is recorded as a decrease to rental income in the consolidated statements of operations for the periods presented.
|
|
(3)
|
The amortization of the below-market ground lease obligation is recorded as an increase to ground lease expense in the consolidated statements of operations for the periods presented.
|
|
(4)
|
The amortization of below-market operating leases is recorded as an increase to rental income in the consolidated statements of operations for the periods presented.
|
|
(5)
|
The amortization of the above-market ground lease obligation is recorded as a decrease to ground lease expense in the consolidated statements of operations for the periods presented.
|
F - 31
KILROY REALTY CORPORATION AND KILROY REALTY, L.P.
NOTES TO CONSOLIDATED FINANCIAL STATEMENTS – (Continued)
The following table sets forth the estimated annual amortization expense related to deferred leasing costs and acquisition-related intangibles as of
December 31, 2017
for future periods:
|
Year
|
Deferred Leasing Costs
|
Above-Market Operating Leases
(1)
|
In-Place Leases
|
Below-Market Ground Lease Obligation
(2)
|
Below-Market Operating Leases
(3)
|
Above-Market Ground Lease Obligation
(4)
|
|||||||||||||||||
|
(in thousands)
|
|||||||||||||||||||||||
|
2018
|
$
|
30,033
|
|
$
|
395
|
|
$
|
13,286
|
|
$
|
8
|
|
$
|
(9,456
|
)
|
$
|
(101
|
)
|
|||||
|
2019
|
25,501
|
|
207
|
|
8,850
|
|
8
|
|
(6,854
|
)
|
(101
|
)
|
|||||||||||
|
2020
|
20,085
|
|
53
|
|
5,610
|
|
8
|
|
(3,942
|
)
|
(101
|
)
|
|||||||||||
|
2021
|
16,048
|
|
53
|
|
2,508
|
|
8
|
|
(1,253
|
)
|
(101
|
)
|
|||||||||||
|
2022
|
13,332
|
|
40
|
|
1,708
|
|
8
|
|
(790
|
)
|
(101
|
)
|
|||||||||||
|
Thereafter
|
41,682
|
|
383
|
|
3,510
|
|
404
|
|
(2,650
|
)
|
(5,189
|
)
|
|||||||||||
|
Total
|
$
|
146,681
|
|
$
|
1,131
|
|
$
|
35,472
|
|
$
|
444
|
|
$
|
(24,945
|
)
|
$
|
(5,694
|
)
|
|||||
_______________
|
(1)
|
Represents estimated annual amortization related to above-market operating leases. Amounts will be recorded as a decrease to rental income in the consolidated statements of operations.
|
|
(2)
|
Represents estimated annual amortization related to below-market ground lease obligations. Amounts will be recorded as an increase to ground lease expense in the consolidated statements of operations.
|
|
(3)
|
Represents estimated annual amortization related to below-market operating leases. Amounts will be recorded as an increase to rental income in the consolidated statements of operations.
|
|
(4)
|
Represents estimated annual amortization related to above-market ground lease obligations. Amounts will be recorded as a decrease to ground lease expense in the consolidated statements of operations.
|
|
6.
|
Receivables
|
Current Receivables, net
Current receivables, net is primarily comprised of contractual rents and other lease-related obligations due from tenants. The balance consisted of the following as of
December 31, 2017
and
2016
:
|
December 31, 2017
|
December 31, 2016
|
||||||
|
(in thousands)
|
|||||||
|
Current receivables
|
$
|
19,235
|
|
$
|
15,172
|
|
|
|
Allowance for uncollectible tenant receivables
|
(2,309
|
)
|
(1,712
|
)
|
|||
|
Current receivables, net
|
$
|
16,926
|
|
$
|
13,460
|
|
|
Deferred Rent Receivables, net
Deferred rent receivables, net consisted of the following as of
December 31, 2017
and
2016
:
|
December 31, 2017
|
December 31, 2016
|
||||||
|
(in thousands)
|
|||||||
|
Deferred rent receivables
|
$
|
249,629
|
|
$
|
220,501
|
|
|
|
Allowance for deferred rent receivables
|
(3,238
|
)
|
(1,524
|
)
|
|||
|
Deferred rent receivables, net
|
$
|
246,391
|
|
$
|
218,977
|
|
|
F - 32
KILROY REALTY CORPORATION AND KILROY REALTY, L.P.
NOTES TO CONSOLIDATED FINANCIAL STATEMENTS – (Continued)
|
7.
|
Prepaid Expenses and Other Assets, Net
|
Prepaid expenses and other assets, net consisted of the following at
December 31, 2017
and
2016
:
|
December 31, 2017
|
December 31, 2016
|
||||||
|
(in thousands)
|
|||||||
|
Furniture, fixtures and other long-lived assets, net
|
$
|
39,686
|
|
$
|
40,395
|
|
|
|
Notes receivable
(1)
|
19,912
|
|
19,439
|
|
|||
|
Prepaid expenses & acquisition deposits
|
55,108
|
|
10,774
|
|
|||
|
Total Prepaid Expenses and Other Assets, Net
|
$
|
114,706
|
|
$
|
70,608
|
|
|
_______________
|
(1)
|
Our notes receivables are held by two unrelated third parties. Approximately
$15.1 million
of our notes receivable balance was secured by real estate as of
December 31, 2017
and
2016
.
|
8. Secured and Unsecured Debt of the Company
In this Note 8, the “Company” refers solely to Kilroy Realty Corporation and not to any of our subsidiaries. The Company itself does not hold any indebtedness. All of our secured and unsecured debt is held directly by the Operating Partnership.
The Company generally guarantees all the Operating Partnership’s unsecured debt obligations including the unsecured revolving credit facility, the
$150.0 million
unsecured term loan facility and all of the unsecured senior notes. At
December 31, 2017
and
2016
, the Operating Partnership had
$2.0 billion
and
$1.8 billion
, respectively, outstanding in total, including unamortized discounts and deferred financing costs, under these unsecured debt obligations.
In addition, although the remaining
$0.3 billion
and
$0.5 billion
of the Operating Partnership’s debt as of
December 31, 2017
and
2016
, respectively, is secured and non-recourse to the Company, the Company provides limited customary secured debt guarantees for items such as voluntary bankruptcy, fraud, misapplication of payments and environmental liabilities.
Debt Covenants and Restrictions
One of the covenants contained within the unsecured revolving credit facility and the unsecured term loan facility as discussed further below in Note 9 prohibits the Company from paying dividends during an event of default in excess of an amount which results in distributions to us in an amount sufficient to permit us to pay dividends to our stockholders that we reasonably believe are necessary to (a) maintain our qualification as a REIT for federal and state income tax purposes and (b) avoid the payment of federal or state income or excise tax.
F - 33
KILROY REALTY CORPORATION AND KILROY REALTY, L.P.
NOTES TO CONSOLIDATED FINANCIAL STATEMENTS – (Continued)
9. Secured and Unsecured Debt of the Operating Partnership
Secured Debt
The following table sets forth the composition of our secured debt as of
December 31, 2017
and
2016
:
|
Annual Stated Interest Rate
(1)
|
GAAP
Effective Rate
(1)(2)
|
Maturity Date
|
December 31,
|
||||||||||
|
Type of Debt
|
2017
|
2016
|
|||||||||||
|
(in thousands)
|
|||||||||||||
|
Mortgage note payable
|
3.57%
|
3.57%
|
December 2026
|
$
|
170,000
|
|
$
|
170,000
|
|
||||
|
Mortgage note payable
(3)
|
4.48%
|
4.48%
|
July 2027
|
93,081
|
|
94,754
|
|
||||||
|
Mortgage note payable
(3)(4)
|
6.05%
|
3.50%
|
June 2019
|
78,894
|
|
82,443
|
|
||||||
|
Mortgage note payable
(3)(5)
|
4.27%
|
4.27%
|
February 2018
|
—
|
|
125,756
|
|
||||||
|
Mortgage note payable
(6)
|
7.15%
|
7.15%
|
May 2017
|
—
|
|
1,215
|
|
||||||
|
Total secured debt
|
$
|
341,975
|
|
$
|
474,168
|
|
|||||||
|
Unamortized Deferred Financing Costs
|
(1,175
|
)
|
(1,396
|
)
|
|||||||||
|
Total secured debt, net
|
$
|
340,800
|
|
$
|
472,772
|
|
|||||||
______________
|
(1)
|
All interest rates presented are fixed-rate interest rates.
|
|
(2)
|
Represents the effective interest rate including the amortization of initial issuance discounts/premiums excluding the amortization of deferred financing costs.
|
|
(3)
|
The secured debt and the related properties that secure the debt are held in a special purpose entity and the properties are not available to satisfy the debts and other obligations of the Company or the Operating Partnership.
|
|
(4)
|
As of
December 31, 2017
and
2016
, the mortgage loan had unamortized debt premiums of
$2.6 million
and
$4.4 million
, respectively.
|
|
(5)
|
This mortgage note payable, held by a consolidated property partnership, was repaid in November 2017 at par. NBREM contributed
$54.4 million
to fund their proportionate share of the payoff. Refer to Note 11 “Noncontrolling Interests on Company’s Consolidated Financial Statements” for additional information.
|
|
(6)
|
This mortgage note payable was repaid in February 2017 at par.
|
The Operating Partnership’s secured debt was collateralized by operating properties with a combined net book value of approximately
$338.2 million
as of
December 31, 2017
.
Although our mortgage loans are secured and non-recourse to the Company and the Operating Partnership, the Company provides limited customary secured debt guarantees for items such as voluntary bankruptcy, fraud, misapplication of payments and environmental liabilities.
As of
December 31, 2017
, all of the Operating Partnership’s secured loans contained restrictions that would require the payment of prepayment penalties for the acceleration of outstanding debt. The mortgage notes payable are secured by deeds of trust on certain of our properties and the assignment of certain rents and leases associated with those properties.
Unsecured Senior Notes
The following table summarizes the balance and significant terms of the registered unsecured senior notes issued by the Operating Partnership and outstanding, which are presented net of unamortized discounts of
$6.3 million
and
$6.6 million
, as of
December 31, 2017
and
2016
, respectively:
F - 34
KILROY REALTY CORPORATION AND KILROY REALTY, L.P.
NOTES TO CONSOLIDATED FINANCIAL STATEMENTS – (Continued)
|
Net Carrying Amount
as of December 31, |
|||||||||||||||
|
Issuance date
|
Maturity date
|
Stated
coupon rate
|
Effective interest rate
(1)
|
2017
|
2016
|
||||||||||
|
(in thousands)
|
|||||||||||||||
|
3.450% Unsecured Senior Notes
(2)
|
December 2017
|
December 2024
|
3.450%
|
3.471%
|
$
|
425,000
|
|
$
|
—
|
|
|||||
|
Unamortized discount and deferred financing costs
|
(4,047
|
)
|
—
|
|
|||||||||||
|
Net carrying amount
|
$
|
420,953
|
|
$
|
—
|
|
|||||||||
|
3.450% Unsecured Senior Notes
(3)
|
February 2017
|
February 2029
|
3.450%
|
3.450%
|
$
|
75,000
|
|
$
|
—
|
|
|||||
|
Unamortized discount and deferred financing costs
|
(475
|
)
|
—
|
|
|||||||||||
|
Net carrying amount
|
$
|
74,525
|
|
$
|
—
|
|
|||||||||
|
3.350% Unsecured Senior Notes
(3)
|
February 2017
|
February 2027
|
3.350%
|
3.350%
|
$
|
175,000
|
|
$
|
—
|
|
|||||
|
Unamortized discount and deferred financing costs
|
(1,056
|
)
|
—
|
|
|||||||||||
|
Net carrying amount
|
$
|
173,944
|
|
$
|
—
|
|
|||||||||
|
4.375% Unsecured Senior Notes
(4)
|
September 2015
|
October 2025
|
4.375%
|
4.444%
|
$
|
400,000
|
|
$
|
400,000
|
|
|||||
|
Unamortized discount and deferred financing costs
|
(4,292
|
)
|
(4,846
|
)
|
|||||||||||
|
Net carrying amount
|
$
|
395,708
|
|
$
|
395,154
|
|
|||||||||
|
4.250% Unsecured Senior Notes
(5)
|
July 2014
|
August 2029
|
4.250%
|
4.352%
|
$
|
400,000
|
|
$
|
400,000
|
|
|||||
|
Unamortized discount and deferred financing costs
|
(6,164
|
)
|
(6,696
|
)
|
|||||||||||
|
Net carrying amount
|
$
|
393,836
|
|
$
|
393,304
|
|
|||||||||
|
3.800% Unsecured Senior Notes
(6)
|
January 2013
|
January 2023
|
3.800%
|
3.804%
|
$
|
300,000
|
|
$
|
300,000
|
|
|||||
|
Unamortized discount and deferred financing costs
|
(1,382
|
)
|
(1,656
|
)
|
|||||||||||
|
Net carrying amount
|
$
|
298,618
|
|
$
|
298,344
|
|
|||||||||
|
4.800% Unsecured Senior Notes
(6)(7)
|
July 2011
|
July 2018
|
4.800%
|
4.827%
|
$
|
—
|
|
$
|
325,000
|
|
|||||
|
Unamortized discount and deferred financing costs
|
—
|
|
(767
|
)
|
|||||||||||
|
Net carrying amount
|
$
|
—
|
|
$
|
324,233
|
|
|||||||||
|
6.625% Unsecured Senior Notes
(8)
|
May 2010
|
June 2020
|
6.625%
|
6.744%
|
$
|
250,000
|
|
$
|
250,000
|
|
|||||
|
Unamortized discount and deferred financing costs
|
(1,321
|
)
|
(1,868
|
)
|
|||||||||||
|
Net carrying amount
|
$
|
248,679
|
|
$
|
248,132
|
|
|||||||||
|
Total Unsecured Senior Notes, Net
|
$
|
2,006,263
|
|
$
|
1,659,167
|
|
|||||||||
________________________
|
(1)
|
Represents the effective interest rate including the amortization of initial issuance discounts, excluding the amortization of deferred financing costs.
|
|
(2)
|
Interest on these notes is payable semi-annually in arrears on June 15th and December 15th of each year.
|
|
(3)
|
Interest on these notes is payable semi-annually in arrears on February 17th and August 17th of each year.
|
|
(4)
|
Interest on these notes is payable semi-annually in arrears on April 1st and October 1st of each year.
|
|
(5)
|
Interest on these notes is payable semi-annually in arrears on February 15th and August 15th of each year.
|
|
(6)
|
Interest on these notes is payable semi-annually in arrears on January 15th and July 15th of each year.
|
|
(7)
|
Certain common limited partners in the Operating Partnership that previously contributed their interests in the property at 6255 W. Sunset Blvd., Los Angeles, California to the Operating Partnership entered into an agreement with the Company. Pursuant to this agreement, such common limited partners will reimburse the Company for a portion of any amounts the Company may be required to pay pursuant to its guarantee of the Operating Partnership's
4.800%
Senior Notes due 2018 or that the Company may otherwise become required to pay under applicable law with respect to such notes. These notes were redeemed by the Company in December 2017.
|
|
(8)
|
Interest on these notes is payable semi-annually in arrears on June 1st and December 1st of each year.
|
Unsecured Senior Notes - Registered Offerings
In December 2017, the Operating Partnership issued
$425.0 million
of aggregate principal amount of unsecured senior notes in a registered public offering, as shown on the table above. The outstanding balance of the unsecured senior notes is included in unsecured debt, net of initial issuance discount of
$0.6 million
, on our consolidated balance sheet. The unsecured senior notes, which are scheduled to mature on
December 15, 2024
, require semi-annual interest payments each June and December based on a stated annual interest rate of
3.450%
. The Operating Partnership may redeem the notes at any time prior to September 15, 2024, either in whole or in part, subject to the payment of an early redemption premium.
In December 2017, we used a portion of the net proceeds from the issuance of our
$425.0 million
,
3.450%
unsecured senior notes to early redeem, at our option, the
$325.0 million
aggregate principal amount of our outstanding
4.800%
F - 35
KILROY REALTY CORPORATION AND KILROY REALTY, L.P.
NOTES TO CONSOLIDATED FINANCIAL STATEMENTS – (Continued)
unsecured senior notes that were scheduled to mature on
July 15, 2018
, as shown on the table above. In connection with our early redemption, we incurred a
$5.3 million
loss on early extinguishment of debt comprised of
$5.0 million
premium paid to the note holders at the redemption date and
$0.3 million
write-off of the unamortized discount and deferred financing costs.
Unsecured Senior Notes - Private Placement
On September 14, 2016, the Operating Partnership entered into a Note Purchase Agreement in a private placement (the “Note Purchase Agreement”), in connection with the issuance and sale of
$175.0 million
principal amount of the Operating Partnership’s
3.35%
Senior Notes, Series A, due
February 17, 2027
(the “Series A Notes”), and
$75.0 million
principal amount of the Operating Partnership’s
3.45%
Senior Notes, Series B, due
February 17, 2029
(the “Series B Notes” and, together with the Series A Notes, the “Series A and B Notes”), as shown on the table above. Under the delayed draw option of the Series A and B Notes, the Operating Partnership was required to issue
$175.0 million
principal amount of its Series A Notes and
$75.0 million
principal amount of its Series B Notes by February 17, 2017.
On February 17, 2017, the Operating Partnership issued the
$175.0 million
principal amount of its Series A Notes and the
$75.0 million
principal amount of its Series B Notes. The Series A Notes mature on
February 17, 2027
, and the Series B Notes mature on
February 17, 2029
, in each case unless earlier redeemed or prepaid pursuant to the terms of the Note Purchase Agreement. Interest on the Series A and B Notes is payable semi-annually in arrears on February 17 and August 17 of each year. As of
December 31, 2017
, there was
$175.0 million
and
$75.0 million
issued and outstanding aggregate principal amount of Series A and B Notes, respectively.
The Operating Partnership may, at its option and upon notice to the purchasers of the Series A and B Notes, prepay at any time all, or from time to time any part of the Series A and B Notes then outstanding (in an amount not less than
5%
of the aggregate principal amount of the Series A and B Notes then outstanding in the case of a partial prepayment), at
100%
of the principal amount so prepaid, plus the make-whole amount determined for the prepayment date with respect to such principal amount as set forth in the Note Purchase Agreement.
In connection with the issuance of the Series A and B Notes, the Company entered into a guaranty agreement whereby it guarantees the payment by the Operating Partnership of all amounts due with respect to the Series A and B Notes and the performance by the Operating Partnership of its obligations under the Note Purchase Agreement.
Unsecured Revolving Credit Facility and Term Loan Facility
In July 2017, the Operating Partnership amended and restated the terms of its unsecured revolving credit facility and unsecured term loan facility (together, the “Facility”). The amendment and restatement increased the size of the unsecured revolving credit facility from
$600.0 million
to
$750.0 million
, maintained the size of the unsecured term loan facility of
$150.0 million
, reduced the borrowing costs and extended the maturity date of the Facility to July 2022. The unsecured term loan facility features a 12-month delayed draw option (subject to a specified reduction in commitments unless 50% drawn within six months).
The following table summarizes the balance and terms of our unsecured revolving credit facility as of
December 31, 2017
and
2016
:
|
December 31, 2017
|
December 31, 2016
|
||||||
|
(in thousands)
|
|||||||
|
Outstanding borrowings
|
$
|
—
|
|
$
|
—
|
|
|
|
Remaining borrowing capacity
|
750,000
|
|
600,000
|
|
|||
|
Total borrowing capacity
(1)
|
$
|
750,000
|
|
$
|
600,000
|
|
|
|
Interest rate
(2)
|
2.56
|
%
|
1.82
|
%
|
|||
|
Facility fee-annual rate
(3)
|
0.200%
|
||||||
|
Maturity date
|
July 2022
|
|
July 2019
|
|
|||
_______________
|
(1)
|
As of
December 31, 2017
, we may elect to borrow, subject to bank approval and obtaining commitments for any additional borrowing capacity, up to an additional
$600.0 million
under an accordion feature under the terms of the unsecured revolving credit facility and unsecured term
|
F - 36
KILROY REALTY CORPORATION AND KILROY REALTY, L.P.
NOTES TO CONSOLIDATED FINANCIAL STATEMENTS – (Continued)
loan facility. As of
December 31, 2016
, we had the option to borrow, subject to bank approval and obtaining commitments for any additional borrowing capacity, up to an additional
$311.0 million
under an accordion feature under the terms of the unsecured revolving credit facility and unsecured term loan facility.
|
(2)
|
Our unsecured revolving credit facility interest rate was calculated based on an annual rate of LIBOR plus
1.000%
and LIBOR plus
1.050%
as of
December 31, 2017
and
December 31, 2016
, respectively.
|
|
(3)
|
Our facility fee is paid on a quarterly basis and is calculated based on the total borrowing capacity. In addition to the facility fee, we incurred debt origination and legal costs. As of
December 31, 2017
and
2016
,
$6.0 million
and
$3.3 million
of unamortized deferred financing costs, respectively, which are included in prepaid expenses and other assets, net on our consolidated balance sheets, remained to be amortized through the respective maturity date of our unsecured revolving credit facility,
|
The Company intends to borrow under the unsecured revolving credit facility from time to time for general corporate purposes, to finance development and redevelopment expenditures, to fund potential acquisitions and to potentially repay long-term debt.
The following table summarizes the balance and terms of our unsecured term loan facility as of
December 31, 2017
and
2016
:
|
December 31, 2017
|
December 31, 2016
|
||||||
|
(in thousands)
|
|||||||
|
Outstanding borrowings
(1)
|
$
|
—
|
|
$
|
150,000
|
|
|
|
Remaining borrowing capacity
|
150,000
|
|
—
|
|
|||
|
Total borrowing capacity
(2)
|
$
|
150,000
|
|
$
|
150,000
|
|
|
|
Interest rate
(3)
|
2.66
|
%
|
1.85
|
%
|
|||
|
Undrawn facility fee-annual rate
(4)
|
0.200
|
%
|
—
|
%
|
|||
|
Maturity date
|
July 2022
|
|
July 2019
|
|
|||
_______________
|
(1)
|
In July 2017, the unsecured term loan facility was paid down and the Facility was amended to include a 12-month delayed draw option (subject to a specified reduction in commitments unless
50%
drawn within
six
months) on the unsecured term loan facility. The Company may draw on the unsecured term loan facility through July 2018, at which time the outstanding balance will become the balance of the unsecured term loan facility and no additional draws may be made. In January 2018, the Company borrowed
$75.0 million
under the unsecured term loan facility.
|
|
(2)
|
As of
December 31, 2017
and
December 31, 2016
,
$1.2 million
and
$0.7 million
of unamortized deferred financing costs, respectively, remained to be amortized through the maturity date of our unsecured term loan facility.
|
|
(3)
|
Our unsecured term loan facility interest rate was calculated based on an annual rate of LIBOR plus
1.100%
and LIBOR plus
1.150%
as of
December 31, 2017
and
December 31, 2016
, respectively.
|
|
(4)
|
In July 2017, the Facility was amended to include a facility fee on the remaining borrowing capacity of the unsecured term loan facility, which is paid on a monthly
basis.
|
As of
December 31, 2016
the Operating Partnership had a
$39.0 million
unsecured term loan outstanding with an annual interest rate of LIBOR plus
1.150%
that was to mature in July 2019. Concurrently with the amendment of the Facility, the Operating Partnership repaid its
$39.0 million
unsecured term loan. As of
December 31, 2016
, there was
$0.2 million
of unamortized deferred financing costs on the unsecured term loan.
Debt Covenants and Restrictions
The unsecured revolving credit facility, the unsecured term loan facility, the unsecured senior notes, the Series A and B Notes and certain other secured debt arrangements contain covenants and restrictions requiring us to meet certain financial ratios and reporting requirements. Some of the more restrictive financial covenants include a maximum ratio of total debt to total asset value, a minimum fixed-charge coverage ratio, a minimum unsecured debt ratio and a minimum unencumbered asset pool debt service coverage ratio. Noncompliance with one or more of the covenants and restrictions could result in the full principal balance of the associated debt becoming immediately due and payable. We believe we were in compliance with all of our debt covenants as of
December 31, 2017
and
2016
.
F - 37
KILROY REALTY CORPORATION AND KILROY REALTY, L.P.
NOTES TO CONSOLIDATED FINANCIAL STATEMENTS – (Continued)
Debt Maturities
The following table summarizes the stated debt maturities and scheduled amortization payments as of
December 31, 2017
:
|
Year
|
(in thousands)
|
||
|
2018
|
$
|
3,584
|
|
|
2019
|
76,309
|
|
|
|
2020
|
255,137
|
|
|
|
2021
|
5,342
|
|
|
|
2022
|
5,554
|
|
|
|
Thereafter
|
2,018,469
|
|
|
|
Total aggregate principal value
(1)
|
$
|
2,364,395
|
|
________________________
|
(1)
|
Includes gross principal balance of outstanding debt before the effect of the following at
December 31, 2017
:
$13.6 million
of unamortized deferred financing costs for the unsecured senior notes and secured debt,
$6.3 million
of unamortized discounts for the unsecured senior notes and
$2.6 million
of unamortized premiums for the secured debt.
|
Capitalized Interest and Loan Fees
The following table sets forth gross interest expense, including debt discount/premium and deferred financing cost amortization, net of capitalized interest, for the years ended
December 31, 2017
,
2016
and
2015
. The interest expense capitalized was recorded as a cost of development and increased the carrying value of undeveloped land and construction in progress.
|
Year Ended December 31,
|
|||||||||||
|
2017
|
2016
|
2015
|
|||||||||
|
(in thousands)
|
|||||||||||
|
Gross interest expense
|
$
|
112,577
|
|
$
|
105,263
|
|
$
|
109,647
|
|
||
|
Capitalized interest and deferred financing costs
|
(46,537
|
)
|
(49,460
|
)
|
(51,965
|
)
|
|||||
|
Interest expense
|
$
|
66,040
|
|
$
|
55,803
|
|
$
|
57,682
|
|
||
|
10.
|
Deferred Revenue and Acquisition Related Liabilities, net
|
Deferred revenue and acquisition-related liabilities, net consisted of the following at
December 31, 2017
and
2016
:
|
December 31,
|
|||||||
|
2017
|
2016
|
||||||
|
(in thousands)
|
|||||||
|
Deferred revenue related to tenant-funded tenant improvements
|
$
|
104,260
|
|
$
|
99,489
|
|
|
|
Other deferred revenue
|
10,991
|
|
9,293
|
|
|||
|
Acquisition-related intangible liabilities, net
(1)
|
30,639
|
|
41,578
|
|
|||
|
Total
|
$
|
145,890
|
|
$
|
150,360
|
|
|
|
(1)
|
See Note 5 “Deferred Leasing Costs and Acquisition-related Intangible Assets and Liabilities, net” for additional information regarding our acquisition-related intangible liabilities.
|
F - 38
KILROY REALTY CORPORATION AND KILROY REALTY, L.P.
NOTES TO CONSOLIDATED FINANCIAL STATEMENTS – (Continued)
Deferred Revenue Related to Tenant-funded Tenant Improvements
During the years ended
December 31, 2017
,
2016
, and
2015
,
$16.8 million
,
$13.2 million
and
$13.3 million
, respectively, of deferred revenue related to tenant-funded tenant improvements was amortized and recognized as rental income. The following is the estimated amortization of deferred revenue related to tenant-funded tenant improvements as of
December 31, 2017
for the next five years and thereafter:
|
Year Ending
|
(in thousands)
|
||
|
2018
|
$
|
16,644
|
|
|
2019
|
14,851
|
|
|
|
2020
|
14,062
|
|
|
|
2021
|
12,607
|
|
|
|
2022
|
11,458
|
|
|
|
Thereafter
|
34,638
|
|
|
|
Total
|
$
|
104,260
|
|
11. Noncontrolling Interests on the Company’s Consolidated Financial Statements
Common Units of the Operating Partnership
The Company owned a
97.9%
and
97.5%
common general partnership interest in the Operating Partnership as of
December 31, 2017
and
2016
, respectively. The remaining
2.1%
and
2.5%
common limited partnership interest as of
December 31, 2017
and
2016
, respectively, was owned by non-affiliated investors and certain of our executive officers and directors in the form of noncontrolling common units. There were
2,077,193
and
2,381,543
common units outstanding held by these investors, executive officers and directors as of
December 31, 2017
and
2016
, respectively. The decrease in the common units from
December 31, 2016
to
December 31, 2017
was attributable to
304,350
common unit redemptions.
The noncontrolling common units may be redeemed by unitholders for cash. Except under certain circumstances, we, at our option, may satisfy the cash redemption obligation with shares of the Company’s common stock on a one-for-one basis. If satisfied in cash, the value for each noncontrolling common unit upon redemption is the amount equal to the average of the closing quoted price per share of the Company’s common stock, par value
$0.01
per share, as reported on the NYSE for the ten trading days immediately preceding the applicable redemption date. The aggregate value upon redemption of the then-outstanding noncontrolling common units was
$154.5 million
and
$174.9 million
as of
December 31, 2017
and
2016
, respectively. This redemption value does not necessarily represent the amount that would be distributed with respect to each noncontrolling common unit in the event of our termination or liquidation. In the event of our termination or liquidation, it is expected in most cases that each common unit would be entitled to a liquidating distribution equal to the liquidating distribution payable in respect of each share of the Company’s common stock.
Noncontrolling Interest in Consolidated Property Partnerships
On August 30, 2016, the Operating Partnership entered into agreements with Norges Bank Real Estate Management (“NBREM”) whereby NBREM invested, through two REIT subsidiaries, in
two
existing companies that owned the Company’s 100 First Street and 303 Second Street office properties located in San Francisco, California. Based on a gross valuation of the
two
properties of approximately
$1.2 billion
, NBREM contributed a total of
$452.9 million
, for a
44%
common equity interest in the companies, which was net of approximately
$55.3 million
of its proportionate share of the existing mortgage debt on 303 Second Street as of the transaction date. In November 2017, NBREM contributed
$54.4 million
to fund their proportionate share of the Company’s repayment of this mortgage debt.
The transaction was structured with a staggered closing. On August 30, 2016, the first tranche of the transaction closed and NBREM contributed
$191.4 million
plus a working capital contribution of
$2.1 million
for a
44%
common ownership interest in 100 First LLC. On November 30, 2016, the second tranche of the transaction closed and NBREM contributed
$261.5 million
, which was net of its proportionate share of the existing mortgage debt secured by the 303
F - 39
KILROY REALTY CORPORATION AND KILROY REALTY, L.P.
NOTES TO CONSOLIDATED FINANCIAL STATEMENTS – (Continued)
Second Street property of approximately
$55.3 million
, plus a working capital contribution of
$2.9 million
for a
44%
common ownership interest in 303 Second LLC.
The transactions did not meet the criteria to qualify as sales of real estate because the Company continues to effectively control the properties and therefore continued to account for the 100 First Street and 303 Second Street office properties on a consolidated basis in its financial statements. At formation, the Company accounted for the transactions as equity transactions and recognized noncontrolling interests in its consolidated balance sheets totaling approximately
$124.5 million
, which was equal to
44%
of the aggregate net asset value of 100 First LLC and 303 Second LLC immediately prior to the transactions (which was net of NBREM’s
44%
share of the existing mortgage debt of
$55.3 million
) plus an additional
$5.0 million
working capital contribution made by NBREM.
The amount of NBREM’s total contribution not recognized as noncontrolling interest, net of transaction costs, was approximately
$329.0 million
. This amount was not reflected as a gain on sale of operating properties in the Company’s consolidated statements of operations and instead was reflected as an increase in additional paid-in capital and partners’ capital in the Company’s and the Operating Partnership’s consolidated balance sheets, respectively. Transfers of less than 50% of an entity ownership interest are normally not subject to certain tax assessments in California and therefore the Company believes that the two tranches of the transaction do not meet the statutory requirements for such tax assessments. If the taxing authority attempted to assess such tax assessments on the transactions, the Company estimates it could incur additional taxes of up to
$10.9 million
and
$18.0 million
for the first and second tranches of the transaction, respectively, plus potential penalties and interest. In connection with the transaction, the Company provides customary property management, leasing and construction management services for both properties. 100 First Street is a
467,095
square foot office tower, and 303 Second Street is a
740,047
square foot office property, both located in the South of Market submarket in San Francisco, California.
The noncontrolling interests in 100 First LLC and 303 Second LLC as of
December 31, 2017
and
2016
were
$175.4 million
and
$124.3 million
, respectively, which is recognized in noncontrolling interests in consolidated property partnerships on the Company’s consolidated balance sheets. The remaining amount of noncontrolling interests in consolidated property partnerships represents the third party equity interest in Redwood LLC. This noncontrolling interest was
$6.2 million
and
$6.4 million
as of
December 31, 2017
and
2016
, respectively.
12. Noncontrolling Interests on the Operating Partnership’s Consolidated Financial Statements
Consolidated Property Partnerships
On August 30, 2016, the Operating Partnership entered into agreements with NBREM whereby NBREM invested, through two REIT subsidiaries, in
two
existing companies that owned the Company’s 100 First Street and 303 Second Street office properties located in San Francisco, California. Based on a gross valuation of the
two
properties of approximately
$1.2 billion
, NBREM contributed a total of
$452.9 million
for a
44%
common equity interest in the companies, which is net of approximately
$55.3 million
of its proportionate share of the existing mortgage debt.
In November 2017, the Company repaid the mortgage debt secured by the 303 Second Street office property. Prior to the repayment, NBREM contributed
$54.4 million
to fund their proportionate share of the repayment. Refer to Note 11 for additional information regarding these transactions.
|
13.
|
Stockholders’ Equity of the Company
|
Preferred Stock
On
August 15, 2017
, the Company redeemed all
4,000,000
shares of its
6.375% Series H Cumulative
Redeemable Preferred Stock (“Series H Preferred Stock”). The shares of Series H Preferred Stock were redeemed at a redemption price equal to their stated liquidation preference of
$25.00
per share, representing
$100.0 million
in aggregate. The redemption payment did not include any additional accrued dividends because the redemption date was also the dividend payment date.
On
March 30, 2017
(the “Series G Redemption Date”), the Company redeemed all
4,000,000
shares of its
6.875% Series G Cumulative
Redeemable Preferred Stock (“Series G Preferred Stock”). The shares of Series G Preferred Stock
F - 40
KILROY REALTY CORPORATION AND KILROY REALTY, L.P.
NOTES TO CONSOLIDATED FINANCIAL STATEMENTS – (Continued)
were redeemed at a redemption price equal to their stated liquidation preference of
$25.00
per share, representing
$100.0 million
in aggregate, plus all accrued and unpaid dividends to the Series G Redemption Date.
In connection with the redemption of the Series G and Series H Preferred Stock, during the
year
ended
December 31, 2017
we recorded non-cash charges of
$7.6 million
as a reduction to net income available to common stockholders for the original issuance costs of the Series H and Series G Preferred Stock.
Common Stock
Common Stock Issuances
In January 2017, the Company completed an underwritten public offering of
4,427,500
shares of its common stock. The net offering proceeds, after deducting underwriting discounts and offering expenses, were approximately
$308.8 million
. We used a portion of the proceeds to partially fund our
$1.90
per share of special dividends declared by our Board of Directors in December 2016 and used the remaining proceeds for general corporate uses, to fund development expenditures and to repay outstanding indebtedness.
In July 2015, the Company completed the sale and issuance of
3,733,766
shares of its common stock at a price of
$66.19
per share for aggregate gross proceeds of
$249.8 million
and aggregate net proceeds after offering costs of
$249.6 million
through a registered direct placement with an institutional investor.
At-The-Market Stock Offering Program
Under our current at-the-market stock offering program, which commenced in December 2014, we may offer and sell shares of our common stock having an aggregate gross sales price of up to
$300.0 million
from time to time in “at-the-market” offerings. Since commencement of the program through
December 31, 2017
, we have sold
2,694,242
shares of common stock having an aggregate gross sales price of
$200.1 million
. As of
December 31, 2017
, shares of common stock having an aggregate gross sales price of up to
$99.9 million
remain available to be sold under this program. Actual future sales will depend upon a variety of factors, including but not limited to market conditions, the trading price of the Company’s common stock and our capital needs. We have no obligation to sell the remaining shares available for sale under this program.
The following table sets forth information regarding sales of our common stock under our at-the-market offering programs for the years ended
December 31, 2017
,
2016
and
2015
:
|
Year Ended December 31,
|
|||||||||||
|
2017
|
2016
|
2015
|
|||||||||
|
(in millions, except share data)
|
|||||||||||
|
Shares of common stock sold during the period
|
235,077
|
|
451,398
|
|
1,866,267
|
|
|||||
|
Aggregate gross proceeds
|
$
|
17.7
|
|
$
|
32.3
|
|
$
|
140.1
|
|
||
|
Aggregate net proceeds after selling commissions
|
$
|
17.5
|
|
$
|
31.9
|
|
$
|
138.2
|
|
||
The proceeds from sales were used to fund acquisitions, development expenditures and general corporate purposes including repayment of borrowings under the unsecured revolving credit facility.
Common Stock Repurchases
On February 23, 2016, the Company’s Board of Directors approved a
4,000,000
share increase to the Company’s existing share repurchase program bringing the total current repurchase authorization to
4,988,025
shares. The Company did not repurchase shares of common stock under this program during the years ended
December 31, 2017
or
December 31, 2015
. In March 2016, the Company repurchased
52,199
shares of common stock at a weighted average price of
$55.45
per share of common stock for
$2.9 million
. As of
December 31, 2017
,
4,935,826
shares remain eligible for repurchase under the Company’s share repurchase program.
F - 41
KILROY REALTY CORPORATION AND KILROY REALTY, L.P.
NOTES TO CONSOLIDATED FINANCIAL STATEMENTS – (Continued)
Accrued Dividends and Distributions
The following tables summarize accrued dividends and distributions for the noted outstanding shares of common stock, preferred stock, and noncontrolling units as of
December 31, 2017
and
2016
:
|
December 31,
|
|||||||
|
2017
|
2016
(1)
|
||||||
|
(in thousands)
|
|||||||
|
Dividends and Distributions payable to:
|
|||||||
|
Common stockholders
|
$
|
41,914
|
|
$
|
212,074
|
|
|
|
Noncontrolling common unitholders of the Operating Partnership
|
883
|
|
5,418
|
|
|||
|
RSU holders
(2)
|
651
|
|
3,158
|
|
|||
|
Total accrued dividends and distribution to common stockholders and noncontrolling unitholders
|
43,448
|
|
220,650
|
|
|||
|
Preferred stockholders
(3)
|
—
|
|
1,656
|
|
|||
|
Total accrued dividends and distributions
|
$
|
43,448
|
|
$
|
222,306
|
|
|
______________________
|
(1)
|
Dividends and distributions payable to common stockholders, noncontrolling common unitholders of the Operating Partnership and RSU holders in 2016 include a special cash dividend of
$1.90
per share that was declared by the Company’s Board of Directors on December 13, 2016. On January 13, 2017, the Company paid
$184.3 million
of special cash dividends to stockholders of record on December 30, 2016. This special dividend payment was in addition to the
$36.4 million
of regular dividends also paid on January 13, 2017 to common stockholders, unitholders and RSU holders of record on December 30, 2016.
|
|
(2)
|
The amount includes the value of the dividend equivalents that will be paid with additional RSUs (see Note 15 “Share-Based Compensation” for additional information).
|
|
(3)
|
The Series G and Series H Preferred stock were redeemed in March 2017 and August 2017, respectively, and the Company did not have any preferred stock outstanding as of
December 31, 2017
.
|
|
|
December 31,
|
||||
|
|
2017
|
2016
|
|||
|
Outstanding Shares and Units:
|
|||||
|
Common stock
(1)
|
98,620,333
|
|
93,219,439
|
|
|
|
Noncontrolling common units
|
2,077,193
|
|
2,381,543
|
|
|
|
RSUs
(2)
|
1,488,724
|
|
1,395,189
|
|
|
|
Series G Preferred stock
(3)
|
—
|
|
4,000,000
|
|
|
|
Series H Preferred stock
(3)
|
—
|
|
4,000,000
|
|
|
______________________
|
(1)
|
The amount includes nonvested shares.
|
|
(2)
|
The amount includes nonvested RSUs. Does not include
665,110
and
659,051
market measure-based RSUs because not all the necessary performance conditions have been met as of
December 31, 2017
and
2016
, respectively. Refer to Note 15 “Share-Based Compensation” for additional information.
|
|
(3)
|
The Series G and Series H Preferred stock were redeemed in March 2017 and August 2017, respectively.
|
F - 42
KILROY REALTY CORPORATION AND KILROY REALTY, L.P.
NOTES TO CONSOLIDATED FINANCIAL STATEMENTS – (Continued)
|
14.
|
Partners' Capital of the Operating Partnership
|
Preferred Units
On
August 15, 2017
, the Company redeemed all
4,000,000
shares of its
6.375%
Series H Preferred Stock. For each share of Series H Preferred Stock that was outstanding, the Company had an equivalent number of
6.375%
Series H Preferred Units (“Series H Preferred Units”) outstanding with substantially similar terms as the Series H Preferred Stock. In connection with the redemption of the Series H Preferred Stock, the Series H Preferred Units held by the Company were redeemed by the Operating Partnership.
On
March 30, 2017
, the Company redeemed all
4,000,000
shares of its
6.875%
Series G Preferred Stock. For each share of Series G Preferred Stock that was outstanding, the Company had an equivalent number of
6.875%
Series G Preferred Units (“Series G Preferred Units”) outstanding with substantially similar terms as the Series G Preferred Stock. In connection with the redemption of the Series G Preferred Stock, the Series G Preferred Units held by the Company were redeemed by the Operating Partnership.
In connection with the redemption of the Series G and Series H Preferred Stock, during the
year
ended
December 31, 2017
we recorded non-cash charges of
$7.6 million
as a reduction to net income available to common unitholders for the original issuance costs of the Series H and Series G Preferred Stock.
Common Units
Issuance of Common Units
In January 2017, the Company completed an underwritten public offering of
4,427,500
shares of its common stock (see Note 13 “Stockholders’ Equity of the Company”). The net offering proceeds of approximately
$308.8 million
were contributed by the Company to the Operating Partnership in exchange for
4,427,500
common units.
In March 2016, the Operating Partnership issued
867,701
common units in connection with a development acquisition (see Note 3 “Acquisitions”). Each common unit was valued at
$55.36
, which was based on a trailing ten-day average of the closing quoted price per share of the Company’s common stock, par value
$.01
per share, as reported on the NYSE, as calculated in accordance with the Partnership Agreement.
In July 2015, the Company completed the sale and issuance of
3,733,766
shares of its common stock at a price of
$66.19
per share for aggregate gross proceeds of
$249.8 million
and aggregate net proceeds after offering costs of
$249.6 million
through a registered direct placement with an institutional investor (see Note 13 “Stockholders’ Equity of the Company” for additional information). The net offering proceeds were contributed by the Company to the Operating Partnership in exchange for
3,733,766
common units.
At-The-Market Stock Offering Program
During the years ended
December 31, 2017
,
2016
and
2015
, the Company utilized its at-the-market stock offering programs to issue shares of common stock (see Note 13 “Stockholders’ Equity of the Company” for additional information). The net offering proceeds and property acquired using net offering proceeds were contributed by the Company to the Operating Partnership in exchange for common units for the years ended
December 31, 2017
,
2016
and
2015
are as follows:
|
Year Ended December 31,
|
|||||||||||
|
2017
|
2016
|
2015
|
|||||||||
|
(in millions, except share and per share data)
|
|||||||||||
|
Shares of common stock contributed by the Company
|
235,077
|
|
451,398
|
|
1,866,267
|
|
|||||
|
Common units exchanged for shares of common stock by the Company
|
235,077
|
|
451,398
|
|
1,866,267
|
|
|||||
|
Aggregate gross proceeds
|
$
|
17.7
|
|
$
|
32.3
|
|
$
|
140.1
|
|
||
|
Aggregate net proceeds after selling commissions
|
$
|
17.5
|
|
$
|
31.9
|
|
$
|
138.2
|
|
||
F - 43
KILROY REALTY CORPORATION AND KILROY REALTY, L.P.
NOTES TO CONSOLIDATED FINANCIAL STATEMENTS – (Continued)
Common Units Outstanding
The following table sets forth the number of common units held by the Company and the number of common units held by non-affiliated investors and certain of our executive officers and directors in the form of noncontrolling common units as well as the ownership interest held on each respective date:
|
December 31, 2017
|
December 31, 2016
|
||||
|
Company owned common units in the Operating Partnership
|
98,620,333
|
|
93,219,439
|
|
|
|
Company owned general partnership interest
|
97.9
|
%
|
97.5
|
%
|
|
|
Noncontrolling common units of the Operating Partnership
|
2,077,193
|
|
2,381,543
|
|
|
|
Ownership interest of noncontrolling interest
|
2.1
|
%
|
2.5
|
%
|
|
For a further discussion of the noncontrolling common units during the years ended
December 31, 2017
and
2016
, refer to Note 11 “Noncontrolling Interests on the Company’s Consolidated Financial Statements.”
Accrued Distributions
The following tables summarize accrued distributions for the noted common and preferred units as of
December 31, 2017
and
2016
:
|
December 31, 2017
|
December 31, 2016
(1)
|
||||||
|
|
(in thousands)
|
||||||
|
Distributions payable to:
|
|||||||
|
General partner
|
$
|
41,914
|
|
$
|
212,074
|
|
|
|
Common limited partners
|
883
|
|
5,418
|
|
|||
|
RSU holders
(2)
|
651
|
|
3,158
|
|
|||
|
Total accrued distributions to common unitholders
|
43,448
|
|
220,650
|
|
|||
|
Preferred unitholders
(3)
|
—
|
|
1,656
|
|
|||
|
Total accrued distributions
|
$
|
43,448
|
|
$
|
222,306
|
|
|
______________________
|
(1)
|
Distributions payable to the general partner, noncontrolling common unitholders of the Operating Partnership and RSU holders in 2016 include a special cash dividend of
$1.90
per share that was declared by the Company’s Board of Directors on December 13, 2016. On January 13, 2017, the Company paid
$184.3 million
of special cash dividends to unitholders of record on December 30, 2016. This special dividend payment was in addition to the
$36.4 million
of regular dividends also paid on January 13, 2017 to common stockholders, unitholders and RSU holders of record on December 30, 2016.
|
|
(2)
|
The amount includes the value of the dividend equivalents that will be paid with additional RSUs (see Note 15 “Share-Based Compensation” for additional information).
|
|
(3)
|
The Series G and Series H Preferred units were redeemed in March 2017 and August 2017, respectively, and the Company did not have any preferred stock outstanding at December 31, 2017.
|
|
December 31, 2017
|
December 31, 2016
|
||||
|
Outstanding Units:
|
|||||
|
Common units held by the general partner
|
98,620,333
|
|
93,219,439
|
|
|
|
Common units held by the limited partners
|
2,077,193
|
|
2,381,543
|
|
|
|
RSUs
(1)
|
1,488,724
|
|
1,395,189
|
|
|
|
Series G Preferred units
(2)
|
—
|
|
4,000,000
|
|
|
|
Series H Preferred units
(2)
|
—
|
|
4,000,000
|
|
|
______________________
|
(1)
|
Does not include
665,110
and
659,051
market measure-based RSUs because not all the necessary performance conditions have been met as of
December 31, 2017
and
2016
, respectively. Refer to Note 15 “Share-Based Compensation” for additional information.
|
|
(2)
|
The Series G and Series H Preferred units were redeemed in March 2017 and August 2017, respectively.
|
F - 44
KILROY REALTY CORPORATION AND KILROY REALTY, L.P.
NOTES TO CONSOLIDATED FINANCIAL STATEMENTS – (Continued)
15. Share-Based Compensation
Stockholder Approved Share-Based Incentive Compensation Plan
As of
December 31, 2017
, we maintained one share-based incentive compensation plan, the Kilroy Realty 2006 Incentive Award Plan, as amended (the “2006 Plan”). The Company has a currently effective registration statement registering
9.2 million
shares of our common stock for possible issuance under our 2006 Incentive Award Plan. As of
December 31, 2017
, approximately
1.9 million
shares were available for grant under the 2006 Plan. The calculation of shares available for grant is presented after taking into account a reserve for a sufficient number of shares to cover the vesting and payment of 2006 Plan awards that were outstanding on that date, including performance-based vesting awards at (i) levels actually achieved for the performance conditions (as defined below) for which the performance period has been completed and (ii) at target levels for the other performance and market conditions (as defined below) for awards still in a performance period.
The Executive Compensation Committee ( the “Compensation Committee”) of the Company's Board of Directors may grant the following share-based awards to eligible individuals, as provided under the 2006 Plan: incentive stock options, nonqualified stock options, restricted stock (nonvested shares), stock appreciation rights, performance shares, performance stock units, dividend equivalents, stock payments, deferred stock, restricted stock units (“RSUs”), profit interest units, performance bonus awards, performance-based awards and other incentive awards. For each award granted under our share-based incentive compensation programs, the Operating Partnership simultaneously issues to the Company a number of common units equal to the number of shares of common stock ultimately paid by the Company in respect of such awards.
Stock Award Deferral Program
We have a Stock Award Deferral Program (the “RSU Program”) under the 2006 Plan. Under the RSU Program, participants may defer receipt of awards of nonvested shares that may be granted by electing to receive an equivalent number of RSUs in lieu of such nonvested shares, or defer payment of RSU awards. Each RSU represents the right to receive one share of our common stock in the future and is subject to the same vesting conditions that would have applied if the award had been issued in nonvested shares. RSUs carry with them the right to receive dividend equivalents such that participants receive additional RSUs at the time dividends are paid equal to the value of the dividend earned on the shares underlying the participant’s RSUs. The dividend equivalents earned vest based on terms specified under the related RSU award agreement. Shares issued upon settlement of vested RSUs, including RSUs paid on dividend equivalents, are distributed in a single lump sum distribution upon the earlier of (1) the date specified by the participant when the election is made or (2) occurrence of certain other events specified under the RSU program.
Share-Based Compensation Programs
The Compensation Committee has historically awarded nonvested shares and RSUs under the share-based compensation programs described below. These share-based awards were valued based on the quoted closing share price of the Company’s common stock on the NYSE on the applicable grant date. The Compensation Committee grants annual long-term equity awards as an incentive for the year in which the awards are granted and subsequent years.
Executive Officer and Key Employee Share-Based Compensation Programs
The Compensation Committee has annually approved compensation programs that include the potential issuance of share-based awards to our executive officers and other key employees as part of their annual and long-term incentive compensation. The share-based awards are generally issued in the first quarter after the end of our prior fiscal year. The share-based awards generally have a service vesting period, which has historically ranged from
one
to
five
years, depending on the type of award.
Non-Employee Board Member Share-Based Compensation Program
The Board of Directors awards nonvested shares or nonvested RSUs to non-employee board members on an annual basis as part of such board members’ annual compensation and to newly elected non-employee board members in
F - 45
KILROY REALTY CORPORATION AND KILROY REALTY, L.P.
NOTES TO CONSOLIDATED FINANCIAL STATEMENTS – (Continued)
accordance with our Board of Directors compensation program. The share-based awards are generally issued in the second quarter, and the individual share awards vest in equal annual installments over the applicable service vesting period, which will be one year for the annual non-employee board awards and four years for the awards relating to newly elected non-employee board members.
2017, 2016 and 2015 Share-Based Compensation Grants
In
February 2017
, the Compensation Committee of the Company’s Board of Directors awarded
229,976
RSUs to certain officers of the Company under the 2006 Plan, which included
130,956
RSUs (at the target level of performance) that are subject to time-based, market-measure based and performance-based vesting requirements (the “2017 Performance-Based RSUs”) and
99,020
RSUs that are subject to time-based vesting requirements (the “2017 Time-Based RSUs”). Additionally, during 2017,
43,081
RSUs were granted to the board of directors and certain members of management subject to time vesting requirements.
On
January 28, 2016
, the Compensation Committee of the Company’s Board of Directors awarded
294,821
RSUs to certain officers of the Company under the 2006 Plan, which included
168,077
RSUs (at the target level of performance) that are subject to time-based, market-measure based and performance-based vesting requirements (the “2016 Performance-Based RSUs”) and
126,744
RSUs that are subject to time-based vesting requirements (“2016 Time-Based RSUs”). Additionally, during 2016,
47,003
RSUs were granted to the board of directors and certain members of management subject to time vesting requirements.
On
January 27, 2015
, the Compensation Committee of the Company’s Board of Directors awarded
212,468
RSUs to certain officers of the Company under the 2006 Plan, which included
127,657
RSUs (at the target level of performance), that are subject to time-based, market-measure based and performance-based vesting requirements (the “2015 Performance-Based RSUs”) and
84,811
RSUs, that are subject to time-based vesting requirements (“2015 Time-Based RSUs”).
2017, 2016 and 2015 Performance-Based RSU Grants
The 2017 Performance-Based RSUs are scheduled to cliff vest at the end of a
three
-year period based upon the achievement of pre-defined FFO per share goals for the year ended December 31, 2017 (the “2017 FFO Performance Condition”) and also based upon either the average FAD per share growth or the Company’s average debt to EBITDA ratio (together, the “Other 2017 Performance Conditions”) or the relative total stockholder return versus a comparative group of companies that consist of companies in the SNL US REIT Office Index (the “2017 Market Condition”) for the
three
-year period ending December 31, 2019. The 2017 FFO Performance Condition was achieved at a weighted average of approximately
131%
of target for the 2017 Performance-Based RSUs. The number of 2017 Performance-Based RSUs ultimately earned could fluctuate based upon the levels of achievement for the Other 2017 Performance Conditions and the 2017 Market Condition.
The 2016 Performance-Based RSUs are also scheduled to cliff vest at the end of a
three
-year service period based upon the achievement of pre-defined FFO per share goals for the year ended December 31, 2016 (the “2016 FFO Performance Condition”) and also upon the average annual relative total stockholder return versus a comparative group of companies that consist of companies in the SNL US REIT Office Index (the “2016 Market Condition”) for the
three
-year period ending December 31, 2018. The 2016 FFO Performance Condition was achieved at approximately
144%
of target for the 2016 Performance-Based RSUs. The number of 2016 Performance-Based RSUs ultimately earned could fluctuate based upon the levels of achievement for the 2016 Market Condition.
The 2015 Performance-Based RSUs cliff vested at the end of the
three
-year service period based upon the achievement of pre-defined FFO per share goals for the year ended December 31, 2015 (the “2015 FFO Performance Condition”) and also upon the average annual relative total shareholder return versus a comparative group of companies that consist of companies in the SNL US REIT Office Index (the “2015 Market Condition”) for the three-year period ending December 31, 2017. Based upon the combined results of the final 2015 FFO Performance Condition and final 2015 Market Condition, the 2015 Performance-Based RSUs achieved
150%
of their target level of performance.
F - 46
KILROY REALTY CORPORATION AND KILROY REALTY, L.P.
NOTES TO CONSOLIDATED FINANCIAL STATEMENTS – (Continued)
As of
December 31, 2017
, the estimated number of RSUs earned for the 2017 and 2016 Performance-Based RSUs and the actual number of RSUs earned for the 2015 Performance-Based RSUs was as follows:
|
2017 Performance-Based RSUs
|
2016 Performance-Based RSUs
|
2015 Performance-Based RSUs
|
||||||
|
Service vesting period
|
February 24, 2017 - January, 2020
|
|
January 28, 2016 - January, 2019
|
|
January 27, 2015 - January, 2018
|
|
||
|
Target RSUs granted
|
130,956
|
|
168,077
|
|
127,657
|
|
||
|
Estimated RSUs earned
(1)
|
170,994
|
|
241,438
|
|
185,510
|
|
||
|
Date of valuation
|
February 24, 2017
|
|
January 28, 2016
|
|
January 27, 2015
|
|
||
_______________
|
(1)
|
Estimated RSUs earned for the 2017 Performance-Based RSUs are based on the actual achievement of the 2017 FFO Performance Condition and assumes target level achievement of the 2017 Market Condition and Other Performance Conditions. Estimated RSUs earned for the 2016 Performance-Based RSUs are based on the actual achievement of the 2016 FFO Performance Condition and assumes target level achievement of the 2016 Market Condition. The 2015 Performance-Based RSUs earned are based on actual performance of the 2015 FFO Performance Condition and the 2015 Market Condition.
|
Each Performance-Based RSU represents the right to receive one share of our common stock in the future, subject to, and as modified by, the Company’s level of achievement of the applicable performance and market conditions. The fair values of the 2017 Performance-Based RSUs, 2016 Performance-Based RSUs and 2015 Performance-Based RSUs were
$10.3 million
at
February 24, 2017
,
$9.6 million
at
January 28, 2016
and
$10.1 million
at
January 27, 2015
, respectively. The fair values for the awards with market conditions were calculated using a Monte Carlo simulation pricing model based on the assumptions in the table below. The determination of the fair value of the 2017, 2016 and 2015 Performance-Based RSUs takes into consideration the likelihood of achievement of the 2017, 2016 and 2015 Performance Conditions and the 2017, 2016 and 2015 Market Conditions, respectively, as discussed above. As of
December 31, 2017
, the number of 2017 Performance-Based RSUs estimated to be earned based on the Company's estimate of the performance conditions measured against the applicable goals was
170,994
, and the compensation cost recorded to date for this program was based on that estimate. For the portion of the 2017 Performance-Based RSUs subject to the 2017 Market Condition, for the year ended
December 31, 2017
, we recorded compensation expense based upon the
$80.89
fair value per share at
February 24, 2017
. Compensation expense will be variable for the portion of the 2017 Performance-Based RSUs subject to the Other 2017 Performance Conditions, based upon the outcome of those conditions. For the years ended
December 31, 2017
and
2016
, we recorded compensation expense for the 2016 Performance-Based RSUs based upon the
$57.08
fair value per share at
January 28, 2016
multiplied by the
241,438
RSUs, which is net of forfeitures, estimated to be earned at
December 31, 2016
. For the years ended
December 31, 2017
,
2016
and
2015
, we recorded compensation expense for the 2015 Performance-Based RSUs based upon
$78.55
fair value per share at
January 27, 2015
multiplied by the
185,510
RSUs, which is net of forfeitures, estimated to be earned at December 31, 2015. Compensation expense for the Performance-Based RSUs is recorded on a straight-line basis over the respective three-year periods. The following table summarizes the assumptions utilized in the Monte Carlo simulation pricing models:
|
2017 Award Fair Value Assumptions
|
2016 Award Fair Value Assumptions
|
2015 Award Fair Value Assumptions
|
|||
|
Valuation date
|
February 24, 2017
|
January 28, 2016
|
January 27, 2015
|
||
|
Fair value per share on valuation date
|
$80.89
|
$57.08
|
$75.34
|
||
|
Expected share price volatility
|
21.00%
|
26.00%
|
20.00%
|
||
|
Risk-free interest rate
|
1.39%
|
1.13%
|
0.92%
|
||
|
Expected life
|
2.8 years
|
2.9 years
|
2.9 years
|
||
The computation of expected volatility was based on a blend of the historical volatility of our shares of common stock over approximately five years, as this is expected to be most consistent with future volatility and equates to a time period twice as long as the approximate two and a half year remaining performance period of the RSUs and implied volatility data based on the observed pricing of six month publicly-traded options on shares of our common stock. The risk-free interest rate was based on the yield curve on zero-coupon U.S. Treasury STRIP securities in effect at
February 24, 2017
,
January 28, 2016
and
January 27, 2015
.
F - 47
KILROY REALTY CORPORATION AND KILROY REALTY, L.P.
NOTES TO CONSOLIDATED FINANCIAL STATEMENTS – (Continued)
2017, 2016 and 2015 Time-Based RSU Grants
The 2017, 2016 and 2015 Time-Based RSUs (collectively, the “Time-Based RSUs”) are scheduled to vest in equal installments over the periods listed below. Compensation expense for the Time-Based RSUs will be recognized on a straight-line basis from the grant date through the continued service vesting periods. Each Time-Based RSU represents the right to receive one share of our common stock in the future, subject to continued employment through the applicable vesting date. The total fair value of the Time-Based RSUs is based on the Company's closing share price on the NYSE on the respective fair valuation dates as detailed in the table below:
|
2017 Time-Based RSU Grant
(1)
|
2016 Time-Based RSU Grant
|
2015 Time-Based RSU Grant
|
|||||||||
|
Service vesting period
|
February 2017 - January 5, 2020
|
|
January 28, 2016 - January 5, 2019
|
|
January 27, 2015 - January 5, 2018
|
|
|||||
|
Fair value on valuation date (in millions)
|
$
|
7.5
|
|
$
|
7.1
|
|
$
|
6.4
|
|
||
|
Fair value per share
|
$
|
73.30
|
|
$
|
56.23
|
|
$
|
75.34
|
|
||
|
Date of fair valuation
|
February 2017
|
|
January 28, 2016
|
|
January 27, 2015
|
|
|||||
_______________
|
(1)
|
The 2017 Time-Based RSUs consist of
41,119
RSUs granted on February 3, 2017 at a fair value per share of
$73.30
and
57,901
RSUs granted on February 24, 2017 at a fair value per share of
$77.16
.
|
Summary of Performance and Market-Measure Based RSUs
A summary of our performance and market-measure based RSU activity from January 1, 2017 through
December 31, 2017
is presented below:
|
Nonvested RSUs
|
Vested RSUs
|
Total RSUs
|
||||||||||
|
Amount
|
Weighted-Average
Fair Value Per Share (1) |
|||||||||||
|
Outstanding at January 1, 2017
|
659,051
|
|
$
|
64.95
|
|
—
|
|
659,051
|
|
|||
|
Granted
|
170,994
|
|
78.97
|
|
—
|
|
170,994
|
|
||||
|
Vested
|
(188,048
|
)
|
64.93
|
|
188,048
|
|
—
|
|
||||
|
Settled
(2)
|
|
(136,191
|
)
|
(136,191
|
)
|
|||||||
|
Issuance of dividend equivalents
(3)
|
23,539
|
|
73.00
|
|
6,943
|
|
30,482
|
|
||||
|
Forfeited
|
(426
|
)
|
78.55
|
|
(3,128
|
)
|
(3,554
|
)
|
||||
|
Outstanding as of December 31, 2017
(4)
|
665,110
|
|
$
|
68.83
|
|
55,672
|
|
720,782
|
|
|||
_______________
|
(1)
|
Represents the grant-date fair value for all awards, excluding the 2014 Performance-Based RSU Grant, which was re-measured upon stockholder approval of the amended 2006 Plan on May 22, 2014, as an insufficient number of shares were available to settle these RSUs upon initial grant on January 29, 2014.
|
|
(2)
|
Represents vested RSUs that were settled in shares of the Company’s common stock. Total shares settled include
72,938
shares that were tendered in accordance with the terms of the 2006 Plan to satisfy minimum statutory tax withholding requirements related to the RSUs settled. We accept the return of RSUs at the current quoted closing share price of the Company’s common stock to satisfy tax obligations.
|
|
(3)
|
Represents the issuance of dividend equivalents earned on the underlying RSUs. The dividend equivalents vest based on terms specified under the related RSU award agreement.
|
|
(4)
|
Outstanding RSUs as of
December 31, 2017
represent the actual achievement of the FFO performance conditions and assumes target levels for the market and other performance conditions. The number of restricted stock units ultimately earned is subject to change based upon actual performance over the three-year vesting period. Dividend equivalents earned will vest along with the underlying award and are also subject to changes based on the number of RSUs ultimately earned for each underlying award.
|
F - 48
KILROY REALTY CORPORATION AND KILROY REALTY, L.P.
NOTES TO CONSOLIDATED FINANCIAL STATEMENTS – (Continued)
A summary of our performance and market-measure based RSU activity for years ended
December 31, 2017
,
2016
and
2015
is presented below:
|
RSUs Granted
|
RSUs Vested
|
||||||||||||
|
Years ended December 31,
|
Non-Vested
RSUs Granted
(1)
|
Weighted-Average
Fair Value
Per Share
(2)
|
Vested RSUs
|
Total Vest-Date Fair Value
(in thousands)
|
|||||||||
|
2017
|
170,994
|
|
$
|
78.97
|
|
(194,991
|
)
|
$
|
14,270
|
|
|||
|
2016
|
258,393
|
|
57.36
|
|
(36,914
|
)
|
2,788
|
|
|||||
|
2015
|
191,483
|
|
79.25
|
|
—
|
|
—
|
|
|||||
_______________
|
(1)
|
Non-vested RSUs granted during the years ended December 31, 2017 and 2016 are based on the actual achievement of the FFO performance conditions and assumes target level achievement for the market and other performance conditions. Non-vested RSUs granted during the year ended December 31, 2015 are based on the final performance of both the 2015 FFO performance and market conditions, and are non-vested as of December 31, 2017 as they are subject to the Compensation Committee’s confirmation of final performance.
|
|
(2)
|
Represents the grant-date fair value for all awards, excluding the 2014 Performance-Based RSU Grant, which was re-measured upon stockholder approval of the amended 2006 Plan on May 22, 2014, as an insufficient number of shares were available to settle these RSUs upon initial grant on January 29, 2014.
|
Summary of Time-Based RSUs
A summary of our time-based RSU activity from January 1, 2017 through
December 31, 2017
is presented below:
|
Nonvested RSUs
|
Vested RSUs
|
Total RSUs
|
||||||||||
|
Amount
|
Weighted Average Fair Value
Per Share (1) |
|||||||||||
|
Outstanding at January 1, 2017
|
366,439
|
|
$
|
59.07
|
|
1,028,750
|
|
1,395,189
|
|
|||
|
Granted
|
142,101
|
|
74.91
|
|
—
|
|
142,101
|
|
||||
|
Vested
|
(172,731
|
)
|
57.77
|
|
172,731
|
|
—
|
|
||||
|
Settled
(2)
|
(171,093
|
)
|
(171,093
|
)
|
||||||||
|
Issuance of dividend equivalents
(3)
|
8,601
|
|
73.00
|
|
55,364
|
|
63,965
|
|
||||
|
Transferred to restricted stock
(4)
|
(10,610
|
)
|
60.16
|
|
—
|
|
(10,610
|
)
|
||||
|
Forfeited
|
(2,254
|
)
|
63.27
|
|
—
|
|
(2,254
|
)
|
||||
|
Canceled
(5)
|
(4,824
|
)
|
(4,824
|
)
|
||||||||
|
Outstanding as of December 31, 2017
|
331,546
|
|
$
|
66.83
|
|
1,080,928
|
|
1,412,474
|
|
|||
_______________
|
(1)
|
Represents the grant-date fair value for all awards, excluding the 2014 Performance-Based RSU Grant, which was re-measured upon stockholder approval of the amended 2006 Plan on May 22, 2014, as an insufficient number of shares were available to settle these RSUs upon initial grant on January 29, 2014.
|
|
(2)
|
Represents vested RSUs that were settled in shares of the Company’s common stock. Total shares settled include
77,866
shares that were tendered in accordance with the terms of the 2006 Plan to satisfy minimum statutory tax withholding requirements related to the RSUs settled. We accept the return of RSUs at the current quoted closing share price of the Company’s common stock to satisfy tax obligations.
|
|
(3)
|
Represents the issuance of dividend equivalents earned on the underlying RSUs. The dividend equivalents vest based on terms specified under the related RSU award agreement.
|
|
(4)
|
During January 2017, RSUs were transferred to restricted stock based on the elected distribution date.
|
|
(5)
|
For shares vested but not yet settled, we accept the return of RSUs at the current quoted closing share price of the Company’s common stock to satisfy minimum statutory tax-withholding requirements related to either the settlement or vesting of RSUs in accordance with the terms of the 2006 Plan.
|
F - 49
KILROY REALTY CORPORATION AND KILROY REALTY, L.P.
NOTES TO CONSOLIDATED FINANCIAL STATEMENTS – (Continued)
A summary of our time-based RSU activity for the years ended
December 31, 2017
,
2016
and
2015
is presented below:
|
RSUs Granted
|
RSUs Vested
|
||||||||||||
|
Year ended December 31,
|
Non-Vested
RSUs Issued
|
Weighted-Average Grant Date
Fair Value
Per Share
|
Vested RSUs
|
Total Vest-Date Fair Value
(1)
(in thousands)
|
|||||||||
|
2017
|
142,101
|
|
$
|
74.91
|
|
(228,095
|
)
|
$
|
16,735
|
|
|||
|
2016
|
173,747
|
|
58.29
|
|
(130,784
|
)
|
8,438
|
|
|||||
|
2015
|
98,802
|
|
74.49
|
|
(107,541
|
)
|
7,528
|
|
|||||
|
(1)
|
Total fair value of RSUs vested was calculated based on the quoted closing share price of the Company’s common stock on the NYSE on the day of vesting. Excludes the issuance of dividend equivalents earned on the underlying RSUs. The dividend equivalents vest based on terms specified under the related RSU award agreement.
|
Summary of Nonvested Restricted Stock
A summary of our nonvested restricted stock activity from January 1, 2017 through
December 31, 2017
is presented below:
|
Nonvested
Restricted Stock |
Weighted-Average
Grant Date Fair Value Per Share |
|||||
|
Outstanding at January 1, 2017
|
36,535
|
|
$
|
47.93
|
|
|
|
Transferred from time-based RSUs
|
10,610
|
|
60.16
|
|
||
|
Vested
(1)
|
(24,261
|
)
|
46.39
|
|
||
|
Outstanding as of December 31, 2017
|
22,884
|
|
$
|
55.23
|
|
|
_______________
|
(1)
|
The total shares vested includes
10,792
shares that were tendered in accordance with the terms of the 2006 Plan to satisfy minimum statutory tax withholding requirements related to the restricted shares that have vested. We accept the return of shares at the current quoted closing share price of the Company’s common stock to satisfy tax withholding obligations.
|
A summary of our nonvested and vested restricted stock activity for years ended
December 31, 2017
,
2016
and
2015
is presented below:
|
Shares Granted
|
Shares Vested
|
||||||||||||
|
Years ended December 31,
|
Nonvested
Shares Issued
|
Weighted-Average Grant Date
Fair Value
Per Share
|
Vested Shares
|
Total Fair Value at Vest Date
(1)
(in thousands)
|
|||||||||
|
2017
|
—
|
|
$
|
—
|
|
(24,261
|
)
|
$
|
1,781
|
|
|||
|
2016
|
—
|
|
—
|
|
(24,262
|
)
|
1,527
|
|
|||||
|
2015
|
—
|
|
—
|
|
(24,264
|
)
|
1,725
|
|
|||||
|
(1)
|
Total fair value of shares vested was calculated based on the quoted closing share price of the Company’s common stock on the NYSE on the date of vesting.
|
Summary of Stock Options
On February 22, 2012, the Compensation Committee of the Company granted non-qualified stock options to certain key members of our senior management team, including our Executive Officers, to purchase an aggregate
1,550,000
shares of the Company’s common stock (the “February 2012” Grant) at an exercise price per share equal to
$42.61
, the closing price of the Company’s common stock on the grant date. The options will vest ratably in annual installments over a
five
year period, subject to continued employment through the applicable vesting date. The term of each option is
ten
years from the date of the grant. Dividends will not be paid on vested or unvested options. The options were granted pursuant to the 2006 Plan.
F - 50
KILROY REALTY CORPORATION AND KILROY REALTY, L.P.
NOTES TO CONSOLIDATED FINANCIAL STATEMENTS – (Continued)
The fair value of each stock option granted is estimated on the date of grant using the Black-Scholes option pricing model based on the following assumptions for the February 2012 Grant.
|
February 2012 Option Grant
|
|
|
Fair value of options granted per share
|
$9.20
|
|
Expected stock price volatility
|
33.00%
|
|
Risk-free interest rate
|
1.35%
|
|
Dividend yield
|
3.80%
|
|
Expected life of option
|
6.5 years
|
The computation of expected volatility is based on a blend of the historical volatility of our shares of common stock over a time period longer than the expected life of the option and implied volatility data based on the observed pricing of six-month publicly traded options on our shares of common stock. The risk-free interest rate is based on the yield curve on zero-coupon U.S. Treasury STRIP securities in effect at the grant date. The expected dividend yield is estimated by examining the average of the historical dividend yield levels over the expected life of the option and the current dividend yield as of the grant date. The expected life of the options is calculated as the average of the vesting term and the contractual term. During the years ended
December 31, 2017
,
2016
and
2015
,
261,000
,
267,000
and
298,000
stock options vested, respectively, with a total fair value of
$2.4 million
,
$2.5 million
and
$2.7 million
, respectively.
A summary of our stock option activity related to the February 2012 grant from January 1,
2017
through
December 31, 2017
is presented below:
|
Number of Options
|
Exercise Price
|
Intrinsic Value
(in millions)
(1)
|
||||||||
|
Outstanding at December 31, 2016
|
314,500
|
|
$
|
42.61
|
|
$
|
9.6
|
|
||
|
Exercised
|
(285,000
|
)
|
42.61
|
|
8.8
|
|
||||
|
Forfeited
|
(3,000
|
)
|
42.61
|
|
0.1
|
|
||||
|
Outstanding at December 31, 2017
(2)
|
26,500
|
|
$
|
42.61
|
|
$
|
0.8
|
|
||
|
Options exercisable at December 31, 2017
(3)
|
26,500
|
|
$
|
42.61
|
|
$
|
0.8
|
|
||
_______________
|
(1)
|
The intrinsic value of a stock option is the amount by which the fair value of the underlying stock exceeds the exercise price of an option. The fair value of the underlying stock was determined by using the closing share price on the NYSE on the date of exercise, forfeiture or respective period end.
|
|
(2)
|
As of
December 31, 2017
, the average remaining life of stock options outstanding was
4.1
years.
|
|
(3)
|
As of
December 31, 2017
, the average remaining life of stock options exercisable was approximately
4.1
years.
|
In accordance with the provisions of the 2006 Plan, we allow shares of our common stock to be withheld to satisfy the payment of exercise price and/or minimum statutory tax withholding obligations due upon the exercise of stock options. The value of the shares withheld is calculated based on the closing market price of our common stock on the NYSE on the day prior to the exercise date. During the year ended
December 31, 2017
,
15,270
shares were withheld on stock option exercises with an aggregate value of
$1.2 million
. During the year ended
December 31, 2016
,
25,680
shares were withheld on stock option exercises with an aggregate value of
$1.8 million
. During the year ended
December 31, 2015
,
62,072
shares were withheld on stock option exercises with an aggregate value of
$3.9 million
.
Share-Based Compensation Cost Recorded During the Period
The total compensation cost for all share-based compensation programs was
$26.3 million
,
$26.6 million
and
$18.9 million
for the years ended
December 31, 2017
,
2016
and
2015
, respectively. Of the total share-based compensation costs,
$7.3 million
,
$5.6 million
and
$3.3 million
was capitalized as part of real estate assets and deferred leasing costs for the years ended
December 31, 2017
,
2016
and
2015
, respectively. As of
December 31, 2017
, there was approximately
$27.2 million
of total unrecognized compensation cost related to nonvested incentive awards granted under share-based compensation arrangements that is expected to be recognized over a weighted-average period of
1.9
years. The remaining compensation cost related to these nonvested incentive awards had been recognized in periods
F - 51
KILROY REALTY CORPORATION AND KILROY REALTY, L.P.
NOTES TO CONSOLIDATED FINANCIAL STATEMENTS – (Continued)
prior to
December 31, 2017
. The
$27.2 million
of unrecognized compensation costs does not reflect the future compensation cost related to share-based awards that were granted subsequent to
December 31, 2017
.
|
16.
|
Employee Benefit Plans
|
401(k) Plan
We have a retirement savings plan designed to qualify under Section 401(k) of the Code (the “401(k) Plan”). Our employees are eligible to participate in the 401(k) Plan on the first day of the month after
three
months of service. The 401(k) Plan allows eligible employees (“401(k) Participants”) to defer up to
60%
of their eligible compensation on a pre-tax basis, subject to certain maximum amounts allowed by the Code. The 401(k) Plan provides for a matching contribution by the Company in an amount equal to
50
cents of each one dollar of participant contributions up to a maximum of
10%
of the 401(k) Participant’s annual salary. 401(k) Participants vest immediately in the amounts contributed by us. For each of the years ended
December 31, 2017
,
2016
, and
2015
, we contributed
$1.3 million
,
$1.2 million
and
$1.1 million
, respectively, to the 401(k) Plan.
Deferred Compensation Plan
In 2007, we adopted the Deferred Compensation Plan, under which directors and certain management employees may defer receipt of their compensation, including up to
70%
of their salaries and up to
100%
of their director fees and bonuses, as applicable. In addition, employee participants will receive mandatory Company contributions to their Deferred Compensation Plan accounts equal to
10%
of their gross monthly salaries, without regard to whether such employees elect to defer salary or bonus compensation under the Deferred Compensation Plan. Our board of directors may, but has no obligation to, approve additional discretionary contributions by the Company to Participant accounts. We hold the Deferred Compensation Plan assets in a limited rabbi trust, which is subject to the claims of our creditors in the event of bankruptcy or insolvency.
See Note 19 “Fair Value Measurements and Disclosures” for further discussion of our Deferred Compensation Plan assets as of
December 31, 2017
and
2016
. Our liability of
$20.6 million
and
$14.7 million
under the Deferred Compensation Plan was fully funded as of
December 31, 2017
and
2016
, respectively.
|
17.
|
Future Minimum Rent
|
We have operating leases with tenants that expire at various dates through
2037
and are either subject to scheduled fixed increases or adjustments in rent based on the Consumer Price Index. Generally, the leases grant tenants renewal options. Leases also provide for additional rents based on certain operating expenses. Future contractual minimum rent under operating leases as of
December 31, 2017
for future periods is summarized as follows:
|
Year Ending
|
(in thousands)
|
||
|
2018
|
$
|
555,393
|
|
|
2019
|
546,587
|
|
|
|
2020
|
525,637
|
|
|
|
2021
|
497,566
|
|
|
|
2022
|
476,146
|
|
|
|
Thereafter
|
2,569,163
|
|
|
|
Total
(1)
|
$
|
5,170,492
|
|
______________
|
(1)
|
Excludes residential leases and leases with a term of
one
year or less.
|
F - 52
KILROY REALTY CORPORATION AND KILROY REALTY, L.P.
NOTES TO CONSOLIDATED FINANCIAL STATEMENTS – (Continued)
|
18.
|
Commitments and Contingencies
|
General
As of
December 31, 2017
, we had commitments of approximately
$696.1 million
, excluding our ground lease commitments, for contracts and executed leases directly related to our operating and development properties.
Ground Leases
The following table summarizes our properties that are held subject to long-term noncancellable ground lease obligations and the respective contractual expiration dates:
|
Property
|
Contractual Expiration Date
(1)
|
|
601 108th Ave NE, Bellevue, WA
|
November 2093
|
|
701, 801 and 837 N. 34th Street, Seattle, WA
(2)
|
December 2041
|
|
1701 Page Mill Road and 3150 Porter Drive, Palo Alto, CA
|
December 2067
|
|
Kilroy Airport Center Phases I, II, and III, Long Beach, CA
|
July 2084
|
____________________
|
(1)
|
Reflects the contractual expiration date prior to the impact of any extension or purchase options held by the Company.
|
|
(2)
|
The Company has
three
10
-year and
one
45
-year extension options for this ground lease, which if exercised would extend the expiration date to December 2116.
|
The minimum commitment under our ground leases as of
December 31, 2017
for five years and thereafter is as follows:
|
Year Ending
|
(in thousands)
|
||
|
2018
|
$
|
4,957
|
|
|
2019
|
4,957
|
|
|
|
2020
|
4,957
|
|
|
|
2021
|
4,957
|
|
|
|
2022
|
4,957
|
|
|
|
Thereafter
|
226,633
|
|
|
|
Total
(1)(2)(3)(4)(5)
|
$
|
251,418
|
|
(1) Excludes contingent future rent payments based on gross income or adjusted gross income and reflects the minimum ground lease obligations before the impact of ground lease extension options.
|
(2)
|
One of our ground lease obligations is subject to a fair market value adjustment every
five years
; however, the lease includes ground rent subprotection and infrastructure rent credits which currently limit our annual rental obligations to
$1.0 million
. The contractual obligations for that ground lease included above assumes the lesser of
$1.0 million
or annual lease rental obligation in effect as of
December 31, 2017
.
|
|
(3)
|
One of our ground lease obligations includes a component which is based on the percentage of gross income that exceeds the minimum ground rent. The minimum rent is subject to increases every
five years
based on
50%
of the average annual percentage rent for the previous five years. The contractual obligations for that lease included above assume the current annual ground lease obligation in effect at December 31, 2017 for the remainder of the lease term since we cannot predict future adjustments.
|
|
(4)
|
One of our ground lease obligations is subject to a fair market value adjustment every five years based on a combination of CPI adjustments and third-party appraisals limited to maximum increases annually. The contractual obligations for that lease included above assume the current annual ground lease obligation in effect at December 31, 2017 for the remainder of the lease term since we cannot predict future adjustments.
|
|
(5)
|
One of our ground lease obligations includes a component which is based on the percentage of adjusted gross income that exceeds the minimum ground rent. The minimum rent is subject to increases every
10 years
by an amount equal to
60%
of the average annual percentage rent for the previous three years. The contractual obligations for this lease included above assume the current annual ground lease obligation in effect at December 31, 2017 for the remainder of the lease term since we cannot predict future adjustments.
|
Environmental Matters
We follow the policy of monitoring all of our properties, both acquisition and existing stabilized portfolio properties, for the presence of hazardous or toxic substances. While there can be no assurance that a material environmental liability does not exist, we are not currently aware of any environmental liability with respect to our stabilized portfolio properties that would have a material adverse effect on our financial condition, results of operations and cash flow, or that we believe would require additional disclosure or the recording of a loss contingency.
F - 53
KILROY REALTY CORPORATION AND KILROY REALTY, L.P.
NOTES TO CONSOLIDATED FINANCIAL STATEMENTS – (Continued)
As of
December 31, 2017
and
2016
, we had accrued environmental remediation liabilities of approximately
$28.3 million
and
$25.1 million
, respectively, recorded on our consolidated balance sheets in connection with certain of our in-process and future development projects. The accrued environmental remediation liabilities represent the costs we estimate we will incur when we commence development at various development acquisition sites. These estimates, which we developed with the assistance of third party experts, consist primarily of the removal of contaminated soil and other related costs since we are required to dispose of any existing contaminated soil when we develop new office properties as these sites.
We record estimated environmental remediation obligations for acquired properties at the acquisition date when we are aware of such costs and when such costs are probable and can be reasonably estimated. Costs incurred in connection with the development related environmental remediation liabilities are recorded as an increase to the cost of the development project. These accruals are adjusted as an increase or decrease to the development project costs and as an increase or decrease to the accrued environmental remediation liability if we obtain further information or circumstances change. The environmental remediation obligations recorded at
December 31, 2017
and
2016
were not discounted to their present value since we expect to complete the remediation activities in the next one to five years in connection with development activities at the various sites. It is possible that we could incur additional environmental remediation costs in connection with these future development projects. However, given we are in the pre-development phase on these future development projects, potential additional environmental costs cannot be reasonably estimated at this time and certain changes in estimates could occur as the site conditions, final project timing, design elements, actual soil conditions and other aspects of the projects, which may depend upon municipal and other approvals beyond the control of the Company, are determined.
Other than the accrued environmental liabilities discussed above, we are not aware of any unasserted claims and assessments with respect to an environmental liability that we believe would require additional disclosure or the recording of an additional loss contingency.
Litigation
We and our properties are subject to litigation arising in the ordinary course of business. To our knowledge, neither we nor any of our properties are presently subject to any litigation or threat of litigation which, if determined unfavorably to us, would have a material adverse effect on our cash flow, financial condition, or results of operations.
Insurance
We maintain commercial general liability, auto liability, employers’ liability, umbrella/excess liability, special form property, difference in conditions including earthquake and flood, environmental, rental loss, and terrorism insurance covering all of our properties. Management believes the policy specifications and insured limits are reasonable given the relative risk of loss, the cost of the coverage, and industry practice. We do not carry insurance for generally uninsurable losses such as loss from governmental action, nuclear hazard, and war and military action. Policies are subject to various terms, conditions, and exclusions and some policies may involve large deductibles or co-payments.
Property Damage Settlement
During the year ended
December 31, 2016
, we settled an outstanding property damage matter and received cash proceeds totaling
$5.0 million
, which is included in other property income on our consolidated statements of operations.
F - 54
KILROY REALTY CORPORATION AND KILROY REALTY, L.P.
NOTES TO CONSOLIDATED FINANCIAL STATEMENTS – (Continued)
19. Fair Value Measurements and Disclosures
Assets and Liabilities Reported at Fair Value
The only assets we record at fair value on our consolidated financial statements are the marketable securities related to our Deferred Compensation Plan (see Note 16 “Employee Benefit Plans” for additional information). The following table sets forth the fair value of our marketable securities as of
December 31, 2017
and
2016
:
|
Fair Value (Level 1)
(1)
|
|||||||
|
2017
|
2016
|
||||||
|
Description
|
(in thousands)
|
||||||
|
Marketable securities
(2)
|
$
|
20,674
|
|
$
|
14,773
|
|
|
_______________
|
(1)
|
Based on quoted prices in active markets for identical securities.
|
|
(2)
|
The marketable securities are held in a limited rabbi trust
.
|
We report the change in the fair value of the marketable securities at the end of each accounting period in interest income and other net investment gains (losses) in the consolidated statements of operations. We also adjust the related Deferred Compensation Plan liability to fair value at the end of each accounting period based on the performance of the benchmark funds selected by each participant, which results in a corresponding increase or decrease to compensation cost for the period.
The following table sets forth the net gain (loss) on marketable securities recorded during the years ended
December 31, 2017
,
2016
and
2015
:
|
December 31,
|
|||||||||||
|
2017
|
2016
|
2015
|
|||||||||
|
Description
|
(in thousands)
|
||||||||||
|
Net gain (loss) on marketable securities
|
$
|
3,023
|
|
$
|
1,130
|
|
$
|
(269
|
)
|
||
Financial Instruments Disclosed at Fair Value
The following table sets forth the carrying value and the fair value of our other financial instruments as of
December 31, 2017
and
2016
:
|
December 31,
|
|||||||||||||||
|
2017
|
2016
|
||||||||||||||
|
Carrying Value
|
Fair Value
(1)
|
Carrying Value
|
Fair Value
(1)
|
||||||||||||
|
(in thousands)
|
|||||||||||||||
|
Liabilities
|
|||||||||||||||
|
Secured debt, net
|
$
|
340,800
|
|
$
|
346,858
|
|
$
|
472,772
|
|
$
|
469,234
|
|
|||
|
Unsecured debt, net
|
2,006,263
|
|
2,077,199
|
|
1,847,351
|
|
1,900,487
|
|
|||||||
_______________
|
(1)
|
Fair value calculated using Level II inputs, which are based on model-derived valuations in which significant inputs and significant value drivers are observable in active markets.
|
F - 55
KILROY REALTY CORPORATION AND KILROY REALTY, L.P.
NOTES TO CONSOLIDATED FINANCIAL STATEMENTS – (Continued)
|
20.
|
Net Income Available to Common Stockholders Per Share of the Company
|
The following table reconciles the numerator and denominator in computing the Company’s basic and diluted per-share computations for net income available to common stockholders for the years ended
December 31, 2017
,
2016
and
2015
:
|
Year Ended December 31,
|
|||||||||||
|
2017
|
2016
|
2015
|
|||||||||
|
(in thousands, except unit and per unit amounts)
|
|||||||||||
|
Numerator:
|
|||||||||||
|
Net income attributable to Kilroy Realty Corporation
|
$
|
164,612
|
|
$
|
293,788
|
|
$
|
234,081
|
|
||
|
Total preferred dividends
|
(13,363
|
)
|
(13,250
|
)
|
(13,250
|
)
|
|||||
|
Allocation to participating securities
(1)
|
(1,975
|
)
|
(3,839
|
)
|
(1,634
|
)
|
|||||
|
Numerator for basic and diluted net income available to common stockholders
|
$
|
149,274
|
|
$
|
276,699
|
|
$
|
219,197
|
|
||
|
Denominator:
|
|
||||||||||
|
Basic weighted average vested shares outstanding
|
98,113,561
|
|
92,342,483
|
|
89,854,096
|
|
|||||
|
Effect of dilutive securities – contingently issuable shares and stock options
|
613,770
|
|
680,551
|
|
541,679
|
|
|||||
|
Diluted weighted average vested shares and common stock equivalents outstanding
|
98,727,331
|
|
93,023,034
|
|
90,395,775
|
|
|||||
|
Basic earnings per share:
|
|
||||||||||
|
Net income available to common stockholders per share
|
$
|
1.52
|
|
$
|
3.00
|
|
$
|
2.44
|
|
||
|
Diluted earnings per share:
|
|
||||||||||
|
Net income available to common stockholders per share
|
$
|
1.51
|
|
$
|
2.97
|
|
$
|
2.42
|
|
||
________________________
|
(1)
|
Participating securities include nonvested shares, certain time-based RSUs and vested market measure-based RSUs.
|
Share-based payment awards that contain non-forfeitable rights to dividends or dividend equivalents (whether paid or unpaid) are considered participating securities. The impact of potentially dilutive common shares, including stock options, RSUs and other securities are considered in our diluted earnings per share calculation for the years ended
December 31, 2017
,
2016
, and
2015
. Certain market measure-based RSUs are not included in dilutive securities as of
December 31, 2017
,
2016
, and
2015
as not all performance metrics had been met by the end of the applicable reporting periods.
See Note 15 “Share-Based Compensation” for additional information regarding the stock options and other share-based compensation.
F - 56
KILROY REALTY CORPORATION AND KILROY REALTY, L.P.
NOTES TO CONSOLIDATED FINANCIAL STATEMENTS – (Continued)
|
21.
|
Net Income Available to Common Unitholders Per Unit of the Operating Partnership
|
The following table reconciles the numerator and denominator in computing the Operating Partnership’s basic and diluted per-unit computations for net income available to common unitholders for the years ended
December 31, 2017
,
2016
and
2015
:
|
Year Ended December 31,
|
|||||||||||
|
2017
|
2016
|
2015
|
|||||||||
|
(in thousands, except unit and per unit amounts)
|
|||||||||||
|
Numerator:
|
|||||||||||
|
Net income attributable to Kilroy Realty, L.P.
|
$
|
167,440
|
|
$
|
300,063
|
|
$
|
238,137
|
|
||
|
Total preferred distributions
|
(13,363
|
)
|
(13,250
|
)
|
(13,250
|
)
|
|||||
|
Allocation to participating securities
(1)
|
(1,975
|
)
|
(3,839
|
)
|
(1,634
|
)
|
|||||
|
Numerator for basic and diluted net income available to common unitholders
|
$
|
152,102
|
|
$
|
282,974
|
|
$
|
223,253
|
|
||
|
Denominator:
|
|
||||||||||
|
Basic weighted average vested units outstanding
|
100,246,567
|
|
94,771,688
|
|
91,645,578
|
|
|||||
|
Effect of dilutive securities - contingently issuable shares and stock options
|
613,770
|
|
680,551
|
|
541,679
|
|
|||||
|
Diluted weighted average vested units and common unit equivalents outstanding
|
100,860,337
|
|
95,452,239
|
|
92,187,257
|
|
|||||
|
Basic earnings per unit:
|
|||||||||||
|
Net income available to common unitholders per unit
|
$
|
1.52
|
|
$
|
2.99
|
|
$
|
2.44
|
|
||
|
Diluted earnings per unit:
|
|
||||||||||
|
Net income available to common unitholders per unit
|
$
|
1.51
|
|
$
|
2.96
|
|
$
|
2.42
|
|
||
________________________
|
(1)
|
Participating securities include nonvested shares, certain time-based RSUs and vested market measure-based RSUs.
|
Share-based payment awards that contain non-forfeitable rights to dividends or dividend equivalents (whether paid or unpaid) are considered participating securities. The impact of potentially dilutive common units, including stock options, RSUs and other securities are considered in our diluted earnings per share calculation for the years ended
December 31, 2017
,
2016
, and
2015
. Certain market measure-based RSUs are not included in dilutive securities as of
December 31, 2017
and
2016
as not all performance metrics had been met by the end of the applicable reporting periods.
See Note 15 “Share-Based Compensation” for additional information regarding the stock options and other share-based compensation.
F - 57
KILROY REALTY CORPORATION AND KILROY REALTY, L.P.
NOTES TO CONSOLIDATED FINANCIAL STATEMENTS – (Continued)
22. Supplemental Cash Flow Information of the Company
Supplemental cash flow information follows (in thousands):
|
Year Ended December 31,
|
|||||||||||
|
2017
|
2016
|
2015
|
|||||||||
|
SUPPLEMENTAL CASH FLOWS INFORMATION:
|
|||||||||||
|
Cash paid for interest, net of capitalized interest of $44,757, $47,675, and $50,923 as of
December 31, 2017, 2016 and 2015, respectively
|
$
|
67,336
|
|
$
|
54,295
|
|
$
|
54,747
|
|
||
|
NON-CASH INVESTING TRANSACTIONS:
|
|||||||||||
|
Accrual for expenditures for operating properties and development and redevelopment
properties
|
$
|
116,089
|
|
$
|
62,589
|
|
$
|
109,715
|
|
||
|
Tenant improvements funded directly by tenants
|
$
|
15,314
|
|
$
|
18,050
|
|
$
|
13,387
|
|
||
|
Assumption of other assets and liabilities in connection with operating and development
property acquisitions, net (Note 3)
|
$
|
1,443
|
|
$
|
5,863
|
|
$
|
6,254
|
|
||
|
Accrual for receivable related to development properties
|
$
|
—
|
|
$
|
1,350
|
|
$
|
—
|
|
||
|
Release of holdback funds to third party
|
$
|
—
|
|
$
|
—
|
|
$
|
9,279
|
|
||
|
NON-CASH FINANCING TRANSACTIONS:
|
|||||||||||
|
Accrual of dividends and distributions payable to common stockholders and common
unitholders (Notes 13 and 27)
|
$
|
43,448
|
|
$
|
220,650
|
|
$
|
33,336
|
|
||
|
Accrual of dividends and distributions payable to preferred stockholders and preferred
unitholders (Note 13)
|
$
|
—
|
|
$
|
1,656
|
|
$
|
1,656
|
|
||
|
Issuance of common units of the Operating Partnership in connection with an acquisition
(Note 3) |
$
|
—
|
|
$
|
48,033
|
|
$
|
—
|
|
||
|
Secured debt assumed by buyers in connection with land disposition (Note 4)
|
$
|
—
|
|
$
|
2,322
|
|
$
|
—
|
|
||
|
Exchange of common units of the Operating Partnership into shares of the Company’s
common stock
|
$
|
10,939
|
|
$
|
8,893
|
|
$
|
1,223
|
|
||
The following is a reconciliation of our cash and cash equivalents and restricted cash at the beginning and end of the years ended
December 31, 2017
,
2016
and
2015
.
|
Year Ended December 31,
|
|||||||||||
|
2017
|
2016
|
2015
|
|||||||||
|
RECONCILIATION OF CASH AND CASH EQUIVALENTS AND RESTRICTED CASH:
|
|
|
|||||||||
|
Cash and cash equivalents at beginning of period
|
$
|
193,418
|
|
$
|
56,508
|
|
$
|
23,781
|
|
||
|
Restricted cash at beginning of period
|
56,711
|
|
696
|
|
75,185
|
|
|||||
|
Cash and cash equivalents and restricted cash at beginning of period
|
$
|
250,129
|
|
$
|
57,204
|
|
$
|
98,966
|
|
||
|
Cash and cash equivalents at end of period
|
$
|
57,649
|
|
$
|
193,418
|
|
$
|
56,508
|
|
||
|
Restricted cash at end of period
|
9,149
|
|
56,711
|
|
696
|
|
|||||
|
Cash and cash equivalents and restricted cash at end of period
|
$
|
66,798
|
|
$
|
250,129
|
|
$
|
57,204
|
|
||
F - 58
KILROY REALTY CORPORATION AND KILROY REALTY, L.P.
NOTES TO CONSOLIDATED FINANCIAL STATEMENTS – (Continued)
23. Supplemental Cash Flow Information of the Operating Partnership:
Supplemental cash flow information follows (in thousands):
|
|
Year Ended December 31,
|
||||||||||
|
|
2017
|
2016
|
2015
|
||||||||
|
SUPPLEMENTAL CASH FLOWS INFORMATION:
|
|||||||||||
|
Cash paid for interest, net of capitalized interest of $44,757, $47,675, and $50,923 as of
December 31, 2017, 2016 and 2015, respectively
|
$
|
67,336
|
|
$
|
54,295
|
|
$
|
54,747
|
|
||
|
NON-CASH INVESTING TRANSACTIONS:
|
|||||||||||
|
Accrual for expenditures for operating properties and development and redevelopment properties
|
$
|
116,089
|
|
$
|
62,589
|
|
$
|
109,715
|
|
||
|
Tenant improvements funded directly by tenants
|
$
|
15,314
|
|
$
|
18,050
|
|
$
|
13,387
|
|
||
|
Assumption of other assets and liabilities in connection with operating and development property acquisitions, net (Note 3)
|
$
|
1,443
|
|
$
|
5,863
|
|
$
|
6,254
|
|
||
|
Accrual for receivable related to development properties
|
$
|
—
|
|
$
|
1,350
|
|
$
|
—
|
|
||
|
Release of holdback funds to third party
|
$
|
—
|
|
$
|
—
|
|
$
|
9,279
|
|
||
|
NON-CASH FINANCING TRANSACTIONS:
|
|||||||||||
|
Accrual of dividends and distributions payable to common stockholders and common
unitholders (Notes 14 and 27) |
$
|
43,448
|
|
$
|
220,650
|
|
$
|
33,336
|
|
||
|
Accrual of dividends and distributions payable to preferred stockholders and preferred unitholders (Note 14)
|
$
|
—
|
|
$
|
1,656
|
|
$
|
1,656
|
|
||
|
Issuance of common units in connection with a development property acquisition (Note 3)
|
$
|
—
|
|
$
|
48,033
|
|
$
|
—
|
|
||
|
Secured debt assumed by buyers in connection with land disposition (Note 4)
|
$
|
—
|
|
$
|
2,322
|
|
$
|
—
|
|
||
The following is a reconciliation of our cash and cash equivalents and restricted cash at the beginning and end of the years ended
December 31, 2017
,
2016
and
2015
.
|
Year Ended December 31,
|
|||||||||||
|
2017
|
2016
|
2015
|
|||||||||
|
RECONCILIATION OF CASH AND CASH EQUIVALENTS AND RESTRICTED CASH:
|
|
|
|||||||||
|
Cash and cash equivalents at beginning of period
|
$
|
193,418
|
|
$
|
56,508
|
|
$
|
23,781
|
|
||
|
Restricted cash at beginning of period
|
56,711
|
|
696
|
|
75,185
|
|
|||||
|
Cash and cash equivalents and restricted cash at beginning of period
|
$
|
250,129
|
|
$
|
57,204
|
|
$
|
98,966
|
|
||
|
Cash and cash equivalents at end of period
|
$
|
57,649
|
|
$
|
193,418
|
|
$
|
56,508
|
|
||
|
Restricted cash at end of period
|
9,149
|
|
56,711
|
|
696
|
|
|||||
|
Cash and cash equivalents and restricted cash at end of period
|
$
|
66,798
|
|
$
|
250,129
|
|
$
|
57,204
|
|
||
F - 59
KILROY REALTY CORPORATION AND KILROY REALTY, L.P.
NOTES TO CONSOLIDATED FINANCIAL STATEMENTS – (Continued)
24. Tax Treatment of Distributions
The following table reconciles the dividends declared per share of common stock to the dividends paid per share of common stock during the years ended
December 31, 2017
,
2016
and
2015
as follows:
|
Year Ended December 31,
|
|||||||||||
|
Dividends
|
2017
|
2016
|
2015
|
||||||||
|
Dividends declared per share of common stock
|
$
|
1.650
|
|
$
|
3.375
|
|
$
|
1.400
|
|
||
|
Less: Dividends declared in the current year and paid in the following year
|
(0.425
|
)
|
(2.275
|
)
|
(0.350
|
)
|
|||||
|
Add: Dividends declared in the prior year and paid in the current year
(1)
|
2.275
|
|
0.350
|
|
0.350
|
|
|||||
|
Dividends paid per share of common stock
|
$
|
3.500
|
|
$
|
1.450
|
|
$
|
1.400
|
|
||
_________________
|
(1)
|
The fourth quarter 2016 dividend of
$2.275
per share of common stock consists of a special cash dividend of
$1.90
per share of common stock and a regular quarterly cash dividend of
$0.375
per share of common stock. The
$1.90
per share special distribution is treated as paid in two tax years for income tax purposes:
$1.587
is treated as paid on December 31, 2016 and
$0.313
is treated as paid on January 13, 2017. The
$0.375
per share regular quarterly distribution is considered a 2017 dividend distribution for income tax purposes.
|
The unaudited income tax treatment for the dividends to common stockholders reportable for the years ended
December 31, 2017
,
2016
and
2015
as identified in the table above was as follows:
|
Year Ended December 31,
|
||||||||||||||||||||
|
Shares of Common Stock
|
2017
|
2016
|
2015
|
|||||||||||||||||
|
Ordinary income
|
$
|
1.356
|
|
70.87
|
%
|
$
|
1.500
|
|
49.40
|
%
|
$
|
0.992
|
|
70.86
|
%
|
|||||
|
Qualified dividend
|
0.002
|
|
0.11
|
|
0.002
|
|
0.06
|
|
0.002
|
|
0.13
|
|
||||||||
|
Return of capital
|
0.344
|
|
18.00
|
|
—
|
|
—
|
|
—
|
|
—
|
|
||||||||
|
Capital gains
(1)
|
—
|
|
—
|
|
1.212
|
|
39.89
|
|
0.051
|
|
3.65
|
|
||||||||
|
Unrecaptured section 1250 gains
|
0.211
|
|
11.02
|
|
0.323
|
|
10.65
|
|
0.355
|
|
25.36
|
|
||||||||
|
$
|
1.913
|
|
100.00
|
%
|
$
|
3.037
|
|
100.00
|
%
|
$
|
1.400
|
|
100.00
|
%
|
||||||
|
(1)
|
Capital gains are comprised entirely of
20%
rate gains.
|
The
6.875%
Series G Cumulative Redeemable Preferred Stock was issued in March 2012 and redeemed in March 2017. The unaudited income tax treatment for the dividends to Series G preferred stockholders reportable for the years ended
December 31, 2017
,
2016
, and
2015
was as follows:
|
Year Ended December 31,
|
||||||||||||||||||||
|
Preferred Shares
|
2017
|
2016
|
2015
|
|||||||||||||||||
|
Ordinary income
|
$
|
0.371
|
|
86.43
|
%
|
$
|
0.848
|
|
49.31
|
%
|
$
|
1.218
|
|
70.86
|
%
|
|||||
|
Qualified dividend
|
0.001
|
|
0.14
|
|
0.001
|
|
0.06
|
|
0.002
|
|
0.13
|
|
||||||||
|
Capital gains
(1)
|
—
|
|
—
|
|
0.687
|
|
39.97
|
|
0.063
|
|
3.65
|
|
||||||||
|
Unrecaptured section 1250 gains
|
0.058
|
|
13.43
|
|
0.183
|
|
10.66
|
|
0.436
|
|
25.36
|
|
||||||||
|
$
|
0.430
|
|
100.00
|
%
|
$
|
1.719
|
|
100.00
|
%
|
$
|
1.719
|
|
100.00
|
%
|
||||||
__________________
|
(1)
|
Capital gains are comprised entirely of
20%
rate gains.
|
The
6.375%
Series H Cumulative Redeemable Preferred Stock was issued in August 2012 and redeemed in August 2017. The unaudited income tax treatment for the dividends to Series H preferred stockholders reportable for the years ended
December 31, 2017
,
2016
, and
2015
was as follows:
|
Year Ended December 31,
|
||||||||||||||||||||
|
Preferred Shares
|
2017
|
2016
|
2015
|
|||||||||||||||||
|
Ordinary income
|
$
|
1.033
|
|
86.43
|
%
|
$
|
0.786
|
|
49.31
|
%
|
$
|
1.129
|
|
70.86
|
%
|
|||||
|
Qualified dividend
|
0.002
|
|
0.14
|
|
0.001
|
|
0.06
|
|
0.002
|
|
0.13
|
|
||||||||
|
Capital gains
(1)
|
—
|
|
—
|
|
0.637
|
|
39.97
|
|
0.059
|
|
3.65
|
|
||||||||
|
Unrecaptured section 1250 gains
|
0.160
|
|
13.43
|
|
0.17
|
|
10.66
|
|
0.404
|
|
25.36
|
|
||||||||
|
$
|
1.195
|
|
100.00
|
%
|
$
|
1.594
|
|
100.00
|
%
|
$
|
1.594
|
|
100.00
|
%
|
||||||
__________________
|
(1)
|
Capital gains are comprised entirely of
20%
rate gains.
|
F - 60
KILROY REALTY CORPORATION AND KILROY REALTY, L.P.
NOTES TO CONSOLIDATED FINANCIAL STATEMENTS – (Continued)
|
25.
|
Quarterly Financial Information of the Company (Unaudited)
|
Summarized quarterly financial data for the years ended
December 31, 2017
and
2016
was as follows:
|
2017 Quarter Ended
(1)
|
|||||||||||||||
|
March 31,
|
June 30,
|
September 30,
|
December 31,
|
||||||||||||
|
(in thousands, except per share amounts)
|
|||||||||||||||
|
Revenues
|
$
|
179,308
|
|
$
|
180,598
|
|
$
|
181,534
|
|
$
|
177,561
|
|
|||
|
Net income
|
37,281
|
|
35,306
|
|
75,488
|
|
32,540
|
|
|||||||
|
Net income attributable to Kilroy Realty Corporation
|
33,525
|
|
31,448
|
|
71,110
|
|
28,529
|
|
|||||||
|
Total preferred dividends and distributions
|
(7,196
|
)
|
(1,615
|
)
|
(4,552
|
)
|
—
|
|
|||||||
|
Net income available to common stockholders
|
26,329
|
|
29,833
|
|
66,558
|
|
28,529
|
|
|||||||
|
Net income available to common stockholders per share – basic
|
0.27
|
|
0.30
|
|
0.67
|
|
0.28
|
|
|||||||
|
Net income available to common stockholders per share – diluted
|
0.26
|
|
0.30
|
|
0.67
|
|
0.28
|
|
|||||||
|
2016 Quarter Ended
(1)
|
|||||||||||||||
|
March 31,
|
June 30,
|
September 30,
|
December 31,
|
||||||||||||
|
(in thousands, except per share amounts)
|
|||||||||||||||
|
Revenues
|
$
|
145,446
|
|
$
|
160,133
|
|
$
|
168,348
|
|
$
|
168,645
|
|
|||
|
Net income
|
178,113
|
|
33,892
|
|
56,375
|
|
35,418
|
|
|||||||
|
Net income attributable to Kilroy Realty Corporation
|
174,308
|
|
32,847
|
|
53,895
|
|
32,738
|
|
|||||||
|
Preferred dividends and distributions
|
(3,313
|
)
|
(3,312
|
)
|
(3,313
|
)
|
(3,312
|
)
|
|||||||
|
Net income available to common stockholders
|
170,995
|
|
29,535
|
|
50,582
|
|
29,426
|
|
|||||||
|
Net income available to common stockholders per share – basic
|
1.85
|
|
0.32
|
|
0.54
|
|
0.29
|
|
|||||||
|
Net income available to common stockholders per share – diluted
|
1.84
|
|
0.31
|
|
0.54
|
|
0.29
|
|
|||||||
|
(1)
|
The summation of the quarterly financial data may not equal the annual number reported on the consolidated statements of operations due to rounding. For the year ended
December 31, 2016
, the summation of the quarterly net income available to common stockholders per share does not equal the annual number reported on the consolidated statements of operations due to the Company’s repurchase of common stock and its at-the-market stock offering programs that occurred during the year.
|
|
26.
|
Quarterly Financial Information of the Operating Partnership (Unaudited)
|
Summarized quarterly financial data for the years ended
December 31, 2017
and
2016
was as follows:
|
2017 Quarter Ended
(1)
|
|||||||||||||||
|
March 31,
|
June 30,
|
September 30,
|
December 31,
|
||||||||||||
|
(in thousands, except per unit amounts)
|
|||||||||||||||
|
Revenues
|
$
|
179,308
|
|
$
|
180,598
|
|
$
|
181,534
|
|
$
|
177,561
|
|
|||
|
Net income
|
37,281
|
|
35,306
|
|
75,488
|
|
32,540
|
|
|||||||
|
Net income attributable to the Operating Partnership
|
34,054
|
|
31,971
|
|
72,402
|
|
29,013
|
|
|||||||
|
Total preferred distributions
|
(7,196
|
)
|
(1,615
|
)
|
(4,552
|
)
|
—
|
|
|||||||
|
Net income available to common unitholders
|
26,858
|
|
30,356
|
|
67,850
|
|
29,013
|
|
|||||||
|
Net income available to common unitholders per unit – basic
|
0.26
|
|
0.30
|
|
0.67
|
|
0.28
|
|
|||||||
|
Net income available to common unitholders per unit – diluted
|
0.26
|
|
0.30
|
|
0.67
|
|
0.28
|
|
|||||||
|
2016 Quarter Ended
(1)
|
|||||||||||||||
|
March 31,
|
June 30,
|
September 30,
|
December 31,
|
||||||||||||
|
(in thousands, except per unit amounts)
|
|||||||||||||||
|
Revenues
|
$
|
145,446
|
|
$
|
160,133
|
|
$
|
168,348
|
|
$
|
168,645
|
|
|||
|
Net income
|
178,113
|
|
33,892
|
|
56,375
|
|
35,418
|
|
|||||||
|
Net income attributable to the Operating Partnership
|
177,833
|
|
33,590
|
|
55,254
|
|
33,386
|
|
|||||||
|
Preferred distributions
|
(3,313
|
)
|
(3,312
|
)
|
(3,313
|
)
|
(3,312
|
)
|
|||||||
|
Net income available to common unitholders
|
174,520
|
|
30,278
|
|
51,941
|
|
30,074
|
|
|||||||
|
Net income available to common unitholders per unit – basic
|
1.85
|
|
0.31
|
|
0.54
|
|
0.29
|
|
|||||||
|
Net income available to common unitholders per unit – diluted
|
1.84
|
|
0.31
|
|
0.54
|
|
0.29
|
|
|||||||
|
(1)
|
The summation of the quarterly financial data may not equal the annual number reported on the consolidated statements of operations due to rounding. For the year ended
December 31, 2016
, the summation of the quarterly net income available to common stockholders per share does not equal the annual number reported on the consolidated statements of operations due to the issuance of common units in connection with an acquisition, the Company’s repurchase of common stock and the its at-the-market stock offering programs that occurred during the year.
|
F - 61
KILROY REALTY CORPORATION AND KILROY REALTY, L.P.
NOTES TO CONSOLIDATED FINANCIAL STATEMENTS – (Continued)
|
27.
|
Subsequent Events
|
On
January 12, 2018
,
$43.4 million
of dividends were paid out to common stockholders, common unitholders and RSU holders of record on
December 29, 2017
.
In January 2018, the Operating Partnership borrowed
$75.0 million
on the unsecured term loan facility.
On January 29, 2018, the Executive Compensation Committee granted
56,015
RSUs to key employees under the 2006 Plan. The compensation cost related to the RSUs is expected to be recognized over a period of
three
years.
On January 31, 2018, the Company completed the acquisition of three, two-story lab buildings encompassing
146,000
square feet for approximately
$111.0 million
in the Oyster Point submarket of South San Francisco.
F - 62
KILROY REALTY CORPORATION AND KILROY REALTY, L.P.
SCHEDULE II – VALUATION AND QUALIFYING ACCOUNTS
Years ended
December 31, 2017
,
2016
and
2015
(in thousands)
|
|
Balance at
Beginning
of Period
|
Charged to
Costs and
Expenses
|
Recoveries
(Deductions)
|
Balance
at End
of Period
(1)
|
|||||||||||
|
Allowance for Uncollectible Tenant Receivables for the year ended
December 31,
|
|||||||||||||||
|
2017 – Allowance for uncollectible tenant receivables
|
$
|
1,712
|
|
$
|
1,517
|
|
$
|
(920
|
)
|
$
|
2,309
|
|
|||
|
2016 – Allowance for uncollectible tenant receivables
|
2,080
|
|
—
|
|
(368
|
)
|
1,712
|
|
|||||||
|
2015 – Allowance for uncollectible tenant receivables
|
1,999
|
|
303
|
|
(222
|
)
|
2,080
|
|
|||||||
|
Allowance for Deferred Rent Receivables for the year ended
December 31,
|
|||||||||||||||
|
2017 – Allowance for deferred rent
|
$
|
1,524
|
|
$
|
1,752
|
|
$
|
(38
|
)
|
$
|
3,238
|
|
|||
|
2016 – Allowance for deferred rent
|
1,882
|
|
—
|
|
(358
|
)
|
1,524
|
|
|||||||
|
2015 – Allowance for deferred rent
|
1,989
|
|
242
|
|
(349
|
)
|
1,882
|
|
|||||||
F - 63
KILROY REALTY CORPORATION AND KILROY REALTY, L.P
SCHEDULE III – REAL ESTATE AND ACCUMULATED DEPRECIATION
December 31, 2017
|
|
Initial Cost
|
Gross Amounts at Which
Carried at Close of Period
|
||||||||||||||||||||||||||||||||||||
|
Property Location
|
Encumb-
rances
|
Land and improve-
ments
|
Buildings
and
Improve-
ments
|
Costs
Capitalized
Subsequent
to
Acquisition/
Improvement
|
Land and improve-
ments
|
Buildings
and
Improve-
ments
|
Total
|
Accumulated
Depreciation
|
Depreci-
ation
Life
(1)
|
Date of
Acquisition
(A)/
Construction
(C)
(2)
|
Rentable
Square
Feet
(3)
(unaudited)
|
|||||||||||||||||||||||||||
|
|
($ in thousands)
|
|||||||||||||||||||||||||||||||||||||
|
Office Properties:
|
||||||||||||||||||||||||||||||||||||||
|
23925 Park Sorrento, Calabasas, CA
|
|
|
|
$
|
50
|
|
$
|
2,346
|
|
$
|
505
|
|
$
|
50
|
|
$
|
2,851
|
|
$
|
2,901
|
|
$
|
1,785
|
|
35
|
2001
|
( C )
|
11,873
|
|
|||||||||
|
23975 Park Sorrento, Calabasas, CA
|
|
|
|
765
|
|
17,720
|
|
8,948
|
|
765
|
|
26,668
|
|
27,433
|
|
15,576
|
|
35
|
2002
|
( C )
|
104,797
|
|
||||||||||||||||
|
24025 Park Sorrento, Calabasas, CA
|
|
|
|
845
|
|
15,896
|
|
8,780
|
|
845
|
|
24,676
|
|
25,521
|
|
14,669
|
|
35
|
2000
|
( C )
|
108,670
|
|
||||||||||||||||
|
2829 Townsgate Rd., Thousand Oaks, CA
|
5,248
|
|
8,001
|
|
7,991
|
|
5,248
|
|
15,992
|
|
21,240
|
|
11,056
|
|
35
|
1997
|
( A )
|
84,098
|
|
|||||||||||||||||||
|
2240 E. Imperial Highway, El Segundo, CA
|
|
|
1,044
|
|
11,763
|
|
29,488
|
|
1,048
|
|
41,247
|
|
42,295
|
|
24,400
|
|
35
|
1983
|
( C )
|
122,870
|
|
|||||||||||||||||
|
2250 E. Imperial Highway, El Segundo, CA
|
|
|
2,579
|
|
29,062
|
|
35,553
|
|
2,547
|
|
64,647
|
|
67,194
|
|
50,919
|
|
35
|
1983
|
( C )
|
298,728
|
|
|||||||||||||||||
|
2260 E. Imperial Highway, El Segundo, CA
|
|
|
2,518
|
|
28,370
|
|
36,620
|
|
2,547
|
|
64,961
|
|
67,508
|
|
11,814
|
|
35
|
1983
|
( C )
|
298,728
|
|
|||||||||||||||||
|
909 N. Sepulveda Blvd., El Segundo, CA
|
|
|
|
3,577
|
|
34,042
|
|
47,184
|
|
3,577
|
|
81,226
|
|
84,803
|
|
35,309
|
|
35
|
2005
|
( C )
|
244,136
|
|
||||||||||||||||
|
999 N. Sepulveda Blvd., El Segundo, CA
|
|
|
|
1,407
|
|
34,326
|
|
13,370
|
|
1,407
|
|
47,696
|
|
49,103
|
|
21,309
|
|
35
|
2003
|
( C )
|
128,588
|
|
||||||||||||||||
|
6115 W. Sunset Blvd., Los Angeles, CA
|
|
|
(4)
|
1,313
|
|
3
|
|
15,386
|
|
2,455
|
|
14,247
|
|
16,702
|
|
970
|
|
35
|
2015
|
( C )
|
26,105
|
|
||||||||||||||||
|
6121 W. Sunset Blvd., Los Angeles, CA
|
|
|
(4)
|
11,120
|
|
4,256
|
|
43,912
|
|
8,703
|
|
50,585
|
|
59,288
|
|
4,003
|
|
35
|
2015
|
( C )
|
91,173
|
|
||||||||||||||||
|
1525 N. Gower Street, Los Angeles, CA
|
|
|
(4)
|
1,318
|
|
3
|
|
9,633
|
|
1,318
|
|
9,636
|
|
10,954
|
|
522
|
|
35
|
2016
|
( C )
|
9,610
|
|
||||||||||||||||
|
1575 N. Gower Street, Los Angeles, CA
|
|
|
(4)
|
22,153
|
|
51
|
|
119,891
|
|
22,153
|
|
119,942
|
|
142,095
|
|
4,438
|
|
35
|
2016
|
( C )
|
251,245
|
|
||||||||||||||||
|
1500 N. El Centro Avenue, Los Angeles, CA
|
|
|
(4)
|
9,235
|
|
21
|
|
55,627
|
|
9,235
|
|
55,648
|
|
64,883
|
|
1,907
|
|
35
|
2016
|
( C )
|
104,504
|
|
||||||||||||||||
|
1550 N. El Centro Avenue, Los Angeles, CA
|
|
|
(4)
|
16,970
|
|
39
|
|
135,390
|
|
16,970
|
|
135,429
|
|
152,399
|
|
6,012
|
|
35
|
2016
|
( C )
|
(5)
|
|||||||||||||||||
|
6255 W. Sunset Blvd., Los Angeles, CA
|
|
|
|
18,111
|
|
60,320
|
|
40,177
|
|
18,111
|
|
100,497
|
|
118,608
|
|
23,147
|
|
35
|
2012
|
( A )
|
323,920
|
|
||||||||||||||||
|
3750 Kilroy Airport Way, Long Beach, CA
|
|
|
—
|
|
1,941
|
|
11,022
|
|
—
|
|
12,963
|
|
12,963
|
|
10,005
|
|
35
|
1989
|
( C )
|
10,457
|
|
|||||||||||||||||
|
3760 Kilroy Airport Way, Long Beach, CA
|
|
|
—
|
|
17,467
|
|
12,031
|
|
—
|
|
29,498
|
|
29,498
|
|
24,461
|
|
35
|
1989
|
( C )
|
165,278
|
|
|||||||||||||||||
|
3780 Kilroy Airport Way, Long Beach, CA
|
|
|
—
|
|
22,319
|
|
20,119
|
|
—
|
|
42,438
|
|
42,438
|
|
35,747
|
|
35
|
1989
|
( C )
|
219,745
|
|
|||||||||||||||||
|
3800 Kilroy Airport Way, Long Beach, CA
|
|
|
—
|
|
19,408
|
|
20,176
|
|
—
|
|
39,584
|
|
39,584
|
|
22,575
|
|
35
|
2000
|
( C )
|
192,476
|
|
|||||||||||||||||
|
3840 Kilroy Airport Way, Long Beach, CA
|
|
|
—
|
|
13,586
|
|
9,635
|
|
—
|
|
23,221
|
|
23,221
|
|
14,695
|
|
35
|
1999
|
( C )
|
136,026
|
|
|||||||||||||||||
|
3880 Kilroy Airport Way, Long Beach, CA
|
|
|
—
|
|
9,704
|
|
11,167
|
|
—
|
|
20,871
|
|
20,871
|
|
3,118
|
|
35
|
1997
|
( A )
|
96,035
|
|
|||||||||||||||||
|
3900 Kilroy Airport Way, Long Beach, CA
|
|
|
—
|
|
12,615
|
|
11,397
|
|
—
|
|
24,012
|
|
24,012
|
|
16,058
|
|
35
|
1997
|
( A )
|
129,893
|
|
|||||||||||||||||
|
Kilroy Airport Center, Phase IV, Long Beach, CA
(6)
|
|
|
—
|
|
—
|
|
4,997
|
|
—
|
|
4,997
|
|
4,997
|
|
4,993
|
|
35
|
|
|
—
|
|
|||||||||||||||||
|
8560 W. Sunset Blvd, West Hollywood, CA
|
|
|
9,720
|
|
50,956
|
|
169
|
|
9,720
|
|
51,125
|
|
60,845
|
|
2,204
|
|
35
|
2016
|
( A )
|
71,875
|
|
|||||||||||||||||
|
8570 W. Sunset Blvd, West Hollywood, CA
|
|
|
31,693
|
|
27,974
|
|
256
|
|
31,693
|
|
28,230
|
|
59,923
|
|
1,075
|
|
35
|
2016
|
( A )
|
43,603
|
|
|||||||||||||||||
|
8580 W. Sunset Blvd, West Hollywood, CA
|
|
|
10,013
|
|
3,695
|
|
35
|
|
10,013
|
|
3,730
|
|
13,743
|
|
137
|
|
35
|
2016
|
( A )
|
7,126
|
|
|||||||||||||||||
|
8590 W. Sunset Blvd, West Hollywood, CA
|
|
|
39,954
|
|
27,884
|
|
272
|
|
39,954
|
|
28,156
|
|
68,110
|
|
1,178
|
|
35
|
2016
|
( A )
|
56,095
|
|
|||||||||||||||||
|
12100 W. Olympic Blvd., Los Angeles, CA
|
170,000
|
|
(7)
|
352
|
|
45,611
|
|
18,417
|
|
9,633
|
|
54,747
|
|
64,380
|
|
25,353
|
|
35
|
2003
|
( C )
|
152,048
|
|
||||||||||||||||
|
12200 W. Olympic Blvd., Los Angeles, CA
|
|
(7)
|
4,329
|
|
35,488
|
|
23,274
|
|
3,977
|
|
59,114
|
|
63,091
|
|
34,746
|
|
35
|
2000
|
( C )
|
150,832
|
|
|||||||||||||||||
|
12233 W. Olympic Blvd., Los Angeles, CA
|
|
|
22,100
|
|
53,170
|
|
3,848
|
|
22,100
|
|
57,018
|
|
79,118
|
|
9,610
|
|
35
|
2012
|
( A )
|
151,029
|
|
|||||||||||||||||
|
12312 W. Olympic Blvd., Los Angeles, CA
|
|
(7)
|
3,325
|
|
12,202
|
|
11,326
|
|
3,399
|
|
23,454
|
|
26,853
|
|
10,573
|
|
35
|
1997
|
( A )
|
76,644
|
|
|||||||||||||||||
|
1633 26th St., Santa Monica, CA
|
|
|
2,080
|
|
6,672
|
|
3,139
|
|
2,040
|
|
9,851
|
|
11,891
|
|
6,638
|
|
35
|
1997
|
( A )
|
43,857
|
|
|||||||||||||||||
|
2100/2110 Colorado Ave., Santa Monica, CA
|
93,081
|
|
(8)
|
5,474
|
|
26,087
|
|
14,373
|
|
5,476
|
|
40,458
|
|
45,934
|
|
22,311
|
|
35
|
1997
|
( A )
|
102,864
|
|
||||||||||||||||
|
3130 Wilshire Blvd., Santa Monica, CA
|
|
|
8,921
|
|
6,579
|
|
14,931
|
|
9,188
|
|
21,243
|
|
30,431
|
|
13,546
|
|
35
|
1997
|
( A )
|
90,002
|
|
|||||||||||||||||
F - 64
KILROY REALTY CORPORATION AND KILROY REALTY, L.P.
SCHEDULE III – REAL ESTATE AND ACCUMULATED DEPRECIATION – (Continued)
December 31, 2017
|
|
Initial Cost
|
Gross Amounts at Which
Carried at Close of Period
|
||||||||||||||||||||||||||||
|
Property Location
|
Encumb-
rances
|
Land and improve-
ments
|
Buildings
and
Improve-
ments
|
Costs
Capitalized
Subsequent
to
Acquisition/
Improvement
|
Land and improve-
ments
|
Buildings
and
Improve-
ments
|
Total
|
Accumulated
Depreciation
|
Depreci-
ation
Life
(1)
|
Date of
Acquisition
(A)/
Construction
(C)
(2)
|
Rentable
Square
Feet
(3)
(unaudited)
|
|||||||||||||||||||
|
|
($ in thousands)
|
|||||||||||||||||||||||||||||
|
501 Santa Monica Blvd., Santa Monica, CA
|
|
(9)
|
4,547
|
|
12,044
|
|
13,173
|
|
4,551
|
|
25,213
|
|
29,764
|
|
14,092
|
|
35
|
1998
|
( A )
|
76,803
|
|
|||||||||
|
2211 Michelson, Irvine, CA
|
(8)
|
9,319
|
|
82,836
|
|
5,779
|
|
9,319
|
|
88,615
|
|
97,934
|
|
24,029
|
|
35
|
2010
|
( A )
|
271,556
|
|
||||||||||
|
12225 El Camino Real, Del Mar, CA
|
1,700
|
|
9,633
|
|
2,982
|
|
1,673
|
|
12,642
|
|
14,315
|
|
8,274
|
|
35
|
1998
|
( A )
|
58,401
|
|
|||||||||||
|
12235 El Camino Real, Del Mar, CA
|
1,507
|
|
8,543
|
|
8,657
|
|
1,540
|
|
17,167
|
|
18,707
|
|
8,927
|
|
35
|
1998
|
( A )
|
53,751
|
|
|||||||||||
|
12340 El Camino Real, Del Mar, CA
|
|
4,201
|
|
13,896
|
|
8,851
|
|
4,201
|
|
22,747
|
|
26,948
|
|
10,375
|
|
35
|
2002
|
( C )
|
88,377
|
|
||||||||||
|
12390 El Camino Real, Del Mar, CA
|
|
3,453
|
|
11,981
|
|
1,380
|
|
3,453
|
|
13,361
|
|
16,814
|
|
8,646
|
|
35
|
2000
|
( C )
|
72,332
|
|
||||||||||
|
12348 High Bluff Dr., Del Mar, CA
|
1,629
|
|
3,096
|
|
6,144
|
|
1,629
|
|
9,240
|
|
10,869
|
|
5,760
|
|
35
|
1999
|
( C )
|
38,806
|
|
|||||||||||
|
12400 High Bluff Dr., Del Mar, CA
|
(9)
|
15,167
|
|
40,497
|
|
14,337
|
|
15,167
|
|
54,834
|
|
70,001
|
|
25,468
|
|
35
|
2004
|
( C )
|
209,220
|
|
||||||||||
|
3579 Valley Centre Dr., Del Mar, CA
|
2,167
|
|
6,897
|
|
7,461
|
|
2,858
|
|
13,667
|
|
16,525
|
|
8,977
|
|
35
|
1999
|
( C )
|
52,418
|
|
|||||||||||
|
3611 Valley Centre Dr., Del Mar, CA
|
4,184
|
|
19,352
|
|
18,843
|
|
5,259
|
|
37,120
|
|
42,379
|
|
22,592
|
|
35
|
2000
|
( C )
|
129,656
|
|
|||||||||||
|
3661 Valley Centre Dr., Del Mar, CA
|
4,038
|
|
21,144
|
|
15,535
|
|
4,725
|
|
35,992
|
|
40,717
|
|
18,966
|
|
35
|
2001
|
( C )
|
128,364
|
|
|||||||||||
|
3721 Valley Centre Dr., Del Mar, CA
|
4,297
|
|
18,967
|
|
14,557
|
|
4,254
|
|
33,567
|
|
37,821
|
|
14,278
|
|
35
|
2003
|
( C )
|
115,193
|
|
|||||||||||
|
3811 Valley Centre Dr., Del Mar, CA
|
3,452
|
|
16,152
|
|
20,092
|
|
4,457
|
|
35,239
|
|
39,696
|
|
20,243
|
|
35
|
2000
|
( C )
|
112,067
|
|
|||||||||||
|
12770 El Camino Real, Del Mar, CA
|
9,360
|
|
—
|
|
31,914
|
|
9,360
|
|
31,914
|
|
41,274
|
|
830
|
|
35
|
2015
|
( C )
|
73,032
|
|
|||||||||||
|
12780 El Camino Real, Del Mar, CA
|
18,398
|
|
54,954
|
|
2,382
|
|
18,398
|
|
57,336
|
|
75,734
|
|
9,642
|
|
35
|
2013
|
( A )
|
140,591
|
|
|||||||||||
|
12790 El Camino Real, Del Mar, CA
|
10,252
|
|
21,236
|
|
1,426
|
|
10,252
|
|
22,662
|
|
32,914
|
|
3,788
|
|
35
|
2013
|
( A )
|
78,836
|
|
|||||||||||
|
13280 Evening Creek Dr. South, I-15 Corridor, CA
|
3,701
|
|
8,398
|
|
4,597
|
|
3,701
|
|
12,995
|
|
16,696
|
|
4,544
|
|
35
|
2008
|
( C )
|
41,196
|
|
|||||||||||
|
13290 Evening Creek Dr. South, I-15 Corridor, CA
|
5,229
|
|
11,871
|
|
5,919
|
|
5,229
|
|
17,790
|
|
23,019
|
|
5,105
|
|
35
|
2008
|
( C )
|
61,180
|
|
|||||||||||
|
13480 Evening Creek Dr. North, I-15 Corridor, CA
|
7,997
|
|
—
|
|
48,184
|
|
7,997
|
|
48,184
|
|
56,181
|
|
16,885
|
|
35
|
2008
|
( C )
|
149,817
|
|
|||||||||||
|
13500 Evening Creek Dr. North, I-15 Corridor, CA
|
7,581
|
|
35,903
|
|
8,761
|
|
7,580
|
|
44,665
|
|
52,245
|
|
18,895
|
|
35
|
2004
|
( A )
|
147,533
|
|
|||||||||||
|
13520 Evening Creek Dr. North, I-15 Corridor, CA
|
7,581
|
|
35,903
|
|
13,232
|
|
7,580
|
|
49,136
|
|
56,716
|
|
20,855
|
|
35
|
2004
|
( A )
|
141,129
|
|
|||||||||||
|
2305 Historic Decatur Rd., Point Loma, CA
|
5,240
|
|
22,220
|
|
7,309
|
|
5,240
|
|
29,529
|
|
34,769
|
|
7,695
|
|
35
|
2010
|
( A )
|
103,900
|
|
|||||||||||
|
4690 Executive Dr., University Towne Centre, CA
|
|
1,623
|
|
7,926
|
|
3,670
|
|
1,623
|
|
11,596
|
|
13,219
|
|
6,819
|
|
35
|
1999
|
( A )
|
47,846
|
|
||||||||||
|
4100 Bohannon Dr., Menlo Park, CA
|
(9)
|
4,835
|
|
15,526
|
|
505
|
|
4,860
|
|
16,006
|
|
20,866
|
|
3,352
|
|
35
|
2012
|
( A )
|
47,379
|
|
||||||||||
|
4200 Bohannon Dr., Menlo Park, CA
|
(9)
|
4,798
|
|
15,406
|
|
2,343
|
|
4,662
|
|
17,885
|
|
22,547
|
|
4,165
|
|
35
|
2012
|
( A )
|
45,451
|
|
||||||||||
|
4300 Bohannon Dr., Menlo Park, CA
|
(9)
|
6,527
|
|
20,958
|
|
2,963
|
|
6,470
|
|
23,978
|
|
30,448
|
|
6,140
|
|
35
|
2012
|
( A )
|
63,079
|
|
||||||||||
|
4400 Bohannon Dr., Menlo Park, CA
|
(9)
|
4,798
|
|
15,406
|
|
2,530
|
|
4,939
|
|
17,795
|
|
22,734
|
|
4,321
|
|
35
|
2012
|
( A )
|
48,146
|
|
||||||||||
|
4500 Bohannon Dr., Menlo Park, CA
|
(9)
|
6,527
|
|
20,957
|
|
1,757
|
|
6,470
|
|
22,771
|
|
29,241
|
|
4,795
|
|
35
|
2012
|
( A )
|
63,078
|
|
||||||||||
|
4600 Bohannon Dr., Menlo Park, CA
|
(9)
|
4,798
|
|
15,406
|
|
3,266
|
|
4,939
|
|
18,531
|
|
23,470
|
|
4,177
|
|
35
|
2012
|
( A )
|
48,147
|
|
||||||||||
|
4700 Bohannon Dr., Menlo Park, CA
|
(9)
|
6,527
|
|
20,958
|
|
1,412
|
|
6,470
|
|
22,427
|
|
28,897
|
|
4,658
|
|
35
|
2012
|
( A )
|
63,078
|
|
||||||||||
|
1290 - 1300 Terra Bella Avenue, Mountain View, CA
|
28,730
|
|
27,555
|
|
—
|
|
28,730
|
|
27,555
|
|
56,285
|
|
2,198
|
|
35
|
2016
|
( A )
|
114,175
|
|
|||||||||||
|
331 Fairchild Dr., Mountain View, CA
|
(9)
|
18,396
|
|
17,712
|
|
7,958
|
|
18,396
|
|
25,670
|
|
44,066
|
|
3,772
|
|
35
|
2013
|
( C )
|
87,147
|
|
||||||||||
|
680 E. Middlefield Rd., Mountain View, CA
|
34,605
|
|
—
|
|
56,464
|
|
34,605
|
|
56,464
|
|
91,069
|
|
6,003
|
|
35
|
2014
|
( C )
|
170,090
|
|
|||||||||||
|
690 E. Middlefield Rd., Mountain View, CA
|
34,755
|
|
—
|
|
56,707
|
|
34,755
|
|
56,707
|
|
91,462
|
|
6,029
|
|
35
|
2014
|
( C )
|
170,823
|
|
|||||||||||
|
1701 Page Mill Rd, Palo Alto, CA
|
—
|
|
99,522
|
|
—
|
|
—
|
|
99,522
|
|
99,522
|
|
3,000
|
|
35
|
2016
|
( A )
|
128,688
|
|
|||||||||||
|
3150 Porter Drive, Palo Alto, CA
|
—
|
|
21,715
|
|
—
|
|
—
|
|
21,715
|
|
21,715
|
|
796
|
|
35
|
2016
|
( A )
|
36,897
|
|
|||||||||||
F - 65
KILROY REALTY CORPORATION AND KILROY REALTY, L.P.
SCHEDULE III – REAL ESTATE AND ACCUMULATED DEPRECIATION – (Continued)
December 31, 2017
|
|
Initial Cost
|
Gross Amounts at Which
Carried at Close of Period
|
|||||||||||||||||||||||||||||||||||||
|
Property Location
|
Encumb-
rances
|
Land and improve-
ments
|
Buildings
and
Improve-
ments
|
Costs
Capitalized
Subsequent
to
Acquisition/
Improvement
|
Land and improve-
ments
|
Buildings
and
Improve-
ments
|
Total
|
Accumulated
Depreciation
|
Depreci-
ation
Life
(1)
|
Date of
Acquisition
(A)/
Construction
(C)
(2)
|
Rentable
Square
Feet
(3)
(unaudited)
|
||||||||||||||||||||||||||||
|
|
($ in thousands)
|
||||||||||||||||||||||||||||||||||||||
|
900 Jefferson Ave., Redwood City, CA
(10)
|
16,668
|
|
—
|
|
109,272
|
|
18,063
|
|
107,877
|
|
125,940
|
|
8,114
|
|
35
|
2015
|
( C )
|
228,505
|
|
||||||||||||||||||||
|
900 Middlefield Rd., Redwood City, CA
(10)
|
7,959
|
|
—
|
|
49,713
|
|
8,626
|
|
49,046
|
|
57,672
|
|
3,497
|
|
35
|
2015
|
( C )
|
118,764
|
|
||||||||||||||||||||
|
303 Second St., San Francisco, CA
(11)
|
|
|
63,550
|
|
154,153
|
|
56,675
|
|
63,550
|
|
210,828
|
|
274,378
|
|
60,664
|
|
35
|
2010
|
( A )
|
740,047
|
|
||||||||||||||||||
|
100 First St., San Francisco, CA
(12)
|
49,150
|
|
131,238
|
|
35,190
|
|
49,150
|
|
166,428
|
|
215,578
|
|
45,677
|
|
35
|
2010
|
( A )
|
467,095
|
|
||||||||||||||||||||
|
250 Brannan St., San Francisco, CA
|
7,630
|
|
22,770
|
|
4,421
|
|
7,630
|
|
27,191
|
|
34,821
|
|
8,520
|
|
35
|
2011
|
( A )
|
95,008
|
|
||||||||||||||||||||
|
201 Third St., San Francisco, CA
|
19,260
|
|
84,018
|
|
57,295
|
|
19,260
|
|
141,313
|
|
160,573
|
|
37,393
|
|
35
|
2011
|
( A )
|
346,538
|
|
||||||||||||||||||||
|
301 Brannan St., San Francisco, CA
|
5,910
|
|
22,450
|
|
5,226
|
|
5,910
|
|
27,676
|
|
33,586
|
|
6,047
|
|
35
|
2011
|
( A )
|
74,430
|
|
||||||||||||||||||||
|
360 Third St., San Francisco, CA
|
—
|
|
88,235
|
|
112,295
|
|
28,504
|
|
172,026
|
|
200,530
|
|
32,575
|
|
35
|
2011
|
( A )
|
429,796
|
|
||||||||||||||||||||
|
333 Brannan, San Francisco, CA
|
18,645
|
|
—
|
|
78,078
|
|
18,645
|
|
78,078
|
|
96,723
|
|
4,109
|
|
35
|
2016
|
( C )
|
185,602
|
|
||||||||||||||||||||
|
350 Mission Street, San Francisco, CA
|
52,815
|
|
—
|
|
211,581
|
|
52,815
|
|
211,581
|
|
264,396
|
|
11,205
|
|
35
|
2016
|
( C )
|
455,340
|
|
||||||||||||||||||||
|
1310 Chesapeake Terrace, Sunnyvale, CA
|
(9)
|
16,700
|
|
11,020
|
|
486
|
|
16,700
|
|
11,506
|
|
28,206
|
|
1,581
|
|
35
|
2014
|
( A )
|
76,244
|
|
|||||||||||||||||||
|
1315 Chesapeake Terrace, Sunnyvale, CA
|
(9)
|
12,260
|
|
7,930
|
|
463
|
|
12,260
|
|
8,393
|
|
20,653
|
|
1,490
|
|
35
|
2014
|
( A )
|
55,635
|
|
|||||||||||||||||||
|
1320-1324 Chesapeake Terrace, Sunnyvale, CA
|
(9)
|
17,360
|
|
10,720
|
|
538
|
|
17,360
|
|
11,258
|
|
28,618
|
|
2,076
|
|
35
|
2014
|
( A )
|
79,720
|
|
|||||||||||||||||||
|
1325-1327 Chesapeake Terrace, Sunnyvale, CA
|
(9)
|
12,610
|
|
8,160
|
|
345
|
|
12,610
|
|
8,505
|
|
21,115
|
|
1,516
|
|
35
|
2014
|
( A )
|
55,383
|
|
|||||||||||||||||||
|
505 Mathilda Ave., Sunnyvale, CA
|
37,843
|
|
1,163
|
|
50,429
|
|
37,943
|
|
51,492
|
|
89,435
|
|
4,913
|
|
35
|
2014
|
( C )
|
212,322
|
|
||||||||||||||||||||
|
555 Mathilda Ave., Sunnyvale, CA
|
37,843
|
|
1,163
|
|
50,426
|
|
37,943
|
|
51,489
|
|
89,432
|
|
4,913
|
|
35
|
2014
|
( C )
|
212,322
|
|
||||||||||||||||||||
|
605 Mathilda Ave., Sunnyvale, CA
|
29,014
|
|
891
|
|
77,266
|
|
29,090
|
|
78,081
|
|
107,171
|
|
10,756
|
|
35
|
2014
|
( C )
|
162,785
|
|
||||||||||||||||||||
|
599 Mathilda Ave., Sunnyvale, CA
|
13,538
|
|
12,559
|
|
58
|
|
13,538
|
|
12,617
|
|
26,155
|
|
2,971
|
|
35
|
2012
|
( A )
|
75,810
|
|
||||||||||||||||||||
|
601 108th Ave., Bellevue, WA
|
—
|
|
214,095
|
|
32,822
|
|
—
|
|
246,917
|
|
246,917
|
|
60,705
|
|
35
|
2011
|
( A )
|
488,470
|
|
||||||||||||||||||||
|
10900 NE 4th St., Bellevue, WA
|
25,080
|
|
150,877
|
|
24,038
|
|
25,080
|
|
174,915
|
|
199,995
|
|
38,829
|
|
35
|
2012
|
( A )
|
416,755
|
|
||||||||||||||||||||
|
10210 NE Points Dr., Kirkland, WA
|
|
4,336
|
|
24,187
|
|
3,072
|
|
4,336
|
|
27,259
|
|
31,595
|
|
7,219
|
|
35
|
2011
|
( A )
|
84,641
|
|
|||||||||||||||||||
|
10220 NE Points Dr., Kirkland, WA
|
|
|
2,554
|
|
12,080
|
|
1,550
|
|
2,554
|
|
13,630
|
|
16,184
|
|
3,487
|
|
35
|
2011
|
( A )
|
49,851
|
|
||||||||||||||||||
|
10230 NE Points Dr., Kirkland, WA
|
|
5,071
|
|
24,694
|
|
6,148
|
|
5,071
|
|
30,842
|
|
35,913
|
|
7,680
|
|
35
|
2011
|
( A )
|
98,982
|
|
|||||||||||||||||||
|
3933 Lake WA Blvd. NE, Kirkland, WA
|
|
2,380
|
|
15,114
|
|
6,591
|
|
2,380
|
|
21,705
|
|
24,085
|
|
5,550
|
|
35
|
2011
|
( A )
|
46,450
|
|
|||||||||||||||||||
|
837 N. 34th St., Lake Union, WA
|
—
|
|
37,404
|
|
2,555
|
|
—
|
|
39,959
|
|
39,959
|
|
8,291
|
|
35
|
2012
|
( A )
|
111,580
|
|
||||||||||||||||||||
|
701 N. 34th St., Lake Union, WA
|
|
|
—
|
|
48,027
|
|
5,221
|
|
—
|
|
53,248
|
|
53,248
|
|
11,830
|
|
35
|
2012
|
( A )
|
138,994
|
|
||||||||||||||||||
|
801 N. 34th St., Lake Union, WA
|
—
|
|
58,537
|
|
183
|
|
—
|
|
58,720
|
|
58,720
|
|
11,997
|
|
35
|
2012
|
( A )
|
169,412
|
|
||||||||||||||||||||
|
320 Westlake Avenue North, WA
|
76,314
|
|
(13)
|
14,710
|
|
82,018
|
|
4,320
|
|
14,710
|
|
86,338
|
|
101,048
|
|
13,865
|
|
35
|
2013
|
( A )
|
184,644
|
|
|||||||||||||||||
|
321 Terry Avenue North, Lake Union, WA
|
(13)
|
10,430
|
|
60,003
|
|
9,935
|
|
10,430
|
|
69,938
|
|
80,368
|
|
10,520
|
|
35
|
2013
|
( A )
|
135,755
|
|
|||||||||||||||||||
|
401 Terry Avenue North, Lake Union, WA
|
22,500
|
|
77,046
|
|
—
|
|
22,500
|
|
77,046
|
|
99,546
|
|
10,222
|
|
35
|
2014
|
( A )
|
140,605
|
|
||||||||||||||||||||
|
TOTAL OPERATING PROPERTIES
|
339,395
|
|
1,033,949
|
|
2,754,699
|
|
2,196,321
|
|
1,076,172
|
|
4,908,797
|
|
5,984,969
|
|
1,264,162
|
|
13,720,597
|
|
|||||||||||||||||||||
|
Undeveloped land and construction in progress
|
—
|
|
692,241
|
|
—
|
|
740,567
|
|
692,241
|
|
740,567
|
|
1,432,808
|
|
—
|
|
—
|
|
|||||||||||||||||||||
|
TOTAL ALL PROPERTIES
|
$
|
339,395
|
|
(14)
|
$
|
1,726,190
|
|
$
|
2,754,699
|
|
$
|
2,936,888
|
|
$
|
1,768,413
|
|
$
|
5,649,364
|
|
$
|
7,417,777
|
|
$
|
1,264,162
|
|
13,720.597
|
|
||||||||||||
F - 66
KILROY REALTY CORPORATION AND KILROY REALTY, L.P.
SCHEDULE III – REAL ESTATE AND ACCUMULATED DEPRECIATION – (Continued)
December 31, 2017
__________________
|
(1)
|
The initial costs of buildings and improvements are depreciated over
35 years
using a straight-line method of accounting; improvements capitalized subsequent to acquisition are depreciated over the shorter of the lease term or useful life, generally ranging from
one
to
20
years.
|
|
(2)
|
Represents our date of construction or acquisition, or of our predecessor, the Kilroy Group.
|
|
(3)
|
Includes square footage from our stabilized portfolio.
|
|
(4)
|
These properties include the costs of a shared parking structure for a complex comprised of five office buildings and one residential tower. The costs of the parking structure are allocated amongst the six buildings.
|
|
(5)
|
This property represents the 200-unit Columbia Square - Residential tower that stabilized in 2016.
|
|
(6)
|
These costs represent infrastructure costs incurred in 1989. During the third quarter of 2009, we exercised our option to terminate the ground lease at Kilroy Airport Center, Phase IV in Long Beach, California. We had previously leased this land, which is adjacent to our Office Properties at Kilroy Airport Center, Long Beach, for potential future development opportunities.
|
|
(7)
|
These properties secure a
$170.0 million
mortgage note.
|
|
(8)
|
These properties secure a
$93.1 million
mortgage note.
|
|
(9)
|
These properties secure intercompany promissory notes between KRLP and consolidated property partnerships.
|
|
(10)
|
These properties are owned by Redwood City Partners LLC, a consolidated property partnership.
|
|
(11)
|
This property is owned by 303 Second Street Member LLC, a consolidated property partnership.
|
|
(12)
|
This property is owned by 100 First Street Member LLC, a consolidated property partnership.
|
|
(13)
|
These properties secure a
$76.3 million
mortgage note.
|
|
(14)
|
Represents gross aggregate principal amount before the effect of the unamortized premium of approximately
$2.6 million
and deferred financing costs of
$1.2 million
as of
December 31, 2017
.
|
F - 67
KILROY REALTY CORPORATION AND KILROY REALTY, L.P.
SCHEDULE III – REAL ESTATE AND ACCUMULATED DEPRECIATION – (Continued)
December 31, 2017
As of
December 31, 2017
, the aggregate gross cost of property included above for federal income tax purposes approximated
$6.3 billion
.
The following table reconciles the historical cost of total real estate held for investment from January 1,
2015
to
December 31, 2017
:
|
|
Year Ended December 31,
|
||||||||||
|
|
2017
|
2016
|
2015
|
||||||||
|
|
(in thousands)
|
||||||||||
|
Total real estate held for investment, beginning of year
|
$
|
7,060,754
|
|
$
|
6,328,146
|
|
$
|
6,057,932
|
|
||
|
Additions during period:
|
|
||||||||||
|
Acquisitions
|
19,829
|
|
460,957
|
|
139,123
|
|
|||||
|
Improvements, etc.
|
533,939
|
|
386,836
|
|
536,411
|
|
|||||
|
Total additions during period
|
553,768
|
|
847,793
|
|
675,534
|
|
|||||
|
Deductions during period:
|
|||||||||||
|
Cost of real estate sold
|
(191,610
|
)
|
(68,200
|
)
|
(231,984
|
)
|
|||||
|
Properties held for sale
|
—
|
|
(13,193
|
)
|
(160,074
|
)
|
|||||
|
Other
|
(5,135
|
)
|
(33,792
|
)
|
(13,262
|
)
|
|||||
|
Total deductions during period
|
(196,745
|
)
|
(115,185
|
)
|
(405,320
|
)
|
|||||
|
Total real estate held for investment, end of year
|
$
|
7,417,777
|
|
$
|
7,060,754
|
|
$
|
6,328,146
|
|
||
The following table reconciles the accumulated depreciation from January 1,
2015
to
December 31, 2017
:
|
|
Year Ended December 31,
|
||||||||||
|
|
2017
|
2016
|
2015
|
||||||||
|
|
(in thousands)
|
||||||||||
|
Accumulated depreciation, beginning of year
|
$
|
1,139,853
|
|
$
|
994,241
|
|
$
|
947,664
|
|
||
|
Additions during period:
|
|
||||||||||
|
Depreciation of real estate
|
190,515
|
|
171,983
|
|
159,524
|
|
|||||
|
Total additions during period
|
190,515
|
|
171,983
|
|
159,524
|
|
|||||
|
Deductions during period:
|
|||||||||||
|
Write-offs due to sale
|
(66,206
|
)
|
(22,471
|
)
|
(66,603
|
)
|
|||||
|
Properties held for sale
|
—
|
|
(3,900
|
)
|
(46,191
|
)
|
|||||
|
Other
|
—
|
|
—
|
|
(153
|
)
|
|||||
|
Total deductions during period
|
(66,206
|
)
|
(26,371
|
)
|
(112,947
|
)
|
|||||
|
Accumulated depreciation, end of year
|
$
|
1,264,162
|
|
$
|
1,139,853
|
|
$
|
994,241
|
|
||
F - 68
EXHIBIT INDEX
|
Exhibit
Number
|
Description
|
|
|
3.(i)1
|
||
|
3.(i)2
|
||
|
3.(i)3
|
||
|
3.(i)4
|
||
|
3.(i)5
|
||
|
3.(ii)1
|
||
|
3.(ii)2
|
||
|
4.1
|
||
|
4.2
|
||
|
4.3
|
||
|
4.4
|
||
|
4.5
|
||
|
4.6
|
||
|
4.7
|
||
|
4.8
|
||
|
Exhibit
Number
|
Description
|
|
|
4.9
|
||
|
4.10
|
||
|
4.11
|
||
|
4.12
|
The Company is party to agreements in connection with long-term debt obligations, none of which individually exceeds ten percent of the total assets of the Company on a consolidated basis. Pursuant to Item 601(b)(4)(iii)(A) of Regulation S-K, the Company agrees to furnish copies of these agreements to the Commission upon request
|
|
|
10.1
|
||
|
10.2†
|
||
|
10.3
|
||
|
10.4†
|
||
|
10.5†
|
||
|
10.6†
|
||
|
10.7†
|
||
|
10.8†
|
||
|
10.9†
|
||
|
10.10†
|
||
|
10.11†
|
||
|
Exhibit
Number
|
Description
|
|
|
10.12†
|
||
|
10.13†
|
||
|
10.14†
|
||
|
10.15†
|
||
|
10.16†
|
||
|
10.17
|
||
|
10.18
|
||
|
10.19
|
||
|
10.20
|
||
|
10.21
|
||
|
10.22
|
||
|
10.23†
|
||
|
10.24†
|
||
|
10.25†
|
||
|
10.26†
|
||
|
10.27†
|
||
|
10.28†
|
||
|
10.29†
|
||
|
Exhibit
Number
|
Description
|
|
|
10.30†
|
||
|
10.31
|
||
|
10.32
|
||
|
10.33
|
||
|
10.34
|
||
|
10.35
|
||
|
10.36
|
||
|
10.37
|
||
|
10.38
|
||
|
10.39*
|
||
|
10.40*
|
||
|
10.41*
|
||
|
10.42*
|
||
|
10.43*
|
||
|
10.44*
|
||
|
10.45†
|
||
|
10.46
|
||
|
10.47†
|
||
|
10.48
|
||
|
10.49
|
||
|
Exhibit
Number
|
Description
|
|
|
12.1*
|
||
|
12.2*
|
||
|
21.1*
|
||
|
21.2*
|
||
|
23.1*
|
||
|
23.2*
|
||
|
24.1*
|
||
|
31.1*
|
||
|
31.2*
|
||
|
31.3*
|
||
|
31.4*
|
||
|
32.1*
|
||
|
32.2*
|
||
|
32.3*
|
||
|
32.4*
|
||
|
101.1
|
The following Kilroy Realty Corporation and Kilroy Realty, L.P. financial information for the year ended December 31, 2017, formatted in XBRL (eXtensible Business Reporting Language): (i) Consolidated Balance Sheets, (ii) Consolidated Statements of Income, (iii) Consolidated Statements of Changes in Equity, (iv) Consolidated Statements of Capital, (v) Consolidated Statements of Cash Flows and (vi) Notes to the Consolidated Financial Statements.
(1)
|
|
|
*
|
Filed herewith
|
|
†
|
Management contract or compensatory plan or arrangement.
|
|
(1)
|
Pursuant to Rule 406T of Regulation S-T, these interactive data files are deemed not filed or part of a registration statement or prospectus for purposes of Sections 11 or 12 of the Securities Act of 1933 or Section 18 of the Securities Exchange Act of 1934 and otherwise are not subject to liability under these sections.
|
TABLE OF CONTENTS
Part IItem 1. BusinessItem 1A. Risk FactorsItem 1B. Unresolved Staff CommentsItem 2. PropertiesItem 3. Legal ProceedingsItem 4. Mine Safety DisclosuresPart IIItem 6. Selected Financial Data Kilroy Realty CorporationItem 7. Management S Discussion and Analysis Of Financial Condition and Results Of OperationsItem 7A. Quantitative and Qualitative Disclosures About Market RiskItem 8. Financial Statements and Supplementary DataItem 9. Changes in and Disagreements with Accountants on Accounting and Financial DisclosureItem 9A. Controls and ProceduresItem 9B. Other InformationPart IIIItem 10. Directors, Executive Officers and Corporate GovernanceItem 11. Executive CompensationItem 12. Security Ownership Of Certain Beneficial Owners and Management and Related Stockholder MattersItem 13. Certain Relationships and Related Transactions, and Director IndependenceItem 14. Principal Accountant Fees and ServicesPart IVItem 15. Exhibits and Financial Statement Schedules