|
|
|
|
|
|
|
|
|
|
|
|
|
|
|
|
|
|
|
|
|
|
|
|
|
|
|
|
|
|
|
|
|
|
|
Table of Contents
Washington, D.C. 20549
|
þ
|
QUARTERLY REPORT PURSUANT TO SECTION 13 OR 15(d)
OF THE SECURITIES EXCHANGE ACT OF 1934 |
|
| For the quarterly period ended March 31, 2010 | ||
|
or
|
||
|
o
|
TRANSITION REPORT PURSUANT TO SECTION 13 OR 15(d) OF THE SECURITIES EXCHANGE ACT OF 1934 | |
| For the transition period from to | ||
|
Delaware
(State or other jurisdiction of incorporation or organization) 427 West 12th Street, Kansas City, Missouri (Address of principal executive offices) |

|
44-0663509
(I.R.S. Employer Identification No.) 64105 (Zip Code) |
| Large accelerated filer þ | Accelerated filer o | Non-accelerated filer o | Smaller reporting company o |
|
Class
|
Outstanding at April 20, 2010
|
|
|
Common Stock, $0.01 per share par value
|
96,712,467 Shares |
Form 10-Q
March 31, 2010
Index
2
Table of Contents
| Item 1. | Financial Statements |
3
Table of Contents
| Three Months Ended March 31, | ||||||||
| 2010 | 2009 | |||||||
| (In millions, except share and per share amounts) | ||||||||
| (Unaudited) | ||||||||
|
Revenues
|
$ | 436.3 | $ | 346.0 | ||||
|
Operating expenses:
|
||||||||
|
Compensation and benefits
|
90.7 | 78.0 | ||||||
|
Purchased services
|
44.9 | 45.6 | ||||||
|
Fuel
|
60.8 | 43.3 | ||||||
|
Equipment costs
|
38.7 | 39.1 | ||||||
|
Depreciation and amortization
|
45.8 | 46.9 | ||||||
|
Casualties and insurance
|
11.9 | 12.5 | ||||||
|
Materials and other
|
35.3 | 33.0 | ||||||
|
Total operating expenses
|
328.1 | 298.4 | ||||||
|
Operating income
|
108.2 | 47.6 | ||||||
|
Equity in net earnings of unconsolidated affiliates
|
6.4 | 1.0 | ||||||
|
Interest expense
|
(44.4 | ) | (41.8 | ) | ||||
|
Debt retirement costs
|
(14.9 | ) | (5.9 | ) | ||||
|
Foreign exchange gain (loss)
|
2.6 | (5.1 | ) | |||||
|
Other income, net
|
0.5 | 1.5 | ||||||
|
Income (loss) before income taxes and noncontrolling interest
|
58.4 | (2.7 | ) | |||||
|
Income tax expense
|
24.2 | 0.1 | ||||||
|
Net income (loss)
|
34.2 | (2.8 | ) | |||||
|
Noncontrolling interest
|
(1.1 | ) | (0.1 | ) | ||||
|
Net income (loss) attributable to Kansas City Southern and
subsidiaries
|
35.3 | (2.7 | ) | |||||
|
Preferred stock dividends
|
2.7 | 5.4 | ||||||
|
Net income (loss) available to common shareholders
|
$ | 32.6 | $ | (8.1 | ) | |||
|
Earnings (loss) per share:
|
||||||||
|
Basic earnings (loss) per share
|
$ | 0.34 | $ | (0.09 | ) | |||
|
Diluted earnings (loss) per share
|
$ | 0.34 | $ | (0.09 | ) | |||
|
Average shares outstanding
(in thousands):
|
||||||||
|
Basic
|
95,890 | 90,743 | ||||||
|
Potentially dilutive common shares
|
568 | — | ||||||
|
Diluted
|
96,458 | 90,743 | ||||||
4
Table of Contents
|
March 31,
|
December 31,
|
|||||||
| 2010 | 2009 | |||||||
|
(In millions, except
|
||||||||
| share amounts) | ||||||||
| (Unaudited) | ||||||||
|
ASSETS
|
||||||||
|
Current assets:
|
||||||||
|
Cash and cash equivalents
|
$ | 126.1 | $ | 117.5 | ||||
|
Accounts receivable, net
|
169.0 | 139.4 | ||||||
|
Restricted funds
|
34.0 | 35.8 | ||||||
|
Materials and supplies
|
107.6 | 106.4 | ||||||
|
Deferred income taxes
|
163.6 | 151.7 | ||||||
|
Other current assets
|
61.5 | 63.0 | ||||||
|
Total current assets
|
661.8 | 613.8 | ||||||
|
Investments
|
53.5 | 46.8 | ||||||
|
Property and equipment (including concession assets), net
|
4,757.9 | 4,722.4 | ||||||
|
Other assets
|
75.9 | 71.3 | ||||||
|
Total assets
|
$ | 5,549.1 | $ | 5,454.3 | ||||
| LIABILITIES AND EQUITY | ||||||||
|
Current liabilities:
|
||||||||
|
Debt due within one year
|
$ | 64.4 | $ | 68.1 | ||||
|
Accounts payable and accrued liabilities
|
381.9 | 342.7 | ||||||
|
Total current liabilities
|
446.3 | 410.8 | ||||||
|
Long-term debt
|
1,906.9 | 1,911.9 | ||||||
|
Deferred income taxes
|
583.1 | 558.6 | ||||||
|
Other noncurrent liabilities and deferred credits
|
249.1 | 247.2 | ||||||
|
Total liabilities
|
3,185.4 | 3,128.5 | ||||||
|
Commitments and contingencies
|
— | — | ||||||
|
Stockholders’ equity:
|
||||||||
|
$25 par, 4% noncumulative, preferred stock,
840,000 shares authorized, 649,736 shares issued,
242,170 shares outstanding
|
6.1 | 6.1 | ||||||
|
Series D — cumulative convertible perpetual
preferred stock, $1 par, 5.125%, 210,000 shares
authorized and issued, 209,995 shares outstanding with a
liquidation preference of $1,000 per share
|
0.2 | 0.2 | ||||||
|
$.01 par, common stock, 400,000,000 shares authorized;
110,583,068 shares issued; 96,718,921 and
96,213,346 shares outstanding at March 31, 2010 and
December 31, 2009, respectively
|
1.0 | 0.9 | ||||||
|
Paid-in capital
|
666.9 | 661.4 | ||||||
|
Retained earnings
|
1,411.3 | 1,378.8 | ||||||
|
Accumulated other comprehensive loss
|
(3.5 | ) | (4.4 | ) | ||||
|
Total stockholders’ equity
|
2,082.0 | 2,043.0 | ||||||
|
Noncontrolling interest
|
281.7 | 282.8 | ||||||
|
Total equity
|
2,363.7 | 2,325.8 | ||||||
|
Total liabilities and equity
|
$ | 5,549.1 | $ | 5,454.3 | ||||
5
Table of Contents
|
Three Months Ended
|
||||||||
| March 31, | ||||||||
| 2010 | 2009 | |||||||
| (In millions) | ||||||||
| (Unaudited) | ||||||||
|
Operating activities:
|
||||||||
|
Net income (loss)
|
$ | 34.2 | $ | (2.8 | ) | |||
|
Adjustments to reconcile net income (loss) to net cash provided
by operating activities:
|
||||||||
|
Depreciation and amortization
|
45.8 | 46.9 | ||||||
|
Deferred income taxes
|
23.7 | (0.7 | ) | |||||
|
Equity in undistributed earnings of unconsolidated affiliates
|
(6.4 | ) | (1.0 | ) | ||||
|
Share-based compensation
|
3.2 | 2.1 | ||||||
|
Excess tax benefit from share-based compensation
|
(11.7 | ) | — | |||||
|
Other deferred compensation
|
1.5 | (1.6 | ) | |||||
|
Gain on sale of assets
|
— | (1.0 | ) | |||||
|
Debt retirement costs
|
14.9 | 5.9 | ||||||
|
Changes in working capital items:
|
||||||||
|
Accounts receivable
|
(29.5 | ) | 3.5 | |||||
|
Materials and supplies
|
(0.9 | ) | 1.2 | |||||
|
Other current assets
|
0.9 | 2.7 | ||||||
|
Accounts payable and accrued liabilities
|
29.8 | 21.2 | ||||||
|
Other, net
|
6.0 | 2.9 | ||||||
|
Net cash provided by operating activities
|
111.5 | 79.3 | ||||||
|
Investing activities:
|
||||||||
|
Capital expenditures
|
(52.3 | ) | (115.4 | ) | ||||
|
Acquisition of an intermodal facility, net of cash acquired
|
(25.0 | ) | — | |||||
|
Property investments in MSLLC
|
(4.8 | ) | (17.8 | ) | ||||
|
Proceeds from disposal of property
|
1.3 | 3.7 | ||||||
|
Other, net
|
(1.0 | ) | (1.5 | ) | ||||
|
Net cash used for investing activities
|
(81.8 | ) | (131.0 | ) | ||||
|
Financing activities:
|
||||||||
|
Proceeds from issuance of long-term debt
|
295.7 | 214.0 | ||||||
|
Repayment of long-term debt
|
(305.7 | ) | (238.7 | ) | ||||
|
Debt costs
|
(20.6 | ) | (9.3 | ) | ||||
|
Proceeds from employee stock plans
|
0.5 | 0.3 | ||||||
|
Excess tax benefit from share-based compensation
|
11.7 | — | ||||||
|
Preferred stock dividends paid
|
(2.7 | ) | (2.8 | ) | ||||
|
Net cash used for financing activities
|
(21.1 | ) | (36.5 | ) | ||||
|
Cash and cash equivalents:
|
||||||||
|
Net increase (decrease) during each period
|
8.6 | (88.2 | ) | |||||
|
At beginning of year
|
117.5 | 229.9 | ||||||
|
At end of period
|
$ | 126.1 | $ | 141.7 | ||||
6
Table of Contents
| 1. | Accounting Policies, Interim Financial Statements and Basis of Presentation |
| Three Months Ended March 31, 2009 | ||||||||||||
| As reported | As adjusted | Change | ||||||||||
|
Purchased services
|
$ | 44.5 | $ | 45.6 | $ | 1.1 | ||||||
|
Depreciation and amortization
|
47.1 | 46.9 | (0.2 | ) | ||||||||
|
Loss before income taxes and noncontrolling interest
|
(1.8 | ) | (2.7 | ) | (0.9 | ) | ||||||
|
Income tax expense
|
0.4 | 0.1 | (0.3 | ) | ||||||||
|
Net loss
|
(2.2 | ) | (2.8 | ) | (0.6 | ) | ||||||
|
Diluted loss per share
|
$ | (0.08 | ) | $ | (0.09 | ) | $ | (0.01 | ) | |||
7
Table of Contents
| December 31, 2009 | ||||||||||||
| As reported | As adjusted | Change | ||||||||||
|
Property and equipment (including concession assets), net
|
$ | 4,747.2 | $ | 4,722.4 | $ | (24.8 | ) | |||||
|
Deferred income tax liabilities
|
567.1 | 558.6 | (8.5 | ) | ||||||||
|
Other noncurrent liabilities and deferred credits
|
247.7 | 247.2 | (0.5 | ) | ||||||||
|
Retained earnings
|
1,394.6 | 1,378.8 | (15.8 | ) | ||||||||
|
Total equity
|
2,341.6 | 2,325.8 | (15.8 | ) | ||||||||
| Three Months Ended March 31, 2009 | ||||||||||||
| As reported | As adjusted | Change | ||||||||||
|
Net cash provided by operating activities
|
$ | 63.8 | $ | 79.3 | $ | 15.5 | ||||||
|
Net cash used for investing activities
|
(115.5 | ) | (131.0 | ) | (15.5 | ) | ||||||
| 2. | Accounting Pronouncements |
| 3. | Earnings (Loss) Per Share Data |
8
Table of Contents
|
Three Months
|
||||||||
| Ended March 31, | ||||||||
| 2010 | 2009 | |||||||
|
Basic shares
|
95,890 | 90,743 | ||||||
|
Effect of dilution
|
568 | — | ||||||
|
Diluted shares
|
96,458 | 90,743 | ||||||
| 4. | Property and Equipment (including Concession Assets) |
|
March 31,
|
December 31,
|
|||||||
| 2010 | 2009 | |||||||
|
Land
|
$ | 176.3 | $ | 162.9 | ||||
|
Concession land rights
|
137.6 | 137.6 | ||||||
|
Road property
|
4,719.9 | 4,644.4 | ||||||
|
Equipment
|
691.0 | 679.3 | ||||||
|
Technology and other
|
127.0 | 125.3 | ||||||
|
Construction in progress
|
120.5 | 165.6 | ||||||
|
Total property
|
5,972.3 | 5,915.1 | ||||||
|
Accumulated depreciation and amortization
|
1,214.4 | 1,192.7 | ||||||
|
Net property
|
$ | 4,757.9 | $ | 4,722.4 | ||||
| 5. | Fair Value Measurements |
9
Table of Contents
| Fair Value Measurements |
Net Assets (Liabilities)
|
|||||||||||||||
| Level 1 | Level 2 | Level 3 | at Fair Value | |||||||||||||
|
March 31, 2010
|
||||||||||||||||
|
Interest rate contracts
|
$ | — | $ | (3.9 | ) | $ | — | $ | (3.9 | ) | ||||||
|
Fuel swap contracts
|
— | 0.6 | — | 0.6 | ||||||||||||
|
Net assets (liabilities), at fair value
|
$ | — | $ | (3.3 | ) | $ | — | $ | (3.3 | ) | ||||||
| Fair Value Measurements |
Net Assets (Liabilities)
|
|||||||||||||||
| Level 1 | Level 2 | Level 3 | at Fair Value | |||||||||||||
|
December 31, 2009
|
||||||||||||||||
|
Interest rate contracts
|
$ | — | $ | (4.9 | ) | $ | — | $ | (4.9 | ) | ||||||
|
Net assets (liabilities), at fair value
|
$ | — | $ | (4.9 | ) | $ | — | $ | (4.9 | ) | ||||||
| 6. | Derivative Instruments |
10
Table of Contents
| Asset Derivatives | ||||||||||
|
Balance Sheet
|
March 31,
|
December 31,
|
||||||||
| Location | 2010 | 2009 | ||||||||
|
Derivatives not designated as hedging instruments:
|
||||||||||
|
Fuel swap contracts
|
Other current assets | 0.8 | — | |||||||
|
Total derivatives not designated as hedging instruments
|
0.8 | — | ||||||||
|
Total asset derivatives
|
$ | 0.8 | $ | — | ||||||
11
Table of Contents
| Liability Derivatives | ||||||||||
|
Balance Sheet
|
March 31,
|
December 31,
|
||||||||
| Location | 2010 | 2009 | ||||||||
|
Derivatives designated as hedging instruments:
|
||||||||||
|
Interest rate contracts
|
Accounts payable & accrued liabilities | $ | 3.9 | $ | 3.2 | |||||
|
Interest rate contracts
|
Other non-current liabilities & deferred credits | — | 1.7 | |||||||
|
Total derivatives designated as hedging instruments
|
3.9 | 4.9 | ||||||||
|
Derivatives not designated as hedging instruments:
|
||||||||||
|
Fuel swap contracts
|
Accounts payable & accrued liabilities | 0.2 | — | |||||||
|
Total derivatives not designated as hedging instruments
|
0.2 | — | ||||||||
|
Total liability derivatives
|
$ | 4.1 | $ | 4.9 | ||||||
|
Location of
|
Amount of
|
|||||||||||||||||||||||||||
|
Gain/(Loss)
|
Gain/(Loss)
|
|||||||||||||||||||||||||||
|
Amount of
|
Recognized in
|
Recognized in
|
||||||||||||||||||||||||||
|
Amount of
|
Gain/(Loss)
|
Income on Derivative
|
Income on Derivative
|
|||||||||||||||||||||||||
|
Gain/(Loss)
|
Location of Gain/(Loss)
|
Reclassified from
|
(Ineffective Portion
|
(Ineffective Portion
|
||||||||||||||||||||||||
|
Derivatives in Cash
|
Recognized in
|
Reclassified from
|
Accumulated OCI
|
and Amount Excluded
|
and Amount Excluded
|
|||||||||||||||||||||||
|
Flow Hedging
|
OCI on Derivative
|
Accumulated OCI into Income
|
into Income
|
from Effectiveness
|
from Effectiveness
|
|||||||||||||||||||||||
| Relationships | (Effective Portion) | (Effective Portion) | (Effective Portion) | Testing) | Testing) | |||||||||||||||||||||||
| 2010 | 2009 | 2010 | 2009 | 2010 | 2009 | |||||||||||||||||||||||
|
Interest rate contracts
|
$ | (0.6 | ) | $ | (0.7 | ) | Interest expense | $ | (1.5 | ) | $ | (0.7 | ) | Interest expense | $ | — | $ | — | ||||||||||
|
Fuel swap contracts
|
— | (1.6 | ) | Fuel expense | — | (0.2 | ) | Fuel Expense | — | (2.0 | ) | |||||||||||||||||
|
Total
|
$ | (0.6 | ) | $ | (2.3 | ) | $ | (1.5 | ) | $ | (0.9 | ) | $ | — | $ | (2.0 | ) | |||||||||||
|
Amount of
|
||||||||||||||||||||||||||||
|
Gain/(Loss)
|
||||||||||||||||||||||||||||
|
Location of Gain/(Loss)
|
Recognized in
|
|||||||||||||||||||||||||||
|
Recognized in Income on
|
Income on
|
|||||||||||||||||||||||||||
| Derivatives not designated as hedging instruments | Derivative | Derivative | ||||||||||||||||||||||||||
| 2010 | 2009 | |||||||||||||||||||||||||||
|
Fuel swap contracts
|
Fuel expense | $ | 0.3 | $ | — | |||||||||||||||||||||||
|
Total
|
$ | 0.3 | $ | — | ||||||||||||||||||||||||
| 7. | Acquisition |
12
Table of Contents
| 8. |
|
13
Table of Contents
| 9. | Equity |
| Three Months Ended March 31, 2010 | Three Months Ended March 31, 2009 | |||||||||||||||||||||||
|
Kansas City
|
Kansas City
|
|||||||||||||||||||||||
|
Southern
|
Southern
|
|||||||||||||||||||||||
|
Stockholders’
|
Noncontrolling
|
Stockholders’
|
Noncontrolling
|
|||||||||||||||||||||
| Equity | interest | Total Equity | Equity | interest | Total Equity | |||||||||||||||||||
|
Beginning Balance
|
$ | 2,043.0 | $ | 282.8 | $ | 2,325.8 | $ | 1,896.6 | $ | 273.7 | $ | 2,170.3 | ||||||||||||
|
Comprehensive income (loss):
|
||||||||||||||||||||||||
|
Net income (loss)
|
35.3 | (1.1 | ) | 34.2 | (2.7 | ) | (0.1 | ) | (2.8 | ) | ||||||||||||||
|
Unrealized gain (loss) on cash flow hedges, net of tax of
$(0.2) million and $(0.9) million
|
(0.4 | ) | — | (0.4 | ) | (1.4 | ) | — | (1.4 | ) | ||||||||||||||
|
Reclassification adjustment from cash flow hedges included in
net income, net of tax of $0.6 million and $0.5 million
|
0.9 | — | 0.9 | 0.4 | — | 0.4 | ||||||||||||||||||
|
Cumulative translation adjustment — FTVM, net of tax
of $0.1 million and $(0.4) million
|
0.4 | — | 0.4 | 0.1 | — | 0.1 | ||||||||||||||||||
|
Comprehensive income (loss)
|
36.2 | (1.1 | ) | 35.1 | (3.6 | ) | (0.1 | ) | (3.7 | ) | ||||||||||||||
|
Dividends on $25 par preferred stock
|
(0.1 | ) | — | (0.1 | ) | (0.1 | ) | — | (0.1 | ) | ||||||||||||||
|
Dividends on series D cumulative preferred stock
|
(2.6 | ) | — | (2.6 | ) | (5.3 | ) | — | (5.3 | ) | ||||||||||||||
|
Options exercised and stock subscribed, net of shares withheld
for employee taxes
|
(9.4 | ) | — | (9.4 | ) | 1.2 | — | 1.2 | ||||||||||||||||
|
Tax benefit from share-based compensation
|
11.7 | — | 11.7 | |||||||||||||||||||||
|
Share-based compensation
|
3.2 | — | 3.2 | 2.1 | — | 2.1 | ||||||||||||||||||
|
Ending Balance
|
$ | 2,082.0 | $ | 281.7 | $ | 2,363.7 | $ | 1,890.9 | $ | 273.6 | $ | 2,164.5 | ||||||||||||
| 10. | Share-Based Compensation |
14
Table of Contents
| 11. | Commitments and Contingencies |
15
Table of Contents
|
Three Months
|
||||||||
| Ended March 31, | ||||||||
| 2010 | 2009 | |||||||
|
Balance at beginning of year
|
$ | 86.9 | $ | 90.7 | ||||
|
Accruals, net (includes the impact of actuarial studies)
|
5.1 | 5.2 | ||||||
|
Payments
|
(5.2 | ) | (6.5 | ) | ||||
|
Balance at end of period
|
$ | 86.8 | $ | 89.4 | ||||
16
Table of Contents
17
Table of Contents
18
Table of Contents
19
Table of Contents
| 12. | Geographic Information |
|
Three Months
|
||||||||
| Ended March 31, | ||||||||
|
Revenues
|
2010 | 2009 | ||||||
|
U.S.
|
$ | 245.5 | $ | 208.7 | ||||
|
Mexico
|
190.8 | 137.3 | ||||||
|
Total revenues
|
$ | 436.3 | $ | 346.0 | ||||
|
Property and equipment
|
March 31,
|
December 31,
|
||||||
|
(including concession assets), net
|
2010 | 2009 | ||||||
|
U.S.
|
$ | 2,497.2 | $ | 2,482.7 | ||||
|
Mexico
|
2,260.7 | 2,239.7 | ||||||
|
Total property and equipment (including concession assets), net
|
$ | 4,757.9 | $ | 4,722.4 | ||||
| 13. | Condensed Consolidating Financial Information |
20
Table of Contents
| Three Months Ended March 31, 2010 | ||||||||||||||||||||||||
|
Guarantor
|
Non-Guarantor
|
Consolidating
|
Consolidated
|
|||||||||||||||||||||
| Parent | KCSR | Subsidiaries | Subsidiaries | Adjustments | KCS | |||||||||||||||||||
|
Revenues
|
$ | — | $ | 217.0 | $ | 4.0 | $ | 221.9 | $ | (6.6 | ) | $ | 436.3 | |||||||||||
|
Operating expenses
|
1.1 | 163.1 | 6.7 | 164.4 | (7.2 | ) | 328.1 | |||||||||||||||||
|
Operating income (loss)
|
(1.1 | ) | 53.9 | (2.7 | ) | 57.5 | 0.6 | 108.2 | ||||||||||||||||
|
Equity in net earnings of unconsolidated affiliates
|
31.8 | 3.4 | — | 9.3 | (38.1 | ) | 6.4 | |||||||||||||||||
|
Interest expense
|
(0.1 | ) | (27.4 | ) | — | (28.0 | ) | 11.1 | (44.4 | ) | ||||||||||||||
|
Debt retirement costs
|
— | — | — | (14.9 | ) | — | (14.9 | ) | ||||||||||||||||
|
Foreign exchange gain
|
— | — | — | 2.6 | — | 2.6 | ||||||||||||||||||
|
Other income, net
|
10.3 | 1.0 | — | 0.9 | (11.7 | ) | 0.5 | |||||||||||||||||
|
Income (loss) before income taxes and noncontrolling interest
|
40.9 | 30.9 | (2.7 | ) | 27.4 | (38.1 | ) | 58.4 | ||||||||||||||||
|
Income tax expense (benefit)
|
5.6 | 12.2 | (1.0 | ) | 7.4 | — | 24.2 | |||||||||||||||||
|
Net income (loss)
|
35.3 | 18.7 | (1.7 | ) | 20.0 | (38.1 | ) | 34.2 | ||||||||||||||||
|
Noncontrolling interest
|
— | — | — | (1.1 | ) | — | (1.1 | ) | ||||||||||||||||
|
Net income (loss) attributable to Kansas City Southern and
subsidiaries
|
$ | 35.3 | $ | 18.7 | $ | (1.7 | ) | $ | 21.1 | $ | (38.1 | ) | $ | 35.3 | ||||||||||
21
Table of Contents
| Three Months Ended March 31, 2009 | ||||||||||||||||||||||||
|
Guarantor
|
Non-Guarantor
|
Consolidating
|
Consolidated
|
|||||||||||||||||||||
| Parent | KCSR | Subsidiaries | Subsidiaries | Adjustments | KCS | |||||||||||||||||||
|
Revenues
|
$ | — | $ | 183.9 | $ | 2.9 | $ | 166.2 | $ | (7.0 | ) | $ | 346.0 | |||||||||||
|
Operating expenses
|
1.3 | 153.2 | 3.8 | 147.7 | (7.6 | ) | 298.4 | |||||||||||||||||
|
Operating income (loss)
|
(1.3 | ) | 30.7 | (0.9 | ) | 18.5 | 0.6 | 47.6 | ||||||||||||||||
|
Equity in net earnings of unconsolidated affiliates
|
5.2 | 0.5 | — | 1.0 | (5.7 | ) | 1.0 | |||||||||||||||||
|
Interest expense
|
(0.7 | ) | (18.6 | ) | — | (23.0 | ) | 0.5 | (41.8 | ) | ||||||||||||||
|
Debt retirement costs
|
— | (5.3 | ) | — | (0.6 | ) | — | (5.9 | ) | |||||||||||||||
|
Foreign exchange loss
|
— | — | — | (5.1 | ) | — | (5.1 | ) | ||||||||||||||||
|
Other income, net
|
0.3 | 1.1 | — | 1.2 | (1.1 | ) | 1.5 | |||||||||||||||||
|
Income (loss) before income taxes and noncontrolling interest
|
3.5 | 8.4 | (0.9 | ) | (8.0 | ) | (5.7 | ) | (2.7 | ) | ||||||||||||||
|
Income tax expense (benefit)
|
6.2 | 4.1 | (0.3 | ) | (9.9 | ) | — | 0.1 | ||||||||||||||||
|
Net income (loss)
|
(2.7 | ) | 4.3 | (0.6 | ) | 1.9 | (5.7 | ) | (2.8 | ) | ||||||||||||||
|
Noncontrolling interest
|
— | — | — | (0.1 | ) | — | (0.1 | ) | ||||||||||||||||
|
Net income (loss) attributable to Kansas City Southern and
subsidiaries
|
$ | (2.7 | ) | $ | 4.3 | $ | (0.6 | ) | $ | 2.0 | $ | (5.7 | ) | $ | (2.7 | ) | ||||||||
| March 31, 2010 | ||||||||||||||||||||||||
|
Guarantor
|
Non-Guarantor
|
Consolidating
|
Consolidated
|
|||||||||||||||||||||
| Parent | KCSR | Subsidiaries | Subsidiaries | Adjustments | KCS | |||||||||||||||||||
|
Assets:
|
||||||||||||||||||||||||
|
Current assets
|
$ | 2.1 | $ | 225.5 | $ | 5.0 | $ | 459.6 | $ | (30.4 | ) | $ | 661.8 | |||||||||||
|
Investments held for operating
|
||||||||||||||||||||||||
|
purposes and affiliate investment
|
1,593.3 | 34.8 | 1.9 | 1,616.2 | (3,192.7 | ) | 53.5 | |||||||||||||||||
|
Property and equipment (including concession assets), net
|
— | 1,733.6 | 210.5 | 2,813.8 | — | 4,757.9 | ||||||||||||||||||
|
Other assets
|
1.2 | 41.9 | — | 65.0 | (32.2 | ) | 75.9 | |||||||||||||||||
|
Total assets
|
$ | 1,596.6 | $ | 2,035.8 | $ | 217.4 | $ | 4,954.6 | $ | (3,255.3 | ) | $ | 5,549.1 | |||||||||||
|
Liabilities and equity:
|
||||||||||||||||||||||||
|
Current liabilities
|
$ | (467.1 | ) | $ | 590.7 | $ | 126.4 | $ | 225.6 | $ | (29.3 | ) | $ | 446.3 | ||||||||||
|
Long-term debt
|
0.2 | 763.6 | 0.4 | 1,142.7 | — | 1,906.9 | ||||||||||||||||||
|
Deferred income taxes
|
(22.7 | ) | 430.1 | 78.6 | 97.1 | — | 583.1 | |||||||||||||||||
|
Other liabilities
|
4.2 | 142.1 | 3.2 | 133.0 | (33.4 | ) | 249.1 | |||||||||||||||||
|
Stockholders’ equity
|
2,082.0 | 77.9 | 8.8 | 3,074.5 | (3,161.2 | ) | 2,082.0 | |||||||||||||||||
|
Noncontrolling interest
|
— | 31.4 | — | 281.7 | (31.4 | ) | 281.7 | |||||||||||||||||
|
Total liabilities and equity
|
$ | 1,596.6 | $ | 2,035.8 | $ | 217.4 | $ | 4,954.6 | $ | (3,255.3 | ) | $ | 5,549.1 | |||||||||||
22
Table of Contents
| December 31, 2009 | ||||||||||||||||||||||||
|
Guarantor
|
Non-Guarantor
|
Consolidating
|
Consolidated
|
|||||||||||||||||||||
| Parent | KCSR | Subsidiaries | Subsidiaries | Adjustments | KCS | |||||||||||||||||||
|
Assets:
|
||||||||||||||||||||||||
|
Current assets
|
$ | 0.5 | $ | 219.1 | $ | 3.4 | $ | 428.8 | $ | (38.0 | ) | $ | 613.8 | |||||||||||
|
Investments held for operating
|
||||||||||||||||||||||||
|
purposes and affiliate investment
|
1,562.0 | 31.7 | 1.9 | 1,616.0 | (3,164.8 | ) | 46.8 | |||||||||||||||||
|
Property and equipment (including concession assets), net
|
— | 1,717.5 | 212.1 | 2,792.8 | — | 4,722.4 | ||||||||||||||||||
|
Other assets
|
1.3 | 42.0 | — | 90.9 | (62.9 | ) | 71.3 | |||||||||||||||||
|
Total assets
|
$ | 1,563.8 | $ | 2,010.3 | $ | 217.4 | $ | 4,928.5 | $ | (3,265.7 | ) | $ | 5,454.3 | |||||||||||
|
Liabilities and equity:
|
||||||||||||||||||||||||
|
Current liabilities
|
$ | (455.7 | ) | $ | 567.6 | $ | 124.0 | $ | 211.7 | $ | (36.8 | ) | $ | 410.8 | ||||||||||
|
Long-term debt
|
0.2 | 793.8 | 0.4 | 1,147.5 | (30.0 | ) | 1,911.9 | |||||||||||||||||
|
Deferred income taxes
|
(27.8 | ) | 416.8 | 79.5 | 90.1 | — | 558.6 | |||||||||||||||||
|
Other liabilities
|
4.1 | 142.0 | 3.0 | 132.2 | (34.1 | ) | 247.2 | |||||||||||||||||
|
Stockholders’ equity
|
2,043.0 | 58.7 | 10.5 | 3,064.2 | (3,133.4 | ) | 2,043.0 | |||||||||||||||||
|
Noncontrolling interest
|
— | 31.4 | — | 282.8 | (31.4 | ) | 282.8 | |||||||||||||||||
|
Total liabilities and equity
|
$ | 1,563.8 | $ | 2,010.3 | $ | 217.4 | $ | 4,928.5 | $ | (3,265.7 | ) | $ | 5,454.3 | |||||||||||
23
Table of Contents
| Three Months Ended March 31, 2010 | ||||||||||||||||||||||||
|
Guarantor
|
Non-Guarantor
|
Consolidating
|
Consolidated
|
|||||||||||||||||||||
| Parent | KCSR | Subsidiaries | Subsidiaries | Adjustments | KCS | |||||||||||||||||||
|
Operating activities:
|
||||||||||||||||||||||||
|
Excluding intercompany activity
|
$ | 0.8 | $ | 56.8 | $ | (2.0 | ) | $ | 55.9 | $ | — | $ | 111.5 | |||||||||||
|
Intercompany activity
|
(10.0 | ) | 3.4 | 2.6 | 4.0 | — | — | |||||||||||||||||
|
Net cash provided (used)
|
(9.2 | ) | 60.2 | 0.6 | 59.9 | — | 111.5 | |||||||||||||||||
|
Investing activities:
|
||||||||||||||||||||||||
|
Capital expenditures
|
— | (27.9 | ) | (0.7 | ) | (23.7 | ) | — | (52.3 | ) | ||||||||||||||
|
Acquisition of an intermodal facility, net of cash acquired
|
— | — | — | (25.0 | ) | — | (25.0 | ) | ||||||||||||||||
|
Property investments in MSLLC
|
— | — | — | (4.8 | ) | — | (4.8 | ) | ||||||||||||||||
|
Other investing activities
|
— | (4.9 | ) | — | 35.2 | (30.0 | ) | 0.3 | ||||||||||||||||
|
Net cash used
|
— | (32.8 | ) | (0.7 | ) | (18.3 | ) | (30.0 | ) | (81.8 | ) | |||||||||||||
|
Financing activities:
|
||||||||||||||||||||||||
|
Proceeds from issuance of long-term debt
|
— | — | — | 295.7 | — | 295.7 | ||||||||||||||||||
|
Repayment of long-term debt
|
(0.2 | ) | (34.7 | ) | — | (300.8 | ) | 30.0 | (305.7 | ) | ||||||||||||||
|
Debt costs
|
— | (1.7 | ) | (18.9 | ) | — | (20.6 | ) | ||||||||||||||||
|
Excess tax benefit from share-based compensation
|
11.7 | — | — | — | — | 11.7 | ||||||||||||||||||
|
Other financing activities
|
(2.2 | ) | — | — | — | — | (2.2 | ) | ||||||||||||||||
|
Net cash provided (used)
|
9.3 | (36.4 | ) | — | (24.0 | ) | 30.0 | (21.1 | ) | |||||||||||||||
|
Cash and cash equivalents:
|
||||||||||||||||||||||||
|
Net increase (decrease)
|
0.1 | (9.0 | ) | (0.1 | ) | 17.6 | — | 8.6 | ||||||||||||||||
|
At beginning of year
|
(0.1 | ) | 12.7 | 0.3 | 104.6 | — | 117.5 | |||||||||||||||||
|
At end of period
|
$ | — | $ | 3.7 | $ | 0.2 | $ | 122.2 | $ | — | $ | 126.1 | ||||||||||||
24
Table of Contents
| Three Months Ended March 31, 2009 | ||||||||||||||||||||||||
|
Guarantor
|
Non-Guarantor
|
Consolidating
|
Consolidated
|
|||||||||||||||||||||
| Parent | KCSR | Subsidiaries | Subsidiaries | Adjustments | KCS | |||||||||||||||||||
|
Operating activities:
|
||||||||||||||||||||||||
|
Excluding intercompany activity
|
$ | 64.8 | $ | 62.4 | $ | 1.0 | $ | (48.9 | ) | $ | — | $ | 79.3 | |||||||||||
|
Intercompany activity
|
(53.4 | ) | (103.5 | ) | — | 156.9 | — | — | ||||||||||||||||
|
Net cash provided (used)
|
11.4 | (41.1 | ) | 1.0 | 108.0 | — | 79.3 | |||||||||||||||||
|
Investing activities:
|
||||||||||||||||||||||||
|
Capital expenditures
|
— | (82.9 | ) | (0.8 | ) | (32.7 | ) | 1.0 | (115.4 | ) | ||||||||||||||
|
Return of investment
|
— | — | — | 65.0 | (65.0 | ) | — | |||||||||||||||||
|
Property investments in MSLLC
|
— | — | — | (17.8 | ) | — | (17.8 | ) | ||||||||||||||||
|
Loans to affiliates
|
(8.7 | ) | — | — | — | 8.7 | — | |||||||||||||||||
|
Other investing activities
|
— | 134.3 | — | (131.1 | ) | (1.0 | ) | 2.2 | ||||||||||||||||
|
Net cash provided (used)
|
(8.7 | ) | 51.4 | (0.8 | ) | (116.6 | ) | (56.3 | ) | (131.0 | ) | |||||||||||||
|
Financing activities:
|
||||||||||||||||||||||||
|
Proceeds from issuance of long-term debt
|
— | 33.7 | — | 189.0 | (8.7 | ) | 214.0 | |||||||||||||||||
|
Repayment of long-term debt
|
— | (204.7 | ) | — | (34.0 | ) | — | (238.7 | ) | |||||||||||||||
|
Other financing activities
|
(2.5 | ) | (5.1 | ) | — | (69.2 | ) | 65.0 | (11.8 | ) | ||||||||||||||
|
Net cash provided (used)
|
(2.5 | ) | (176.1 | ) | — | 85.8 | 56.3 | (36.5 | ) | |||||||||||||||
|
Cash and cash equivalents:
|
||||||||||||||||||||||||
|
Net increase (decrease)
|
0.2 | (165.8 | ) | 0.2 | 77.2 | — | (88.2 | ) | ||||||||||||||||
|
At beginning of year
|
— | 177.9 | 0.2 | 51.8 | — | 229.9 | ||||||||||||||||||
|
At end of period
|
$ | 0.2 | $ | 12.1 | $ | 0.4 | $ | 129.0 | $ | — | $ | 141.7 | ||||||||||||
25
Table of Contents
26
Table of Contents
| Item 2. | Management’s Discussion and Analysis of Financial Condition and Results of Operations |
27
Table of Contents
|
Three Months Ended
|
||||||||||||
| March 31, | Change | |||||||||||
| 2010 | 2009 | Dollars | ||||||||||
|
Revenues
|
$ | 436.3 | $ | 346.0 | $ | 90.3 | ||||||
|
Operating expenses
|
328.1 | 298.4 | 29.7 | |||||||||
|
Operating income
|
108.2 | 47.6 | 60.6 | |||||||||
|
Equity in net earnings of unconsolidated affiliates
|
6.4 | 1.0 | 5.4 | |||||||||
|
Interest expense
|
(44.4 | ) | (41.8 | ) | (2.6 | ) | ||||||
|
Debt retirement costs
|
(14.9 | ) | (5.9 | ) | (9.0 | ) | ||||||
|
Foreign exchange gain (loss)
|
2.6 | (5.1 | ) | 7.7 | ||||||||
|
Other income, net
|
0.5 | 1.5 | (1.0 | ) | ||||||||
|
Income (loss) before income taxes and noncontrolling interest
|
58.4 | (2.7 | ) | 61.1 | ||||||||
|
Income tax expense
|
24.2 | 0.1 | 24.1 | |||||||||
|
Net income (loss)
|
34.2 | (2.8 | ) | 37.0 | ||||||||
|
Noncontrolling interest
|
(1.1 | ) | (0.1 | ) | (1.0 | ) | ||||||
|
Net income (loss) attributable to Kansas City Southern and
subsidiaries
|
$ | 35.3 | $ | (2.7 | ) | $ | 38.0 | |||||
28
Table of Contents
| Revenues | Carloads and Units | Revenue per Carload/Unit | ||||||||||||||||||||||||||||||||||
|
Three Months Ended
|
Three Months Ended
|
Three Months Ended
|
||||||||||||||||||||||||||||||||||
| March 31, | March 31, | March 31, | ||||||||||||||||||||||||||||||||||
| 2010 | 2009 | % Change | 2010 | 2009 | % Change | 2010 | 2009 | % Change | ||||||||||||||||||||||||||||
|
Chemical and petroleum
|
$ | 89.6 | $ | 71.5 | 25 | % | 62.2 | 55.5 | 12 | % | $ | 1,441 | $ | 1,288 | 12 | % | ||||||||||||||||||||
|
Industrial and consumer products
|
99.8 | 82.0 | 22 | % | 73.4 | 66.1 | 11 | % | 1,360 | 1,241 | 10 | % | ||||||||||||||||||||||||
|
Agriculture and minerals
|
106.0 | 82.6 | 28 | % | 67.3 | 62.2 | 8 | % | 1,575 | 1,328 | 19 | % | ||||||||||||||||||||||||
|
Total general commodities
|
295.4 | 236.1 | 25 | % | 202.9 | 183.8 | 10 | % | 1,456 | 1,285 | 13 | % | ||||||||||||||||||||||||
|
Coal
|
59.0 | 47.3 | 25 | % | 72.0 | 75.0 | (4 | )% | 819 | 631 | 30 | % | ||||||||||||||||||||||||
|
Intermodal
|
42.6 | 30.6 | 39 | % | 150.5 | 114.6 | 31 | % | 283 | 267 | 6 | % | ||||||||||||||||||||||||
|
Automotive
|
21.7 | 12.3 | 76 | % | 17.8 | 10.6 | 68 | % | 1,219 | 1,160 | 5 | % | ||||||||||||||||||||||||
|
Subtotal
|
418.7 | 326.3 | 28 | % | 443.2 | 384.0 | 15 | % | $ | 945 | $ | 850 | 11 | % | ||||||||||||||||||||||
|
Other revenue
|
17.6 | 19.7 | (11 | )% | ||||||||||||||||||||||||||||||||
|
Total revenues(i)
|
$ | 436.3 | $ | 346.0 | 26 | % | ||||||||||||||||||||||||||||||
|
(i) Included in revenues:
|
||||||||||||||||||||||||||||||||||||
|
Fuel surcharge
|
$ | 34.8 | $ | 16.8 | ||||||||||||||||||||||||||||||||
|
Revenues by commodity
|
||
|
group for the three months
|
||
| ended March 31, 2010 | ||
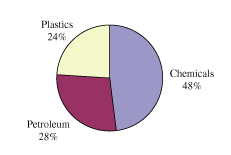
| Chemical and petroleum. Revenues increased $18.1 million for the three months ended March 31, 2010, compared to the same period in 2009, primarily due to increases in volume and pricing. Petroleum and plastics product volumes increased due to inventory replenishment and new petroleum business. Additionally, petroleum revenues increased in Mexico due to a government initiated oil export program, which resulted in record levels of oil production and storage. Revenues also increased in chemicals used to manufacture glass and paint as a result of the economic improvements in the automotive industry. |
|
29
Table of Contents
|
Revenues by commodity
|
||
|
group for the three months
|
||
| ended March 31, 2010 | ||
|
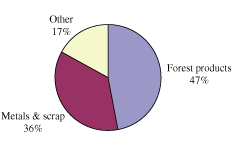
Industrial and consumer products.
Revenues
increased $17.8 million for the three months ended
March 31, 2010, compared to the same period in 2009,
primarily due to increases in volume and pricing. Metals and
scrap business growth was primarily due to increased length of
haul, growing demand for steel coil due to the rebound in the
automotive industry and the strengthening economy. Forest
products increased primarily due to a restocking of inventory to
meet increased demand. In addition, paper mill demand was at a
three year high and due to the wet conditions in the
southeastern U.S., mills were forced to source from further
distances.
|
|
|
|
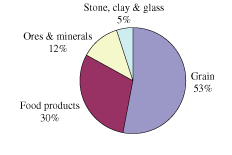
Agriculture and minerals.
Revenues increased
$23.4 million for the three months ended March 31,
2010, compared to the same period in 2009, due to increases in
pricing and volume. Grain revenue increased as a portion of the
traffic lost to vessel in 2009 was converted back to rail in
Mexico. Increased length of haul also drove year over year
revenue increases. Food products showed continued strength
primarily due to new business.
|
|
30
Table of Contents
|
Three Months Ended
|
||||||||||||||||
| March 31, | Change | |||||||||||||||
| 2010 | 2009 | Dollars | Percent | |||||||||||||
|
Compensation and benefits
|
$ | 90.7 | $ | 78.0 | $ | 12.7 | 16 | % | ||||||||
|
Purchased services
|
44.9 | 45.6 | (0.7 | ) | (2 | )% | ||||||||||
|
Fuel
|
60.8 | 43.3 | 17.5 | 40 | % | |||||||||||
|
Equipment costs
|
38.7 | 39.1 | (0.4 | ) | (1 | )% | ||||||||||
|
Depreciation and amortization
|
45.8 | 46.9 | (1.1 | ) | (2 | )% | ||||||||||
|
Casualties and insurance
|
11.9 | 12.5 | (0.6 | ) | (5 | )% | ||||||||||
|
Materials and other
|
35.3 | 33.0 | 2.3 | 7 | % | |||||||||||
|
Total operating expenses
|
$ | 328.1 | $ | 298.4 | $ | 29.7 | 10 | % | ||||||||
31
Table of Contents
| • | Equity in earnings from the operations of Panama Canal Railway Company was $1.9 million for the three month period ended March 31, 2010, compared to $0.3 million for the same period in 2009. The increase is primarily due to an increase in container volume attributable to the improvement in the economy. | |
| • | Equity in earnings of Southern Capital Corporation, LLC was $4.3 million for the three month period ended March 31, 2010, compared to $1.1 million for the same period in 2009. The increase is primarily due to the gain on sale of railcars and other equipment in 2010. | |
| • | KCSM’s equity in earnings of Ferrocarril y Terminal del Valle de México, S.A. de C.V. (“FTVM”) was $0.2 million for the three month period ended March 31, 2010, compared to a loss of $0.4 million for the same period in 2009. The increase is primarily due to a slight recovery in volumes. |
32
Table of Contents
33
Table of Contents
|
Three Months Ended
|
||||||||
| March 31, | ||||||||
| 2010 | 2009 | |||||||
|
Cash flows provided by (used for):
|
||||||||
|
Operating activities
|
$ | 111.5 | $ | 79.3 | ||||
|
Investing activities
|
(81.8 | ) | (131.0 | ) | ||||
|
Financing activities
|
(21.1 | ) | (36.5 | ) | ||||
|
Net increase (decrease) in cash and cash equivalents
|
8.6 | (88.2 | ) | |||||
|
Cash and cash equivalents beginning of year
|
117.5 | 229.9 | ||||||
|
Cash and cash equivalents end of period
|
$ | 126.1 | $ | 141.7 | ||||
34
Table of Contents
|
Three Months Ended
|
||||||||
| March 31, | ||||||||
| 2010 | 2009 | |||||||
|
Roadway capital program
|
$ | 42.2 | $ | 44.4 | ||||
|
Equipment
|
3.3 | 2.3 | ||||||
|
Capacity
|
0.2 | 44.2 | ||||||
|
Information technology
|
3.4 | 2.7 | ||||||
|
Other
|
2.6 | 5.2 | ||||||
|
Total capital expenditures (accrual basis)
|
51.7 | 98.8 | ||||||
|
Change in capital accruals
|
0.6 | 16.6 | ||||||
|
Total cash capital expenditures
|
$ | 52.3 | $ | 115.4 | ||||
| Item 3. | Quantitative and Qualitative Disclosures about Market Risk |
35
Table of Contents
| Item 4. | Controls and Procedures |
| (a) | Disclosure Controls and Procedures |
| (b) | Changes in Internal Control over Financial Reporting |
| Item 4T. | Controls and Procedures |
| Item 1. | Legal Proceedings |
| Item 1A. | Risk Factors |
| Item 2. | Unregistered Sale of Equity Securities and Use of Proceeds |
| Item 3. | Defaults upon Senior Securities |
| Item 4. | Reserved |
| Item 5. | Other Information |
36
Table of Contents
| Item 6. | Exhibits |
| Exhibit No. | ||||
|
Description of Exhibits Filed with this Report
|
||||
| 10 | .1 | Settlement Agreement , dated February 9, 2010, between KCSM and Ferrocarril Mexicano, S.A. de C.V. (“Ferromex”), Ferrosur S.A. de C.V., Minera México, S.A. de C.V., Infraestructura y Transportes Ferroviarios, S.A. de C.V., Infraestructura y Transportes México, S.A. de C.V., Líneas Ferroviarias de México, S.A. de C.V., Grupo Ferroviario Mexicano, S.A. de C.V., and Grupo México, S.A.B. de C.V. is attached to this Form 10-Q as Exhibit 10.1.* | ||
| 10 | .2 | Trackage Rights Agreement, dated February 9, 2010, between KCSM and Ferromex is attached to this Form 10-Q as Exhibit 10.2.* | ||
| 15 | .1 | Letter regarding unaudited interim financial information is attached to this Form 10-Q as Exhibit 15.1. | ||
| 18 | .1 | Letter regarding change in accounting principles is attached to this Form 10-Q as Exhibit 18.1. | ||
| 31 | .1 | Principal Executive Officer’s Certification Pursuant to Section 302 of the Sarbanes-Oxley Act of 2002 is attached to this Form 10-Q as Exhibit 31.1. | ||
| 31 | .2 | Principal Financial Officer’s Certification Pursuant to Section 302 of the Sarbanes-Oxley Act of 2002 is attached to this Form 10-Q as Exhibit 31.2. | ||
| 32 | .1 | Principal Executive Officer’s Certification furnished Pursuant to Section 906 of the Sarbanes-Oxley Act of 2002 is attached to this Form 10-Q as Exhibit 32.1. | ||
| 32 | .2 | Principal Financial Officer’s Certification furnished Pursuant to Section 906 of the Sarbanes-Oxley Act of 2002 is attached to this Form 10-Q as Exhibit 32.2. | ||
| 101 | The following financial information from Kansas City Southern’s Quarterly Report on Form 10-Q for the quarter ended March 31, 2010, formatted in XBRL (Extensible Business Reporting Language) includes:(i) Consolidated Statements of Operations for the three months ended March 31, 2010 and 2009, (ii) Consolidated Balance Sheets as of March 31, 2010 and December 31, 2009, (iii) Consolidated Statements of Cash Flows for the three months ended March 31, 2010 and 2009, and (iv) the Notes to Consolidated Financial Statements, tagged as blocks of text. | |||
| Exhibit No. |
Description of Exhibits Incorporated by Reference
|
|||
| 4 | .1 | Indenture, dated January 22, 2010, between Kansas City Southern de México, S.A. de C.V., and U.S. Bank National Association, as trustee and paying agent, filed as Exhibit 4.1 to the Company’s Current Report on Form 8-K on January 28, 2010 (File No. 1-4717), is incorporated herein by reference as Exhibit 4.1. | ||
| 4 | .2 | Registration Rights Agreement, dated January 22, 2010, between Kansas City Southern de México, S.A. de C.V., and Banc of America Securities LLC, J.P. Morgan Securities Inc., Scotia Capital (USA) Inc., BBVA Securities Inc. and BMO Capital Markets Corp, filed as Exhibit 4.2 to the Company’s Current Report on Form 8-K on January 28, 2010 (File No. 1-4717), is incorporated herein by reference as Exhibit 4.2. | ||
| 10 | .3 | Second Amendment to the Amended and Restated Credit Agreement, dated March 16, 2010, among KCSR, KCS, the subsidiary guarantors, the lenders party thereto and The Bank of Nova Scotia, filed as Exhibit 10.1 to the Company’s Current Report on Form 8-K on March 22, 2010 (File No. 1-4717) is incorporated herein by reference as Exhibit 10.3. | ||
| * | Certain portions of this exhibit have been omitted pursuant to our request for confidential treatment under Rule 24b-2 of the Securities Exchange Act of 1934, as amended. |
37
Table of Contents
38