KANSAS CITY SOUTHERN
10-Ks and 10-Qs
|
|
|
|
|
|
|
|
|
|
|
|
|
|
|
|
|
|
|
|
|
|
|
|
|
|
|
|
|
|
|
|
|
|
|
UNITED STATES
SECURITIES AND EXCHANGE COMMISSION
Washington, D.C. 20549
Form 10-Q
|
ý
|
QUARTERLY REPORT PURSUANT TO SECTION 13 OR 15(d) OF THE SECURITIES EXCHANGE ACT OF 1934
|
|
For the quarterly period ended March 31, 2019
|
|
or
|
¨
|
TRANSITION REPORT PURSUANT TO SECTION 13 OR 15(d) OF THE SECURITIES EXCHANGE ACT OF 1934
|
|
For the transition period from to
|
|
Commission File Number 1-4717
KANSAS CITY SOUTHERN
(Exact name of registrant as specified in its charter)
|
Delaware
|
|

|
|
44-0663509
|
|
(State or other jurisdiction of
incorporation or organization)
|
|
|
(I.R.S. Employer
Identification No.)
|
|
|
427 West 12th Street,
Kansas City, Missouri
|
|
|
64105 |
|
|
(Address of principal executive offices)
|
|
|
(Zip Code)
|
|
816.983.1303
(Registrant’s telephone number, including area code)
No Change
(Former name, former address and former fiscal year, if changed since last report.)
____________________________________________________
Indicate by check mark whether the registrant (1) has filed all reports required to be filed by Section 13 or 15(d) of the Securities Exchange Act of 1934 during the preceding 12 months (or for such shorter period that the registrant was required to file such reports), and (2) has been subject to such filing requirements for the past 90 days. Yes
ý
No
¨
Indicate by check mark whether the registrant has submitted electronically, every Interactive Data File required to be submitted pursuant to Rule 405 of Regulation S-T during the preceding 12 months (or for such shorter period that the registrant was required to submit such files). Yes
ý
No
¨
Indicate by check mark whether the registrant is a large accelerated filer, an accelerated filer, a non-accelerated filer, a smaller reporting company, or an emerging growth company. See the definitions of “large accelerated filer,” “accelerated filer,” “smaller reporting company,” and “emerging growth company” in Rule 12b-2 of the Exchange Act. (Check one):
Large accelerated filer
ý
Accelerated filer
¨
Non-accelerated filer
¨
Smaller reporting company
¨
Emerging growth company
¨
If an emerging growth company, indicate by check mark if the registrant has elected not to use the extended transition period for complying with any new or revised financial accounting standards provided pursuant to Section 13(a) of the Exchange Act.
¨
Indicate by check mark whether the registrant is a shell company (as defined in Rule 12b-2 of the Exchange Act). Yes
¨
No
ý
Indicate the number of shares outstanding of each of the issuer’s classes of common stock, as of the latest practicable date.
|
Class
|
|
April 10, 2019
|
|
Common Stock, $0.01 per share par value
|
|
100,586,999 Shares
|
Kansas City Southern and Subsidiaries
Form 10-Q
March 31, 2019
Index
|
|
Page
|
|
|
PART I — FINANCIAL INFORMATION
|
||
|
Item 1.
|
||
|
Item 2.
|
||
|
Item 3.
|
||
|
Item 4.
|
||
|
PART II — OTHER INFORMATION
|
||
|
Item 1.
|
||
|
Item 1A.
|
||
|
Item 2.
|
||
|
Item 3.
|
||
|
Item 4.
|
||
|
Item 5.
|
||
|
Item 6.
|
||
2
|
Item 1.
|
Financial Statements (unaudited)
|
Kansas City Southern and Subsidiaries
|
Three Months Ended
|
|||||||
|
March 31,
|
|||||||
|
2019
|
2018
|
||||||
|
(In millions, except share and per share amounts)
(Unaudited)
|
|||||||
|
Revenues
|
$
|
674.8
|
|
$
|
638.6
|
|
|
|
Operating expenses:
|
|||||||
|
Compensation and benefits
|
128.9
|
|
121.6
|
|
|||
|
Purchased services
|
52.8
|
|
47.1
|
|
|||
|
Fuel
|
83.0
|
|
81.3
|
|
|||
|
Mexican fuel excise tax credit
|
—
|
|
(9.2
|
)
|
|||
|
Equipment costs
|
30.4
|
|
32.2
|
|
|||
|
Depreciation and amortization
|
88.5
|
|
83.3
|
|
|||
|
Materials and other
|
63.4
|
|
63.6
|
|
|||
|
Restructuring charges
|
67.5
|
|
—
|
|
|||
|
Total operating expenses
|
514.5
|
|
419.9
|
|
|||
|
Operating income
|
160.3
|
|
218.7
|
|
|||
|
Equity in net earnings of affiliates
|
1.7
|
|
1.0
|
|
|||
|
Interest expense
|
(28.2
|
)
|
(25.5
|
)
|
|||
|
Debt retirement costs
|
(0.6
|
)
|
—
|
|
|||
|
Foreign exchange gain
|
4.6
|
|
27.8
|
|
|||
|
Other income (expense), net
|
0.1
|
|
(0.3
|
)
|
|||
|
Income before income taxes
|
137.9
|
|
221.7
|
|
|||
|
Income tax expense
|
34.7
|
|
76.8
|
|
|||
|
Net income
|
103.2
|
|
144.9
|
|
|||
|
Less: Net income attributable to noncontrolling interest
|
0.4
|
|
0.4
|
|
|||
|
Net income attributable to Kansas City Southern and subsidiaries
|
102.8
|
|
144.5
|
|
|||
|
Preferred stock dividends
|
0.1
|
|
0.1
|
|
|||
|
Net income available to common stockholders
|
$
|
102.7
|
|
$
|
144.4
|
|
|
|
Earnings per share:
|
|||||||
|
Basic earnings per share
|
$
|
1.02
|
|
$
|
1.41
|
|
|
|
Diluted earnings per share
|
$
|
1.02
|
|
$
|
1.40
|
|
|
|
Average shares outstanding
(in thousands):
|
|||||||
|
Basic
|
100,500
|
|
102,574
|
|
|||
|
Potentially dilutive common shares
|
415
|
|
402
|
|
|||
|
Diluted
|
100,915
|
|
102,976
|
|
|||
See accompanying notes to the unaudited consolidated financial statements.
3
Kansas City Southern and Subsidiaries
Consolidated Statements of Comprehensive Income
|
Three Months Ended
|
|||||||
|
March 31,
|
|||||||
|
2019
|
2018
|
||||||
|
(In millions)
(Unaudited) |
|||||||
|
Net income
|
$
|
103.2
|
|
$
|
144.9
|
|
|
|
Other comprehensive income (loss):
|
|||||||
|
Unrealized gain (loss) on interest rate derivative instruments during the period, net of tax of $(1.7) million and $1.6 million, respectively
|
(5.1
|
)
|
4.5
|
|
|||
|
Foreign currency translation adjustments
|
0.2
|
|
1.2
|
|
|||
|
Other comprehensive income (loss)
|
(4.9
|
)
|
5.7
|
|
|||
|
Comprehensive income
|
98.3
|
|
150.6
|
|
|||
|
Less: Comprehensive income attributable to noncontrolling interest
|
0.4
|
|
0.4
|
|
|||
|
Comprehensive income attributable to Kansas City Southern and subsidiaries
|
$
|
97.9
|
|
$
|
150.2
|
|
|
See accompanying notes to the unaudited consolidated financial statements.
4
Kansas City Southern and Subsidiaries
|
March 31,
2019 |
December 31,
2018 |
||||||
|
(In millions, except share and per share amounts)
|
|||||||
|
(Unaudited)
|
|
||||||
|
ASSETS
|
|||||||
|
Current assets:
|
|||||||
|
Cash and cash equivalents
|
$
|
92.7
|
|
$
|
100.5
|
|
|
|
Accounts receivable, net
|
277.9
|
|
301.2
|
|
|||
|
Materials and supplies
|
166.2
|
|
160.3
|
|
|||
|
Other current assets
|
117.6
|
|
73.4
|
|
|||
|
Total current assets
|
654.4
|
|
635.4
|
|
|||
|
Operating lease right-of-use assets
|
199.1
|
|
—
|
|
|||
|
Investments
|
47.8
|
|
44.9
|
|
|||
|
Property and equipment (including concession assets), net
|
8,694.3
|
|
8,691.1
|
|
|||
|
Other assets
|
42.1
|
|
98.4
|
|
|||
|
Total assets
|
$
|
9,637.7
|
|
$
|
9,469.8
|
|
|
|
LIABILITIES AND EQUITY
|
|||||||
|
Current liabilities:
|
|||||||
|
Long-term debt due within one year
|
$
|
9.7
|
|
$
|
10.1
|
|
|
|
Accounts payable and accrued liabilities
|
470.9
|
|
436.9
|
|
|||
|
Total current liabilities
|
480.6
|
|
447.0
|
|
|||
|
Long-term operating lease liabilities
|
105.6
|
|
—
|
|
|||
|
Long-term debt
|
2,677.6
|
|
2,679.3
|
|
|||
|
Deferred income taxes
|
1,085.2
|
|
1,079.9
|
|
|||
|
Other noncurrent liabilities and deferred credits
|
138.7
|
|
130.9
|
|
|||
|
Total liabilities
|
4,487.7
|
|
4,337.1
|
|
|||
|
Stockholders’ equity:
|
|||||||
|
$25 par, 4% noncumulative, preferred stock, 840,000 shares authorized, 649,736 shares issued; 226,285 and 228,395 shares outstanding at March 31, 2019 and December 31, 2018, respectively
|
5.7
|
|
5.7
|
|
|||
|
$.01 par, common stock, 400,000,000 shares authorized; 123,352,185 shares issued; 100,580,696 and 100,896,678 shares outstanding at March 31, 2019 and December 31, 2018, respectively
|
1.0
|
|
1.0
|
|
|||
|
Additional paid-in capital
|
946.1
|
|
946.6
|
|
|||
|
Retained earnings
|
3,891.1
|
|
3,870.6
|
|
|||
|
Accumulated other comprehensive loss
|
(15.8
|
)
|
(10.9
|
)
|
|||
|
Total stockholders’ equity
|
4,828.1
|
|
4,813.0
|
|
|||
|
Noncontrolling interest
|
321.9
|
|
319.7
|
|
|||
|
Total equity
|
5,150.0
|
|
5,132.7
|
|
|||
|
Total liabilities and equity
|
$
|
9,637.7
|
|
$
|
9,469.8
|
|
|
See accompanying notes to the unaudited consolidated financial statements.
5
Kansas City Southern and Subsidiaries
|
Three Months Ended
|
|||||||
|
March 31,
|
|||||||
|
2019
|
2018
|
||||||
|
(In millions)
(Unaudited)
|
|||||||
|
Operating activities:
|
|||||||
|
Net income
|
$
|
103.2
|
|
$
|
144.9
|
|
|
|
Adjustments to reconcile net income to net cash provided by operating activities:
|
|||||||
|
Depreciation and amortization
|
88.5
|
|
83.3
|
|
|||
|
Deferred income taxes
|
6.9
|
|
23.9
|
|
|||
|
Equity in net earnings of affiliates
|
(1.7
|
)
|
(1.0
|
)
|
|||
|
Share-based compensation
|
6.0
|
|
5.8
|
|
|||
|
Settlement of foreign currency derivative instruments
|
0.7
|
|
12.1
|
|
|||
|
Gain on foreign currency derivative instruments
|
(3.6
|
)
|
(16.5
|
)
|
|||
|
Mexican fuel excise tax credit
|
(6.8
|
)
|
(9.2
|
)
|
|||
|
Restructuring charges
|
67.5
|
|
—
|
|
|||
|
Cash payments for restructuring charges
|
(0.5
|
)
|
—
|
|
|||
|
Changes in working capital items:
|
|||||||
|
Accounts receivable
|
34.6
|
|
(37.2
|
)
|
|||
|
Materials and supplies
|
(8.7
|
)
|
(7.5
|
)
|
|||
|
Other current assets
|
3.0
|
|
(22.1
|
)
|
|||
|
Accounts payable and accrued liabilities
|
(9.5
|
)
|
(19.2
|
)
|
|||
|
Other, net
|
(6.9
|
)
|
(16.7
|
)
|
|||
|
Net cash provided by operating activities
|
272.7
|
|
140.6
|
|
|||
|
Investing activities:
|
|||||||
|
Capital expenditures
|
(179.9
|
)
|
(110.0
|
)
|
|||
|
Purchase or replacement of equipment under operating leases
|
—
|
|
(11.2
|
)
|
|||
|
Property investments in MSLLC
|
(4.7
|
)
|
(3.9
|
)
|
|||
|
Investments in and advances to affiliates
|
(8.4
|
)
|
(0.2
|
)
|
|||
|
Proceeds from disposal of property
|
2.2
|
|
1.4
|
|
|||
|
Other, net
|
1.1
|
|
(0.3
|
)
|
|||
|
Net cash used for investing activities
|
(189.7
|
)
|
(124.2
|
)
|
|||
|
Financing activities:
|
|||||||
|
Net short-term borrowings
|
—
|
|
(4.1
|
)
|
|||
|
Repayment of long-term debt
|
(2.7
|
)
|
(8.7
|
)
|
|||
|
Dividends paid
|
(36.4
|
)
|
(37.1
|
)
|
|||
|
Shares repurchased
|
(50.3
|
)
|
(54.0
|
)
|
|||
|
Debt issuance costs paid
|
(1.6
|
)
|
—
|
|
|||
|
Proceeds from employee stock plans
|
0.2
|
|
0.4
|
|
|||
|
Net cash used for financing activities
|
(90.8
|
)
|
(103.5
|
)
|
|||
|
Cash and cash equivalents:
|
|||||||
|
Net decrease during each period
|
(7.8
|
)
|
(87.1
|
)
|
|||
|
At beginning of year
|
100.5
|
|
134.1
|
|
|||
|
At end of period
|
$
|
92.7
|
|
$
|
47.0
|
|
|
See accompanying notes to the unaudited consolidated financial statements.
6
Kansas City Southern and Subsidiaries
Consolidated Statements of Changes in Equity
(in millions, except per share amounts)
(Unaudited)
|
$25 Par
Preferred
Stock
|
$.01 Par
Common
Stock
|
Additional Paid-in
Capital
|
Retained
Earnings
|
Accumulated
Other
Comprehensive
Loss
|
Non-
controlling
Interest
|
Total
|
|||||||||||||||||||||
|
|
|||||||||||||||||||||||||||
|
Balance at December 31, 2018
|
$
|
5.7
|
|
$
|
1.0
|
|
$
|
946.6
|
|
$
|
3,870.6
|
|
$
|
(10.9
|
)
|
$
|
319.7
|
|
$
|
5,132.7
|
|
||||||
|
Net income
|
102.8
|
|
0.4
|
|
103.2
|
|
|||||||||||||||||||||
|
Other comprehensive loss
|
(4.9
|
)
|
(4.9
|
)
|
|||||||||||||||||||||||
|
Contribution from noncontrolling interest
|
1.8
|
|
1.8
|
|
|||||||||||||||||||||||
|
Dividends on common stock ($0.36/share)
|
(36.3
|
)
|
(36.3
|
)
|
|||||||||||||||||||||||
|
Dividends on $25 par preferred stock ($0.25/share)
|
(0.1
|
)
|
(0.1
|
)
|
|||||||||||||||||||||||
|
Share repurchases
|
—
|
|
—
|
|
(4.4
|
)
|
(45.9
|
)
|
(50.3
|
)
|
|||||||||||||||||
|
Options exercised and stock subscribed, net of shares withheld for employee taxes
|
(2.1
|
)
|
(2.1
|
)
|
|||||||||||||||||||||||
|
Share-based compensation
|
6.0
|
|
6.0
|
|
|||||||||||||||||||||||
|
Balance at March 31, 2019
|
$
|
5.7
|
|
$
|
1.0
|
|
$
|
946.1
|
|
$
|
3,891.1
|
|
$
|
(15.8
|
)
|
$
|
321.9
|
|
$
|
5,150.0
|
|
||||||
|
$25 Par
Preferred
Stock
|
$.01 Par
Common
Stock
|
Additional Paid-in
Capital
|
Retained
Earnings
|
Accumulated
Other
Comprehensive
Loss
|
Non-
controlling
Interest
|
Total
|
|||||||||||||||||||||
|
Balance at December 31, 2017
|
$
|
6.1
|
|
$
|
1.0
|
|
$
|
943.3
|
|
$
|
3,611.4
|
|
$
|
(12.9
|
)
|
$
|
316.5
|
|
$
|
4,865.4
|
|
||||||
|
Reclassification due to adoption of ASU 2018-02, Reclassification of Certain Tax Effects from Accumulated Other Comprehensive Income
|
|
|
0.7
|
|
(0.7
|
)
|
—
|
|
|||||||||||||||||||
|
Net income
|
144.5
|
|
0.4
|
|
144.9
|
|
|||||||||||||||||||||
|
Other comprehensive income
|
5.7
|
|
5.7
|
|
|||||||||||||||||||||||
|
Dividends on common stock ($0.36/share)
|
(36.9
|
)
|
(36.9
|
)
|
|||||||||||||||||||||||
|
Dividends on $25 par preferred stock ($0.25/share)
|
(0.1
|
)
|
(0.1
|
)
|
|||||||||||||||||||||||
|
Share repurchases
|
—
|
|
(4.6
|
)
|
(49.4
|
)
|
(54.0
|
)
|
|||||||||||||||||||
|
Options exercised and stock subscribed, net of shares withheld for employee taxes
|
0.6
|
|
0.6
|
|
|||||||||||||||||||||||
|
Share-based compensation
|
5.8
|
|
5.8
|
|
|||||||||||||||||||||||
|
Balance at March 31, 2018
|
$
|
6.1
|
|
$
|
1.0
|
|
$
|
945.1
|
|
$
|
3,670.2
|
|
$
|
(7.9
|
)
|
$
|
316.9
|
|
$
|
4,931.4
|
|
||||||
See accompanying notes to the unaudited consolidated financial statements.
7
Kansas City Southern and Subsidiaries
Notes to the Unaudited Consolidated Financial Statements
For purposes of this report, “KCS” or the “Company” may refer to Kansas City Southern or, as the context requires, to one or more subsidiaries of Kansas City Southern.
1. Basis of Presentation
In the opinion of the management of KCS, the accompanying unaudited consolidated financial statements contain all adjustments (consisting of normal and recurring adjustments) necessary to reflect a fair statement of the results for interim periods in accordance with U.S. generally accepted accounting principles (“U.S. GAAP”). Pursuant to the rules and regulations of the Securities and Exchange Commission (“SEC”), certain information and note disclosures normally included in financial statements prepared in accordance with U.S. GAAP have been condensed or omitted. These consolidated financial statements should be read in conjunction with the consolidated financial statements and accompanying notes included in the Company’s Annual Report on Form 10-K for the year ended
December 31, 2018
. The results of operations for the
three
months ended
March 31, 2019
, are not necessarily indicative of the results to be expected for the full year ending
December 31, 2019
. Certain prior year amounts have been reclassified to conform to the current year presentation.
During the first quarter of 2019, the Company adopted Accounting Standards Update (“ASU”) No. 2016-02, Leases, which is also known as Accounting Standard Codification (“ASC”) Topic 842, that requires lessees to recognize for all operating leases a right-of-use asset and a lease obligation in the consolidated balance sheet. Expenses are recognized in the consolidated statement of income in a manner similar to previous accounting guidance. Lessor accounting under the new standard is substantially unchanged and is immaterial to the Company. The Company adopted the accounting standard using a prospective transition approach, which applies the provisions of the new guidance at the effective date without adjusting the comparative periods presented, with certain practical expedients available to ease the burden of adoption.
The Company elected the following practical expedients upon adoption: not to reassess whether any expired or existing contracts are or contain leases, not to reassess the lease classification for any expired or existing leases, not to reassess initial direct costs for any existing leases, not to separately identify lease and nonlease components (i.e. maintenance costs) except for fleet vehicles and real estate, and not to evaluate historical land easements under the new guidance. Additionally, the Company elected the short-term lease exemption policy, applying the requirements of ASC 842 to long-term leases (leases greater than 1 year).
Adoption of the new standard resulted in
$175.2 million
of additional right-of-use lease assets and lease liabilities as of January 1, 2019. The new standard did not have a significant impact on the consolidated statement of income. See Note
4
, Leases for additional information.
2. Restructuring Charges
The Company began implementing certain principles of Precision Scheduled Railroading (“PSR”), which focus on providing reliable customer service, facilitating growth, improving asset utilization, and improving the cost profile of the Company. As a result of the PSR initiatives, management approved a restructuring plan during the first quarter of 2019, which coincides with the preparation of the Company’s quarterly financial statements, and recognized restructuring charges of
$67.5 million
in the consolidated statements of income.
Expenses related to these initiatives are shown in the following table (
in millions
):
|
Three months ended March 31, 2019
|
||||
|
Restructuring charges:
|
||||
|
Asset impairments
|
$
|
62.5
|
|
|
|
Workforce reduction
|
3.2
|
|
||
|
Contract restructuring
|
1.8
|
|
||
|
Total restructuring charges
|
$
|
67.5
|
|
|
Asset Impairments.
The Company committed to a plan to dispose certain locomotives and rail cars to increase operational fluidity, reduce maintenance expense, and improve labor and fuel efficiency. Accordingly, the Company performed an impairment analysis to adjust the carrying amount of the assets to the lower of its depreciated book value or its estimated fair value, less costs to dispose, and stopped recognizing depreciation expense.
Workforce Reduction.
The Company recognized severance costs associated with a planned workforce reduction as a result of a lower active locomotive fleet and rail cars online.
8
Kansas City Southern and Subsidiaries
Notes to the Unaudited Consolidated Financial Statements—(Continued)
Contract Restructuring.
The Company terminated certain third party vendor contracts in order to drive operational efficiencies, which resulted in contract termination penalties.
3. Mexican Fuel Excise Tax Credit
Fuel
purchases in Mexico are subject to an excise tax that is included in the price of fuel. The Company is eligible for and utilizes a credit for the excise tax included in the price of fuel that is purchased and consumed in locomotives and certain work equipment in Mexico. For years 2018, 2017, and 2016, the Mexican fuel excise tax credit (“IEPS credit”) was realized through the offset of the total annual Mexico income tax liability and income tax withholding payment obligations of KCSM, with no carryforward to future periods and recognized as a benefit in operating expenses on the consolidated statements of income. In December 2018, the Mexican government enacted changes in the tax law effective January 1, 2019 (“Mexico Tax Reform”), which,
among other things, for 2019
eliminated the option to monetize the IEPS credit by offsetting income tax withholding payment obligations. As a result, the Company will be allowed to offset the 2019 IEPS credit only against its Mexico corporate income tax liability on the 2019 annual income tax return. The elimination of the option to apply the IEPS credit to income tax withholding payment obligations requires the Company to recognize the IEPS credit as a reduction of income tax expense rather than a reduction of operating expenses for 2019. For the three months ended March 31, 2019, the Company recognized a net benefit of
$6.8 million
in income tax expense within the consolidated statements of income.
4
. Leases
The Company leases transportation equipment, as well as office and other operating facilities, under various finance and operating leases. Operating lease right-of-use assets and liabilities are recognized at commencement date based on the present value of lease payments over the lease term. As the implicit rate is not readily determinable in most of the Company’s lease agreements, the Company uses its estimated secured incremental borrowing rate based on the information available at commencement date in determining the present value of lease payments. Lease expense is recognized on a straight-line basis over the lease term.
The Company determines if an arrangement is a lease or contains a lease at inception. The Company’s leases have remaining lease terms of approximately
1
year to
15
years, which may include the option to extend the lease when it is reasonably certain the Company will exercise that option. The Company does not have lease agreements with residual value guarantees, sale leaseback terms or material restrictive covenants. Additionally, short-term leases and leases with variable lease costs are immaterial, and the Company does not have any sublease arrangements.
|
Leases
|
Classification
|
March 31, 2019
(
in millions
)
|
||||
|
Assets
|
||||||
|
Operating
|
Operating lease right-of-use assets
|
$
|
199.1
|
|
||
|
Finance
|
Property and equipment (including concession assets), net
|
10.5
|
|
|||
|
Total leased assets
|
$
|
209.6
|
|
|||
|
Liabilities
|
||||||
|
Current
|
|
|
||||
|
Operating
|
Accounts payable and accrued liabilities
|
$
|
49.2
|
|
||
|
Finance
|
Long-term debt due within one year
|
2.3
|
|
|||
|
Noncurrent
|
||||||
|
Operating
|
Long-term operating lease liabilities
|
105.6
|
|
|||
|
Finance
|
Long-term debt
|
8.2
|
|
|||
|
Total lease liabilities
|
$
|
165.3
|
|
|||
9
Kansas City Southern and Subsidiaries
Notes to the Unaudited Consolidated Financial Statements—(Continued)
|
Three Months Ended
|
||||||
|
Lease Cost
|
Classification
|
March 31, 2019
(
in millions
)
|
||||
|
Operating lease cost
|
Equipment costs
|
$
|
13.8
|
|
||
|
Finance lease cost:
|
||||||
|
Amortization of finance lease assets
|
Depreciation and amortization
|
0.9
|
|
|||
|
Interest on lease liabilities
|
Interest expense
|
0.3
|
|
|||
|
Total lease cost
|
$
|
15.0
|
|
|||
|
Cash Flow Information
|
||||
|
Cash paid for operating leases included in operating activities
|
$
|
23.1
|
|
|
|
Cash paid for finance leases included in operating activities
|
0.3
|
|
||
|
Cash paid for finance leases included in financing activities
|
0.9
|
|
||
|
Lease Term and Discount Rate
|
Weighted-Average Remaining Lease Term
(years)
|
Weighted-Average Discount Rate
|
|||
|
Operating leases
|
7.1
|
4.4
|
%
|
||
|
Finance leases
|
4.5
|
11.1
|
%
|
||
|
Remaining Maturities of Lease Liabilities
Year Ending December 31 (
in millions
),
|
Operating Leases
|
Finance Leases
|
||||||
|
2019
|
$
|
54.1
|
|
$
|
2.8
|
|
||
|
2020
|
32.4
|
|
2.7
|
|
||||
|
2021
|
24.3
|
|
2.7
|
|
||||
|
2022
|
17.7
|
|
2.7
|
|
||||
|
2023
|
12.3
|
|
2.4
|
|
||||
|
Thereafter
|
35.1
|
|
0.1
|
|
||||
|
Total lease payments
|
175.9
|
|
13.4
|
|
||||
|
Less imputed interest
|
21.1
|
|
2.9
|
|
||||
|
Total
|
$
|
154.8
|
|
$
|
10.5
|
|
||
As of March 31, 2019, the Company had additional operating leases that have not yet commenced of
$2.2 million
, which will commence during fiscal year 2019, and carry lease terms of
2
years to
3
years.
10
Kansas City Southern and Subsidiaries
Notes to the Unaudited Consolidated Financial Statements—(Continued)
5. Revenue
Disaggregation of Revenue
The following table presents revenues disaggregated by the major commodity groups as well as the product types included within the major commodity groups
(in millions)
. The Company believes disaggregation by product type best depicts how cash flows are affected by economic factors. See Note
14
for revenues by geographical area.
|
Three Months Ended
|
|||||||
|
March 31,
|
|||||||
|
2019
|
2018
|
||||||
|
Chemical & Petroleum
|
|||||||
|
Chemicals
|
$
|
60.5
|
|
$
|
57.7
|
|
|
|
Petroleum
|
74.3
|
|
49.0
|
|
|||
|
Plastics
|
33.8
|
|
33.0
|
|
|||
|
Total
|
168.6
|
|
139.7
|
|
|||
|
Industrial & Consumer Products
|
|||||||
|
Forest Products
|
66.4
|
|
65.3
|
|
|||
|
Metals & Scrap
|
57.0
|
|
53.8
|
|
|||
|
Other
|
26.4
|
|
27.2
|
|
|||
|
Total
|
149.8
|
|
146.3
|
|
|||
|
Agriculture & Minerals
|
|||||||
|
Grain
|
72.7
|
|
65.2
|
|
|||
|
Food Products
|
35.7
|
|
36.2
|
|
|||
|
Ores & Minerals
|
6.5
|
|
4.9
|
|
|||
|
Stone, Clay & Glass
|
8.0
|
|
7.1
|
|
|||
|
Total
|
122.9
|
|
113.4
|
|
|||
|
Energy
|
|||||||
|
Utility Coal
|
32.5
|
|
29.3
|
|
|||
|
Coal & Petroleum Coke
|
10.5
|
|
10.2
|
|
|||
|
Frac Sand
|
8.0
|
|
11.1
|
|
|||
|
Crude Oil
|
13.6
|
|
10.7
|
|
|||
|
Total
|
64.6
|
|
61.3
|
|
|||
|
Intermodal
|
79.9
|
|
90.9
|
|
|||
|
Automotive
|
57.6
|
|
59.8
|
|
|||
|
Total Freight Revenues
|
643.4
|
|
611.4
|
|
|||
|
Other Revenue
|
31.4
|
|
27.2
|
|
|||
|
Total Revenues
|
$
|
674.8
|
|
$
|
638.6
|
|
|
Contract Balances
The amount of revenue recognized in the
first
quarter of 2019 from performance obligations partially satisfied in previous periods was
$21.9 million
. The performance obligations that were unsatisfied or partially satisfied as of
March 31, 2019
, were
$18.7 million
, which represents in-transit shipments that are fully satisfied the following month.
A receivable is any unconditional right to consideration, and is recognized as shipments have been completed and the relating performance obligation has been fully satisfied. At
March 31, 2019
, and
December 31, 2018
, the accounts receivable, net balance was
$277.9 million
and
$301.2 million
, respectively. Contract assets represent a conditional right to consideration in exchange for goods or services. The Company did not have any contract assets at
March 31, 2019
, and December 31, 2018.
Contract liabilities represent consideration received in advance from customers, and are recognized as revenue over time as the relating performance obligation is satisfied. The amount of revenue recognized in the
first
quarter of 2019 that was included in the opening contract liability balance was
$15.7 million
. The Company has recognized contract liabilities within the accounts payable and
11
Kansas City Southern and Subsidiaries
Notes to the Unaudited Consolidated Financial Statements—(Continued)
accrued liabilities financial statement caption on the balance sheet. These are considered current liabilities as they will be settled in less than 12 months.
The following tables summarize the changes in contract liabilities
(in millions)
:
|
Contract liabilities
|
Three Months Ended March 31,
|
|||||||
|
2019
|
2018
|
|||||||
|
Beginning balance
|
$
|
32.4
|
|
$
|
26.8
|
|
||
|
Revenue recognized that was included in the contract liability balance at the beginning of the period
|
(15.7
|
)
|
(11.2
|
)
|
||||
|
Increases due to consideration received, excluding amounts recognized as revenue during the period
|
5.6
|
|
4.4
|
|
||||
|
Ending balance
|
$
|
22.3
|
|
$
|
20.0
|
|
||
6. Earnings Per Share Data
Basic earnings per common share is computed by dividing net income available to common stockholders by the weighted-average number of common shares outstanding for the period. Diluted earnings per share adjusts basic earnings per common share for the effects of potentially dilutive common shares, if the effect is not anti-dilutive. Potentially dilutive common shares include the dilutive effects of shares issuable under the stock option and performance award plans.
The following table reconciles the basic earnings per share computation to the diluted earnings per share computation
(in millions, except share and per share amounts)
:
|
Three Months Ended
|
|||||||
|
March 31,
|
|||||||
|
|
2019
|
2018
|
|||||
|
Net income available to common stockholders for purposes of computing basic and diluted earnings per share
|
$
|
102.7
|
|
$
|
144.4
|
|
|
|
Weighted-average number of shares outstanding (
in thousands
):
|
|||||||
|
Basic shares
|
100,500
|
|
102,574
|
|
|||
|
Effect of dilution
|
415
|
|
402
|
|
|||
|
Diluted shares
|
100,915
|
|
102,976
|
|
|||
|
Earnings per share:
|
|||||||
|
Basic earnings per share
|
$
|
1.02
|
|
$
|
1.41
|
|
|
|
Diluted earnings per share
|
$
|
1.02
|
|
$
|
1.40
|
|
|
Potentially dilutive shares excluded from the calculation
(in thousands):
|
Stock options excluded as their inclusion would be anti-dilutive
|
212
|
|
100
|
|
|
12
Kansas City Southern and Subsidiaries
Notes to the Unaudited Consolidated Financial Statements—(Continued)
7. Property and Equipment (including Concession Assets)
Property and equipment, including concession assets, and related accumulated depreciation and amortization are summarized below
(in millions)
:
|
March 31,
2019 |
December 31,
2018 |
||||||
|
Land
|
$
|
219.0
|
|
$
|
219.3
|
|
|
|
Concession land rights
|
141.2
|
|
141.2
|
|
|||
|
Road property
|
7,755.5
|
|
7,720.1
|
|
|||
|
Equipment
|
2,699.7
|
|
2,739.5
|
|
|||
|
Technology and other
|
310.9
|
|
305.6
|
|
|||
|
Construction in progress
|
135.2
|
|
152.5
|
|
|||
|
Total property
|
11,261.5
|
|
11,278.2
|
|
|||
|
Accumulated depreciation and amortization
|
2,567.2
|
|
2,587.1
|
|
|||
|
Property and equipment (including concession assets), net
|
$
|
8,694.3
|
|
$
|
8,691.1
|
|
|
Concession assets, net of accumulated amortization of
$671.6 million
and
$653.9 million
, totaled
$2,281.9 million
and
$2,260.4 million
at
March 31, 2019
and
December 31, 2018
, respectively.
8. Fair Value Measurements
The Company’s derivative financial instruments are measured at fair value on a recurring basis and consist of foreign currency forward and option contracts and treasury lock agreements, which are classified as Level 2 valuations. The Company determines the fair value of its derivative financial instrument positions based upon pricing models using inputs observed from actively quoted markets and also takes into consideration the contract terms as well as other inputs, including market currency exchange rates and in the case of option contracts, volatility, the risk-free interest rate and the time to expiration.
The Company’s short-term financial instruments include cash and cash equivalents, accounts receivable, accounts payable and short-term borrowings. The carrying value of the short-term financial instruments approximates their fair value.
The fair value of the Company’s debt is estimated using quoted market prices when available. When quoted market prices are not available, fair value is estimated based on current market interest rates for debt with similar maturities and credit quality. The carrying value of the Company’s debt was
$2,687.3 million
and
$2,689.4 million
at
March 31, 2019
and
December 31, 2018
, respectively. If the Company’s debt were measured at fair value, the fair value measurements of the individual debt instruments would have been classified as Level 2 in the fair value hierarchy.
The fair value of the Company’s financial instruments is presented in the following table
(in millions)
:
|
March 31, 2019
|
December 31, 2018
|
|||||||
|
Level 2
|
Level 2
|
|||||||
|
Assets
|
||||||||
|
Foreign currency derivative instruments
|
$
|
3.2
|
|
$
|
0.3
|
|
||
|
Liabilities
|
||||||||
|
Debt instruments
|
2,745.7
|
|
2,661.3
|
|
||||
|
Treasury lock agreements
|
8.8
|
|
2.0
|
|
||||
9
. Derivative Instruments
The Company enters into derivative transactions in certain situations based on management’s assessment of current market conditions and perceived risks. Management intends to respond to evolving business and market conditions and in doing so, may enter into such transactions as deemed appropriate.
Credit Risk.
As a result of the use of derivative instruments, the Company is exposed to counterparty credit risk. The Company manages this risk by limiting its counterparties to large financial institutions which meet the Company’s credit rating standards and
13
Kansas City Southern and Subsidiaries
Notes to the Unaudited Consolidated Financial Statements—(Continued)
have an established banking relationship with the Company. As of
March 31, 2019
, the Company did not expect any losses as a result of default of its counterparties.
Interest Rate Derivative Instruments
. In May 2017, the Company executed
four
treasury lock agreements with an aggregate notional value of
$275.0 million
and a weighted average interest rate of
2.85%
. The purpose of the treasury locks is to hedge the U.S. Treasury benchmark interest rate associated with future interest payments related to the anticipated refinancing of the
$275.0 million
,
2.35%
senior notes due
May 15, 2020
. The Company has designated the treasury locks as cash flow hedges and recorded unrealized gains and losses in accumulated other comprehensive loss. Upon settlement, the unrealized gain or loss in accumulated other comprehensive income will be amortized to interest expense over the life of the future underlying debt issuance.
Foreign Currency Derivative Instruments.
The Company’s Mexican subsidiaries have net U.S. dollar-denominated monetary liabilities which, for Mexican income tax purposes, are subject to periodic revaluation based on changes in the value of the Mexican peso against the U.S. dollar. This revaluation creates fluctuations in the Company’s Mexican income tax expense and the amount of income taxes paid in Mexico. The Company hedges its exposure to this cash tax risk by entering into foreign currency forward contracts and foreign currency option contracts known as zero-cost collars.
The foreign currency forward contracts involve the Company’s purchase of pesos at an agreed-upon weighted-average exchange rate to each U.S dollar. The zero-cost collars involve the Company’s purchase of a Mexican peso call option and a simultaneous sale of a Mexican peso put option, with equivalent U.S. dollar notional amounts for each option and no net cash premium paid by the Company. The Company’s foreign currency forward and zero-cost collar contracts are executed with counterparties in the U.S. and are governed by International Swaps and Derivatives Association agreements that include standard netting arrangements. Asset and liability positions from contracts with the same counterparty are net settled upon maturity/expiration and presented on a net basis in the consolidated balance sheets prior to settlement. There was no offsetting of derivative assets or liabilities in the consolidated balance sheets as of
March 31, 2019
and
December 31, 2018
.
Below is a summary of the Company’s 2019 and 2018 foreign currency derivative contracts
(amounts in millions, except Ps./USD)
:
|
Foreign currency forward contracts
|
||||||||||||||||||||||||||||
|
Contracts to purchase Ps./pay USD
|
Offsetting contracts to sell Ps./receive USD
|
|||||||||||||||||||||||||||
|
Notional amount
|
Notional amount
|
Weighted-average exchange rate
(in Ps./USD)
|
Notional amount
|
Notional amount
|
Weighted-average exchange rate
(in Ps./USD)
|
Cash received/(paid) on settlement
|
||||||||||||||||||||||
|
Contracts executed in 2019 and outstanding
|
$
|
275.0
|
|
Ps.
|
5,504.6
|
|
Ps.
|
20.0
|
|
—
|
|
—
|
|
—
|
|
—
|
|
|||||||||||
|
Contracts executed in 2019 and settled in 2019
|
$
|
75.0
|
|
Ps.
|
1,448.6
|
|
Ps.
|
19.3
|
|
$
|
75.4
|
|
Ps.
|
1,448.6
|
|
Ps.
|
19.2
|
|
$
|
0.4
|
|
|||||||
|
Foreign currency zero-cost collar contracts
|
||||||||||||||||||||||||||||
|
Notional amount
|
Cash received/(paid) on settlement
|
|||||||||||||||||||||||||||
|
Contracts executed in 2018 and settled in 2019
|
$
|
120.0
|
|
$
|
0.3
|
|
||||||||||||||||||||||
|
Contracts executed in 2018 and settled in 2018 (i)
|
$
|
220.0
|
|
$
|
3.9
|
|
||||||||||||||||||||||
|
Contracts executed in 2017 and settled in 2018 (i)
|
$
|
80.0
|
|
$
|
10.0
|
|
||||||||||||||||||||||
(i) During the first quarter of 2018, the Company settled
$85.0 million
and
$80.0 million
of zero-cost collar contracts executed in 2018 and 2017, respectively, resulting in cash received of
$2.1 million
and
$10.0 million
.
The Company has not designated any of the foreign currency derivative contracts as hedging instruments for accounting purposes. The Company measures the foreign currency derivative contracts at fair value each period and recognizes any change in fair value in foreign exchange gain within the consolidated statements of income. The cash flows associated with these instruments is classified as an operating activity within the consolidated statements of cash flows.
14
Kansas City Southern and Subsidiaries
Notes to the Unaudited Consolidated Financial Statements—(Continued)
The following tables present the fair value of derivative instruments included in the Consolidated Balance Sheets (
in millions
):
|
Derivative Assets
|
|||||||||
|
|
Balance Sheet Location
|
March 31,
2019 |
December 31, 2018
|
||||||
|
Derivatives not designated as hedging instruments:
|
|||||||||
|
Foreign currency forward contracts
|
Other current assets
|
$
|
3.2
|
|
$
|
—
|
|
||
|
Foreign currency zero-cost collar contracts
|
Other current assets
|
—
|
|
0.3
|
|
||||
|
Total derivatives not designated as hedging instruments
|
3.2
|
|
0.3
|
|
|||||
|
Total derivative assets
|
$
|
3.2
|
|
$
|
0.3
|
|
|||
|
Derivative Liabilities
|
|||||||||
|
Balance Sheet Location
|
March 31,
2019 |
December 31, 2018
|
|||||||
|
Derivatives designated as hedging instruments:
|
|||||||||
|
Treasury lock agreements
|
Other noncurrent liabilities and deferred credits
|
$
|
8.8
|
|
$
|
2.0
|
|
||
|
Total derivatives designated as hedging instruments
|
8.8
|
|
2.0
|
|
|||||
|
Total derivative liabilities
|
$
|
8.8
|
|
$
|
2.0
|
|
|||
The following table presents the effects of derivative instruments on the Consolidated Statements of Income and Consolidated Statements of Comprehensive Income
(in millions)
:
|
Derivatives in Cash Flow Hedging Relationships
|
Amount of Gain/(Loss) Recognized in OCI on Derivative
|
|||||||||
|
Three Months Ended
|
||||||||||
|
March 31,
|
||||||||||
|
|
2019
|
2018
|
||||||||
|
Treasury lock agreements
|
$
|
(6.8
|
)
|
$
|
6.1
|
|
||||
|
Total
|
$
|
(6.8
|
)
|
$
|
6.1
|
|
||||
|
|
||||||||||
|
Derivatives Not Designated as Hedging Instruments
|
Location of Gain/(Loss) Recognized in Income on Derivative
|
Amount of Gain/(Loss) Recognized in Income on Derivative
|
||||||||
|
Three Months Ended
|
||||||||||
|
March 31,
|
||||||||||
|
2019
|
2018
|
|||||||||
|
Foreign currency forward contracts
|
Foreign exchange gain
|
$
|
3.6
|
|
$
|
—
|
|
|||
|
Foreign currency zero-cost collar contracts
|
Foreign exchange gain
|
—
|
|
16.5
|
|
|||||
|
Total
|
$
|
3.6
|
|
$
|
16.5
|
|
||||
See Note 8, Fair Value Measurements, for the determination of the fair values of derivatives.
10. Short-Term Borrowings
Commercial Paper.
The Company’s commercial paper program generally serves as the primary means of short-term funding. As of
March 31, 2019
and
December 31, 2018
, KCS had
no
commercial paper outstanding. For the three months ended
March 31, 2019
and
2018
, any commercial paper borrowings were outstanding for less than
90 days
and the related activity is presented on a net basis in the consolidated statements of cash flows.
15
Kansas City Southern and Subsidiaries
Notes to the Unaudited Consolidated Financial Statements—(Continued)
Revolving Senior Credit Facility
On March 8, 2019, KCS, with certain of its domestic subsidiaries named therein as guarantors, entered into a new
five
-year,
$600.0 million
senior unsecured revolving credit facility (the “Facility”), with a
$25.0 million
standby letter of credit facility which, if utilized, constitutes usage under the Facility. The Facility replaced KCS’s existing
$800.0 million
revolving credit facility. The Facility serves as a backstop for the commercial paper program, which generally serves as the Company’s primary means of short-term funding.
Borrowings under the Revolving Credit Facility will bear interest at floating rates. Depending on the Company’s credit rating, the margin that KCS would pay above the London Interbank Offered Rate (“LIBOR”) at any point would be between
1.000%
and
1.750%
. As of March 31, 2019, the margin is
1.25%
based on KCS’s current credit rating.
The Facility is guaranteed by KCSR, together with certain domestic subsidiaries named therein as guarantors, and matures on
March 8, 2024
. The Facility agreement contains representations, warranties, covenants and events of default that are customary for credit agreements of this type. The occurrence of an event of default could result in the termination of the commitments and the acceleration of the repayment of any outstanding principal balance on the Facility and the commercial paper program.
The Facility was categorized as a debt modification and the Company incurred
$2.5 million
of debt issuance costs, which were capitalized and will be amortized over the life of the related debt instrument. The Company recorded debt retirement costs of
$0.6 million
to write off previously capitalized debt issuance costs.
As of March 31, 2019, KCS had
$600.0 million
available under the Facility, with
no
outstanding borrowings. As of December 31, 2018, KCS had
$800.0 million
available under its previous revolving credit facility, with
no
outstanding borrowings.
12
. Share Repurchases
During the three months ended
March 31, 2019
, KCS repurchased
465,523
shares of common stock for
$50.3 million
at an average price of
$108.02
per share. Since inception of the August 2017 common share repurchase program, KCS has repurchased
5,157,205
shares of common stock for
$548.6 million
at an average price of
$106.37
per share. The excess of repurchase price over par value is allocated between additional paid-in capital and retained earnings.
During the three months ended
March 31, 2019
, KCS repurchased
2,110
shares of its
$25
par preferred stock for less than
$0.1 million
at an average price of
$26.40
per share. The excess of repurchase price over par value is allocated between additional paid-in capital and retained earnings.
13
. Commitments and Contingencies
Concession Duty.
Under KCSM’s
50
-year railroad concession from the Mexican government (the “Concession”), which could expire in 2047 unless extended, KCSM pays annual concession duty expense of
1.25%
of gross revenues. For the
three
months ended
March 31, 2019
, the concession duty expense, which is recorded within materials and other in operating expenses, was
$4.2 million
, compared to
$4.1 million
for the same period in
2018
.
Litigation.
The Company is a party to various legal proceedings and administrative actions, all of which are of an ordinary, routine nature and incidental to its operations. Included in these proceedings are various tort claims brought by current and former employees for job-related injuries and by third parties for injuries related to railroad operations. KCS aggressively defends these matters and has established liability provisions, which management believes are adequate to cover expected costs. Although it is not possible to predict the outcome of any legal proceeding, in the opinion of management, such proceedings and actions should not, individually, or in the aggregate, have a material adverse effect on the Company’s consolidated financial statements.
Environmental Liabilities.
The Company’s U.S. operations are subject to extensive federal, state and local environmental laws and regulations. The major U.S. environmental laws to which the Company is subject include, among others, the Federal Comprehensive Environmental Response, Compensation and Liability Act (“CERCLA,” also known as the Superfund law), the Toxic Substances Control Act, the Federal Water Pollution Control Act, and the Hazardous Materials Transportation Act. CERCLA can impose joint and several liabilities for cleanup and investigation costs, without regard to fault or legality of the original conduct, on current and predecessor owners and operators of a site, as well as those who generate, or arrange for the disposal of, hazardous substances. The Company does not believe that compliance with the requirements imposed by the environmental legislation will impair its competitive capability or result in any material additional capital expenditures, operating or maintenance costs. The Company is, however, subject to environmental remediation costs as described in the following paragraphs.
16
Kansas City Southern and Subsidiaries
Notes to the Unaudited Consolidated Financial Statements—(Continued)
The Company’s Mexico operations are subject to Mexican federal and state laws and regulations relating to the protection of the environment through the establishment of standards for water discharge, water supply, emissions, noise pollution, hazardous substances and transportation and handling of hazardous and solid waste. The Mexican government may bring administrative and criminal proceedings, impose economic sanctions against companies that violate environmental laws, and temporarily or even permanently close non-complying facilities.
The risk of incurring environmental liability is inherent in the railroad industry. As part of serving the petroleum and chemicals industry, the Company transports hazardous materials and has a professional team available to respond to and handle environmental issues that might occur in the transport of such materials.
The Company performs ongoing reviews and evaluations of the various environmental programs and issues within the Company’s operations, and, as necessary, takes actions intended to limit the Company’s exposure to potential liability. Although these costs cannot be predicted with certainty, management believes that the ultimate outcome of identified matters will not have a material adverse effect on the Company’s consolidated financial statements.
Personal Injury.
The Company’s personal injury liability is based on semi-annual actuarial studies performed on an undiscounted basis by an independent third party actuarial firm and reviewed by management. This liability is based on personal injury claims filed and an estimate of claims incurred but not yet reported. Actual results may vary from estimates due to the number, type and severity of the injury, costs of medical treatments and uncertainties in litigation. Adjustments to the liability are reflected within operating expenses in the period in which changes to estimates are known. Personal injury claims in excess of self-insurance levels are insured up to certain coverage amounts, depending on the type of claim and year of occurrence. The personal injury liability as of
March 31, 2019
, was based on an updated actuarial study of personal injury claims through November 30, 2018, and review of the last four months’ experience. Although these estimates cannot be predicted with certainty, management believes that the ultimate outcome will not have a material adverse effect on the Company’s consolidated financial statements.
Tax Contingencies
. Tax returns filed in the U.S. for periods after 2014 and in Mexico for periods after 2012 remain open to examination by the taxing authorities. In 2018, the IRS initiated an examination of the 2016 U.S. federal tax return. During the first quarter of 2019, the Servicio de Administración Tributaria (the “SAT”), the Mexican equivalent of the IRS, initiated an audit of the KCSM 2013 and 2014 Mexico tax returns. The Company does not expect that these examinations will have a material impact on the consolidated financial statements. During the first quarter of 2017, the Company received audit assessments from the SAT for the KCSM 2009 and 2010 Mexico tax returns. In 2017, the Company commenced administrative actions with the SAT. During the first quarter of 2018, the audit assessments were nullified by the SAT. In the third quarter of 2018, the SAT issued new assessments and the Company filed administrative appeals with the SAT. The Company believes that it has strong legal arguments in its favor and it is more likely than not that it will prevail in any challenge of the assessments.
The Company litigated a Value Added Tax (“VAT”) audit assessment from the SAT for KCSM for the year ended December 31, 2005. In November 2016, KCSM was notified of a resolution by the Mexican tax court annulling this assessment. The SAT appealed this resolution to the Mexican circuit court. In September 2017, KCSM was notified of a resolution by the circuit court which ordered the tax court to consider an argument made by KCSM in the original tax court proceeding that was not addressed in the tax court’s November 2016 resolution. In October 2017, the tax court ruled that the arguments made by KCSM asserting that the SAT unduly extended the audit process were not valid, and also annulled the assessment consistent with the tax court’s earlier November 2016 ruling. In December 2017, KCSM and the SAT filed an appeal with the Federal Courts of Appeals. In November 2018, the Appeals Court issued a ruling denying the SAT appeal and permanently annulled the VAT assessment. The SAT is unable to appeal the decision. The Appeals Court also denied KCSM’s appeal. In February 2019, the SAT issued a new assessment that conflicted with the tax court’s guidelines. As such, in March 2019, KCSM filed a complaint with the tax court to require the SAT to follow the guidelines issued by the tax court that would result in no tax being assessed. In addition, in April 2019 the Company filed a nullification lawsuit with the tax court. Therefore, the Company believes any new assessment based on the tax court’s guidelines should not have a material impact to the Company’s consolidated financial statements.
KCSM has not historically assessed VAT on international import transportation services provided to its customers based on a written ruling that KCSM obtained from the SAT in 2008 stating that such services were not subject to VAT (the “2008 Ruling”). Notwithstanding the 2008 Ruling, in December 2013, the SAT unofficially informed KCSM of an intended implementation of new criteria effective as of January 1, 2014, pursuant to which VAT would be assessed on all international import transportation services on the portion of the services provided within Mexico. Additionally, in November 2013, the SAT filed an action to nullify the 2008 Ruling, potentially exposing the application of the new criteria to open tax years. In February 2014, KCSM filed an action opposing the SAT’s nullification action. In December 2016, KCSM was notified of a resolution issued by the Mexican tax court confirming the 2008 Ruling. The SAT appealed this resolution. In October 2017, the circuit court resolved to not render a decision on the case but
17
Kansas City Southern and Subsidiaries
Notes to the Unaudited Consolidated Financial Statements—(Continued)
rather to send the SAT’s appeal to the Supreme Court. In February 2018, the Supreme Court decided not to hear the case and remanded the SAT’s appeal back to the circuit court for a decision. In July 2018, the circuit court ordered the tax court to consider certain arguments made by the SAT in the original court proceeding that were not addressed in the tax court’s December 2016 resolution. On October 2, 2018, the tax court issued a decision confirming the 2008 Ruling. The SAT has appealed this decision. The Company believes it is more likely than not that it will continue to prevail in this matter. Further, as of the date of this filing, the SAT has not implemented any new criteria regarding the assessment of VAT on international import transportation services. The Company believes it is probable that any unexpected nullification of the 2008 Ruling and the implementation of any new VAT criteria would be applied on a prospective basis, in which case, due to the pass-through nature of VAT, KCSM would begin to assess its customers for VAT on international import transportation services, resulting in no material impact to the Company’s consolidated financial statements.
Contractual Agreements.
In the normal course of business, the Company enters into various contractual agreements related to commercial arrangements and the use of other railroads’ or governmental entities’ infrastructure needed for the operations of the business. The Company is involved or may become involved in certain disputes involving transportation rates, product loss or damage, charges, and interpretations related to these agreements. While the outcome of these matters cannot be predicted with certainty, the Company believes that, when resolved, these disputes will not have a material effect on its consolidated financial statements.
Credit Risk.
The Company continually monitors risks related to economic changes and certain customer receivables concentrations. Significant changes in customer concentration or payment terms, deterioration of customer creditworthiness, bankruptcy, insolvency or liquidation of a customer, or weakening in economic trends could have a significant impact on the collectability of the Company’s receivables and its operating results. If the financial condition of the Company’s customers were to deteriorate and result in an impairment of their ability to make payments, additional allowances may be required. The Company has recorded provisions for uncollectability based on its best estimate at
March 31, 2019
.
Panama Canal Railway Company (“PCRC”) Guarantees and Indemnities.
At
March 31, 2019
, the Company had issued and outstanding
$5.6 million
under a standby letter of credit to fulfill its obligation to fund
fifty percent
of the debt service reserve and liquidity reserve established by PCRC in connection with the issuance of the
7.0%
Senior Secured Notes due
November 1, 2026
(the “PCRC Notes”). Additionally, KCS has pledged its shares of PCRC as security for the PCRC Notes.
14
. Geographic Information
The Company strategically manages its rail operations as
one
reportable business segment over a single coordinated rail network that extends from the midwest and southeast portions of the United States south into Mexico and connects with other Class I railroads. Financial information reported at this level, such as revenues, operating income and cash flows from operations, is used by corporate management, including the Company’s chief operating decision-maker, in evaluating overall financial and operational performance, market strategies, as well as the decisions to allocate capital resources. The Company’s chief operating decision-maker is the chief executive officer.
The following tables provide information by geographic area
(in millions)
:
|
Three Months Ended
|
|||||||
|
March 31,
|
|||||||
|
Revenues
|
2019
|
2018
|
|||||
|
U.S.
|
$
|
365.6
|
|
$
|
335.2
|
|
|
|
Mexico
|
309.2
|
|
303.4
|
|
|||
|
Total revenues
|
$
|
674.8
|
|
$
|
638.6
|
|
|
|
Property and equipment (including concession assets), net
|
March 31,
2019 |
December 31,
2018 |
|||||
|
U.S.
|
$
|
5,407.9
|
|
$
|
5,401.3
|
|
|
|
Mexico
|
3,286.4
|
|
3,289.8
|
|
|||
|
Total property and equipment (including concession assets), net
|
$
|
8,694.3
|
|
$
|
8,691.1
|
|
|
18
Kansas City Southern and Subsidiaries
Notes to the Unaudited Consolidated Financial Statements—(Continued)
15. Condensed Consolidating Financial Information
Pursuant to SEC Regulation S-X Rule 3-10 “Financial statements of guarantors and issuers of guaranteed securities registered or being registered,” the Company is required to provide condensed consolidating financial information for issuers of certain of its senior notes that are guaranteed.
As of
March 31, 2019
, KCS, the parent, had outstanding
$2,593.5 million
principal amount of senior notes due through
2048
. The senior notes are unsecured obligations of KCS, and are also jointly and severally and fully and unconditionally guaranteed on an unsecured senior basis by The Kansas City Southern Railway Company (“KCSR”) and certain wholly-owned domestic subsidiaries of KCS (the “Guarantor Subsidiaries”).
As of
March 31, 2019
, KCSR had outstanding
$2.7 million
principal amount of senior notes due through 2045. The senior notes are unsecured obligations of KCSR, and are also jointly and severally and fully and unconditionally guaranteed on an unsecured senior basis by KCS and the Guarantor Subsidiaries.
The following condensed and consolidating financial information (
in millions
) of KCS, KCSR, the Guarantor Subsidiaries and the other KCS subsidiaries that are not guarantors (the "Non-Guarantor Subsidiaries") are being presented in order to meet the reporting requirements under Rule 3-10 of Regulation S-X. Pursuant to Rule 3-10(d) and (f) of Regulation S-X, separate financial statements for the Issuer, the Parent and the Guarantor Subsidiaries are not required to be filed with the SEC as the subsidiary debt issuer and the guarantors are directly or indirectly 100% owned by the Parent and the guarantees are full and unconditional and joint and several.
Condensed Consolidating Statements of Comprehensive Income
|
Three Months Ended March 31, 2019
|
|||||||||||||||||||||||
|
Parent
|
KCSR
|
Guarantor
Subsidiaries
|
Non-Guarantor
Subsidiaries
|
Consolidating
Adjustments
|
Consolidated
KCS
|
||||||||||||||||||
|
Revenues
|
$
|
—
|
|
$
|
324.2
|
|
$
|
11.7
|
|
$
|
349.3
|
|
$
|
(10.4
|
)
|
$
|
674.8
|
|
|||||
|
Operating expenses
|
1.2
|
|
291.1
|
|
9.6
|
|
223.2
|
|
(10.6
|
)
|
514.5
|
|
|||||||||||
|
Operating income (loss)
|
(1.2
|
)
|
33.1
|
|
2.1
|
|
126.1
|
|
0.2
|
|
160.3
|
|
|||||||||||
|
Equity in net earnings (losses) of affiliates
|
102.4
|
|
(0.3
|
)
|
0.7
|
|
1.3
|
|
(102.4
|
)
|
1.7
|
|
|||||||||||
|
Interest expense
|
(26.4
|
)
|
(21.4
|
)
|
—
|
|
(7.1
|
)
|
26.7
|
|
(28.2
|
)
|
|||||||||||
|
Debt retirement costs
|
(0.2
|
)
|
(0.2
|
)
|
—
|
|
(0.2
|
)
|
—
|
|
(0.6
|
)
|
|||||||||||
|
Foreign exchange gain
|
—
|
|
—
|
|
—
|
|
4.6
|
|
—
|
|
4.6
|
|
|||||||||||
|
Other income (expense), net
|
26.5
|
|
(0.4
|
)
|
—
|
|
0.8
|
|
(26.8
|
)
|
0.1
|
|
|||||||||||
|
Income before income taxes
|
101.1
|
|
10.8
|
|
|
2.8
|
|
|
125.5
|
|
|
(102.3
|
)
|
137.9
|
|
||||||||
|
Income tax expense (benefit)
|
(1.7
|
)
|
1.9
|
|
0.7
|
|
33.8
|
|
—
|
|
34.7
|
|
|||||||||||
|
Net income
|
102.8
|
|
8.9
|
|
|
2.1
|
|
|
91.7
|
|
|
(102.3
|
)
|
103.2
|
|
||||||||
|
Less: Net income attributable to noncontrolling interest
|
—
|
|
—
|
|
—
|
|
0.4
|
|
—
|
|
0.4
|
|
|||||||||||
|
Net income attributable to Kansas City Southern and subsidiaries
|
102.8
|
|
8.9
|
|
|
2.1
|
|
|
91.3
|
|
|
(102.3
|
)
|
102.8
|
|
||||||||
|
Other comprehensive income (loss)
|
(4.9
|
)
|
—
|
|
—
|
|
0.2
|
|
(0.2
|
)
|
(4.9
|
)
|
|||||||||||
|
Comprehensive income attributable to Kansas City Southern and subsidiaries
|
$
|
97.9
|
|
$
|
8.9
|
|
$
|
2.1
|
|
$
|
91.5
|
|
$
|
(102.5
|
)
|
$
|
97.9
|
|
|||||
19
Kansas City Southern and Subsidiaries
Notes to the Unaudited Consolidated Financial Statements—(Continued)
Condensed Consolidating Statements of Comprehensive Income—(Continued)
|
Three Months Ended March 31, 2018
|
|||||||||||||||||||||||
|
Parent
|
KCSR
|
Guarantor
Subsidiaries
|
Non-Guarantor
Subsidiaries
|
Consolidating
Adjustments
|
Consolidated
KCS
|
||||||||||||||||||
|
Revenues
|
$
|
—
|
|
$
|
301.8
|
|
$
|
8.9
|
|
$
|
336.8
|
|
$
|
(8.9
|
)
|
$
|
638.6
|
|
|||||
|
Operating expenses
|
1.2
|
|
225.8
|
|
8.2
|
|
193.6
|
|
(8.9
|
)
|
419.9
|
|
|||||||||||
|
Operating income (loss)
|
(1.2
|
)
|
76.0
|
|
0.7
|
|
143.2
|
|
—
|
|
218.7
|
|
|||||||||||
|
Equity in net earnings (losses) of affiliates
|
154.7
|
|
(0.2
|
)
|
0.8
|
|
0.6
|
|
(154.9
|
)
|
1.0
|
|
|||||||||||
|
Interest expense
|
(21.3
|
)
|
(17.3
|
)
|
—
|
|
(6.9
|
)
|
20.0
|
|
(25.5
|
)
|
|||||||||||
|
Debt retirement costs
|
—
|
|
—
|
|
—
|
|
—
|
|
—
|
|
—
|
|
|||||||||||
|
Foreign exchange gain
|
—
|
|
—
|
|
—
|
|
27.8
|
|
—
|
|
27.8
|
|
|||||||||||
|
Other income (expense), net
|
19.6
|
|
(0.3
|
)
|
—
|
|
0.5
|
|
(20.1
|
)
|
(0.3
|
)
|
|||||||||||
|
Income before income taxes
|
151.8
|
|
58.2
|
|
1.5
|
|
165.2
|
|
(155.0
|
)
|
221.7
|
|
|||||||||||
|
Income tax expense
|
7.3
|
|
12.4
|
|
0.4
|
|
56.7
|
|
—
|
|
76.8
|
|
|||||||||||
|
Net income
|
144.5
|
|
45.8
|
|
1.1
|
|
108.5
|
|
(155.0
|
)
|
144.9
|
|
|||||||||||
|
Less: Net income attributable to noncontrolling interest
|
—
|
|
—
|
|
—
|
|
0.4
|
|
—
|
|
0.4
|
|
|||||||||||
|
Net income attributable to Kansas City Southern and subsidiaries
|
144.5
|
|
45.8
|
|
1.1
|
|
108.1
|
|
(155.0
|
)
|
144.5
|
|
|||||||||||
|
Other comprehensive income
|
5.7
|
|
—
|
|
—
|
|
1.2
|
|
(1.2
|
)
|
5.7
|
|
|||||||||||
|
Comprehensive income attributable to Kansas City Southern and subsidiaries
|
$
|
150.2
|
|
$
|
45.8
|
|
$
|
1.1
|
|
$
|
109.3
|
|
$
|
(156.2
|
)
|
$
|
150.2
|
|
|||||
Condensed Consolidating Balance Sheets
|
March 31, 2019
|
|||||||||||||||||||||||
|
Parent
|
KCSR
|
Guarantor
Subsidiaries
|
Non-Guarantor
Subsidiaries
|
Consolidating
Adjustments
|
Consolidated
KCS
|
||||||||||||||||||
|
Assets:
|
|||||||||||||||||||||||
|
Current assets
|
$
|
217.6
|
|
$
|
256.9
|
|
$
|
6.1
|
|
$
|
392.0
|
|
$
|
(218.2
|
)
|
$
|
654.4
|
|
|||||
|
Operating lease right-of-use assets
|
—
|
|
170.1
|
|
—
|
|
33.4
|
|
(4.4
|
)
|
199.1
|
|
|||||||||||
|
Investments
|
—
|
|
3.6
|
|
5.6
|
|
38.6
|
|
—
|
|
47.8
|
|
|||||||||||
|
Investments in consolidated subsidiaries
|
4,921.0
|
|
3.8
|
|
195.6
|
|
—
|
|
(5,120.4
|
)
|
—
|
|
|||||||||||
|
Property and equipment (including concession assets), net
|
—
|
|
4,426.2
|
|
163.2
|
|
4,112.8
|
|
(7.9
|
)
|
8,694.3
|
|
|||||||||||
|
Other assets
|
2,523.1
|
|
16.2
|
|
—
|
|
23.8
|
|
(2,521.0
|
)
|
42.1
|
|
|||||||||||
|
Total assets
|
$
|
7,661.7
|
|
$
|
4,876.8
|
|
$
|
370.5
|
|
$
|
4,600.6
|
|
$
|
(7,871.9
|
)
|
$
|
9,637.7
|
|
|||||
|
Liabilities and equity:
|
|||||||||||||||||||||||
|
Current liabilities
|
$
|
247.1
|
|
$
|
128.8
|
|
$
|
77.9
|
|
$
|
247.3
|
|
$
|
(220.5
|
)
|
$
|
480.6
|
|
|||||
|
Long-term operating lease liabilities
|
—
|
|
91.0
|
|
—
|
|
18.1
|
|
(3.5
|
)
|
105.6
|
|
|||||||||||
|
Long-term debt
|
2,563.7
|
|
1,828.3
|
|
—
|
|
806.6
|
|
(2,521.0
|
)
|
2,677.6
|
|
|||||||||||
|
Deferred income taxes
|
(4.3
|
)
|
814.5
|
|
84.7
|
|
192.3
|
|
(2.0
|
)
|
1,085.2
|
|
|||||||||||
|
Other liabilities
|
27.1
|
|
96.4
|
|
0.2
|
|
15.0
|
|
—
|
|
138.7
|
|
|||||||||||
|
Stockholders’ equity
|
4,828.1
|
|
1,917.8
|
|
207.7
|
|
2,999.4
|
|
(5,124.9
|
)
|
4,828.1
|
|
|||||||||||
|
Noncontrolling interest
|
—
|
|
—
|
|
—
|
|
321.9
|
|
—
|
|
321.9
|
|
|||||||||||
|
Total liabilities and equity
|
$
|
7,661.7
|
|
$
|
4,876.8
|
|
$
|
370.5
|
|
$
|
4,600.6
|
|
$
|
(7,871.9
|
)
|
$
|
9,637.7
|
|
|||||
20
Kansas City Southern and Subsidiaries
Notes to the Unaudited Consolidated Financial Statements—(Continued)
Condensed Consolidating Balance Sheets—(Continued)
|
|
December 31, 2018
|
||||||||||||||||||||||
|
Parent
|
KCSR
|
Guarantor
Subsidiaries
|
Non-Guarantor
Subsidiaries
|
Consolidating
Adjustments
|
Consolidated
KCS
|
||||||||||||||||||
|
Assets:
|
|||||||||||||||||||||||
|
Current assets
|
$
|
229.8
|
|
$
|
257.6
|
|
$
|
5.0
|
|
$
|
350.4
|
|
$
|
(207.4
|
)
|
$
|
635.4
|
|
|||||
|
Operating lease right-of-use assets
|
—
|
|
—
|
|
—
|
|
—
|
|
—
|
|
—
|
|
|||||||||||
|
Investments
|
—
|
|
3.9
|
|
4.4
|
|
36.6
|
|
—
|
|
44.9
|
|
|||||||||||
|
Investments in consolidated subsidiaries
|
4,852.8
|
|
4.4
|
|
190.2
|
|
—
|
|
(5,047.4
|
)
|
—
|
|
|||||||||||
|
Property and equipment (including concession assets), net
|
—
|
|
4,429.2
|
|
165.1
|
|
4,104.8
|
|
(8.0
|
)
|
8,691.1
|
|
|||||||||||
|
Other assets
|
2,523.4
|
|
59.3
|
|
—
|
|
36.8
|
|
(2,521.1
|
)
|
98.4
|
|
|||||||||||
|
Total assets
|
$
|
7,606.0
|
|
$
|
4,754.4
|
|
$
|
364.7
|
|
$
|
4,528.6
|
|
$
|
(7,783.9
|
)
|
$
|
9,469.8
|
|
|||||
|
Liabilities and equity:
|
|||||||||||||||||||||||
|
Current liabilities
|
$
|
214.2
|
|
$
|
109.2
|
|
$
|
80.1
|
|
$
|
252.3
|
|
$
|
(208.8
|
)
|
$
|
447.0
|
|
|||||
|
Long-term operating lease liabilities
|
—
|
|
—
|
|
—
|
|
—
|
|
—
|
|
—
|
|
|||||||||||
|
Long-term debt
|
2,563.0
|
|
1,828.8
|
|
—
|
|
808.5
|
|
(2,521.0
|
)
|
2,679.3
|
|
|||||||||||
|
Deferred income taxes
|
(4.4
|
)
|
812.8
|
|
84.7
|
|
188.8
|
|
(2.0
|
)
|
1,079.9
|
|
|||||||||||
|
Other liabilities
|
20.2
|
|
94.8
|
|
0.2
|
|
15.8
|
|
(0.1
|
)
|
130.9
|
|
|||||||||||
|
Stockholders’ equity
|
4,813.0
|
|
1,908.8
|
|
199.7
|
|
2,943.5
|
|
(5,052.0
|
)
|
4,813.0
|
|
|||||||||||
|
Noncontrolling interest
|
—
|
|
—
|
|
—
|
|
319.7
|
|
—
|
|
319.7
|
|
|||||||||||
|
Total liabilities and equity
|
$
|
7,606.0
|
|
$
|
4,754.4
|
|
$
|
364.7
|
|
$
|
4,528.6
|
|
$
|
(7,783.9
|
)
|
$
|
9,469.8
|
|
|||||
21
Kansas City Southern and Subsidiaries
Notes to the Unaudited Consolidated Financial Statements—(Continued)
Condensed Consolidating Statements of Cash Flows
|
Three Months Ended March 31, 2019
|
|||||||||||||||||||||||
|
Parent
|
KCSR
|
Guarantor
Subsidiaries
|
Non-Guarantor
Subsidiaries
|
Consolidating
Adjustments
|
Consolidated
KCS
|
||||||||||||||||||
|
Operating activities:
|
|||||||||||||||||||||||
|
Net cash provided
|
$
|
65.4
|
|
$
|
109.7
|
|
$
|
0.1
|
|
$
|
137.6
|
|
$
|
(40.1
|
)
|
$
|
272.7
|
|
|||||
|
Investing activities:
|
|||||||||||||||||||||||
|
Capital expenditures
|
—
|
|
(113.5
|
)
|
(0.1
|
)
|
(66.3
|
)
|
—
|
|
(179.9
|
)
|
|||||||||||
|
Purchase or replacement of equipment under operating leases
|
—
|
|
—
|
|
—
|
|
—
|
|
—
|
|
—
|
|
|||||||||||
|
Property investments in MSLLC
|
—
|
|
—
|
|
—
|
|
(4.7
|
)
|
—
|
|
(4.7
|
)
|
|||||||||||
|
Investments in and advances to affiliates
|
(5.9
|
)
|
—
|
|
(5.9
|
)
|
(7.2
|
)
|
10.6
|
|
(8.4
|
)
|
|||||||||||
|
Proceeds from repayment of loans to affiliates
|
—
|
|
—
|
|
—
|
|
—
|
|
—
|
|
—
|
|
|||||||||||
|
Loans to affiliates
|
—
|
|
—
|
|
—
|
|
—
|
|
—
|
|
—
|
|
|||||||||||
|
Proceeds from disposal of property
|
—
|
|
1.4
|
|
—
|
|
0.8
|
|
—
|
|
2.2
|
|
|||||||||||
|
Other investing activities
|
—
|
|
(4.9
|
)
|
—
|
|
6.0
|
|
—
|
|
1.1
|
|
|||||||||||
|
Net cash used
|
(5.9
|
)
|
(117.0
|
)
|
(6.0
|
)
|
(71.4
|
)
|
10.6
|
|
(189.7
|
)
|
|||||||||||
|
Financing activities:
|
|||||||||||||||||||||||
|
Net short-term borrowings
|
—
|
|
—
|
|
—
|
|
—
|
|
—
|
|
—
|
|
|||||||||||
|
Repayment of long-term debt
|
—
|
|
(0.9
|
)
|
—
|
|
(1.8
|
)
|
—
|
|
(2.7
|
)
|
|||||||||||
|
Debt issuance costs paid
|
—
|
|
(0.3
|
)
|
—
|
|
(1.3
|
)
|
—
|
|
(1.6
|
)
|
|||||||||||
|
Dividends paid
|
(36.4
|
)
|
—
|
|
—
|
|
(40.1
|
)
|
40.1
|
|
(36.4
|
)
|
|||||||||||
|
Shares repurchased
|
(50.3
|
)
|
—
|
|
—
|
|
—
|
|
—
|
|
(50.3
|
)
|
|||||||||||
|
Proceeds from loans from affiliates
|
—
|
|
—
|
|
—
|
|
—
|
|
—
|
|
—
|
|
|||||||||||
|
Repayment of loans from affiliates
|
—
|
|
—
|
|
—
|
|
—
|
|
—
|
|
—
|
|
|||||||||||
|
Contribution from affiliates
|
—
|
|
—
|
|
5.9
|
|
4.7
|
|
(10.6
|
)
|
—
|
|
|||||||||||
|
Other financing activities
|
0.2
|
|
—
|
|
—
|
|
—
|
|
—
|
|
0.2
|
|
|||||||||||
|
Net cash provided (used)
|
(86.5
|
)
|
(1.2
|
)
|
5.9
|
|
(38.5
|
)
|
29.5
|
|
(90.8
|
)
|
|||||||||||
|
Cash and cash equivalents:
|
|||||||||||||||||||||||
|
Net increase (decrease)
|
(27.0
|
)
|
(8.5
|
)
|
—
|
|
27.7
|
|
—
|
|
(7.8
|
)
|
|||||||||||
|
At beginning of year
|
41.5
|
|
28.1
|
|
—
|
|
30.9
|
|
—
|
|
100.5
|
|
|||||||||||
|
At end of period
|
$
|
14.5
|
|
$
|
19.6
|
|
$
|
—
|
|
$
|
58.6
|
|
$
|
—
|
|
$
|
92.7
|
|
|||||
22
Kansas City Southern and Subsidiaries
Notes to the Unaudited Consolidated Financial Statements—(Continued)
Condensed Consolidating Statements of Cash Flows—(Continued)
|
Three Months Ended March 31, 2018
|
|||||||||||||||||||||||
|
Parent
|
KCSR
|
Guarantor
Subsidiaries
|
Non-Guarantor
Subsidiaries
|
Consolidating
Adjustments
|
Consolidated
KCS
|
||||||||||||||||||
|
Operating activities:
|
|||||||||||||||||||||||
|
Net cash provided
|
$
|
3.2
|
|
$
|
22.5
|
|
$
|
0.1
|
|
$
|
114.8
|
|
$
|
—
|
|
$
|
140.6
|
|
|||||
|
Investing activities:
|
|||||||||||||||||||||||
|
Capital expenditures
|
—
|
|
(49.4
|
)
|
—
|
|
(60.6
|
)
|
—
|
|
(110.0
|
)
|
|||||||||||
|
Purchase or replacement of equipment under operating leases
|
—
|
|
(11.2
|
)
|
—
|
|
—
|
|
—
|
|
(11.2
|
)
|
|||||||||||
|
Property investments in MSLLC
|
—
|
|
—
|
|
—
|
|
(3.9
|
)
|
—
|
|
(3.9
|
)
|
|||||||||||
|
Investment in and advances to affiliates
|
(0.2
|
)
|
—
|
|
(0.2
|
)
|
(0.2
|
)
|
0.4
|
|
(0.2
|
)
|
|||||||||||
|
Proceeds from repayment of loans to affiliates
|
2,576.9
|
|
—
|
|
—
|
|
—
|
|
(2,576.9
|
)
|
—
|
|
|||||||||||
|
Loans to affiliates
|
(2,609.9
|
)
|
—
|
|
—
|
|
(125.0
|
)
|
2,734.9
|
|
—
|
|
|||||||||||
|
Proceeds from disposal of property
|
—
|
|
0.3
|
|
—
|
|
1.1
|
|
—
|
|
1.4
|
|
|||||||||||
|
Other investing activities
|
—
|
|
0.2
|
|
—
|
|
(0.5
|
)
|
—
|
|
(0.3
|
)
|
|||||||||||
|
Net cash used
|
(33.2
|
)
|
(60.1
|
)
|
(0.2
|
)
|
(189.1
|
)
|
158.4
|
|
(124.2
|
)
|
|||||||||||
|
Financing activities:
|
|||||||||||||||||||||||
|
Net short-term borrowings
|
(4.1
|
)
|
—
|
|
—
|
|
—
|
|
—
|
|
(4.1
|
)
|
|||||||||||
|
Repayment of long-term debt
|
—
|
|
(0.9
|
)
|
(0.1
|
)
|
(7.7
|
)
|
—
|
|
(8.7
|
)
|
|||||||||||
|
Debt issuance costs paid
|
—
|
|
—
|
|
—
|
|
—
|
|
—
|
|
—
|
|
|||||||||||
|
Dividends paid
|
(37.1
|
)
|
—
|
|
—
|
|
—
|
|
—
|
|
(37.1
|
)
|
|||||||||||
|
Shares repurchased
|
(54.0
|
)
|
—
|
|
—
|
|
—
|
|
—
|
|
(54.0
|
)
|
|||||||||||
|
Proceeds from loans from affiliates
|
125.0
|
|
2,609.9
|
|
—
|
|
—
|
|
(2,734.9
|
)
|
—
|
|
|||||||||||
|
Repayment of loans from affiliates
|
—
|
|
(2,576.9
|
)
|
—
|
|
—
|
|
2,576.9
|
|
—
|
|
|||||||||||
|
Contribution from affiliates
|
—
|
|
—
|
|
0.2
|
|
0.2
|
|
(0.4
|
)
|
—
|
|
|||||||||||
|
Other financing activities
|
0.4
|
|
—
|
|
—
|
|
—
|
|
—
|
|
0.4
|
|
|||||||||||
|
Net cash provided (used)
|
30.2
|
|
32.1
|
|
0.1
|
|
(7.5
|
)
|
(158.4
|
)
|
(103.5
|
)
|
|||||||||||
|
Cash and cash equivalents:
|
|||||||||||||||||||||||
|
Net increase (decrease)
|
0.2
|
|
(5.5
|
)
|
—
|
|
(81.8
|
)
|
—
|
|
(87.1
|
)
|
|||||||||||
|
At beginning of year
|
0.7
|
|
17.6
|
|
—
|
|
115.8
|
|
—
|
|
134.1
|
|
|||||||||||
|
At end of period
|
$
|
0.9
|
|
$
|
12.1
|
|
$
|
—
|
|
$
|
34.0
|
|
$
|
—
|
|
$
|
47.0
|
|
|||||
23
|
Item 2.
|
Management’s Discussion and Analysis of Financial Condition and Results of Operations
|
The discussion below, as well as other portions of this Form 10-Q, contain forward-looking statements that are not based upon historical information. Readers can identify these forward-looking statements by the use of such verbs as “expects,” “anticipates,” “believes” or similar verbs or conjugations of such verbs. Such forward-looking statements are based upon information currently available to management and management’s perception thereof as of the date of this Form 10-Q. However, such statements are dependent on and, therefore, can be influenced by, a number of external variables over which management has little or no control, including: competition and consolidation within the transportation industry; the business environment in industries that produce and use items shipped by rail; loss of the rail concession of Kansas City Southern’s subsidiary, Kansas City Southern de México, S.A. de C.V.; the termination of, or failure to renew, agreements with customers, other railroads and third parties; access to capital; disruptions to the Company’s technology infrastructure, including its computer systems; natural events such as severe weather, hurricanes and floods; climate change and the market and regulatory responses to climate change; legislative and regulatory developments and disputes; rail accidents or other incidents or accidents on KCS’s rail network or at KCS’s facilities or customer facilities involving the release of hazardous materials, including toxic inhalation hazards; fluctuation in prices or availability of key materials, in particular diesel fuel; dependency on certain key suppliers of core rail equipment; changes in securities and capital markets; unavailability of qualified personnel; labor difficulties, including strikes and work stoppages; acts of terrorism or risk of terrorist activities; war or risk of war; domestic and international economic, political and social conditions; the level of trade between the United States and Asia or Mexico; fluctuations in the peso-dollar exchange rate; increased demand and traffic congestion; the outcome of claims and litigation involving the Company or its subsidiaries; and other factors affecting the operation of the business. For more discussion about each risk factor, see Part II Item 7 “Management’s Discussion and Analysis of Financial Condition and Results of Operations” in the Company’s Annual Report on Form 10-K for the year ended
December 31, 2018
, which is on file with the U.S. Securities and Exchange Commission (File No. 1-4717) and Part I Item 1A — “Risk Factors” in the Form 10-K and any updates contained herein. Readers are strongly encouraged to consider these factors when evaluating forward-looking statements. Forward-looking statements should not be read as a guarantee of future performance or results and will not necessarily be accurate indications of the timing when, or by which, such performance or results will be achieved. As a result, actual outcomes or results could materially differ from those indicated in forward-looking statements. We are not under any obligation, and we expressly disclaim any obligation, to update or alter any forward-looking statements.
This discussion is intended to clarify and focus on Kansas City Southern’s (“KCS” or the “Company”) results of operations, certain changes in its financial position, liquidity, capital structure and business developments for the periods covered by the consolidated financial statements included under Item 1 of this Form 10-Q. This discussion should be read in conjunction with those consolidated financial statements and the related notes and is qualified by reference to them.
Critical Accounting Policies and Estimates
The Company’s discussion and analysis of its financial position and results of operations is based upon its consolidated financial statements. The preparation of these consolidated financial statements requires estimation and judgment that affect the reported amounts of revenue, expenses, assets and liabilities. The Company bases its estimates on historical experience and on various other factors that are believed to be reasonable under the circumstances, the results of which form the basis for making judgments about the accounting for assets and liabilities that are not readily apparent from other sources. If the estimates differ materially from actual results, the impact on the consolidated financial statements may be material. The Company’s critical accounting policies are disclosed in the
2018
Annual Report on Form 10-K filed with the SEC.
Overview
The Company is engaged primarily in the freight rail transportation business, operating a single coordinated rail network under one reportable business segment. The primary operating subsidiaries of the Company consist of the following: The Kansas City Southern Railway Company (“KCSR”), Kansas City Southern de México, S.A. de C.V. (“KCSM”), Meridian Speedway, LLC (“MSLLC”), and The Texas Mexican Railway Company (“TexMex”). The Company generates revenues and cash flows by providing customers with freight delivery services both within its regions and throughout North America through connections with other Class I rail carriers. KCS’s customers conduct business in a number of different industries, including chemical and petroleum, industrial and consumer products, agriculture and minerals, energy, automotive, and intermodal transportation. Appropriate eliminations and reclassifications have been recorded in preparing the consolidated financial statements.
24
Strategic Initiatives
KCS started 2019 with a renewed and heightened focus on operational excellence. Throughout the year, the Company is implementing principles of the Precision Scheduled Railroading (“PSR”) methodology that are most applicable to its network. The Company expects this focus on operational excellence and PSR principles to help drive the following improvements:
|
•
|
Customer service
—
improve and sustain consistency and reliability of service and create a more resilient and dependable network;
|
|
•
|
Facilitating growth — additional capacity for new opportunities;
|
|
•
|
Improving asset utilization — meet growing demand with the same or fewer assets; and,
|
|
•
|
Improving the cost profile of the Company — increased profitability driven by volume and revenue growth and improved productivity and asset utilization
|
As a result of the PSR initiatives, management approved a restructuring plan during the first quarter of 2019, and the Company recognized restructuring charges of $67.5 million in the consolidated statements of income. The Company expects this restructuring plan and other related PSR initiatives to be completed in 2019 and to provide cost savings of approximately $16.0 million for the remainder of 2019. As the Company continues to implement these PSR initiatives, management may develop additional restructuring plans as necessary.
First Quarter
Highlights
Revenues increased
6%
for the three months ended
March 31, 2019
, as compared to the same period in
2018
, due to a
7%
increase in revenue per carload/unit, partially offset by a
1%
decrease in carload/unit volumes. Revenue per carload/unit increased due to mix, positive pricing impacts, and higher fuel surcharge. These increases were partially offset by shorter average length of haul and the weakening of the Mexican peso against the U.S. dollar.
Operating expenses increased
23%
during the three months ended
March 31, 2019
, as compared to the same period in
2018
, primarily due to restructuring charges as a result of PSR initiatives, exclusion of the Mexican fuel excise tax credit as a reduction of operating expenses due to changes in Mexican tax law effective January 1, 2019, and an increase in compensation and benefits. Expense fluctuations resulting from the weakening Mexican peso and changing fuel prices were offset by revenue fluctuations driven by these same macroeconomic factors. Operating expenses as a percentage of revenues was
76.2%
for the three months ended
March 31, 2019
, compared to
65.8%
for the same period in
2018
.
The Company reported quarterly earnings of
$1.02
per diluted share on consolidated net income of
$102.8 million
for the three months ended
March 31, 2019
, compared to earnings of
$1.40
per diluted share on consolidated net income of
$144.5 million
for the same period in
2018
. This change is due to lower operating income primarily as a result of the restructuring charges noted above and lower foreign exchange gain, partially offset by a lower effective tax rate.
Results of Operations
The following summarizes KCS’s consolidated statement of income components
(in millions)
:
|
Three Months Ended
|
Change
|
||||||||||
|
March 31,
|
|||||||||||
|
2019
|
2018
|
||||||||||
|
Revenues
|
$
|
674.8
|
|
$
|
638.6
|
|
$
|
36.2
|
|
||
|
Operating expenses
|
514.5
|
|
419.9
|
|
94.6
|
|
|||||
|
Operating income
|
160.3
|
|
218.7
|
|
(58.4
|
)
|
|||||
|
Equity in net earnings of affiliates
|
1.7
|
|
1.0
|
|
0.7
|
|
|||||
|
Interest expense
|
(28.2
|
)
|
(25.5
|
)
|
(2.7
|
)
|
|||||
|
Debt retirement costs
|
(0.6
|
)
|
—
|
|
(0.6
|
)
|
|||||
|
Foreign exchange gain
|
4.6
|
|
27.8
|
|
(23.2
|
)
|
|||||
|
Other income (expense), net
|
0.1
|
|
(0.3
|
)
|
0.4
|
|
|||||
|
Income before income taxes
|
137.9
|
|
221.7
|
|
(83.8
|
)
|
|||||
|
Income tax expense
|
34.7
|
|
76.8
|
|
(42.1
|
)
|
|||||
|
Net income
|
103.2
|
|
144.9
|
|
(41.7
|
)
|
|||||
|
Less: Net income attributable to noncontrolling interest
|
0.4
|
|
0.4
|
|
—
|
|
|||||
|
Net income attributable to Kansas City Southern and subsidiaries
|
$
|
102.8
|
|
$
|
144.5
|
|
$
|
(41.7
|
)
|
||
25
Revenues
The following summarizes revenues (
in millions
), carload/unit statistics
(in thousands)
and revenue per carload/unit:
|
Revenues
|
Carloads and Units
|
Revenue per Carload/Unit
|
||||||||||||||||||||||||||||
|
Three Months Ended
|
|
Three Months Ended
|
|
Three Months Ended
|
|
|||||||||||||||||||||||||
|
March 31,
|
March 31,
|
March 31,
|
||||||||||||||||||||||||||||
|
2019
|
2018
|
% Change
|
2019
|
2018
|
% Change
|
2019
|
2018
|
% Change
|
||||||||||||||||||||||
|
Chemical and petroleum
|
$
|
168.6
|
|
$
|
139.7
|
|
21
|
%
|
79.4
|
|
68.1
|
|
17
|
%
|
$
|
2,123
|
|
$
|
2,051
|
|
4
|
%
|
||||||||
|
Industrial and consumer products
|
149.8
|
|
146.3
|
|
2
|
%
|
79.9
|
|
82.0
|
|
(3
|
%)
|
1,875
|
|
1,784
|
|
5
|
%
|
||||||||||||
|
Agriculture and minerals
|
122.9
|
|
113.4
|
|
8
|
%
|
62.0
|
|
56.9
|
|
9
|
%
|
1,982
|
|
1,993
|
|
(1
|
%)
|
||||||||||||
|
Energy
|
64.6
|
|
61.3
|
|
5
|
%
|
60.8
|
|
57.5
|
|
6
|
%
|
1,063
|
|
1,066
|
|
—
|
|
||||||||||||
|
Intermodal
|
79.9
|
|
90.9
|
|
(12
|
%)
|
220.9
|
|
243.0
|
|
(9
|
%)
|
362
|
|
374
|
|
(3
|
%)
|
||||||||||||
|
Automotive
|
57.6
|
|
59.8
|
|
(4
|
%)
|
36.6
|
|
39.8
|
|
(8
|
%)
|
1,574
|
|
1,503
|
|
5
|
%
|
||||||||||||
|
Carload revenues, carloads and units
|
643.4
|
|
611.4
|
|
5
|
%
|
539.6
|
|
547.3
|
|
(1
|
%)
|
$
|
1,192
|
|
$
|
1,117
|
|
7
|
%
|
||||||||||
|
Other revenue
|
31.4
|
|
27.2
|
|
15
|
%
|
||||||||||||||||||||||||
|
Total revenues (i)
|
$
|
674.8
|
|
$
|
638.6
|
|
6
|
%
|
||||||||||||||||||||||
|
(i) Included in revenues:
|
||||||||||||||||||||||||||||||
|
Fuel surcharge
|
$
|
62.4
|
|
$
|
51.4
|
|
||||||||||||||||||||||||
Revenues include both revenue for transportation services and fuel surcharges. For the
three
months ended
March 31, 2019
, revenues increased
6%
and carload/unit volumes decreased
1%
, compared to the same period in 2018. Revenue increased primarily due to increased refined product shipments to Mexico, and grain increased as a result of improved cycle times. These increases were partially offset by service interruption at Lazaro Cardenas due to teacher protests, which also affected volumes for certain commodity groups.
For the three months ended March 31, 2019, revenue per carload/unit increased by
7%
, compared to the same period in 2018, due to mix, positive pricing impacts, and higher fuel surcharge. These increases were partially offset by shorter average length of haul
and the weakening of the Mexican peso against the U.S. dollar for revenue transactions denominated in Mexican pesos. The average exchange rate of Mexican pesos per U.S. dollar was Ps.19.2 for the three months ended March 31, 2019, compared to Ps.18.8 for the same period in 2018, which resulted in a decrease to revenues of approximately $3.0 million.
KCS’s fuel surcharges are a mechanism to adjust revenue based upon changes in fuel prices above fuel price thresholds set in KCS’s tariffs or contracts. Fuel surcharge revenue is calculated using a fuel price from a prior time period that can be up to 60 days earlier. In a period of volatile fuel prices or changing customer business mix, changes in fuel expense and fuel surcharge revenue may differ.
For the
three
months ended
March 31, 2019
, fuel surcharge revenue increased
$11.0 million
, compared to the same period in 2018, primarily due to higher fuel prices and increased fuel surcharge rates.
26
The following discussion provides an analysis of revenues by commodity group:
|
Revenues by commodity group
for the three months ended March 31, 2019 |
|
|
Chemical and petroleum
. Revenues increased $28.9 million for the three months ended March 31, 2019, compared to the same period in 2018, due to a 17% increase in carload/unit volumes and a 4% increase in revenue per carload/unit. Volumes increased primarily due to increased refined fuel product shipments to Mexico, partially offset by service interruption at Lazaro Cardenas due to teacher protests. Revenue per carload/unit increased due to longer average length of haul, positive pricing impacts, and higher fuel surcharge.
|
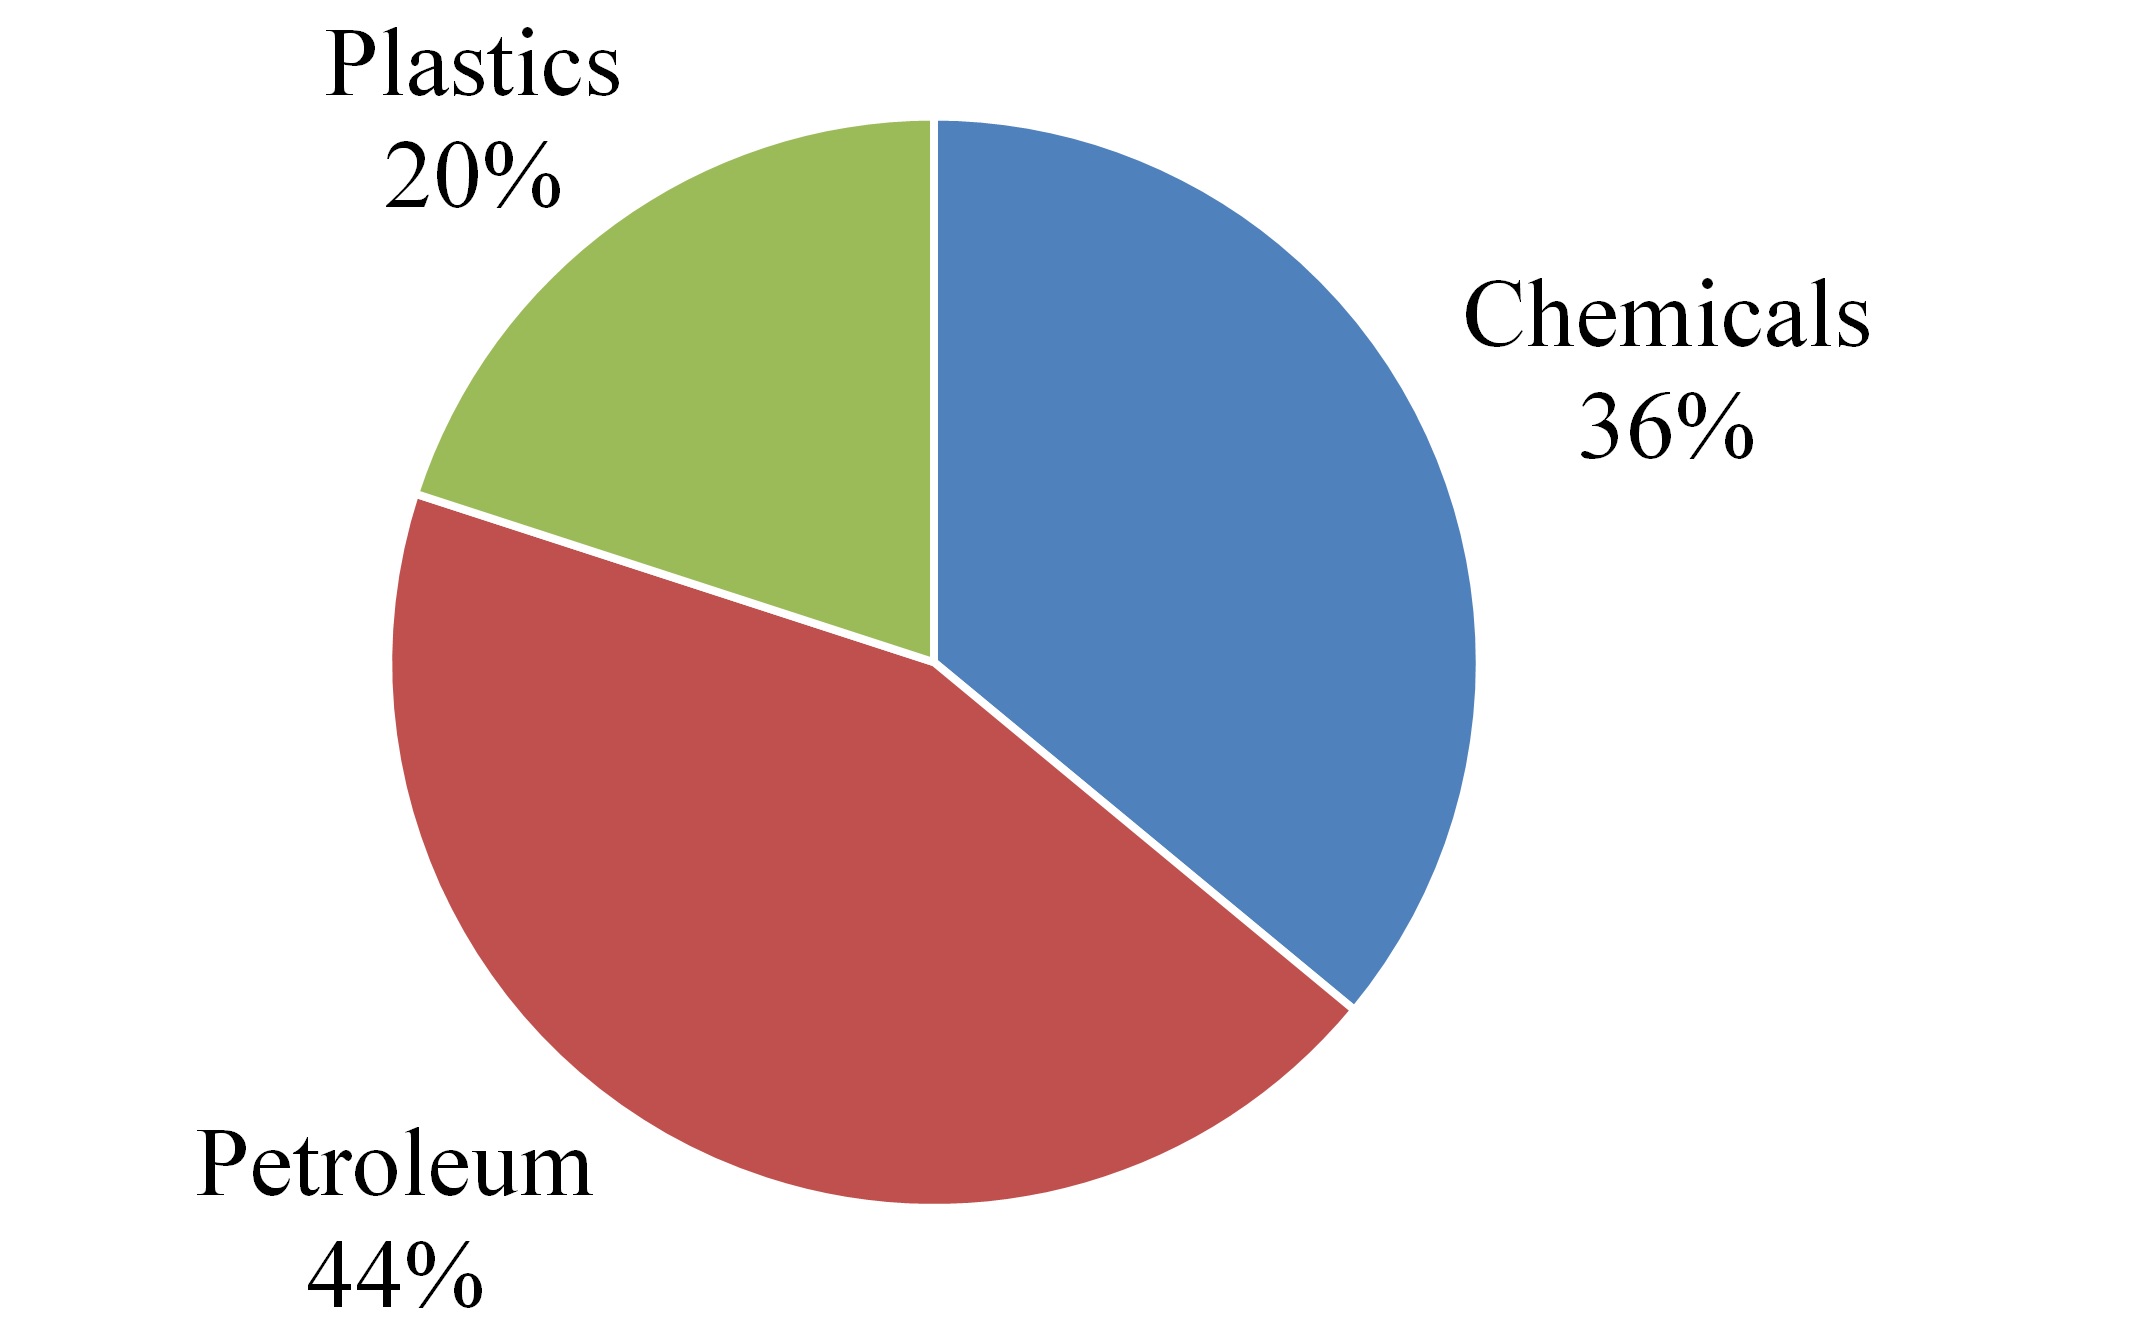
|
|
Industrial and consumer products
. Revenues increased $3.5 million for the three months ended March 31, 2019, compared to the same period in 2018, due to a 5% increase in revenue per carload/unit, partially offset by a 3% decrease in carload/unit volumes. Revenue per carload/unit increased due to higher fuel surcharge, mix, and positive pricing impacts, partially offset by shorter average length of haul. Volumes decreased due to lower military shipments, unplanned paper plant outages, and service interruption at Lazaro Cardenas due to teacher protests. These decreases were partially offset by an increase in metals due to improved cycle times.
|
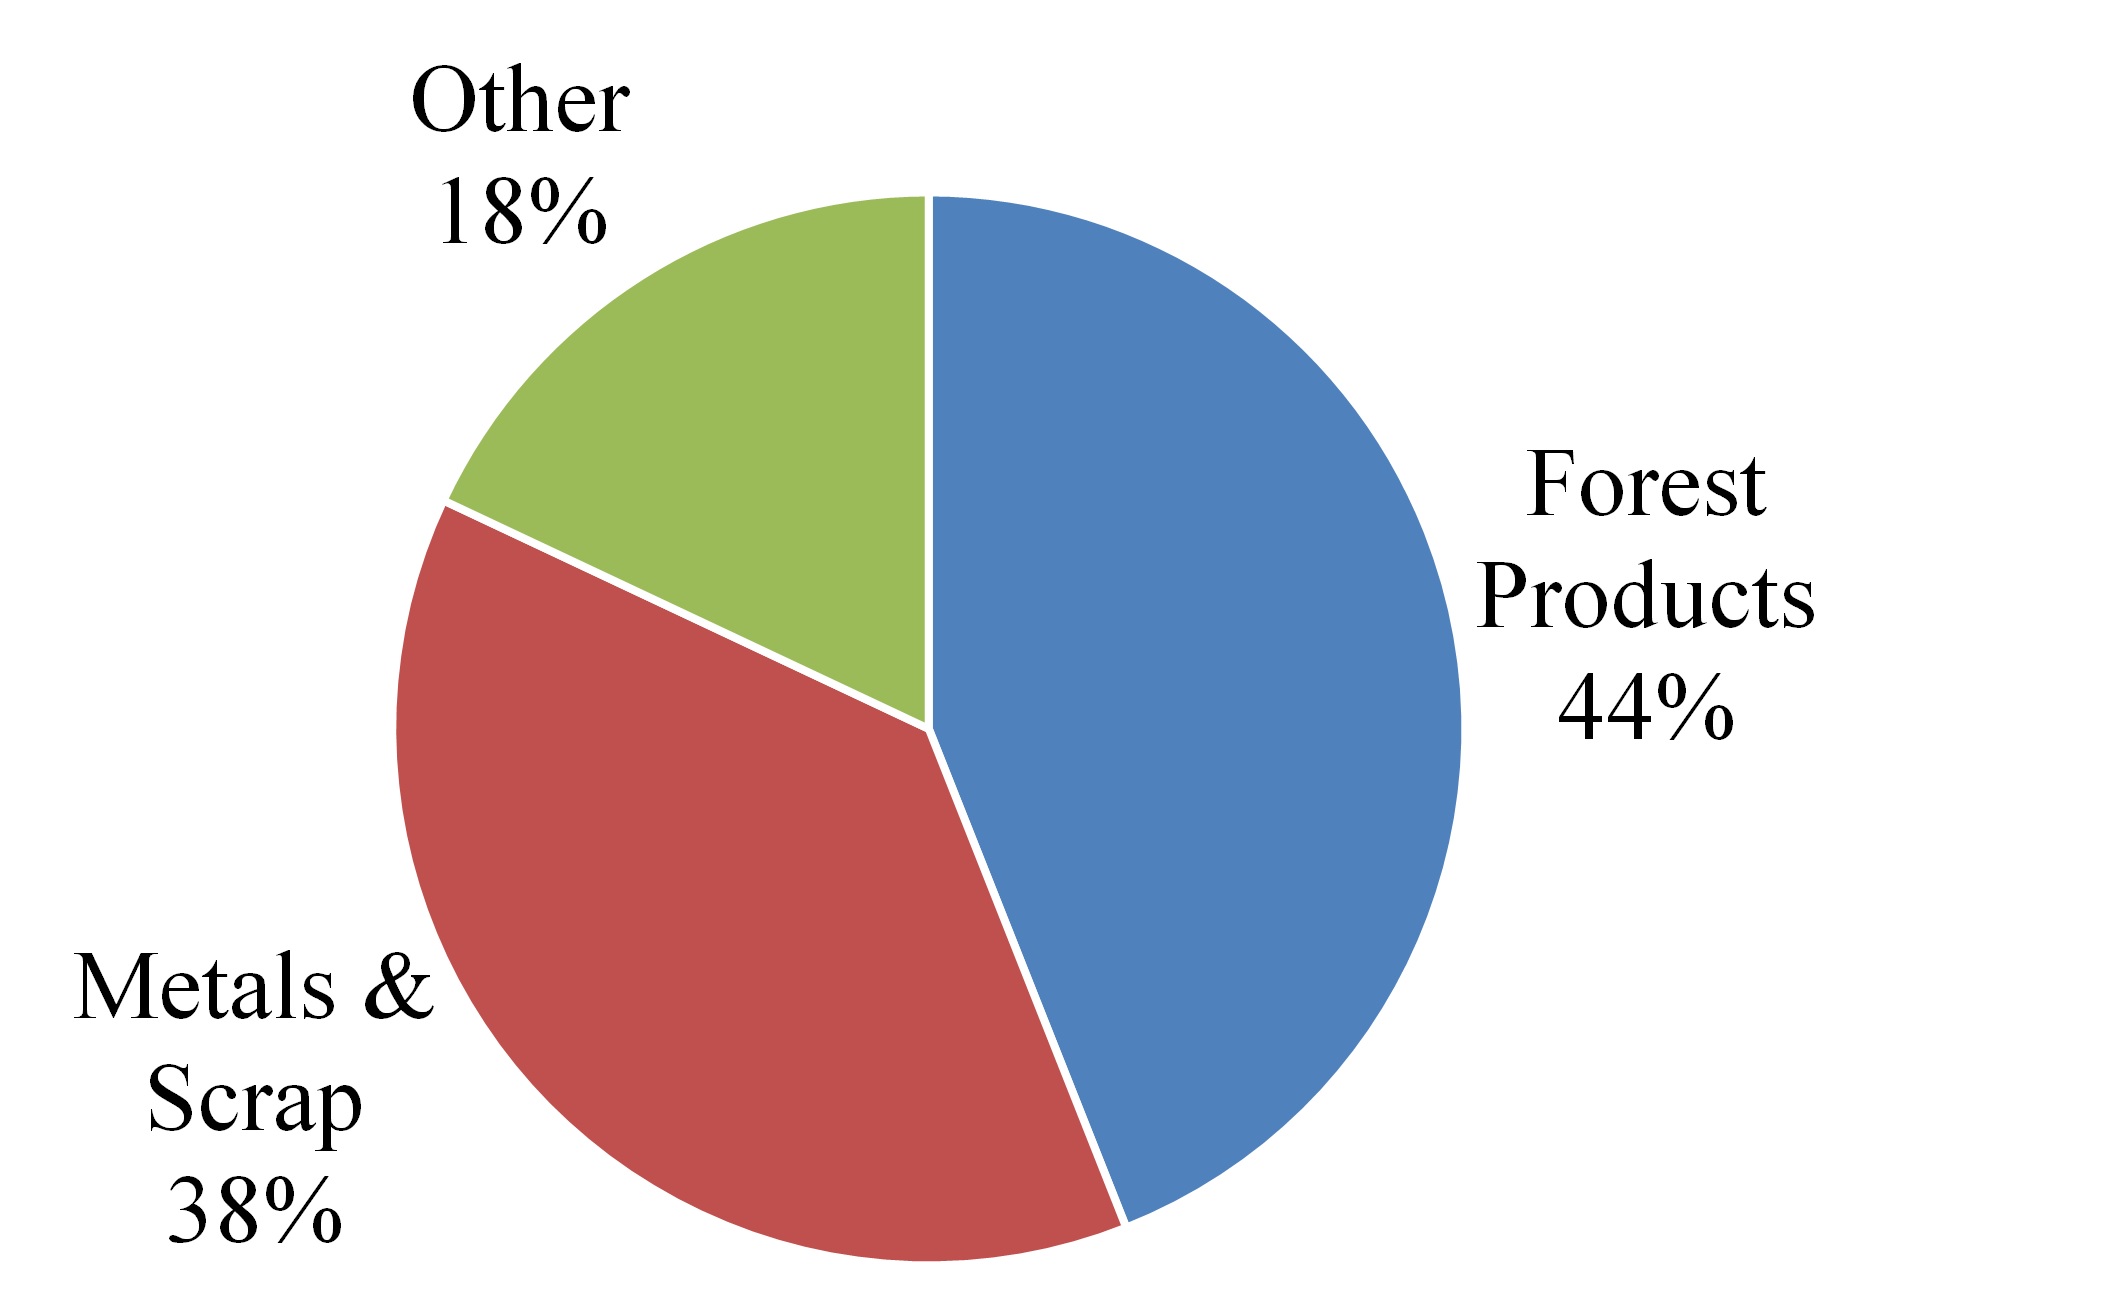
|
27
|
Revenues by commodity group
for the three months ended March 31, 2019 |
|
|
Agriculture and minerals.
Revenues increased $9.5 million for the three months ended March 31, 2019, compared to the same period in 2018, due to a 9% increase in carload/unit volumes, partially offset by a 1% decrease in revenue per carload/unit. Volumes increased as a result of improved cycle times and soft market demand in 2018. Revenues per carload/unit decreased due to shorter average length of haul, partially offset by positive pricing impacts, higher fuel surcharge, and mix.
|
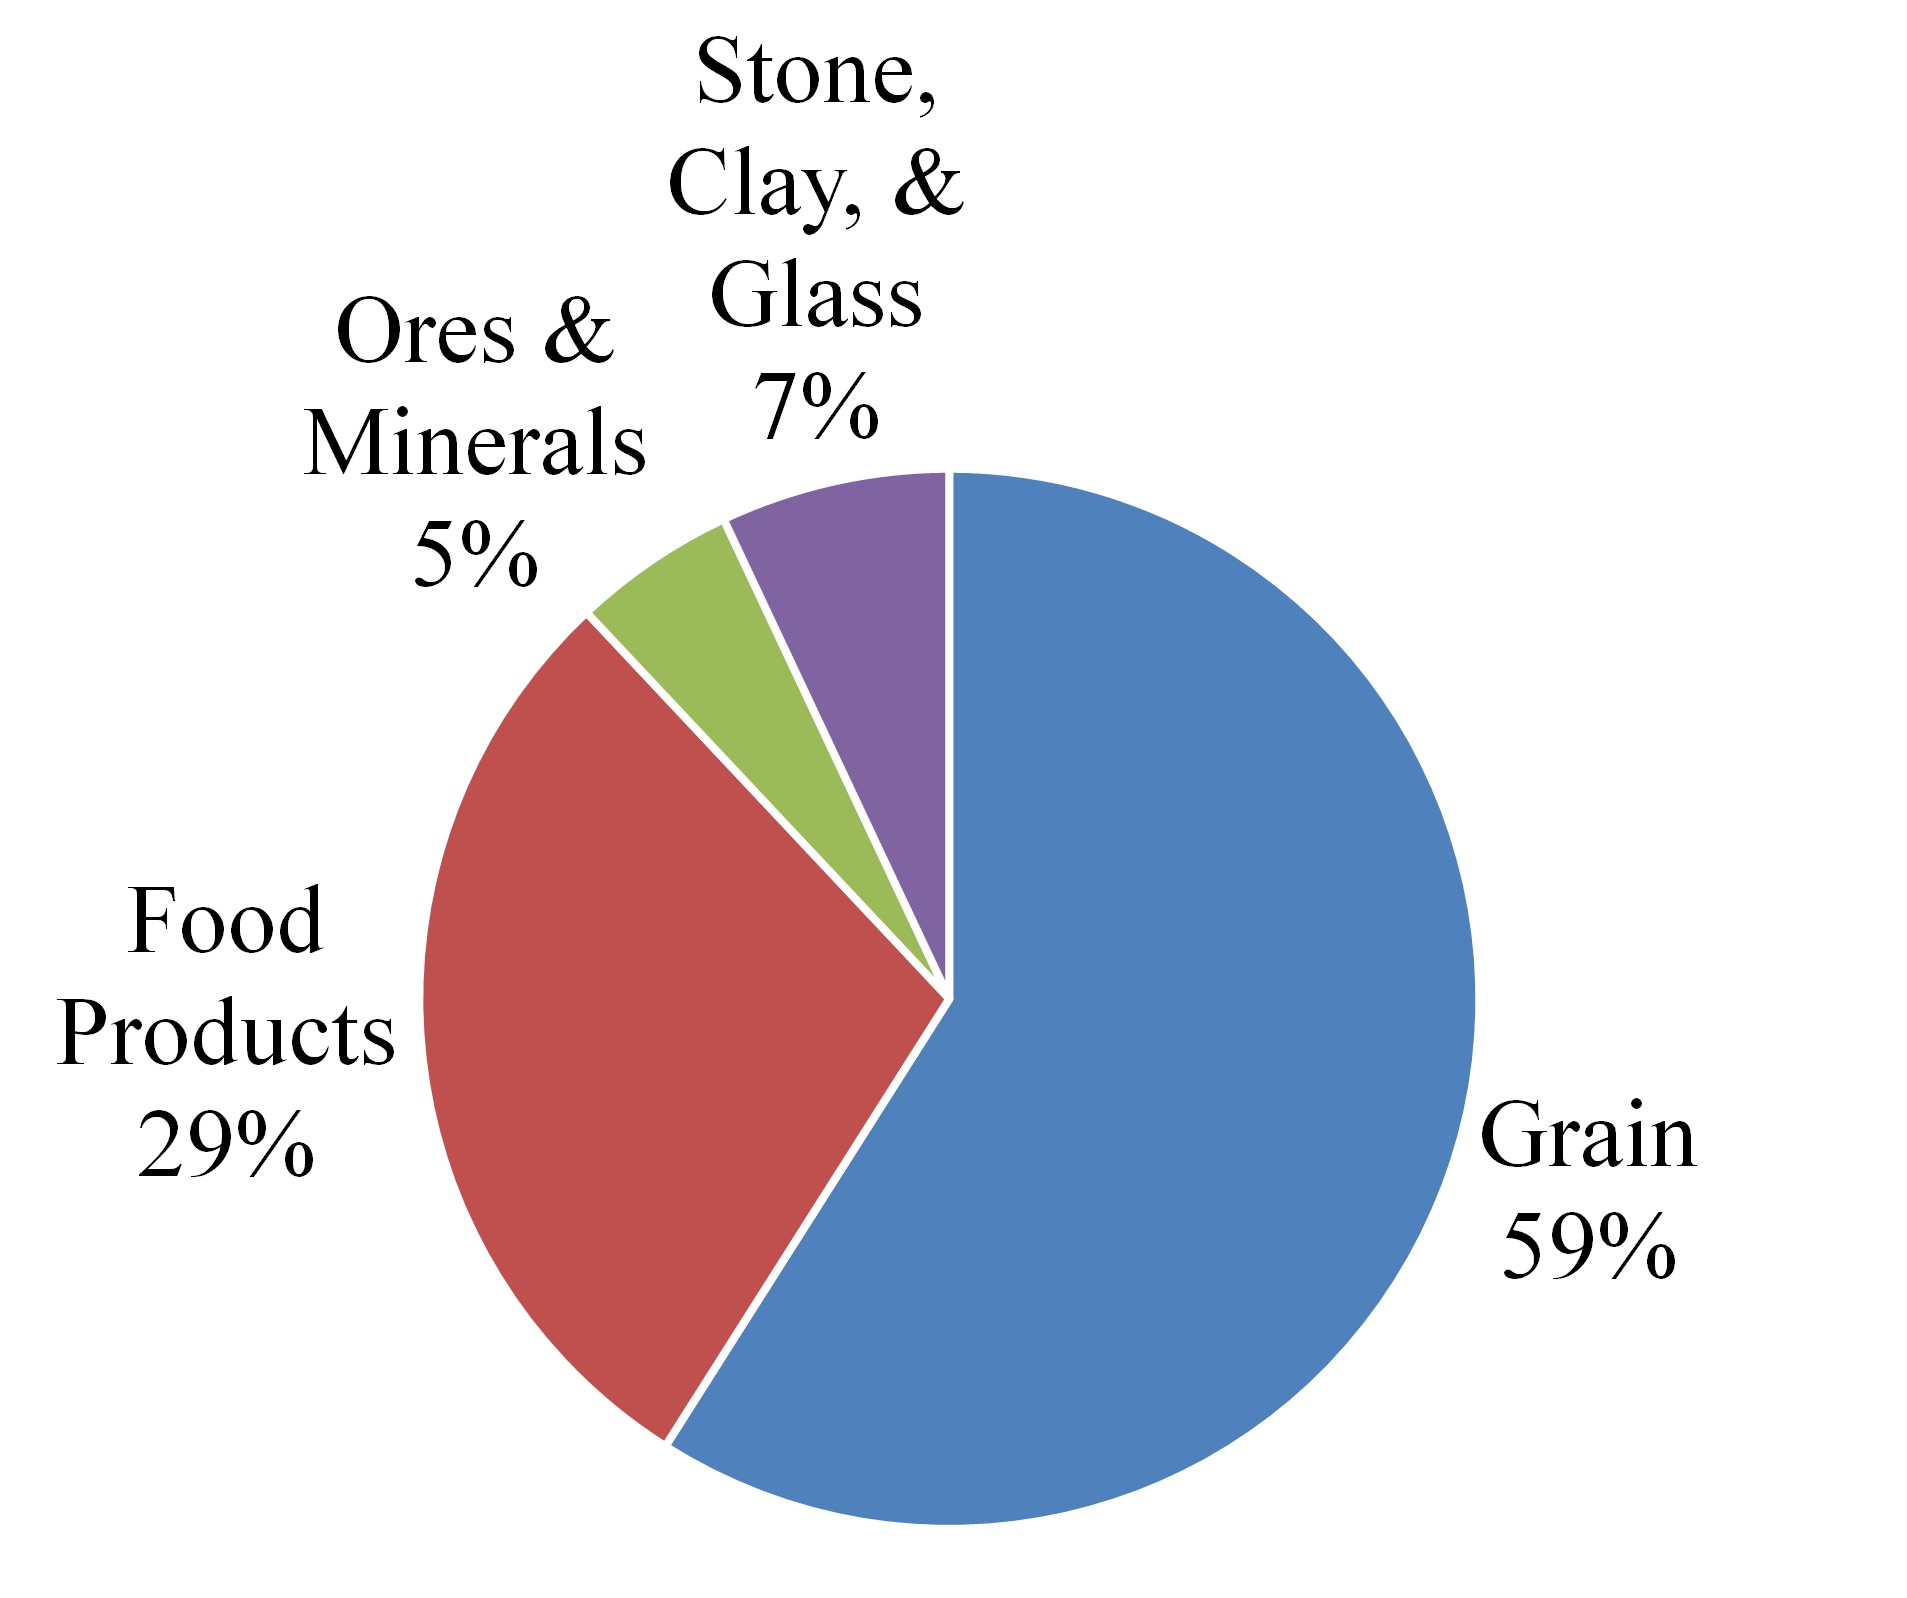
|
|
Energy.
Revenues increased $3.3 million for the three months ended March 31, 2019, compared to the same period in 2018, due to a 6% increase in carload/unit volumes driven by an increase in utility coal volumes due to stockpile replenishment, partially offset by frac sand volume decreases due to changes in sourcing patterns.
|
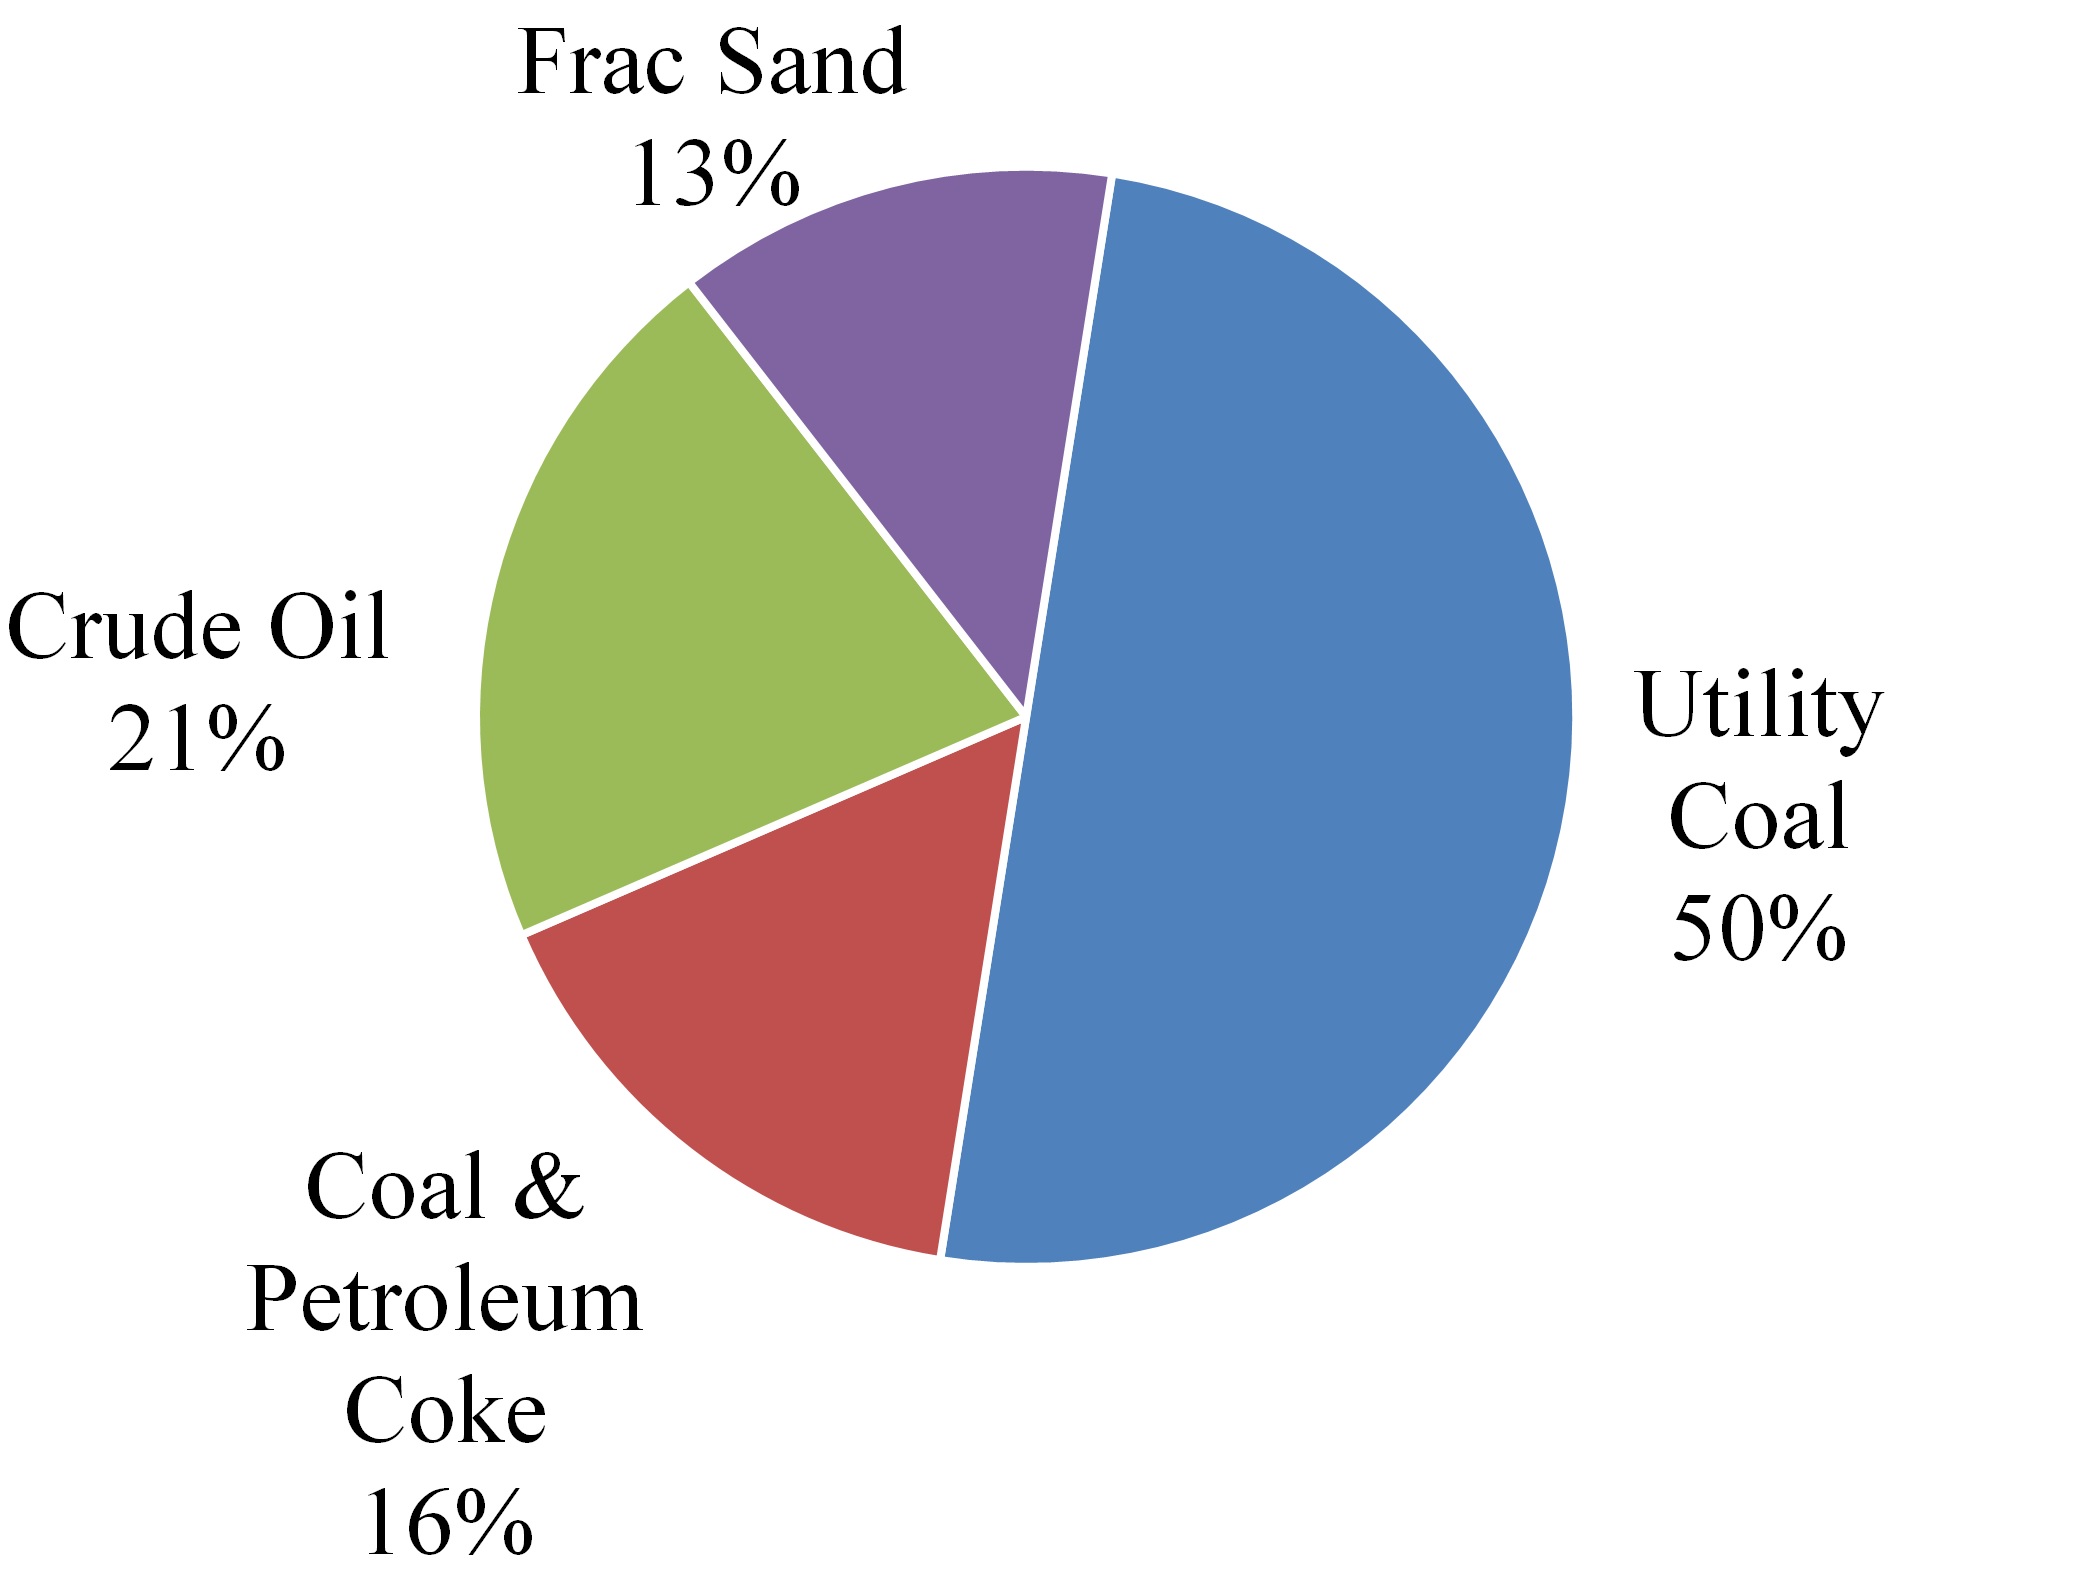
|
Intermodal.
Revenues decreased
$11.0 million
for the
three
months ended
March 31, 2019
, compared to the same period in 2018, due to a
9%
decrease in carload/unit volumes and a
3%
decrease in revenue per carload/unit. The volume decrease was primarily due to service interruption at Lazaro Cardenas due to teacher protests and unplanned auto plant shutdowns impacting cross border traffic. Revenue per carload/unit decreased due to shorter average length of haul.
Automotive.
Revenues decreased
$2.2 million
for the three months ended
March 31, 2019
, compared to the same period in 2018, due to an
8%
decrease in carload/unit volumes, partially offset by a
5%
increase in revenue per carload/unit. Volumes decreased due to service interruption at Lazaro Cardenas due to teacher protests and unplanned auto plant shutdowns. Revenue per carload/unit increased due to positive pricing impacts and higher fuel surcharge, partially offset by shorter average length of haul and the weakening of the Mexican peso against the U.S. dollar.
28
Operating Expenses
Operating expenses, as shown below (
in millions
), increased
$94.6 million
for the
three
months ended
March 31, 2019
, compared to the same period in 2018, primarily due to restructuring charges as a result of PSR initiatives, exclusion of the Mexican fuel excise tax credit as a reduction of operating expenses due to changes in Mexican tax law effective January 1, 2019, and an increase in compensation and benefits. The weakening of the Mexican peso against the U.S. dollar during the three months ended
March 31, 2019
, resulted in reduced expense of approximately $3.0 million, compared to the same period in 2018, for expense transactions denominated in Mexican pesos. The average exchange rate of Mexican pesos per U.S. dollar was Ps.19.2 for the
three
months ended
March 31, 2019
, compared to Ps.18.8 for the same period in 2018.
|
Three Months Ended
|
||||||||||||||
|
March 31,
|
Change
|
|||||||||||||
|
2019
|
2018
|
Dollars
|
Percent
|
|||||||||||
|
Compensation and benefits
|
$
|
128.9
|
|
$
|
121.6
|
|
$
|
7.3
|
|
6
|
%
|
|||
|
Purchased services
|
52.8
|
|
47.1
|
|
5.7
|
|
12
|
%
|
||||||
|
Fuel
|
83.0
|
|
81.3
|
|
1.7
|
|
2
|
%
|
||||||
|
Mexican fuel excise tax credit
|
—
|
|
(9.2
|
)
|
9.2
|
|
(100
|
%)
|
||||||
|
Equipment costs
|
30.4
|
|
32.2
|
|
(1.8
|
)
|
(6
|
%)
|
||||||
|
Depreciation and amortization
|
88.5
|
|
83.3
|
|
5.2
|
|
6
|
%
|
||||||
|
Materials and other
|
63.4
|
|
63.6
|
|
(0.2
|
)
|
—
|
|
||||||
|
Restructuring charges
|
67.5
|
|
—
|
|
67.5
|
|
100
|
%
|
||||||
|
Total operating expenses
|
$
|
514.5
|
|
$
|
419.9
|
|
$
|
94.6
|
|
23
|
%
|
|||
Compensation and benefits.
Compensation and benefits increased
$7.3 million
for the
three
months ended
March 31, 2019
, compared to the same period in
2018
, due to increases in wages and benefits and headcount of approximately $4.0 million and $2.0 million, respectively.
Purchased services.
Purchased services expense increased
$5.7 million
for the
three
months ended
March 31, 2019
, compared to the same period in 2018, due to higher repairs and maintenance.
Fuel.
Fuel increased
$1.7 million
for the
three
months ended
March 31, 2019
, compared to the same period in
2018
, due to higher diesel fuel prices of approximately $7.0 million in Mexico, partially offset by lower diesel fuel prices of approximately $2.0 million in the U.S., increased efficiency of approximately $2.0 million and the weakening of the Mexican peso of approximately $1.0 million. The average price per gallon was $2.54 for the
three
months ended
March 31, 2019
, compared to $2.44 for the same period in
2018
. Fuel purchases in Mexico are subject to an excise tax that is included in the price of fuel. For the three months ended March 31, 2019 and 2018, the Company paid Mexican fuel excise tax of $13.8 million and $9.2 million, respectively.
Mexican fuel excise tax credit.
For the
three
months ended
March 31, 2019
, the Company did not recognize a benefit within operating expenses for the Mexican fuel excise tax credit, due to changes in Mexican tax law effective January 1, 2019. For 2019, any benefit is recognized as a reduction of income tax expense within the consolidated statements of income rather than a reduction of operating expenses. The Company recognized a benefit of
$9.2 million
within operating expenses for the three months ended March 31,
2018
. For additional discussion, see Note 3, Mexican Fuel Excise Tax Credit.
Equipment costs.
Equipment costs decreased
$1.8 million
for the
three
months ended
March 31, 2019
, compared to the same period in
2018
, due to lower car hire expense primarily as a result of reduced cycle times.
Depreciation and amortization.
Depreciation and amortization expense increased
$5.2 million
for the
three
months ended
March 31, 2019
, compared to the same period in
2018
, due to a larger asset base, including investments in positive train control.
Materials and other.
Materials and other expense was flat for the three months ended
March 31, 2019
, compared to the same period in
2018
.
Restructuring charges.
During the three months ended
March 31, 2019
, the Company recognized
$67.5 million
of restructuring charges related to the implementation of PSR initiatives most applicable to its network. Included in the restructuring charges were costs relating to the impairment of certain locomotives and rail cars, planned activities for workforce reduction, and contract restructuring activities. For additional discussion, see Note 2, Restructuring Charges.
29
Non-Operating Income and Expenses
Equity in net earnings of affiliates.
Equity in net earnings from affiliates increased
$0.7 million
for the
three
months ended
March 31, 2019
, compared to the same period in 2018, driven by increase in equity in net earnings from the operations of Panama Canal Railway Company due to lower operating expenses.
Interest expense.
For the
three
months ended
March 31, 2019
, interest expense increased
$2.7 million
, compared to the same period in
2018
, due to higher average interest rates and debt balances. During the
three
months ended
March 31, 2019
, the average debt balance (including commercial paper) was
$2,711.9 million
, compared to
$2,618.2 million
for the same period in 2018. The average interest rate during the
three
months ended
March 31, 2019
was
4.2%
, compared to
3.9%
for the same period in 2018.
Debt retirement costs
. Debt retirement costs were
$0.6 million
for the three months ended March 31, 2019, related to the write-off of previously capitalized debt issuance costs associated with the establishment of the new revolving credit facility in the first quarter of 2019. The Company did not incur debt retirement costs during the first quarter of 2018.
Foreign exchange gain.
For the
three
months ended
March 31, 2019
and 2018, foreign exchange gain was
$4.6 million
and
$27.8 million
, respectively. Foreign exchange gain includes the re-measurement and settlement of net monetary assets denominated in Mexican pesos and the gain on foreign currency derivative contracts.
For the
three
months ended
March 31, 2019
and 2018, the re-measurement and settlement of monetary assets and liabilities denominated in Mexican pesos resulted in a foreign exchange gain of
$1.0 million
and
$11.3 million
, respectively.
The Company enters into foreign currency derivative contracts to hedge its net exposure to fluctuations in the Mexican cash tax obligation due to changes in the value of the Mexican peso against the U.S. dollar. For the
three
months ended
March 31, 2019
and 2018, the Company incurred a foreign exchange gain on foreign currency derivative contracts of
$3.6 million
and
$16.5 million
, respectively.
Other income (expense), net
. Other income (expense), net increased
$0.4 million
for the
three
months ended
March 31, 2019
, compared to the same period in
2018
, due to an increase in miscellaneous income.
Income tax expense.
Income tax expense decreased
$42.1 million
for the
three
months ended
March 31, 2019
, compared to the same period in
2018
, due to lower pre-tax income as a result of restructuring charges related to PSR initiatives and a lower effective tax rate.
The components of the effective tax rates for the
three
months ended
March 31, 2019
, compared to the same period in
2018
, are as follows:
|
Three Months Ended
|
|||||
|
March 31,
|
|||||
|
2019
|
2018
|
||||
|
Statutory rate in effect
|
21.0
|
%
|
21.0
|
%
|
|
|
Tax effect of:
|
|||||
|
Difference between U.S. and foreign tax rate
|
5.8
|
%
|
5.9
|
%
|
|
|
Global intangible low-taxed income (“GILTI”) tax, net
|
1.0
|
%
|
3.0
|
%
|
|
|
Mexican fuel excise tax credit, net (i)
|
(4.9
|
%)
|
—
|
|
|
|
State and local income tax provision, net
|
1.1
|
%
|
1.1
|
%
|
|
|
Foreign exchange (ii)
|
1.2
|
%
|
4.0
|
%
|
|
|
Other, net
|
—
|
|
(0.4
|
%)
|
|
|
Effective tax rate
|
25.2
|
%
|
34.6
|
%
|
|
|
(i)
|
See discussion of the inclusion of the Mexican fuel excise tax credit, net within the effective tax rate in the Mexican Tax Reform section below.
|
|
(ii)
|
Mexican income taxes are paid in Mexican pesos, and as a result, the effective income tax rate reflects fluctuations in the value of the Mexican peso against the U.S. dollar measured by the forward exchange rate. The foreign exchange impact on income taxes includes the gain or loss from the revaluation of net U.S. dollar-denominated monetary liabilities into Mexican pesos which is included in Mexican taxable income under Mexican tax law. As a result, a strengthening of the Mexican peso against the U.S. dollar for the reporting period will generally increase the Mexican cash tax obligation and the effective income tax rate, and a weakening of the Mexican peso against the U.S. dollar for the reporting period will generally decrease the Mexican cash tax obligation and the effective tax rate. To hedge its exposure to this cash tax risk, the Company enters into
|
30
foreign currency derivative contracts, which are measured at fair value each period and any change in fair value is recognized in foreign exchange gain within the consolidated statements of income as described above. Refer to Note
9
, Derivative Instruments for more information.
Mexico Tax Reform
In December 2018, the Mexican government enacted changes in the tax law effective January 1, 2019 (“Mexico Tax Reform”), which for 2019 eliminated the option to monetize the Mexican fuel excise tax credit by offsetting income tax withholding payment obligations. Previously, the Company had the option to monetize the Mexican fuel excise tax credit through income tax withholding and income tax obligations. As a result, the Company will be allowed to offset the 2019 Mexican fuel excise tax credit only against its Mexico corporate income tax liability on the 2019 annual income tax return. The elimination of the option to apply the Mexican fuel excise tax credit to income tax withholding payment obligations requires the Company to recognize the credit as a reduction of income tax expense rather than a reduction of operating expenses. The Company believes it will continue to be eligible for the Mexican fuel excise tax credit and expects to have sufficient 2019 Mexico corporate income tax liability to fully utilize the credit in accordance with Mexico Tax Reform.
Liquidity and Capital Resources
Overview
The Company focuses its cash and capital resources on investing in the business, shareholder returns and optimizing its capital structure.
The Company believes, based on current expectations, that cash and other liquid assets, operating cash flows, access to debt and equity capital markets, and other available financing resources will be sufficient to fund anticipated operating expenses, capital expenditures, debt service costs, dividends, share repurchases, and other commitments in the foreseeable future. The Company’s current financing instruments contain restrictive covenants which limit or preclude certain actions; however, the covenants are structured such that the Company expects to have sufficient flexibility to conduct its operations. The Company was in compliance with all of its debt covenants as of
March 31, 2019
.
Though KCS’s cash flows from operations are expected to be sufficient to fund operations, capital expenditures, debt service and dividends, the Company may, from time to time, incur debt to refinance existing indebtedness, purchase equipment under operating leases, repurchase shares, or fund equipment additions or new investments.
During the three months ended
March 31, 2019
, the Company invested
$174.9 million
in capital expenditures. See the Capital Expenditures section for further details.
During the first quarter of 2019, KCS repurchased
465,523
shares of common stock for
$50.3 million
at an average price of
$108.02
per share under the common share repurchase program announced in August 2017. Since inception of this program, KCS has repurchased
5,157,205
shares of common stock for
$548.6 million
at an average price of
$106.37
per share. Management’s assessment of market conditions, available liquidity and other factors will determine the timing and volume of any future repurchases.
During the first quarter of 2019, the Company repurchased
2,110
shares of its $25 par preferred stock for less than
$0.1 million
at an average price of
$26.40
per share.
During the first quarter of 2019, the Company’s Board of Directors declared a quarterly cash dividend on its common stock of $0.36 per share (total of
$36.3 million
). Subject to the discretion of the Board of Directors, capital availability and a determination that cash dividends continue to be in the best interest of its stockholders, the Company intends to pay a quarterly dividend on an ongoing basis.
On March 8, 2019, KCS entered into a new $600.0 million revolving credit facility which replaced its existing $800.0 million revolving credit facility.
For additional discussion of the agreements representing the indebtedness of KCS, see Note 11, Short-Term Borrowings and Note 12, Long-Term Debt in the “Notes to the Consolidated Financial Statements” section of the Company’s Annual Report on Form 10-K for the year ended
December 31, 2018
.
On
March 31, 2019
, total available liquidity (the cash balance plus revolving credit facility availability) was
$692.7 million
, compared to availability at
December 31, 2018
of
$900.5 million
. This decrease was due to the reduction in the revolving credit facility availability discussed above.
31
As of
March 31, 2019
, the total cash and cash equivalents held outside of the U.S. in foreign subsidiaries was
$51.7 million
after repatriating approximately $40.0 million during the first quarter of 2019. The Company expects that this cash will be available to fund operations without incurring significant additional income taxes.
Mexico Tax Reform eliminated “universal compensation” that allowed Mexican taxpayers to offset recoverable tax balances against balances due for other federal taxes. The elimination of “universal compensation” could negatively impact the timing of KCSM’s cash flow by up to $60.0 million in 2019 while awaiting refunds of value added tax from the Mexican government.
Cash Flow Information
Summary cash flow data follows
(in millions)
:
|
Three Months Ended
|
|||||||
|
March 31,
|
|||||||
|
2019
|
2018
|
||||||
|
Cash flows provided by (used for):
|
|||||||
|
Operating activities
|
$
|
272.7
|
|
$
|
140.6
|
|
|
|
Investing activities
|
(189.7
|
)
|
(124.2
|
)
|
|||
|
Financing activities
|
(90.8
|
)
|
(103.5
|
)
|
|||
|
Net decrease in cash and cash equivalents
|
(7.8
|
)
|
(87.1
|
)
|
|||
|
Cash and cash equivalents beginning of year
|
100.5
|
|
134.1
|
|
|||
|
Cash and cash equivalents end of period
|
$
|
92.7
|
|
$
|
47.0
|
|
|
Cash flows from operating activities increased
$132.1 million
for the
three
months ended
March 31, 2019
, compared to the same period in
2018
, primarily due to an increase in cash received for working capital items resulting mainly from the timing of certain receipts.
Net cash used for investing activities increased
$65.5 million
for the
three
months ended
March 31, 2019
, compared to the same period in 2018, due to an increase in capital expenditures of
$69.9 million
and an increase in investments in and advances to affiliates of
$8.2 million
, partially offset by a
$11.2 million
decrease in the purchase or replacement of equipment under existing operating leases. Additional information regarding capital expenditures is provided below.
Net cash used for financing activities decreased
$12.7 million
for the
three
months ended
March 31, 2019
, compared to the same period in 2018, primarily due to a decrease in repayment of long-term debt of $6.0 million, a decrease in repayments of net short-term borrowings of $4.1 million and a decrease in shares repurchased of
$3.7 million
.
32
Capital Expenditures
KCS has funded, and expects to continue to fund capital expenditures with operating cash flows and short and long-term debt.
The following table summarizes capital expenditures by type
(in millions):
|
Three Months Ended
|
|||||||
|
March 31,
|
|||||||
|
2019
|
2018
|
||||||
|
Roadway capital program
|
$
|
59.8
|
|
$
|
65.1
|
|
|
|
Locomotives and freight cars
|
85.3
|
|
8.5
|
|
|||
|
Capacity
|
16.4
|
|
7.6
|
|
|||
|
Positive train control
|
3.7
|
|
6.2
|
|
|||
|
Information technology
|
8.1
|
|
7.9
|
|
|||
|
Other
|
1.6
|
|
2.8
|
|
|||
|
Total capital expenditures (accrual basis)
|
174.9
|
|
98.1
|
|
|||
|
Change in capital accruals
|
5.0
|
|
11.9
|
|
|||
|
Total cash capital expenditures
|
$
|
179.9
|
|
$
|
110.0
|
|
|
|
Purchase or replacement of equipment under operating leases (accrual basis)
|
$
|
—
|
|
$
|
11.0
|
|
|
|
Change in capital accruals
|
—
|
|
0.2
|
|
|||
|
Total cash purchase or replacement of equipment under operating leases
|
$
|
—
|
|
$
|
11.2
|
|
|
Generally, the Company’s capital program consists of capital replacement and equipment. For
2019
, internally generated cash flows are expected to fund cash capital expenditures, which are currently estimated to be between $640.0 million and $660.0 million. In addition, the Company periodically reviews its equipment under operating leases. Any purchase or replacement of equipment under operating leases during 2019 is expected to be funded with internally generated cash flows and/or debt.
Other Matters
Regulatory Updates
USMCA.
On November 30, 2018, U.S. President Trump, Canadian Prime Minister Trudeau, and then-Mexican President Peña Nieto signed the U.S.-Mexico-Canada Agreement (“USMCA”). The agreement would serve as a successor to the 1994 North American Free Trade Agreement (“NAFTA”). The USMCA will not become effective until all three parties have completed their respective domestic ratification procedures.
In the United States, congressional review and approval of the USMCA is done under the Bipartisan Trade Priorities and Accountability Act of 2015. Implementing legislation is expected to be introduced in Congress possibly in the first half of 2019.
U.S. Tariff Imposition on Imports.
The administration of U.S. President Donald J. Trump has implemented new U.S. tariffs, that could impact the level of trade between the U.S and Mexico and global commerce. U.S. trading partners have responded by announcing retaliatory tariffs on some U.S. exports. At this time, the Company cannot determine the impacts these tariffs will have on the Company’s consolidated financial statements.
Collective Bargaining
KCSR participates in industry-wide multi-employer bargaining as a member of the National Carriers’ Conference Committee (“NCCC”), as well as local bargaining for agreements that are limited to KCSR's property. Approximately 75% of KCSR employees are covered by collective bargaining agreements. Long-term agreements were reached voluntarily or through the arbitration process during 2017 and 2018 covering all of the participating unions. These agreements will be in effect through December 2019.
KCSM Servicios, S.A. de C.V. (“KCSM Servicios”), a wholly owned subsidiary of KCS, provides employee services to KCSM, and KCSM pays KCSM Servicios market-based rates for these services. KCSM Servicios union employees are covered by one labor agreement, which was signed on April 16, 2012, between KCSM Servicios and the Sindicato de Trabajadores Ferrocarrileros de la República Mexicana (“Mexican Railroad Union”), and which remains in effect during the period of the Concession, for the purpose of regulating the relationship between the parties. Approximately 80% of KCSM Servicios employees are covered by this labor agreement. The compensation terms under this labor agreement are subject to renegotiation on an annual basis and all other benefits
33
are subject to negotiation every two years. During the third quarter of 2018, the compensation terms for the period covering July 1, 2018, to June 30, 2019, were finalized between KCSM Servicios and the Mexican Railroad Union. The finalization of the compensation terms did not have a significant effect on the consolidated financial statements.
Union labor negotiations have not historically resulted in any strike, boycott, or other disruption in the Company’s business operations.
|
Item 3.
|
Quantitative and Qualitative Disclosures about Market Risk
|
There was no material change during the quarter from the information set forth in Part II, Item 7A. “Quantitative and Qualitative Disclosure about Market Risk” in the Annual Report on Form 10-K for the year ended
December 31, 2018
.
|
Item 4.
|
Controls and Procedures
|
(a) Disclosure Controls and Procedures
As of the end of the period for which this Quarterly Report on Form 10-Q is filed, the Company’s Chief Executive Officer and Chief Financial Officer have each reviewed and evaluated the effectiveness of the Company’s disclosure controls and procedures (as defined in Rules 13a-15(e) and 15d-15(e) of the Securities Exchange Act of 1934, as amended (the “Exchange Act”)). Based on that evaluation, the Chief Executive Officer and Chief Financial Officer have each concluded that the Company’s current disclosure controls and procedures are effective to ensure that information required to be disclosed by the Company in reports that it files or submits under the Exchange Act is recorded, processed, summarized and reported within the time periods specified in the Securities and Exchange Commission rules and forms, and include controls and procedures designed to ensure that information required to be disclosed by the Company in such reports is accumulated and communicated to the Company’s management, including the Chief Executive Officer and Chief Financial Officer, as appropriate, to allow timely decisions regarding required disclosure.
(b) Changes in Internal Control over Financial Reporting
There have not been any changes in the Company’s internal control over financial reporting that occurred during the
first
quarter of
2019
that have materially affected, or are reasonably likely to materially affect, the Company’s internal control over financial reporting. The Company implemented changes to internal controls due to the adoption of Accounting Standard Update No. 2016-02, Leases (Accounting Standard Codification Topic 842) effective January 1, 2019. These changes include implementing a new lease accounting system and processes to evaluate and account for contracts under the new accounting standard. There were no significant changes to the Company’s internal control over financial reporting due to the adoption of the new standard.
34
|
Item 1.
|
Legal Proceedings
|
For information related to the Company’s legal proceedings, see Note
13
, Commitments and Contingencies, under Part I, Item 1 of this quarterly report on Form 10-Q.
|
Item 1A.
|
Risk Factors
|
There were no material changes during the quarter to the Risk Factors disclosed in Item 1A - “Risk Factors” in our annual report on Form 10-K for the year ended December 31, 2018.
|
Item 2.
|
Unregistered Sales of Equity Securities and Use of Proceeds
|
Purchases of Equity Securities
The following table presents stock repurchases during each month for the first quarter of 2019:
|
Period
|
|
(a) Total
Number
of Shares
(or Units)
Purchased
(1)
|
|
(b) Average
Price Paid
per Share (or Unit)
|
|
(c) Total
Number of
Shares
(or Units)
Purchased
as Part of
Publicly
Announced
Plans or
Programs
(2)
|
|
(d) Maximum
Number (or
Approximate
Dollar Value)
of Shares (or Units)
that may yet be
purchased under
the Plans
or
Programs
(2)
|
|
||||||||||
|
Common stock
|
|||||||||||||||||||
|
January 1-31, 2019
|
|
123,050
|
|
|
$
|
107.64
|
|
|
123,050
|
|
|
$
|
288,488,166
|
|
|
||||
|
February 1-28, 2019
|
|
187,043
|
|
|
$
|
105.45
|
|
|
187,043
|
|
|
$
|
268,764,223
|
|
|
||||
|
March 1-31, 2019
|
|
155,430
|
|
|
$
|
111.40
|
|
|
155,430
|
|
|
$
|
251,449,237
|
|
|
||||
|
Total
|
|
465,523
|
|
|
|
|
|
465,523
|
|
|
|
|
|
||||||
|
$25 Par preferred stock
|
|||||||||||||||||||
|
January 1-31, 2019
|
1,050
|
|
$
|
25.89
|
|
—
|
|
—
|
|
||||||||||
|
February 1-28, 2019
|
1,060
|
|
$
|
26.90
|
|
—
|
|
—
|
|
||||||||||
|
March 1-31, 2019
|
—
|
|
—
|
|
—
|
|
—
|
|
|||||||||||
|
Total
|
2,110
|
|
—
|
|
|||||||||||||||
|
(1
|
)
|
All $25 par preferred stock repurchases were made other than through a publicly disclosed plan or program. Repurchases of $25 par preferred stock were made through open market purchases and/or privately negotiated transactions.
|
|
(2
|
)
|
On August 15, 2017, the Company announced that the Board of Directors approved a share repurchase program, pursuant to which up to $800.0 million in shares of common stock could be repurchased through June 30, 2020. The authorization included a $200.0 million Accelerated Share Repurchase (“ASR”) program and a $600.0 million open market share repurchase program.
|
|
Item 3.
|
Defaults upon Senior Securities
|
None.
|
Item 4.
|
Mine Safety Disclosures
|
Not applicable.
|
Item 5.
|
Other Information
|
None.
35
|
Item 6.
|
Exhibits
|
|
Exhibit
No.
|
Exhibits
|
|
|
10.1
|
||
|
10.2
|
||
|
10.3*
|
||
|
10.4*
|
||
|
31.1*
|
||
|
31.2*
|
||
|
32.1*
|
||
|
32.2*
|
||
|
101
|
The following unaudited financial information from Kansas City Southern’s Quarterly Report on Form 10-Q for the quarter ended March 31, 2019, formatted in XBRL (Extensible Business Reporting Language) includes: (i) Consolidated Statements of Income for the three months ended March 31, 2019 and 2018, (ii) Consolidated Statements of Comprehensive Income for the three months ended March 31, 2019 and 2018, (iii) Consolidated Balance Sheets as of March 31, 2019 and December 31, 2018, (iv) Consolidated Statements of Cash Flows for the three months ended March 31, 2019 and 2018, (v) Consolidated Statements of Changes in Equity for the three months ended March 31, 2019 and 2018, and (vi) the Notes to Consolidated Financial Statements.
|
|
|
* Filed with this Report.
|
||
36
SIGNATURES
Pursuant to the requirements of the Securities Exchange Act of 1934, the Company has duly caused this report to be signed on its behalf by the undersigned thereunto duly authorized and in the capacities indicated on
April 17, 2019
.
|
Kansas City Southern
|
|
/s/ M
ICHAEL
W. U
PCHURCH
|
|
Michael W. Upchurch
|
|
Executive Vice President and Chief Financial Officer
(Principal Financial Officer)
|
|
/s/ S
UZANNE
M. G
RAFTON
|
|
Suzanne M. Grafton
|
|
Vice President and Chief Accounting Officer
|
|
(Principal Accounting Officer)
|
37
TABLE OF CONTENTS
Part I Financial InformationItem 1. Financial Statements (unaudited)Item 2. Management S Discussion and Analysis Of Financial Condition and Results Of OperationsItem 3. Quantitative and Qualitative Disclosures About Market RiskItem 4. Controls and ProceduresPart II Other InformationItem 1. Legal ProceedingsItem 1A. Risk FactorsItem 2. Unregistered Sales Of Equity Securities and Use Of ProceedsItem 3. Defaults Upon Senior SecuritiesItem 4. Mine Safety DisclosuresItem 5. Other InformationItem 6. Exhibits