KEY TRONIC CORP
10-Ks and 10-Qs
|
|
|
|
|
|
|
|
|
|
|
|
|
|
|
|
|
|
|
|
|
|
|
|
|
|
|
|
|
|
|
|
|
|
|
|
|
|
|
|
|
|
|
|
|
|
|
|
|
|
UNITED STATES
SECURITIES AND EXCHANGE COMMISSION
Washington, D.C. 20549
____________________________________________________________
FORM 10-K
____________________________________________________________
x
ANNUAL REPORT PURSUANT TO SECTION 13 OR 15(d) OF THE SECURITIES EXCHANGE ACT OF 1934
FOR THE FISCAL YEAR ENDED
JUNE 29, 2013
OR
¨
TRANSITION REPORT PURSUANT TO SECTION 13 OR 15(D) OF THE SECURITIES EXCHANGE ACT OF 1934
FOR THE PERIOD FROM TO
Commission File Number 0-11559
____________________________________________________________
KEY TRONIC CORPORATION
(Exact name of registrant as specified in its charter)
____________________________________________________________
|
Washington
|
|
91-0849125
|
|
(State or other jurisdiction of
Incorporation or organization)
|
|
(I.R.S. Employer
Identification No.)
|
|
N. 4424 Sullivan Road, Spokane Valley,
Washington
|
|
99216
|
|
(Address of principal executive offices)
|
|
(Zip Code)
|
(509) 928-8000
(Registrant’s telephone number, including area code)
N/A
(Former name, former address and former fiscal year, if changed since last report)
____________________________________________________________
Securities Registered Pursuant to Section 12(b) of the Act: None
|
Title of each class
|
|
Name of each exchange on which registered
|
|
Common stock, no par value
|
|
The NASDAQ Stock Market LLC
|
Securities Registered Pursuant to Section 12(g) of the Act: None
____________________________________________________________
Indicate by check mark if the registrant is a well-known seasoned issuer, as defined in Rule 405 of the Securities Act. Yes
¨
No
x
Indicate by check mark if the registrant is not required to file reports pursuant to Section 13 or Section 15(d) of the Exchange Act. Yes
¨
No
x
Indicate by check mark whether the registrant (1) has filed all reports required to be filed by Section 13 or 15(d) of the Securities Exchange Act of 1934 during the preceding 12 months (or for such shorter period that the registrant was required to file such reports), and (2) has been subject to such filing requirements for the past 90 days. Yes
x
No
¨
Indicate by check mark whether the registrant has submitted electronically and posted on its corporate Web site, if any, every Interactive Data File required to be submitted and posted pursuant to Rule 405 of Regulations S-T (§ 232.405 of this chapter) during the preceding 12 months (or for such shorter period that the registrant was required to submit and post such files). Yes
x
No
¨
Indicate by check mark if disclosure of delinquent filers pursuant to Item 405 of Regulation S-K is not contained herein, and will not be contained, to the best of registrant’s knowledge, in definitive proxy or information statements incorporated by reference in Part III of this Form 10-K or any amendment to this Form 10-K.
x
Indicate by check mark whether the registrant is a large accelerated filer, an accelerated filer, a non-accelerated filer or a smaller reporting company. See the definitions of “large accelerated filer,” “accelerated filer” and “smaller reporting company” in Rule 12b-2 of the Exchange Act.
(Check one):
|
Large accelerated filer
|
¨
|
Accelerated filer
|
x
|
|||
|
Non-accelerated filer
|
¨
(Do not check if a smaller reporting company)
|
Smaller reporting company
|
¨
|
|||
Indicate by check mark whether the registrant is a shell company (as defined in Rule 12b-2 of the Exchange Act). Yes
¨
No
x
State the aggregate market value of the voting and non-voting common equity held by non affiliates computed by reference to the price at which the common equity was last sold, or the average bid and asked price of such common equity, as of the last business day of the registrant’s most recently completed second fiscal quarter.
As of December 29, 2012, the aggregate market value of the registrant’s common stock held by non-affiliates of the registrant was
$98.8 million
based on the closing price as reported on the NASDAQ.
Indicate the number of shares outstanding of each of the issuer’s classes of common stock, as of the latest practicable date:
10,509,688
shares of common stock were outstanding as of
September 4, 2013
.
____________________________________________________________
Documents Incorporated by Reference:
The following documents are incorporated by reference to the extent specified herein:
|
Document Description
|
|
Part of Form 10-K
|
|
Proxy Statement dated September 20, 2013
|
|
Part III
|
KEY TRONIC CORPORATION
2013
FORM 10-K
TABLE OF CONTENTS
|
|
|
Page No.
|
|
|
PART I
|
|
|
Item 1.
|
||
|
Item 1A.
|
||
|
Item 1B.
|
||
|
Item 2.
|
||
|
Item 3.
|
||
|
Item 4.
|
||
|
|
PART II
|
|
|
Item 5.
|
||
|
Item 6.
|
||
|
Item 7.
|
||
|
Item 7A.
|
||
|
Item 8.
|
28-50
|
|
|
Item 9.
|
||
|
Item 9A.
|
||
|
Item 9B.
|
||
|
|
PART III
|
|
|
Item 10.
|
||
|
Item 11.
|
||
|
Item 12.
|
||
|
Item 13.
|
||
|
Item 14.
|
||
|
|
PART IV
|
|
|
Item 15.
|
||
|
|
||
3
FORWARD-LOOKING STATEMENTS
References in this report to “the Company”, “Key Tronic”, “KeyTronicEMS”, “we”, “our”, or “us” mean Key Tronic Corporation together with its subsidiaries, except where the context otherwise requires.
This Annual Report on Form 10-K contains forward-looking statements in addition to historical information. Forward-looking statements are subject to certain risks and uncertainties that could cause actual results to differ materially from those reflected in the forward-looking statements. Risks and uncertainties that might cause such differences include, but are not limited to those outlined in “Management’s Discussion and Analysis of Financial Condition and Results of Operations—Risks and Uncertainties that May Affect Future Results.” Readers are cautioned not to place undue reliance on forward-looking statements, which reflect management’s opinions only as of the date hereof. The Company undertakes no obligation to update forward-looking statements to reflect developments or information obtained after the date hereof and disclaims any obligation to do so. Readers should carefully review the risk factors described in periodic reports the Company files from time to time with the Securities and Exchange Commission, including Quarterly Reports on Form 10-Q and Current Reports on Form 8-K.
|
Item 1.
|
BUSINESS
|
Background
Key Tronic Corporation (dba: KeyTronicEMS Co.), was organized in 1969 as a Washington corporation that locally manufactured computer keyboards. The ability to design, build and deliver a quality product led us to become a leading independent manufacturer of keyboards for computers in the United States. Our fully integrated design, tooling, and automated manufacturing capabilities enabled us to rapidly respond to customers’ needs for keyboards in production quantities worldwide. We supported our sales growth through the development and purchase of international manufacturing facilities. As the computer keyboard market matured with increasing competition from other international providers, we determined that our business could no longer solely rely on keyboard sales.
After assessing market conditions and our strengths and capabilities, we shifted focus from keyboard manufacturing to contract manufacturing for a wide range of products. Our unique strategic attributes are based on our core strengths of innovative design and engineering expertise in electronics, mechanical engineering, sheet metal and stamping, and precision plastics combined with high-quality, low cost production, and assembly on an international basis while providing exceptional customer service. These strengths have made our company a strong competitor in the electronic manufacturing services (EMS) market.
Our Industry and Strategy
The expansion of the EMS industry has allowed us to continue to expand our customer base and the industries that we serve. The challenging global macroeconomic environment has had a negative impact on previously held customer programs. However, we are successfully confronting the challenging global macroeconomic environment by controlling our costs and winning new customer programs, which allowed us to increase our profitability and maintain a strong balance sheet. The increase in new programs represents a growing portion of our revenue and a promising foundation for our future. In keeping with our long-term strategic objectives, we have been successfully building a more diversified customer portfolio, spanning a wider range of industries. We currently offer our customers the following services: integrated electronic and mechanical engineering, precision plastic molding, sheet metal fabrication, assembly, component selection, sourcing and procurement, worldwide logistics, and new product testing and production all at competitive pricing due to our global footprint.
We believe that we are well positioned in the EMS industry to continue the expansion of our customer base and achieve long term growth. Our unique blend of multinational facilities, centralized management, and core strengths continue to support our growth and our customers’ needs. We continue to focus on controlling operating expenses and leveraging the synergistic capabilities of our world-class facilities in the United States, Mexico, and China. This international production capability provides our customers with the benefits of improved supply-chain management, reduced inventory, lower labor costs, lower transportation costs, and reduced product fulfillment time. Given our competitive advantages and the growing pressure for new potential customers to move forward with their outsourcing strategies, we are strongly positioned to win new business in coming periods and grow our revenue and profits.
The EMS industry is intensely competitive. Although our customer base is growing we still have less than 1% of the potential global market and our revenue can fluctuate significantly due to reliance on a concentrated base of customers. We are planning for new customer growth in the coming quarters by securing new programs with new and existing customers, increasing our worldwide manufacturing capacity, and continuing to improve our manufacturing and procurement processes. Ongoing challenges that we face include the following: Continuing to win programs from new and existing customers, balancing production capacity and key personnel in support of new customer programs, improving operating efficiencies, controlling costs while developing competitive pricing strategies, and successfully transitioning new program wins to full production during a time of macroeconomic uncertainty.
4
Customers and Marketing
We provide a mix of manufacturing services for outsourced Original Equipment Manufacturing (OEM) products. We provide the following EMS services: Product design, surface mount technologies (SMT) and pin through hole capability for printed circuit board assembly, tool making, precision plastic molding, sheet metal fabrication, liquid injection molding, complex assembly, automated tape winding, prototype design and full product assembly.
Sales of the majority of our products have historically not been seasonal in nature, but may be seasonal in the future if there are changes in the types of products manufactured. Sales can, however, fluctuate significantly between quarters from changes in customers and customer demand due to the concentration of sales generated by our largest customers.
For the fiscal years
2013
,
2012
and
2011
, the five largest customers in each year accounted for 71%, 73%, and 62% of combined total net sales, respectively. At the end of fiscal year
2013
, we were generating revenue from 183 separate programs and 56 distinct customers as compared to 165 programs and 48 customers at the end of fiscal year
2012
. As these new customers’ sales ramp up and new programs are won our concentration of revenue should decrease in the future.
The following table represents all customers that represented 10% or more of total net sales during the last three fiscal years:
|
|
Percentage of Net Sales by Fiscal Year
|
|||||
|
|
2013
|
2012
|
2011
|
|||
|
Customer A
|
23%
|
29%
|
15%
|
|||
|
Customer B
|
21%
|
17%
|
16%
|
|||
|
Customer C
|
19%
|
16%
|
16%
|
|||
Although keyboard manufacturing is still included in our product offerings, we do not expect annual keyboard sales to be a material component of our business. We realized revenues of approximately
$2.4 million
,
$2.8 million
, and
$3.9 million
in fiscal years
2013
,
2012
, and
2011
, respectively, from the sale of keyboards. In order to accommodate the demand for standard keyboard layouts, we maintain a purchase-from-stock program. The more popular standard layouts are built and stocked for immediate availability.
We market our products and services primarily through our direct sales department aided by strategically located field sales people and distributors. Although we maintain relationships with several independent sales organizations to assist in marketing our EMS product lines, commissions earned and paid are not material to the consolidated financial statements.
Manufacturing
We have continually made investments in developing and expanding a capital equipment base to achieve vertical integration and efficiencies in our manufacturing processes. We have invested significant capital into SMT for volume manufacturing of complex printed circuit board assemblies. We also design and develop tooling for injection molding and manufacture the majority of plastic parts used in the products we manufacture. Additionally, we have equipment to maintain a controlled clean environment for manufacturing processes that require a high level of precise control.
We use a variety of manual and automated assembly processes in our facilities, depending upon product complexity and degree of customization. Some examples of automated processes include component insertion, SMT, flexible robotic assembly, automated storage tape winding, computerized vision system quality inspection, automated switch and key top installation, and automated functional testing.
Our engineering expertise and automated manufacturing processes enable us to work closely with our customers during the design and prototype stages of production and to jointly increase productivity and reduce response time to the marketplace. We use computer-aided design techniques and software to assist in preparation of the tool design layout and component placement, to reduce tooling and production costs, improve component and product quality, and enhance turnaround time during product development.
We purchase materials and components for our products from many different suppliers, including both domestic and international sources. We develop close working relationships with our suppliers, many of whom have been supplying products to us for several years.
5
Research, Development, and Engineering
As part of our long-term strategy, we are committed to supporting our customers by providing research, development, and engineering services. These services allow us to facilitate in optimizing new product designs, and the production processes of our customers programs.
Research, development, and engineering (RD&E) expenses consist principally of employee related costs, third party development costs, program materials costs, depreciation, and allocated information technology and facilities costs.
Competition
The market for the products and services we provide is highly competitive. There are numerous competitors in the EMS industry, many of which have substantially more resources and are more geographically diverse than we are. Some of our competitors have similar international production capabilities, large financial resources and some have substantially greater manufacturing, research and development, and marketing resources. There is also competition from the manufacturing operations of our current and potential customers, who are continually evaluating the merits of manufacturing their products internally versus the advantages of outsourcing. We believe that we can currently compete favorably in these areas primarily on the basis of our international footprint, responsiveness, creativity, vertical production capability, quality, and cost.
Trademarks and Patents
Our name and logo are federally registered trademarks, and we believe they are valuable assets of our business. During 2001, we began operating under the trade name “KeyTronicEMS” to better identify our primary business concentration. We also own several keyboard patents; however, since our focus is EMS, management believes that these patents will not have a significant impact on future revenues.
Employees
We consider our employees to be our primary strength and we make considerable efforts to maintain a well-qualified workforce. Our employee benefits include bonus programs involving periodic payments to all employees based on meeting quarterly or fiscal year performance targets. We regularly provide transportation, medical services, and meals to all of our employees in foreign locations. We maintain a 401(k) plan for U.S. employees, which provides a discretionary matching company contribution of up to 4% of an employee’s salary. We provide group health, life, and disability insurance plans. We also maintain stock option plans and other long term incentive plans for certain employees and outside directors.
As of
June 29, 2013
we had
2,584
employees compared to
2,700
on
June 30, 2012
, and
1,997
on
July 2, 2011
. Since we can have significant fluctuations in product demand, we seek to maintain flexibility in our workforce by utilizing skilled temporary and short-term contract labor in our manufacturing facilities in addition to full-time employees.
Backlog
On July 27, 2013 our order backlog was valued at approximately $60.0 million, compared to approximately $83.1 million on July 28, 2012. Even though our order backlog is comprised of firm purchase orders, the amount of backlog is not necessarily indicative of future sales but can be indicative of trends in expected future sales revenue. Due to the relationships with our customers, we will occasionally allow orders to be canceled or rescheduled and as a result it is not a meaningful indicator of future financial results. If there are canceled or rescheduled orders, we typically negotiate fees to cover the costs we have incurred. Order backlog consists of purchase orders received for products expected to be shipped approximately within the next twelve months, although shipment dates are subject to change due to design modifications, customer forecast changes, or other customer requirements.
Foreign Markets
Information concerning net sales and long-lived assets (property, plant, and equipment) by geographic areas is set forth in Note 11, “Enterprise-Wide Disclosures” of the consolidated financial statements of this Annual Report on Form 10-K and that information is incorporated herein.
6
Executive Officers of the Registrant
The table below sets forth the name, current age and current position of our executive officers and other significant employees:
|
Name
|
Age
|
Positions Held
|
|
Executive Officers
|
||
|
Craig D. Gates
|
54
|
President and Chief Executive Officer
|
|
Ronald F. Klawitter
|
61
|
Executive Vice President of Administration, Chief Financial Officer and Treasurer
|
|
Douglas G. Burkhardt
|
55
|
Executive Vice President of Worldwide Operations
|
|
Philip S. Hochberg
|
51
|
Executive Vice President of Business Development
|
|
Lawrence J. Bostwick
|
61
|
Vice President of Engineering and Quality
|
|
Brett R. Larsen
|
40
|
Vice President of Finance and Controller
|
|
Frank Crispigna III
|
52
|
Vice President of Materials
|
|
Duane D. Mackleit
|
45
|
Vice President of Program Management
|
Executive Officers
CRAIG D. GATES
– President and Chief Executive Officer
Mr. Gates, age
54
, has been President and Chief Executive officer of the Company since April 2009. Previously he was Executive Vice President and General Manager from August 2002 to April 2009. He served as Executive Vice President of Marketing, Engineering and Sales from July 1997 to August 2002 and served as Vice President and General Manager of New Business Development from October 1995 to July 1997. He joined the Company as Vice President of Engineering in October of 1994. From 1982 to 1991 he held various engineering and management positions within the Microswitch Division of Honeywell, Inc., in Freeport, Illinois, and from 1991 to October 1994 he served as Director of Operations, Electronics for Microswitch. Mr. Gates has a Bachelor of Science Degree in Mechanical Engineering and a Masters in Business Administration from the University of Illinois, Urbana.
RONALD F. KLAWITTER
– Executive Vice President of Administration, Chief Financial Officer, and Treasurer
Mr. Klawitter, age
61
, has been Executive Vice President of Administration, CFO, and Treasurer since July 1997. Previously he was Vice President of Finance, Secretary, and Treasurer of the Company from October 1995 to July 1997. He was Acting Secretary from November 1994 to October 1995 and Vice President of Finance and Treasurer from 1992 to October 1995. From 1987 to 1992, Mr. Klawitter was Vice President of Finance at Baker Hughes Tubular Service, a subsidiary of Baker Hughes, Inc. Mr. Klawitter has a BA degree from Wittenberg University and is a Certified Public Accountant.
DOUGLAS G. BURKHARDT
– Executive Vice President of Worldwide Operations
Mr. Burkhardt, age
55
, has been Executive Vice President of Worldwide Operations of the Company since July 22, 2010. Previously Mr. Burkhardt was Vice President of Worldwide Operations from July 2008 to July 2010 and Director of China Operations and Program Management from January 2006 to July 2008. Mr. Burkhardt also served as Director of Northwest and China Operations from November of 1998 to January of 2006. Mr. Burkhardt also served as Director of Customer Satisfaction from March 1997 to November 1998 and Director of Molding from September of 1995 to March of 1997. Prior to this, Mr. Burkhardt served in other various senior management positions within the Company. Mr. Burkhardt has been with the Company since May of 1989. Prior to joining Key Tronic, Mr. Burkhardt worked for House of Aluminum and Glass for 12 years where he was the plant manager.
PHILIP S. HOCHBERG
– Executive Vice President of Business Development
Mr. Hochberg, age
51
, has been Executive Vice President of Business Development since July 2012. Prior this, Mr. Hochberg served as Vice President of Business Development from October 2009 through June 2012. He was Director of Business Development and Program Management from July 2008 to October 2009. Mr. Hochberg served as Director of Business Development from October 2004 to July 2008 and as Director of EMS Sales and Marketing from July 2000 to October 2004. Prior to joining Key Tronic, Mr. Hochberg worked for Quinton Instrument Company as their Director of Marketing and Product Management from 1992 to 2000. From 1988 to 1992, he was employed by SpaceLabs Medical as their Business Development Marketing Manager. Mr. Hochberg has an MBA from the University of British Columbia, a BA Psychology, with a minor in Business from Washington University in St. Louis.
7
LAWRENCE J. BOSTWICK
– Vice President of Engineering and Quality
Mr. Bostwick, age
61
, has been Vice President of Engineering and Quality since July 2008. Previously he was Director of Engineering and Quality from February 2007 to July 2008 and served as Corporate Director of Quality from February 2006 to February 2007. From 2003 to 2006 he was Director of Supply Chain Management and Quality for the Lancer Corporation and from 1998 to 2003 he was Vice President of Operations for Thermacore International. He is a graduate of the Westinghouse and General Electric – Engineering and Manufacturing Professional Development Programs. He is certified in both Quality and Industrial Engineering and is a Lean – Six Sigma Master Black Belt. Mr. Bostwick has a combined B.S. degree in Production and Operation and Industrial Engineering from Bowling Green State University and a Masters degree in Industrial Engineering and Business Administration from Syracuse University.
BRETT R. LARSEN
– Vice President of Finance, and Controller
Mr. Larsen, age
40
, has served as Vice President of Finance and Controller since February 2010. He was Chief Financial Officer of FLSmidth Spokane, Inc. from December 2008 to February 2010. From October 2005 through November 2008, Mr. Larsen served as Controller of Key Tronic Corporation. From May 2004 to October 2005, Mr. Larsen served as Manager of Financial Reporting of Key Tronic Corporation. From 2002 to May 2004, Mr. Larsen was an audit manager for the public accounting firm BDO Seidman, LLP. He also held various auditing and supervisory positions with Grant Thornton LLP from 1997 to 2002. Mr. Larsen has a Bachelor of Science degree in Accounting and a Masters degree in Accounting from Brigham Young University and is a Certified Public Accountant.
FRANK CRISPIGNA III
– Vice President of Materials
Mr. Crispigna, age
52
, has been Vice President of Materials of the company since October 2011. Prior to this, Mr. Crispigna held a variety of Materials and Supply Chain positions at Plexus Corporation since 1997, most recently serving as the Director – Supply Chain Solutions from 2005 - 2011. He has a Masters degree in Business Administration, and a Bachelor of Business Administration Degree in Marketing from the University of Wisconsin – Oshkosh. Mr. Crispigna also is a C.P.M., and received his certification in Supply Chain Leadership from the University of Wisconsin.
DUANE D. MACKLEIT
– Vice President of Program Management
Mr. Mackleit, age
45
, has been Vice President of Program Management of the company since July 2012. He served as Director of Program Management from July 2008 through June 2012. From May 2006 to July 2008 he served as Principal Program Manager. Prior to that, he served as Program Manager from March 2002 to May 2006 and Associate Program Manager from August 2000 to March 2002. Mr. Mackleit has also held several other positions with Key Tronic Corporation. Mr. Mackleit has an AA in Business from Spokane Falls Community College and a BA in Business/Marketing from Eastern Washington University. He also holds a MBA from Gonzaga University.
Available Information
Our principal executive offices are located at N. 4424 Sullivan Road, Spokane Valley, Washington 99216, and our telephone number is (509) 928-8000. Our website is located at http://www.keytronicems.com where filings of our Annual Report on Form 10-K, Quarterly Reports on Form 10-Q or current reports on Form 8-K are available after they have been filed with the Securities and Exchange Commission. The information presented on our website currently and in the future is not considered to be part of this document or any document incorporated by reference in this document.
|
Item 1A.
|
RISK FACTORS
|
There are risks and uncertainties that could affect our business. These risks and uncertainties include but are not limited to, the risk factors described below, in Item 7A: “Quantitative and Qualitative Disclosures about Market Risk” and elsewhere in this Form 10-K.
RISKS AND UNCERTAINTIES THAT MAY AFFECT FUTURE RESULTS
The following risks and uncertainties could affect our actual results and could cause results to differ materially from past results or those contemplated by our forward-looking statements. When used herein, the words “expects”, “believes”, “anticipates” and similar expressions are intended to identify forward-looking statements.
8
We may experience fluctuations in quarterly results of operations.
Our quarterly operating results have varied in the past and may vary in the future due to a variety of factors, including adverse changes in the U.S. and global macroeconomic environment, volatility in overall demand for our customers' products, success of customers' programs, timing of new programs, new product introductions or technological advances by us, our customers and our competitors, and changes in pricing policies by us, our customers, our suppliers, and our competitors. Our customer base is diverse in the markets they serve, however, decreases in demand, particularly from customers that supply the education, consumer products, and gambling industries, could affect future quarterly results. Additionally, our customers could be impacted by the illiquidity of the credit markets which could directly impact our operating results.
Component procurement, production schedules, personnel and other resource requirements are based on estimates of customer requirements. Occasionally, our customers may request accelerated production that can stress resources and reduce operating margins. In addition, because many of our operating expenses are relatively fixed, a reduction in customer demand can harm our gross profit and operating results. The products which we manufacture for our customers have relatively short product lifecycles. Therefore, our business, operating results and financial condition are dependent in a significant way on our ability to obtain orders from new customers and new product programs from existing customers.
Operating results can also fluctuate if changes are made to significant estimates and assumptions. Significant estimates and assumptions include the allowance for doubtful receivables, provision for obsolete and non-saleable inventory, stock-based compensation, the valuation allowance on deferred tax assets, impairment of long-lived assets, long-term incentive compensation accrual, the provision for warranty costs, and the impact of hedging activities.
We are exposed to general economic conditions, which could have a material adverse impact on our business, operating results and financial condition.
Recently there have been adverse conditions and uncertainty in the global economy as the result of unstable global financial and credit markets, inflation, and recession. These unfavorable economic conditions and the weakness of the credit market could affect the demand for our customers' products. The current global macroeconomic environment may affect some of our customers that could reduce orders and change forecasts which could adversely affect our sales in future periods. Additionally, the financial strength of our customers and suppliers and their ability to obtain and rely on credit financing may affect their ability to fulfill their obligations to us and have an adverse effect on our financial results.
The majority of our sales come from a small number of customers and a decline in sales to any of these customers could adversely affect our business.
At present, our customer base is concentrated and could become more or less concentrated. There can be no assurance that our principal customers will continue to purchase products from us at current levels. Moreover, we typically do not enter into long-term volume purchase contracts with our customers, and our customers have certain rights to extend or delay the shipment of their orders. We, however, typically require that our customers contractually agree to buy back inventory purchased within specified lead times to build their products if not used.
The loss of one or more of our major customers, or the reduction, delay or cancellation of orders from such customers, due to economic conditions or other forces, could materially and adversely affect our business, operating results and financial condition. Specifically, some of our major customers provide products to the banking and gambling industries which have been adversely affected by the unfavorable economic environment. The contraction in demand from our customers in these industries could continue to impact our customer orders and continue to have a negative impact on our operations over the foreseeable future. Additionally, if one or more of our customers were to become insolvent or otherwise unable to pay for the manufacturing services provided by us, our operating results and financial condition would be adversely affected.
We depend on a limited number of suppliers for components that are critical to our manufacturing processes. A shortage of these components or an increase in their price could interrupt our operations and result in a significant change in our results of operations.
We are dependent on many suppliers, including sole source suppliers, to provide key components and raw materials used in manufacturing customers' products. We have seen supply shortages in certain electronic components. This can result in longer lead times and the inability to meet our customers request for flexible production and extended shipment dates. If demand for components outpaces supply, capacity delays could affect future operations. Delays in deliveries from suppliers or the inability to obtain sufficient quantities of components and raw materials could cause delays or reductions in shipment of products to our customers which could adversely affect our operating results and damage customer relationships.
9
We operate in a highly competitive industry; if we are not able to compete effectively in the EMS industry, our business could be adversely affected.
Competitors may offer customers lower prices on certain high volume programs. This could result in price reductions, reduced margins and loss of market share, all of which would materially and adversely affect our business, operating results, and financial condition. If we were unable to provide comparable or better manufacturing services at a lower cost than our competitors, it could cause sales to decline. In addition, competitors can copy our non-proprietary designs and processes after we have invested in development of products for customers, thereby enabling such competitors to offer lower prices on such products due to savings in development costs.
Cash and cash equivalents are exposed to concentrations of credit risk.
We place our cash with high credit quality institutions. At times, such balances may be in excess of the federal depository insurance limit or may be on deposit at institutions which are not covered by insurance. If such institutions were to become insolvent during which time it held our cash and cash equivalents in excess of the insurance limit, it could be necessary to obtain other credit financing to operate our facilities.
Our ability to secure and maintain sufficient credit arrangements is key to its continued operations
.
There is no assurance that we will be able to retain or renew our credit agreements in the future. In the event the business grows rapidly or the uncertain macroeconomic climate continues, additional financing resources could be necessary in the current or future fiscal years. There is no assurance that we will be able to obtain equity or debt financing at acceptable terms, or at all in the future. For a summary of our banking arrangements, see Note 4, Long-Term Debt, of the “Notes to Consolidated Financial Statements” in this Annual Report on Form 10-K.
Our international operations may be subject to certain risks.
Most of the products we manufacture are in facilities located in Mexico and China. These international operations may be subject to a number of risks, including:
|
•
|
difficulties in staffing and managing foreign operations;
|
|
•
|
political and economic instability (including acts of terrorism, civil unrest, forms of violence and outbreaks of war), which could impact our ability to ship, manufacture, and/or receive product;
|
|
•
|
unexpected changes in regulatory requirements and laws;
|
|
•
|
longer customer payment cycles and difficulty collecting accounts receivable;
|
|
•
|
export duties, import controls and trade barriers (including quotas);
|
|
•
|
governmental restrictions on the transfer of funds;
|
|
•
|
burdens of complying with a wide variety of foreign laws and labor practices;
|
|
•
|
fluctuations in currency exchange rates, which could affect component costs, local payroll, utility and other expenses;
|
|
•
|
our foreign locations may be impacted by hurricanes, earthquakes, water shortages, tsunamis, floods, typhoons, fires, extreme weather conditions and other natural or man-made disasters.
|
Our operations in certain foreign locations receive favorable income tax treatment in the form of tax credits or other incentives. In the event that such tax incentives are not extended, are repealed, or we no longer qualify for such programs, our taxes may increase, which would reduce our net income.
A significant portion of our operations are in foreign locations. As a result, transactions occur in currencies other than the U.S. dollar. Exchange rate fluctuations among other currencies used by us could directly or indirectly affect our financial results. Future currency fluctuations are dependent upon a number of factors and cannot be easily predicted. We currently use Mexican peso forward contracts to hedge foreign currency fluctuations for a portion of our Mexican peso denominated expenses. However, unexpected losses could occur from future fluctuations in exchange rates.
Additionally, certain foreign jurisdictions restrict the amount of cash that can be transferred to the U.S or impose taxes and penalties on such transfers of cash. To the extent we have excess cash in foreign locations that could be used in, or is needed by, our operations in the United States, we may incur significant penalties and/or taxes to repatriate these funds.
10
Our success will continue to depend to a significant extent on our key personnel.
Our future success depends in large part on the continued service of our key technical, marketing and management personnel and on our ability to continue to attract and retain qualified employees. There can be no assurance that we will be successful in attracting and retaining such personnel. The loss of key employees could have a material adverse effect on our business, operating results and financial condition.
If we are unable to maintain our technological and manufacturing process expertise, our business could be adversely affected.
The markets for our customers' products is characterized by rapidly changing technology, evolving industry standards, frequent new product introductions and short product life cycles. The introduction of products embodying new technologies or the emergence of new industry standards can render existing products obsolete or unmarketable. Our success will depend upon our customers' ability to enhance existing products and to develop and introduce, on a timely and cost-effective basis, new products that keep pace with technological developments and emerging industry standards and address evolving and increasingly sophisticated customer requirements. Failure of our customers to do so could substantially harm our customers' competitive positions. There can be no assurance that our customers will be successful in identifying, developing and marketing products that respond to technological change, emerging industry standards or evolving customer requirements.
Start-up costs and inefficiencies related to new or transferred programs can adversely affect our operating results and such costs may not be recoverable if such new programs or transferred programs are canceled.
Start-up costs, the management of labor and equipment resources in connection with the establishment of new programs and new customer relationships, and the need to obtain required resources in advance can adversely affect our gross margins and operating results. These factors are particularly evident in the ramping stages of new programs. These factors also affect our ability to efficiently use labor and equipment. We are currently managing a number of new programs. Consequently, our exposure to these factors has increased. In addition, if any of these new programs or new customer relationships were terminated, our operating results could be harmed, particularly in the short term. We may not be able to recoup these start-up costs or replace anticipated new program revenues.
An adverse change in the interest rates for our borrowings could adversely affect our financial condition.
We are exposed to interest rate risk under our revolving line of credit with interest rates based on various levels of margin added to published prime rate and LIBOR rates depending on the calculation of a certain financial covenant. We have not historically hedged the interest rate on our credit facility, therefore, significant changes in interest rates could adversely affect our results of operations.
Compliance or the failure to comply with current and future environmental laws or regulations could cause us significant expense.
We are subject to a variety of domestic and foreign environmental regulations relating to the use, storage, and disposal of materials used in our manufacturing processes. If we fail to comply with any present or future regulations, we could be subject to future liabilities or the suspension of current manufacturing operations. In addition, such regulations could restrict our ability to expand our operations or could require us to acquire costly equipment, substitute materials, or incur other significant expenses to comply with government regulations.
Our stock price is volatile.
Holders of the common stock will suffer immediate dilution to the extent outstanding equity awards are exercised to purchase common stock. Our stock price may be subject to wide fluctuations and possible rapid increases or declines over a short time period. These fluctuations may be due to factors specific to us such as variations in quarterly operating results or changes in earnings estimates, or to factors relating to the EMS industry or to the securities markets in general, which, in recent years, have experienced significant price fluctuations. These fluctuations often have been unrelated to the operating performance of the specific companies whose stocks are traded.
Due to inherent limitations, there can be no assurance that our system of disclosure and internal controls and procedures will be successful in preventing all errors, theft and fraud, or in informing management of all material information in a timely manner.
Management does not expect that our disclosure controls and internal controls and procedures will prevent all errors or fraud. A control system is designed to give reasonable, but not absolute, assurance that the objectives of the control system are met. In addition, any control system reflects resource constraints and the benefits of controls must be considered relative to their costs. Inherent limitations of a control system may include: judgments in decision making may be faulty, breakdowns can occur simply because of error or mistake and controls can be circumvented by collusion or management override. Due to the inherent limitations in a cost-effective control system, misstatements due to error or fraud may occur and may not be detected.
11
If we do not manage our growth effectively, our profitability could decline.
Our business is experiencing rapid growth which can place considerable additional demands upon our management team and our operational, financial and management information systems. Our ability to manage growth effectively requires us to continue to implement and improve these systems; avoid cost overruns; maintain customer, supplier and other favorable business relationships during possible transition periods; continue to develop the management skills of our managers and supervisors; and continue to train, motivate and manage our employees. Our failure to effectively manage growth could have a material adverse effect on our results of operations.
If our manufacturing processes and services do not comply with applicable statutory and regulatory requirements, or if we manufacture products containing design or manufacturing defects, demand for our services may decline and we may be subject to liability claims.
We manufacture and design products to our customers' specifications, and, in some cases, our manufacturing processes and facilities may need to comply with applicable statutory and regulatory requirements. For example, medical devices that we manufacture or design, as well as the facilities and manufacturing processes that we use to produce them, are regulated by the Food and Drug Administration and non-U.S. counterparts of this agency. In addition, our customers' products and the manufacturing processes that we use to produce them often are highly complex. As a result, products that we manufacture may at times contain manufacturing or design defects, and our manufacturing processes may be subject to errors or not be in compliance with applicable statutory and regulatory requirements. Defects in the products we manufacture or design, whether caused by a design, manufacturing or component failure or error, or deficiencies in our manufacturing processes, may result in delayed shipments to customers or reduced or canceled customer orders. If these defects or deficiencies are significant, our business reputation may also be damaged. The failure of the products that we manufacture or our manufacturing processes and facilities to comply with applicable statutory and regulatory requirements may subject us to legal fines or penalties and, in some cases, require us to shut down or incur considerable expense to correct a manufacturing process or facility. Our customers are required to indemnify us against liability associated with designing products to meet their specifications. However, if our customers are responsible for the defects, they may not, or may not have resources to, assume responsibility for any costs or liabilities arising from these defects, which could expose us to additional liability claims.
Energy price increases may negatively impact our results of operations.
Certain components that we use in our manufacturing process are petroleum-based. In addition, we, along with our suppliers and customers, rely on various energy sources in our transportation activities. While significant uncertainty currently exists about the future levels of energy prices, a significant increase is possible. Increased energy prices could cause an increase to our raw material costs and transportation costs. In addition, increased transportation costs of certain of our suppliers and customers could be passed along to us. We may not be able to increase our product prices enough to offset these increased costs. In addition, any increase in our product prices may reduce our future customer orders and profitability.
Disruptions to our information systems, including security breaches, losses of data or outages, could adversely affect our operations.
We rely on information technology networks and systems to process, transmit and store electronic information. In particular, we depend on our information technology infrastructure for a variety of functions, including worldwide financial reporting, inventory management, procurement, invoicing and email communications. Any of these systems may be susceptible to outages due to fire, floods, power loss, telecommunications failures, terrorist attacks and similar events. Despite the implementation of network security measures, our systems and those of third parties on which we rely may also be vulnerable to computer viruses, break-ins and similar disruptions. If we or our vendors are unable to prevent such outages and breaches, our operations could be disrupted.
We are involved in various legal proceedings.
In the past, we have been notified of claims relating to various matters including contractual matters, intellectual property rights or other issues arising in the ordinary course of business. In the event of such a claim, we may be required to spend a significant amount of money to defend or otherwise address the claim. Any litigation, even where a claim is without merit, could result in substantial costs and diversion of resources. Accordingly, the resolution or adjudication of such disputes, even those encountered in the ordinary course of business, could have a material adverse effect on our business, consolidated financial conditions and results of operations.
12
Increases in our own market capitalization and changes in securities laws and regulations will increase our costs and risk of noncompliance.
As a result of our increased market capitalization as of the end of our second quarter of fiscal year 2013, we are required to file as an accelerated filer. As such, we are subject to additional requirements contained in the Sarbanes-Oxley Act of 2002 (the Sarbanes-Oxley Act) and more recently the Dodd-Frank Act. The Sarbanes-Oxley and Dodd-Frank Acts required or will require changes in some of our corporate governance, securities disclosure and compliance practices. In response to the requirements of the Sarbanes-Oxley and Dodd-Frank Acts, the SEC and NASDAQ promulgated new rules and additional rulemaking is expected in the future. Compliance with these new rules and future rules has increased and may increase further our legal, financial and accounting costs as well as a potential risk of noncompliance. Absent significant changes in related rules, which we cannot assure, we anticipate some level of increased costs related to these new regulations to continue indefinitely. We also expect these developments to make it more difficult and more expensive to obtain director and officer liability insurance, and we may be forced to accept reduced coverage or incur substantially higher costs to obtain coverage. Likewise, these developments may make it more difficult for us to attract and retain qualified members of our Board of Directors or qualified management personnel. Further, the costs associated with the compliance with and implementation of procedures under these and future laws and related rules could have a material impact on our results of operations. In addition, the costs associated with noncompliance with additional securities laws and regulations could also impact our business.
We may encounter complications with acquisitions, which could potentially harm our business.
Any current or future acquisitions may require additional equity financing, which could be dilutive to our existing shareholders, or additional debt financing, which could potentially affect our credit ratings. Any downgrades in our credit ratings associated with an acquisition could adversely affect our ability to borrow by resulting in more restrictive borrowing terms. To integrate acquired businesses, we must implement our management information systems, operating systems and internal controls, and assimilate and manage the personnel of the acquired operations. The integration of acquired businesses may be further complicated by difficulties managing operations in geographically dispersed locations. The integration of acquired businesses may not be successful and could result in disruption by diverting management's attention from the core business. In addition, the integration of acquired businesses may require that we incur significant restructuring charges or other increases in our expenses and working capital requirements, which reduce our return on invested capital.
Acquisitions may involve numerous other risks and challenges including but not limited to: potential loss of key employees and customers of the acquired companies; the potential for deficiencies in internal controls at acquired companies; lack of experience operating in the geographic market or industry sector of the acquired business; and exposure to unanticipated liabilities of acquired companies. These and other factors could harm our ability to achieve anticipated levels of profitability at acquired operations or realize other anticipated benefits of an acquisition, and could adversely affect our consolidated business and operating results.
|
Item 1B.
|
UNRESOLVED STAFF COMMENTS
|
None
13
|
Item 2.
|
PROPERTIES
|
We have manufacturing and sales operations located in the United States, Mexico, and China. The table below lists the locations and square footage of our operating facilities:
|
Location
|
Approx.
Sq. Ft. |
Type of Interest
(Leased/ Owned) |
Description of Use
|
|||
|
Spokane Valley, Washington
|
75,000
|
Leased
|
Sales, research, administration and manufacturing
|
|||
|
Spokane Valley, Washington
|
36,000
|
Leased
|
Manufacturing
|
|||
|
El Paso, Texas
|
80,000
|
Leased
|
Shipping and warehouse
|
|||
|
Total USA
|
191,000
|
|||||
|
Juarez, Mexico
|
174,000
|
Owned
|
Manufacturing
|
|||
|
Juarez, Mexico
|
60,000
|
Owned
|
Manufacturing and warehouse
|
|||
|
Juarez, Mexico
|
66,000
|
Owned
|
Manufacturing and warehouse
|
|||
|
Juarez, Mexico
|
115,000
|
Owned
|
Manufacturing and warehouse
|
|||
|
Juarez, Mexico (1)
|
103,000
|
Owned
|
Manufacturing and warehouse
|
|||
|
Juarez, Mexico (2)
|
105,000
|
Leased
|
Warehouse
|
|||
|
Juarez, Mexico (3)
|
66,000
|
Leased
|
Manufacturing
|
|||
|
Total Mexico
|
689,000
|
|||||
|
Shanghai, China (4)
|
95,000
|
Leased
|
Manufacturing
|
|||
|
Shanghai, China (5)
|
36,000
|
Leased
|
Manufacturing
|
|||
|
Total China
|
131,000
|
|||||
|
Grand Total
|
1,011,000
|
|||||
|
(1)
|
During fiscal year 2012, we purchased an additional 103,000 square feet of manufacturing and warehouse space.
|
|
(2)
|
During fiscal year 2012, we entered into an agreement to lease an additional 105,000 square feet of warehouse space to replace the 72,000 square feet leased space that expired August 30, 2012.
|
|
(3)
|
Subsequent to fiscal year 2013, we completed our acquisition of Sabre Manufacturing resulting in an additional 66,000 square feet of leased manufacturing space with the lease expiring on August 30, 2016.
|
|
(4)
|
During fiscal year 2011, we amended the lease of our China facility whereby extending the term to December 2015 and increasing our leased space to 95,000 square feet to accommodate an additional SMT line and for additional assembly space.
|
|
(5)
|
During fiscal year 2011, we entered into an agreement to lease an additional 36,000 square feet of manufacturing space.
|
The geographic diversity of these locations allows us to offer services near certain of our customers and major electronics markets with the additional benefit of reduced labor costs. We consider the productive capacity of our current facilities sufficient to carry on our current business. In addition, in Juarez, Mexico one of our buildings includes adjacent vacant land that could be developed into additional manufacturing and warehouse space.
All of our facilities are ISO certified to ISO 9001:2008 standards, ISO-14001 environmental standards, ISO-13485:2003 medical devices standards, AS9100C aviation, space and defense standards, ISO/TS 16949 automotive standards and to Customs Trade Partnership against Terrorism (CTPAT). The Spokane, Washington facilities are additionally registered by the US State Department for International Traffic in Arms Regulations (ITAR).
|
Item 3.
|
LEGAL PROCEEDINGS
|
We are a party to certain lawsuits or claims in the ordinary course of business. We do not believe that these proceedings, individually or in the aggregate, will have a material adverse effect on our financial position, results of operations or cash flow.
|
Item 4.
|
MINE SAFETY DISCLOSURES
|
Not Applicable
14
|
Item 5:
|
MARKET FOR REGISTRANT’S COMMON EQUITY, RELATED SHAREHOLDER MATTERS, AND ISSUER PURCHASES OF EQUITY SECURITIES
|
Market Information
Our common stock is traded on the NASDAQ Global Market, formerly the NASDAQ National Market System under the symbol “KTCC”. Quarterly high and low sales prices for our common stock for fiscal years
2013
and
2012
were as follows:
|
|
2013
|
2012
|
||||||||||||||
|
|
High
|
Low
|
High
|
Low
|
||||||||||||
|
First Quarter
|
$
|
11.35
|
|
$
|
7.15
|
|
$
|
4.70
|
|
$
|
3.21
|
|
||||
|
Second Quarter
|
11.62
|
|
8.69
|
|
5.08
|
|
3.22
|
|
||||||||
|
Third Quarter
|
12.28
|
|
9.36
|
|
11.49
|
|
4.71
|
|
||||||||
|
Fourth Quarter
|
12.12
|
|
10.16
|
|
13.16
|
|
7.60
|
|
||||||||
High and low stock prices are based on the daily sales prices reported by the NASDAQ Stock Market. These quotations represent prices between dealers without adjustment for markups, markdowns, and commissions, and may not represent actual transactions.
Holders and Dividends
As of
June 29, 2013
, we had 726 shareholders of common stock on record. As a result of our credit agreement with Wells Fargo Bank, N.A. we are restricted from declaring or paying dividends in cash or stock without the Bank's prior written consent. We have not paid a cash dividend and do not anticipate payment of dividends in the foreseeable future.
15
Equity Compensation Plan Information
Information concerning securities authorized for issuance under our equity compensation plans is set forth in Part III, Item 12 of this Annual Report, under the caption “Securities Authorized for Issuance under Equity Compensation Plans”, and that information is incorporated herein by reference.
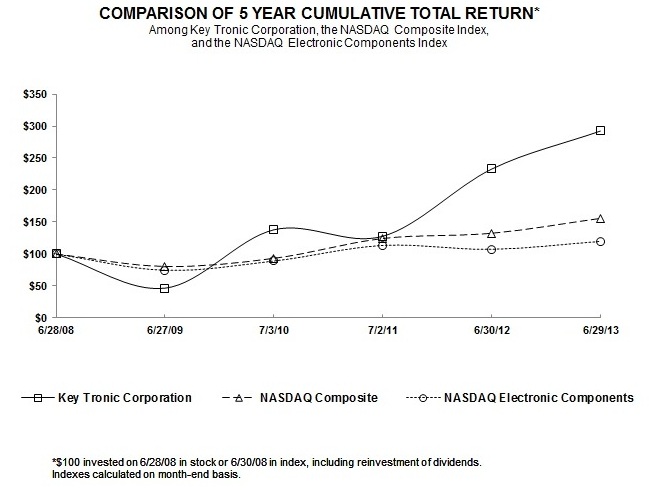
Performance Graph
Set forth below is a line graph comparing the cumulative total shareholder return on our common stock with the cumulative total return of the NASDAQ Stock Market (U.S. & Foreign) Index and the NASDAQ Electronic Components Index in fiscal
2013
.
|
6/28/2008
|
6/27/2009
|
7/3/2010
|
7/2/2011
|
6/30/2012
|
6/29/2013
|
|||||||||||||
|
Key Tronic Corporation
|
100.00
|
|
46.61
|
|
137.85
|
|
127.68
|
|
232.77
|
|
292.37
|
|
||||||
|
NASDAQ Composite
|
100.00
|
|
80.56
|
|
93.30
|
|
124.28
|
|
132.47
|
|
155.74
|
|
||||||
|
NASDAQ Electronic Components
|
100.00
|
|
74.56
|
|
89.10
|
|
113.46
|
|
107.40
|
|
119.76
|
|
||||||
16
|
Item 6:
|
SELECTED FINANCIAL DATA
|
The following selected data is derived from our audited consolidated financial statements and should be read in conjunction with “Management’s Discussion and Analysis of Financial Condition and Results of Operations,” the consolidated financial statements and related notes, and other information included in this report.
Financial Highlights
(In thousands, except for Supplemental Data and Per Share Amounts)
|
|
Fiscal Years
|
|||||||||||||||||||
|
|
June 29, 2013
|
June 30, 2012
|
July 2, 2011
|
July 3, 2010
|
June 27, 2009
|
|||||||||||||||
|
Consolidated Statements of Operations Data
:
|
||||||||||||||||||||
|
Net sales
|
$
|
361,033
|
|
$
|
346,475
|
|
$
|
253,846
|
|
$
|
199,620
|
|
$
|
184,924
|
|
|||||
|
Gross profit
|
34,512
|
|
29,836
|
|
20,648
|
|
19,250
|
|
13,180
|
|
||||||||||
|
Gross margin percentage
|
9.6
|
%
|
8.6
|
%
|
8.1
|
%
|
9.6
|
%
|
7.1
|
%
|
||||||||||
|
Operating income
|
18,126
|
|
14,351
|
|
6,939
|
|
7,388
|
|
1,783
|
|
||||||||||
|
Operating margin percentage
|
5.0
|
%
|
4.1
|
%
|
2.7
|
%
|
3.7
|
%
|
1.0
|
%
|
||||||||||
|
Net income
|
12,583
|
|
11,626
|
|
5,736
|
|
8,690
|
|
1,063
|
|
||||||||||
|
Earnings per share – diluted
|
1.15
|
|
1.10
|
|
0.55
|
|
0.85
|
|
0.11
|
|
||||||||||
|
Consolidated Cash Flow Data
:
|
||||||||||||||||||||
|
Cash flows provided by (used in) operations
|
29,282
|
|
(5,066
|
)
|
(2,569
|
)
|
3,534
|
|
10,038
|
|
||||||||||
|
Capital expenditures
|
3,470
|
|
4,654
|
|
3,818
|
|
3,378
|
|
1,891
|
|
||||||||||
|
Consolidated Balance Sheet Data
:
|
||||||||||||||||||||
|
Net working capital
(1)
|
73,827
|
|
76,236
|
|
58,307
|
|
44,708
|
|
37,444
|
|
||||||||||
|
Total assets
|
135,130
|
|
150,912
|
|
112,364
|
|
101,642
|
|
77,755
|
|
||||||||||
|
Long-term liabilities
|
3,030
|
|
19,050
|
|
11,063
|
|
4,236
|
|
3,030
|
|
||||||||||
|
Shareholders’ equity
|
94,160
|
|
78,608
|
|
68,023
|
|
59,417
|
|
51,114
|
|
||||||||||
|
Book value per share
(2)
|
$
|
8.97
|
|
$
|
7.50
|
|
$
|
6.54
|
|
$
|
5.79
|
|
$
|
5.08
|
|
|||||
|
Supplemental Data
:
|
||||||||||||||||||||
|
Number of shares outstanding at year-end
|
10,502,188
|
|
10,481,356
|
|
10,399,187
|
|
10,264,390
|
|
10,065,974
|
|
||||||||||
|
Number of employees at year-end
|
2,584
|
|
2,700
|
|
1,997
|
|
2,036
|
|
1,963
|
|
||||||||||
|
Approximate square footage of operational facilities
|
1,011,000
|
|
945,000
|
|
796,000
|
|
987,000
|
|
849,000
|
|
||||||||||
|
(1)
|
Net working capital is defined as total current assets less total current liabilities. Net working capital measures the portion of current assets that are financed by long term funds and is an indicator of short term financial management.
|
|
(2)
|
Book value per share is defined as total shareholders’ equity divided by the number of shares outstanding at the end of the fiscal year.
|
17
|
Item 7:
|
MANAGEMENT’S DISCUSSION AND ANALYSIS OF FINANCIAL CONDITION AND RESULTS OF OPERATIONS
|
Overview
KeyTronicEMS is a leader in electronic manufacturing services and solutions to original equipment manufacturers of a broad range of products. We provide engineering services, worldwide procurement and distribution, materials management, world-class manufacturing and assembly services, in-house testing, and unparalleled customer service. Our international production capability provides our customers with benefits of improved supply-chain management, reduced inventories, lower transportation costs, and reduced product fulfillment time. We continue to make investments in all of our operating facilities to give us the production capacity and logistical advantages to continue to win new business. The following information should be read in conjunction with the consolidated financial statements included herein and with Item 1A, Risk Factors.
Our mission is to provide our customers with superior manufacturing and engineering services at the lowest total cost for the highest quality products, and create long-term mutually beneficial business relationships by employing our “Trust, Commitment, Results” philosophy.
Executive Summary
After strong year-over-year growth in the first half of fiscal 2013, our revenue decreased slightly in the second half. This was primarily due to the anticipated slowdown from a large customer that reduced its production requirements in the second quarter. Although we saw a continued ramp up of new programs in the second half of fiscal 2013, those increases did not yet offset the decreased demand from this one customer. However, we maintained strong operating efficiencies and significantly strengthened our balance sheet and paid off our revolving line of credit.
During fiscal year
2013
we set a new record for annual revenue of
$361.0 million
, a
4.2
percent growth as compared to sales of
$346.5 million
in fiscal year
2012
. The increase in net sales was primarily driven by an increasingly diverse mix of new customer programs. At the end of fiscal year
2013
, we were generating revenue from 183 separate programs and 56 distinct customers as compared to 165 programs and 48 customers at the end of fiscal year
2012
. These new customers have programs that represent small annual sales while others have multi-million-dollar potenti
al. Moving into the first quarter of fiscal 2014, we are currently seeing a reduction in orders from another large customer and a few of our new programs are not ramping up as rapidly as anticipated. Net sales for the first quarter of fiscal year
2014
are expected to be within the range o
f $73 million to $78 million. Future results will depend on actual levels of customers’ orders, the timing of the start up of production of new product programs and the potential impact of the macroeconomic uncertainty. We believe that we are well positioned in the EMS industry to continue expansion of our customer base and continue long-term growth.
The concentration of our largest customers decreased during fiscal year
2013
with the top five customers’ sales decreasing to 71 percent of total sales in
2013
from 73 percent in
2012
, and 62 percent in
2011
. Our current customer relationships involve a variety of products, including consumer electronics, electronic storage devices, plastics, household products, gaming devices, specialty printers, telecommunications, industrial equipment, military supplies, computer accessories, electronic whiteboards, medical, educational, irrigations, automotive, transportation management, robotics, RFID, power supply and offroad vehicle equipment. The growth during fiscal year
2013
was powered by an increasingly diverse mix of new customer programs.
Gross profit as a percent of sales was
9.6 percent
in fiscal year
2013
compared to
8.6 percent
for the prior fiscal year. This 1.0 percentage point increase in gross profit as a percentage of net sales during fiscal year
2013
as compared to fiscal year
2012
is primarily related to a 1.9 percentage point improvement in material costs, as a percent of sales, partially offset by a 0.9 percentage point increase in certain overhead costs as we brought on additional headcount and equipment to support new customer programs. The level of gross margin is impacted by product mix, timing of the start up of new programs, facility utilization, pricing within the electronics industry and material costs, which can fluctuate significantly from quarter to quarter and year to year.
Operating income as a percentage of sales for fiscal year
2013
was
5.0 percent
compared to
4.1 percent
for fiscal year
2012
. The increase in operating income as a percentage of sales was due to an increase in gross margin, while keeping operating expenses relatively flat and by improving efficiencies during fiscal year
2013
.
Net income for fiscal year
2013
was
$12.6 million
or
$1.15
per diluted share, as compared to net income of
$11.6 million
or
$1.10
per diluted share for fiscal year
2012
. The increase in net income for fiscal year
2013
as compared to fiscal year
2012
was primarily due to the increase in net sales that led an improvement in our gross margin and operating income, partially offset by an increase in income tax expense.
18
We maintain a strong balance sheet with a current ratio of
2.9
and a long-term debt to equity ratio of
0.01
. Total cash provided by operating activities as defined on our cash flow statement was
$29.3 million
during fiscal year
2013
. We maintain sufficient liquidity for our expected future operations. We did not have an outstanding balance on our revolving line of credit with Wells Fargo Bank, N.A. as of
June 29, 2013
. As a result, $30.0 million remained available to borrow as of
June 29, 2013
. We believe cash flow from operations, our borrowing capacity, and equipment lease financing should provide adequate capital for planned growth over the long term.
RESULTS OF OPERATIONS
Comparison of the Fiscal Year Ended
June 29, 2013
with the Fiscal Year Ended
June 30, 2012
The following table sets forth for the periods indicated certain items of the consolidated statements of income expressed as a percentage of net sales. The financial information and discussion below should be read in conjunction with the consolidated financial statements and notes contained in this Annual Report.
|
|
Fiscal Year Ended
|
||||||||||||||||||||
|
|
June 29, 2013
|
% of
net sales
|
June 30, 2012
|
% of
net sales
|
$ change
|
% point
change
|
|||||||||||||||
|
Net sales
|
$
|
361,033
|
|
100.0
|
%
|
$
|
346,475
|
|
100.0
|
%
|
$
|
14,558
|
|
—
|
|
||||||
|
Cost of sales
|
326,521
|
|
90.4
|
|
316,639
|
|
91.4
|
|
9,882
|
|
(1.0
|
)
|
|||||||||
|
Gross profit
|
34,512
|
|
9.6
|
|
29,836
|
|
8.6
|
|
4,676
|
|
1.0
|
|
|||||||||
|
Operating expenses:
|
|||||||||||||||||||||
|
Research, development and engineering
|
5,156
|
|
1.4
|
|
4,444
|
|
1.3
|
|
712
|
|
0.1
|
|
|||||||||
|
Selling, general and administrative
|
11,230
|
|
3.1
|
|
11,041
|
|
3.2
|
|
189
|
|
(0.1
|
)
|
|||||||||
|
Total operating expenses
|
16,386
|
|
4.5
|
|
15,485
|
|
4.5
|
|
901
|
|
—
|
|
|||||||||
|
Operating income
|
18,126
|
|
5.0
|
|
14,351
|
|
4.1
|
|
3,775
|
|
0.9
|
|
|||||||||
|
Interest expense, net
|
271
|
|
0.1
|
|
510
|
|
0.1
|
|
(239
|
)
|
—
|
|
|||||||||
|
Income before income taxes
|
17,855
|
|
4.9
|
|
13,841
|
|
4.0
|
|
4,014
|
|
0.9
|
|
|||||||||
|
Income tax provision
|
5,272
|
|
1.5
|
|
2,215
|
|
0.6
|
|
3,057
|
|
0.9
|
|
|||||||||
|
Net income
|
$
|
12,583
|
|
3.5
|
%
|
$
|
11,626
|
|
3.4
|
%
|
$
|
957
|
|
0.1
|
|
||||||
|
Effective income tax rate
|
29.5
|
%
|
16.0
|
%
|
|||||||||||||||||
Net Sales
The increase in net sales from prior year was primarily driven by an approximate $11.7 million increase in revenues related to new programs for both new and longstanding customers and to a lesser extent a net $5.5 million increase related to increased demand from current customer programs, which was partially offset by the previously disclosed slowdown from the large customer that began to reduce production levels in the second quarter of fiscal year 2013. In addition, the increases were negatively impacted by $2.6 million related to customer program losses. The negative impact resulting from the previously discussed slowdown of demand from one of our larger customers is reflected in the analysis above.
The following table shows the revenue by industry sectors as a percentage of revenue for fiscal years
2013
and
2012
:
|
|
Years Ended
|
|||||
|
|
June 29, 2013
|
June 30, 2012
|
||||
|
Communication
|
29
|
%
|
36
|
%
|
||
|
Consumer
|
24
|
|
20
|
|
||
|
Gaming
|
22
|
|
18
|
|
||
|
Transaction Printer
|
11
|
|
12
|
|
||
|
Industrial
|
8
|
|
6
|
|
||
|
Computer and Peripheral
|
6
|
|
7
|
|
||
|
Commercial Printer
|
—
|
|
1
|
|
||
|
Total
|
100
|
%
|
100
|
%
|
||
We provide services to customers in a number of industries and produce a variety of products for our customers in each industry. As we continue to diversify our customer base and win new customers we will continue to see a change in the industry concentrations of our revenue.
19
Sales to foreign locations outside the United States represented 31.8 percent, and 40.6 percent of our total net sales in fiscal years
2013
, and
2012
, respectively.
Cost of Sales
Total cost of sales as a percentage of net sales was
90.4 percent
and
91.4 percent
in fiscal years
2013
, and
2012
, respectively.
Total cost of materials as a percentage of net sales was approximately 68.5 percent and 70.4 percent in fiscal years
2013
and
2012
, respectively. The change from year-to-year is primarily the result of a change in product mix and to a lesser degree improved pricing of certain raw materials.
Production and support costs as a percentage of net sales were 21.9 percent, and 21.0 percent in fiscal years
2013
and
2012
, respectively. The increase in fiscal year
2013
is primarily related to adding headcount and manufacturing capacity to support new programs.
We provide a reserve for obsolete and non-saleable inventories based on specific identification of inventory against current demand and recent usage. The amounts charged to expense for these inventories were approximately $0.5 million, and $0.8 million in fiscal years
2013
and
2012
, respectively.
We provide warranties on certain products we sell and estimate warranty costs based on historical experience and anticipated product returns. Warranty expense is related to workmanship claims on keyboards and EMS products. The amounts charged to expense are determined based on an estimate of warranty exposure. The net warranty expense was approximately $26,000 and $65,000 in fiscal years
2013
and
2012
, respectively.
Gross Profit
Gross profit as a percentage of net sales was
9.6 percent
and
8.6 percent
in fiscal years
2013
, and
2012
, respectively. The 1.0 percentage point increase in gross profit as a percentage of net sales during fiscal year
2013
as compared to fiscal year
2012
is primarily related to a 1.9 percentage point improvement in material costs, as a percent of sales, partially offset by a 0.9 percentage point increase in certain overhead costs.
Changes in gross profit margins reflect the impact of a number of factors that can vary from period to period, including product mix, start-up costs and efficiencies associated with new programs, product life cycles, sales volumes, capacity utilization of our resources, management of inventories, component pricing and shortages, end market demand for customers’ products, fluctuations in and timing of customer orders, and competition within the EMS industry. These and other factors can cause variations in operating results. There can be no assurance that gross margins will not decrease in future periods.
We took early pay discounts to suppliers that totaled approximately $946,000 and $932,000 in fiscal years
2013
and
2012
, respectively. Early pay discounts will fluctuate based on our liquidity and changes in the discounts and terms offered by our suppliers.
Research, Development and Engineering
Research, development and engineering expenses (RD&E) consists principally of employee related costs, third party development costs, program materials, depreciation and allocated information technology and facilities costs. Total RD&E expense was
$5.2 million
and
$4.4 million
in fiscal years
2013
and
2012
, respectively. This
$0.7 million
increase is primarily the result of an increase in payroll related expenses as additional headcount was necessary to support new programs as they ramp up.
Total RD&E expenses as a percent of net sales were
1.4 percent
and
1.3 percent
in fiscal years
2013
and
2012
, respectively. This
0.1
percentage point increase in RD&E is primarily related to our deleveraging of operating expenses as a percent of net sales.
Selling, General and Administrative
Selling, general and administrative expenses (SG&A) consist principally of salaries and benefits, advertising and marketing programs, sales commissions, travel expenses, provision for doubtful accounts, facilities costs, and professional services. Total SG&A expenses were
$11.2 million
and
$11.0 million
in fiscal years
2013
and
2012
, respectively. This
$0.2 million
increase is primarily related to an increase in payroll related expenses due to increased headcount and higher incentive compensation as compared to the prior year. This increase is partially offset by the positive impact of a non-recurring adjustment of approximately $0.5 million related to the elimination of a deferred compensation liability.
Total SG&A expenses as a percent of net sales were
3.1 percent
and
3.2 percent
in fiscal years
2013
and
2012
, respectively. This
0.1 percent
percentage point improvement in SG&A is primarily related to our continued success in leveraging operating expenses as a percent of net sales.
20
Interest Expense
We had net interest expense of
$0.3 million
and
$0.5 million
in fiscal years
2013
and
2012
, respectively.
This decrease is primarily related to a decrease in the average balance outstanding on our line of credit during the year and the impact of not having an outstanding balance on our line of credit at fiscal year end 2013.
Income Tax Provision
We had an income tax expense of
$5.3 million
during fiscal year
2013
as compared to an income tax expense of
$2.2 million
in fiscal year
2012
. The income tax expense recognized during both fiscal
2013
and
2012
was primarily a function of U.S. and foreign taxes recognized at the statutory rates offset by the net benefit associated with federal research and development tax credits and changes in potential foreign tax credits. The impact of this offset was greater in 2012 because the Company recognized a benefit related to federal research and development tax credits during fiscal 2012, due to the results of a multi-year tax credit study performed during that year. Fiscal 2013 recognized credits were related to expenses incurred during the current year.
Due to increased profitability, revenue growth, and new customer programs, we utilized all remaining domestic and foreign net operating loss carryforwards (NOLs) during fiscal year 2012. As a result, there was no remaining deferred tax asset as of June 30, 2012 related to NOLs. In addition, we continually review our requirements for liquidity domestically to fund revenue growth and to look for potential future acquisitions. We continue to anticipate repatriating a portion of our unremitted foreign earnings. The associated taxes and potential foreign tax credits are included in the income tax calculation. For further information on taxes please review footnote 5 of the “Notes to Consolidated Financial Statements”.
International Subsidiaries
We offer customers a complete global manufacturing solution. Our facilities provide our customers the opportunity to have their products manufactured in the facility that best serves specific cost, product manufacturing, and distribution needs. The locations of active foreign subsidiaries are as follows:
|
•
|
Key Tronic Juarez, SA de CV owns an SMT, assembly and molding facility, newly acquired sheet metal fabrication, and five assembly and storage facilities in Juarez, Mexico. This subsidiary is primarily used to support our U.S. operations.
|
|
•
|
Key Tronic Computer Peripherals (Shanghai) Co., Ltd. leases two facilities with SMT, assembly, global purchasing and warehouse capabilities in Shanghai, China, which began operations in 1999. Its primary function is to provide EMS services for export; however, it is also currently manufacturing certain electronic keyboards.
|
Foreign sales (based on shipping instructions) from our worldwide operations, including domestic exports, were
$115.0 million
,
$140.8 million
and
$81.1 million
in fiscal years
2013
,
2012
and
2011
, respectively. Products and manufacturing services provided by our subsidiary operations are primarily sold to customers directly by the parent company. Key Tronic Computer Peripherals (Shanghai) Co., Ltd., our subsidiary in Shanghai, China, had only minimal direct sales to customers in China during the past two fiscal years.
21
RESULTS OF OPERATIONS
Comparison of the Fiscal Year Ended June 30, 2012 with the Fiscal Year Ended July 2, 2011
The following table sets forth for the periods indicated certain items of the consolidated statements of income expressed as a percentage of net sales. The financial information and discussion below should be read in conjunction with the consolidated financial statements and notes contained in this Annual Report.
|
|
Fiscal Year Ended
|
||||||||||||||||||||
|
|
June 30,
2012
|
% of
net sales
|
July 2,
2011
|
% of
net sales
|
$ change
|
% point
change
|
|||||||||||||||
|
Net sales
|
$
|
346,475
|
|
100.0
|
%
|
$
|
253,846
|
|
100.0
|
%
|
$
|
92,629
|
|
—
|
|
||||||
|
Cost of sales
|
316,639
|
|
91.4
|
|
233,198
|
|
91.9
|
|
83,441
|
|
(0.5
|
)
|
|||||||||
|
Gross profit
|
29,836
|
|
8.6
|
|
20,648
|
|
8.1
|
|
9,188
|
|
0.5
|
|
|||||||||
|
Operating expenses:
|
|||||||||||||||||||||
|
Research, development and engineering
|
4,444
|
|
1.3
|
|
3,782
|
|
1.5
|
|
662
|
|
(0.2
|
)
|
|||||||||
|
Selling, general and administrative
|
11,041
|
|
3.2
|
|
9,927
|
|
3.9
|
|
1,114
|
|
(0.7
|
)
|
|||||||||
|
Total operating expenses
|
15,485
|
|
4.5
|
|
13,709
|
|
5.4
|
|
1,776
|
|
(0.9
|
)
|
|||||||||
|
Operating income
|
14,351
|
|
4.1
|
|
6,939
|
|
2.7
|
|
7,412
|
|
1.4
|
|
|||||||||
|
Interest expense, net
|
510
|
|
0.1
|
|
457
|
|
0.2
|
|
53
|
|
(0.1
|
)
|
|||||||||
|
Income before income taxes
|
13,841
|
|
4.0
|
|
6,482
|
|
2.6
|
|
7,359
|
|
1.4
|
|
|||||||||
|
Income tax provision
|
2,215
|
|
0.6
|
|
746
|
|
0.3
|
|
1,469
|
|
0.3
|
|
|||||||||
|
Net income
|
$
|
11,626
|
|
3.4
|
%
|
$
|
5,736
|
|
2.3
|
%
|
$
|
5,890
|
|
1.1
|
|
||||||
|
Effective income tax rate
|
16.0
|
%
|
11.5
|
%
|
|||||||||||||||||
Net Sales
Net sales increased $92.6 million during fiscal year 2012 as compared with fiscal year 2011. This increase in net sales was primarily driven by an approximate $90.6 million increase in revenues related to new programs for both new and longstanding customers and to a lesser extent a $2.9 million increase related to increased demand from certain current customer programs. These increases were partially offset by $0.9 million related to customer program losses. The negative impact resulting from the uncertain macroeconomic environment is reflected in the analysis of our new and longstanding customers programs as discussed above.
The following table shows the revenue by industry sectors as a percentage of revenue for fiscal years 2012 and 2011:
|
|
Years Ended
|
|||
|
|
June 30, 2012
|
July 2, 2011
|
||
|
Communication
|
36%
|
22%
|
||
|
Consumer
|
20
|
20
|
||
|
Gaming
|
18
|
16
|
||
|
Transaction Printer
|
12
|
18
|
||
|
Computer and Peripheral
|
7
|
13
|
||
|
Industrial
|
6
|
6
|
||
|
Commercial Printer
|
1
|
5
|
||
|
Total
|
100%
|
100%
|
||
We provide services to customers in a number of industries and produce a variety of products for our customers in each industry. As we continue to diversify our customer base and win new customers we may continue to see a change in the industry concentrations of our revenue.
Sales to foreign locations represented 40.6 percent, and 31.9 percent of our total net sales in fiscal years 2012 and 2011, respectively.
22
Cost of Sales
Total cost of sales as a percentage of net sales was 91.4 percent, and 91.9 percent in fiscal years 2012 and 2011, respectively.
Total cost of materials as a percentage of net sales was approximately 70.4 percent, and 68.6 percent in fiscal years 2012 and 2011, respectively. The change from year-to-year is primarily the result of higher material content in certain new customer programs and changes in product mix.
Production and support costs as a percentage of net sales were 21.0 percent, and 23.3 percent in fiscal years 2012 and 2011, respectively. The decrease in fiscal year 2012 is primarily related to the leveraging of our fixed costs as a percentage of sales during the fiscal year.
We provide for obsolete and non-saleable inventories based on specific identification of inventory against current demand and recent usage. The amounts charged to expense for these inventories were approximately $0.8 million, and $0.3 million in fiscal years 2012 and 2011, respectively.
We provide warranties on certain products we sell and estimate warranty costs based on historical experience and anticipated product returns. Warranty expense is related to workmanship claims on keyboards and EMS products. The amounts charged to expense are determined based on an estimate of warranty exposure. The net warranty expense was approximately $65,000 and $158,000 in fiscal years 2012 and 2011, respectively.
Gross Profit
Gross profit as a percentage of net sales was 8.6 percent, and 8.1 percent in fiscal years 2012 and 2011, respectively. The 0.5 percentage point increase in gross profit as a percentage of net sales during fiscal year 2012 as compared to fiscal year 2011 is primarily related to a 2.3 percentage point improvement in leveraging of certain overhead costs, as a percent of sales, partially offset by a 1.8 percentage point increase in material costs, as a percent of sales, resulting from higher material content in certain new customer programs and changes in product mix.
We took early pay discounts to suppliers that totaled approximately $932,000 and $678,000, in fiscal years 2012 and 2011, respectively. Early pay discounts will fluctuate based on our liquidity and changes in the discounts and terms offered by our suppliers.
Changes in gross profit margins reflect the impact of a number of factors that can vary from period to period, including product mix, start-up costs and efficiencies associated with new programs, product life cycles, sales volumes, capacity utilization of our resources, management of inventories, component pricing and shortages, end market demand for customers’ products, fluctuations in and timing of customer orders, and competition within the EMS industry. These and other factors can cause variations in operating results. There can be no assurance that gross margins will not decrease in future periods.
Research, Development and Engineering
Research, development and engineering expenses (RD&E) consists principally of employee related costs, third party development costs, program materials, depreciation and allocated information technology and facilities costs. Total RD&E expense was $4.4 million and $3.8 million in fiscal years 2012 and 2011, respectively. This $0.6 million increase is primarily the result of increased headcount and to a lesser extent higher incentive compensation.
Total RD&E expenses as a percent of net sales were 1.3 percent and 1.5 percent in fiscal years 2012 and 2011, respectively. This 0.2 percentage point improvement in RD&E is primarily related to our continued success in leveraging operating expenses as a percent of net sales.
Selling, General and Administrative
Selling, general and administrative expenses (SG&A) consist principally of salaries and benefits, advertising and marketing programs, sales commissions, travel expenses, provision for doubtful accounts, facilities costs, and professional services. Total SG&A expenses were $11.0 million and $9.9 million in fiscal years 2012, and 2011, respectively. This $1.1 million increase is primarily related to an increase in headcount.
Total SG&A expenses as a percent of net sales were 3.2 percent, and 3.9 percent in fiscal years 2012, and 2011, respectively. This 0.7 percentage point improvement in SG&A is primarily related to our continued success in leveraging operating expenses as a percent of net sales.
Interest Expense
We had net interest expense of $0.5 million, and $0.5 million in fiscal years 2012 and 2011, respectively. Interest expense for fiscal year 2012 remained relatively flat as did the average balance and interest rate compared to fiscal year 2011.
23
Income Tax Provision
We had an income tax expense of $2.2 million during fiscal year 2012 as compared to an income tax expense of $746,000 in fiscal year 2011. The income tax expense recognized during fiscal 2012 was primarily a function of U.S. and foreign taxes recognized at the statutory rates offset by the net benefit associated with federal research and development tax credits and changes in potential foreign tax credits. The income tax expense recognized during fiscal 2011 was primarily a function of U.S. and foreign taxes recognized at the statutory rates offset by the net benefit associated with federal research and development tax credits, the release of the valuation allowance in China, and changes in potential foreign tax credits.
Due to increased profitability, revenue growth, and new customer programs, we utilized all remaining domestic net operating loss carryforwards (NOLs) during fiscal year 2012. Furthermore, all previous NOL carryforwards in China have been fully utilized as well. As a result, there is no remaining deferred tax asset as of June 30, 2012 related to NOLs. In addition, we reviewed our requirements for liquidity domestically to fund our revenue growth and to look for potential future acquisitions. We continue to anticipate repatriating a portion of our unremitted foreign earnings. The associated taxes and potential foreign tax credits were first included in the income tax benefit that was realized during fiscal year 2010 and certain changes in the estimates of foreign earnings and profits and tax pools resulted in the recognition of additional tax benefits during fiscal years 2011 and 2012. For further information on taxes please review footnote 5 of the “Notes to Consolidated Financial Statements”.
Capital Resources and Liquidity
Operating Cash Flow
Net cash provided by operating activities for fiscal year
2013
was
$29.3 million
compared to net cash used in operating activities of
$5.1 million
and
$2.6 million
in fiscal years
2012
and
2011
, respectively. Cash flows provided by operating activities increased primarily due to a drop in working capital caused by decreased revenue in the fourth quarter of fiscal 2013 when compared to fiscal 2012. The decreased revenue allowed the company to decrease its accounts receivable and inventories. Additionally, the Company improved its inventory turns through better management of order quantities and requiring certain customer payments on aged inventory purchased to forecast but subsequently not consumed.
The working capital increase year-over-year is primarily related to a
$13.3 million
decrease in inventory, and a
$13.6 million
decrease in accounts receivable partially offset by a
$16.6 million
decrease in accounts payable. The working capital changes during fiscal year
2012
, are primarily due to a
$17.6 million
increase in inventory and a
$20.3 million
increase in accounts receivable, which were partially offset by a
$16.9 million
increase in accounts payable. The increase in working capital during fiscal 2012 was related to a significant increase in revenue occurring during the year.
We purchase inventory based on customer forecasts and orders, and when those forecasts and orders change, the amount of inventory may also fluctuate. Accounts receivable fluctuates based on the timing of shipments, terms offered and collections. Accounts payable fluctuates with changes in inventory levels, volume of inventory purchases, negotiated supplier terms, and taking advantage of early pay discounts.
Investing Cash Flow
Cash flows used in investing activities were
$3.3 million
,
$4.6 million
, and
$3.7 million
in fiscal years
2013
,
2012
and
2011
, respectively. Our investing cash flows primarily consist of capital expenditures to purchase manufacturing equipment to support production and to a lesser extent leasehold improvements at our corporate headquarters.
Operating and capital leases may be utilized when potential technical obsolescence and funding requirement advantages outweigh the benefits of equipment ownership. Capital expenditures and periodic lease payments are expected to be financed with internally generated funds and available borrowing capacities.
Financing Cash Flow
Cash flows used in financing activities were
$15.7 million
in fiscal year
2013
as compared to cash flows provided by financing activities of
$9.0 million
and
$6.7 million
in fiscal years
2012
and
2011
, respectively. Our primary financing activity in fiscal years
2013
,
2012
, and
2011
was borrowing and repayment under our revolving line of our credit facility. Our credit agreement with Wells Fargo Bank, N.A. provides a revolving line of credit facility of up to $30.0 million. The agreement specifies that the proceeds of the revolving line of credit be used primarily for working capital and general corporate purposes of the Company and its subsidiaries. The Company did not have an outstanding balance on the line of credit as of
June 29, 2013
. We had availability to borrow
$30.0 million
under the Wells Fargo line of credit and we were in compliance with our loan covenants. During fiscal year
2013
, cash used in financing activities also reflected payments of
$0.7 million
on capital leases.
Our cash requirements are affected by the level of current operations and new EMS programs. We believe that projected cash from operations, funds available under the revolving credit facility and leasing capabilities will be sufficient to meet our working and fixed capital requirements for the foreseeable future.
24
As of
June 29, 2013
, we had approximately $0.8 million of cash held by foreign subsidiaries. If cash is to be repatriated in the future from these foreign subsidiaries, the Company could be subject to additional income taxes payable in the U.S. The total amount of U.S. taxes required to be paid for the amount of foreign subsidiary cash on hand as of
June 29, 2013
would approximate $81,000. The Company also has approximately $19.1 million of foreign earnings that has not been repatriated back to the U.S. Of that amount, the Company estimates that $9.3 million is to be repatriated in the future, requiring U.S. taxes of $1.5 million that is currently accrued in our deferred tax liabilities. The remaining $9.8 million is considered to be permanently reinvested in Mexico and China. If these amounts were required to be repatriated it would create an additional $1.2 million U.S. tax liability.
Contractual Obligations and Commitments
In the normal course of business, we enter into contracts which obligate us to make payments in the future. The table below sets forth our significant future obligations by fiscal year:
Payments Due by Fiscal Year (in thousands)
|
Total
|
2014
|
2015
|
2016
|
2017
|
2018
|
Thereafter
|
||||||||||||||||||||||
|
Wells Fargo Bank N.A. revolving loan
(1)
|
$
|
—
|
|
$
|
—
|
|
$
|
—
|
|
$
|
—
|
|
$
|
—
|
|
$
|
—
|
|
$
|
—
|
|
|||||||
|
Operating leases
(2)
|
8,526
|
|
1,874
|
|
1,898
|
|
1,420
|
|
881
|
|
735
|
|
1,718
|
|
||||||||||||||
|
Capital leases
(3)
|
588
|
|
588
|
|
—
|
|
—
|
|
—
|
|
—
|
|
—
|
|
||||||||||||||
|
Purchase orders
(4)
|
||||||||||||||||||||||||||||
|
(1)
|
The terms of the Wells Fargo Bank N.A. revolving loan are discussed in the consolidated financial statements at Note 4, “Long-Term Debt”. As of
June 29, 2013
, we were in compliance with our loan covenants. Breaching these covenants could have resulted in a material impact on our operations or financial condition.
|
|
(2)
|
We maintain vertically integrated manufacturing operations in Mexico and China. We lease some of our administrative and manufacturing facilities. A complete discussion of properties can be found in Part 1, Item 2 at “Properties”. Leases have proven to be an acceptable method for us to acquire new or replacement equipment and to maintain facilities with a minimum impact on our short term cash flows for operations. In addition, such operations are heavily dependent upon technically superior manufacturing equipment including molding machines in various tonnages, Surface Mount Technology (SMT) lines, clean rooms, and automated insertion, and test equipment for the various products we are capable of producing.
|
|
(3)
|
During fiscal year 2011, we entered into capital leases for the purchase of certain equipment and leasehold improvements. See Note 8, “Commitments and Contingencies” for additional discussion of capital lease obligations. Amounts presented above include interest and principal, if applicable.
|
|
(4)
|
As of
June 29, 2013
, we had open purchase order commitments for materials and other supplies of approximately $68.5 million. Included in the open purchase orders are various blanket orders for annual requirements. Actual needs under these blanket purchase orders fluctuate with our manufacturing levels. In addition, we have contracts with our customers that minimize our exposure to losses for material purchased within lead-times necessary to meet customer forecasts. Purchase orders generally can be cancelled without penalty within specified ranges that are determined in negotiations with our suppliers. These agreements depend in part on the type of materials purchased as well as the circumstances surrounding any requested cancellations.
|
In addition to the cash requirements presented above, we have various other accruals which are not included in the table above. For example, we owe our suppliers approximately $26.4 million for accounts payable and shipments in transit at the end of the fiscal year. We generally pay our suppliers in a range from 30 to 120 days depending on terms offered. These payments are financed by operating cash flows and our revolving line of credit.
We believe that cash flows generated from operations, leasing facilities, and funds available under the revolving credit facility will satisfy cash requirements for a period in excess of 12 months and into the foreseeable future.
Critical Accounting Policies and Estimates
Preparation of our consolidated financial statements requires management to make estimates and assumptions that affect the reported amount of assets, liabilities, revenues and expenses. Note 1 to our consolidated financial statements describes the significant accounting policies used in the preparation of our consolidated financial statements. Management believes the most complex and sensitive judgments, because of their significance to our consolidated financial statements, result primarily from the need to make estimates about effects of matters that are inherently uncertain. The most significant areas involving management judgments are described below. Actual results in these areas could differ from management’s estimates.
25
Revenue
Sales revenue from manufacturing is recognized upon shipment of the manufactured product per contractual terms. Upon shipment, title transfers and the customer assumes risks and rewards of ownership of the product. The price to the buyer is fixed or determinable and recoverability is reasonably assured. Unless specifically stated in contractual terms, there are no formal customer acceptance requirements or further obligations related to the manufacturing services; if any such requirements exist, then sales revenue is recognized at the time when such requirements are completed and such obligations are fulfilled. Revenue is recorded net of estimated returns of manufactured product based on management’s analysis of historical returns.
Revenues and associated costs from engineering design, development services and tooling, which are performed under contract of short term durations, are recognized only after the completed performance of the service.
Inactive, Obsolete, and Surplus Inventory Reserve
We reserve for inventories that we deem inactive, obsolete or surplus. This reserve is calculated based upon the demand for the products that we produce. Demand is determined by expected sales, customer purchase orders, or customer forecasts. If expected sales do not materialize, then we would have inventory in excess of our reserves and would have to charge the excess against future earnings. In the case where we have purchased material based upon a customer’s forecast or purchase orders, we are usually covered by lead-time assurance agreements or purchase orders with each customer. These contracts state that the financial liability for material purchased within agreed upon lead-time and based upon the customer’s forecasts, lies with the customer. If we purchase material outside the lead-time assurance agreement and the customer’s forecasts do not materialize or if we have no lead-time assurance agreement for a specific program, we would have the financial liability and may have to charge inactive, obsolete or surplus inventory against earnings.
Allowance for Doubtful Accounts
We value our accounts receivable net of an allowance for doubtful accounts. The allowance for doubtful accounts was $40,000 as of June 29, 2013. As of June 30, 2012, we deemed that no allowance was necessary. This allowance is based on estimates of the portion of accounts receivable that may not be collected in the future. The estimates used are based primarily on specific identification of potentially uncollectible accounts. Such accounts are identified using publicly available information in conjunction with evaluations of current payment activity. However, if any of our customers were to develop unexpected and immediate financial problems that would prevent payment of open invoices, we could incur additional and possibly material expenses that would negatively impact earnings.
Accrued Warranty
An accrual is made for expected warranty costs, with the related expense recognized in cost of goods sold. We review the adequacy of this accrual quarterly based on historical analysis and anticipated product returns and rework costs. As we have made the transition from manufacturing primarily keyboards to primarily EMS products, our exposure to warranty claims has declined significantly. Our warranty period for keyboards is generally longer than that for EMS products. We only warrant materials and workmanship on EMS products, and we do not warrant design defects for EMS customers.
Income Taxes
Income tax expense includes U.S. and international income taxes and the provision for U.S. taxes on undistributed earnings of foreign subsidiaries not deemed to be permanently invested. We do not record U.S. tax liabilities on undistributed earnings of international subsidiaries that are deemed to be permanently reinvested. Certain income and expenses are not reported in tax returns and financial statements in the same year. The tax effect of such temporary differences is reported as deferred income taxes. The deferred income taxes are classified as current or long-term based on the classification of the related asset or liability. The most significant areas involving management judgments include deferred income tax assets and liabilities, uncertain tax positions, and research and development tax credits. Our estimates of the realization of the deferred tax assets related to our tax credits are based upon our estimates of future taxable income which may change.
Stock-Based Compensation
Stock-based compensation is accounted for according to Financial Accounting Standards Board (FASB) Accounting Standards Codification (ASC) 718,
Compensation—Stock Compensation
. ASC 718 requires us to expense the fair value of employee stock options, stock appreciation rights and other forms of stock-based compensation. Under the fair value recognition provisions of ASC 718, share-based compensation cost is estimated at the grant date based upon the fair value of the award and is recognized as expense ratably over the requisite service period of the award (generally the vesting period). Determining the appropriate fair value model and calculating the fair value of share-based awards requires judgment, including estimating the expected life of the share-based award, the expected stock price volatility over the expected life of the share-based award and forfeitures.
26
To determine the fair value of stock based awards on the date of grant we use the Black-Scholes option-pricing model. Inherent in this model are assumptions related to expected stock price volatility, option life, risk-free interest rate and dividend yield. The risk-free interest rate is a less-subjective assumption as it is based on factual data derived from public sources. We use a dividend yield of zero as we have never paid cash dividends and have no intention to pay cash dividends in the foreseeable future. The expected stock price volatility and option life assumptions require a greater level of judgment. Our expected stock-price volatility assumption is based upon the historical volatility of our stock which is obtained from public data sources. The expected life represents the weighted average period of time that share-based awards are expected to be outstanding, giving consideration to vesting schedules and historical exercise patterns. We determine the expected life assumption based upon the exercise and post-vesting behavior that has been exhibited historically, adjusted for specific factors that may influence future exercise patterns. If expected volatility or expected life were to increase, that would result in an increase in the fair value of our stock options which would result in higher compensation charges, while a decrease in volatility or the expected life would result in a lower fair value of our stock option awards resulting in lower compensation charges.
We estimate forfeitures for all of our awards based upon historical experience of stock-based pre-vesting forfeitures. We believe that our estimates are based upon outcomes that are reasonably likely to occur. If actual forfeitures are higher than our estimates it would result in lower compensation expense and to the extent the actual forfeitures are lower than our estimate we would record higher compensation expense.
Impairment of Long-Lived Assets
Long-lived assets, such as property, plant, and equipment are reviewed for impairment whenever events or changes in circumstances indicate that the carrying amount of an asset may not be recoverable. The recoverability of assets to be held and used is measured by a comparison of the carrying amount of an asset to the estimated undiscounted future cash flows expected to be generated by the asset. If the carrying amount of an asset exceeds its estimated undiscounted future cash flows, an impairment charge would be recognized in the amount by which the carrying amount of the asset exceeds the fair value of the asset.
Derivatives and Hedging Activity
Derivatives are recognized on the balance sheet at their estimated fair value. On the date a derivative contract is entered into, the Company designates the derivative as a hedge of a forecasted transaction or of the variability of cash flows to be received or paid related to a recognized asset or liability (a “cash flow” hedge). The Company does not enter into derivatives for speculative purposes. Changes in the fair value of a derivative that qualifies as a cash flow hedge are recorded in “Accumulated Other Comprehensive Income”, until earnings are affected by the variability of cash flows. See Note 10 of the Company’s consolidated financial statements for additional information.
New and Future Accounting Pronouncements
See Note 1 to our consolidated financial statements.
|
Item 7A:
|
QUANTITATIVE AND QUALITATIVE DISCLOSURES ABOUT MARKET RISK
|
Interest Rate Risk
We are subject to the risk of fluctuating interest rates in the normal course of business. Our major market risk relates to our secured debt. Our revolving credit facility is secured by substantially all of our assets. The interest rates applicable to our revolving credit facility fluctuate with the JP Morgan Chase Bank prime rate and LIBOR rates. The Company did not have an outstanding balance on the line of credit as of
June 29, 2013
. See “Management’s Discussion and Analysis of Financial Condition and Results of Operations – Capital Resources and Liquidity” and Note 4 – “Long-Term Debt” to the Consolidated Financial Statements for additional information regarding our revolving credit facility.
Foreign Currency Exchange Risk
A significant portion of our operations are in foreign locations. As a result, transactions occur in currencies other than the U.S. dollar. Exchange rate fluctuations among other currencies used by us would directly or indirectly affect our financial results. We currently use Mexican peso forward contracts to hedge foreign currency fluctuations for a portion of our Mexican peso denominated expenses. There was
$69.7 million
of foreign currency forward contracts outstanding as of
June 29, 2013
. The fair value of these contracts was approximately
$2.0 million
. See Note 10 – “Derivative Financial Instruments” to the Consolidated Financial Statements for additional information regarding our derivative instruments.
27
|
Item 8:
|
FINANCIAL STATEMENTS AND SUPPLEMENTARY DATA
|
Report of Independent Registered Public Accounting Firm
Board of Directors and Stockholders
Key Tronic Corporation
Spokane Valley, Washington
We have audited the accompanying consolidated balance sheets of Key Tronic Corporation (the “Company”) as of June 29, 2013 and June 30, 2012 and the related consolidated statements of income, comprehensive income, shareholders' equity, and cash flows for each of the three years in the period ended June 29, 2013. In connection with our audits of the financial statements, we have also audited the financial statement schedule listed in the accompanying index. These financial statements and schedule are the responsibility of the Company's management. Our responsibility is to express an opinion on these financial statements and schedule based on our audits.
We conducted our audits in accordance with the standards of the Public Company Accounting Oversight Board (United States). Those standards require that we plan and perform the audit to obtain reasonable assurance about whether the financial statements are free of material misstatement. An audit includes examining, on a test basis, evidence supporting the amounts and disclosures in the financial statements, assessing the accounting principles used and significant estimates made by management, as well as evaluating the overall presentation of the financial statements and schedule. We believe that our audits provide a reasonable basis for our opinion.
In our opinion, the consolidated financial statements referred to above present fairly, in all material respects, the financial position of Key Tronic Corporation at June 29, 2013 and June 30, 2012, and the results of its operations and its cash flows for each of the three years in the period ended June 29, 2013
,
in conformity with accounting principles generally accepted in the United States of America.
Also, in our opinion, the financial statement schedule, when considered in relation to the basic consolidated financial statements taken as a whole, presents fairly, in all material respects, the information set forth therein.
We also have audited, in accordance with the standards of the Public Company Accounting Oversight Board (United States), Key Tronic Corporation's internal control over financial reporting as of June 29, 2013, based on criteria established in
Internal Control - Integrated Framework (1992)
issued by the Committee of Sponsoring Organizations of the Treadway Commission (the COSO criteria) and our report dated September 6, 2013 expressed an unqualified opinion thereon.
|
/s/ BDO USA, LLP
|
|
Spokane, Washington
|
|
September 6, 2013
|
28
KEY TRONIC CORPORATION AND SUBSIDIARIES
(In thousands)
|
June 29, 2013
|
June 30, 2012
|
||||||
|
ASSETS
|
|||||||
|
Current assets:
|
|||||||
|
Cash and cash equivalents
|
$
|
10,819
|
|
$
|
502
|
|
|
|
Trade receivables, net
|
47,009
|
|
60,709
|
|
|||
|
Inventories
|
44,664
|
|
58,439
|
|
|||
|
Deferred income tax asset
|
1,767
|
|
5,201
|
|
|||
|
Other
|
7,508
|
|
4,639
|
|
|||
|
Total current assets
|
111,767
|
|
129,490
|
|
|||
|
Property, plant and equipment, net
|
17,911
|
|
17,306
|
|
|||
|
Other assets:
|
|||||||
|
Deferred income tax asset
|
3,179
|
|
2,703
|
|
|||
|
Other
|
2,273
|
|
1,413
|
|
|||
|
Total other assets
|
5,452
|
|
4,116
|
|
|||
|
Total assets
|
$
|
135,130
|
|
$
|
150,912
|
|
|
|
LIABILITIES AND SHAREHOLDERS' EQUITY
|
|||||||
|
Current liabilities:
|
|||||||
|
Accounts payable
|
$
|
26,400
|
|
$
|
43,025
|
|
|
|
Accrued compensation and vacation
|
7,413
|
|
6,337
|
|
|||
|
Current portion of other long-term obligations
|
576
|
|
729
|
|
|||
|
Other
|
3,551
|
|
3,163
|
|
|||
|
Total current liabilities
|
37,940
|
|
53,254
|
|
|||
|
Long-term liabilities:
|
|||||||
|
Revolving loan
|
—
|
|
15,011
|
|
|||
|
Deferred income tax liability
|
1,585
|
|
1,094
|
|
|||
|
Other long-term obligations
|
1,445
|
|
2,945
|
|
|||
|
Total long-term liabilities
|
3,030
|
|
19,050
|
|
|||
|
Total liabilities
|
40,970
|
|
72,304
|
|
|||
|
Commitments and contingencies (Note 4 and 8)
|
|
|
|||||
|
Shareholders’ equity:
|
|||||||
|
Common stock, no par value—shares authorized 25,000; issued and outstanding 10,502 and 10,481 shares, respectively
|
43,369
|
|
42,372
|
|
|||
|
Retained earnings
|
49,478
|
|
36,895
|
|
|||
|
Accumulated other comprehensive income (loss)
|
1,313
|
|
(659
|
)
|
|||
|
Total shareholders’ equity
|
94,160
|
|
78,608
|
|
|||
|
Total liabilities and shareholders’ equity
|
$
|
135,130
|
|
$
|
150,912
|
|
|
See accompanying notes to consolidated financial statements.
29
KEY TRONIC CORPORATION AND SUBSIDIARIES
(In thousands, except per share amounts)
|
|
Years Ended
|
|||||||||||
|
|
June 29, 2013
|
June 30, 2012
|
July 2, 2011
|
|||||||||
|
Net sales
|
$
|
361,033
|
|
$
|
346,475
|
|
$
|
253,846
|
|
|||
|
Cost of sales
|
326,521
|
|
316,639
|
|
233,198
|
|
||||||
|
Gross profit
|
34,512
|
|
29,836
|
|
20,648
|
|
||||||
|
Research, development and engineering expenses
|
5,156
|
|
4,444
|
|
3,782
|
|
||||||
|
Selling, general and administrative expenses
|
11,230
|
|
11,041
|
|
9,927
|
|
||||||
|
Total operating expenses
|
16,386
|
|
15,485
|
|
13,709
|
|
||||||
|
Operating income
|
18,126
|
|
14,351
|
|
6,939
|
|
||||||
|
Interest expense, net
|
271
|
|
510
|
|
457
|
|
||||||
|
Income before income taxes
|
17,855
|
|
13,841
|
|
6,482
|
|
||||||
|
Income tax provision
|
5,272
|
|
2,215
|
|
746
|
|
||||||
|
Net income
|
$
|
12,583
|
|
$
|
11,626
|
|
$
|
5,736
|
|
|||
|
Net income per share — Basic
|
$
|
1.20
|
|
$
|
1.11
|
|
$
|
0.55
|
|
|||
|
Weighted average shares outstanding — Basic
|
10,490
|
|
10,447
|
|
10,344
|
|
||||||
|
Net income per share — Diluted
|
$
|
1.15
|
|
$
|
1.10
|
|
$
|
0.55
|
|
|||
|
Weighted average shares outstanding — Diluted
|
10,897
|
|
10,609
|
|
10,407
|
|
||||||
See accompanying notes to consolidated financial statements.
30
KEY TRONIC CORPORATION AND SUBSIDIARIES
CONSOLIDATED STATEMENTS OF COMPREHENSIVE INCOME
(In thousands)
|
|
Years Ended
|
||||||||||
|
|
June 29, 2013
|
June 30, 2012
|
July 2, 2011
|
||||||||
|
Comprehensive income:
|
|||||||||||
|
Net income
|
$
|
12,583
|
|
$
|
11,626
|
|
$
|
5,736
|
|
||
|
Other comprehensive income:
|
|||||||||||
|
Unrealized gain (loss) on foreign exchange contracts, net of tax
|
1,972
|
|
(2,399
|
)
|
1,982
|
|
|||||
|
Comprehensive income
|
$
|
14,555
|
|
$
|
9,227
|
|
$
|
7,718
|
|
||
Other comprehensive income for fiscal years
2013
,
2012
, and
2011
is reflected net of tax expense (benefit) of approximately
$1.0 million
,
$(1.2) million
, and
$1.0 million
respectively.
See accompanying notes to consolidated financial statements.
31
KEY TRONIC CORPORATION AND SUBSIDIARIES
(In thousands)
See accompanying notes to consolidated financial statements.
|
|
Year Ended
|
||||||||||
|
|
June 29, 2013
|
June 30, 2012
|
July 2, 2011
|
||||||||
|
Operating activities:
|
|||||||||||
|
Net income
|
$
|
12,583
|
|
$
|
11,626
|
|
$
|
5,736
|
|
||
|
Adjustments to reconcile net income to cash provided by (used in) operating activities:
|
|||||||||||
|
Depreciation and amortization
|
2,965
|
|
2,333
|
|
2,212
|
|
|||||
|
Accretion of deferred gain on sale of building
|
—
|
|
—
|
|
(39
|
)
|
|||||
|
Excess tax benefit from exercise of stock options
|
(103
|
)
|
(509
|
)
|
—
|
|
|||||
|
Provision for obsolete inventory
|
525
|
|
762
|
|
299
|
|
|||||
|
Provision for warranty
|
26
|
|
60
|
|
158
|
|
|||||
|
Provision for (recovery of) doubtful accounts
|
62
|
|
(111
|
)
|
15
|
|
|||||
|
Loss (gain) on disposal of fixed assets
|
27
|
|
5
|
|
(6
|
)
|
|||||
|
Share-based compensation expense
|
848
|
|
624
|
|
500
|
|
|||||
|
Deferred income taxes
|
2,493
|
|
221
|
|
1,036
|
|
|||||
|
Deferred compensation
|
(546
|
)
|
—
|
|
—
|
|
|||||
|
Changes in operating assets and liabilities:
|
|||||||||||
|
Trade receivables
|
13,638
|
|
(20,268
|
)
|
(5,748
|
)
|
|||||
|
Inventories
|
13,250
|
|
(17,647
|
)
|
(2,078
|
)
|
|||||
|
Other assets
|
(2,381
|
)
|
(1,732
|
)
|
(274
|
)
|
|||||
|
Accounts payable
|
(16,625
|
)
|
16,876
|
|
(3,009
|
)
|
|||||
|
Accrued compensation and vacation
|
1,148
|
|
1,829
|
|
(661
|
)
|
|||||
|
Other liabilities
|
1,372
|
|
865
|
|
(710
|
)
|
|||||
|
Cash provided by (used in) operating activities
|
29,282
|
|
(5,066
|
)
|
(2,569
|
)
|
|||||
|
Investing activities:
|
|||||||||||
|
Purchase of property and equipment
|
(3,470
|
)
|
(4,654
|
)
|
(3,818
|
)
|
|||||
|
Proceeds from sale of fixed assets
|
27
|
|
9
|
|
15
|
|
|||||
|
Proceeds from life insurance
|
144
|
|
—
|
|
113
|
|
|||||
|
Cash used in investing activities
|
(3,299
|
)
|
(4,645
|
)
|
(3,690
|
)
|
|||||
|
Financing activities:
|
|||||||||||
|
Payment of financing costs
|
(75
|
)
|
(75
|
)
|
(50
|
)
|
|||||
|
Proceeds from long term debt
|
—
|
|
—
|
|
2,244
|
|
|||||
|
Principal payments on long term debt
|
(729
|
)
|
(689
|
)
|
(251
|
)
|
|||||
|
Borrowings under revolving credit agreement
|
66,528
|
|
114,591
|
|
98,985
|
|
|||||
|
Repayment of revolving credit agreement
|
(81,539
|
)
|
(105,580
|
)
|
(94,539
|
)
|
|||||
|
Excess tax benefit from exercise of stock options
|
103
|
|
509
|
|
—
|
|
|||||
|
Proceeds from exercise of stock options
|
46
|
|
225
|
|
332
|
|
|||||
|
Cash (used in) provided by financing activities
|
(15,666
|
)
|
8,981
|
|
6,721
|
|
|||||
|
Net increase (decrease) in cash and cash equivalents
|
10,317
|
|
(730
|
)
|
462
|
|
|||||
|
Cash and cash equivalents, beginning of period
|
502
|
|
1,232
|
|
770
|
|
|||||
|
Cash and cash equivalents, end of period
|
$
|
10,819
|
|
$
|
502
|
|
$
|
1,232
|
|
||
|
Supplemental cash flow information:
|
|||||||||||
|
Interest payments
|
$
|
317
|
|
$
|
443
|
|
$
|
463
|
|
||
|
Income tax payments, net of refunds
|
$
|
2,708
|
|
$
|
1,412
|
|
$
|
533
|
|
||
32
KEY TRONIC CORPORATION AND SUBSIDIARIES
CONSOLIDATED STATEMENT OF SHAREHOLDERS’ EQUITY
(In thousands)
|
Shares
|
Common
Stock
|
Retained
Earnings
|
Accumulated
Other
Comprehensive
Income (Loss)
|
Total
Shareholders’
Equity
|
||||||||||||||
|
Balances, July 3, 2010
|
10,264
|
|
$
|
40,126
|
|
$
|
19,533
|
|
$
|
(242
|
)
|
$
|
59,417
|
|
||||
|
Net Income
|
—
|
|
—
|
|
5,736
|
|
—
|
|
5,736
|
|
||||||||
|
Unrealized gain on foreign exchange contracts, net
|
—
|
|
—
|
|
—
|
|
1,982
|
|
1,982
|
|
||||||||
|
Exercise of stock options
|
135
|
|
332
|
|
—
|
|
—
|
|
332
|
|
||||||||
|
Share-based compensation
|
—
|
|
556
|
|
—
|
|
—
|
|
556
|
|
||||||||
|
Balances, July 2, 2011
|
10,399
|
|
$
|
41,014
|
|
$
|
25,269
|
|
$
|
1,740
|
|
$
|
68,023
|
|
||||
|
Net Income
|
—
|
|
—
|
|
11,626
|
|
—
|
|
11,626
|
|
||||||||
|
Unrealized loss on foreign exchange contracts, net
|
—
|
|
—
|
|
—
|
|
(2,399
|
)
|
(2,399
|
)
|
||||||||
|
Exercise of stock options
|
82
|
|
225
|
|
—
|
|
—
|
|
225
|
|
||||||||
|
Share-based compensation
|
—
|
|
624
|
|
—
|
|
—
|
|
624
|
|
||||||||
|
Tax benefit from exercise of stock options
|
—
|
|
509
|
|
—
|
|
—
|
|
509
|
|
||||||||
|
Balances, June 30, 2012
|
10,481
|
|
$
|
42,372
|
|
$
|
36,895
|
|
$
|
(659
|
)
|
$
|
78,608
|
|
||||
|
Net income
|
—
|
|
—
|
|
12,583
|
|
—
|
|
12,583
|
|
||||||||
|
Unrealized gain on foreign exchange contracts, net
|
—
|
|
—
|
|
—
|
|
1,972
|
|
1,972
|
|
||||||||
|
Exercise of stock options
|
21
|
|
46
|
|
—
|
|
—
|
|
46
|
|
||||||||
|
Share-based compensation
|
—
|
|
848
|
|
—
|
|
—
|
|
848
|
|
||||||||
|
Tax benefit from exercise of stock options
|
—
|
|
103
|
|
—
|
|
—
|
|
103
|
|
||||||||
|
Balances, June 29, 2013
|
10,502
|
|
$
|
43,369
|
|
$
|
49,478
|
|
$
|
1,313
|
|
$
|
94,160
|
|
||||
See accompanying notes to consolidated financial statements.
33
NOTES TO CONSOLIDATED FINANCIAL STATEMENTS
1. SIGNIFICANT ACCOUNTING POLICIES
Business
Key Tronic Corporation and subsidiaries (the Company) is engaged in electronic manufacturing services (EMS) for original equipment manufacturers (OEMs), and also manufactures keyboards and other input devices. The Company’s headquarters are located in Spokane Valley, Washington with manufacturing operations in Spokane Valley; Juarez, Mexico; and Shanghai, China.
Principles of Consolidation
The consolidated financial statements include the Company and its wholly owned subsidiaries in Mexico and China. Intercompany balances and transactions have been eliminated in consolidation.
Reclassifications
Certain prior period reclassifications were made to conform with the current period presentation. These reclassifications had no effect on reported income, comprehensive income, cash flows, total assets, or shareholders' equity as previously reported.
Use of Estimates
The preparation of financial statements in conformity with accounting principles generally accepted in the United States of America requires management to make estimates and assumptions that affect the reported amounts of assets and liabilities, disclosure of contingent assets and liabilities at the date of the financial statements, and the reported amounts of revenues and expenses during the reporting period. Estimates include the allowance for doubtful receivables, the provision for obsolete and non-saleable inventories, deferred tax assets and liabilities, uncertain tax positions, impairment of long-lived assets, medical self-funded insurance liability, long-term incentive compensation accrual, the provision for warranty costs, and the fair values of options and stock appreciation rights granted under the Company’s stock-based compensation plans. Due to uncertainties with respect to the assumptions and estimates actual results could differ from those estimates.
Cash and Cash Equivalents
The Company considers investments with an original maturity of three months or less to be cash equivalents. Cash equivalents are carried at cost, which approximates fair value. The Company may have cash and cash equivalents at financial institutions that are in excess of federally insured limits from time to time.
Allowance for Doubtful Accounts
The Company evaluates the collectability of accounts receivable and records an allowance for doubtful accounts, which reduces the receivables to an amount that management reasonably estimates will be collected. A specific allowance is recorded against receivables considered to be impaired based on the Company’s knowledge of the financial condition of the customer. In determining the amount of the allowance, the Company considers several factors including the aging of the receivables, the current business environment, and historical experience. After all attempts to collect a receivable have failed, the receivable is written off against the allowance.
Inventories
Inventories are stated at the lower of cost or market. Cost is determined principally using the first-in, first-out (FIFO) method. Customer orders are based upon forecasted quantities of product manufactured for shipment over defined periods. Raw material inventories are purchased to fulfill these customer requirements. Within these arrangements, customer demands for products frequently change, sometimes creating excess and obsolete inventories. The Company regularly reviews raw material inventories by customer for both excess and obsolete quantities. Wherever possible, the Company attempts to recover its full cost of excess and obsolete inventories from customers or, in some cases, through other markets. When it is determined that the Company's carrying cost of such excess and obsolete inventories cannot be recovered in full, a charge is taken against income for the difference between the carrying cost and the estimated realizable amount.
Property, Plant and Equipment
Property, plant and equipment are carried at cost and depreciated using straight-line methods over the expected useful lives of the assets. Internally constructed molds and dies are depreciated over the expected useful lives of one to two years. Repairs and maintenance costs are expensed as incurred.
34
Impairment of Long-lived Assets
The Company, using its best estimates based on reasonable and supportable assumptions and projections, reviews assets for impairment whenever events or changes in circumstances have indicated that the carrying amount of its assets might not be recoverable. Impaired assets are reported at the lower of cost or fair value.
Accrued Warranty
An accrual is made for expected warranty costs, with the related expense recognized in cost of goods sold. Management reviews the adequacy of this accrual quarterly based on historical analyses and anticipated product returns.
Self-funded Insurance
The Company self-funds its domestic employee health plan. The Company contracted with a separate administrative service company to supervise and administer the program and act as its representative. The Company reduces its risk under this self-funded platform by purchasing stop-loss insurance coverage for individual claims. In addition, if the aggregate annual claims amount to more than
125 percent
of expected claims for the plan year this insurance will also pay those claims amounts exceeding that level.
The Company estimates its exposure for claims incurred but not paid at the end of each reporting period and uses historical claims data supplied by the Company’s broker to estimate its self-funded insurance liability. This liability is subject to a total limitation that varies based on employee enrollment and factors that are established at each annual contract renewal. Actual claims experience may differ from the Company’s estimates. Costs related to the administration of the plan and related claims are expensed as incurred.
Revenue Recognition
Sales revenue from manufacturing is recognized upon shipment of the manufactured product per contractual terms. Upon shipment, title transfers and the customer assumes risks and rewards of ownership of the product. The price to the buyer is fixed or determinable and recoverability is reasonably assured. Unless specifically stated in contractual terms, there are no formal customer acceptance requirements or further obligations related to the manufacturing services; if any such requirements exist, then sales revenue is recognized at the time when such requirements are completed and such obligations are fulfilled. Revenue is recorded net of estimated returns of manufactured product based on management’s analysis of historical returns.
Revenues and associated costs from engineering design, development services and tooling, which are performed under contract of short term durations, are recognized only after the completed performance of the service. Revenue from engineering design, development services and tooling represented approximately
2.5 percent
,
2.1 percent
, and
3.3 percent
of total revenue in fiscal years
2013
,
2012
, and
2011
, respectively.
Shipping and Handling Fees
The Company classifies costs associated with shipping and handling fees as a component of cost of goods sold. Customer billings related to shipping and handling fees are reported as revenue.
Research, Development and Engineering
Research, development and engineering expenses include unreimbursed EMS costs as well as design and engineering costs associated with the production of EMS programs. Research, development and engineering costs are expensed as incurred.
Income Taxes
Income taxes are accounted for under the asset and liability method. Deferred tax assets and liabilities are recognized for the estimated future tax consequences and benefits attributable to differences between the financial statement carrying amounts of existing assets and liabilities and their respective tax basis, as well as operating losses and tax credit carryforwards. Deferred tax assets and liabilities are measured using enacted tax rates expected to apply to taxable income in the years in which temporary differences and carryforwards are expected to be recovered or settled. The effect on deferred tax assets and liabilities for a change in tax rates is recognized in the period that includes the enactment date. Valuation allowances are established when necessary to reduce deferred tax assets to the amount that is more likely than not to be realized.
35
We utilize a two-step approach to recognizing and measuring uncertain tax positions. The first step is to evaluate the tax position for recognition by determining if the weight of available evidence indicates it is more likely than not that the position will be sustained on audit, including resolution of related appeals or litigation processes, if any. The second step is to measure the tax benefit as the largest amount which is more than
50%
likely of being realized upon ultimate settlement. We consider many factors when evaluating and estimating our tax positions and tax benefits, which may require periodic adjustments based on new assessments and changes in estimates and which may not accurately forecast actual outcomes. Our policy is to recognize interest and penalties related to the underpayment of income taxes as a component of income tax provision. To date, we have not incurred charges for interest or penalties in relation to the underpayment of income taxes. The tax years 1997 through the present remain open to examination by the major U.S. taxing jurisdictions to which we are subject. Refer to Note 5 for further discussions.
Derivative Instruments and Hedging Activities
The Company has entered into foreign currency forward contracts which are accounted for as cash flow hedges in accordance with ASC 815,
Derivatives and Hedging
. The effective portion of the gain or loss on the derivative is reported as a component of accumulated other comprehensive income (AOCI) and is reclassified into earnings in the same period in which the underlying hedged transaction affects earnings. The derivative’s effectiveness represents the change in fair value of the hedge that offsets the change in fair value of the hedged item.
The Company transacts business in Mexico and is subject to the risk of foreign currency exchange rate fluctuations. The Company enters into foreign currency forward contracts to manage the foreign currency fluctuations for Mexican peso denominated payroll, utility, tax, and accounts payable expenses. The foreign currency forward contracts have terms that are matched to the underlying transactions being hedged. As a result, these transactions fully offset the hedged risk and no ineffectiveness has been recorded.
The Company's foreign currency forward contracts potentially expose the Company to credit risk to the extent the counterparties may be unable to meet the terms of the agreement. The Company minimizes such risk by seeking high quality counterparties. The Company’s counterparties to the foreign currency forward contracts are major banking institutions. These institutions do not require collateral for the contracts, and the Company believes that the risk of the counterparties failing to meet their contractual obligations is remote. The Company does not enter into derivative instruments for trading or speculative purposes.
Earnings Per Common Share
Basic earnings per common share is computed by dividing net income by the weighted average number of common shares outstanding during the period. Diluted earnings per common share is computed by dividing net income by the combination of other potentially dilutive weighted average common shares and the weighted average number of common shares outstanding during the period using the treasury stock method. The computation assumes the proceeds from the exercise of stock options were used to repurchase common shares at the average market price during the period. The computation of diluted earnings per common share does not assume conversion, exercise, or contingent issuance of common stock equivalent shares that would have an anti-dilutive effect on earnings per share.
Foreign Currency Transactions
The functional currency of the Company’s subsidiaries in Mexico and China is the U.S. dollar. Realized foreign currency transaction gains and losses for local currency denominated assets and liabilities are included in cost of goods sold.
Fair Value of Financial Instruments
The carrying values of cash and cash equivalents, accounts receivable and current liabilities reflected on the balance sheets at
June 29, 2013
and
June 30, 2012
, reasonably approximate their fair value. Based on the borrowing rates currently available to the Company for loans with similar terms and average maturities, the fair value of long-term debt was estimated to be
$15.0 million
as of
June 30, 2012
. As of
June 29, 2013
, the Company did not have an outstanding balance on the line of credit.
Share-based Compensation
The Company’s incentive plan may provide for equity and liability awards to employees in the form of stock options, stock appreciation rights, restricted stock, restricted stock units, stock awards, stock units, performance shares, performance units, and other stock –based or cash-based awards. Compensation cost is recognized on a straight-line basis over the requisite employee service period, which is generally the vesting period, and is included in cost of goods sold and selling, general, and administrative expenses.
36
Newly Adopted and Recent Accounting Pronouncements
In December 2011, the Financial Accounting Standards Board (FASB) issued Accounting Standards Update 2011-11 (ASU 2011-11),
Disclosures about Offsetting Assets and Liabilities
. The amendments in this Update will enhance disclosures required by U.S. GAAP by requiring improved information about financial instruments and derivative instruments that are either (1) offset in accordance with either Section 210-20-45 or Section 815-10-45 or (2) subject to an enforceable master netting arrangement or similar agreement. The amendments are effective for fiscal years beginning after January 1, 2013 and for interim periods within those fiscal years. The amendments of ASU 2011-11 are not expected to have a material impact on the Company’s consolidated financial statements.
In January 2013, the FASB issued Accounting Standards Update 2013-01 (ASU 2013-01),
Clarifying the Scope of Disclosures about Offsetting Assets and Liabilities
. The main objective in developing this Update is to address implementation issues about the scope of Accounting Standards Update No. 2011-11, Balance Sheet Topic 210: Disclosures about Offsetting Assets and Liabilities. The amendments are effective for fiscal years beginning on or after January 1, 2013, and interim periods within those annual periods. The amendments of ASU 2013-01 are not expected to have a material impact on the Company’s consolidated financial statements.
In February 2013, the FASB issued Accounting Standards Update 2013-02 (ASU 2013-02),
Reporting of Amounts Reclassified Out of Accumulated Other Comprehensive Income
. The objective of this Update is to improve the reporting of reclassifications out of accumulated other comprehensive income. The amendments in this Update seek to attain that objective by requiring an entity to report the effect of significant reclassifications out of accumulated other comprehensive income on the respective line items in net income if the amount being reclassified is required under U.S. GAAP to be reclassified in its entirety to net income. For other amounts that are not required under U.S. GAAP to be reclassified in their entirety to net income in the same reporting period, an entity is required to cross-reference other disclosures required under U.S. GAAP that provide additional detail about those amounts. The amendments are effective prospectively for annual reporting periods beginning after December 15, 2012 and interim periods within those annual periods. The amendments of ASU 2013-02, when adopted, are not expected to have a material impact on the Company’s consolidated financial statements, however will require additional disclosure within the notes to the financial statements.
In July 2013, the FASB issued Accounting Standards Update 2013-11 (ASU 2013-11),
Presentation of an Unrecognized Tax Benefit When a Net Operating Loss Carryforward, a Similar Tax Loss, or a Tax Credit Carryforward Exists a consensus of the FASB Emerging Issues Task Force
. The objective of this Update is to eliminate the diversities that exist in financial statement presentation. The amendments aim at attaining this objective by giving explicit guidance on the financial statement presentation of an unrecognized tax benefit when a net operating loss carryforward, a similar tax loss, or a tax credit carryforward exists. The amendments in this Update are effective for fiscal years, and interim periods within those years, beginning after December 15, 2013. The amendments of ASU 2013-11, when adopted, are not expected to have a material impact on the Company's consolidated financial statements.
Fiscal Year
The Company operates on a 52/53 week fiscal year. Fiscal years end on the Saturday nearest June 30. As such, fiscal years
2013
,
2012
, and
2011
, ended on
June 29, 2013
,
June 30, 2012
, and
July 2, 2011
, respectively and each year was a 52 week year.
2. INVENTORIES
The components of inventories consist of the following (in thousands):
|
June 29, 2013
|
June 30, 2012
|
||||||
|
Finished goods
|
$
|
7,097
|
|
$
|
9,805
|
|
|
|
Work-in-process
|
5,098
|
|
6,340
|
|
|||
|
Raw materials and supplies
|
32,469
|
|
42,294
|
|
|||
|
$
|
44,664
|
|
$
|
58,439
|
|
||
37
3. PROPERTY, PLANT AND EQUIPMENT
Property, plant and equipment consists of the following:
|
Life
|
June 29, 2013
|
June 30, 2012
|
||||||||
|
|
(in years)
|
(in thousands)
|
||||||||
|
Land
|
—
|
$
|
2,629
|
|
$
|
2,629
|
|
|||
|
Buildings and improvements
|
3 to 30
|
18,919
|
|
18,300
|
|
|||||
|
Equipment
|
1 to 10
|
37,317
|
|
35,160
|
|
|||||
|
Furniture and fixtures
|
3 to 5
|
2,730
|
|
2,378
|
|
|||||
|
61,595
|
|
58,467
|
|
|||||||
|
Accumulated depreciation
|
(43,684
|
)
|
(41,161
|
)
|
||||||
|
$
|
17,911
|
|
$
|
17,306
|
|
|||||
Note Payable - Bank
On October 15, 2010, the Company entered into an amended credit agreement with Wells Fargo Bank, N.A. thereby increasing its revolving line of credit for up to
$30.0 million
. On January 30, 2012, the Company entered into a second amendment to the credit agreement extending the term to October 15, 2016. The agreement specifies that the proceeds of the revolving line of credit be used primarily for working capital and general corporate purposes of the Company and its subsidiaries. Borrowings under this revolving line of credit bear interest at either a “Base Rate” or a “Fixed Rate”, as elected by the Company. The base rate is the higher of the Wells Fargo Bank prime rate, daily one month London Interbank Offered Rate (LIBOR) plus
1.5%
, or the Federal Funds rate plus
1.5%
. The fixed rate is LIBOR plus
2.1%
or LIBOR plus
2.5%
depending on the level of the Company’s trailing four quarters Earnings Before Interest, Taxes, Depreciation and Amortization (EBITDA). The revolving line of credit is secured by substantially all of the assets of the Company.
The Company must comply with certain financial covenants, including a cash flow leverage ratio and a trading ratio. The credit agreement requires the Company to maintain a minimum profit threshold, limits the maximum lease expenditures and restricts the Company from declaring or paying dividends in cash or stock. The Company is in compliance with all financial covenants for all periods presented.
As of
June 29, 2013
, the Company had availability to borrow
$30.0 million
under the line of credit. The Company did not have an outstanding balance on the line of credit as of
June 29, 2013
. The outstanding balance under the credit facility was
$15.0 million
as of
June 30, 2012
and the interest rate on the outstanding balances was in the range of
2.35%
-
3.25%
.
38
5. INCOME TAXES
Income tax provision consists of the following:
|
|
Year Ended
|
|||||||||||
|
|
June 29, 2013
|
June 30, 2012
|
July 2, 2011
|
|||||||||
|
|
(in thousands)
|
|||||||||||
|
Current income tax provision:
|
||||||||||||
|
United States
|
$
|
1,729
|
|
$
|
1,483
|
|
$
|
34
|
|
|||
|
Foreign
|
1,050
|
|
511
|
|
242
|
|
||||||
|
2,779
|
|
1,994
|
|
276
|
|
|||||||
|
Deferred income tax provision:
|
||||||||||||
|
United States
|
2,049
|
|
(85
|
)
|
1,250
|
|
||||||
|
Foreign
|
444
|
|
306
|
|
(780
|
)
|
||||||
|
2,493
|
|
221
|
|
470
|
|
|||||||
|
Total income tax provision
|
$
|
5,272
|
|
$
|
2,215
|
|
$
|
746
|
|
|||
The Company has total tax credit carryforwards of approximately
$7.9 million
at
June 29, 2013
. Included in total tax credits carryforwards is approximately
$5.7 million
in research and development (R&D) tax credits.
Management also has reviewed its other deferred tax assets for purposes of determining whether or not a valuation allowance may be required. A valuation allowance against these deferred tax assets is required if it is more likely than not that some of the deferred tax assets will not be realized. Based on the Company’s increased profitability and estimated future repatriations from foreign subsidiaries, it has been determined that it is more likely than not that the deferred tax assets will be realized.
Management has reviewed and updated as necessary estimates of future repatriations of the undistributed earnings of its foreign subsidiaries. Based on this analysis, management expects to repatriate a portion of the foreign undistributed earnings based on increased sales growth driving additional U.S. capital requirements, cash requirements for potential acquisitions and to potentially implement certain tax strategies. No foreign earnings were repatriated from either foreign subsidiary during fiscal
2013
or
2012
. The Company currently estimates that future repatriations from foreign subsidiaries will approximate
$9.3 million
. As such, as earnings are recognized in the United States, the Company would be subject to U.S. federal and state income taxes and potential withholding taxes estimated to be approximately
$4.6 million
. Both the domestic tax and estimated withholding tax have been recorded as part of deferred taxes as of
June 29, 2013
. Included in tax credits is
$3.9 million
related to foreign tax credits that can be used to offset future domestic income tax. All other unremitted foreign earnings are expected to remain permanently reinvested for planned fixed asset purchases in foreign locations.
The Company has not provided for U.S. income taxes or foreign withholding taxes on approximately
$9.8 million
of earnings from foreign subsidiaries which are permanently reinvested outside the U.S. The unrecognized net tax provision, after netting U.S. federal and state income tax and any related foreign tax credits, would be approximately
$1.2 million
associated to these earnings.
The Company has a wholly owned foreign subsidiary in Mexico that applies certain tax credits related to production assets that currently offset all of the income tax liabilities under general Mexican income tax law. However, the Company is subject to a Mexican business flat tax called Impuesto Empresarial a Tasa Unica (IETU). The Company anticipates that it will be taxable under IETU for the foreseeable future based on projected assets used in its operations and anticipated future cash flows. The effect of IETU and the associated presidential decrees have been included in the effective tax rate for the year ended
June 29, 2013
.
39
The Company’s effective tax rate differs from the federal tax rate as follows:
|
|
Year Ended
|
|||||||||||
|
|
June 29, 2013
|
June 30, 2012
|
July 2, 2011
|
|||||||||
|
|
(in thousands)
|
|||||||||||
|
Federal income tax provision at statutory rates
|
$
|
6,071
|
|
$
|
4,706
|
|
$
|
2,205
|
|
|||
|
Foreign tax rate differences
|
(625
|
)
|
(361
|
)
|
(326
|
)
|
||||||
|
Effect of income tax credits
|
(340
|
)
|
(2,104
|
)
|
(1,249
|
)
|
||||||
|
Effect of repatriation of foreign earnings, net
|
188
|
|
—
|
|
72
|
|
||||||
|
Other
|
235
|
|
436
|
|
(86
|
)
|
||||||
|
Change in valuation allowance
|
(257
|
)
|
(462
|
)
|
130
|
|
||||||
|
Income tax provision
|
$
|
5,272
|
|
$
|
2,215
|
|
$
|
746
|
|
|||
The domestic and foreign components of income before income taxes were:
|
|
Year Ended
|
|||||||||||
|
|
June 29, 2013
|
June 30, 2012
|
July 2, 2011
|
|||||||||
|
|
(in thousands)
|
|||||||||||
|
Domestic
|
$
|
12,863
|
|
$
|
10,666
|
|
$
|
4,048
|
|
|||
|
Foreign
|
4,992
|
|
3,175
|
|
2,434
|
|
||||||
|
Income before income taxes
|
$
|
17,855
|
|
$
|
13,841
|
|
$
|
6,482
|
|
|||
Deferred income tax assets and liabilities consist of the following at:
|
June 29, 2013
|
June 30, 2012
|
|||||||
|
|
(in thousands)
|
|||||||
|
Deferred tax assets:
|
||||||||
|
Tax credit carryforwards, net
|
$
|
3,414
|
|
$
|
4,559
|
|
||
|
Foreign subsidiaries – future tax credits
|
3,389
|
|
2,600
|
|
||||
|
Inventory
|
131
|
|
396
|
|
||||
|
Accruals
|
1,925
|
|
3,069
|
|
||||
|
Fixed Assets
|
755
|
|
378
|
|
||||
|
Other
|
185
|
|
362
|
|
||||
|
Deferred income tax assets
|
9,799
|
|
11,364
|
|
||||
|
Valuation allowance
|
—
|
|
(257
|
)
|
||||
|
Deferred income tax assets, net of valuation allowance
|
$
|
9,799
|
|
$
|
11,107
|
|
||
|
Deferred tax liabilities:
|
||||||||
|
Foreign subsidiaries – unremitted earnings
|
(4,115
|
)
|
(3,138
|
)
|
||||
|
Fixed assets
|
(1,617
|
)
|
(1,157
|
)
|
||||
|
Other
|
(706
|
)
|
(2
|
)
|
||||
|
Deferred income tax liabilities
|
$
|
(6,438
|
)
|
$
|
(4,297
|
)
|
||
|
Net deferred income tax assets
|
$
|
3,361
|
|
$
|
6,810
|
|
||
|
Balance sheet caption reported in:
|
||||||||
|
Current deferred tax asset
|
$
|
1,767
|
|
$
|
5,201
|
|
||
|
Long-term deferred tax asset
|
3,179
|
|
2,703
|
|
||||
|
Long term deferred income tax liability
|
(1,585
|
)
|
(1,094
|
)
|
||||
|
Net deferred income tax asset
|
$
|
3,361
|
|
$
|
6,810
|
|
||
At
June 30, 2012
the Company utilized all its NOLs carried forward from prior years in both the U. S. and Chinese jurisdictions. The Company has R&D tax credits that approximate
$5.7 million
that have
20
year carryforwards before expiring. The Company’s R&D tax credits expire in various fiscal years from 2019 to 2033. The Company also has alternative minimum tax credits, which do not expire, approximating
$726,000
.
40
Uncertain Tax Positions
As of
June 29, 2013
, the Company had unrecognized tax benefits of
$3.0 million
related to its gross R&D tax credits. The unrecognized tax benefits relate to certain R&D tax credits generated from 1999 to 2013.
A reconciliation of the beginning and ending amount of unrecognized tax benefits is as follows:
|
Balances, July 2, 2011
|
$
|
781
|
|
|
Additions in fiscal 2012
|
2,222
|
|
|
|
Balances, June 30, 2012
|
$
|
3,003
|
|
|
Additions in fiscal 2013
|
97
|
|
|
|
Deletions in fiscal 2013
|
(69
|
)
|
|
|
Balances, June 29, 2013
|
$
|
3,031
|
|
The increase from the prior year is due to additional R&D credits that were recorded in
2013
as discussed above. Management does not anticipate any material changes to this amount during the next 12 months.
The Company recognizes interest accrued related to unrecognized tax benefits and penalties in its income tax provision. The Company has not recognized any interest or penalties in the fiscal years presented in these financial statements. The Company is subject to income tax in the U.S. federal jurisdiction, Mexico and China. Certain years remain subject to examination but there are currently no ongoing exams in any taxing jurisdictions.
41
6. EARNINGS PER SHARE
Basic earnings per share (EPS) is calculated by dividing net income (the numerator) by the weighted-average number of common shares outstanding (the denominator) during the period. Diluted EPS is computed by including both the weighted-average number of shares outstanding and any dilutive common share equivalents in the denominator. The following table presents a reconciliation of the denominator and the number of antidilutive common share awards that were not included in the diluted earnings per share calculation. These antidilutive securities occur when equity awards outstanding have an option price greater than the average market price for the period:
|
Years Ended
(in thousands, except per share information)
|
||||||||||||
|
|
June 29, 2013
|
June 30, 2012
|
July 2, 2011
|
|||||||||
|
Net income
|
$
|
12,583
|
|
$
|
11,626
|
|
$
|
5,736
|
|
|||
|
Weighted average shares outstanding– basic
|
10,490
|
|
10,447
|
|
10,344
|
|
||||||
|
Effect of dilutive common stock options
|
407
|
|
162
|
|
63
|
|
||||||
|
Weighted average shares outstanding – diluted
|
10,897
|
|
10,609
|
|
10,407
|
|
||||||
|
Earnings per share – basic
|
$
|
1.20
|
|
$
|
1.11
|
|
$
|
0.55
|
|
|||
|
Earnings per share – diluted
|
$
|
1.15
|
|
$
|
1.10
|
|
$
|
0.55
|
|
|||
|
Antidilutive options not included in diluted earnings per share
|
—
|
|
—
|
|
541
|
|
||||||
7. STOCK OPTION AND BENEFIT PLANS
The Company’s incentive plan provides for equity and liability awards to employees and non-employee directors in the form of stock options, stock appreciation rights (SARs), restricted stock, restricted stock units, stock awards, stock units, performance shares, performance units, and other stock – based or cash-based awards. Compensation cost is recognized on a straight-line basis over the requisite employee service period, which is generally the vesting period, and is recorded as employee compensation expense in cost of goods sold and selling general and administrative expenses. Share-based compensation is recognized only for those awards that are expected to vest, with forfeitures estimated at the date of grant based on historical experience and future expectations.
In addition to service conditions, these SARs contain a performance condition. The additional performance condition is based upon the achievement of Return on Invested Capital (ROIC) goals relative to a peer group. All awards with performance conditions are measured over the vesting period and are charged to compensation expense over the requisite service period based on the number of shares expected to vest. The SARs cliff vest after a three-year period from date of grant and expire five years from date of grant.
On July 25, 2012, the Company granted
210,666
SARs under the 2010 Incentive Plan to certain key employees and outside directors at a strike price of
$7.44
and a grant date fair value of
$3.71
, as of
June 29, 2013
203,166
remain outstanding. The grant date fair value for the awards granted during fiscal year
2013
were estimated using the Black Scholes option valuation method with the following weighted average assumptions as July 25, 2012:
|
Fiscal Year 2013
|
|||
|
|
July 25, 2012
|
||
|
Expected dividend yield
|
—
|
%
|
|
|
Risk – free interest rate
|
0.46
|
%
|
|
|
Expected volatility
|
66.50
|
%
|
|
|
Expected life
|
4.00
|
|
|
42
On July 27, 2011, the Company granted
184,666
SARs under the 2010 Incentive Plan to certain key employees and outside directors at a strike price of
$4.40
and a grant date weighted average fair market value of
$2.20
, as of
June 29, 2013
,
179,666
remain outstanding. On January 26, 2012, the Company granted
32,000
SARs under the 2010 Incentive Plan to certain key employees at a strike price of
$6.30
and grant date weighted average fair market value of
$3.08
. The grant date fair value for the awards granted during fiscal year
2012
were estimated using the Black Scholes option valuation method with the following weighted average assumptions at each of the respective grant dates:
|
Fiscal Year 2012
|
|||||
|
|
January 26, 2012
|
July 27, 2011
|
|||
|
Expected dividend yield
|
—
|
%
|
—
|
%
|
|
|
Risk – free interest rate
|
0.52
|
%
|
1.16
|
%
|
|
|
Expected volatility
|
64.90
|
%
|
65.50
|
%
|
|
|
Expected life
|
4.00
|
|
4.00
|
|
|
On October 21, 2010, the Company obtained shareholder approval of the 2010 Incentive Plan at the Annual Shareholder Meeting. As a result, the Company replaced the cash-settlement feature with a net-share-settlement feature for the 522,000 SARs granted during the fourth quarter of fiscal 2010. Therefore, the awards were reclassified from liability awards to equity awards effective October 21, 2010 at a weighted average fair value of
$2.89
. The fair value for the liability awards amended to equity awards during fiscal year 2011 were estimated using the Black-Scholes option valuation model with the following weighted average assumptions as of October 21, 2010:
|
|
Fiscal Year 2011
|
|
|
|
October 21, 2010
|
|
|
Expected dividend yield
|
—
|
%
|
|
Risk – free interest rate
|
0.73
|
%
|
|
Expected volatility
|
68.30
|
%
|
|
Expected life
|
3.56
|
|
Share-based compensation expense is recognized only for those awards that are expected to vest, with forfeitures estimated at the date of grant based on the Company’s historical experience and future expectations. This forfeiture rate will be revised, if necessary, in subsequent periods if actual forfeitures differ from the amount estimated. Share-based compensation expense for fiscal years ended
June 29, 2013
,
June 30, 2012
and
July 2, 2011
was
$0.8 million
,
$0.6 million
and
$0.5 million
, respectively.
The Black-Scholes option valuation model was developed for use in estimating the fair value of traded options, which differ significantly from the SARs, as traded options have no vesting restrictions and are fully transferable. In addition, option valuation models require the input of highly subjective assumptions, particularly for the expected term and expected stock price volatility. Changes in these assumptions can materially affect the fair value estimates.
The intrinsic value for options exercised in fiscal years
2013
,
2012
and
2011
was
$0.2 million
,
$0.3 million
and
$0.2 million
, respectively.
As of
June 29, 2013
, total unrecognized compensation expense related to nonvested share-based compensation arrangements was approximately
$0.7 million
. This expense is expected to be recognized over a weighted-average period of
1.84 years
.
43
The following table summarizes option/SARs activity of all plans from
June 30, 2012
through
June 29, 2013
:
|
Shares
Available For Grant |
Options/SARs
Outstanding |
Aggregate
Intrinsic Value (in thousands) |
Weighted
Average Exercise Price |
Weighted
Average Remaining Contractual Life (in years) |
|||||||||||||
|
Balances, June 30, 2012
|
461,334
|
|
784,360
|
|
$
|
2,261
|
|
$
|
5.36
|
|
3.1
|
|
|||||
|
Shares authorized
|
—
|
|
—
|
|
—
|
|
—
|
|
—
|
|
|||||||
|
Options/SARs granted
|
—
|
|
210,666
|
|
—
|
|
7.44
|
|
—
|
|
|||||||
|
Options canceled and expired
|
—
|
|
(12,502
|
)
|
—
|
|
6.22
|
|
—
|
|
|||||||
|
Options exercised
|
—
|
|
(20,832
|
)
|
157
|
|
2.23
|
|
—
|
|
|||||||
|
Balances, June 29, 2013
|
461,334
|
|
961,692
|
|
$
|
4,309
|
|
$
|
5.87
|
|
2.6
|
|
|||||
|
Exercisable at June 29, 2013
|
546,860
|
|
$
|
3,141
|
|
$
|
5.74
|
|
1.8
|
|
|||||||
Additional information regarding options outstanding as of
June 29, 2013
, is as follows:
|
Options/SARs
Outstanding |
Options/SARs
Exercisable |
|||||||||||||||
|
Range of
Exercise Prices |
Number Outstanding
|
Weighted Avg.
Remaining Contractual Life (yrs.) |
Weighted Avg.
Exercise Price |
Number
Exercisable |
Weighted
Avg. Exercise Price |
|||||||||||
|
$1.81 – $2.72
|
15,000
|
|
0.3
|
$
|
2.20
|
|
15,000
|
|
$
|
2.20
|
|
|||||
|
2.73 – 4.09
|
9,860
|
|
3.0
|
3.40
|
|
9,860
|
|
3.40
|
|
|||||||
|
4.10 – 6.15
|
701,666
|
|
2.5
|
5.51
|
|
522,000
|
|
5.89
|
|
|||||||
|
6.16 – 7.44
|
235,166
|
|
4.0
|
7.28
|
|
—
|
|
—
|
|
|||||||
|
$1.81 to $7.44
|
961,692
|
|
2.6
|
$
|
5.87
|
|
546,860
|
|
$
|
5.74
|
|
|||||
The Company also has a defined contribution plan (401(k)) available to U.S. employees who have attained age 21. The Company contributes an amount equal to
100%
of the employee’s contribution on the first
3%
of the employee’s compensation and an additional
50%
of the employee’s contribution on the following
2%
of the employee’s compensation. Company contributions to the plan were approximately
$0.5 million
for each of fiscal years
2013
,
2012
, and
2011
.
8. COMMITMENTS AND CONTINGENCIES
Leases
: The Company had equipment financed through capital leases with a net book value of
$1.7 million
,
$1.9 million
, and
$2.2 million
during fiscal years 2013, 2012, and 2011, respectively. The related depreciation expense was
$0.3 million
for fiscal years 2013 and 2012, and
$0.1 million
for fiscal year 2011. The Company has operating and capital leases for certain equipment and production facilities, which expire at various dates during the next
ten years
.
Future minimum payments under non-cancelable operating and capital leases with initial or remaining terms of one year or more at
June 29, 2013
, are summarized as follows (in thousands):
|
Fiscal Years Ending
|
Operating
Leases |
Capital
Leases |
|||||||
|
2014
|
$
|
1,874
|
|
$
|
588
|
|
|||
|
2015
|
1,898
|
|
—
|
|
|||||
|
2016
|
1,420
|
|
—
|
|
|||||
|
2017
|
881
|
|
—
|
|
|||||
|
2018
|
735
|
|
—
|
|
|||||
|
Thereafter
|
1,718
|
|
—
|
|
|||||
|
Total minimum lease payments
|
$
|
8,526
|
|
$
|
588
|
|
*
|
||
* Includes
$12
of interest.
44
Subsequent to fiscal year 2013, the Company completed the acquisition of Sabre Manufacturing resulting in an additional 66,000 square feet of leased manufacturing space with the lease expiring on August 30, 2016. The operating lease obligation is included in the table above.
On
January 11, 2011
, the Company entered into a capital lease agreement. The term of the capital lease agreement extends to January 2014 with monthly payments of
$16,760
and a fixed interest rate of
3.86%
. At
June 29, 2013
, the outstanding principal balance was
$197,379
under the capital lease agreement and the net book value of the equipment was
$483,788
.
On
April 1, 2011
, the Company entered into two capital lease agreements. The term of the capital lease agreements extends to March 2014 with monthly payments of
$39,445
and
$8,961
, with fixed interest rates of
6.21%
. At
June 29, 2013
, the outstanding principal balances were
$308,336
and
$70,051
under the capital lease agreements. The net book value at
June 29, 2013
for the equipment under the capital lease agreements was
$969,522
and
$171,468
, respectively.
Rental expense under operating leases was approximately
$1.5 million
,
$1.5 million
, and
$2.4 million
during fiscal years
2013
,
2012
, and
2011
, respectively.
Warranty Costs
: The Company provides warranties on certain product sales, and allowances for estimated warranty costs are recorded during the period of sale. The determination of such allowances requires the Company to make estimates of product return rates and expected costs to repair or to replace the products under warranty. The Company establishes warranty reserves based on historical warranty costs for each product line combined with liability estimates based on the prior twelve months’ sales activities.
If actual return rates and/or repair and replacement costs differ significantly from estimates, adjustments to recognize additional cost of sales may be required in future periods.
Components of the reserve for warranty costs during fiscal years
2013
,
2012
, and
2011
were as follows (in thousands):
|
Balances, July 3, 2010
|
$
|
25
|
|
|
Additions
|
158
|
|
|
|
Warranty costs incurred
|
(173
|
)
|
|
|
Balances, July 2, 2011
|
10
|
|
|
|
Additions
|
65
|
|
|
|
Warranty costs incurred
|
(52
|
)
|
|
|
Balances, June 30, 2012
|
23
|
|
|
|
Additions
|
26
|
|
|
|
Warranty costs incurred
|
(40
|
)
|
|
|
Balances, June 29, 2013
|
$
|
9
|
|
Warranty expense for fiscal years
2013
,
2012
and
2011
is related to workmanship claims on keyboards and certain EMS products.
Litigation
: The Company is party to certain lawsuits or claims in the ordinary course of business. The Company does not believe that these proceedings, individually or in the aggregate, will have a material adverse effect on the financial position, results of operations or cash flow of the Company.
Indemnification Rights
: Under the Company’s bylaws, the Company’s directors and officers have certain rights to indemnification by the Company against certain liabilities that may arise by reason of their status or service as directors or officers. The Company maintains director and officer insurance, which may cover certain liabilities arising from its obligation to indemnify its directors and officers and former directors in certain circumstances.
9. FAIR VALUE MEASUREMENTS
The Company has adopted ASC 820,
Fair Value Measurements,
which defines fair value, establishes a framework for assets and liabilities being measured and reported at fair value and expands disclosures about fair value measurements. There are three levels of fair value hierarchy inputs used to value assets and liabilities which include: Level 1 – inputs are quoted market prices for identical assets or liabilities; Level 2 – inputs other than quoted market prices included in Level 1 that are observable for the asset or liability, either directly or indirectly; and Level 3 – inputs are unobservable inputs for the asset or liability. There have been no changes in the fair value methodologies used at
June 29, 2013
and
June 30, 2012
.
45
The following table summarizes the Company’s financial assets and liabilities (only those required to be measured at fair value on a recurring basis) at fair value as of
June 29, 2013
and
June 30, 2012
(in thousands):
|
|
June 29, 2013
|
|||||||||||||||
|
|
Level 1
|
Level 2
|
Level 3
|
Total
Fair Value
|
||||||||||||
|
Financial Assets:
|
||||||||||||||||
|
Foreign currency forward contracts
|
$
|
—
|
|
$
|
2,429
|
|
$
|
—
|
|
$
|
2,429
|
|
||||
|
Financial Liabilities:
|
||||||||||||||||
|
Foreign currency forward contracts
|
$
|
—
|
|
$
|
(434
|
)
|
$
|
—
|
|
$
|
(434
|
)
|
||||
|
|
June 30, 2012
|
|||||||||||||||
|
|
Level 1
|
Level 2
|
Level 3
|
Total
Fair Value
|
||||||||||||
|
Financial Assets:
|
||||||||||||||||
|
Foreign currency forward contracts
|
$
|
—
|
|
$
|
858
|
|
$
|
—
|
|
$
|
858
|
|
||||
|
Financial Liabilities:
|
||||||||||||||||
|
Foreign currency forward contracts
|
$
|
—
|
|
$
|
(1,851
|
)
|
$
|
—
|
|
$
|
(1,851
|
)
|
||||
The Company currently has forward contracts to hedge known future cash outflows for expenses denominated in the Mexican peso. These contracts are measured on a recurring basis based on the foreign currency spot rates and forward rates quoted by banks or foreign currency dealers. These contracts are marked to market using level 2 input criteria every period with the unrealized gain or loss, net of tax, reported as a component of shareholders’ equity in accumulated other comprehensive income, as they qualify for hedge accounting.
The carrying values of cash and cash equivalents, accounts receivable and current liabilities reflected on the balance sheets at
June 29, 2013
and
June 30, 2012
, reasonably approximate their fair value. The Company’s long-term debt primarily consists of a revolving line of credit. Borrowings under this revolving line of credit bear interest at the higher of Wells Fargo Bank prime rate, daily one month London Interbank Offered Rate (LIBOR) plus
1.5%
to
2.5%
, or the Federal Funds rate plus
1.5%
. Each of these rates is a variable floating rate dependent upon current market conditions and the Company’s current credit risk. As a result of the determinable market rate for our revolving credit debt it is classified within Level 2 of the fair value hierarchy. The Company did not have an outstanding balance on the line of credit as of
June 29, 2013
. The discounted cash flow of the revolving line of credit was estimated to be
$15.0 million
as of
June 30, 2012
, which carrying value approximates the fair value.
10. DERIVATIVE FINANCIAL INSTRUMENTS
As of
June 29, 2013
, the Company had outstanding foreign currency forward contracts of
$69.7 million
. These contract maturity dates extend through
September 2016
. As of
June 29, 2013
, the net amount of existing gains expected to be reclassified into earnings within the next 12 months is
$0.4 million
. During the fiscal year ended
June 29, 2013
, the Company entered into
$34.7 million
of foreign currency forward contracts and settled
$22.7 million
of such contracts. During the fiscal year ended
June 30, 2012
, the Company entered into
$41.1 million
of foreign currency forward contracts and settled
$21.2 million
of such contracts. During the fiscal year ended
July 2, 2011
, the Company entered into
$21.7 million
of foreign currency forward contracts and settled
$14.6 million
of such contracts.
Subsequent to
June 29, 2013
, the Company entered into
$5.0 million
of additional foreign currency forward contracts that extended our hedge position through December 2016.
The following table summarizes the fair value of derivative instruments in the Consolidated Balance Sheets as of
June 29, 2013
and
June 30, 2012
(in thousands):
|
June 29, 2013
|
June 30, 2012
|
|||||||||
|
Derivatives Designated as Hedging Instruments
|
Balance Sheet Location
|
Fair Value
|
Fair Value
|
|||||||
|
Foreign currency forward contracts
|
Other current assets
|
$
|
760
|
|
$
|
199
|
|
|||
|
Foreign currency forward contracts
|
Other long-term assets
|
$
|
1,669
|
|
$
|
659
|
|
|||
|
Foreign currency forward contracts
|
Other current liabilities
|
$
|
(145
|
)
|
$
|
(923
|
)
|
|||
|
Foreign currency forward contracts
|
Other long-term liabilities
|
$
|
(289
|
)
|
$
|
(928
|
)
|
|||
46
The following table summarizes the gain (loss) of derivative instruments on the Consolidated Statement of Operations for the fiscal year
2013
(in thousands):
|
Derivatives Designated as Hedging Instruments
|
AOCI Balance
as of June 30, 2012 |
Effective
Portion Recorded In AOCI |
Effective Portion
Reclassified From AOCI Into Cost of Sales |
AOCI Balance
as of June 29, 2013 |
||||||||||||
|
Settled foreign currency forward contracts
|
$
|
(479
|
)
|
$
|
1,060
|
|
$
|
(581
|
)
|
$
|
—
|
|
||||
|
Unsettled foreign currency forward contracts
|
(180
|
)
|
1,493
|
|
—
|
|
1,313
|
|
||||||||
|
Total
|
$
|
(659
|
)
|
$
|
2,553
|
|
$
|
(581
|
)
|
$
|
1,313
|
|
||||
The following table summarizes the gain (loss) of derivative instruments on the Consolidated Statement of Operations for the fiscal year
2012
(in thousands):
|
Derivatives Designated as Hedging Instruments
|
AOCI Balance
as of July 2, 2011 |
Effective
Portion Recorded In AOCI |
Effective Portion
Reclassified From AOCI Into Cost of Sales |
AOCI Balance
as of June 30, 2012 |
||||||||||||
|
Settled foreign currency forward contracts
|
$
|
1,035
|
|
$
|
(1,119
|
)
|
$
|
84
|
|
$
|
—
|
|
||||
|
Unsettled foreign currency forward contracts
|
705
|
|
(1,364
|
)
|
—
|
|
(659
|
)
|
||||||||
|
Total
|
$
|
1,740
|
|
$
|
(2,483
|
)
|
$
|
84
|
|
$
|
(659
|
)
|
||||
The following table summarizes the gain (loss) of derivative instruments on the Consolidated Statement of Operations for the fiscal year
2011
(in thousands):
|
Derivatives Designated as Hedging Instruments
|
AOCI Balance
as of July 3, 2010 |
Effective
Portion Recorded In AOCI |
Effective Portion
Reclassified From AOCI Into Cost of Sales |
AOCI Balance
as of July 2, 2011 |
||||||||||||
|
Settled foreign currency forward contracts
|
$
|
279
|
|
$
|
1,253
|
|
$
|
(1,532
|
)
|
$
|
—
|
|
||||
|
Unsettled foreign currency forward contracts
|
(521
|
)
|
2,261
|
|
—
|
|
1,740
|
|
||||||||
|
Total
|
$
|
(242
|
)
|
$
|
3,514
|
|
$
|
(1,532
|
)
|
$
|
1,740
|
|
||||
As of
June 29, 2013
, the Company does not have any foreign exchange contracts with credit-risk-related contingent features. The Company is subject to the risk of fluctuating interest rates from our line of credit and foreign currency risk resulting from our China operations. The Company does not currently manage these risk exposures by using derivative instruments.
11. ENTERPRISE-WIDE DISCLOSURES
Operating segments are defined as components of an enterprise for which separate financial information is available that is evaluated regularly by the chief operating decision maker, or decision making group, in deciding how to allocate resources and in assessing performance. The Company’s chief operating decision maker is its Chief Executive Officer. As of
June 29, 2013
, the Company operates and internally manages a single operating segment, Electronics Manufacturing Services.
Products and Services
Of the revenues for the years ended
June 29, 2013
,
June 30, 2012
, and
July 2, 2011
, EMS sales and services were
$358.6 million
,
$343.7 million
, and
$249.9 million
, respectively. Keyboard sales for the years ended
June 29, 2013
,
June 30, 2012
, and
July 2, 2011
were
$2.4 million
,
$2.8 million
, and
$3.9 million
, respectively.
47
Geographic Areas
Net sales and long-lived assets (property, plant, and equipment) by geographic area for the years ended
June 29, 2013
,
June 30, 2012
, and
July 2, 2011
are summarized in the following table. Net sales set forth below are based on the shipping destination.
|
Domestic (U.S.)
|
Foreign
(in thousands) |
Total
|
||||||||||
|
2013
|
||||||||||||
|
Net sales
|
$
|
246,059
|
|
$
|
114,974
|
|
$
|
361,033
|
|
|||
|
Long-lived assets
|
$
|
2,045
|
|
$
|
15,866
|
|
$
|
17,911
|
|
|||
|
2012
|
||||||||||||
|
Net sales
|
$
|
205,668
|
|
$
|
140,807
|
|
$
|
346,475
|
|
|||
|
Long-lived assets
|
$
|
1,660
|
|
$
|
15,646
|
|
$
|
17,306
|
|
|||
|
2011
|
||||||||||||
|
Net sales
|
$
|
172,778
|
|
$
|
81,068
|
|
$
|
253,846
|
|
|||
|
Long-lived assets
|
$
|
1,588
|
|
$
|
13,329
|
|
$
|
14,917
|
|
|||
For the year ended
June 29, 2013
,
70.3%
of the Company’s foreign net sales were to customers in Canada,
10.6%
were to Australia,
9.5%
were to Switzerland,
3.2%
were to England,
1.5%
were to New Zealand, and the remaining
4.9%
were spread among customers in other parts of Europe and Asia.
For the year ended
June 30, 2012
,
70.9%
of the Company’s foreign net sales were to customers in Canada,
12.5%
were to Australia,
5.4%
were to Switzerland,
3.9%
were to England,
1.5%
were to New Zealand, and the remaining
5.8%
were spread among customers in other parts of Europe and Asia.
For the year ended
July 2, 2011
,
50.7%
of the Company’s foreign net sales were to customers in Canada,
24.4%
were to Australia,
6.9%
were to Switzerland,
6.1%
were to England,
5.1%
were to New Zealand, and the remaining
6.8%
were spread among customers in other parts of Europe and Asia.
Significant Customers
The percentage of net sales to and trade accounts receivables from significant customers were as follows:
|
|
Percentage of Net
Sales Fiscal Year |
Percentage of
Trade Accounts Receivable Fiscal Year |
|||||||||||||
|
|
2013
|
2012
|
2011
|
2013
|
2012
|
||||||||||
|
Customer A
|
23
|
%
|
29
|
%
|
15
|
%
|
21
|
%
|
30
|
%
|
|||||
|
Customer B
|
21
|
%
|
17
|
%
|
16
|
%
|
13
|
%
|
16
|
%
|
|||||
|
Customer C
|
19
|
%
|
16
|
%
|
16
|
%
|
24
|
%
|
20
|
%
|
|||||
There can be no assurance that the Company’s principal customers will continue to purchase products from the Company at current levels. Moreover, the Company typically does not enter into long-term volume purchase contracts with its customers, and the Company’s customers have certain rights to extend or delay the shipment of their orders. The loss of one or more of the Company’s major customers, or the reduction, delay or cancellation of orders from such customers, could materially and adversely affect the Company’s business, operating results and financial condition.
48
12. QUARTERLY FINANCIAL DATA (Unaudited)
|
|
Year Ended June 29, 2013
|
|||||||||||||||
|
|
First
Quarter
|
Second
Quarter
|
Third
Quarter
|
Fourth
Quarter
|
||||||||||||
|
|
(in thousands, except per share amounts)
|
|||||||||||||||
|
Net sales
|
$
|
97,508
|
|
$
|
94,567
|
|
$
|
84,343
|
|
$
|
84,615
|
|
||||
|
Gross profit
|
9,475
|
|
9,496
|
|
7,860
|
|
7,681
|
|
||||||||
|
Income before income taxes
|
5,580
|
|
5,240
|
|
3,555
|
|
3,480
|
|
||||||||
|
Net income
|
3,744
|
|
3,579
|
|
2,863
|
|
2,397
|
|
||||||||
|
Earnings per common share-basic
|
$
|
0.36
|
|
$
|
0.34
|
|
$
|
0.27
|
|
$
|
0.23
|
|
||||
|
Earnings per common share-diluted
|
$
|
0.35
|
|
$
|
0.33
|
|
$
|
0.26
|
|
$
|
0.22
|
|
||||
|
Weighted average shares outstanding
|
||||||||||||||||
|
Basic
|
10,486
|
|
10,489
|
|
10,489
|
|
10,495
|
|
||||||||
|
Diluted
|
10,830
|
|
10,899
|
|
10,931
|
|
10,946
|
|
||||||||
|
|
Year Ended June 30, 2012
|
|||||||||||||||
|
|
First
Quarter
|
Second
Quarter
|
Third
Quarter
|
Fourth
Quarter
|
||||||||||||
|
|
(in thousands, except per share amounts)
|
|||||||||||||||
|
Net sales
|
$
|
69,761
|
|
$
|
84,454
|
|
$
|
95,527
|
|
$
|
96,733
|
|
||||
|
Gross profit
|
5,005
|
|
6,868
|
|
8,724
|
|
9,239
|
|
||||||||
|
Income before income taxes
|
1,512
|
|
2,671
|
|
4,562
|
|
5,096
|
|
||||||||
|
Net income
|
1,247
|
|
3,174
|
|
3,394
|
|
3,811
|
|
||||||||
|
Earnings per common share-basic
|
$
|
0.12
|
|
$
|
0.30
|
|
$
|
0.32
|
|
$
|
0.36
|
|
||||
|
Earnings per common share-diluted
|
$
|
0.12
|
|
$
|
0.30
|
|
$
|
0.32
|
|
$
|
0.35
|
|
||||
|
Weighted average shares outstanding
|
||||||||||||||||
|
Basic
|
10,418
|
|
10,447
|
|
10,447
|
|
10,474
|
|
||||||||
|
Diluted
|
10,446
|
|
10,479
|
|
10,762
|
|
10,843
|
|
||||||||
49
13. SUBSEQUENT EVENTS
On July 1, 2013, the Company acquired Sabre Assembly & Manufacturing Co. of Texas (“Sabre”), a sheet metal fabrication company with facilities located in Juarez, Mexico. Sabre enables the Company to offer metal fabrication directly to its customers, in combination with plastic molding, PCB assembly, complete product assembly, design engineering and testing engineering services. Under the terms of the transaction, the assets acquired included manufacturing equipment, inventory, customer relationships and non-compete agreements with key employees. No debt or liabilities were assumed. The total cash payment of
$6.0 million
was funded through existing cash. The Company incurred an immaterial amount of costs related to due diligence and closing this acquisition.
The Company has not yet determined the initial purchase price allocation in connection with the Sabre acquisition.
|
Item 9:
|
CHANGES IN AND DISAGREEMENTS WITH ACCOUNTANTS ON ACCOUNTING AND FINANCIAL DISCLOSURES
|
None
|
Item 9A:
|
CONTROLS AND PROCEDURES
|
Evaluation of Disclosure Controls and Procedures
It is the responsibility of our management to establish, maintain, and monitor disclosure controls and procedures that are designed to ensure that information required to be disclosed in our reports filed or submitted under the Securities Exchange Act of 1934 are recorded, processed, summarized, and reported within the time periods specified in the Securities and Exchange Commission rules and forms. Additionally, these disclosure controls include controls and procedures that are designed to accumulate and communicate the information required to be disclosed to our Company’s Chief Executive Officer and Chief Financial Officer, allowing for timely decisions regarding required disclosures. As of the end of the period covered by this report, our management carried out an evaluation, under the supervision and with the participation of the Chief Executive Officer and Chief Financial Officer, of the effectiveness of the design and operation of our disclosure controls and procedures pursuant to Exchange Act Rule 13a-15(f). Based on our assessment, we believe that as of
June 29, 2013
, the Company’s disclosure controls and procedures are effective based on that criteria.
Management’s Report on Internal Control over Financial Reporting
Our management has the responsibility to establish and maintain adequate internal controls over our financial reporting, as defined in Rule 13a-15(f) under the Securities and Exchange Act of 1934. Our internal controls are designed to provide reasonable assurance regarding the reliability of our financial reporting and the preparation of our external financial statements in accordance with generally accepted accounting principles (GAAP).
Due to inherent limitations of any internal control system, management acknowledges that there are limitations as to the effectiveness of internal controls over financial reporting and therefore recognize that only reasonable assurance can be gained from any internal control system. Accordingly, our internal control system may not detect or prevent material misstatements in our financial statements and projections of any evaluation of effectiveness to future periods are subject to the risk that controls may become inadequate because of changes in conditions, or that the degree of compliance with the policies or procedures may deteriorate.
Under the supervision and participation of management, including the Chief Executive Officer and Chief Financial Officer, we have performed an assessment of the effectiveness of our internal controls over financial reporting as of
June 29, 2013
. This assessment was based on the criteria established in Internal Control-Integrated Framework, issued by the Committee of Sponsoring Organizations of the Treadway Commission. Based on our assessment, we believe that as of
June 29, 2013
, the Company’s internal control over financial reporting is effective based on that criteria.
The effectiveness of the Company's internal control over financial reporting as of June 29, 2013 has been audited by BDO USA LLP, an independent registered public accounting firm, as stated in their report which is included herein.
Changes in Internal Control over Financial Reporting
There have been no significant changes in our internal controls over financial reporting during our fourth fiscal quarter ended
June 29, 2013
that have materially affected, or are reasonable likely to materially affect, the Company’s internal control over financial reporting (as defined in Exchange Act Rules 13a – 15(f) and 15d – 15(f)).
50
Report of Independent Registered Public Accounting Firm
Board of Directors and Stockholders
Key Tronic Corporation
Spokane Valley, Washington
We have audited Key Tronic Corporation's internal control over financial reporting as of June 29, 2013, based on criteria established in
Internal Control - Integrated Framework
(1992)
issued by the Committee of Sponsoring Organizations of the Treadway Commission (the COSO criteria). Key Tronic Corporation's management is responsible for maintaining effective internal control over financial reporting and for its assessment of the effectiveness of internal control over financial reporting, included in the accompanying Item 9A “Management's Report on Internal Control over Financial Reporting”. Our responsibility is to express an opinion on the company's internal control over financial reporting based on our audit.
We conducted our audit in accordance with the standards of the Public Company Accounting Oversight Board (United States). Those standards require that we plan and perform the audit to obtain reasonable assurance about whether effective internal control over financial reporting was maintained in all material respects. Our audit included obtaining an understanding of internal control over financial reporting, assessing the risk that a material weakness exists, and testing and evaluating the design and operating effectiveness of internal control based on the assessed risk. Our audit also included performing such other procedures as we considered necessary in the circumstances. We believe that our audit provides a reasonable basis for our opinion.
A company's internal control over financial reporting is a process designed to provide reasonable assurance regarding the reliability of financial reporting and the preparation of financial statements for external purposes in accordance with generally accepted accounting principles. A company's internal control over financial reporting includes those policies and procedures that (1) pertain to the maintenance of records that, in reasonable detail, accurately and fairly reflect the transactions and dispositions of the assets of the company; (2) provide reasonable assurance that transactions are recorded as necessary to permit preparation of financial statements in accordance with generally accepted accounting principles, and that receipts and expenditures of the company are being made only in accordance with authorizations of management and directors of the company; and (3) provide reasonable assurance regarding prevention or timely detection of unauthorized acquisition, use, or disposition of the company's assets that could have a material effect on the financial statements.
Because of its inherent limitations, internal control over financial reporting may not prevent or detect misstatements. Also, projections of any evaluation of effectiveness to future periods are subject to the risk that controls may become inadequate because of changes in conditions, or that the degree of compliance with the policies or procedures may deteriorate.
In our opinion, Key Tronic Corporation maintained, in all material respects, effective internal control over financial reporting as of June 29, 2013, based on the COSO criteria
.
We also have audited, in accordance with the standards of the Public Company Accounting Oversight Board (United States), the consolidated balance sheets of Key Tronic Corporation as of June 29, 2013 and June 30, 2012, and the related consolidated statements of income, comprehensive income, shareholders' equity, and cash flows for each of the three years in the period ended June 29, 2013 and our report dated September 6, 2013 expressed an unqualified opinion thereon.
/s/ BDO USA, LLP
Spokane, Washington
September 6, 2013
|
Item 9B:
|
OTHER INFORMATION
|
None
51
|
Item 10:
|
DIRECTORS, EXECUTIVE OFFICERS AND CORPORATE GOVERNANCE
|
Directors of the Registrant
Information on the nominees for election as Directors of the Company is incorporated by reference from the Company’s definitive proxy statement for the
2013
Annual Meeting of Shareholders to be filed pursuant to Regulation 14A under the Exchange Act no later than 120 days after the end of the Company’s
2013
fiscal year.
Executive Officers of the Registrant
This information is included in a separate item captioned “Executive Officers of the Registrant” in Item 1 of Part 1 of this report pursuant to Instruction G(3) of Form 10-K and Instruction 3 to Item 401(b) of Regulation S-K.
Compliance with Section 16(a) of the Exchange Act:
Incorporated by reference to Key Tronic Corporation’s
2013
Proxy Statement to Shareholders.
Code of Conduct
The Board of Directors has adopted a written Code of Conduct which applies to its directors and employees, including its executive officers. The Code of Conduct is available on the Company’s website at
www.keytronic.com
. The Company intends to disclose on its website any amendments to or waivers of the Code of Conduct.
|
Item 11:
|
EXECUTIVE COMPENSATION
|
Information appearing under the caption “Executive Compensation” in the Company’s
2013
Proxy Statement is incorporated herein by this reference.
52
|
Item 12:
|
SECURITY OWNERSHIP OF CERTAIN BENEFICIAL OWNERS AND MANAGEMENT AND RELATED STOCKHOLDER MATTERS
|
The following table sets forth the aggregate information for the Company’s equity compensation plans in effect as of
June 29, 2013
.
EQUITY COMPENSATION PLAN INFORMATION
|
Plan category
|
Number of securities to
be issued upon exercise
of outstanding options,
warrants, and rights
(a)
|
Weighted-average
exercise price of
outstanding options,
warrants, and rights
(b)
|
Number of securities
remaining available for
future issuance under
equity compensation
plans (excluding
securities reflected in
column (a)
(c)
|
|||||||
|
Equity compensation plans approved by security holders
(1)
|
961,692
|
|
$
|
5.87
|
|
—
|
|
|||
|
Equity compensation plans not approved by security holders
|
—
|
|
$
|
—
|
|
—
|
|
|||
|
Total
|
961,692
|
|
$
|
5.87
|
|
—
|
|
|||
|
(1)
|
Included are the 1,200,000 shares subject to the 2010 Plan, the issuance of which were approved by the shareholders at the 2010 Annual Meeting. As a result of the shareholder approval, the Company made the decision to amend the cash-settled SARs granted during fiscal year 2010 to stock-settled SARs effective October 21, 20
11. Also included are the shares subject to the 1990 Stock Option Plan for Non-Employee Directors.
|
Information under the caption “Beneficial Ownership of Securities” in the Company’s
2013
Proxy Statement is incorporated herein by this reference.
|
Item 13:
|
CERTAIN RELATIONSHIPS AND RELATED TRANSACTIONS, AND DIRECTOR INDEPENDENCE
|
Information appearing under the caption “Related Person Transactions”, “Compensation Committee Interlocks and Insider Participation”, and “Directors’ Independence” in the Company’s
2013
Proxy Statement is incorporated herein by this reference.
|
Item 14:
|
PRINCIPAL ACCOUNTING FEES AND SERVICES
|
Information appearing under the caption “Principal Accountant Fees and Services” in the Company’s
2013
Proxy Statement is incorporated herein by this reference.
|
Item 15:
|
EXHIBITS AND FINANCIAL STATEMENT SCHEDULES
|
(a) 1. FINANCIAL STATEMENTS
|
|
Page in
Form 10-K
|
|
FINANCIAL STATEMENTS
|
|
|
34-50
|
|
53
2. SCHEDULES
|
II. Consolidated Valuation and Qualifying Accounts
|
59
|
|
Other schedules are omitted because of the absence of conditions under which they are required, or because required information is given in the financial statements or notes thereto.
3. EXHIBITS
|
Exhibit No.
|
Description
|
|
3.1
|
Articles of Incorporation, incorporated by reference to the Exhibits to the Company’s form 10-K for the year ended June 30, 1986
|
|
3.2
|
Bylaws, as amended, incorporated by reference to the Exhibits to the Company’s Form 10-K for the year ended June 30, 1986
|
|
10.1*
|
Executive Stock Option Plan, incorporated by reference to Exhibits to the Company’s Form 10-K for the year ended June 30, 1986
|
|
10.2*
|
Amended and Restated 1990 Stock Option Plan for Non-Employee Directors, as amended, incorporated by reference to the Company’s 1997 Proxy Statement (dated October 10, 1997), pages 14-17
|
|
10.3*
|
1995 Executive Stock Option Plan, incorporated by reference to the Company’s 1995 Proxy Statement, pages 19-22
|
|
10.4*
|
2000 Employee Stock Option Plan, incorporated by reference to the Exhibits to the Company’s Form 10-Q for the quarter ended January 1, 2000
|
|
10.5*
|
Officers’ Employment Contracts, incorporated by reference to the Company’s 1998 Proxy Statement, pages 10 and 11
|
|
10.6*
|
Addenda to Officers’ Employment Contracts, incorporated by reference to Exhibits to the Company’s Form 10-Q for the quarter ended January 1, 2000
|
|
10.7*
|
Description of Retention Bonus Plan, incorporated by reference to the Exhibits to the Company’s 10-Q for the quarter ended December 28, 2002
|
|
10.8*
|
Addenda to Officers’ Employment Contracts, incorporated by reference to Exhibits to the Company’s Form 10-K for the year ended June 29, 2002
|
|
10.9
|
Promise to execute a Purchase and Sale Agreement with Key Safety Systems de Mexico, S.A. de C.V., incorporated by reference to the Exhibit to the Company’s Form 8-K filed April 26, 2005
|
|
10.10
|
Summary of material terms and conditions of the Purchase and Sale Agreement with Key Safety Systems de Mexico, S.A. de C.V., incorporated by reference to the Exhibit to the Company’s Form 8-K filed June 6, 2005
|
|
10.11*
|
Summary of Key Tronic Corporation Incentive Compensation Plan, incorporated by reference to Exhibit 10.23 to the Company’s Form 10-K for the year ended July 2, 2005
|
54
|
10.12*
|
Summary of Incentive Compensation Plan Performance goals and Target Payments for fiscal year 2007, incorporated by reference to the Company’s Form 8-K filed July 28, 2006
|
|
10.13*
|
Summary of Fiscal Years 2007 – 2009 Long Term Incentive Plan Performance Measures and Awards, incorporated by reference to the Company’s Form 8-K filed July 28, 2006
|
|
10.14*
|
Summary of Key Tronic Corporation Long Term Incentive Compensation Plan, incorporated by reference to Exhibit 10.1 to the Company’s Form 8-K filed September 27, 2005
|
|
10.15
|
Summary of material terms and conditions of the Purchase and Sale Agreement with Todenko Mexico S.A. de C.V., incorporated by reference to Exhibit 10.1 to the Company’s Form 8-K filed October 12, 2006
|
|
10.16
|
Summary of material terms and conditions of the Purchase and Sale Agreement with Todenko Mexico S.A. de C.V., incorporated by reference to Exhibit 10.1 to the Company’s Form 8-K filed November 20, 2006
|
|
10.17
|
Summary of material terms and conditions of the Sale and Purchase Agreement with Adevco Corporation, incorporated by reference to Exhibit 10.1 to the Company’s Form 8-K filed January 5, 2007
|
|
10.18
|
Summary of Second Amendment to Agreement of Sale and Purchase Agreement with Adevco Corporation, incorporated by reference to Exhibit 10.1 to the Company’s Form 8-K filed April 11, 2007
|
|
10.19*
|
Summary of Incentive Compensation Plan Performance Goals and Target Payments for Fiscal Year 2008 and Fiscal Years 2008-2010 Long Term Incentive Plan Performance Measures and Awards incorporated by reference to the Company’s Form 8-K filed July 27, 2007
|
|
10.20*
|
Summary of Incentive Compensation Plan Performance Goals and Target payments for Fiscal Year 2009 and Fiscal Years 2009 – 2011 Long Term Incentive Plan Performance Measures and Awards incorporated by reference to the Company’s Form 8-K filed July 24, 2008
|
|
10.21*
|
Summary of Incentive Compensation Plan Performance Goals and Target payments for Fiscal Year 2010 and Fiscal Years 2010 – 2012 Long Term Incentive Plan Performance Measures and Awards incorporated by reference to the Company’s Form 8-K filed July 23, 2009
|
|
10.22
|
Financing Agreement with Wells Fargo Bank, N.A., incorporated by reference to the Exhibits to the Company’s Form 8-K filed on August 24, 2009
|
|
10.23*
|
2010 Incentive Plan, incorporated by reference to Exhibit 10.36 to the Company’s Form 10-K for the year ended July 3, 2010
|
|
10.24*
|
Employment Contract with Douglas G. Burkhardt, incorporated by reference to Exhibit 10.37 to the Company’s Form 10-K for the year ended July 3, 2010
|
|
10.25
|
Summary of material terms and conditions of the Purchase and Sale Agreement with Autopartes Y Arneses de Mexico S.A. de C.V., incorporated by reference to Exhibit 10.38 to the Company’s Form 10-K for the year ended July 3, 2010
|
|
10.26*
|
Summary of Incentive Compensation Plan Performance Goals and Target Payments for Fiscal Year 2011 and Fiscal Years 2011 – 2013 Long Term Incentive Plan Performance Measures and Awards incorporated by reference to the Company’s Form 8-K filed July 27, 2011
|
55
|
10.27*
|
Amendment to Employment Contract of Craig D. Gates, dated August 23, 2011; of Ronald F. Klawitter, dated August 23, 2011 and of Douglas G. Burkhardt dated September 6, 2011; incorporated by reference to the Exhibits to the Company’s Form 10-K for the year ended July 2, 2011
|
|
10.28
|
Second Loan Modification Agreement to the Credit Agreement with Wells Fargo Bank, N.A., incorporated by reference to the Exhibits to the Company’s Form 8-K filed on January 30, 2012
|
|
10.29*
|
Amendment to Employment Contract of Craig D. Gates, dated May 10, 2012, and of Douglas G. Burkhardt dated May 10, 2012; incorporated by reference to the Exhibits to the Company’s Form 10-Q filed on May 14, 2012
|
|
10.30*
|
Summary of Incentive Compensation Plan Performance Goals and Target Payments for Fiscal Year 2013 and Fiscal Years 2013 – 2015 Long Term Incentive Plan Performance Measures and Awards incorporated by reference to the Company’s Form 8-K filed August 7, 2012
|
|
10.31*
|
Summary of Incentive Compensation Plan Performance Goals and Target Payments for Fiscal Year 2014 and Fiscal Years 2014 – 2016 Long Term Incentive Plan Performance Measures and Awards incorporated by reference to the Company’s Form 8-K filed August 6, 2013
|
|
21.
|
Subsidiaries of Registrant, submitted herewith
|
|
23.1
|
Consent of Independent Registered Public Accounting Firm, submitted herewith
|
|
31.1
|
Rule 13a-14(a)/15d-14(a) Certification of Chief Executive Officer, submitted herewith
|
|
31.2
|
Rule 13a-14(a)/15d-14(a) Certification of Chief Financial Officer, submitted herewith
|
|
32.1
|
Section 1350 Certification of Chief Executive Officer, submitted herewith
|
|
32.2
|
Section 1350 Certification of Chief Financial Officer, submitted herewith
|
|
101.INS
|
XBRL Instance Document **
|
|
101.SCH
|
XBRL Taxonomy Extension Schema Document **
|
|
101.CAL
|
XBRL Taxonomy Extension Calculation Linkbase Document **
|
|
101.DEF
|
XBRL Taxonomy Extension Definition Linkbase Document **
|
|
101.LAB
|
XBRL Taxonomy Extension Label Linkbase Document **
|
|
101.PRE
|
XBRL Taxonomy Extension Presentation Linkbase Document **
|
|
*
|
Management contract or compensatory plan or arrangement
|
|
**
|
Pursuant to Rule 406T of Regulation S-T, these interactive data files are deemed not filed or part of a registration statement or prospectus for purposes of Sections 11 or 12 of the Securities Act of 1933, as amended, or Section 18 of the Securities and Exchange Act of 1934, as amended and otherwise are not subject to liability under those sections.
|
56
SCHEDULE II
KEY TRONIC CORPORATION AND SUBSIDIARIES
CONSOLIDATED VALUATION AND QUALIFYING ACCOUNTS
FISCAL YEARS ENDED
JUNE 29, 2013
,
JUNE 30, 2012
, AND
JULY 2, 2011
|
2013
|
2012
|
2011
|
||||||||||
|
|
(in thousands)
|
|
||||||||||
|
Allowance for Obsolete Inventory
|
||||||||||||
|
Balance at beginning of year
|
$
|
1,146
|
|
$
|
732
|
|
$
|
1,303
|
|
|||
|
Provisions
|
525
|
|
762
|
|
299
|
|
||||||
|
Dispositions
|
(1,290
|
)
|
(348
|
)
|
(870
|
)
|
||||||
|
Balance at end of year
|
$
|
381
|
|
$
|
1,146
|
|
$
|
732
|
|
|||
|
Allowance for Doubtful Accounts
|
||||||||||||
|
Balance at beginning of year
|
$
|
—
|
|
$
|
111
|
|
$
|
111
|
|
|||
|
Provisions
|
60
|
|
—
|
|
15
|
|
||||||
|
Write-offs
|
(20
|
)
|
(111
|
)
|
(15
|
)
|
||||||
|
Balance at end of year
|
$
|
40
|
|
$
|
—
|
|
$
|
111
|
|
|||
57
SIGNATURES
Pursuant to the requirements of Section 13 or 15(d) of the Securities Exchange Act of 1934, the registrant has duly caused this report to be signed on its behalf by the undersigned, thereunto duly authorized.
Dated:
September 6, 2013
|
KEY TRONIC CORPORATION
|
||
|
By:
|
|
/s/ Craig D. Gates
|
|
|
Craig D. Gates, President and Chief
Executive Officer
(Principal Executive Officer)
|
|
Pursuant to the requirements of the Securities Exchange Act of 1934, this report has been signed below by the following persons on behalf of the registrant and in the capacities and on the dates indicated:
|
/s/ Craig D. Gates
|
|
September 6, 2013
|
|
Craig D. Gates
|
|
Date
|
|
Director and President and Chief Executive Officer
(Principal Executive Officer)
|
|
|
|
/s/ Ronald F. Klawitter
|
|
September 6, 2013
|
|
Ronald F. Klawitter
|
|
Date
|
|
Director and Executive Vice President of Administration, Chief Financial Officer and Treasurer
(Principal Financial Officer)
|
|
|
|
/s/ Brett R. Larsen
|
|
September 6, 2013
|
|
Brett R. Larsen
|
|
Date
|
|
Vice President of Finance and Controller
(Principal Accounting Officer)
|
|
|
|
/s/ James R. Bean
|
|
September 6, 2013
|
|
James R. Bean, Director
|
|
Date
|
|
/s/ Yacov A. Shamash
|
|
September 6, 2013
|
|
Yacov A. Shamash, Director
|
|
Date
|
|
/s/ Patrick Sweeney
|
|
September 6, 2013
|
|
Patrick Sweeney, Director and Chairman of the Board
|
|
Date
|
58
TABLE OF CONTENTS
Part IItem 1. BusinessItem 1A. Risk FactorsItem 1B. Unresolved Staff CommentsItem 2. PropertiesItem 3. Legal ProceedingsItem 4. Mine Safety DisclosuresPart IIItem 5:market For Registrant S Common Equity, Related Shareholder Matters, and Issuer Purchases Of Equity SecuritiesItem 6:selected Financial DataItem 7:management S Discussion and Analysis Of Financial Condition and Results Of OperationsItem 7a:quantitative and Qualitative Disclosures About Market RiskItem 8:financial Statements and Supplementary DataItem 9:changes in and Disagreements with Accountants on Accounting and Financial DisclosuresItem 9a:controls and ProceduresItem 9b:other InformationPart IIIItem 10:directors, Executive Officers and Corporate GovernanceItem 11:executive CompensationItem 12:security Ownership Of Certain Beneficial Owners and Management and Related Stockholder MattersItem 13:certain Relationships and Related Transactions, and Director IndependenceItem 14:principal Accounting Fees and ServicesPart IVItem 15:exhibits and Financial Statement Schedules