KVH INDUSTRIES INC \DE\
10-Ks and 10-Qs
|
|
|
|
|
|
|
|
|
|
|
|
|
|
|
|
|
|
|
|
|
|
|
|
|
|
|
|
|
|
|
|
|
|
|
|
|
|
|
|
|
|
|
|
|
|
|
|
|
|
|
|
|
|
|
|
UNITED STATES
SECURITIES AND EXCHANGE COMMISSION
Washington, D.C. 20549
FORM 10-K
|
(Mark One)
|
|
|
x
|
ANNUAL REPORT PURSUANT TO SECTION 13 OR 15(d) OF THE SECURITIES EXCHANGE ACT OF 1934
|
For the fiscal year ended
December 31, 2017
OR
|
¨
|
TRANSITION REPORT PURSUANT TO SECTION 13 OR 15(d) OF THE SECURITIES EXCHANGE ACT OF 1934
|
For the transition period from
to
Commission File Number 0-28082
KVH Industries, Inc.
(Exact Name of Registrant as Specified in its Charter)
|
Delaware
|
|
05-0420589
|
|
(State or Other Jurisdiction of Incorporation or Organization)
|
|
(I.R.S. Employer Identification Number)
|
50 Enterprise Center, Middletown, RI 02842
(Address of Principal Executive Offices) (Zip Code)
(401) 847-3327
(Registrant’s Telephone Number, Including Area Code)
Securities registered pursuant to Section 12(b) of the Act:
|
Title of Each Class
|
|
Name of Each Exchange on Which Registered
|
|
Common Stock, $0.01 par value per share
|
|
The NASDAQ Stock Market LLC (NASDAQ Global Market)
|
Securities registered pursuant to Section 12(g) of the Act: None
Indicate by check mark if the registrant is a well-known seasoned issuer, as defined in Rule 405 of the Securities Act.
Yes
¨
No
x
Indicate by check mark if the registrant is not required to file reports pursuant to Section 13 or Section 15(d) of the Exchange Act.
Yes
¨
No
x
Indicate by check mark whether the registrant (1) has filed all reports required to be filed by Section 13 or 15(d) of the Securities Exchange Act of 1934 during the preceding 12 months (or for such shorter period that the registrant was required to file such reports), and (2) has been subject to such filing requirements for the past 90 days.
Yes
x
No
¨
Indicate by check mark whether the registrant has submitted electronically and posted on its corporate Web site, if any, every Interactive Data File required to be submitted and posted pursuant to Rule 405 of Regulation S-T during the preceding 12 months (or for such shorter period that the registrant was required to submit and post such files).
Yes
x
No
¨
Indicate by check mark if disclosure of delinquent filers pursuant to Item 405 of Regulation S-K is not contained herein, and will not be contained, to the best of registrant’s knowledge, in definitive proxy or information statements incorporated by reference in Part III of this Form 10-K or any amendment to this Form 10-K.
x
Indicate by check mark whether the registrant is a large accelerated filer, an accelerated filer, a non-accelerated filer, or a smaller reporting company or an emerging growth company. See the definitions of “large accelerated filer,” “accelerated filer,” “smaller reporting company,” and “emerging growth company” in Rule 12b-2 of the Exchange Act. (Check one):
|
Large accelerated filer
o
|
|
Accelerated filer
x
|
|
Non-accelerated filer
o
|
|
Smaller reporting company
o
|
|
(Do not check if a smaller reporting company)
|
|
Emerging growth company
o
|
If an emerging growth company, indicate by check mark if the registrant has elected not to use the extended transition period for complying with any new or revised financial accounting standards provided pursuant to Section 13(a) of the Exchange Act.
o
Indicate by check mark whether the registrant is a shell company (as defined in Rule 12b-2 of the Exchange Act).
Yes
¨
No
x
As of
June 30, 2017
, the aggregate market value of the registrant’s common stock held by non-affiliates of the registrant was
$147,662,889
based on the closing sale price of
$9.50
per share as reported on the NASDAQ Global Select Market. Shares of common stock held by executive officers and directors of the registrant and their affiliates have been excluded from this calculation because such persons may be deemed affiliates. As of
February 28, 2018
, the registrant had
17,525,394
shares of common stock outstanding.
DOCUMENTS INCORPORATED BY REFERENCE
Portions of the registrant’s Proxy Statement relating to its 2018 Annual Meeting of Stockholders are incorporated herein by reference in Part III.
INDEX TO FORM 10-K
|
|
|
Page
|
|
Item 1.
|
||
|
Item 1A.
|
||
|
Item 1B.
|
||
|
Item 2.
|
||
|
Item 3.
|
||
|
Item 4.
|
Mine Safety Disclosures
|
|
|
Item 5.
|
||
|
Item 6.
|
||
|
Item 7.
|
||
|
Item 7A.
|
||
|
Item 8.
|
||
|
Item 9.
|
||
|
Item 9A.
|
||
|
Item 9B.
|
||
|
Item 10.
|
||
|
Item 11.
|
||
|
Item 12.
|
||
|
Item 13.
|
||
|
Item 14.
|
||
|
Item 15.
|
||
|
Item 16.
|
||
2
|
ITEM 1.
|
Business
|
Cautionary Statement Regarding Forward-Looking Information
In addition to historical facts, this annual report contains forward-looking statements. Forward-looking statements are merely our current predictions of future events. These statements are inherently uncertain, and actual events could differ materially from our predictions. Important factors that could cause actual events to vary from our predictions include those discussed in this annual report under the headings “Item 7. Management’s Discussion and Analysis of Financial Condition and Results of Operations,” and “Item 1A. Risk Factors.” We assume no obligation to update our forward-looking statements to reflect new information or developments. We urge readers to review carefully the risk factors described in this annual report and in the other documents that we file with the Securities and Exchange Commission. You can read these documents at
www.sec.gov
.
Additional Information Available
Our principal Internet address is
www.kvh.com
. Our website provides a hyperlink to a third-party website through which our annual, quarterly, and current reports, as well as amendments to those reports, are available free of charge. We believe these reports are made available as soon as reasonably practicable after we electronically file them with, or furnish them to, the SEC. We do not provide any information regarding our SEC filings directly to the third-party website, and we do not check its accuracy or completeness.
Introduction
We are a leading manufacturer of solutions that provide global high-speed Internet, television, and voice services via satellite to mobile users at sea and on land. We are also a leading provider of commercially licensed entertainment, including news, sports, music, and movies, to commercial and leisure customers in the maritime, hotel, and retail markets. In addition, we develop and distribute training films and eLearning computer-based training courses to commercial maritime customers. We are also a premier manufacturer of high-performance navigational sensors and integrated inertial systems for defense and commercial inertial navigation applications. Our reporting segments are as follows:
|
•
|
the mobile connectivity segment and
|
|
•
|
the inertial navigation segment
|
Through these segments, we manufacture and sell our solutions in a number of major geographic areas, including internationally. We generate revenues from various international locations, primarily consisting of Canada, Europe (both inside and outside the European Union), Africa, Asia/Pacific, and the Middle East.
We are headquartered in Middletown, Rhode Island, with active operations in Denmark, Germany, Cyprus, Hong Kong, the State of Illinois, Japan, Norway, Singapore, and the United Kingdom.
3
Our Business Segments
|
Segment
|
Primary Products
|
Major Brands
|
2017 Net Sales
(1)
|
|||||
|
Mobile connectivity
|
Satellite television, phone and internet solutions and media and content delivery solutions
|
TracVision®
TracPhone® CommBox TM Videotel® Mini-VSAT Broadband SM IP-MobileCast TM KVH OneCare TM NEWSLink TM AgilePlans TM |
$
|
132,227
|
|
|||
|
Inertial navigation
|
Digital compass and fiber optic gyro-based navigation and guidance systems
|
TACNAV®
|
27,861
|
|
||||
|
Total
|
$
|
160,088
|
|
|||||
|
(1) Amounts in thousands
|
||||||||
Mobile Connectivity Segment
The mobile connectivity segment primarily manufactures and distributes a comprehensive family of mobile satellite antenna products and services that provide access to television, the Internet and voice services while on the move. Product sales within the mobile connectivity segment accounted for
20%
, 23% and 23% of our consolidated net sales for
2017, 2016, and 2015
, respectively. Sales of mini-VSAT Broadband airtime service accounted for
41%
, 37%, and 35% of our consolidated net sales for
2017, 2016, and 2015
, respectively. Sales of content and training sales within the mobile connectivity segment accounted for
20%
, 20% and 21% of our consolidated net sales for
2017, 2016, and 2015
, respectively.
In the global maritime market, we believe that there is significant demand for mobile access to television, the Internet, voice services, entertainment content, and operational services such as safety training, navigation chart updates, weather services, and voyage optimization. For both maritime and onshore customers that want to access live television while on the move, we offer a comprehensive family of mobile satellite antenna products marketed under the TracVision brand. For access to the Internet and voice services while on the move, which we refer to collectively as our airtime services, we offer a family of mobile satellite antenna products and communication services marketed under the brands TracPhone and mini-VSAT Broadband. The network infrastructure that we have developed to support our airtime services also supports the delivery of other value-added services over our IP-MobileCast content delivery service for both entertainment and operational needs.
Our mobile satellite antenna products use sophisticated robotics, stabilization and control software, sensing technologies, transceiver integration, and advanced antenna designs to automatically search for, identify and point directly at the selected television and communications satellite while the vehicle or vessel is in motion. Our antennas use gyros and inclinometers to measure the pitch, roll and yaw of an antenna platform in relation to the earth. Microprocessors and our proprietary stabilization and control software use that data to compute the antenna movement necessary for the antenna’s motors to point the antenna properly and maintain contact with the satellite. If an obstruction temporarily blocks the satellite signal, our products continue to track the satellite’s location according to the movement of the antenna platform in order to carry out automatic, rapid reacquisition of the signal when a direct line of sight to the satellite is restored.
Our Certified Support Network offers our TracVision and TracPhone customers an international network of skilled technical dealers and support centers in many locations where our customers are likely to travel. We have selected technical dealers based on their technical expertise, professionalism, and commitment to quality, and regularly provide them with extensive training in the sale, installation and support of our products.
4
Maritime
In the marine market, we offer a range of mobile satellite TV, internet access, and communications products.
Satellite TV
. Our TracVision TV-series satellite TV antennas, are designed with the full spectrum of vessel sizes in mind, ranging from recreational vessels as small as 20 to 25 feet to large commercial vessels. The TV-series incorporate an Internet Protocol (IP)-enabled control unit to allow access to system information from any Wi-Fi device. Our family of marine TracVision products includes the 32-cm diameter TracVision TV1, 37-cm diameter TracVision TV3, 45-cm diameter TracVision TV5, 60-cm diameter TracVision TV6, and 81-cm TracVision TV8. These products are compatible with Ku-band HDTV programming as well as high-powered regional satellite TV services around the globe, based on available signal strength and antenna size requirements.
Our TracVision HD-series satellite TV antennas are designed to offer a high definition TV experience comparable to that available to a home DIRECTV HDTV subscriber. Our TracVision HD7 uses a 61-cm diameter satellite TV antenna to receive signals from two DIRECTV Ka-band satellites and one DIRECTV Ku-band satellite simultaneously. It includes an IP-enabled antenna control unit as well as an optional antenna control unit via a free TracVision application for use on an Apple iPhone or iPad. We believe the TracVision HD7 was the first marine antenna to offer this combination of capabilities. Our TracVision HD11 offers a worldwide satellite TV capability through the use of a 1-meter diameter antenna and a global low noise block (LNB) designed for use with the majority of direct-to-home satellite TV services. As a result, it is able to receive all Ku-band and DIRECTV Ka-band satellite television signals without changing out hardware elements. The Ku-band also works with modern satellite television services currently available throughout the world. The Ka-band receives DIRECTV HDTV. Like the TracVision HD7, it features an optional application for the Apple iPhone or iPad to provide easy control of the system.
Satellite Phone and Internet.
Our mini-VSAT Broadband network offers an end-to-end solution for offshore mobile connectivity. This unified C/Ku-band Broadband service enables us to offer commercial, leisure, and government customers an integrated hardware and service solution for mobile communications and seamless region-to-region roaming. We design and manufacture the onboard TracPhone V-IP terminals, own hub equipment installed in leased earth stations, lease the satellite capacity, manage the network through third-party service providers, and provide 24/7/365 after-sale support. Because we manufacture the onboard hardware, we can integrate the full rack of discrete below decks equipment typically used on traditional VSAT systems into a single, streamlined unit that is significantly easier to deploy than competing VSAT solutions. Our mini-VSAT Broadband network utilizes ArcLight spread spectrum modem technology developed by ViaSat. This spread spectrum approach reduces the broadcast power requirements and the pointing accuracy necessary to track the C- and Ku-band satellites that carry the service. The resulting efficiencies allowed us to develop and bring to market our TracPhone V-IP series of terminals. Our 60-cm diameter TracPhone V7-IP Ku-band antenna is 85% smaller by volume and 75% lighter than alternative 1-meter diameter VSAT antennas. Our 37-cm diameter TracPhone V3-IP Ku-band antenna is practical for use on smaller vessels as well as land vehicles. We believe that the TracPhone V3 is the smallest maritime VSAT system currently available. Our dual-mode TracPhone V11-IP antenna seamlessly tracks both C- and Ku-band satellites, making it the only 1-meter diameter maritime VSAT antenna to deliver seamless global coverage outside the far polar regions.
In October 2017, we introduced our new 60-cm diameter TracPhone V7-HTS Ku-band antenna which is designed to deliver faster data speeds globally to the maritime market. We are able to offer download/upload speeds as fast as 10 Mbps/3 Mbps by combining our proprietary antenna system design and industry-leading mini-VSAT Broadband network, along with partnering with Intelsat Epic satellite services for high throughput satellite (HTS) capabilities and additional capacity from SKY Perfect JSAT satellites. With the HTS network, we added an additional 25 million square miles to our global maritime Ku-band high-speed connectivity footprint.
We are actively engaged in sales efforts for the TracPhone V-IP Series and mini-VSAT Broadband service to government agencies for maritime, military, and emergency responder use. In September 2010, the U.S. Coast Guard awarded us a 10-year contract valued at up to $42 million to supply TracPhone V7 systems and mini-VSAT Broadband airtime to as many as 216 U.S. Coast Guard cutters. As of December 31, 2017, we have supplied TracPhone V7 and V7-IP systems for 113 U.S. Coast Guard vessels. We also continue to expand our ability to support the commercial maritime market. For example, in March 2017, we completed the deployment of 99 TracPhone V7-IP systems on Pacific Basin Shipping Limited vessels to support their initiative to modernize ship-to-shore communications on their entire fleet of owned ships.
5
We also offer CommBox, a ship-to-shore network management product that comprises shipboard hardware, a KVH-hosted or privately-owned shore-based hub, and a suite of software applications. CommBox offers a range of tools designed to increase communication efficiency, reduce costs, and manage network operations. Key functions include web and data compression and optimization to increase network capacity; remote PC management for customer IT departments; integrated e-mail, firewalls, and security; least-cost routing; and bandwidth management on multiple communication carriers. We offer the CommBox functionality as an option for all TracPhone V-IP Series products through software accompanying the integrated Commbox modem. We receive subscription fees related to the selected software applications and monthly system maintenance fees. Because we offer CommBox as an integrated solution, we do not generate significant revenue from sales of standalone CommBox hardware.
We also offer Iridium OpenPort hardware and service to be used in conjunction with our mini-VSAT service. Iridium OpenPort service provides data rates up to 128Kbps and covers the entire world, including the polar regions. We offer the Iridium hardware and service along with our own mini-VSAT solution with the integrated CommBox functionality, which will switch over to the Iridium service if the mini-VSAT service is not available. Our customers might choose to add the Iridium service to expand the geographic coverage of the system or as a backup service.
In addition to our TracPhone VSAT products and mini-VSAT Broadband service, we also offer a family of Inmarsat-compatible TracPhone products that provide in-motion access to global satellite communications. These products rely on services offered by Inmarsat, a satellite service provider that supports links for phone, fax, and data communications as fast as 432 Kbps. The TracPhone FB150, FB250, FB500, and FleetOne antennas use the Inmarsat FleetBroadband service to offer voice as well as high-speed Internet service. The TracPhone FB150, FB250, FB500 and FleetOne products are manufactured by Thrane & Thrane A/S of Denmark (acquired by Cobham) and distributed on an OEM basis by us in North America under our TracPhone brand and distributed in other markets on a non-exclusive basis.
Unlike mini-VSAT Broadband, where we control and sell the airtime, we purchase Inmarsat and Iridium airtime directly from these companies and resell it to our customers.
Land Mobile
We design, manufacture, and sell a range of TracVision satellite TV antenna systems for use on a broad array of vehicles, including recreational vehicles, buses, conversion vans, and automobiles.
In the RV and bus markets, we offer TracVision satellite TV products, intended for both stationary and in-motion use. Our TracVision R1 delivers DIRECTV or DISH network service through a small 32-cm diameter dome. Our TracVision A9 uses hybrid phased-array antenna technology to provide in-motion reception of satellite TV programming in the continental United States using either the DIRECTV or DISH Network services. The TracVision A9 stands approximately five inches high and mounts either to a vehicle’s roof rack or directly to the vehicle’s roof, making it practical for use aboard minivans, SUVs and other passenger vehicles. The TracVision A9 includes a mobile satellite television antenna and an IP-enabled TV hub for easy system configuration and control via Wi-Fi devices, such as an Apple iPhone or iPad. The TracVision A9 is also suitable for tall motor coaches and buses. Automotive customers subscribe to DIRECTV’s TOTAL CHOICE MOBILE satellite TV programming package, which is specifically promoted for automotive applications, or to DISH Network programming.
6
Airtime Services
In addition to our mobile satellite antenna hardware and software, we offer airtime plans that enable customers to obtain Internet and voice services. We offer a variety of rate plans that typically require an initial commitment of one or more years with a one-year auto-renewal feature. Since October 2015, we have offered mini-VSAT Broadband 2.0, our second generation mini-VSAT service. The key features of the mini-VSAT Broadband 2.0 service are usage-based airtime plans, a new network management portal and a new comprehensive global customer support program. Our usage-based plans, which are designed around each vessel's monthly data requirements for operational and crew needs, deliver data at higher speeds. Our network management portal, myKVH, is a secure portal that enables a ship operator to manage network usage by vessel or by individual crew members by allocating operational and crew data caps while receiving customized usage alerts. For customers that want the certainty of a fixed monthly price, we offer fixed rate plans that vary depending on data speeds and include protocol restrictions, such as limiting streaming of video content. User speeds are also restricted but not stopped when users reach established data use thresholds. In addition, we offer multiple usage plans that are either billed monthly based on the data consumed without any application or protocol blocking or based on a monthly minimum data quota with the option to add more data for an incremental charge. The TracPhone V3-IP requires a usage-based plan while the TracPhone V7-IP and V11-IP can support any plan.
In April 2017, we launched a new mini-VSAT Broadband service offering, AgilePlans. AgilePlans is our all-inclusive connectivity-as-a-service, or CaaS, usage-based pricing model for commercial maritime customers of our mini-VSAT broadband service. Under this CaaS model, we charge subscribers a monthly fee in exchange for which we provide satellite communication hardware, shipping and installation, maintenance and support, airtime and voice services, a service management portal and certain basic content services with no minimum commitment. We offer AgilePlans customers a variety of airtime data plans with varying data speeds and fixed data usage levels with overage charges per megabyte, which is similar to the plans that we offer to our other customers. Under this new model, we retain ownership of our satellite equipment and do not sell it to subscribers, who must return the hardware to us when they terminate our service. We anticipate that, to the extent that customers adopt this new subscription model, our revenues from product sales will decline, and our provision of this equipment to subscribers will increase our capital expenditures, which over time will increase our costs of product sales as we depreciate these assets.
The high bandwidth speeds offered by the Ku-band satellites also permits faster data rates than those supported by Inmarsat’s L-band satellites. TracPhone V11-IP customers may select service packages with Internet data connections offering shore-to-ship satellite data rates as fast as 4 megabits per second, or Mbps, and ship-to-shore satellite data rates as fast as 1 Mbps. The V7-IP offers shore-to-ship satellite data rates as fast as 3 Mbps and ship-to-shore data rates as fast as 512 kilobits per second, or Kbps. The TracPhone V3-IP, due to its smaller dish diameter, offers shore-to-ship satellite data rates as fast as 2 Mbps and ship-to-shore data rates as fast as 128 Kbps. In addition, subscriptions include Voice over Internet Protocol (VoIP) telephone services designed for use over satellite connections. The TracPhone V11-IP and V7-IP can support two or more simultaneous calls while the TracPhone V3-IP can support one call at a time.
Our mini-VSAT Broadband network currently uses a combination of 23 Ku-band transponders, of which we own 14, and three global C-band transponders, all of which we own, on 19 satellites to provide Ku-band coverage throughout the northern hemisphere and around the continents in the southern hemisphere, and C-band coverage world-wide. It is our long-term plan to continue to maintain and enhance our mini-VSAT Broadband network. Under the terms of our revenue sharing arrangement with ViaSat, expansions of our ViaSat network position us to earn revenue not only from the maritime and land-based use of the mini-VSAT Broadband service but also from aeronautical platforms that roam throughout our network.
In June 2015, we implemented a global private multiprotocol label switching (MPLS) network connecting all of our teleports and satellite beams in order to increase security, enhance quality of service and increase network reliability and uptime for our customers.
In October 2017, we launched our next-generation, advanced maritime broadband network with Intelsat. The HTS high-speed overlay to our current mini-VSAT Broadband service triples, and in some cases increases by a multiple of six, the data speeds for maritime customers. At the core of its capabilities, our advanced maritime broadband network incorporate Intelsat Epic satellite services and the award-winning IntelsatOne Flex platform, a global managed service designed to optimize bandwidth allocations and provide flexible coverage where it is needed. Our mini-VSAT Broadband network also benefits from increased Asian satellite capacity acquired from SKY Perfect JSAT.
In addition, we offer professional services for our VSAT products that include network design, installation of onboard TracPhone terminals and custom configuration of the CommBox based on customer requirements. These services are performed by our employees as well as a dealer network of certified engineers.
7
Content and Training Services
As part of our mobile communications segment, we offer a variety of value-added services to our maritime customers as well as news content to our hotel customers and radio content to a small number of retail customers. The vast majority of these value-added services are subscription-based.
In May 2013, we acquired Headland Media Limited (now known as KVH Media Group), a media and entertainment service company based in the United Kingdom that distributes commercially licensed entertainment, including news, sports, music, and movies, to commercial and leisure customers in the maritime, hotel, and retail markets. Sales from KVH Media Group are included in our mobile broadband service sales. Our "news from home" digital newspaper service includes more than 100 daily newspapers in more than 20 languages that at the end of 2017 was delivered to more than 10,000 commercial ships, hotels, and cruise ships. The digital content can be printed onboard or viewed on a tablet, smartphone, or laptop. For movie content, we are an approved distributor of licensed content for certain major Hollywood, Bollywood, and independent studios. For television content, we are an approved distributor for certain major TV studios worldwide.
In July 2014, we acquired Videotel Marine Asia Limited and Super Dragon Limited (together referred to as Videotel), a leading provider of high-quality training films and eLearning services for the commercial maritime industry. Servicing close to 12,000 fielded training systems at the end of 2017, Videotel offers video, animation, eLearning computer-based training and interactive distance learning services through its Videotel Performance Manager service, which includes its Practical Engineer suite of content. Certification and refresher courses are mandated by international regulations. Sales from Videotel are included in our mobile connectivity service sales.
We offer a content delivery service called IP-MobileCast through which content and data files are transmitted using multicast technology across our global satellite network to every vessel or mobile vehicle that has an active, compatible TracPhone V series or V-IP series terminal. The content is either stored on the terminal itself or on a KVH-supplied media server, which is required for digital rights managed content such as movies and Videotel content. This delivery mechanism reduces the amount of bandwidth required to transmit large files to a large population of customers. Before multicasting, large data files were generally transmitted across satellite networks “on demand” or unicast, which consumes significant bandwidth. Moreover, copyright law requires permission from the rights holder for exhibitions of copyrighted film and television. Historically, studios have granted KVH Media Group permission to license non-theatrical exhibitions aboard ships. While traditionally we have licensed this content to commercial maritime customers primarily through the distribution of DVDs, we have now also automated the transmission of this type of entertainment via IP-MobileCast.
Customers that subscribe to one of our entertainment packages generally receive a variety of movie and television content that is cached locally onboard with unlimited onboard viewing for a year. We transmit approximately 400 local "news from home" segments in a variety of languages on a monthly basis, at least 20 movies a month plus daily sports and news clips and special programming such as the highlights of sporting events.
We also offer a variety of operational services through IP-MobileCast. Subscribers to the Videotel training and eLearning content can also receive new content over the IP-MobileCast network through TRAININGlink, whereby customers receive new content more frequently than once a year. As part of our CHARTlink service, we transmit electronic chart updates for ECDIS solution providers Transas and Jeppesen. For our FORECASTlink service, we transmit global forecasts and high-resolution weather data provided by AWT. Our charting and weather forecasting services provide critical content for voyage optimization.
8
Inertial Navigation Segment
We offer a portfolio of digital compass and fiber optic gyro (FOG)-based systems that address the rigorous requirements of military and commercial customers. Our systems provide reliable, easy-to-use and continuously available navigation and pointing data. Our guidance and stabilization products include our FOG-based inertial measurement units (IMUs) for precision guidance, FOGs for tactical navigation as well as pointing and stabilization systems, and digital compasses that provide accurate heading information for demanding applications. Sales of FOG-based guidance and navigation systems within the inertial navigation segment accounted for
13%
, 10%, and 10% of our consolidated net sales for
2017, 2016, and 2015
, respectively. Sales of tactical guidance and navigation systems within the inertial navigation segment accounted for 3%, 8%, and 8% of our consolidated net sales for
2017, 2016, and 2015
, respectively.
Guidance and Stabilization
Our high-performance digital signal processing (DSP)-based FOG products use an all-fiber design that has no moving parts, resulting in an affordable combination of precision, accuracy, and durability. Our FOG products support a broad range of military applications, including stabilization of remote weapons stations, antennas, radar, optical devices, or turrets; image stabilization and synchronization for shoulder-or tripod-mounted weapon simulators; precision tactical navigation systems for military vehicles, and guidance for weapons and unmanned autonomous vehicles. Our FOG products are also used in numerous commercial products, such as navigation and positioning systems for various applications including precision mapping, dynamic surveying, autonomous vehicles, train location control and track geometry measurement systems, industrial robotics, and optical stabilization.
The CG-5100, our first commercial-grade IMU, is suitable for a wide range of applications such as 3D augmented reality, mobile mapping, platform navigation, and GPS augmentation for unmanned vehicle programs, precise mapping, and imagery.
Our CNS-5000 continuous navigation system is a self-contained navigation system that combines our FOG-based inertial measurement technology with GPS technology from NovAtel. This navigation solution provides precise position and orientation of a host platform on a continuous basis, even during periods where GPS signals are blocked by natural or man-made obstructions or conditions. The CNS-5000 is designed for demanding commercial applications, such as dynamic surveying, mobile mapping, precision agriculture, container terminal management, and autonomous vehicle navigation, where the ability to determine the precise position and orientation of a piece of equipment or a mobile platform is critical. The CNS-5000 is a commercial-off-the-shelf (COTS) product consisting of a FOG-based inertial measurement unit tightly integrated with GPS within a single enclosure. This design reduces the operational complexities for customers whose products cross international boundaries.
Our open-loop DSP-1750, DSP-3000, and DSP-4000 FOGs provide precision measurement of the rate and angle of a platform’s turning motion for significantly less cost than competing closed-loop gyros. These DSP-based products deliver performance superior to analog signal processing devices, which experience greater temperature-sensitive drift and rotation errors. Applications for these products include inertial measurement units, integrated navigation systems, attitude/heading/reference systems, and stabilization of antenna, radar, and optical equipment.
The DSP-1750, which we believe to be the world’s smallest high-performance FOG, uses our E
·
Core
TM
ThinFiber technology. This thin fiber, which is created at our Tinley Park, Illinois manufacturing facility, is only 170 microns in diameter, enabling longer lengths of fiber to be wound into smaller housings. Since the length of the fiber used in a FOG directly relates to gyro accuracy and performance, this technology enables us to produce smaller and more accurate gyros. The small size and weight of the DSP-1750 make it well suited for applications with size and weight restrictions, such as night vision and thermal imaging systems, aircraft-mounted gimbaled cameras for law enforcement and homeland security, and shipboard optical systems.
Our DSP-1760 single-axis and multi-axis FOGs offer improved performance and ease of integration relative to the DSP-1750. Many customers using our DSP-1750 single-axis and dual-axis FOGs also had requirements for packaged DSP-1750s. To address this demand, we introduced the DSP-1760 product line, consisting of packaged one, two, or three axes of FOGs, each with two different interface connector options.
9
The DSP-3000, DSP-3100, and DSP-3400 are each slightly larger than a deck of playing cards and offer
s
a variety of interface options to support a range of applications. High-performance 2-axis and 3-axis configurations can be realized by integrating multiple DSP-3000 and DSP-3100 units. Currently, the DSP-3000, DSP-3100, and DSP-3400 are used in an array of pointing and stabilization applications, including the U.S. Army’s Common Remotely Operated Weapon Station (CROWS) to provide the image and gun stabilization necessary to ensure that the weapon remains aimed at its target. We estimate that more than 20 companies have developed or are developing stabilized remote weapons stations that we believe will require similar FOG stabilization capabilities. The larger, militarized dual axis DSP-4000 is designed for use in high-shock and highly dynamic environments, such as gun turret stabilization.
Our 1750 IMU is an advanced 6-degrees-of-freedom sensor designed to integrate easily into the most demanding stabilization, pointing, and navigation applications. It offers enhanced performance at a lower cost than competing systems. The 1750 IMU marries the E·Core ThinFiber technology of our DSP-1750 FOGs with very low noise, solid state MEMS accelerometers to create a commercial-off-the-shelf IMU. Our 1775 IMU and 1725 IMU products complement the 1750 IMU and provide customers with a range of choices for advanced 6-degrees-of-freedom sensors. The family of IMUs offers exceptional precision in a very small form factor, making them suitable for applications where space is limited, such as manned and unmanned commercial and defense platforms, optical equipment stabilization systems, pipeline inspection equipment, and autonomous vehicle control and navigation systems.
In January 2016, we introduced the GEO-FOG 3D and GEO-FOG 3D Dual inertial navigation systems that offers roll, pitch and heading accuracies of 0.05 degrees for demanding applications in unmanned, autonomous and manned aerial platforms. These systems combine our 1750 IMU technology with centimeter-level precise GNSS receivers, a 3-axis magnetometer and a barometric pressure sensor.
Tactical Navigation
Our TACNAV® tactical navigation product line employs digital compass sensors and KVH FOGs to offer vehicle-based navigation and pointing systems with a range of capabilities, including GPS backup and enhancement, vehicle position, hull azimuth and navigation displays. Because our digital compass products measure the earth’s magnetic field rather than detect satellite signals from the GPS, they are not susceptible to GPS jamming devices.
TACNAV systems vary in size and complexity to suit a wide range of vehicles. Our TACNAV Light, including a version with embedded GPS, is low-cost, digital compass-based battlefield navigation system specifically designed for non-turreted vehicles, such as high mobility multi-wheeled vehicles (HMMWVs) and trucks.
Our TACNAV TLS, a digital compass-based tactical navigation and targeting system, offers a FOG upgrade for enhanced accuracy designed for turreted vehicles, including reconnaissance vehicles, armored personnel carriers, and light armored vehicles. Our TACNAV II Fiber Optic Gyro Navigation system offers a compact design, continuous output of heading and pointing data, and a flexible architecture that allows it to function as either a stand-alone navigation module or as the central component of an expanded, multifunctional navigation system. Our FOG-based TACNAV 3D product provides full three-dimensional navigation. The TACNAV 3D is fitted with an Iridium transceiver to transmit and receive vehicle position, waypoint, and target location to or from a command center or other vehicle. The system also allows messages to be received from battlefield management systems. The TACNAV Moving Map Display offers real-time moving map technology and an easy-to-use graphical navigation capability for military vehicles. It is compatible with existing and future TACNAV systems, provides a high-bright display for outdoor viewing, and dims to support low-light tactical operations.
Our navigation systems function as standalone tools and also aggregate, integrate, and communicate critical information from a variety of on-board systems. TACNAV can receive data from systems such as the vehicle’s odometer, military and commercial GPS devices, laser rangefinders, turret angle indicators and laser warning systems. TACNAV can also output this data to an on-board computer for retransmission through the vehicle’s communications systems to a digital battlefield management application.
Our TACNAV digital compass products have been sold for use aboard U.S. Army, Marine Corps, and Navy vehicles as well as to many foreign countries, including Australia, the United Kingdom, Canada, Germany, Italy, New Zealand, Saudi Arabia, Spain, Sweden, Taiwan, Malaysia, and Switzerland. We believe that we are among the leading manufacturers of such systems. Our standard TACNAV products can be customized to our customers’ specifications. At customer request, we offer training and other services on a time-and-materials basis.
10
Value-Added Services
Our value-added services for the inertial navigation market include engineering and program management services, product repairs, and engineering services provided under development contracts.
Sales, Marketing and Support
Our sales, marketing and support efforts target markets that are substantial and complex, and require in many cases networks of intermediaries, such as dealers, distributors, airtime service providers, and manufacturers' representatives, to reach our ultimate customers. These sales channels vary and evolve from time to time, but currently include targeted efforts to reach the commercial and leisure maritime markets; the recreational vehicle (RV), high-end automotive and bus markets; and the commercial, industrial, and government markets. As our business evolves, we may pursue additional sales channels, including direct sales, in various markets. We believe our brands are well known and well respected by customers within their respective niches. These brands include:
|
•
|
TracVision - satellite television systems for vessels and vehicles
|
|
•
|
TracPhone - two-way satellite communications systems
|
|
•
|
mini-VSAT Broadband - hardware, software, content and content delivery for mobile satellite communications network
|
|
•
|
IP-MobileCast - content delivery service
|
|
•
|
NEWSlink - maritime news delivery service through a variety of means
|
|
•
|
SPORTSlink - sporting content delivered through a variety of means
|
|
•
|
TVlink - television programming delivered through a variety of means
|
|
•
|
MOVIElink - movie distribution through a variety of means
|
|
•
|
Videotel - maritime eLearning content and related services
|
|
•
|
CommBox - network management hardware and software for maritime communications
|
|
•
|
TACNAV - tactical navigation systems for military vehicles
|
|
•
|
KVH OneCare - services and support for the mini-VSAT Broadband solution
|
|
•
|
AgilePlans by KVH- Connectivity as a Service Program
|
We sell our mobile connectivity products directly and through an international network of independent retailers, chain stores and distributors, as well as to manufacturers of vessels and vehicles.
We sell news, sports, and entertainment media content directly through our KVH Media Group, headquartered in Leeds, England, and our training and eLearning content directly though our Videotel group, which is located in London, England, and Hong Kong.
Our European headquarters, which is located in Denmark, coordinates our sales, marketing, and support efforts for our mobile connectivity products in Europe, the Middle East, and Africa. Asian sales are managed through our offices located in Singapore. All international offices are managed under the oversight of our Chief Operating Officer. See Note 12 of the notes to our consolidated financial statements for information regarding our segments.
We sell our inertial navigation products directly to U.S. and foreign governments and government contractors, as well as through an international network of authorized independent sales representatives. This network also sells our FOG products to commercial and industrial customers.
11
Backlog
Backlog is not a meaningful indicator for predicting revenue in future periods. Commercial resellers for our mobile connectivity products and legacy products do not carry extensive inventories and rely on us to ship products quickly. Generally, due to the rapid delivery of our commercial products, our backlog for those products is not significant.
Our backlog for all products and services was $16.3 million, $8.9 million, and $19.8 million on December 31,
2017, 2016, and 2015
, respectively. As of December 31, 2017, $14.1 million of our backlog was scheduled for fulfillment in 2018 and $2.2 million was scheduled for fulfillment in 2019 through 2025. The increase in backlog of $7.4 million from December 31, 2016 to December 31, 2017 was primarily the result of a $6.0 million increase in FOG product orders, a $2.3 million increase in contracted engineering services, and a $0.9 million increase in TACNAV product orders, partially offset by a $1.8 million decrease in mobile connectivity product orders. The decrease in backlog of $10.9 million from December 31, 2015 to December 31, 2016 was primarily the result of the fulfillment of various TACNAV and FOG product orders.
Backlog consists of orders evidenced by written agreements and specified delivery dates for customers who are acceptable credit risks. We do not include satellite connectivity or media content service sales in our backlog even though many of our satellite connectivity and media content customers have signed annual or multi-year service contracts providing for a fixed monthly fee. Military orders included in backlog are generally subject to cancellation for the convenience of the customer. When orders are canceled, we generally recover actual costs incurred through the date of cancellation and the costs resulting from termination. As of December 31, 2017, our backlog included $10.3 million in orders that are subject to cancellation for convenience by the customer. Individual orders for inertial navigation products are often large and may require procurement of specialized long-lead components and allocation of manufacturing resources. The complexity of planning and executing larger orders generally requires customers to order well in advance of the required delivery date, resulting in backlog.
Intellectual Property
Our ability to compete effectively depends to a significant extent on our ability to protect our proprietary information. We rely primarily on patent, copyright and trade secret laws, confidentiality procedures, and licensing arrangements to protect our intellectual property rights. We own 22 U.S. and foreign patents and have 15 additional patent applications that are currently pending. We also register our trademarks in the United States and other key markets where we do business. Our patents will expire at various dates between July 2018 and November 2034. We enter into confidentiality agreements with our consultants, key employees, and sales representatives and maintain controls over access to and distribution of our technology, software, and other proprietary information. The steps we have taken to protect our technology may be inadequate to prevent others from using what we regard as our technology to compete with us.
We do not generally conduct exhaustive patent searches to determine whether the technology used in our products infringes patents held by third parties. In addition, product development is inherently uncertain in a rapidly evolving technological environment in which there may be numerous patent applications pending, many of which are confidential when filed, with regard to similar technologies.
From time to time, we have faced claims by third parties that our products or technologies infringe their patents or other intellectual property rights, and we may face similar claims in the future. Any claim of infringement could cause us to incur substantial costs defending against or settling the claim, even if the claim is invalid, and could distract the attention of our management. If any of our products is found to violate third-party proprietary rights, we may be required to pay substantial damages. In addition, we may be required to re-engineer our products or seek to obtain licenses from third parties to continue to offer our products. Any efforts to re-engineer our products or obtain licenses on commercially reasonable terms may not be successful, which would prevent us from selling our products, and, in any case, could substantially increase our costs and have a material adverse effect on our business, financial condition, and results of operations.
12
Manufacturing
Manufacturing operations for our mobile satellite communications and navigation products consist of light manufacture, final assembly and testing. Manufacturing operations for our FOG products are more complex. We produce specialized optical fiber, FOG components and sensing coils and combine them with components purchased from outside vendors for assembly into finished goods. These finished goods undergo extensive calibration and verification over temperature and rotation before shipping to customers. We own optical fiber drawing towers with which we produce the specialized optical fiber that we use in all of our FOG products. Excluding the CommBox product, which we manufacture in Norway, we manufacture, warehouse and distribute our mobile satellite communications products at our facilities in Middletown, Rhode Island. We manufacture our navigation and FOG products in our facility located in Tinley Park, Illinois. Our manufacturing processes are controlled by an ISO 9001:2008-certified quality standards program.
For subscribers of the Videotel maritime safety video and computer-based training modules, we provide computer hardware preloaded with the content, a VOD kiosk, which is updated at least annually by flash drive. We use two contract manufacturers in the United Kingdom to supply the VOD kiosks.
Raw Materials, Components and Services
We purchase raw materials and most of the components used in our various manufacturing processes, such as printed circuit boards, injection-molded plastic parts, machined metal components, connectors and housings. In addition, we purchase certain services, predominantly networking and mobile broadband services, to support the delivery of our mobile communications solutions.
The materials, molds and dies, subassemblies and components purchased from other manufacturers, and other materials and supplies used in our manufacturing processes have generally been available from a variety of sources. We believe there are a number of acceptable vendors for the components we purchase. We regularly evaluate both domestic and foreign suppliers for quality, dependability and cost effectiveness. From time to time the cost and availability of materials and services is affected by the demands of other industries, among other factors. Whenever practical, we seek to establish multiple sources for the purchase of raw materials, components and services to achieve competitive pricing, maintain flexibility, and protect against supply disruption. When possible, we employ a company-wide procurement strategy designed to reduce the purchase price of materials, purchased components and services.
For reasons of quality assurance, scarcity or cost effectiveness, certain components and raw materials used in the manufacturing of our products, as well as certain services utilized in the delivery of our solutions, are available only from a limited number of suppliers or from a sole source supplier. We work with our suppliers to develop contingency plans intended to assure continuity of supply while maintaining high quality and reliability, and in some cases, we have established long-term supply contracts with our suppliers. Due to the nature of certain raw materials, purchased components and services, we may not be able to quickly establish additional or replacement sources for certain components, materials or services. In the event that we are unable to obtain sufficient quantities of raw materials or components or unable to obtain sufficient access to the services needed to deliver our solutions on commercially reasonable terms or in a timely manner, our ability to manufacture and deliver our products and services on a timely and cost-competitive basis may be compromised, which may have a material adverse effect on our business, financial condition and results of operations. To date, we have not experienced any material adverse effect on our financial condition or results of operations due to supplier limitations.
13
Competition
We encounter significant competition in the markets we serve, and we expect this competition to intensify in the future. Many of our primary competitors are well-established companies and some have substantially greater financial, managerial, technical, marketing, operational, and other resources than we do.
In the marine market for satellite TV equipment, we compete primarily with Intellian, Cobham SATCOM, Orbit Communication Systems, RayMarine (Intellian made), KNS, and Sea King (King Controls).
In the marine market for voice, fax, data, and Internet communications equipment, we compete primarily with Intellian, Cobham SATCOM, Orbit Communication Systems, Jotron AS, KNS Inc., Inmarsat, AddValue, and Iridium Satellite LLC.
In the marine market for high-speed voice, fax, data, and Internet services, we compete primarily with Inmarsat, Marlink, Speedcast, and Global Eagle Entertainment. We also face competition from providers of low-speed data services, which include Inmarsat, Globalstar LP, and Iridium Satellite LLC.
In the market for land mobile satellite TV equipment, we compete primarily with King Controls and Winegard Company.
In the markets for media content, we compete primarily with Swank Motion Pictures and Newspapersdirect Inc.
In the markets for safety and eLearning content, we compete primarily with Seagull AS.
In the markets for mobile satellite connectivity technology, the principal competitive factors are product size, features, design, performance, reliability, and price. In the markets for airtime services, the principal competitive factors are geographic coverage, data speed, value-added services, and price. In the markets for media content, the principal competitive factors are license rights, distribution, and price.
In the inertial navigation markets, we compete primarily with Honeywell International Inc., Northrop Grumman Corporation, Goodrich Aerospace, IAI, Fizoptica, SAGEM, and Systron Donner Inertial. We believe the principal competitive factors in these markets are performance, size, reliability, durability, and price.
Although we believe that we compete favorably with respect to these factors, there can be no assurance that we will continue to do so. We encounter substantial competition in most of our product lines, although no single competitor competes with us across all product lines.
14
Research and Development
Focused investments in research and development are critical to our future growth and competitive position in the marketplace. Our research and development efforts are directly related to timely development of new and enhanced products and services that are central to our core business strategy. The industries in which we compete are subject to rapid technological developments, evolving industry standards, changes in customer requirements, and new product and service introductions and enhancements. As a result, our success depends in part upon our ability, on a cost-effective and timely basis, to continue to enhance our existing products and to develop and introduce new products and services that improve performance and meet customers’ operational and cost requirements. Our current research and development efforts include projects to achieve additional cost reductions in our products and the development of new products and services for our existing marine and land mobile communications markets, and navigation, guidance, and stabilization application markets. For example:
|
•
|
We released the DSP-1760 Unhoused Multi-Axis FOG, which provides more flexibility for our customers to build navigation and stabilization systems
|
|
•
|
We released the TracPhone V7-HTS in October 2017, which works with our high throughput satellite (HTS) services to provide higher speed Internet services to our customers
|
|
•
|
We released the TACNAV Moving Map Display to provide more capability to our TACNAV customers who use our dead-reckoning systems to operate in GPS-denied environments
|
|
•
|
We made significant developments on our Photonics Integrated Chip, a key component in a low-cost FOG for the self-driving automobile market
|
Our research and development activities consist of projects funded by us and projects funded with the assistance of customer-funded contract research. Our customer-funded research efforts are made up of contracts with defense and OEM customers, whose performance specifications are unique to their product applications. Defense and OEM research often results in new product offerings. We strive to be the first company to bring a new product to market, and we use our own funds to accelerate new product development efforts.
Our research and development costs were
$15.9 million
, $16.0 million, and $14.0 million for
2017, 2016, and 2015
, respectively, and represented
10%
,
9%
, and 8% of consolidated net sales for
2017, 2016, and 2015
, respectively.
Government Regulation
Our manufacturing operations are subject to various laws governing the protection of the environment and our employees. These laws and regulations are subject to change, and any such change may require us to improve our technologies, incur expenditures, or both, in order to comply with such laws and regulations.
We are subject to compliance with the U.S. Export Administration Regulations. Some of our products have military or strategic applications and are on the Munitions List of the U.S. International Traffic in Arms Regulations. These products require an individual validated license to be exported to certain jurisdictions. The length of time involved in the licensing process varies and can result in delays of the shipping of the products. Sales of our products to either the U.S. government or its prime contractors are subject to the U.S. Federal Acquisition Regulations.
We are also subject to the laws and regulations of the U.S. and foreign jurisdictions in which we offer and sell our satellite communication products and services, including those of the European Union, Brazil, Norway, Singapore, and Japan. These laws and regulations, as well as the interpretation and application of these laws and regulations, are subject to change and any such change may affect our ability to offer and sell existing and planned satellite communications products and services.
15
Employees
On
December 31, 2017
, we employed 604 full-time employees. We also employ part-time employees as well as temporary or contract personnel, when necessary, to provide short-term and/or specialized support for production and other functional projects.
We believe our future success will depend upon the continued service of our key technical and senior management personnel and upon our continued ability to attract and retain highly qualified technical and managerial personnel. None of our employees is represented by a labor union. We have never experienced a work stoppage and consider our relationship with our employees to be good.
Working Capital and Seasonality
We hold significant inventory to support our customers and provide prompt delivery of finished goods. As a consequence, we expend substantial working capital in advance of receipt of customer orders. Because of the large size of certain orders, we often incur significant receivables upon order fulfillment.
Our leisure marine business within the mobile connectivity segment is highly seasonal, and seasonality can also impact our commercial marine business. Historically, we have generated the majority of our marine leisure product revenues during the first and second quarters of each year, and these revenues typically decline in the third and fourth quarters of each year. Temporary suspensions of our airtime services typically increase in the third and fourth quarters of each year as boats are placed out of service during the winter months.
16
|
ITEM 1A.
|
Risk Factors
|
An investment in our common stock involves a high degree of risk. You should carefully consider the following risk factors in evaluating our business. If any of these risks, or other risks not presently known to us or that we currently believe are not significant, develops into an actual event, then our business, financial condition and results of operations could be adversely affected. If that happens, the market price of our common stock could decline.
Our new AgilePlans pricing model for our mini-VSAT broadband business may adversely affect our revenues on a short-term or long-term basis.
In April 2017, we launched AgilePlans, our all-inclusive connectivity-as-a-service, or CaaS, usage-based pricing model for our mini-VSAT broadband service. Under this CaaS model, we charge subscribers a monthly fee in exchange for which we provide satellite communication hardware, shipping and installation, maintenance and support, airtime and voice services, a service management portal and certain basic content services. In 2017, AgilePlans revenue comprised less than 1% of our total revenue. Under this new model, we retain ownership of our satellite equipment and do not sell it to subscribers; accordingly, we anticipate that, to the extent that customers adopt this new subscription model, our revenues from product sales will decline, and our provision of this equipment to subscribers will increase our capital expenditures, which over time will increase our operating expenses as we depreciate these assets. Similarly, we anticipate that revenues from other services included in the plans, which have previously been sold separately, will also decline. Although our goal with the new pricing model is to increase the number of subscribers and thereby increase our overall mobile connectivity revenues, the pricing model is new and untested in our markets and may have unanticipated consequences for our business. There can be no assurance that customers will adopt the new pricing model or that revenues from our AgilePlans will offset the loss of other revenue and increase our overall mobile connectivity revenues. Accordingly, the introduction of this new pricing model may lead to lower overall revenues in our mobile connectivity segment on either a short-term or long-term basis. Further, because we retain ownership of the satellite communications equipment provided to subscribers under the AgilePlans, we may incur increased costs seeking to recover equipment from any customers who may default on payment or transition to another service. Adoption of the same or similar pricing models by competitors may lead to significant price competition, which could also adversely affect our revenues.
Our launch of a new high-throughput satellite network will cause us to incur significant additional operating costs and may create technical challenges and management distraction that may adversely affect our operating profit.
On November 1, 2017, we announced that we are launching a new high-throughput satellite, or HTS, communications service that will make use of Intelsat’s Global IntelsatOne Flex managed services and will also incorporate SKY-Perfect JSAT capacity. We currently operate a global network of leased satellite transponders and terrestrial teleports in cooperation with ViaSat, Inc. We anticipate that the HTS network may eventually significantly reduce costs and enhance the capabilities of the satellite communications services that we offer to our customers. In the short term, however, we expect that the launch of the HTS network will result in additional operating costs resulting from the need to operate both the HTS network and the legacy network. The operation of the HTS network may also present technical challenges arising from Intelsat’s use of the relatively new iDirect Velocity technology for the coding and modulation of satellite signals. Further, the operational requirements associated with the HTS network are likely to require significant attention from our management, marketing, sales, and technical teams, potentially distracting them from other opportunities to further develop our services and increase our customer base. Finally, our current focus on the HTS network creates potential risks with respect to the continued operation of our existing satellite communications network and our contractual arrangement with ViaSat and satellite operators. The contractual arrangement with ViaSat and satellite operators will need to be phased out over a period of several years, but the reliability of the existing satellite network will need to be maintained during the entirety of the wind-down period.
17
Our financial results may be adversely affected by changes in accounting principles applicable to us.
Generally accepted accounting principles in the United States, or U.S. GAAP, are subject to modification and interpretation by the Financial Accounting Standards Board, or the FASB, the SEC, and other bodies formed to promulgate and interpret accounting principles. For example, in May 2014, the FASB issued Accounting Standards Codification Update No. 2014-09,
Revenue from Contracts with Customers
(Topic 606), which substantially revised revenue recognition guidance under U.S. GAAP. We implemented this new revenue standard in the first quarter of 2018. The adoption of this new standard will have a material impact on our consolidated financial statements, including expected delays in recognition of revenue for certain mini-VSAT Broadband services and hardware contracts and expected balance sheet impacts relating to accounts receivable, contract assets and contract liabilities. These or other changes in accounting principles are expected to adversely affect our reported financial results, including a meaningful increase to our accumulated deficit upon adoption. Moreover, our system of internal controls was originally designed to address previous standards for revenue recognition (Topic 605), and the modifications we have made to our internal controls to address the new standard may be insufficient to implement the new standard accurately or in full. Any insufficiencies or errors in implementation could lead to mistakes in, or delays in filing, our consolidated financial statements as well as deficiencies or weaknesses in our internal control over financial reporting and our disclosure controls and procedures, any of which could lead to additional accounting, legal and other expenses, potential restatements, loss of investor confidence, enforcement actions by governmental authorities, securities class actions and other adverse consequences.
Our revenues and results of operations have been and may continue to be adversely impacted by economic turmoil in the markets we serve, political events, macroeconomic conditions, credit tightening and associated declines in consumer and enterprise spending.
Economic conditions in the markets we serve have experienced significant turmoil over the last several years, including slow economic activity, tight credit markets, inflation and deflation concerns, low consumer confidence, limited capital spending, adverse business conditions, war and refugee crises in the Middle East and Europe, terrorist attacks, the United Kingdom vote to leave the European Union, the change in presidential administration and government priorities, and liquidity concerns. These conditions can make it difficult for businesses, governments and consumers to accurately forecast and plan future activities. Many governments, including the US government, are experiencing significant deficits that have caused and may continue to cause them to curtail spending significantly and/or reallocate funds away from defense programs. There can be no assurances that government programs to improve economic conditions will be effective. As a result of these and other factors, customers and government entities could continue to slow or suspend spending on our products and services. We may also incur increased credit losses and need to further increase our allowance for doubtful accounts, which would have a negative impact on our earnings and financial condition.
We cannot predict the timing, duration, or ultimate impact of the turmoil in our markets. We expect our business to continue to be adversely impacted by this turmoil to varying degrees and for varying amounts of time, in all our geographic markets.
Decline in oil prices may continue to adversely affect our revenues and profitability.
Oil prices have declined significantly since the peak in 2014. West Texas Intermediate oil prices dropped from a high of $107.26 per barrel on June 20, 2014 to a low of $26.21 per barrel on February 11, 2016. Customers of our mobile satellite business include offshore support vessel companies that participate in or depend on the offshore oil industry. Although prices have recovered somewhat in recent periods, the declines in worldwide oil prices have had a significant impact on the financial performance of companies in this sector of the economy, and as a result demand for new products and services has declined severely during and since 2015 as they have sought to reduce expenditures. In addition, we have experienced a higher customer churn rate primarily attributed to customers that operate in this sector, where the sale, decommissioning, or laying up of vessels has led to a higher rate of airtime plan terminations and suspensions. These trends could continue to limit or reduce demand for our mobile connectivity products and services from companies in this sector, which could continue to adversely affect our revenues and profitability.
18
Our financial performance is impacted by U.S. government contracts, which are subject to uncertain levels of funding and termination.
We have historically sold a substantial portion of our TACNAV and FOG products and services to the U.S. government and its contractors. We are unable to predict the impact on our business of the change in Presidential administration and recently enacted tax reform, which may lead to significant budget deficits and an overall reduction in federal spending. A reduction in sales to the U.S. government or its contractors, whether due to lack of funding, for convenience or otherwise, or the occurrence of delays, could negatively impact our results of operations and financial condition.
The funding of U.S. government programs is subject to congressional appropriations. Congress generally appropriates funds on a fiscal year basis even though a program may extend over several fiscal years. Consequently, programs are often only partially funded initially and additional funds are committed only as Congress makes further appropriations. Changes in the White House and the composition of Congress may disrupt or delay appropriations for upcoming periods. If appropriations for any program in which we participate become unavailable, or are reduced or delayed, our contract or subcontract under such program may be terminated or adjusted by the government, which could have a negative impact on our future sales under such contract or subcontract. When a formal appropriation bill has not been signed into law before the end of the U.S. government's fiscal year, which has become more frequent in recent years, Congress may pass a continuing resolution that authorizes agencies of the U.S. government to continue to operate, generally at the same funding levels from the prior year, but that typically does not authorize new spending initiatives, during this period. Appropriations can also be impacted by other budgetary considerations, such as failure to increase the statutory debt ceiling of the U.S. government. During such periods (or until the regular appropriation bills are passed), delays can occur in procurement of products and services due to lack of funding, and these delays can affect our results of operations during the period of delay.
Appropriations can also be affected by legislation that addresses larger budgetary issues of the U.S. government. For example, future federal sequestration measures could continue to adversely affect federal spending across the U.S. government, including the Department of Defense, and we expect that these measures will continue to limit or reduce defense spending.
In addition, U.S. government contracts generally also permit the government to terminate the contract, in whole or in part, without prior notice, at the government's convenience or for default based on performance. Government customers can also decline to exercise previously disclosed contract options. If one of our contracts is terminated for convenience, we would generally be entitled to payments for our allowable costs and would receive some allowance for profit on the work performed. If one of our contracts is terminated for default, we would generally be entitled to payments for our work that has been accepted by the government. A termination arising out of our default could expose us to liability and adversely affect our ability to obtain future contracts and orders. Furthermore, on contracts for which we are a subcontractor and not the prime contractor, the U.S. government could terminate the prime contract for convenience or otherwise, irrespective of our performance as a subcontractor.
We must generate a certain level of sales of the TracPhone V-IP series products and our mini-VSAT Broadband service in order to maintain or improve our service gross margins.
As a result of our mini-VSAT Broadband network infrastructure, our cost of service sales includes certain fixed costs that do not generally vary with the volume of service sales, and we have almost no ability to reduce these fixed costs in the short term. These fixed costs have increased significantly each year as we have further expanded our network to accommodate additional subscriber demand and/or coverage areas, and we expect that this trend will continue in 2018 and beyond, particularly as we establish and expand our new high throughput satellite, or HTS, network. Sales of our TracPhone V-IP series products declined from 2015 to 2016, continuing through 2017. If sales of our TracPhone V-IP series products and the mini-VSAT Broadband service, including through our new AgilePlans subscription model, do not generate the level of revenue that we expect or if those revenues decline, our service gross margins may decline. As our market share has increased, we have also experienced a general increase in customer termination and suspension rates, compounded by accelerated declines in sales for vessels servicing the oil supply market with some bulk carriers, and lower unit sales of our mobile connectivity hardware, both in the United States and Europe. The failure to improve our mini-VSAT Broadband service gross margins and unit or subscriber sales would have a material adverse effect on our overall profitability.
19
Competition may limit our ability to sell our mobile connectivity products and services and inertial navigation products.
The mobile connectivity markets and defense navigation and inertial navigation markets in which we participate are very competitive, and we expect this competition to persist and intensify in the future. We may not be able to compete successfully against current and future competitors, which could impair our ability to sell our products and services. For example, improvements in the performance of lower-cost gyros by competitors could potentially jeopardize sales of our FOGs and FOG-based systems. As our market share in the mobile satellite communication market has grown, competition has intensified significantly, most notably from companies that seek to compete primarily on price. These companies may continue to implement price reductions and discounts for both products and services, which have required us to reduce our prices or offer discounts in order to maintain or increase our market share. Some of our VSAT competitors have also leveraged partnerships amongst themselves in order to capture larger combined market share. We anticipate that this trend of substantial competition will continue. Further, some of the companies that we depend on to supply us with capacity on satellite communications networks may vertically integrate by introducing their own products and services in competition with our products and services, thus potentially incentivizing them to refrain from providing satellite network capacity to us, or to make it available only on less favorable terms.
In the marine market for satellite TV equipment, we compete primarily with Intellian, Cobham SATCOM, Orbit Communication Systems, RayMarine (Intellian made), KNS, and Sea King (King Controls).
In the marine market for voice, fax, data, and Internet communications equipment, we compete primarily with Intellian, Cobham SATCOM, Orbit Communication Systems, Jotron AS, KNS Inc., Inmarsat, AddValue, and Iridium Satellite LLC.
I
n the marine market for high-speed voice, fax, data, and Internet services, we compete primarily with Inmarsat, Marlink, Speedcast, and Global Eagle Entertainment. We also face competition from providers of low-speed data services, which include Inmarsat, Globalstar LP, and Iridium Satellite LLC.
In the market for land mobile satellite TV equipment, we compete primarily with King Controls and Winegard Company.
In the markets for media content, the KVH Media Group competes primarily with Swank Motion Pictures and NewspaperDirect Inc., and Videotel competes with Seagull AS.
In the inertial navigation markets, we compete primarily with Honeywell International Inc., Northrop Grumman Corporation, Goodrich Aerospace, IAI, Fizoptica, SAGEM, and Systron Donner Inertial.
Among the factors that may affect our ability to compete in our markets are the following:
|
•
|
many of our primary competitors are well-established companies that generally have substantially greater financial, managerial, technical, marketing, personnel and other resources than we do, which help them to compete more effectively in the market for mobile broadband solutions for larger fleets of vessels;
|
|
•
|
the infrastructure costs for potential customers to switch from an existing service provider to our service may create disincentives for customers to enter into agreements for our services, even if those services are more attractive or cost effective;
|
|
•
|
many of our prime competitors have well-established and/or growing partner programs, which pose a threat of multiplying their market influence;
|
|
•
|
product and service improvements, new product and service developments or price reductions by competitors may weaken customer acceptance of, and reduce demand for, our products and services;
|
|
•
|
new technology or market trends may disrupt or displace a need for our products and services;
|
|
•
|
our competitors may have access to a broader array of media content than we do, which may cause customers to prefer competitors’ media offerings; and
|
|
•
|
our competitors may have lower production costs than we do, which may enable them to compete more aggressively in offering discounts and other promotions.
|
20
The emergence of a competing small maritime VSAT antenna and complementary service or other similar service could reduce the competitive advantage we believe we currently enjoy with our smaller TracPhone V-IP series antennas and Ku-band mini-VSAT Broadband service, or with our TracPhone V11-IP antenna and our C/Ku-band mini-VSAT Broadband service.
Our TracPhone V3-IP and V7-IP systems offer customers a range of benefits due to their integrated design, hardware costs that are lower than existing maritime Ku-band VSAT systems, and spread spectrum technology. We currently compete against companies that offer established maritime Ku-band VSAT service using, in some cases, antennas 1-meter in diameter or larger. While we are unaware of any company offering a 37-cm VSAT solution comparable to our TracPhone V3-IP, we are encountering regional competition from companies offering 60-cm VSAT systems and services, which are comparable in size to our TracPhone V7-IP. Likewise, our TracPhone V11-IP, at 1.1-meter in diameter, is approximately 85% smaller and lighter than competing C-band maritime VSAT systems, which use antennas in excess of 2.4-meters in diameter to provide similar global services. We are unaware of any competitor currently offering a similar size solution for global C-band coverage, but any introduction of such a product could adversely impact our success. In addition, other companies could replicate some of the distinguishing features of our TracPhone V-IP series products, which could potentially reduce the appeal of our solution, increase price competition, and adversely affect sales. For example, in early 2016, Inmarsat launched its Fleet Xpress service, a global Ka-band mobile VSAT service that Inmarsat claims is faster and has a lower price per megabit than existing Ku-band services. This service may adversely impact sales of our mini-VSAT Broadband service and related equipment. Moreover, consumers may choose other services such as FleetBroadband or Iridium OpenPort for their service coverage at potentially lower hardware costs despite higher service costs and slower data rates.
If we are unable to improve our existing mobile connectivity and inertial navigation products and services and develop new, innovative products and services, our sales and market share may decline.
The markets for mobile connectivity products and services and inertial navigation products and services are each characterized by rapid technological change, frequent new product innovations, changes in customer requirements and expectations, and evolving industry standards. For example, Inmarsat is now selling its latest-generation Fleet Xpress satellite communications products and services. If we fail to make innovations in our existing products and services and reduce the costs of our products and services in a timely way, our market share may decline. For example, the introductions of our new TracVision TV-series antennas in 2014 occurred later than we had anticipated, which we believe led certain customers to purchase competing products. Products or services using new technologies, or emerging industry standards, could render our products and services obsolete. If our competitors successfully introduce new or enhanced products or services that eliminate technological advantages our products or services may have in a market or otherwise outperform our products or services, or are perceived by consumers as doing so, we may be unable to compete successfully in the markets affected by these changes.
We are devoting significant resources to research and development efforts that may be unsuccessful.
Research and development in our industry is inherently complex and uncertain, and our current and anticipated research and development projects may not achieve the results we seek. For example, we are currently investing in the development of a new, low-cost FOG for the autonomous vehicle market that will satisfy rigorous performance expectations but that can be manufactured at a significantly lower cost than our current FOGs. We are also seeking to develop enhancements to our current generation of TACNAV products. As with all development projects, we may encounter unforeseen technical challenges, delays, cost overruns, licensing requirements or other problems that prevent us from achieving our goals, as a result of which we could lose significant market opportunities. Our research and development expenses decreased 1% from 2016 to 2017, and the capital resources that we can devote to our research and development efforts may be insufficient to achieve our goals. Our efforts may not result in any viable products or may result in products whose performance, features, price or availability may not be attractive to customers. As a result, our efforts may not result in products that generate meaningful revenues in the near term, or at all. We may expend a significant amount of resources in unsuccessful research and development efforts, and any failure to achieve our research and development goals may harm our reputation with customers or otherwise adversely affect our business, financial condition and results of operations.
21
The purchasing and delivery schedules and priorities of the U.S. military and foreign governments are often unpredictable.
We sell our FOG systems and tactical navigation products and services to U.S. and foreign military and government customers, either directly or as a subcontractor to other contractors. These customers often use a competitive bidding process and have unique purchasing and delivery requirements, which often makes the timing of sales to these customers unpredictable. Factors that affect their purchasing and delivery decisions include:
|
•
|
increasing budgetary pressures, which may reduce or delay funding for military programs;
|
|
•
|
changes in modernization plans for military equipment;
|
|
•
|
changes in tactical navigation requirements;
|
|
•
|
global conflicts impacting troop deployment, including troop withdrawals;
|
|
•
|
priorities for current battlefield operations;
|
|
•
|
new military and operational doctrines that affect military equipment needs;
|
|
•
|
sales cycles that are long and difficult to predict;
|
|
•
|
shifting response time and/or delays in the approval process associated with the export licenses we must obtain prior to the international shipment of certain of our military products;
|
|
•
|
delays in military procurement schedules; and
|
|
•
|
delays in the testing and acceptance of our products, including delays resulting from changes in customer specifications.
|
These factors periodically cause substantial fluctuations in sales of our TACNAV and FOG products and services from period to period. For example, TACNAV product sales decreased $10.3 million, or 69%, from
2016
to
2017
, while sales of our TACNAV products increased $0.3 million, or 2%, from the 2015 to 2016. Similarly, sales of our FOG products increased $2.8 million, or 16%, from
2016
to
2017
, but sales of our FOG products decreased $1.2 million, or 7%, from the 2015 to 2016. In October 2014, we received a $19.0 million TACNAV product and services contract with an international military customer which included program management and engineering services delivered through 2017 and hardware shipments that were completed in the third quarter of 2016. These large orders contribute to the unpredictability of our revenues from period to period. Government customers may change defense spending priorities at any time.
Sales of our FOG systems and TACNAV products generally consist of a few large orders, and the delay or cancellation of a single order could substantially reduce our net sales.
KVH products sold to customers in the defense industry are purchased through orders that can generally range in size from several hundred thousand dollars to more than thirty million dollars. For example, we received orders for TACNAV products and services of $3.5 million, $1.3 million, $1.4 million, $1.5 million, $4.3 million, $19.0 million, and $5.2 million in April 2017, November 2015, September 2015, May 2015, November 2014, October 2014 and May 2014, respectively. Orders of this size are often unpredictable and difficult to replicate. As a result, the delay or cancellation of a single order could materially reduce our net sales and results of operations. We routinely experience repeated and unanticipated delays in defense orders, which make our revenues and operating results less predictable. Because our inertial navigation products typically have relatively higher product gross margins than our mobile connectivity products, the loss of an order for inertial navigation products could have a disproportionately adverse effect on our results of operations.
Only a few customers account for a substantial portion of our inertial navigation revenues, and the loss of any of these customers could substantially reduce our net sales.
We derive a significant portion of our inertial navigation revenues from a small number of customers, many of whom are contractors for the U.S. government. In October 2014, we received a $19.0 million TACNAV product and services contract from an international military customer which included program management and engineering services delivered through 2017 and hardware shipments that occurred in 2015 and 2016. The loss of business from any of these customers or delays in orders could substantially reduce our net sales and results of operations and could seriously harm our business. Since we are often awarded a contract as a subcontractor to a major defense supplier that is engaged in a competitive bidding process as prime contractor for a major weapons procurement program, our revenues depend significantly on the success of the prime contractors with which we align ourselves.
22
Commercial sales of our inertial navigation products are unpredictable.
Fluctuating commercial sales of our inertial navigation products are making it more difficult to predict our future revenues. We have been marketing our inertial navigation products, particularly our FOG products and systems, to original equipment manufacturers for incorporation into commercial products, such as navigation and positioning systems for various applications, including precision mapping, dynamic surveying, self-driving and other autonomous vehicles, train location control and track geometry measurement systems, industrial robotics, and optical stabilization. Because we sell these products to original equipment manufacturers rather than end-users, we have less information about market trends and other developments affecting the buying patterns of end-users and, as a result, may be unable to forecast demand for these products accurately. Sales of FOGs for commercial applications increased from
2016
to
2017
; however, sales can significantly increase or decrease quarter-to-quarter due to our customer mix. Moreover, sales of these products for commercial applications depend on the success of our customers’ products, and any decline in sales of our customers’ products would reduce demand for our products.
Our results of operations could be adversely affected by unseasonably cold weather, prolonged winter conditions, disasters or similar events.
Our leisure marine business is highly seasonal, and seasonality can also impact our commercial marine business. Historically, we have generated the majority of our leisure marine product revenues during the first and second quarters of each year, and these revenues typically decline in the third and fourth quarters of each year, compared to the first two quarters. Temporary suspensions of our airtime services typically increase in the third and fourth quarters of each year as boats are placed out of service during winter months. Our leisure marine business is also significantly affected by the weather. Unseasonably cool weather, prolonged winter conditions, hurricanes, unusual amounts of rain, and natural and other disasters may decrease boating, which could reduce our revenues. Specifically, we may encounter a decrease in new airtime activations as well as an increase in the number of cancellations or temporary suspensions of our airtime service.
We could derive an increasing portion of our revenues from commercial leases of mobile connectivity equipment, rather than sales, which could increase our credit and collection risk.
We are actively seeking to increase revenues from the commercial markets for our mini-VSAT Broadband service, particularly shipping companies and other companies that deploy a fleet of vessels. In marketing this service, we offer leasing arrangements for the TracPhone antennas to both commercial and leisure customers. If commercial leases become increasingly popular with our customers, we could face increased risks of default under those leases. Defaults could increase our costs of collection (including costs of retrieving or abandoning leased equipment) and reduce the amount we collect from customers, which could harm our results of operations. Moreover, fleet sales are likely to be less common than, and perhaps substantially larger than, our typical orders, which could lead to increased variability in our quarterly revenues and gross margin realization.
Our ability to compete in the maritime airtime services market may be impaired if we are unable to provide sufficient service capacity to meet customer demand.
We currently offer our mini-VSAT Broadband service in the Americas, Europe, the Middle East, Africa, Asia-Pacific, and Australian and New Zealand waters. In the future, we may need to expand capacity, including under our new HTS network, in existing coverage areas to support our subscriber base. If we are unable to reach agreement with third-party satellite providers to support our mini-VSAT Broadband service and its technology or if transponder capacity is unavailable to meet growing demand in a given region, our ability to provide airtime services will be at risk and could reduce the attractiveness of our products and services.
23
Changes in foreign currency exchange rates may negatively affect our financial condition and results of operations.
Because of the scope of our foreign sales and foreign operations, we face significant exposure to movements in exchange rates for foreign currencies, particularly the pounds sterling and the euro. During 2017, the U.S. dollar weakened against certain foreign currencies, which increased our revenues reported in U.S. dollars and increased the reported value of our assets in foreign countries. However, if the U.S. dollar strengthens, our revenues denominated in foreign currencies but reported in U.S. dollars, as well as the reported value of our assets in foreign countries, would be commensurately lower.
We also have intragroup receivables and liabilities, such as loans, that can generate significant foreign currency effects. Changes in exchange rates, particularly the U.S. dollar against the pounds sterling, could lead to the recognition of unrealized foreign exchange losses.
Moreover, certain of our products and services are sold internationally in U.S. dollars; if the U.S. dollar strengthens, the relative cost of these products and services to customers located in foreign countries would increase, which could adversely affect export sales. In addition, most of our financial obligations, including payments under our outstanding debt obligations, must be satisfied in U.S. dollars. Our exposures to changes in foreign currency exchange rates may change over time as our business practices evolve and could result in increased costs or reduced revenue and could adversely affect our cash flow. Changes in the relative values of currencies occur regularly and may have a significant impact on our operating results. We cannot predict with any certainty changes in foreign currency exchange rates or the degree to which we can cost-effectively mitigate this exposure.
Brexit and political uncertainty in the United Kingdom and Europe could adversely affect our revenue and results of operations and disrupt our operations.
We have significant operations in the United Kingdom, including the major portion of our KVH Media Group and Videotel operations. The United Kingdom's intention to exit from the European Union, or Brexit, has caused significant political uncertainty in both the United Kingdom and the European Union. The impact of Brexit and the resulting turmoil on the political and economic future of the United Kingdom and the European Union is uncertain, and we may be adversely affected in ways we do not currently anticipate. Brexit may result in a significant change in the British regulatory environment, which would likely increase our compliance costs. Customers and other businesses may curtail expenditures, including for purchases of our products and services. We may find it more difficult to conduct business in the United Kingdom and the European Union, as Brexit may result in increased restrictions on the movement of capital, goods and personnel. Depending on the outcome of negotiations between the United Kingdom and the European Union regarding the terms of Brexit, we may decide to relocate or otherwise alter our European operations to respond to the new business, legal, regulatory, tax and trade environments that may result. Brexit may materially and adversely affect our relationships with customers, suppliers and employees and could result in decreased revenue, increased expenses, higher tariffs and taxes, and lower earnings and cash flow.
Tight credit availability, environmental concerns and ongoing low levels of consumer confidence are adversely affecting sales of our mobile satellite TV products.
Factors such as tight credit, environmental protection laws and ongoing low levels of consumer confidence can materially and adversely affect sales of larger vehicles and vessels for which our mobile satellite TV products are designed, such as yachts and recreational vehicles. Many customers finance their purchases of these vehicles and vessels, and tight credit availability can reduce demand for both these vehicles and vessels and our mobile satellite TV products. Moreover, in the current credit markets, financing for these purchases has sometimes been unavailable or more difficult to obtain. The increased cost of operating these vehicles and vessels can adversely affect demand for our mobile satellite TV products.
24
Our business has substantial indebtedness, which could restrict our business opportunities.
We currently have, and will likely continue to have, a substantial amount of indebtedness. Our indebtedness could, among other things, make it more difficult for us to satisfy our financial obligations, require us to use a large portion of our cash flow from operations to repay and service our debt or otherwise create liquidity problems, limit our flexibility to adjust to market conditions, place us at a competitive disadvantage and expose us to interest rate fluctuations. As of
December 31, 2017
, we had total debt outstanding of $
47.1 million
, which included
$44.3 million
in aggregate principal amount of indebtedness outstanding under our term note that matures in 2019. As of
December 31, 2017
, there were no borrowings outstanding under the revolver and the full balance of $15.0 million was available for borrowing.
We expect to obtain the money to pay our expenses and pay the principal and interest on our indebtedness from cash flow from our operations and potentially from other debt or equity offerings. Accordingly, our ability to meet our obligations depends on our future performance and capital raising activities, which will be affected by financial, business, economic and other factors, many of which are beyond our control. If our cash flow and capital resources prove inadequate to allow us to pay the principal and interest on our debt and meet our other obligations, we could face substantial liquidity problems and might be required to dispose of material assets or operations, restructure or refinance our debt, which we may be unable to do on favorable terms, and forego attractive business opportunities. In addition, the terms of our existing or future debt agreements may restrict us from pursuing any of these alternatives.
The agreements governing our indebtedness subject us to various restrictions that may limit our ability to pursue business opportunities.
The agreements governing our indebtedness subject us to various restrictions on our ability to engage in certain activities, including, among other things, our ability to:
|
•
|
acquire other businesses or make investments;
|
|
•
|
raise additional capital;
|
|
•
|
incur additional debt or create liens on our assets;
|
|
•
|
pay dividends or make distributions;
|
|
•
|
prepay indebtedness; and
|
|
•
|
merge, dissolve, liquidate, consolidate, or dispose of all or substantially all of our assets.
|
These restrictions may limit or restrict our cash flow and our ability to pursue business opportunities or strategies that we would otherwise consider to be in our best interests.
Our secured credit facility contains certain financial and other restrictive covenants that we may not satisfy, and that, if not satisfied, could result in the acceleration of the amounts due under our secured credit facility and the limitation of our ability to borrow additional funds in the future.
The agreements governing our secured credit facility subject us to various financial and other restrictive covenants with which we must comply on an ongoing or periodic basis. These include covenants pertaining to a maximum consolidated leverage ratio, a minimum consolidated fixed charge coverage ratio, covenants requiring the mandatory prepayment of amounts outstanding under the term loan and the revolver under specified circumstances, including (i) 100% of the net cash proceeds from certain dispositions to the extent not reinvested in our business within a stated period, (ii) 50% of the net cash proceeds from stated equity issuances, and (iii) 100% of the net cash proceeds from certain receipts of more than $250,000 outside the ordinary course of business, and limits on capital expenditures. If we violate any of these covenants, we may suffer a material adverse effect. Most notably, our outstanding debt under our secured credit facility could become immediately due and payable, our lenders could proceed against any collateral securing such indebtedness, and our ability to borrow additional funds in the future could be limited or terminated. Alternatively, we could be forced to refinance or renegotiate the terms and conditions of our secured credit facility, including the interest rates, financial and restrictive covenants and security requirements of the secured credit facility, on terms that may be significantly less favorable to us.
In March 2017, we entered into an amendment to our secured credit facility. This amendment included (i) an increase to the Maximum Consolidated Leverage Ratio from 1.25:1.00 to 1.50:1.00, (ii) an increase to the lowest rate applicable to borrowing under the credit agreement from 1.50% to 1.75%, (iii) an amendment to the amortization schedule for the term loan to reduce the amount of required quarterly principal repayments to $575,000 and (iv) an amendment to the definition of Consolidated Fixed Charges Coverage Ratio to exclude any capital expenditures related to growth or revenue generating initiatives from the calculation. As a condition to the amendment, we made a principal repayment of $6.0 million on the term loan.
25
A default under agreements governing our indebtedness could result in a default and acceleration of indebtedness under other agreements.
Certain agreements governing our indebtedness contain cross-default provisions whereby a default under one agreement could result in a default and acceleration of our repayment obligations under other agreements. If a cross-default were to occur, we may not be able to pay our debts or borrow sufficient funds to refinance them. Even if new financing were available, it may not be available on favorable terms. If some or all of our indebtedness is in default for any reason, our business, financial condition, and results of operations could be materially and adversely affected.
Our mobile satellite products currently depend on satellite services, gateway teleports and terrestrial networks provided by third parties, and a disruption in those services could adversely affect sales.
Our satellite antenna products include the equipment necessary to utilize satellite services; we do not own the satellites that directly provide two-way satellite communications or the terrestrial networks that interconnect our facilities with the satellite teleports that communicate with the satellites. We currently offer satellite television products compatible with the DIRECTV and DISH Network services in the United States, the Bell TV service in Canada, the Sky Mexico service and various other regional satellite TV services in other parts of the world.
SES, Eutelsat, Sky Perfect-JSAT, Telesat, EchoStar, Intelsat and Star One currently provide the satellite capacity to support the mini-VSAT Broadband service and our TracPhone V-IP series products. Intelsat also currently provides our C-Band satellite coverage. In addition, we have agreements with various teleports and Internet service providers around the globe to support the mini-VSAT Broadband service. The terrestrial fiber links that we use to connect with the Internet and to move our voice and data services between our facilities and the various satellite earth stations that support our services are provided to us through numerous service providers, some of which have contractual relationships with our satellite service providers and not directly with us. We rely on Inmarsat for satellite communications services for our FleetBroadband- and FleetOne-compatible TracPhone products. We also have an arrangement with Iridium for additional satellite communications services that we make available to our customers as a backup option to provide communications redundancy with our primary service offerings.
We exercise little or no control over these third-party providers of satellite, teleport and terrestrial network services, which increases our vulnerability to problems with the services they provide. Due to our reliance on these service providers, when problems occur, it may be difficult to identify the source of the problem. Service disruption or outages, regardless of whether they are caused by our service, the equipment or services of our third-party service providers, or our customers’ or their equipment and systems, may result in loss of market acceptance of our service, and any necessary repairs or other remedial actions may cause us to incur significant costs and expenses. Any failure on the part of third-party service providers to achieve or maintain expected performance levels, stability and security could harm our relationships with our customers, result in claims for credits or damages, damage our reputation, significantly reduce customer demand for our solution and seriously harm our financial condition and operating results.
If customers become dissatisfied with the programming, pricing, service, availability or other aspects of any of these satellite services, or if any one or more of these services becomes unavailable for any reason, we could suffer a substantial decline in sales of our satellite products. There may be no alternative service provider available in a particular geographic area, and our modem or other technology may not be compatible with the technology of any alternative service provider that may be available. Even if available, delays caused by switching our technology to another service provider, if available, and qualifying this new service provider could materially harm our customer relationships, business, financial condition and operating results In addition, the unexpected failure of a satellite could disrupt the availability of programming and services, which could reduce the demand for, or customer satisfaction with, our products.
26
We rely upon spread spectrum communications technology developed by ViaSat and transmitted by third-party satellite providers to permit two-way broadband Internet via our TracPhone V-IP series antennas, and any disruption in the availability of this technology could adversely affect sales.
Our mini-VSAT Broadband service relies on spread spectrum technology developed by ViaSat, for use with satellite capacity controlled by SES, Eutelsat, Sky Perfect-JSAT, Telesat, Echostar, Intelsat and Star One. Our TracPhone two-way broadband satellite terminals combine our stabilized antenna technology with ViaSat’s ArcLight spread spectrum mobile broadband technology, along with ViaSat’s ArcLight spread spectrum modem. The ArcLight technology is also integrated within the satellite hubs that support this service. Sales of the TracPhone V-IP series products and our mini-VSAT Broadband service could be disrupted if we fail to receive approval from regulatory authorities to provide our spread spectrum service in the waters of various countries where our customers operate or if there are issues with the availability of the ArcLight maritime modems. Moreover, satellite communications technology may continue to evolve, which could reduce the relative attractiveness of the ArcLight technology we currently offer, and our ArcLight technology may cease to be compatible with changes in satellite service offerings. As we transition to our new HTS service over the next several years, we may encounter technological challenges, increased expenses, customer dissatisfaction, inventory obsolescence, interruptions in supply, disruptions in current relationships or arrangements and unforeseen obstacles, any of which could have a material adverse effect on our mobile satellite business, revenues and profitability.
We have single dedicated manufacturing facilities for each of our mobile connectivity and inertial navigation product categories, and any significant disruption to a facility could impair our ability to deliver our products.
Excluding the products manufactured by Videotel and KVH Media Group, which are manufactured in the United Kingdom, we currently manufacture all of our mobile connectivity products at our manufacturing facility in Middletown, Rhode Island, and the majority of our inertial navigation products at our facility in Tinley Park, Illinois. Some of our production processes are complex, and we may be unable to respond rapidly to the loss of the use of either production facility. For example, our production facilities use some specialized equipment that may take time to replace if they are damaged or become unusable for any reason. In that event, shipments would be delayed, which could result in customer or dealer dissatisfaction, loss of sales and damage to our reputation. Finally, we have only a limited capability to increase our manufacturing capacity in the short term. If short-term demand for our products exceeds our manufacturing capacity, our inability to fulfill orders in a timely manner could also lead to customer or dealer dissatisfaction, loss of sales and damage to our reputation.
We depend on sole or limited source suppliers, and any disruption in supply could impair our ability to deliver our products on time or at expected cost.
We obtain many key components for our products from third-party suppliers, and in some cases we use a single or a limited number of suppliers. Any interruption in supply could impair our ability to deliver our products until we identify and qualify a new source of supply, which could take several weeks, months or longer and could increase our costs significantly. Suppliers might change or discontinue key components, which could require us to modify our product designs. For example, in the past, we have experienced changes in the chemicals used to coat our optical fiber, which changed its characteristics and thereby necessitated design modifications. Department of Defense regulations requiring government contractors to implement processes to avoid counterfeit parts may require us to find new sources of materials or components if the current supplier cannot meet the requirements. In general, we do not have written long-term supply agreements with our suppliers but instead purchase components through purchase orders, which expose us to potential price increases and termination of supply without notice or recourse. It is generally not our practice to carry significant inventories of product components, and this could magnify the impact of the loss of a supplier. If we are required to use a new source of materials or components, it could also result in unexpected manufacturing difficulties and could affect product performance and reliability. In addition, from time to time, lead times for certain components can increase significantly due to imbalances in overall market supply and demand. This, in turn, could limit our ability to satisfy the demand for certain of our products on a timely basis and could result in some customer orders being rescheduled or canceled.
We may continue to increase the use of international suppliers to source components for our manufacturing operations, which could disrupt our business.
Although we have historically manufactured and sourced raw materials for the majority of our products domestically, in order for us to compete with lower priced competing products while also improving our profitability, in some instances we have found it desirable to source raw materials and manufactured components and assemblies from Europe, Asia, and South America. Reliance on foreign manufacturing and/or raw material supply has lengthened our supply chain and increased the risk that a disruption in that supply chain could have a material adverse effect on our operations and financial performance.
27
We depend on cloud-based data services operated by third parties, and any disruption in the operation of these services could harm our business.
We host some of our content services and business records using various cloud-based data services operated by third parties. Any failure or downtime in one of these services could affect a significant percentage of our customers. Although we control and have access to our servers and all of the components of our network that are located in our internal facilities and certain of our external data facilities, we do not control the operation of external facilities. The providers of our data management services have no obligation to renew their agreements with us on commercially reasonable terms, or at all. If we are unable to renew these agreements on commercially reasonable terms, or if one or more of our data management service providers is acquired, closes, suffers financial difficulty or is unable to meet our growing capacity needs, we may be required to transfer our data to other services, and we may incur significant costs and service interruptions in connection with doing so, which could harm our reputation with our customers and adversely affect our revenues and results of operations.
Adverse economic conditions could result in financial difficulties or bankruptcy for any of our suppliers, which could adversely affect our business and results of operations.
The current state of worldwide economic conditions and tight credit could present challenges to our suppliers, which could result in disruptions to our business, increase our costs, delay shipment of our products or delivery of services, and impair our ability to generate and recognize revenue. To address their own business challenges, our suppliers may increase prices, reduce the availability of credit, require deposits or advance payments or take other actions that may impose a burden on us.
They may also reduce production capacity, slow or delay delivery of products, face challenges meeting our specifications or otherwise fail to meet our requirements. In some cases, our suppliers may face bankruptcy. We may be required to identify, qualify, and engage new suppliers, which would require time and the attention of management. Any of these events could impair our ability to deliver our products and services to customers in a timely and cost-effective manner, cause us to breach our contractual commitments or result in the loss of customers.
Our media and entertainment business relies on licensing arrangements with content providers, and the loss of or changes in those arrangements could adversely affect our business.
We distribute premium news, sports, movies, and music content for commercial and leisure customers in the maritime, hotel, and retail markets. We do not generate this content but instead license the content from third parties on a non-exclusive basis. We do not have long-term license agreements with any content provider. Accordingly, any content provider could terminate our existing arrangements with little or no advance notice or could adversely modify the terms of the arrangement, including initiating potential price increases. Further, the licenses we obtain are limited in scope, and any violation of the terms of a license could expose us to liability for copyright infringement. We pay license fees that are based in part on the revenue we generate from sublicenses, and our licensors generally have the right to audit our records to determine whether we have paid all necessary license fees. Failure to pay required license fees could result in any combination of termination of our license rights, penalties, or damages. The loss of content could adversely affect the attractiveness of our media and entertainment offerings, which could in turn adversely affect our revenues. Any increase in the cost of content could reduce the profitability of these offerings.
Any failure to maintain and expand our third-party distribution relationships may limit our ability to penetrate markets for mobile connectivity products and services.
We market and sell our mobile connectivity products and services through an international network of independent retailers, chain stores and distributors, as well as to manufacturers of marine vessels, recreational vehicles and buses. Many of our distributors are also responsible for providing onsite support and installation for our products, which requires our distributors to employ highly skilled workers and maintain facilities in locations convenient to our customers, such as at maritime ports. We also expect our distributors to assist us in expanding internationally. Some of our distribution relationships are new, and our new distributors may not be successful in marketing and selling our products and services. In addition, our distribution partners do not have exclusive relationships with us and may sell products of other companies, including competing products, and are generally not required to purchase minimum quantities of our products. Our competitors may be able to cause our current or potential distributors to favor their services over ours, either through financial incentives, technological innovation, by offering a broader array of services to these service providers or otherwise, which could reduce the effectiveness of our use of these distributors. If we fail to maintain relationships with our current distributors, fail to develop relationships with new distributors in new and existing markets, or manage, train, or provide appropriate incentives to our existing distributors, or if our distributors are not successful in their sales efforts, sales of our products and services may decline and our operating results could be harmed.
28
Our international business operations expose us to a number of difficulties in coordinating our activities abroad and in dealing with multiple regulatory environments.
Historically, sales to customers outside the United States have accounted for a significant portion of our net sales. We derived
62%
, 63%, and 67% of our revenues in
2017
,
2016
, and
2015
, respectively, from sales to customers outside the United States. We have foreign sales offices in Denmark, the United Kingdom, Singapore, Hong Kong, Japan, Norway, Cyprus and the Philippines, as well as a subsidiary in Brazil that manages local sales. However, aside from these international sales offices, substantially all of our personnel and operations, particularly for our mobile connectivity equipment business and our inertial navigation business, are located in the United States. Our limited operations in foreign countries may impair our ability to compete successfully in international markets and to meet the service and support needs of our customers in countries where we have little to no infrastructure. We are subject to a number of risks associated with our international business activities, which may increase our costs and require significant management attention. These risks include:
|
•
|
technical challenges we may face in adapting our mobile connectivity products to function with different satellite services and technology in use in various regions around the world;
|
|
•
|
satisfaction of international regulatory requirements and delays and costs associated with procurement of any necessary licenses or permits;
|
|
•
|
the potential unavailability of content licenses covering international waters and foreign locations;
|
|
•
|
restrictions on the sale of certain inertial navigation products to foreign military and government customers;
|
|
•
|
increased costs of providing customer support in multiple languages;
|
|
•
|
increased costs of managing operations that are international in scope;
|
|
•
|
potentially adverse tax consequences, including restrictions on the repatriation of earnings;
|
|
•
|
protectionist laws and business practices that favor local competitors, which could slow our growth in international markets;
|
|
•
|
potentially longer sales cycles, which could slow our revenue growth from international sales;
|
|
•
|
potentially longer accounts receivable payment cycles and difficulties in collecting accounts receivable; and
|
|
•
|
economic and political instability in some international markets.
|
We could incur additional legal compliance costs associated with our international operations and could become subject to legal penalties if we do not comply with certain regulations.
As a result of our international operations, we are subject to a number of legal requirements, including the U.S. Foreign Corrupt Practices Act, the U.K. Bribery Act and the customs, export, trade sanctions and anti-boycott laws of the United States, including those administered by the U.S. Customs and Border Protection, the Bureau of Industry and Security, the Department of Commerce, the Department of State, and the Office of Foreign Assets Control of the Treasury Department, as well as those of other nations in which we do business. In addition, the governments of many of the countries where our customers use our products and services maintain licensing and regulatory requirements for the importation and use of satellite communications and reception equipment, including the use of such equipment in the country’s territorial waters, the transmission of satellite signals on certain radio frequencies, the transmission of voice over Internet services using such equipment, and, in some cases, the reception of certain video programming services. These laws and regulations are changing continuously, and compliance with these laws and regulations is complex. We incur significant costs identifying and maintaining compliance with applicable licensing and regulatory requirements. In addition, our training and compliance programs and our other internal control policies may be insufficient to protect us from acts committed by our employees, agents or third-party contractors. Any violation of these requirements by us or our employees, agents or third-party contractors may subject us to significant criminal and civil liability.
Exports of certain inertial navigation products are subject to the U.S. Export Administration Regulations and the International Traffic in Arms Regulations and require a license from the U.S. Department of State prior to shipment.
We must comply with the United States Export Administration Regulations and the International Traffic in Arms Regulations, or ITAR. Certain of our products have military or strategic applications and are on the munitions list of the ITAR and require an individual validated license in order to be exported to certain jurisdictions. Any changes in export regulations or reclassifications of our products may further restrict the export of our products, and we may cease to be able to procure export licenses for our products under existing regulations. The length of time required by the licensing process can vary, potentially delaying the shipment of products and the recognition of the corresponding revenue. Any restriction on the export of a product line or any amount of our products could cause a significant reduction in net sales.
29
We are subject to FCC rules and regulations, and any non-compliance could subject us to FCC enforcement actions, fines, loss of licenses and possibly restrictions on our ability to operate or offer certain of our services.
The satellite communications industry is regulated by the Federal Communications Commission in the United States and, as a result, we are subject to existing and potential FCC regulations relating to privacy, contributions to the Universal Service Fund, or USF, and other requirements. If we do not comply with FCC rules and regulations, we could be subject to FCC enforcement actions, substantial fines, penalties, loss of licenses and possibly restrictions on our ability to operate or offer certain of our services. Any enforcement action by the FCC, which may be a public process, could hurt our reputation in the industry, possibly impair our ability to sell our services to customers and could harm our business and results of operations.
Reform of federal and state USF programs could increase the cost of our service to our customers, diminishing or eliminating our pricing advantage.
The FCC has been considering reform or other modifications to its USF program. The way we calculate our contribution to USF may change if the FCC engages in reform or adopts other modifications. In April 2012, the FCC released a Further Notice of Proposed Rulemaking to consider reforms to the manner in which companies like us contribute to the federal USF program. In general, the Further Notice of Proposed Rulemaking indicates that the FCC is considering changes to the companies that should contribute, how contributions should be assessed, and methods to improve the administration of the system. We cannot predict the outcome of this proceeding or its impact on our business at this time. The changes in the leadership of the U.S. Government resulting from the federal election in 2016 may renew interest in completing this proceeding.
Should the FCC adopt new contribution mechanisms or otherwise modify contribution obligations that increase our contribution burden, we will either need to raise the amount we currently collect from our customers to cover this obligation or absorb the costs, which would reduce our profit margins. The attractiveness of our services may also be reduced as compared to the services of our competitors that do not appear to contribute to USF, or do not do so to the same extent that we do.
Privacy concerns and domestic or foreign laws and regulations may reduce demand for our services, increase our costs and harm our business.
Our company and our customers can potentially use our services to collect, use and store information, including personally identifiable information or other information treated as confidential, regarding the content and manner of usage of our services by them, their employees and maritime crews. Federal, state and foreign governments and agencies have adopted, are considering adopting, or may adopt laws and regulations regarding the collection, use, storage and disclosure of such information obtained from consumers and individuals, such as the European Union’s new General Data Protection Regulation, which takes effect in May 2018. The costs of compliance with, and other burdens imposed by, such laws and regulations that are applicable to us and the operations of our customers may limit the use and adoption of our services and reduce overall demand, and any non-compliance with these laws and regulations could lead to significant remediation expenses, fines, penalties or other regulatory liabilities such as orders or consent decrees forcing us to modify our privacy practices, as well as reputational damage or third-party lawsuits seeking damages or other relief.
Domestic and international legislative and regulatory initiatives may harm our ability, and the ability of our customers, to process, handle, store, use and transmit information, including demographic and personally identifiable information or other information treated as confidential, regarding individual users of the services, which could reduce demand for some of our services, increase our costs and force us to change our business practices. These laws and regulations are still evolving and are likely to be in flux and subject to uncertain interpretation for the foreseeable future. Our business could be harmed if legislation or regulations are adopted, interpreted or implemented in a manner that is inconsistent from country to country and inconsistent with our current policies and practices, or those of our customers. In addition, foreign data protection, privacy, and consumer protection laws and regulations are often more stringent than those in the United States. In particular, the European Union and its member states traditionally have imposed greater legal obligations on companies that collect and process personal data.
30
Acquisitions may disrupt our operations or adversely affect our results.
We evaluate strategic acquisition opportunities to acquire other businesses as they arise, such as our acquisitions of Videotel in July 2014 and KVH Media Group in May 2013. The expenses we incur evaluating and pursuing these and other such acquisitions could have a material adverse effect on our results of operations. For example, during 2014, we incurred significant expenses related to the acquisition of Videotel. If we acquire a business, we may be unable to manage it profitably or successfully integrate its operations with our own. Moreover, we may be unable to realize the strategic, financial, operational and other benefits we anticipate from any acquisition, and any acquisition may increase our overall operating expenses. Competition for acquisition opportunities could increase the price we pay for businesses we acquire and could reduce the number of potential acquisition targets. Further, our approach to acquisitions may involve a number of special financial and business risks, such as:
|
•
|
entry into new and unfamiliar lines of business or markets, which may present challenges or risks that we did not anticipate;
|
|
•
|
entry into new or unfamiliar geographic regions, including exposure to additional tax and regulatory regimes;
|
|
•
|
increased expenses associated with the amortization of acquired intangible assets;
|
|
•
|
increased exposure to fluctuations in foreign currency exchange rates;
|
|
•
|
charges related to any potential acquisition from which we may withdraw;
|
|
•
|
diversion of our management’s time, attention, and resources;
|
|
•
|
loss of key acquired personnel;
|
|
•
|
increased costs to improve or coordinate managerial, operational, financial, and administrative systems, including compliance with the Sarbanes-Oxley Act of 2002;
|
|
•
|
dilutive issuances of equity securities;
|
|
•
|
the assumption of legal liabilities; and
|
|
•
|
losses arising from impairment charges associated with goodwill or intangible assets.
|
For example, we incurred additional expenses to implement internal control over financial reporting appropriate for a public company at Videotel and KVH Media Group, which previously operated as private companies not subject to U.S. generally accepted accounting principles.
If we cannot effectively manage changes in our rate of growth, our business may suffer.
We have previously expanded our operations to pursue existing and potential market opportunities, and we are continuing to expand our international operations. For example, we expanded our service offerings through the acquisitions of Videotel in 2014 and KVH Media Group in 2013. This growth placed a strain on our personnel, management, financial and other resources and increased our operating expenses. If any portion of our business grows more rapidly than we anticipate and we fail to manage that growth properly, we may incur unnecessary expenses, and the efficiency of our operations may decline. If we are unable to adjust our operating expenses on a timely basis in response to changes in revenue cycles, our results of operations may be harmed. To manage changes in our rate of growth effectively, we must, among other things:
|
•
|
match our manufacturing facilities and capacity to demand for our products and services in a timely manner;
|
|
•
|
secure appropriate satellite capacity to match changes in demand for airtime services in a timely manner;
|
|
•
|
successfully attract, train, motivate and manage appropriate numbers of employees for manufacturing, sales, marketing and customer support activities;
|
|
•
|
effectively manage our inventory and working capital;
|
|
•
|
maintain the efficiencies within our operating, administrative, financial and accounting systems; and
|
|
•
|
ensure that our procedures and internal controls are revised and updated to remain appropriate for the size and scale of our business operations.
|
We may be unable to hire and retain the skilled personnel we need to expand our operations.
To meet our growth objectives, we must attract and retain highly skilled technical, operational, managerial and sales and marketing personnel. If we fail to attract and retain the necessary personnel, we may be unable to achieve our business objectives and may lose our competitive position, which could lead to a significant decline in net sales. We face significant competition for these skilled professionals from other companies, research and academic institutions, government entities and other organizations.
31
Our success depends on the services of our executive officers.
Our future success depends to a significant degree on the skills and efforts of Martin Kits van Heyningen, our co-founder, President, Chief Executive Officer, and Chairman of the Board. If we lost the services of Mr. Kits van Heyningen, our business and operating results could be seriously harmed. We also depend on the ability of our other executive officers to work effectively as a team. The loss of one or more of our executive officers could impair our ability to manage our business effectively.
Our business may suffer if we cannot protect our proprietary technology.
Our ability to compete depends significantly upon our patents, copyrights, source code, and other proprietary technology. The steps we have taken to protect our technology may be inadequate to prevent others from using what we regard as our technology to compete with us. Our patents could expire or be challenged, invalidated or circumvented, and the rights we have under our patents could provide no competitive advantages. Existing trade secret, copyright, and trademark laws offer only limited protection. Customers or others with access to our proprietary or licensed media content could copy that content without permission or otherwise violate the terms of our customer agreements, which would adversely affect our revenues and could impair our relationships with content providers. In addition, the laws of some foreign countries do not protect our proprietary technology to the same extent as the laws of the United States, which could increase the likelihood of misappropriation. Furthermore, other companies could independently develop similar or superior technology without violating our intellectual property rights. Any misappropriation of our technology or the development of competing technology could seriously harm our competitive position, which could lead to a substantial reduction in net sales.
If we resort to legal proceedings to enforce our intellectual property rights, the proceedings could be burdensome, disruptive and expensive, distract the attention of management, and there can be no assurance that we would prevail.
Also, we have delivered certain technical data and information to the U.S. government under procurement contracts, and it may have unlimited rights to use that technical data and information. There can be no assurance that the U.S. government will not authorize others to use that data and information to compete with us.
Claims by others that we infringe their intellectual property rights could harm our business and financial condition.
Our industries are characterized by the existence of a large number of patents and frequent claims and related litigation regarding patent and other intellectual property rights. We cannot be certain that our products do not and will not infringe issued patents, patents that may be issued in the future, or other intellectual property rights of others.
We do not generally conduct exhaustive patent searches to determine whether the technology used in our products infringes patents held by third parties. In addition, product development is inherently uncertain in a rapidly evolving technological environment in which there may be numerous patent applications pending, many of which are confidential when filed, with regard to similar technologies.
From time to time we have faced claims by third parties that our products or technology infringe their patents or other intellectual property rights, and we may face similar claims in the future. For example, we were sued for patent infringement in 2015, and we settled this claim in January 2016 with a payment of cash to Advanced Media Network. Any claim of infringement could cause us to incur substantial costs defending against or settling the claim, even if the claim is invalid, and could distract the attention of our management. If any of our products are found to violate third-party proprietary rights, we may be required to pay substantial damages. In addition, we may be required to re-engineer our products or obtain licenses from third parties to continue to offer our products. Any efforts to re-engineer our products or obtain licenses on commercially reasonable terms may not be successful, which would prevent us from selling our products, and, in any case, could substantially increase our costs and have a material adverse effect on our business, financial condition and results of operations.
32
Cybersecurity breaches could disrupt our operations, expose us to liability, damage our reputation, and require us to incur significant costs or otherwise adversely affect our financial results.
We are highly dependent on information technology networks and systems, including the Internet, to securely process, transmit and store electronic information, including personal information of our customers. We also retain sensitive data, including intellectual property, proprietary business information, personally identifiable information, credit card information, and usage data of our employees and customers on our computer networks. Although we take certain protective measures and endeavor to modify them as we believe circumstances warrant, invasive technologies and techniques continue to evolve rapidly, and our computer systems, software and networks are vulnerable to disruption, shutdown, unauthorized access, misuse, erasure, alteration, employee error, phishing, computer viruses or other malicious code, and other events that could have a security impact. Any security breach may compromise information stored on our networks and may result in significant data losses or theft of our, our customers', our business partners' or our employees' sensitive information. Public reports suggest that cybersecurity incidents are happening more often and with increasingly severe consequences. We may be required to expend substantial additional resources to augment our efforts to address potential cybersecurity risks, which could adversely affect our results of operations.
If any of these events were to occur, they could disrupt our operations, distract our management, cause us to lose existing customers and fail to attract new customers, as well as subject us to regulatory actions, litigation, fines, damage to our reputation or competitive position, or orders or decrees requiring us to modify our business practices, any of which could have a material adverse effect on our financial position, results of operations or cash flows.
Our media business may expose us to claims regarding our media content.
Our media business produces training films and eLearning computer-based training courses, including programs on safety, maintenance, security and regulatory compliance, and also provides commercially licensed maritime charting and navigation information. Our efforts to ensure the accuracy and reliability of the content we provide could be inadequate, and we could face claims of liability based on this content. Contractual and other measures we take to limit our liability may be inadequate to protect us from these claims. Although we have certain rights of indemnification from third parties for certain portions of the content we provide to customers, it may be time-consuming and expensive to enforce our rights, and the third parties may lack the resources to fulfill their obligations to us. Further, our insurance coverage is subject to deductibles, exclusions and limitations of coverage, and there can be no assurance that our insurance coverage would be available to satisfy any claims against us. Any such claims may have a material adverse effect on our financial condition and results of operations.
Fluctuations in our quarterly net sales and results of operations could depress the market price of our common stock.
We have at times experienced significant fluctuations in our net sales and results of operations from one quarter to the next. Our future net sales and results of operations could vary significantly from quarter to quarter due to a number of factors, many of which are outside our control. Accordingly, you should not rely on quarter-to-quarter comparisons of our results of operations as an indication of future performance. It is possible that our net sales or results of operations in a quarter will fall below the expectations of securities analysts or investors. If this occurs, the market price of our common stock could fall significantly. Our results of operations in any quarter can fluctuate for many reasons, including:
|
•
|
changes in demand for our mobile connectivity products and services and inertial navigation products and services, including as a result of our AgilePlans;
|
|
•
|
the timing and size of individual orders from military customers, which may be delayed or canceled for various reasons;
|
|
•
|
the mix of products and services we sell, including the mix of fixed rate and metered contracts for airtime services;
|
|
•
|
our ability to manufacture, test and deliver products in a timely and cost-effective manner, including the availability and timely delivery of components and subassemblies from our suppliers;
|
|
•
|
our success in winning competitions for orders;
|
|
•
|
the timing of new product introductions by us or our competitors;
|
|
•
|
the scope of our investments in research and development;
|
|
•
|
expenses incurred in pursuing acquisitions;
|
|
•
|
expenses incurred in expanding, maintaining, or improving our mini-VSAT Broadband network;
|
|
•
|
market and competitive pricing pressures;
|
|
•
|
unanticipated charges or expenses, such as increases in warranty claims;
|
|
•
|
general economic climate; and
|
|
•
|
seasonality of pleasure boat and recreational vehicle usage.
|
33
In 2018, in light of our current investments in research and development and the establishment and expansion of our new HTS network, we expect that our operating expenses in each quarter of 2018 could increase significantly over the amount we incurred in the comparable quarter of 2017.
In late 2015, we introduced new rate plans for our airtime services, including various rate plans that offer higher data speeds with usage caps. Under these rate plans, customers receive a base level of service for a fixed fee and pay additional fees for usage over the base level. Accordingly, the revenue we generate from a customer may vary with that customer's usage. We are unable to predict accurately the extent to which customers will transition to particular metered rate plans or the degree to which usage, and therefore our revenue, may vary from quarter to quarter.
A large portion of our expenses, including expenses for network infrastructure, facilities, equipment, and personnel, are relatively fixed. Accordingly, if our net sales decline or do not grow as much or as quickly as we anticipate, we might be unable to maintain or improve our operating margins. Any failure to achieve anticipated net sales could therefore significantly harm our operating results for a particular fiscal period.
The market price of our common stock may be volatile.
Our stock price has historically been volatile. During the period from January 1, 2015 to
December 31, 2017
, the trading price of our common stock ranged from $7.31 to $15.79. Many factors may cause the market price of our common stock to fluctuate, including:
|
•
|
variations in our quarterly results of operations;
|
|
•
|
the introduction of new products and services by us or our competitors;
|
|
•
|
changing needs of military customers;
|
|
•
|
changes in estimates of our performance or recommendations by securities analysts;
|
|
•
|
the hiring or departure of key personnel;
|
|
•
|
acquisitions or strategic alliances involving us or our competitors;
|
|
•
|
market conditions in our industries; and
|
|
•
|
the global macroeconomic and geopolitical environment.
|
In addition, the stock market can experience extreme price and volume fluctuations. Major stock market indices experienced dramatic declines in 2008, in the first quarter of 2009 and in January 2016. These fluctuations are often unrelated to the operating performance of particular companies. These broad market fluctuations may adversely affect the market price of our common stock. When the market price of a company’s stock drops significantly, stockholders often institute securities litigation against that company. Any such litigation could cause us to incur significant expenses defending against the claim, divert the time and attention of our management and result in significant damages.
We may have exposure to additional tax liabilities, which could negatively impact our income tax expense, net income and cash flow.
We are subject to income taxes and other taxes in both the U.S. and the foreign jurisdictions in which we currently operate. The determination of our worldwide provision for income taxes and current and deferred tax assets and liabilities requires significant judgment and estimation. In the ordinary course of our business, there are many transactions and calculations where the ultimate tax determination is uncertain. We are subject to regular review and audit by both domestic and foreign tax authorities and to the prospective and retrospective effects of changing tax regulations and legislation. Although we believe our tax estimates are reasonable, the ultimate tax outcome may materially differ from the tax amounts recorded in our consolidated financial statements and may materially affect our income tax benefit or expense, net loss or income, and cash flows in the period in which such determination is made. As of
December 31, 2017
, we had liabilities for uncertain tax positions of
$1.6 million
.
Deferred tax assets are recognized for the expected future tax consequences of temporary differences between the financial reporting and tax bases of assets and liabilities, and for operating losses and tax credit carry forwards. In certain instances, a valuation allowance may be recorded to reduce certain deferred tax assets to estimated realizable value. We review our deferred tax assets and valuation allowance requirements on a quarterly basis. If, during our quarterly reviews of our deferred tax assets, we determine that it is more likely than not that we will not be able to generate sufficient future taxable income to realize the net carrying value of deferred tax assets, we will record a valuation allowance to reduce the tax assets to estimated realizable value, which could result in a material income tax charge. As part of our review, we consider positive and negative evidence, including cumulative results of recent years. As of December 31,
2017
, we had recorded
$16.0 million
of valuation allowances against our gross deferred tax assets of $17.8 million.
34
Our effective tax rate fluctuates, and we may incur obligations in tax jurisdictions in excess of accrued amounts.
As a global company, we are subject to taxation in numerous countries, states and other jurisdictions. As a result, our effective tax rate is derived from a combination of applicable tax rates in the various places that we operate. In preparing our financial statements, we estimate the amount of tax that will become payable in each jurisdiction. Our effective tax rate, however, may be different than experienced in the past due to numerous factors, including changes in the mix of our profitability from country to country, the results of examinations and audits of our tax filings, adjustments to the value of our uncertain tax positions, changes in accounting for income taxes and changes in tax laws, including the 2017 Tax Act. Any of these factors could cause us to experience an effective tax rate significantly different from previous periods or our current expectations.
In addition, our inability to secure or sustain acceptable arrangements with tax authorities and future changes in the tax laws, among other things, may result in tax obligations in excess of amounts accrued in our financial statements.
The 2017 Tax Cuts and Jobs Act (the "Tax Act") has resulted in significant changes to the U.S. corporate income tax system. These changes include a federal statutory rate reduction from 35% to 21%, the elimination or reduction of certain domestic deductions and credits and limitations on the deductibility of interest expense and executive compensation. The 2017 Tax Act also transitions international taxation from a worldwide system to a modified territorial system and includes base erosion prevention measures on non-U.S. earnings, which has the effect of subjecting certain earnings of our foreign subsidiaries to U.S. taxation as global intangible low-taxed income or "GILTI". These changes are effective beginning in 2018.
The 2017 Tax Act also includes the Transition Toll Tax, which is a one-time mandatory deemed repatriation tax on accumulated foreign subsidiaries' previously untaxed foreign earnings. The Transition Toll Tax may be paid over an eight-year period, starting in 2018, and will not accrue interest.
We have made a preliminary estimate of the Transition Toll Tax and the remeasurement of our deferred tax assets and liabilities as of December 31, 2017. The preliminary estimate is subject to change as we finalize our analysis and as interpretations of the provisions of the 2017 Tax Act continue to develop. The final determination of the Transition Toll Tax and the remeasurement of our deferred tax assets and liabilities will be completed as additional information becomes available, but no later than one year from the enactment of the 2017 Tax Act. U.S. Treasury regulations, administrative interpretations or court decisions interpreting the 2017 Tax Act may require further adjustments and changes in our estimates, which could have a material adverse effect on our business, results of operations or financial conditions.
Changes in the competitive environment or supply chain issues may require inventory write-downs.
From time to time, we have recorded significant inventory charges and/or inventory write-offs as a result of substantial declines in customer demand. Market or competitive changes could lead to future charges for excess or obsolete inventory, especially if we are unable to appropriately adjust the supply of material from our vendors.
If goodwill or other intangible assets that we have recorded in connection with our acquisitions of other businesses become impaired, we could have to take significant charges against earnings.
As a result of our acquisitions, we have recorded, and may continue to record, a significant amount of goodwill and other intangible assets. Under current accounting guidelines, we must assess, at least annually and potentially more frequently, whether the value of goodwill and other intangible assets has been impaired. Any reduction or impairment of the value of goodwill or other intangible assets will result in additional charges against earnings, which could materially reduce our reported results of operations in future periods.
35
Our charter and by-laws and Delaware law may deter takeovers.
Our certificate of incorporation, by-laws and Delaware law contain provisions that could have an anti-takeover effect and discourage, delay or prevent a change in control or an acquisition that many stockholders may find attractive. These provisions may also discourage proxy contests and make it more difficult for our stockholders to take some corporate actions, including the election of directors. These provisions relate to:
|
•
|
the ability of our Board of Directors to issue preferred stock, and determine its terms, without a stockholder vote;
|
|
•
|
the classification of our Board of Directors, which effectively prevents stockholders from electing a majority of the directors at any one annual meeting of stockholders;
|
|
•
|
the limitation that directors may be removed only for cause by the affirmative vote of the holders of two-thirds of our shares of capital stock entitled to vote;
|
|
•
|
the prohibition against stockholder actions by written consent;
|
|
•
|
the inability of stockholders to call a special meeting of stockholders; and
|
|
•
|
advance notice requirements for stockholder proposals and director nominations.
|
|
ITEM 1B.
|
Unresolved Staff Comments
|
None.
36
|
ITEM 2.
|
Properties
|
The following table provides information about our principal facilities as of
December 31, 2017
.
|
Location
|
Type
|
Principal Uses
|
Approximate
Square
Footage
|
Ownership
|
Lease
Expiration
|
|||||
|
Middletown, Rhode Island
|
Office
|
Corporate headquarters, research and development, sales and service, marketing and administration
|
75,000
|
Owned
|
—
|
|||||
|
Middletown, Rhode Island
|
Plant and warehouse
|
Manufacturing and warehousing (mobile connectivity products)
|
75,300
|
Owned
|
—
|
|||||
|
Tinley Park, Illinois
|
Plant and warehouse
|
Manufacturing, warehousing, research and development (inertial navigation products)
|
101,000
|
Owned
|
—
|
|||||
|
Horten, Norway
|
Office
|
Research and development, sales, marketing and support
|
4,400
|
Leased
|
December 2018
|
|||||
|
Singapore
|
Office
|
Asian headquarters and sales office
|
3,444
|
Leased
|
April
2022
|
|||||
|
Kokkedal, Denmark
|
Office and warehouse
|
European headquarters, sales, marketing and support
|
11,000
|
Leased
|
3 month notice
|
|||||
|
Leeds, UK
|
Media Lab
|
Audio/video production, sales and support
|
2,608
|
Leased
|
January
2020
|
|||||
|
Liverpool, UK
|
Office
|
Maritime sales, news production, marketing and support
|
4,692
|
Leased
|
June
2023
|
|||||
|
London, UK
|
Office
|
Sales, production, dispatch, and general office
|
5,654
|
Leased
|
August
2019
|
|||||
|
Leeds, UK
|
Office
|
Audio/video production, Media distribution, sales and administration
|
3,628
|
Leased
|
January
2020
|
|||||
|
Manila, Philippines
|
Office
|
News production, inside sales, support
|
7,440
|
Leased
|
September 2021
|
|||||
|
New Delhi, India
|
Office
|
News production
|
1,800
|
Leased
|
November 2025
|
|||||
|
ITEM 3.
|
Legal Proceedings
|
From time to time, we are involved in litigation incidental to the conduct of our business. In the ordinary course of business, we are a party to inquiries, legal proceedings and claims including, from time to time, disagreements with vendors and customers.
|
ITEM 4.
|
Mine Safety Disclosures
|
Not applicable.
37
|
ITEM 5.
|
Market for Registrant’s Common Equity, Related Stockholder Matters and Issuer Purchases of Equity Securities
|
Market Information.
Our common stock trades on the NASDAQ Global Select Market under the symbol “KVHI.” The following table provides, for the periods indicated, the high and low sale prices for our common stock as reported on the NASDAQ Global Select Market.
|
High
|
Low
|
||||||
|
Year Ended December 31, 2017:
|
|||||||
|
First quarter
|
$
|
11.90
|
|
$
|
7.70
|
|
|
|
Second quarter
|
10.20
|
|
7.65
|
|
|||
|
Third quarter
|
12.22
|
|
9.10
|
|
|||
|
Fourth quarter
|
12.65
|
|
9.60
|
|
|||
|
Year Ended December 31, 2016:
|
|||||||
|
First quarter
|
$
|
9.88
|
|
$
|
8.00
|
|
|
|
Second quarter
|
10.20
|
|
7.51
|
|
|||
|
Third quarter
|
9.24
|
|
7.31
|
|
|||
|
Fourth quarter
|
12.75
|
|
7.50
|
|
|||
Stockholders.
As of
February 28, 2018
, we had 70 holders of record of our common stock. This number does not include stockholders for whom shares were held in a nominee or “street” name.
Dividends
. We have never declared or paid cash dividends on our capital stock, and we have no plan to pay any cash dividends in the foreseeable future. We currently intend to retain any future earnings to finance our operations and future growth. In addition, the terms of our senior credit agreement, which we entered into in July 2014, place restrictions on our ability to pay cash dividends on our common stock.
Issuer Purchases of Equity Securities.
On November 26, 2008, our Board of Directors authorized a program to repurchase up to one million shares of our common stock. The repurchase program is funded using our existing cash, cash equivalents, marketable securities, and future cash flows. Under the repurchase program, at management’s discretion, we may repurchase shares on the open market from time to time, in privately negotiated transactions or block transactions, or through an accelerated repurchase agreement. The timing of such repurchases depends on availability of shares, price, market conditions, alternative uses of capital, and applicable regulatory requirements. The program may be modified, suspended, or terminated at any time without prior notice. The repurchase program has no expiration date. There were no other repurchase programs outstanding during the year ended
December 31, 2017
, and no repurchase programs expired during the period.
We did not repurchase any shares of our common stock in open market transactions during the
years ended December 31, 2017, 2016, and 2015
.
During the year ended
December 31, 2017
, 43,000 vested restricted shares were surrendered in satisfaction of tax withholding obligations at an average price of $9.08 per share. There were no shares repurchased in satisfaction of tax withholding obligations during the fourth quarter ended December 31, 2017.
38
STOCK PERFORMANCE GRAPH
The following graph compares the performance of our cumulative stockholder return with that of the NASDAQ Composite Index, a broad equity market index, and the NASDAQ Telecommunications Index, a published industry index. The cumulative stockholder returns for shares of our common stock and for the market indices are calculated assuming $100 was invested on December 31, 2012. We paid no cash dividends during the periods shown. The performance of the market indices is shown on a total return (dividends reinvested) basis. Measurement points are the last trading days of the years ended December 2013, 2014, 2015, 2016, and 2017.
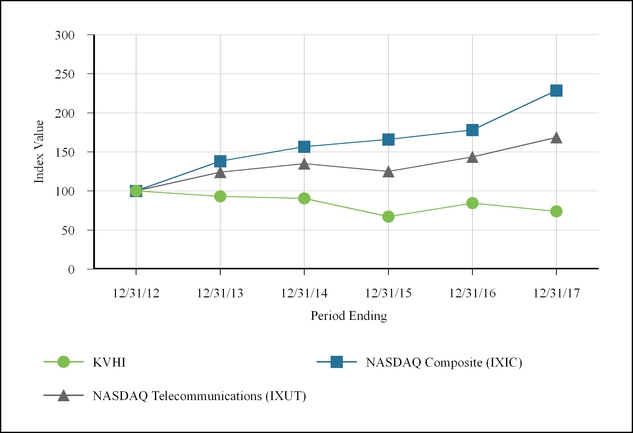
|
|
||||||||||||||||||||||||
|
|
2012
|
2013
|
2014
|
2015
|
2016
|
2017
|
||||||||||||||||||
|
KVH Industries, Inc.
|
$
|
100
|
|
$
|
93
|
|
$
|
90
|
|
$
|
67
|
|
$
|
84
|
|
$
|
74
|
|
||||||
|
NASDAQ Composite
|
100
|
|
138
|
|
157
|
|
166
|
|
178
|
|
229
|
|
||||||||||||
|
NASDAQ Telecommunications
|
100
|
|
124
|
|
135
|
|
125
|
|
144
|
|
169
|
|
||||||||||||
|
ITEM 6.
|
Selected Financial Data
|
We have derived the following selected financial data from our audited consolidated financial statements. You should read this data in conjunction with “Item 7. Management’s Discussion and Analysis of Financial Condition and Results of Operations” and “Item 8. Financial Statements and Supplementary Data.”
In May 2013, we acquired Headland Media Limited (now known as the KVH Media Group) for $24.2 million. In July 2014, we acquired Videotel for
$47.4 million
. See Note 1 to our consolidated financial statements for a summary of significant accounting policies and the effects on the year-to-year comparability of the selected financial data.
39
|
|
Year Ended December 31,
|
||||||||||||||||||
|
|
2017
|
2016
|
2015
|
2014
|
2013
|
||||||||||||||
|
|
(in thousands, except per share data)
|
||||||||||||||||||
|
Consolidated Statement of Operations Data:
|
|||||||||||||||||||
|
Sales:
|
|||||||||||||||||||
|
Product
|
$
|
56,968
|
|
$
|
73,075
|
|
$
|
76,213
|
|
$
|
81,143
|
|
$
|
90,295
|
|
||||
|
Service
|
103,120
|
|
103,047
|
|
108,421
|
|
91,448
|
|
71,993
|
|
|||||||||
|
Net sales
|
160,088
|
|
176,122
|
|
184,634
|
|
172,591
|
|
162,288
|
|
|||||||||
|
Costs and expenses:
|
|||||||||||||||||||
|
Costs of product sales
|
37,474
|
|
46,334
|
|
47,404
|
|
48,843
|
|
51,518
|
|
|||||||||
|
Costs of service sales
|
52,692
|
|
52,966
|
|
54,816
|
|
50,301
|
|
45,058
|
|
|||||||||
|
Research and development
|
15,858
|
|
16,030
|
|
14,039
|
|
14,101
|
|
12,987
|
|
|||||||||
|
Sales, marketing and support
|
33,896
|
|
33,942
|
|
35,714
|
|
32,976
|
|
28,792
|
|
|||||||||
|
General and administrative
|
28,932
|
|
28,172
|
|
29,453
|
|
24,448
|
|
17,764
|
|
|||||||||
|
Total costs and expenses
|
168,852
|
|
177,444
|
|
181,426
|
|
170,669
|
|
156,119
|
|
|||||||||
|
(Loss) income from operations
|
(8,764
|
)
|
(1,322
|
)
|
3,208
|
|
1,922
|
|
6,169
|
|
|||||||||
|
Interest income
|
659
|
|
513
|
|
546
|
|
738
|
|
657
|
|
|||||||||
|
Interest expense
|
1,467
|
|
1,436
|
|
1,460
|
|
1,296
|
|
637
|
|
|||||||||
|
Other (expense) income, net
|
(366
|
)
|
275
|
|
372
|
|
(39
|
)
|
494
|
|
|||||||||
|
(Loss) income before income taxes
|
(9,938
|
)
|
(1,970
|
)
|
2,666
|
|
1,325
|
|
6,683
|
|
|||||||||
|
Income tax expense
|
1,096
|
|
5,547
|
|
413
|
|
1,284
|
|
2,150
|
|
|||||||||
|
Net (loss) income
|
$
|
(11,034
|
)
|
$
|
(7,517
|
)
|
$
|
2,253
|
|
$
|
41
|
|
$
|
4,533
|
|
||||
|
Per share information:
|
|||||||||||||||||||
|
Net (loss) income per common share, basic
|
$
|
(0.67
|
)
|
$
|
(0.47
|
)
|
$
|
0.14
|
|
$
|
—
|
|
$
|
0.30
|
|
||||
|
Net (loss) income per common share, diluted
|
$
|
(0.67
|
)
|
$
|
(0.47
|
)
|
$
|
0.14
|
|
$
|
—
|
|
$
|
0.30
|
|
||||
|
Number of shares used in per share calculation:
|
|||||||||||||||||||
|
Basic
|
16,419
|
|
15,834
|
|
15,625
|
|
15,420
|
|
15,144
|
|
|||||||||
|
Diluted
|
16,419
|
|
15,834
|
|
15,834
|
|
15,605
|
|
15,341
|
|
|||||||||
|
|
December 31,
|
||||||||||||||||||
|
|
2017
|
2016
|
2015
|
2014
|
2013
|
||||||||||||||
|
|
(in thousands)
|
||||||||||||||||||
|
Consolidated Balance Sheet Data:
|
|||||||||||||||||||
|
Cash, cash equivalents, and marketable securities
|
$
|
42,915
|
|
$
|
52,134
|
|
$
|
45,338
|
|
$
|
49,802
|
|
$
|
55,744
|
|
||||
|
Working capital
|
54,430
|
|
69,189
|
|
71,534
|
|
65,200
|
|
78,933
|
|
|||||||||
|
Total assets
|
196,239
|
|
199,757
|
|
226,277
|
|
235,837
|
|
183,849
|
|
|||||||||
|
Line of credit
|
—
|
|
—
|
|
—
|
|
—
|
|
30,000
|
|
|||||||||
|
Long-term debt, excluding current portion
|
44,572
|
|
50,153
|
|
58,054
|
|
64,687
|
|
7,094
|
|
|||||||||
|
Other long-term obligations
|
19
|
|
326
|
|
1,391
|
|
1,459
|
|
204
|
|
|||||||||
|
Total stockholders’ equity
|
105,665
|
|
106,502
|
|
118,176
|
|
116,540
|
|
116,467
|
|
|||||||||
40
|
ITEM 7.
|
Management’s Discussion and Analysis of Financial Condition and Results of Operations
|
The following discussion and analysis should be read in conjunction with the other financial information and consolidated financial statements and related notes appearing elsewhere in this annual report. This discussion contains forward-looking statements that involve risks and uncertainties. Our actual results could differ materially from those anticipated in the forward-looking statements as a result of a variety of factors, including those discussed under the heading “Item 1A. Risk Factors” and elsewhere in this annual report.
Overview
We design, develop, manufacture and market mobile connectivity products and services for the marine and land mobile markets, and inertial navigation products for commercial and defense markets. Our reporting segments are as follows:
|
•
|
the mobile connectivity segment and
|
|
•
|
the inertial navigation segment
|
Through these segments, we manufacture and sell our solutions in a number of major geographic areas, including internationally. We generate a majority of our revenues from various international locations, primarily consisting of Canada, Europe (both inside and outside the European Union), Africa, Asia/Pacific, and the Middle East.
Mobile Connectivity Segment
Our mobile connectivity segment offers satellite communications products and services. Our mobile connectivity products enable customers to receive voice and Internet services and live digital television via satellite services in marine vessels, recreational vehicles, buses and automobiles. Our CommBox offers a range of tools designed to increase communication efficiency, reduce costs, and manage network operations. We sell and lease our mobile connectivity products through an extensive international network of dealers and distributors. We also sell and lease products directly to end users.
Our mobile connectivity service sales include sales of satellite voice and Internet airtime services, engineering services provided under development contracts, sales from product repairs, and extended warranty sales. Our mobile connectivity service sales also include our distribution of entertainment, including news, sports, music, and movies, to commercial and leisure customers in the maritime, hotel, and retail markets through KVH Media Group, as well as the distribution of training films and eLearning computer-based training courses to commercial customers in the maritime market through our Videotel business. We typically recognize revenue from media content sales ratably over the period of the service contract. We provide, for monthly fixed fees and usage-based fees, satellite connectivity services for broadband Internet, data and Voice over Internet Protocol (VoIP) service to our TracPhone V-series customers. We also earn monthly usage fees for third-party satellite connectivity for voice, data and Internet services to our Inmarsat and Iridium customers who choose to activate their subscriptions with us. Our service sales have grown as a percentage of total revenue from
59%
of our net sales in
2015
and
2016
to
64%
in
2017
, a portion of which is attributable to our acquisition of the KVH Media Group business in May 2013 and the Videotel business in July 2014. The majority of Videotel’s services are invoiced in pounds sterling, which increases our exposure to fluctuations in exchange rates.
Inertial Navigation Segment
Our inertial navigation segment offers precision fiber optic gyro (FOG)-based systems that enable platform and optical stabilization, navigation, pointing, and guidance. Our inertial navigation products also include tactical navigation systems that provide uninterrupted access to navigation and pointing information in a variety of military vehicles, including tactical trucks and light armored vehicles. Our inertial navigation products are sold directly to U.S. and foreign governments and government contractors, as well as through an international network of authorized independent sales representatives. In addition, our inertial navigation products are used in numerous commercial products, such as navigation and positioning systems for various applications including precision mapping, dynamic surveying, autonomous vehicles, train location control and track geometry measurement systems, industrial robotics and optical stabilization. Our inertial navigation service sales include engineering services provided under development contracts, product repairs and extended warranty sales.
41
The following table provides, for the periods indicated, our sales by segment:
|
|
Year Ended December 31,
|
||||||||||
|
|
2017
|
2016
|
2015
|
||||||||
|
|
(in thousands)
|
||||||||||
|
Mobile connectivity
|
$
|
132,227
|
|
$
|
141,507
|
|
$
|
147,809
|
|
||
|
Inertial navigation
|
27,861
|
|
34,615
|
|
36,825
|
|
|||||
|
Net sales
|
$
|
160,088
|
|
$
|
176,122
|
|
$
|
184,634
|
|
||
Product sales within the mobile connectivity segment accounted for
20%
, 23% and 23% of our consolidated net sales for 2017, 2016 and 2015, respectively. Sales of mini-VSAT Broadband airtime service accounted for
41%
, 37%, and 35% of our consolidated net sales for 2017, 2016, and 2015, respectively. Sales of content and training services within the mobile connectivity segment accounted for
20%
, 20% and 21% of our consolidated net sales for 2017, 2016 and 2015, respectively.
Within our inertial navigation segment, net sales of FOG-based guidance and navigation systems accounted for
13%
, 10%, and 10% of our consolidated net sales for 2017, 2016, and 2015, respectively.
No other single product class accounted for 10% or more of consolidated net sales. No individual customer accounted for 10% or more of our consolidated net sales for 2017, 2016 or 2015.
We operate in a number of major geographic areas across the globe. We generate our international net sales, based upon customer location, primarily from customers located in Canada, Europe, Africa, Asia/Pacific, the Middle East, and India. Our international net sales totaled
62%
, 63% and 67% of our consolidated net sales for 2017, 2016 and 2015, respectively. Sales to customers located in Canada represented 11% and 10% of net sales for the years ended December 31, 2016 and 2015, respectively. No other individual foreign country represented 10% or more of the Company’s consolidated net sales for 2016 or 2015. No individual foreign country represented 10% or more of our consolidated net sales for the year ended December 31, 2017. See Note 12 to our consolidated financial statements for more information on our segments.
In addition to our internally funded research and development efforts, we also conduct research and development activities that are funded by our customers. These activities relate primarily to engineering studies, surveys, prototype development, program management, and standard product customization. In accordance with accounting principles generally accepted in the United States of America, we account for customer-funded research as service revenue, and we account for the associated research and development costs as costs of service and product sales. As a result, customer-funded research and development are not included in the research and development expense that we present in our statement of operations. The following table presents our total annual research and development effort, representing the sum of research costs of service and product sales and the operating expense of research and development as described in our statement of operations. Our management believes this information is useful because it provides a better understanding of our total expenditures on research and development activities.
|
|
Year ended December 31,
|
||||||||||
|
|
2017
|
2016
|
2015
|
||||||||
|
|
(in thousands)
|
||||||||||
|
Research and development expense presented on the statement of operations
|
$
|
15,858
|
|
$
|
16,030
|
|
$
|
14,039
|
|
||
|
Costs of customer-funded research and development included in costs of service sales
|
1,510
|
|
498
|
|
1,546
|
|
|||||
|
Total consolidated statements of operations expenditures on research and development activities
|
$
|
17,368
|
|
$
|
16,528
|
|
$
|
15,585
|
|
||
42
Results of Operations
The following table provides, for the periods indicated, certain financial data expressed as a percentage of net sales:
|
|
Year Ended December 31,
|
|||||||
|
|
2017
|
2016
|
2015
|
|||||
|
Sales:
|
||||||||
|
Product
|
35.6
|
%
|
41.5
|
%
|
41.3
|
%
|
||
|
Service
|
64.4
|
|
58.5
|
|
58.7
|
|
||
|
Net sales
|
100.0
|
|
100.0
|
|
100.0
|
|
||
|
Costs and expenses:
|
||||||||
|
Costs of product sales
|
23.4
|
|
26.3
|
|
25.7
|
|
||
|
Costs of service sales
|
32.9
|
|
30.1
|
|
29.6
|
|
||
|
Research and development
|
9.9
|
|
9.1
|
|
7.6
|
|
||
|
Sales, marketing and support
|
21.2
|
|
19.3
|
|
19.3
|
|
||
|
General and administrative
|
18.1
|
|
16.0
|
|
16.0
|
|
||
|
Total costs and expenses
|
105.5
|
|
100.8
|
|
98.2
|
|
||
|
(Loss) income from operations
|
(5.5
|
)
|
(0.8
|
)
|
1.8
|
|
||
|
Interest income
|
0.4
|
|
0.3
|
|
0.3
|
|
||
|
Interest expense
|
0.9
|
|
0.8
|
|
0.7
|
|
||
|
Other (expense) income, net
|
(0.2
|
)
|
0.2
|
|
0.2
|
|
||
|
(Loss) Income before income taxes
|
(6.2
|
)
|
(1.1
|
)
|
1.6
|
|
||
|
Income tax expense
|
0.7
|
|
3.1
|
|
0.2
|
|
||
|
Net (loss) income
|
(6.9
|
)%
|
(4.2
|
)%
|
1.4
|
%
|
||
Years ended December 31, 2017 and 2016
Net Sales
As discussed further under the heading "Segment Discussion"
below, product sales decreased $16.1 million, or 22%, to $57.0 million in 2017 from $73.1 million in 2016, due to a decrease in mobile connectivity product sales of $8.7 million and a decrease in inertial navigation product sales of $7.4 million. Service sales for 2017 increased $0.1 million or less than 1%, to $103.1 million from $103.0 million in 2016 due to an increase in inertial navigation service sales of $0.7 million and a decrease in mobile connectivity service sales of $0.6 million.
We have adopted the revenue recognition guidance provided by Accounting Standards Codification (ASC) 606,
Revenue from Contracts with Customers,
effective January 1, 2018 using the modified retrospective method. We expect the adoption of the new guidance to impact the timing of revenue recognition and corresponding costs of product sales for certain mini-VSAT Broadband hardware customer contracts to be deferred and recognized over the estimated customer life of the associated mini-VSAT Broadband service contracts. Please see Note 1 to our accompanying audited consolidated financial statements for further discussion of the impact of our adoption of ASC 606.
43
Costs of Sales
Costs of sales consists of costs of product sales and costs of service sales. Costs of sales decreased in 2017 to $90.2 million from $99.3 million in 2016. The reduction in costs of sales was driven by a decrease in overall sales. As a percentage of net sales, costs of sales was 56% for both 2017 and 2016, respectively.
Our costs of product sales consist primarily of materials, manufacturing overhead, and direct labor used to produce our products. For 2017, costs of product sales decreased by $8.8 million, or 19%, to $37.5 million in 2017 from $46.3 million in 2016. As a percentage of product sales, costs of product sales were 66% and 63% for 2017 and 2016, respectively. The increase in the costs of product sales as a percentage of product sales was due to product mix, primarily due to lower TACNAV product sales, which generally have higher gross margins. Mobile connectivity costs of product sales decreased by $7.1 million, or 24%, primarily due to a $5.9 million decrease in our marine and product accessories mobile connectivity costs of product sales and a $1.2 million decrease in our land mobile costs of product sales. Mobile connectivity costs of product sales as a percentage of mobile connectivity product sales were 71% and 74% for 2017 and 2016, respectively. The decrease was principally driven by product mix. Inertial navigation costs of product sales decreased by $1.7 million, or 11%, primarily due to a $3.3 million decrease in our TACNAV costs of product sales, offset by a $1.6 million increase in our FOG costs of product sales. Inertial navigation costs of product sales as a percentage of inertial navigation product sales was 58% and 50% for 2017 and 2016, respectively. The increase was principally driven by product mix.
Our costs of service sales consist primarily of satellite service capacity, depreciation, service network overhead expense associated with our mini-VSAT Broadband network infrastructure, direct network service labor, Inmarsat service costs, product installation costs, engineering and related direct costs associated with customer-funded research and development, media materials and distribution costs, and service repair materials. For 2017, costs of service sales decreased by $0.3 million, or 1%, to $52.7 million in 2017 from $53.0 million in 2016. As a percentage of service sales, costs of service sales were 51% in each of 2017 and 2016. Mobile connectivity costs of service sales decreased by $1.3 million, or 2%, primarily due to a $2.4 million decrease in content and training costs, partially offset by a $0.9 million increase in airtime costs and $0.2 million increase in airtime services and repairs costs of service sales due to an increase in installations. Mobile connectivity costs of service sales as a percentage of mobile connectivity service sales was 51% and 52% for 2017 and 2016, respectively. Inertial navigation costs of service sales increased by $1.0 million, or 200%, due to an increase in contract engineering service revenues. Inertial navigation costs of service sales as a percentage of inertial navigation service sales was 48% and 21% for 2017 and 2016, respectively. The increase in the inertial navigation costs of service sales as a percentage of inertial navigation service sales was primarily due to the increase in the relative material and labor components needed for the different contract engineering services projects completed in the two periods.
We expect that our costs of sales will generally increase in correlation with our expected growth in our mobile connectivity and inertial navigation net sales. We expect that the mobile connectivity costs of service sales as percentage of mobile connectivity sales will increase as we integrate our HTS airtime network.
Operating Expenses
Research and development expense consists of direct labor, materials, external consultants, and related overhead costs that support our internally funded product development and product sustaining engineering activities. Research and development expense for 2017 decreased by $0.1 million, or 1%, to
$15.9 million
from
$16.0 million
in 2016. The primary reasons for the decrease in expense in 2017 were a $1.1 million decrease in unfunded engineering expenses, a $0.4 million decrease in expensed materials and hardware maintenance, partially offset by a $1.5 million increase in salaries and employee benefits. As a percentage of net sales, research and development expense was
10%
and
9%
in 2017 and 2016, respectively.
We expect that research and development expense will grow year-over-year as we continue to invest in developing new technologies and applications for our products.
Sales, marketing, and support expense consists primarily of salaries and related expenses for sales and marketing personnel, commissions for both in-house and third-party representatives, costs related to the co-development of certain content, other sales and marketing support costs such as advertising, literature and promotional materials, product service personnel and support costs, warranty-related costs and bad debt expense. Sales, marketing and support expense also includes the operating expenses of our sales office subsidiaries in Denmark, Singapore, Brazil, and Japan. Sales, marketing, and support expense remained flat at $33.9 million for 2017 and 2016. In 2017 there was a $0.6 million decrease in warranty expense, which was offset by a $0.1 million increase in bad debt expense due to improved collection efforts and a $0.5 million increase in employee termination costs primarily related to staff reductions. As a percentage of net sales, sales, marketing and support expense was 21% and 19% in 2017 and 2016, respectively.
44
We expect that our sales, marketing, and support expense will increase year-over-year primarily driven by increased personnel, marketing and technology investments to support product sales and launches.
General and administrative expense consists of costs attributable to management, finance and accounting, information technology, human resources, certain outside professional services, and other administrative costs. General and administrative expense for 2017 increased by $0.7 million, or 2%, to $28.9 million from $28.2 million for 2016. The primary reasons for the increase in 2017 was a $1.9 million increase in salaries and employee benefits, including employee termination costs. This was partially offset by a $0.4 million decrease in depreciation and amortization, a $0.4 million decrease in legal and professional fees and a $0.2 million decrease in expensed materials and hardware maintenance. As a percentage of net sales, general and administrative expense was 18% and 16% for 2017 and 2016, respectively.
We expect general and administrative expenses to increase year-over-year in 2018, primarily driven by increased personnel costs.
Interest and Other (Expense) Income, Net
Interest income increased by $0.2 million, or 40%, to $0.7 million from $0.5 million for 2016 and relates to interest earned on our cash and cash equivalents, as well as from investments. Interest expense for 2017 increased by less than $0.1 million, or 7%, to $1.5 million from $1.4 million for 2016 due to the change in the variable interest rate related to our term loan. Other (expense) income, net for 2017 decreased by $0.7 million or 233%, primarily due to $0.6 million of foreign exchange transaction losses in 2017 compared to $0.1 million of foreign exchange translation gains in 2016, primarily due to fluctuation of the pounds sterling.
Income Tax Expense
Income tax expense for 2017 was $1.1 million as compared to $5.5 million for 2016. Current year income tax expense is related to taxes on income earned in foreign jurisdictions. The current year loss in the U.S. and Brazil did not result in income tax benefit due to recording an additional valuation allowance of $3.3 million on the related net deferred tax assets. In 2016, the Company recorded a valuation allowance on its U.S. and Brazilian deferred tax assets of $6.8 million. This valuation allowance was recorded as we concluded that it was more likely than not that certain of our U.S. and Brazilian deferred tax assets were not realizable primarily based on the three-year cumulative pre-tax loss as of December 31, 2016.
The effective tax rate for 2017 was (11.0%). The primary driver of the difference between our effective tax rate as compared to the United States federal statutory rate was the impact of recording valuation reserves on the current year tax benefit generated on U.S. net operating losses and tax credits. This impact was partially offset by income taxed at lower foreign tax rates. The effective income tax rate of (281.6%) for 2016 differs from the U.S. federal statutory rate principally as a result of recording the valuation reserve against the U.S. deferred tax assets, which was partially offset by income taxed at lower foreign tax rates.
45
Segment Discussion - Years ended December 31, 2017 and 2016
Our net sales by segment for 2017 and 2016 were as follows:
|
Change
|
||||||||||||||
|
For the year ended December 31,
|
2017 vs. 2016
|
|||||||||||||
|
2017
|
2016
|
$
|
%
|
|||||||||||
|
(dollars in thousands)
|
||||||||||||||
|
Mobile connectivity sales
|
||||||||||||||
|
Product
|
$
|
32,175
|
|
$
|
40,904
|
|
$
|
(8,729
|
)
|
(21
|
)%
|
|||
|
Service
|
100,052
|
|
100,603
|
|
(551
|
)
|
(1
|
)%
|
||||||
|
Net sales
|
$
|
132,227
|
|
$
|
141,507
|
|
$
|
(9,280
|
)
|
(7
|
)%
|
|||
|
Inertial navigation sales
|
||||||||||||||
|
Product
|
$
|
24,793
|
|
$
|
32,171
|
|
$
|
(7,378
|
)
|
(23
|
)%
|
|||
|
Service
|
3,068
|
|
2,444
|
|
624
|
|
26
|
%
|
||||||
|
Net sales
|
$
|
27,861
|
|
$
|
34,615
|
|
$
|
(6,754
|
)
|
(20
|
)%
|
|||
Operating earnings (loss) by segment for 2017 and 2016 were as follows:
|
Change
|
||||||||||||||
|
For the year ended December 31,
|
2017 vs. 2016
|
|||||||||||||
|
2017
|
2016
|
$
|
%
|
|||||||||||
|
(dollars in thousands)
|
||||||||||||||
|
Mobile connectivity
|
$
|
7,334
|
|
$
|
10,041
|
|
$
|
(2,707
|
)
|
(27
|
)%
|
|||
|
Inertial navigation
|
556
|
|
5,272
|
(4,716
|
)
|
(89
|
)%
|
|||||||
|
$
|
7,890
|
|
$
|
15,313
|
|
$
|
(7,423
|
)
|
(48
|
)%
|
||||
|
Unallocated
|
(16,654
|
)
|
(16,635
|
)
|
(19
|
)
|
—
|
%
|
||||||
|
Operating loss
|
$
|
(8,764
|
)
|
$
|
(1,322
|
)
|
$
|
(7,442
|
)
|
563
|
%
|
|||
Mobile Connectivity Segment
Net sales in the mobile connectivity segment decreased $9.3 million, or 7%, in 2017 as compared to 2016. Mobile connectivity product sales decreased by $8.7 million, or 21%, to $32.2 million in 2017 from $40.9 million in 2016. The decrease was primarily due to a $7.4 million, or 20%, decrease in marine mobile connectivity product sales and a $1.3 million, or 29%, decrease in sales of our land mobile connectivity products. The decrease was partly due to the receipt of a particularly large order in 2016, as well as the impact of the new AgilePlans subscription service. The hurricanes in the Caribbean and the Gulf of Mexico in the 2017 third quarter and inclement weather in the 2017 second quarter, particularly in the US East Coast region, also impacted our marine business as boat owners delayed the seasonal retrofitting of their vessels.
We have adopted the revenue recognition guidance under ASC 606 effective January 1, 2018 using the modified retrospective method. We expect the adoption of the new guidance to impact the timing of revenue recognition and corresponding costs of product sales for certain mini-VSAT Broadband hardware customer contracts to be deferred and recognized over the estimated customer life of the associated mini-VSAT Broadband service contracts. Please see Note 1 to our accompanying audited consolidated financial statements for further discussion of the impact of our adoption of ASC 606.
46
Mobile connectivity service sales decreased by $0.6 million, or 1%, to $100.0 million in 2017 from $100.6 million in 2016. The decrease was primarily due to a $3.1 million decrease in our content and training service revenue, which resulted primarily from exchange rate fluctuations impacting our content and training service sales recorded in pounds sterling, a decrease in fleet subscribers and a large film contract that occurred in the third quarter of 2016, and a $0.5 million decrease in Inmarsat service sales due to an overall decrease in Inmarsat airtime customers. Partially offsetting these decreases was a $2.8 million increase in mini-VSAT service sales driven by an increase in the number of installed mini-VSAT units, as well as an increase in the number of service offerings and a $0.2 million increase in activations and other mobile connectivity services.
We expect that our mini-VSAT service sales will continue to grow year-over-year, primarily through the continued expansion of our mini-VSAT Broadband customer base, and due to the availability of our AgilePlans subscription service model which we initiated in our 2017 second quarter. We expect that mini-VSAT product sales may decline if customers select the new subscription service model.
Operating earnings for the mobile connectivity segment decreased $2.7 million, or 27%, in 2017 as compared to 2016. This decrease was primarily the result of a decrease in product sales less associated costs of $1.6 million, offset somewhat by an increase in service sales less associated costs of $0.7 million. In addition, operating expenses increased in 2017 due to an increase in employee salaries and benefits of $1.8 million and an increase in employee termination costs of $0.8 million, offset somewhat by a $0.6 million decrease in warranty expense, and a $0.5 million decrease in external commissions and certain royalty expenses.
We expect our overall mobile connectivity operating earnings to show modest growth in 2018 through market expansion and as existing customers expand their mini-VSAT Broadband usage and as customers take advantage of the AgilePlans subscription service option.
Inertial Navigation Segment
Net sales in the inertial navigation segment decreased $6.7 million, or 19%, in 2017 as compared to 2016. Inertial navigation product sales decreased $7.4 million, or 23%, to $24.8 million in 2017 from $32.2 million in 2016.
Specifically, sales of our TACNAV products decreased $10.3 million, or 69%, partially offset by a $2.8 million, or 16%, increase in FOG product sales. TACNAV sales decreased due to orders filled in 2016 that did not reoccur in 2017. Inertial navigation service sales increased $0.7 million, or 29%, to $3.1 million in 2017 from $2.4 million for 2016. The primary reason for the increase was a $1.2 million, or 86%, increase in contracted engineering services due to a new project that began in January 2017 and was completed in the third quarter of 2017. This increase was partially offset by a $0.5 million decrease in inertial navigation repair revenue.
We expect to see modest growth in our FOG products in 2018 due to a higher backlog entering the year. We also expect to see growth in contracted engineering services year-over-year. However, it is challenging to predict whether sales of our TACNAV products will increase in 2018 as we cannot predict when specific orders, which could be individually significant, may be received, if at all.
Operating earnings for the inertial navigation segment decreased $4.7 million, or 89%, in 2017 as compared to 2016. This decrease is primarily due to the net decrease in product sales and service sales of $6.7 million and a $0.2 million increase in employee salaries and benefits, partially offset by a $0.6 million decrease in unfunded engineering costs.
We expect our overall inertial navigation operating earnings to increase modestly in 2018 due to the higher backlog of FOG products entering the year and due to the higher expected increase in contracted engineering service sales.
Unallocated
Certain corporate-level costs have not been allocated because they are not attributable to either segment. These costs primarily consist of broad corporate functions, including executive, legal, finance, information technology, and costs associated with corporate actions.
Unallocated operating loss was approximately $16.6 million for both 2017 and 2016. This was due to a $0.4 million decrease in consulting fees, offset by a $0.3 million increase in salaries and benefits and a $0.1 million increase in legal and accounting fees.
47
Years ended December 31, 2016 and 2015
Net Sales
As discussed further under the heading "Segment Discussion"
below, product sales decreased $3.1 million, or 4%, to $73.1 million in 2016 from $76.2 million in 2015, due to a decrease in mobile connectivity product sales of $2.2 million and a decrease in inertial navigation product sales of $0.9 million. Service sales for 2016 decreased $5.4 million to $103.0 million from $108.4 million for 2015 due to a decrease in mobile connectivity service sales of $4.0 million and a decrease in inertial navigation service sales of $1.4 million or 35%.
Costs of Sales
Costs of sales consists of costs of product sales and costs of service sales. Costs of sales decreased in 2016 to $99.3 million from $102.2 million in 2015. The reduction in costs of sales was driven by a decrease in overall sales. As a percentage of net sales, costs of sales was 56% and 55% for 2016 and 2015, respectively. The slightly higher percentage of costs of sales compared to total net sales in 2016 was driven by a slight increase in the percentage of costs of product sales compared to product sales.
Our costs of product sales consist primarily of materials, manufacturing overhead, and direct labor used to produce our products. For 2016, costs of product sales decreased by $1.1 million, or 2% to $46.3 million in 2016 from $47.4 million in 2015. As a percentage of product sales, costs of product sales were 63% and 62% for 2016 and 2015, respectively. The increase in the percentage of costs of product sales compared to product sales was due to increases in product and freight costs, an increase in wage and benefit expenses due to a slight increase in headcount, as well as lower overhead absorption due to lower manufacturing volumes driven by lower product sales. Mobile connectivity costs of product sales decreased by $1.0 million, or 3%, primarily due to a $1.4 million decrease in our marine mobile connectivity costs of product sales, partially offset by a $0.4 million increase in our land mobile costs of product sales. Mobile connectivity costs of product sales as a percentage of mobile connectivity product sales were 74% and 72% for 2016 and 2015, respectively. The increase was principally driven by lower marine product sales which are higher margin products. Inertial navigation costs of product sales decreased by $0.1 million, or 1%, primarily due to a $0.9 million decrease in our FOG costs of product sales, offset by a $0.8 million increase in our TACNAV costs of product sales. Inertial navigation costs of product sales as a percentage of inertial navigation product sales was 50% and 49% for 2016 and 2015, respectively. The increase was primarily driven by product mix.
Our costs of service sales consist primarily of satellite service capacity, depreciation, service network overhead expense associated with our mini-VSAT Broadband network infrastructure, direct network service labor, Inmarsat service costs, product installation costs, engineering and related direct costs associated with customer-funded research and development, media materials and distribution costs, and service repair materials. For 2016, costs of service sales decreased by $1.9 million, or 3%, to $53.0 million in 2016 from $54.8 million in 2015. As a percentage of service sales, costs of service sales were 51% and 51% for 2016 and 2015, respectively. Mobile connectivity costs of service sales decreased by $0.8 million, or 2%, primarily due to a $1.2 million decrease in airtime costs due to airtime cost-saving initiatives, partially offset by a $0.4 million increase in airtime services and repairs costs of service sales due to an increase in installations. Mobile connectivity costs of service sales as a percentage of mobile connectivity service sales was 52% and 51% for 2016 and 2015, respectively. Inertial navigation costs of service sales decreased by $1.1 million, or 68%, due to the decrease in contract engineering services. Inertial navigation costs of service sales as a percentage of inertial navigation service sales was 21% and 41% for 2016 and 2015, respectively. The decrease in the inertial navigation costs of service sales as a percentage of inertial navigation service sales was primarily due to the differences in the relative material and labor components needed for the different contract engineering services projects completed in the two periods.
Operating Expenses
Research and development expense consists of direct labor, materials, external consultants, and related overhead costs that support our internally funded product development and product sustaining engineering activities. Research and development expense for 2016 increased by $2.0 million, or 14%, to $16.0 million from $14.0 million in 2015. The primary reasons for the increase in expense in 2016 were a $1.2 million increase in labor expenses and outside consulting fees, an increase of $0.5 million in expensed materials, and a $0.1 million increase in tooling and set-up charges. The primary reason for the increase in research and development expense is an increase in overall expenditures for new initiatives, as well as a decrease in the level of customer-funded engineering projects where the support costs are included in costs of service sales. As a percentage of net sales, research and development expense was 9% and 8% in 2016 and 2015, respectively.
48
Sales, marketing, and support expense consists primarily of salaries and related expenses for sales and marketing personnel, commissions for both in-house and third-party representatives, costs related to the co-development of certain content, other sales and marketing support costs such as advertising, literature and promotional materials, product service personnel and support costs, warranty-related costs and bad debt expense. Sales, marketing and support expense also includes the operating expenses of our sales office subsidiaries in Denmark, Singapore, Brazil, and Japan. Sales, marketing, and support expense for 2016 decreased by $1.8 million, or 5%, to $33.9 million from $35.7 million for 2015. The primary reasons for the decrease in 2016 were a $1.9 million decrease in commissions due to lower sales and a $0.3 million decrease in bad debt expense due to improved collection efforts, partially offset by a $0.3 million increase in warranty expense primarily related to an increase in the number of our mobile connectivity products under warranty. As a percentage of net sales, sales, marketing and support expense was 19% in both 2016 and 2015.
General and administrative expense consists of costs attributable to management, finance and accounting, information technology, human resources, certain outside professional services, and other administrative costs. General and administrative expense for 2016 decreased by $1.3 million, or 4%, to $28.2 million from $29.5 million for 2015. The primary reasons for the decrease in 2016 expense were a $1.5 million decrease in compensation and consulting expense primarily due to the decrease in executive bonuses and profit sharing, as well as a decrease in expenses arising from the centralization of administrative functions in the UK and a $0.4 million decrease in legal settlement expense due to settlement of patent infringement matters where settlement was accrued in 2015, partially offset by a $0.5 million increase in computer maintenance for new software subscriptions and software support as a result of additional purchased software and related maintenance. As a percentage of net sales, general and administrative expense was 16% for both 2016 and 2015.
Interest and Other Expense (Income), Net
Interest income was $0.5 million for both 2016 and 2015 and relates to interest earned on our cash and cash equivalents, as well as from investments. Interest expense for 2016 decreased slightly by $0.1 million, or 7%, to $1.4 million from $1.5 million for 2015 due to a reduction in our overall debt obligations. Other income, net for 2016 decreased by $0.1 million or 25%, to $0.3 million from $0.4 million for 2015 primarily due to foreign exchange transaction losses as a result of the fluctuation of the pounds sterling.
Income Tax Expense
Income tax expense for 2016 was $5.5 million as compared to $0.4 million for 2015. The significant increase in income tax expense for 2016 was principally due to a change in the valuation allowance of our deferred tax assets of approximately $6.8 million. We assessed evidence of the realizability of our deferred tax assets as of December 31, 2016 and, based on the three-year cumulative pre-tax loss as of December 31, 2016, we concluded that it was more likely than not that certain of our deferred tax assets were not realizable and recorded a full valuation allowance against these deferred tax assets. This is the key driver of the difference between our effective tax rate as compared to the United States federal statutory rate. This impact was partially offset by the impact of foreign tax rates and research and development tax credits. The effective income tax rate of 16% for 2015 differs from the United States federal statutory rate of 35% principally as a result of the impact of foreign tax rates, research and development tax credits and reduction in uncertain tax positions as a result of settlements with taxing authorities partially offset by changes in the valuation allowance against our deferred tax assets.
49
Segment Discussion - Years ended December 31, 2016 and 2015
Our net sales by segment for 2016 and 2015 were as follows:
|
Change
|
||||||||||||||
|
For the year ended December 31,
|
2016 vs. 2015
|
|||||||||||||
|
2016
|
2015
|
$
|
%
|
|||||||||||
|
(dollars in thousands)
|
||||||||||||||
|
Mobile connectivity sales
|
||||||||||||||
|
Product
|
$
|
40,904
|
|
$
|
43,169
|
|
$
|
(2,265
|
)
|
(5
|
)%
|
|||
|
Service
|
100,603
|
|
104,640
|
|
(4,037
|
)
|
(4
|
)%
|
||||||
|
Net sales
|
$
|
141,507
|
|
$
|
147,809
|
|
$
|
(6,302
|
)
|
(4
|
)%
|
|||
|
Inertial navigation sales
|
||||||||||||||
|
Product
|
$
|
32,171
|
|
$
|
33,044
|
|
$
|
(873
|
)
|
(3
|
)%
|
|||
|
Service
|
2,444
|
|
3,781
|
|
(1,337
|
)
|
(35
|
)%
|
||||||
|
Net sales
|
$
|
34,615
|
|
$
|
36,825
|
|
$
|
(2,210
|
)
|
(6
|
)%
|
|||
Operating earnings (loss) by segment for 2016 and 2015 were as follows:
|
Change
|
||||||||||||||
|
For the year ended December 31,
|
2016 vs. 2015
|
|||||||||||||
|
2016
|
2015
|
$
|
%
|
|||||||||||
|
(dollars in thousands)
|
||||||||||||||
|
Mobile connectivity
|
$
|
10,041
|
|
$
|
9,459
|
|
$
|
582
|
|
6
|
%
|
|||
|
Inertial navigation
|
5,272
|
7,934
|
(2,662
|
)
|
(34
|
)%
|
||||||||
|
$
|
15,313
|
|
$
|
17,393
|
|
$
|
(2,080
|
)
|
(12
|
)%
|
||||
|
Unallocated
|
(16,635
|
)
|
(14,185
|
)
|
(2,450
|
)
|
17
|
%
|
||||||
|
Operating (loss) earnings
|
$
|
(1,322
|
)
|
$
|
3,208
|
|
$
|
(4,530
|
)
|
(141
|
)%
|
|||
Mobile Connectivity Segment
Net sales in the mobile connectivity segment decreased $6.3 million, or 4%, in 2016 as compared to 2015. Mobile connectivity product sales decreased by $2.3 million, or 5%, to $40.9 million in 2016 from $43.2 million in 2015. The decrease was primarily due to a $2.6 million, or 21%, decrease in European mini-VSAT product sales due to a slowdown in the European maritime markets and a $0.3 million, or 1%, decrease in our US marine mobile connectivity product sales, partially offset by a $0.6 million increase in sales of our land mobile connectivity products. Mobile connectivity service sales decreased by $4.0 million, or 4%, to $100.6 million in 2016 from $104.6 million in 2015. The decrease was primarily due to a $3.6 million decrease in our content and training service revenue, which resulted primarily from exchange rate weakness arising from content and training service sales recorded in pounds sterling, and a $0.7 million decrease in Inmarsat service sales due to a 14% decrease in Inmarsat airtime customers. Partially offsetting these decreases was a $0.3 million increase in mini-VSAT service sales driven by an increase in the number of installed mini-VSAT units, as well as an increase in number of service offerings.
Operating earnings for the mobile connectivity segment increased $0.6 million, or 6%, in 2016 as compared to 2015. This change was principally due to a decrease in operating costs related to the centralization of certain administrative functions in the UK, a decrease in the exchange rate of the pounds sterling and airtime cost savings initiatives. The increase in operating expenses was partially offset by the decrease in product and service sales.
50
Inertial Navigation Segment
Net sales in the inertial navigation segment decreased $2.2 million, or 6%, in 2016 as compared to 2015. Inertial navigation product sales decreased $0.9 million, or 3%, to $32.2 million in 2016 from $33.1 million in 2015.
Specifically, sales of our FOG products decreased $1.2 million, or 7%, partially offset by a $0.3 million, or 2%, increase in TACNAV sales. TACNAV sales increased due to large but anticipated orders that were in our backlog. FOG product sales decreased due to a decrease in sales of our single and dual axis FOG units, partially offset by increased sales of our IMU FOG units. Inertial navigation service sales decreased $1.4 million, or 35%, to $2.4 million in 2016 from $3.8 million for 2015. The primary reason for the decrease was a $1.6 million, or 53%, decrease in contracted engineering services due to a prior year project which was completed during the first half of 2016. This decrease was partially offset by a $0.3 million increase in inertial navigation repair revenue.
Operating earnings for the inertial navigation segment decreased $2.7 million, or 34%, in 2016 as compared to 2015. This decrease is primarily due to the $2.2 million decrease in product and service sales and a $0.6 million decrease in sales representative commissions due to these lower sales. Partially offsetting this decrease is a slight increase in costs of product sales as a percentage of product sales.
Unallocated
Certain corporate-level costs have not been allocated because they are not attributable to either segment. These costs primarily consist of broad corporate functions, including executive, legal, finance, information technology, and costs associated with corporate actions.
Unallocated operating loss was $16.6 million and $14.2 million for 2016 and 2015, respectively. The increase in the operating loss was primarily the result of a $1.4 million increase in salary and benefits due to an increase in corporate headcount partially offset by a decrease in executive bonuses, a $0.5 million increase in outside consulting that includes accounting and legal fees, and a $0.5 million increase in computer maintenance fees due to new internal analytical software subscription and support.
Critical Accounting Policies and Significant Estimates
The discussion and analysis of our financial condition and results of operations are based upon our consolidated financial statements, which have been prepared in accordance with accounting principles generally accepted in the United States. The preparation of these financial statements requires us to make estimates and judgments that affect the reported amounts of assets and liabilities, revenues and expenses, and related disclosure at the date of our financial statements. Our significant accounting policies are summarized in Note 1 to our consolidated financial statements. The significant accounting policies that we believe are the most critical in understanding and evaluating our reported financial results include the following:
Revenue Recognition
Product sales.
Product sales are recognized when persuasive evidence of an arrangement exists, goods are shipped, title has passed, and collectability is reasonably assured. Our standard sales terms require that:
|
•
|
All sales are final;
|
|
•
|
Terms are generally Net 30;
|
|
•
|
Shipments are tendered and shipped FOB (or as may be applicable, FCA or EXW) our plant or warehouse; and
|
|
•
|
Title and risk of loss or damage passes to the dealer or distributor at the point of shipment when delivery is made to the possession of the carrier.
|
For certain inertial navigation product sales, customer acceptance or inspection may be required before title and risk of loss transfers to the customer. For those sales, revenue is recognized after transfer of title and risk of loss and after notification of customer acceptance. In certain circumstances customers may request a bill and hold arrangement. Under these bill and hold arrangements, revenue is recognized when we have fulfilled all of our performance obligations, the units are segregated and available for shipment in accordance with the defined contract delivery schedule, and we have received notification of customer acceptance which transfers title and risk of loss to the customer.
51
Under certain limited conditions, we, at our sole discretion, provide for the return of goods. No product is accepted for return and no credit is allowed on any returned product unless we have granted and confirmed prior written permission by means of appropriate authorization. We establish reserves for potential sales returns, credits and allowances, and evaluate, on a monthly basis, the adequacy of those reserves based upon historical experience and our expectations for the future.
Multiple-element revenue arrangements
. Some of our sales involve multiple-element arrangements that include both hardware-related products and contracted service, or satellite connectivity. We analyze revenue arrangements with multiple deliverables to determine if the deliverables should be divided into more than one unit of accounting. For contracts with more than one unit of accounting, we allocate the consideration we receive among the separate units of accounting based on a selling price hierarchy for determining the selling price of each deliverable, which includes: (1) vendor-specific objective evidence (VSOE) if available; (2) third-party evidence (TPE) if VSOE is not available; and (3) best estimated selling price (BESP), if neither VSOE nor TPE is available. Best estimate selling price is determined based on prices of the deliverables if sold on a stand-alone basis, or if not sold on a stand-alone basis, the prices we would charge if sold on a stand-alone basis. We recognize revenue for each deliverable based on the revenue recognition policies described in this section.
Contracted service sales
. We also engage in contracts for development, production and services activities related to standard product modification or enhancement, which we account for using the proportional performance method of revenue recognition. The use of contract accounting requires significant judgment relative to estimating total contract revenues and costs, including assumptions relative to the length of time to complete the contract, the nature and complexity of the work to be performed, and prices for subcontractor services and materials. Our estimates are based upon the professional knowledge and experience of our engineers, program managers and other personnel, who review each long-term contract monthly to assess the contract's schedule, performance, technical matters, and estimated cost at completion. A cancellation, schedule delay, or modification of a fixed-price contract which is accounted for using the proportional performance method may adversely affect our gross margins for the period in which the contract is modified. Changes in estimates are applied when adjustments in estimated contract costs are identified, such revisions may result in current period adjustments to earnings applicable to performance in prior periods.
Satellite connectivity and media content sales
. Directly sold and re-sold satellite connectivity service for voice, data and Internet is recognized monthly based upon minutes or megabytes of traffic processed or contracted fixed fee schedules. Typically, all subscribers enter into a contracted one-year minimum service agreement. We have evaluated the factors within ASC 605 regarding gross versus net revenue reporting for our satellite connectivity service sales and our payments to the applicable service providers. Based on the evaluation of the factors within ASC 605, we have determined that the applicable indicators of gross revenue reporting were met. The applicable indicators of gross revenue reporting included, but were not limited to, the following:
|
•
|
We are the primary obligor in our arrangements with our subscribers. We manage all interactions with the subscribers, while satellite connectivity service providers do not interact with the subscribers. In addition, we assume the entire performance risk under our arrangements with the subscribers and in the event of a performance issue, we may incur reduction in fees without regard for any recourse that we may have with the applicable satellite connective service providers.
|
|
•
|
We have latitude in establishing pricing, as the pricing under our arrangements with the subscribers is negotiated through a contracting process and we have discretion in establishing pricing. We then separately negotiated the fees with the applicable satellite service providers.
|
|
•
|
We have had complete discretion in determining which satellite service providers with which we will contract with.
|
As a result, we have determined that we earn revenue (as a principal) from the delivery of satellite connectivity services to our subscribers and record all satellite connectivity service sales to subscribers as gross sales. All associated regulatory service fees and costs are recorded net in our consolidated financial statements. Media content sales include our distribution of commercially licensed news, sports, movies and music content for commercial and leisure customers in the maritime, hotel, and retail markets as well as training videos to the merchant marine market that are typically based on a contracted fixed fee schedule. We typically recognize revenue from media content sales ratably over the period of the service contract. The accounting estimates related to the recognition of satellite connectivity and media content service sales in our results of operations require us to make assumptions about future billing adjustments for disputes with subscribers as well as unauthorized usage.
For further discussion of revenue recognition and the impact of the new revenue recognition guidance provided by ASC 606, which we adopted using the modified retrospective method as of January 1, 2018, please refer to Note 1 to our accompanying audited consolidated financial statements.
52
Accounts Receivable Allowance
Our estimate of allowance for doubtful accounts related to trade receivables is primarily based on specific and historical criteria. We evaluate specific accounts where we have information that the customer may have an inability to meet its financial obligations. We make judgments, based on facts and circumstances, regarding the need to record a specific reserve for that customer against amounts owed to reduce the receivable to the amount that we expect to collect. We also provide for a reserve based on an aging analysis of our accounts receivable. We evaluate these reserves on a monthly basis and adjust them as we receive additional information that impacts the amount reserved. If circumstances change, we could change our estimates of the recoverability of amounts owed to us by a material amount. Our bad debt expense decreased by
$0.2 million
in
2017
from
2016
, driven by improved collections efforts.
We wrote off
$1.3 million
, $0.9 million, and $0.5 million of our accounts receivable in
2017
,
2016
, and
2015
, respectively. These write-offs were driven largely by the financial deterioration of several airtime and lease customers as well as several mobile connectivity product distributors and eLearning customers.
Inventories
Inventory is valued at the lower of cost or net realizable value. We generally must order components for our products and build inventory in advance of product shipments. We regularly review current quantities on hand, actual and projected sales volumes and anticipated selling prices on products and write down, as appropriate, slow-moving and/or obsolete inventory to its net realizable value. In
2017
we wrote off an immaterial balance and in
2016
and
2015
, we wrote off $0.2 million and $0.3 million of inventory, respectively, that was previously deemed excess or obsolete inventory and whose carrying values had previously been reduced to zero. However, if we overestimate projected sales or anticipated selling prices, our inventory might be overstocked or overvalued, and we would have to reduce our inventory valuation accordingly.
Accounting for Income Taxes
We are subject to income taxes in the U.S. and in numerous foreign jurisdictions. The Company accounts for income taxes following ASC 740,
Accounting for Income Taxes,
recognizing deferred tax assets and liabilities using enacted tax rates for the effect of temporary differences between book and tax basis of recorded assets and liabilities. Deferred tax assets are reduced by a valuation allowance if it is more likely than not that some or all of a deferred tax asset will not be realized.
As part of the process of preparing our financial statements, we are required to estimate our provision for income taxes in each of the jurisdictions in which we operate. This involves estimating our actual current tax exposure, including assessing the risks associated with tax audits, together with assessing temporary differences resulting from the different treatment of items for tax and accounting purposes. These differences result in deferred tax assets and liabilities. We assess the likelihood that our deferred tax assets will be recovered from future taxable income and record a valuation allowance to reduce the deferred tax assets to an amount that, in our judgment, is more likely than not to be recovered.
Management judgment is required in determining our provision for income taxes, our deferred tax assets and liabilities, and any valuation allowance recorded against our deferred tax assets. The valuation allowance is based on our estimates of future taxable income and the period over which we expect the deferred tax assets to be recovered. Our assessment of future taxable income is based on historical experience and current and anticipated market and economic conditions and trends. In the event that actual results differ from these estimates or we adjust our estimates in the future, we may need to adjust our valuation allowance, which could materially impact our consolidated financial position and results of operations. In 2016, as a result of negative evidence, principally three years of cumulative pre-tax operating losses, we concluded that it was more likely than not that certain of our deferred tax assets were not realizable and therefore, recorded a full valuation allowance against those deferred tax assets. As of
December 31, 2017
, we concluded that a net increase of the valuation allowance of $4.4 million was appropriate. As of
December 31, 2017
, we had valuation allowances of $
16.0 million
to offset gross deferred tax assets of $17.8 million.
We record benefits for uncertain tax positions based on an assessment of whether it is more likely than not that the tax positions will be sustained by the taxing authorities. If this threshold is not met, no tax benefit of the uncertain position is recognized. The tax benefit to be recognized of any tax position that meets the more likely than not recognition threshold is calculated as the largest amount that is
more than 50%
likely of being realized upon resolution of the contingency.
We recognize interest and penalties within the income tax expense line in the accompanying consolidated statements of operations. Accrued interest and penalties are included within the related tax liability line in the consolidated balance sheets.
53
Tax Reform
The 2017 Tax Cut and Jobs Act (the "Tax Act") has resulted in significant changes to the U.S. corporate income tax system. These changes include a federal statutory rate reduction from 35% to 21%, the elimination or reduction of certain domestic deductions and credits and limitations on the deductibility of interest expense and executive compensation. The 2017 Tax Act also transitions international taxation from a worldwide system to a modified territorial system and includes base erosion prevention measures on non-U.S. earnings, which has the effect of subjecting certain earnings of our foreign subsidiaries to U.S. taxation as GILTI. These changes are effective beginning in 2018.
The 2017 Tax Act also includes the Transition Toll Tax, which is a one-time mandatory deemed repatriation tax on accumulated foreign subsidiaries' previously untaxed foreign earnings.
Changes in tax rates and tax laws are accounted for in the period of enactment. Therefore, during the year ended December 31, 2017, we recorded a reduction in our deferred tax assets and corresponding valuation allowance of $1.7 million and a net tax benefit of $0.1 million related to our estimate of the provision of the 2017 Tax Act. Included in $1.7 million reduction in our deferred tax assets and corresponding valuation allowance, is $0.8 million related to the Transition Toll Tax.
We do not expect the 2017 Tax Act to have a significant impact on our effective tax rate in 2017 or 2018 due to the full valuation reserve recorded on U.S. deferred tax assets.
The Securities and Exchange Commission released Staff Accounting Bulletin (SAB) No. 118 to provide guidance to companies on how to implement the accounting and disclosure changes as a result of the Tax Act. The SEC staff guidance has recognized that, due to the complexity and timing of the release of the Tax Act, the accounting for this change in the law may be incomplete upon issuance of a company's financial statements for the reporting period in which the Tax Act was enacted. SAB No. 118 states that if a company can determine a reasonable estimate for the effects of the Tax Act then this estimate can be included in the financial statements. We have made a preliminary estimate of the Transition Toll Tax and the remeasurement of our deferred tax assets and liabilities as of December 31, 2017. The preliminary estimate is subject to change as we finalize our analysis and as interpretations of the provisions of the 2017 Tax Act continue to develop. The final determination of the Transition Toll Tax and the remeasurement of our deferred tax assets and liabilities will be completed as additional information becomes available, but no later than one year from the enactment of the 2017 Tax Act. U.S. Treasury regulations, administrative interpretations or court decisions interpreting the 2017 Tax Act may require further adjustments and changes in our estimates, which could have a material adverse effect on our business, results of operations, financial position and cash flows.
Warranty Provision
We typically offer standard limited warranties that range from one to two years and vary by product. We provide for the estimated cost of product warranties at the time product revenue is recognized. Factors that affect our warranty reserves include the number of units sold, historical and anticipated rates of warranty repairs and the cost per repair. While we engage in extensive product quality programs and processes, including actively monitoring and evaluating the quality of our component suppliers, our estimated warranty obligation is affected by ongoing product failure rates, specific product class failures outside our baseline experience, material usage and service delivery costs incurred in correcting a product failure. If actual product failure rates, material usage or service delivery costs differ from our estimates, revisions to the estimated warranty liability would be required. For example, our warranty expense decreased $0.7
million in
2017
from
2016
, driven primarily by a decrease in warranty expenses related to our mobile connectivity products.
Assumptions and historical warranty experience are evaluated to determine the appropriateness of such assumptions. We assess the adequacy of the warranty provision on a quarterly basis and we adjust this provision when necessary.
Stock-Based Compensation
Our stock-based compensation cost is measured at the grant date based on the fair value of the award and is recognized as expense over the requisite service period, which is generally the vesting period.
We use the Black-Scholes valuation model for estimating the fair value on the date of grant of compensatory stock options. Determining the fair value of stock option awards at the grant date requires judgment regarding certain valuation assumptions, including the volatility of our stock price, expected term of the option, risk-free interest rate and expected dividends. Changes in these assumptions and estimates could result in different fair values and could therefore impact our earnings. These changes would not impact our cash flows. The fair value of restricted stock awards is based upon our stock price on the grant date.
54
The amount of stock-based compensation expense recorded in any period for unvested awards requires estimates of the amount of stock-based awards that are expected to be forfeited prior to vesting. As of January 1, 2017, we adopted ASC Update No. 2016-09,
Compensation-Stock Compensation (Topic 718): Improvements to Employee Share-Based Payment Accounting
. As a result of this adoption, commencing on January 1, 2017 prospectively, we have elected to account for forfeitures as they occur which could result in a significant reversal of previously recognized stock-based compensation expense.
Compensation costs for awards subject only to service conditions that vest ratably are recognized on a straight-line basis over the requisite service period for the entire award. We have no awards that are subject to performance or market conditions as of December 31, 2017.
Goodwill, Intangible Assets, and other Long-Lived Assets
ASC Topic 350, Intangibles—Goodwill and Other (ASC 350) requires the completion of a goodwill impairment test at least annually. Historically, this goodwill impairment test was comprised of a two-step process. In January 2017, the FASB issued ASC Update No. 2017-04, Intangibles—Goodwill and Other (Topic 350): Simplifying the Test of Goodwill Impairment. This ASC simplified the accounting for goodwill impairment for all entities by requiring impairment charges to be based on the first step of the goodwill impairment test under ASC 350. Under previous guidance, if the fair value of a reporting unit is lower than its carrying amount (Step 1), an entity would calculate any impairment charge by comparing the implied fair value of goodwill with its carrying amount (Step 2). The implied fair value of goodwill was calculated by deducting the fair value of all assets and liabilities of the reporting unit from the reporting unit’s fair value as determined in Step 1. To determine the implied fair value of goodwill, entities would estimate the fair value of any unrecognized intangible assets (including in-process research and development) and any corporate level assets or liabilities that were included in the determination of the carrying amount and fair value of the reporting unit in Step1. Under this new guidance if a reporting unit's carrying value exceeds its fair value, an entity will record an impairment charge based on that difference with such impairment charge limited to the amount of goodwill in the reporting unit. This ASC does not change the guidance on completing Step 1 of the goodwill impairment test. An entity will still be able to perform the existing optional qualitative goodwill impairment assessment before determining whether to proceed to Step 1. This ASC will be applied prospectively and is effective for annual and interim impairment tests performed in periods beginning after December 15, 2019 for public business enterprises. Early adoption is permitted for annual and interim goodwill impairment testing dates after January 1, 2017. We have elected to early adopt this ASC as of January 1, 2017. The adoption of this ASC had no impact on our consolidated statements of operations, financial condition or cash flows.
We have historically performed our annual goodwill impairment test as of August 31st. During the three months ended December 31, 2017, we changed our annual impairment assessment date from August 31st to October 1st to better align the timing of the test date with our annual budgeting cycle. We do not consider the change in the annual goodwill impairment testing date to be a material change to our method of applying an accounting principle. In connection with the change in the date of our annual goodwill impairment test, we performed a goodwill impairment test as of both August 31, 2017 and October 1, 2017, and concluded that the fair value of our reporting units exceeded their carrying value. To date, we have not had recorded or incurred goodwill impairment losses. For the August 31, 2017 test, we utilized an income approach and market approaches to estimate the fair value of our reporting units. We believe that the assumptions we used to estimate the fair value of our reporting units were reasonable. As an additional corroborative test of the reasonableness of those assumptions, we completed a reconciliation of our market capitalization and overall enterprise value to the fair value of all of our reporting units as of August 31, 2017. We note that, as of August 31, 2017, the fair value of all of our reporting units exceeded their carrying values by more than 10%. A negative trend of operating results or material changes to forecasted operating results could result in the requirement for additional interim goodwill impairment tests and the potential of a future goodwill impairment charge, which could be material. For the October 1, 2017 test, we performed a qualitative assessment over goodwill impairment concluding it was more-likely-than-not that our reporting units fair value exceeded their carrying value. Accordingly, it was not necessary for us to perform the full Step 1 quantitative analysis.
Intangible assets with estimated lives and other long-lived assets are reviewed for impairment when events or changes in circumstances indicate that the carrying amount of an asset may not be recoverable. Recoverability of intangible assets with estimated lives and other long-lived assets is measured by a comparison of the carrying amount of an asset or asset group to future net undiscounted cash flows expected to be generated by the asset or asset group. If these comparisons indicate that an asset is not recoverable, we will recognize an impairment loss for the amount by which the carrying value of the asset or asset group exceeds the related estimated fair value. Estimated fair value is based on either discounted future operating cash flows or appraised values, depending on the nature of the asset. During
2017
, there were no events or changes in circumstances that indicated that any of the carrying amounts of our intangible assets or other long-lived assets may not be recoverable. See Note 9 for further discussion of goodwill and intangible assets.
55
Contingencies
We are subject to ongoing business risks arising in the ordinary course of business. See Item 3.
Legal Proceedings,
for more information regarding litigation matters. An estimated loss
contingency is accrued when it is probable that a liability has been incurred or an asset has been impaired and the amount of loss can be reasonably estimated. We regularly evaluate current information available to determine whether such amounts should be adjusted and record changes in estimates in the period they become known. We reserve for legal contingencies and legal fees when the amounts are probable and reasonably estimable. During 2016, we had settled a legal claim for a cash payment by us. The cash payment was included in accrued other in our consolidated balance sheet at December 31, 2015. The cash payment was made in January 2016.
Liquidity and Capital Resources
Our primary liquidity needs are to fund general business requirements, including working capital requirements, capital expenditures, interest payments, and debt repayments. In recent years, we have funded our operations primarily from cash flows from operations, bank financings, and proceeds received from exercises of stock options.
We believe that our cash and cash equivalents as of
December 31, 2017
, our estimated cash flows from operations, and borrowings available under our credit agreement will be sufficient to fund our operations, anticipated capital expenditures, and debt repayment obligations through at least the next twelve months based on our current operating plans. However, as the need or opportunity arises, we may seek to raise additional capital through public or private sales of securities or through additional debt financing. There are no assurances that we will be able to obtain any additional funding or that such funding will be available on terms acceptable to us.
We believe that our primary long-term capital requirements relate to servicing and repaying our indebtedness and our satellite service capacity and equipment lease obligations. At
December 31, 2017
, we had outstanding debt obligations with a principal balance of $
47.1 million
and had outstanding non-cancellable satellite service capacity and other lease obligations with future minimum payments of
$26.8 million
.
Our ability to make payments on our indebtedness and satellite service capacity and equipment lease obligations, as well as our ability to fund planned capital expenditures, will depend on our ability to generate cash in the future. Our ability to generate cash in the future will depend upon, among other things, the performance of our operating segments and general economic, financial, competitive, legislative, regulatory and other factors that are beyond our control.
As of
December 31, 2017
, we had
$42.9 million
in cash, cash equivalents, and marketable securities, of which $18.4 million in cash equivalents were held in local currencies by our foreign subsidiaries. There were no marketable securities held by our foreign subsidiaries as of
December 31, 2017
. As of
December 31, 2017
, we had
$54.4 million
in working capital.
Operating Activities
Net cash provided by operations for
2017
was
$11.5 million
as compared to
$18.7 million
for
2016
. The $7.2 million decrease is primarily due to a $8.0 decrease in cash inflows related to accounts receivable, a $6.9 million net decrease in non-cash items, a $3.5 million increase in net loss, a $2.8 million increase in cash outflows related to inventory, and a $1.6 million decrease in cash inflows related to deferred revenue. Partially offsetting the increase in cash outflows were a $7.5 million decrease in cash outflows related to accounts payable, a $4.5 million decrease in cash outflows related to accrued expenses, a $1.7 million decrease in cash outflows related to other non-current assets, a $1.4 million decrease in cash outflows related to prepaid expenses and other assets, and a $0.6 million decrease in cash outflows related to other long term liabilities.
Net cash provided by operations for
2016
was
$18.7 million
as compared to
$8.4 million
for
2015
. The $10.3 million increase is primarily due to a $16.5 million increase in cash inflows related to accounts receivable, a $4.6 million decrease in cash outflows related to inventory, a $3.5 million net increase in non-cash items, a $3.1 million increase in cash inflows related to deferred revenue, a $2.6 million decrease in cash outflows related to accounts payable, and a $1.2 million decrease in cash outflows related to prepaid expenses and other assets. Partially offsetting the increase in cash inflows were a $9.8 million shift from net income to net loss, a $6.7 million increase in cash outflows related to accrued expenses, a $3.9 million increase in cash outflows related to other non-current assets, and a $0.8 million increase in cash outflows related to other long term liabilities.
56
Investing Activities
Net cash provided by investing activities for
2017
was
$4.5 million
as compared to net cash used in investing activities of
$8.7 million
for
2016
. The $13.2 million increase was principally the result of a $20.5 million decrease in net investments in available-for-sale marketable securities, which was partially offset by a $7.2 million increase in capital expenditures. The change in investing activities was primarily due to an increase in capital expenditures for key strategic initiatives, additional principal repayment on our Term Note, extinguishment of our Equipment Loan, and to fund current year operations.
Net cash used in investing activities for
2016
was
$8.7 million
as compared
$3.8 million
for
2015
. The $4.9 million increase in cash used in investing activities was principally driven by an increase in available-for-sale marketable securities purchases of $1.9 million and a decrease in available-for-sale marketable securities maturities or sales of $3.1 million, resulting in an overall increase in available-for-sale marketable securities held as of December 31, 2016. The net cash used in investing activities of $8.7 million for 2016 was principally comprised of $5.6 million of capital expenditures and a net increase in available-for-sale marketable securities held of $3.1 million.
Financing Activities
Net cash used in financing activities for
2017
was
$9.7 million
as compared to
$4.4 million
for
2016
. The $5.3 million increase in net cash used in financing activities is primarily attributable to a $4.1 million increase in repayments of our term loan in 2017 that we undertook in connection with the acquisition of Videotel in July 2014, a $0.9 million decrease in proceeds from the exercise of stock options and the purchase of shares under our employee stock purchase plan, a $0.3 million increase in repayments of long-term debt under our credit agreement and a $0.1 million increase in payments of employee restricted stock withholdings.
Net cash used in financing activities for
2016
was
$4.4 million
as compared to
$6.3 million
for
2015
. Net cash used in financing activities primarily consists of repayments of our term loan we undertook in connection with the acquisition of Videotel in July 2014 and other long-term debt as well as the payment of employee withholdings on stock-based awards. Proceeds from stock purchases under our equity incentive plans increased by $2.2 million from 2015 to 2016.
Borrowing Arrangements
Principal Credit Facility
As of December 31,
2017
, there was $
44.3 million
in aggregate principal amount outstanding under our principal credit facility. On
July 1, 2014
, we entered into a
five
-year senior credit agreement with Bank of America, N.A., as administrative agent, and the lenders named from time to time as parties thereto, for an aggregate amount of up to
$80.0 million
, including a revolving credit facility of up to
$15.0 million
and a term loan of
$65.0 million
to be used for general corporate purposes, including both the refinancing of the
$30.0 million
of indebtedness then outstanding under our former credit facility and permitted acquisitions. The credit agreement was most recently amended in March 2017, to modify the Maximum Consolidated Leverage Ratio, the Applicable Rate, the Consolidated Fixed Charge Coverage Ratio (each as defined in the credit agreement) and the amortization schedule of the term loan, as well as to make certain other changes.
In connection with the March 2017 amendment, we made an additional principal repayment of $6.0 million on the term loan and amended the repayment terms. Under the amended terms, we must make principal repayments of $575,000 every three months starting on April 1, 2017 until the loan matures on July 1, 2019. On the maturity date, the entire remaining principal balance of the loan, including any future loans under the revolver, is due and payable, together with all accrued and unpaid interest, penalties, and any other amounts due and payable under the credit agreement. The credit agreement contains provisions requiring the mandatory prepayment of amounts outstanding under the term loan and the revolver under specified circumstances, including (i)
100%
of the net cash proceeds from certain dispositions to the extent not reinvested in our business within a stated period, (ii)
50%
of the net cash proceeds from stated equity issuances and (iii) 100% of the net cash proceeds from certain receipts of more than
$250,000
outside the ordinary course of business. The prepayments are first applied to the term loan, in inverse order of maturity, and then to the revolver. In the discretion of the administrative agent, certain mandatory prepayments made on the revolver can permanently reduce the amount of credit available under the revolver.
57
Loans under the credit agreement bear interest at varying rates determined in accordance with the credit agreement. Each LIBOR Rate Loan, as defined in the credit agreement, bears interest on the outstanding principal amount thereof for each interest period from the applicable borrowing date at a rate per annum equal to the LIBOR Daily Floating Rate or LIBOR Monthly Floating Rate, each as defined in the credit agreement, as applicable, plus the Applicable Rate, as defined in the credit agreement, and each Base Rate Loan, as defined in the credit agreement, bears interest on the outstanding principal amount thereof from the applicable borrowing date at a rate per annum equal to the Base Rate, as defined in the credit agreement, plus the Applicable Rate. The Applicable Rate ranges from 1.75% to 2.25%, depending on our Consolidated Leverage Ratio, as defined in the credit agreement. The highest Applicable Rate applies when the Consolidated Leverage Ratio exceeds 1.50:1.00. Upon certain defaults, including failure to make payments when due, interest becomes payable at a higher default rate.
Borrowings under the revolver are subject to the satisfaction of numerous conditions precedent at the time of each borrowing, including the continued accuracy of our representations and warranties and the absence of any default under the credit agreement. As of
December 31, 2017
, there were no borrowings outstanding under the revolver, and the full balance of $15.0 million was available for borrowing.
The credit agreement contains two financial covenants, a Maximum Consolidated Leverage Ratio and a Minimum Consolidated Fixed Charge Coverage Ratio, each as defined in the credit agreement. The Maximum Consolidated Leverage Ratio may not be greater than 1.50:1.00. The Minimum Consolidated Fixed Charge Coverage Ratio may not be less than 1.25:1.00. In the March 2017 amendment, the definition of the Consolidated Fixed Charge Coverage Ratio was amended to include only maintenance capital expenditures, as defined. We were in compliance with these financial ratio debt covenants as of
December 31, 2017
.
The credit agreement imposes certain other affirmative and negative covenants, including without limitation covenants with respect to the payment of taxes and other obligations, compliance with laws, entry into material contracts, creation of liens, incurrence of indebtedness, investments, dispositions, fundamental changes, restricted payments, changes in the nature of our business, transactions with affiliates, corporate and accounting changes, and sale and leaseback arrangements.
Our obligation to repay loans under the credit agreement could be accelerated upon a default or event of default under the terms of the credit agreement, including certain failures to pay principal or interest when due, certain breaches of representations and warranties, the failure to comply with our affirmative and negative covenants under the credit agreement, a change of control, certain defaults in payment relating to other indebtedness, the acceleration of payment of certain other indebtedness, certain events relating to our liquidation, dissolution, bankruptcy, insolvency or receivership, the entry of certain judgments against us, certain events relating to the impairment of collateral or the lenders’ security interest therein, and any other material adverse change with respect to us.
Mortgage Loan
We have a $4.0 million mortgage loan related to our headquarters facility in Middletown, Rhode Island. The loan term is ten years, with a principal amortization of 20 years. The interest rate is based on the BBA LIBOR Rate (as defined in the loan agreement) plus 2.00 percentage points. The mortgage loan is secured by the underlying property and improvements. The monthly mortgage payment is approximately $14,000, plus interest, and increases in increments of approximately $1,000 each year over the life of the mortgage. Due to the difference in the term of the loan and amortization of the principal, a balloon payment of $2.6 million is due in April 2019. The loan contains one financial covenant, a Fixed Charge Coverage Ratio, which applies in the event that our consolidated cash, cash equivalents, and marketable securities balance falls below $25.0 million at any time. As our consolidated cash, cash equivalents, and marketable securities balance was above the minimum threshold throughout 2017, the Fixed Charge Coverage Ratio did not apply.
Under the mortgage loan, we may prepay our outstanding loan balance subject to certain early termination charge. If we were to default on the mortgage loan, the underlying property and improvements would be used as collateral. In 2010, we entered into two interest rate swap agreements that are intended to hedge our mortgage interest obligations over the term of the mortgage loan by fixing the interest rates specified in the mortgage loan to 5.91% for half of the principal amount outstanding as of April 1, 2010 and 6.07% for the remaining half.
58
Other Matters
We intend to continue to invest in the mini-VSAT Broadband network on a global basis. As part of the future potential capacity expansion, we would plan to seek to acquire additional satellite capacity from satellite operators, expend funds to seek regulatory approvals and permits, develop product enhancements in anticipation of the expansion, and hire additional personnel. For example, in December 2011, we entered into a five-year agreement to lease satellite capacity from a satellite operator, effective February 1, 2012, and in 2012 we also purchased three satellite hubs to support this added capacity. The total cost of the five-year satellite capacity agreement, the satellite hubs, and teleport services was $12.2 million, including $2.7 million for the hubs. In January 2013, we borrowed $4.7 million from a bank and pledged as collateral six satellite hubs and related equipment, including the three hubs purchased in 2012. The term of the equipment loan was five years, and the loan bore interest at a fixed rate of 2.76% per annum. In March 2017, we repaid in full the current balance of the loan in advance of the January 30, 2018 original maturity date. In December 2013, we borrowed $1.2 million from a bank and pledged as collateral one satellite hub and related equipment. The term of the equipment loan was five years, and the loan bore interest at a fixed rate of 3.08% per annum. In March 2017, we repaid in full the current balance of the loan in advance of the December 30, 2018 original maturity date.
On November 26, 2008, our Board of Directors authorized a program to repurchase up to one million shares of our common stock. The share repurchase program is funded using our existing cash, cash equivalents, marketable securities and future cash flows. As of
December 31, 2017
, 341,009 shares of our common stock remain available for repurchase under the program. We did not purchase any shares of our common stock in
2017
.
Contractual Obligations and Other Commercial Commitments
As of
December 31, 2017
, our material contractual commitments consisted of satellite service capacity, near-term purchase commitments, term notes payable, a mortgage note payable, equipment notes payable, and equipment and facility leases. Our purchase commitments include unconditional purchase orders for inventory, manufacturing materials and fixed assets extending out over various periods throughout 2018. We are also obligated under satellite service capacity leases and multi-year facility leases that terminate at various times between 2018 and 2023.
The following table summarizes our obligations under these commitments, excluding interest, at
December 31, 2017
:
|
|
Payment Due by Period
|
|||||||||||||||||||
|
Contractual Obligations
|
Total
|
Less than
1 Year
|
1-3 Years
|
3-5 Years
|
More than
5 Years
|
|||||||||||||||
|
|
(in thousands)
|
|||||||||||||||||||
|
Term notes payable
|
$
|
44,275
|
|
$
|
2,300
|
|
$
|
41,975
|
|
$
|
—
|
|
$
|
—
|
|
|||||
|
Satellite service capacity and related equipment lease obligations
|
24,974
|
|
13,008
|
|
10,436
|
|
1,530
|
|
—
|
|
||||||||||
|
Inventory, materials, and fixed asset purchase commitments
|
13,583
|
|
13,583
|
|
—
|
|
—
|
|
—
|
|
||||||||||
|
Mortgage notes payable
|
2,779
|
|
182
|
|
2,597
|
|
—
|
|
—
|
|
||||||||||
|
Facility lease obligations
|
1,790
|
|
674
|
|
968
|
|
148
|
|
—
|
|
||||||||||
|
Total
|
$
|
87,401
|
|
$
|
29,747
|
|
$
|
55,976
|
|
$
|
1,678
|
|
$
|
—
|
|
|||||
The above table does not include our obligations related to certain interest rate swap derivative financial instruments that we entered into in April 2010 to reduce the volatility of cash flows that arise from change in interest rates in order to hedge our mortgage loan related to our corporate headquarters by fixing the interest rates specified in the mortgage loan to 5.9% for 50% of the principal outstanding and 6.1% for the remaining principal outstanding. These derivative financial instruments mature on April 1, 2019 and as of
December 31, 2017
, we had a liability of
$0.1 million
recorded related to the fair value of these derivative financial instruments.
The above table also does not reflect our liabilities associated with uncertain tax positions recorded under FIN 48 (codified primarily in ASC 740,
Income Taxes
) totaling
$1.6 million
. Due to the complexity associated with tax uncertainties, we cannot reasonably make a reliable estimate of the period in which we expect to settle these liabilities. See Note 8 to our consolidated financial statements contained in Item 15 of this Annual Report for more information on our unrecognized tax benefits.
We did not have any other off-balance sheet commitments, guarantees, or standby repurchase obligations as of
December 31, 2017
.
59
Recently Issued Accounting Pronouncements
See Note 1 of our accompanying audited consolidated financial statements for a description of recently issued accounting pronouncements including the dates of adoption and effects on our results of operations, financial position and disclosures.
|
ITEM 7A.
|
Quantitative and Qualitative Disclosure About Market Risk
|
Our primary market risk exposures are interest rate risk and foreign currency exchange rate risk.
We are exposed to changes in interest rates because we finance certain operations through fixed and variable rate debt instruments.
We had
$44.3 million
in borrowings outstanding at
December 31, 2017
, at an interest rate equal to the LIBOR Daily Floating Rate plus 1.50% under our variable-rate credit facility. For more information regarding our credit facility, see Item 7.
Management’s
Discussion and Analysis of Financial Condition and Results of Operations - Borrowing Arrangements.
A hypothetical 10% increase or decrease in interest rates would have an approximately $0.1 million impact on our annual interest expense, based on the
$44.3 million
outstanding at
December 31, 2017
with an interest rate of 3.32%.
As discussed in Note 15 to the audited consolidated financial statements, effective April 1, 2010, in order to reduce the volatility of cash outflows that arise from changes in interest rates, we entered into two interest rate swap agreements. These interest rate swap agreements are intended to hedge our mortgage loan related to our headquarters facility in Middletown, Rhode Island by fixing the interest rates specified in the mortgage loan to
5.9%
for half of the principal amount outstanding and
6.1%
for the remaining half of the principal amount outstanding as of April 1, 2010 until the mortgage loan expires on April 16, 2019.
We are exposed to currency exchange rate fluctuations related to our subsidiary operations in the United Kingdom, Denmark, Norway, Brazil, Singapore, Hong Kong, Cyprus, Japan, Belgium, and the Netherlands. Certain transactions in these locations are made in the local currency, yet are reported in the U.S. dollar, the functional currency. For foreign currency exposures existing at
December 31, 2017
, a 10% unfavorable movement in the foreign exchange rates for our subsidiary locations would not expose us to material losses in earnings or cash flows.
In the past, we purchased foreign currency forward contracts. These forward contracts were intended to offset the impact of exchange rate fluctuations on cash flows of our foreign subsidiaries. Foreign exchange contracts are accounted for as cash flow hedges and are recorded on the balance sheet at fair value until executed. Changes in the fair value are recognized in earnings. We did not enter into any such contracts during 2015, 2016, or
2017
. We do not currently anticipate that we will enter into new agreements to replace the settled contracts.
The primary objective of our investment activities is to preserve principal and maintain liquidity, while at the same time maximizing income. We have not entered into any instruments for trading purposes. Some of the securities that we invest in may have market risk. To minimize this risk, we maintain our portfolio of cash equivalents and short-term investments in a variety of securities that can include United States treasuries, certificates of deposit, investment grade asset-backed corporate securities, money market mutual funds, municipal bonds, and government agency and non-government debt securities. As of
December 31, 2017
, a hypothetical 100 basis-point increase in interest rates would have resulted in an immaterial decrease in the fair value of our investments that had maturities of greater than one year. Due to the conservative nature of our investments and the relatively short duration of their maturities, we believe this interest rate risk is substantially mitigated. As of
December 31, 2017
, all of the
$8.3 million
classified as available-for-sale marketable securities will mature or reset within one year. Accordingly, long-term interest rate risk is not considered material for our investment activities. We did not invest in any financial instruments denominated in foreign currencies as of
December 31, 2017
.
|
ITEM 8.
|
Financial Statements and Supplementary Data
|
Our consolidated financial statements and supplementary data, together with the reports of Grant Thornton LLP, our independent registered public accounting firm, are included in Part IV of this annual report.
|
ITEM 9.
|
Changes in and Disagreements with Accountants on Accounting and Financial Disclosure
|
None.
60
|
ITEM 9A.
|
Controls and Procedures
|
Evaluation of Disclosure Controls and Procedures
We maintain disclosure controls and procedures, as defined in Rules 13a-15(e) and 15d-15(e) under the Securities Exchange Act of 1934, as amended, or the Exchange Act, which are designed to ensure that information required to be disclosed in the reports that we file or submit under the Exchange Act is recorded, processed, summarized and reported within the time periods specified in the Securities and Exchange Commission's rules and forms and that such information is accumulated and communicated to our management, including our Chief Executive Officer and Chief Financial Officer, as appropriate to allow timely decisions regarding required disclosure.
Under the supervision and with the participation of our Chief Executive Officer and Chief Financial Officer, our management has evaluated the effectiveness of our disclosure controls and procedures as of
December 31, 2017
, the end of the period covered by this annual report. Based on that evaluation, our Chief Executive Officer and Chief Financial Officer concluded that our disclosure controls and procedures were effective as of
December 31, 2017
.
Management's Report on Internal Control over Financial Reporting
Our management is responsible for establishing and maintaining adequate internal control over financial reporting. Our internal control over financial reporting is the process designed by and under the supervision of our Chief Executive Officer and Chief Financial Officer to provide reasonable assurance regarding the reliability of our financial reporting and the preparation of our financial statements for external reporting in accordance with accounting principles generally accepted in the United States of America. Management has evaluated the effectiveness of our internal control over financial reporting using the criteria set forth by the Committee of Sponsoring Organizations of the Treadway Commission (COSO) in Internal Control-Integrated Framework (2013).
Under the supervision and with the participation of our Chief Executive Officer and Chief Financial Officer, our management has assessed the effectiveness of our internal control over financial reporting as of
December 31, 2017
and concluded that it was effective.
Our independent registered public accounting firm, Grant Thornton LLP, has issued a report regarding the effectiveness of our internal control over financial reporting as of
December 31, 2017
, and that report is included in Item 9A in this annual report.
Evaluation of Changes in Internal Control over Financial Reporting
Under the supervision and with the participation of our Chief Executive Officer and Chief Financial Officer, our management has evaluated changes in our internal control over financial reporting that occurred during the fourth quarter of
2017
. Based on that evaluation, our Chief Executive Officer and Chief Financial Officer did not identify any change in our internal control over financial reporting that has materially affected, or is reasonably likely to materially affect, our internal control over financial reporting.
Important Considerations
The effectiveness of our disclosure controls and procedures and our internal control over financial reporting is subject to various inherent limitations, including cost limitations, judgments used in decision making, assumptions about the likelihood of future events, the soundness of our systems, the possibility of human error, and the risk of fraud. Moreover, projections of any evaluation of effectiveness to future periods are subject to the risk that controls may become inadequate because of changes in conditions and the risk that the degree of compliance with policies or procedures may deteriorate over time. Because of these limitations, there can be no assurance that any system of disclosure controls and procedures or internal control over financial reporting will be successful in preventing all errors or fraud or in making all material information known in a timely manner to the appropriate levels of management.
61
Report of Independent Registered Public Accounting Firm
Board of Directors and Stockholders
KVH Industries, Inc.
Opinion on internal control over financial reporting
We have audited the internal control over financial reporting of KVH Industries, Inc. (a Delaware corporation) and subsidiaries (the “Company”) as of
December 31, 2017
, based on criteria established in the 2013
Internal Control-Integrated Framework
issued by the Committee of Sponsoring Organizations of the Treadway Commission (“COSO”). In our opinion, the Company maintained, in all material respects, effective internal control over financial reporting as of
December 31, 2017
, based on criteria established in the 2013
Internal Control-Integrated Framework
issued by COSO.
We also have audited, in accordance with the standards of the Public Company Accounting Oversight Board (United States) (“PCAOB”), the consolidated
financial statements of the Company as of and for the year ended
December 31, 2017
, and our report dated
March 2, 2018
expressed an unqualified opinion on those financial statements.
Basis for opinion
The Company’s management is responsible for maintaining effective internal control over financial reporting and for its assessment of the effectiveness of internal control over financial reporting, included in the accompanying Management’s Report on Internal Control over Financial Reporting. Our responsibility is to express an opinion on the Company’s internal control over financial reporting based on our audit. We are a public accounting firm registered with the PCAOB and are required to be independent with respect to the Company in accordance with the U.S. federal securities laws and the applicable rules and regulations of the Securities and Exchange Commission and the PCAOB.
We conducted our audit in accordance with the standards of the PCAOB. Those standards require that we plan and perform the audit to obtain reasonable assurance about whether effective internal control over financial reporting was maintained in all material respects. Our audit included obtaining an understanding of internal control over financial reporting, assessing the risk that a material weakness exists, testing and evaluating the design and operating effectiveness of internal control based on the assessed risk, and performing such other procedures as we considered necessary in the circumstances. We believe that our audit provides a reasonable basis for our opinion.
Definition and limitations of internal control over financial reporting
A company’s internal control over financial reporting is a process designed to provide reasonable assurance regarding the reliability of financial reporting and the preparation of financial statements for external purposes in accordance with generally accepted accounting principles. A company’s internal control over financial reporting includes those policies and procedures that (1) pertain to the maintenance of records that, in reasonable detail, accurately and fairly reflect the transactions and dispositions of the assets of the company; (2) provide reasonable assurance that transactions are recorded as necessary to permit preparation of financial statements in accordance with generally accepted accounting principles, and that receipts and expenditures of the company are being made only in accordance with authorizations of management and directors of the company; and (3) provide reasonable assurance regarding prevention or timely detection of unauthorized acquisition, use, or disposition of the company’s assets that could have a material effect on the financial statements.
Because of its inherent limitations, internal control over financial reporting may not prevent or detect misstatements. Also, projections of any evaluation of effectiveness to future periods are subject to the risk that controls may become inadequate because of changes in conditions, or that the degree of compliance with the policies or procedures may deteriorate.
|
/s/ GRANT THORNTON LLP
|
|
Boston, Massachusetts
|
|
March 2, 2018
|
|
ITEM 9B.
|
Other Information
|
None.
62
We have omitted the information required in Part III of this annual report because we intend to include that information in our definitive proxy statement for our 2018 annual meeting of stockholders, which we expect to file before 120 days after the end of fiscal
2017
. We incorporate the information required in Part III of this annual report by reference to our 2018 proxy statement.
|
ITEM 10.
|
Directors, Executive Officers and Corporate Governance
|
Except as set forth below, the information required by this item is incorporated by reference to our 2018 proxy statement.
Our Board of Directors has adopted a Code of Business Conduct and Ethics that applies to our directors, executive officers and employees. Our Code of Business Conduct and Ethics can be found on our website, which is located at www.kvh.com. We intend to make all required disclosures concerning any amendments to or waivers from, our Code of Business Conduct and Ethics on our website. Any person may request a copy of the Code of Business Conduct and Ethics, at no cost, by writing to us at the following address: KVH Industries, Inc., 50 Enterprise Center, Middletown, Rhode Island, 02842, Attention: Investor Relations.
|
ITEM 11.
|
Executive Compensation
|
The information required by this item is incorporated by reference to our 2018 proxy statement.
|
ITEM 12.
|
Security Ownership of Certain Beneficial Owners and Management and Related Stockholder Matters
|
The information required by this item is incorporated by reference to our 2018 proxy statement.
|
ITEM 13.
|
Certain Relationships and Related Transactions and Director Independence
|
The information required by this item is incorporated by reference to our 2018 proxy statement.
|
ITEM 14.
|
Principal Accountant Fees and Services
|
The information required by this item is incorporated by reference to our 2018 proxy statement.
63
|
ITEM 15.
|
Exhibits and Financial Statement Schedules
|
|
|
|
Page
|
|
|
(a)
|
1.
|
||
|
(a)
|
2.
|
Financial Statement Schedules
|
|
|
None.
|
|||
|
3.
|
Exhibits
|
||
|
Exhibit No.
|
Description
|
Filed with
this Form
10-K
|
Incorporated by Reference
|
||||||||
|
Form
|
Filing Date
|
Exhibit No.
|
|||||||||
|
Amended and Restated Certificate of Incorporation, as amended
|
10-Q
|
August 6,
2010
|
3.1
|
|
|||||||
|
Amended and Restated Bylaws of KVH Industries, Inc.
|
8-K
|
April 30, 2014
|
3.1
|
|
|||||||
|
Amended and Restated Bylaws
|
10-Q
|
November 1, 2017
|
3.2
|
|
|||||||
|
Specimen certificate for the common stock
|
X
|
||||||||||
|
Second Amended and Restated 2003 Incentive and Nonqualified Stock Option Plan
|
10-Q
|
May 6, 2009
|
10.21
|
|
|||||||
|
Fourth Amended and Restated 2006 Stock Incentive Plan
|
DEF 14A
|
April 25, 2013
|
App. A
|
|
|||||||
|
2016 Equity and Incentive Plan
|
DEF 14A
|
April 25, 2016
|
App. A
|
|
|||||||
|
Amended and Restated 1996 Employee Stock Purchase Plan
|
DEF 14A
|
April 25, 2016
|
App. B
|
|
|||||||
|
Form of Incentive Stock Option Agreement granted under the 2016 Equity and Incentive Plan
|
10-K
|
March 9, 2017
|
10.5
|
|
|||||||
|
Form of Non-Statutory Stock Option Agreement granted under the 2016 Equity and Incentive Plan
|
10-K
|
March 9, 2017
|
10.6
|
|
|||||||
|
Form of Restricted Stock Agreement granted under the 2016 Equity and Incentive Plan
|
10-K
|
March 9, 2017
|
10.7
|
|
|||||||
|
Policy Regarding Automatic Grants to Non-Employee Directors
|
10-Q
|
May 6, 2009
|
10.23
|
|
|||||||
|
Loan Agreement dated April 6, 2009 by and among KVH Industries, Inc., and Bank of America, N.A.
|
8-K
|
April 8,
2009
|
10.1
|
|
|||||||
64
|
Exhibit No.
|
Description
|
Filed with
this Form
10-K
|
Incorporated by Reference
|
||||||||
|
Form
|
Filing Date
|
Exhibit No.
|
|||||||||
|
Second Amendment, dated June 9, 2011 by and between KVH Industries, Inc. and Bank of America, N.A., amending the Loan Agreement, dated April 6, 2009, as amended
|
8-K
|
June 14,
2011
|
10.2
|
|
|||||||
|
Master Loan and Security Agreement, dated as of January 30, 2013 by and between KVH Industries, Inc. and Bank of America Leasing & Capital, LLC
|
8-K
|
February 5, 2013
|
10.1
|
|
|||||||
|
Equipment Security Note, dated as of January 30, 2013 by and between KVH Industries, Inc. and Bank of America Leasing & Capital, LLC
|
8-K
|
February 5, 2013
|
10.2
|
|
|||||||
|
Credit Agreement, dated as of July 1, 2014, by and between Bank of America, N.A., The Washington Trust Company and KVH Industries, Inc.
|
8-K
|
July 3, 2014
|
10.1
|
|
|||||||
|
Term Notes, dated as of July 1, 2014, by and between KVH Industries, Inc. and each of Bank of America, N.A. and The Washington Trust Company
|
8-K
|
July 3, 2014
|
10.2
|
|
|||||||
|
Revolving Credit Notes, dated as of July 1, 2014, by and between KVH Industries, Inc. and each of Bank of America, N.A. and The Washington Trust Company
|
8-K
|
July 3, 2014
|
10.3
|
|
|||||||
|
Security Agreement, dated as of July 1, 2014, by and between Bank of America, N.A. and KVH Industries, Inc.
|
8-K
|
July 3, 2014
|
10.4
|
|
|||||||
|
Pledge Agreements, dated as of July 1, 2014, by and between Bank of America, N.A. and KVH Industries, Inc. with respect to KVH Industries A/S and KVH Industries U.K. Limited
|
8-K
|
July 3, 2014
|
10.5
|
|
|||||||
|
First Amendment to Credit Agreement, dated as of June 15, 2015, by and among Bank of America, N.A., The Washington Trust Company and KVH Industries, Inc.
|
10-Q/A
|
August 13, 2015
|
10.1
|
|
|||||||
|
Second Amendment to Credit Agreement, dated as of September 30, 2015, by and among Bank of America, N.A., The Washington Trust Company and KVH Industries, Inc.
|
8-K
|
October 5, 2015
|
10.1
|
|
|||||||
|
Third Amendment to Credit Agreement, dated as of March 7, 2017, by and among Bank of America, N.A., The Washington Trust Company and KVH Industries, Inc.
|
8-K
|
March 9, 2017
|
10.1
|
|
|||||||
|
List of Subsidiaries
|
X
|
||||||||||
|
Consent of Grant Thornton LLP
|
X
|
||||||||||
|
Rule 13a-14(a)/15d-14(a) certification of principal executive officer
|
X
|
||||||||||
|
Rule 13a-14(a)/15d-14(a) certification of principal financial officer
|
X
|
||||||||||
|
Rule 1350 certification
|
X
|
||||||||||
65
|
101.1
|
Interactive Data File regarding (a) our Consolidated Balance Sheets as of December 31, 2017 and 2016, (b) our Consolidated Statements of Operations for the years ended December 31, 2017, 2016, and 2015, (c) our Consolidated Statements of Comprehensive Loss for the years ended December 31, 2017, 2016, and 2015, (d) our Consolidated Statements of Stockholders' Equity for the years ended December 31, 2017, 2016, and 2015, (e) our Consolidated Statements of Cash Flows for the years ended December 31, 2017, 2016, and 2015 and (e) the Notes to such Consolidated Financial Statements
|
X
|
|||||||||
|
*
|
Management contract or compensatory plan.
|
66
|
ITEM 16.
|
Form 10-K Summary
|
None.
SIGNATURES
Pursuant to the requirements of Section 13 or Section 15(d) of the Securities Exchange Act of 1934, the registrant has duly caused this report to be signed on its behalf by the undersigned, thereunto duly authorized.
|
|
KVH Industries, Inc.
|
|
|
Date: March 2, 2018
|
By:
|
/
S
/ M
ARTIN
A. K
ITS
V
AN
H
EYNINGEN
|
|
Martin A. Kits van Heyningen
President, Chief Executive Officer and Chairman of the Board
|
||
Pursuant to the requirements of the Securities Exchange Act of 1934, this report has been signed below by the following persons in the capacities and on the dates indicated.
|
Name
|
|
Title
|
Date
|
|
|
/S/ MARTIN A. KITS VAN HEYNINGEN
|
|
President, Chief Executive Officer and Chairman of the Board (Principal Executive Officer)
|
March 2, 2018
|
|
|
Martin A. Kits van Heyningen
|
||||
|
/S/ DONALD W. REILLY
|
|
Chief Financial Officer (Principal Financial Officer)
|
March 2, 2018
|
|
|
Donald W. Reilly
|
||||
|
/S/ JENNIFER L. BAKER
|
|
Chief Accounting Officer and Corporate Controller (Principal Accounting Officer)
|
March 2, 2018
|
|
|
Jennifer L. Baker
|
||||
|
/S/ MARK S. AIN
|
|
Director
|
March 2, 2018
|
|
|
Mark S. Ain
|
||||
|
/S/ JAMES S. DODEZ
|
Director
|
March 2, 2018
|
||
|
James S. Dodez
|
||||
|
/S/ STANLEY K. HONEY
|
|
Director
|
March 2, 2018
|
|
|
Stanley K. Honey
|
||||
|
/S/ BRUCE J. RYAN
|
|
Director
|
March 2, 2018
|
|
|
Bruce J. Ryan
|
||||
|
/S/ CHARLES R. TRIMBLE
|
|
Director
|
March 2, 2018
|
|
|
Charles R. Trimble
|
||||
67
Report of Independent Registered Public Accounting Firm
Board of Directors and Stockholders
KVH Industries, Inc.
Opinion on the financial statements
We have audited the accompanying consolidated balance sheets of KVH Industries, Inc. (a Delaware corporation) and subsidiaries (the “Company”) as of December 31, 2017 and 2016, the related consolidated statements of operations, comprehensive loss, stockholders’ equity, and cash flows for each of the three years in the period ended December 31, 2017, and the related notes (collectively referred to as the “financial statements”). In our opinion, the financial statements present fairly, in all material respects, the financial position of the Company as of December 31, 2017 and 2016, and the results of its operations and its cash flows for each of the three years in the period ended December 31, 2017 in conformity with accounting principles generally accepted in the United States of America.
We also have audited, in accordance with the standards of the Public Company Accounting Oversight Board (United States) (“PCAOB”), the Company’s internal control over financial reporting as of December 31, 2017, based on criteria established in the 2013
Internal Control-Integrated Framework
issued by the Committee of Sponsoring Organizations of the Treadway Commission (“COSO”), and our report dated
March 2, 2018
expressed an unqualified opinion.
Basis for opinion
These financial statements are the responsibility of the Company’s management. Our responsibility is to express an opinion on the Company’s financial statements based on our audits. We are a public accounting firm registered with the PCAOB and are required to be independent with respect to the Company in accordance with the U.S. federal securities laws and the applicable rules and regulations of the Securities and Exchange Commission and the PCAOB.
We conducted our audits in accordance with the standards of the PCAOB. Those standards require that we plan and perform the audit to obtain reasonable assurance about whether the financial statements are free of material misstatement, whether due to error or fraud. Our audits included performing procedures to assess the risks of material misstatement of the financial statements, whether due to error or fraud, and performing procedures that respond to those risks. Such procedures included examining, on a test basis, evidence supporting the amounts and disclosures in the financial statements. Our audits also included evaluating the accounting principles used and significant estimates made by management, as well as evaluating the overall presentation of the financial statements. We believe that our audits provide a reasonable basis for our opinion.
|
/s/ GRANT THORNTON LLP
|
|
We have served as the Company’s auditor since 2014.
|
|
Boston, Massachusetts
|
|
March 2, 2018
|
68
KVH INDUSTRIES, INC. AND SUBSIDIARIES
(in thousands, except share and per share data)
|
|
December 31,
|
||||||
|
|
2017
|
2016
|
|||||
|
ASSETS
|
|||||||
|
Current assets:
|
|||||||
|
Cash and cash equivalents
|
$
|
34,596
|
|
$
|
26,422
|
|
|
|
Marketable securities
|
8,319
|
|
25,712
|
|
|||
|
Accounts receivable, net of allowance for doubtful accounts of $2,852 and $3,477 as of December 31, 2017 & December 31, 2016, respectively
|
28,316
|
|
31,152
|
|
|||
|
Inventories
|
22,732
|
|
20,745
|
|
|||
|
Prepaid expenses and other current assets
|
3,816
|
|
4,801
|
|
|||
|
Total current assets
|
97,779
|
|
108,832
|
|
|||
|
Property and equipment, less accumulated depreciation of $51,099 and $45,766 as of December 31, 2017 & December 31, 2016, respectively
|
43,521
|
|
36,586
|
|
|||
|
Intangible assets, less accumulated amortization of $20,656 and $16,344 as of December 31, 2017 & December 31, 2016, respectively
|
15,120
|
|
17,838
|
|
|||
|
Goodwill
|
33,872
|
|
31,343
|
|
|||
|
Other non-current assets
|
5,927
|
|
5,134
|
|
|||
|
Non-current deferred income tax asset
|
20
|
|
24
|
|
|||
|
Total assets
|
$
|
196,239
|
|
$
|
199,757
|
|
|
|
LIABILITIES AND STOCKHOLDERS’ EQUITY
|
|||||||
|
Current liabilities:
|
|||||||
|
Accounts payable
|
$
|
15,736
|
|
$
|
8,436
|
|
|
|
Accrued compensation and employee-related expenses
|
5,358
|
|
4,766
|
|
|||
|
Accrued other
|
9,210
|
|
8,317
|
|
|||
|
Accrued product warranty costs
|
2,074
|
|
2,280
|
|
|||
|
Deferred revenue
|
6,919
|
|
6,661
|
|
|||
|
Current portion of long-term debt
|
2,482
|
|
7,900
|
|
|||
|
Liability for uncertain tax positions
|
1,570
|
|
1,283
|
|
|||
|
Total current liabilities
|
43,349
|
|
39,643
|
|
|||
|
Other long-term liabilities
|
19
|
|
326
|
|
|||
|
Long-term debt, excluding current portion
|
44,572
|
|
50,153
|
|
|||
|
Non-current deferred income tax liability
|
2,634
|
|
3,133
|
|
|||
|
Total liabilities
|
$
|
90,574
|
|
$
|
93,255
|
|
|
|
Commitments and contingencies (Notes 1, 5, 6, 15 and 16)
|
|
|
|||||
|
Stockholders’ equity:
|
|||||||
|
Preferred stock, $0.01 par value. Authorized 1,000,000 shares; none issued
|
—
|
|
—
|
|
|||
|
Common stock, $0.01 par value. Authorized 30,000,000 shares, 18,787,816 and
18,420,914 shares issued at December 31, 2017 and December 31, 2016, respectively; and 17,128,825 and 16,761,923 shares outstanding at
December 31, 2017 and December 31, 2016, respectively
|
188
|
|
184
|
|
|||
|
Additional paid-in capital
|
134,361
|
|
129,660
|
|
|||
|
(Accumulated deficit) retained earnings
|
(4,417
|
)
|
6,617
|
|
|||
|
Accumulated other comprehensive loss
|
(11,317
|
)
|
(16,809
|
)
|
|||
|
118,815
|
|
119,652
|
|
||||
|
Less: treasury stock at cost, common stock, 1,658,991 shares as of December 31, 2017 and December 31, 2016, respectively
|
(13,150
|
)
|
(13,150
|
)
|
|||
|
Total stockholders’ equity
|
105,665
|
|
106,502
|
|
|||
|
Total liabilities and stockholders’ equity
|
$
|
196,239
|
|
$
|
199,757
|
|
|
See accompanying Notes to Consolidated Financial Statements.
69
KVH INDUSTRIES, INC. AND SUBSIDIARIES
(in thousands, except per share amounts)
|
|
Year Ended December 31,
|
||||||||||
|
|
2017
|
2016
|
2015
|
||||||||
|
Sales:
|
|||||||||||
|
Product
|
$
|
56,968
|
|
$
|
73,075
|
|
$
|
76,213
|
|
||
|
Service
|
103,120
|
|
103,047
|
|
108,421
|
|
|||||
|
Net sales
|
160,088
|
|
176,122
|
|
184,634
|
|
|||||
|
Costs and expenses:
|
|||||||||||
|
Costs of product sales
|
37,474
|
|
46,334
|
|
47,404
|
|
|||||
|
Costs of service sales
|
52,692
|
|
52,966
|
|
54,816
|
|
|||||
|
Research and development
|
15,858
|
|
16,030
|
|
14,039
|
|
|||||
|
Sales, marketing and support
|
33,896
|
|
33,942
|
|
35,714
|
|
|||||
|
General and administrative
|
28,932
|
|
28,172
|
|
29,453
|
|
|||||
|
Total costs and expenses
|
168,852
|
|
177,444
|
|
181,426
|
|
|||||
|
(Loss) income from operations
|
(8,764
|
)
|
(1,322
|
)
|
3,208
|
|
|||||
|
Interest income
|
659
|
|
513
|
|
546
|
|
|||||
|
Interest expense
|
1,467
|
|
1,436
|
|
1,460
|
|
|||||
|
Other (expense) income, net
|
(366
|
)
|
275
|
|
372
|
|
|||||
|
(Loss) income before income tax expense
|
(9,938
|
)
|
(1,970
|
)
|
2,666
|
|
|||||
|
Income tax expense
|
1,096
|
|
5,547
|
|
413
|
|
|||||
|
Net (loss) income
|
$
|
(11,034
|
)
|
$
|
(7,517
|
)
|
$
|
2,253
|
|
||
|
Per share information:
|
|||||||||||
|
Net (loss) income per share, basic
|
$
|
(0.67
|
)
|
$
|
(0.47
|
)
|
$
|
0.14
|
|
||
|
Net (loss) income per share, diluted
|
$
|
(0.67
|
)
|
$
|
(0.47
|
)
|
$
|
0.14
|
|
||
|
Number of shares used in per share calculation:
|
|||||||||||
|
Basic
|
16,419
|
|
15,834
|
|
15,625
|
|
|||||
|
Diluted
|
16,419
|
|
15,834
|
|
15,834
|
|
|||||
See accompanying Notes to Consolidated Financial Statements.
70
KVH INDUSTRIES, INC. AND SUBSIDIARIES
CONSOLIDATED STATEMENTS OF COMPREHENSIVE LOSS
(in thousands)
|
Year Ended December 31,
|
|||||||||||
|
2017
|
2016
|
2015
|
|||||||||
|
Net (loss) income
|
$
|
(11,034
|
)
|
$
|
(7,517
|
)
|
$
|
2,253
|
|
||
|
Other comprehensive income (loss), net of tax:
|
|||||||||||
|
Unrealized loss on marketable securities
|
(1
|
)
|
(1
|
)
|
(3
|
)
|
|||||
|
Foreign currency translation adjustment
|
5,404
|
|
(9,288
|
)
|
(4,207
|
)
|
|||||
|
Unrealized gain on derivative instruments, net
|
89
|
|
80
|
|
57
|
|
|||||
|
Other comprehensive income (loss), net of tax
(1)
|
5,492
|
|
(9,209
|
)
|
(4,153
|
)
|
|||||
|
Total comprehensive loss
|
$
|
(5,542
|
)
|
$
|
(16,726
|
)
|
$
|
(1,900
|
)
|
||
(1) Tax impact was nominal for all periods.
See accompanying Notes to Consolidated Financial Statements.
71
KVH INDUSTRIES, INC. AND SUBSIDIARIES
CONSOLIDATED STATEMENTS OF STOCKHOLDERS’ EQUITY
(in thousands)
|
|
Common Stock
|
Additional
Paid-in
Capital
|
Accumulated Earnings
|
Accumulated
Other
Comprehensive
(Loss) Income
|
Treasury Stock
|
Total
Stockholders’
Equity
|
|||||||||||||||||||||||
|
|
Shares
|
Amount
|
Shares
|
Amount
|
|||||||||||||||||||||||||
|
Balance at December 31, 2014
|
17,153
|
|
$
|
172
|
|
$
|
121,084
|
|
$
|
11,881
|
|
$
|
(3,447
|
)
|
(1,659
|
)
|
$
|
(13,150
|
)
|
$
|
116,540
|
|
|||||||
|
Net income
|
—
|
|
—
|
|
—
|
|
2,253
|
|
—
|
|
—
|
|
—
|
|
2,253
|
|
|||||||||||||
|
Other comprehensive loss
|
—
|
|
—
|
|
—
|
|
—
|
|
(4,153
|
)
|
—
|
|
—
|
|
(4,153
|
)
|
|||||||||||||
|
Stock-based compensation
|
—
|
|
—
|
|
3,734
|
|
—
|
|
—
|
|
—
|
|
—
|
|
3,734
|
|
|||||||||||||
|
Issuance of common stock under employee stock purchase plan
|
28
|
|
—
|
|
291
|
|
—
|
|
—
|
|
—
|
|
—
|
|
291
|
|
|||||||||||||
|
Shares withheld, repurchased and retired related to minimum statutory tax withholding requirements
|
(27
|
)
|
—
|
|
(578
|
)
|
—
|
|
—
|
|
—
|
|
—
|
|
(578
|
)
|
|||||||||||||
|
Exercise of stock options and issuance of restricted stock awards, net of forfeitures
|
182
|
|
1
|
|
88
|
|
—
|
|
—
|
|
—
|
|
—
|
|
89
|
|
|||||||||||||
|
Balance at December 31, 2015
|
17,336
|
|
$
|
173
|
|
$
|
124,619
|
|
$
|
14,134
|
|
$
|
(7,600
|
)
|
(1,659
|
)
|
$
|
(13,150
|
)
|
$
|
118,176
|
|
|||||||
|
Net loss
|
—
|
|
—
|
|
—
|
|
(7,517
|
)
|
—
|
|
—
|
|
—
|
|
(7,517
|
)
|
|||||||||||||
|
Other comprehensive loss
|
—
|
|
—
|
|
—
|
|
—
|
|
(9,209
|
)
|
—
|
|
—
|
|
(9,209
|
)
|
|||||||||||||
|
Stock-based compensation
|
—
|
|
—
|
|
3,651
|
|
—
|
|
—
|
|
—
|
|
—
|
|
3,651
|
|
|||||||||||||
|
Issuance of common stock under employee stock purchase plan
|
18
|
|
—
|
|
146
|
|
—
|
|
—
|
|
—
|
|
—
|
|
146
|
|
|||||||||||||
|
Shares withheld, repurchased and retired related to minimum statutory tax withholding requirements
|
(32
|
)
|
—
|
|
(313
|
)
|
—
|
|
—
|
|
—
|
|
—
|
|
(313
|
)
|
|||||||||||||
|
Excess tax shortfall on share-based awards
|
—
|
|
—
|
|
(869
|
)
|
—
|
|
—
|
|
—
|
|
—
|
|
(869
|
)
|
|||||||||||||
|
Exercise of stock options and issuance of restricted stock awards, net of forfeitures
|
1,099
|
|
11
|
|
2,426
|
|
—
|
|
—
|
|
—
|
|
—
|
|
2,437
|
|
|||||||||||||
|
Balance at December 31, 2016
|
18,421
|
|
$
|
184
|
|
$
|
129,660
|
|
$
|
6,617
|
|
$
|
(16,809
|
)
|
(1,659
|
)
|
$
|
(13,150
|
)
|
$
|
106,502
|
|
|||||||
|
Net loss
|
—
|
|
—
|
|
—
|
|
(11,034
|
)
|
—
|
|
—
|
|
—
|
|
(11,034
|
)
|
|||||||||||||
|
Other comprehensive income
|
—
|
|
—
|
|
—
|
|
—
|
|
5,492
|
|
—
|
|
—
|
|
5,492
|
|
|||||||||||||
|
Stock-based compensation
|
—
|
|
—
|
|
3,518
|
|
—
|
|
—
|
|
—
|
|
—
|
|
3,518
|
|
|||||||||||||
|
Issuance of common stock under employee stock purchase plan
|
47
|
|
—
|
|
358
|
|
—
|
|
—
|
|
—
|
|
—
|
|
358
|
|
|||||||||||||
|
Shares withheld, repurchased and retired related to minimum statutory tax withholding requirements
|
(43
|
)
|
—
|
|
(392
|
)
|
—
|
|
—
|
|
—
|
|
—
|
|
(392
|
)
|
|||||||||||||
|
Exercise of stock options and issuance of restricted stock awards, net of forfeitures
|
363
|
|
4
|
|
1,217
|
|
—
|
|
—
|
|
—
|
|
—
|
|
1,221
|
|
|||||||||||||
|
Balance at December 31, 2017
|
18,788
|
|
$
|
188
|
|
$
|
134,361
|
|
$
|
(4,417
|
)
|
$
|
(11,317
|
)
|
(1,659
|
)
|
$
|
(13,150
|
)
|
$
|
105,665
|
|
|||||||
See accompanying Notes to Consolidated Financial Statements.
72
KVH INDUSTRIES, INC. AND SUBSIDIARIES
(in thousands)
|
|
Year Ended December 31,
|
||||||||||
|
|
2017
|
2016
|
2015
|
||||||||
|
Cash flows from operating activities:
|
|||||||||||
|
Net (loss) income
|
$
|
(11,034
|
)
|
$
|
(7,517
|
)
|
$
|
2,253
|
|
||
|
Adjustments to reconcile net (loss) income to net cash provided by operating activities:
|
|||||||||||
|
Provision for doubtful accounts
|
674
|
|
872
|
|
1,337
|
|
|||||
|
Depreciation and amortization
|
11,037
|
|
12,564
|
|
12,719
|
|
|||||
|
Deferred income taxes
|
(756
|
)
|
2,406
|
|
(411
|
)
|
|||||
|
Loss (gain) on disposals of fixed assets
|
27
|
|
907
|
|
(4
|
)
|
|||||
|
Loss on derivatives instruments
|
—
|
|
—
|
|
57
|
|
|||||
|
Compensation expense related to stock-based awards and employee stock purchase plan
|
3,518
|
|
3,651
|
|
3,734
|
|
|||||
|
Unrealized currency translation (gain) loss
|
(86
|
)
|
881
|
|
391
|
|
|||||
|
Changes in operating assets and liabilities:
|
|||||||||||
|
Accounts receivable
|
2,701
|
|
10,709
|
|
(5,803
|
)
|
|||||
|
Inventories
|
(1,978
|
)
|
806
|
|
(3,755
|
)
|
|||||
|
Prepaid expenses and other current assets
|
1,045
|
|
(332
|
)
|
(1,576
|
)
|
|||||
|
Other non-current assets
|
(712
|
)
|
(2,378
|
)
|
1,539
|
|
|||||
|
Accounts payable
|
6,711
|
|
(790
|
)
|
(3,390
|
)
|
|||||
|
Deferred revenue
|
(138
|
)
|
1,474
|
|
(1,643
|
)
|
|||||
|
Accrued expenses
|
834
|
|
(3,687
|
)
|
3,023
|
|
|||||
|
Other long-term liabilities
|
(316
|
)
|
(867
|
)
|
(74
|
)
|
|||||
|
Net cash provided by operating activities
|
$
|
11,527
|
|
$
|
18,699
|
|
$
|
8,397
|
|
||
|
Cash flows from investing activities:
|
|||||||||||
|
Capital expenditures
|
(12,788
|
)
|
(5,631
|
)
|
(5,694
|
)
|
|||||
|
Cash paid for acquisition of intangible assets
|
(83
|
)
|
—
|
|
—
|
|
|||||
|
Purchases of marketable securities
|
(11,115
|
)
|
(13,173
|
)
|
(11,323
|
)
|
|||||
|
Maturities and sales of marketable securities
|
28,508
|
|
10,080
|
|
13,217
|
|
|||||
|
Net cash provided by (used in) investing activities
|
$
|
4,522
|
|
$
|
(8,724
|
)
|
$
|
(3,800
|
)
|
||
|
Cash flows from financing activities:
|
|||||||||||
|
Repayments of long-term debt
|
(1,649
|
)
|
(1,358
|
)
|
(1,307
|
)
|
|||||
|
Repayments of term note borrowings
|
(9,350
|
)
|
(5,281
|
)
|
(4,876
|
)
|
|||||
|
Proceeds from stock options exercised and employee stock purchase plan
|
1,644
|
|
2,583
|
|
432
|
|
|||||
|
Payment of employee restricted stock withholdings
|
(392
|
)
|
(313
|
)
|
(578
|
)
|
|||||
|
Other
|
—
|
|
(4
|
)
|
—
|
|
|||||
|
Net cash used in financing activities
|
$
|
(9,747
|
)
|
$
|
(4,373
|
)
|
$
|
(6,329
|
)
|
||
|
Effect of exchange rate changes on cash and cash equivalents
|
1,872
|
|
(1,899
|
)
|
(838
|
)
|
|||||
|
Net increase (decrease) in cash and cash equivalents
|
8,174
|
|
3,703
|
|
(2,570
|
)
|
|||||
|
Cash and cash equivalents at beginning of period
|
26,422
|
|
22,719
|
|
25,289
|
|
|||||
|
Cash and cash equivalents at end of period
|
$
|
34,596
|
|
$
|
26,422
|
|
$
|
22,719
|
|
||
|
Supplemental disclosure of cash flow information:
|
|||||||||||
|
Cash paid for interest
|
$
|
1,449
|
|
$
|
1,433
|
|
$
|
1,467
|
|
||
|
Cash paid for income taxes, net of refunds
|
$
|
972
|
|
$
|
3,647
|
|
$
|
2,182
|
|
||
|
Changes in accrued liabilities and accounts payable related to fixed asset additions
|
$
|
501
|
|
$
|
345
|
|
$
|
—
|
|
||
|
Deferred purchase price consideration related to asset acquisition included
in accrued expenses
|
$
|
50
|
|
$
|
—
|
|
$
|
—
|
|
||
See accompanying Notes to Consolidated Financial Statements.
73
KVH INDUSTRIES, INC. AND SUBSIDIARIES
NOTES TO CONSOLIDATED FINANCIAL STATEMENTS
December 31, 2017
,
2016
and
2015
(in thousands, except per share amounts)
|
(1)
|
Summary of Significant Accounting Policies
|
|
(a)
|
Description of Business
|
KVH Industries, Inc. (together with its subsidiaries, the Company or KVH) designs, develops, manufactures and markets mobile connectivity products and services for the marine and land markets, and inertial navigation products for both the commercial and defense markets. KVH's reporting segments are as follows:
|
•
|
the mobile connectivity segment and
|
|
•
|
the inertial navigation segment
|
KVH’s mobile connectivity products enable customers to receive voice and Internet services, and live digital television via satellite services in marine vessels, recreational vehicles, buses and automobiles. KVH’s CommBox offers a range of tools designed to increase communication efficiency, reduce costs, and manage network operations. KVH sells and leases its mobile connectivity products through an extensive international network of dealers and distributors. KVH also sells and leases products directly to end users. In the second quarter of 2017, the Company launched a new mini-VSAT Broadband service offering, AgilePlans, which is a monthly subscription model providing global connectivity to commercial maritime customers, including hardware, installation, broadband Internet, Voice over Internet Protocol (VoIP), entertainment and training content and global support for a monthly fee with no minimum commitment. KVH offers AgilePlans customers a variety of airtime data plans with varying data speeds and fixed data usage levels with overage charges per megabyte, which is similar to the plans that the Company offers to its other customers. The Company recognizes the monthly subscription fee as service revenue over the service delivery period. The Company retains ownership of the hardware that it provides to AgilePlans customers, who must return the hardware to KVH if they decide to terminate the service. Because KVH does not sell the hardware under AgilePlans, the Company does not recognize any product revenue when the hardware is deployed to an AgilePlans customer. KVH records the cost of the hardware used by AgilePlans customers as revenue-generating assets and depreciates the cost over an estimated useful life of five years. Since the Company is retaining ownership of the hardware, it does not accrue any warranty costs for AgilePlans hardware; however, any maintenance costs on the hardware is expensed in the period these costs are incurred.
KVH’s mobile connectivity service sales represent primarily sales earned from satellite voice and Internet airtime services. KVH provides, for monthly fixed and usage fees, satellite connectivity services, including broadband Internet, data and VoIP services, to its TracPhone V-series customers. Mobile connectivity service sales also include the distribution of commercially licensed entertainment, including news, sports, music, and movies to commercial and leisure customers in the maritime, hotel, and retail markets through KVH Media Group, and the distribution of training films and eLearning computer-based training courses to commercial customers in the maritime market through Super Dragon Limited and Videotel Marine Asia Limited (together referred to as Videotel). KVH also earns monthly usage fees from third-party satellite connectivity services, including voice, data and Internet services, provided to its Inmarsat and Iridium customers who choose to activate their subscriptions with KVH. Mobile connectivity service sales also include engineering services provided under development contracts, sales from product repairs, and extended warranty sales.
KVH's inertial navigation products offer precision fiber optic gyro (FOG)-based systems that enable platform and optical stabilization, navigation, pointing and guidance. KVH’s inertial navigation products also include tactical navigation systems that provide uninterrupted access to navigation and pointing information in a variety of military vehicles, including tactical trucks and light armored vehicles. KVH’s inertial navigation products are sold directly to U.S. and foreign governments and government contractors, as well as through an international network of authorized independent sales representatives. In addition, KVH's inertial navigation technology is used in numerous commercial products, such as navigation and positioning systems for various applications including precision mapping, dynamic surveying, autonomous vehicles, train location control and track geometry measurement systems, industrial robotics and optical stabilization.
KVH’s inertial navigation service sales include product repairs, engineering services provided under development contracts and extended warranty sales.
74
KVH INDUSTRIES, INC. AND SUBSIDIARIES
NOTES TO CONSOLIDATED FINANCIAL STATEMENTS—(Continued)
December 31, 2017, 2016, and 2015
(in thousands except per share amounts)
|
(b)
|
Principles of Consolidation
|
The accompanying consolidated financial statements of KVH Industries, Inc. and its wholly owned subsidiaries have been prepared in accordance with accounting principles generally accepted in the United States of America. All of the operating expenses of the subsidiaries that serve as the Company’s European, Singaporean, Japanese, and Brazilian international distributors are reflected within sales, marketing, and support within the accompanying consolidated statements of operations. All significant intercompany accounts and transactions have been eliminated in consolidation. The Company's adoption of Accounting Standards Codification (ASC) Update No. 2015-02,
Consolidation (Topic 810) - Amendments to the Consolidation Analysis,
on January 1, 2016 did not have an impact on the entities that the Company consolidates, which represent its wholly-owned subsidiaries, and had no impact on the Company’s consolidated results of operations or financial position.
|
(c)
|
Significant Estimates and Assumptions and Other Significant Non-Recurring Transactions
|
The preparation of financial statements in conformity with accounting principles generally accepted in the United States of America requires management to make estimates and assumptions that affect the reported amounts of assets and liabilities and disclosure of contingent assets and liabilities as of the date of the financial statements and the reported amounts of sales and expenses during the reporting periods. On an on-going basis, the Company evaluates its significant estimates, including those related to revenue recognition, valuation of accounts receivable, value of inventory, expected future cash flows including growth rates, discount rates, terminal values and other assumptions and estimates used to evaluate the recoverability of long-lived assets and goodwill, estimated fair values of long-lived assets, including goodwill, amortization methods and periods, certain accrued expenses and other related charges, stock-based compensation, contingent liabilities, forfeitures and key valuation assumptions for its share-based awards, estimated fulfillment costs for warranty obligations, tax reserves and recoverability of the Company’s net deferred tax assets and related valuation allowance. There have been no material changes to the Company's significant accounting policies, except for ASC Update No. 2016-09,
Compensation-Stock Compensation (Topic 718): Improvements to Employee Share-Based Payment Accounting
, which the Company adopted as required on January 1, 2017 and which resulted primarily in a change in the Company’s accounting prospectively for share-based payment forfeitures and accounting for excess tax benefits or deficiencies related to share-based payments as a component of earnings (see Note 7 for further discussion) and ASC Update No. 2015-11,
Simplifying the Measurement of Inventory
, which the Company adopted as of January 1, 2017 and which simplified the subsequent measurement of inventory by replacing the lower of cost a market test with a lower of cost and net realizable value test (see Note 3 for further discussion).
During the fourth quarter of 2016, the Company entered into arrangements with certain third parties who had previously co-produced certain content that the Company distributes where the Company had certain ongoing royalty payments to these third parties. The agreements entered into during the fourth quarter of 2016 settled all outstanding liabilities owed by the Company to these third parties and resulted in the Company obtaining sole ownership and rights to the applicable content. Based on the final amounts paid under these agreements, the Company recognized a gain in the fourth quarter of 2016 of approximately
$855
. This amount was recorded as a reduction to sales, marketing and support expense in the Company's consolidated statement of operations for the year ended December 31, 2016.
|
(d)
|
Concentration of Credit Risk and Single Source Suppliers
|
Cash, cash equivalents and marketable securities.
The Company is potentially subject to financial instrument concentration of credit risk through its cash, cash equivalent and marketable securities investments. To mitigate these risks the Company maintains cash, cash equivalents and marketable securities with reputable and nationally recognized financial institutions. As of
December 31, 2017
,
$8,319
classified as marketable securities was held by Wells Fargo and substantially all of the cash and cash equivalents were held by Bank of America, N.A. See Note 2 for a description of marketable securities.
75
KVH INDUSTRIES, INC. AND SUBSIDIARIES
NOTES TO CONSOLIDATED FINANCIAL STATEMENTS—(Continued)
December 31, 2017, 2016, and 2015
(in thousands except per share amounts)
Trade accounts receivable.
Concentrations of risk (see Note 11) with respect to trade accounts receivable are generally limited due to the large number of customers and their dispersion across several geographic areas. Although the Company does not foresee that credit risk associated with these receivables will deviate from historical experience, repayment is dependent upon the financial stability of those individual customers. The Company establishes allowances for potential bad debts and evaluates, on a monthly basis, the adequacy of those reserves based upon historical experience and its expectations for future collectability concerns. The Company performs ongoing credit evaluations of the financial condition of its customers and generally does not require collateral. Activity within the Company’s allowance for doubtful accounts for the periods presented is as follows:
|
2017
|
2016
|
2015
|
|||||||||
|
Beginning balance
|
$
|
3,477
|
|
$
|
3,534
|
|
$
|
2,723
|
|
||
|
Additions
|
674
|
|
872
|
|
1,342
|
|
|||||
|
Deductions (write-offs/recoveries) from reserve
|
(1,299
|
)
|
(929
|
)
|
(531
|
)
|
|||||
|
Ending balance
|
$
|
2,852
|
|
$
|
3,477
|
|
$
|
3,534
|
|
||
Revenue and operations.
Certain components from third parties used in the Company’s products are procured from single sources of supply. The failure of a supplier, including a subcontractor, to deliver on schedule could delay or interrupt the Company’s delivery of products and thereby materially adversely affect the Company’s revenues and operating results.
|
(e)
|
Revenue Recognition
|
Product sales.
Product sales are recognized when persuasive evidence of an arrangement exists, goods are shipped, title has passed and collectability is reasonably assured. The Company’s standard sales terms require that:
|
•
|
All sales are final;
|
|
•
|
Terms are generally Net 30;
|
|
•
|
Shipments are tendered and shipped FOB (or as may be applicable, FCA, or EXW) the Company’s plant or warehouse; and
|
|
•
|
Title and risk of loss or damage passes to the dealer or distributor at the point of shipment when delivery is made to the possession of the carrier.
|
For certain inertial navigation product sales, customer acceptance or inspection may be required before title and risk of loss transfers. For those sales, revenue is recognized after transfer of title
and risk of loss and after notification of customer acceptance. In certain circumstances customers may request a bill and hold arrangement. Under these bill and hold arrangements, revenue is recognized when the Company has fulfilled all of its performance obligations, the units are segregated and available for shipment in accordance with the defined contract delivery schedule, and the Company has received notification of customer acceptance which transfers title and risk of loss to the customer.
Under certain limited conditions, the Company, at its sole discretion, provides for the return of goods. No product is accepted for return and no credit is allowed on any returned product unless the Company has granted and confirmed prior written permission by means of appropriate authorization. The Company establishes reserves for potential sales returns, credits, and allowances, and evaluates, on a monthly basis, the adequacy of those reserves based upon historical experience and expectations for the future.
Multiple-element revenue arrangements.
Some of our sales involve multiple-element arrangements that include both hardware-related products and contracted service, or satellite connectivity that are accounted under ASC 605-25,
Multiple-Element Arrangements
.
76
KVH INDUSTRIES, INC. AND SUBSIDIARIES
NOTES TO CONSOLIDATED FINANCIAL STATEMENTS—(Continued)
December 31, 2017, 2016, and 2015
(in thousands except per share amounts)
The consideration is allocated to each element based on the relative selling prices of all of the elements in the arrangement using the fair value hierarchy. ASC 605-25 requires that the Company establish vendor-specific objective evidence (VSOE) of fair value based upon the price charged when the same element is sold separately or established by management having the relevant pricing authority. When VSOE exists it is used to determine the selling price of a deliverable. When VSOE is not established, the Company attempts to establish the selling price of each element based on third-party evidence (TPE). When the Company is unable to establish selling price using VSOE or TPE, the Company uses best estimated selling price (BESP) in the allocation of arrangement consideration for the relevant deliverables. The objective of BESP is to determine the price at which the Company would transact a sale if a product or service was sold on a stand-alone basis. The Company determines BESP for our products and certain services by considering multiple factors including, but not limited to, overall market conditions, including geographic or regional-specific market factors and profit objectives for such deliverables.
Each deliverable within the Company's multiple-deliverable revenue arrangements is accounted for as a separate unit of accounting under the guidance of ASC 605-25 if both of the following criteria are met: the delivered item or items have value to the customer on a standalone basis; and for an arrangement that includes a general right of return relative to the delivered item(s), delivery or performance of the undelivered item(s) is considered probable and substantially in the control of the Company. The Company considers a deliverable to have standalone value if the item is sold separately by the Company or another vendor or if the item could be resold by the customer. Further, the Company's revenue arrangements generally do not include a general right of return relative to delivered products.
Deliverables not meeting the criteria for being a separate unit of accounting are combined with a deliverable that does meet that criterion. The appropriate allocation of arrangement consideration and recognition of revenue is then determined for the combined unit of accounting.
Satellite connectivity and media content sales
. Directly sold and re-sold satellite connectivity service for voice, data and Internet is recognized monthly based upon minutes or megabytes of traffic processed or contracted fixed fee schedules. Typically, all subscribers enter into a contracted one-year minimum service agreement. The Company has evaluated the factors within ASC 605 regarding gross versus net revenue reporting for its satellite connectivity service sales and its payments to the applicable service providers. Based on the evaluation of the factors within ASC 605, the Company has determined that the applicable indicators of gross revenue reporting were met. The applicable indicators of gross revenue reporting included, but were not limited to, the following:
|
•
|
The Company is the primary obligor in its arrangements with its subscribers. The Company manages all interactions with the subscribers, while satellite connectivity service providers do not interact with the subscribers. In addition, the Company assumes the entire performance risk under its arrangements with the subscribers and in the event of a performance issue, the Company may incur reduction in fees without regard for any recourse that the Company may have with the applicable satellite connective service providers.
|
|
•
|
The Company has latitude in establishing pricing, as the pricing under its arrangements with the subscribers is negotiated through a contracting process and has discretion on establishing pricing. The Company then separately negotiates the fees with the applicable satellite service providers.
|
|
•
|
The Company has complete discretion in determining which satellite service providers it will contract with.
|
As a result, the Company has determined that we earn revenue (as a principal) from the delivery of satellite connectivity services to its subscribers and records all satellite connectivity service sales to subscribers as gross sales. All associated regulatory service fees and costs are recorded net in the consolidated financial statements. Media content sales include the Company's distribution of commercially licensed news, sports, movies and music content for commercial and leisure customers in the maritime, hotel, and retail markets as well as training videos to the merchant marine market that are typically based on a contracted fixed fee schedule. The Company typically recognizes revenue from media content sales ratably over the period of the service contract. The accounting estimates related to the recognition of satellite connectivity and media content service sales in results of operations requires the Company to make assumptions about future billing adjustments for disputes with subscribers as well as unauthorized usage. The Company recognizes the monthly subscription fee as service revenue over the service delivery period. The Company retains ownership of the hardware that it provides to AgilePlans customers, who must return the hardware to KVH if they decide to terminate the service. Because KVH does not sell the hardware under AgilePlans, the Company does not recognize any product revenue when the hardware is deployed to an AgilePlans customer.
77
KVH INDUSTRIES, INC. AND SUBSIDIARIES
NOTES TO CONSOLIDATED FINANCIAL STATEMENTS—(Continued)
December 31, 2017, 2016, and 2015
(in thousands except per share amounts)
Lease financing.
Lease financing consists of sales-type leases primarily of the TracPhone V-IP Series. The Company records the leases at a price typically equivalent to normal selling price and in excess of the cost or carrying amount. Upon delivery, the Company records the present value of all payments under these leases as revenues, and the related costs of the product are charged to cost of sales. Interest income is recognized throughout the lease term (typically three to five years) using an implicit interest rate. Through
December 31, 2017
, lease sales have not been a significant portion of the Company’s total sales.
Contracted service sales.
The Company engages in contracts for development, production, and services activities related to standard product modification or enhancement, which it accounts for using the proportional performance method of revenue recognition. The Company considers the nature of these contracts and the types of products and services provided when determining the proper accounting for a particular contract. Customer and government-agency contracted engineering service and grant sales under development contracts are recognized primarily under the proportional performance method during the period in which the Company performs the service or development efforts in accordance with the agreement. Services performed under these types of contracts include engineering studies, surveys, building construction, prototype development, and program management. Performance is determined principally by comparing the accumulated costs incurred to date with management’s estimate of the total cost to complete the contracted work. The Company establishes billing terms at the time project deliverables and milestones are agreed. Unbilled revenue recognized in excess of the amounts invoiced to clients are classified within the accompanying consolidated balance sheets in the caption “prepaid expenses and other assets.”
The use of contract accounting requires significant judgment relative to estimating total contract revenues and costs, including assumptions relative to the length of time to complete the contract, the nature and complexity of the work to be performed, and prices for subcontractor services and materials. The risk to the Company on a fixed-price contract is that if estimates to complete the contract change from one period to the next, profit levels will vary from period to period. The Company's estimates are based upon the professional knowledge and experience of its engineers, program managers and other personnel, who review each long-term contract monthly to assess the contract's schedule, performance, technical matters and estimated cost at completion. Changes in estimates are applied when adjustments in estimated contract costs are identified, such revisions may result in current period adjustments to earnings applicable to performance in prior periods. Any advance payments arising from such extended-term development contracts are recorded as deposits. If, in any period, estimated total costs under a contract indicate an expected loss, then such loss is provided for in that period. Through
December 31, 2017
, contracted service revenue has not been a significant portion of the Company’s total sales.
Product service sales.
Product service sales other than under development contracts are recognized when completed services are provided to the customer and collectability is reasonably assured. The Company establishes reserves for potential sales returns, credit and allowances, and evaluates, on a monthly basis, the adequacy of those reserves based upon historical experience and its expectations for the future. Through
December 31, 2017
, product service sales have not been a significant portion of the Company’s total sales.
Extended warranty sales
. The Company sells extended warranty contracts on mobile connectivity and inertial navigation products. Sales under these contracts are recognized ratably over the contract term. Through
December 31, 2017
, warranty sales have not been a significant portion of the Company’s total sales.
|
(f)
|
Fair Value of Financial Instruments
|
The carrying amounts of the Company’s financial instruments, which include cash equivalents, investments, accounts receivable, accounts payable and accrued expenses approximate their fair values due to the short maturity of these instruments. The carrying amount of the Company’s mortgage loan approximates fair value based on currently available quoted rates of similarly structured mortgage facilities. See Note 2 for more information on the fair value of the Company’s marketable securities.
78
KVH INDUSTRIES, INC. AND SUBSIDIARIES
NOTES TO CONSOLIDATED FINANCIAL STATEMENTS—(Continued)
December 31, 2017, 2016, and 2015
(in thousands except per share amounts)
|
(g)
|
Cash, Cash Equivalents, and Marketable Securities
|
In accordance with the Company’s investment policy, cash in excess of operational needs is invested in money market mutual funds, government agency bonds, United States treasuries, municipal bonds, corporate notes, and certificates of deposit. All highly liquid investments with a maturity date of three months or less at the date of purchase are classified as cash equivalents. The Company determines the appropriate classification of marketable securities at each balance sheet date. As of
December 31, 2017
and
2016
, all of the Company’s marketable securities have been designated as available-for-sale and are carried at their fair value with unrealized gains and losses included in accumulated other comprehensive (loss) income in the accompanying consolidated balance sheets.
The Company reviews investments in debt securities for other than temporary impairment whenever the fair value of an investment is less than amortized cost and evidence indicates that an investment’s carrying amount is not recoverable within a reasonable period of time. To determine whether an impairment is other-than-temporary, the Company considers whether it intends to sell the security, whether it expects to recover the credit loss, and if it is more likely than not that the Company will be required to sell the security prior to recovery. Evidence considered in this assessment includes the reasons for the impairment, compliance with the Company’s investment policy, the severity and duration of the impairment, changes in value subsequent to year-end and forecasted performance of the investee. The Company has reviewed its securities with unrealized losses as of
December 31, 2017
and
2016
and has concluded that no other-than-temporary impairments exist.
|
(h)
|
Inventories
|
Inventories are stated at the lower of cost and net realizable value using the first-in first-out costing method. The Company adjusts the carrying value of its inventory based on the consideration of excess and obsolete components based on future estimate demand. The Company records inventory charges to costs of product sales.
|
(i)
|
Property and Equipment
|
Property and equipment are stated at cost. Depreciation and amortization are computed on the straight-line method over the estimated useful lives of the respective assets. The principal lives used in determining the depreciation rates of various assets are: buildings and improvements,
5
-
40 years
; leasehold improvements, shorter of original lease term or useful life; machinery, satellite hubs and equipment, and video-on-demand (VOD) units,
4
-
10 years
; office and computer equipment,
3
-
7 years
; and motor vehicles,
5 years
.
|
(j)
|
Goodwill, Intangible Assets and other Long-Lived Assets
|
The Company’s goodwill and intangible assets are associated with the purchase of Virtek Communication (now known as KVH Industries Norway AS) in September 2010, Headland Media Limited (now known as the KVH Media Group) in May 2013, and Videotel in July 2014.
79
KVH INDUSTRIES, INC. AND SUBSIDIARIES
NOTES TO CONSOLIDATED FINANCIAL STATEMENTS—(Continued)
December 31, 2017, 2016, and 2015
(in thousands except per share amounts)
ASC Topic 350,
Intangibles—Goodwill and Other
(ASC 350) requires the completion of a goodwill impairment test at least annually. Historically, this goodwill impairment test was comprised of a two-step process. In January 2017, the FASB issued ASC Update No. 2017-04,
Intangibles—Goodwill and Other
(Topic 350): Simplifying the Test of Goodwill Impairment
. This ASC simplified the accounting for goodwill impairment for all entities by requiring impairment charges to be based on the first step of the goodwill impairment test under ASC 350. Under previous guidance, if the fair value of a reporting unit was lower than its carrying amount (Step 1), an entity would calculate any impairment charge by comparing the implied fair value of goodwill with its carrying amount (Step 2). The implied fair value of goodwill was calculated by deducting the fair value of all assets and liabilities of the reporting unit from the reporting unit’s fair value as determined in Step 1. To determine the implied fair value of goodwill, entities would estimate the fair value of any unrecognized intangible assets (including in-process research and development) and any corporate level assets or liabilities that were included in the determination of the carrying amount and fair value of the reporting unit in Step1. Under this new guidance, if a reporting unit's carrying value exceeds its fair value, an entity will record an impairment charge based on that difference, with such impairment charge limited to the amount of goodwill in the reporting unit. This ASC does not change the guidance on completing Step 1 of the goodwill impairment test. An entity will still be able to perform the existing optional qualitative goodwill impairment assessment before determining whether to proceed to Step 1. This ASC will be applied prospectively and is effective for annual and interim impairment test performed in periods beginning after December 15, 2019 for public business enterprises. Early adoption is permitted for annual and interim goodwill impairment testing dates after January 1, 2017. The Company has elected to early adopt this ASC as of January 1, 2017. The adoption of this ASC had no impact on the Company's consolidated statements of operations, financial condition or cash flows.
The Company has historically performed its annual goodwill impairment test as of August 31st. During the three months ended December 31, 2017, the Company changed its annual impairment assessment date from August 31st to October 1st to better align the timing of the test date with its annual budgeting cycle. The Company does not consider the change in the annual goodwill impairment testing date to be a material change to its method of applying an accounting principle. In connection with the change in the date of its annual goodwill impairment test, the Company performed a goodwill impairment test as of both August 31, 2017 and October 1, 2017, and concluded that the fair value of its reporting units exceeded their carrying value. To date, the Company has not had accumulated goodwill impairment losses. For the August 31, 2017 test, the Company utilized an income approach and market approaches to estimate the fair value of the Company’s reporting units. The Company believes that the assumptions it used to estimate the fair value of its reporting units were reasonable. As an additional corroborative test of the reasonableness of those assumptions, the Company completed a reconciliation of its market capitalization and overall enterprise value to the fair value of all of its reporting units as of August 31, 2017. The Company notes that, as of August 31, 2017, the fair value of all of the Company’s reporting units exceeded their carrying values by more than 10%. A negative trend of operating results or material changes to forecasted operating results could result in the requirement for additional interim goodwill impairment tests and the potential of a future goodwill impairment charge, which could be material. For the October 1, 2017 test, the Company performed a qualitative assessment over goodwill impairment concluding it was more-likely-than-not that its reporting units fair value exceeded their carrying value. Accordingly, it was not necessary for the Company to perform the full Step 1 quantitative analysis.
Intangible assets with estimated lives and other long-lived assets are reviewed for impairment when events or changes in circumstances indicate that the carrying amount of an asset may not be recoverable. Recoverability of intangible assets with estimated lives and other long-lived assets is measured by a comparison of the carrying amount of an asset or asset group to future net undiscounted cash flows expected to be generated by the asset or asset group. If these comparisons indicate that an asset is not recoverable, the Company will recognize an impairment loss for the amount by which the carrying value of the asset or asset group exceeds the related estimated fair value. Estimated fair value is based on either discounted future operating cash flows or appraised values, depending on the nature of the asset. During
2017
, there were no events or changes in circumstances that indicated any of the carrying amounts of the Company’s intangible assets or other long-lived assets may not be recoverable. See Note 9 for further discussion of goodwill and intangible assets.
|
(k)
|
Other Non-Current Assets
|
Other non-current assets are primarily comprised of long-term lease receivables, prepaid expenses, and deposits.
80
KVH INDUSTRIES, INC. AND SUBSIDIARIES
NOTES TO CONSOLIDATED FINANCIAL STATEMENTS—(Continued)
December 31, 2017, 2016, and 2015
(in thousands except per share amounts)
|
(l)
|
Product Warranty
|
The Company’s products carry standard limited warranties that range from
one
to
two years
and vary by product. The warranty period begins on the date of retail purchase or lease by the original purchaser. The Company accrues estimated product warranty costs at the time of sale and any additional amounts are recorded when such costs are probable and can be reasonably estimated. Factors that affect the Company’s warranty liability include the number of units sold or leased, historical and anticipated rates of warranty repairs and the cost per repair. Warranty and related costs are reflected within sales, marketing and support in the accompanying statements of operations. As of
December 31, 2017
and
2016
, the Company had accrued product warranty costs of
$2,074
and
$2,280
, respectively. The following table summarizes product warranty activity during
2017
and
2016
:
|
2017
|
2016
|
||||||
|
Beginning balance
|
$
|
2,280
|
|
$
|
1,880
|
|
|
|
Charges to expense
|
1,042
|
|
1,723
|
|
|||
|
Costs incurred
|
(1,248
|
)
|
(1,323
|
)
|
|||
|
Ending balance
|
$
|
2,074
|
|
$
|
2,280
|
|
|
|
(m)
|
Shipping and Handling Costs
|
Shipping and handling costs are expensed as incurred and included in cost of sales. Billings for shipping and handling are reflected within net sales in the accompanying statements of operations.
|
(n)
|
Research and Development
|
Expenditures for research and development, including customer-funded research and development, are expensed as incurred. Revenue and related development costs from customer-funded research and development are as follows:
|
|
Year Ended December 31,
|
||||||||||
|
|
2017
|
2016
|
2015
|
||||||||
|
Customer-funded service sales
|
$
|
2,621
|
|
$
|
1,400
|
|
$
|
3,002
|
|
||
|
Customer-funded costs included in costs of service sales
|
1,510
|
|
498
|
|
1,546
|
|
|||||
|
(o)
|
Advertising Costs
|
Costs related to advertising are expensed as incurred. Advertising expense was
$2,739
,
$2,761
, and
$2,712
for the
years ended December 31, 2017, 2016, and 2015
, respectively, and is included in sales, marketing, and support expense in the accompanying consolidated statements of operations.
|
(p)
|
Foreign Currency Translation
|
The financial statements of the Company’s foreign subsidiaries located in Denmark and Singapore are maintained using the United States dollar as the functional currency. Exchange rates in effect on the date of the transaction are used to record monetary assets and liabilities. Revenue and other expense elements are recorded at rates that approximate the rates in effect on the transaction dates.
Foreign currency exchange gains and losses are recognized within “other (expense) income” in the accompanying consolidated statements of operations
. For the
years ended December 31, 2017, 2016, and 2015
, the Company recorded a total of net foreign currency exchange losses (gains) in its accompanying consolidated statements of operations of
$554
,
$(53)
, and
$59
, respectively, which is comprised of both realized and unrealized foreign currency exchange gains and losses.
The financial statements of the Company’s foreign subsidiaries located in the United Kingdom, Brazil, Norway, Cyprus, Belgium, the Netherlands and Japan use the foreign subsidiaries’ respective local currencies as the functional currency. The Company translates the assets and liabilities of these foreign subsidiaries at the exchange rates in effect at year-end. Net sales, costs and expenses are translated using average exchange rates in effect during the year. Gains and losses from foreign currency translation are credited or charged to accumulated other comprehensive loss included in stockholders' equity in the accompanying consolidated balance sheets.
81
KVH INDUSTRIES, INC. AND SUBSIDIARIES
NOTES TO CONSOLIDATED FINANCIAL STATEMENTS—(Continued)
December 31, 2017, 2016, and 2015
(in thousands except per share amounts)
|
(q)
|
Income Taxes
|
We are subject to income taxes in the U.S. and in numerous foreign jurisdictions. The Company accounts for income taxes following ASC Topic 740,
Accounting for Income Taxes.
Deferred tax assets and liabilities are recognized for the future tax consequences attributable to differences between the financial statement carrying amounts of existing assets and liabilities and their respective tax bases using enacted tax rates expected to apply to taxable income in the years in which those temporary differences are expected to be recovered or settled. Deferred tax assets are reduced by a valuation allowance if it is more likely than not that some or all of a deferred tax asset will not be realized. The Company determines whether it is more likely than not that a tax position will be sustained upon examination. If it is not more likely than not that a position will be sustained, no amount of the benefit attributable to the position is recognized. The tax benefit to be recognized of any tax position that meets the more likely than not recognition threshold is calculated as the largest amount that is
more than 50%
likely of being realized upon resolution of the contingency.
The effect on deferred tax assets and liabilities of a change in tax rates is recognized in income in the period that includes the enactment date. The Company recognizes interest and penalties within the income tax expense line in the accompanying consolidated statements of operations. Accrued interest and penalties are included within the related tax liability line in the consolidated balance sheets. See Note 8 for further discussion of income taxes.
|
(r)
|
Net (Loss) Income per Common Share
|
Basic net (loss) income per share is calculated based on the weighted average number of common shares outstanding during the period. Diluted net income per share incorporates the dilutive effect of common stock equivalent options, warrants and other convertible securities, if any, as determined in accordance with the treasury stock accounting method. Common stock equivalents related to options and restricted stock awards for
766
shares of common stock for the year ended December 31, 2015 have been excluded from the fully diluted calculation of net income per share, as inclusion would be anti-dilutive. For the years ended
December 31, 2017
and 2016 since there was a net loss, the Company excluded
228
and
162
shares, respectively, subject to outstanding stock options and non-vested restricted shares from its diluted loss per share calculation, as inclusion of these securities would have reduced the net loss per share.
A reconciliation of the basic and diluted weighted average common shares outstanding is as follows:
|
2017
|
2016
|
2015
|
||||||
|
Weighted average common shares outstanding—basic
|
16,419
|
|
15,834
|
|
15,625
|
|
||
|
Dilutive common shares issuable in connection with stock plans
|
—
|
|
—
|
|
209
|
|
||
|
Weighted average common shares outstanding—diluted
|
16,419
|
|
15,834
|
|
15,834
|
|
||
|
(s)
|
Contingent Liabilities
|
The Company estimates the amount of potential exposure it may have with respect to claims, assessments and litigation in accordance with ASC 450,
Contingencies
. As of
December 31, 2017
and
2016
, the Company was not party to any lawsuit or proceeding that, in management's opinion, was likely to materially harm the Company's business, results of operations, financial condition or cash flows, as described in Note 16. It is not always possible to predict the outcome of litigation, as it is subject to many uncertainties. Additionally, it is not always possible for management to make meaningful estimate of the potential loss or range of loss associated with such litigation.
82
KVH INDUSTRIES, INC. AND SUBSIDIARIES
NOTES TO CONSOLIDATED FINANCIAL STATEMENTS—(Continued)
December 31, 2017, 2016, and 2015
(in thousands except per share amounts)
|
(t)
|
Operating Segments
|
The Company operates in two segments, the mobile connectivity and inertial navigation segments. Operating segments are identified as components of an enterprise about which separate discrete financial information is available for evaluation by the chief operating decision maker in making decisions regarding resource allocation and assessing performance. The Company’s chief operating decision maker is its President, Chief Executive Officer and Chairman of the Board.
The Company's reportable segments are: mobile connectivity and inertial navigation (see Note 12, "
Segment Reporting
"). The Company operates in a number of major geographic areas, including internationally. Revenues from international locations, primarily consisting of Canada, European countries, both inside and outside the European Union, as well as Africa, Asia/Pacific, the Middle East, and South America.
(u) Film Production Costs
The Company capitalizes direct costs incurred in the production of its training videos, such as writing, directing, narrating, casting, location rental, and editing. These film costs are classified as a non-current asset on its consolidated balance sheet and are placed into service upon the film title being released and available for customers' use. The Company’s sales model associated with training is subscription-based, in which fees from third parties are not directly attributable to the exhibition of a particular film but relate instead to access to the entire film library. Accordingly, management estimates that the straight line method is the most representative method for the amortization of film costs. Consistent with the period over which revenues are assessed (i.e. the subscription period), the film costs are amortized over four years. In the event that the film title is replaced or removed from the film library before the amortization period has expired, all unamortized costs are expensed immediately.
(v) Recently Issued Accounting Standards
From time to time, new accounting pronouncements are issued by the FASB or other standard setting bodies. Recently issued standards typically do not require adoption until a future effective date. Prior to their effective date, the Company evaluates the pronouncements to determine the potential effects of adoption on our consolidated financial statements.
Standards Implemented
ASC Update No. 2015-11
In April 2015, the FASB issued ASC Update No. 2015-11,
Simplifying the Measurement of Inventory
regarding ASC Topic 330 - Inventory. Update No. 2015-11 require entities that measure inventory using the first-in, first-out or average cost methods to measure inventory at the lower of cost and net realizable value. Net realizable value is defined as estimated selling price in the ordinary course of business less reasonably predictable costs of completion and disposal. Update No. 2015-11 is effective on a prospective basis for fiscal years, and for interim periods within those fiscal years, beginning after December 15, 2016, with earlier application permitted. The Company adopted Update No. 2015-11 on January 1, 2017 and the adoption did not have a material effect on the Company's consolidated financial position, results of operations or cash flows.
83
KVH INDUSTRIES, INC. AND SUBSIDIARIES
NOTES TO CONSOLIDATED FINANCIAL STATEMENTS—(Continued)
December 31, 2017, 2016, and 2015
(in thousands except per share amounts)
ASC Update No. 2016-09
In March 2016, the FASB issued ASC Update No. 2016-09,
Compensation- Stock Compensation (Topic 718): Improvements to Employee Share-Based Payment Accounting
. This update is effective for annual reporting periods after December 15, 2016, including interim periods within those fiscal periods. Early adoption is permitted. The purpose of the update is to simplify several areas of the accounting for share-based payment transactions, including the income tax consequences, classification of awards as either equity or liabilities, and classification on the statement of cash flows. The Company adopted this ASC update on January 1, 2017. Although this ASC update does not impact the Company’s results of operations, financial position or cash flows for any periods prior to the adoption, the adoption of this ASC update had the following impact on the date of adoption:
|
•
|
The adoption of Update No. 2016-09 requires all income tax adjustments to be recorded in the consolidated statements of operations. The cumulative adjustment upon adoption to accumulated earnings was zero since the increase in net deferred tax assets was fully offset by a corresponding increase in the deferred tax asset valuation allowance. The amount of deferred tax assets that had not been previously recognized due to the recognition of excess tax benefits was
|
$1,571
.
|
•
|
The Company has elected to account for forfeitures on share-based payments as these forfeitures occur, which represents a change from the accounting previously required under ASC Topic 718. As a result, the Company notes that future forfeitures could result in a significant reversal of stock-based compensation expense recognized in the period in which such forfeitures occur.
|
ASC Update No. 2017-04
In January 2017, the FASB issued ASC Update No. 2017-04,
Intangibles--Goodwill and Other (Topic 350): Simplifying the Test of Goodwill Impairment.
This ASC simplifies the accounting for goodwill impairment for all entities by requiring impairment charges to be based on the first step of the goodwill impairment test under ASC 350. Under previous guidance, if the fair value of a reporting unit is lower than its carrying amount (Step 1), an entity calculates any impairment charge by comparing the implied fair value of goodwill with its carrying amount (Step 2). The implied fair value of goodwill is calculated by deducting the fair value of all assets and liabilities of the reporting unit from the reporting unit’s fair value as determined in Step 1. To determine the implied fair value of goodwill, entities estimate the fair value of any unrecognized intangible assets (including in-process research and development) and any corporate-level assets or liabilities that were included in the determination of the carrying amount and fair value of the reporting unit in Step 1. Under this new guidance, if a reporting unit's carrying value exceeds its fair value, an entity will record an impairment charge based on that difference, with such impairment charge limited to the amount of goodwill in the reporting unit. This ASC does not change the guidance on completing Step 1 of the goodwill impairment test. An entity will still be able to perform the existing optional qualitative goodwill impairment assessment before determining whether to proceed to Step 1. This ASC will be applied prospectively and is effective for annual and interim impairment test performed in periods beginning after December 15, 2019 for public business enterprises. Early adoption is permitted for annual and interim goodwill impairment testing dates after January 1, 2017. The Company elected to early adopt this ASC as of January 1, 2017. The adoption of this ASC had no impact on the Company's consolidated statements of operations, financial condition or cash flows. The Company expects that adoption of this ASC will simplify the evaluation and recording of goodwill impairment charges, if any.
Standards to be Implemented
ASC Updates No. 2014-09, No. 2016-08, No. 2016-10, No. 2016-11, No. 2016-12 and No. 2016-20
In May 2014, the FASB issued ASC Update No. 2014-09,
Revenue from Contracts with Customers (Topic 606).
Update No. 2014-09 provides enhancements to the quality and consistency of how revenue is reported while also improving comparability in the financial statements of companies using International Financial Reporting Standards and U.S. GAAP. The core principle requires entities to recognize revenue in a manner that depicts the transfer of goods or services to customers in amounts that reflect the consideration an entity expects to be entitled to in exchange for those goods or services. In July 2015, the FASB voted to approve a one-year deferral, making the standard effective for public entities for annual and interim periods beginning after December 15, 2017.
84
KVH INDUSTRIES, INC. AND SUBSIDIARIES
NOTES TO CONSOLIDATED FINANCIAL STATEMENTS—(Continued)
December 31, 2017, 2016, and 2015
(in thousands except per share amounts)
In March 2016, the FASB issued ASC Update No. 2016-08,
Revenue from Contracts with Customers (Topic 606): Principal versus Agent Considerations (Reporting Revenue Gross versus Net)
. The purpose of Update No. 2016-08 is to clarify the guidance on principal versus agent considerations. It includes indicators that help to determine whether an entity controls the specified good or service before it is transferred to the customer and to assist in determining when the entity satisfied the performance obligation and as such, whether to recognize a gross or a net amount of consideration in their consolidated statement of operations.
In April 2016, the FASB issued ASC Update No. 2016-10,
Revenue from Contracts with Customers (Topic 606): Identifying Performance Obligations and Licensing.
Update No. 2016-10 clarifies that entities are not required to assess whether promised goods or services are performance obligations if they are immaterial in the context of the contract. Update No. 2016-10 also addresses how to determine whether promised goods or services are separately identifiable and permits entities to make a policy election to treat shipping and handling costs as fulfillment activities. In addition, it clarifies key provisions in Topic 606 related to licensing.
In May 2016, the FASB issued ASC Update No. 2016-11,
Revenue Recognition (Topic 605) and Derivatives and Hedging (Topic 815).
Update No. 2016-11 rescinds previous SEC comments that were codified in Topic 605, Topic 932 and Topic 815. Upon adoption of Topic 606, certain SEC comments including guidance on accounting for shipping and handling fees and costs and consideration given by a vendor to a customer should not be relied upon.
In May 2016, the FASB also issued ASC Update No. 2016-12,
Revenue from Contracts with Customers (Topic 606): Narrow Scope Improvements and Practical Expedients
. Update No. 2016-12 provides clarity around collectability, presentation of sales taxes, non-cash consideration, contract modifications at transition and completed contracts at transition. Update No. 2016-12 also includes a technical correction within Topic 606 related to required disclosures if the guidance is applied retrospectively upon adoption.
In December 2016, the FASB issued ASC Update No. 2016-20,
Technical Corrections and Improvements to Topic 606, Revenue from Contracts with Customers
. Update No. 2016-20 allows entities not to make quantitative disclosures about remaining performance obligations in certain cases and requires entities that use any of the optional exemptions to expand their qualitative disclosures. Update No. 2016-20 also clarifies other areas of the new revenue standard, including disclosure requirements for prior period performance obligations, impairment guidance for contract costs and the interaction of impairment guidance in ASC 340-40 with other guidance elsewhere in the Codification.
85
KVH INDUSTRIES, INC. AND SUBSIDIARIES
NOTES TO CONSOLIDATED FINANCIAL STATEMENTS—(Continued)
December 31, 2017, 2016, and 2015
(in thousands except per share amounts)
The Company adopted Topic 606 effective January 1, 2018. The Company adopted Topic 606 under the modified retrospective method and is only applying this method to contracts that were not completed as of the date of adoption. The modified retrospective method resulted in a cumulative effect of initially applying the standard as an adjustment to the opening balance of retained earnings at the date of initial application for any open contracts as of the adoption date. The Company established an implementation team to assist with its assessment of the impact of the new revenue guidance on its operations, consolidated financial statements and related disclosures. To date, this assessment has included (1) utilizing questionnaires to assist with the identification of revenue streams, (2) performing sample contract analyses for each revenue stream identified, (3) assessing the noted differences in recognition and measurement that may result from adopting this new standard, (4) performing detailed analyses of contracts with larger customers, and (5) developing plans to test transactions for consistency with contract provisions that affect revenue recognition. The adoption of Topic 606 will have a material effect on the Company's consolidated financial statements with the most significant impact related to our mobile connectivity segment. Based on the preliminary results of the evaluation, which is still in process, the Company currently believes that the most significant potential changes relate to promised services under certain contracts that were previously determined to be separate units of accounting under Topic 605 will not be separate performance obligations under Topic 606 due to the fact that they are not distinct in the context of the contract, which will impact the timing of revenue recognition. The Company anticipates that the most significant impact of the new standard will relate to the timing of revenue recognition for certain mini-VSAT Broadband hardware contracts. The Company also anticipates changes to the consolidated balance sheet related to accounts receivable, contract assets, and contract liabilities, as well as enhanced footnote disclosures related to customer contracts. The Company is still evaluating the impact that Topic 606 is expected to have on its accounting for costs to obtain and fulfill a contract. The Company anticipates that the adoption of Topic 606 associated with VSAT contracts as of January 1, 2018 will result in an increase to its accumulated deficit of
$3.0 million
to
$4.0 million
. This anticipated adjustment represents the gross margin on approximately
$12 million
to
$14 million
of previously recognized revenue under current guidance. Gross margin reflects revenue less cost of revenue. These ranges represent management’s best estimates of the effects of adopting Topic 606 at the time of the preparation of this Annual Report on Form 10-K. The actual impact of Topic 606 is subject to change from these estimates and such change may be significant, pending the completion of the Company’s assessment in the first quarter of 2018.
The Company is in the process of evaluating and designing the necessary changes to its business processes, systems and controls to support recognition and disclosure under the new standard. Further, the Company is continuing to assess what incremental disaggregated revenue disclosures will be required in its consolidated financial statements.
ASC Update No. 2016-01
In January 2016, the FASB issued ASC Update No. 2016-01,
Financial Instruments-Overall (Subtopic 825-10): Recognition and Measurement of Financial Assets and Financial Liabilities.
It is effective for fiscal years beginning after December 15, 2017, including interim periods within those fiscal years. Early application of certain provisions is permitted. Update No. 2016-01 requires entities to measure equity investments that do not result in consolidation and are not accounted for under the equity method at fair value with changes recognized in net income. However, an entity may choose to measure equity investments that do not have readily determinable fair values at cost minus impairment, if any, plus or minus changes resulting from observable price changes in orderly transactions for the identical or a similar investment of the same issuer. It also simplifies the impairment assessment of equity investments without readily determinable fair values by requiring a qualitative assessment to identify impairment. Update No. 2016-01 also requires separate presentation of financial assets and financial liabilities by measurement category and form of financial asset and liability. The adoption of Update No. 2016-01 is not expected to have a material impact on the Company's financial position or results of operations.
86
KVH INDUSTRIES, INC. AND SUBSIDIARIES
NOTES TO CONSOLIDATED FINANCIAL STATEMENTS—(Continued)
December 31, 2017, 2016, and 2015
(in thousands except per share amounts)
ASC Update No. 2016-02
In February 2016, the FASB issued ASC Update No. 2016-02,
Leases (Topic 842).
It is effective for fiscal years beginning after December 15, 2018, including interim periods within those fiscal years. Earlier application is permitted. Update No. 2016-02 creates new accounting and reporting guidelines for leasing arrangements. The new guidance requires organizations that lease assets to recognize assets and liabilities on the balance sheet related to the rights and obligations created by those leases, regardless of whether they are classified as finance or operating leases. Consistent with current guidance, the recognition, measurement, and presentation of expenses and cash flows arising from a lease primarily will depend on its classification as a finance or operating lease. The guidance also requires new disclosures to help financial statement users better understand the amount, timing, and uncertainty of cash flows arising from leases. The new standard is to be applied using a modified retrospective approach. The Company is currently evaluating the impact of the new pronouncement on its financial statements. Based on its preliminary assessment, upon adoption the Company expects to recognize significant right-to-use assets and corresponding lease liabilities on its balance sheet related to leased facilities and equipment.
ASC Update No. 2016-13
In June 2016, the FASB issued ASC Update No. 2016-13,
Financial Instruments - Credit Losses (Topic 326): Measurement of Credit Losses on Financial Instruments
. The update is effective for fiscal years beginning after December 15, 2019. Early adoption is permitted for fiscal years beginning after December 15, 2018. The purpose of Update No. 2016-13 is to replace the current incurred loss impairment methodology for financial assets measured at amortized cost with a methodology that reflects expected credit losses and requires consideration of a broader range of reasonable and supportable information, including forecasted information, to develop credit loss estimates. The adoption of Update No. 2016-13 is not expected to have a material impact on the Company's financial position or results of operations.
ASC Update No. 2016-15
In August 2016, the FASB issued ASC Update No. 2016-15,
Statement of Cash Flows (Topic 230): Classification of Certain Cash Receipts and Cash Payments.
The update is effective for fiscal years beginning after December 15, 2017 and interim periods within those fiscal years. Early adoption is permitted, including adoption in an interim period. The purpose of Update No. 2016-15 is to reduce the diversity in practice in presentation and classification of the following items within the statement of cash flows: debt prepayments, settlement of zero coupon debt instruments, contingent consideration payments, insurance proceeds, securitization transactions and distributions from equity method investees. The update also addresses classification of transactions that have characteristics of more than one class of cash flows. The adoption of Update No. 2016-15 is not expected to have a material impact on the Company's financial position or results of operations.
ASC Update No. 2016-16
In October 2016, the FASB issued ASU Update No. 2016-16,
Income Taxes (Topic 740): Intra-Entity Transfers of Assets Other Than Inventory
. The update is effective for fiscal years beginning after December 15, 2017, including interim reporting periods within those fiscal years. Early adoption is permitted as of the beginning of an annual reporting period for which financial statements (interim or annual) have not been issued or made available for issuance. The purpose of Update No. 2016-16 is to allow an entity to recognize the income tax consequences of an intra-entity transfer of an asset other than inventory when the transfer occurs, as opposed to waiting until the asset is sold to an outside party. The adoption of Update No. 2016-16 is not expected to have a material impact on the Company's financial position or results of operations.
ASC Update No. 2017-09
In May 2017, the FASB issued ASC Update No. 2017-09,
Compensation—Stock Compensation (Topic 718): Scope of Modification Accounting.
The update is effective for annual periods beginning on or after December 15, 2017. Early adoption is permitted. The purpose of Update No. 2017-09 is to clarify when to account for a change to the terms or conditions of a share-based payment award as a modification under Topic 718,
Compensation - Stock Compensation
. Under this new guidance, modification accounting is only required if the fair value, the vesting conditions, or the equity or liability classification of the award changes as a result of the change in terms or conditions. The Company expects that the adoption of this standard will only affect, on a prospective basis, the manner in which the Company evaluates any changes to the terms or conditions of its share-based payment awards.
87
KVH INDUSTRIES, INC. AND SUBSIDIARIES
NOTES TO CONSOLIDATED FINANCIAL STATEMENTS—(Continued)
December 31, 2017, 2016, and 2015
(in thousands except per share amounts)
ASC Update No. 2017-12
In August 2017, the FASB issued ASC Update No. 2017-12,
Derivatives and Hedging (Topic 815): Targeted Improvements to Accounting for Hedging Activities
. The update is effective for annual periods beginning after December 15, 2018. Early adoption is permitted. The purpose of Update No. 2017-12 is to improve the presentation and disclosure requirements for, and simplify the application and increase transparency of hedge accounting. The adoption of Update No. 2017-12 is not expected to have a material impact on the Company's financial position or results of operations.
There are no other recent accounting pronouncements issued by the FASB that the Company expects would have a material impact on the Company's financial statements.
|
(2)
|
Marketable Securities
|
Marketable securities consisted of the following as of
December 31, 2017
and
2016
:
|
December 31, 2017
|
Amortized
Cost
|
Gross
Unrealized
Gains
|
Gross
Unrealized
Losses
|
Fair
Value
|
|||||||||||
|
Money market mutual funds
|
$
|
7,318
|
|
$
|
—
|
|
$
|
—
|
|
$
|
7,318
|
|
|||
|
United States treasuries
|
1,002
|
|
—
|
|
(1
|
)
|
1,001
|
|
|||||||
|
Total marketable securities designated as available-for-sale
|
$
|
8,320
|
|
$
|
—
|
|
$
|
(1
|
)
|
$
|
8,319
|
|
|||
|
December 31, 2016
|
Amortized
Cost
|
Gross
Unrealized
Gains
|
Gross
Unrealized
Losses
|
Fair
Value
|
|||||||||||
|
Money market mutual funds
|
$
|
21,848
|
|
$
|
—
|
|
$
|
—
|
|
$
|
21,848
|
|
|||
|
Certificates of deposit
|
3,864
|
|
—
|
|
—
|
|
3,864
|
|
|||||||
|
Total marketable securities designated as available-for-sale
|
$
|
25,712
|
|
$
|
—
|
|
$
|
—
|
|
$
|
25,712
|
|
|||
The amortized costs and fair value of debt securities as of
December 31, 2017
and
2016
are shown below by effective maturity. Effective maturities may differ from contractual maturities because the issuers of the securities may have the right to prepay obligations without prepayment penalties.
|
December 31, 2017
|
Amortized
Cost
|
Fair
Value
|
|||||
|
Due in less than one year
|
$
|
1,002
|
|
$
|
1,001
|
|
|
|
Due after one year and within two years
|
—
|
|
—
|
|
|||
|
$
|
1,002
|
|
$
|
1,001
|
|
||
|
December 31, 2016
|
Amortized
Cost
|
Fair
Value
|
|||||
|
Due in less than one year
|
$
|
3,864
|
|
$
|
3,864
|
|
|
|
Due after one year and within two years
|
—
|
|
—
|
|
|||
|
$
|
3,864
|
|
$
|
3,864
|
|
||
Interest income from cash equivalents and marketable securities was
$107
and
$94
for the years ended
December 31, 2017
and
2016
, respectively.
88
KVH INDUSTRIES, INC. AND SUBSIDIARIES
NOTES TO CONSOLIDATED FINANCIAL STATEMENTS—(Continued)
December 31, 2017, 2016, and 2015
(in thousands except per share amounts)
|
(3)
|
Inventories
|
The Company adopted ASC 2015-11,
Simplifying the Measurement of Inventory
as of January 1, 2017. ASC 2015-11 simplifies the subsequent measurement of inventory by replacing the lower of cost or market test with a lower of cost and net realizable value test. The adoption of this standard did not have a material impact on the Company’s consolidated financial position or results of operations. Inventories are stated at the lower of cost and net realizable value using the first-in first-out costing method. Inventories as of
December 31, 2017
and
2016
include the costs of material, labor, and factory overhead. Components of inventories consist of the following:
|
|
December 31,
|
||||||
|
|
2017
|
2016
|
|||||
|
Raw materials
|
$
|
13,347
|
|
$
|
10,606
|
|
|
|
Work in process
|
2,137
|
|
2,185
|
|
|||
|
Finished goods
|
7,248
|
|
7,954
|
|
|||
|
$
|
22,732
|
|
$
|
20,745
|
|
||
|
(4)
|
Property and Equipment
|
Property and equipment, net, as of
December 31, 2017
and
2016
consist of the following:
|
|
December 31,
|
||||||
|
|
2017
|
2016
|
|||||
|
Land
|
$
|
3,828
|
|
$
|
3,828
|
|
|
|
Building and improvements
|
24,038
|
|
21,717
|
|
|||
|
Leasehold improvements
|
429
|
|
155
|
|
|||
|
Machinery and equipment
|
53,217
|
|
41,777
|
|
|||
|
Office and computer equipment
|
13,057
|
|
14,824
|
|
|||
|
Motor vehicles
|
51
|
|
51
|
|
|||
|
94,620
|
|
82,352
|
|
||||
|
Less accumulated depreciation
|
(51,099
|
)
|
(45,766
|
)
|
|||
|
$
|
43,521
|
|
$
|
36,586
|
|
||
Depreciation expense for the
years ended December 31, 2017, 2016, and 2015
amounted to
$6,725
,
$7,608
, and
$7,193
, respectively.
Included within machinery and equipment are certain hardware revenue generating assets that had a net book value of $
11,300
and $
7,734
as of December 31, 2017 and 2016, respectively, that are utilized in the delivery of the Company's airtime services, media, and other content.
|
(5)
|
|
Long-term debt consists of the following:
|
December 31,
|
|||||||
|
2017
|
2016
|
||||||
|
Term notes
|
$
|
44,275
|
|
$
|
53,625
|
|
|
|
Mortgage loan
|
2,779
|
|
2,951
|
|
|||
|
Equipment loans
|
—
|
|
1,477
|
|
|||
|
Total
|
47,054
|
|
58,053
|
|
|||
|
Less amounts classified as current
|
2,482
|
|
7,900
|
|
|||
|
Long-term debt, excluding current portion
|
$
|
44,572
|
|
$
|
50,153
|
|
|
89
KVH INDUSTRIES, INC. AND SUBSIDIARIES
NOTES TO CONSOLIDATED FINANCIAL STATEMENTS—(Continued)
December 31, 2017, 2016, and 2015
(in thousands except per share amounts)
Term Note and Line of Credit
On
July 1, 2014
, the Company entered into (i) a
five
-year senior credit facility agreement (the Credit Agreement) with Bank of America, N.A., as Administrative Agent, and the lenders named from time to time as parties thereto (the Lenders), for an aggregate amount of up to
$80,000
, including a revolving credit facility (the Revolver) of up to
$15,000
and a term loan (Term Loan) of
$65,000
to be used for general corporate purposes, including both (A) the refinancing of the Company’s
$30,000
then-outstanding indebtedness under its previous credit facility and (B) permitted acquisitions, (ii) revolving credit notes (together, the Revolving Credit Note) to evidence the Revolver, (iii) term notes (together, the Term Note, and together with the Revolving Credit Note, the Notes) to evidence the Term Loan, (iv) a Security Agreement (the Security Agreement) required by the Lenders with respect to the grant by the Company of a security interest in substantially all of the assets of the Company in order to secure the obligations of the Company under the Credit Agreement and the Notes, and (v) Pledge Agreements (the Pledge Agreements) required by the Lenders with respect to the grant by the Company of a security interest in
65%
of the capital stock of each of KVH Industries A/S and KVH Industries U.K. Limited held by the Company in order to secure the obligations of the Company under the Credit Agreement and the Notes.
The Credit Agreement was most recently amended in March 2017 to modify the Maximum Consolidated Leverage Ratio, the Applicable Rate, the Consolidated Fixed Charge Coverage Ratio and the amortization schedule of the Term Loan, as well as to make certain other changes. The amendment was accounted for as a debt modification as it did not result in a significant modification to the Credit Agreement.
In connection with the March 2017 amendment, the Company made an additional principal repayment of
$6,000
on the Term Note and amended the repayment terms. Under the amended terms, the Company must make principal repayments of
$575
every three months starting on April 1, 2017 until the Term Note maturity on July 1, 2019. On the maturity date, the entire remaining principal balance of the loan, including any future loans under the Revolver, is due and payable, together with all accrued and unpaid interest, penalties, and any other amounts due and payable under the Credit Agreement. The Credit Agreement contains provisions requiring the mandatory prepayment of amounts outstanding under the Term Loan and the Revolver under specified circumstances, including (i)
100%
of the net cash proceeds from certain dispositions to the extent not reinvested in the Company’s business within a stated period, (ii)
50%
of the net cash proceeds from stated equity issuances and (iii)
100%
of the net cash proceeds from certain receipts of more than
$250
outside the ordinary course of business. The prepayments are first applied to the Term Loan, in inverse order of maturity, and then to the Revolver. In the discretion of the Administrative Agent, certain mandatory prepayments made on the Revolver can permanently reduce the amount of credit available under the Revolver.
Loans under the Credit Agreement bear interest at varying rates determined in accordance with the Credit Agreement. Each LIBOR Rate Loan, as defined in the Credit Agreement, bears interest on the outstanding principal amount thereof for each interest period from the applicable borrowing date at a rate per annum equal to the LIBOR Daily Floating Rate or LIBOR Monthly Floating Rate, each as defined in the Credit Agreement, as applicable, plus the Applicable Rate, as defined in the Credit Agreement, and each Base Rate Loan, as defined in the Credit Agreement, bears interest on the outstanding principal amount thereof from the applicable borrowing date at a rate per annum equal to the Base Rate, as defined in the Credit Agreement, plus the Applicable Rate. The Applicable Rate ranges from
1.75%
to
2.25%
, depending on the Company’s Consolidated Leverage Ratio, as defined in the Credit Agreement. The highest Applicable Rate applies when the Consolidated Leverage Ratio exceeds
1.50
:1.00. Upon certain defaults, including failure to make payments when due, interest becomes payable at a higher default rate.
Borrowings under the Revolver are subject to the satisfaction of numerous conditions precedent at the time of each borrowing, including the continued accuracy of the Company’s representations and warranties and the absence of any default under the Credit Agreement. As of December 31, 2017, there were no borrowings outstanding under the Revolver and the full balance of
$15,000
was available for borrowing.
The Credit Agreement contains
two
financial covenants, a Maximum Consolidated Leverage Ratio and a Minimum Consolidated Fixed Charge Coverage Ratio, each as defined in the Credit Agreement. The Maximum Consolidated Leverage Ratio may not be greater than
1.50
:1.00. The Minimum Consolidated Fixed Charge Coverage Ratio may not be less than
1.25
:1.00. In the March 2017 amendment, the definition of the Consolidated Fixed Charge Coverage Ratio was amended to include only maintenance capital expenditures, as defined. The Company was in compliance with these financial ratio debt covenants as of
December 31, 2017
.
90
KVH INDUSTRIES, INC. AND SUBSIDIARIES
NOTES TO CONSOLIDATED FINANCIAL STATEMENTS—(Continued)
December 31, 2017, 2016, and 2015
(in thousands except per share amounts)
The Credit Agreement imposes certain other affirmative and negative covenants, including without limitation covenants with respect to the payment of taxes and other obligations, compliance with laws, entry into material contracts, creation of liens, incurrence of indebtedness, investments, dispositions, fundamental changes, restricted payments, changes in the nature of the Company’s business, transactions with affiliates, corporate and accounting changes, and sale and leaseback arrangements.
The Company’s obligation to repay loans under the Credit Agreement could be accelerated upon a default or event of default under the terms of the Credit Agreement, including certain failures to pay principal or interest when due, certain breaches of representations and warranties, the failure to comply with the Company’s affirmative and negative covenants under the Credit Agreement, a change of control of the Company, certain defaults in payment relating to other indebtedness, the acceleration of payment of certain other indebtedness, certain events relating to the liquidation, dissolution, bankruptcy, insolvency or receivership of the Company, the entry of certain judgments against the Company, certain events relating to the impairment of collateral or the Lenders' security interest therein, and any other material adverse change with respect to the Company.
Mortgage Loan
The Company has a mortgage loan (as amended, the Mortgage Loan) in the amount of
$4,000
related to its headquarters facility in Middletown, Rhode Island. The loan term is
ten years
, with a principal amortization of
20 years
. The interest rate is based on the BBA LIBOR Rate plus
2.00
percentage points. The Mortgage Loan is secured by the underlying property and improvements. The monthly mortgage payment is approximately
$14
plus interest and increases in increments of approximately
$1
each year throughout the life of the mortgage. Due to the difference in the term of the loan and amortization of the principal, a balloon payment of
$2,551
is due on April 1, 2019. The loan contains
one
financial covenant, a Fixed Charge Coverage Ratio, which applies in the event that the Company’s consolidated cash, cash equivalents, and marketable securities balance falls below
$25,000
at any time. As the Company’s consolidated cash, cash equivalents, and marketable securities balance was above the minimum threshold throughout the year ended
December 31, 2017
, the Fixed Charge Coverage Ratio did not apply.
Under the Mortgage Loan, the Company may prepay its outstanding loan balance subject to certain early termination charges. If the Company were to default on the Mortgage Loan, the underlying property and improvements would be used as collateral. As discussed in Note 15 to the consolidated financial statements, the Company entered into
two
interest rate swap agreements that are intended to hedge its mortgage interest obligations over the term of the Mortgage Loan by fixing the interest rates specified in the mortgage loan to
5.91%
for half of the principal amount outstanding as of April 1, 2010 and
6.07%
for the remaining half.
Equipment Loan
On January 30, 2013, the Company borrowed
$4,700
from a bank and pledged as collateral
six
satellite hubs and related equipment. This equipment loan had a term of
five
years and carried a fixed rate of interest of
2.76%
per annum. In December 2013, the Company borrowed
$1,200
from a bank and pledged as collateral
one
satellite hub and related equipment. This equipment loan had a term of
five
years and carried a fixed rate of interest of
3.08%
per annum. In March 2017, the Company repaid in full the remaining outstanding balances of both loans before their 2018 maturity dates.
91
KVH INDUSTRIES, INC. AND SUBSIDIARIES
NOTES TO CONSOLIDATED FINANCIAL STATEMENTS—(Continued)
December 31, 2017, 2016, and 2015
(in thousands except per share amounts)
|
(6)
|
Commitments and Contingencies
|
The Company has certain operating leases for satellite capacity, various equipment, and facilities. The following reflects future minimum payments under operating leases that have initial or remaining non-cancelable lease terms at
December 31, 2017
:
|
Years ending December 31,
|
Operating
Leases
|
||
|
2018
|
$
|
13,682
|
|
|
2019
|
7,109
|
|
|
|
2020
|
2,970
|
|
|
|
2021
|
1,326
|
|
|
|
2022
|
1,189
|
|
|
|
Thereafter
|
489
|
|
|
|
Total minimum lease payments
|
$
|
26,765
|
|
Total rent expense incurred under facility operating leases for the
years ended December 31, 2017, 2016, and 2015
amounted to
$905
,
$601
, and
$630
, respectively. Total expense incurred under satellite capacity and equipment operating leases for the
years ended December 31, 2017, 2016, and 2015
amounted to
$31,774
,
$31,606
, and
$32,793
, respectively, which also includes payments for usage charges in excess of the minimum contractual requirements.
In the normal course of business, the Company enters into unconditional purchase order obligations with its suppliers for inventory and other operational purchases. Outstanding and unconditional purchase order obligations were
$13,583
as of
December 31, 2017
, which the Company expects to fulfill in 2018.
Other than the interest rate swaps (see Note 15), the Company did not have any off-balance sheet commitments, guarantees, or standby repurchase obligations as of
December 31, 2017
.
|
(7)
|
Stockholders’ Equity
|
The Company recognizes stock-based compensation in accordance with the provisions of ASC Topic 718,
Compensation--Stock Compensation
. The Company adopted ASC Update No. 2016-09,
Compensation-Stock Compensation (ASC Topic 718): Improvements to Employee Share-Based Payment Accounting
on January 1, 2017. Although this ASC update did not impact the Company’s results of operations, financial position or cash flows for any periods prior to the adoption, the adoption of this ASC update had the following impact on the date of adoption:
|
•
|
The adoption of ASC Update No. 2016-09 requires all income tax adjustments to be recorded in the consolidated statements of operations. The cumulative adjustment upon adoption to accumulated earnings was zero since the increase in net deferred tax assets was fully offset by a corresponding increase in the deferred tax asset valuation allowance. The amount of deferred tax assets that had not been previously recognized due to the recognition of excess tax benefits was $
1,571
.
|
|
•
|
The tax benefit or expense is required to be classified as a cash flow provided by (used in) operating activities. It was previously required to be presented as a cash flow provided by (used in) financing activities in the Consolidated Statements of Cash Flows, with a corresponding adjustment to operating cash flows.
|
|
•
|
In the diluted net earnings per share calculation, when applying the treasury stock method for shares that could be repurchased, the assumed proceeds no longer include the amount of excess tax benefit. This provision, which is only applicable on a prospective basis, did not have an impact on the Company's diluted net earnings per share calculation for the
year ended December 31, 2017
.
|
92
KVH INDUSTRIES, INC. AND SUBSIDIARIES
NOTES TO CONSOLIDATED FINANCIAL STATEMENTS—(Continued)
December 31, 2017, 2016, and 2015
(in thousands except per share amounts)
|
•
|
The Company has elected to account for forfeitures on share-based payments as these forfeitures occur instead of a 5% forfeiture rate, which represents a change from the accounting previously required under ASC Topic 718. As a result, future forfeitures could result in a significant reversal of stock-based compensation expense recognized in the period in which such forfeitures occur. During the
year ended December 31, 2017
, as a result of share-based award forfeitures, the Company recorded a reversal of previously recognized stock-based compensation expense of
$215
. In addition, had the Company continued to account for stock-based compensation expense related to forfeitures of share-based payments based on estimating the number of awards expected to be forfeited and recognizing only stock-based compensation expense on awards expected to vest, the Company would have recognized $
3,449
of stock-based compensation expense, or $
19
less than what was actually recorded, during the
year ended December 31, 2017
.
|
Stock-based compensation expense, excluding compensation charges related to our employee stock purchase plan, or the ESPP, was $
3,468
and $
3,640
for the
year ended December 31, 2017
and
2016
, respectively.
|
(a)
|
Employee Stock Options
|
The Company is authorized to grant stock options, restricted stock awards and other stock-based awards under its 2016 Equity and Incentive Plan (the 2016 Plan) with respect to up to 3,000 shares of common stock (plus up to an additional 1,690 shares in respect of certain awards under earlier equity compensation plans that may be forfeited, cancelled, reacquired by the Company or terminated after adoption of the 2016 Plan). Options are generally granted with an exercise price equal to the fair market value of the common stock on the date of grant and generally vest in equal annual amounts over
four years
beginning on the first anniversary of the date of the grant. No options are exercisable for periods of more than
five years
after date of grant. Under the 2016 Plan, each share issued under awards other than options and stock appreciation rights will reduce the number of shares reserved for issuance by
two
shares. Shares issued under options or stock appreciation rights will reduce the shares reserved for issuance on a share-for-share basis. The 2016 Plan and earlier equity compensation plans, pursuant to which an aggregate of
12,415
shares of the Company’s common stock were reserved for issuance, were all approved by the Company's shareholders. As of
December 31, 2017
,
1,715
shares were available for future grants. The Compensation Committee of the Board of Directors administers the equity compensation plans, approves the individuals to whom awards will be granted and determines the number of shares and other terms of each award. Outstanding options under the Company's equity compensation plans at
December 31, 2017
expire from February 2018 through November 2022. None of the Company’s outstanding options includes performance-based or market-based vesting conditions as of
December 31, 2017
.
The Company has estimated the fair value of each option grant on the date of grant using the Black-Scholes option-pricing model. The expected volatility assumption is based on the historical daily price data of the Company’s common stock over a period equivalent to the weighted average expected life of the Company’s options. The expected term of options granted is derived using assumed exercise rates based on historical exercise patterns and represents the period of time the options granted are expected to be outstanding. The risk-free interest rate is based on the actual U.S. Treasury zero-coupon rates for bonds matching the expected term of the option as of the option grant date. The dividend yield of
zero
is based upon the fact that the Company has not historically declared or paid cash dividends, and does not expect to declare or pay dividends in the foreseeable future.
The per share weighted-average fair values of stock options granted during
2017, 2016, and 2015
were
$2.74
,
$2.77
, and
$4.39
, respectively. The weighted-average assumptions used to value options as of their grant date were as follows:
|
|
Year Ended
December 31,
|
|||||||
|
|
2017
|
2016
|
2015
|
|||||
|
Risk-free interest rate
|
1.98
|
%
|
1.43
|
%
|
1.55
|
%
|
||
|
Expected volatility
|
35.7
|
%
|
38.2
|
%
|
43.3
|
%
|
||
|
Expected life (in years)
|
4.22
|
|
4.18
|
|
4.17
|
|
||
|
Dividend yield
|
0
|
%
|
0
|
%
|
0
|
%
|
||
93
KVH INDUSTRIES, INC. AND SUBSIDIARIES
NOTES TO CONSOLIDATED FINANCIAL STATEMENTS—(Continued)
December 31, 2017, 2016, and 2015
(in thousands except per share amounts)
The changes in outstanding stock options for the year ended December 31,
2017, 2016, and 2015
are as follows:
|
Number of Options
|
Weighted Average
Exercise Price
|
Weighted Average
Remaining
Contractual Life
(in Years)
|
Aggregate Intrinsic
Value
|
|||||||||
|
Outstanding at December 31, 2016
|
686
|
|
$
|
11.41
|
|
|||||||
|
Granted
|
682
|
|
$
|
8.65
|
|
|||||||
|
Exercised
|
(134
|
)
|
$
|
9.24
|
|
|||||||
|
Expired, canceled or forfeited
|
(170
|
)
|
$
|
10.46
|
|
|||||||
|
Outstanding at December 31, 2017
|
1,064
|
|
$
|
10.06
|
|
3.27
|
$
|
1,268
|
|
|||
|
Exercisable at December 31, 2017
|
307
|
|
$
|
12.37
|
|
1.37
|
$
|
9
|
|
|||
|
Options vested or expected to vest at December 31, 2017
|
1,064
|
|
$
|
10.06
|
|
3.27
|
$
|
1,268
|
|
|||
|
Number of Options
|
Weighted Average
Exercise Price
|
Weighted Average
Remaining
Contractual Life
(in Years)
|
Aggregate Intrinsic
Value
|
|||||||||
|
Outstanding at December 31, 2015
|
1,177
|
|
$
|
11.60
|
|
|||||||
|
Granted
|
75
|
|
$
|
8.90
|
|
|||||||
|
Exercised
|
(269
|
)
|
$
|
9.06
|
|
|||||||
|
Expired, canceled or forfeited
|
(297
|
)
|
$
|
13.68
|
|
|||||||
|
Outstanding at December 31, 2016
|
686
|
|
$
|
11.41
|
|
2.23
|
$
|
681
|
|
|||
|
Exercisable at December 31, 2016
|
379
|
|
$
|
11.39
|
|
1.50
|
$
|
382
|
|
|||
|
Options vested or expected to vest at December 31, 2016
|
674
|
|
$
|
11.42
|
|
2.04
|
$
|
662
|
|
|||
|
Number of Options
|
Weighted Average
Exercise Price |
Weighted Average
Remaining Contractual Life (in Years) |
Aggregate Intrinsic
Value |
|||||||||
|
Outstanding at December 31, 2014
|
1,205
|
|
$
|
11.65
|
|
|
|
|||||
|
Granted
|
120
|
|
$
|
12.04
|
|
|||||||
|
Exercised
|
(10
|
)
|
$
|
8.64
|
|
|||||||
|
Expired, canceled or forfeited
|
(138
|
)
|
$
|
12.59
|
|
|||||||
|
Outstanding at December 31, 2015
|
1,177
|
|
$
|
11.60
|
|
2.04
|
$
|
123
|
|
|||
|
Exercisable at December 31, 2015
|
687
|
|
$
|
11.60
|
|
2.00
|
$
|
122
|
|
|||
|
Options vested or expected to vest at December 31, 2015
|
1,154
|
|
$
|
11.58
|
|
1.25
|
$
|
111
|
|
|||
The total aggregate intrinsic value of options exercised was
$149
,
$484
, and
$50
in
2017, 2016, and 2015
, respectively.
94
KVH INDUSTRIES, INC. AND SUBSIDIARIES
NOTES TO CONSOLIDATED FINANCIAL STATEMENTS—(Continued)
December 31, 2017, 2016, and 2015
(in thousands except per share amounts)
As of
December 31, 2017
, there was
$1,789
of total unrecognized compensation expense related to stock options, which is expected to be recognized over a weighted-average period of
2.99
years. In
2017, 2016, and 2015
, the Company recorded compensation charges of
$707
,
$702
, and
$1,229
, respectively, related to stock options. Compensation costs for options subject only to service conditions that vest ratably are recognized on a straight-line basis over the requisite service period for the entire award. During
2017, 2016, and 2015
, cash received under stock option plans for exercises was
$1,236
,
$2,438
and
$90
, respectively.
|
(b)
|
Restricted Stock
|
The Company granted
271
,
424
, and
203
restricted stock awards to employees under the terms of the 2016 Plan or the Amended and Restated 2006 Stock Incentive Plan (2006 Plan) for the
years ended December 31, 2017, 2016, and 2015
, respectively. The restricted stock awards generally vest annually over four years from the date of grant subject to the recipient remaining an employee through the applicable vesting dates. Compensation expense for restricted stock awards is measured at fair value on the date of grant based on the number of shares granted and the quoted market closing price of the Company’s common stock. Such value is recognized as expense over the vesting period of the award, net of forfeitures. The weighted-average grant-date fair value of restricted stock granted during
2017, 2016, and 2015
was
$8.83
,
$8.68
, and
$12.43
per share, respectively.
As of
December 31, 2017
, there was
$3,863
of total unrecognized compensation expense related to restricted stock awards, which is expected to be recognized over a weighted-average period of
2.15 years
. Compensation costs for awards subject only to service conditions that vest ratably are recognized on a straight-line basis over the requisite service period for the entire award. Compensation cost for awards initially subject to certain performance conditions are recognized on a ratable basis over the requisite service period for the entire award. In
2017, 2016, and 2015
, the Company recorded compensation charges of
$2,760
,
$2,938
, and
$2,422
, respectively, related to restricted stock awards.
Restricted stock activity under the 2006 Plan and the 2016 Plan for
2017
is as follows:
|
Number of
Shares |
Weighted-
average grant date fair value |
|||||
|
Outstanding at December 31, 2016, unvested
|
644
|
|
$
|
10.58
|
|
|
|
Granted
|
271
|
|
8.83
|
|
||
|
Vested
|
(269
|
)
|
11.20
|
|
||
|
Forfeited
|
(42
|
)
|
9.57
|
|
||
|
Outstanding at December 31, 2017, unvested
|
604
|
|
$
|
9.59
|
|
|
|
(c)
|
Employee Stock Purchase Plan
|
Under the Company's Amended and Restated 1996 Employee Stock Purchase Plan (ESPP), an aggregate of
1,650
shares of common stock have been reserved for issuance, of which
954
shares remain available as of
December 31, 2017
.
The ESPP covers all of the Company’s employees. Under the terms of the ESPP, eligible employees can elect to have up to
six
percent of their pre-tax compensation withheld to purchase shares of the Company’s common stock on a semi-annual basis. Before the amendment to the plan, the ESPP allowed eligible employees the right to purchase the Company’s common stock on a semi-annual basis at
85%
of the market price at the end of each purchase period. Under the amendment, the ESPP now allows eligible employees the right to purchase the Company's common stock on a semi-annual basis at 85% of the market price on the first or last day of each purchase period, whichever is lower. During
2017, 2016, and 2015
, shares issued under this plan were
46
,
18
, and
28
shares, respectively. The Company utilizes the Black-Scholes option-pricing model to calculate the fair value of these discounted purchases. The fair value of the
15%
discount is recognized as compensation expense over the purchase period. The Company applies a graded vesting approach because the ESPP provides for multiple purchase periods and is, in substance, a series of linked awards. In
2017, 2016, and 2015
, the Company recorded compensation charges of
$50
,
$11
, and
$58
, respectively, related to the ESPP. During
2017, 2016, and 2015
, cash received under the ESPP was
$358
,
$146
, and
$291
, respectively.
95
KVH INDUSTRIES, INC. AND SUBSIDIARIES
NOTES TO CONSOLIDATED FINANCIAL STATEMENTS—(Continued)
December 31, 2017, 2016, and 2015
(in thousands except per share amounts)
|
(d)
|
Stock- Based Compensation Expense
|
The following presents stock-based compensation expense, including expense for the ESPP, in the Company's consolidated statements of operations for the
years ended December 31, 2017, 2016, and 2015
.
|
2017
|
2016
|
2015
|
|||||||||
|
Cost of product sales
|
$
|
298
|
|
$
|
321
|
|
$
|
317
|
|
||
|
Cost of service sales
|
18
|
|
1
|
|
—
|
|
|||||
|
Research and development
|
696
|
|
690
|
|
619
|
|
|||||
|
Sales, marketing and support
|
780
|
|
1,027
|
|
927
|
|
|||||
|
General and administrative
|
1,726
|
|
1,612
|
|
1,871
|
|
|||||
|
$
|
3,518
|
|
$
|
3,651
|
|
$
|
3,734
|
|
|||
(e) Accumulated Other Comprehensive Loss
Comprehensive income (loss) includes net income (loss), unrealized gains and losses from foreign currency translation, and unrealized gains and losses from available for sale marketable securities and changes in fair value related to interest rate swap
derivative instruments, net of tax attributes, which were not material. The components of the Company’s comprehensive income (loss) and the effect on earnings for the periods presented are detailed in the accompanying consolidated statements of comprehensive income (loss).
|
Foreign Currency Translation
|
Unrealized Gain (Loss) on Available for Sale Marketable Securities
|
Interest Rate Swaps
|
Total Accumulated Other Comprehensive Loss
|
||||||||||||
|
Balance, December 31, 2014
|
$
|
(3,156
|
)
|
$
|
4
|
|
$
|
(295
|
)
|
$
|
(3,447
|
)
|
|||
|
Other comprehensive loss before reclassifications
|
(4,207
|
)
|
(3
|
)
|
(58
|
)
|
(4,268
|
)
|
|||||||
|
Amounts reclassified from AOCI to Other income, net
|
—
|
|
—
|
|
115
|
|
115
|
|
|||||||
|
Net other comprehensive (loss) income, December 31, 2015
|
(4,207
|
)
|
(3
|
)
|
57
|
|
(4,153
|
)
|
|||||||
|
Balance, December 31, 2015
|
(7,363
|
)
|
1
|
|
(238
|
)
|
(7,600
|
)
|
|||||||
|
Other comprehensive loss before reclassifications
|
(9,288
|
)
|
(1
|
)
|
(20
|
)
|
(9,309
|
)
|
|||||||
|
Amounts reclassified from AOCI to Other income, net
|
—
|
|
—
|
|
100
|
|
100
|
|
|||||||
|
Net other comprehensive (loss) income, December 31, 2016
|
(9,288
|
)
|
(1
|
)
|
80
|
|
(9,209
|
)
|
|||||||
|
Balance, December 31, 2016
|
(16,651
|
)
|
—
|
|
(158
|
)
|
(16,809
|
)
|
|||||||
|
Other comprehensive income (loss) before reclassifications
|
5,404
|
|
(1
|
)
|
12
|
|
5,415
|
|
|||||||
|
Amounts reclassified from AOCI to Other income, net
|
—
|
|
—
|
|
77
|
|
77
|
|
|||||||
|
Net other comprehensive income (loss), December 31, 2017
|
5,404
|
|
(1
|
)
|
89
|
|
5,492
|
|
|||||||
|
Balance, December 31, 2017
|
$
|
(11,247
|
)
|
$
|
(1
|
)
|
$
|
(69
|
)
|
$
|
(11,317
|
)
|
|||
For additional information, see Note 2, "Marketable Securities", and see Note 15, "Derivative Instruments and Hedging Activities"
96
KVH INDUSTRIES, INC. AND SUBSIDIARIES
NOTES TO CONSOLIDATED FINANCIAL STATEMENTS—(Continued)
December 31, 2017, 2016, and 2015
(in thousands except per share amounts)
|
(8)
|
Income Taxes
|
Income tax expense (benefit) for the years ended December 31, 2017, 2016, and 2015 attributable to (loss) income from operations is presented below.
|
Current
|
Deferred
|
Total
|
|||||||||
|
Year ended December 31, 2017
|
|||||||||||
|
Federal
|
$
|
(41
|
)
|
$
|
6
|
|
$
|
(35
|
)
|
||
|
State
|
36
|
|
—
|
|
36
|
|
|||||
|
Foreign
|
1,857
|
|
(762
|
)
|
1,095
|
|
|||||
|
$
|
1,852
|
|
$
|
(756
|
)
|
$
|
1,096
|
|
|||
|
Year ended December 31, 2016
|
|||||||||||
|
Federal
|
$
|
227
|
|
$
|
3,197
|
|
$
|
3,424
|
|
||
|
State
|
144
|
|
457
|
|
601
|
|
|||||
|
Foreign
|
2,770
|
|
(1,248
|
)
|
1,522
|
|
|||||
|
$
|
3,141
|
|
$
|
2,406
|
|
$
|
5,547
|
|
|||
|
Year ended December 31, 2015
|
|||||||||||
|
Federal
|
$
|
(555
|
)
|
$
|
(94
|
)
|
$
|
(649
|
)
|
||
|
State
|
120
|
|
765
|
|
885
|
|
|||||
|
Foreign
|
295
|
|
(118
|
)
|
177
|
|
|||||
|
$
|
(140
|
)
|
$
|
553
|
|
$
|
413
|
|
|||
97
KVH INDUSTRIES, INC. AND SUBSIDIARIES
NOTES TO CONSOLIDATED FINANCIAL STATEMENTS—(Continued)
December 31, 2017, 2016, and 2015
(in thousands except per share amounts)
Actual income tax expense differs from the “expected” income tax (benefit) expense computed by applying the United States Federal statutory income tax rate of
34%
to (loss) income before tax expense, as follows:
|
|
Year Ended December 31,
|
||||||||||
|
|
2017
|
2016
|
2015
|
||||||||
|
Income tax (benefit) expense at Federal statutory income tax rate
|
$
|
(3,379
|
)
|
$
|
(670
|
)
|
$
|
906
|
|
||
|
Increase (decrease) in income taxes resulting from:
|
|||||||||||
|
State income tax expense, net of federal benefit
|
56
|
|
(156
|
)
|
(37
|
)
|
|||||
|
State research and development, investment credits
|
(435
|
)
|
(363
|
)
|
(317
|
)
|
|||||
|
Non-deductible meals & entertainment
|
47
|
|
49
|
|
33
|
|
|||||
|
Non-deductible stock compensation expense
|
338
|
|
216
|
|
181
|
|
|||||
|
Non-deductible deferred compensation expense
|
—
|
|
116
|
|
260
|
|
|||||
|
Subpart F income, net of foreign tax credits
|
1,171
|
|
523
|
|
61
|
|
|||||
|
Foreign branch income
|
—
|
|
52
|
|
—
|
|
|||||
|
Manufacturing deduction
|
—
|
|
—
|
|
(102
|
)
|
|||||
|
Nontaxable interest income
|
—
|
|
(162
|
)
|
(106
|
)
|
|||||
|
Foreign tax rate differential
|
(902
|
)
|
(1,258
|
)
|
(792
|
)
|
|||||
|
Federal research and development credits
|
(427
|
)
|
(395
|
)
|
(348
|
)
|
|||||
|
Uncertain tax positions
|
189
|
|
283
|
|
(413
|
)
|
|||||
|
Provision to tax return adjustments
|
8
|
|
(95
|
)
|
80
|
|
|||||
|
Change in tax rates
|
926
|
|
14
|
|
(313
|
)
|
|||||
|
Change in valuation allowance
|
3,330
|
|
7,425
|
|
1,392
|
|
|||||
|
Foreign research and development incentives
|
(22
|
)
|
(45
|
)
|
(59
|
)
|
|||||
|
Other
|
196
|
|
13
|
|
(13
|
)
|
|||||
|
Income tax expense
|
$
|
1,096
|
|
$
|
5,547
|
|
$
|
413
|
|
||
(Loss) income before income tax expense determined by tax jurisdiction, are as follows:
|
|
Year Ended December 31,
|
||||||||||
|
|
2017
|
2016
|
2015
|
||||||||
|
United States
|
$
|
(13,271
|
)
|
$
|
(7,775
|
)
|
$
|
(570
|
)
|
||
|
Foreign
|
3,333
|
|
5,805
|
|
3,236
|
|
|||||
|
Total
|
$
|
(9,938
|
)
|
$
|
(1,970
|
)
|
$
|
2,666
|
|
||
98
KVH INDUSTRIES, INC. AND SUBSIDIARIES
NOTES TO CONSOLIDATED FINANCIAL STATEMENTS—(Continued)
December 31, 2017, 2016, and 2015
(in thousands except per share amounts)
Deferred tax assets and liabilities for the periods presented consisted of the following:
|
|
December 31,
|
||||||
|
|
2017
|
2016
|
|||||
|
Deferred tax assets:
|
|||||||
|
Accounts receivable, due to allowance for doubtful accounts
|
$
|
540
|
|
$
|
1,104
|
|
|
|
Inventories
|
581
|
|
792
|
|
|||
|
Operating loss carry-forwards
|
4,725
|
|
3,078
|
|
|||
|
Stock-based compensation expense
|
696
|
|
1,231
|
|
|||
|
Property and equipment, due to difference in depreciation
|
190
|
|
148
|
|
|||
|
Research and development, alternative minimum tax credit carry-forwards
|
4,338
|
|
3,031
|
|
|||
|
Foreign tax credit carry-forwards
|
2,958
|
|
754
|
|
|||
|
State tax credit carry-forwards
|
2,958
|
|
2,277
|
|
|||
|
Warranty reserve
|
495
|
|
822
|
|
|||
|
Accrued expenses
|
334
|
|
432
|
|
|||
|
Gross deferred tax assets
|
17,815
|
|
13,669
|
|
|||
|
Less valuation allowance
|
(16,014
|
)
|
(11,567
|
)
|
|||
|
Total deferred tax assets
|
1,801
|
|
2,102
|
|
|||
|
Deferred tax liabilities:
|
|||||||
|
Purchased intangible assets
|
(2,705
|
)
|
(3,197
|
)
|
|||
|
Property and equipment, due to differences in depreciation
|
(1,681
|
)
|
(2,003
|
)
|
|||
|
Other
|
(29
|
)
|
(11
|
)
|
|||
|
Total deferred tax liabilities
|
(4,415
|
)
|
(5,211
|
)
|
|||
|
Net deferred tax liability
|
$
|
(2,614
|
)
|
$
|
(3,109
|
)
|
|
|
Net deferred tax asset- non-current
|
$
|
20
|
|
$
|
24
|
|
|
|
Net deferred tax liability- non-current
|
$
|
(2,634
|
)
|
$
|
(3,133
|
)
|
|
As of
December 31, 2017
, the Company had federal research and development tax credit carry-forwards in the amount of
$4,329
and other general business credits of
$9
that expire in years
2026 through 2037
. As of December 31, 2017, the Company had foreign tax credit carry-forwards in the amount of
$2,958
that expire in years 2026 through 2027. As of
December 31, 2017
, the Company had state research and development tax credit carry-forwards in the amount of
$3,501
that expire in years
2018 through 2024
. The Company also had other state tax credit carry-forwards of
$243
available to reduce future state tax expense that expire in years
2018 through 2024
.
The Company’s ability to utilize these net operating loss carry-forwards and tax credit carry-forwards may be limited in the future if the Company experiences an ownership change pursuant to Internal Revenue Code Section 382. An ownership change occurs when the ownership percentages of
5%
or greater stockholders change by more than
50%
over a three-year period.
As of January 1, 2017, the Company adopted Update No. 2016-09. In accordance with Update No. 2016-09, previously unrecognized excess tax benefits are recognized on a modified retrospective basis. On January 1, 2017, the Company recorded a
$1,117
deferred tax asset related to unrecognized excess tax benefits with an offsetting adjustment to retained earnings. As the Company had previously recorded a full valuation allowance on its U.S. deferred tax assets, a corresponding increase to the valuation allowance was recorded with an offsetting adjustment to retained earnings.
In assessing the realizability of its net deferred tax assets, the Company considered whether it is more likely than not that some portion or all of the deferred tax assets will not be realized. As of
December 31, 2017
, the Company concluded that a net increase of
$4,447
of the valuation allowance was appropriate. As part of the Company’s analysis, the Company evaluated, among other factors, its recent history of generating taxable income and its near-term forecasts of future taxable income. The net increase in valuation allowance of
$4,447
is composed of expense of
$3,330
and an increase of
$1,117
related to recording deferred tax assets as a result of the adoption of ASU 2016-09.
99
KVH INDUSTRIES, INC. AND SUBSIDIARIES
NOTES TO CONSOLIDATED FINANCIAL STATEMENTS—(Continued)
December 31, 2017, 2016, and 2015
(in thousands except per share amounts)
As of
December 31, 2017
, the Company has not provided for U.S. deferred income taxes on undistributed earnings of its foreign subsidiaries of approximately
$18,328
since these earnings are expected to be indefinitely reinvested. Upon distribution of those earnings in the form of dividends or otherwise, the Company will be subject to additional state income taxes as well as withholding taxes in certain foreign jurisdictions. The amount of taxes attributable to the undistributed earnings is not practicably determinable.
The Company establishes reserves for uncertain tax positions based on management’s assessment of exposure associated with tax deductions, permanent tax differences, and tax credits. The tax reserves are analyzed periodically and adjustments are made as events occur that warrant adjustment to the reserve. The Company's policy is to recognize interest and penalties related to unrecognized tax benefits as a component of income tax expense.
The aggregate changes in the total gross amount of unrecognized tax benefits are as follows:
|
|
Year Ended December 31,
|
||||||||||
|
|
2017
|
2016
|
2015
|
||||||||
|
Unrecognized tax benefits as of January 1
|
$
|
815
|
|
$
|
983
|
|
$
|
2,487
|
|
||
|
Gross increase in unrecognized tax benefits - prior year tax positions
|
52
|
|
—
|
|
168
|
|
|||||
|
Gross increase (decrease) in unrecognized tax benefits due to currency fluctuations - prior year tax positions
|
43
|
|
(131
|
)
|
(116
|
)
|
|||||
|
Gross increase in unrecognized tax benefits - current year tax positions
|
111
|
|
293
|
|
13
|
|
|||||
|
Settlements with taxing authorities
|
—
|
|
(330
|
)
|
(1,569
|
)
|
|||||
|
Lapse of statute of limitations
|
(15
|
)
|
—
|
|
—
|
|
|||||
|
Unrecognized tax benefits as of December 31
|
$
|
1,006
|
|
$
|
815
|
|
$
|
983
|
|
||
All unrecognized tax benefits as of December 31, 2017, 2016 and 2015, if recognized, would result in a reduction of the Company's effective tax rate.
The Company recorded interest and penalties of
$67
,
$40
, and
$78
in its statement of operations for the years ended December 31, 2017, 2016, and 2015, respectively. Total accrued interest and penalties related to tax positions taken on our tax returns and included in non-current income taxes payable was approximately
$564
,
$545
, and
$468
as of December 31, 2017, 2016, and 2015, respectively.
The timing of any resolution of income tax examinations is highly uncertain, as are the amounts and timing of any settlement payment. These events could cause fluctuations in the balance sheet classification of current and non-current assets and liabilities. The Company estimates that it is reasonably possible that the balance of unrecognized tax benefits as of December 31, 2017 may decrease approximately
$235
in the next twelve months as a result of a lapse of statutes of limitation and settlements with taxing authorities.
The Company’s tax jurisdictions include the United States, the United Kingdom, Denmark, Cyprus, Norway, Brazil, Singapore, Belgium, the Netherlands, Hong Kong, Japan, and India. In general, the statute of limitations with respect to the Company's United States federal income taxes has expired for years prior to
2014
, and the relevant state and foreign statutes vary. However, preceding years remain open to examination by United States federal and state and foreign taxing authorities to the extent of future utilization of net operating losses and research and development tax credits generated in each preceding year.
100
KVH INDUSTRIES, INC. AND SUBSIDIARIES
NOTES TO CONSOLIDATED FINANCIAL STATEMENTS—(Continued)
December 31, 2017, 2016, and 2015
(in thousands except per share amounts)
Tax Reform
The 2017 Tax Cuts and Jobs Act (the “Tax Act”), which was signed into law on December 22, 2017, has resulted in significant changes to the U.S. corporate income tax system. These changes include a federal statutory rate reduction from 35% to 21%, the elimination or reduction of certain domestic deductions and credits and limitations on the deductibility of interest expense and executive compensation. The 2017 Tax Act also transitions international taxation from a worldwide system to a modified territorial system and includes base erosion prevention measures on non-U.S. earnings, which has the effect of subjecting certain earnings of our foreign subsidiaries to U.S. taxation as global intangible low-taxed income (GILTI). These changes are effective beginning in 2018.
The 2017 Tax Act also includes a one-time mandatory deemed repatriation tax on accumulated foreign subsidiaries' previously untaxed foreign earnings (the “Transition Toll Tax”).
Changes in tax rates and tax laws are accounted for in the period of enactment. Therefore, during the year ended December 31, 2017, the Company recorded a reduction in our deferred tax assets and corresponding valuation allowance of
$1,780
and a net tax benefit of
$54
related to the Company's current estimate of the provisions of the 2017 Tax Act.
The Securities and Exchange Commission released Staff Accounting Bulletin (SAB) No. 118 to provide guidance to companies on how to implement the accounting and disclosure changes as a result of the Tax Act. The SEC staff guidance has recognized that, due to the complexity and timing of the release of the Tax Act, the accounting for this change in the law may be incomplete upon issuance of a company's financial statements for the reporting period in which the Tax Act was enacted. SAB No. 118 states that if a company can determine a reasonable estimate for the effects of the Tax Act then this estimate can be included in the financial statements. The Company has made a preliminary estimate of the Transition Toll Tax and the remeasurement of our deferred tax assets and liabilities as of December 31, 2017. The preliminary estimate is subject to change as we finalize our analysis and as interpretations of the provisions of the 2017 Tax Act continue to develop. The final determination of the Transition Toll Tax and the remeasurement of our deferred tax assets and liabilities will be completed as additional information becomes available, but no later than one year from the enactment of the 2017 Tax Act. U.S. Treasury regulations, administrative interpretations or court decisions interpreting the 2017 Tax Act may require further adjustments and changes in our estimates, which could have a material adverse effect on our business, results of operations, financial position and cash flows.
Transition Toll Tax
The 2017 Tax Act eliminates the deferral of U.S. income tax on historical unrepatriated earnings by imposing the Transition Toll Tax, which is a one-time mandatory deemed repatriation tax on undistributed foreign earnings. The Transition Toll Tax is assessed on the U.S. shareholder's share of the foreign corporation's accumulated foreign earnings that have not previously been taxed. Earnings in the form of cash and cash equivalents will be taxed at a rate of 15.5% and all other earnings will be taxed at a rate of 8.0%.
As of December 31, 2017, the Company has included
$7,818
of foreign earnings and profits in U.S. taxable income and included an additional
$1,935
of foreign tax credits in deferred assets under the Transition Toll Tax. The Company's valuation allowance on deferred tax assets was reduced by
$802
as a result of the Transition Toll Tax.
At December 31, 2017, we considered all of our foreign earnings to be permanently reinvested outside the U.S. as we continue to evaluate the implications of the 2017 Tax Act on the Company.
Effect on Deferred Tax Assets and Liabilities and other Adjustments
Our deferred tax assets and liabilities are measured at the enacted tax rate expected to apply when these temporary differences are expected to be realized or settled.
As the Company's U.S. deferred tax assets exceed the balance of its deferred tax liabilities at the date of enactment, the Company has recorded a reduction in deferred tax assets of
$926
and a corresponding decrease in the related valuation allowance to reflect the decrease in the U.S. corporate income tax rate and other changes to U.S. tax law.
101
KVH INDUSTRIES, INC. AND SUBSIDIARIES
NOTES TO CONSOLIDATED FINANCIAL STATEMENTS—(Continued)
December 31, 2017, 2016, and 2015
(in thousands except per share amounts)
Status of Assessment
The preliminary estimate of the Transition Toll Tax and remeasurement of deferred tax assets and liabilities is subject to the finalization of management’s analysis related to certain matters, such as developing interpretations of the provisions of the 2017 Tax Act, changes to certain estimates and amounts related to the earnings and profits of certain subsidiaries and the filing of our tax returns. U.S. Treasury regulations, administrative interpretations or court decisions interpreting the 2017 Tax Act may require further adjustments and changes in our estimates.
The final determination of the Transition Toll Tax and the remeasurement of our deferred assets and liabilities will be completed as additional information becomes available, but no later than one year from the enactment of the 2017 Tax Act.
(9) Goodwill and Intangible Assets
The Company’s goodwill and intangible assets are associated with the purchase of Virtek Communication (now KVH Industries Norway AS) in September 2010, Headland Media Limited (now known as the KVH Media Group) in May 2013, and Videotel in July 2014. Intangibles arising from the acquisition made prior to 2013 were amortized on a straight-line basis over an estimated useful life of
7 years
. Intangibles arising from the acquisition of KVH Media Group are being amortized on a straight-line basis over the estimated useful life of: (i)
10 years
for acquired subscriber relationships, (ii)
15 years
for distribution rights, (iii)
3 years
for internally developed software and (iv)
2 years
for proprietary content. Intangibles arising from the acquisition of Videotel are being amortized on a straight-line basis over the estimated useful life of: (i)
8 years
for acquired subscriber relationships, (ii)
5 years
for favorable leases, (iii)
4 years
for internally developed software and (iv)
5 years
for proprietary content. The intangibles arising from the KVH Media Group and Videotel acquisitions were recorded in pounds sterling and fluctuations in exchange rates could cause these amounts to increase or decrease from time to time.
In January 2017, the Company completed the acquisition of certain subscriber relationships from a third party. This acquisition did not meet the definition of a business under ASC 2017-01,
Business Combinations (Topic 805)-Clarifying the Definition of a Business
, which the Company adopted on October 1, 2016. The Company ascribed
$100
of the initial purchase price to the acquired subscriber relationships definite-lived intangible assets with an initial estimated useful life of
10
years. Under the asset purchase agreement, the purchase price includes a component of contingent consideration under which the Company is required to pay a percentage of recurring revenues received from the acquired subscriber relationships through 2026 up to a maximum annual payment of $
114
. As the acquisition did not represent a business combination, the contingent consideration arrangement is recognized only when the contingency is resolved and the consideration is paid or becomes payable. The amounts payable under the contingent consideration arrangement, if any, will be included in the measurement of the cost of the acquired subscriber relationships. During the year ended
December 31, 2017
,
$33
in consideration was earned under the contingent consideration arrangement.
102
KVH INDUSTRIES, INC. AND SUBSIDIARIES
NOTES TO CONSOLIDATED FINANCIAL STATEMENTS—(Continued)
December 31, 2017, 2016, and 2015
(in thousands except per share amounts)
Intangible assets are subject to amortization. The following table summarizes other intangible assets as of
December 31, 2017
and
2016
, respectively:
|
Gross Carrying Amount
|
Accumulated Amortization
|
Net Carrying Value
|
|||||||||
|
December 31, 2017
|
|||||||||||
|
Subscriber relationships
|
$
|
17,912
|
|
$
|
8,347
|
|
$
|
9,565
|
|
||
|
Distribution rights
|
4,385
|
|
1,450
|
|
2,935
|
|
|||||
|
Internally developed software
|
2,324
|
|
2,206
|
|
118
|
|
|||||
|
Proprietary content
|
8,223
|
|
5,908
|
|
2,315
|
|
|||||
|
Intellectual property
|
2,284
|
|
2,284
|
|
—
|
|
|||||
|
Favorable lease
|
648
|
|
461
|
|
187
|
|
|||||
|
$
|
35,776
|
|
$
|
20,656
|
|
$
|
15,120
|
|
|||
|
December 31, 2016
|
|||||||||||
|
Subscriber relationships
|
$
|
16,888
|
|
$
|
6,431
|
|
$
|
10,457
|
|
||
|
Distribution rights
|
4,122
|
|
1,180
|
|
2,942
|
|
|||||
|
Internally developed software
|
2,301
|
|
1,904
|
|
397
|
|
|||||
|
Proprietary content
|
7,960
|
|
4,431
|
|
3,529
|
|
|||||
|
Intellectual property
|
2,284
|
|
2,056
|
|
228
|
|
|||||
|
Favorable lease
|
627
|
|
342
|
|
285
|
|
|||||
|
$
|
34,182
|
|
$
|
16,344
|
|
$
|
17,838
|
|
|||
Amortization expense related to intangible assets was
$4,312
,
$4,956
, and
$5,526
for
years ended December 31, 2017, 2016, and 2015
, respectively.
Amortization expense related to intangible assets for the years ended
years ended December 31, 2017, 2016, and 2015
was as follows:
|
Expense Category
|
2017
|
2016
|
2015
|
||||||||
|
Cost of service sales
|
$
|
1,477
|
|
$
|
2,068
|
|
$
|
1,978
|
|
||
|
General administrative expense
|
2,835
|
|
2,888
|
|
3,548
|
|
|||||
|
Total amortization expense
|
$
|
4,312
|
|
$
|
4,956
|
|
$
|
5,526
|
|
||
As of
December 31, 2017
, the total weighted average remaining useful lives of the definite-lived intangible assets was
4.2
years and the weighted average remaining useful lives by the definite-lived intangible asset category are as follows:
|
Intangible Asset
|
Weighted Average Remaining Useful Life in Years
|
|
Subscriber relationships
|
4.9
|
|
Distribution rights
|
10.3
|
|
Internally developed software
|
0.4
|
|
Proprietary content
|
1.5
|
|
Favorable lease
|
1.5
|
103
KVH INDUSTRIES, INC. AND SUBSIDIARIES
NOTES TO CONSOLIDATED FINANCIAL STATEMENTS—(Continued)
December 31, 2017, 2016, and 2015
(in thousands except per share amounts)
Estimated future amortization expense for intangible assets recorded by the Company at
December 31, 2017
is as follows:
|
Years ending December 31,
|
Amortization
Expense
|
||
|
2018
|
$
|
4,082
|
|
|
2019
|
3,122
|
|
|
|
2020
|
2,292
|
|
|
|
2021
|
2,292
|
|
|
|
2022
|
1,505
|
|
|
|
Thereafter
|
1,827
|
|
|
|
Total amortization expense
|
$
|
15,120
|
|
The changes in the carrying amount of intangible assets during the year ended
December 31, 2017
is as follows:
|
|
2017
|
||
|
Balance at January 1
|
$
|
17,838
|
|
|
Amortization expense
|
(4,312
|
)
|
|
|
Intangibles assets acquired in asset acquisition
|
133
|
|
|
|
Foreign currency translation adjustment
|
1,461
|
|
|
|
Balance at December 31
|
$
|
15,120
|
|
Goodwill is recorded when the consideration for an acquisition exceeds the fair value of net tangible and identifiable intangible assets acquired. All of the Company's goodwill as of
December 31, 2017
relates to its mobile connectivity reportable segment. None of the Company's goodwill is deductible for tax purposes. The changes in the carrying amount of goodwill during the year ended
December 31, 2017
is as follows:
|
|
Goodwill
|
||
|
Balance at January 1, 2016
|
$
|
36,747
|
|
|
Foreign currency translation adjustment
|
(5,404
|
)
|
|
|
Balance at December 31, 2016
|
31,343
|
|
|
|
Foreign currency translation adjustment
|
2,529
|
|
|
|
Balance at December 31, 2017
|
$
|
33,872
|
|
(10) 401(k) Plan
The Company has a 401(k) Plan (the Plan) for all eligible employees. Participants may defer a portion of their pre-tax earnings subject to limits determined by the Internal Revenue Service. Participants age
50
or older may be eligible to make additional contributions. As of
December 31, 2017
, the Company matches
one half of the first 6%
contributed by the Plan participants. The Company’s contributions vest over a
five
-year period from the date of hire. Total Company matching contributions were
$683
,
$671
, and
$608
for the
years ended December 31, 2017, 2016, and 2015
, respectively. In addition, the Company may make contributions to the Plan at the discretion of the Compensation Committee of the Board of Directors. There were no discretionary contributions in
2017
,
2016
, or
2015
.
104
(11) Business and Credit Concentrations
The Company had
no
customers that accounted for 10% or more of its consolidated net sales for the
years ended December 31, 2017, 2016, and 2015
, respectively. The Company had
one
customer that accounted for
17%
of accounts receivable as of December 31, 2015, and all amounts were collected within 2016 in accordance with the contractual payment terms. The Company had no customers who account for 10% or more of the Company's consolidated accounts receivable as of December 31, 2017 or December 31, 2016.
(12) Segment Reporting
In the fourth quarter of 2016, the Company concluded that it has two operating segments, which are also reportable segments, and were organized based on products and services. The Company’s reportable segments are:
|
•
|
Mobile connectivity, and
|
|
•
|
Inertial navigation
|
The Company’s Chief Operating Decision Maker (CODM), whom the Company has identified as its Chief Executive Officer, primarily evaluates the business and assesses performance based on the revenue and operating income of the segments. The Company does not allocate interest, taxes, and certain corporate-level costs to its reportable segments, as discussed further below.
The financial results of each segment are based on revenues from external customers, cost of revenue and operating expenses that are directly attributable to the segment and an allocation of costs from shared functions. These shared functions include, but are not limited to, facilities, human resources, information technology, and engineering. Allocations are made based on management’s judgment of the most relevant factors, such as head count, number of customer sites, or other operational data that contributes to the shared costs. Certain corporate-level costs have not been allocated as they are not attributable to either segment. These costs primarily consist of broad corporate functions, including executive, legal, finance, and costs associated with corporate actions. Segment-level asset information has not been provided as such information is not reviewed by the CODM for purposes of assessing segment performance and allocating resources. There are no inter-segment sales or transactions.
The Company's performance is impacted by the levels of activity in the marine and land mobile markets and defense sectors, among others. Performance in any particular period could be impacted by the timing of sales to certain large customers.
The mobile connectivity segment primarily manufactures and distributes a comprehensive family of mobile satellite antenna products and services that provide access to television, the Internet and voice services while on the move. Product sales within the mobile connectivity segment accounted for approximately
20%
,
23%
and
23%
of our consolidated net sales for 2017, 2016 and 2015, respectively. Sales of mini-VSAT Broadband airtime service accounted for approximately
41%
,
37%
, and
35%
of our consolidated net sales for 2017, 2016, 2015, respectively. Sales of content and training sales within the mobile connectivity segment accounted for approximately
20%
,
20%
and
21%
of our consolidated net sales for 2017, 2016 and 2015, respectively.
The inertial navigation segment manufactures and distributes a portfolio of digital compass and fiber optic gyro (FOG)-based systems that address the rigorous requirements of military and commercial customers and provide reliable, easy-to-use and continuously available navigation and pointing data. The principal product categories in this segment include the FOG based inertial measurement units (IMUs) for precision guidance, FOGs for tactical navigation as well as pointing and stabilization systems, and digital compasses that provide accurate heading information for demanding applications, security, automation and access control equipment and systems. Sales of FOG-based guidance and navigation systems within the inertial navigation segment accounted for approximately
13%
,
10%
, and
10%
of consolidated net sales for 2017, 2016, and 2015, respectively.
No other single product class accounts for 10% or more of consolidated net sales.
The Company operates in a number of major geographic areas, including internationally. Revenues from international locations, primarily consisting of Canada, European countries, both inside and outside the European Union, as well as Africa, Asia/Pacific, the Middle East, and India. Revenues are based upon customer location and internationally represented
62%
,
63%
, and
67%
of consolidated net sales for 2017, 2016 and 2015, respectively. No individual foreign country represented 10% or more of the Company's consolidated net sales for 2017. Sales to Canada represented
11%
and
10%
of net sales for 2016 and 2015, respectively. No other individual foreign country represented 10% or more of the Company’s consolidated net sales for 2016 or 2015.
105
KVH INDUSTRIES, INC. AND SUBSIDIARIES
NOTES TO CONSOLIDATED FINANCIAL STATEMENTS—(Continued)
December 31, 2017, 2016, and 2015
(in thousands except per share amounts)
As of December 31, 2017 and 2016, the long-lived tangible assets related to the Company’s international subsidiaries were less than
10%
of the Company’s long-lived tangible assets and were deemed not material.
Net sales and operating (loss) earnings for the Company's reporting segments and the Company's (loss) income before income tax expense for the years ended December 31, 2017, 2016, and 2015 were as follows:
|
For the year ended December 31,
|
|||||||||||
|
2017
|
2016
|
2015
|
|||||||||
|
Net sales:
|
|||||||||||
|
Mobile connectivity
|
$
|
132,227
|
|
$
|
141,507
|
|
$
|
147,809
|
|
||
|
Inertial navigation
|
27,861
|
|
34,615
|
|
36,825
|
|
|||||
|
Consolidated net sales
|
$
|
160,088
|
|
$
|
176,122
|
|
$
|
184,634
|
|
||
|
Operating earnings (loss):
|
|||||||||||
|
Mobile connectivity
|
$
|
7,334
|
|
$
|
10,041
|
|
$
|
9,459
|
|
||
|
Inertial navigation
|
556
|
|
5,272
|
|
7,934
|
|
|||||
|
Subtotal
|
7,890
|
|
15,313
|
|
17,393
|
|
|||||
|
Unallocated, net
|
(16,654
|
)
|
(16,635
|
)
|
(14,185
|
)
|
|||||
|
Consolidated (loss) operating earnings
|
(8,764
|
)
|
(1,322
|
)
|
3,208
|
|
|||||
|
Net interest and other expense
|
(1,174
|
)
|
(648
|
)
|
(542
|
)
|
|||||
|
(Loss) income before income tax expense
|
$
|
(9,938
|
)
|
$
|
(1,970
|
)
|
$
|
2,666
|
|
||
Depreciation expense and amortization expense for the Company's segments are presented in the table that follows for the periods presented:
|
For the year ended December 31,
|
|||||||||||
|
2017
|
2016
|
2015
|
|||||||||
|
Depreciation expense:
|
|||||||||||
|
Mobile connectivity
|
$
|
5,720
|
|
$
|
6,084
|
|
$
|
5,843
|
|
||
|
Inertial navigation
|
928
|
|
1,063
|
|
961
|
|
|||||
|
Unallocated
|
77
|
|
461
|
|
389
|
|
|||||
|
Total consolidated depreciation expense
|
$
|
6,725
|
|
$
|
7,608
|
|
$
|
7,193
|
|
||
|
Amortization expense:
|
|||||||||||
|
Mobile connectivity
|
$
|
4,312
|
|
$
|
4,956
|
|
$
|
5,526
|
|
||
|
Inertial navigation
|
—
|
|
—
|
|
—
|
|
|||||
|
Unallocated
|
—
|
|
—
|
|
—
|
|
|||||
|
Total consolidated amortization expense
|
$
|
4,312
|
|
$
|
4,956
|
|
$
|
5,526
|
|
||
106
KVH INDUSTRIES, INC. AND SUBSIDIARIES
NOTES TO CONSOLIDATED FINANCIAL STATEMENTS—(Continued)
December 31, 2017, 2016, and 2015
(in thousands except per share amounts)
(13) Share Buyback Program
On November 26, 2008, the Company’s Board of Directors authorized a program to repurchase up to
1,000
shares of the Company’s common stock. As of
December 31, 2017
,
341
shares of the Company’s common stock remain available for repurchase under the authorized program. The repurchase program is funded using the Company’s existing cash, cash equivalents, marketable securities and future cash flows. Under the repurchase program, the Company, at management’s discretion, may repurchase shares on the open market from time to time, in privately negotiated transactions or block transactions, or through an accelerated repurchase agreement. The timing of such repurchases depends on availability of shares, price, market conditions, alternative uses of capital, and applicable regulatory requirements. The program may be modified, suspended or terminated at any time without prior notice. The repurchase program has no expiration date. There were
no
other repurchase programs outstanding during the year ended
December 31, 2017
and
no
repurchase programs expired during the period.
During the
years ended December 31, 2017, 2016, and 2015
, the Company did not repurchase any shares of its common stock in open market transactions.
(14) Fair Value Measurements
ASC 820,
Fair Value Measurements and Disclosures
, provides a framework for measuring fair value and requires expanded disclosures regarding fair value measurements. ASC 820 defines fair value as the exchange price that would be received for an asset or paid to transfer a liability (an exit price) in the principal or most advantageous market for the asset or liability in an orderly transaction between market participants on the measurement date. ASC 820 also establishes a fair value hierarchy, which requires an entity to maximize the use of observable inputs and minimize the use of unobservable inputs when measuring fair value. ASC 820 describes three levels of inputs that may be used to measure fair value:
|
Level 1:
|
Unadjusted quoted prices in active markets that are accessible at the measurement date for identical, unrestricted assets or liabilities. The Company’s Level 1 assets are investments in money market mutual funds, United States treasuries, and certificates of deposit.
|
|
Level 2:
|
Quoted prices for similar assets or liabilities in active markets; or observable prices that are based on observable market data, based on directly or indirectly market-corroborated inputs. The Company’s Level 2 assets are investments in certain corporate notes and its Level 2 liabilities are interest rate swaps.
|
|
Level 3:
|
Unobservable inputs that are supported by little or no market activity, and are developed based on the best information available given the circumstances. The Company has no Level 3 assets.
|
Assets and liabilities measured at fair value are based the valuation techniques identified in the table below. The valuation techniques are:
|
(a)
|
Market approach—prices and other relevant information generated by market transactions involving identical or comparable assets.
|
|
(b)
|
The valuations of the interest rate swaps intended to mitigate the Company’s interest rate risk are determined with the assistance of a third-party financial institution using widely accepted valuation techniques, including discounted cash flow analysis on the expected cash flows of each instrument. This analysis utilizes observable market-based inputs, including interest rate curves and interest rate volatility, and reflects the contractual terms of these instruments, including the period to maturity.
|
The following tables present financial assets and liabilities at
December 31, 2017
and
December 31, 2016
for which the Company measures fair value on a recurring basis, by level, within the fair value hierarchy:
107
|
December 31, 2017
|
Total
|
Level 1
|
Level 2
|
Level 3
|
Valuation
Technique
|
||||||||||||
|
Assets
|
|||||||||||||||||
|
Money market mutual funds
|
$
|
7,318
|
|
$
|
7,318
|
|
$
|
—
|
|
$
|
—
|
|
(a)
|
||||
|
United States treasuries
|
1,001
|
|
1,001
|
|
—
|
|
—
|
|
(a)
|
||||||||
|
Liabilities
|
|||||||||||||||||
|
Interest rate swaps
|
$
|
69
|
|
$
|
—
|
|
$
|
69
|
|
$
|
—
|
|
(b)
|
||||
|
December 31, 2016
|
Total
|
Level 1
|
Level 2
|
Level 3
|
Valuation
Technique
|
||||||||||||
|
Assets
|
|||||||||||||||||
|
Money market mutual funds
|
$
|
21,848
|
|
$
|
21,848
|
|
$
|
—
|
|
$
|
—
|
|
(a)
|
||||
|
Certificates of deposit
|
3,864
|
|
3,864
|
|
—
|
|
—
|
|
(a)
|
||||||||
|
Liabilities
|
|||||||||||||||||
|
Interest rate swaps
|
$
|
158
|
|
$
|
—
|
|
$
|
158
|
|
$
|
—
|
|
(b)
|
||||
Certain financial instruments are carried at cost on the consolidated balance sheets, which approximates fair value due to their short-term, highly liquid nature. These instruments include cash and cash equivalents, accounts receivable, accounts payable, and accrued expenses.
Assets Measured and Recorded at Fair Value on a Nonrecurring Basis
The Company's non-financial assets, such as goodwill, intangible assets, and other long-lived assets resulting from business combinations, are measured at fair value using income approach valuation methodologies at the date of acquisition and subsequently re-measured if an impairment exists. There were no impairments of the Company’s non-financial assets noted as of
December 31, 2017
or
2016
. The Company does not have any liabilities that are recorded at fair value on a non-recurring basis.
(15) Derivative Instruments and Hedging Activities
Effective April 1, 2010, in order to reduce the volatility of cash outflows that arise from changes in interest rates, the Company entered into
two
interest rate swap agreements. These interest rate swap agreements are intended to hedge the Company’s mortgage loan related to its headquarters facility in Middletown, Rhode Island by fixing the interest rates specified in the mortgage loan to
5.9%
for half of the principal amount outstanding and
6.1%
for the remaining half of the principal amount outstanding as of April 1, 2010 until the mortgage loan expires on
April 16, 2019
. The Company does not use derivatives for speculative purposes. For a derivative that is designated as a cash flow hedge, changes in the fair value of the derivative are recognized in accumulated other comprehensive loss to the extent the derivative is effective at offsetting the changes in the cash flows being hedged until the hedged item affects earnings. To the extent there is any hedge ineffectiveness, changes in fair value relating to the ineffective portion are immediately recognized in earnings in other income (expense) in the Consolidated Statements of Income. The interest rate swap is recorded within accrued other liabilities on the balance sheet. The critical terms of the interest rate swaps were designed to mirror the terms of the Company’s mortgage loans. The Company designated these derivatives as cash flow hedges of the variability of the LIBOR-based interest payments on principal over a nine-year period, which ends on April 1, 2019. As of
December 31, 2017
, the Company determined that the existence of hedge ineffectiveness, if any, was immaterial and all changes in the fair value of the interest rate caps were recorded in the Consolidated Statements of Comprehensive Loss as a component of accumulated other comprehensive loss.
As of
December 31, 2017
, the Company had the following outstanding interest rate derivatives that were designated as cash flow hedges of interest rate risk:
|
Interest Rate Derivatives
|
Notional
(in thousands)
|
Asset
(Liability)
|
Effective Date
|
Maturity Date
|
Index
|
Strike Rate
|
|||||||||
|
Interest rate swap
|
$
|
1,389
|
|
(33
|
)
|
April 1, 2010
|
April 1, 2019
|
1-month LIBOR
|
5.91
|
%
|
|||||
|
Interest rate swap
|
$
|
1,389
|
|
(36
|
)
|
April 1, 2010
|
April 1, 2019
|
1-month LIBOR
|
6.07
|
%
|
|||||
108
(16) Legal Matters
From time to time, the Company is involved in litigation incidental to the conduct of its business. In the ordinary course of business, the Company is a party to inquiries, legal proceedings and claims including, from time to time, disagreements with vendors and customers. The Company is not a party to any lawsuit or proceeding that, in management's opinion, is likely to materially harm the Company's business, results of operations, financial condition or cash flows.
Advanced Media Networks, L.L.C., or AMN, filed suit in the United States District Court for the District of Rhode Island against us for allegedly infringing two of its patents, seeking unspecified monetary damages and other relief. The Company settled this claim in January 2016 with a payment of cash to AMN.
(17) Quarterly Financial Results (Unaudited)
The following financial information for interim periods includes transactions which affect comparability of the quarterly results for the years ended
December 31, 2017
and
2016
.
Financial information for interim periods was as follows:
|
First
Quarter
|
Second
Quarter
|
Third
Quarter
|
Fourth
Quarter
|
||||||||||||
|
|
(in thousands, except per share amounts)
|
||||||||||||||
|
2017
|
|||||||||||||||
|
Product sales
|
$
|
14,863
|
|
$
|
14,323
|
|
$
|
14,169
|
|
$
|
13,613
|
|
|||
|
Service sales
|
25,348
|
|
26,126
|
|
26,281
|
|
25,365
|
|
|||||||
|
Cost of product sales
|
10,539
|
|
9,295
|
|
9,578
|
|
8,062
|
|
|||||||
|
Cost of service sales
|
13,268
|
|
13,094
|
|
13,374
|
|
12,956
|
|
|||||||
|
Operating expenses
|
20,874
|
|
19,428
|
|
19,299
|
|
19,085
|
|
|||||||
|
Loss from operations
|
(4,470
|
)
|
(1,368
|
)
|
(1,801
|
)
|
(1,125
|
)
|
|||||||
|
Net loss
|
$
|
(4,885
|
)
|
$
|
(2,026
|
)
|
$
|
(2,438
|
)
|
$
|
(1,685
|
)
|
|||
|
Net loss per share (a):
|
|||||||||||||||
|
Basic
|
$
|
(0.30
|
)
|
$
|
(0.12
|
)
|
$
|
(0.15
|
)
|
$
|
(0.10
|
)
|
|||
|
Diluted
|
$
|
(0.30
|
)
|
$
|
(0.12
|
)
|
$
|
(0.15
|
)
|
$
|
(0.10
|
)
|
|||
|
2016
|
|||||||||||||||
|
Product sales
|
$
|
15,382
|
|
$
|
20,062
|
|
$
|
19,020
|
|
$
|
18,611
|
|
|||
|
Service sales
|
24,998
|
|
25,904
|
|
26,826
|
|
25,319
|
|
|||||||
|
Cost of product sales
|
10,670
|
|
12,989
|
|
11,001
|
|
11,674
|
|
|||||||
|
Cost of service sales
|
12,991
|
|
13,259
|
|
13,576
|
|
13,140
|
|
|||||||
|
Operating expenses
|
20,093
|
|
20,411
|
|
18,256
|
|
19,384
|
|
|||||||
|
(Loss) income from operations
|
(3,374
|
)
|
(693
|
)
|
3,013
|
|
(268
|
)
|
|||||||
|
Net (loss) income
|
$
|
(2,791
|
)
|
$
|
(806
|
)
|
$
|
2,863
|
|
$
|
(6,783
|
)
|
|||
|
Net (loss) income per share (a):
|
|||||||||||||||
|
Basic
|
$
|
(0.18
|
)
|
$
|
(0.05
|
)
|
$
|
0.18
|
|
$
|
(0.43
|
)
|
|||
|
Diluted
|
$
|
(0.18
|
)
|
$
|
(0.05
|
)
|
$
|
0.18
|
|
$
|
(0.43
|
)
|
|||
|
(a)
|
Net (loss) income per share is computed independently for each of the quarters. Therefore, the net (loss) income per share for the four quarters may not equal the annual net (loss) income per share data.
|
(18) Subsequent Event
On February 27, 2018, we entered into a stock purchase agreement with SKY Perfect JSAT Corporation, or SJC, pursuant to which we agreed to sell 376,569 shares of our common stock to SJC for a purchase price of $11.95 per share, or an aggregate of $4.5 million, in a private placement. The transaction closed on February 28, 2018.
109
TABLE OF CONTENTS
Part IItem 1. BusinessItem 1A. Risk FactorsItem 1B. Unresolved Staff CommentsItem 2. PropertiesItem 3. Legal ProceedingsItem 4. Mine Safety DisclosuresPart IIItem 5. Market For Registrant S Common Equity, Related Stockholder Matters and Issuer Purchases Of Equity SecuritiesItem 6. Selected Financial DataItem 7. Management S Discussion and Analysis Of Financial Condition and Results Of OperationsItem 7A. Quantitative and Qualitative Disclosure About Market RiskItem 8. Financial Statements and Supplementary DataItem 9. Changes in and Disagreements with Accountants on Accounting and Financial DisclosureItem 9A. Controls and ProceduresItem 9B. Other InformationPart IIIItem 10. Directors, Executive Officers and Corporate GovernanceItem 11. Executive CompensationItem 12. Security Ownership Of Certain Beneficial Owners and Management and Related Stockholder MattersItem 13. Certain Relationships and Related Transactions and Director IndependenceItem 14. Principal Accountant Fees and ServicesPart IVItem 15. Exhibits and Financial Statement SchedulesItem 16. Form 10-k Summary