LITHIA MOTORS INC
10-Ks and 10-Qs
|
|
|
|
|
|
|
|
|
|
|
|
|
|
|
|
|
|
|
|
|
|
|
|
|
|
|
|
|
|
|
|
|
|
|
|
|
|
|
|
|
|
|
|
|
|
|
|
|
|
|
|
|
|
|
|
|
|
|
UNITED STATES
SECURITIES AND EXCHANGE COMMISSION
WASHINGTON, D. C. 20549
FORM 10-K
[X]
ANNUAL REPORT PURSUANT TO SECTION 13 OR 15(d) OF THE
SECURITIES EXCHANGE ACT OF 1934
For the Fiscal Year Ended: December 31, 2012
OR
[ ]
TRANSITION REPORT PURSUANT TO SECTION 13 OR 15(d) OF THE
SECURITIES EXCHANGE ACT OF 1934
Commission File Number: 001-14733
LITHIA MOTORS, INC.
(Exact name of registrant as specified in its charter)
|
Oregon
|
93-0572810
|
|
(State or other jurisdiction of incorporation or organization)
|
(I.R.S. Employer Identification No.)
|
|
150 N. Bartlett Street, Medford, Oregon
|
97501
|
|
(Address of principal executive offices)
|
(Zip Code)
|
541-776-6401
(Registrant’s telephone number including area code)
Securities registered pursuant to Section 12(b) of the Act:
|
Title of each class
|
Name of each exchange on which registered
|
|
Class A common stock, without par value
|
New York Stock Exchange
|
Securities registered pursuant to Section 12(g) of the Act:
None
(Title of Class)
Indicate by check mark if the Registrant is not required to file reports pursuant to Section 13 or Section 15(d) of the Act: [ ]
Indicate by check mark whether the Registrant (1) has filed all reports required to be filed by Section 13 or 15(d) of the Securities Exchange Act of 1934 during the preceding 12 months (or for such shorter period that the Registrant was required to file such reports), and (2) has been subject to such filing requirements for the past 90 days: Yes [X] No [ ]
Indicate by check mark whether the registrant has submitted electronically and posted on its corporate Web site, if any, every Interactive Data File required to be submitted and posted pursuant to Rule 405 of Regulation S-T (§ 232.405 of this chapter) during the preceding 12 months (or for such shorter period that the registrant was required to submit and post such files). Yes [X] No [ ]
Indicate by check mark if disclosure of delinquent filers pursuant to Item 405 of Regulation S-K is not contained herein, and will not be contained, to the best of Registrant’s knowledge, in definitive proxy or information statements incorporated by reference in Part III of this Form 10-K, or any amendment to this Form 10-K. [X]
Indicate by check mark whether the registrant is a large accelerated filer, an accelerated filer, a non-accelerated filer or a smaller reporting company. See definition of “accelerated filer,” “large accelerated filer” and “smaller reporting company” in Rule 12b-2 of the Exchange Act. Large accelerated filer [ ] Accelerated filer [X] Non-accelerated filer [ ] (Do not check if a smaller reporting company) Smaller reporting company [ ]
Indicate by check mark whether the registrant is a shell company (as defined in Rule 12b-2 of the Exchange Act). Yes [ ] No [ X ]
The aggregate market value of the voting and non-voting common equity held by non-affiliates of the Registrant was approximately $503,888,000 computed by reference to the last sales price ($23.05) as reported by the New York Stock Exchange for the Registrant’s Class A common stock, as of the last business day of the Registrant’s most recently completed second fiscal quarter (June 30, 2012).
The number of shares outstanding of the Registrant’s common stock as of February 22, 2013 was: Class A: 22,946,314 shares and Class B: 2,762,261 shares.
Documents Incorporated by Reference
The Registrant has incorporated into Part III of Form 10-K, by reference, portions of its Proxy Statement for its 2013 Annual Meeting of Shareholders.
LITHIA MOTORS, INC.
2012 FORM 10-K ANNUAL REPORT
TABLE OF CONTENTS
|
Page
|
||
| PART I | ||
|
Item 1.
|
Business
|
2
|
|
Item 1A.
|
Risk Factors
|
11
|
|
Item 1B.
|
Unresolved Staff Comments
|
23
|
|
Item 2.
|
Properties
|
24
|
|
Item 3.
|
Legal Proceedings
|
24
|
|
Item 4.
|
Mine Safety Disclosure
|
25
|
| PART II | ||
|
Item 5.
|
Market for Registrant’s Common Equity, Related Stockholder Matters and Issuer Purchases of Equity Securities
|
25
|
|
Item 6.
|
Selected Financial Data
|
28
|
|
Item 7.
|
Management’s Discussion and Analysis of Financial Condition and Results of Operations
|
29
|
|
Item 7A.
|
Quantitative and Qualitative Disclosures About Market Risk
|
54
|
|
Item 8.
|
Financial Statements and Supplementary Data
|
55
|
|
Item 9.
|
Changes in and Disagreements With Accountants on Accounting and Financial Disclosure
|
55
|
|
Item 9A.
|
Controls and Procedures
|
55
|
|
Item 9B.
|
Other Information
|
56
|
| PART III | ||
|
Item 10.
|
Directors, Executive Officers and Corporate Governance
|
56
|
|
Item 11.
|
Executive Compensation
|
56
|
|
Item 12.
|
Security Ownership of Certain Beneficial Owners and Management and Related Stockholder Matters
|
57
|
|
Item 13.
|
Certain Relationships and Related Transactions, and Director Independence
|
57
|
|
Item 14.
|
Principal Accountant Fees and Services
|
57
|
| PART IV | ||
|
Item 15.
|
Exhibits and Financial Statement Schedules
|
58
|
|
Signatures
|
62
|
|
1
Forward-Looking Statements
Certain statements under the sections entitled “Risk Factors,” “Management’s Discussion and Analysis of Financial Condition and Results of Operations” and “Business” and elsewhere in this Form 10-K constitute forward-looking statements within the meaning of the Private Securities Litigation Reform Act of 1995. Generally, you can identify forward-looking statements by terms such as “may,” “will,” “should,” “expect,” “plan,” “intend,” “forecast,” “anticipate,” “believe,” “estimate,” “predict,” “potential,” and “continue” or the negative of these terms or other comparable terminology. The forward-looking statements contained in this Form 10-K involve known and unknown risks, uncertainties and situations that may cause our actual results, level of activity, performance or achievements to be materially different from any future results, levels of activity, performance or achievements expressed or implied by these statements. Some of the important factors that could cause actual results to differ from our expectations are discussed in Item 1A. of this Form 10-K.
By their nature, forward-looking statements involve risks and uncertainties because they relate to events that depend on circumstances that may or may not occur in the future. While we believe that the expectations reflected in the forward-looking statements are reasonable, we cannot guarantee future results, levels of activity, performance or achievements, and our actual results of operations, financial condition and liquidity and development of the industries in which we operate may differ materially from those made in or suggested by the forward-looking statements in this Form 10-K. You should not place undue reliance on these forward-looking statements. Any forward-looking statement speaks only as of the date on which it is made. We assume no obligation to update or revise any forward-looking statement.
Overview
We are a leading operator of automotive franchises and a retailer of new and used vehicles and services. As of February 22, 2013, we offered 27 brands of new vehicles and all brands of used vehicles in 87 stores in the United States and online at
Lithia.com
. We sell new and used cars and trucks and replacement parts; provide vehicle maintenance, warranty, paint and repair services; and arrange related financing, service contracts, protection products and credit insurance.
Our dealerships are primarily located throughout the Western and Midwestern regions of the United States. We target mid-sized regional markets for domestic and import franchises and metropolitan markets for luxury franchises. We believe this strategy enables brand exclusivity with insulation from competition with the same franchise in the market.
The following table sets forth information about stores that were part of our continuing operations as of December 31, 2012:
|
State
|
Number of
Stores
|
Percent of
2012 Revenue
|
||||||
|
Texas
|
15 | 25 | % | |||||
|
Oregon
|
19 | 20 | ||||||
|
California
|
11 | 10 | ||||||
|
Montana
|
8 | 9 | ||||||
|
Washington
|
7 | 8 | ||||||
|
Alaska
|
7 | 8 | ||||||
|
Idaho
|
5 | 5 | ||||||
|
Iowa
|
5 | 5 | ||||||
|
Nevada
|
4 | 5 | ||||||
|
North Dakota
|
3 | 3 | ||||||
|
New Mexico
|
3 | 2 | ||||||
|
Total
|
87 | 100 | % | |||||
2
Business Strategy and Operations
Our mission statement is: “Driven by our employees and preferred by our customers, Lithia is the leading automotive retailer in each of our markets.” We offer customers personal, convenient, flexible hometown service combined with the large company advantages of selection, competitive pricing, broad access to financing, consistent service, competence and guarantees. We strive for diversification in our products, services, brands and geographic locations to insulate us from market risk and to maintain profitability. We have developed a centralized support structure to reduce store level administrative functions. This allows store personnel to focus on providing a positive customer experience. With our management information systems and centrally-performed administrative functions in Medford, Oregon, we seek to gain economies of scale from our dealership network.
Our overall strategy is to target mid-sized and rural markets for domestic and import brands and metropolitan markets for luxury brands. We offer a variety of luxury, import and domestic new vehicle brands and models, reducing our dependence on any one manufacturer and our susceptibility to changing consumer preferences. Encompassing economy and luxury cars, sports utility vehicles (SUVs), crossovers, minivans and trucks, we believe our brand mix is well-suited to what customers demand in the markets we serve. Our new vehicle unit mix of 53% domestic, 37% import and 10% luxury aligns similarly with national market share.
We have centralized many administrative functions to streamline store level operations. Accounts payable, accounts receivable, credit and collections, accounting and taxes, payroll and benefits, information technology, legal, human resources, personnel development, treasury, cash management, advertising and marketing are all centralized at our corporate headquarters. The reduction of administrative functions at our stores allows our local managers to focus on customer-facing opportunities to generate increased revenues and gross profit. Our operations are supported by our dedicated training and personnel development program, which shares best practices across our dealership network and seeks to develop our store management talent.
Operations are structured to promote an entrepreneurial environment at the dealership level. Each store’s general manager and department managers, with assistance from regional and corporate management, are responsible for developing retail models that perform in their communities. They are the leaders in driving dealership operations, personnel development, manufacturer relationships, store culture and financial performance.
During 2012, we continued to focus on the following areas to achieve our mission:
|
●
|
increasing revenues in all business lines;
|
|
●
|
capturing a greater percentage of overall new vehicle sales in our local markets;
|
|
●
|
increasing sales of manufacturer certified pre-owned used vehicles; late model, lower-mileage vehicles; and value autos to reach additional customers;
|
|
●
|
leveraging our cost structure as vehicle sales increase while maintaining fixed costs;
|
|
●
|
diversifying our franchise mix through acquisitions;
|
|
●
|
increasing our return to investors through dividends and strategic share buy backs;
|
|
●
|
utilizing prudent cash management, including investing capital to produce accretive returns; and
|
|
●
|
reducing our exposure to pending debt maturities by renewing and extending debt instruments.
|
We believe our cost structure is aligned with current industry sales levels and is positioned to be leveraged if vehicle sales levels continue to improve. Our selling, general and administrative (“SG&A”) expense as a percentage of gross profit improved to 69.3% in 2012 compared to 71.1% in 2011. The 2011 results included a $6.3 million gain on the sale of property in California. Adjusting for this gain and other pro forma items in both 2012 and 2011, our adjusted SG&A expense as a percentage of gross profit in 2012 was 69.4%, compared to 72.5% in 2011.
3
We also measure the leverage of our cost structure by evaluating throughput, which is calculated as the incremental percentage of gross profit retained after deducting SG&A expense. For the years ended December 31, 2012 and 2011, our incremental throughput was 39.3% and 60.5%, respectively. Adjusting for the gain on the sale of property in California and other pro forma items, our adjusted throughput in 2012 was 45.3% and in 2011 was 51.1%. See Non-GAAP Reconciliations of Management’s Discussion and Analysis of Financial Condition and Results of Operations for additional information regarding pro forma SG&A expense.
Throughput contributions for newly opened or acquired stores are on a ”first-dollar” basis for the first twelve months of operations and reduce overall throughput performance. In 2012, we acquired four stores and opened two new stores. In 2011, we acquired four stores and opened one new store. Adjusting for these locations, our throughput contribution on a same store basis was 51.2% and 59.9% for the years ended December 31, 2012 and 2011, respectively.
We believe we are well positioned to improve our SG&A expense leverage if vehicle sales levels continue to improve. As sales volume increases and we gain leverage in our cost structure, we anticipate achieving metrics of SG&A as a percentage of gross profit in the high 60% range depending on sales volumes and incremental same store throughput of approximately 50%.
We continuously evaluate our portfolio of franchises, divesting stores that are not expected to meet our financial return requirements while selectively acquiring attractive stores in our target markets. In the past three years, we generated $31.4 million in cash by divesting stores that did not meet our financial return expectations. Additionally, in the past three years, we spent $128.9 million in cash on acquisitions which increase revenue and diversify our portfolio.
New Vehicles
In 2012, we sold 55,666 new vehicles, generating 25% of our gross profit for the year. New vehicle sales also have the potential to create incremental profit opportunities through manufacturer incentives, resale of trade-in vehicles, sale of third-party financing, vehicle service and insurance contracts, and future service and repair work.
In 2012, we represented 27 domestic and import brands ranging from economy to luxury cars, SUVs, crossovers, minivans and light trucks.
4
|
Manufacturer
|
Percent of
2012 New
Vehicle
Revenue
|
Percent of
2012 New
Vehicle Gross
Profit
|
||||||
|
Chrysler, Jeep, Dodge
|
33.2% | 29.7% | ||||||
|
Chevrolet, Cadillac, GMC, Buick
|
15.7 | 15.8 | ||||||
|
Toyota, Scion
|
12.3 | 11.7 | ||||||
|
BMW, Mini
|
9.8 | 10.1 | ||||||
|
Honda, Acura
|
5.6 | 7.1 | ||||||
|
Ford, Lincoln
|
5.9 | 5.1 | ||||||
|
Hyundai
|
2.7 | 4.6 | ||||||
|
Subaru
|
5.6 | 4.6 | ||||||
|
Mercedes, smart
|
3.5 | 4.6 | ||||||
|
Nissan
|
2.2 | 2.6 | ||||||
|
Volkswagen, Audi
|
1.8 | 1.9 | ||||||
|
Kia
|
0.7 | 0.9 | ||||||
|
Porsche
|
0.6 | 0.8 | ||||||
|
Mazda
|
0.3 | 0.5 | ||||||
|
Mitsubishi
|
0.1 | * | ||||||
|
Fiat
|
* | * | ||||||
|
Total
|
100.0% | 100.0% | ||||||
* Less than 0.1%
We purchase our new car inventory directly from manufacturers, who generally allocate new vehicles to stores based on availability, monthly sales and market area. Accordingly, we rely on the manufacturers to provide us with vehicles that meet consumer demand at suitable locations, with appropriate quantities and prices. However, high demand vehicles are often in short supply. We exchange vehicles with other automotive retailers and between our own stores to accommodate customer demand and to balance inventory.
Used Vehicles
At each new vehicle store, we also sell used vehicles. In 2012, retail used vehicle sales generated 23% of our gross profit.
Our used vehicle operations give us an opportunity to:
|
·
|
generate sales to customers financially unable or unwilling to purchase a new vehicle;
|
|
·
|
generate sales of vehicle brands other than the store’s new vehicle franchise;
|
|
·
|
increase new and used vehicle sales by aggressively pursuing customer trade-ins; and
|
|
·
|
increase finance and insurance revenues and service and parts sales.
|
Our longer-term strategy is to maintain a ratio of one retail used vehicle sale to one retail new vehicle sale. For the years ended December 31, 2012 and 2011, we had a ratio of 0.9:1. In addition, our stores currently sell an average of 46 retail used vehicle units per month and our longer-term strategy is to increase monthly sales to an average of 75 units.
We strive to achieve this strategy through offering three categories of used vehicles: manufacturer certified pre-owned used vehicles; late model, lower-mileage vehicles; and value autos. We offer manufacturer certified pre-owned used vehicles at most of our franchised dealerships. These vehicles undergo additional reconditioning and receive an extended factory-provided warranty. Late model, lower-mileage vehicles are reconditioned and offer a Lithia certified warranty. Value autos are older, higher mileage vehicles that undergo a safety check and a lesser degree of reconditioning. Value autos are offered to customers who require a less expensive vehicle with lower monthly payments.
5
We acquire our used vehicles through customer trade-ins and at closed auctions. We also purchase vehicles directly from customers visiting our stores, private parties advertising through local newspapers, competing dealers and online.
Wholesale transactions result from vehicles we have purchased from customers or vehicles we have attempted to sell via retail that we elect to dispose of due to inventory age or other factors. As part of our used vehicle strategy, we have concentrated on directing more lower-priced, older vehicles to retail sale rather than wholesale disposal.
Vehicle Financing, Service Contracts and Other Products
As part of the vehicle sales process, we assist in arranging customer financing options as well as offer extended warranties, insurance contracts and vehicle and theft protection products. The sale of these items generated 21% of our gross profit.
We believe that arranging financing is an important part of our ability to sell vehicles and related products and services. Our sales personnel and finance and insurance managers receive training in securing customer financing and possess extensive knowledge of available financing alternatives. We attempt to arrange financing for every vehicle we sell and we offer customers financing on a “same day” basis, giving us an advantage, particularly over smaller competitors who do not generate enough sales to attract our breadth of finance sources.
We earn a commission on each finance, service and insurance contract we write and subsequently sell to a third-party. We normally arrange financing for customers by selling the contracts to outside sources on a non-recourse basis to avoid the risk of default.
We were able to arrange financing on 76% of the vehicles we sold during 2012, compared to 72% in 2011. Our presence in multiple markets and changes in technology surrounding the credit application process have allowed us to utilize a larger network of lenders across a broader geographic area. Additionally, we continue to see the availability of consumer credit expand with lenders increasing the loan-to-value amount available to most customers. These shifts afford us the opportunity to sell additional or more comprehensive products, while remaining within a loan-to-value framework acceptable to our retail customer lenders. On a same store basis, sub-prime customers, which are defined as customers with credit scores of 620 or less and comprised approximately 11.7% of the financings we completed in 2012, continue to experience constraints in obtaining automotive financing. In 2012, we increased the number of vehicles sold to customers visiting our dealerships with credit scores of 620 or lower by 39.8% compared to the prior year. Over our entire customer base, the average credit score in 2012 was 725. While the market for sub-prime customers continued to improve in 2012, we believe vehicle sales will increase as these customers are able to obtain loans at more attractive terms.
We also market third-party extended warranty contracts, insurance contracts and vehicle and theft protection products to our customers. These products and services yield higher profit margins than vehicle sales and contribute significantly to our profitability. Extended warranty contracts for new vehicles provide additional coverage beyond the duration or scope of the manufacturer’s warranty. We also sell service contracts, which provide coverage for certain major repairs. We believe the sale of extended warranties and service contracts increases our service and parts business as well, linking future repair work to our locations.
When customers finance an automobile purchase, we offer them guaranteed auto protection (“gap”) coverage that provides protection from loss incurred by the difference in the amount owed and the amount received under a comprehensive insurance claim. We receive a commission on each gap policy sold.
6
We offer a lifetime lube, oil and filter (“LOF”) service, which, in 2012, was purchased by 35% of our total new and used vehicle buyers. This service, where customers prepay for their LOF services, helps us retain customers by building customer loyalty and provides opportunities for selling additional routine maintenance items and generating repeat service business. In 2012, we sold an average of $48 of additional maintenance on each lifetime LOF service we performed.
Service, Body and Parts
In 2012, our service, body and parts operations generated 31% of our gross profit. Our service, body and parts operations are an integral part of establishing customer loyalty and contribute significantly to our overall revenue and profits. We provide parts and service for the new vehicle brands sold by our stores, as well as service most other makes and models.
The service and parts business provides important repeat revenues to our stores. In addition to warranty revenues associated with new vehicles, we target growing our service and parts business organically. Customer pay revenues represent sales for vehicle maintenance and service performed on other makes and models. We believe offering ‘one-stop shopping’ for customers will be an important point of differentiation as we offer more diversified services for our repeat customers. Our parts wholesale business is an additional source of revenue. We believe body shops provide an attractive opportunity to grow our business, and we continue to evaluate potential locations to expand. We currently operate 14 collision repair centers: four in Texas; three in Oregon; two in Idaho; and one each in Alaska, Washington, Montana, Iowa and Nevada.
We focus on growing our customer pay business and market our parts and service products by notifying owners when their vehicles are due for periodic service. This encourages preventive maintenance rather than post-breakdown repairs. The number of customers who purchase our lifetime LOF service helps to improve customer loyalty and provides opportunities for repeat parts and service business.
Revenues from the service and parts departments are particularly important during economic downturns, as owners tend to repair their existing vehicles rather than buy new vehicles during such periods. This partially mitigates the effects of a drop in new vehicle sales that may occur in a recessionary economic environment.
Our service, body and parts operations provide us an opportunity to build the Lithia Automotive brand independent of new vehicle franchises. We have branded our service processes as “Assured Service.” Assured Service provides customer benefits such as same day service, upfront price guarantees and a three-year/50,000 mile warranty on repairs. We have also launched “Assured Automotive Products” on various commodity items such as tires, filters and batteries. These branded parts provide improved margins as we procure in bulk directly from the manufacturer.
Marketing
We emphasize customer satisfaction and we realize that customer retention is critical to our success. We want our customers’ experiences to be satisfying so that they refer us to their families and friends. We utilize an owner marketing strategy, consisting of email, traditional mail and phone contact, to maintain regular communication and solicit feedback.
To increase awareness and traffic at our stores, we employ a combination of traditional, digital and social media to reach potential customers. Total advertising expense, net of manufacturer credits, was $31.9 million in 2012, $23.9 million in 2011 and $25.4 million in 2010. In 2012, approximately 47% of those funds were spent in traditional media and 53% were spent in digital and owner communications and other media outlets. In all of our communications, we seek to differentiate ourselves from competitors by conveying price, selection and finance benefits unique to Lithia.
7
Certain advertising and marketing expenditures are offset by manufacturer cooperative programs. Advertising credits not tied to specific vehicles are earned as qualifying expenses are incurred and requests for reimbursement are submitted to manufacturers for qualifying advertising expenditures. These reimbursements are recognized as a reduction of advertising expense upon manufacturer confirmation of submitted expenditures. Manufacturer cooperative advertising credits were $9.6 million in 2012, $7.8 million in 2011 and $2.5 million in 2010.
Many people now shop online before visiting our stores. We maintain websites for all of our stores and a corporate site (Lithia.com) dedicated to generating customer leads for our stores. Today, our websites enable our customers to:
|
●
|
locate our stores and identify the new vehicle brands sold at each store;
|
|
●
|
search new and pre-owned vehicle inventory;
|
|
●
|
view current pricing and specials;
|
|
●
|
obtain a value for their vehicle to trade or sell to us;
|
|
●
|
submit credit applications;
|
|
●
|
shop for and order manufacturers’ vehicle parts;
|
|
●
|
schedule service appointments; and
|
|
●
|
provide feedback about their Lithia experience.
|
We also maintain mobile versions of our websites and a mobile application in anticipation of greater adoption of mobile technology. Mobile traffic now accounts for 20% of our web traffic.
We post our inventory on major new and used vehicle listing services (cars.com, autotrader.com, kbb.com, edmunds.com, ebay, craigslist, etc.) to reach online shoppers. We also employ search engine optimization, search engine marketing and online display advertising to reach more online prospects.
Social influence marketing represents a cost-effective method to enhance our corporate reputation and increase vehicle sales and service. We are deploying tools and training to our employees in ways that will help us listen to our customers and create more ambassadors for Lithia.
Franchise Agreements
Each of our stores operates under a separate agreement (“Franchise Agreement”) with the manufacturer of the new vehicle brand it sells.
Typical automobile Franchise Agreements specify the locations within a designated market area at which the store may sell vehicles and related products and perform certain approved services. The designation of such areas and the allocation of new vehicles among stores are at the discretion of the manufacturer. Franchise Agreements do not, however, guarantee exclusivity within a specified territory.
A Franchise Agreement may impose requirements on the store with respect to:
|
●
|
facilities and equipment;
|
|
●
|
inventories of vehicles and parts;
|
|
●
|
minimum working capital;
|
|
●
|
training of personnel; and
|
|
●
|
performance standards for market share and customer satisfaction.
|
Each manufacturer closely monitors compliance with these requirements and requires each store to submit monthly financial statements. Franchise Agreements also grant a store the right to use and display manufacturers’ trademarks, service marks and designs in the manner approved by each manufacturer.
8
We have determined the useful life of a Franchise Agreement is indefinite, even though certain Franchise Agreements are renewed after one to five years. In our experience, agreements are routinely renewed without substantial cost and there are legal remedies to help prevent termination. Certain Franchise Agreements, including those with Ford and Chrysler, have no termination date. In addition, state franchise laws protect franchised automotive retailers. Under certain laws, a manufacturer may not terminate or fail to renew a franchise without good cause or prevent any reasonable changes in the capital structure or financing of a store.
The typical Franchise Agreement provides for early termination or non-renewal by the manufacturer upon:
|
●
|
a change of management or ownership without manufacturer consent;
|
|
●
|
insolvency or bankruptcy of the dealer;
|
|
●
|
death or incapacity of the dealer/manager;
|
|
●
|
conviction of a dealer/manager or owner of certain crimes;
|
|
●
|
misrepresentation of certain sales or inventory information by the store, dealer/manager or owner to the manufacturer;
|
|
●
|
failure to adequately operate the store;
|
|
●
|
failure to maintain any license, permit or authorization required for the conduct of business;
|
|
●
|
poor market share; or
|
|
●
|
low customer satisfaction index scores.
|
Franchise Agreements generally provide for prior written notice before a franchise may be terminated under most circumstances. We also sign master framework agreements with most manufacturers that impose additional requirements on our stores. See Item 1A. “Risk Factors.”
Competition
The retail automotive business is highly competitive. Currently, there are approximately 17,900 dealers in the United States, many of whom are independent stores managed by individuals, families or small retail groups. We compete primarily with other automotive retailers, both publicly and privately-held.
Vehicle manufacturers have designated specific marketing and sales areas within which only one dealer of a vehicle brand may operate. In addition, our Franchise Agreements typically limit our ability to acquire multiple dealerships of a given brand within a particular market area. Certain state franchise laws also restrict us from relocating our dealerships, or establishing new dealerships of a particular brand, within any area that is served by another dealer with the same brand. Accordingly, to the extent that a market has multiple dealers of a particular brand, as certain markets we operate in do, we are subject to significant intra-brand competition.
We are larger and have more financial resources than most private automotive retailers with which we currently compete in the majority of our regional markets. We compete directly with retailers with similar or greater resources in our metropolitan markets in Seattle, Washington and Portland, Oregon. If we enter other metropolitan markets, we may face competitors that are larger or have access to greater financial resources. We do not have any cost advantage in purchasing new vehicles from manufacturers. We rely on advertising and merchandising, pricing, our customer guarantees and sales model, our sales expertise, service reputation and the location of our stores to sell new vehicles.
Regulation
Automotive and Other Laws and Regulations
We operate in a highly regulated industry. A number of state and federal laws and regulations affect our business. In every state in which we operate, we must obtain various licenses in order to operate our businesses, including dealer, sales and finance and insurance licenses issued by state regulatory authorities. Numerous laws and regulations govern our conduct of business, including those relating to our sales, operations, financing, insurance, advertising and employment practices. These laws and regulations include state franchise laws and regulations, consumer protection laws, privacy laws, escheatment laws, anti-money laundering laws and other extensive laws and regulations applicable to new and used motor vehicle dealers, as well as a variety of other laws and regulations. These laws also include federal and state wage-hour, anti-discrimination and other employment practices laws.
9
Our financing activities with customers are subject to numerous federal, state and local laws and regulations. Claims arising out of actual or alleged violations of law may be asserted against us or our stores by individuals, a class of individuals, or governmental entities. These claims may expose us to significant damages or other penalties, including revocation or suspension of our licenses to conduct store operations and fines.
Our operations are subject to the National Traffic and Motor Vehicle Safety Act, Federal Motor Vehicle Safety Standards promulgated by the United States Department of Transportation, and the rules and regulations of various state motor vehicle regulatory agencies.
Environmental, Health, and Safety Laws and Regulations
Our operations involve the use, handling, storage and contracting for recycling and/or disposal of materials such as motor oil and filters, transmission fluids, antifreeze, refrigerants, paints, thinners, batteries, cleaning products, lubricants, degreasing agents, tires and fuel. Consequently, our business is subject to a complex variety of federal, state and local requirements that regulate the environment and public health and safety.
Most of our stores use above ground storage tanks, and, to a lesser extent, underground storage tanks, primarily for petroleum-based products. Storage tanks are subject to periodic testing, containment, upgrading and removal under the Resource Conservation and Recovery Act and its state law counterparts. Clean-up or other remedial action may be necessary in the event of leaks or other discharges from storage tanks or other sources. In addition, water quality protection programs under the federal Water Pollution Control Act (commonly known as the Clean Water Act), the Safe Drinking Water Act and comparable state and local programs govern certain discharges from our operations. Similarly, certain air emissions from operations, such as auto body painting, may be subject to the federal Clean Air Act and related state and local laws. Health and safety standards promulgated by the Occupational Safety and Health Administration of the United States Department of Labor and related state agencies also apply.
Certain stores may become a party to proceedings under the Comprehensive Environmental Response, Compensation, and Liability Act, or CERCLA, typically in connection with materials that were sent to former recycling, treatment and/or disposal facilities owned and operated by independent businesses. The remediation or clean-up of facilities where the release of a regulated hazardous substance occurred is required under CERCLA and other laws.
We incur certain costs to comply with applicable environmental, health and safety laws and regulations in the ordinary course of our business. We do not anticipate, however, that the costs of such compliance will have a material adverse effect on our business, results of operations, cash flows or financial condition, although such outcome is possible given the nature of our operations and the extensive environmental, public health and safety regulatory framework. We are aware of minor contamination at certain of our facilities, and we are in the process of conducting investigations and/or remediation at certain properties. In certain cases, the current or prior property owner is conducting the investigation and/or remediation or we have been indemnified by either the current or prior property owner for such contamination. The current level of contamination is such that we do not expect to incur significant costs for the remediation. However, no assurances can be given that material environmental commitments or contingencies will not arise in the future, or that they do not already exist but are unknown to us.
10
Employees
As of December 31, 2012, we employed approximately 5,043 persons on a full-time equivalent basis.
Available Information and NYSE Compliance
We file annual, quarterly and special reports, proxy statements and other information with the Securities and Exchange Commission (“SEC”) under the Securities Exchange Act of 1934 as amended (the “Exchange Act”). You may inspect and copy our reports, proxy statements, and other information filed with the SEC at the SEC’s Public Reference Room at 100 F Street, NE, Washington, D.C. 20549. Please call the SEC at 1-800-SEC-0330 for further information on the Public Reference Room. The SEC maintains an Internet Web site at http://www.sec.gov where you may access copies of our SEC filings.
We also make available free of charge, on our website at www.lithia.com, our annual reports on Form 10-K, quarterly reports on Form 10-Q, current reports on Form 8-K, and amendments to those reports filed or furnished pursuant to Section 13(a) or 15(d) of the Exchange Act, as soon as reasonably practicable after they are filed electronically with the SEC. The information found on our website is not part of this Form 10-K.
You may also obtain copies of these reports by contacting Investor Relations at 877-331-3084.
You should carefully consider the risks described below before making an investment decision. The risks described below are not the only ones facing our company. Additional risks not presently known to us or that we currently deem immaterial may also impair our business operations.
Risks related to our business
Our business will be harmed if overall consumer demand continues to suffer from a severe or sustained downturn.
Our business is heavily dependent on consumer demand and preferences. A downturn in overall levels of consumer spending may materially and adversely affect our revenues. Retail vehicle sales are cyclical and historically have experienced periodic downturns characterized by oversupply and weak demand. These cycles are often dependent on general economic conditions and consumer confidence, as well as the level of discretionary personal income and credit availability. Economic conditions may be anemic for an extended period of time, or deteriorate in the future. This would have a material adverse effect on our retail business, particularly sales of new and used automobiles.
Our business may be adversely affected by unfavorable conditions in our local markets, even if those conditions are not prominent nationally.
Our performance is subject to local economic, competitive and other conditions prevailing in our various geographic areas. Our dealerships are currently located in limited markets in 11 states, with sales in the top three states accounting for approximately 55% of our revenue in 2012. Our results of operations, therefore, depend substantially on general economic conditions and consumer spending levels in those markets and could be materially adversely affected to the extent these markets experience sustained economic downturns regardless of improvements in the U.S. economy overall.
Increasing competition among automotive retailers reduces our profit margins on vehicle sales and related businesses. Further, the use of the Internet in the car purchasing process could materially adversely affect us.
Automobile retailing is a highly competitive business. Our competitors include publicly and privately-owned dealerships, of which certain competitors are larger and have greater financial and marketing resources than we have. Many of our competitors sell the same or similar makes of new and used vehicles that we offer in our markets at competitive prices. We do not have any cost advantage in purchasing new vehicles from manufacturers due to economies of scale or otherwise.
11
Our finance and insurance business and other related businesses, which have higher margins than sales of new and used vehicles, are subject to strong competition from various financial institutions and other third parties.
The Internet has become a significant part of the sales process in our industry. Customers are using the Internet to compare pricing for vehicles and related finance and insurance services, which may further reduce margins for new and used vehicles and profits for related finance and insurance services. If Internet new vehicle sales are allowed to be conducted without the involvement of franchised dealers, our business could be materially adversely affected. In addition, other franchise groups have aligned themselves with services offered on the Internet or are investing heavily in the development of their own Internet capabilities, which could materially adversely affect our business, results of operations, financial condition and cash flows.
Our Franchise Agreements do not grant us the exclusive right to sell a manufacturer’s product within a given geographic area. Our revenues or profitability could be materially adversely affected if any of our manufacturers award franchises to others in the same markets where we operate or if existing franchised dealers increase their market share in our markets.
In addition, we may face increasingly significant competition as we strive to gain market share through acquisitions or otherwise. Our operating margins may decline over time as we expand into markets where we do not have a leading position.
Increasing fuel prices change consumer demand. Significant increases in fuel prices can be expected to reduce vehicle sales.
Historically, in times of rapid increase in crude oil and fuel prices, sales of vehicles have dropped, particularly in the short term, as the economy slows, consumer confidence wanes and fuel costs become more prominent to the consumer’s buying decision. In sustained periods of higher fuel costs, consumers who do purchase vehicles tend to prefer smaller, more fuel efficient vehicles (which typically have lower margins) or hybrid vehicles (which can be in limited supply during these periods).
Additionally, a significant portion of our new vehicle revenue and gross profit is derived from domestic manufacturers. These manufacturers have historically sold a higher percentage of trucks and SUVs than import or luxury brands. They may, therefore, experience a more significant decline in sales in the event that fuel prices increase.
A decline of available financing in the lending market has adversely affected, and may continue to adversely affect, our vehicle sales volume.
A significant portion of vehicle buyers finance their purchases of automobiles. Sub-prime lenders have historically provided financing for consumers who, for a variety of reasons, including poor credit histories and lack of down payment, do not have access to more traditional finance sources. Lenders have generally tightened their credit standards. If lenders maintain or further tighten their credit standards or there is a further decline in the availability of credit in the lending market, the ability of these consumers to purchase vehicles could be limited, which could have a material adverse effect on our business, results of operations, financial condition and cash flows.
12
Adverse conditions affecting one or more key manufacturers may negatively impact our business, results of operations, financial condition and cash flows.
We depend on our manufacturers to provide a supply of vehicles which supports expected sales levels. If manufacturers are unable to supply the needed level of vehicles, our financial performance may be adversely impacted.
We are subject to a concentration of risk in the event of financial distress, including potential reorganization or bankruptcy, of a major vehicle manufacturer. We purchase substantially all of our new vehicles from various manufacturers or distributors at the prevailing prices available to all franchised dealers. Our sales volume could be materially adversely impacted by the manufacturers’ or distributors’ inability to supply our stores with an adequate supply of vehicles.
In the event of a manufacturer or distributor bankruptcy, we could be held liable for damages related to product liability claims, intellectual property suits or other legal actions. These legal actions are typically directed towards the vehicle manufacturer and it is customary to indemnify us from exposure related to any judgments associated with the claims. However, in the event that damages could not be collected from the manufacturer or distributor, we could be named in lawsuits and judgments could be levied against us.
There can be no assurance that we will be able to successfully address the risks described above or those of the current economic circumstances and sales environment.
Our success depends in large part upon the overall demand for the particular lines of vehicles that each of our stores sell and the ability of the manufacturers to continue to deliver high quality, defect-free vehicles.
Demand for our primary manufacturers’ vehicles, as well as the financial condition, management, marketing, production and distribution capabilities of these manufacturers, can significantly affect our business. Events that adversely affect a manufacturer’s ability to timely deliver new vehicles may adversely affect us by reducing our supply of popular new vehicles and leading to lower sales in our stores during those periods than would otherwise occur. We depend on our manufacturers to deliver high-quality, defect-free vehicles. If manufacturers experience future quality issues, our financial performance may be adversely impacted. In addition, the discontinuance of a particular brand could negatively impact our revenues and profitability.
Many new competitors are entering the automotive industry. New companies have raised capital to produce fully electric vehicles or to license battery technology to existing manufacturers. Foreign manufacturers from China and India are producing significant volumes of new vehicles and are entering the U.S. and selecting partners to distribute their products. Because the automotive market in the U.S. is mature and the overall level of new vehicle sales may not increase in the coming years, the success of new competitors will likely be at the expense of other, established brands. This could have a material adverse impact on our success in the future.
Vehicle manufacturers would be adversely impacted by economic downturns or recessions, adverse fluctuations in currency exchange rates, significant declines in the sales of their new vehicles, increases in interest rates, declines in their credit ratings, labor strikes or similar disruptions (including within their major suppliers), supply shortages or rising raw material costs, rising employee benefit costs, adverse publicity that may reduce consumer demand for their products, product defects, vehicle recall campaigns, litigation, poor product mix or unappealing vehicle design, or other adverse events. These and other risks could materially adversely affect any manufacturer and limit its ability to profitably design, market, produce or distribute new vehicles, which, in turn, could materially adversely affect our business, results of operations, financial condition and cash flows.
13
Additionally, federal and certain state laws mandate minimum levels of vehicle fuel economy and establish emission standards. These levels and standards could be increased in the future, including the required use of renewable energy sources. Such laws often increase the costs of new vehicles, which would be expected to reduce demand. Further, changes in these laws could result in fewer vehicles available for sale by manufacturers unwilling or unable to comply with the higher standards.
If manufacturers or distributors discontinue or change sales incentives, warranties and other promotional programs, our business, results of operations, financial condition and cash flows may be materially adversely affected.
We depend upon the manufacturers and distributors for sales incentives, warranties and other programs that are intended to promote new vehicle sales or support dealership profitability. Manufacturers and distributors routinely make changes to their incentive programs. Key incentive programs include:
|
●
|
customer rebates;
|
|
●
|
dealer incentives on new vehicles;
|
|
●
|
special rates on certified, pre-owned cars;
|
|
●
|
below-market financing on new vehicles and special leasing terms; and
|
|
●
|
sponsorship of used vehicle sales by authorized new vehicle dealers.
|
Our financial condition could be materially adversely impacted by a discontinuation or change in our manufacturers’ or distributors’ incentive programs. In addition, certain manufacturers, including BMW and Mercedes, use a dealership’s manufacturer-determined customer satisfaction index, or “CSI”, score as a factor governing participation in incentive programs. To the extent we cannot meet minimum score requirements, we may be precluded from receiving certain incentives, which could materially adversely affect our business, results of operations, financial condition and cash flows.
The ability of our stores to make new vehicle sales depends in large part upon the manufacturers and, therefore, any disruption or change in our relationships with manufacturers may materially and adversely affect our business, results of operations, financial condition and cash flows.
We depend on the manufacturers to provide us with a desirable mix of new vehicles. The most popular vehicles usually produce the highest profit margins and are frequently in short supply. If we cannot obtain sufficient quantities of the most popular models, our profitability may be adversely affected. Sales of less desirable models may reduce our profit margins.
Each of our stores operates pursuant to a Franchise Agreement with each of the respective manufacturers for which it serves as franchisee. Manufacturers exert significant control over our stores through the terms and conditions of their franchise agreements. Such agreements contain provisions for termination or non-renewal for a variety of causes, including CSI scores and sales and financial performance. From time to time, certain of our stores have failed to comply with certain provisions of their franchise agreements, and we cannot assure you that our stores will be able to comply with these provisions in the future. In addition, actions taken by a manufacturer to exploit its bargaining position in negotiating the terms of renewals of franchise agreements or otherwise could also have a material adverse effect on our revenues and profitability. If a manufacturer terminates or fails to renew one or more of our significant franchise agreements or a large number of our franchise agreements, such action could have a material adverse effect on our business, results of operations, financial condition and cash flows.
14
Our Franchise Agreements also specify that, except in certain situations, we cannot operate a franchise by another manufacturer in the same building as the manufacturer’s franchised store. This may require us to build new facilities at a significant cost. Moreover, our manufacturers generally require that the store meet defined image standards. These commitments could require us to make significant capital expenditures.
Manufacturer stock ownership restrictions may impair our ability to maintain or renew franchise agreements or issue additional equity.
Certain of our Franchise Agreements prohibit transfers of ownership interests of a store or, in selected cases, its parent. The most prohibitive restriction which could be imposed by various manufacturers, including Honda/Acura, Hyundai, Mazda and Nissan, provides that, under certain circumstances, we may lose a franchise if a person or entity acquires an ownership interest in us above a specified level (ranging from 20% to 50% depending on the particular manufacturer’s restrictions and falling as low as 5% if another vehicle manufacturer is the entity acquiring the ownership interest) without the approval of the applicable manufacturer. Other restrictions in certain Franchise Agreements with manufacturers, including Ford, GM, Honda/Acura and Toyota, provide that a change in control in the Company without prior consent is a violation of our franchise or dealer framework agreement. Transactions in our stock by our stockholders or prospective stockholders are generally outside of our control and may result in the termination or non-renewal of one or more of our franchises or impair our ability to negotiate new franchise agreements for dealerships we desire to acquire in the future, which may have a material adverse effect on our business, results of operations, financial condition and cash flows. These restrictions may also prevent or deter a prospective acquirer from acquiring control of us or otherwise adversely affect the market price of our Class A common stock or limit our ability to restructure our debt obligations.
If state dealer laws are repealed or weakened, our dealerships will be more susceptible to termination, non-renewal or renegotiation of their franchise agreements. Additionally, federal bankruptcy law can override protections afforded under state dealer laws.
State dealer laws generally provide that a manufacturer may not terminate or refuse to renew a franchise agreement unless it has first provided the dealer with written notice setting forth good cause and stating the grounds for termination or non-renewal. Certain state dealer laws allow dealers to file protests or petitions or attempt to comply with the manufacturer’s criteria within the notice period to avoid the termination or non-renewal. If dealer laws are repealed in the states in which we operate, manufacturers may be able to terminate our franchises without providing advance notice, an opportunity to cure or a showing of good cause. Without the protection of state dealer laws, it may also be more difficult for our dealers to renew their franchise agreements upon expiration.
In addition, these laws restrict the ability of automobile manufacturers to directly enter the retail market in the future. If manufacturers obtain the ability to directly retail vehicles and do so in our markets, such competition could have a material adverse effect on our business, results of operations, financial condition and cash flows.
As evidenced by the bankruptcy proceedings of both Chrysler and GM in 2009, state dealer laws do not afford continued protection from manufacturer terminations or non-renewal of franchise agreements. No assurances can be given that a manufacturer will not seek protection under bankruptcy laws, or that, in this event, they will not seek to terminate franchise rights held by us.
15
Import product restrictions and foreign trade risks may impair our ability to sell foreign vehicles profitably.
A significant portion of the vehicles we sell, as well as certain major components of such vehicles, are manufactured outside the United States. Accordingly, we are affected by import and export restrictions of various jurisdictions and are dependent, to a certain extent, on general socio-economic conditions in, and political relations with, a number of foreign countries. Additionally, fluctuations in currency exchange rates may increase the price and adversely affect our sales of vehicles produced by foreign manufacturers. Imports into the United States may also be adversely affected by increased transportation costs and tariffs, quotas or duties, any of which could have a material adverse effect on our business, results of operations, financial condition and cash flows.
Environmental, health or safety regulations could have a material adverse effect on our business, results of operations, financial condition and cash flows or cause us to incur significant expenditures.
We are subject to various federal, state and local environmental, health and safety regulations which govern items such as the generation, storage, handling, use, treatment, recycling, transportation, disposal and remediation of hazardous material and the emission and discharge of hazardous material into the environment. Under certain environmental regulations or pursuant to signed private contracts, we could be held responsible for all of the costs relating to any contamination at our present, or our previously owned, facilities, and at third party waste disposal sites. We are aware of minor contamination at certain of our facilities, and we are in the process of conducting investigations and/or remediation at certain properties. The current level of contamination is such that we do not expect to incur significant costs for the remediation. In certain cases, the current or prior property owner is conducting the investigation and/or remediation or we have been indemnified by either the current or prior property owner for such contamination. There can be no assurance that these owners will remediate, or continue to remediate, these properties or pay, or continue to pay, pursuant to these indemnities. We are also required to obtain permits from governmental authorities for certain operations. If we violate or fail to fully comply with these regulations or permits, we could be fined or otherwise sanctioned by regulators.
Environmental, health and safety regulations are becoming increasingly stringent. There can be no assurance that the cost of compliance with these regulations will not result in a material adverse effect on our results of operations or financial condition. Further, no assurances can be given that additional environmental, health or safety matters will not arise or new conditions or facts will not develop in the future at our currently or formerly owned or operated facilities, or at sites that we may acquire in the future, which will require us to incur significant expenditures.
With the breadth of our operations and volume of consumer and financing transactions, compliance with the many applicable federal and state laws and regulations cannot be assured. New regulations are enacted on an ongoing basis. These regulations may impact our profitability and require continuous training and vigilance. Fines, judgments and administrative sanctions can be severe.
We are subject to federal, state and local laws and regulations in each of the 11 states in which we have stores. New laws and regulations are enacted on an ongoing basis. With the number of stores we operate, the number of personnel we employ and the large volume of transactions we handle, it is likely that technical mistakes will be made. It is also likely that these regulations may impact our profitability and require ongoing training. Current practices in stores may become prohibited. We are responsible for ensuring that continued compliance with laws is maintained. If there are unauthorized activities of serious magnitude, the state and federal authorities have the power to impose civil penalties and sanctions, suspend or withdraw dealer licenses or take other actions. These actions could materially impair our activities or our ability to acquire new stores in those states where violations occurred. Further, private causes of action on behalf of individuals or a class of individuals could result in significant damages or injunctive relief.
16
Compliance with the variety of federal, state and local advertising related regulations cannot be assured. These regulations, which impact various forms of advertising including print, media, text and Internet, could have a material adverse effect on our business, results of operations, financial condition and cash flows.
Advertising in our business is subject to numerous federal, state and local laws and regulations. These laws and regulations address unfair, deceptive and/or fraudulent trade practices. Claims arising out of actual or alleged violations of law may be asserted against us or any of our dealers by individuals, either individually or through class actions, or by governmental entities in civil or criminal investigations and proceedings. Such actions may expose us to substantial monetary damages and legal defense costs, injunctive relief and criminal and civil fines and penalties.
Governmental regulations related to fuel economy standards and greenhouse gases may have an adverse impact on the ability of vehicle manufacturers to cost-effectively produce vehicles or design vehicles desired by customers. These regulations may also impact our ability to sell these vehicles at affordable prices.
Federal regulations around fuel economy standards and “greenhouse gas” emissions have continued to increase. New requirements may adversely affect any manufacturer’s ability to profitably design, market, produce and distribute vehicles that comply with such regulations. We could be adversely impacted in our ability to market and sell these vehicles at affordable prices and in our ability to finance these inventories. These regulations could have a material adverse effect on our business, results of operations, financial condition and cash flows.
Failure of our information technology systems to perform adequately or data protection breaches and cyber attacks could disrupt our operations or result in the loss or misuse of customers’ proprietary information. These disruptions could have a material adverse effect on our business, financial results and reputation.
Our information technology systems are important to operating our business efficiently. We employ systems and websites that allow for the secure storage and transmission of customers’ proprietary information. The failure of our information technology systems to perform as we anticipate could disrupt our business and could expose us to a risk of loss or misuse of this information, litigation and potential liability.
Our information technology systems may be vulnerable to data protection breaches and cyber attacks beyond our control and we may not have the resources or technical sophistication to anticipate or prevent rapidly evolving types of cyber attacks. We invest in security technology to protect our data and business processes against these risks. We also purchase insurance to mitigate the potential financial impact of these risks. Despite these precautions, we cannot assure that a breach will not occur and any breach or successful attack could have a negative impact on our operations or business reputation.
Our ability to increase revenues through acquisitions depends on our ability to acquire and successfully integrate additional stores.
General
The U.S. automobile industry is considered a mature industry in which minimal growth is expected in unit sales of new vehicles. Accordingly, a principal component of our growth in sales is to make acquisitions in our existing markets and in new geographic markets. To complete the acquisition of additional stores, we need to successfully address each of the following challenges.
17
Limitations on our capital resources
The acquisition of additional stores will require substantial capital investment. Limitations on our capital resources would restrict our ability to complete new acquisitions.
We have financed our past acquisitions from a combination of the cash flow from our operations, borrowings under our credit arrangements, issuances of our common stock and proceeds from private debt offerings. The use of any of these financing sources could have the effect of reducing our earnings per share. We may not be able to obtain financing in the future due to the market price of our Class A common stock and overall market conditions. Furthermore, using cash to complete acquisitions could substantially limit our operating or financial flexibility.
Substantially all of the assets of our dealerships are pledged to secure the indebtedness under our credit facility and our other floor plan financing indebtedness. These pledges may limit our ability to borrow from other sources in order to fund our acquisitions.
Manufacturers
We are required to obtain consent from the applicable manufacturer prior to the acquisition of a franchised store. In determining whether to approve an acquisition, a manufacturer considers many factors, including our financial condition, ownership structure, the number of stores currently owned and our performance with those stores. Obtaining manufacturer approval of acquisitions also takes a significant amount of time, typically 60 to 90 days. We cannot assure you that manufacturers will approve future acquisitions timely, if at all, which could significantly impair the execution of our acquisition strategy.
Most major manufacturers have now established limitations or guidelines on the:
|
●
|
number of such manufacturers’ stores that may be acquired by a single owner;
|
|
●
|
number of stores that may be acquired in any market or region;
|
|
●
|
percentage of market share that may be controlled by one automotive retailer group;
|
|
●
|
ownership of stores in contiguous markets;
|
|
●
|
performance requirements for existing stores; and
|
|
●
|
frequency of acquisitions.
|
In addition, such manufacturers generally require that no other manufacturers’ brands be sold from the same store location, and many manufacturers have site control agreements in place that limit our ability to change the use of the facility without their approval.
A manufacturer also considers our past performance as measured by the Minimum Sales Responsibility (“MSR”) scores, CSI scores and Sales Satisfaction Index (“SSI”) scores at our existing stores. At any point in time, certain stores may have scores below the manufacturers’ sales zone averages or have achieved sales below the targets manufacturers have set. Our failure to maintain satisfactory scores and to achieve market share performance goals could restrict our ability to complete future store acquisitions.
Acquisition risks
We will face risks commonly encountered with growth through acquisitions. These risks include, without limitation:
|
●
|
failing to assimilate the operations and personnel of acquired dealerships;
|
|
●
|
failing to achieve predicted sales levels;
|
|
●
|
incurring significantly higher capital expenditures and operating expenses;
|
|
●
|
entering new markets with which we are unfamiliar;
|
|
●
|
encountering undiscovered liabilities and operational difficulties at acquired dealerships;
|
18
|
●
|
disrupting our ongoing business;
|
|
●
|
diverting our management resources;
|
|
●
|
failing to maintain uniform standards, controls and policies;
|
|
●
|
impairing relationships with employees, manufacturers and customers as a result of changes in management;
|
|
●
|
incurring increased expenses for accounting and computer systems, as well as integration difficulties;
|
|
●
|
failing to obtain a manufacturer’s consent to the acquisition of one or more of its dealership franchises or renew the franchise agreement on terms acceptable to us; and
|
|
●
|
incorrectly valuing entities to be acquired.
|
In addition, we may not adequately anticipate all of the demands that growth will impose on our systems, procedures and structures.
Consummation and competition
We may not be able to consummate any future acquisitions at acceptable prices and terms or identify suitable candidates. In addition, increased competition in the future for acquisition candidates could result in fewer acquisition opportunities for us and higher acquisition prices. The magnitude, timing, pricing and nature of future acquisitions will depend upon various factors, including:
|
●
|
the availability of suitable acquisition candidates;
|
|
●
|
competition with other dealer groups for suitable acquisitions;
|
|
●
|
the negotiation of acceptable terms with the seller and with the manufacturer;
|
|
●
|
our financial capabilities and ability to obtain financing on acceptable terms;
|
|
●
|
our stock price;
|
|
●
|
our ability to maintain required financial covenant levels after the acquisition; and
|
|
●
|
the availability of skilled employees to manage the acquired businesses.
|
Financial condition
The operating and financial condition of acquired businesses cannot be determined accurately until we assume control. Although we conduct what we believe to be a prudent level of investigation regarding the operating and financial condition of the businesses we purchase, in light of the circumstances of each transaction, an unavoidable level of risk remains regarding the actual operating condition of these businesses. Similarly, many of the dealerships we acquire do not have financial statements audited or prepared in accordance with U.S. generally accepted accounting principles. We may not have an accurate understanding of the historical financial condition and performance of our acquired businesses. Until we actually assume control of the business assets and their operations, we may not be able to ascertain the actual value or understand the potential liabilities of the acquired businesses and their earnings potential.
Indefinite-lived intangible assets, which consist of goodwill and franchise value, comprise a meaningful portion of our total assets ($94.5 million at December 31, 2012). We must assess our indefinite-lived intangible assets for impairment at least annually, which may result in a non-cash write-down of franchise rights or goodwill and could have a material adverse impact on our business, results of operations, financial condition and cash flows and impair our ability to comply with loan covenants.
Indefinite-lived intangible assets are subject to impairment assessments at least annually (or more frequently when events or circumstances indicate that an impairment may have occurred) by applying a fair-value based test. Our principal intangible assets are goodwill and our rights under our Franchise Agreements with vehicle manufacturers. The risk of impairment charges associated with goodwill increases if there are declines in our market capitalization, profitability or cash flows. The risk of impairment charges associated with franchise value increases if operating losses are suffered at those stores, if a manufacturer files for bankruptcy or if the stores are closed. Impairment charges result in non-cash write-downs of the affected franchise values or goodwill. Furthermore, impairment charges could have an adverse impact on our ability to satisfy the financial ratios or other covenants under our debt agreements and could have a material adverse impact on our business, results of operations, financial condition and cash flows.
19
A net deferred tax asset position comprises a meaningful portion of our total assets (approximately $21.0 million at December 31, 2012). We are required to assess the recoverability of this asset on an ongoing basis. Future negative operating performance or other unfavorable developments may result in a valuation allowance being recorded against part or all of this amount. This could have a material adverse impact on our business, results of operations, financial condition and cash flows and impair our ability to comply with loan covenants.
Deferred tax assets are evaluated periodically to determine if they are expected to be recoverable in the future. This evaluation considers positive and negative evidence in order to assess whether it is more likely than not that a portion of the asset will not be realized. The risk of a valuation allowance increases if continuing operating losses are incurred. A valuation allowance on our deferred tax asset could have an adverse impact on our ability to satisfy financial ratios or other covenants under our debt agreements and could have a material adverse impact on our business, results of operations, financial condition and cash flows.
Our indebtedness and lease obligations could materially adversely affect our financial health, limit our ability to finance future acquisitions and capital expenditures and prevent us from fulfilling our financial obligations. Much of our debt has a variable interest rate component that may significantly increase our interest costs in a rising rate environment.
Our indebtedness and lease obligations could have important consequences to us, including the following:
|
●
|
limitations on our ability to make acquisitions;
|
|
●
|
impaired ability to obtain additional financing for acquisitions, capital expenditures, working capital or general corporate purposes;
|
|
●
|
reduced funds available for our operations and other purposes, as a portion of our current cash flow from operations would be dedicated to the payment of principal and interest on our indebtedness; and
|
|
●
|
exposure to the risk of increasing interest rates as certain borrowings are, and will continue to be, at variable rates of interest.
|
In addition, our loan agreements contain covenants that limit our discretion with respect to business matters, including incurring additional debt, acquisition activity or disposing of assets. Other covenants are financial in nature, including current ratio, fixed charge coverage and leverage ratio. A breach of any of these covenants could result in a default under the applicable agreement. In addition, a default under one agreement could result in a default and acceleration of our repayment obligations under the other agreements under the cross-default provisions in such other agreements.
Certain debt agreements contain subjective acceleration clauses based on a lender deeming itself insecure or if a “material adverse change” in our business has occurred. If these clauses are implicated, and the lender declares that an event of default has occurred, the outstanding indebtedness would likely be immediately due and owing.
If these events were to occur, we may not be able to pay our debts or borrow sufficient funds to refinance them. Even if new financing were available, it may not be on terms acceptable to us. As a result of this risk, we could be forced to take actions that we otherwise would not take, or not take actions that we otherwise might take, in order to comply with these agreements.
20
Additionally, our real estate debt generally has a five-year term, after which the debt needs to be renewed or replaced. A decline in the appraised value of real estate or a reduction in the loan-to-value lending ratios for new or renewed real estate loans could result in our inability to renew maturing real estate loans at the debt level existing at maturity, or on terms acceptable to us, requiring us to find replacement lenders or to refinance at lower loan amounts.
As of December 31, 2012, including the effect of interest rate swaps, approximately 74% of our total debt was variable rate. The majority of our variable rate debt is indexed to the one-month LIBOR rate. The current interest rate environment is at historically low levels, and interest rates will likely increase in the future. In the event interest rates increase, our borrowing costs may increase substantially. Additionally, fixed rate debt that matures may be renewed at interest rates significantly higher than current levels. As a result, this could have a material adverse impact on our business, results of operations, financial condition and cash flows.
We have a significant relationship with a third-party warranty insurer and administrator. This third-party is the obligor of service warranty policies sold to our customers. Additionally, we have agreements in place that allow for future income based on the claims experience on policies sold to our customers. If the insurer should be unable to honor our customers’ policies or has a decline in their financial health, such events could negatively impact our business and reputation, results of operations, financial condition and cash flows.
We sell service warranty policies to our customers issued by a third-party obligor. We receive additional fee income if actual claims are less than the amounts reserved for anticipated claims and the costs of administration and administrator profit.
A decline in the financial health of the third-party insurer could jeopardize the claims reserves held by the administrator, and prevent us from collecting the experience payments anticipated to be earned in future years. While the amount we receive varies annually, the loss of this income could negatively impact our business, results of operations, financial condition and cash flows. Further, the inability of the insurer to honor service warranty claims would likely result in reputational risk to us and might result in claims to cover any default by the insurer.
The loss of key personnel or the failure to attract additional qualified management personnel could adversely affect our operations and growth.
Our success depends to a significant degree on the efforts and abilities of our senior management, particularly Bryan B. DeBoer, our Director, President and Chief Executive Officer, and Christopher S. Holzshu, our Senior Vice President and Chief Financial Officer. Further, we have identified Sidney B. DeBoer, our Executive Chairman of the Board, and/or Bryan B. DeBoer in most of our store franchise agreements as the individuals who control the franchises and upon whose financial resources and management expertise the manufacturers may rely when awarding or approving the transfer of any franchise. If we lose these key personnel, our business may suffer.
In addition, as we expand, we may need to hire additional managers. The market for qualified employees in the industry and in the regions in which we operate, particularly for general managers and sales and service personnel, is highly competitive and may subject us to increased labor costs during periods of low unemployment. The loss of the services of key employees or the inability to attract additional qualified managers could have a material adverse effect on our business, results of operations, financial condition and cash flows. In addition, the lack of qualified management or employees employed by potential acquisition candidates may limit our ability to consummate future acquisitions.
21
The sole voting control of our company is currently held by Sidney B. DeBoer, who may have interests different from our other shareholders. Further, 2.8 million shares of our Class B common stock held by Lithia Holding Company, LLC (“Lithia Holding”) are pledged, with other assets, to secure personal indebtedness of Mr. DeBoer. The failure to repay the indebtedness could result in the sale of such shares and the loss of such control, which may violate agreements with certain manufacturers.
Sidney B. DeBoer, our Founder and Executive Chairman, is the sole managing member of Lithia Holdings, which holds all of the outstanding shares of our Class B common stock. A holder of Class B common stock is entitled to ten votes for each share held, while a holder of Class A common stock is entitled to one vote per share held. On most matters, the Class A and Class B common stock vote together as a single class. As of February 22, 2013, Lithia Holding controlled, and Mr. DeBoer had the authority to vote, approximately 55% of the aggregate number of votes eligible to be cast by shareholders for the election of directors and most other shareholder actions. In addition, Mr. DeBoer may prevent a change in control of our Company and make certain transactions more difficult or impossible. The interest of Mr. DeBoer may not always coincide with our interests as a Company or the interest of other shareholders. Accordingly, Mr. DeBoer could cause us to enter into transactions or agreement that other shareholders would not approve of or make decisions with which other shareholders may disagree.
Lithia Holding has pledged 2.8 million shares of our Class B common stock, together with other personal assets of Mr. DeBoer, to secure a personal loan to Mr. DeBoer from U.S. Bank National Association. If he is unable to repay the loan, the bank could foreclose on the Class B common stock, which would result in the automatic conversion of such shares to Class A common stock and a change in control of our Company. If this change is not consented to by the manufacturers, we would have a technical violation under most of the dealer sales and service agreements held by us. In addition, the market price of our Class A common stock could decline materially if the bank foreclosed on such pledged stock and subsequently sold such stock in the open market.
Risks related to investing in our Class A common stock
Future sales of our Class A common stock in the public market could adversely impact the market price of our Class A common stock.
As of February 22, 2013, we had 2,183,114 shares of Class A common stock reserved for issuance under our equity plans (including our employee stock purchase plan). As of February 22, 2013, a total of 583,463 shares related to outstanding restricted stock, restricted stock units and options (with the options having a weighted average exercise price of $6.27 per share and options to purchase 250,499 shares being exercisable). In addition, we had 2,762,261 shares of Class B common stock outstanding convertible into 2,762,261 shares of Class A common stock.
In the future, we may issue additional shares of our Class A common stock to raise capital or effect acquisitions. We cannot predict the size of future sales or issuance or the effect, if any, they may have on the market price of our Class A common stock. The sale of substantial amounts of Class A common stock, or the perception that such sales may occur, could adversely affect the market price of our Class A common stock and impair our ability to raise capital through the sale of additional equity securities, or to sell equity at a price acceptable to us.
22
Volatility in the market price and trading volume of our Class A common stock could adversely impact the value of the shares of our Class A common stock.
The stock market in recent years has experienced significant price and volume fluctuations that have often been unrelated or disproportionate to the operating performance of companies like ours. These broad market factors may materially reduce the market price of our Class A common stock, regardless of our operating performance. The market price of our Class A common stock, which has experienced large price and volume fluctuations over the last five years, could continue to fluctuate significantly for many reasons, including in response to the risks described herein or for reasons unrelated to our operations, such as:
|
●
|
reports by industry analysts;
|
|
●
|
changes in financial estimates by securities analysts or us, or our inability to meet or exceed securities analysts’, investors’ or our own estimates or expectations;
|
|
●
|
actual or anticipated sales of common stock by existing shareholders;
|
|
●
|
capital commitments;
|
|
●
|
additions or departures of key personnel;
|
|
●
|
developments in our business or in our industry;
|
|
●
|
a prolonged downturn in our industry;
|
|
●
|
general market conditions, such as interest or foreign exchange rates, commodity and equity prices, availability of credit, asset valuations and volatility;
|
|
●
|
changes in global financial and economic markets;
|
|
●
|
armed conflict, war or terrorism;
|
|
●
|
regulatory changes affecting our industry generally or our business and operations in particular;
|
|
●
|
changes in market valuations of other companies in our industry;
|
|
●
|
the operating and securities price performance of companies that investors consider to be comparable to us; and
|
|
●
|
announcements of strategic developments, acquisitions and other material events by us, our competitors or our suppliers.
|
Oregon law and our Restated Articles of Incorporation may impede or discourage a takeover, which could impair the market price of our Class A common stock.
We are an Oregon corporation, and certain provisions of Oregon law and our Restated Articles of Incorporation may have anti-takeover effects. These provisions could delay, defer or prevent a tender offer or takeover attempt that a shareholder might consider to be in his or her best interest. These provisions may also affect attempts that might result in a premium over the market price for the shares held by shareholders, and may make removal of the incumbent management and directors more difficult, which, under certain circumstances, could reduce the market price of our Class A common stock.
Our issuance of preferred stock could adversely affect holders of Class A common stock.
Our Board of Directors is authorized to issue a series of preferred stock without any action on the part of our holders of Class A common stock. Our Board of Directors also has the power, without shareholder approval, to set the terms of any such series of preferred stock that may be issued, including voting powers, preferences over our Class A common stock with respect to dividends or if we voluntarily or involuntarily dissolve or distribute our assets, and other terms. If we issue preferred stock in the future that has preference over our Class A common stock with respect to the payment of dividends or upon our liquidation, dissolution or winding up, or if we issue preferred stock with voting rights that dilute the voting power of our Class A common stock, the rights of holders of our Class A common stock or the price of our Class A common stock could be adversely affected.
Our business is seasonal, and events occurring during seasons in which revenues are typically higher may disproportionately affect our results of operations and financial condition.
Historically, our sales have been lower during the first and fourth quarters of each year due to consumer purchasing patterns during the holiday season, inclement weather in certain of our markets and the reduced number of business days during the holiday season. If conditions occur during the second or third quarters that weaken automotive sales, such as severe weather in the geographic areas in which our dealerships operate, war, high fuel costs, depressed economic conditions including unemployment or weakened consumer confidence or similar adverse conditions, our revenues for the year may be disproportionately adversely affected.
None.
23
Our stores and other facilities consist primarily of automobile showrooms, display lots, service facilities, collision repair and paint shops, supply facilities, automobile storage lots, parking lots and offices located in the states listed under the caption
Overview
in Item 1. We believe our facilities are currently adequate for our needs and are in good repair. Some of our facilities do not currently meet manufacturer image or size requirements and we are actively working to find a mutually acceptable outcome in terms of timing and overall cost. We own certain properties, but also lease certain properties, providing future flexibility to relocate our retail stores as demographics, economics, traffic patterns or sales methods change. Most leases provide us the option to renew the lease for one or more lease extension periods. We also hold certain vacant dealerships and undeveloped land for future expansion.
We are party to numerous legal proceedings arising in the normal course of our business. While we cannot predict with certainty the outcomes of these matters, we do not anticipate that the resolution of legal proceedings arising in the normal course of business or the proceedings described below will have a material adverse effect on our business, results of operations, financial condition, or cash flows.
Alaska Consumer Protection Act Claims
In December 2006, a suit was filed against us (Jackie Neese, et al vs. Lithia Chrysler Jeep of Anchorage, Inc, et al, Case No. 3AN-06-13341 CI, and in April, 2007, a second case (Jackie Neese, et al vs. Lithia Chrysler Jeep of Anchorage, Inc, et al, Case No. 3AN-06-4815 CI) (now consolidated)), in the Superior Court for the State of Alaska, Third Judicial District at Anchorage. In the suits, plaintiffs alleged that we, through our Alaska dealerships, engaged in three practices that purportedly violate Alaska consumer protection laws: (i) charging customers dealer fees and costs (including document preparation fees) not disclosed in the advertised price, (ii) failing to disclose the acquisition, mechanical and accident history of used vehicles or whether the vehicles were originally manufactured for sale in a foreign country, and (iii) engaging in deception, misrepresentation and fraud by providing to customers financing from third parties without disclosing that we receive a fee or discount for placing that loan (a “dealer reserve”). The suit seeks statutory damages of $500 for each violation (or three times plaintiff’s actual damages, whichever is greater), and attorney fees and costs and the plaintiffs sought class action certification. Before and during the pendency of these suits, we engaged in settlement discussions with the State of Alaska through its Office of Attorney General with respect to the first two practices enumerated above. As a result of those discussions, we entered into a Consent Judgment subject to court approval and permitted potential class members to “opt-out” of the proposed settlement. Counsel for the plaintiffs attempted to intervene and, after various motions, hearings and an appeal to the state Court of Appeals, the Consent Judgment became final.
Plaintiffs then filed a motion in November 2010 seeking certification of a class (i) for the 339 customers who “opted-out” of the state settlement, (ii) for those customers who did not qualify for recovery under the Consent Judgment but were allegedly eligible for recovery under the plaintiffs’ broader interpretation of the applicable statutes, and (iii) arguing that since the State’s suit against our dealerships did not address the loan fee/discount (dealer reserve) claim, for those customers who arranged their vehicle financing through us. On June 14, 2011, the Trial Court granted plaintiffs’ motion to certify a class without addressing either the merits of the claims or the size of the classes. Discovery in this case is ongoing. We intend to defend the claims vigorously and do not believe the novel “dealer reserve” claim has merit.
The ultimate resolution of these matters cannot be predicted with certainty, and an unfavorable resolution of any of the matters could have a material adverse effect on our results of operations, financial condition or cash flows.
24
Not applicable.
Item 5.
Market for Registrant’s Common Equity, Related Stockholder Matters and Issuer Purchases of Equity Securities
Stock Prices and Dividends
Our Class A common stock trades on the New York Stock Exchange under the symbol LAD.
The following table presents the high and low sale prices for our Class A common stock, as reported on the New York Stock Exchange Composite Tape for each of the quarters in 2011 and 2012:
|
2011
|
High
|
Low
|
||||||
|
First quarter
|
$ | 16.07 | $ | 13.28 | ||||
|
Second quarter
|
20.31 | 14.12 | ||||||
|
Third quarter
|
23.84 | 13.80 | ||||||
|
Fourth quarter
|
24.85 | 13.57 | ||||||
|
2012
|
||||||||
|
First quarter
|
$ | 27.51 | $ | 20.62 | ||||
|
Second quarter
|
27.99 | 21.45 | ||||||
| Third quarter | 34.00 | 22.08 | ||||||
| Fourth quarter | 37.80 | 31.60 | ||||||
The number of shareholders of record and approximate number of beneficial holders of Class A common stock as of February 22, 2013 was 861 and 14,072, respectively. All shares of Lithia’s Class B common stock are held by Lithia Holding Company, LLC.
Dividends declared on our Class A and Class B common stock during 2010, 2011 and 2012 were as follows:
|
Quarter declared:
|
Dividend
amount per
share
|
Total amount of
dividend (in
thousands)
|
||||||
|
2010
|
||||||||
|
First quarter
|
$ | - | $ | - | ||||
|
Second quarter
|
0.05 | 1,300 | ||||||
|
Third quarter
|
0.05 | 1,307 | ||||||
|
Fourth quarter
|
0.05 | 1,312 | ||||||
|
2011
|
||||||||
|
First quarter
|
$ | 0.05 | $ | 1,316 | ||||
|
Second quarter
|
0.07 | 1,851 | ||||||
|
Third quarter
|
0.07 | 1,838 | ||||||
|
Fourth quarter
|
0.07 | 1,817 | ||||||
|
2012
|
||||||||
|
First quarter
|
$ | 0.07 | $ | 1,815 | ||||
|
Second quarter
|
0.10 | 2,583 | ||||||
|
Third quarter
|
0.10 | 2,545 | ||||||
|
Fourth quarter
(1)
|
0.20 | 5,123 | ||||||
|
(1)
|
In November 2012, we paid dividends of $2.5 million that had been declared in October 2012. An additional dividend payment of $2.6 million was declared and paid in December 2012 in lieu of the dividend typically declared and paid in March of the following year.
|
25
Repurchases of Class A Common Stock
We repurchased the following shares of our Class A common stock during the fourth quarter of 2012:
|
Total number of shares purchased
|
Average price paid per share
|
Total number of shares purchased as part of publicly announced plans or programs
(1)
|
Maximum number of shares that may yet be purchased under the plans or programs
(1)
|
|||||||||||||
|
October 1 to October 31
|
- | $ | - | - | 1,879,853 | |||||||||||
|
November 1 to November 30
|
70,819 | 34.28 | 25,000 | 1,854,853 | ||||||||||||
|
December 1 to December 31
|
6,695 | 36.64 | - | 1,854,853 | ||||||||||||
|
Total
|
77,514 | (2) | 34.48 | 25,000 | 1,854,853 | |||||||||||
|
(1)
|
In August 2011, our Board of Directors authorized the repurchase of up to 2,000,000 shares of our Class A common stock. On July 20, 2012, our Board of Directors authorized the repurchase of 1,000,000 additional shares of our Class A common stock. Through December 31, 2012, we had purchased 1,145,147 shares under these programs at an average price of $22.33 per share. These plans do not have an expiration date and we may continue to repurchase shares from time to time as conditions warrant.
|
|
(2)
|
Includes 52,514 shares repurchased in association with tax withholdings on the exercise of stock options.
|
Equity Compensation Plan Information
Information regarding securities authorized for issuance under equity compensation plans is included in Item 12.
Stock Performance Graph
The following line-graph shows the annual percentage change in the cumulative total returns for the past five years on an assumed $100 initial investment and reinvestment of dividends, on (a) Lithia Motors, Inc.’s Class A common stock; (b) the Russell 2000; and (c) an auto peer group index composed of Penske Automotive Group, AutoNation, Sonic Automotive, Group 1 Automotive and Asbury Automotive Group, the only other comparable publicly traded automobile dealerships in the United States as of December 31, 2012. The peer group index utilizes the same methods of presentation and assumptions for the total return calculation as does Lithia Motors and the Russell 2000. All companies in the peer group index are weighted in accordance with their market capitalizations.
26
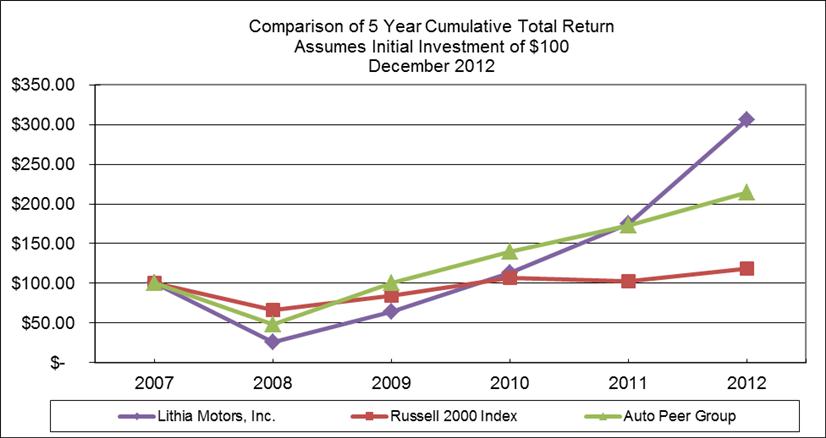
|
Base
Period
|
Indexed Returns for the Year Ended
|
|||||||||||||||||||||||
|
Company/Index
|
12/31/2007
|
12/31/2008
|
12/31/2009
|
12/31/2010
|
12/31/2011
|
12/31/2012
|
||||||||||||||||||
|
Lithia Motors, Inc.
|
$ | 100.00 | $ | 25.37 | $ | 63.97 | $ | 113.07 | $ | 175.43 | $ | 305.85 | ||||||||||||
|
Auto Peer Group
|
100.00 | 48.43 | 100.20 | 139.53 | 172.62 | 214.74 | ||||||||||||||||||
|
Russell 2000
|
100.00 | 66.20 | 84.20 | 106.81 | 102.33 | 119.05 | ||||||||||||||||||
27
You should read the Selected Financial Data in conjunction with Item 7. “Management’s Discussion and Analysis of Financial Condition and Results of Operations,” our Consolidated Financial Statements and Notes thereto and other financial information contained elsewhere in this Annual Report on Form 10-K. The results of operations for stores classified as discontinued operations have been presented on a comparable basis for all periods presented.
|
(In thousands, except per share amounts)
|
Year Ended December 31,
|
|||||||||||||||||||
|
Consolidated Statements of Operations Data:
|
2012
|
2011
|
2010
|
2009
|
2008
|
|||||||||||||||
|
Revenues:
|
||||||||||||||||||||
|
New vehicle
|
$ | 1,847,603 | $ | 1,391,375 | $ | 1,020,883 | $ | 844,294 | $ | 1,113,477 | ||||||||||
|
Used vehicle retail
|
833,484 | 678,571 | 558,105 | 455,633 | 443,825 | |||||||||||||||
|
Used vehicle wholesale
|
139,237 | 128,329 | 103,817 | 69,845 | 91,263 | |||||||||||||||
|
Finance and insurance
|
112,234 | 84,130 | 64,217 | 53,898 | 74,173 | |||||||||||||||
|
Service, body and parts
|
347,703 | 315,958 | 277,945 | 271,726 | 283,751 | |||||||||||||||
|
Fleet and other
|
36,226 | 34,383 | 11,655 | 2,457 | 4,829 | |||||||||||||||
|
Total revenues
|
$ | 3,316,487 | $ | 2,632,746 | $ | 2,036,622 | $ | 1,697,853 | $ | 2,011,318 | ||||||||||
|
Gross Profit:
|
||||||||||||||||||||
|
New vehicle
|
$ | 134,447 | $ | 107,150 | $ | 83,646 | $ | 70,971 | $ | 87,646 | ||||||||||
|
Used vehicle retail
|
121,721 | 98,214 | 78,795 | 64,167 | 51,138 | |||||||||||||||
|
Used vehicle wholesale
|
1,414 | 597 | 703 | 507 | (2,961 | ) | ||||||||||||||
|
Finance and insurance
|
112,234 | 84,130 | 64,217 | 53,898 | 74,173 | |||||||||||||||
|
Service, body and parts
|
168,070 | 152,220 | 133,942 | 129,242 | 135,487 | |||||||||||||||
|
Fleet and other
|
1,414 | 2,973 | 1,643 | 1,232 | 1,534 | |||||||||||||||
|
Total gross profit
|
$ | 539,300 | $ | 445,284 | $ | 362,946 | $ | 320,017 | $ | 347,017 | ||||||||||
|
Operating income (loss)
(1)
|
$ | 148,369 | $ | 110,818 | $ | 46,470 | $ | 34,517 | $ | (291,415 | ) | |||||||||
|
Income (loss) from continuing operations before income taxes
(1)
|
$ | 128,457 | $ | 88,270 | $ | 22,212 | $ | 11,578 | $ | (322,182 | ) | |||||||||
|
Income (loss) from continuing operations
(1)
|
$ | 79,395 | $ | 55,210 | $ | 13,587 | $ | 6,606 | $ | (218,420 | ) | |||||||||
|
Basic income (loss) per share from continuing operations
|
$ | 3.09 | $ | 2.10 | $ | 0.52 | $ | 0.30 | $ | (10.82 | ) | |||||||||
|
Basic income (loss) per share from discontinued operations
|
0.04 | 0.14 | 0.01 | 0.12 | (1.69 | ) | ||||||||||||||
|
Basic net income (loss) per share
|
$ | 3.13 | $ | 2.24 | $ | 0.53 | $ | 0.42 | $ | (12.51 | ) | |||||||||
|
Shares used in basic per share
|
25,696 | 26,230 | 26,062 | 22,037 | 20,195 | |||||||||||||||
|
Diluted income (loss) per share from continuing operations
|
$ | 3.03 | $ | 2.07 | $ | 0.52 | $ | 0.30 | $ | (10.82 | ) | |||||||||
|
Diluted income (loss) per share from discontinued operations
|
0.04 | 0.14 | 0.00 | 0.11 | (1.69 | ) | ||||||||||||||
|
Diluted net income (loss) per share
|
$ | 3.07 | $ | 2.21 | $ | 0.52 | $ | 0.41 | $ | (12.51 | ) | |||||||||
|
Shares used in diluted per share
|
26,170 | 26,664 | 26,729 | 22,176 | 20,195 | |||||||||||||||
|
Cash dividends declared per common share
|
$ | 0.47 | $ | 0.26 | $ | 0.15 | $ | - | $ | 0.47 | ||||||||||
|
(In thousands)
|
As of December 31,
|
|||||||||||||||||||
|
Consolidated Balance Sheets Data:
|
2012
|
2011
|
2010
|
2009
|
2008
|
|||||||||||||||
|
Working capital
|
$ | 211,905 | $ | 191,607 | $ | 162,675 | $ | 96,886 | $ | 99,524 | ||||||||||
|
Inventories
|
723,326 | 506,484 | 415,228 | 333,628 | 428,032 | |||||||||||||||
|
Total assets
|
1,492,702 | 1,146,133 | 971,676 | 895,100 | 1,133,459 | |||||||||||||||
|
Floor plan notes payable
|
581,584 | 343,940 | 251,257 | 216,082 | 343,290 | |||||||||||||||
|
Long-term debt, including current maturities
|
295,058 | 286,874 | 280,774 | 265,773 | 338,229 | |||||||||||||||
|
Total stockholders’ equity
|
428,101 | 367,121 | 320,217 | 307,038 | 248,343 | |||||||||||||||
|
(1)
|
Includes $0.1 million, $1.4 million, $15.3 million, $7.9 million and $330.3 million of non-cash charges related to asset impairments and terminated construction projects for the years ended 2012, 2011, 2010, 2009 and 2008, respectively. See Notes 1 and 4 of Notes to Consolidated Financial Statements for additional information.
|
28
You should read the following discussion in conjunction with Item 1. “Business,” Item 1A. “Risk Factors” and our Consolidated Financial Statements and Notes thereto.
Overview
As discussed in Overview in Item 1, “Business” above, we are a leading operator of automotive franchises and retailer of new and used vehicles and services. As of February 22, 2013, we offered 27 brands of new vehicles and all brands of used vehicles in 87 stores in the United States and online at
Lithia.com
. We sell new and used cars and trucks and replacement parts; provide vehicle maintenance, warranty, paint and repair services; and arrange related financing, service contracts, protection products and credit insurance.
We continue to believe that the fragmented nature of the automotive dealership sector provides us with the opportunity to achieve growth through consolidation. We seek exclusive franchises for acquisition and target mid-sized and regional markets for domestic and import franchises and metropolitan markets for luxury franchises. We have completed over 100 acquisitions since our initial public offering in 1996. Our acquisition strategy has been to acquire dealerships at prices that meet our internal investment targets and, through the application of our centralized operating structure, leverage costs and improve store profitability. We believe the current economic environment provides us with attractive acquisition opportunities.
We also believe that we can continue to improve operations at our existing stores. By promoting entrepreneurial leadership within our general managers and department managers, we strive for continual improvement to drive sales and capture market share in our local markets. Our goal is to retail an average of 75 used vehicles per store per month and we believe we can make additional improvements in our used vehicle sales performance by offering lower-priced value vehicles and selling brands other than the new vehicle franchise at each location. Our service, body and parts operations provide important repeat business for our stores. We continue to grow this business through increased marketing efforts, competitive pricing on routine maintenance items and diverse commodity product offerings. In 2012, we continued to experience organic growth through increasing market share and maintaining a lean cost structure.
We believe our cost structure is aligned with current industry sales levels and positioned to be leveraged if vehicle sales levels continue to improve. We target selling, general and administrative (“SG&A”) expense as a percentage of gross profit in the high 60% range as vehicle sales improve. As we focus on maintaining discipline in controlling costs, we continue to target retaining, on a same store pre-tax basis, 50% of each incremental gross profit dollar after deducting SG&A expense.
Critical Accounting Policies and Estimates
The preparation of financial statements in conformity with U.S. generally accepted accounting principles requires us to make certain estimates, judgments and assumptions that affect the reported amounts of assets and liabilities, the disclosure of contingent assets and liabilities and reported amounts of revenues and expenses at the date of the financial statements. Certain accounting policies require us to make difficult and subjective judgments on matters that are inherently uncertain. The following accounting policies involve critical accounting estimates because they are particularly dependent on assumptions made by management. While we have made our best estimates based on facts and circumstances available to us at the time, different estimates could have been used in the current period. Changes in the accounting estimates we used are reasonably likely to occur from period to period, which may have a material impact on the presentation of our financial condition and results of operations.
29
Our most critical accounting estimates include those related to goodwill and franchise value, long-lived assets, deferred tax assets, service contracts and other insurance contracts, and lifetime oil change and self-insurance programs. We also have other key accounting policies for valuation of accounts receivable, expense accruals and revenue recognition. However, these policies either do not meet the definition of critical accounting estimates described above or are not currently material items in our financial statements. We review our estimates, judgments and assumptions periodically and reflect the effects of revisions in the period that they are deemed to be necessary. We believe that these estimates are reasonable. However, actual results could differ materially from these estimates.
Goodwill and Franchise Value
We are required to test our goodwill and franchise value for impairment at least annually, or more frequently if conditions indicate that an impairment may have occurred. We have determined that we operate as one reporting unit for evaluating goodwill. We have the option to qualitatively or quantitatively assess goodwill for impairment and, in 2012, evaluated our goodwill using a quantitative assessment process. We test goodwill for impairment using the Adjusted Present Value method (“APV”) to estimate the fair value of our reporting unit. Under the APV method, future cash flows are based on recently prepared budget forecasts and business plans and are used to estimate the future economic benefits that the reporting unit will generate. An estimate of the appropriate discount rate is utilized to convert the future economic benefits to their present value equivalent.
The quantitative goodwill impairment test is a two-step process. The first step identifies potential impairments by comparing the calculated fair value of a reporting unit with its book value. If the fair value of the reporting unit exceeds the carrying amount, goodwill is not impaired and the second step is not necessary. If the carrying value exceeds the fair value, the second step includes determining the implied fair value through further market research. The implied fair value of goodwill is then compared with the carrying amount to determine if an impairment loss should be recorded.
As of December 31, 2012, we had $32.0 million of goodwill on our balance sheet. The first step of our annual goodwill impairment analysis, which we perform as of October 1 of each year, did not result in an indication of impairment in 2012, 2011 or 2010. The fair value of the reporting unit as of December 31, 2012, using the APV method, was 109% greater than the carrying value at December 31, 2012.
We have determined the appropriate unit of accounting for testing franchise rights for impairment is on an individual store basis. We have the option to early adopt an amendment that allows us to qualitatively assess indefinite-lived intangible assets for impairment. In 2012, we evaluated our indefinite-lived intangible assets using a quantitative assessment process. We estimate the fair value of our franchise rights primarily using the Multi-Period Excess Earnings (“MPEE”) model. The forecasted cash flows used in the MPEE model contain inherent uncertainties, including significant estimates and assumptions related to growth rates, margins, general operating expenses, and cost of capital. We use primarily internally-developed forecasts and business plans to estimate the future cash flows that each franchise will generate. We have determined that only certain cash flows of the store are directly attributable to the franchise rights. We estimate the appropriate interest rate to discount future cash flows to their present value equivalent taking into consideration factors such as a risk-free rate, a peer group average beta, an equity risk premium and a small stock risk premium.
We also may use a market approach to determine the fair value of our franchise rights. These market data points include our acquisition and divestiture experience and third-party broker estimates.
As of December 31, 2012, we had $62.4 million of franchise value on our balance sheet. Our impairment testing of franchise value did not indicate any impairment in 2012, 2011 or 2010.
We are subject to financial statement risk to the extent that our goodwill or franchise rights become impaired due to decreases in the fair value. A future decline in performance, decreases in projected growth rates or margin assumptions or changes in discount rates could result in a potential impairment, which could have a material adverse impact on our financial position and results of operations. Furthermore, in the event that a manufacturer is unable to remain solvent, we may be required to record a partial or total impairment on the remaining franchise value related to that manufacturer.
30
See Notes 1 and 5 of Notes to Consolidated Financial Statements for additional information.
Long-Lived Assets
We estimate the depreciable lives of our property and equipment, including leasehold improvements, and review them for impairment when events or circumstances indicate that their carrying amounts may not be recoverable.
We determine a triggering event has occurred by reviewing store forecasted and historical financial performance. A store is evaluated for recoverability if it has an operating loss in the current year and two of the prior three years. Additionally, we may judgmentally evaluate a store if its financial performance indicates it may not support the carrying amount of the long-lived assets. If a store meets these criteria, we estimate the projected undiscounted cash flows for each asset group based on internally developed forecasts. If the undiscounted cash flows are lower than the carrying value of the asset group, we determine the fair value of the asset group based on additional market data, including recent experience in selling similar assets.
We hold certain property for future development or investment purposes. If a triggering event is deemed to have occurred, we evaluate the property for impairment by comparing its estimated fair value based on listing price less costs to sell and other market data, including similar property that is for sale or has been recently sold, to the current carrying value. If the carrying value is more than the estimated fair value, an impairment is recorded.
Although we believe our property and equipment and assets held and used are appropriately valued, the assumptions and estimates used may change and we may be required to record impairment charges to reduce the value of these assets. A future decline in store performance, decrease in projected growth rates or changes in other operating assumptions could result in an impairment of long-lived asset groups, which could have a material adverse impact on our financial position and results of operations.
Due to the adverse change in the business climate and the commercial real estate market, we performed impairment testing on long-lived assets, mainly related to certain property held for future development or investment purposes in 2012, 2011 and 2010. As a result, we recorded impairments related to long-lived assets of $0.1 million, $1.4 million and $15.3 million in 2012, 2011 and 2010, respectively.
See Notes 1 and 4 of Notes to Consolidated Financial Statements for additional information.
Deferred Tax Assets
As of December 31, 2012, we had deferred tax assets of approximately $61.1 million and deferred tax liabilities of $28.5 million. The principal components of our deferred tax assets are related to goodwill, allowances and accruals, capital loss carryforwards, deferred revenue and cancellation reserves. The principal components of our deferred tax liabilities are related to depreciation on property and equipment and inventories.
We consider whether it is more likely than not that some portion or all of the deferred tax assets will not be realized. The ultimate realization of deferred tax assets is dependent upon future taxable income during the periods in which those temporary differences become deductible. We consider the scheduled reversal of deferred tax liabilities (including the impact of available carryback and carryforward periods), projected future taxable income, and tax-planning strategies in making this assessment.
31
Based upon the scheduled reversal of deferred tax liabilities, and our projections of future taxable income over the periods in which the deferred tax assets are deductible, we believe it is more likely than not that we will realize the benefits of the unreserved deductible differences.
As of December 31, 2012, we had an $11.6 million valuation allowance against our deferred tax assets. This valuation allowance was associated with losses from the sale of corporate entities. As these amounts are characterized as capital losses, we evaluated the availability of projected capital gains and determined that it would be unlikely these amounts would be fully utilized. If we are unable to meet the projected taxable income levels utilized in our analysis, and depending on the availability of feasible tax planning strategies, we might record an additional valuation allowance on a portion or all of our deferred tax assets in the future. In the event that a manufacturer is unable to remain solvent, our operations may be impacted and we might record a valuation allowance on a portion or all of the deferred tax assets, which could have a material adverse impact on our financial position and results of operations.
Service Contracts and Other Insurance Contracts
We receive commissions from the sale of vehicle service contracts and certain other insurance contracts. The contracts are sold through unrelated third parties, but we may be charged back for a portion of the commissions in the event of early termination of the contracts by customers. We sell these contracts on a straight commission basis; in addition, we may also participate in future underwriting profit pursuant to retrospective commission arrangements, which are recognized as income upon receipt.
We record commissions at the time of sale of the vehicles, net of an estimated liability for future charge-backs. We have established a reserve for estimated future charge-backs based on an analysis of historical charge-backs in conjunction with estimated lives of the applicable contracts. If future cancellations are different than expected, we could have additional expense related to the cancellations in future periods, which could have a material adverse impact on our financial position and results of operations.
At December 31, 2012 and 2011, the reserve for future cancellations totaled $13.5 million and $10.4 million, respectively, and is included in accrued liabilities and other long-term liabilities on our Consolidated Balance Sheets. A 10% increase in expected cancellations would result in an additional reserve of approximately $1.3 million.
Lifetime Oil Change Self-Insurance
In March 2009, we assumed from a third party the obligation to provide future lifetime oil service for a pool of existing contracts and began to self-insure the majority of the lifetime oil contracts we sell.
Payments we receive upon sale of the lifetime oil contracts are deferred and recognized in revenue over the expected life of the service agreement to best match the expected timing of the costs to be incurred to perform the service. We estimate the timing and amount of future costs for claims and cancellations related to our lifetime oil contracts using historical experience rates and estimated future costs.
If our estimates of future costs to perform under the contracts exceed the existing deferred revenue, we record a charge in the Consolidated Statements of Operations. We perform our loss contingency analysis separately for the pool of assumed contracts and the pool of self-insured contracts sold starting in March 2009. We recorded a charge of $1.0 million in both 2011 and 2010 for expected costs in excess of revenue deferred related to the pool of assumed contracts. We did not record an additional charge in 2012. The analysis on our self-insured sold contracts did not indicate a loss reserve was needed in 2012, 2011 and 2010.
32
We believe the new vehicle purchase cycle has been delayed for many buyers. If the ownership cycle does not accelerate towards pre-recession levels, our estimate of the number of oil changes to be performed over a vehicle’s life may increase, which would adversely affect our financial position and results of operations. In addition, other changes in assumptions about future costs expected to be incurred to service contracts could result in the recognition of additional charges, which could have a material adverse impact on our financial position and results of operations.
A 10% change in expected claims costs per contract for the assumed pool of contracts would result in an additional reserve of approximately $0.7 million. A 10% change in expected claims per contract for the self-insured sold contracts would not require any additional reserve. At December 31, 2012, the remaining deferred revenue related to the assumed obligation and the self-insured sold contracts was $4.0 million and $33.9 million, respectively.
Self Insurance Programs
We self-insure a portion of our property and casualty insurance, medical insurance and workers’ compensation insurance. Third-parties are engaged to estimate the loss exposure related to the self-retained portion of the risk associated with these insurances. Additionally, we analyze our historical loss and claims experience to estimate the loss exposure associated with these programs. Any changes in assumptions or claims experience could result in the recognition of additional charges, which could have a material adverse impact on our financial position and results of operations.
At December 31, 2012 and 2011, the total reserve associated with these programs was $12.4 million and $10.4 million, respectively, and is included in accrued liabilities and other long-term liabilities on our Consolidated Balance Sheets. A 10% increase in claims experience would result in an additional reserve of approximately $4.5 million.
Results of Continuing Operations
For the year ended December 31, 2012, we reported income from continuing operations, net of tax, of $79.4 million, or $3.03 per diluted share. For the years ended December 31, 2011 and 2010, we reported income from continuing operations, net of tax, of $55.2 million, or $2.07 per diluted share, and $13.6 million, or $0.52 per diluted share, respectively.
Discontinued Operations
Results for sold or closed stores, qualifying for reclassification under the applicable accounting guidance, have their results presented as discontinued operations in our Consolidated Statements of Operations. As a result, our results from continuing operations are presented on a comparable basis for all periods. Within discontinued operations, we realized a gain, net of tax, of $1.0 million, $3.7 million and $0.1 million for the years ended December 31, 2012, 2011 and 2010, respectively. See Notes 1 and 16 of Notes to Consolidated Financial Statements for additional information.
33
Key Performance Metrics
Certain key performance metrics for revenue and gross profit were as follows for 2012, 2011 and 2010 (dollars in thousands):
|
2012
|
Revenues
|
Percent of
Total Revenues
|
Gross
Profit
|
Gross Profit
Margin
|
Percent of Total
Gross Profit
|
|||||||||||||||
|
New vehicle
|
$ | 1,847,603 | 55.7 | % | $ | 134,447 | 7.3 | % | 24.9 | % | ||||||||||
|
Used vehicle, retail
|
833,484 | 25.1 | 121,721 | 14.6 | 22.6 | |||||||||||||||
|
Used vehicle, wholesale
|
139,237 | 4.2 | 1,414 | 1.0 | 0.3 | |||||||||||||||
|
Finance and insurance
(1)
|
112,234 | 3.4 | 112,234 | 100.0 | 20.8 | |||||||||||||||
|
Service, body and parts
|
347,703 | 10.5 | 168,070 | 48.3 | 31.1 | |||||||||||||||
|
Fleet and other
|
36,226 | 1.1 | 1,414 | 3.9 | 0.3 | |||||||||||||||
| $ | 3,316,487 | 100.0 | % | $ | 539,300 | 16.3 | % | 100.0 | % | |||||||||||
|
2011
|
Revenues
|
Percent of
Total Revenues
|
Gross
Profit
|
Gross Profit
Margin
|
Percent of Total
Gross Profit
|
|||||||||||||||
|
New vehicle
|
$ | 1,391,375 | 52.8 | % | $ | 107,150 | 7.7 | % | 24.1 | % | ||||||||||
|
Used vehicle, retail
|
678,571 | 25.8 | 98,214 | 14.5 | 22.1 | |||||||||||||||
|
Used vehicle, wholesale
|
128,329 | 4.9 | 597 | 0.5 | 0.1 | |||||||||||||||
|
Finance and insurance
(1)
|
84,130 | 3.2 | 84,130 | 100.0 | 18.9 | |||||||||||||||
|
Service, body and parts
|
315,958 | 12.0 | 152,220 | 48.2 | 34.2 | |||||||||||||||
|
Fleet and other
|
34,383 | 1.3 | 2,973 | 8.6 | 0.6 | |||||||||||||||
| $ | 2,632,746 | 100.0 | % | $ | 445,284 | 16.9 | % | 100.0 | % | |||||||||||
|
2010
|
Revenues
|
Percent of
Total Revenues
|
Gross
Profit
|
Gross Profit
Margin
|
Percent of Total
Gross Profit
|
|||||||||||||||
|
New vehicle
|
$ | 1,020,883 | 50.1 | % | $ | 83,646 | 8.2 | % | 23.0 | % | ||||||||||
|
Used vehicle, retail
|
558,105 | 27.4 | 78,795 | 14.1 | 21.7 | |||||||||||||||
|
Used vehicle, wholesale
|
103,817 | 5.1 | 703 | 0.7 | 0.2 | |||||||||||||||
|
Finance and insurance
(1)
|
64,217 | 3.2 | 64,217 | 100.0 | 17.7 | |||||||||||||||
|
Service, body and parts
|
277,945 | 13.6 | 133,942 | 48.2 | 36.9 | |||||||||||||||
|
Fleet and other
|
11,655 | 0.6 | 1,643 | 14.1 | 0.5 | |||||||||||||||
| $ | 2,036,622 | 100.0 | % | $ | 362,946 | 17.8 | % | 100.0 | % | |||||||||||
|
(1)
|
Commissions reported net of anticipated cancellations.
|
Same Store Operating Data
We believe that same store sales are a key indicator of our financial performance. Same store metrics demonstrate our ability to grow our revenue and profitability in our existing locations. As a result, same store sales have been integrated into the discussion below.
A same store metric represents stores that were operating during 2012, and only includes the months when operations occur in both comparable periods. For example, a store acquired in August 2011 would be included in same store operating data beginning in September 2012, after its first full complete comparable month of operation. Thus, operating results for same store comparisons would include only the period of September through December of both comparable years.
34
New Vehicle Revenues
|
Year Ended
December 31,
|
%
|
|||||||||||||||
|
(Dollars in thousands)
|
2012
|
2011
|
Increase
|
Increase
|
||||||||||||
|
Reported
|
||||||||||||||||
|
Revenue
|
$ | 1,847,603 | $ | 1,391,375 | $ | 456,228 | 32.8 | % | ||||||||
|
Retail units sold
|
55,666 | 42,139 | 13,527 | 32.1 | ||||||||||||
|
Average selling price per retail unit
|
$ | 33,191 | $ | 33,019 | $ | 172 | 0.5 | |||||||||
|
Same store
|
||||||||||||||||
|
Revenue
|
$ | 1,776,896 | $ | 1,367,176 | $ | 409,720 | 30.0 | % | ||||||||
|
Retail units sold
|
53,590 | 41,391 | 12,199 | 29.5 | ||||||||||||
|
Average selling price per retail unit
|
$ | 33,157 | $ | 33,031 | $ | 126 | 0.4 | |||||||||
|
Year Ended
December 31,
|
%
|
|||||||||||||||
|
(Dollars in thousands)
|
2011
|
2010
|
Increase
|
Increase
|
||||||||||||
|
Reported
|
||||||||||||||||
|
Revenue
|
$ | 1,391,375 | $ | 1,020,883 | $ | 370,492 | 36.3 | % | ||||||||
|
Retail units sold
|
42,139 | 31,945 | 10,194 | 31.9 | ||||||||||||
|
Average selling price per retail unit
|
$ | 33,019 | $ | 31,958 | $ | 1,061 | 3.3 | |||||||||
|
Same Store
|
||||||||||||||||
|
Revenue
|
$ | 1,295,001 | $ | 1,005,721 | $ | 289,280 | 28.8 | % | ||||||||
|
Retail units sold
|
39,506 | 31,464 | 8,042 | 25.6 | ||||||||||||
|
Average selling price per retail unit
|
$ | 32,780 | $ | 31,964 | $ | 816 | 2.6 | |||||||||
New vehicle sales in 2012 improved compared to 2011 primarily due to volume growth as year-over-year same store sales volume increased 29.5% and 25.6%, respectively, in 2012 and 2011.
The number of new vehicles sold in the U.S. in 2012, defined as the seasonally adjusted annual rate, grew approximately 13.4% over 2011. In addition to the overall market recovery, we have increased our share of vehicle sales in several of our markets. Growth in our domestic and import brand sales have outpaced the growth experienced nationally. Our domestic brand same store sales grew 27.2% in 2012 compared to 2011. Same store sales for import brands grew 38.3% in 2012 compared to 2011. Certain of our markets have seen an increase in local market sales volumes exceeding the national average. We remain focused on increasing our share of overall new vehicle sales within our markets.
New vehicle sales improved throughout 2011 compared to 2010 due to a recovery in the U.S. economy and our efforts to increase our share of the new vehicles sold within each local market. Credit availability continued to improve throughout 2011, although, within the sub-prime market, lending remained constrained.
35
Used Vehicle Retail Revenues
|
Year Ended
December 31,
|
%
|
|||||||||||||||
|
(Dollars in thousands)
|
2012
|
2011
|
Increase
|
Increase
|
||||||||||||
|
Reported
|
||||||||||||||||
|
Retail revenue
|
$ | 833,484 | $ | 678,571 | $ | 154,913 | 22.8 | % | ||||||||
|
Retail units sold
|
47,965 | 39,436 | 8,529 | 21.6 | ||||||||||||
|
Average selling price per retail unit
|
$ | 17,377 | $ | 17,207 | $ | 170 | 1.0 | |||||||||
|
Same store
|
||||||||||||||||
|
Retail revenue
|
$ | 802,169 | $ | 664,292 | $ | 137,877 | 20.8 | % | ||||||||
|
Retail units sold
|
46,179 | 38,628 | 7,551 | 19.5 | ||||||||||||
|
Average selling price per retail unit
|
$ | 17,371 | $ | 17,197 | $ | 174 | 1.0 | |||||||||
|
Year Ended
December 31,
|
%
|
|||||||||||||||
|
(Dollars in thousands)
|
2011
|
2010
|
Increase
|
Increase
|
||||||||||||
|
Reported
|
||||||||||||||||
|
Retail revenue
|
$ | 678,571 | $ | 558,105 | $ | 120,466 | 21.6 | % | ||||||||
|
Retail units sold
|
39,436 | 33,241 | 6,195 | 18.6 | ||||||||||||
|
Average selling price per retail unit
|
$ | 17,207 | $ | 16,790 | $ | 417 | 2.5 | |||||||||
|
Same store
|
||||||||||||||||
|
Retail revenue
|
$ | 633,912 | $ | 543,106 | $ | 90,806 | 16.7 | % | ||||||||
|
Retail units sold
|
37,168 | 32,325 | 4,843 | 15.0 | ||||||||||||
|
Average selling price per retail unit
|
$ | 17,055 | $ | 16,801 | $ | 254 | 1.5 | |||||||||
Used vehicle retail sales continue to be a strategic focus as we strive for organic growth. Our strategy is to offer three categories of used vehicles: manufacturer certified pre-owned used vehicles; late model, lower-mileage vehicles; and value autos, vehicles with over 80,000 miles.
In 2012, sales increased in all three categories of used vehicles compared to 2011.
|
●
|
Same store unit sales for manufacturer certified pre-owned used vehicles increased 22.9%. This category has higher average sale prices and experiences a lower gross margin than the other categories.
|
|
●
|
Same store unit sales for the late model, lower mileage vehicle category increased 11.3%. Our performance in this category is still below management’s expectation and we continue to focus on improving our results.
|
|
●
|
Same store unit sales for the value auto category increased 36.9%. Value auto vehicles have lower average selling prices and experience a higher gross margin than our other used vehicle categories. Additionally, value autos provide an organic opportunity to convert vehicles acquired via trade-in to retail used vehicle sales.
|
Our retail used to new vehicle sales ratio was 0.9:1 for the year ended December 31, 2012 compared to 0.9:1 in 2011 and 1.0:1 in 2010. On average, each of our stores currently sells 46 retail used vehicle units per month and we target increasing sales to 75 units per month.
Used vehicle retail unit sales increased in 2011 compared to 2010 as consumers elected to purchase used vehicles instead of new vehicles, and as we increased the number of lower-price, higher-margin, older used vehicles we sell. We also increased the sale of brands other than the store’s new vehicle franchise. We focused our store personnel on maximizing retail used vehicle sales and reducing the number of used vehicles we wholesale after acquiring them via trade-in.
36
Used Vehicle Wholesale Revenues
|
Year Ended
December 31,
|
Increase
|
%
Increase
|
||||||||||||||
|
(Dollars in thousands)
|
2012
|
2011
|
(Decrease)
|
(Decrease)
|
||||||||||||
|
Reported
|
||||||||||||||||
|
Wholesale revenue
|
$ | 139,237 | $ | 128,329 | $ | 10,908 | 8.5 | % | ||||||||
|
Wholesale units sold
|
19,144 | 16,085 | 3,059 | 19.0 | ||||||||||||
|
Average selling price per wholesale unit
|
$ | 7,273 | $ | 7,978 | $ | (705 | ) | (8.8 | ) | |||||||
|
Same store
|
||||||||||||||||
|
Wholesale revenue
|
$ | 132,722 | $ | 123,046 | $ | 9,676 | 7.9 | % | ||||||||
|
Wholesale units sold
|
18,383 | 15,613 | 2,770 | 17.7 | ||||||||||||
|
Average selling price per wholesale unit
|
$ | 7,220 | $ | 7,881 | $ | (661 | ) | (8.4 | ) | |||||||
|
Year Ended
December 31,
|
%
|
|||||||||||||||
|
(Dollars in thousands)
|
2011
|
2010
|
Increase
|
Increase
|
||||||||||||
|
Reported
|
||||||||||||||||
|
Wholesale revenue
|
$ | 128,329 | $ | 103,817 | $ | 24,512 | 23.6 | % | ||||||||
|
Wholesale units sold
|
16,085 | 13,594 | 2,491 | 18.3 | ||||||||||||
|
Average selling price per wholesale unit
|
$ | 7,978 | $ | 7,637 | $ | 341 | 4.5 | |||||||||
|
Same store
|
||||||||||||||||
|
Wholesale revenue
|
$ | 118,591 | $ | 100,770 | $ | 17,821 | 17.7 | % | ||||||||
|
Wholesale units sold
|
15,171 | 13,239 | 1,932 | 14.6 | ||||||||||||
|
Average selling price per wholesale unit
|
$ | 7,817 | $ | 7,612 | $ | 205 | 2.7 | |||||||||
Wholesale transactions are vehicles we have purchased from customers or vehicles we have attempted to sell via retail that we elect to dispose of due to inventory age or other factors. Wholesale vehicles are typically sold at or near inventory cost and do not comprise a meaningful component of our gross profit. We generated wholesale gross profit of $1.4 million, $0.6 million and $0.7 million in 2012, 2011 and 2010, respectively.
Finance and Insurance
|
Year Ended
December 31,
|
%
|
|||||||||||||||
|
(Dollars in thousands)
|
2012
|
2011
|
Increase
|
Increase
|
||||||||||||
|
Reported
|
||||||||||||||||
|
Revenue
|
$ | 112,234 | $ | 84,130 | $ | 28,104 | 33.4 | % | ||||||||
|
Same store
|
||||||||||||||||
|
Revenue
|
$ | 107,376 | $ | 81,055 | $ | 26,321 | 32.5 | % | ||||||||
37
|
Year Ended
December 31,
|
Increase
|
%
Increase
|
||||||||||||||
|
(Dollars in thousands)
|
2011
|
2010
|
(Decrease)
|
(Decrease)
|
||||||||||||
|
Reported
|
||||||||||||||||
|
Revenue
|
$ | 84,130 | $ | 64,217 | $ | 19,913 | 31.0 | % | ||||||||
|
Same store
|
||||||||||||||||
|
Revenue
|
$ | 78,619 | $ | 60,440 | $ | 18,179 | 30.1 | % | ||||||||
The increases in finance and insurance sales in 2012 compared to 2011 and 2011 compared to 2010 were driven by increased vehicle sales volume. The availability of consumer credit has expanded since 2010 with lenders increasing the loan-to-value amount available to most customers. Additionally, competition continued to increase among lenders and we saw an increase in finance reserves. As a result, we experienced annual improvement in the average amount of revenue per unit. These shifts afforded us the opportunity to sell additional or more comprehensive products, while remaining within a loan-to-value framework acceptable to our retail customer lenders.
Penetration rates for certain products were as follows:
|
2012
|
2011
|
2010
|
||||||||||
|
Finance and insurance
|
76 | % | 72 | % | 68 | % | ||||||
|
Service contracts
|
41 | 41 | 41 | |||||||||
|
Lifetime oil change and filter
|
35 | 36 | 34 | |||||||||
Service, Body and Parts Revenue
|
Year Ended
December 31,
|
Increase
|
%
Increase
|
||||||||||||||
|
(Dollars in thousands)
|
2012
|
2011
|
(Decrease)
|
(Decrease)
|
||||||||||||
|
Reported
|
||||||||||||||||
|
Customer pay
|
$ | 196,077 | $ | 176,879 | $ | 19,198 | 10.9 | % | ||||||||
|
Warranty
|
52,713 | 52,041 | 672 | 1.3 | ||||||||||||
|
Wholesale parts
|
64,139 | 56,826 | 7,313 | 12.9 | ||||||||||||
|
Body shop
|
34,774 | 30,212 | 4,562 | 15.1 | ||||||||||||
|
Total service, body and parts
|
$ | 347,703 | $ | 315,958 | $ | 31,745 | 10.0 | % | ||||||||
|
Same store
|
||||||||||||||||
|
Customer pay
|
$ | 185,047 | $ | 173,074 | $ | 11,973 | 6.9 | % | ||||||||
|
Warranty
|
49,056 | 50,408 | (1,352 | ) | (2.7 | ) | ||||||||||
|
Wholesale parts
|
60,931 | 56,111 | 4,820 | 8.6 | ||||||||||||
|
Body shop
|
34,769 | 30,212 | 4,557 | 15.1 | ||||||||||||
|
Total service, body and parts
|
$ | 329,803 | $ | 309,805 | $ | 19,998 | 6.5 | % | ||||||||
38
|
Year Ended
December 31,
|
Increase
|
%
Increase
|
||||||||||||||
|
(Dollars in thousands)
|
2011
|
2010
|
(Decrease)
|
(Decrease)
|
||||||||||||
|
Reported
|
||||||||||||||||
|
Customer pay
|
$ | 176,879 | $ | 155,569 | $ | 21,310 | 13.7 | % | ||||||||
|
Warranty
|
52,041 | 48,633 | 3,408 | 7.0 | ||||||||||||
|
Wholesale parts
|
56,826 | 47,670 | 9,156 | 19.2 | ||||||||||||
|
Body shop
|
30,212 | 26,073 | 4,139 | 15.9 | ||||||||||||
|
Total service, body and parts
|
$ | 315,958 | $ | 277,945 | $ | 38,013 | 13.7 | % | ||||||||
|
Same store
|
||||||||||||||||
|
Customer pay
|
$ | 158,451 | $ | 152,451 | $ | 6,000 | 3.9 | % | ||||||||
|
Warranty
|
45,411 | 47,397 | (1,986 | ) | (4.2 | ) | ||||||||||
|
Wholesale parts
|
51,894 | 47,072 | 4,822 | 10.2 | ||||||||||||
|
Body shop
|
29,689 | 26,040 | 3,649 | 14.0 | ||||||||||||
|
Total service, body and parts
|
$ | 285,445 | $ | 272,960 | $ | 12,485 | 4.6 | % | ||||||||
Our service, body and parts business improved in 2012 compared to 2011 and in 2011 compared to 2010. Our customer pay business has increased as we maintained our focus on retaining customers through competitively-priced routine maintenance offerings and increased marketing efforts. The same store customer pay service and parts business represented 56.1% and 55.9% of the total same store service, body and parts business in 2012 and 2011, respectively. As a result of our increased focus and marketing efforts, same store customer pay business increased 6.9% in 2012 compared to 2011 and 3.9% in 2011 compared to 2010.
Warranty work accounted for approximately 14.9% of our same store service, body and parts sales in 2012 compared to 16.3% in 2011. In 2012 compared to 2011, same store warranty sales decreased 2.7%. Domestic brand warranty work decreased by 3.7%, while import/luxury warranty work decreased by 1.8% in 2012 compared to 2011. Same store warranty work declined 4.2% in 2011 compared to 2010. Warranty work continues to be impacted by declining units in operation from 2008, 2009 and 2010 and increased vehicle reliability, particularly in domestic brands.
We continued to grow our wholesale parts and body shop sales in 2012, which represented 29.0% of our same store service, body and parts revenue mix in 2012 and grew 10.9% on a same store basis in 2012 compared to 2011. These categories allow for incremental organic growth. Because both wholesale parts and body shop margins are lower than service work, we expect gross margins may modestly decline as these areas of the business comprise a larger portion of the total.
Gross Profit
Gross profit increased $94.0 million in 2012 compared to 2011 and increased $82.3 million in 2011 compared to 2010. The increases in 2012 and 2011 were primarily due to increased revenues, partially offset by declines in our overall gross profit margin.
Our gross profit margins by business line were as follows:
|
Basis
|
||||||||||||
|
Year Ended December 31,
|
Point Change*
|
|||||||||||
|
2012
|
2011
|
|||||||||||
|
New vehicle
|
7.3 | % | 7.7 | % | (40 | )bp | ||||||
|
Retail used vehicle
|
14.6 | 14.5 | 10 | |||||||||
|
Wholesale used vehicle
|
1.0 | 0.5 | 50 | |||||||||
|
Finance and insurance
|
100.0 | 100.0 | - | |||||||||
|
Service, body and parts
|
48.3 | 48.2 | 10 | |||||||||
|
Fleet and other
|
3.9 | 8.6 | (470 | ) | ||||||||
|
Overall
|
16.3 | % | 16.9 | % | (60 | ) | ||||||
39
|
Basis
|
||||||||||||
|
Year Ended December 31,
|
Point Change*
|
|||||||||||
|
2011
|
2010
|
|||||||||||
|
New vehicle
|
7.7 | % | 8.2 | % | (50 | )bp | ||||||
|
Retail used vehicle
|
14.5 | 14.1 | 40 | |||||||||
|
Wholesale used vehicle
|
0.5 | 0.7 | (20 | ) | ||||||||
|
Finance and insurance
|
100.0 | 100.0 | - | |||||||||
|
Service, body and parts
|
48.2 | 48.2 | - | |||||||||
|
Fleet and other
|
8.6 | 14.1 | (550 | ) | ||||||||
|
Overall
|
16.9 | % | 17.8 | % | (90 | ) | ||||||
* A basis point is equal to 1/100
th
of one percent.
Our overall gross profit margin decreased 60 basis points in 2012 compared to 2011. New vehicle margins decreased compared to 2011. This decrease was due to higher gross margins in 2011 as new vehicle supply had been limited due to the earthquake and tsunami in Japan. Additionally, in 2012, to gain market share in certain markets, we priced vehicles lower, negatively impacting margins. Used vehicle margins and service, body and parts margins were relatively unchanged in 2012 compared to 2011. Our overall gross profit margin decreased primarily due to a mix shift as we sold a greater number of new vehicles, which have lower margins than our other businesses.
Asset Impairment Charges
Asset impairments recorded as a component of continuing operations consist of the following (in thousands):
|
Year Ended December 31,
|
2012
|
2011
|
2010
|
|||||||||
|
Asset Impairments
|
||||||||||||
|
Long-lived assets
|
$ | 115 | $ | 1,376 | $ | 15,301 | ||||||
During 2012 and 2011, we recorded impairment charges associated with certain properties. As the expected future use of these facilities changed, the long-lived assets were tested for recoverability. As a result, we determined the carrying value exceeded the fair value of these properties and asset impairment charges were recorded.
During 2010, we believed events and circumstances indicated the carrying amount of our non-operational long-lived assets may no longer be recoverable, triggering interim impairment tests. We determined a triggering event had occurred based on the following factors:
|
●
|
slower industry recovery for retail vehicle sales than originally projected at the end of 2009;
|
|
●
|
oversupply of vacant dealership properties due to the economic downturn and bankruptcy proceedings for Chrysler and GM; and
|
|
●
|
the broader economic recovery, including the availability of credit, remained gradual, limiting the potential buyers of these types of properties.
|
Based on the results of those tests, we recorded asset impairment charges associated with certain properties during 2010.
See Notes 1 and 4 of Notes to Consolidated Financial Statements for additional information.
40
Selling, General and Administrative Expense (“SG&A”)
SG&A includes salaries and related personnel expenses, advertising (net of manufacturer cooperative advertising credits), rent, facility costs, and other general corporate expenses.
|
Year Ended
December 31,
|
%
|
|||||||||||||||
|
(Dollars in thousands)
|
2012
|
2011
|
Increase
|
Increase
|
||||||||||||
|
Personnel
|
$ | 243,249 | $ | 210,996 | $ | 32,253 | 15.3 | % | ||||||||
|
Advertising
|
31,913 | 23,875 | 8,038 | 33.7 | ||||||||||||
|
Rent
|
15,162 | 13,256 | 1,906 | 14.4 | ||||||||||||
|
Facility costs
|
24,172 | 17,260 | 6,912 | 40.0 | ||||||||||||
|
Other
|
59,192 | 51,276 | 7,916 | 15.4 | ||||||||||||
|
Total SG&A
|
$ | 373,688 | $ | 316,663 | $ | 57,025 | 18.0 | |||||||||
|
Year Ended
December 31,
|
Increase
|
|||||||||||
|
As a % of gross profit
|
2012
|
2011
|
(Decrease)
|
|||||||||
|
Personnel
|
45.1 | % | 47.4 | % |
(230
|
)bps | ||||||
|
Advertising
|
5.9 | 5.4 | 50 | |||||||||
|
Rent
|
2.8 | 3.0 | (20 | ) | ||||||||
|
Facility costs
|
4.5 | 3.8 | 70 | |||||||||
|
Other
|
11.0 | 11.5 | (50 | ) | ||||||||
|
Total SG&A
|
69.3 | % | 71.1 | % |
(180
|
)bps | ||||||
|
Year Ended
December 31,
|
Increase
|
%
Increase
|
||||||||||||||
|
(Dollars in thousands)
|
2011
|
2010
|
(Decrease)
|
(Decrease)
|
||||||||||||
|
Personnel
|
$ | 210,996 | $ | 176,938 | $ | 34,058 | 19.2 | % | ||||||||
|
Advertising
|
23,875 | 25,398 | (1,523 | ) | (6.0 | ) | ||||||||||
|
Rent
|
13,256 | 12,569 | 687 | 5.5 | ||||||||||||
|
Facility costs
|
17,260 | 22,335 | (5,075 | ) | (22.7 | ) | ||||||||||
|
Other
|
51,276 | 46,923 | 4,353 | 9.3 | ||||||||||||
|
Total SG&A
|
$ | 316,663 | $ | 284,163 | $ | 32,500 | 11.4 | |||||||||
|
Year Ended
December 31,
|
Increase | |||||||||||
|
As a % of gross profit
|
2011
|
2010
|
(Decrease) | |||||||||
|
Personnel
|
47.4 | % | 48.8 | % |
(140
|
)bps | ||||||
|
Advertising
|
5.4 | 7.0 | (160 | ) | ||||||||
|
Rent
|
3.0 | 3.5 | (50 | ) | ||||||||
|
Facility costs
|
3.8 | 6.1 | (230 | ) | ||||||||
|
Other
|
11.5 | 12.9 | (140 | ) | ||||||||
|
Total SG&A
|
71.1 | % | 78.3 | % |
(720
|
)bps | ||||||
SG&A expense increased $57.0 million in 2012 compared to 2011, and $32.5 million in 2011 compared to 2010. These increases were primarily driven by increased variable costs associated with improved sales and an increase in advertising as we focused on gaining market share. These increases in costs were offset by a continued focus to reduce or maintain fixed costs and effectively manage variable costs. In 2011, a $6.3 million gain on the sale of property in California was recorded as a component of facility costs.
SG&A as a percentage of gross profit was 69.3% in 2012 compared to 71.1% in 2011 and 78.3% in 2010. Adjusting for the gain on the sale of property in California and other pro forma items, our adjusted SG&A expense as a percentage of gross profit was 69.3% in 2012 compared to 72.5% in 2011 and 77.8% in 2010. See Non-GAAP Reconciliations in Management’s Discussion and Analysis of Financial Condition and Results of Operations for additional information regarding pro forma SG&A expense. As sales volume increases and we gain leverage in our cost structure, we anticipate achieving metrics of SG&A as a percentage of gross profit in the high 60% range with improved sales volumes.
41
We also measure the leverage of our cost structure by evaluating throughput, which is the incremental percentage of gross profit retained after deducting SG&A expense.
|
Year Ended
December 31,
|
% of
Change in
|
|||||||||||||||
|
(Dollars in thousands)
|
2012
|
2011
|
Change
|
Gross Profit
|
||||||||||||
|
Gross profit
|
$ | 539,300 | $ | 445,284 | $ | 94,016 | 100.0 | % | ||||||||
|
SG&A expense
|
(373,688 | ) | (316,663 | ) | (57,025 | ) | (60.7 | ) | ||||||||
|
Throughput contribution
|
$ | 36,991 | 39.3 | % | ||||||||||||
|
Year Ended
December 31,
|
% of Change in
|
|||||||||||||||
|
(Dollars in thousands)
|
2011 | 2010 |
Change
|
Gross Profit
|
||||||||||||
|
Gross profit
|
$ | 445,284 | $ | 362,946 | $ | 82,338 | 100.0 | % | ||||||||
|
SG&A expense
|
(316,663 | ) | (284,163 | ) | (32,500 | ) | (39.5 | ) | ||||||||
|
Throughput contribution
|
$ | 49,838 | 60.5 | % | ||||||||||||
Throughput contributions for newly opened or acquired stores are on a ”first dollar” basis for the first twelve months of operations. We acquired four stores and opened two new stores in 2012 and, adjusting for these locations, our throughput contribution on a same store basis was 51.2% for the year ended December 31, 2012 compared to 2011. Our throughput contribution on a same store basis for 2011 compared to 2010 was 59.9%. We continue to target a same store throughput contribution of approximately 50%.
Depreciation and Amortization
Depreciation and amortization is comprised of depreciation expense related to buildings, significant remodels or betterments, furniture, tools, equipment and signage and amortization of certain intangible assets, including customer lists and non-compete agreements.
|
Year Ended
December 31,
|
%
|
|||||||||||||||
|
(Dollars in thousands)
|
2012
|
2011
|
Increase
|
Increase
|
||||||||||||
|
Depreciation and amortization
|
$ | 17,128 | $ | 16,427 | $ | 701 | 4.3 | % | ||||||||
|
Year Ended
December 31,
|
%
|
|||||||||||||||
|
(Dollars in thousands)
|
2011
|
2010
|
Decrease
|
Decrease
|
||||||||||||
|
Depreciation and amortization
|
$ | 16,427 | $ | 17,012 | $ | (585 | ) | (3.4 | )% | |||||||
Depreciation and amortization increased $0.7 million in 2012 compared to 2011 due to increased capital expenditures of $32.9 million in 2012. These expenditures were for the improvement of store facilities, purchases of new store locations, replacement of equipment and construction of a new headquarters building.
Depreciation and amortization decreased $0.6 million in 2011 compared to 2010. The decrease in 2011 compared to 2010 was due primarily to the sale of facilities in the second half of 2010 and early 2011.
Operating Income
Operating income was 4.5%, 4.2% and 2.3% of revenue, respectively, in 2012, 2011 and 2010. The increases in 2012 compared to 2011, and 2011 compared to 2010 were primarily due to improved sales and continued cost control.
Floor Plan Interest Expense and Floor Plan Assistance
Floor plan interest expense increased $2.5 million in 2012 compared to 2011. This increase is due to higher inventory levels compared to the prior year. Floor plan interest expense increased $0.2 million in 2011 compared to 2010.
42
Floor plan assistance is provided by manufacturers to support store financing of new vehicle inventory. Under accounting standards, floor plan assistance is recorded as a component of new vehicle gross profit when the specific vehicle is sold. However, because manufacturers provide this assistance to offset inventory carrying costs, we believe a comparison of floor plan interest expense to floor plan assistance is a useful measure of the efficiency of our new vehicle sales relative to stocking levels.
The following tables detail the carrying costs for new vehicles and include new vehicle floor plan interest net of floor plan assistance earned.
|
Year Ended
December 31,
|
%
|
|||||||||||||||
|
(Dollars in thousands)
|
2012
|
2011
|
Increase
|
Increase
|
||||||||||||
|
Floor plan interest expense (new vehicles)
|
$ | 12,816 | $ | 10,364 | $ | 2,452 | 23.7 | % | ||||||||
|
Floor plan assistance (included as an offset to cost of sales)
|
(16,633 | ) | (12,582 | ) | 4,051 | 32.2 | ||||||||||
|
Net new vehicle carrying costs (benefit)
|
$ | (3,817 | ) | $ | (2,218 | ) | $ | 1,599 | 72.1 | % | ||||||
|
Year Ended
December 31,
|
%
|
|||||||||||||||
|
(Dollars in thousands)
|
2011
|
2010
|
Increase
|
Increase
|
||||||||||||
|
Floor plan interest expense (new vehicles)
|
$ | 10,364 | $ | 10,155 | $ | 209 | 2.1 | % | ||||||||
|
Floor plan assistance (included as an offset to cost of sales)
|
(12,582 | ) | (9,362 | ) | 3,220 | 34.4 | ||||||||||
|
Net new vehicle carrying costs (benefit)
|
$ | (2,218 | ) | $ | 793 | $ | 3,011 | 379.7 | % | |||||||
Other Interest Expense
Other interest expense includes interest on debt incurred related to acquisitions, real estate mortgages and our working capital, acquisition and used vehicle credit facility.
|
Year Ended
December 31,
|
Increase
|
%
Increase
|
||||||||||||||
|
(Dollars in thousands)
|
2012
|
2011
|
(Decrease)
|
(Decrease)
|
||||||||||||
|
Mortgage interest
|
$ | 8,148 | $ | 11,395 | $ | (3,247 | ) | (28.5 | )% | |||||||
|
Other interest
|
1,767 | 1,646 | 121 | 7.4 | ||||||||||||
|
Capitalized interest
|
(294 | ) | (163 | ) | 131 | 80.4 | ||||||||||
|
Total other interest expense
|
$ | 9,621 | $ | 12,878 | $ | (3,257 | ) | (25.3 | )% | |||||||
|
Year Ended
December 31,
|
Increase
|
%
Increase
|
||||||||||||||
|
(Dollars in thousands)
|
2011
|
2010
|
(Decrease)
|
(Decrease)
|
||||||||||||
|
Mortgage interest
|
$ | 11,395 | $ | 13,593 | $ | (2,198 | ) | (16.2 | )% | |||||||
|
Other interest
|
1,646 | 930 | 716 | 77.0 | ||||||||||||
|
Capitalized interest
|
(163 | ) | - | (163 | ) | - | ||||||||||
|
Total other interest expense
|
$ | 12,878 | $ | 14,523 | $ | (1,645 | ) | (11.3 | )% | |||||||
For 2012 compared to 2011, other interest decreased $3.3 million primarily due to the retirement of approximately $36.4 million in mortgages mainly in the first half of 2012. We also refinanced mortgages resulting in reduced interest rates. We had $42.3 million in mortgage issuances, mainly occurring in the fourth quarter of 2012, which had minimal impact on interest expense for the full year. This decrease related to mortgage interest was offset by higher volumes of borrowing on our credit facility.
Other interest expense decreased $1.6 million in 2011 compared to 2010 primarily due to decreases in outstanding real estate mortgage debt, partially offset by an increase in interest on our working capital, acquisition and used vehicle credit facility due to a higher volume of borrowing compared to 2010. Additionally, we recorded $0.2 million in capitalized interest in 2011 associated with construction projects, further reducing our overall interest expense.
43
Other Income, net
Other income, net primarily includes interest income and, beginning in 2012, the gains related to an equity investment. Other income, net was $2.5 million, $0.7 million and $0.4 million for 2012, 2011 and 2010, respectively.
Income Tax Expense
Our effective income tax rate was 38.2% in 2012, 37.5% in 2011 and 38.8% in 2010. Our federal income tax rate is 35.0% and our state income tax rate is currently 3.4%, which varies with the mix of states where our stores are located. We also have certain non-deductible expenses and other adjustments that impact our effective rate.
Non-GAAP Reconciliations
We believe each of the non-GAAP financial measures below improves the transparency of our disclosures, provides a meaningful presentation of our results from the core business operations excluding adjustments for items not related to our ongoing core business operations or other non-cash adjustments, and improves the period-to-period comparability of our results from the core business operations. Our management uses these measures in conjunction with GAAP financial measures as part of our assessment of our business, including our compliance with covenants in our credit facility and in communications with our board of directors concerning financial performance. These measures should not be considered an alternative to GAAP measures.
44
The following tables reconcile certain non-GAAP measures to the most comparable GAAP measure from our Consolidated Statements of Operations (dollars in thousands, except per share amounts):
|
Year Ended December 31, 2012
|
||||||||||||||||||||
|
As reported
|
Asset impairment and disposal gain
|
Equity investment
|
Tax attribute
|
Adjusted
|
||||||||||||||||
|
Asset impairments
|
$ | 115 | $ | (115 | ) | $ | - | $ | - | $ | - | |||||||||
|
Selling, general and administrative
|
$ | 373,688 | $ | 739 | $ | - | $ | - | $ | 374,427 | ||||||||||
|
Income from operations
|
$ | 148,369 | $ | (624 | ) | $ | - | $ | - | $ | 147,745 | |||||||||
|
Other income, net
|
$ | 2,525 | $ | - | $ | (244 | ) | $ | - | $ | 2,281 | |||||||||
|
Income from continuing operations before
income taxes
|
$ | 128,457 | $ | (624 | ) | $ | (244 | ) | $ | - | $ | 127,589 | ||||||||
|
Income tax provision
|
(49,062 | ) | 249 | 97 | (1,447 | ) | (50,163 | ) | ||||||||||||
|
Income from continuing operations, net of income tax
|
$ | 79,395 | $ | (375 | ) | $ | (147 | ) | $ | (1,447 | ) | $ | 77,426 | |||||||
|
Income from discontinued operations, net of income tax
|
$ | 967 | $ | (172 | ) | $ | - | $ | - | $ | 795 | |||||||||
|
Net income
|
$ | 80,362 | $ | (547 | ) | $ | (147 | ) | $ | (1447 | ) | $ | 78,221 | |||||||
|
Diluted income (loss) per share from continuing operations
|
$ | 3.03 | $ | (0.01 | ) | $ | (0.01 | ) | $ | (0.05 | ) | $ | 2.96 | |||||||
|
Diluted income (loss) per share from discontinued operations
|
$ | 0.04 | $ | (0.01 | ) | $ | - | $ | - | $ | 0.03 | |||||||||
|
Diluted net income per share
|
$ | 3.07 | $ | (0.02 | ) | $ | (0.01 | ) | $ | (0.05 | ) | $ | 2.99 | |||||||
|
Diluted share count
|
26,170 | |||||||||||||||||||
45
| Year Ended December 31, 2011 | ||||||||||||||||
|
As reported
|
Asset impairment and disposal gain
|
Reserve adjustments
|
Adjusted
|
|||||||||||||
|
Cost of Sales – service, body and parts
|
$ | 163,738 | $ | - | $ | (950 | ) | $ | 162,788 | |||||||
|
Gross Profit
|
$ | 445,284 | $ | - | $ | 950 | $ | 446,234 | ||||||||
|
Asset impairments
|
$ | 1,376 | $ | (1,376 | ) | $ | - | $ | - | |||||||
|
Selling, general and administrative
|
$ | 316,663 | $ | 6,881 | $ | - | $ | 323,544 | ||||||||
|
Income from operations
|
$ | 110,818 | $ | (5,505 | ) | $ | 950 | $ | 106,263 | |||||||
|
Income from continuing operations before income taxes
|
$ | 88,270 | $ | (5,505 | ) | $ | 950 | $ | 83,715 | |||||||
|
Income tax provision
|
(33,060 | ) | 1,724 | (360 | ) | (31,696 | ) | |||||||||
|
Income from continuing operations, net of income tax
|
$ | 55,210 |
(3,781
|
) | $ | 590 | $ | 52,019 | ||||||||
|
Income from discontinued operations,
net of income tax
|
$ | 3,650 | $ | (2,616 | ) | $ | - | $ | 1,034 | |||||||
|
Net income
|
$ | 58,860 |
(6,397
|
) | $ | 590 | $ | 53,053 | ||||||||
|
Diluted income per share from continuing operations
|
$ | 2.07 | $ | (0.14 | ) | $ | 0.02 | $ | 1.95 | |||||||
|
Diluted income per share from
discontinued operations
|
$ | 0.14 | $ | (0.10 | ) | $ | - | $ | 0.04 | |||||||
|
Diluted net income per share
|
$ | 2.21 | $ | (0.24 | ) | $ | 0.02 | $ | 1.99 | |||||||
|
Diluted share count
|
26,664 | |||||||||||||||
|
Year Ended December 31, 2010
|
||||||||||||||||
|
As reported
|
Asset
impairment
and disposal
gain
|
Reserve
adjustment
|
Adjusted
|
|||||||||||||
|
Gross Profit
|
$ | 362,946 | $ | - | $ | 1,040 | $ | 363,986 | ||||||||
|
Asset impairments
|
$ | 15,301 | $ | (15,301 | ) | $ | - | $ | - | |||||||
|
Selling, general and administrative
|
$ | 284,163 | $ | 419 | $ | (1,238 | ) | $ | 283,344 | |||||||
|
Income from operations
|
$ | 46,470 | $ | 14,882 | $ | 2,278 | $ | 63,630 | ||||||||
|
Income from continuing operations before income taxes
|
$ | 22,212 | $ | 14,882 | $ | 2,278 | $ | 39,372 | ||||||||
|
Income tax provision
|
(8,625 | ) | (5,716 | ) | (782 | ) | (15,123 | ) | ||||||||
|
Income from continuing operations, net of income tax
|
$ | 13,587 | $ | 9,166 | $ | 1,496 | $ | 24,249 | ||||||||
|
Income from discontinued operations,
net of income tax
|
$ | 132 | $ | 181 | $ | - | $ | 313 | ||||||||
|
Income from continuing operations, net of income tax
|
$ | 13,719 | $ | 9,347 | $ | 1,496 | $ | 24,562 | ||||||||
|
Diluted income (loss) per share from continuing operations
|
$ | 0.52 | $ | 0.35 | $ | 0.05 |
0.92
|
|||||||||
|
Diluted income (loss) per share from discontinued operations
|
$ | - | $ | 0.01 | $ | - | $ | 0.01 | ||||||||
|
Diluted net income per share
|
$ | 0.52 | $ | 0.36 | $ | 0.05 | $ | 0.93 | ||||||||
|
Diluted share count
|
26,279 | |||||||||||||||
46
Liquidity and Capital Resources
We manage our liquidity and capital resources to be able to fund future capital expenditures, working capital requirements and contractual obligations. Additionally, we use capital resources to fund cash dividend payments, share repurchases and acquisitions.
Available Sources
We have relied primarily on cash flows from operations, borrowings under our credit agreements, financing of real estate and the proceeds from equity and debt offerings to finance operations and expansion. Based on these factors and our normal operational cash flow, we believe we have sufficient availability to accommodate both our short- and long-term capital needs.
Below is a summary and discussion of our available funds (in thousands):
|
As of December 31,
|
Increase
|
%
Increase
|
||||||||||||||
|
2012
|
2011
|
(Decrease)
|
(Decrease)
|
|||||||||||||
|
Cash and cash equivalents
|
$ | 42,839 | $ | 20,851 | $ | 21,988 | 105.5 | % | ||||||||
|
Available credit on the Credit Facility
|
120,536 | 10,449 | 110,087 | 1,053.6 | ||||||||||||
|
Unfinanced new vehicles
|
- | 65,857 | (65,857 | ) | (100.0 | ) | ||||||||||
|
Total available funds
|
$ | 163,375 | $ | 97,157 | $ | 66,218 | 68.2 | % | ||||||||
Historically, we have raised capital through the sale of assets, sale of stores, issuance of stock and the issuance of debt. We may strategically use excess cash to reduce the amount of debt outstanding when appropriate. During 2012, 2011 and 2010, we raised $14.2 million, $23.5 million and $18.3 million, respectively, through the sale of assets and stores and the issuance of long-term debt (primarily related to the financing of certain real estate), net of debt repayments in excess of scheduled amounts.
We have the ability to raise funds through the financing of owned real estate. As of December 31, 2012, we had a book value of $102.1 million in unfinanced owned real estate. Assuming we can obtain financing on 75% of this value, we estimate we could obtain additional funds of approximately $76.6 million; however, no assurances can be provided that this capital source will be available in sufficient amounts or with terms acceptable to us.
While we have no immediate plans to access such funds, we have an effective shelf registration statement with the SEC that allows us to offer for sale, from time to time and as the capital markets permit, up to $100 million in various forms of debt or equity securities.
In addition to the above sources of liquidity, potential sources include the placement of subordinated debentures or loans, additional store sales or additional other asset sales. We will evaluate all of these options and may select one or more of them depending on overall capital needs and the availability and cost of capital, although no assurances can be provided that these capital sources will be available in sufficient amounts or with terms acceptable to us.
47
Summary of Outstanding Balances on Credit Facilities and Long-term Debt
Below is a summary of our outstanding balances on credit facilities and long-term debt (in thousands):
|
Outstanding as of December 31, 2012
|
Remaining Available as of December 31, 2012
|
||||||||
|
New vehicle floor plan commitment
|
$ | 568,130 | $ | - | (1),(4) | ||||
|
Floor plan notes payable
|
13,454 | - | (4) | ||||||
|
Used vehicle inventory financing facility
|
78,309 | - | (3) | ||||||
|
Revolving line of credit
|
21,045 | 120,536 | (2),(3) | ||||||
|
Real estate mortgages
|
192,928 | - | |||||||
|
Other debt
|
2,776 | - | |||||||
|
Liabilities related to assets held for sale
|
8,347 | - | (4) | ||||||
|
Total debt
|
$ | 884,989 | $ | 120,536 | |||||
|
(1)
|
We have a $575 million new vehicle floor plan commitment as part of our credit facility.
|
|
(2)
|
Available credit is based on the borrowing base amount effective as of December 31, 2012. This amount is reduced by $3.4 million for outstanding letters of credit.
|
|
(3)
|
The amount available on the credit facility is limited based on a borrowing base calculation and fluctuates monthly.
|
|
(4)
|
At December 31, 2012, an additional $6.9 million of floor plan notes payable outstanding on our new vehicle floor plan commitment and $1.4 million of floor plan notes payable on vehicles designated as service loaners are recorded as liabilities related to assets held for sale.
|
Credit Facility
On April 17, 2012, we executed a new five-year $650 million credit facility with a syndicate of 10 financial institutions, including four manufacturer-affiliated finance companies. On December 19, 2012 we entered into an amendment to the loan agreement that expanded the available loan commitment to $800 million. The amendment to loan agreement amended the allocation of the financing commitment to $575 million in new vehicle inventory floor plan financing, $80 million in used vehicle inventory floor plan financing and $145 million in a revolving line of credit for general corporate purposes, including acquisitions and working capital. All borrowings from, and repayments to, our syndicated lending group are presented in the Consolidated Statements of Cash Flows as financing activities.
The interest rate on the credit facility varies based on the type of debt with the rate ranging from the one-month LIBOR plus 1.50% to the one-month LIBOR plus 2.0%. The interest rates on the credit facility at December 31, 2012 ranged from 1.7% to 2.2%. Our financial covenants related to this credit facility include maintaining a current ratio of not less than 1.20x, a fixed charge coverage ratio of not less than 1.20x and a leverage ratio of not more than 5.0x.
New Vehicle Lines
We finance substantially all of our new vehicles through the new vehicle floor plan commitment component of our credit facility. We also have additional floor plan agreements with manufacturer-affiliated finance companies for vehicles that are designated for use as service loaners. Borrowings from, and repayments to, manufacturer-affiliated finance companies are classified as operating activities on the Consolidated Statements of Cash Flows.
Real Estate Mortgages and Other Debt
We have mortgages associated with our owned real estate and leasehold improvements. Interest rates related to this debt ranged from 1.8% to 5.9% at December 31, 2012. The mortgages are payable in various installments through May 2031. As of December 31, 2012, we had fixed interest rates on 66% of our outstanding mortgages.
Our other debt includes various notes, capital leases and obligations assumed as a result of acquisitions and other agreements and had interest rates that ranged from 2.0% to 9.0% at December 31, 2012. This debt, which totaled $2.8 million at December 31, 2012, is due in various installments through May 2019
.
48
Debt Covenants
Under the terms of our credit facility and other debt agreements, we are subject to financial covenants and restrictive covenants
that limit or restrict our incurring additional indebtedness, making investments, selling or acquiring assets and granting security interests in our assets.
Under our credit facility, we are required to maintain the ratios detailed in the following table:
|
Debt Covenant Ratio
|
Requirement
|
As of December 31, 2012
|
|||||||
|
Current ratio
|
Not less than 1.20
|
to | 1 |
1.43
|
to | 1 | |||
|
Fixed charge coverage ratio
|
Not less than 1.20
|
to | 1 |
2.35
|
to | 1 | |||
|
Liabilities to tangible net worth ratio
|
Not more than 5.00
|
to | 1 |
2.08
|
to | 1 | |||
|
Funded debt restriction
|
Not to exceed $375 million | $195.7 million | |||||||
We expect to remain in compliance with the financial and restrictive covenants in our credit facility and other debt agreements. However, no assurances can be provided that we will continue to remain in compliance with the financial and restrictive covenants.
If we do not meet the financial and restrictive covenants and are unable to remediate or cure the condition or obtain a waiver from our lenders, a breach would give rise to remedies under the agreement, the most severe of which is the termination of the agreement and acceleration of the amounts owed. We also would trigger cross-defaults under other debt agreements.
Inventories
We calculate days supply of inventory based on current inventory levels, excluding in-transit vehicles, and a 30-day historical cost of sales level. As of December 31, 2012, our new vehicle days supply was 76, or 14 days higher than our days supply as of December 31, 2011. The increase in our 2012 new vehicle inventory levels is partly related to the building of certain truck models prior to manufacturer planned platform changes, when production is halted and additional vehicles will not be available for several months. Additionally, 2011 new vehicle inventory levels were lower than normal as inventory supply was recovering from the effects of the earthquake and tsunami in Japan in the last half of 2011. Our days supply of used vehicles was 56 days as of December 31, 2012, or 4 days higher than our days supply as of December 31, 2011. We have continued to focus on managing our mix and maintaining an appropriate level of used vehicle inventory.
49
Contractual Payment Obligations
A summary of our contractual commitments and obligations as of December 31, 2012,
was as follows (in thousands):
|
Payments Due By Period
|
||||||||||||||||||||
|
Contractual Obligation
|
Total
|
2013
|
2014 and
2015
|
2016 and
2017
|
2018 and
beyond
|
|||||||||||||||
|
New vehicle floor plan commitment
(1)
|
$ | 568,130 | $ | 568,130 | $ | - | $ | - | $ | - | ||||||||||
|
Floor plan notes payable
(1)
|
13,454 | 13,454 | - | - | - | |||||||||||||||
|
Used vehicle inventory
financing facility
|
78,309 | - | - | 78,309 | - | |||||||||||||||
|
Revolving line of credit
|
21,045 | - | - | 21,045 | - | |||||||||||||||
|
Liabilities related to
assets held for sale
|
8,347 | 8,347 | - | - | - | |||||||||||||||
|
Real estate debt,
including interest
|
230,854 | 14,463 | 28,902 | 52,207 | 135,282 | |||||||||||||||
|
Other debt, including
capital leases and interest
|
3,871 | 258 | 503 | 409 | 2,701 | |||||||||||||||
|
Charge-backs on various contracts
|
13,504 | 7,540 | 5,345 | 609 | 10 | |||||||||||||||
|
Operating leases
(2)
|
139,965 | 16,930 | 29,562 | 23,205 | 70,268 | |||||||||||||||
|
Fixed rate payments on interest rate swaps
|
5,511 | 2,085 | 2,832 | 594 | - | |||||||||||||||
| $ | 1,082,990 | $ | 631,207 | $ | 67,144 | $ | 176,378 | $ | 208,261 | |||||||||||
|
(1)
|
Amounts for floor plan notes payable, the used vehicle inventory financing facility and the revolving line of credit do not include estimated interest payments. See Notes 1 and 6 in the Notes to Consolidated Financial Statements.
|
|
(2)
|
Amounts for operating lease commitments do not include sublease income, and certain operating expenses such as maintenance, insurance and real estate taxes. See Note 7 in the Notes to Consolidated Financial Statements.
|
Capital Expenditures
Capital expenditures were $64.6 million, $31.7 million and $7.6 million for 2012, 2011 and 2010, respectively. The increase in capital expenditures in 2012 compared to 2011 was mainly related to the building of facilities for an awarded open point, the purchase of previously leased facilities, image improvements and the construction of, and relocation to, a new headquarters building. The increase in 2011 compared to 2010 was related to improvements at certain of our store facilities, the purchase of new store locations, replacement of equipment and construction of a new headquarters building.
Many manufacturers provide assistance in the form of additional vehicle incentives if facilities meet image standards and requirements. We believe it is an attractive time to invest in certain facility upgrades and remodels that will generate additional manufacturer incentive payments. Also, recently enacted tax law changes that accelerate deductions for capital expenditures have accelerated project timelines to ensure completion before the law expires.
In the event we undertake a significant capital commitment in the future, we expect to pay for the commitment out of existing cash balances, construction financing and borrowings on our credit facility. Upon completion of the projects, we would anticipate securing long-term financing and general borrowings from third party lenders for 70% to 90% of the amounts expended, although no assurances can be provided that these financings will be available to us in sufficient amounts or on terms acceptable to us.
50
Dividends
Our Board of Directors paid dividends on our Class A and Class B common stock in 2012 as follows:
|
Dividend paid:
|
Dividend
amount per
share
|
Total amount of
dividend
(in thousands)
|
||||||
|
March 2012
|
$ | 0.07 | $ | 1,815 | ||||
|
May 2012
|
0.10 | 2,583 | ||||||
|
August 2012
|
0.10 | 2,545 | ||||||
|
November 2012
|
0.10 | 2,556 | ||||||
|
December 2012
|
0.10 | 2,567 | ||||||
Management evaluates performance and makes a recommendation to the Board of Directors on dividend payments on a quarterly basis. An additional dividend payment was paid in December 2012 in lieu of the dividend typically declared and paid in March of the following year.
Share Repurchase Program
In June 2000, our Board of Directors authorized the repurchase of up to 1,000,000 shares of our Class A common stock. As of December 31, 2011, we had purchased all available shares under this program, 419,376 of which were purchased during 2011 at an average price of $17.92 per share.
In August 2011, our Board of Directors authorized the repurchase of up to 2,000,000 shares of our Class A common stock. On July 20, 2012, our Board of Directors authorized the repurchase of 1,000,000 additional shares of our Class A common stock.
Through December 31, 2012, we had purchased 1,145,147 shares under these programs at an average price of $22.33 per share.
As of December 31, 2012, 1,854,853 shares remained available for repurchase. These plans do not have an expiration date and we may continue to repurchase shares from time to time as conditions warrant.
51
Selected Consolidated Quarterly Financial Data
The following tables set forth our unaudited quarterly financial data
(1) (2)
.
|
2012 (in thousands, except per share data )
|
Three Months Ended,
|
|||||||||||||||
|
|
March 31
|
June 30
|
September 30
|
December 31
|
||||||||||||
|
Revenues:
|
||||||||||||||||
|
New vehicle
|
$ | 392,946 | $ | 455,939 | $ | 491,847 | $ | 506,871 | ||||||||
|
Used vehicle retail
|
190,619 | 207,341 | 227,157 | 208,367 | ||||||||||||
|
Used vehicle wholesale
|
33,357 | 35,106 | 35,006 | 35,768 | ||||||||||||
|
Finance and insurance
|
24,877 | 27,183 | 30,930 | 29,244 | ||||||||||||
|
Service, body and parts
|
83,544 | 85,456 | 89,038 | 89,665 | ||||||||||||
|
Fleet and other
|
12,903 | 11,317 | 4,548 | 7,458 | ||||||||||||
|
Total revenues
|
738,246 | 822,342 | 878,526 | 877,373 | ||||||||||||
|
Cost of sales
|
613,912 | 688,246 | 736,016 | 739,013 | ||||||||||||
|
Gross profit
|
124,334 | 134,096 | 142,510 | 138,360 | ||||||||||||
|
Asset impairments
|
115 | - | - | - | ||||||||||||
|
Selling, general and administrative
|
88,440 | 92,990 | 95,132 | 97,126 | ||||||||||||
|
Depreciation and amortization
|
4,138 | 4,198 | 4,351 | 4,441 | ||||||||||||
|
Operating income
|
31,641 | 36,908 | 43,027 | 36,793 | ||||||||||||
|
Floor plan interest expense
|
(2,902 | ) | (3,054 | ) | (3,370 | ) | (3,490 | ) | ||||||||
|
Other interest expense
|
(2,726 | ) | (2,531 | ) | (2,125 | ) | (2,239 | ) | ||||||||
|
Other, net
|
498 | 820 | 453 | 754 | ||||||||||||
|
Income from continuing operations before income taxes
|
26,511 | 32,143 | 37,985 | 31,818 | ||||||||||||
|
Income tax provision
|
(9,877 | ) | (12,138 | ) | (14,893 | ) | (12,154 | ) | ||||||||
|
Income before discontinued operations
|
16,634 | 20,005 | 23,092 | 19,664 | ||||||||||||
|
Discontinued operations, net of tax
|
162 | 486 | 150 | 169 | ||||||||||||
|
Net income
|
$ | 16,796 | $ | 20,491 | $ | 23,242 | $ | 19,833 | ||||||||
|
Basic income per share from continuing operations
|
$ | 0.64 | $ | 0.78 | $ | 0.91 | $ | 0.77 | ||||||||
|
Basic income per share from discontinued operations
|
0.01 | 0.02 | - | - | ||||||||||||
|
Basic net income per share
|
$ | 0.65 | $ | 0.80 | $ | 0.91 | $ | 0.77 | ||||||||
|
Diluted income per share from continuing operations
|
$ | 0.63 | $ | 0.76 | $ | 0.90 | $ | 0.76 | ||||||||
|
Diluted income per share from discontinued operations
|
- | 0.02 | - | - | ||||||||||||
|
Diluted net income per share
|
$ | 0.63 | $ | 0.78 | $ | 0.90 | $ | 0.76 | ||||||||
52
|
2011 (in thousands, except per share data)
|
T hree Months Ended, | |||||||||||||||
| March 31 |
June 30
|
September 30 | December 31 | |||||||||||||
| Revenues: | ||||||||||||||||
|
New vehicle
|
$ | 295,533 | $ | 339,378 | $ | 374,460 | $ | 382,004 | ||||||||
|
Used vehicle retail
|
153,803 | 172,283 | 182,432 | 170,053 | ||||||||||||
|
Used vehicle wholesale
|
29,327 | 28,852 | 35,288 | 34,862 | ||||||||||||
|
Finance and insurance
|
18,939 | 20,492 | 22,302 | 22,397 | ||||||||||||
|
Service, body and parts
|
72,199 | 78,410 | 83,296 | 82,053 | ||||||||||||
|
Fleet and other
|
3,128 | 17,168 | 10,108 | 3,979 | ||||||||||||
|
Total revenues
|
572,929 | 656,583 | 707,886 | 695,348 | ||||||||||||
|
Cost of sales
|
473,270 | 542,607 | 589,089 | 582,496 | ||||||||||||
|
Gross profit
|
99,659 | 113,976 | 118,797 | 112,852 | ||||||||||||
|
Asset impairments
|
383 | 489 | - | 504 | ||||||||||||
|
Selling, general and administrative
|
75,294 | 79,903 | 83,135 | 78,331 | ||||||||||||
|
Depreciation and amortization
|
4,059 | 4,170 | 4,103 | 4,095 | ||||||||||||
|
Operating income
|
19,923 | 29,414 | 31,559 | 29,922 | ||||||||||||
|
Floor plan interest expense
|
(2,423 | ) | (3,281 | ) | (1,954 | ) | (2,706 | ) | ||||||||
|
Other interest expense
|
(3,284 | ) | (2,999 | ) | (3,063 | ) | (3,532 | ) | ||||||||
|
Other, net
|
76 | 171 | 214 | 233 | ||||||||||||
|
Income from continuing operations before income taxes
|
14,292 | 23,305 | 26,756 | 23,917 | ||||||||||||
|
Income tax provision
|
(5,914 | ) | (8,716 | ) | (10,534 | ) | (7,896 | ) | ||||||||
|
Income before discontinued operations
|
8,378 | 14,589 | 16,222 | 16,021 | ||||||||||||
|
Discontinued operations, net of tax
|
327 | 237 | 341 | 2,745 | ||||||||||||
|
Net income
|
$ | 8,705 | $ | 14,826 | $ | 16,563 | $ | 18,766 | ||||||||
|
Basic income per share from continuing operations
|
$ | 0.32 | $ | 0.55 | $ | 0.62 | $ | 0.62 | ||||||||
|
Basic income per share from discontinued operations
|
0.01 | 0.01 | 0.01 | 0.10 | ||||||||||||
|
Basic net income per share
|
$ | 0.33 | $ | 0.56 | $ | 0.63 | $ | 0.72 | ||||||||
|
Diluted income per share from continuing operations
|
$ | 0.31 | $ | 0.54 | $ | 0.61 | $ | 0.61 | ||||||||
|
Diluted income per share from discontinued operations
|
0.02 | 0.01 | 0.01 | 0.10 | ||||||||||||
|
Diluted net income per share
|
$ | 0.33 | $ | 0.55 | $ | 0.62 | $ | 0.71 | ||||||||
|
(1)
|
Quarterly data may not add to yearly totals due to rounding.
|
|
(2)
|
Certain reclassifications of amounts previously reported have been made to the quarterly financial data to maintain consistency and comparability between periods presented.
|
Seasonality and Quarterly Fluctuations
Historically, our sales have been lower in the first and fourth quarters of each year due to consumer purchasing patterns during the holiday season, inclement weather in certain of our markets and the reduced number of business days during the holiday season. As a result, financial performance is expected to be lower during the first and fourth quarters than during the second and third quarters of each fiscal year. We believe that interest rates, levels of consumer debt, consumer confidence and manufacturer sales incentives, as well as general economic conditions, also contribute to fluctuations in sales and operating results.
Off-Balance Sheet Arrangements
We do not have any off-balance sheet arrangements that have or are reasonably likely to have a material current or future effect on our financial condition, changes in financial condition, revenues or expenses, results of operations, liquidity, capital expenditures or capital resources.
Inflation
The effects of inflation were insignificant in the years ended December 31, 2012, 2011 and 2010.
53
Variable Rate Debt
Our credit facility, other floor plan notes payable and certain real estate mortgages are structured as variable rate debt. The interest rates on our variable rate debt are tied to either the one- or three-month LIBOR or the prime rate. These debt obligations, therefore, expose us to variability in interest payments due to changes in these rates. Certain floor plan debt is based on open-ended lines of credit tied to each individual store from the various manufacturer finance companies.
Our variable-rate floor plan notes payable, variable rate mortgage notes payable and other credit line borrowings subject us to market risk exposure. At December 31, 2012, we had $746.2 million outstanding under such agreements at a weighted average interest rate of 1.9% per annum. A 10% increase in interest rates would increase annual interest expense by approximately $1.4 million, net of tax, based on amounts outstanding at December 31, 2012.
Fixed Rate Debt
The fair value of our long-term fixed interest rate debt is subject to interest rate risk. Generally, the fair value of fixed interest rate debt will increase as interest rates fall because we would expect to be able to refinance for a lower rate. Conversely, the fair value of fixed interest rate debt will decrease as interest rates rise. The interest rate changes affect the fair value but do not impact earnings or cash flows.
At December 31, 2012, we had $130.5 million of long-term fixed interest rate debt outstanding and recorded on the balance sheet, with maturity dates between November 2016 and May 2031. Based on discounted cash flows using current interest rates for comparable debt, we have determined that the fair value of this long-term fixed interest rate debt was approximately $134.7 million at December 31, 2012.
Hedging Strategies
We believe it is prudent to limit the variability of a portion of our interest payments. Accordingly, we have entered into interest rate swaps to manage the variability of our interest rate exposure, thus leveling a portion of our interest expense in a rising or falling rate environment.
We have effectively changed the variable-rate cash flow exposure on a portion of our floor plan debt to fixed-rate cash flows by entering into receive-variable, pay-fixed interest rate swaps. Under the interest rate swaps, we receive variable interest rate payments and make fixed interest rate payments, thereby creating fixed rate floor plan debt.
We do not enter into derivative instruments for any purpose other than to manage interest rate exposure. That is, we do not engage in interest rate speculation using derivative instruments. Typically, we designate all interest rate swaps as cash flow hedges.
As of December 31, 2012, we had outstanding the following interest rate swaps with U.S. Bank Dealer Commercial Services:
|
●
|
$25 million interest rate swap at a fixed rate of 4.495% per annum, variable rate adjusted on the 26
th
of each month, matures January 25, 2013;
|
|
●
|
$25 million interest rate swap at a fixed rate of 3.495% per annum, variable rate adjusted on the 1
st
and 16
th
of each month, matures April 30, 2013;
|
|
●
|
$25 million interest rate swap at a fixed rate of 3.495% per annum, variable rate adjusted on the 1
st
and
16
th
of each month, matures April 30, 2013 and
|
|
●
|
$25 million interest rate swap at a fixed rate of 5.587% per annum, variable rate adjusted on the 1
st
and 16
th
of each month, matures June 15, 2016.
|
54
We receive interest on all of the interest rate swaps at the one-month LIBOR rate. The one-month LIBOR rate at December 31, 2012 was 0.21% per annum, as reported in the Wall Street Journal.
The fair value of our interest rate swap agreements represents the estimated receipts or payments that would be made to terminate the agreements. These amounts related to our cash flow hedges are recorded as deferred gains or losses in our Consolidated Balance Sheets with the offset recorded in accumulated other comprehensive income, net of tax. Changes to the fair value of discontinued cash flow hedges are recognized into earnings as a component of floor plan interest expense. At December 31, 2012, the fair value of all of our agreements was a liability of $4.7 million. The estimated amount expected to be reclassified into earnings within the next twelve months was $1.9 million at December 31, 2012.
Risk Management Policies
We assess interest rate cash flow risk by continually identifying and monitoring changes in interest rate exposures that may adversely impact expected future cash flows and by evaluating hedging opportunities. Our policy is to manage this risk through a mix of fixed rate and variable rate debt structures and interest rate swaps.
We maintain risk management control systems to monitor interest rate cash flow attributable to both our outstanding and forecasted debt obligations, as well as our offsetting hedge positions. The risk management control systems involve the use of analytical techniques, including cash flow sensitivity analysis, to estimate the expected impact of changes in interest rates on our future cash flows.
The financial statements and notes thereto required by this item begin on page F-1 as listed in Item 15 of Part IV of this document. Quarterly financial data
for each of the eight quarters in the two-year period ended December 31, 2012 is included in Item 7.
None.
Evaluation of Disclosure Controls and Procedures
Our management evaluated, with the participation and under the supervision of our Chief Executive Officer and Chief Financial Officer, the effectiveness of our disclosure controls and procedures as of the end of the period covered by this Annual Report on Form 10-K. Based on this evaluation, our Chief Executive Officer and our Chief Financial Officer concluded that our disclosure controls and procedures are effective to ensure that information we are required to disclose in reports that we file or submit under the Securities Exchange Act of 1934 is accumulated and communicated to our management, including our Chief Executive Officer and our Chief Financial Officer, as appropriate to allow timely decisions regarding required disclosure and that such information is recorded, processed, summarized and reported within the time periods specified in Securities and Exchange Commission rules and forms.
Changes in Internal Control Over Financial Reporting
There was no change in our internal control over financial reporting that occurred during our last fiscal quarter that has materially affected or is reasonably likely to materially affect our internal control over financial reporting
.
55
Management’s Report on Internal Control Over Financial Reporting
Our management is responsible for establishing and maintaining adequate internal control over financial reporting.
Our management assessed the effectiveness of our internal control over financial reporting as of December 31, 2012. In making this assessment, we used the criteria set forth in
Internal Control – Integrated Framework
issued by the Committee of Sponsoring Organizations of the Treadway Commission. Based on our assessment using those criteria, our management concluded that, as of December 31, 2012, our internal control over financial reporting was effective.
KPMG LLP, our Independent Registered Public Accounting Firm, has issued an attestation report on our internal control over financial reporting as of December 31, 2012, which is included in Item 8 of this Form 10-K.
None.
Information required by this item will be included under the captions
Election of Directors,
Committees of the Board of Directors
,
Audit Committee Independence and Financial Expert
,
Code of Business Conduct and Ethics, Named Executive Officers
and
Section 16(a) Beneficial Ownership Reporting Compliance
in our Proxy Statement for our 2013 Annual Meeting of Shareholders and, upon filing, is incorporated herein by reference.
The information required by this item will be included under the captions
Compensation of Directors, Compensation Committee Report, Compensation Discussion and Analysis,
Executive Compensation, Potential Payments Upon Termination or Change-in-Control, Company Compensation Policies and Practices, Risk Analysis
and
Compensation Committee Interlocks and Insider Participation
in our Proxy Statement for our 2013 Annual Meeting of Shareholders and, upon filing, is incorporated herein by reference.
56
Equity Compensation Plan Information
The following table summarizes equity securities authorized for issuance as of December 31, 2012.
|
Plan Category
|
Number of securities to be issued upon exercise of outstanding options, warrants and rights (a)
|
Weighted average exercise price of outstanding options, warrants and rights (b)
|
Number of securities remaining available for future issuance under equity compensation plans (excluding securities reflected in column (a)) (c)
(2)
|
|||||||||
|
Equity compensation plans approved by shareholders
|
1,349,152 | |||||||||||
|
Options
|
253,499 | $ | 6.26 | |||||||||
|
Restricted stock u
nits
|
583,463 |
NA
(1)
|
||||||||||
|
Equity compensation plans not approved by shareholders
|
- | - | - | |||||||||
|
Total
|
836,962 | $ | 6.26 | (1) | 1,349,152 | |||||||
|
(1)
|
There is no exercise price associated with our restricted stock units.
The total weighted average exercise price is shown with respect to options only.
|
|
(2)
|
Includes 667,859 shares available pursuant to our 2003 Stock Incentive Plan and 681,293 shares available pursuant to our Employee Stock Purchase Plan.
|
The additional information required by this item will be included under the caption
Security Ownership of Certain Beneficial Owners and Management
in our Proxy Statement for our 2013 Annual Meeting of Shareholders and, upon filing, is incorporated herein by reference.
The information required by this item will be included under the captions
Certain Relationships and Related Transactions
and
Director Independence
in our Proxy Statement for our 2013 Annual Meeting of Shareholders and, upon filing, is incorporated herein by reference.
Information required by this item will be included under the caption
Fees Paid to KPMG LLP Related to Fiscal 2012 and 2011 and Pre-Approval Policies
in our Proxy Statement for our 2013 Annual Meeting of Shareholders and, upon filing, is incorporated herein by reference.
57
Financial Statements and Schedules
The Consolidated Financial Statements, together with the report thereon of KPMG LLP, Independent Registered Public Accounting Firm, are included on the pages indicated below:
|
Page
|
|
|
Reports of Independent Registered Public Accounting Firm
|
F-1, F-2
|
|
Consolidated Balance Sheets as of December 31, 2012 and 2011
|
F-3
|
|
Consolidated Statements of Operations for the years ended December 31, 2012, 2011 and 2010
|
F-4
|
|
Consolidated Statements of Comprehensive Income for the years ended December 31, 2012, 2011 and 2010
|
F-5
|
|
Consolidated Statements of Changes in Stockholders’ Equity for the years ended December 31, 2012, 2011 and 2010
|
F-6
|
|
Consolidated Statements of Cash Flows for the years ended December 31, 2012, 2011 and 2010
|
F-7
|
|
Notes to Consolidated Financial Statements
|
F-8
|
There are no schedules required to be filed herewith.
Exhibits
The following exhibits are filed herewith and this list is intended to constitute the exhibit index. An asterisk (*) beside the exhibit number indicates the exhibits containing a management contract, compensatory plan or arrangement, which are required to be identified in this report.
|
Exhibit
|
Description
|
|
3.1
|
Restated Articles of Incorporation of Lithia Motors, Inc., as amended May 13, 1999 (incorporated by reference to exhibit 3.1 to the Company’s Form 10-K for the year ended December 31, 1999)
|
|
3.2
|
Amended and Restated Bylaws of Lithia Motors, Inc. (Corrected) (incorporated by reference to exhibit 3.2 to the Company’s Form 10-K for the year ended December 31, 2008)
|
|
10.1*
|
2009 Employee Stock Purchase Plan (incorporated by reference to Appendix A to the Company’s Proxy Statement for its 2009 annual meeting of shareholders filed on March 20, 2009)
|
|
10.2*
|
Lithia Motors, Inc. 2001 Stock Option Plan (incorporated by reference to Appendix B to the Company’s Proxy Statement for its 2001 annual meeting of shareholders filed on May 8, 2001)
|
|
10.2.1*
|
Form of Incentive Stock Option Agreement for 2001 Stock Option Plan (incorporated by reference to exhibit 10.6.1 to the Company’s Form 10-K for the year ended December 31, 2001)
|
|
10.2.2*
|
Form of Non-Qualified Stock Option Agreement for 2001 Stock Option Plan (incorporated by reference to exhibit 10.6.2 to the Company’s Form 10-K for the year ended December 31, 2001)
|
|
10.3
|
Lithia Motors, Inc. Amended and Restated 2003 Stock Incentive Plan (incorporated by reference to exhibit 10.1 to the Company’s Form 10-Q for the quarter ended March 31, 2011)
|
|
10.3.1
|
RSU Deferral Plan (incorporated by reference to exhibit 10.3.1 to the Company’s Form 10-K for the year ended December 31, 2011)
|
|
10.4*
|
Form of Restricted Stock Unit Agreement for Senior Executives (incorporated by reference to exhibit 10.4 to the Company’s Form 10-K for the year ended December 31, 2010)
|
| 10.4.1* |
Form of Restricted Stock Unit Agreement for Non-Executive Officers (incorporated by reference to exhibit 10.4.1 to the Company’s Form 10-K for the year ended December 31, 2010)
|
| 10.4.2* |
Form of Restricted Stock Unit Agreement for Non-Executive Directors (incorporated by reference to exhibit 10.4.2 to the Company’s Form 10-K for the year ended December 31, 2010)
|
|
10.5*
|
Written description of Discretionary Support Services Variable Performance Compensation Plan (incorporated by reference from the Company’s Proxy Statement for the 2013 Annual Meeting under the caption
Compensation Discussion and Analysis - Elements of Compensation Program
)
|
|
10.6
|
Chrysler Corporation Sales and Service Agreement Additional Terms and Provisions (incorporated by reference to exhibit 10.3.2 to the Company’s Registration Statement on Form S-1, Registration Statement No. 333-14031, as declared effective by the Securities Exchange Commission on December 18, 1996)
|
58
|
Exhibit
|
Description
|
|
10.6.1
|
Chrysler Corporation Chrysler Sales and Service Agreement, dated September 28, 1999, between Chrysler Corporation and Lithia Chrysler Plymouth Jeep Eagle, Inc. (incorporated by reference to exhibit 10.15.1 to the Company’s Form 10-K for the year ended December 31, 1999 (Additional Terms and Provisions to the Sales and Service Agreements are in Exhibit 10.9) (1))
|
|
10.7
|
Mercury Sales and Service Agreement General Provisions (incorporated by reference to exhibit 10.6.5 to the Company’s Registration Statement on Form S-1, Reg. No. 333-14031)
|
|
10.7.1
|
Supplemental Terms and Conditions agreement between Ford Motor Company and Lithia Motors, Inc. dated June 12, 1997 (incorporated by reference to exhibit 10.7.2 to the Company’s Form 10-K for the year ended December 31, 1997)
|
|
10.7.2
|
Mercury Sales and Service Agreement, dated June 1, 1997, between Ford Motor Company and Lithia TLM, LLC dba Lithia Lincoln Mercury (incorporated by reference to exhibit 10.7.1 to the Company’s Form 10-K for the year ended December 31, 1997) (general provisions are in Exhibit 10.10) (2)
|
|
10.8
|
Volkswagen Dealer Agreement Standard Provisions (incorporated by reference to exhibit 10.16.2 to the Company’s Form 10-K for the year ended December 31, 1997)
|
|
10.8.1
|
Volkswagen Dealer Agreement dated September 17, 1998, between Volkswagen of America, Inc. and Lithia HPI, Inc. dba Lithia Volkswagen (incorporated by reference to exhibit 10.17.1 to the Company’s Form 10-K for the year ended December 31, 1999 (standard provisions are in Exhibit 10.11) (3)
|
|
10.9
|
General Motors Dealer Sales and Service Agreement Standard Provisions (incorporated by reference to exhibit 10.7.2 to the Company’s Registration Statement on Form S-1, Reg. No. 333-14031)
|
|
10.9.1
|
Supplemental Agreement to General Motors Corporation Dealer Sales and Service Agreement dated January 16, 1998 (incorporated by reference to exhibit 10.18.1 to the Company’s Form 10-K for the year ended December 31, 1999)
|
|
10.9.2
|
Chevrolet Dealer Sales and Service Agreement dated October 13, 1998 between General Motors Corporation, Chevrolet Motor Division and Camp Automotive, Inc. (incorporated by reference to exhibit 10.31 to the Company’s Form 10-K for the year ended December 31, 1998) (4)
|
|
10.10
|
Toyota Dealer Agreement Standard Provisions (incorporated by reference to exhibit 10.10.2 to the Company’s Registration Statement on Form S-1, Reg. No. 333-14031)
|
|
10.10.1
|
Toyota Dealer Agreement, between Toyota Motor Sales, USA, Inc. and Lithia Motors, Inc., dba Lithia Toyota, dated February 15, 1996 (incorporated by reference to exhibit 10.20.1 to the Company’s Form 10-K for the year ended December 31, 1999) (5)
|
|
10.11
|
Nissan Standard Provisions (incorporated by reference to exhibit 10.15.2 to the Company’s Form 10-K for the year ended December 31, 1997)
|
|
10.11.1
|
Nissan Public Ownership Addendum dated August 30, 1999 (incorporated by reference to exhibit 10.22.1 to the Company’s Form 10-K for the year ended December 31, 1999) (6)
|
|
10.11.2
|
Nissan Dealer Term Sales and Service Agreement between Lithia Motors, Inc., Lithia NF, Inc., and the Nissan Division of Nissan Motor Corporation In USA dated January 2, 1998 (incorporated by reference to exhibit 10.15.1 to the Company’s Form 10-K for the year ended December 31, 1997) (standard provisions are in Exhibit 10.14) (7)
|
|
10.12
|
Lease Agreement between CAR LIT, LLC and Lithia Real Estate, Inc. relating to properties in Medford, Oregon (incorporated by reference to exhibit 10.36 to the Company’s Form 10-K for the year ended December 31, 1999) (8)
|
|
10.13*
|
Non Employee Director Compensation Plan 2010/2011 Service Year (incorporated by reference to exhibit 10.13 to the Company’s Form 10-K for the year ended December 31, 2011)
|
| 10.13.1* |
Non Employee Director Compensation Plan 2012/2013 Service Year
|
|
10.14*
|
Form of Outside Director Nonqualified Deferred Compensation Agreement (incorporated by reference to exhibit 10.20 to the Company’s Form 10-K for the year ended December 31, 2005)
|
|
10.15
|
Option Agreement between the Company and M. L. Dick Heimann dated December 31, 2009 (incorporated by reference to exhibit 99.1 to the Company’s Form 8-K filed January 5, 2010)
|
|
10.15.1*
|
Executive Nonqualified Deferred Compensation Agreement between the Company and M. L. Dick Heimann dated December 31, 2009 (incorporated by reference to exhibit 99.2 to the Company’s Form 8-K filed January 5, 2010)
|
59
|
Exhibit
|
Description
|
|
10.16
|
Loan Agreement dated as of April 17, 2012 between Lithia Motors, Inc., and U.S. Bank National Association, as agent for the lenders, and U.S. Bank National Association, JPMorgan Chase Bank, N.A., Mercedes-Benz Financial Services USA LLC, Toyota Motor Credit Corporation, BMW Financial Services N.A., LLC, Nissan Motor Acceptance Corporation, Bank of America, N.A., Wells Fargo Bank, N.A., Bank of the West and Key Bank National Association, as lenders (incorporated by reference to exhibit 99.1 to the Company’s Form 8-K filed April 20, 2012)
|
|
10.16.1
|
Amendment to Loan Agreement dated December 19, 2012 with U.S. Bank National Association as agent for the lenders, and U.S. Bank National Association, JPMorgan Chase Bank, N.A., Mercedes-Benz Financial Services USA LLC, Toyota Motor Credit Corporation, BMW Financial Services N.A., LLC, Nissan Motor Acceptance Corporation, Bank of America, N.A., Wells Fargo Bank, N.A., Bank of the West and KeyBank National Association, as lenders (incorporated by reference to exhibit 10.1 to the Company’s Form 8-K filed December 24, 2012)
|
|
10.17*
|
Amended and Restated Split-Dollar Agreement
|
|
10.18*
|
Terms of Amended Employment and Change in Control Agreement between Lithia Motors, Inc. and Sidney B. DeBoer dated January 15, 2009 (incorporated by reference to exhibit 10.22 to the Company’s Form 10-K for the year ended December 31, 2008) (9)
|
|
10.19*
|
Form of Indemnity Agreement for each Named Executive Officer (incorporated by reference to exhibit 10.1 to the Company’s Form 8-K filed May 29, 2009)
|
|
10.20*
|
Form of Indemnity Agreement for each non-management Director (incorporated by reference to exhibit 10.2 to the Company’s Form 8-K filed May 29, 2009)
|
|
10.21*
|
Executive Management Non-Qualified Deferred Compensation and Long-Term Incentive Plan (incorporated by reference to exhibit 10.22 to the Company’s Form 10-K for the year ended December 31, 2010)
|
|
10.21.1*
|
Form of Executive Management Non-Qualified Deferred Compensation and Long-Term Incentive Plan – Notice of Discretionary Contribution Award for Sidney DeBoer (incorporated by reference to exhibit 10.22.1 to the Company’s Form 10-K for the year ended December 31, 2010)
|
|
10.21.2*
|
Form of Executive Management Non-Qualified Deferred Compensation and Long-Term Incentive Plan – Notice of Discretionary Contribution Award (incorporated by reference to exhibit 10.22.2 to the Company’s Form 10-K for the year ended December 31, 2010)
|
|
10.22
|
Acquisition and Option Termination Agreement with M.L. Dick Heimann dated December 16, 2011 (incorporated by reference to exhibit 99.1 to the Company’s Form 8-K filed December 22, 2011)
|
|
10.22.1*
|
Form of Membership Purchase Agreement with M.L. Dick Heimann (incorporated by reference to exhibit 99.2 to the Company’s Form 8-K filed December 22, 2011)
|
|
10.23*
|
Employment Agreement with Executive Vice President Brad Gray dated March 1, 2012 (incorporated by reference to exhibit 10.2 to the Company’s Form 10-Q for the quarter ended March 31, 2012)
|
| 10.24* |
Form of Amended Employment and Change in Control Agreement dated February 22, 2013 between the Company and each of Scott Hillier, Bryan B. DeBoer, John F. North III and Chris Holzshu
|
|
12
|
Ratio of Earnings to Combined Fixed Charges
|
|
21
|
Subsidiaries of Lithia Motors, Inc.
|
|
23
|
Consent of KPMG LLP, Independent Registered Public Accounting Firm
|
|
31.1
|
Certification of Chief Executive Officer pursuant to Rule 13a-14(a) or Rule 15d-14(a) of the Securities Exchange Act of 1934.
|
|
31.2
|
Certification of Chief Financial Officer pursuant to Rule 13a-14(a) or Rule 15d-14(a) of the Securities Exchange Act of 1934.
|
|
32.1
|
Certification of Chief Executive Officer pursuant to Rule 13a-14(b) or Rule 15d-14(b) of the Securities Exchange Act of 1934 and 18 U.S.C. Section 1350.
|
|
32.2
|
Certification of Chief Financial Officer pursuant to Rule 13a-14(b) or Rule 15d-14(b) of the Securities Exchange Act of 1934 and 18 U.S.C. Section 1350.
|
60
|
Exhibit
|
Description
|
|
101.INS
|
XBRL Instance Document.
|
|
101.SCH
|
XBRL Taxonomy Extension Schema Document.
|
|
101.CAL
|
XBRL Taxonomy Extension Calculation Linkbase Document.
|
|
101.DEF
|
XBRL Taxonomy Extension Definition Linkbase Document.
|
|
101.LAB
|
XBRL Taxonomy Extension Label Linkbase Document.
|
|
101.PRE
|
XBRL Taxonomy Extension Presentation Linkbase Document.
|
|
(1)
|
Substantially identical agreements exist between DaimlerChrysler Motor Company, LLC and those other subsidiaries operating Dodge, Chrysler, Plymouth or Jeep dealerships.
|
|
(2)
|
Substantially identical agreements exist for its Ford and Lincoln-Mercury lines between Ford Motor Company and those other subsidiaries operating Ford or Lincoln-Mercury dealerships.
|
|
(3)
|
Substantially identical agreements exist between Volkswagen of America, Inc. and those subsidiaries operating Volkswagen dealerships.
|
|
(4)
|
Substantially identical agreements exist between Chevrolet Motor Division, GM Corporation and those other subsidiaries operating General Motors dealerships.
|
|
(5)
|
Substantially identical agreements exist (except the terms are all 2 years) between Toyota Motor Sales, USA, Inc. and those other subsidiaries operating Toyota dealerships.
|
|
(6)
|
Substantially identical documents exist with each Nissan store.
|
|
(7)
|
Substantially identical agreements exist between Nissan Motor Corporation and those other subsidiaries operating Nissan dealerships.
|
|
(8)
|
Lithia Real Estate, Inc. leases all the property in Medford, Oregon sold to CAR LIT, LLC under substantially identical leases covering six separate blocks of property.
|
|
(9)
|
Substantially similar agreements exist between Lithia Motors, Inc. and each of M.L. Dick Heimann, Bryan B. DeBoer, Christopher S. Holzshu and John F. North III.
|
61
SIGNATURES
Pursuant to the requirements of Section 13 or 15(d) of the Securities Exchange Act of 1934, the Registrant has duly caused this report to be signed on its behalf by the undersigned, thereunto duly authorized.
| Date: February 22, 2013 | LITHIA MOTORS, INC. | ||
| By: | /s/Bryan B. DeBoer | ||
| Bryan B. DeBoer | |||
| Director, President and | |||
| Chief Executive Officer | |||
Pursuant to the requirements of the Securities Exchange Act of 1934, this report has been signed below by the following persons on behalf of the Registrant and in the capacities indicated on February 22, 2013:
|
Signature
|
Title
|
|
|
/s/ Bryan B. DeBoer
|
Director, President and Chief Executive Officer
|
|
| Bryan B. DeBoer |
(Principal Executive Officer)
|
|
|
/s/ Christopher S. Holzshu
|
Senior Vice President, Chief Financial Officer
|
|
| Christopher S. Holzshu |
and Secretary (Principal Financial Officer)
|
|
|
/s/John F. North III
|
Vice President and Corporate Controller
|
|
| John F. North III |
(Principal Accounting Officer)
|
|
|
/s/Thomas Becker
|
Director
|
|
| Thomas Becker | ||
|
/s/Susan O. Cain
|
Director
|
|
| Susan O. Cain | ||
|
|
||
|
/s/Sidney B. DeBoer
|
Director
|
|
| Sidney B. DeBoer | ||
|
|
||
|
/s/M.L. Dick Heimann
|
Director
|
|
| M.L. Dick Heimann | ||
|
|
||
|
/s/Kenneth E. Roberts
|
Director
|
|
| Kenneth E. Roberts | ||
|
/s/William J. Young
|
Director
|
|
| William J. Young |
62
Report of Independent Registered Public Accounting Firm
The Board of Directors and Stockholders
Lithia Motors, Inc.:
We have audited the accompanying Consolidated Balance Sheets of Lithia Motors, Inc. and subsidiaries as of December 31, 2012 and 2011, and the related Consolidated Statements of Operations, Comprehensive Income, Changes in Stockholders’ Equity, and Cash Flows for each of the years in the three-year period ended December 31, 2012. These Consolidated Financial Statements are the responsibility of the Company’s management. Our responsibility is to express an opinion on these Consolidated Financial Statements based on our audits.
We conducted our audits in accordance with the standards of the Public Company Accounting Oversight Board (United States). Those standards require that we plan and perform the audit to obtain reasonable assurance about whether the financial statements are free of material misstatement. An audit includes examining, on a test basis, evidence supporting the amounts and disclosures in the financial statements. An audit also includes assessing the accounting principles used and significant estimates made by management, as well as evaluating the overall financial statement presentation. We believe that our audits provide a reasonable basis for our opinion.
In our opinion, the Consolidated Financial Statements referred to above present fairly, in all material respects, the financial position of Lithia Motors, Inc. and subsidiaries as of December 31, 2012 and 2011, and the results of their operations and their cash flows for each of the years in the three-year period ended December 31, 2012, in conformity with U.S. generally accepted accounting principles.
We also have audited, in accordance with the standards of the Public Company Accounting Oversight Board (United States), Lithia Motors, Inc.’s internal control over financial reporting as of December 31, 2012, based on criteria established in
Internal Control – Integrated Framework
issued by the Committee of Sponsoring Organizations of the Treadway Commission (COSO), and our report dated February 22, 2013 expressed an unqualified opinion on the effectiveness of the Company’s internal control over financial reporting.
/s/ KPMG LLP
Portland, Oregon
February 22, 2013
F-1
Report of Independent Registered Public Accounting Firm
The Board of Directors and Stockholders
Lithia Motors, Inc.:
We have audited Lithia Motors, Inc.’s internal control over financial reporting as of December 31, 2012, based on criteria established in
Internal Control – Integrated Framework
issued by the Committee of Sponsoring Organizations of the Treadway Commission (COSO). Lithia Motors, Inc.’s management is responsible for maintaining effective internal control over financial reporting and for its assessment of the effectiveness of internal control over financial reporting, included in the accompanying Management’s Report on Internal Control Over Financial Reporting. Our responsibility is to express an opinion on the Company’s internal control over financial reporting based on our audit.
We conducted our audit in accordance with the standards of the Public Company Accounting Oversight Board (United States). Those standards require that we plan and perform the audit to obtain reasonable assurance about whether effective internal control over financial reporting was maintained in all material respects. Our audit included obtaining an understanding of internal control over financial reporting, assessing the risk that a material weakness exists, and testing and evaluating the design and operating effectiveness of internal control based on the assessed risk. Our audit also included performing such other procedures as we considered necessary in the circumstances. We believe that our audit provides a reasonable basis for our opinion.
A company’s internal control over financial reporting is a process designed to provide reasonable assurance regarding the reliability of financial reporting and the preparation of financial statements for external purposes in accordance with generally accepted accounting principles. A company’s internal control over financial reporting includes those policies and procedures that (1) pertain to the maintenance of records that, in reasonable detail, accurately and fairly reflect the transactions and dispositions of the assets of the company; (2) provide reasonable assurance that transactions are recorded as necessary to permit preparation of financial statements in accordance with generally accepted accounting principles, and that receipts and expenditures of the company are being made only in accordance with authorizations of management and directors of the company; and (3) provide reasonable assurance regarding prevention or timely detection of unauthorized acquisition, use, or disposition of the company’s assets that could have a material effect on the financial statements.
Because of its inherent limitations, internal control over financial reporting may not prevent or detect misstatements. Also, projections of any evaluation of effectiveness to future periods are subject to the risk that controls may become inadequate because of changes in conditions, or that the degree of compliance with the policies or procedures may deteriorate.
In our opinion, Lithia Motors, Inc. maintained, in all material respects, effective internal control over financial reporting as of December 31, 2012, based on criteria established in
Internal Control – Integrated Framework
issued by the Committee of Sponsoring Organizations of the Treadway Commission.
We also have audited, in accordance with the standards of the Public Company Accounting Oversight Board (United States), the Consolidated Balance Sheets of Lithia Motors, Inc. and subsidiaries as of December 31, 2012 and 2011, and the related Consolidated Statements of Operations, Comprehensive Income, Changes in Stockholders’ Equity, and Cash Flows for each of the years in the three-year period ended December 31, 2012, and our report dated February 22, 2013 expressed an unqualified opinion on those Consolidated Financial Statements.
/s/ KPMG LLP
Portland, Oregon
February 22, 2013
F-2
LITHIA MOTORS, INC. AND SUBSIDIARIES
(In thousands)
| December 31, | ||||||||
|
2012
|
2011
|
|||||||
|
Assets
|
||||||||
|
Current Assets:
|
||||||||
|
Cash and cash equivalents
|
$ | 42,839 | $ | 20,851 | ||||
|
Accounts receivable, net of allowance for doubtful
accounts of $336 and $261
|
133,149 | 99,407 | ||||||
|
Inventories, net
|
723,326 | 506,484 | ||||||
|
Deferred income taxes
|
3,832 | 4,730 | ||||||
|
Other current assets
|
17,484 | 16,719 | ||||||
|
Assets held for sale
|
12,579 | - | ||||||
|
Total Current Assets
|
933,209 | 648,191 | ||||||
|
Property and equipment, net of accumulated
depreciation of $97,883 and $99,115
|
425,086 | 373,779 | ||||||
|
Goodwill
|
32,047 | 18,958 | ||||||
|
Franchise value
|
62,429 | 59,095 | ||||||
|
Deferred income taxes
|
17,123 | 29,270 | ||||||
|
Other non-current assets
|
22,808 | 16,840 | ||||||
|
Total Assets
|
$ | 1,492,702 | $ | 1,146,133 | ||||
|
|
||||||||
|
Liabilities and Stockholders' Equity
|
||||||||
|
Current Liabilities:
|
||||||||
|
Floor plan notes payable
|
$ | 13,454 | $ | 114,760 | ||||
|
Floor plan notes payable: non-trade
|
568,130 | 229,180 | ||||||
|
Current maturities of long-term debt
|
8,182 | 8,221 | ||||||
|
Trade payables
|
41,589 | 31,712 | ||||||
|
Accrued liabilities
|
81,602 | 72,711 | ||||||
|
Liabilities related to assets held for sale
|
8,347 | - | ||||||
|
Total Current Liabilities
|
721,304 | 456,584 | ||||||
|
Long-term debt, less current maturities
|
286,876 | 278,653 | ||||||
|
Deferred revenue
|
33,589 | 25,146 | ||||||
|
Other long-term liabilities
|
22,832 | 18,629 | ||||||
|
Total Liabilities
|
1,064,601 | 779,012 | ||||||
|
Stockholders' Equity:
|
||||||||
|
Preferred stock - no par value; authorized
15,000 shares; none outstanding
|
- | - | ||||||
|
Class A common stock - no par value;
authorized 100,000 shares; issued and outstanding 22,916 and 22,195
|
268,801 | 279,366 | ||||||
|
Class B common stock - no par value;
authorized 25,000 shares; issued and outstanding 2,762 and 3,762
|
343 | 468 | ||||||
|
Additional paid-in capital
|
12,399 | 10,918 | ||||||
|
Accumulated other comprehensive loss
|
(2,615 | ) | (4,508 | ) | ||||
|
Retained earnings
|
149,173 | 80,877 | ||||||
|
Total Stockholders' Equity
|
428,101 | 367,121 | ||||||
|
Total Liabilities and Stockholders' Equity
|
$ | 1,492,702 | $ | 1,146,133 | ||||
See accompanying notes to consolidated financial statements.
F-3
LITHIA MOTORS, INC. AND SUBSIDIARIES
(In thousands, except per share amounts)
| Year Ended December 31, | ||||||||||||
|
2012
|
2011
|
2010
|
||||||||||
|
Revenues:
|
||||||||||||
|
New vehicle
|
$ | 1,847,603 | $ | 1,391,375 | $ | 1,020,883 | ||||||
|
Used vehicle retail
|
833,484 | 678,571 | 558,105 | |||||||||
|
Used vehicle wholesale
|
139,237 | 128,329 | 103,817 | |||||||||
|
Finance and insurance
|
112,234 | 84,130 | 64,217 | |||||||||
|
Service, body and parts
|
347,703 | 315,958 | 277,945 | |||||||||
|
Fleet and other
|
36,226 | 34,383 | 11,655 | |||||||||
|
Total revenues
|
3,316,487 | 2,632,746 | 2,036,622 | |||||||||
|
Cost of sales:
|
||||||||||||
|
New vehicle
|
1,713,156 | 1,284,225 | 937,237 | |||||||||
|
Used vehicle retail
|
711,763 | 580,357 | 479,310 | |||||||||
|
Used vehicle wholesale
|
137,823 | 127,732 | 103,114 | |||||||||
|
Service, body and parts
|
179,633 | 163,738 | 144,003 | |||||||||
|
Fleet and other
|
34,812 | 31,410 | 10,012 | |||||||||
|
Total cost of sales
|
2,777,187 | 2,187,462 | 1,673,676 | |||||||||
|
Gross profit
|
539,300 | 445,284 | 362,946 | |||||||||
|
Asset impairments
|
115 | 1,376 | 15,301 | |||||||||
|
Selling, general and administrative
|
373,688 | 316,663 | 284,163 | |||||||||
|
Depreciation and amortization
|
17,128 | 16,427 | 17,012 | |||||||||
|
Operating income
|
148,369 | 110,818 | 46,470 | |||||||||
|
Floor plan interest expense
|
(12,816 | ) | (10,364 | ) | (10,155 | ) | ||||||
|
Other interest expense
|
(9,621 | ) | (12,878 | ) | (14,523 | ) | ||||||
|
Other income, net
|
2,525 | 694 | 420 | |||||||||
|
Income from continuing operations before income taxes
|
128,457 | 88,270 | 22,212 | |||||||||
|
Income tax provision
|
(49,062 | ) | (33,060 | ) | (8,625 | ) | ||||||
|
Income from continuing operations, net of income tax
|
79,395 | 55,210 | 13,587 | |||||||||
|
Income from discontinued operations, net of income tax
|
967 | 3,650 | 132 | |||||||||
|
Net income
|
$ | 80,362 | $ | 58,860 | $ | 13,719 | ||||||
|
Basic income per share from continuing operations
|
$ | 3.09 | $ | 2.10 | $ | 0.52 | ||||||
|
Basic income per share from discontinued operations
|
0.04 | 0.14 | 0.01 | |||||||||
|
Basic net income per share
|
$ | 3.13 | $ | 2.24 | $ | 0.53 | ||||||
|
Shares used in basic per share calculations
|
25,696 | 26,230 | 26,062 | |||||||||
|
Diluted income per share from continuing operations
|
$ | 3.03 | $ | 2.07 | $ | 0.52 | ||||||
|
Diluted income per share from discontinued operations
|
0.04 | 0.14 | - | |||||||||
|
Diluted net income per share
|
$ | 3.07 | $ | 2.21 | $ | 0.52 | ||||||
|
Shares used in diluted per share calculations
|
26,170 | 26,664 | 26,279 | |||||||||
See accompanying notes to consolidated financial statements.
F-4
LITHIA MOTORS, INC. AND SUBSIDIARIES
Consolidated Statements of Comprehensive Income
(In thousands)
| Year Ended December 31, | ||||||||||||
|
2012
|
2011
|
2010
|
||||||||||
|
Net income
|
$ | 80,362 | $ | 58,860 | $ | 13,719 | ||||||
|
Other comprehensive income (loss), net of tax:
|
||||||||||||
|
Gain (loss) on cash flow hedges, net of tax expense (benefit)
of $1,175, $195 and $(626)
|
1,893 | 361 | (1,019 | ) | ||||||||
|
Comprehensive income
|
$ | 82,255 | $ | 59,221 | $ | 12,700 | ||||||
See accompanying notes to consolidated financial statements.
F-5
LITHIA MOTORS, INC. AND SUBSIDIARIES
Consolidated Statements of Changes in Stockholders' Equity
(In thousands)
| Common Stock |
Additional
|
Accumulated
Other
|
Total
Stock-
|
|||||||||||||||||||||||||||||
| Class A |
Class B
|
Paid In
|
Income
|
Retained
|
holders'
|
|||||||||||||||||||||||||||
|
Shares
|
Amount
|
Shares
|
Amount
|
Capital
|
(Loss)
|
Earnings
|
Equity
|
|||||||||||||||||||||||||
|
Balance at December 31, 2009
|
22,036 | $ | 280,880 | 3,762 | $ | 468 | $ | 10,501 | $ | (3,850 | ) | $ | 19,039 | $ | 307,038 | |||||||||||||||||
|
Net income
|
- | - | - | - | - | - | 13,719 | 13,719 | ||||||||||||||||||||||||
|
Fair value of interest rate swap agreements, net of
tax benefit of $626
|
- | - | - | - | - | (1,019 | ) | - | (1,019 | ) | ||||||||||||||||||||||
|
Issuance of stock in connection with employee
stock plans
|
658 | 4,192 | - | - | - | - | - | 4,192 | ||||||||||||||||||||||||
|
Shares forfeited by employees
|
(9 | ) | - | - | - | - | - | - | - | |||||||||||||||||||||||
|
Repurchase of Class A common stock
|
(162 | ) | (1,626 | ) | - | - | - | - | - | (1,626 | ) | |||||||||||||||||||||
|
Compensation for stock and stock option issuances
and excess tax benefits from option exercises
|
- | 1,361 | - | - | 471 | - | - | 1,832 | ||||||||||||||||||||||||
|
Dividends paid
|
- | - | - | - | - | - | (3,919 | ) | (3,919 | ) | ||||||||||||||||||||||
|
Balance at December 31, 2010
|
22,523 | 284,807 | 3,762 | 468 | 10,972 | (4,869 | ) | 28,839 | 320,217 | |||||||||||||||||||||||
|
Net income
|
- | - | - | - | - | - | 58,860 | 58,860 | ||||||||||||||||||||||||
|
Fair value of interest rate swap agreements, net of
tax expense of $195
|
- | - | - | - | - | 361 | - | 361 | ||||||||||||||||||||||||
|
Issuance of stock in connection with employee
stock plans
|
438 | 5,654 | - | - | - | - | - | 5,654 | ||||||||||||||||||||||||
|
Issuance of restricted stock to employees
|
11 | - | - | - | - | - | - | - | ||||||||||||||||||||||||
|
Shares forfeited by employees
|
(5 | ) | - | - | - | - | - | - | - | |||||||||||||||||||||||
|
Repurchase of Class A common stock
|
(772 | ) | (13,568 | ) | - | - | - | - | - | (13,568 | ) | |||||||||||||||||||||
|
Compensation for stock and stock option issuances
and excess tax benefits from option exercises
|
- | 2,473 | - | - | (54 | ) | - | - | 2,419 | |||||||||||||||||||||||
|
Dividends paid
|
- | - | - | - | - | - | (6,822 | ) | (6,822 | ) | ||||||||||||||||||||||
|
Balance at December 31, 2011
|
22,195 | 279,366 | 3,762 | 468 | 10,918 | (4,508 | ) | 80,877 | 367,121 | |||||||||||||||||||||||
|
Net income
|
- | - | - | - | - | - | 80,362 | 80,362 | ||||||||||||||||||||||||
|
Fair value of interest rate swap agreements, net of
tax expense of $1,175
|
- | - | - | - | - | 1,893 | - | 1,893 | ||||||||||||||||||||||||
|
Issuance of stock in connection with employee
stock plans
|
647 | 8,652 | - | - | - | - | - | 8,652 | ||||||||||||||||||||||||
|
Issuance of restricted stock to employees
|
3 | - | - | - | - | - | - | - | ||||||||||||||||||||||||
|
Repurchase of Class A common stock
|
(929 | ) | (23,279 | ) | - | - | - | - | - | (23,279 | ) | |||||||||||||||||||||
|
Class B commons stock converted to Class A
common stock
|
1,000 | 125 | (1,000 | ) | (125 | ) | - | |||||||||||||||||||||||||
|
Compensation for stock and stock option issuances
and excess tax benefits from option exercises
|
- | 3,937 | - | - | 1,481 | - | - | 5,418 | ||||||||||||||||||||||||
|
Dividends paid
|
- | - | - | - | - | - | (12,066 | ) | (12,066 | ) | ||||||||||||||||||||||
|
Balance at December 31, 2012
|
22,916 | $ | 268,801 | 2,762 | $ | 343 | $ | 12,399 | $ | (2,615 | ) | $ | 149,173 | $ | 428,101 | |||||||||||||||||
See accompanying notes to consolidated financial statements.
F-6
LITHIA MOTORS, INC. AND SUBSIDIARIES
(In thousands)
| Year Ended December 31, | ||||||||||||
|
2012
|
2011
|
2010
|
||||||||||
|
Cash flows from operating activities:
|
||||||||||||
|
Net income
|
$ | 80,362 | $ | 58,860 | $ | 13,719 | ||||||
|
Adjustments to reconcile net income to net cash used in operating activities:
|
||||||||||||
|
Asset impairments
|
115 | 1,376 | 15,301 | |||||||||
|
Depreciation and amortization
|
17,128 | 16,427 | 17,012 | |||||||||
|
Depreciation and amortization within discontinued operations
|
186 | 521 | 574 | |||||||||
|
Stock-based compensation
|
3,116 | 2,001 | 2,419 | |||||||||
|
Gain on disposal of other assets
|
(747 | ) | (6,495 | ) | (107 | ) | ||||||
|
(Gain) loss from disposal activities within discontinued operations
|
621 | (4,396 | ) | 301 | ||||||||
|
Deferred income taxes
|
14,172 | 8,093 | (2,131 | ) | ||||||||
|
Excess tax benefit from share-based payment arrangements
|
(2,802 | ) | (525 | ) | (264 | ) | ||||||
|
(Increase) decrease (net of acquisitions and dispositions):
|
||||||||||||
|
Trade receivables, net
|
(33,704 | ) | (22,503 | ) | (22,881 | ) | ||||||
|
Inventories
|
(230,442 | ) | (78,202 | ) | (68,305 | ) | ||||||
|
Other current assets
|
(4,194 | ) | (13,111 | ) | (1,633 | ) | ||||||
|
Other non-current assets
|
(6,176 | ) | (1,108 | ) | (2,029 | ) | ||||||
|
Increase (decrease) (net of acquisitions and dispositions):
|
||||||||||||
|
Floor plan notes payable
|
(82,109 | ) | 13,510 | 10,550 | ||||||||
|
Trade payables
|
8,001 | 5,998 | 4,960 | |||||||||
|
Accrued liabilities
|
10,538 | 11,605 | 10,029 | |||||||||
|
Other long-term liabilities and deferred revenue
|
13,459 | 7,183 | 1,155 | |||||||||
|
Net cash used in operating activities
|
(212,476 | ) | (766 | ) | (21,330 | ) | ||||||
|
Cash flows from investing activities:
|
||||||||||||
|
Principal payments received on notes receivable
|
946 | 121 | 85 | |||||||||
|
Capital expenditures
|
(64,584 | ) | (31,673 | ) | (7,589 | ) | ||||||
|
Proceeds from sales of assets
|
6,027 | 29,677 | 10,288 | |||||||||
|
Cash paid for acquisitions, net of cash acquired
|
(44,716 | ) | (60,485 | ) | (23,691 | ) | ||||||
|
Payments for life insurance policies
|
(3,288 | ) | (900 | ) | - | |||||||
|
Proceeds from sales of stores
|
6,618 | 23,838 | 941 | |||||||||
|
Net cash used in investing activities
|
(98,997 | ) | (39,422 | ) | (19,966 | ) | ||||||
|
Cash flows from financing activities:
|
||||||||||||
|
Borrowings on floor plan notes payable: non-trade
|
348,477 | 63,145 | 24,090 | |||||||||
|
Borrowings on lines of credit
|
592,623 | 56,000 | 40,000 | |||||||||
|
Repayments on lines of credit
|
(580,269 | ) | (9,000 | ) | (24,000 | ) | ||||||
|
Principal payments on long-term debt, scheduled
|
(8,347 | ) | (10,909 | ) | (8,248 | ) | ||||||
|
Principal payments on long-term debt and capital leases, other
|
(40,765 | ) | (55,666 | ) | (40,146 | ) | ||||||
|
Proceeds from issuance of long-term debt
|
42,333 | 25,674 | 47,219 | |||||||||
|
Proceeds from issuance of common stock
|
8,652 | 5,654 | 4,192 | |||||||||
|
Repurchase of common stock
|
(23,279 | ) | (13,568 | ) | (1,626 | ) | ||||||
|
Excess tax benefit from share-based payment arrangements
|
2,802 | 525 | 264 | |||||||||
|
Decrease (increase) in restricted cash
|
3,300 | (3,300 | ) | - | ||||||||
|
Dividends paid
|
(12,066 | ) | (6,822 | ) | (3,919 | ) | ||||||
|
Net cash provided by financing activities
|
333,461 | 51,733 | 37,826 | |||||||||
|
Increase (decrease) in cash and cash equivalents
|
21,988 | 11,545 | (3,470 | ) | ||||||||
|
Cash and cash equivalents at beginning of year
|
20,851 | 9,306 | 12,776 | |||||||||
|
Cash and cash equivalents at end of year
|
$ | 42,839 | $ | 20,851 | $ | 9,306 | ||||||
|
Supplemental disclosure of cash flow information:
|
||||||||||||
|
Cash paid during the period for interest
|
$ | 22,976 | $ | 24,961 | $ | 25,357 | ||||||
|
Cash paid during the period for income taxes, net
|
36,579 | 33,722 | 8,000 | |||||||||
|
Supplemental schedule of non-cash activities:
|
||||||||||||
|
Debt issued in connection with acquisitions
|
2,609 | - | 63 | |||||||||
|
Floor plan debt acquired in connection with acquisitions
|
- | 19,348 | 1,856 | |||||||||
|
Acquisition of assets with capital leases
|
2,609 | - | 77 | |||||||||
|
Floor plan debt paid in connection with store disposals
|
6,712 | 1,784 | 2,134 | |||||||||
See accompanying notes to consolidated financial statements.
F-7
LITHIA MOTORS, INC. AND SUBSIDIARIES
NOTES TO CONSOLIDATED FINANCIAL STATEMENTS
(1) Summary of Significant Accounting Policies
Organization and Business
We are a leading operator of automotive franchises and a retailer of new and used vehicles and services. As of December 31, 2012, we offered 27 brands of new vehicles and all brands of used vehicles in 87 stores in the United States and online at
Lithia.com
. We sell new and used cars and trucks and replacement parts; provide vehicle maintenance, warranty, paint and repair services; and arrange related financing, service contracts, protection products and credit insurance.
Our dealerships are primarily located throughout the Western and Midwestern regions of the United States. We target mid-sized regional markets for domestic and import franchises and metropolitan markets for luxury franchises. We believe this strategy enables brand exclusivity with minimal competition from other dealerships with the same franchise in the market.
Basis of Presentation
The accompanying Consolidated Financial Statements reflect the results of operations, the financial position and the cash flows for Lithia Motors, Inc. and its directly and indirectly wholly owned subsidiaries. All intercompany balances and transactions have been eliminated in consolidation. The results of operations of stores classified as discontinued operations have been presented on a comparable basis for all periods presented in the accompanying Consolidated Statements of Operations. See Note 16.
Cash and Cash Equivalents
Cash and cash equivalents are defined as cash on hand and cash in bank accounts without restrictions.
Accounts Receivable
Accounts receivable include amounts due from the following:
|
·
|
various lenders for the financing of vehicles sold;
|
|
·
|
customers for vehicles sold and service and parts sales;
|
|
·
|
manufacturers for factory rebates, dealer incentives and warranty reimbursement; and
|
|
·
|
insurance companies, finance companies, and other miscellaneous receivables.
|
Receivables are recorded at invoice and do not bear interest until such time as they are 60 days past due. The allowance for doubtful accounts is estimated based on our historical write-off experience and is reviewed on a monthly basis. Account balances are charged off against the allowance after all appropriate means of collection have been exhausted and the potential for recovery is considered remote. The annual activity for charges and subsequent recoveries are immaterial. See Note 2.
Inventories
Inventories are valued at the lower of market value or cost, using a pooled approach for vehicles and the specific identification method for parts. The cost of new and used vehicle inventories includes the cost of any equipment added, reconditioning and transportation.
Manufacturers reimburse us for holdbacks, floor plan interest assistance and advertising assistance, which are reflected as a reduction in the carrying value of each vehicle purchased. We recognize advertising assistance, floor plan interest assistance, holdbacks, cash incentives and other rebates received from manufacturers that are tied to specific vehicles as a reduction to cost of sales as the related vehicles are sold.
Parts purchase discounts that we receive from the manufacturer are reflected as a reduction in the carrying value of the parts purchased from the manufacturer and are recognized as a reduction to cost of goods sold as the related inventory is sold. See Note 3.
F-8
Property and Equipment
Property and equipment are stated at cost and are depreciated over their estimated useful lives on the straight-line basis. Leasehold improvements made at the inception of the lease or during the term of the lease are amortized on a straight-line basis over the shorter of the life of the improvement or the remaining term of the lease.
The range of estimated useful lives is as follows:
|
Buildings and improvements (years)
|
5 | to |
40
|
|
Service equipment (years)
|
5 | to |
15
|
|
Furniture, office equipment, signs and fixtures (years)
|
3 | to |
10
|
The cost for maintenance, repairs and minor renewals is expensed as incurred, while significant remodels and betterments are capitalized. In addition, interest on borrowings for major capital projects, significant remodels and betterments are capitalized. Capitalized
interest becomes a part of the cost of the depreciable asset and is depreciated according to the estimated useful lives as previously stated. For the years ended December 31, 2012 and 2011, we recorded capitalized interest of $0.3 million and $0.2
million, respectively. We recorded no
capitalized interest in 2010.
When an asset is retired or otherwise disposed of, the related cost and accumulated depreciation are removed from the accounts, and any gain or loss is credited or charged to income from continuing operations.
Leased property meeting certain criteria is capitalized and the present value of the related lease payments is recorded as a liability. Amortization of capitalized leased assets is computed on a straight-line basis over the term of the lease, unless the lease transfers title or it contains a bargain purchase option, in which case, it is amortized over the asset’s useful life, and is included in depreciation expense.
Long-lived assets held and used by us are reviewed for impairment whenever events or circumstances indicate that the carrying amount of assets may not be recoverable. We consider several factors when evaluating whether there are indications of potential impairment related to our long-lived assets, including store profitability, overall macroeconomic factors and impact of our strategic management decisions. If recoverability testing is performed, we evaluate assets to be held and used by comparing the carrying amount of an asset to future net undiscounted cash flows associated with the asset, including its disposition. If such assets are considered to be impaired, the amount by which the carrying amount of the assets exceeds the fair value of the assets is recognized as a charge to income from continuing operations. See Note 4.
Goodwill
Goodwill represents the excess purchase price over the fair value of net assets acquired which is not allocable to separately identifiable intangible assets. Other identifiable intangible assets, such as franchise rights, are separately recognized if the intangible asset is obtained through contractual or other legal right or if the intangible asset can be sold, transferred, licensed or exchanged.
Goodwill is not amortized but tested for impairment at least annually, and more frequently if events or circumstances indicate the carrying value of the reporting unit more likely than not exceeds fair value. We have the option to qualitatively or quantitatively assess goodwill for impairment and in 2012 evaluated our goodwill using a quantitative assessment process. We have determined that we operate as one reporting unit for the goodwill impairment test.
We test our goodwill for impairment on October 1 of each year. We used an Adjusted Present Value (“APV”) method, a fair-value based test, to indicate the fair value of our reporting unit. Under the APV method, future cash flows based on recently prepared operating forecasts and business plans are used to estimate the future economic benefits generated by the reporting unit. Operating forecasts and cash flows include estimated revenue growth rates based on management’s forecasted sales projections and on U.S. Department of Labor, Bureau of Labor Statistics for historical consumer price index data. A discount rate is utilized to convert the forecasted cash flows to their present value equivalent representing the indicated fair value of our reporting unit. The discount rate applied to the future cash flows factors an equity market risk premium, small stock risk premium, an average peer group beta and a risk-free interest rate. We compare the indicated fair value of our reporting unit to our market capitalization, including consideration of a control premium. The control premium represents the estimated amount an investor would pay to obtain a controlling interest. We believe this reconciliation is consistent with a market participant perspective.
F-9
The quantitative impairment test of goodwill is a two step process. The first step identifies potential impairment by comparing the estimated fair value of a reporting unit with its book value. If the fair value of the reporting unit exceeds the carrying amount, goodwill is not impaired and the second step is not necessary. If the carrying value exceeds the fair value, the second step includes determining the implied fair value in the same manner as the amount of goodwill recognized in a business combination is determined. The implied fair value of goodwill is then compared with the carrying amount of goodwill to determine if an impairment loss is necessary. See Note 5.
Franchise Value
We enter into agreements (“Franchise Agreements”) with the manufacturers. Franchise value represents a right received under Franchise Agreements with manufacturers and is identified on an individual store basis.
We evaluated the useful lives of our Franchise Agreements based on the following factors:
|
●
|
certain of our Franchise Agreements continue indefinitely by their terms;
|
|
●
|
certain of our Franchise Agreements have limited terms, but are routinely renewed without substantial cost to us;
|
|
●
|
other than franchise terminations related to the unprecedented reorganizations of Chrysler and General Motors, and allowed by bankruptcy law, we are not aware of manufacturers terminating Franchise Agreements against the wishes of the franchise owners under the ordinary course of business. A manufacturer may pressure a franchise owner to sell a franchise when the owner is in breach of the franchise agreement over an extended period of time;
|
|
●
|
state dealership franchise laws typically limit the rights of the manufacturer to terminate or not renew a franchise;
|
|
●
|
we are not aware of any legislation or other factors that would materially change the retail automotive franchise system; and
|
|
●
|
as evidenced by our acquisition and disposition history, there is an active market for most automotive dealership franchises within the United States. We attribute value to the Franchise Agreements acquired with the dealerships we purchase based on the understanding and industry practice that the Franchise Agreements will be renewed indefinitely by the manufacturer.
|
Accordingly, we have determined that our Franchise Agreements will continue to contribute to our cash flows indefinitely and, therefore, have indefinite lives.
As an indefinite-lived intangible asset, franchise value is tested for impairment at least annually, and more frequently if events or circumstances indicate the carrying value may exceed fair value. The impairment test for indefinite-lived intangible assets requires the comparison of estimated fair value to carrying value. An impairment charge is recorded to the extent the fair value is less than the carrying value. We have the option to early adopt an accounting amendment that allows us to qualitatively assess indefinite-lived intangible assets for impairment. In 2012 we evaluated our indefinite-lived intangible assets using a quantitative assessment process. We have determined the appropriate unit of accounting for testing franchise value for impairment is on an individual store basis.
We test our franchise value for impairment on October 1 of each year. The quantitative assessment uses a multi-period excess earnings (“MPEE”) model to estimate the fair value of our franchises. We have determined that only certain cash flows of the store are directly attributable to franchise rights. Future cash flows are based on recently prepared operating forecasts and business plans to estimate the future economic benefits that the store will generate. Operating forecasts and cash flows include estimated revenue growth rates that are calculated based on management’s forecasted sales projections and on the U.S. Department of Labor, Bureau of Labor Statistics for historical consumer price index data. Additionally, we use a contributory asset charge to represent working capital, personal property and assembled workforce costs. A discount rate is utilized to convert the forecasted cash flows to their present value equivalent. The discount rate applied to the future cash flows factors an equity market risk premium, small stock risk premium, an average peer group beta and a risk-free interest rate. See Note 5.
F-10
Advertising
We expense production and other costs of advertising as incurred as a component of selling, general and administrative expense. Additionally, manufacturer cooperative advertising credits for qualifying, specifically-identified advertising expenditures are recognized as a reduction of advertising expense.
Advertising expense, net of manufacturer cooperative advertising credits, was $31.9 million, $23.9 million and $25.4 million for the years ended December 31, 2012, 2011 and 2010, respectively. Manufacturer cooperative advertising credits were $9.6 million in 2012, $7.8 million in 2011 and $2.5 million in 2010.
Income and Other Taxes
Income taxes are accounted for under the asset and liability method. Deferred tax assets and liabilities are recognized for the future tax consequences attributable to differences between the financial statement carrying amounts of existing assets and liabilities and their respective tax bases and operating loss and tax credit carryforwards. Deferred tax assets and liabilities are measured using enacted tax rates expected to apply to taxable income in the years in which those temporary differences are expected to be recovered or settled. The effect on deferred tax assets and liabilities of a change in tax rates is recognized in income in the period that includes the enactment date. A valuation allowance, if needed, reduces deferred tax assets when it is more likely than not that some or all of the deferred tax assets will not be realized.
When there are situations with uncertainty as to the timing of the deduction, the amount of the deduction, or the validity of the deduction, we adjust our financial statements to reflect only those tax positions that are more-likely-than-not to be sustained. Positions that meet this criterion are measured using the largest benefit that is more than 50% likely to be realized. Interest and penalties are recorded in the period incurred or accrued when related to an uncertain tax position. See Note 14.
We account for all taxes assessed by a governmental authority that are directly imposed on a revenue-producing transaction (i.e., sales, use, value-added) on a net (excluded from revenues) basis.
Concentration of Risk and Uncertainties
We purchase substantially all of our new vehicles and inventory from various manufacturers at the prevailing prices charged by auto makers to all franchised dealers. Our overall sales could be impacted by the auto manufacturers’ inability or unwillingness to supply the dealership with an adequate supply of popular models.
We depend on our manufacturers to provide a supply of vehicles which supports expected sales levels. In the event that manufacturers are unable to supply the needed level of vehicles, our financial performance may be adversely impacted.
We depend on our manufacturers to deliver high-quality, defect-free vehicles. In the event that manufacturers experience future quality issues, our financial performance may be adversely impacted.
We are subject to a concentration of risk in the event of financial distress, including potential reorganization or bankruptcy, of a major vehicle manufacturer. Our sales volume could be materially adversely impacted by the manufacturers’ or distributors’ inability to supply the stores with an adequate supply of vehicles. We also receive incentives and rebates from our manufacturers, including cash allowances, financing programs, discounts, holdbacks and other incentives. These incentives are recorded as receivables on our Consolidated Balance Sheets until payment is received. Our financial condition could be materially adversely impacted by the manufacturers’ or distributors’ inability to continue to offer these incentives and rebates at substantially similar terms, or to pay our outstanding receivables.
F-11
We enter into Franchise Agreements with the manufacturers. The Franchise Agreements generally limit the location of the dealership and provide the auto manufacturer approval rights over changes in dealership management and ownership. The auto manufacturers are also entitled to terminate the Franchise Agreement if the dealership is in material breach of the terms. Our ability to expand operations depends, in part, on obtaining consents of the manufacturers for the acquisition of additional dealerships. See also “Goodwill” and “Franchise Value” above.
We have a credit facility with a syndicate of 10 financial institutions, including four manufacturer-affiliated finance companies. Several of these financial institutions also provide mortgage financing. This credit facility is the primary source of floor plan financing for our new vehicle inventory and also provides used vehicle financing and a revolving line of credit. The term of the facility extends through April 2017, which provides a financing commitment for the next four years. At maturity our financial condition could be materially adversely impacted if lenders are unable to provide credit that has typically been extended to us or with terms unacceptable to us.
Our financial condition could be materially adversely impacted if these providers incur losses in the future or undergo funding limitations. Additionally, we exercised an option to increase the size of the credit facility within the first eight months of the agreement. We anticipate continued organic growth and growth through acquisitions. This growth will require additional credit which may be unavailable or with terms unacceptable to us. If these events were to occur, we may not be able to borrow sufficient funds to facilitate our growth.
Financial Instruments, Fair Value and Market Risks
The carrying amounts of cash equivalents, accounts receivables, trade payables, accrued liabilities and short-term borrowings approximate fair value because of the short-term nature and current market rates of these instruments.
Fair value estimates are made at a specific point in time, based on relevant market information about the financial instrument. These estimates are subjective in nature and involve uncertainties and matters of significant judgment and, therefore, cannot be determined with precision. Changes in assumptions could significantly affect the estimates. See Note 13.
We have variable rate floor plan notes payable, mortgages and other credit line borrowings that subject us to market risk exposure. At December 31, 2012, we had $746.2 million outstanding in variable rate debt. These borrowings had interest rates ranging from 1.7% to 3.2% per annum. An increase or decrease in the interest rates would affect interest expense for the period accordingly.
The fair value of long-term, fixed interest rate debt is subject to interest rate risk. Generally, the fair value of fixed interest rate debt will increase as interest rates fall because we could refinance for a lower rate. Conversely, the fair value of fixed interest rate debt will decrease as interest rates rise. The interest rate changes affect the fair value, but do not impact earnings or cash flows. We monitor our fixed interest rate debt regularly, refinancing debt that is materially above market rates if permitted. See Note 13.
We are also subject to credit risk and market risk by entering into interest rate swaps. See below and Note 12. We are generally exposed to credit or repayment risk based on our relationship with the counterparty to the transaction. We minimize the credit or repayment risk on our derivative instruments by entering into transactions with institutions whose credit rating is Aa or higher.
Derivative Financial Instruments
We enter into interest rate swap agreements to reduce our exposure to market risks from changing interest rates on our new vehicle floor plan lines of credit. All derivative instruments are recorded on the Consolidated Balance Sheets as an asset or liability at fair value. The related gains and losses on these instruments are deferred as a component of stockholders’ equity, provided specific hedge accounting criteria are met. Recognition of the deferred gains and losses occurs in the period the related cash flow item hedged is recognized as a component of floor plan interest expense. To the extent the derivative contract is determined to be ineffective, the ineffective portion is immediately recognized in earnings. See Note 12.
F-12
Use of Estimates
The preparation of financial statements in conformity with U.S. generally accepted accounting principles requires management to make estimates and assumptions that affect the amounts reported in the Consolidated Financial Statements and related notes to financial statements. Changes in such estimates may affect amounts reported in future periods.
Estimates are used in the calculation of certain reserves maintained for charge-backs on estimated cancellations of service contracts; life, accident and disability insurance policies; and finance fees from customer financing contracts. We also use estimates in the calculation of various expenses, accruals and reserves, including anticipated losses related to workers compensation insurance, anticipated losses related to self-insurance components of our property and casualty and medical insurance, self-insured lifetime lube, oil and filter service contracts, discretionary employee bonuses, warranties provided on certain products and services and stock-based compensation. We also make certain estimates regarding the assessment of the recoverability of long-lived assets, indefinite-lived intangible assets and deferred tax assets.
Revenue Recognition
Revenue from the sale of a vehicle is recognized when a contract is signed by the customer, financing has been arranged or collectability is reasonably assured and the delivery of the vehicle to the customer is made.
We do not allow the return of new or used vehicles, except where mandated by state law.
Revenue from parts and service is recognized upon delivery of the parts or service to the customer. We allow for customer returns on sales of our parts inventory up to 30 days after the sale. Most parts returns generally occur within one to two weeks from the time of sale, and are not significant.
Finance fees earned for notes placed with financial institutions in connection with customer vehicle financing are recognized, net of estimated charge-backs, as finance and insurance revenue upon acceptance of the credit by the financial institution.
Insurance income from third party insurance companies for commissions earned on credit life, accident and disability insurance policies sold in connection with the sale of a vehicle are recognized, net of anticipated cancellations, as finance and insurance revenue upon execution of the insurance contract.
Commissions from third party service contracts are recognized, net of anticipated cancellations, as finance and insurance revenue upon sale of the contracts. We also participate in future underwriting profit, pursuant to retrospective commission arrangements, which is recognized in income as earned.
Revenue related to self-insured lifetime lube, oil and filter service contracts is deferred and recognized based on expected future claims for service. The expected future claims experience is evaluated periodically to ensure it remains appropriate given actual claims history.
Asset Impairments
We perform periodic impairment tests for goodwill and franchise value and recoverability tests for long-lived assets.
As a result of these tests, we recorded asset impairments against long-lived assets totaling $0.1 million, $1.4 million and $15.3 million, respectively, in 2012, 2011 and 2010.
See Notes 4 and 16.
F-13
Stock-Based Compensation
Compensation costs associated with equity instruments exchanged for employee and director services are measured at the grant date, based on the fair value of the award, and recognized as an expense over the individual’s requisite service period (generally the vesting period of the equity award). See Note 11.
Legal Costs
We are a party to numerous legal proceedings arising in the normal course of business. We accrue for certain legal costs, including attorney fees, and potential settlement claims related to various legal proceedings that are estimable and probable. See Note 7.
Contract Origination Costs
Contract origination commissions paid to our employees directly related to the sale of our self-insured lifetime lube, oil and filter service contracts are deferred and charged to expense in proportion to the associated revenue to be recognized.
Segment Reporting
We define an operating segment as a component of an enterprise that meets the following criteria:
|
·
|
engages in business activities from which it may earn revenues and incur expenses;
|
|
·
|
operating results are regularly reviewed by the enterprise’s chief operating decision maker to make decisions about resources to be allocated to the segment and assess its performance; and
|
|
·
|
discrete financial information is available.
|
Based on this definition, we believe we operate as a single operating and reporting segment, automotive retailing. Our chief operating decision maker (“CODM”), defined to be our executive management group, evaluates our performance on a consolidated basis. Historical and forecasted operational performance is evaluated on a consolidated basis by the CODM. Additionally, allocation of future resources is evaluated on a consolidated basis as several of our functions are centralized.
Warranty
We offer a 60-day, 3,000 mile limited warranty on the sale of most retail used vehicles. We also offer a 3-year, 50,000 mile warranty on parts used in our service repair work and a 2-year warranty on tire purchases. The cost that may be incurred for these warranties is estimated at the time the related revenue is recorded. A reserve for these warranty liabilities is estimated based on current sales levels, warranty experience rates and estimated costs per claim. The annual activity for reserve increases and claims are immaterial. As of December 31, 2012 and 2011, the accrued warranty balance was $0.3 million and $0.5 million, respectively.
(2) Accounts Receivable
Accounts receivable consisted of the following (in thousands):
|
December 31,
|
2012
|
2011
|
||||||
|
Contracts in transit
|
$ | 65,597 | $ | 47,867 | ||||
|
Trade receivables
|
20,932 | 16,418 | ||||||
|
Vehicle receivables
|
21,298 | 15,930 | ||||||
|
Manufacturer receivables
|
25,658 | 19,453 | ||||||
| 133,485 | 99,668 | |||||||
|
Less: Allowance
|
(336 | ) | (261 | ) | ||||
|
Total accounts receivables, net
|
$ | 133,149 | $ | 99,407 | ||||
Contracts in transit are receivables from various lenders for the financing of vehicles that we have arranged on behalf of the customer and are typically received within five to ten days of selling a vehicle. Trade receivables are comprised of amounts due from customers, lenders for the commissions earned on financing and third parties for commissions earned on service contracts and insurance products. Vehicle receivables represent receivables for the portion of the vehicle sales price paid directly by the customer.
F-14
Manufacturer receivables represent amounts due from manufacturers including holdbacks, rebates, incentives and warranty claims.
(3) Inventories
Inventories consisted of the following (in thousands):
|
December 31,
|
2012
|
2011
|
||||||
|
New vehicles
|
$ | 563,275 | $ | 372,838 | ||||
|
Used vehicles
|
130,529 | 106,622 | ||||||
|
Parts and accessories
|
29,522 | 27,024 | ||||||
|
Total inventories
|
$ | 723,326 | $ | 506,484 | ||||
The new vehicle inventory cost is generally reduced by manufacturer holdbacks and incentives, while the related floor plan notes payable are reflective of the gross cost of the vehicle. As of December 31, 2012 and 2011, the carrying value of inventory had been reduced by $4.8 million and $3.2 million, respectively, for assistance received from manufacturers as discussed in Note 1.
(4) Property and Equipment
Property and equipment consisted of the following (in thousands):
|
December 31,
|
2012
|
2011
|
||||||
|
Land
|
$ | 128,653 | $ | 120,092 | ||||
|
Building and improvements
|
279,084 | 232,478 | ||||||
|
Service equipment
|
39,374 | 36,895 | ||||||
|
Furniture, office equipment, signs and fixtures
|
70,082 | 71,313 | ||||||
| 517,193 | 460,778 | |||||||
|
Less accumulated depreciation
|
(97,883 | ) | (99,115 | ) | ||||
| 419,310 | 361,663 | |||||||
|
Construction in progress
|
5,776 | 12,116 | ||||||
| $ | 425,086 | $ | 373,779 | |||||
Long-Lived Asset Impairment Charges
In 2012 and 2011, triggering events were determined to have occurred related to certain properties due to changes in the expected future use. In 2010, we changed our strategy related to real estate held for future development to focus on more immediate disposition to a broader market of potential buyers and allowing for the redeployment of the invested capital to higher-growth potential opportunities within our business. With this change, we received offers at prices significantly lower than the value of these properties from a long-term income approach at their highest and best use. However, given the prospect of accepting these offers and effecting a quick sale or alternatively continuing the capital investment in these non-operational properties, we decided to accept certain offers and redeploy the capital elsewhere.
As a result of these events, we tested certain long-lived assets for recovery. Based on these tests, we recorded asset impairment charges of $0.1 million, $1.4 million and $15.3 million in 2012, 2011 and 2010, respectively, on our Consolidated Statements of Operations.
F-15
(5) Goodwill and Franchise Value
The following is a roll-forward of goodwill (in thousands):
|
Goodwill
|
||||
|
Balance as of December, 31, 2010, gross
|
$ | 305,452 | ||
|
Accumulated impairment losses
|
(299,266 | ) | ||
|
Balance as of December 31, 2010, net
|
6,186 | |||
|
Additions through acquisitions
|
12,869 | |||
|
Goodwill allocation to dispositions
|
(97 | ) | ||
|
Balance as of December 31, 2011, net
|
18,958 | |||
|
Additions through acquisitions
|
13,710 | |||
|
Goodwill allocation to dispositions
|
(621 | ) | ||
|
Balance as of December 31, 2012, net
|
$ | 32,047 | ||
The following is a roll-forward of franchise value (in thousands):
|
Franchise
Value
|
||||
|
Balance as of December 31, 2010
|
$ | 45,193 | ||
|
Additions through acquisitions
|
14,517 | |||
|
Transfers to discontinued operations
|
(615 | ) | ||
|
Balance as of December 31, 2011
|
59,095 | |||
|
Additions through acquisitions
|
5,174 | |||
|
Transfers to discontinued operations
|
(1,840 | ) | ||
|
Balance as of December 31, 2012
|
$ | 62,429 | ||
Below is a summary of our outstanding balances on credit facilities and long-term debt (in thousands):
|
December 31,
|
2012
|
2011
|
||||||
|
New vehicle floor plan commitment
(1) (2)
|
$ | 568,130 | $ | 229,180 | ||||
|
Floor plan notes payable
(2)
|
13,454 | 114,760 | ||||||
|
Total floor plan debt
|
581,584 | 343,940 | ||||||
|
Used vehicle inventory financing facility
|
78,309 | - | ||||||
|
Revolving line of credit
|
21,045 | 87,000 | ||||||
|
Real estate mortgages
|
192,928 | 194,404 | ||||||
|
Other debt
|
2,776 | 5,470 | ||||||
|
Total debt
|
$ | 876,642 | $ | 630,814 | ||||
|
(1)
|
We have a $575 million new vehicle floor plan commitment as part of our credit facility.
|
|
(2)
|
At December 31, 2012, an additional $6.9 million of floor plan notes payable outstanding on our new vehicle floor plan commitment and $1.4 million of floor plan notes payable on vehicles designated as service loaners are recorded as liabilities related to assets held for sale.
|
Credit Facility
On April 17, 2012, we executed a new five-year $650 million credit facility with a syndicate of 10 financial institutions, including four manufacturer-affiliated finance companies. On December 19, 2012, we amended the loan agreement to expand the available loan commitment to $800 million, allocating the financing commitment to $575 million in new vehicle inventory floor plan financing, $80 million in used vehicle inventory financing and $145 million on a revolving line of credit for general corporate purposes, including acquisitions and working capital. All borrowings from, and repayments to, our syndicated lending group are presented in the Consolidated Statements of Cash Flows as financing activities.
F-16
The new vehicle floor plan financing commitment is collateralized by our new vehicle inventory. Our used vehicle inventory financing facility is collateralized by our used vehicle inventory that is less than 180 days old. Our revolving line of credit is collateralized by our outstanding contracts in transit, other eligible receivables, parts and accessories and equipment. If the outstanding principal balance on our new vehicle inventory floor plan facility, plus requests on any day, exceeds 95% of the loan commitment, a portion of the revolving loan commitment must be reserved. The reserve amount is equal to the lesser of $15.0 million or the maximum revolving loan commitment less the outstanding balance on the loan less outstanding letters of credit. The reserve amount will decrease the revolving loan availability and may be used to repay the new vehicle floor plan balance.
The interest rate on the credit facility varies based on the type of debt with the rate ranging from the one-month LIBOR plus 1.5% to the one-month LIBOR plus 2.0%. Our financial covenants related to this credit facility include maintaining a current ratio of not less than 1.20x, a fixed charge coverage ratio of not less than 1.20x and a leverage ratio of not more than 5.0x.
The interest rate associated with our new vehicle floor plan commitment, excluding the effects of our interest rate swaps, was 1.7% at December 31, 2012.
New Vehicle Floor Plan Lines
We have additional floor plan agreements with manufacturer-affiliated finance companies for vehicles that are designated for use as service loaners. At December 31, 2012, $13.5 million was outstanding on these agreements. Borrowings from, and repayments to, manufacturer-affiliated finance companies are classified as operating activities on the Consolidated Statements of Cash Flows.
Real Estate Mortgages and Other Debt
We have mortgages associated with our owned real estate. Interest rates related to this debt ranged from 1.8% to 5.9% at December 31, 2012 with fixed interest rates on 66% of our outstanding mortgages. The mortgages are payable in various installments through May 2031.
Our other debt includes various notes, capital leases and obligations assumed as a result of acquisitions and other agreements and had interest rates that ranged from 2.0% to 9.0% at December 31, 2012. This debt, which totaled $2.8 million at December 31, 2012, is due in various installments through May 2019.
Future Principal Payments
The schedule of future principal payments on long-term debt as of December 31, 2012 was as follows (in thousands):
|
Year Ending December 31,
|
||||
|
2013
|
$ | 8,182 | ||
|
2014
|
8,459 | |||
|
2015
|
8,713 | |||
|
2016
|
32,885 | |||
|
2017
|
109,216 | |||
|
Thereafter
|
127,603 | |||
|
Total principal payments
|
$ | 295,058 | ||
(7) Commitments and Contingencies
Leases
We lease certain facilities under non-cancelable operating and capital leases. These leases expire at various dates through 2066. Certain lease commitments contain fixed payment increases at predetermined intervals over the life of the lease, while other lease commitments are subject to escalation clauses of an amount equal to the increase in the cost of living based on the “Consumer Price Index - U.S. Cities Average - All Items for all Urban Consumers” published by the U.S. Department of Labor, or a substantially equivalent regional index. Lease expense related to operating leases is recognized on a straight-line basis over the life of the lease.
F-17
The minimum lease payments under our operating and capital leases after December 31, 2012 are as follows (in thousands):
|
Year Ending December 31,
|
||||
|
2013
|
$ | 17,188 | ||
|
2014
|
15,749 | |||
|
2015
|
14,317 | |||
|
2016
|
12,948 | |||
|
2017
|
10,666 | |||
|
Thereafter
|
72,968 | |||
|
Total minimum lease payments
|
143,836 | |||
|
Less: sublease rentals
|
(7,785 | ) | ||
| $ | 136,051 | |||
Rent expense, net of sublease income, for all operating leases was $15.2 million, $13.3 million and $12.6 million for the years ended December 31, 2012, 2011 and 2010, respectively. These amounts are included as a component of selling, general and administrative expenses in our Consolidated Statements of Operations.
In connection with dispositions of dealerships, we occasionally assign or sublet our interests in any real property leases associated with such dealerships to the purchaser. We often retain responsibility for the performance of certain obligations under such leases to the extent that the assignee or sublessee does not perform. Additionally, we may remain subject to the terms of any guarantees and have correlating indemnification rights against the assignee or sublessee in the event of non-performance, as well as certain other defenses. We may also be called upon to perform other obligations under these leases, such as environmental remediation of the premises or repairs upon termination of the lease. We currently have no reason to believe that we will be called upon to perform any such services; however, there can be no assurance that any future performance required by us under these leases will not have a material adverse effect on our financial condition or results of operations.
Certain of our facilities where a lease obligation still exists have been vacated for business reasons. In these instances, we make efforts to find qualified tenants to sublease the facilities and assume financial responsibility. However, due to the specific nature and size of the facilities used in our dealerships, tenants are not always available. Liabilities have been accrued to reflect our estimate of future lease obligations. These amounts were not material to our Consolidated Statements of Operations during 2012, 2011 and 2010 and the amounts accrued at December 31, 2012 and 2011 were not material.
Capital Expenditures
Capital expenditures were $64.6 million, $31.7 million and $7.6 million for 2012, 2011 and 2010, respectively. The increase in capital expenditures in 2012 compared to 2011 and 2011 compared to 2010 was related to improvements at certain of our store facilities, the purchase of previously leased facilities, the purchase of new store locations, replacement of equipment and construction of, and relocation to, a new headquarters building.
Many manufacturers provide assistance in the form of additional vehicle incentives if facilities meet image standards and requirements. We believe it is an attractive time to invest in certain internal initiatives that will generate additional manufacturer incentive payments, particularly from our domestic partners. Also, recently enacted tax law changes that accelerate deductions for capital expenditures have accelerated project timelines to ensure completion before the law expires.
In the event we undertake a significant capital commitment in the future, we expect to pay for the commitment out of existing cash balances, construction financing and borrowings on our credit facility. Upon completion of the projects, we would anticipate securing long-term financing and general borrowings from third party lenders for 70% to 90% of the amounts expended, although no assurances can be provided that these financings will be available to us in sufficient amounts or on terms acceptable to us.
F-18
Charge-Backs for Various Contracts
We have recorded a liability of $13.5 million as of December 31, 2012 for our estimated contractual obligations related to potential charge-backs for vehicle service contracts, lifetime oil change contracts and other various insurance contracts that are terminated early by the customer. We estimate that the charge-backs will be paid out as follows (in thousands):
|
Year Ending December 31,
|
||||
|
2013
|
$ | 7,540 | ||
|
2014
|
3,792 | |||
|
2015
|
1,553 | |||
|
2016
|
491 | |||
|
2017
|
118 | |||
|
Thereafter
|
10 | |||
|
Total
|
$ | 13,504 | ||
Lifetime Lube, Oil and Filter Contracts
In March 2009, we entered into a transaction related to existing lifetime lube, oil and filter contracts, in which we assumed the obligation to provide future services under the purchased contracts. As of December 31, 2012, we had a remaining balance of $4.0 million. We estimate the deferred revenue associated with this assumed obligation will be recognized as follows (in thousands):
|
Year Ending December 31,
|
|||||
|
2013
|
$ | 1,090 | |||
|
2014
|
850 | ||||
|
2015
|
654 | ||||
|
2016
|
488 | ||||
|
2017
|
349 | ||||
|
Thereafter
|
559 | ||||
|
Total
|
$ | 3,990 | |||
We periodically evaluate the estimated future costs of these contracts and record a charge if future expected claim and cancellation costs exceed the deferred revenue to be recognized. In 2011 and 2010, our analysis indicated expected costs had increased as experience rates changed due to customers retaining their cars for longer periods of time compared to our historical experience. We recorded a charge of $1.0 million in both 2011 and 2010, as a component of cost of sales in our Consolidated Statements of Operations. As of December 31, 2012, we had a reserve balance of $4.0 million recorded as a component of accrued liabilities and other long-term liabilities on our Consolidates Balance Sheet.
We retain the obligation for lifetime lube, oil and filter service contracts sold to our customers and record deferred revenues related to these contracts. At the time of sale, we defer the full sale price and recognize the revenue based on the rate we expect future costs to be incurred. As of December 31, 2012, we had a deferred revenue balance of $33.9 million associated with these contracts and estimate the deferred revenue will be recognized as follows (in thousands):
|
Year Ending December 31,
|
||||
|
2013
|
$ | 8,448 | ||
|
2014
|
5,839 | |||
|
2015
|
4,541 | |||
|
2016
|
3,547 | |||
|
2017
|
2,827 | |||
|
Thereafter
|
8,721 | |||
|
Total
|
$ | 33,923 | ||
Self-insurance Programs
We self-insure a portion of our property and casualty insurance, medical insurance and workers’ compensation insurance. A third-party is engaged to assist in estimating the loss exposure related to the self-retained portion of the risk associated with these insurances. Additionally, we analyze our historical loss and claims experience to estimate the loss exposure associated with these programs. As of December 31, 2012 and 2011, we had liabilities associated with these programs of $12.4 million and $10.4 million, respectively, recorded as a component of accrued liabilities and other long-term liabilities on our Consolidated Balance Sheets.
F-19
Regulatory Compliance
We are subject to numerous state and federal regulations common in the automotive sector that cover retail transactions with customers and employment and trade practices. We do not anticipate that compliance with these regulations will have an adverse effect on our business, consolidated results of operations, financial condition or cash flows, although such outcome is possible given the nature of our operations and the legal and regulatory environment affecting our business.
Litigation
We are party to numerous legal proceedings arising in the normal course of our business. Although we do not anticipate that the resolution of legal proceedings arising in the normal course of business or the proceedings described below will have a material adverse effect on our business, results of operations, financial condition, or cash flows, we cannot predict this with certainty.
Alaska Consumer Protection Act Claims
In December 2006, a suit was filed against us (Jackie Neese, et al vs. Lithia Chrysler Jeep of Anchorage, Inc, et al, Case No. 3AN-06-13341 CI, and in April, 2007, a second case (Jackie Neese, et al vs. Lithia Chrysler Jeep of Anchorage, Inc, et al, Case No. 3AN-06-4815 CI) (now consolidated)), in the Superior Court for the State of Alaska, Third Judicial District at Anchorage. In the suits, plaintiffs alleged that we, through our Alaska dealerships, engaged in three practices that purportedly violate Alaska consumer protection laws: (i) charging customers dealer fees and costs (including document preparation fees) not disclosed in the advertised price, (ii) failing to disclose the acquisition, mechanical and accident history of used vehicles or whether the vehicles were originally manufactured for sale in a foreign country, and (iii) engaging in deception, misrepresentation and fraud by providing to customers financing from third parties without disclosing that we receive a fee or discount for placing that loan (a “dealer reserve”). The suit seeks statutory damages of $500 for each violation (or three times plaintiff’s actual damages, whichever is greater), and attorney fees and costs and the plaintiffs sought class action certification. Before and during the pendency of these suits, we engaged in settlement discussions with the State of Alaska through its Office of Attorney General with respect to the first two practices enumerated above. As a result of those discussions, we entered into a Consent Judgment subject to court approval and permitted potential class members to “opt-out” of the proposed settlement. Counsel for the plaintiffs attempted to intervene and, after various motions, hearings and an appeal to the state Court of Appeals, the Consent Judgment became final.
Plaintiffs then filed a motion in November 2010 seeking certification of a class (i) for the 339 customers who “opted-out” of the state settlement, (ii) for those customers who did not qualify for recovery under the Consent Judgment but were allegedly eligible for recovery under the plaintiffs’ broader interpretation of the applicable statutes, and (iii) arguing that since the State’s suit against our dealerships did not address the loan fee/discount (dealer reserve) claim, for those customers who arranged their vehicle financing through us. On June 14, 2011, the Trial Court granted plaintiffs’ motion to certify a class without addressing either the merits of the claims or the size of the classes. Discovery in this case is ongoing. We intend to defend the claims vigorously and do not believe the novel “dealer reserve” claim has merit.
The ultimate resolution of these matters cannot be predicted with certainty, and an unfavorable resolution of any of the matters could have a material adverse effect on our results of operations, financial condition or cash flows.
(8) Stockholders’ Equity
Class A and Class B Common Stock
The shares of Class A common stock are not convertible into any other series or class of our securities. Each share of Class B common stock, however, is freely convertible into one share of Class A common stock at the option of the holder of the Class B common stock. All shares of Class B common stock shall automatically convert to shares of Class A common stock (on a share-for-share basis, subject to adjustment) on the earliest record date for an annual meeting of our stockholders on which the number of shares of Class B common stock outstanding is less than 1% of the total number of shares of common stock outstanding. Shares of Class B common stock may not be transferred to third parties, except for transfers to certain family members and in other limited circumstances.
F-20
Holders of Class A common stock are entitled to one vote for each share held of record and holders of Class B common stock are entitled to ten votes for each share held of record. The Class A common stock and Class B common stock vote together as a single class on all matters submitted to a vote of stockholders.
Repurchases of Class A Common Stock
In June 2000, our Board of Directors authorized the repurchase of up to 1,000,000 shares of our Class A common stock. As of December 31, 2011, we had purchased all available shares under this program.
In August 2011, our Board of Directors authorized the repurchase of up to 2,000,000 shares of our Class A common stock and, on July 20, 2012, our Board of Directors authorized the repurchase of 1,000,000 additional shares of our Class A common stock.
Through December 31, 2012, we had purchased 1,145,147 shares under these programs at an average price of $22.33 per share. As of December 31, 2012, 1,854,853 shares remained available for purchase pursuant to these programs
.
These plans do not have an expiration date and we may continue to repurchase shares from time to time as conditions warrant.
The following is a summary of our repurchases in the years ended December 31, 2012, 2011 and 2010.
|
Year Ended December 31,
|
||||||||||||
|
2012
|
2011
|
2010
|
||||||||||
|
Shares repurchased
(1)
|
848,092 | 716,431 | 100,893 | |||||||||
|
Total purchase price (in thousands)
|
$ | 20,698 | $ | 12,389 | $ | 795 | ||||||
|
Average purchase price per share
|
$ | 24.41 | $ | 17.29 | $ | 7.88 | ||||||
|
(1)
|
Includes only shares repurchased under repurchase plans. An additional 80,687, 56,012 and 61,153 shares were repurchased in association with tax withholdings on the exercise of stock options in 2012, 2011 and 2010, respectively.
|
Dividends
For the period January 1, 2010 through December 31, 2012, we declared and paid dividends on our Class A and Class B Common Stock as follows:
|
Quarter declared
|
Dividend amount per Class A and Class B share
|
Total amount of dividend
(in thousands)
|
||||||
|
2010
|
||||||||
|
First quarter
|
$ | - | $ | - | ||||
|
Second quarter
|
0.05 | 1,300 | ||||||
|
Third quarter
|
0.05 | 1,307 | ||||||
|
Fourth quarter
|
0.05 | 1,312 | ||||||
|
2011
|
||||||||
|
First quarter
|
$ | 0.05 | $ | 1,316 | ||||
|
Second quarter
|
0.07 | 1,851 | ||||||
|
Third quarter
|
0.07 | 1,838 | ||||||
|
Fourth quarter
|
0.07 | 1,817 | ||||||
|
2012
|
||||||||
|
First quarter
|
$ | 0.07 | $ | 1,815 | ||||
|
Second quarter
|
0.10 | 2,583 | ||||||
|
Third quarter
|
0.10 | 2,545 | ||||||
|
Fourth quarter
|
0.20 | 5,123 | (1) | |||||
|
(1)
|
In November 2012, we paid dividends of $2.5 million that had been declared in October 2012. An additional dividend payment of $2.6 million was declared and paid in December 2012 in lieu of the dividend typically declared and paid in March of the following year.
|
F-21
(9) Net Income Per Share of Class A and Class B Common Stock
We compute net income per share of Class A and Class B common stock using the two-class method. Under this method, basic net income per share is computed using the weighted average number of common shares outstanding during the period excluding unvested common shares subject to repurchase or cancellation. Diluted net income per share is computed using the weighted average number of common shares and, if dilutive, potential common shares outstanding during the period. Potential common shares consist of the incremental common shares issuable upon the exercise of stock options and unvested restricted shares subject to repurchase or cancellation. The dilutive effect of outstanding stock options and other grants is reflected in diluted earnings per share by application of the treasury stock method. The computation of the diluted net income per share of Class A common stock assumes the conversion of Class B common stock, while the diluted net income per share of Class B common stock does not assume the conversion of those shares.
Except with respect to voting and transfer rights, the rights of the holders of our Class A and Class B common stock are identical. Our Restated Articles of Incorporation require that the Class A and Class B common stock must share equally in any dividends, liquidation proceeds or other distribution with respect to our common stock and the Articles of Incorporation can only be amended by a vote of the stockholders. Additionally, Oregon law provides that amendments to our Articles of Incorporation, which would have the effect of adversely altering the rights, powers or preferences of a given class of stock, must be approved by the class of stock adversely affected by the proposed amendment. As a result, the undistributed earnings for each year are allocated based on the contractual participation rights of the Class A and Class B common shares as if the earnings for the year had been distributed. Because the liquidation and dividend rights are identical, the undistributed earnings are allocated on a proportionate basis.
Following is a reconciliation of the income from continuing operations and weighted average shares used for our basic earnings per share (“EPS”) and diluted EPS for the years ended December 31, 2012, 2011 and 2010 (in thousands, except per share amounts):
|
Year Ended December 31,
|
2012
|
2011
|
2010
|
|||||||||||||||||||||
|
Basic EPS
|
Class A
|
Class B
|
Class A
|
Class B
|
Class A
|
Class B
|
||||||||||||||||||
|
Numerator:
|
||||||||||||||||||||||||
|
Income from continuing operations applicable to common stockholders
|
$ | 69,069 | $ | 10,326 | $ | 47,292 | $ | 7,918 | $ | 11,626 | $ | 1,961 | ||||||||||||
|
Distributed income applicable to common stockholders
|
(10,497 | ) | (1,569 | ) | (5,844 | ) | (978 | ) | (3,353 | ) | (566 | ) | ||||||||||||
|
Basic undistributed income from continuing operations applicable to common stockholders
|
$ | 58,572 | $ | 8,757 | $ | 41,448 | $ | 6,940 | $ | 8,273 | $ | 1,395 | ||||||||||||
|
Denominator:
|
||||||||||||||||||||||||
|
Weighted average number of shares out-standing used to calculate basic income per share
|
22,354 | 3,342 | 22,468 | 3,762 | 22,300 | 3,762 | ||||||||||||||||||
|
Basic income from continuing operations per share applicable to common stockholders
|
$ | 3.09 | $ | 3.09 | $ | 2.10 | $ | 2.10 | $ | 0.52 | $ | 0.52 | ||||||||||||
|
Basic distributed income per share applicable to common stockholders
|
(0.47 | ) | (0.47 | ) | (0.26 | ) | (0.26 | ) | (0.15 | ) | (0.15 | ) | ||||||||||||
|
Basic undistributed income from continuing operations per share applicable to common stockholders
|
$ | 2.62 | $ | 2.62 | $ | 1.84 | $ | 1.84 | $ | 0.37 | $ | 0.37 | ||||||||||||
F-22
|
Year Ended December 31,
|
2012
|
2011
|
2010
|
|||||||||||||||||||||
|
Diluted EPS
|
Class A
|
Class B
|
Class A
|
Class B
|
Class A
|
Class B
|
||||||||||||||||||
|
Numerator:
|
||||||||||||||||||||||||
|
Distributed income applicable to common stockholders
|
$ | 10,497 | $ | 1,569 | $ | 5,844 | $ | 978 | $ | 3,353 | $ | 566 | ||||||||||||
|
Reallocation of distributed income as a result of conversion of dilutive stock options
|
28 | (28 | ) | 15 | (15 | ) | 5 | (5 | ) | |||||||||||||||
|
Reallocation of distributed income due to conversion of Class B to Class A
|
1,541 | - | 963 | - | 561 | - | ||||||||||||||||||
|
Diluted distributed income applicable to common stockholders
|
$ | 12,066 | $ | 1,541 | $ | 6,822 | $ | 963 | $ | 3,919 | $ | 561 | ||||||||||||
|
Undistributed income from continuing operations applicable to common stockholders
|
$ | 58,572 | $ | 8,757 | $ | 41,448 | $ | 6,940 | $ | 8,273 | $ | 1,395 | ||||||||||||
|
Reallocation of undistributed income as a result of conversion of dilutive stock options
|
159 | (159 | ) | 113 | (113 | ) | 11 | (11 | ) | |||||||||||||||
|
Reallocation of undistributed income due to conversion of Class B to Class A
|
8,598 | - | 6,827 | - | 1,384 | - | ||||||||||||||||||
|
Diluted undistributed income from continuing operations applicable to common stockholders
|
$ | 67,329 | $ | 8,598 | $ | 48,388 | $ | 6,827 | $ | 9,668 | $ | 1,384 | ||||||||||||
|
Denominator:
|
||||||||||||||||||||||||
|
Weighted average number of shares outstanding used to calculate basic income per share
|
22,354 | 3,342 | 22,468 | 3,762 | 22,300 | 3,762 | ||||||||||||||||||
|
Weighted average number of shares from stock options
|
474 | - | 434 | - | 217 | - | ||||||||||||||||||
|
Conversion of Class B to Class A
|
3,342 | - | 3,762 | - | 3,762 | - | ||||||||||||||||||
|
Weighted average number of shares outstanding used to calculate diluted income per share
|
26,170 | 3,342 | 26,664 | 3,762 | 26,279 | 3,762 | ||||||||||||||||||
|
Year Ended December 31,
|
2012
|
2011
|
2010
|
|||||||||||||||||||||
|
Diluted EPS
|
Class A
|
Class B
|
Class A
|
Class B
|
Class A
|
Class B
|
||||||||||||||||||
|
Diluted income from continuing operations per share available to common stockholders
|
$ | 3.03 | $ | 3.03 | $ | 2.07 | $ | 2.07 | $ | 0.52 | $ | 0.52 | ||||||||||||
|
Diluted distributed income from continuing operations per share applicable to common stockholders
|
(0.47 | ) | (0.47 | ) | (0.26 | ) | (0.26 | ) | (0.15 | ) | (0.15 | ) | ||||||||||||
|
Diluted undistributed income from continuing operations per share applicable to common stockholders
|
$ | 2.56 | $ | 2.56 | $ | 1.81 | $ | 1.81 | $ | 0.37 | $ | 0.37 | ||||||||||||
|
Antidilutive Securities:
|
||||||||||||||||||||||||
|
Shares issuable pursuant to stock options not included since they were antidilutive
|
45 | - | 280 | - | 661 | - | ||||||||||||||||||
F-23
(10) 401(k) Profit Sharing, Deferred Compensation and Long-term Incentive Plans
We have a defined contribution 401(k) plan and trust covering substantially all full-time employees. The annual contribution to the plan is at the discretion of our Board of Directors. Contributions of $1.9 million, $1.7 million and $0.6 million were recognized for the years ended December 31, 2012, 2011 and 2010, respectively. Employees may contribute to the plan if they meet certain eligibility requirements.
We offer a deferred compensation and long-term incentive plan (the “Plan”) to provide certain employees the ability to accumulate assets for retirement on a tax deferred basis. We may make discretionary contributions to the Plan. Discretionary contributions vest between one and seven years based on the employee’s age and position. Additionally, participants may defer a portion of their compensation and are fully vested in their respective deferrals.
We made a discretionary contribution of $1.9 million and $1.3 million in 2012 and 2011, respectively, to the Plan. No discretionary contribution was made in 2010. Participants received a guaranteed return of 5.9% in 2012 and 6.0% in 2011. We recognized compensation expense related to the Plan of $1.2 million and $0.9 million in 2012 and 2011, respectively. We did not recognize any compensation expense in 2010 associated with the Plan. As of December 31, 2012, the balance due to participants was $3.6 million and was included as a component of other long-term liabilities in the Consolidated Balance Sheets.
(11) Stock Based Compensation
2003 Stock Incentive Plan
Our 2003 Stock Incentive Plan, as amended, (the “2003 Plan”) allows for the granting of up to a total of 2.8 million nonqualified stock options and shares of restricted stock to our officers, key employees, directors and consultants. Our plan is administered by the Compensation Committee of the Board of Directors and permit accelerated vesting of outstanding awards upon the occurrence of certain changes in control. Options become exercisable over a period of up to five years from the date of grant with expiration dates up to ten years from the date of grant and at exercise prices of not less than market value, as determined by the Board of Directors. Restricted stock grants vest over a period up to five years from the date of grant. Beginning in 2004, the expiration date of options granted was reduced to six years.
At December 31, 2012, 667,859 shares of Class A common stock were available for future grants.
Activity under our stock incentive plans was as follows:
|
Shares subject
to options
|
Weighted average
exercise price
|
Aggregate intrinsic value
(in millions)
|
Weighted average
remaining contractual term
(in years)
|
||||||||||||
|
Balance, December 31, 2011
|
811,176 | $ | 12.69 | ||||||||||||
|
Granted
|
- | - | |||||||||||||
|
Forfeited
|
(59,793 | ) | 9.12 | ||||||||||||
|
Expired
|
(90,000 | ) | 31.67 | ||||||||||||
|
Exercised
|
(407,884 | ) | 13.02 | ||||||||||||
|
Balance, December 31, 2012
|
253,499 | $ | 6.26 | $ |
7.9
|
1.6
|
|||||||||
|
Exercisable, December 31, 2012
|
253,499 | $ | 6.26 | $ |
7.9
|
1.6
|
|||||||||
F-24
|
Non-vested
stock grants
|
Weighted average
grant date fair value
|
|||||||
|
Balance, December 31, 2011
|
590,550 | $ | 8.72 | |||||
|
Granted
|
225,664 | 23.82 | ||||||
|
Vested
|
(144,591 | ) | 11.19 | |||||
|
Forfeited
|
(19,680 | ) | 10.25 | |||||
|
Balance, December 31, 2012
|
651,943 | $ | 13.35 | |||||
We estimate the fair value of stock options using the Black-Scholes valuation model. This valuation model takes into account the exercise price of the award, as well as a variety of significant assumptions. We believe that the valuation technique and the approach utilized to develop the underlying assumptions are appropriate in calculating the fair values of our stock options. Estimates of fair value are not intended to predict actual future events or the value ultimately realized by persons who receive equity awards.
Compensation expense related to stock options granted in 2010 is based on values calculated using the Black-Scholes valuation model. No stock options were granted in 2011 or 2012. Below are the significant assumptions used in the Black-Scholes valuation model:
|
Year Ended December 31,
|
2010
|
|||
|
Risk-free interest rate
(1)
|
2.53 | % | ||
|
Dividend yield
(2)
|
2.54 | % | ||
|
Expected term
(3)
(in years)
|
4.2
|
|||
|
Volatility
(4)
|
81.22 | % | ||
|
Discount for post-vesting restrictions
|
0.0 | % | ||
|
(1)
|
The risk-free interest rate for each grant is based on the U.S. Treasury yield curve in effect at the time of grant for a period equal to the expected term of the stock option.
|
|
(2)
|
The dividend yield is calculated as a ratio of annualized expected dividends per share to the market value of our common stock on the date of grant.
|
|
(3)
|
The expected term is calculated based on the observed and expected time to post-vesting exercise behavior of identifiable employee groups.
|
|
(4)
|
The expected volatility is estimated based on a weighted average of historical volatility of our common stock.
|
Compensation expense related to non-vested stock is based on the intrinsic value on the date of grant as if the stock is vested.
We amortize stock-based compensation on a straight-line basis over the vesting period of the individual award with estimated forfeitures considered. Shares to be issued upon the exercise of stock options will come from newly issued shares.
As of December 31, 2012, unrecognized stock-based compensation related to outstanding, but unvested stock options and stock awards was $5.1 million, which will be recognized over the remaining weighted average vesting period of 2.0 years.
2009 Employee Stock Purchase Plan
The 2009 Employee Stock Purchase Plan (the “2009 ESPP”) allows for the issuance of 1,500,000 shares of our Class A common stock. The 2009 ESPP replaced the 1998 Employee Stock Purchase Plan, which was terminated. The 2009 ESPP is intended to qualify as an “Employee Stock Purchase Plan” under Section 423 of the Internal Revenue Code of 1986, as amended, and is administered by the Compensation Committee of the Board of Directors.
Eligible employees are entitled to defer up to 10% of their base pay for the purchase of stock, up to $25,000 of fair market value of our Class A common stock annually. The purchase price is equal to 85% of the fair market value at the end of the purchase period. During 2012, a total of 143,071 shares were purchased under the 2009 ESPP at a weighted average price of $24.28 per share, which represented a weighted average discount from the fair market value of $4.29 per share. As of December 31, 2012, 681,293 shares remained available for purchase under the 2009 ESPP.
F-25
Compensation expense related to our 2009 ESPP is calculated based on the 15% discount from the per share market price on the date of grant.
RSU Grants
In the first quarter of 2012, we granted 168,000 restricted stock units (“RSUs”) to certain employees, of which grants to executives and other key employees are subject to performance measures discussed below. Each grant entitles the holder to receive shares of our Class A common stock upon vesting. A quarter of the RSUs vest on each of the second and third anniversaries of the grant date and the remaining RSUs vest on the fourth anniversary of the grant date.
Our executives and other key employees received 89,000 of the 168,000 RSUs granted based on attaining a target level of earnings per share for 2012. The RSUs are subject to forfeiture, in whole or in part, based upon 2012 minimum performance measures and continuation of employment. If minimum performance measures were met, the number of RSUs received under these grants was subject to attainment of specific earnings per share thresholds. Each earnings per share threshold specified an attainment level ranging from 75% to 150% of the base number of units identified in the grant. Failure to achieve the minimum performance threshold in 2012 would have resulted in forfeiture of the entire grant. The final attainment was calculated at 150% using the 2012 adjusted net income per share from continuing operations for a total award of 133,500 RSUs. After final attainment, these RSUs vest over four years. We initially estimated compensation expense, based on a fair value methodology and a 133% attainment level, of $4.2 million related to the RSUs. We increased the estimated compensation expense to $4.6 million based on the final attainment level of 150%. Total compensation expense is being recognized over the vesting period. Of this amount, $1.0 million was recognized in 2012.
In the second quarter of 2012, we granted RSUs covering 12,870 shares of our Class A common stock to members of our Board of Directors. These awards vest 25% on the first day of each month following our quarterly board meetings. We estimated compensation expense, based on a fair value methodology, of $0.4 million related to these RSUs, which is being recognized over the vesting period. Of this amount, $0.3 million was recognized in 2012.
Stock-Based Compensation
Certain information regarding our stock-based compensation was as follows:
|
Year Ended December 31,
|
2012
|
2011
|
2010
|
|||||||||
|
Weighted average grant-date fair value per share of stock options granted
|
$ | - | $ | - | $ | 4.19 | ||||||
|
Per share intrinsic value of non-vested stock granted
|
23.82 | 13.58 | 6.02 | |||||||||
|
Weighted average per share discount for compensation expense recognized under the 2009 ESPP
|
4.29 | 2.56 | 1.11 | |||||||||
|
Total intrinsic value of stock options exercised (in millions)
|
7.2
|
1.5
|
1.1
|
|||||||||
|
Fair value of non-vested stock that vested during the period (in millions)
|
3.5
|
0.7
|
0.4
|
|||||||||
|
Stock-based compensation recognized in results of operations, as a component of selling, general and administrative expense - excludes compensation expense related to an option granted to one of our executives. See Note 18. (in millions)
|
3.1
|
2.3
|
1.8
|
|||||||||
|
Tax benefit recognized in Consolidated Statements of Operations (in millions)
|
1.0
|
0.7
|
0.5
|
|||||||||
|
Cash received from options exercised and shares purchased under all share-based arrangements (in millions)
|
8.8
|
5.8
|
4.2
|
|||||||||
|
Tax deduction realized related to stock options exercised (in millions)
|
4.1
|
0.9
|
0.5
|
|||||||||
(12) Derivative Financial Instruments
We enter into interest rate swaps to manage the variability of our interest rate exposure, thus fixing a portion of our interest expense in a rising or falling rate environment. We do not enter into derivative instruments for any purpose other than to manage interest rate exposure of the one-month LIBOR benchmark. That is, we do not engage in interest rate speculation using derivative instruments.
F-26
Typically, we designate all interest rate swaps as cash flow hedges and, accordingly, we record the change in fair value for the effective portion of these interest rate swaps in comprehensive income rather than net income until the underlying hedged transaction affects net income. If a swap is no longer accounted for as a cash flow hedge and the forecasted transaction remains probable or reasonably possible of occurring, the gain or loss recorded in accumulated other comprehensive loss is recognized in income as the forecasted transaction occurs. If the forecasted transaction is probable of not occurring, the gain or loss recorded in accumulated other comprehensive loss is recognized in income immediately.
See Note
13
.
At December 31, 2012 and 2011, the net fair value of all of our agreements totaled a loss of $4.7 million and $7.5 million, respectively, which was recorded on our Consolidated Balance Sheets as a component of accrued liabilities and other long-term liabilities. The estimated amount expected to be reclassified into earnings within the next twelve months was $1.9 million at December 31, 2012.
As of December 31, 2012, we had outstanding the following interest rate swaps with U.S. Bank Dealer Commercial Services:
|
●
|
$25 million interest rate swap at a fixed rate of 4.495% per annum, variable rate adjusted on the 26
th
of each month, matures January 25, 2013;
|
|
●
|
$25 million interest rate swap at a fixed rate of 3.495% per annum, variable rate adjusted on the 1
st
and 16
th
of each month, matures April 30, 2013;
|
|
●
|
$25 million interest rate swap at a fixed rate of 3.495% per annum, variable rate adjusted on the 1
st
and
16
th
of each month, matures April 30, 2013 and
|
|
●
|
$25 million interest rate swap at a fixed rate of 5.587% per annum, variable rate adjusted on the 1
st
and 16
th
of each month, matures June 15, 2016.
|
We receive interest on all of the interest rate swaps at the one-month LIBOR rate. The one-month LIBOR rate at December 31, 2012 was 0.21% per annum, as reported in the Wall Street Journal.
At December 31, 2012 and 2011, the fair value of our derivative instruments was included in our Consolidated Balance Sheets as follows (in thousands):
|
Balance Sheet Information (in thousands)
|
Fair Value of Liability Derivatives
|
|||||
|
Location in Balance Sheet
|
December 31, 2012
|
|||||
|
Derivatives designated as hedging instruments
|
||||||
|
Interest rate swap contracts
|
Accrued liabilities
|
$ | 1,839 | |||
|
Other long-term liabilities
|
2,840 | |||||
| $ | 4,679 | |||||
|
Balance Sheet Information (in thousands)
|
Fair Value of Liability Derivatives
|
|||||
|
Location in Balance Sheet
|
December 31, 2011
|
|||||
|
Derivatives designated as hedging instruments
|
||||||
|
Interest rate swap contracts
|
Accrued liabilities
|
$ | 3,522 | |||
|
Other long-term liabilities
|
4,008 | |||||
| $ | 7,530 | |||||
F-27
The effect of derivative instruments on our Consolidated Statements of Operations for the years ended
December 31, 2012, 2011 and 2010
was as follows (in thousands):
|
Derivatives in Cash Flow Hedging Relationships
|
Amount of gain (loss) recognized in Accumulated OCI (effective portion)
|
Location of loss reclassified from accumulated OCI into Income (effective portion)
|
Amount of loss reclassified from Accumulated OCI into Income (effective portion)
|
Location of gain (loss) recognized in Income on derivative (ineffective portion and amount excluded from effectiveness testing)
|
Amount of gain (loss) recognized in Income on derivative (ineffective portion and amount excluded from effectiveness testing)
|
|||||||||||
|
For the Year Ended December 31, 2012
|
||||||||||||||||
|
Interest rate swap contracts
|
$ | 1,655 |
Floor plan
Interest expense
|
$ | (1,413 | ) |
Floor plan
Interest expense
|
$ | (2,900 | ) | ||||||
|
For the Year Ended December 31, 2011
|
||||||||||||||||
|
Interest rate swap contracts
|
$ | (1,343 | ) |
Floor plan
Interest expense
|
$ | (1,899 | ) |
Floor plan
Interest expense
|
$ | (1,587 | ) | |||||
|
For the Year Ended December 31, 2010
|
||||||||||||||||
|
Interest rate swap contracts
|
$ | (4,459 | ) |
Floor plan
Interest expense
|
$ | (2,814 | ) |
Floor plan
Interest expense
|
$ | (1,483 | ) | |||||
(13) Fair Value Measurements
Factors used in determining the fair value of our financial assets and liabilities are summarized into three broad categories:
|
●
|
Level 1 – quoted prices in active markets for identical securities;
|
|
●
|
Level 2 – other significant observable inputs, including quoted prices for similar securities, interest rates, prepayment spreads, credit risk; and
|
|
●
|
Level 3 – significant unobservable inputs, including our own assumptions in determining fair value.
|
The inputs or methodology used for valuing financial assets and liabilities are not necessarily an indication of the risk associated with investing in them.
We use the income approach to determine the fair value of our interest rate swaps using observable Level 2 market expectations at each measurement date and an income approach to convert estimated future cash flows to a single present value amount (discounted) assuming that participants are motivated, but not compelled, to transact. Level 2 inputs for the swap valuations are limited to quoted prices for similar assets or liabilities in active markets (specifically futures contracts on LIBOR for the first two years) and inputs other than quoted prices that are observable for the asset or liability (specifically LIBOR cash and swap rates and credit risk at commonly quoted intervals). Mid-market pricing is used as a practical expedient for fair value measurements. Key inputs, including the cash rates for very short term borrowings, futures rates for up to two years and LIBOR swap rates beyond the derivative maturity, are used to predict future reset rates to discount those future cash flows to present value at the measurement date.
Inputs are collected from Bloomberg on the last market day of the period. The same methodology is used to determine the rate used to discount the future cash flows. The valuation of the interest rate swaps also takes into consideration our own, as well as the counterparty’s, risk of non-performance under the contract.
F-28
We estimate the fair value of our assets held for sale based on a market valuation approach, which uses prices and other relevant information generated primarily by recent market transactions involving similar or comparable assets or liabilities, as well as our historical experience in divestitures, acquisitions and real estate transactions. When available, we use inputs from independent valuation experts, such as brokers and real estate appraisers, to corroborate our internal estimates. Because these valuations contain unobservable inputs, we classified the assets held for sale and liabilities related to assets held for sale as Level 3.
We estimate the value of long-lived assets that are recorded at fair value based on a market valuation approach. We use prices and other relevant information generated primarily by recent market transactions involving similar or comparable assets, as well as our historical experience in divestitures, acquisitions and real estate transactions. Additionally, we may use a cost valuation approach to value long-lived assets when a market valuation approach is unavailable. Under this approach, we determine the cost to replace the service capacity of an asset, adjusted for physical and economic obsolescence. When available, we use valuation inputs from independent valuation experts, such as real estate appraisers and brokers, to corroborate our estimates of fair value. Real estate appraisers’ and brokers’ valuations are typically developed using one or more valuation techniques including market, income and replacement cost approaches. As these valuations contain unobservable inputs, we classified the measurement of fair value of long-lived assets as Level 3.
There were no changes to our valuation techniques during the year ended December 31, 2012.
Assets and Liabilities Measured at Fair Value
Following are the disclosures related to our assets and (liabilities) that are measured at fair value (in thousands):
|
Fair Value at December 31, 2012
|
Level 1
|
Level 2
|
Level 3
|
|||||||||
|
Measured on a recurring basis:
|
||||||||||||
|
Derivative contracts, net
|
$ | - | $ | (4,679 | ) | $ | - | |||||
|
Fair Value at December 31, 2011
|
Level 1
|
Level 2
|
Level 3
|
|||||||||
|
Measured on a recurring basis:
|
||||||||||||
|
Derivative contracts, net
|
$ | - | $ | (7,530 | ) | $ | - | |||||
|
Measured on a non-recurring basis:
|
||||||||||||
|
Long-lived assets held and used:
|
||||||||||||
|
Certain buildings and improvements
|
$ | - | $ | - | $ | 2,500 | ||||||
See Note 12 for more details regarding our derivative contracts.
Fair Value Disclosures for Financial Assets and Liabilities
We have fixed rate debt and calculate the estimated fair value of our fixed rate debt using a discounted cash flow methodology. Using estimated current interest rates based on a similar risk profile and duration (Level 2), the fixed cash flows are discounted and summed to compute the fair value of the debt. As of December 31, 2012, this debt had maturity dates between November 2016 and May 2031. A summary of the aggregate carrying values and fair values of our long-term fixed interest rate debt is as follows (in thousands):
|
December 31,
2012
|
December 31, 2011
|
|||||||
|
Carrying value
|
$ | 130,469 | $ | 64,463 | ||||
|
Fair value
|
134,688 | 73,551 | ||||||
We believe the carrying value of our variable rate debt approximates fair value.
F-29
(14) Income Taxes
Income tax provision (benefit) from continuing operations was as follows (in thousands):
|
Year Ended December 31,
|
2012
|
2011
|
2010
|
|||||||||
|
Current:
|
||||||||||||
|
Federal
|
$ | 31,438 | $ | 21,779 | $ | 9,093 | ||||||
|
State
|
3,626 | 3,561 | 1,619 | |||||||||
| 35,064 | 25,340 | 10,712 | ||||||||||
|
Deferred:
|
||||||||||||
|
Federal
|
10,888 | 7,046 | (1,670 | ) | ||||||||
|
State
|
3,110 | 674 | (417 | ) | ||||||||
| 13,998 | 7,720 | (2,087 | ) | |||||||||
|
Total
|
$ | 49,062 | $ | 33,060 | $ | 8,625 | ||||||
At December 31, 2012 and 2011, we had income taxes receivable of $7.3 million and $6.2 million, respectively, included as a component of other current assets on the Consolidated Balance Sheets.
Individually significant components of the deferred tax assets and liabilities are presented below (in thousands):
|
December 31,
|
2012
|
2011
|
||||||
|
Deferred tax assets:
|
||||||||
|
Deferred revenue and cancellation reserves
|
$ | 7,597 | $ | 6,369 | ||||
|
Allowances and accruals, including state tax
carryforward amounts
|
21,340 | 20,234 | ||||||
|
Interest on derivatives
|
1,796 | 2,889 | ||||||
|
Goodwill
|
18,139 | 26,817 | ||||||
|
Capital loss carryforward
|
12,248 | 12,841 | ||||||
|
Total deferred tax assets
|
61,120 | 69,150 | ||||||
|
Deferred tax liabilities:
|
||||||||
|
Inventories
|
(4,684 | ) | (4,351 | ) | ||||
|
Property and equipment, principally due to differences in depreciation
|
(22,484 | ) | (16,418 | ) | ||||
|
Prepaids and property taxes
|
(1,356 | ) | (1,540 | ) | ||||
|
Total deferred tax liabilities
|
(28,524 | ) | (22,309 | ) | ||||
|
Valuation allowance
|
(11,641 | ) | (12,841 | ) | ||||
|
Total
|
$ | 20,955 | $ | 34,000 | ||||
We consider whether it is more likely than not that some portion or all of the deferred tax assets will not be realized. The ultimate realization of deferred tax assets is dependent upon future taxable income during the periods in which those temporary differences become deductible. We consider the scheduled reversal of deferred tax liabilities (including the impact of available carryback and carryforward periods), projected future taxable income and tax-planning strategies in making this assessment.
The change in our valuation allowance was $1.2 million in 2012. At December 31, 2012, we had an $11.6 million valuation allowance recorded associated with our deferred tax assets. We recorded this allowance in association with losses from the sale of corporate entities. As these amounts are characterized as capital losses, we evaluated the availability of projected capital gains and determined that it would be unlikely these amounts would be fully utilized. We will continue to evaluate if it is more likely than not that we will realize the benefits of these deductible differences. However, additional valuation allowance amounts could be recorded in the future if estimates of taxable income during the carryforward period are reduced.
At December 31, 2012, we had a number of state tax carryforward amounts totaling approximately $0.3 million, tax affected, with expiration dates through 2029.
F-30
The reconciliation between amounts computed using the federal income tax rate of 35% and our income tax provision from continuing operations for 2012, 2011 and 2010 is shown in the following tabulation (in thousands):
|
Year Ended December 31,
|
2012
|
2011
|
2010
|
|||||||||
|
Federal tax provision at statutory rate
|
$ | 44,723 | $ | 30,895 | $ | 7,774 | ||||||
|
State taxes, net of federal income tax benefit
|
4,772 | 3,021 | 973 | |||||||||
|
Non-deductible expenses
|
618 | 208 | 223 | |||||||||
|
Permanent differences related to the employee
stock purchase program
|
52 | 105 | 164 | |||||||||
|
Release of valuation allowance
|
(1,200 | ) | (346 | ) | - | |||||||
|
Other
|
97 | (823 | ) | (509 | ) | |||||||
|
Income tax provision
|
$ | 49,062 | $ | 33,060 | $ | 8,625 | ||||||
We did not have any activity during 2012 or 2011 related to unrecognized tax benefits and did not have any amounts of unrecognized tax benefits as of December 31, 2012 or 2011. No interest or penalties were included in our results of operations during 2012, 2011 or 2010, and we had no accrued interest or penalties at December 31, 2012 or 2011.
Open tax years at December 31, 2012 included the following:
|
Federal
|
2009-2012 | |||
|
13 states
|
2008-2012 |
(15) Acquisitions
We completed the following acquisitions in 2012:
|
●
|
On April 30, 2012, we acquired the inventory, equipment and intangible assets and assumed certain liabilities of Bellingham Chevrolet and Cadillac in Bellingham, Washington from Jerry Chambers Chevrolet.
|
|
●
|
On June 12, 2012, we acquired the inventory, equipment and intangible assets and assumed certain liabilities of Fairbanks GMC Buick from Gene’s GMC, LLC.
|
|
●
|
On August 27, 2012, we acquired the inventory, equipment and intangible assets and assumed certain liabilities of Killeen Chevrolet in Killeen, Texas from Connell Chevrolet, Inc.
|
|
●
|
On October 23, 2012, we acquired the inventory, equipment, real estate and intangible assets of, and assumed certain liabilities related to Bitterroot Toyota of Missoula, Montana from Bitterroot Motors, Inc.
|
These acquisitions contributed revenues of $32.2 million for the year ended December 31, 2012.
We completed the following acquisitions in 2011:
|
●
|
In April 2011, we acquired the inventory, equipment, real estate and intangible assets of, and assumed certain liabilities related to, Mercedes-Benz of Portland, Oregon, Mercedes Benz of Wilsonville, Oregon and Rasmussen BMW/MINI in Portland, Oregon from the Don Rasmussen Group.
|
|
●
|
In October 2011 we acquired the inventory, equipment, real estate and intangible assets of Fresno Subaru from Herwaldt Automotive Group.
|
We completed the following acquisitions in 2010:
|
●
|
In July 2010, we acquired the inventory, equipment and intangible assets and assumed certain liabilities related to Honda of Bend and agreed to the transfer of Chevrolet and Cadillac brands from Bob Thomas Chevrolet Cadillac, both located in Bend, Oregon.
|
F-31
|
●
|
In August 2010, we acquired the inventory, equipment, real estate and intangible assets and assumed certain liabilities related to Toyota of Billings from Prestige Toyota, located in Billings, Montana.
|
The results of operations of the acquired stores are included in our Consolidated Financial Statements from the date of acquisition.
Pro forma results of operations are not materially different than actual results of operations for the 2010 acquisitions. The following unaudited pro forma summary presents consolidated information as if the 2012 and 2011 acquisitions had occurred on January 1 of the prior year (in thousands, except for per share amounts):
|
Year Ended December 31,
|
2012
|
2011
|
2010
|
|||||||||
|
Revenue
|
$ | 3,386,066 | $ | 2,789,436 | $ | 2,210,073 | ||||||
|
Income from continuing operations, net of tax
|
80,064 | 56,904 | 14,779 | |||||||||
|
Basic income per share from continuing operations, net of tax
|
3.12 | 2.17 | 0.57 | |||||||||
|
Diluted income per share from continuing operations, net of tax
|
3.06 | 2.13 | 0.57 | |||||||||
These amounts have been calculated by estimating and applying our accounting policies. The results of these stores have been adjusted to reflect depreciation on a straight-line basis over our expected lives for property, plant and equipment; accounting for inventory on a specific identification method; and recognition of interest expense for real estate financing related to stores where we purchased the facility. No nonrecurring pro forma adjustments directly attributable to these business combinations are included in the reported pro forma revenues and earnings.
All acquisitions were accounted for as business combinations under the acquisition method of accounting. No portion of the purchase price was paid with our equity securities. The following table summarizes the consideration paid for material acquisitions and the amount of identified assets acquired and liabilities assumed as of the acquisition date (in thousands):
|
Consideration paid for year ended December 31,
|
2012
|
2011
|
||||||
|
Cash paid, net of cash acquired
|
$ | 44,716 | $ | 55,368 | ||||
|
Floor plan financing assumed
|
- | 19,348 | ||||||
| $ | 44 ,716 | $ | 74,716 | |||||
|
Assets acquired and liabilities assumed for year ended ended December 31,
|
2012 | 2011 | ||||||
|
Inventories
|
$ | 17,541 | $ | 29,268 | ||||
|
Franchise value
|
5,174 | 14,517 | ||||||
|
Property, plant and equipment
|
11,097 | 17,351 | ||||||
|
Real estate lease reserves
|
- | 325 | ||||||
|
Other assets
|
110 | 1,475 | ||||||
|
Reserves
|
- | (663 | ) | |||||
|
Capital lease obligations
|
(2,609 | ) | - | |||||
|
Other liabilities
|
(307 | ) | (426 | ) | ||||
| 31,006 | 61,847 | |||||||
|
Goodwill
|
13,710 | 12,869 | ||||||
| $ | 44,716 | $ | 74,716 |
The fair values of assets acquired and liabilities assumed in our 2010 acquisitions are not material to our Consolidated Balance Sheets.
In July 2011, we were awarded a Ford franchise in Klamath Falls, Oregon which was accounted for as an asset acquisition. Consideration of $5.1 million was paid for the inventory, equipment and associated real estate.
We account for franchise value as an indefinite-lived intangible asset. We expect the full amount of the goodwill recognized to be deductible for tax purposes. We did not have any material acquisition related expenses in 2012, 2011 or 2010.
F-32
(16) Discontinued Operations
We classify a store as discontinued operations if the location has been sold, we have ceased operations at that location or if management has committed to a plan to dispose of the store. Additionally, the store must meet the criteria as required by U.S. generally accepted accounting standards:
|
●
|
our management team, possessing the necessary authority, commits to a plan to sell the store;
|
|
●
|
the store is available for immediate sale in its present condition;
|
|
●
|
an active program to locate buyers and other actions that are required to sell the store are initiated;
|
|
●
|
a market for the store exists and we believe its sale is likely to be completed within one year;
|
|
●
|
active marketing of the store commences at a price that is reasonable in relation to the estimated fair market value; and
|
|
●
|
our management team believes it is unlikely that changes will be made to the plan or the plan to dispose of the store will be withdrawn.
|
We reclassify the store’s operations to discontinued operations in our Consolidated Statements of Operations, on a comparable basis for all periods presented, provided we do not expect to have any significant continuing involvement in the store’s operations after its disposal.
At December 31, 2009, two operating stores and three properties were classified as held for sale. The two operating stores were under contract to sell at that time.
Based on subsequent negotiations with the buyer in the first quarter of 2010, management concluded that it was no longer probable that the sale of the remaining two stores would be effected, resulting in the determination that these two operating stores no longer met all of the criteria for classification as held for sale at March 31, 2010. Therefore, in the first quarter of 2010, assets and related liabilities associated with two stores were reclassified from assets held for sale to assets held and used. Their associated results of operations were retrospectively reclassified from discontinued operations to continuing operations for all periods presented.
In the second quarter of 2010, we classified the operating results of Fresno Dodge, which was sold during the quarter, as discontinued operations. Additionally, one of the properties classified as held for sale as of December 31, 2009 was sold. Management evaluated the remaining two properties to determine if classification remained appropriate. Based on new facts and circumstances previously considered unlikely, management no longer believed the sales were probable. As a result the properties were reclassified to assets held and used in June 2010. As of December 31, 2010, we had no stores or properties classified as held for sale.
In 2011, we sold three stores: a Chrysler Jeep Dodge store in Concord, California; a Volkswagen store in Thornton, Colorado and a GMC Buick and a Kia store in Cedar Rapids, Iowa. The associated results of operations for these locations are classified as discontinued operations. As of December 31, 2011, we had no stores and no properties classified as held for sale.
In October 2012, we sold two stores: a Chrysler Jeep Dodge store and a Hyundai store, both located in Renton, Washington. The associated results of operations for these locations are classified as discontinued operations. Additionally, in October 2012, we determined that one of our stores met the criteria for classification of the assets and related liabilities as held for sale.
F-33
As of December 31, 2012, we have one store and no properties classified as held for sale. Assets held for sale included the following (in thousands):
|
December 31,
|
2012
|
|||
|
Inventories
|
$ | 9,412 | ||
|
Property, plant and equipment
|
1,102 | |||
|
Intangible assets
|
2,065 | |||
| $ | 12,579 | |||
Liabilities related to assets held for sale included the following (in thousands):
|
December 31,
|
2012
|
|||
|
Floor plan notes payable
|
$ | 8,347 | ||
Interest expense is allocated to stores classified as discontinued operations for actual floor plan interest expense directly related to the new vehicles in the store. Interest expense related to our working capital, acquisition and used vehicle credit facility is allocated based on the amount of assets pledged towards the total borrowing base. Interest expense included as a component of discontinued operations was as follows (in thousands):
|
Year Ended December 31,
|
2012
|
2011
|
2010
|
|||||||||
|
Floor plan interest
|
$ | 217 | $ | 520 | $ | 493 | ||||||
|
Other interest
|
69 | 108 | 117 | |||||||||
|
Total interest
|
$ | 286 | $ | 628 | $ | 610 | ||||||
Certain financial information related to discontinued operations was as follows (in thousands):
|
Year Ended December 31,
|
2012
|
2011
|
2010
|
|||||||||
|
Revenue
|
$ | 82,150 | $ | 131,380 | $ | 100,979 | ||||||
|
Gain from discontinued operations
|
$ | 2,186 | $ | 1,516 | $ | 648 | ||||||
|
Net gain (loss) on disposal activities
|
(621 | ) | 4,396 | (301 | ) | |||||||
| 1,565 | 5,912 | 347 | ||||||||||
|
Income tax expense
|
(598 | ) | (2,262 | ) | (215 | ) | ||||||
|
Income from discontinued operations, net of income taxes
|
$ | 967 | $ | 3,650 | $ | 132 | ||||||
|
Goodwill and other intangible assets disposed of
|
$ | 169 | $ | 712 | $ | - | ||||||
|
Cash generated from disposal activities
|
$ | 6,618 | $ | 23,838 | $ | 941 | ||||||
|
Floor plan debt paid in connection with disposal activities
|
$ | 6,712 | $ | 1,784 | $ | 2,134 | ||||||
The net gain (loss) on disposal activities included the following charges (in thousands):
|
Year Ended December 31,
|
2012
|
2011
|
2010
|
|||||||||
|
Goodwill and other intangible assets
|
$ | (169 | ) | $ | 3,168 | $ | - | |||||
|
Property, plant and equipment
|
(299 | ) | 1,357 | (217 | ) | |||||||
|
Inventory
|
(82 | ) | (88 | ) | - | |||||||
|
Other
|
(71 | ) | (41 | ) | (84 | ) | ||||||
| $ | (621 | ) | $ | 4,396 | $ | (301 | ) | |||||
(17) Recent Accounting Pronouncements
In July 2012, the FASB issued an accounting standard update that amends the accounting guidance on testing for impairment on indefinite-lived intangible assets. This amendment allows an entity to assess qualitative factors to determine the likelihood of indefinite-lived intangible asset impairments, reducing the cost and complexity of performing an impairment test. This amendment also improves consistency in impairment testing guidance for long-lived asset categories. The amendments in this accounting standard update are effective for interim and annual impairment tests performed for fiscal years beginning after September 15, 2012 and could be early adopted. In 2012, we used a quantitative assessment to test for impairment on indefinite-lived intangible assets. The accounting standard update is intended to simplify the assessment for indefinite-lived asset impairments and will not affect our consolidated financial position, results of operations, or cash flows.
F-34
In December 2011, the FASB issued an accounting standard update that requires disclosure about offsetting and related arrangements of certain financial instruments and derivative instruments. These disclosures enable users to understand the effect of these arrangements on financial position. The amendments in this accounting standard update are effective for annual periods beginning on or after January 1, 2013, and interim periods within those annual periods. The accounting standard update affects disclosure requirements only and will not affect our consolidated financial position, results of operations, or cash flows.
(18)
Related Party Transactions
On March 27, 2012, we completed the sale of an 80% interest in our Nissan, Volkswagen and BMW stores in Medford, Oregon to Dick Heimann, a director and our Vice Chairman. We received proceeds of $9.6 million, of which $2.9 million was received in cash and $6.7 million was received through the payoff of floor plan financing. The sale of the 80% interest in the stores resulted in a gain of $0.7 million and was recorded as a component of selling, general and administrative expense on our Consolidated Statements of Operations.
The Nissan and Volkswagen stores were purchased for the book value of the inventory as defined by the original terms of an option agreement provided to Mr. Heimann in 2009. The price of the intangible assets of $1.2 million was based on the fair value of the intangible assets related to the BMW store. We corroborated the fair value of the BMW store’s intangible assets with independent third party broker opinions and financial projections using a fair value income approach.
When we sold the three stores, we entered into a shared service agreement with the stores. This agreement allows the stores to lease our employees, use the Lithia name, utilize accounting support functions and receive consulting services. The services provided and the costs of the services are structured the same as the shared services provide to our wholly owned stores.
We retained a 20% interest in the stores as of the transaction date. We determined that we are not the primary beneficiary of the stores and the risk and rewards associated with our investment are based on ownership percentages. As a result, the stores do not qualify for consolidation and our 20% interest is accounted for under the equity method. We determined we maintained significant influence over the operations. We recorded the equity investment at fair value of $0.8 million as of the transaction date that resulted in a gain of $0.2 million. The gain was recorded as a component of other income on our Consolidated Statements of Operations. We determined the fair value of our equity investment based on independent third party broker opinions and financial projections using a fair value income approach.
As of December 31, 2012, the carrying value of our equity investment was $1.1 million and was recorded as a component of other non-current assets in our Consolidated Balance Sheets.
F-35
TABLE OF CONTENTS
Part IItem 1. BusinessItem 1A. Risk FactorsItem 1B . Unresolved Staff CommentsItem 2 . PropertiesItem 3. Legal ProceedingsItem 4. Mine Safety DisclosurePart IIItem 5. Market For Registrant S Common Equity, Related Stockholder Matters and Issuer Purchases Of Equity SecuritiesItem 6. Selected Financial DataItem 7. Management S Discussion and Analysis Of Financial Condition and Results Of OperationsItem 7A. Quantitative and Qualitative Disclosures About Market RiskItem 8. Financial Statements and Supplementary Financial DataItem 9. Changes in and Disagreements with Accountants on Accounting and Financial DisclosureItem 9A. Controls and ProceduresItem 9B. Other InformationPart IIIItem 10. Directors, Executive Officers and Corporate GovernanceItem 11. Executive CompensationItem 12. Security Ownership Of Certain Beneficial Owners and ManagementItem 13. Certain Relationships and Related Transactions, and Director IndependenceItem 14. Principal Accountant Fees and ServicesPart IVItem 15. Exhibits and Financial Statement Schedules