UNITED STATES
SECURITIES AND EXCHANGE COMMISSION
WASHINGTON, D.C. 20549
FORM 10-K
☒
ANNUAL REPORT PURSUANT TO SECTION 13 OR 15(d) OF THE SECURITIES
EXCHANGE ACT OF 1934
FOR THE FISCAL YEAR ENDED DECEMBER 31, 2020
OR
☐
TRANSITION REPORT PURSUANT TO SECTION 13 OR 15(d) OF THE SECURITIES
EXCHANGE ACT OF 1934
FOR THE TRANSITION PERIOD FROM ______ TO _____
COMMISSION FILE NUMBER
LASER
PHOTONICS CORPORATION
(Exact name of registrant as specified in its charter)
|
Delaware
|
|
84-3628771
|
|
State or Other jurisdiction of
Incorporation or Organization
|
|
I.R.S. Employer Identification No.
|
|
1101 N. Keller Road, Suite G
Orlando, FL
|
|
32810
|
|
Address of Principal Executive Offices
|
|
Zip Code
|
|
(407) 804 1000
|
|
Registrant’s Telephone Number, Including Area
Code
|
|
|
|
Former Name, Former Address and Former Fiscal Year, if Changed
Since Last Report
|
SECURITIES REGISTERED PURSUANT TO SECTION 12(b) OF THE ACT:
NONE
SECURITIES REGISTERED PURSUANT TO SECTION 12(g) OF THE
ACT:
COMMON STOCK, $0.001 PAR VALUE
(Title of class)
1
Indicate by check mark if the registrant is a well-known seasoned
issuer, as defined in Rule 405 of the Securities Act.
Yes
☐
No
☒
Indicate by check mark if the registrant is not required to file
reports pursuant to Section 13 or Section 15(d) of the
Act.
Yes
☐
No
☒
Indicate by check mark whether the registrant (1) has filed all
reports required to be filed be Section 13 or 15(d) of the
Securities Exchange Act of 1934 during the preceding 12 months (or
for such shorter period that the registrant was required to file
such reports), and (2) has been subject to such filing requirements
for the past 90 days.
Yes
☒
No
☐
Indicate by check mark whether the registrant has submitted
electronically and posted on its corporate Web site, if any, every
Interactive Data File required to be submitted and posted pursuant
to Rule 405 of Regulation S-T (§232.405 of this chapter)
during the preceding 12 months (or for such shorter period that the
registrant was required to submit and post such files).
Yes
☒
No
☐
Indicate by check mark if disclosure of delinquent filers pursuant
to Item 405 of Regulation S-K (Section 229.405 of this chapter) is
not contained herein, and will not be contained, to the best of
registrant's knowledge, in definitive proxy or information
statements incorporated by reference in Part III of this Form 10-K
or any amendment to this Form 10-K.
☐
Indicate by check mark whether the registrant is a large
accelerated filer, an accelerated filer, a non-accelerated filer,
smaller reporting company, or an emerging growth company. See the
definitions of “large accelerated filer,”
“accelerated filer,” “smaller reporting
company,” and “emerging growth company” in Rule
12b-2 of the Exchange Act.
|
Large accelerated filer
|
☐
|
|
Accelerated filer
|
☐
|
|
Non-accelerated filer
|
☐
|
|
Smaller reporting company
|
☒
|
|
|
|
|
Emerging growth company
|
☒
|
If an emerging growth company, indicate by check mark if the
registrant has elected not to use the extended transition period
for complying with any new or revised financial accounting
standards provided pursuant to Section 13(a) of the Exchange
Act.
☐
Indicate by check mark whether the registrant is a shell company
(as defined in Rule 12b-2 of the Exchange
Act).
Yes
☐
No
☒
.
The aggregate market value of the voting common stock held by
non-affiliates of the registrant (assuming executive officers,
directors and our largest shareholder whose daughter serves on the
Board of Directors are affiliates) was approximately $0.00 as of
December 31, 2020, computed on the basis of the closing price on
such date.
As of March 15, 2021, there were
29,331,057
shares of the registrant's Common Stock outstanding.
2
FORWARD LOOKING STATEMENTS
The Private Securities Litigation Reform Act of 1995 provides a
"safe harbor" for forward-looking statements, which are identified
by the words "believe," "expect," "anticipate," "intend," "plan"
and similar expressions. The statements contained herein which are
not based on historical facts are forward-looking statements that
involve known and unknown risks and uncertainties that could
significantly affect our actual results, performance or
achievements in the future and, accordingly, such actual results,
performance or achievements may materially differ from those
expressed or implied in any forward-looking statements made by or
on our behalf. These risks and uncertainties include, but are not
limited to, risks associated with our ability to successfully
develop and protect our intellectual property, our ability to raise
additional capital to fund future operations and compliance with
applicable laws and changes in such laws and the administration of
such laws. These risks are described below and in "Item 1.
Business," "Item 7. Management's Discussion and Analysis of
Financial Condition and Results of Operations," and "Item 7A.
Quantitative and Qualitative Disclosures About Market Risk"
included in this Form 10-K. Readers are cautioned not to place
undue reliance on these forward-looking statements which speak only
as of the date the statements were made.
3
TABLE OF CONTENTS
|
PART
I
|
||
|
|
|
|
|
ITEM
1.
|
BUSINESS
|
5
|
|
ITEM
1A.
|
RISK
FACTORS
|
15
|
|
ITEM
1B.
|
UNRESOLVED
STAFF COMMENTS
|
30
|
|
ITEM
2.
|
PROPERTIES
|
30
|
|
ITEM
3.
|
LEGAL
PROCEEDINGS
|
30
|
|
ITEM
4.
|
MINE
SAFETY DISCLOSURES
|
30
|
|
|
|
|
|
PART
II
|
||
|
|
|
|
|
ITEM
5.
|
MARKET
FOR REGISTRANT'S COMMON EQUITY, RELATED STOCKHOLDER MATTERS AND
ISSUER PURCHASES OF EQUITY SECURITIES
|
31
|
|
ITEM
6.
|
SELECTED
FINANCIAL DATA
|
32
|
|
ITEM
7.
|
MANAGEMENT'S
DISCUSSION AND ANALYSIS OF FINANCIAL CONDITION AND RESULTS OF
OPERATIONS
|
33
|
|
ITEM
7A.
|
QUANTITATIVE
AND QUALITATIVE DISCLOSURES ABOUT MARKET RISK
|
40
|
|
ITEM
8.
|
FINANCIAL
STATEMENTS AND SUPPLEMENTARY DATA
|
41
|
|
ITEM
9.
|
CHANGES
IN AND DISAGREEMENTS WITH ACCOUNTANTS ON ACCOUNTING AND FINANCIAL
DISCLOSURE
|
61
|
|
ITEM
9A.
|
CONTROLS
AND PROCEDURES
|
61
|
|
ITEM
9B.
|
OTHER
INFORMATION
|
61
|
|
|
|
|
|
PART
III
|
||
|
|
|
|
|
ITEM
10.
|
DIRECTORS,
EXECUTIVE OFFICERS AND CORPORATE GOVERANCE
|
62
|
|
ITEM
11.
|
EXECUTIVE
COMPENSATION
|
64
|
|
ITEM
12.
|
SECURITY
OWNERSHIP OF CERTAIN BENEFICIAL OWNERS AND MANAGEMENT AND RELATED
STOCKHOLDER MATTERS
|
70
|
|
ITEM
13.
|
CERTAIN
RELATIONSHIPS AND RELATED TRANSACTIONS, AND DIRECTOR
INDEPENDENCE
|
71
|
|
ITEM
14.
|
PRINCIPAL
ACCOUNTING FEES AND SERVICES
|
73
|
|
|
|
|
|
PART
IV
|
||
|
|
|
|
|
ITEM
15.
|
EXHIBITS
AND FINANCIAL STATEMENT SCHEDULES
|
74
|
|
|
|
|
|
SIGNATURES
|
75
|
|
4
PART I
ITEM 1.BUSINESS
OVERVIEW
We were
formed under the laws of Wyoming on November 8, 2019. We changed
our domicile to Delaware on March 5, 2021. We are a vertically
integrated manufacturing company for photonics based industrial
products and solutions, primarily disruptive laser cleaning
technologies.
We
initiated our sales effort in January 2020 and as of December 31,
2020 had gross sales of $3,244,186. We sell our products globally
to end users and principally to Fortune 1000 companies. Among the
Fortune 1000 companies to which we sold our laser equipment was
Chrysler, Cooper, Eaton Aerospace Group (a division of Eaton
Corporation), Entergis, Mahar Tool Company and Medtronic. We also
sell to the U.S. Government as of December 31, 2020 we received a
purchase orders to provide the U.S. Army, US Navy, VA, and US
National Laboratories with laser cleaning equipment in the amount
of $514,319.
Our
vertically integrated operations allow us to reduce development and
advanced laser equipment manufacturing time, offer better prices,
control quality and protect our proprietary knowhow and technology
compared to other laser cleaning companies and companies with
competing technologies.
We
market our products globally through our direct sales force which
is located in the United States.
The
Laser Photonics™ brand dates back nearly 40 years and has
been historically associated with high-quality manufacturing
equipment for laser material processing. The brand was previously
owned by a number of entities before being acquired by ICT
Investments. ICT is investing in Laser Photonics™ branded
equipment for innovative and disrupting laser blasting, cleaning,
rust removal and corrosion control equipment and
technology.
We have
an exclusive license agreement with ICT. Under the terms of the
exclusive license agreement we have a perpetual, worldwide,
exclusive license to sell the Laser Photonics™ branded
equipment for laser cleaning and rust removal.
Through
our CRM we have access to more than 1,500 high profile Fortune 5000
customer prospects as well as recognition as a global leader in
manufacturing premium laser equipment. In addition, through the
expertise and reputation of our officers, Board members and
advisors, we have the foundation of our technologically advanced,
disruptive laser systems specifically suited for most material
processes with specific cleaning requirements and
challenges.
Our
principal executive offices are located at 1101 N. Keller Rd.,
Suite G, Orlando, Florida 32810, and our telephone number is (407)
804-1000.
We
offer the latest generation of laser material processing equipment
for a variety of industrial markets and applications, including for
defense, space exploration, aerospace, automotive, medical,
industrial, electronic and agriculture markets.
The
laser cleaning market is estimated to be valued at $611.4 million
in 2020 and is expected to be worth $713.6 million by 2023, growing
at a CAGR of 3.9% between 2020 and 2024 according to Absolute
Reports and Data Bridge Market Research.
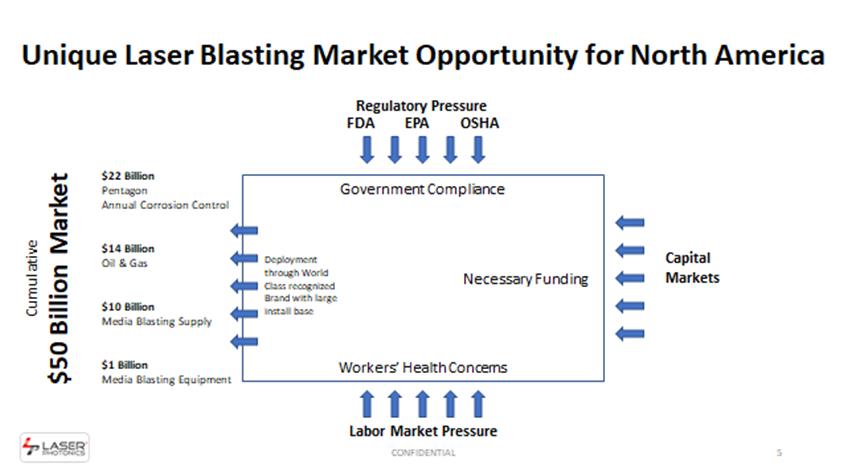
Unique
Laser Blasting Opportunity for North America
We
believe that the laser cleaning equipment market has even a greater
potential for growth in light of the size of the $10 billion
abrasive cleaning market, and the ancillary $1 billion sandblasting
media market, which are being pressured into obsolescence from
regulatory agencies from above and labor from below. These market
pressures, driven by health, safety and environmental concerns, are
accelerating the replacement of abrasive blasting and laser
cleaning is emerging as the safe, clean, efficient and affordable
alternative.
5
The
growth of the laser cleaning market is attributable to the benefits
it provides over traditional cleaning methods, such as abrasive
media blasting (a.k.a. sandblasting), dry-ice blasting, and
chemical cleaning processes; all of which are inherently hazardous
to the health of workers, as well as to the environment since they
generate a considerable amount of potentially harmful
waste.
In
contrast, laser cleaning is a non-contact and non-abrasive process
to remove contaminants or impurities on the surface of metals by
physically removing the upper layer of the substrate using laser
irradiation and where a desired depth can be achieved with a high
degree of accuracy. We expect to approach owners of nuclear
facilities that have been decommissioned where studies have shown
that for metal surfaces have been exposed to radiation and that the
radioactivity is primarily located in the oxide layer. Accordingly,
we propose to develop the decontamination of metallic surfaces by
laser ablation which consists in ejecting surface contamination
using high energy pulses and trapping ablated matter (the
impurities removed from the metal’s surface) in a filter to
avoid its release into the environment. We believe that laser
cleaning has many advantages over abrasive cleaning methods such as
the minimization of secondary waste, the absence of effluents and
the reduction of the exposure of workers to toxic waste through
automation of the cleaning process.
6

The
diverse lines of laser cleaning equipment are used in work
environments to improve and promote programs to address significant
concerns about the exposure of employees to toxic airborne
materials to reduce the risk of lung cancer and silicosis triggered
by inhalation of crystalline silica powders released from abrasive
blasting.
Our laser
cleaning equipment also facilitates a company’s compliance
with OSHA and EPA regulations to protect the health of workers
using conventional abrasive blasting equipment.
We are
now or will soon address the following market
opportunities:
|
Industry
|
Application
|
Benefit
|
|
Aerospace
|
Selective
and large scale coating and paint removal, assembled component
maintenance, cleanups, and reconditioning
|
No
damage to base material, safer to personnel and environment of
operation, no maintenance costs, simple waste disposal, achieves
surface composition
|
|
Automotive
|
Restoration
and renovation, mold cleaning, coating removal, surface pre/post
treatment,
|
No
damage to base material, safer to personnel and environment of
operation, no maintenance costs, simple waste disposal, achieves
surface composition
|
|
Healthcare
|
Production
of medical and surgical instruments, orthopedic implants,
prototypes
|
High
maturity, quality requirements, customized implants unique to each
patient, low-medium instrument production volumes
|
|
Shipbuilding
|
Cleaning,
coating preparation, ship maintenance interior and exterior,
assembled component maintenance cleanup and reconditioning,
selective de-painting, pre-welding cleaning, post
welding
|
No
damage to base material, safer to personnel and environment of
operation, no maintenance costs, simple waste disposal, achieves
ideal surface composition
|
|
Dental
|
Production
of fixed dentures and structures (crowns, bridges, inlays);
Production and repair of turbine, components and prototypes
Production of fixed dentures and structures (crowns, bridges,
inlays)
|
Customized
dental parts unique to each patient, Speed and flexibility, high
strength, fast-track innovations Customized dental parts unique to
each patient
|
7
Growth
Strategy
Our
objective is to achieve a leadership position in our industry by
pursuing the following key elements of our growth
strategy:
Multi-market and Multi-product
Approach
. We intend to develop and manufacture laser systems
for a variety of markets to reduce the financial impact that a
downturn in any one market would have.
Accent on Developing Standard Systems for
Specific Markets.
We expect to increase sales through
an industry recognized expertise in clearly defined markets with
substantial sales demand such as rust removal equipment for the
shipbuilding industry, laser de-contamination equipment for the
nuclear industry, laser blasting cabinets for the general
manufacturing industry, etc.
Broaden Customer Relationships
. We
expect to develop a global diversified customer base in a variety
of industries. We seek to differentiate ourselves from our
competitors through superior product pricing, performance and
service. We believe that a global presence and investments in
application engineering and support will create competitive
advantages in serving multinational and local
companies.
New Product Development
. We intend to
target new applications early in the development cycle and drive
adoption by leveraging our strong customer relationships,
engineering expertise and competitive production
costs.
Our Products
Our
products are used in a broad range of commercial and industrial
applications across a wide range of industries. Laser cleaning
products comprised 90% of our sales in 2020. 95% of our sales
pipelines for Q1, 2021 are for industrial laser cleaning systems to
replace obsolete hazardous abrasives blasting and chemical cleaning
equipment. Government health, safety and environmental regulations
designed to protect laborers and the environment are pressuring the
market to abandon dangerous 19
th
century abrasives
blasting and chemical cleaning processes for safe, clean &
green alternatives.
In
terms of replacing legacy cleaning systems to safeguarding
workers’ health and the environment in a practical,
cost-effective manner, we see the laser ablation process as the
only viable alternative. Our technology-driven products are already
disrupting the abrasives cleaning market, and as a recognized
leader in laser photonics research, systems development and product
production, we are well-positioned to own a sizable piece of the
laser cleaning market.
Our
products are researched, designed, tested and built in-house by
credentialed laser physicists, software engineers and industrial
design engineers. Because we pioneer the innovations that shape the
laser photonics industry and we own the intellectual property (IP)
that we develop, our systems are cutting-edge and state-of-the-art.
Our solid state, integrated optics systems are the most imitated on
the market.
Consequently, we
expect that our superior quality, Made in America laser blasting
products will disrupt and dislodge a significant part of the
estimated $50 billion annual global abrasive blasting market,
especially in the United States, where government remedies in the
form of tough regulations are driven by pressure from labor groups
and environmental advocates. The price to operate abrasives-based
systems has simply become too high, in terms of fines, law suites,
environmental damage and human suffering.
8
We are
price competitive with abrasive-based cleaning solutions, in part
through our streamlined manufacturing process. We utilize
standardized subassemblies and components, as well as
interchangeable common building block technologies, which enable
the quick deployment of a wide range of equipment for a broad
spectrum of applications to the end user markets. We maintain large
inventories for service and repair purposes, as well as expedited
deliveries.
|
Product Line
|
Principal Applicable Markets
|
Principal Applications
|
|
CleanTech™ line of industrial laser cleaning and rust removal
systems
|
Aerospace,
Automotive, General Industry and Manufacturing, Medical Device
Manufacturing, Product Identification, Weapons and Defense,
Medical, Food & Beverage Industry, Sign Industry
|
Rust
removal Etching Ablation De painting Paint stripping
|
|
Hand Held™ laser cleaning systems
|
Aerospace
engine manufacturing Heavy Manufacturing Oil & Gas Industry
Medical Devices (Containers) Gas turbines
manufacturing
|
Coating
removal Light Engraving Service latches de-painting
|
|
Titan™ line of large-format laser cleaning
systems
|
Heavy
Manufacturing General Industry and Manufacturing Tooling Industry
Gun Manufacturing Missile Manufacturing and ID
|
Space
components manufacturing Gun Fabrication Gun Custom Tools repair
and Manufacturing Die fabrication
|
|
Precision Laser Cleaning Systems
|
General Manufacturing Heavy Industry Aluminum car and Track
Industry Food processing equipment Industry
|
Vacuum
deposition jig cleaning
|
We
believe that our products are less expensive, higher in quality,
simpler to operate and more efficient than any other abrasive or
laser cleaning product on the market. We believe that the pricing
and quality of our laser cleaning equipment will allow us to obtain
deep market penetration of our target markets since our products
will be affordable to the many small and mid-sized companies not
previously able to afford laser equipment because of its high cost
and complexity to operate. We believe that a combination of the
price and quality of our products combined with our patented
technology and trade secrets will allow us to achieve a market
leadership position in the laser cleaning market.
We
expect to facilitate sales of the following laser cleaning
equipment through a manufacturing process that integrates research
and development, engineering and manufacturing at all levels of
equipment design and fabrication, which includes vertically
integrated manufacturing allowing us to maintain standard laser
equipment in stock for quick deliveries.
Handheld Systems
Laser
cleaning handhelds are an industrial grade, turnkey laser surface
cleaning and preparation system that operates as a portable
standalone unit. The handheld laser cleaners process a wide range
of materials with special attention to highly-reflective
metals.
9

|

|
Class 1 Systems
Class 1
Systems are fully enclosed high power, large format laser parts
cleaning, rust removal, and surface conditioning systems. The
industrial, turn-key laser cleaning systems operate as a standalone
unit or can be easily integrated into a production line
environment.

Laser Blaster Systems
Laser
Blaster Systems are high performance, industrial-grade, fast,
precise and very productive laser cleaning machines containing
exclusive powerful fiber lasers, hand held laser blasting heads and
suitable working areas for speed, precision, OSHA compliance,
safety and flexibility. It is the only equipment in the market
currently manufactured in compliance with CDRH FDA regulatory
compliance.

10
Our Competitive Strengths
Track Record of World Class Product
Development and Commercialization
. Through the combined
engineering and operational experience in the laser cleaning
industry of our officers and Board members, our team has received
access to decades of development of a number of advanced materials
processing technologies applicable to the precision glass,
semiconductor, photovoltaic, power generation and optical
industries.
Vertically Integrated Application Center,
Equipment Development and Manufacturing.
We develop and
manufacture most of our critical assemblies, subassemblies and
components, including motion systems, integrated fiber lasers,
specialty components, frames, cabinets and proprietary optical
assemblies. We also develop our software for use with our laser
systems. We have our own engineering, procurement, manufacturing
and assembly operations as a part of our vertically integrated
manufacturing process. Integration of our application and R&D
center with our manufacturing capability provides our customers
with a competitive edge to achieving their manufacturing goals for
our laser material processing systems.
Accumulated Expertise
. We have
extensive know-how in mathematical and physical processes and
equipment modeling, industrial electronics, laser systems,
materials and computer science which enables us to make our
market-specific laser material processing equipment, machine
operating software, motion and vision systems and other critical
assemblies, subassemblies and components.
Diverse Customer Base, End Markets and
Applications.
We intend to have a diverse customer
base, multi-market and multi-product business model given the broad
application of our laser cleaning equipment and its competitive
pricing and high quality that will not have us dependent on the
performance of a specific market sector.
Diversified IP and Knowhow
. We were
able to secure through our affiliation with ICT Investments a
diverse portfolio of knowhow, trade secrets and proprietary
technologies. We believe that we possess the design documentation
for the largest array of laser-based systems for material
processing in North America. We benefit from what we believe are
high barriers to entry into 2D and 3D laser material processing
systems for both subtractive and additive
manufacturing.
Customers
Our
intent is to establish additional relationships with Fortune 1000
customers primarily within the United States and with select
Fortune 1000 customers around the globe.
Research, Development and Engineering
The
principal focus of our research and development activity is the
development of our proprietary laser based cleaning equipment to
replace global sand blasting and abrasive blasting applications in
a large number of markets discussed below.
11
Marketing and Sales
As of
December 31, 2020, we achieved sales of $3,244,186 and employed
three salesmen. We have a marketing and sales budget for equal to
10% of our Gross sales and our Board of Directors approved a new
product promotional budget of $1,000,000 for 2021.
Product Warranty and Support
We
offer a two-year limited warranty against defects in materials and
workmanship under normal use and service conditions following
delivery of our equipment to our customers.
We also
warrant to the owners of our custom laser systems that they are
designed and manufactured in accordance with agreed-upon
specifications. In resolving claims under both the defects and
performance warranties, we have the option of either repairing or
replacing the covered laser cleaning equipment. Our warranties are
automatically transferred from the original purchaser of our laser
cleaning equipment and optical components to subsequent purchasers
upon delivery of our finished laser systems.
In
general, our products carry a warranty against defects, depending
on the product type and customer negotiations. The expected costs
associated with these warranty obligations are not expected to be
significant and are not recorded on our financial
statements.
Competition
Our
primary focus is providing diversified industrial-grade laser-based
cleaning machinery in a variety of markets. Each market has
different group of competitors subject to rapidly changing
technologies and materials, a customer base with continuously
changing requirements and geographical outsourcing
challenges.
We
believe that our future success is dependent on our flexibility to
adapt to changes in the marketplace expanding our existing products
and services targeting application specific systems for each
industry we serve. We continuously introduce new products and
services on a timely and cost-effective basis identifying both
standard and niche laser-systems opportunities enhancing our
ability to penetrate new customers and new emerging
markets.
Primary
competitive factors in our markets include:
●
Price
and value
●
Ability
to design, manufacture, and deliver new products on a
cost-effective and timely basis
●
Ability
of our suppliers to produce and deliver components, including sole
or limited source components, in a timely manner, in the quantity
desired and at the budgeted prices
●
Product
performance and reliability
●
Service
support
●
Product
mix
●
Ability
to meet customer specifications
●
Ability
to respond quickly to changes in market demand and technology
developments
In the
materials processing market, the competition is fragmented with a
large number of competitors that are small or privately owned or
compete with the company on a limited geographic, industry, or
application specific basis including Trumpf GmbH, Clean Leaser
GMBH, P-Laser. Advanced Laser Technology, Anilox Roll Cleaning
Systems, General Lasertronics, IPG Photonics, Laserax and
White Lion Dry Ice & Laser Cleaning Technology. We believe
that none of our competitors compete in all the industries,
applications, and geographical markets which we serve and that our
products compete favorably with respect to their laser cleaning
equipment.
Backlog
At
December 31, 2020, our backlog of orders (generally scheduled for
shipment within 12-16 weeks) was approximately $1,09 million
compared to $0,36 million at December 31, 2019. At December 31,
2020, and December 31, 2019 our backlog included only orders with
firm shipment dates and did not included any commitments and orders
in process.
12
Intellectual Property and License Rights.
Our
success depends, in part, on our ability to maintain and protect
our proprietary technology and to conduct our business without
infringing on the proprietary rights of others. We rely primarily
on a combination of trademarks, patents and trade secrets, as well
as associate and third party confidentiality agreements, to
safeguard our intellectual property.
With
respect to proprietary know-how that is not patentable and
processes for which patents are difficult to enforce, we rely on,
among other things, trade secret protection and confidentiality
agreements to safeguard our interests. We believe that many
elements of our laser system manufacturing process, including our
unique materials sourcing, involve proprietary know-how,
technology, or data that are not covered by patents or patent
applications, including technical processes, equipment designs,
algorithms, and procedures. We have taken security measures to
protect these elements. All of our research and development
personnel will have to sign confidentiality and proprietary
information agreements with us. These agreements address
intellectual property protection issues and require our associates
to assign to us all of the inventions, designs, and technologies
they develop during the course of employment with us. We also
require our customers and business partners to enter into
confidentiality agreements before we disclose any sensitive aspects
of our modules, technology, or business plans.
Employees
As of
December 31, 2020, we had 21 full time employees and two part-time
employees.
Government Regulation
Our
current and contemplated activities and the products and processes
that will result from such activities are subject to substantial
government regulation, both in the United States and
internationally.
Radiation Control for Health and Safety Act
We are
subject to the laser radiation safety regulations of the Radiation
Control for Health and Safety Act administered by the National
Center for Devices and Radiological Health, a branch of the United
States Food and Drug Administration. Among other things, those
regulations require laser manufacturers to file new product and
annual reports, to maintain quality control and sales records, to
perform product testing, to distribute appropriate operating
manuals, to incorporate design and operating features in lasers
sold to end-users and to certify and label each laser sold to
end-users as one of four classes (based on the level of radiation
from the laser that is accessible to users). Various warning labels
must be affixed and certain protective devices installed depending
on the class of product. The National Center for Devices and
Radiological Health is empowered to seek fines and other remedies
for violations of the regulatory requirements.
CE Marking
We are
subject to certain regulations in Europe as administered by the
European Commission. CE Marking is required for products marketed
within the European Economic Area (EEA) and confirms that the
manufacturer meets certain safety, health and environmental
protection requirements administered by the European Union.
Non-compliance with these regulations could result in warnings,
penalties or fines. We believe that we are currently in compliance
with these regulations.
United States Food and Drug Administration
Certain
products manufactured by us are integrated into systems by our
customers that are subject to certain regulations administered by
the United States Food and Drug Administration. We must comply with
certain quality control measurements for our products to be
effectively used in our customers’ end products.
Non-compliance with quality control measurements could result in
loss of business with our customers, fines and
penalties.
Facility
On
December 1, 2019, we entered a sub-lease with ICT Investments for
5,000 sf of manufacturing space on a month-to-month basis at $4,050
per month. In January 2020 we expanded the lease with ICT
Investments to include the entire facility of 18,000 sf and
increased our monthly rent to $14,377.50.
Our
facility is currently equipped with five of our latest advanced
laser cleaning demonstration models.
13
Available Information
We
maintain a website with the address
www.laserphotonics.com
.
We are
not including the information contained in our website as part of,
or incorporating it by reference into, this on Form 10-K. We will
make available, free of charge through our website, our annual
reports on Form 10-K-K, quarterly reports on Form 10-K, current
reports on Form 8-K, and amendments to these reports as soon
as reasonably practicable after we electronically file these
materials with, or otherwise furnish them to, the Securities and
Exchange Commission (“SEC”).
Emerging Growth Company
We are
and we will remain an “emerging growth company” as
defined under The Jumpstart Our Business Startups Act (the
“JOBS Act”), until the earliest to occur of
(i) the last day of the fiscal year during which our total
annual revenues equal or exceed $1 billion (subject to adjustment
for inflation), (ii) the last day of the fiscal year following
the fifth anniversary of our initial public offering,
(iii) the date on which we have, during the previous
three-year period, issued more than $1 billion in non-convertible
debt securities, or (iv) the date on which we are deemed a
“large accelerated filer” (with at least $700 million
in public float) under the Securities and Exchange Act of 1934, as
amended (the “Exchange Act”).
As an
“emerging growth company”, we may take advantage of
specified reduced disclosure and other requirements that are
otherwise applicable generally to public companies. These
provisions include:
●
only two years of audited financial statements in addition to any
required unaudited interim financial statements with
correspondingly reduced “Management’s Discussion and
Analysis” disclosure;
●
reduced disclosure about our executive compensation
arrangements;
●
no requirement that we hold non-binding advisory votes on executive
compensation or golden parachute arrangements; and
●
exemption from the auditor attestation requirement in the
assessment of our internal control over financial
reporting.
We have
taken advantage of some of these reduced burdens, and thus the
information we provide stockholders may be different from what you
might receive from other public companies in which you hold
shares.
In
addition, Section 107 of the JOBS Act also provides that an
emerging growth company can take advantage of the extended
transition period provided in Section 7(a)(2)(B) of the
Securities Act for complying with new or revised accounting
standards. In other words, an emerging growth company can delay the
adoption of certain accounting standards until those standards
would otherwise apply to private companies. Section 107 of the
JOBS Act provides that our decision to opt out of the extended
transition period for complying with new or revised accounting
standards is irrevocable. We are choosing to take advantage of such
extended transition period, and as a result, we will not comply
with new or revised accounting standards on the relevant dates on
which adoption of such standards is required for non-emerging
growth companies.
Notwithstanding the
above, we are also currently a “smaller reporting
company”, meaning that we are not an investment company, an
asset-backed issuer, or a majority-owned subsidiary of a parent
company that is not a smaller reporting company and have a public
float of less than $75 million and annual revenues of less than $50
million during the most recently completed fiscal year. In the
event that we are still considered a “smaller reporting
company”, at such time as we cease being an “emerging
growth company”, the disclosure we will be required to
provide in our SEC filings will increase, but will still be less
than it would be if we were not considered either an
“emerging growth company” or a “smaller reporting
company”. Specifically, similar to “emerging
growth companies”, “smaller reporting companies”
are able to provide simplified executive compensation disclosures
in their filings; are exempt from the provisions of
Section 404(b) of the Sarbanes-Oxley Act
(“SOX”) requiring that independent registered public
accounting firms provide an attestation report on the effectiveness
of internal control over financial reporting; and have certain
other decreased disclosure obligations in their SEC filings,
including, among other things, only being required to provide two
years of audited financial statements in annual
reports.
14
Item 1A. RISK FACTORS
Risks related to our business and our industry
We have an extremely limited operating history.
With
respect to the manufacturing and sale of laser-based cleaning
equipment, we are currently a start-up company with limited current
sales of our laser-based cleaning products. There is no historical
basis to make judgments on the capabilities associated with our
enterprise, management and/or employee’s ability to produce a
commercial product leading to a profitable company.
We will need to raise additional capital.
Given
our limited revenues from sales of our laser cleaning products to
date, with no assurance as to when we may begin to receive revenues
sufficient to meet our manufacturing goals, we expect that we will
need to obtain additional operating capital either through equity
offerings, debt offerings or a combination thereof, in the future.
In addition, if, in the future, we are not capable of generating
sufficient revenues from operations and our capital resources are
insufficient to meet future requirements, we may have to raise
funds to allow us to continue to commercialize, market and sell our
products. We presently have no committed sources of funding and we
have not entered into any agreements or arrangements with respect
to our fundraising efforts. We cannot be certain that funding will
be available on acceptable terms or at all. To the extent that we
raise additional funds by issuing equity securities, our
stockholders may experience significant dilution. Any debt
financing, if available, may involve restrictive covenants that may
impact our ability to conduct business. If we are unable to raise
additional capital if required or on acceptable terms, we may have
to significantly scale back, delay or discontinue the development
and/or commercialization of our laser-based cleaning products,
restrict our operations or obtain funds by entering into agreements
on unattractive terms.
If our proposed marketing efforts are unsuccessful, we may not earn
enough revenue to become profitable
.
Our
success will depend on investment in marketing resources and the
successful implementation of our marketing plan. Our marketing plan
may include attendance at trade shows and making private
demonstrations, advertising and promotional materials and
advertising campaigns in print and/or broadcast media. We cannot
give any assurance that our marketing efforts will be successful.
If they are not, revenue may not be sufficient to cover our
fixed costs and we may not become profitable.
The Coronavirus pandemic could delay or eliminate current and
future purchase orders for our laser-based cleaning equipment that
could prevent us from achieving our business plan.
As the
Covid-19 outbreak and the global response to it continue to evolve,
our financial condition, liquidity, and future results of
operations could be negatively affected We are currently involved
in completing purchase orders for our laser-based cleaning
equipment and will be attempting to obtain additional purchase
orders from these customers and new customers. The Covid-19
outbreak could reduce or eliminate the demand for our equipment as
a result of factory closures or slowdowns, disruption of supply
lines, employee absences or government required travel restrictions
and changes in demand for our equipment. As a consequence, our
sales could be depressed and our business may fail if we are not
able to make adjustments to the reduced cash flow or borrow money
on acceptable terms.
We may be unable to respond to rapid technology changes and
innovative products.
In a
constantly changing and innovative technology market with frequent
new product introductions, enhancement and modifications, we may be
forced to implement and develop new technologies into our products
for anticipation of changing customer requirements that may
significantly impact costs in order to retain or enhance our
competitive position in existing and new markets.
15
There is intense competition in our market.
We face
intense competition from other manufacturers of crystalline silicon
laser modules, thin-film laser modules and solar thermal and
concentrated fiber laser systems. By entering this sector, our
management is aware that failure to compete with direct market
leading companies and new entrants will affect overall business and
the product. Therefore, the faster innovative applications and
technologies are implemented to the developed product, the better
the pricing and commercial business strategies management will be
able to offer to businesses purchasing fiber laser systems.
Competitive factors in this market are all related to product
performance, price, customer service, training platforms,
reputation, sales and marketing effectiveness.
Future acquisitions may be
unsuccessful and may negatively affect operations and financial
condition
.
We plan
to grow organically but will be opportunistic in terms of potential
acquisitions of complementary acquisition targets. Should we
acquire other companies, the integration of businesses, personnel,
product lines and technologies can be difficult, time consuming and
subject to significant risks. Any difficulties could disrupt our
ongoing business, distract our management and employees, increase
our expenses and decrease our revenue.
We may be unable to protect our intellectual property.
Our
ability to protect our proprietary technology and operate without
infringing the rights of others will allow our laser-based cleaning
business to compete successfully and achieve future revenue growth.
If we are unable to
protect
our proprietary technology or infringe upon the rights of others,
it could negatively impact our operating results.
If we are unable to hire
additional personnel, we will have trouble growing our
business
.
Our
future success depends on our ability to attract, retain and
motivate highly skilled technical, marketing, management,
accounting and administrative personnel. We plan to hire additional
personnel in all areas of our business as we grow. Competition for
qualified personnel is intense. As a result, we may be unable to
attract and retain qualified personnel. We may also be unable to
retain the employees that we currently employ or to attract
additional technical personnel. The failure to retain and attract
the necessary personnel could seriously harm our business,
financial condition and results of operations.
Because ICT Investments, LLC owns a majority of our outstanding
shares, it can elect our directors without regard to other
stockholders’ votes.
ICT
Investments has majority voting control through his ownership of
all issued and outstanding shares of our common stock. As a result,
it may elect all of our directors, who in turn elect all executive
officers, without regard to the votes of other stockholders. The
voting control of ICT Investments is held by Dmitriy Nikitin which
gives him the ability to authorize change-in-control transactions,
amendments to our articles of incorporation and other matters that
may not be in the best interests of our minority stockholders. In
this regard, Mr. Nikitin has absolute control over our
management and affairs.
We face a higher risk of failure because we cannot accurately
forecast our future revenues and operating results.
The
rapidly changing nature of the markets in which we compete makes it
difficult to accurately forecast our revenues and operating
results. Furthermore, we expect our revenues and operating
results to fluctuate in the future due to a number of factors,
including the following:
•
the
timing of sales of our products;
•
unexpected delays
in introducing new products;
•
increased
expenses, whether related to sales and marketing, or
administration;
•
costs
related to anticipated acquisitions of complementary
businesses.
Our products may suffer defects.
Our
products may suffer defects that may lead to substantial product
liability, damage or warranty claims. Given our complex platforms
and systems within our product, errors and defects may be related
to flight and/or communications. Such an event could result in
significant expenses arising from product liability and warranty
claims, and reduce sales, which could have a material adverse
effect on business, financial condition and results of
operations.
16
We will need to increase the size of our organization, and we may
experience difficulties in managing growth, which would hurt our
financial performance.
We will
need to expand our employee infrastructure for managerial,
operational, financial and other resources in addition to employees
hired from other companies which we may acquire. Future growth will
impose significant added responsibilities on members of management,
including the need to identify, recruit, maintain and integrate
additional employees. Our future financial performance and our
ability to commercialize our product candidates and to compete
effectively will depend, in part, on our ability to manage any
future growth effectively.
In
order to manage our future growth, we will need to continue to
improve our management, operational and financial controls and our
reporting systems and procedures. All of these measures will
require significant expenditures and will demand the attention of
management. If we do not continue to enhance our management
personnel and our operational and financial systems and controls in
response to growth in our business, we could experience operating
inefficiencies that could impair our competitive position and could
increase our costs more than we had planned. If we are unable to
manage growth effectively, our business, financial condition and
operating results could be adversely affected.
Our business depends on experienced and skilled personnel, and if
we are unable to attract and integrate skilled personnel, it will
be more difficult for us to manage our business and complete
contracts.
The
success of our business depends on the skill of our personnel.
Accordingly, it is critical that we maintain, and continue to
build, a highly experienced management team and specialized
workforce, including sales professionals. Competition for
personnel, particularly those with expertise in government
consulting and a security clearance is high and identifying
candidates with the appropriate qualifications can be costly and
difficult. We may not be able to hire the necessary personnel to
implement our business strategy given our anticipated hiring needs,
or we may need to provide higher compensation or more training to
our personnel than we currently anticipate. In addition, our
ability to recruit, hire and indirectly deploy former employees of
the U.S. Government is subject to complex laws and regulations,
which may serve as an impediment to our ability to attract such
former employees.
Our
business is labor intensive and our success depends on our ability
to attract, retain, train and motivate highly skilled employees,
including employees who may become part of our organization in
connection with our acquisitions. The increase in demand for
consulting, technology integration and managed services has further
increased the need for employees with specialized skills or
significant experience in these areas. Our ability to expand our
operations will be highly dependent on our ability to attract a
sufficient number of highly skilled employees and to retain our
employees and the employees of companies that we have acquired. We
may not be successful in attracting and retaining enough employees
to achieve our desired expansion or staffing plans. Furthermore,
the industry turnover rates for these types of employees are high
and we may not be successful in retaining, training or motivating
our employees. Any inability to attract, retain, train and motivate
employees could impair our ability to adequately manage and
complete existing projects and to accept new client engagements.
Such inability may also force us to increase our hiring of
independent contractors, which may increase our costs and reduce
our profitability on client engagements. We must also devote
substantial managerial and financial resources to monitoring and
managing our workforce. Our future success will depend on our
ability to manage the levels and related costs of our
workforce.
In the
event we are unable to attract, hire and retain the requisite
personnel and subcontractors, we may experience delays in
completing contracts in accordance with project schedules and
budgets, which may have an adverse effect on our financial results,
harm our reputation and cause us to curtail our pursuit of new
contracts. Further, any increase in demand for personnel may result
in higher costs, causing us to exceed the budget on a contract,
which in turn may have an adverse effect on our business, financial
condition and operating results and harm our relationships with our
customers.
Insurance and contractual protections may not always cover lost
revenue, increased expenses or liquidated damages payments, which
could adversely affect our financial results.
Although we
maintain insurance and intend to obtain warranties from suppliers,
obligate subcontractors to meet certain performance levels and
attempt, where feasible, to pass risks we cannot control to our
customers, the proceeds of such insurance, warranties, performance
guarantees or risk sharing arrangements may not be adequate to
cover lost revenue, increased expenses or liquidated damages
payments that may be required in the future.
Internal system or service failures could disrupt our business and
impair our ability to effectively provide our services and products
to our customers, which could damage our reputation and adversely
affect our revenues and profitability.
Any
system or service disruptions, including those caused by ongoing
projects to improve our information technology systems and the
delivery of services, if not anticipated and appropriately
mitigated, could have a material adverse effect on our business
including, among other things, an adverse effect on our ability to
bill our customers for work performed on our contracts, collect the
amounts that have been billed and produce accurate financial
statements in a timely manner. We are also subject to system
failures, including network, software or hardware failures, whether
caused by us, third-party service providers, cyber security
threats, natural disasters, power shortages, terrorist attacks or
other events, which could cause loss of data and interruptions or
delays in our business, cause us to incur remediation costs,
subject us to claims and damage our reputation. In addition, the
failure or disruption of our communications or utilities could
cause us to interrupt or suspend our operations or otherwise
adversely affect our business. Our property and business
interruption insurance may be inadequate to compensate us for all
losses that may occur as a result of any system or operational
failure or disruption and, as a result, our future results could be
adversely affected.
17
Our financial performance could be adversely affected by decreases
in spending on technology products and services by our public
sector customers.
Our
sales to our public sector customers are impacted by government
spending policies, budget priorities and revenue levels. An adverse
change in government spending policies (including budget cuts at
the federal level), budget priorities or revenue levels could cause
our public sector customers to reduce their purchases or to
terminate or not renew their contracts with us, which could
adversely affect our business, results of operations or cash
flows.
Our business could be adversely affected by the loss of certain
vendor partner relationships and the availability of their
products.
We
purchase products from vendors on a global basis as components to
include in our finished laser-based cleaning equipment. In the
event we were to lose one of our significant vendor partners, our
business could be adversely affected.
We expect to enter into joint ventures, teaming and other
arrangements, and these activities involve risks and
uncertainties.
We
expect to enter into joint ventures, teaming and other
arrangements. These activities involve risks and uncertainties,
including the risk of the joint venture or applicable entity
failing to satisfy its obligations, which may result in certain
liabilities to us for guarantees and other commitments, the
challenges in achieving strategic objectives and expected benefits
of the business arrangement, the risk of conflicts arising between
us and our partners and the difficulty of managing and resolving
such conflicts, and the difficulty of managing or otherwise
monitoring such business arrangements.
Our business and operations expose us to numerous legal and
regulatory requirements and any violation of these requirements
could harm our business.
We are
subject to numerous federal, state and foreign legal requirements
on matters as diverse as data privacy and protection, employment
and labor relations, immigration, taxation, anticorruption,
import/export controls, trade restrictions, internal and disclosure
control obligations, securities regulation and anti-competition.
Compliance with diverse and changing legal requirements is costly,
time-consuming and requires significant resources. We are also
focused on expanding our business in certain identified growth
areas, such as energy and environment, which are highly regulated
and may expose us to increased compliance risk. Violations of one
or more of these diverse legal requirements in the conduct of our
business could result in significant fines and other damages,
criminal sanctions against us or our officers, prohibitions on
doing business and damage to our reputation. Violations of these
regulations or contractual obligations related to regulatory
compliance in connection with the performance of customer contracts
could also result in liability for significant monetary damages,
fines and/or criminal prosecution, unfavorable publicity and other
reputational damage, restrictions on our ability to compete for
certain work and allegations by our customers that we have not
performed our contractual obligations.
If we do not adequately protect our intellectual property rights,
we may experience a loss of revenue and our operations may be
materially harmed.
We rely
upon confidentiality agreements signed by our employees,
consultants and third parties to protect our intellectual property.
We cannot assure you that we can adequately protect our
intellectual property or successfully prosecute potential
infringement of our intellectual property rights. Also, we cannot
assure you that others will not assert rights in, or ownership of,
trademarks and other proprietary rights of ours or that we will be
able to successfully resolve these types of conflicts to our
satisfaction. Our failure to protect our intellectual property
rights may result in a loss of revenue and could materially
adversely affect our operations and financial
condition.
As a manufacturer of laser cleaning equipment our future success
depends on our ability to effectively balance manufacturing
production with market demand and reducing our manufacturing cost
per watt.
Our
ability to generate the profits we expect to achieve will depend,
in part, on our ability to respond to market demand and add new
manufacturing capacity in a cost-effective manner. In addition, we
must continue to increase the efficiency of our manufacturing
process to compete successfully and generate the returns to our
shareholders, attract growth capital and a qualify for and maintain
a listing on an exchange. Our failure to do so could threaten our
long-term viability.
18
We depend on the U.S. Government for a portion of our business
which we expect to increase and changes in government defense
spending could have adverse consequences on our financial position,
results of operations and business.
Approximately 10%
of our U.S. revenues have been from sales and services rendered
directly or indirectly to the U.S. Government which we expect to
grow to 25% in the next 12 months. Our current contract for the
U.S. Army is a defense related award and our anticipated future
revenues from the U.S. Government are expected to result from
contracts awarded under various U.S. Government programs, primarily
defense-related programs with the Department of Defense (DoD) and
other departments and agencies. Cost cutting including through
consolidation and elimination of duplicative organizations and
insurance has become a major initiative for DoD. The funding of our
programs is subject to the overall U.S. Government budget and
appropriation decisions and processes which are driven by numerous
factors, including geo-political events and macroeconomic
conditions. The overall level of U.S. defense spending increased in
recent years for numerous reasons, including increases in funding
of operations in Iraq and Afghanistan. However, with the winding
down of both wars, defense spending levels are becoming
increasingly difficult to predict and are expected to be affected
by numerous factors. Such factors include priorities of the
Administration and the Congress, and the overall health of the U.S.
and world economies and the state of governmental
finances.
The
Budget Control Act of 2011 enacted 10-year discretionary spending
caps which are expected to generate over $1 trillion in savings for
the U.S. Government, a substantial portion of which comes from DoD
baseline spending reductions. In addition, the Budget Control Act
of 2011 provides for additional automatic spending cuts (referred
to as “sequestration”) totaling $1.2 trillion over nine
years. These reduction targets will further reduce DoD and other
federal agency budgets. Although the Office of Management and
Budget has provided guidance to agencies on implementing
sequestration cuts, there remains much uncertainty about how
exactly sequestration cuts will be implemented and the impact those
cuts will have on contractors supporting the government. Given the
potential impasse over raising the debt ceiling, we are not able to
predict them impact of budget cuts, including sequestration, on our
company or our financial results. However, we expect that budgetary
constraints and concerns related to the national debt will continue
to place downward pressure on DoD spending levels and that
implementation of the automatic spending cuts without change will
reduce, delay or cancel funding for certain of our contracts -
particularly those with unobligated balances - and programs and
could adversely impact our operations, financial results and growth
prospects.
Significant
reduction in defense spending could have long-term consequences for
our size and structure. In addition, reduction in government
priorities and requirements could impact the funding, or the timing
of funding, of our programs, which could negatively impact our
results of operations and financial condition. In addition, we are
involved in U.S. Government programs, which are classified by the
U.S. Government and our ability to discuss these programs,
including any risks and disputes and claims associated with and our
performance under such programs, could be limited due to applicable
security restrictions.
Our financial performance is dependent on our ability to perform on
our current and future expected U.S. Government contracts, which
are subject to termination for convenience, which could harm our
financial performance.
We
believe that our financial performance will dependent on our
performance under our expected U.S. Government contracts.
Government customers have the right to cancel any contract for its
convenience. An unanticipated termination of, or reduced purchases
under, one of the Company’s major contracts whether due to
lack of funding, for convenience or otherwise, or the occurrence of
delays, cost overruns and product failures could adversely impact
our results of operations and financial condition. If one of our
contracts were terminated for convenience, we would generally be
entitled to payments for our allowable costs and would receive some
allowance for profit on the work performed. If one of our contracts
were terminated for default, we would generally be entitled to
payments for our work that has been accepted by the government. A
termination arising out of our default could expose us to liability
and have a negative impact on our ability to obtain future
contracts and orders. Furthermore, on contracts for which we are a
subcontractor and not the prime contractor, the U.S. Government
could terminate the prime contract for convenience or otherwise,
irrespective of our performance as a subcontractor.
19
Our failure to comply with a variety of complex procurement rules
and regulations could result in our being liable for penalties,
including termination of our current and anticipated U.S.
Government contracts, disqualification from bidding on future U.S.
Government contracts and suspension or debarment from U.S.
Government contracting that could adversely affect our financial
condition
.
We must
comply with laws and regulations relating to the formation,
administration and performance of our one existing and anticipated
future U.S. Government contracts, which affect how we do business
with our customers and may impose added costs on our business. U.S.
Government contracts generally are subject to the Federal
Acquisition Regulation (FAR), which sets forth policies, procedures
and requirements for the acquisition of goods and services by the
U.S. Government, department-specific regulations that implement or
supplement DFAR, such as the DOD’s Defense Federal
Acquisition Regulation Supplement (DFARS) and other applicable laws
and regulations. We are also subject to the Truth in Negotiations
Act, which requires certification and disclosure of cost and
pricing data in connection with certain contract negotiations; the
Procurement Integrity Act, which regulates access to competitor bid
and proposal information and government source selection
information, and our ability to provide compensation to certain
former government officials; the Civil False Claims Act, which
provides for substantial civil penalties for violations, including
for submission of a false or fraudulent claim to the U.S.
Government for payment or approval; the Civil False Claims Act,
which provides for substantial civil penalties for violations,
including for submission of a false or fraudulent claim to the U.S.
Government for payment or approval; and the U.S. Government Cost
Accounting Standards, which impose accounting requirements that
govern our right to reimbursement under certain cost-based U.S.
Government contracts. These regulations impose a broad range of
requirements, many of which are unique to government contracting,
including various procurement, import and export, security,
contract pricing and cost, contract termination and adjustment, and
audit requirements. A contractor’s failure to comply with
these regulations and requirements could result in reductions to
the value of contracts, contract modifications or termination, and
the assessment of penalties and fines and lead to suspension or
debarment, for cause, from government contracting or subcontracting
for a period of time. In addition, government contractors are also
subject to routine audits and investigations by U.S. Government
agencies such as the Defense Contract Audit Agency (DCAA) and
Defense Contract Management Agency (DCMA). These agencies review a
contractor’s performance under its contracts, cost structure
and compliance with applicable laws, regulations and standards. The
DCAA also reviews the adequacy of and a contractor’s
compliance with its internal control systems and policies,
including the contractor’s purchasing, property, estimating,
compensation and management information systems. During the term of
any suspension or debarment by any U.S. Government agency,
contractors can be prohibited from competing for or being awarded
contracts by U.S. Government agencies. The termination of any of
the Company’s significant Government contracts or the
imposition of fines, damages, suspensions or debarment would
adversely affect the Company’s business and financial
condition.
The U.S. Government may adopt new contract rules and
regulations or revise its procurement practices in a manner adverse
to us at any time.
Our
industry has experienced, and we expect it will continue to
experience, significant changes to business practices as a result
of an increased focus on affordability, efficiencies, and recovery
of costs, among other items. U.S. Government agencies may face
restrictions or pressure regarding the type and amount of services
that they may obtain from private contractors. Legislation,
regulations and initiatives dealing with procurement reform,
mitigation of potential conflicts of interest and environmental
responsibility or sustainability, as well as any resulting shifts
in the buying practices of U.S. Government agencies, such as
increased usage of fixed price contracts, multiple award contracts
and small business set-aside contracts, could have adverse effects
on government contractors, including us. Any of these changes could
impair our ability to obtain new contracts or renew our existing
contracts when those contracts are recompeted. Any new contracting
requirements or procurement methods could be costly or
administratively difficult for us to implement and could adversely
affect our future revenues, profitability and
prospects.
We may incur cost overruns as a result of fixed priced government
contracts which would have a negative impact on our
operations.
As we
pursue additional U.S. Government contracts in addition to the one
U.S. Government contract we now have for the U.S. Army, we expect
to have to perform under fixed price contracts such as multi-award,
multi-year IDIQ task order based contracts, which generally provide
for fixed price schedules for products and services, have no
pre-set delivery schedules, have very low minimum purchase
requirements, are typically competed among multiple awardees and
could force us to carry the burden of any cost overruns. Due to
their nature, fixed-priced contracts inherently have more risk than
cost reimbursable contracts. If we are unable to control costs or
if our initials cost estimates are incorrect, we can lose money on
these contracts. In addition, some of these fixed price contracts
will likely have provisions relating to cost controls and audit
rights, and if we fail to meet the terms specified in those
contracts, we may not realize their full benefits. Lower earnings
caused by cost overruns and cost controls would have a negative
impact on our results of operations should we receive awards of
such contracts. The U.S. Government has the right to enter into
contracts with other suppliers, which may be competitive with the
Company’s IDIQ contracts. The Company anticipates that it may
also perform fixed priced contracts under which the Company agrees
to provide specific quantities of products and services over time
for a fixed price. Since the price competition to win both IDIQ and
fixed price contracts is intense and the costs of future contract
performance cannot be predicted with certainty, there can be no
assurance as to the profits, if any, that the Company will realize
over the term of such contracts.
20
Misconduct of employees, subcontractors, agents and business
partners could cause us to lose existing contracts or customers and
adversely affect our ability to obtain new contracts and customers
and could have a significant adverse impact on our business and
reputation.
Misconduct could
include fraud or other improper activities such as falsifying time
or other records and violations of laws, including the
Anti-Kickback Act. Other examples could include the failure to
comply with our policies and procedures or with federal, state or
local government procurement regulations, regulations regarding the
use and safeguarding of classified or other protected information,
legislation regarding the pricing of labor and other costs in
government contracts, laws and regulations relating to
environmental, health or safety matters, bribery of foreign
government officials, import-export control, lobbying or similar
activities, and any other applicable laws or regulations. Any data
loss or information security lapses resulting in the compromise of
personal information or the improper use or disclosure of sensitive
or classified information could result in claims, remediation
costs, regulatory sanctions against us, loss of current and future
contracts and serious harm to our reputation. Although we have
implemented policies, procedures and controls to prevent and detect
these activities, these precautions may not prevent all misconduct,
and as a result, we could face unknown risks or losses. Our failure
to comply with applicable laws or regulations or misconduct by any
of our employees, subcontractors, agents or business partners could
damage our reputation and subject us to fines and penalties,
restitution or other damages, loss of security clearance, loss of
current and future customer contracts and suspension or debarment
from contracting with federal, state or local government agencies,
any of which would adversely affect our business, reputation and
our future results.
We may fail to obtain and maintain necessary security clearances,
which may adversely affect our ability to perform on certain
anticipated U.S. government contracts and depress our potential
revenues.
Many
U.S. Government programs require contractors to have security
clearances. Depending on the level of required clearance, security
clearances can be difficult and time-consuming to obtain. If we or
our employees are unable to obtain or retain necessary security
clearances, we may not be able to win new business, and our
existing clients could terminate their contracts with us or decide
not to renew them. To the extent we are not able to obtain and
maintain facility security clearances or engage employees with the
required security clearances for a particular contract, we may not
be able to bid on or win new contracts, or effectively rebid on
expiring contracts, as well as lose existing contracts, which may
adversely affect our operating results and inhibit the execution of
our growth strategy.
Our future revenues and growth prospects could be adversely
affected by our dependence on other contractors.
If
other contractors with whom we have contractual relationships
either as a prime contractor or subcontractor eliminate or reduce
their work with us, or if the U.S. Government terminates or reduces
these other contractors’ programs, does not award them new
contracts or refuses to pay under a contract our financial and
business condition may be adversely affected. Companies that do not
have access to U.S. Government contracts may perform services as
our subcontractor and that exposure could enhance such
companies’ prospect of securing a future position as a prime
U.S. Government contractor which could increase competition for
future contracts and impair our ability to perform on
contracts.
We may
have disputes with our subcontractors arising from, among other
things, the quality and timeliness of work performed by the
subcontractor, customer concerns about the subcontractor, our
failure to extend existing task orders or issue new task orders
under a subcontract, our hiring of a subcontractor’s
personnel or the subcontractor’s failure to comply with
applicable law. Current uncertain economic conditions heighten the
risk of financial stress of our subcontractors, which could
adversely impact their ability to meet their contractual
requirements to us. If any of our subcontractors fail to timely
meet their contractual obligations or have regulatory compliance or
other problems, our ability to fulfill our obligations as a prime
contractor or higher tier subcontractor may be jeopardized.
Significant losses could arise in future periods and subcontractor
performance deficiencies could result in our termination for
default. A termination for default could eliminate a revenue
source, expose us to liability and have an adverse effect on our
ability to compete for future contracts and task orders, especially
if the customer is an agency of the U.S. Government.
Our international business exposes us to geo-political and economic
factors, regulatory requirements and other risks associated with
doing business in foreign countries.
.
We
intend to engage in additional foreign operations which pose
complex management, foreign currency, legal, tax and economic
risks, which we may not adequately address. These risks differ from
and potentially may be greater than those associated with our
domestic business.
Our
international business is sensitive to changes in the priorities
and budgets of international customers and geo-political
uncertainties, which may be driven by changes in threat
environments and potentially volatile worldwide economic
conditions, various regional and local economic and political
factors, risks and uncertainties, as well as U.S. foreign policy.
Our international sales are subject to U.S. laws, regulations and
policies, including the International Traffic in Arms Regulations
(ITAR) and the Foreign Corrupt Practices Act (see below) and other
export laws and regulations. Due to the nature of our products, we
must first obtain licenses and authorizations from various U.S.
Government agencies before we are permitted to sell our products
outside of the U.S. We can give no assurance that we will continue
to be successful in obtaining the necessary licenses or
authorizations or that certain sales will not be prevented or
delayed. Any significant impairment of our ability to sell products
outside of the U.S. could negatively impact our results of
operations and financial condition.
21
Our
international sales are also subject to local government laws,
regulations and procurement policies and practices which may differ
from U.S. Government regulations, including regulations relating to
import-export control, investments, exchange controls and
repatriation of earnings, as well as to varying currency,
geo-political and economic risks. Our international contracts may
include industrial cooperation agreements requiring specific
in-country purchases, manufacturing agreements or financial support
obligations, known as offset obligations, and provide for penalties
if we fail to meet such requirements. Our international contracts
may also be subject to termination at the customer’s
convenience or for default based on performance, and may be subject
to funding risks. We also are exposed to risks associated with
using foreign representatives and consultants for international
sales and operations and teaming with international subcontractors,
partners and suppliers in connection with international programs.
As a result of these factors, we could experience award and funding
delays on international programs and could incur losses on such
programs, which could negatively impact our results of operations
and financial condition.
We are
also subject to a number of other risks including:
●
the absence in some jurisdictions of effective laws to protect our
intellectual property rights;
●
multiple and possibly overlapping and conflicting tax
laws;
●
restrictions on movement of cash;
●
the burdens of complying with a variety of national and local
laws;
●
political instability;
●
currency fluctuations;
●
longer payment cycles;
●
restrictions on the import and export of certain
technologies;
●
price controls or restrictions on exchange of foreign currencies;
and
●
trade barriers.
Our international operations are subject to special U.S. government
laws and regulations, such as the Foreign Corrupt Practices Act,
and regulations and procurement policies and practices, including
regulations to import-export control, which may expose us to
liability or impair our ability to compete in international
markets.
Our
international operations are subject to the U.S. Foreign Corrupt
Practices Act, or the FCPA, and other laws that prohibit improper
payments or offers of payments to foreign governments and their
officials and political parties by U.S. and other business entities
for the purpose of obtaining or retaining business. We expect to
have operations and deal with governmental customers in countries
known to experience corruption, including certain countries in the
Middle East and in the future, the Far East. Our activities in
these countries could create the risk of unauthorized payments or
offers of payments by one of our employees, consultants or
contractors that could be in violation of various laws including
the FCPA, even though these parties are not always subject to our
control. We are also subject to import-export control regulations
restricting the use and dissemination of information classified for
national security purposes and the export of certain products,
services, and technical data, including requirements regarding any
applicable licensing of our employees involved in such
work.
As a U.S. defense contractor we are vulnerable to security threats
and other disruptions that could negatively impact our
business.
As a
U.S. defense contractor, we face certain security threats,
including threats to our information technology infrastructure,
attempts to gain access to our proprietary or classified
information, and threats to physical security. These types of
events could disrupt our operations, require significant management
attention and resources, and could negatively impact our reputation
among our customers and the public, which could have a negative
impact on our financial condition, results of operations and
liquidity. We are continuously exposed to cyber-attacks and other
security threats, including physical break-ins. Any electronic or
physical break-in or other security breach or compromise may
jeopardize security of information stored or transmitted through
our information technology systems and networks. This could lead to
disruptions in mission-critical systems, unauthorized release of
confidential or otherwise protected information and corruption of
data. Although we have implemented policies, procedures and
controls to protect against, detect and mitigate these threats, we
face advanced and persistent attacks on our information systems and
attempts by others to gain unauthorized access to our information
technology systems are becoming more sophisticated. These attempts
include covertly introducing malware to our computers and networks
and impersonating authorized users, among others, and may be
perpetrated by well-funded organized crime or state sponsored
efforts. We seek to detect and investigate all security incidents
and to prevent their occurrence or recurrence. We continue to
invest in and improve our threat protection, detection and
mitigation policies, procedures and controls. In addition, we work
with other companies in the industry and government participants on
increased awareness and enhanced protections against cyber security
threats. However, because of the evolving nature and sophistication
of these security threats, which can be difficult to detect, there
can be no assurance that our policies, procedures and controls have
or will detect or prevent any of these threats and we cannot
predict the full impact of any such past or future incident.
Although we work cooperatively with our customers and other
business partners to seek to minimize the impacts of cyber and
other security threats, we must rely on the safeguards put in place
by those entities. Any remedial costs or other liabilities related
to cyber or other security threats may not be fully insured or
indemnified by other means. Occurrence of any of these security
threats could expose us to claims, contract terminations and
damages and could adversely affect our reputation, ability to work
on sensitive U.S. Government contracts, business operations and
financial results.
22
Difficult conditions in the global capital markets and the economy
generally may materially adversely affect our business and results
of operations.
Our
results of operations are materially affected by conditions in the
global capital markets and the economy generally, both in the U.S.
and elsewhere around the world. Weak economic conditions sustained
uncertainty about global economic conditions, concerns about future
U.S. budgetary cuts, or a prolonged or further tightening of credit
markets could cause our customers and potential customers to
postpone or reduce spending on technology products or services or
put downward pressure on prices, which could have an adverse effect
on our business, results of operations or cash flows. In the event
of extreme prolonged adverse market events, such as a global credit
crisis, we could incur significant losses.
Risks Related to Our Common Stock
We are eligible to be treated as an “emerging growth
company” as defined in the Jumpstart Our Business Startups
Act of 2012, and we cannot be certain if the reduced disclosure
requirements applicable to emerging growth companies will make our
common stock less attractive to investors.
We are
an “emerging growth company”, as defined in the
Jumpstart Our Business Startups Act of 2012, or the JOBS Act. For
as long as we continue to be an emerging growth company, we may
take advantage of exemptions from various reporting requirements
that are applicable to other public companies that are not emerging
growth companies, including (1) not being required to comply
with the auditor attestation requirements of Section 404 of
the Sarbanes-Oxley Act of 2002, which we refer to as the
Sarbanes-Oxley Act, (2) reduced disclosure obligations
regarding executive compensation in this FORM 10-K and our periodic
reports and proxy statements and (3) exemptions from the
requirements of holding a nonbinding advisory vote on executive
compensation and stockholder approval of any golden parachute
payments not previously approved. In addition, as an emerging
growth company, we are only required to provide two years of
audited financial statements and two years of selected financial
data in this FORM 10-K. We could be an emerging growth company for
up to five years, although circumstances could cause us to lose
that status earlier, including if the market value of our common
stock held by non-affiliates exceeds $700.0 million as of any
June 30 before that time or if we have total annual gross
revenue of $1.0 billion or more during any fiscal year before that
time, in which cases we would no longer be an emerging growth
company as of the following December 31 or, if we issue more
than $1.0 billion in non-convertible debt during any three-year
period before that time, we would cease to be an emerging growth
company immediately. Even after we no longer qualify as an emerging
growth company, we may still qualify as a “smaller reporting
company” which would allow us to take advantage of many of
the same exemptions from disclosure requirements, including not
being required to comply with the auditor attestation requirements
of Section 404 of the Sarbanes-Oxley Act and reduced
disclosure obligations regarding executive compensation in our
periodic reports and proxy statements. We cannot predict if
investors will find our common stock less attractive because we may
rely on these exemptions. If some investors find our common stock
less attractive as a result, there may be a less active trading
market for our common stock and our stock price may be more
volatile.
Our
independent registered public accounting firm will not be required
to formally attest to the effectiveness of our internal control
over financial reporting until the later of our second annual
report or the first annual report required to be filed with the
Commission following the date we are no longer an “emerging
growth company” as defined in the JOBS “Act. We cannot
assure you that there will not be material weaknesses or
significant deficiencies in our internal controls in the
future.
Under
the JOBS Act, emerging growth companies can also delay adopting new
or revised accounting standards until such time as those standards
apply to private companies. We have irrevocably elected not to
avail ourselves of this exemption from new or revised accounting
standards and, therefore, will be subject to the same new or
revised accounting standards as other public companies that are not
emerging growth companies.
Our largest shareholder
beneficially owns a significant number of shares of our common
stock. That shareholder’s interests may conflict with other
stockholders, who may be unable to influence management and
exercise control over our business
.
As of
the date of this Form 10-K, our largest shareholder, ICT
Investments, owns approximately 97% of our shares of common stock.
As a result, ICT Investments is able to: elect or defeat the
election of our directors, amend or prevent amendment to our
certificates of incorporation or bylaws, effect or prevent a
merger, sale of assets or other corporate transaction, and control
the outcome of any other matter submitted to the shareholders for
vote. Accordingly, other stockholders may be unable to influence
management and exercise control over our business.
We do not intend to pay cash dividends to our stockholders, so you
will not receive any return on your investment in our Company prior
to selling your interest in the Company.
We have
never paid any dividends to our common stockholders as a public
company. We currently intend to retain any future earnings for
funding growth and, therefore, do not expect to pay any cash
dividends in the foreseeable future. If we determine that we will
pay cash dividends to the holders of our common stock, we cannot
assure that such cash dividends will be paid on a timely basis. The
success of your investment in the Company will likely depend
entirely upon any future appreciation. As a result, you will not
receive any return on your investment prior to selling your shares
in our Company and, for the other reasons discussed in this
“Risk Factors” section, you may not receive any return
on your investment even when you sell your shares in our
Company.
23
Anti-Takeover, Limited Liability and Indemnification
Provisions
Some provisions of our articles of incorporation and bylaws may
deter takeover attempts, which may inhibit a takeover that
stockholders consider favorable and limit the opportunity of our
stockholders to sell their shares at a favorable
price.
Under
our articles of incorporation, our Board of Directors may issue
additional shares of common or preferred stock. Our Board of
Directors has the ability to authorize “blank check”
preferred stock without future shareholder approval. This makes it
possible for our board of directors to issue preferred stock with
voting or other rights or preferences that could impede the success
of any attempt to acquire us by means of a merger, tender offer,
proxy contest or otherwise, including a transaction in which our
stockholders would receive a premium over the market price for
their shares and/or any other transaction that might otherwise be
deemed to be in their best interests, and thereby protects the
continuity of our management and limits an investor’s
opportunity to profit by their investment in the Company.
Specifically, if in the due exercise of its fiduciary obligations,
the Board of Directors were to determine that a takeover proposal
was not in our best interest, shares could be issued by our Board
of Directors without stockholder approval in one or more
transactions that might prevent or render more difficult or costly
the completion of the takeover by:
●
diluting the voting or other rights of the proposed acquirer or
insurgent stockholder group,
●
putting a substantial voting bloc in institutional or other hands
that might undertake to support the incumbent Board of Directors,
or
●
effecting an acquisition that might complicate or preclude the
takeover.
Our indemnification of our officers and directors may cause us to
use corporate resources to the detriment of our
stockholders.
Our
certificate of incorporation eliminates the personal liability of
our directors for monetary damages arising from a breach of their
fiduciary duty as directors to the fullest extent permitted by
Delaware law. This limitation does not affect the availability of
equitable remedies, such as injunctive relief or rescission. Our
articles of incorporation require us to indemnify our directors and
officers to the fullest extent permitted by Delaware law, including
in circumstances in which indemnification is otherwise
discretionary under Delaware law.
Under
Delaware law, we may indemnify our directors or officers or other
persons who were, are or are threatened to be made a named
defendant or respondent in a proceeding because the person is or
was our director, officer, employee or agent, if we determine that
the person
:
•
conducted himself
or herself in good faith, reasonably believed, in the case of
conduct in his or her official capacity as our director or officer,
that his or her conduct was in our best interests, and, in all
other cases, that his or her conduct was at least not opposed to
our best interests; and
•
in the
case of any criminal proceeding, had no reasonable cause to believe
that his or her conduct was unlawful. These persons may be
indemnified against expenses, including attorneys’ fees,
judgments, fines, including excise taxes, and amounts paid in
settlement, actually and reasonably incurred, by the person in
connection with the proceeding. If the person is found liable to
the corporation, no indemnification will be made unless the court
in which the action was brought determines that the person is
fairly and reasonably entitled to indemnity in an amount that the
court will establish.
These
persons may be indemnified against expenses, including
attorneys’ fees, judgments, fines, including excise taxes,
and amounts paid in settlement, actually and reasonably incurred,
by the person in connection with the proceeding. If the person is
found liable to the corporation, no indemnification will be made
unless the court in which the action was brought determines that
the person is fairly and reasonably entitled to indemnity in an
amount that the court will establish.
Insofar
as indemnification for liabilities under the Securities Act may be
permitted to directors, officers or persons controlling us under
the above provisions, we have been informed that, in the opinion of
the SEC, such indemnification is against public policy as expressed
in the Securities Act and is, therefore,
unenforceable.
24
The obligations associated with being a public company require
significant resources and management attention, which may divert
from our business operations.
We will
be subject to the reporting requirements of the Securities Exchange
Act of 1934, as amended (the “Exchange Act”), and The
Sarbanes-Oxley Act of 2002, or the Sarbanes-Oxley Act. The Exchange
Act requires that we file annual, quarterly and current reports
with respect to our business and financial condition, proxy
statement, and other information. The Sarbanes-Oxley Act requires,
among other things, that we establish and maintain effective
internal controls and procedures for financial reporting. Our Chief
Executive Officer and Chief Financial Officer will need to certify
that our disclosure controls and procedures are effective in
ensuring that material information we are required to disclose in
reports that we file or submit under the Exchange Act is recorded,
processed, summarized and reported within the time periods
specified in the SEC’s rules and forms. We may need to
hire additional financial reporting, internal controls and other
financial personnel in order to develop and implement appropriate
internal controls and reporting procedures. As a result, we will
incur significant legal, accounting and other expenses.
Furthermore, the need to establish the corporate infrastructure
demanded of a public company may divert management’s
attention from implementing our growth strategy, which could
prevent us from improving our business, results of operations and
financial condition. We have made, and will continue to make,
changes to our internal controls and procedures for financial
reporting and accounting systems to meet our reporting obligations
as a public company. However, the measures we take may not be
sufficient to satisfy our obligations as a public company. In
addition, we cannot predict or estimate the amount of additional
costs we may incur in order to comply with these requirements. We
anticipate that these costs will materially increase our selling,
general and administrative expenses.
Section 404 of
the Sarbanes-Oxley Act requires annual management assessments of
the effectiveness of our internal control over financial reporting.
In connection with the implementation of the necessary procedures
and practices related to internal control over financial reporting,
we may identify deficiencies. If we are unable to comply with the
internal controls requirements of the Sarbanes-Oxley Act of 2002,
then we may not be able to obtain the independent account and
certifications required by that act, which may preclude us from
keeping our filings with the SEC current, and interfere with the
ability of investors to trade our securities and our shares to
continue to be quoted on the OTCQB or our ability to list our
shares on any national securities exchange.
If we fail to establish and maintain an effective system of
internal controls, we may not be able to report our financial
results accurately or prevent fraud. Any inability to report and
file our financial results accurately and timely could harm our
reputation and adversely impact the trading price of our common
stock.
Effective internal
controls are necessary for us to provide reliable financial reports
and prevent fraud. If we cannot provide reliable financial reports
or prevent fraud, we may not be able to manage our business as
effectively as we would if an effective control environment
existed, and our business and reputation with investors may be
harmed. With each prospective acquisition we may make we will
conduct whatever due diligence is necessary or prudent to assure us
that the acquisition target can comply with the internal controls
requirements of the Sarbanes-Oxley Act. Notwithstanding our
diligence, certain internal controls deficiencies may not be
detected. As a result, any internal control deficiencies may
adversely affect our financial condition, results of operations and
access to capital. We have not performed an in-depth analysis to
determine if historical undiscovered failures of internal controls
exist and may in the future discover areas of our internal controls
that need improvement.
Public company compliance may make it more difficult to attract and
retain officers and directors.
The
Sarbanes-Oxley Act and rules implemented by the SEC have
required changes in corporate governance practices of public
companies. As a public company, these rules and regulations
increase our compliance costs and make certain activities more time
consuming and costly. As a public company, these rules and
regulations may make it more difficult and expensive for us to
maintain our director and officer liability insurance and we may be
required to accept reduced policy limits and coverage or incur
substantially higher costs to obtain the same or similar coverage.
As a result, it may be more difficult for us to attract and retain
qualified persons to serve on our board of directors or as
executive officers, and to maintain insurance at reasonable rates,
or at all.
Our stock price may be volatile.
The
market price of our common stock is likely to be highly volatile
and could fluctuate widely in price in response to various factors,
many of which are beyond our control, including the
following:
●
our ability to execute our business plan and complete prospective
acquisitions;
●
changes in our industry;
●
competitive pricing pressures;
●
our ability to obtain working capital financing;
●
additions or departures of key personnel;
●
limited “public float” in the hands of a small number
of persons whose sales or lack of sales could result in positive or
negative pricing pressure on the market price for our common
stock;
●
sales of our common stock (particularly following effectiveness of
this FORM 10-K);
●
operating results that fall below expectations;
●
regulatory developments;
●
economic and other external factors;
●
period-to-period fluctuations in our financial
results;
●
our inability to develop or acquire new or needed
technologies;
●
the public’s response to press releases or other public
announcements by us or third parties, including filings with the
SEC;
●
changes in financial estimates or ratings by any securities
analysts who follow our common stock, our failure to meet these
estimates or failure of those analysts to initiate or maintain
coverage of our common stock;
●
the development and sustainability of an active trading market for
our common stock; and
●
any future sales of our common stock by our officers, directors and
significant stockholders.
25
In
addition, the securities markets have from time to time experienced
significant price and volume fluctuations that are unrelated to the
operating performance of particular companies. These market
fluctuations may also materially and adversely affect the market
price of our common stock.
Unless we have a successful IPO, our shares of common stock will be
thinly traded, the price may not reflect our value and there can be
no assurance that there will be an active market for our shares of
common stock either now or in the future.
Our
shares of common stock will be thinly traded so long as they are
held by a small number of shareholders, and the price may not
reflect our actual or perceived value. There can be no assurance
that there will be an active market for our shares of common stock
either now or in the future. The market liquidity will be dependent
on the perception of our operating business, among other things. We
will take certain steps including utilizing investor awareness
campaigns and firms, press releases, road shows and conferences to
increase awareness of our business. Any steps that we might take to
bring us to the awareness of investors may require that we
compensate consultants with cash and/or stock. There can be no
assurance that there will be any awareness generated or the results
of any efforts will result in any impact on our trading volume.
Consequently, investors may not be able to liquidate their
investment or liquidate it at a price that reflects the value of
the business, and trading may be at an inflated price relative to
the performance of the Company due to, among other things, the
availability of sellers of our shares.
If an
active market should develop following a successful IPO, whether it
is self-underwritten, through a Regulation A offering or a more
traditional underwritten IPO, and we do not qualify for listing on
a national exchange, the price may be highly volatile. Because
there is currently a low price for our shares of common stock, many
brokerage firms or clearing firms are not willing to effect
transactions in the securities or accept our shares for deposit in
an account. Many lending institutions will not permit the use of
low priced shares of common stock as collateral for any loans.
Furthermore, if our securities qualify for trading on the OTCQB,
our share price may continue to be volatile since on the OTCQB
since it is more difficult than being traded on a national exchange
(1) to obtain accurate quotations, (2) to obtain coverage
for significant news events because major wire services generally
do not publish press releases about these companies, and
(3) to obtain needed capital.
Our common stock may be deemed a “penny stock,” which
would make it more difficult for our investors to sell their
shares.
Our
common stock is currently subject to the “penny stock”
rules adopted under Section 15(g) of the Exchange
Act. The penny stock rules generally apply to companies whose
common stock is not listed on The Nasdaq Stock Market or another
national securities exchange and trades at less than $4.00 per
share, other than companies that have had average revenues of at
least $6,000,000 for the last three years or that have tangible net
worth of at least $5,000,000 ($2,000,000 if the company has been
operating for three or more years). These rules require, among
other things, that brokers who trade penny stock to persons other
than “established customers” complete certain
documentation, make suitability inquiries of investors and provide
investors with certain information concerning trading in the
security, including a risk disclosure document and quote
information under certain circumstances. Many brokers have decided
not to trade penny stocks because of the requirements of the penny
stock rules and, as a result, the number of broker-dealers
willing to act as market makers in these securities is limited. If
we remain subject to the penny stock rules for any significant
period, it could have an adverse effect on the market, if any, for
our securities. If our securities are subject to the penny stock
rules, investors will find it more difficult to dispose of our
securities.
Offers or availability for sale of a substantial number of shares
of our common stock may cause the price of our common stock to
decline.
If our
stockholders sell substantial amounts of our common stock in the
public market upon the expiration of any statutory holding period
under Rule 144, or shares issued upon the exercise of
outstanding options or warrants, it could create a circumstance
commonly referred to as an “overhang” and, in
anticipation of which, the market price of our common stock could
fall. The existence of an overhang, whether or not sales have
occurred or are occurring, also could make more difficult our
ability to raise additional financing through the sale of equity or
equity-related securities in the future at a time and price that we
deem reasonable or appropriate.
Sales
of substantial amounts of our common stock in the public market, or
the perception that these sales could occur, could adversely affect
the price of our common stock and impair our ability to raise
capital through the sale of shares.
Any substantial sale of stock by existing shareholders could
depress the market value of our stock, thereby devaluing the market
price and causing investors to risk losing all or part of their
investment.
ICT
Investments holds a large number of our outstanding shares. We can
make no prediction as to the effect, if any, that sales of shares,
or the availability of shares for future sale, will have on the
prevailing market price of our shares of common stock. Sales of
substantial amounts of shares in the public market, or the
perception that such sales could occur, could depress prevailing
market prices for the shares. Such sales may also make it more
difficult for us to sell equity securities or equity-related
securities in the future at a time and price which it deems
appropriate.
26
Risks Related to Our IP
Our Success May Depend on Our Ability to Obtain and Protect
the Proprietary Information on Which We Base Our Laser-Based
Cleaning Equipment..
As we
acquire companies with intellectual property (“IP”)
that is important to the development of our laser cleaning
products, we will need to:
●
obtain valid and enforceable patents;
●
protect trade secrets; and
●
operate without infringing upon the proprietary rights of
others.
We will
be able to protect our proprietary technology from unauthorized use
by third parties only to the extent that such proprietary rights
are covered by valid and enforceable patents or are effectively
maintained as trade secrets. Any non-confidential disclosure to or
misappropriation by third parties of our confidential or
proprietary information could enable competitors to quickly
duplicate or surpass our technological achievements, thus eroding
our competitive position in our market.
The
patent application process, also known as patent prosecution, is
expensive and time-consuming, and we and our current or future
licensors and licensees may not be able to prepare, file and
prosecute all necessary or desirable patent applications at a
reasonable cost or in a timely manner. It is also possible that we
or our current licensors, or any future licensors or licensees,
will fail to identify patentable aspects of inventions made in the
course of development and commercialization activities before it is
too late to obtain patent protection on them. Therefore, these and
any of our patents and applications may not be prosecuted and
enforced in a manner consistent with the best interests of our
business. It is possible that defects of form in the preparation or
filing of our patents or patent applications may exist, or may
arise in the future, for example with respect to proper priority
claims or inventorship. If we or our current licensors or
licensees, or any future licensors or licensees, fail to establish,
maintain or protect such patents and other intellectual property
rights, such rights may be reduced or eliminated. If our current
licensors or licensees, or any future licensors or licensees, are
not fully cooperative or disagree with us as to the prosecution,
maintenance or enforcement of any patent rights, such patent rights
could be compromised. If there are material defects in the form or
preparation of our patents or patent applications, such patents or
applications may be invalid and unenforceable. Any of these
outcomes could impair our ability to prevent competition from third
parties, which may harm our business.
The
patent applications that we may own or license may fail to result
in issued patents in the United States or in other countries. Even
if patents do issue on such patent applications, third parties may
challenge the validity, enforceability or scope thereof, which may
result in such patents being narrowed, invalidated or held
unenforceable. For example, U.S. patents can be challenged by any
person before the new USPTO Patent Trial and Appeals Board at any
time within the one year period following that person’s
receipt of an allegation of infringement of the patents. Patents
granted by the European Patent Office may be similarly opposed by
any person within nine months from the publication of the grant.
Similar proceedings are available in other jurisdictions, and in
the United States, Europe and other jurisdictions third parties can
raise questions of validity with a patent office even before a
patent has granted. Furthermore, even if they are unchallenged, our
patents and patent applications may not adequately protect our
intellectual property or prevent others from designing around our
claims. If the breadth or strength of protection provided by the
patents and patent applications we hold or pursue with respect to
our product candidates is successfully challenged, then our ability
to commercialize such product candidates could be negatively
affected, and we may face unexpected competition that could harm
our business. Further, if we encounter delays in our clinical
trials, the period of time during which we or our collaborators
could market our product candidates under patent protection would
be reduced.
The
degree of future protection of our proprietary rights is uncertain.
Patent protection may be unavailable or severely limited in some
cases and may not adequately protect our rights or permit us to
gain or keep our competitive advantage. For example:
●
we might not have been the first to invent or the first to file the
inventions covered by each of our pending patent applications and
issued patents;
●
others may be able to make, use, sell, offer to sell or import
products that are similar to our products or product candidates but
that are not covered by the claims of our patents; others may
independently develop similar or alternative technologies or
duplicate any of our technologies;
●
the proprietary rights of others may have an adverse effect on our
business;
●
any proprietary rights we do obtain may not encompass commercially
viable products, may not provide us with any competitive advantages
or may be challenged by third parties;
●
any patents we obtain or our in-licensed issued patents may not be
valid or enforceable; or
●
we may not develop additional technologies or products that are
patentable or suitable to maintain as trade secrets.
27
If we
or our current licensors or licensees, or any future licensors or
licensees, fail to prosecute, maintain and enforce patent
protection for our product candidates, our ability to develop and
commercialize our product candidates could be harmed and we might
not be able to prevent competitors from making, using and selling
competing products. This failure to properly protect the
intellectual property rights relating to our product candidates
could harm our business, financial condition and operating results.
Moreover, our competitors may independently develop equivalent
knowledge, methods and know-how.
Even
where laws provide protection, costly and time-consuming litigation
could be necessary to enforce and determine the scope of our
proprietary rights, and the outcome of such litigation would be
uncertain. If we or one of our collaborators were to initiate legal
proceedings against a third party to enforce a patent covering the
product candidate, the defendant could assert an affirmative
defense or counterclaim that our patent is not infringed, invalid
and/or unenforceable. In patent litigation in the United States,
defendant defenses and counterclaims alleging non-infringement,
invalidity and/or unenforceability are commonplace. Grounds for a
validity challenge could be an alleged failure to meet any of
several statutory requirements, including lack of novelty,
anticipation or obviousness, and lack of written description,
definiteness or enablement. Patents may be unenforceable if someone
connected with prosecution of the patent withheld material
information from the USPTO, or made a misleading statement, during
prosecution. The outcomes of proceedings involving assertions of
invalidity and unenforceability are unpredictable. It is possible
that prior art of which we and the patent examiner were unaware
during prosecution exists, which would render our patents invalid.
Moreover, it is also possible that prior art may exist that we are
aware of, but that we do not believe are relevant to our current or
future patents, that could nevertheless be determined to render our
patents invalid. If a defendant were to prevail on a legal
assertion of invalidity and/or unenforceability of our patents
covering one of our product candidates, we would lose at least
part, and perhaps all, of the patent protection on such product
candidate. Such a loss of patent protection would harm our
business. Moreover, our competitors could counterclaim in any suit
to enforce our patents that we infringe their intellectual
property. Furthermore, some of our competitors have substantially
greater intellectual property portfolios, and resources, than we
do.
Our
ability to stop third parties from using our technology or making,
using, selling, offering to sell or importing our products is
dependent upon the extent to which we have rights under valid and
enforceable patents that cover these activities. If any patent we
currently or in the future may own or license is deemed not
infringed, invalid or unenforceable, it could impact our commercial
success. We cannot predict the breadth of claims that may be issued
from any patent applications we currently or may in the future own
or license from third parties.
To the
extent that consultants or key employees apply technological
information independently developed by them or by others to our
product candidates, disputes may arise as to who has the
proprietary rights to such information and product candidates, and
certain of such disputes may not be resolved in our favor.
Consultants and key employees that work with our confidential and
proprietary technologies are required to assign all intellectual
property rights in their inventions and discoveries created during
the scope of their work to our company. However, these consultants
or key employees may terminate their relationship with us, and we
cannot preclude them indefinitely from dealing with our
competitors.
If we are unable to prevent disclosure of our trade secrets or
other confidential information to third parties, our competitive
position may be impaired.
We also
may rely on trade secrets to protect our technology, especially
where we do not believe patent protection is appropriate or
obtainable. Our ability to stop third parties from obtaining the
information or know-how necessary to make, use, sell, offer to sell
or import our products or practice our technology is dependent in
part upon the extent to which we prevent disclosure of the trade
secrets that cover these activities. Trade secret rights can be
lost through disclosure to third parties. Although we use
reasonable efforts to protect our trade secrets, our employees,
consultants, contractors, outside scientific collaborators and
other advisors may unintentionally or willfully disclose our trade
secrets to third parties, resulting in loss of trade secret
protection. Moreover, our competitors may independently develop
equivalent knowledge, methods and know-how, which would not
constitute a violation of our trade secret rights. Enforcing a
claim that a third party is engaged in the unlawful use of our
trade secrets is expensive, difficult and time consuming, and the
outcome is unpredictable. In addition, recognition of rights in
trade secrets and a willingness to enforce trade secrets differs in
certain jurisdictions.
28
If we are sued for infringing intellectual property rights of third
parties, it will be costly and time consuming, and an unfavorable
outcome in that litigation could harm our business.
Our
commercial success depends significantly on our ability to operate
without infringing, violating or misappropriating the patents and
other proprietary rights of third parties. Our own technologies we
acquire or develop may infringe, violate or misappropriate the
patents or other proprietary rights of third parties, or we may be
subject to third-party claims of such infringement. Numerous U.S.
and foreign issued patents and pending patent applications owned by
third parties, exist in the fields in which we are developing our
product candidates. Because some patent applications may be
maintained in secrecy until the patents are issued, because
publication of patent applications is often delayed, and because
publications in the scientific literature often lag behind actual
discoveries, we cannot be certain that we were the first to invent
the technology or that others have not filed patent applications
for technology covered by our pending applications. We may not be
aware of patents that have already issued that a third party might
assert are infringed by our product candidates. It is also possible
that patents of which we are aware, but which we do not believe are
relevant to our product candidates, could nevertheless be found to
be infringed by our product candidates. Moreover, we may face
patent infringement claims from non-practicing entities that have
no relevant product revenue and against whom our own patent
portfolio may thus have no deterrent effect. In the future, we may
agree to indemnify our manufacturing partners against certain
intellectual property claims brought by third parties.
Intellectual
property litigation involves many risks and uncertainties, and
there is no assurance that we will prevail in any lawsuit brought
against us. Third parties making claims against us for
infringement, violation or misappropriation of their intellectual
property rights may seek and obtain injunctive or other equitable
relief, which could effectively block our ability to further
develop and commercialize our product candidates. Further, if a
patent infringement suit were brought against us, we could be
forced to stop or delay research, development, manufacturing or
sales of the product or product candidate that is the subject of
the suit. Defense of these claims, regardless of their merit, would
cause us to incur substantial expenses and, would be a substantial
diversion of resources from our business. In the event of a
successful claim of any such infringement, violation or
misappropriation, we may need to obtain licenses from such third
parties and we and our partners may be prevented from pursuing
product development or commercialization and/or may be required to
pay damages. We cannot be certain that any licenses required under
such patents or proprietary rights would be made available to us,
or that any offer to license would be made available to us on
commercially reasonable terms. If we cannot obtain such licenses,
we and our collaborators may be restricted or prevented from
manufacturing and selling products employing our technology. These
adverse results, if they occur, could adversely affect our
business, results of operations and prospects, and the value of our
shares.
We may become involved in lawsuits to protect or enforce our
patents or other intellectual property, which could be expensive,
time consuming and unsuccessful.
The
defense and prosecution of contractual or intellectual property
lawsuits, USPTO interference or derivation proceedings, European
Patent Office oppositions and related legal and administrative
proceedings in the United States, Europe and other countries,
involve complex legal and factual questions. As a result, such
proceedings may be costly and time-consuming to pursue and their
outcome is uncertain.
Litigation may be
necessary to:
●
protect and enforce our patents and any future patents issuing on
our patent applications;
●
enforce or clarify the terms of the licenses we have granted or may
be granted in the future;
●
protect and enforce trade secrets, know-how and other proprietary
rights that we own or have licensed, or may license in the future;
or
●
determine the enforceability, scope and validity of the proprietary
rights of third parties and defend against alleged patent
infringement.
Competitors may
infringe our intellectual property. As a result, we may be required
to file infringement claims to stop third-party infringement or
unauthorized use. This can be expensive, particularly for a company
of our size, and time-consuming. In addition, in an infringement
proceeding, a court may decide that a patent of ours is not valid
or is unenforceable, or may refuse to stop the other party from
using the technology at issue on the grounds that our patent claims
do not cover its technology or that the factors necessary to grant
an injunction against an infringer are not satisfied. An adverse
determination of any litigation or other proceedings could put one
or more of our patents at risk of being invalidated, interpreted
narrowly, or amended such that they do not cover our product
candidates. Moreover, such adverse determinations could put our
patent applications at risk of not issuing, or issuing with limited
and potentially inadequate scope to cover our product candidates or
to prevent others from marketing similar products.
29
Interference,
derivation or other proceedings brought at the USPTO, may be
necessary to determine the priority or patentability of inventions
with respect to our patent applications or those of our licensors
or potential collaborators. Litigation or USPTO proceedings brought
by us may fail or may be invoked against us by third parties. Even
if we are successful, domestic or foreign litigation or USPTO or
foreign patent office proceedings may result in substantial costs
and distraction to our management. We may not be able, alone or
with our licensors or potential collaborators, to prevent
misappropriation of our proprietary rights, particularly in
countries where the laws may not protect such rights as fully as in
the United States.
Furthermore,
because of the substantial amount of discovery required in
connection with intellectual property litigation or other
proceedings, there is a risk that some of our confidential
information could be compromised by disclosure during this type of
litigation or other proceedings. In addition, during the course of
this kind of litigation or proceedings, there could be public
announcements of the results of hearings, motions or other interim
proceedings or developments or public access to related documents.
If investors perceive these results to be negative, the market
price for our common stock could be significantly
harmed.
Some of
our competitors may be able to sustain the costs of patent-related
disputes, including patent litigation, more effectively than we can
because they have substantially greater resources. In addition, any
uncertainties resulting from the initiation and continuation of any
litigation could have a material adverse effect on our ability to
raise the funds necessary to continue our operations.
We may not be able to enforce our intellectual property rights
throughout the world.
Filing,
prosecuting and defending patents on our product candidates in all
countries throughout the world would be prohibitively expensive.
The requirements for patentability may differ in certain countries,
particularly in developing countries. Moreover, our ability to
protect and enforce our intellectual property rights may be
adversely affected by unforeseen changes in foreign intellectual
property laws. Additionally, laws of some countries outside of the
United States do not afford intellectual property protection to the
same extent as the laws of the United States. Many companies have
encountered significant problems in protecting and defending
intellectual property rights in certain foreign jurisdictions. The
legal systems of some countries, particularly developing countries,
do not favor the enforcement of patents and other intellectual
property rights. This could make it difficult for us to stop the
infringement of our patents or the misappropriation of our other
intellectual property rights. For example, many foreign countries
have compulsory licensing laws under which a patent owner must
grant licenses to third parties. Consequently, we may not be able
to prevent third parties from practicing our inventions in all
countries outside the United States. Competitors may use our
technologies in jurisdictions where we have not obtained patent
protection to develop their own products and, further, may export
otherwise infringing products to territories where we have patent
protection, if our ability to enforce our patents to stop
infringing activities is inadequate. These products may compete
with our products, and our patents or other intellectual property
rights may not be effective or sufficient to prevent them from
competing.
Proceedings to
enforce our patent rights in foreign jurisdictions, whether or not
successful, could result in substantial costs and divert our
efforts and resources from other aspects of our business.
Furthermore, while we intend to protect our intellectual property
rights in major markets for our products, we cannot ensure that we
will be able to initiate or maintain similar efforts in all
jurisdictions in which we may wish to market our products.
Accordingly, our efforts to protect our intellectual property
rights in such countries may be inadequate.
ITEM 1B. UNRESOLVED STAFF COMMENTS
None.
ITEM 2. PROPERTIES
On
January 1, 2020, we entered a sublease with ICT Investments for
18,000 square feet of manufacturing space on a month-to-month basis
at $14,377 per month.
ITEM 3. LEGAL PROCEEDINGS
None.
ITEM 4. MINE SAFETY DISCLOSURES
None.
30
PART II
ITEM 5. MARKET FOR REGISTRANT'S COMMON EQUITY, RELATED STOCKHOLDER
MATTERS AND ISSUER PURCHASES OF EQUITY SECURITIES
(a)
Market
Information
. Our common stock
is not traded on any securities exchange nor quoted on any broker
network.
(b)
Stockholders
.
As of March 15, 2021, there were four record holders of our common
stock.
(c)
Dividends
.
We have not paid any dividends on our common stock and do not
intend to pay any dividends in the foreseeable
future.
(d)
Securities
Authorized for Issuance under Equity Compensation
Plans
.
The
following table provides information about the common stock that
may be issued upon the exercise of options, warrants and rights
under all of the Company’s existing equity compensation plans
as of December 31, 2020.
|
Plan
Category
|
Number of
securities to be issued upon exercise of outstanding options,
warrants and rights
|
Weighted average exercise price of outstanding
options, warrants and rights ($)
|
Number of
securities remaining available for future issuance under equity
compensation plans
|
|
Equity compensation
plans approved by security holders
1
|
10,000,000
|
None
|
10,000,000
|
(1)
In December 2019 our
Board of Directors and a majority of our shareholders approved a
2019 Stock Incentive Plan and authorized the issuance of up to
5,000,000 shares under this plan
.
Recent Sales of Unregistered Securities.
Set
forth below is information regarding shares of common stock issued,
and options granted, by from January 1, 2020 to December 31, 2020.
Also included is the consideration, if any, received by us, for
such shares and options and information relating to the Securities
Act, or rule of the SEC, under which exemption from registration
was claimed.
On
January 1, 2020, we purchased from ICT Investments certain capital
manufacturing equipment valued at $158,456 which we will use in our
business in exchange for 900,000 shares of our common
stock.
During
the year 2020, ICT Investments made additional investments into the
Company, consisting of inventories, certain capital manufacturing
equipment, office and computer equipment, intangible assets
consisting of 3D engineering design documentation, manufacturing
database, customer relationship database with populated CRM, valued
in total at $$4,520,018 which we will use in our business in
exchange for 26,609,186 shares of our common stock.
No
underwriters were involved in the foregoing issuances of
securities.
The
offer, sale and issuance of the securities described in the
paragraphs above were deemed to be exempt from registration under
the Securities Act in reliance on Rule 506 of Regulation D in
that the issuance of securities to the accredited investors did not
involve a public offering. Each of the recipients of the securities
in this transaction acquired the securities for investment only and
not with a view to or for sale in connection with any distribution
thereof and appropriate legends were affixed to the securities
issued in these transactions. Each of the recipients of these
securities in this transaction was an accredited investor under
Rule 501 of Regulation D.
31
ITEM 6. SELECTED FINANCIAL DATA
The
following selected consolidated financial data should be read in
conjunction with, and is qualified by reference to, our
consolidated financial statements and related notes and
Item 7, "Management's Discussion and Analysis of Financial
Condition and Results of Operations" included elsewhere in this
Annual Report on Form 10-K. The data as of December 31, 2020 and
2019, and for the years ended December 31, 2020 and 2019, is
derived from our audited financial statements and related notes
included elsewhere in this Annual Report on Form 10-K. Our
historical results are not necessarily indicative of the results
for any future period.
Statement of Income
|
|
Year Ended December 31,
|
||
|
|
2020
|
% of Income
|
2019
|
|
Gross
Sales
|
3,244,186
|
|
0
|
|
Net
Sales
|
2,154,777
|
100
%
|
0
|
|
Cost
of Goods Sold
|
949,782
|
44
%
|
0
|
|
Gross
Profit
|
1,204,995
|
56
%
|
0
|
|
Expense
|
|
|
|
|
Depreciation
Expense
|
26,409
|
1
%
|
0
|
|
G&A
Expense
|
227,420
|
11
%
|
5,280
|
|
Payroll
Expenses
|
767,879
|
36
%
|
10,356
|
|
Rent
Expense
|
172,646
|
8
%
|
0
|
|
Total
Expense
|
1,194,354
|
55
%
|
15,636
|
|
Net
Income
|
10,641
|
0
%
|
(15,636
)
|
|
|
|
|
|
|
Net
income (loss) per share
|
0
|
|
0
|
|
Weighted
average shares
|
26,609,186
|
|
2,661,316
|
|
|
|
|
|
|
EBITDA
|
129,732
|
|
(15,636
)
|
|
Adjusted
EBITDA (Non GAAP)
|
1,219,141
|
|
(15,636
)
|
Statement of Balance Sheet
|
|
Year Ended December 31,
|
|
|
|
2020
|
2019
|
|
ASSETS
|
|
|
|
Cash and Cash Equivalents
|
326,713
|
0
|
|
Accounts Receivable
|
756,095
|
0
|
|
Inventory
|
2,172,327
|
495,150
|
|
Fixed Assets
|
849,027
|
0
|
|
Intangible Assets
|
3,184,280
|
0
|
|
Operating lease right-of-use - Other
|
196,299
|
0
|
|
TOTAL ASSETS
|
7,484,742
|
495,150
|
|
|
|
|
|
LIABILITIES & EQUITY
|
|
|
|
Current Liabilities
|
1,028,749
|
5,280
|
|
Long Term Liabilities
|
1,169,373
|
0
|
|
Additional Paid in Capital
|
4,998,910
|
478,893
|
|
Common stock
|
292,705
|
26,613
|
|
Retained Earnings
|
-15,636
|
0
|
|
Net Income
|
10,641
|
-15,636
|
|
Laser Photonics Corp Equity
|
5,286,620
|
489,870
|
|
TOTAL LIABILITIES & EQUITY
|
7,484,742
|
495,150
|
Statement of Cash Flow
|
|
Year ended December 31,
|
|
|
|
2020
|
2019
|
|
Net
cash provided by Operating Activities
|
(1,328,899
)
|
(505,506
)
|
|
Net
cash provided by Investing Activities
|
(4,256,015
)
|
0
|
|
Net
cash provided by Financing Activities
|
5,911,628
|
505,506
|
|
Cash
at the beginning of period
|
0
|
0
|
|
Net
cash increase for period
|
326,714
|
0
|
|
Cash
at end of period
|
326,714
|
0
|
32
ITEM 7. MANAGEMENT'S DISCUSSION AND ANALYSIS OF FINANCIAL CONDITION
AND RESULTS OF OPERATIONS
General
The
following discussion and analysis of the results of operations and
financial condition of the Company for the years ended December 31,
2020 and 2019 should be read in conjunction with our audited
consolidated financial statements and related notes and the
description of our business and properties included elsewhere
herein.
Overview
Laser
Photonics is a vertically integrated manufacturing company for
photonics based industrial products and solutions, primarily
disruptive laser technologies, mainly premier Laser Blasting
equipment. Our vertically integrated operations allow us to reduce
development and advanced laser equipment manufacturing time, offer
better prices, control quality and protect our proprietary knowhow
and technology compared to other laser cleaning companies and
companies with competing technologies.
We
intend to continue to stay ahead of the technology curve by
researching and developing cutting edge products and technologies
for both large and small businesses. We view the small companies as
an attractive market opportunity since they were previously unable
to take advantage of laser processing equipment due to high prices,
significant operating costs and the technical complexities of the
laser equipment. As a result, we are developing a group of
standardized laser cleaning equipment that we have named the
CleanTech™ laser blaster family of equipment that we believe
represents a new generation of high power laser cleaning and rust
removal systems that will be affordable to more than a million
small and mid- size companies.
Our
vertically integrated operations allow us to reduce manufacturing
costs, control quality, rapidly develop and integrate advanced
products and protect our proprietary technology.
COVID-19
On
January 30, 2020, the World Health Organization
(“WHO”) announced a global health emergency because of
a new strain of coronavirus originating in Wuhan, China (the
“COVID-19 outbreak”) and the risks to the international
community as the virus spreads globally beyond its point of origin.
In March 2020, the WHO classified the COVID-19 outbreak as a
pandemic, based on the rapid increase in exposure
globally.
The
full impact of the COVID-19 outbreak continues to evolve as of the
date of this Form 10-K. As such, it is uncertain as to the full
magnitude that the pandemic will have on our financial condition,
liquidity, and future results of operations. Management is actively
monitoring the global situation on its financial condition,
liquidity, operations, suppliers, industry, and workforce. Given
the daily evolution of the COVID-19 outbreak and the global
responses to curb its spread, we are not able to estimate the
effects of the COVID-19 outbreak on our results of operations,
financial condition, or liquidity for fiscal year
2020.
Some of
our suppliers from China are likely to decrease production due to
factory closures or reduced operating hours in those facilities.
While these disruptions may be temporary, continued disruption in
the supply chain may lead to our delayed receipt of necessary raw
materials, component inventory, and negatively impact sales in
fiscal year 2020 and our overall liquidity.
We are
dependent on our workforce to deliver our products. Developments
such as social distancing and shelter-in-place directives will
impact our ability to deploy our workforce effectively. While
expected to be temporary, prolonged workforce disruptions may
negatively impact sales in fiscal year 2020 and our overall
liquidity.
The
adverse economic effects of the COVID-19 outbreak are expected not
to materially decrease demand for our products based on the
restrictions in place by governments trying to curb the outbreak
and changes in consumer behavior. However, this may lead to our not
achieving our sales goals in fiscal year 2020 and our overall
liquidity.
The
Covid 19 outbreak could have a continued material adverse impact on
economic and market conditions and trigger a period of global
economic slowdown, which is expected to depress our asset values,
including long-lived assets, intangible
assets, etc.
Although we cannot
estimate the length or gravity of the impact of the COVID-19
outbreak at this time, if the pandemic continues, it may have a
material adverse effect on our results of future operations,
financial position, and liquidity in fiscal year 2020.
Coronavirus Aid, Relief and Economic Security Act
On
March 27, 2020, the U.S. Government enacted the Coronavirus Aid,
Relief, and Economic Security Act (the “CARES Act”).
The CARES Act includes various income and payroll tax provisions.
The Company has analyzed the tax provisions of the CARES Act and
determined they could have a significant financial impact on our
financial statements. On April 27, 2020, the Company received a
loan from Axiom Bank, N.A., headquartered in Central Florida in the
aggregate amount of $198,750 pursuant to the Paycheck Protection
Program (the “PPP”) under the CARES Act. Under the
terms of the PPP, PPP loans and accrued interest are forgivable
after eight weeks as long as the borrower uses the loan proceeds
for eligible purposes, including payroll, benefits, rent and
utilities, and maintains its payroll levels. The amount of loan
forgiveness will be reduced if the borrower terminates employees or
reduces salaries during the eight-week period. The Company intends
to use the loan proceeds for purposes consistent with the PPP, and
anticipates that a majority of the loan amount will be forgiven,
but no assurance can be given that the Company will not take
actions that could cause the Company to be ineligible for
forgiveness of some portion of the loan. The unforgiven portion of
the loan is payable over two years at an interest rate of 1%, with
a deferral of payments for the first six months.
33
Description of Our Gross Sales, Costs and Expenses
Gross
sales.
We derive net sales
primarily from the growth was driven by increasing demand for
our products, partially offset by declines in average sales prices,
the introduction of new products, including laser blasting systems
and the development of new applications for our
products.
We
develop our products to standard specifications and use a common
set of components within our product architectures. Our major
products are based upon a common technology platform. We
continually enhance these and other products by improving their
components and developing new product designs. Sales of our
products are generally recognized upon shipment, provided that no
obligations remain and collection of the receivable is reasonably
assured.
Our sales typically are made on a purchase order
basis rather than through long-term purchase commitments.
We
entered into laser equipment sales agreements with customers for
specific equipment based on purchase orders and our standard terms
and conditions of sale. All revenues are reported net of any sales
discounts or taxes. Under our customer contracts or/and purchase
orders, we transfer title and risk of loss to the customer and
recognize revenue upon shipment. Our customers do not have extended
payment terms or rights of return under these
contracts.
Cost of Goods
Sold.
Our cost of
goods sold includes the cost of raw materials and components for
manufacturing laser systems and consists of different electronic
and optical components such as optical generators, scan heads,
connector assemblies and wires, edge seal and adhesives, junction
boxes, and other items, such as raw aluminum and aluminum
extrusions, steel for tilt brackets and frames,
subassemblies, miscellaneous materials, chemicals,
support and low cost common parts and components, like tie wraps,
insulating tape, shrink wraps, terminals, etc. We are vertically
integrated and currently manufacture all critical components for
our products as well as assemble finished products.
Our cost
of goods sold dose not includes direct labor for the manufacturing,
and manufacturing overhead such as engineering, equipment
maintenance, quality and production control, and procurement costs.
Cost of goods sold dose not includes depreciation of manufacturing
plant and equipment and facility-related expenses. In addition, we
accrue warranty costs to our cost of sales.
Overall, we expect
our cost of goods sold to continue to decrease over the next
several years due to an increase in worldwide capacity in fiber
laser parts and components, and availability of optical generators,
an increase in unit output per production line, and more efficient
absorption of fixed costs driven by economies of scale. This
expected decrease in cost for laser technology would be partially
offset during periods in which we underutilize manufacturing
capacity.
Sales and
marketing.
Our sales and
marketing expense consists primarily of costs related to
compensation, trade shows, professional and technical conferences,
travel, facilities, depreciation of equipment used for
demonstration purposes and other marketing
costs.
Selling, General and
administrative Expenses.
Our general and administrative expense
consists primarily of compensation and associated costs for
executive management, finance, legal, human resources, information
technology and other administrative personnel, outside legal and
professional fees, insurance premiums and fees, allocated
facilities costs and other corporate expenses such as charges and
benefits related to the change in allowance for doubtful
debt.
Our business has certain of its own dedicated
administrative key functions, such as accounting, legal, finance,
project finance, human resources, procurement, and marketing. Costs
for such functions are recorded and included within selling,
general and administrative costs.
Gross
margin.
Our total gross
margin in any period can be significantly affected by total net
sales in any period, by competitive factors, by product mix, and by
other factors such as changes in foreign exchange rates relative to
the U.S. Dollar, some of which are not under our control.
Gross margin is affected by numerous factors, including our module
average selling prices, foreign exchange rates, the existence and
effectiveness of subsidies and other economic incentives,
competitive pressures, market demand, market mix, our manufacturing
costs, product development costs, the effective utilization of our
production facilities, and the ramp of production on new
products.
Research and development
expenses.
Our research
and development expense consists primarily of compensation,
development expenses related to the design of our products and
certain components, the cost of materials and components to build
prototype devices for testing and facilities costs. Costs related
to product development are recorded as research and development
expenses in the period in which they are incurred.
We
acquire equipment for general use in further process developments
and record the depreciation of this equipment as research and
development expense.
We plan to continue to invest in research and
development to improve our existing products and develop new
systems and applications technology.
We maintain a number of
programs and activities to improve our technology and processes in
order to enhance the performance and reduce the costs of our laser
cleaning modules.
Interest Expense, Net.
Interest expense, net of amounts capitalized, is incurred on
various debt financings. We capitalize interest expense into our
property, plant and equipment, project assets, and deferred project
costs when such costs qualify for interest
capitalization.
34
Factors and Trends That Affect Our Operations and Financial
Results
In
reading our financial statements, you should be aware of the
following factors and trends that our management believes are
important in understanding our financial performance.
COVID-19
Update
. Economic indicators
show some improvement from the severe contraction experienced
earlier in 2020, which has led to an improvement in the recent
demand environment in the United States. Currently, our Orlando, FL
production facility in the United States remains open and is
operating normally. We have implemented employee safety and
sanitization protocols that have impacted productivity and
efficiency. Our vertically integrated operations allow us to reduce
development and advanced laser equipment manufacturing time, offer
better prices, control quality and protect our proprietary knowhow
and technology compared to other laser cleaning companies and
companies with competing technologies.
Net sales
. Net sales generated in 2020 showed an increase
quarter to quarter driven by the demand for our products in spite
of the COVID-19 pandemic that extended and deepened the weak
macroeconomic environment prevailing at the end of 2019. In
addition to these factors, sales were not affected by declines in
average sales prices by competitors due to our offering lower
prices, quality control and proprietary knowhow and technology
compared to other laser cleaning companies with competing
technologies.
Gross
margin
. Our total gross margin
in any period can be significantly affected by total net sales in
any period, by competitive factors such as product mix, and by
other factors, some of which are not under our control. For
instance, the gross margin for certain specialty products may be
higher because there are fewer or sometimes no equivalent competing
products. Further, we expect that some new technologies, products
and systems will have returns above our cost of capital but may
have gross margins below our corporate average.
Selling and general and
administrative expenses.
Selling, general and administrative expenses
consist primarily of salaries and other personnel-related costs,
professional fees, insurance costs, travel expenses and other
selling expenses. We expect selling expenses to increase in the
near term to support the planned growth of our business as we
expand our sales and marketing efforts.
Research and development
expenses
. Research and
development expenses consist primarily of salaries and
personnel-related costs, the cost of products, materials, and
outside services used in our process and product research and
development activities. We acquire equipment for general use in
further process developments and record the depreciation of this
equipment as research and development expense. We maintain a number
of programs and activities to improve our technology and processes
to enhance the performance and reduce the costs of our cleaning
laser modules. We intend to establish a separate accounting for
R&D expenses in the near future.
Goodwill and long-lived assets
impairments
. Long-lived assets
are reviewed for impairment whenever events or changes in
circumstances indicate that the carrying value may not be
recoverable. Impairment is measured by comparing the carrying value
of the long-lived assets to the estimated undiscounted future cash
flows expected to result from use of the assets and their ultimate
disposition. In instances where impairment is determined to exist,
the Company will writes down the asset to its fair value based on
the present value of estimated future cash
flows.
Major
customers
. While we would
expect to depend on current customers for a large percentage of our
annual net sales, the composition of this group can change from
year to year. Net sales derived from our current customers as a
percentage of our annual net sales were 34% in 2020. Our new
customers accounted for 66% of our net sales in 2020. We seek to
add new customers and to expand our relationships with existing
customers.
35
Critical Accounting Policies and Estimates
The
preparation of financial statements in conformity with accounting
principles generally accepted in the United States ("GAAP")
requires management to make estimates and assumptions that affect
the reported amounts of assets and liabilities and disclosure of
contingent assets and liabilities at the date of the financial
statements and the reported amounts of net sales and
expenses
Our
financial statements and accompanying notes have been prepared in
accordance with United States generally accepted accounting
principles applied on a consistent basis. The preparation of
financial statements in conformity with U.S. generally accepted
accounting principles requires management to make estimates and
assumptions that affect the reported amounts of assets and
liabilities, the disclosure of contingent assets and liabilities at
the date of the financial statements and the reported amounts of
revenues and expenses during the reporting periods.
We
regularly evaluate the accounting policies and estimates that we
use to prepare our financial statements. In general,
management’s estimates are based on historical experience,
and on various other assumptions that are believed to be reasonable
under the facts and circumstances. Actual results could differ from
those estimates made by management. These estimates are based on
management’s historical industry experience and not the
company’s historical experience.
Revenue Recognition-
Under Topic 606, an entity recognizes revenue when its customer
obtains control of promised goods or services, in an amount that
reflects the consideration which the entity expects to receive in
exchange for those goods or services. To determine revenue
recognition for arrangements that an entity determines are within
the scope of Topic 606, the entity performs the following five
steps: (i) identify the contract(s) with a customer; (ii) identify
the performance obligations in the contract; (iii) determine the
transaction price; (iv) allocate the transaction price to the
performance obligations in the contract; and (v) recognize revenue
when (or as) the entity satisfies a performance obligation. We only
apply the five-step model to contracts when it is probable that the
entity will collect the consideration it is entitled to in exchange
for the goods or services it transfers to the customer. At contract
inception, once the contract is determined to be within the scope
of Topic 606, we assess the goods or services promised within each
contract and determine those that are performance obligations, and
assess whether each promised good or service is distinct. We then
recognize as revenue the amount of the transaction price that is
allocated to the respective performance obligation when (or as) the
performance obligation is satisfied. Refunds and returns, which are
minimal, are recorded as a reduction of revenue. Payments received
by customers prior to our satisfying the above criteria are
recorded as unearned income in the combined balance sheets. All
revenues were reported net of any sales discounts or
taxes.
Inventory
—
Inventory is stated at the lower of cost (first-in, first-out
method) or market value. Inventory includes parts and components
that may be specialized in nature and subject to rapid
obsolescence. We maintain a reserve for excess or obsolete
inventory items. Inventories are written off and charged to cost of
goods sold when identified as excess or obsolete. If future sales
differ from these forecasts, the valuation of excess and obsolete
inventory may change and additional inventory provisions may be
required. Because of our vertical integration, a significant or
sudden decrease in sales could result in a significant change in
the estimates of excess or obsolete inventory valuation. On
December 31, 2020, we recorded $63,323 in Inventory
Obsolescence.
Warranty
—
We maintain an accrual for warranty claims for units sold that are
subject to warranty.
Income Taxes and Deferred
Taxes
— Our annual
tax rate is based on our income, statutory tax rates and tax
planning opportunities available to us in the various jurisdictions
in which we operate.
Goodwill and Long-lived assets
impairments
. We review our
intangible assets and property, plant and equipment for impairment
when events or changes in circumstances indicate the carrying value
may not be recoverable. Goodwill is required to be tested for
impairment at least annually. We perform our annual goodwill
impairment review as of the first day of our fourth quarter, or
more frequently if events or circumstances indicate it is more
likely than not that the fair value of a reporting unit is less
than its carrying amount.
36
Results of Operations
The following table sets forth selected statement
of operations data for the periods indicated in dollar amounts and
expressed as a percentage of net sales:
We
reported a gross sales of $3,244,186 and generated revenues of
$
2,154,777
for the year ended
December 31, 2020. For the year ended December 31, 2020, we
reported cost of goods sold of $
949,782
, general and administrative
expenses of $
227,420
,
depreciation expense of $26,409, payroll expenses of $767,879 and
rent of $172,646. As a result, we reported a net income before
provision for income tax of $10,641.
|
|
Year Ended December 31,
|
||
|
|
2020
|
% of Income
|
2019
|
|
Gross
Sales
|
3,244,186
|
|
0
|
|
Net
Sales
|
2,154,777
|
100
%
|
0
|
|
Cost
of Goods Sold
|
949,782
|
44
%
|
0
|
|
Gross
Profit
|
1,204,995
|
56
%
|
0
|
|
Expense
|
|
|
|
|
Depreciation
Expense
|
26,409
|
1
%
|
0
|
|
G&A
Expense
|
227,420
|
11
%
|
5,280
|
|
Payroll
Expenses
|
767,879
|
36
%
|
10,356
|
|
Rent
Expense
|
172,646
|
8
%
|
0
|
|
Total
Expense
|
1,194,354
|
55
%
|
15,636
|
|
Net
Income
|
10,641
|
0
%
|
(15,636
)
|
|
|
|
|
|
|
Net
income (loss) per share
|
0
|
|
0
|
|
Weighted
average shares
|
26,609,186
|
|
2,661,316
|
|
|
|
|
|
|
EBITDA
|
129,732
|
|
(15,636
)
|
|
Adjusted
EBITDA (Non GAAP)
|
1,219,141
|
|
(15,636
)
|
37
Liquidity and Capital Resources
For the
year ended December 31, 2020, our liquidity needs were met through
the financing activity and ongoing support of the ICT
Investments.
The
following is a summary of the Company’s cash flows provided
by (used in) operating, investing and financing
activities:
|
|
Year ended December 31,
|
|
|
|
2020
|
2019
|
|
Net
cash provided by Operating Activities
|
(1,328,899
)
|
(505,506
)
|
|
Net
cash provided by Investing Activities
|
(4,256,015
)
|
0
|
|
Net
cash provided by Financing Activities
|
5,911,628
|
505,506
|
As of
December 31, 2020, we had $
3,255,136
in current assets, comprised of $
326,713
in cash, $756,095 in accounts receivable and $2,172,327 in
inventory, compared to $495,150 in current assets, all of which was
inventory, at December 31, 2019. Current liabilities at December
31, 2020, totaled $1,028,749 compared to $5,280 at December 31,
2019. As a result, on December 31 2020, we had $2,226,387 in total
working capital:
|
|
Year Ended December 31,
|
|
|
|
2020
|
2019
|
|
Cash
And Cash Equivalents
|
326,713
|
0
|
|
Working
Capital
(excluding cash and
cash equivalents)
|
1,899,674
|
489,870
|
|
Total
Working Capital
|
2,226,387
|
489,870
|
If we
require financing for growth and cannot raise funds through a
private placement of our equity or debt securities, or secure a
loan, we would be required to operate at a moderate level to
sustain operation. Unless we are able to increase our sales, we
must raise cash to implement our strategy to grow and expand in
accordance with our business plan.
We anticipate
our short-term liquidity needs to be approximately $1,300,000 which
will be used to increase our sales staff and manufacturing
capacity. Since we expect gross profits of approximately $2,500,000
we would need to raise $600,000 to cover the negative cash flow. To
meet these financial needs we intend to seek debt or equity
financing. Once this is completed, and we implement our sales and
marketing plan to sell our laser cleaning products, we anticipate
minimal long-term liquidity needs which we expect to meet through
short-term borrowings or equity financing.
Additionally, we
will have to meet all the financial disclosure and reporting
requirements associated with being a publicly reporting company.
Our management will have to spend additional time on policies and
procedures to make sure it is compliant with various regulatory
requirements, especially that of Section 404 of the Sarbanes-Oxley
Act of 2002. This additional corporate governance time required of
management could limit the amount of time our management has to
implement our business plan and may delay our anticipated growth
plans. We anticipate over the next 12 months the cost of being a
reporting public company will be approximately
$250,000.
The following table
details our line-of-credit facilities and long-term notes as of
December 31, 2020:
|
Description
|
|
Total Facility/ Note
|
|
Interest Rate
|
|
Maturity
|
|
Security
|
|
Long-term Unsecured Note
(1)
|
|
$440.0 Thousands
|
|
Fixed at 6.0%
|
|
January 2023
|
|
Unsecured
|
|
Long-term Unsecured Note
(2)
|
|
$745.4 Thousands
|
|
Fixed at 6.0%
|
|
December 2023
|
|
Unsecured
|
(1)
At maturity, the
outstanding note balance will be $0.0.
(2)
At maturity, the
outstanding note balance will be $0.0.
In
January 2020, the Company issued a promissory note to ICT in the
principal amount of $439,990 bearing 6% annual interest with a
maturity date of January 31, 2023. This Note may be prepaid in
whole or in part. As of December 31st, 2020, the unpaid principal
amount of the Note was $181,330.
In October
2020, the Company issued a second promissory note to ICT in the
principal amount of $745,438 bearing 6% annual interest with a
maturity date of December 31, 2023. This Note may be prepaid in
whole or in part. As of December 31, 2020, the unpaid principal
amount of the Note was $689,926.
38
Lease Liability
We are
leasing our manufacturing facility from the landlord with monthly
payments and recording those expenses as rent expense. On January
1, 2020, we entered into a lease agreement for 18,000 sf of
manufacturing space on a month-to-month basis at a cost of $14,377
per month. Our facility is currently equipped with three of our
latest advanced laser cleaning demonstration models. It has a
materials stock room, ramp and high dock in the warehouse with
loading and moving equipment. It also has a machine shop,
electronic assembly and equipment assembly area.
As of
December 31, 2020, the amount of the recorded lease liability less
the current portion was $225,055.
We
adopted ASU 2016-02 effective as of January 1, 2020, utilizing the
cumulative-effect adjustment transition method of adoption, which
resulted in the recognition on our balance sheet as of December 31,
2020, of $196,299 of right-of-use assets for operating
leases and $225,055 of operating lease
liability.
The
original maturity date of our facility operating lease is November
1, 2021. However, due to the impact of COVID 19, we reached an
agreement with the landlord to defer two monthly payments to the
end of the lease. Those lease liabilities were booked as deferred
lease payments under long term liabilities.
The
maturity amounts of our lease liabilities are as
follows:
|
Year Ending December 31,
|
Operating leases
|
|
2021
|
$
181,200
|
|
2022
|
$
15,100
|
|
Deferred
rent
|
$
28,755
|
|
Total lease
payments
|
$
225,055
|
|
Less imputed
interest
|
$
0
|
|
Total
|
$
225,055
|
|
As
of December 31, 2020
|
|
|
Operating
leases:
|
|
|
Operating
lease right-of-use asset
|
$
196,300
|
|
Current
operating lease liability
|
$
181,200
|
|
Operating
lease liability - less current portion
|
$
43,855
|
|
Total
operating lease liability
|
$
225,055
|
Net Earnings/Loss per Share
Basic
earnings/loss per share is calculated by dividing the loss
attributable to stockholders by the weighted-average number of
shares outstanding for the period. Diluted loss per share reflects
the potential dilution that could occur if securities or other
contracts to issue common stock were exercised or converted into
common stock or resulted in the issuance of common stock that
shared in the earnings (loss) of the Company. Diluted earnings/
loss per share is computed by dividing the earnings/loss available
to stockholders by the weighted average number of shares
outstanding for the period and dilutive potential shares
outstanding unless such dilutive potential shares would result in
anti-dilution.
As of
December 31, 2020, Company recorded $0.01 net income per
share.
|
|
Year Ended
December 31,
|
|
|
|
2020
|
2019
|
|
Net
Income/loss
|
10.641
|
0
|
|
Net
income (loss) per Share
|
(0.01
)
|
0
|
|
Weighted
average shares
|
26,609,186
|
0
|
39
Off-Balance Sheet Arrangements
As of
December 31, 2020, we have not entered into any off-balance sheet
arrangements that have or are reasonably likely to have a current
or future effect on our financial condition, changes in financial
condition, revenues or expenses, results of operations, liquidity,
capital expenditures or capital resources and would be considered
material to investors.
Recent Accounting Pronouncements
See
Note 1, "Nature of Business and Summary of Significant Accounting
Policies" in the notes to the consolidated financial statements for
a full description of recent accounting pronouncements, including
the respective dates of adoption or expected adoption and effects
on our consolidated financial statements contained in Part IV of
this Annual Report.
Item 7A. QUANTITATIVE AND QUALITATIVE DISCLOSURES ABOUT MARKET
RISK
We have
not utilized any derivative financial instruments such as futures
contracts, options and swaps, forward foreign exchange contracts or
interest rate swaps and futures. We believe that adequate controls
are in place to monitor any hedging activities. We do not have any
borrowings and, consequently, we are not affected by changes in
market interest rates. We do not currently have any sales or own
assets and operate facilities in countries outside the United
States and, consequently, we are not affected by foreign currency
fluctuations or exchange rate changes. Overall, we believe that our
exposure to interest rate risk and foreign currency exchange rate
changes is not material to our financial condition or results of
operations.
40
ITEM 8. FINANCIAL STATEMENTS AND SUPPLEMENTARY DATA
INDEX
TO FINANCIAL STATEMENTS
|
Report
of BF Borgers CPA PC, Independent Registered Public Accounting
Firm
|
42
|
|
|
|
|
Balance
Sheets
|
48
|
|
Statements of
Income
|
49
|
|
Statements of
Comprehensive Income
|
50
|
|
Statements of
Stockholders’ Equity
|
51
|
|
Statements of
Cash Flows
|
52
|
41
REPORT OF INDEPENDENT REGISTERED PUBLIC ACCOUNTING
FIRM
To the
shareholders and the board of directors of Laser Photonics
Corporation
Opinion on the Financial Statements
We have
audited the accompanying balance sheet of Laser Photonics
Corporation (the “Company”) as of December 31, 2020,
the related statement of operations, stockholders’ equity
(deficit), and cash flows for the period November 8, 2019
(Inception) through December 31, 2019 and the related notes
(collectively referred to as the “financial
statements”). In our opinion, the financial statements
present fairly, in all material respects, the financial position of
the Company as of December 31, 2019, and the results of its
operations and its cash flows for the period November 8, 2019
(Inception) through December 31, 2019, in conformity with
accounting principles generally accepted in the United
States.
Basis for Opinion
These
financial statements are the responsibility of the Company’s
management. Our responsibility is to express an opinion on the
Company’s financial statements based on our audit. We are a
public accounting firm registered with the Public Company
Accounting Oversight Board (United States) (“PCAOB”)
and are required to be independent with respect to the Company in
accordance with the U.S. federal securities laws and the applicable
rules and regulations of the Securities and Exchange Commission and
the PCAOB.
We
conducted our audit in accordance with the standards of the PCAOB.
Those standards require that we plan and perform the audit to
obtain reasonable assurance about whether the financial statements
are free of material misstatement, whether due to error or fraud.
The Company is not required to have, nor were we engaged to
perform, an audit of its internal control over financial reporting.
As part of our audits we are required to obtain an understanding of
internal control over financial reporting but not for the purpose
of expressing an opinion on the effectiveness of the
Company’s internal control over financial reporting.
Accordingly, we express no such opinion.
Our
audit included performing procedures to assess the risks of
material misstatement of the financial statements, whether due to
error or fraud, and performing procedures that respond to those
risks. Such procedures included examining, on a test basis,
evidence regarding the amounts and disclosures in the financial
statements. Our audit also included evaluating the accounting
principles used and significant estimates made by management, as
well as evaluating the overall presentation of the financial
statements. We believe that our audit provides a reasonable basis
for our opinion.
/s/ BF
Borgers CPA PC
BF Borgers CPA PC
Lakewood,
CO
March
26, 2021
We have
served as the Company’s auditor since 2019
42
BALANCE SHEET
LASER PHOTONICS CORPORATION
BALANCE SHEET
DECEMBER 31, 2020 and DECEMBER 31, 2019
|
|
Year Ended December 31,
|
|
|
|
2020
|
2019
|
|
ASSETS
|
|
|
|
Current Assets
|
|
|
|
Cash and Cash Equivalents
|
326,713
|
0
|
|
Accounts Receivable
|
756,095
|
0
|
|
Inventory
|
2,172,327
|
495,150
|
|
Total Current Assets
|
3,255,136
|
495,150
|
|
Fixed Assets
|
849,027
|
0
|
|
Intangible Assets
|
3,184,280
|
0
|
|
Operating lease right-of-use
|
196,299
|
0
|
|
TOTAL ASSETS
|
7,484,742
|
495,150
|
|
LIABILITIES & EQUITY
|
|
|
|
Accounts Payable
|
55,756
|
5,280
|
|
Deferred Revenue
|
779,128
|
0
|
|
Lease liability Current Portion
|
181,199
|
0
|
|
Sales Tax Payable
|
12,665
|
0
|
|
Total Current Liabilities
|
1,028,749
|
5,280
|
|
ICT Investments Notes
|
926,768
|
0
|
|
Lease liability - less current
|
43,855
|
0
|
|
PPP Loan
|
198,750
|
0
|
|
Total Long Term Liabilities
|
1,169,373
|
0
|
|
Total Liabilities
|
2,198,122
|
5,280
|
|
Additional Paid in Capital
|
4,998,910
|
478,893
|
|
Common stock
|
292,705
|
26,613
|
|
Capital Stock
|
5,291,615
|
505,506
|
|
Retained Earnings
|
-15,636
|
0
|
|
Net Income
|
10,641
|
-15,636
|
|
Total Equity
|
5,286,620
|
489,870
|
|
TOTAL LIABILITIES & EQUITY
|
7,484,742
|
495,150
|
See
accompanying notes to financial statement
43
STATEMENTS OF PROFIT AND LOSS
|
|
Year Ended December 31,
|
||
|
|
2020
|
% of Income
|
2019
|
|
Gross
Sales
|
3,244,186
|
|
0
|
|
Net
Sales
|
2,154,777
|
100
%
|
0
|
|
Cost
of Goods Sold
|
949,782
|
44
%
|
0
|
|
Gross
Profit
|
1,204,995
|
56
%
|
0
|
|
Expense
|
|
|
|
|
Depreciation
Expense
|
26,409
|
1
%
|
0
|
|
G&A
Expense
|
227,420
|
11
%
|
5,280
|
|
Payroll
Expenses
|
767,879
|
36
%
|
10,356
|
|
Rent
Expense
|
172,646
|
8
%
|
0
|
|
Total
Expense
|
1,194,354
|
55
%
|
15,636
|
|
Net
Income
|
10,641
|
0
%
|
(15,636
)
|
|
|
|
|
|
|
Net
income (loss) per share
|
0
|
|
0
|
|
Weighted
average shares
|
26,609,186
|
|
2,661,316
|
|
|
|
|
|
|
EBITDA
|
129,732
|
|
(15,636
)
|
|
Adjusted
EBITDA (Non GAAP)
|
1,219,141
|
|
(15,636
)
|
See
accompanying notes to financial statements
44
STATEMENTS OF CASH
FLOWS
LASER PHOTONICS CORPORATION
STATEMENTS OF CASH FLOWS
DECEMBER 31, 2020 AND DECEMBER 31, 2019
|
|
Year ended December 31,
|
|
|
|
2020
|
2019
|
|
Cash
Flows From:
|
|
|
|
OPERATING
ACTIVITIES
|
|
|
|
Net
Income (loss)
|
10,641
|
(15,636
)
|
|
Adjustments
to reconcile Net Income to net cash provided by
operations:
|
|
|
|
Change
in operating assets and liabilities:
|
|
|
|
Accounts
Receivable
|
(756,095
)
|
0
|
|
Equipment
Parts Inventory
|
(690,069
)
|
(495,150
)
|
|
Finished
Goods Inventory
|
(181,453
)
|
0
|
|
Work
in process Inventory
|
(19,241
)
|
0
|
|
Sales
Demo Inventory
|
(786,414
)
|
0
|
|
Depreciation
and amortization
|
26,409
|
0
|
|
Accounts
Payable
|
50,476
|
5,280
|
|
Unearned
product Revenues
|
779,128
|
0
|
|
Lease
Liability
|
225,054
|
0
|
|
Sales
tax payable
|
12,665
|
0
|
|
Net
cash provided by Operating Activities
|
(1,328,899
)
|
(505,506
)
|
|
INVESTING
ACTIVITIES
|
|
|
|
Purchase
of Machinery & Equipment
|
(794,945
)
|
0
|
|
Purchase
of Vehicles
|
(9,989
)
|
0
|
|
Purchase
of Office & Computer Equipment
|
(39,449
)
|
0
|
|
Purchase
of R&D Equipment
|
(31,053
)
|
0
|
|
Purchase
of Intengible assets
|
(3,184,280
)
|
0
|
|
Operating
lease right-of-use
|
(196,299
)
|
0
|
|
Net
cash provided by Investing Activities
|
(4,256,015
)
|
0
|
|
FINANCING
ACTIVITIES
|
|
|
|
Proceeds
from Notes
|
926,768
|
0
|
|
PP
Loan
|
198,750
|
0
|
|
Additional
Paid in Capital
|
4,520,018
|
478,893
|
|
Common
Stock
|
266,092
|
26,613
|
|
Net
cash provided by Financing Activities
|
5,911,628
|
505,506
|
|
Cash
at the beginning of period
|
0
|
0
|
|
Net
cash increase for period
|
326,714
|
0
|
|
Cash
at end of period
|
326,714
|
0
|
See
accompanying notes to financial statements
45
STATEMENTS OF LIABILITY AND STOCKHOLDERS’ EQUTY
LASER PHOTONICS CORPORATION
STATEMENTS OF LIABILITY AND STOCKHOLDERS’ EQUTY
FOR THE YEARS ENDED DECEMBER 31, 2019 AND DECEMBER 31,
2020
|
|
Common Stock
|
Additional
|
Accumulated
|
Stockholders'
|
|
|
|
Shares
|
Amount
|
Paid-In Capital
|
(Deficit/Income)
|
Equity
|
|
BALANCE
JANUARY 1ST 2020
|
-
|
-
|
$
-
|
$
-
|
$
489,870
|
|
Shares
issued for cash
|
$
2,661,316
|
$
26,613
|
$
478,893
|
|
|
|
Net loss
for year ended December 31, 2019
|
|
|
|
$
(15,636
)
|
|
|
January
1 - December 31st, 2020
|
-
|
-
|
$
-
|
$
-
|
|
|
Shares
issued for cash
|
$
26,609,186
|
$
266,092
|
$
4,520,018
|
|
|
|
Income
for period ended December 31st, 2020
|
|
|
|
$
10,641
|
|
|
BALANCE
DECEMBER 31st, 2020
|
$
29,270,502
|
$
292,705
|
$
4,998,911
|
$
(4,995
)
|
$
5,286,620
|
See
accompanying notes to financial statements
46
NOTES TO FINANCIAL STATEMENTS
DECEMBER 31, 2020
NOTE
1 – ORGANIZATION AND DESCRIPTION OF
BUSINESS
Laser
Photonics Corporation (the “Company”) was formed under
the laws of Wyoming on November 8, 2019 and changed its domicile to
Delaware on March 5, 2020. The Company is a vertically integrated
manufacturing company for photonics based industrial products and
solutions, primarily disruptive laser cleaning technologies. Its
vertically integrated operations allow us to reduce development and
advanced laser equipment manufacturing time, offer better prices,
control quality and protect our proprietary knowhow and technology
compared to other laser cleaning companies and companies with
competing technologies.
The
Company’s accounting year end is December 31.
Basis of Presentation
These
financial statements are presented in United States dollars and
have been prepared in accordance with United States generally
accepted accounting principles.
Impact of the Novel Coronavirus
On
January 30, 2020, the World Health Organization (“WHO”)
announced a global health emergency because of a new strain of
coronavirus originating in Wuhan, China (the “COVID-19
outbreak”) and the risks to the international community as
the virus spreads globally beyond its point of origin. In March
2020, the WHO classified the COVID-19 outbreak as a pandemic, based
on the rapid increase in exposure globally.
The
full impact of the COVID-19 outbreak continues to evolve as of the
date of this registration statement. As such, it is uncertain as to
the full magnitude that the pandemic will have on the
Company’s financial condition, liquidity, and future results
of operations.
Management
is actively monitoring the global situation on its financial
condition, liquidity, operations, scientific collaborations,
suppliers, industry, and workforce. Given the daily evolution of
the COVID-19 outbreak and the global responses to curb its spread,
the Company is not able to estimate the effects of the COVID-19
outbreak on its results of operations, financial condition, or
liquidity for fiscal year 2020.
Some of
our suppliers from China are likely to decrease production due to
factory closures or reduced operating hours in those facilities.
While these disruptions may be temporary, continued disruption in
the supply chain may lead to our delayed receipt of necessary raw
materials, component inventory, and negatively impact sales in
fiscal year 2020 and our overall liquidity.
.
We are
dependent on our workforce to deliver our products. Developments
such as social distancing and shelter-in-place directives will
impact our ability to deploy our workforce effectively. While
expected to be temporary, prolonged workforce disruptions may
negatively impact sales in fiscal year 2020 and our overall
liquidity.
The
adverse economic effects of the COVID-19 outbreak are expected not
to materially decrease demand for our products based on the
restrictions in place by governments trying to curb the outbreak
and changes in consumer behavior. However, in spite of those
negative effects we were able to achieve our sales goals in fiscal
year 2020 and our overall liquidity.
The
Covid 19 outbreak could have a continued material adverse impact on
economic and market conditions and trigger a period of global
economic slowdown, which is expected to depress our asset values,
including long-lived assets, intangible assets, etc.
Although
we cannot estimate the length or gravity of the impact of the
COVID-19 outbreak at this time, if the pandemic continues, it may
have a material adverse effect on our results of future operations,
financial position, and liquidity in fiscal year 2021.
47
NOTE
2 – SUMMARY OF SIGNIFICANT ACCOUNTING
POLICIES
Use of Estimates
The
preparation of financial statements in conformity with accounting
principles generally accepted in the United States of America
requires management to make estimates and assumptions that affect
the reported amounts of assets and liabilities and disclosure of
contingent liabilities at dates of the financial statements and the
reported amounts of revenue and expenses during the periods. Actual
results could differ from these estimates. Our significant
estimates and assumptions include depreciation and the fair value
of our stock, stock-based compensation, debt discount and the
valuation allowance relating to the Company’s deferred tax
assets.
Cash and Cash Equivalents
Cash
and cash equivalents consist of highly liquid investments with an
original maturity of three months or less at the date of
purchase. Cash and cash equivalents are carried at cost,
which approximates fair value.
As of
December 31, 2020, the Company had $326,714 of cash.
Accounts Receivable
Trade
accounts receivable are recorded net of allowance for expected
uncollectible accounts. The Company extends credit to its customers
in the normal course of business and performs on-going credit
evaluations of its customers. All accounts, or portions thereof,
that are deemed uncollectible are written off to bad debt expense,
as incurred. In addition, most sales orders are not accepted
without a substantial deposit. As of December 31, 2020, the
Company’s ledger had $756,095 as an allowance/ provision for
collectible accounts.
Inventory
Inventories
are stated at the lower of cost or net realizable value using the
first-in first-out (FIFO) method. The Company has four principal
categories of inventory:
Sales demonstration inventory
-Sales demonstration
inventory represents completed product used to support the
Company’s sales force for demonstrations and held for sale.
Sales demonstration inventory is held in the Company’s demo
facilities or by its sales representatives for up to three
years, at which time it would be refurbished and transferred to
finished goods as used equipment, stated at the lower of cost or
net realizable value. The Company expects these refurbished units
to remain in finished goods inventory and sold
within 12 months at prices that produce reduced gross
margins.
Equipment parts inventory
- This inventory represents
components and raw materials that are currently in the process of
being converted to a certifiable lot of saleable product through
the manufacturing and/or equipment assembly process. Inventories
include parts and components that may be specialized in nature and
subject to rapid obsolescence. The Company periodically reviews the
quantities and carrying values of inventories to assess whether the
inventories are recoverable. Because of the Company’s
vertical integration, a significant or sudden decrease in sales
activity could result in a significant change in the estimates of
excess or obsolete inventory valuation. The costs associated with
provisions for excess quantities, technological obsolescence, or
component rejections are charged to cost of sales as
incurred.
Work in process inventory
-
Work in process inventory
consists of inventory that is partially manufactured or not fully
assembled as of the date of these financial
statements. This equipment, machines, parts, frames,
lasers and assemblies are items not ready for use or
resale. Costs are accumulated as work in process until
sales ready items are compete when it is moved to finished goods
inventory. Amounts in this account represent items at
various stages of completion at the Registration date.
Finished goods inventory
- Finished goods
inventory consists of purchased inventory that were fully
manufactured, assembled or in salable condition. Finished
goods inventory is comprised of items that are complete and
ready for commercial application without further cost other that
delivery and setup. Finished goods inventory includes demo and
other equipment, lasers, software, machines, parts or
assemblies.
At
December 31, 2020, and December 31, 2019, respectively, the
Company’s inventory consisted of the following:
|
|
Dec 31, 20
|
Dec 31, 19
|
|
Inventory
|
|
|
|
Equipment Parts Inventory
|
690,069
|
0
|
|
Finished Goods Inventory
|
186,463
|
|
|
Sales Demo Inventory
|
1,281,564
|
495,150
|
|
Work in process Inventory
|
19,241
|
0
|
|
Total Inventory
|
2,172,327
|
495,150
|
Inventory
is stated at the lower of cost (first-in, first-out method) or
market value. Inventory includes parts and components that may be
specialized in nature and subject to rapid obsolescence. Company
maintain a reserve for excess or obsolete inventory items.
Inventories are written off and charged to cost of goods sold when
identified as excess or obsolete. If future sales differ from these
forecasts, the valuation of excess and obsolete inventory may
change and additional inventory provisions may be required. Because
of our vertical integration, a significant or sudden decrease in
sales could result in a significant change in the estimates of
excess or obsolete inventory valuation.
On
December 31, 2020, the Company recorded $63,323 in inventory
obsolescence. No inventory was obsolete on December 31,
2019.
48
F
ixed Assets
- Plant Machinery and Equipment
Property
and equipment are recorded at cost. Expenditures for major
additions and improvements are capitalized and minor replacements,
maintenance, and repairs are charged to expense as incurred. When
property and equipment are retired or otherwise disposed of, the
cost and accumulated depreciation are removed from the accounts and
any resulting gain or loss is included in the results of operations
for the respective period.
Machinery and Equipment
Depreciation
is provided over the estimated useful lives of the related assets
using the straight-line method for financial statement purposes.
The Company will use other depreciation methods (generally
accelerated) for tax purposes where appropriate. The estimated
useful lives for significant property and equipment categories are
as follows:
|
Category
|
Economic
Useful Life
|
|
|
Office
furniture and fixtures
|
3-5 years
|
|
|
Machinery
and equipment
|
5-7 years
|
|
|
Intangible
Assets
|
7-12
years
|
|
|
|
Dec 31, 20
|
Dec 31, 19
|
|
Fixed
Assets
|
|
|
|
Equipment
and Furniture
|
|
|
|
Accumulated
Depreciation
|
(26,409
)
|
0
|
|
Machinery
& Equipment
|
804,934
|
0
|
|
R&D
Equipment
|
31,053
|
|
|
Office
Furniture and Computer Equipment
|
39,449
|
0
|
|
Total
Fixed Assets
|
849,027
|
0
|
As of
December 31, 2020, the Company recorded $849,027of capital assets
net of depreciation. Accordingly, depreciation as of December 31,
2020 was recorded at $26,409.
Intangible Assets
Intangible
assets consist primarily of capitalized equipment design
documentation, software costs for equipment manufactured for sale,
research and development, as well as certain patent, trademark and
license costs. Capitalized software and equipment design
documentation development costs are recorded in accordance with
Statement of Financial Accounting Standards (“SFAS”)
No. 86, “Accounting for the Costs of Computer Software to Be
Sold, Leased, or Otherwise Marketed,” with costs amortized
using the straight-line method over a ten-year period. Patent,
trademark and license costs are amortized using the straight-line
method over their estimated useful lives of 12 years. On an ongoing
basis, management reviews the valuation of intangible assets to
determine if there has been impairment by comparing the related
assets’ carrying value to the undiscounted estimated future
cash flows and/or operating income from related
operations.
The
Company’s intangible assets are deemed to have indefinite
lives and, accordingly, are not amortized, but are evaluated for
impairment at least annually, but more often whenever changes in
facts and circumstances occur which may indicate that the carrying
value may not be recoverable. The customer list was deemed to have
a life of five years and will be amortized through
December 2025.
The Company employs various core technologies
across many different product families and applications in an
effort to maximize the impact of our research and development costs
and increase economies of scale and to leverage its
technology-specific expertise across multiple product platforms.
The technologies inherent in its laser equipment products include
application documentation, proprietary and custom software
developed for operation of its equipment, specific knowledge of
supply chain and, mostly important, equipment design documentation,
consisting of 3D engineering drawings, bills of materials, wiring
diagrams, parts AutoCad drawings, software architecture
documentation, etc.
Intangible assets were received from a
related party, ICT Investments, and therefore transferred and
booked by Laser Photonics Corp. at their historical
cost.
Historically, ICT
Investments acquired IP through various acquisitions and business
combinations as a part of its ordinary line of business, mainly
concentrated within the photonics industries. A variety of IP was
accumulated within the 2000 to 2020 time frame and compiled from IP
of various portfolio companies, acquired for cash in various public
auctions, and contributed in a normal cause of business in
different entities and start-ups. Historical IP costs are typically
reflected mostly in reviewed financial statements and from purchase
receipts, which form the historical base of Intellectual Property
invested or contributed, or sold to a to a selected
company.
49
In
addition, on December 3, 2021 intangible assets were tested for
fair market value and an impairment analysis of intangible assets
was conducted, which can be found in the attachments to this Annual
Report on Form 10-K. To perform a fair market evaluation of its
portfolio assets the Company is using the practical studies and
recommendations published by the leading financial auditing
institutions such as Ernst & Young and Deloitte, in particular
the “25% Rule” method income approach:
|
Intangible
Assets
|
December
2020
|
December
2019
|
|
Customer
Relationships
|
211,000
|
0.00
|
|
Equipment
Design Documentation
|
2,675,000.00
|
0.00
|
|
Operational
Software & Website
|
298,280
|
0.00
|
|
Total
Intangible Assets
|
3,184,280
|
0.00
|
As of
December 31, 2020, the Company had $3,184,279 of intangible
property.
ICT Asset Purchase
During
the year 2020, the Company purchased from ICT Investments
additional assets, consisting of inventories, certain capital
manufacturing equipment, office and computer equipment, intangible
assets consisting of 3D engineering design documentation,
manufacturing database, customer relationship database with
populated CRM, valued in total at $$4,787,109 which the Company
will use in its business, in exchange for 29,270,502
shares of its common
stock.
The Company intends to focus on the business of design and
manufacture of various industrial grade laser material processing
equipment, first being laser blasting and cleaning equipment and
later introducing another laser- based material processing
applications, systems and technologies.
ICT
asset sales for Laser Photonics Corp stock
|
Sales
Demo Inventory
|
$
786,413
|
|
Equipment
and Furniture: Machinery & Equipment :
|
$
819,136
|
|
Intangible
Assets: Customer relationship Database
|
$
211,000
|
|
Intangible
Assets: Equipment Design Documentation
|
$
2,675,000
|
|
Intangible
Assets: Operational Software & Website
|
$
294,560
|
|
Total
non-cash asset purchase
|
$
4,786,109
|
|
|
|
|
Stock
issued for purchase of assets from ICT Investments (at
par)
|
$
266,092
|
|
Additional
paid in capital
|
$
4,520,018
|
|
Total
non-cash consideration
|
$
4,786,109
|
Historically, ICT
Investments acquired capital and intangible assets through various
acquisitions and business combinations as a part of its ordinary
line of business, mainly concentrated within the photonics
industries. Most of ICT assets were accumulated within the 2000 to
2020 time frame and compiled from the assets of various portfolio
companies, acquired for cash in various public auctions, and
contributed in the ordinary course of business in different
entities and start-ups. Historical asset costs are typically
reflected mostly in reviewed financial statements and from purchase
receipts, which form the historical base of assets invested,
contributed or sold to a to a selected company. Some of the capital
assets or sales demo inventories were recently acquired or
manufactured by ICT portfolio companies. In that case the sale
price to Laser Photonics Corp. was determined either at historical
cost or equipment sales at market prices in the ordinary course of
business for the respective piece of equipment or
machinery.
50
Laser Photonics Stock Price Evaluation
Generally, the
basis of value can be different depending on the purpose of the
valuation being performed. Laser Photonics Corp. normally uses more
than one approach in order to arrive at a supportable share price
valuation range. To perform a stock price evaluation of its
portfolio assets the Company is using the practical studies and
recommendations published by the leading financial auditing
institutions such as Ernst & Young and Deloitte.
By
comparing the two methods used to establish the stock price the
Company has used the lesser of the two.
Method #1 Income Approach
The
income approach focuses on the income-producing capability of the
business or asset. This approach assumes that the value is measured
by the present worth of the net economic benefit to be received
over the specific EBITDA multiples common for a specific industry.
In the photonics industry this value it typically determined as
7-10. The methodology usually adopted is the discounted cash flow
methodology (DCF). This approach, and the financial models which
are required to support it, are becoming increasingly important
given the current focus upon cash metrics in the optimization of
capital investments.
A
financial model is developed to generate cash flows using input
assumptions for capital and operating expenditure, feedstock costs,
feed-in tariff or electricity price, governmental policy support,
output utilization and taxation. The resulting cash flows are then
discounted at a rate which reflects the overall risk of the
project. It is critically important that cash flow analysis is
underpinned by robust financial models.
Variations of the income approach, including ‘excess
earnings’ and ‘relief from royalty’ methods, are
commonly used to value stock price to that matter.
Method #2 Free Equity Approach
This
approach relies upon the principle of substitution, which proposes
that a prudent investor will pay no more for stock in a business
than the cost based on the Shareholder Equity shown in the
Company’s balance sheet.
While
the FE method is an important metric, it suffers from a significant
weakness: it does not reflect the fact that many transactions
include portfolios of assets at various stages of their life. That
is why it is practical to use this method in conjunction with other
methods as a validation technique for determining the value of a
stock.
The
table below summarizes the three stock price valuation methods as
applied to the Company:
|
|
Method 1
|
Method 2
|
|
|
Income Approach
|
Cost Approach
|
|
|
DCF Value
|
Free Equity
|
|
Number
of Shares Issued and Outstanding
|
29,270,502
|
29,270,502
|
|
EBITDA
|
1,219,141
|
|
|
EBITDA
Multiple
|
7.00
|
|
|
Free
Equity
|
|
5,286,620
|
|
|
|
|
|
LPC
Stock Price Value
|
0.29
|
0.18
|
As of
December 31, 2020, the Company’s stock was valued by Method
#1 at $0.29 and by Method #2 at $0.18. Selecting the smallest
valuation between the two methods, the Company arrived at a
valuation of $0.18 for the Company’s stock which was used as
a basis for purchasing ICT Investments’ assets in exchange
for shares of the Company stock.
51
Long-Lived Assets
Long-lived
assets are reviewed for impairment whenever events or changes in
circumstances indicate that the carrying value may not be
recoverable. Impairment is measured by comparing the carrying value
of the long-lived assets to the estimated undiscounted future cash
flows expected to result from use of the assets and their ultimate
disposition. In instances where impairment is determined to exist,
the Company writes down the asset to its fair value based on the
present value of estimated future cash flows.
Liabilities
Liabilities Consist of Current Liabilities and Long Term
Liabilities.
|
|
Dec 31, 20
|
Dec 31, 19
|
|
Liabilities
|
|
|
|
Current Liabilities
|
|
|
|
Accounts Payable
|
55,756
|
5,280
|
|
Deferred Revenue
|
779,128
|
0
|
|
Lease liability current
portion
|
181,199
|
0
|
|
Sales Tax Liability
|
12,665
|
0
|
|
Total Current Liabilities
|
1,028,749
|
5,280
|
|
Long Term Liabilities
|
1,169,373
|
0
|
|
Total Liabilities
|
2,198,122
|
5,280
|
As of
December 31, 2020, and December 31, 2019, total liabilities were
recorded at $2,198,122 and $5,280, respectively.
Current Liabilities
Our
current liabilities consist of accounts payable and deferred
revenue.
Sales Tax Liability
Sales
tax liability is created when the Company sells equipment and
services to another entity located in the State of Florida.
Currently the sales tax rate in the Company’s County of
business is 6.5%. As of December 31, 2020, our sales tax liability
was recorded at $12,665 compared to $0 recorded at December 31,
2019.
Accounts Payable
Accounts
payable consist of short-term liability to our vendors and
sub-contractors, who extend credit terms to the Company or deliver
goods or services with delayed payment terms. As of December 31,
2020, and December 31, 2019, our accounts payable were recorded at
$55.756 and $0, respectively.
Deferred Revenue
The
Company requires deposits on most sales orders. These deposits are
recorded as deferred revenue until such time as the revenue
recognition criteria for that project are order is completed. As of
December 31, 2020, the Company’s other deferred revenue
liabilities were recorded at $779,128.
52
Long Term Liabilities
Our
long-term liabilities include a promissory note to ICT in the
principal amount of $439,990 bearing 6% annual interest with a
maturity date of January 31, 2023 and . This Note may be prepaid in
whole or in part. As of December 31, 2020, the unpaid principal
amount of the Note was $399,347.
|
|
December 31,
2020
|
December 31,
2019
|
|
|
(Unaudited)
|
|
|
Long Term Liabilities
|
|
|
|
PPP Loan
|
198,750
|
0
|
|
Lease Liability less Current
|
43,855
|
0
|
|
Notes
|
926,768
|
0
|
|
Total Long Term Liabilities
|
1,169,373
|
0
|
Our
long term liabilities include a PPP Loan from Axiom Bank,
promissory notes to ICT, and long term lease liability. The Notes
to ICT may be prepaid in whole or in part.
In
January 2020, the Company issued a promissory note to ICT in the
principal amount of $439,990 bearing 6% annual interest with a
maturity date of January 31, 2023. This Note may be prepaid in
whole or in part. As of December 31st, 2020, the unpaid principal
amount of the Note was $181,330.
In
October 2020, the Company issued a second promissory note to ICT in
the principal amount of $745,438 bearing 6% annual interest with a
maturity date of December 31, 2023. This Note may be prepaid in
whole or in part. As of December 31, 2020, the unpaid principal
amount of the Note was $689,926.
As of
December 31, 2020, the total unpaid principal amount of the Notes
was $926,768.
Liquidity and Capital Resources
For
the year ended December 31, 2020, the Company’s liquidity
needs were met through the financing activity and ongoing support
of the ICT Investments.
The
following is a summary of the Company’s cash flows provided
by (used in) operating, investing and financing
activities:
|
|
Year ended December 31,
|
|
|
|
2020
|
2019
|
|
Net
cash provided by Operating Activities
|
(1,328,899
)
|
(505,506
)
|
|
Net
cash provided by Investing Activities
|
(4,256,015
)
|
0
|
|
Net
cash provided by Financing Activities
|
5,911,628
|
505,506
|
As of
December 31, 2020, the Company had $
3,255,136
in current assets, comprised of $
326,713
in cash, $756,095 in accounts receivable and $2,172,327 in
inventory, compared to $495,150 in current assets, all of which was
inventory, at December 31, 2019. Current liabilities at December
31, 2020, totaled $1,028,749 compared to $5,280 at December 31,
2019.
As a
result, on December 31 2020, the Company had $2,226,387 in total
working capital:
|
|
Year Ended December 31,
|
|
|
|
2020
|
2019
|
|
Cash
And Cash Equivalents
|
326,713
|
0
|
|
Working
Capital
(excluding cash and
cash equivalents)
|
1,899,674
|
489,870
|
|
Total
Working Capital
|
2,226,387
|
489,870
|
53
Net Earnings/Loss per Share
Basic
earnings/loss per share is calculated by dividing the loss
attributable to stockholders by the weighted-average number of
shares outstanding for the period. Diluted loss per share reflects
the potential dilution that could occur if securities or other
contracts to issue common stock were exercised or converted into
common stock or resulted in the issuance of common stock that
shared in the earnings (loss) of the Company. Diluted earnings/
loss per share is computed by dividing the earnings/loss available
to stockholders by the weighted average number of shares
outstanding for the period and dilutive potential shares
outstanding unless such dilutive potential shares would result in
anti-dilution.
As of
December 31, 2020, the Company recorded $0.01 net income per
share.
Revenue Recognition
Under
Topic 606, an entity recognizes revenue when its customer obtains
control of promised goods or services, in an amount that reflects
the consideration which the entity expects to receive in exchange
for those goods or services. To determine revenue recognition for
arrangements that an entity determines are within the scope of
Topic 606, the entity performs the following five steps: (i)
identify the contract(s) with a customer; (ii) identify the
performance obligations in the contract; (iii) determine the
transaction price; (iv) allocate the transaction price to the
performance obligations in the contract; and (v) recognize revenue
when (or as) the entity satisfies a performance obligation. The
Company only applies the five-step model to contracts when it is
probable that the entity will collect the consideration it is
entitled to in exchange for the goods or services it transfers to
the customer. At contract inception, once the contract is
determined to be within the scope of Topic 606, the Company assess
the goods or services promised within each contract and determine
those that are performance obligations and assess whether each
promised good or service is distinct. The Company then recognize as
revenue the amount of the transaction price that is allocated to
the respective performance obligation when (or as) the performance
obligation is satisfied.
Refunds
and returns, which are minimal, are recorded as a reduction of
revenue. Payments received by customers prior to our satisfying the
above criteria are recorded as unearned income in the combined
balance sheets.
All
revenues were reported net of any sales discounts or
taxes.
Promissory Notes
In
January 2020, the Company issued a promissory note to ICT in the
principal amount of $439,990 bearing 6% annual interest with a
maturity date of January 31, 2023. This Note may be prepaid in
whole or in part. As of December 31, 2020, the unpaid principal
amount of the Note was $181,330.
In
October 2020, the Company issued a second promissory note to ICT in
the principal amount of $745,438 bearing 6% annual interest with a
maturity date of December 31, 2023. This Note may be prepaid in
whole or in part. As of December 31, 2020, the unpaid principal
amount of the Note was $689,926.
54
Fair Value of Financial Instruments
The
Company applies the accounting guidance under Financial Accounting
Standards Board (“FASB”) ASC 820-10, “Fair Value
Measurements”, as well as certain related FASB staff
positions. This guidance defines fair value as the price that would
be received from selling an asset or paid to transfer a liability
in an orderly transaction between market participants at the
measurement date. When determining the fair value measurements for
assets and liabilities required to be recorded at fair value, the
Company considers the principal or most advantageous market in
which it would transact business and considers assumptions that
marketplace participants would use when pricing the asset or
liability, such as inherent risk, transfer restrictions, and risk
of nonperformance.
The
guidance also establishes a fair value hierarchy for measurements
of fair value as follows:
☐
Level 1 - quoted
market prices in active markets for identical assets or
liabilities.
☐
Level 2
- inputs other than Level 1 that are observable, either directly or
indirectly, such as quoted prices in active markets for similar
assets or liabilities, quoted prices for identical or similar
assets or liabilities in markets that are not active, or other
inputs that are observable or can be corroborated by observable
market data for substantially the full term of the assets or
liabilities.
☐
Level 3
- unobservable inputs that are supported by little or no market
activity and that are significant to the fair value of the assets
or liabilities.
55
The
carrying amount of the Company’s financial instruments
approximates their fair value as of December 31, 2020, due to the
short-term nature of these instruments.
Tax Loss Carryforwards
The
Company recognizes deferred tax assets and liabilities for the tax
effects of differences between the financial statement and tax
basis of assets and liabilities. A valuation allowance is
established to reduce the deferred tax assets if it is more likely
than not that a deferred tax asset will not be
realized.
Off-Balance Sheet Arrangements
During
the quarter ended December 31, 2020, the Company did not engage in
any off-balance sheet arrangements as defined in item
303(a)(4) of the SEC’s Regulation S-K.
The
Company does not have any off-balance sheet arrangements that have
or are reasonably likely to have a current or future effect on its
financial condition, changes in financial condition, revenues or
expenses, results of operations, liquidity, capital expenditures or
capital resources that are material to investors.
56
Recent
Accounting Pronouncements
In
June 2014, FASB issued Accounting Standards Update
(“ASU”) No. 2014-10, “Development Stage
Entities (Topic 915): Elimination of Certain Financial Reporting
Requirements, Including an Amendment to Variable Interest
Entities Guidance in Topic 810, Consolidation”. The update
removes all incremental financial reporting requirements from GAAP
for development stage entities, including the removal of Topic 915
from the FASB Accounting Standards Codification. In addition, the
update adds an example disclosure in Risks and Uncertainties (Topic
275) to illustrate one way that an entity that has not begun
planned principal operations could provide information about the
risks and uncertainties related to the company’s current
activities. Furthermore, the update removes an exception provided
to development stage entities in Consolidations (Topic 810) for
determining whether an entity is a variable interest entity-which
may change the consolidation analysis, consolidation decision, and
disclosure requirements for a company that has an interest in a
company in the development stage. The update is effective for the
annual reporting periods beginning after December 15, 2014,
including interim periods therein. Early application with the first
annual reporting period or interim period for which the
entity’s financial statements have not yet been issued
(Public business entities) or made available for issuance (other
entities). The Company adopted this pronouncement for the year
ended December 31, 2014.
In
June 2014, FASB issued Accounting Standards Update
(“ASU”) No. 2014-12, “Compensation –
Stock Compensation ( Topic 718 ); Accounting for Share-Based
Payments When the Terms of an Award Provide That a Performance
Target Could Be Achieved after the Requisite Service Period”.
The amendments in this ASU apply to all reporting entities that
grant their employees share-based payments in which the terms of
the award provide that a performance target that affects vesting
could be achieved after the requisite service period. The
amendments require that a performance target that affects vesting
and that could be achieved after the requisite service period be
treated as a performance condition. A reporting entity should apply
existing guidance in Topic 718 as it relates to awards with
performance conditions that affect vesting to account for such
awards. For all entities, the amendments in this ASU are effective
for annual periods and interim periods within those annual periods
beginning after December 15, 2015. Earlier adoption is
permitted. Entities may apply the amendments in this ASU either
(a) prospectively to all awards granted or modified after the
effective date or (b) retrospectively to all awards with
performance targets that are outstanding as of the beginning of the
earliest annual period presented in the financial statements and to
all new or modified awards thereafter. If retrospective transition
is adopted, the cumulative effect of applying this Update as of the
beginning of the earliest annual period presented in the financial
statements should be recognized as an adjustment to the opening
retained earnings balance at that date. Additionally, if
retrospective transition is adopted, an entity may use hindsight in
measuring and recognizing the compensation cost. This updated
guidance is not expected to have a material impact on our results
of operations, cash flows or financial condition. Company are
currently reviewing the provisions of this ASU to determine if
there will be any impact on our results of operations, cash flows
or financial condition.
In
August 2014, the FASB issued Accounting Standards Update
“ASU” 2014-15 on “Presentation of Financial
Statements Going Concern (Subtopic 205-40) – Disclosure of
Uncertainties about an Entity’s Ability to Continue as a
Going Concern”. Currently, there is no guidance in U.S. GAAP
about management’s responsibility to evaluate whether there
is substantial doubt about an entity’s ability to continue as
a going concern or to provide related footnote disclosures. The
amendments in this Update provide that guidance. In doing so, the
amendments are intended to reduce diversity in the timing and
content of footnote disclosures. The amendments require management
to assess an entity’s ability to continue as a going concern
by incorporating and expanding upon certain principles that are
currently in U.S. auditing standards. Specifically, the amendments
(1) provide a definition of the term substantial doubt,
(2) require an evaluation every reporting period including
interim periods, (3) provide principles for considering the
mitigating effect of management’s plans, (4) require
certain disclosures when substantial doubt is alleviated as a
result of consideration of management’s plans,
(5) require an express statement and other disclosures when
substantial doubt is not alleviated, and (6) require an
assessment for a period of one year after the date that the
financial statements are issued (or available to be issued).
Company are currently reviewing the provisions of this ASU to
determine if there will be any impact on our results of operations,
cash flows or financial condition.
All
other newly issued accounting pronouncements but not yet effective
have been deemed either immaterial or not applicable.
57
NOTE
3 – RELATED PARTY TRANSACTIONS
Since
the date of incorporation on November 8, 2019, the Company has
engaged in the following transactions with our directors, executive
officers, holders of more than 5% of its voting securities, and
affiliates or immediately family members of its directors,
executive officers and holders of more than 5% of our voting
securities, and its co-founders. The Company believes that all of
these transactions were on terms as favorable as could have been
obtained from unrelated third parties.
In
January 2020, the Company issued a promissory note 1 to ICT in the
principal amount of $439,990 bearing 6% annual interest with a
maturity date of January 31, 2023. This Note may be prepaid in
whole or in part. As of December 31st, 2020, the unpaid principal
amount of the Note was $181,330.
In
October 2020, the Company issued a promissory note 2 to ICT in the
principal amount of $745,438 bearing 6% annual interest with a
maturity date of December 31, 2023. This Note may be prepaid in
whole or in part. As of December 31st, 2020, the unpaid principal
amount of the Note was $689,926.
On
December 31, 2019, Company purchased from ICT Investments certain
sales demonstration equipment valued at $495,150 which we will use
in our business in exchange for 2,616,316 shares of our common
stock.
During
the year 2020, ICT Investments made additional investments in the
Company, consisting of inventories, certain capital manufacturing
equipment, office and computer equipment, intangible assets
consisting of 3D engineering design documentation, manufacturing
database, customer relationship database with populated CRM, valued
in total at $$4,520,018 which we will use in our business in
exchange for 26,609,186 shares of its common stock.
The
Company initially entered into a lease with ICT Investments, the
Company’s largest shareholder. In January 202 we took over
the entire lease and enter in direct lease with the landlord. The
Company’s monthly lease payments of $14,377.50 represent a
direct payment to the landlord and a fair market rate for
comparable leases.
Dmitriy
Nikitin is the Managing Partner of ICT Investments and also is a
promoter of the Company.
Dmitriy Nikitin serves as a member of
our Board of Advisors. During the year of 2020 he received $75,218
as cash compensation in that role.
Tatiana
Nikitina, in a role of Marketing Director, created the
Company’s Marketing Department, trained personnel and
transitioned into a Marketing adviser role. She is the daughter of
Dmitriy Nikitin. During the year of 2020 she received $12,749 as
cash compensation in that role.
On
December 31, 2020, the Company’s President, Wayne Tupuola,
received directly from ICT Investments 555,555 shares in form of
re-assignment for recognition of achievements in the Company
progress in 2020.
On
December 31, 2020, the Company’s Chief Equipment Design
Engineer, Arnold Bykov, received directly from ICT Investments
277,777 shares in form of re-assignment for recognition of
outstanding achievements of new generation of equipment design in
2020.
On
December 31, 2020, the Company’sMarketing Adviser and
Director, Tatiana Nikitina, received directly from ICT Investments
200,000 shares in form of re-assignment for recognition of her
efforts and success establishing of Marketing Department in
2020.
58
NOTE 4
– STOCKHOLDERS’ EQUITY/DEFICIT
As of
December 31, 2020, the Company did not have a stockholder deficit.
Stockholder equity as of December 31, 2020, was
$5,286,620.
NOTE 5
– COMMITMENTS AND CONTINGENCIES
The
Company has committed to lease 18,000 SF of manufacturing space
with the monthly cost of $14,377.50 per months. The lease
commitment expires on October 20, 2021.
NOTE 6
– ADVANCES
During
its operations in the quarter ended December 31, 2020, the Company
did not accrue any costs which were not paid through the cash
proceeds or the sale of capital stock.
NOTE 7
– SUBSEQUENT EVENTS
On
April 27, 2020, the Company received a loan from Axiom Bank, N.A.,
headquartered in Central Florida in the aggregate amount of
$198,750 pursuant to the Paycheck Protection Program (the
“PPP”) under Division A, Title I of the Coronavirus
Aid, Relief and Economic Security Act (the “CARES
Act”), which was enacted March 27, 2020. Under the terms of
the PPP, PPP loans and accrued interest are forgivable after eight
weeks as long as the borrower uses the loan proceeds for eligible
purposes, including payroll, benefits, rent and utilities, and
maintains its payroll levels. The amount of loan forgiveness will
be reduced if the borrower terminates employees or reduces salaries
during the eight-week period. The Company intends to use the loan
proceeds for purposes consistent with the PPP, and anticipates that
a majority of the loan amount will be forgiven, but no assurance
can be given that the Company will not take actions that could
cause the Company to be ineligible for forgiveness of some portion
of the loan. The unforgiven portion of the loan is payable over two
years at an interest rate of 1%, with a deferral of payments for
the first six months.
59
NOTE 8
- SELECTED QUARTERLY FINANCIAL DATA (UNAUDITED)
|
|
First Quarter
|
Second Quarter
|
Third Quarter
|
Fourth Quarter
|
|
Ordinary Income/Expense
|
|
|
|
|
|
Net Income
|
177,925.33
|
559,851.00
|
607,686.80
|
809,313.86
|
|
Cost of Goods Sold
|
57,319.52
|
214,227.39
|
260,990.07
|
417,244.75
|
|
Gross Profit
|
120,605.81
|
345,623.61
|
346,696.73
|
392,069.11
|
|
Expense
|
|
|
|
|
|
Depreciation Expense
|
6,602.34
|
6,602.34
|
6,602.34
|
6,602.34
|
|
G&A Expense
|
37,001.68
|
57,613.33
|
61,203.32
|
71,601.84
|
|
Payroll Expenses
|
189,491.28
|
101,505.86
|
215,674.65
|
261,207.05
|
|
Rent Expense
|
43,161.50
|
43,190.50
|
43,161.50
|
43,132.50
|
|
Total Expense
|
276,256.80
|
208,912.03
|
326,641.81
|
382,543.73
|
|
Net Ordinary Income
|
-155,650.99
|
136,711.58
|
20,054.92
|
9,525.38
|
|
Net Income
|
-155,650.99
|
136,711.58
|
20,054.92
|
9,525.38
|
Net
income attributable to the Company as well as the income per share
in the fourth quarter of the year ended December 31, 2020 were
impacted by inventory impairment discussed in Note 2.
60
ITEM 9. CHANGES IN AND DISAGREEMENTS WITH ACCOUNTANTS ON ACCOUNTING
AND FINANCIAL DISCLOSURE
None.
ITEM 9A. CONTROLS AND PROCEDURES
Evaluation of Disclosure Controls and Procedures
Under
the supervision and with the participation of the Company’s
management, including its Chief Executive Officer and Chief
Financial Officer, the Company conducted an evaluation of the
effectiveness of the Company’s disclosure controls and
procedures, as defined in Rule 13a−15(e) and 15d-15(e) under
the Securities Exchange Act of 1934 (the “Exchange
Act”), as of the end of the period covered by this annual
report. Based on this evaluation, the Company’s Chief
Executive Officer and Chief Financial Officer concluded as of
December 31, 2020 that the Company’s disclosure controls and
procedures were effective such that the information required to be
disclosed in the Company’s United States Securities and
Exchange Commission (the “SEC”) reports is recorded,
processed, summarized and reported within the time periods
specified in the SEC rules and forms, and is accumulated and
communicated to the Company’s management, including its Chief
Executive Officer and Chief Financial Officer, currently the same
person to allow timely decisions regarding required
disclosure.
Management’s Annual Report on Internal Control over Financial
Reporting
Based
on its evaluation under the framework in Internal Control –
Integrated Framework (2013) issued by the Committee of Sponsoring
Organizations of the Treadway Commission as of December 31, 2020,
the Company’s management, with the participation of its Chief
Executive Officer and Chief Financial Officer, concluded that its
internal control over financial reporting were effective as of
December 31, 2020.
This
annual report does not include an attestation report of the
Company's registered public accounting firm regarding internal
control over financial reporting. Management's report was not
subject to attestation by our registered public accounting firm
pursuant to the Dodd-Frank Wall Street Reform and Consumer
Protection Act, which permanently exempts non-accelerated filers
from complying with Section 404(b) of the Sarbanes-Oxley Act of
2002.
Attached as exhibits to this Form 10-K are
certifications of Laser Photonics’ Chief Executive Officer
(“CEO”) and Chief Financial Officer
(“CFO”), which are required in accordance with Rule
13a-14 of the Securities Exchange Act of 1934, as amended (the
“Exchange Act”). This “Controls and
Procedures” section includes information concerning the
controls and controls evaluation referred to in the
certifications.
Material Weakness Identified
None.
Changes in Internal Control over Financial Reporting
There
have been no changes in our internal control over financial
reporting during the quarter ended December 31, 2020, that have
materially affected, or are reasonably likely to materially affect,
our internal control over financial reporting.
Inherent Limitations on Effectiveness of Controls
Our
management, including the CEO/CFO, does not expect that the
disclosure controls or our internal control over financial
reporting will prevent or detect all errors and all fraud. A
control system, no matter how well designed and operated, can
provide only reasonable, not absolute, assurance that the control
system’s objectives will be met. The design of a control
system must reflect the fact that there are resource constraints,
and the benefits of controls must be considered relative to their
costs. Further, because of the inherent limitations in all control
systems, no evaluation of controls can provide absolute assurance
that misstatements due to error or fraud will not occur or that all
control issues and instances of fraud, if any, within our Company
have been detected.
These
inherent limitations include the realities that judgments in
decision-making can be faulty and that breakdowns can occur because
of simple error or mistake. Controls can also be circumvented by
the individual acts of some persons, by collusion of two or more
people, or by management override of the controls. The design of
any system of controls is based in part on certain assumptions
about the likelihood of future events, and there can be no
assurance that any design will succeed in achieving its stated
goals under all potential future conditions. Projections of any
evaluation of controls effectiveness to future periods are subject
to risks. Over time, controls may become inadequate because of
changes in conditions of deterioration in the degree of compliance
with policies or procedures.
ITEM 9B. OTHER INFORMATION
None
61
PART III
ITEM 10. DIRECTORS, EXECUTIVE OFFICERS AND CORPORATE
GOVERNANCE
The
following table sets forth certain information about our executive
officers, key employees and directors as of December 31,
2020.
|
Name
|
|
Age
|
|
Position
|
|
Wayne
Tupuola
|
|
57
|
|
President,
Director
|
|
Tatiana
Nikitina
|
|
25
|
|
Secretary,
Director
|
|
Arnold
Bykov
|
|
78
|
|
Chief
Design Engineer, Director
|
|
Mark
Kouri
|
|
59
|
|
Director.
Investment Relationships
|
|
Igor
Vodopiyanov
|
|
62
|
|
VP
R&D and Product Development
|
Wayne
Tupuola is President and the Chairman of the Board. Mr. Tupuola
joined an affiliate of ICT Investments as Vice President of
Operations in 2007 and joined us on November 15, 2019. In 2014 and
2015, he was acting as an Industrial Consultant for Florida high
tech companies. He brought experience based on 15 successful years
of C-level management capacity in manufacturing operations, and
more than 24 years hands-on experience in the semiconductor,
aerospace, food & beverage and commercial industries,
including: Sumitomo Corp, the world’s second-largest wafer
manufacturer in the semiconductor sector (one of the world’s
largest semiconductor component companies) and Thermo-Electron, one
of the world’s leading analytical instruments, lab equipment,
and industrial equipment manufacturers. From September 2015 to
December 2015 he was appointed as a Director and Vice President of
Operations to an affiliate of Laser Photonics and one of the
ICT’s portfolio companies, Fonon Corporation. He is currently
in charge of all manufacturing and day to day business operations
of Laser Photonics. Mr. Tupuola is a graduate of the University of
Phoenix. We believe that his significant management experience with
manufacturing operations makes him qualified to be a member of our
Board of Directors.
Tatiana
Nikitina is Secretary and Marketing Director. Ms. Nikitina joined
us on November 15, 2019, as Marketing Director. From November 2013
until August 2017 Ms. Nikitina was Senior Brand Ambassador &
Event Production Manager for The Party Robot Inc. Ms. Nikitina
received her Bachelor of General Marketing in Business from Florida
Atlantic University in August 2017 and a Master of Business
Administration in August 2018 from the University of Central
Florida. We believe that Ms. Nikitina’s marketing expertise
which will be critical to our future success qualifies her to be a
member of our Board of Directors.
Arnold
Bykov joined us on November 15, 2019 as Chief Design Engineer. For
the last 25 years, Mr. Bykov has been working in the photonics
industry, primarily with ICT and affiliated companies, including
being appointed Director and Chief Design Engineer of Fonon
Corporation from September 2015 to December 2015, where he
developed laser systems for material processing and worked as a
design and project engineer supervising design teams. Mr. Bykov is
currently responsible for the industrial design and technological
process of our laser cleaning technology. Mr. Bykov has devoted 20
years of his engineering career in the development of industrial
equipment for high-tech industries. The majority of those
developments were prepared for laser cutting technology related
products through his work with a team of other ICT engineers during
the last 15 years and directly for ICT for the past five years. Mr.
Bykov received a number of state awards and certificates of
invention for the development of laser cutting technology. He
graduated from Minsk Polytechnic University in 1966. The Company
believes that the expertise that Arnold Bykov has in industrial
design and engineering makes him a valuable resource of knowledge
and qualifies him to be a member of the Board.
Mark
Kouri, age 59, is Director Investment Relationships. Mr. Kouri
joined Laser Photonics as Marketing Manager in 2020. In 2017 and
2018 he was Regional Director, Americas for GardaWorld, a global
leader in security and the world’s largest privately owned
security company. He serves as an Energy Sector Security Advisor,
and was embedded with ExxonMobil, Noble Energy and CNPC in West
Africa from 2014-2017. From 2010 to 2014, Mark launched and managed
peacekeeping support training missions for the US Department of
State in francophone Africa. Prior to working in government
services, Mark was a credentialed journalist. As a credentialed
journalist, Mark served as Media Advisor to the Iraqi Democracy
Project in Washington and Baghdad. He worked as Design Director for
Oklahoma City’s market-leading CBS-TV affiliate for five
years, and as Art Director for Ackerman McQueen, one of the
nation’s leading advertising agencies for three years. Mark
has recent Project Management experience in various industries. He
has written prospectuses and conducted roadshows that funded a
DOTCOM, and secured funding and distribution guarantees for feature
film projects. Mark earned a Bachelor of Science degree in Liberal
Arts and Sciences from Excelsior College in Albany, NY. He is an
Honor Graduate of the Defense Language Institute Foreign Language
Center in Modern Standard Arabic.
Igor
Vodopiyanov, PhD, age 62, is the Senior Research & Development
(R&D) Engineer
at
Laser Photonics. Dr. Vodopiyanov served as a Research Scientist at
Florida Institute of Technology before joining the Laser Photonics
R&D team in 2017 as a Subject Matter Expert in the tuning and
calibration of laser systems for material processing. Dr.
Vodopiyanov conducted research in Particle Physics within CMS
(Compact Muon Solenoid) Collaboration at the CERN Large Hadron
Collider in Switzerland, and managed the Hadron Calorimeter
Calibration and Condition Group of the CMS Collaboration, which
included the calibration and alignment of Forward Tracking Chambers
of CERN’s L3 detector. Dr. Vodopiyanov also carried out
research in Particle Physics within L3 Collaboration at the CERN
Electron-Positron Collider at Petersburg Nuclear Physics Institute.
He earned a Master of Science degree from the M. I. Kalinin
Leningrad Polytechnic Institute in Saint Petersburg, Russia, and a
PhD in Physics and Mathematics from the V.G. Khlopin Radium
Institute in Saint Petersburg, Russia. Dr. Vodopiyanov has over 250
publications to his credit, and he is a Professional Member of the
Sigma Pi Sigma honor society within the American Institute of
Physics.
62
Board Composition and Election of Directors
Our
board of directors is currently authorized to have five members and
currently has three members. In accordance with the terms of our
current certificate of incorporation and bylaws, the term of office
of each director expires at our annual meeting of stockholders or
until their successors are duly elected and qualified.
Board Committees
Our
board of directors does not have a separate, standing audit
committee nor a nominating or governance committee. The full board
of directors performs the function of an audit committee. We do not
have any member of the board of directors who qualifies as an
“audit committee financial expert” as that term is
defined under Item 407(d)(5) of Regulation S-K.
Indemnification of Directors and Officers.
Delaware Law
Section
145 of the Delaware General Corporation Law provides for, under
certain circumstances, the indemnification of our officers,
directors, employees and agents against liabilities that they may
incur in such capacities. Below is a summary of the circumstances
in which such indemnification is provided.
In
general, the statute provides that any director, officer, employee
or agent of a corporation may be indemnified against expenses
(including attorneys’ fees), judgments, fines and amounts
paid in settlement, actually and reasonably incurred in a
proceeding (including any civil, criminal, administrative or
investigative proceeding) to which the individual was a party by
reason of such status. Such indemnity may be provided if the
indemnified person’s actions resulting in the liabilities:
(i) were taken in good faith; (ii) were reasonably believed to have
been in or not opposed to our best interests; and (iii) with
respect to any criminal action, such person had no reasonable cause
to believe the actions were unlawful. Unless ordered by a court,
indemnification generally may be awarded only after a determination
of independent members of the Board of Directors or a committee
thereof, by independent legal counsel or by vote of the
stockholders that the applicable standard of conduct was met by the
individual to be indemnified.
The
statutory provisions further provide that to the extent a director,
officer, employee or agent is wholly successful on the merits or
otherwise in defense of any proceeding to which he or she was a
party, he or she is entitled to receive indemnification against
expenses, including attorneys’ fees, actually and reasonably
incurred in connection with the proceeding.
Indemnification in
connection with a proceeding by us or in our right in which the
director, officer, employee or agent is successful is permitted
only with respect to expenses, including attorneys’ fees
actually and reasonably incurred in connection with the defense. In
such actions, the person to be indemnified must have acted in good
faith, in a manner believed to have been in our best interests and
must not have been adjudged liable to us, unless and only to the
extent that the Court of Chancery or the court in which such action
or suit was brought shall determine upon application that, despite
the adjudication of liability, in view of all the circumstances of
the case, such person is fairly and reasonably entitled to
indemnity for such expense which the Court of Chancery or such
other court shall deem proper. Indemnification is otherwise
prohibited in connection with a proceeding brought on our behalf in
which a director is adjudged liable to us, or in connection with
any proceeding charging improper personal benefit to the director
in which the director is adjudged liable for receipt of an improper
personal benefit.
Delaware law
authorizes us to reimburse or pay reasonable expenses incurred by a
director, officer, employee or agent in connection with a
proceeding in advance of a final disposition of the matter. Such
advances of expenses are permitted if the person furnishes to us a
written agreement to repay such advances if it is determined that
he or she is not entitled to be indemnified by us.
The
statutory section cited above further specifies that any provisions
for indemnification of or advances for expenses does not exclude
other rights under our certificate of incorporation, by-laws,
resolutions of our stockholders or disinterested directors, or
otherwise. These indemnification provisions continue for a person
who has ceased to be a director, officer, employee or agent of the
corporation and inure to the benefit of the heirs, executors and
administrators of such persons.
The
statutory provision cited above also grants us the power to
purchase and maintain insurance policies that protect any director,
officer, employee or agent against any liability asserted against
or incurred by him or her in such capacity arising out of his or
her status as such. Such policies may provide for indemnification
whether or not the corporation would otherwise have the power to
provide for it.
Our
bylaws include an indemnification provision under which we have the
power to indemnify our directors, officers, former directors and
officers, employees and other agents (including heirs and personal
representatives) against all costs, charges and expenses actually
and reasonably incurred, including an amount paid to settle an
action or satisfy a judgment to which a director or officer is made
a party by reason of being or having been a director or officer of
the Company. Our bylaws further provide for the advancement of all
expenses incurred in connection with a proceeding upon receipt of
an undertaking by or on behalf of such person to repay such amounts
if it is determined that the party is not entitled to be
indemnified under our bylaws. No advance will be made by the
Company to a party if it is determined that the party acting in bad
faith. These indemnification rights are contractual, and as such
will continue as to a person who has ceased to be a director,
officer, employee or other agent, and will inure to the benefit of
the heirs, executors and administrators of such a
person.
63
At present,
we do not maintain directors’ and officers’ liability
insurance in order to limit the exposure to liability for
indemnification of directors and officers, including liabilities
under the Securities Act; however, we are in the process of
obtaining such insurance.
Certificate of Incorporation
Our
certificate of incorporation contains provisions that limit the
liability of our current and former directors for monetary damages
to the fullest extent permitted by Delaware law. Delaware law
provides that directors of a corporation will not be personally
liable for monetary damages for any breach of fiduciary duties as
directors, except liability for:
●any breach
of the director’s duty of loyalty to the corporation or its
stockholders;
●any act or
omission not in good faith or that involves intentional misconduct
or a knowing violation of law;
●unlawful
payments of dividends or unlawful stock repurchases or redemptions;
or
●any
transaction from which the director derived an improper personal
benefit.
Such
limitation of liability does not apply to liabilities arising under
federal securities laws and does not affect the availability of
equitable remedies such as injunctive relief or
rescission.
Our
certificate of incorporation authorize us to indemnify our
directors, officers, employees, and other agents to the fullest
extent permitted by Delaware law.
ITEM 11. EXECUTIVE COMPENSATION
Compensation Discussion and Analysis
Compensation Philosophy
This
section discusses the principles underlying our policies and
decisions with respect to the compensation of our executive
officers and what we believe are the most important factors
relevant to an analysis of these policies and decisions. This
section also describes the material elements of compensation
awarded to, earned by or paid to each of our named executive
officers as of December 31, 2020. Our three “named executive
officer” for 2020 were Wayne Tupuola, Tatiana Nikitina and
Arnold Bykov. The compensation of our other current executive
officers is based on individual terms approved by our board of
directors.
Our
compensation committee oversees these compensation policies and,
together with our board of directors, periodically evaluates the
need for revisions to ensure our compensation program is
competitive with the companies with which we compete for executive
talent.
Objectives and Philosophy of Our Executive Compensation
Program
The
primary objectives of the board of directors in designing our
executive compensation program are to:
●
attract, retain and
motivate experienced and talented executives;
●
ensure executive
compensation is aligned with our corporate strategies, research and
development programs and business goals;
●
recognize the individual contributions of executives while
fostering a shared commitment among executives by aligning their
individual goals with our corporate goals;
●
promote the achievement of
key strategic, development and operational performance measures by
linking compensation to the achievement of measurable corporate and
individual performance goals; and
●
align the interests of our
executives with our stockholders by rewarding performance that
leads to the creation of stockholder value.
Our
board of directors and compensation committee will evaluate our
executive compensation program with the goal of setting and
maintaining compensation at levels that are justifiable based on
each executive’s level of experience, performance and
responsibility and that the board believes are competitive with
those of other companies in our industry and our region that
compete with us for executive talent. In addition, our executive
compensation program will tie a substantial portion of each
executive’s overall compensation to key strategic, financial
and operational goals. We have provided, and expect to continue to
provide, a portion of our executive compensation in the form of
stock options and restricted stock that vest over time, which we
believe helps to retain our executives and aligns their interests
with those of our stockholders by allowing them to participate in
the longer term success of our company as reflected in stock price
appreciation.
64
Use of Compensation Consultants and Market
Benchmarking
For
purposes of determining total compensation and the primary
components of compensation for our executive officers in 2020, we
did not retain the services of a compensation consultant or use
survey information or compensation data to engage in benchmarking.
In the future, we expect that our compensation committee will
consider publicly available compensation data for national and
regional companies in the laser cleaning industry to help guide its
executive compensation decisions at the time of hiring and for
subsequent adjustments in compensation. Even if we retain the
services of an independent compensation consultant to provide
additional comparative data on executive compensation practices in
our industry and to advise on our executive compensation program
generally, our board of directors and future compensation committee
will ultimately make their own decisions about these
matters.
Our
annual cash bonus program is based upon the achievement of
specified annual corporate and individual goals that will be
established in advance by our board of directors or compensation
committee. Our annual cash bonus program emphasizes
pay-for-performance and is intended to closely align executive
compensation with achievement of specified operating results as the
amount is calculated on the basis of percentage of corporate goals
achieved. The performance goals established by our compensation
committee is based on the business strategy of the company and the
objective of building stockholder value. There are three steps to
determine if and the extent to which an annual cash bonus is
payable to a named executive officer. First, at the beginning of
the year, our compensation committee determines the target annual
cash incentive award for the named executive officer based on a
percentage of the officer’s annual base salary for that year.
Second, the compensation committee establishes the specific
performance goals, including both corporate and individual
objectives, that must be met for the officer to receive the award.
Third, shortly after the end of the year, the compensation
committee determines the extent to which these performance goals
were met and the amount of the award. Our compensation committee
works with our chief executive officer to develop corporate and
individual goals that they believe can be reasonably achieved with
hard work over the course of the year and will target total cash
compensation, consisting of base salaries and target annual cash
bonuses
Stock-Based Awards
Our
equity award program is the primary vehicle for offering long-term
incentives to our executives. While we do not have any equity
ownership guidelines for our executives, we believe that equity
grants provide our executives with a strong link to our long-term
performance, create an ownership culture and help to align the
interests of our executives and our stockholders. In addition, the
vesting feature of our equity awards contributes to executive
retention by providing an incentive for our executives to remain in
our employ during the vesting period. Currently, our executives are
eligible to participate in our 2019 stock incentive plan, which we
refer to as the 2019 Plan. Our employees and executives are
eligible to receive stock-based awards pursuant to our 2019 Plan.
Under our 2019 Plan, executives are eligible to receive grants of
stock options, restricted stock awards, restricted stock unit
awards, stock appreciation rights and other stock-based equity
awards at the discretion of our board of directors.
Our
employee equity awards are typically in the form of stock options.
Because our executives profit from stock options only if our stock
price increases relative to the stock option’s exercise
price, we believe stock options provide meaningful incentives for
our executives to achieve increases in the value of our stock over
time. While we currently expect to continue to use stock options as
the primary form of equity awards that we grant, we may in the
future use alternative forms of equity awards, such as restricted
stock and restricted stock units. To date, we have generally used
equity awards to compensate our executive officers in the form of
initial grants in connection with the commencement of employment.
In the future, we also generally plan to grant equity awards on an
annual basis to our executive officers. We may also make additional
discretionary grants, typically in connection with the promotion of
an employee, to reward an employee, for retention purposes or in
other circumstances recommended by management.
In
general, the equity awards that we expect to grant to our
executives will vest with respect to 25% of the shares on the first
anniversary of the grant date and with respect to the remaining
shares in approximately equal quarterly installments through the
fourth anniversary of the grant date. Vesting ceases upon
termination of employment and exercise rights cease shortly after
termination of employment. Prior to the exercise of a stock option,
the holder has no rights as a stockholder with respect to the
shares subject to such option, including voting rights or the right
to receive dividends or dividend equivalents.
We will
grant, stock options with exercise prices that are set at no less
than the fair value of shares of our common stock on the date of
grant as determined by our board of directors.
Benefits and Other Compensation
We
believe that establishing competitive benefit packages for our
employees is an important factor in attracting and retaining highly
qualified personnel. We expect to maintain broad-based benefits
that are provided to all employees, including health and dental
insurance, life and disability insurance, and a 401(k) plan.
All of our executives will be eligible to participate in all of our
employee benefit plans, in each case on the same basis as other
employees.
In
certain circumstances, we may award cash signing bonuses or may
reimburse relocation expenses when executives first join us.
Whether a signing bonus is paid or relocation expenses are
reimbursed, and the amount of either such benefit, is determined by
our board of directors on a case-by-case basis based on the
specific hiring circumstances and the recommendation of our chief
executive officer.
65
Severance and Change in Control Benefits
Pursuant to
agreements we expect to enter into with certain of our executives,
these executives will be entitled to specified benefits in the
event of the termination of their employment under specified
circumstances, including termination following a change in control
of our company.
We
believe providing these benefits helps us compete for executive
talent. Based on the substantial business experience of the members
of our board of directors, we believe that our severance and change
in control benefits are generally in line with severance packages
offered to executives by companies at comparable stages of
development in our industry and related industries.
Risk Considerations in Our Compensation Program
Our
board of directors is evaluating the philosophy and standards on
which our compensation plans will be implemented across our
company. It is our belief that our compensation programs do not,
and in the future will not, encourage inappropriate actions or risk
taking by our executive officers. We do not believe that any risks
arising from our employee compensation policies and practices are
reasonably likely to have a material adverse effect on our company.
In addition, we do not believe that the mix and design of the
components of our executive compensation program will encourage
management to assume excessive risks. We believe that our current
business process and planning cycle fosters the behaviors and
controls that would mitigate the potential for adverse risk caused
by the action of our executives. We believe that the following
aspects of our executive compensation program that we plan to
implement will mitigate the potential for adverse risk caused by
the action of our executives:
●
annual establishment of
corporate and individual objectives for our performance-based cash
bonus programs for our executive officers, which we expect to be
consistent with our annual operating and strategic plans, designed
to achieve the proper risk/reward balance and not require excessive
risk taking to achieve;
●
the mix between fixed and
variable, annual and long-term and cash and equity compensation,
which we expect to be designed to encourage strategies and actions
that balance the company’s short-term and long-term best
interests; and
●
equity incentive awards
that vest over a period of time, which we believe will encourage
executives to take a long-term view of our business.
Tax and Accounting Considerations
Section 162(m) of
the Internal Revenue Code of 1986, as amended, or the Code,
generally disallows a tax deduction for compensation in excess of
$1,000,000 per person paid to a publicly traded company’s
chief executive officer and three other most highly paid officers,
other than the chief financial officer. Qualifying
performance-based compensation is not subject to the deduction
limitation if specified requirements are met. We will periodically
review the potential consequences of Section 162(m), however,
the board of directors may, in its judgment, authorize compensation
payments that do not comply with the exemptions in
Section 162(m) when it believes that such payments are
appropriate to attract and retain executive talent and are in the
best interests of our stockholders.
We
account for equity compensation paid to our employees in accordance
with Financial Accounting Standards Board, or FASB, Accounting
Standard Codification Topic 718,
Compensation—Stock Compensation
,
or ASC 718, which requires us to measure and recognize
compensation expense in our financial statements for all
share-based payments based on an estimate of their fair value over
the service period of the award. We record cash compensation as an
expense at the time the obligation is accrued.
66
Summary Compensation Table
Since
neither of our named executive officers received any compensation
from the Company during the fiscal years ended December 31,
2020 and 201919, there is no compensation to them reflected in this
Summary Compensation Table.
SUMMARY
COMPENSATION TABLE
|
Name and
Principal Occupation
|
|
Year
|
Salary($)
|
Bonus($)
|
Stock
Awards($)
|
OptionAwards
($)(1)
|
Non-Equity
Incentive Plan Compensation ($)
|
Nonqualified
Deferred Compensation Earnings
($)
|
All Other
Compensation ($)(2)
|
Total($)
|
|
Wayne Tupuola
|
|
2019
|
$
0
|
$
0
|
$
0
|
$
0
|
$
0
|
$
0
|
$
0
|
$
0
|
|
Tatiana
Nikitina
|
|
2019
|
$
0
|
$
0
|
$
0
|
$
0
|
$
0
|
$
0
|
$
0
|
$
0
|
Grants of Plan-Based Awards in 2020
There
were no grants of plan-based awards to our named executive officers
during the fiscal years ended December 31, 2020 and as of
December 31, 2019.
Outstanding Equity Awards at December 31, 2020
There
were no outstanding equity awards held by our named executive
officers as of December 31, 2020.
Nonqualified Deferred Compensation
We do
not maintain any nonqualified deferred compensation
plans.
Defined Contribution Plan
We do
not currently have a defined contribution plan.
Stock Option and Other Employee Benefit Plans
The
purpose of the 2019 Plan is to advance the interests of our
stockholders by enhancing our ability to attract, retain and
motivate persons who are expected to make important contributions
and by providing such persons with equity ownership opportunities
and performance-based incentives that are intended to better align
the interests of such persons with those of our
stockholders.
67
2019 Stock Incentive Plan
History
. On December 2, 2019, the Board
of Directors approved and on December 3, 2019, the
stockholders approved the 2019 stock incentive plan (the
“2019 Plan”) under which employees, officers, directors
and consultants are eligible to receive grants of stock options,
stock appreciation rights (“SAR”), restricted or
unrestricted stock awards, restricted stock units, performance
awards, other stock-based awards, or any combination of the
foregoing. The Plan authorizes up to 10,000,000 shares of our
common stock for stock-based awards.
Administration
. The 2019 Plan is
administered by the Board of Directors or the committee or
committees as may be appointed by the Board of Directors from time
to time (the “Administrator”). The Administrator
determines the persons who are to receive awards, the types of
awards to be granted, the number of shares subject to each such
award and the terms and conditions of such awards. The
Administrator also has the authority to interpret the provisions of
the 2019 Plan and of any awards granted there under and to modify
awards granted under the 2019 Plan. The Administrator may not,
however, reduce the price of options or stock appreciation rights
issued under the 2019 Plan without prior approval of the
Company’s shareholders.
Eligibility
. The 2019 Plan provides
that awards may be granted to employees, officers, directors and
consultants of the Company or of any parent, subsidiary or other
affiliate of the Company as the Administrator may determine. A
person may be granted more than one award under the 2019
Plan.
Shares
that are subject to issuance upon exercise of an option under the
2019 Plan but cease to be subject to such option for any reason
(other than exercise of such option), and shares that are subject
to an award granted under the 2019 Plan but are forfeited or
repurchased by the Company at the original issue price, or that are
subject to an award that terminates without shares being issued,
will again be available for grant and issuance under the 2019
Plan.
Terms of Options and Stock Appreciation
Rights
. The Administrator determines many of the terms and
conditions of each option and SAR granted under the 2019 Plan,
including whether the option is to be an incentive stock option or
a non-qualified stock option, whether the SAR is a related SAR or a
freestanding SAR, the number of shares subject to each option or
SAR, and the exercise price of the option and the periods during
which the option or SAR may be exercised. Each option and SAR is
evidenced by a grant agreement in such form as the Administrator
approves and is subject to the following conditions (as described
in further detail in the 2019 Plan):
(a) Vesting
and Exercisability: Options, restricted shares and SARs become
vested and exercisable, as applicable, within such periods, or upon
such events, as determined by the Administrator in its discretion
and as set forth in the related grant agreement. The term of each
option is also set by the Administrator. However, a related SAR
will be exercisable at the time or times, and only to the extent,
that the option is exercisable and will not be transferable except
to the extent that the option is transferable. A freestanding SAR
will be exercisable as determined by the Administrator but in no
event after 10 years from the date of grant.
(b) Exercise
Price: Each grant agreement states the related option exercise
price, which, in the case of SARs, may not be less than 100% of the
fair market value of the Company’s shares of common stock on
the date of the grant. The exercise price of an incentive stock
option granted to a 10% stockholder may not be less than 110% of
the fair market value of shares of the Company’s common stock
on the date of grant.
(c) Method of
Exercise: The option exercise price is typically payable in cash,
common stock or a combination of cash of common stock, as
determined by the Administrator, but may also be payable, at the
discretion of the Administrator, in a number of other forms of
consideration.
(d) Recapitalization;
Change of Control: The number of shares subject to any award, and
the number of shares issuable under the 2019 Plan, are subject to
proportionate adjustment in the event of a stock dividend,
spin-off, split-up, recapitalization, merger, consolidation,
business combination or exchange of shares and the like. Except as
otherwise provided in any written agreement between the participant
and the Company in effect when a change in control occurs, in the
event an acquiring company does not assume plan awards (i) all
outstanding options and SARs shall become fully vested and
exercisable; (ii) for performance-based awards, all
performance goals or performance criteria shall be deemed achieved
at target levels and all other terms and conditions met, with award
payout prorated for the portion of the performance period completed
as of the change in control and payment to occur within 45 days of
the change in control; (iii) all restrictions and conditional
applicable to any restricted stock award shall lapse; (iv) all
restrictions and conditions applicable to any restricted stock
units shall lapse and payment shall be made within 45 days of the
change in control; and (v) all other awards shall be delivered
or paid within 45 days of the change in control.
(e) Other
Provisions: The option grant and exercise agreements authorized
under the 2019 Plan, which may be different for each option, may
contain such other provisions as the Administrator deems advisable,
including without limitation, (i) restrictions upon the
exercise of the option and (ii) a right of repurchase in favor
of the Company to repurchase unvested shares held by an optionee
upon termination of the optionee’s employment at the original
purchase price.
Amendment and Termination of the 2019
Plan
. The Administrator, to the extent permitted by law, and
with respect to any shares at the time not subject to awards, may
suspend or discontinue the 2019 Plan or amend the 2019 Plan in any
respect; provided that the Administrator may not, without approval
of the stockholders, amend the 2019 Plan in a manner that requires
stockholder approval.
68
2
020 Director
Compensation
We
currently do not have a formal non-employee director compensation
policy. However, in the event we have non-employee directors we
intend to reimburse them for their reasonable expenses incurred in
connection with attending our board of directors and committee
meetings, and we may in the future grant stock options and pay cash
compensation to those non-employee directors.
Limitation of Liability and Indemnification
Our
certificate of incorporation provides that we are authorized to
provide indemnification and advancement of expenses to our
directors, officers and other agents to the fullest extent
permitted by Delaware General Corporation Law.
In
addition, our certificate of incorporation limits the personal
liability of directors for breach of fiduciary duty to the maximum
extent permitted by the Delaware General Corporation Law and
provides that no director will have personal liability to us or to
our stockholders for monetary damages for breach of fiduciary duty
or other duty as a director. However, these provisions do not
eliminate or limit the liability of any of our directors
for:
●any
breach of the director’s duty of loyalty to the corporation
or its stockholders;
●any act or
omission not in good faith or that involves intentional misconduct
or a knowing violation of law;
●unlawful
payments of dividends or unlawful stock repurchases or redemptions;
or
●any
transaction from which the director derived an improper personal
benefit.
Any
amendment to or repeal of these provisions will not eliminate or
reduce the effect of these provisions in respect of any act,
omission or claim that occurred or arose prior to such amendment or
repeal. If the Delaware General Corporation Law is amended to
provide for further limitations on the personal liability of
directors of corporations, then the personal liability of our
directors will be further limited to the greatest extent permitted
by the Delaware General Corporation Law.
Our
certificate of incorporation also provides that we must indemnify
our directors and officers and we must advance expenses, including
attorneys’ fees, to our directors and officers in connection
with legal proceedings, subject to very limited
exceptions.
We
maintain a general liability insurance policy that covers certain
liabilities of our directors and officers arising out of claims
based on acts or omissions in their capacities as directors or
officers.
Compensation Committee Interlocks and Insider
Participation
None of
our officers currently serves, or has served during the last
completed fiscal year, on the compensation committee or board of
directors of any other entity that has one or more officers serving
as a member of our board of directors.
69
ITEM 12. SECURITY OWNERSHIP OF CERTAIN BENEFICIAL OWNERS AND
MANAGEMENT AND RELATED STOCKHOLDER MATTERS
The
following table sets forth, as of December 31, 2020, certain
information concerning the beneficial ownership of our capital
stock, including our common stock, and stock options as converted
into common stock basis, by:
●
each stockholder known by us to own beneficially 5% or more of any
class of our outstanding stock;
●
each director;
●
each named executive officer;
●
all of our executive officers and directors as a group;
and
●
each person, or group of affiliated persons, who is known by us to
beneficially own more than 5% of any class of our outstanding
stock.
The
column entitled “Percentage of Class” is based on
29,331,057 shares of common stock outstanding as of December 31,
2020. Beneficial ownership is determined in accordance with the
rules and regulations of the SEC and includes voting or investment
power with respect to our common stock. Shares of our common stock
subject to options that are currently exercisable or exercisable
within 60 days of December 31, 2020, are considered outstanding and
beneficially owned by the person holding the options for the
purpose of calculating the percentage ownership of that person but
not for the purpose of calculating the percentage ownership of any
other person. Except as otherwise noted, we believe the persons and
entities in this table have sole voting and investing power with
respect to all of the shares of our common stock beneficially owned
by them, subject to community property laws, where
applicable.
|
Name and Address(1)
|
Amount and Nature of Beneficial Ownership
|
Percentage of Class
|
|
Wayne
Tupuola
|
610,555
|
2.09
%
|
|
ICT
Investments, LLC (2)
|
28,132,170
|
96.11
%
|
|
Tatiana
Nikitina
|
250,000
|
0.85
%
|
|
Arnold
Bykov
|
277,777
|
0.95
%
|
|
Total
|
29,270,502
|
100.00
%
|
|
All
Officers and Directors as a Group
|
1,138,332
|
3.89
%
|
(1)
Unless otherwise indicated, the address of such individual is c/o
the Company.
(2)
Dmitriy Nikitin has voting control through his ownership of
all membership interests of ICT Investments, LLC.
70
ITEM 13. CERTAIN RELATIONSHIPS AND RELATED TRANSACTIONS, AND
DIRECTOR INDEPENDENCE
Since
the date of our incorporation on November 8, 2019, we have engaged
in the following transactions with our directors, executive
officers, holders of more than 5% of our voting securities, and
affiliates or immediately family members of our directors,
executive officers and holders of more than 5% of our voting
securities, and our co-founders. We believe that all of these
transactions were on terms as favorable as could have been obtained
from unrelated third parties.
In
January 2020, the Company issued a promissory note to ICT in the
principal amount of $439,990 bearing 6% annual interest with a
maturity date of January 31, 2023. This Note may be prepaid in
whole or in part. As of December 31st, 2020, the unpaid principal
amount of the Note was $181,330.
In
October 2020, the Company issued a second promissory note to ICT in
the principal amount of $745,438 bearing 6% annual interest with a
maturity date of December 31, 2023. This Note may be prepaid in
whole or in part. As of December 31st, 2020, the unpaid principal
amount of the Note was $689,926.
On
December 31, 2019, we purchased from ICT Investments certain sales
demonstration equipment valued at $495,150 which we will use in our
business in exchange for 2,616,316 shares of our common
stock.
During
the year 2020, ICT Investments made additional investments into the
Company, consisting of inventories, certain capital manufacturing
equipment, office and computer equipment, intangible assets
consisting of 3D engineering design documentation, manufacturing
database, customer relationship database with populated CRM, valued
in total at $$
4,786,
109
which we will use in our business in
exchange for 26,609,186 shares of our common stock.
We
initially entered into a sublease with ICT Investments, our largest
shareholder. In January 2020 we assumed the master lease from ICT
Investments and now pay a monthly lease payment of $14,377 to the
landlord.
Dmitriy
Nikitin is the Managing Partner of ICT Investments and also is a
promoter of the Company. Dmitriy Nikitin serves as a member of our
Board of Advisors. During the year of 2020 he received $75,218 as
cash compensation in that role.
Tatiana
Nikitina, in her role as Marketing Director, created our Marketing
Department, trained personnel and transitioned into a marketing
adviser role. She is the daughter of Dmitriy Nikitin. During the
year of 2020 she received $12,749 as cash compensation in that
role.
On
December 31, 2020, our President Wayne Tupuola received directly
from ICT Investments 555,555 shares as recognition of the
Company’s progress in 2020.
On
December 31, 2020, our Chief Equipment Design Engineer, Arnold
Bykov received directly from ICT Investments 277,777 shares of our
common stock in recognition of his contribution to the Company
through his new equipment designs in 2020.
71
Policies and Procedures for Related Person
Transactions
Our
board of directors has adopted written policies and procedures for
the review of any transaction, arrangement or relationship in which
we are a participant, the amount involved exceeds $120,000, and one
of our executive officers, directors, director nominees or 5%
stockholders (or their immediate family members), each of whom we
refer to as a “related person,” has a direct or
indirect material interest.
If a
related person proposes to enter into such a transaction,
arrangement or relationship, which we refer to as a “related
person transaction,” the related person must report the
proposed related person transaction to our chief legal officer or,
in the event we do not have a chief legal officer, to our principal
financial officer. The policy calls for the proposed related person
transaction to be reviewed and, if deemed appropriate, approved by
the audit committee of our board of directors. Whenever
practicable, the reporting, review and approval will occur prior to
entry into the transaction. If advance review and approval is not
practicable, the committee will review, and, in its discretion, may
ratify the related person transaction. The policy also permits the
chairman of the committee to review and, if deemed appropriate,
approve proposed related person transactions that arise between
committee meetings, subject to ratification by the committee at its
next meeting. Any related person transactions that are ongoing in
nature will be reviewed annually.
A
related person transaction reviewed under the policy will be
considered approved or ratified if it is authorized by the
committee after full disclosure of the related person’s
interest in the transaction. As appropriate for the circumstances,
the committee will review and consider:
●
the related person’s interest in the related person
transaction;
●
the approximate dollar value of the amount involved in the related
person transaction;
●
the approximate dollar value of the amount of the related
person’s interest in the transaction without regard to the
amount of any profit or loss;
●
whether the transaction was undertaken in the ordinary course of
our business;
●
whether the terms of the transaction are no less favorable to us
than terms that could have been reached with an unrelated third
party;
●
the purpose of, and the potential benefits to us of, the
transaction; and
●
any other information regarding the related person transaction or
the related person in the context of the proposed transaction that
would be material to investors in light of the circumstances of the
particular transaction.
The
committee may approve or ratify the transaction only if the
committee determines that, under all of the circumstances, the
transaction is not inconsistent with our best interests. The
committee may impose any conditions on the related person
transaction that it deems appropriate.
In
addition to the transactions that are excluded by the instructions
to the SEC’s related person transaction disclosure rule, our
board of directors has determined that the following transactions
do not create a material direct or indirect interest on behalf of
related persons and, therefore, are not related person transactions
for purposes of this policy:
●
interests arising solely from the related person’s position
as an executive officer of another entity (whether or not the
person is also a director of such entity), that is a participant in
the transaction, where (a) the related person and all other
related persons own in the aggregate less than a 10% equity
interest in such entity, (b) the related person and his or her
immediate family members are not involved in the negotiation of the
terms of the transaction and do not receive any special benefits as
a result of the transaction and (c) the amount involved in the
transaction equals less than the greater of $200,000 or 5% of the
annual consolidated gross revenues of the other entity that is a
party to the transaction; and
●
a transaction that is specifically contemplated by provisions of
our charter or by-laws.
The
policy provides that transactions involving compensation of
executive officers shall be reviewed and approved by the
compensation committee in the manner specified in its
charter.
Director Independence
We have
no member of our board of directors who is independent as defined
under NASDAQ Marketplace Rules.
There
are no family relationships among any of our directors or executive
officers.
72
ITEM 14. PRINCIPAL ACCOUNTING FEES AND SERVICES
Our
Board of Directors has approved BF Borgers CPA PC
(“BFG”) to continue as our independent registered
public accounting firm to audit our financial statements for the
fiscal year ending December 31, 2020.
During
the Company’s most recent fiscal years, neither we nor anyone
acting on our behalf consulted with BFG regarding either (i) the
application of accounting principles to a specified transaction,
either completed or proposed, or the type of audit opinion that
might be rendered on our financial statements, and neither a
written report nor oral advice was provided to the Company that BFG
concluded was an important factor considered by the Company in
reaching a decision as to the accounting, auditing or financial
reporting issue, or (ii) any matter that was either the subject of
a disagreement (as defined in Item 304(a)(1)(iv) of Regulation S-K
and the related instructions to Item 304 of Regulation S-K) or a
reportable event (as defined in Item 304(a)(1)(v) of Regulation
S-K).
Fees Paid to the Independent Registered Public Accounting
Firm
The
following table sets forth fees billed with respect to the years
ended December 31, 2020 and 2019:
|
|
2020
|
2019
|
|
Audit
Fees
|
$
14,000
|
$
6,000
|
|
Audit Related
Fees
|
4,195
|
0
|
|
Tax
fees
|
2,775
|
0
|
|
|
$
20,970
|
$
6,000
|
In
the above table, in accordance with the SEC’s definitions and
rules, “audit fees” are fees that Laser Photonics Corp
paid for professional services for the audit of our financial
statements included in our Form 10-K and for services that are
normally provided by the registered public accounting firm in
connection with statutory and regulatory filings or engagements;
“audit-related fees” are fees for assurance and related
services that are reasonably related to the performance of the
audit or review of our financial statements; and “tax
fees” are fees for tax compliance, tax advice and tax
planning.
Auditor Independence
In
our fiscal year ended December 31, 2020, there were no professional
services provided, other than those listed above, that would
require our Board of Directors to consider their compatibility with
maintaining the independence of BF Borgers CPA PC.
73
PART IV
ITEM 15. EXHIBITS AND FINANCIAL STATEMENTS
SCHEDULES
INDEX TO FINANCIAL STATEMENTS
|
|
(a)
|
Financial
Statements filed as part of this Form 10-K:
|
|
|
Laser
Photonics, Corporation December 31, 2020 and 2019 Audited
Financial Statements
|
|
||
|
|
|
||
|
Report
of Independent Registered Accounting Firm
|
|
||
|
|
|
||
|
Balance
Sheet
|
|
||
|
|
|
||
|
Statement of
Profit and Loss
|
|
||
|
|
|
||
|
Statement of
Liability and Stockholders’ Equity
|
|
||
|
|
|
||
|
Statement of Cash
Flows
|
|
||
|
|
|
||
|
Notes
to Financial Statements
|
|
||
(b) Exhibits.
See the
Exhibit Index immediately following the signature page to this
Annual Report on Form10-K.
74
SIGNATURES
Pursuant to the requirements of Section 13 or 15(d) of the
Securities Exchange Act of 1934, the registrant has duly caused
this report to be signed on its behalf by the undersigned,
thereunto duly authorized.
|
|
Laser Photonics Corporation
|
|
|
|
|
|
|
|
|
March
26, 2021
|
By:
|
/s/
Wayne
Tupuola
|
|
|
|
Name:
|
Wayne
Tupuola
|
|
|
|
Title:
|
Chief
Executive Officer
(Principal
Executive Officer and
Principal
Financial Officer)
|
|
P
OWERS OF ATTORNEY
Each person whose signature appears below constitutes and appoints
Wayne Tupuola as his true and lawful attorney-in-fact and agents,
with full power of substitution and re substitution, for him and in
his name, place and stead, in any and all capacities, to sign any
or all amendments to this Annual Report on Form 10-K, and to file
the same, with all exhibits thereto and other documents in
connection therewith, with the U.S. Securities and Exchange
Commission, granting unto said attorney-in-fact and agents full
power and authority to do and perform each and every act and thing
requisite and necessary to be done, as fully to all intents and
purposes as he might or could do in person, hereby ratifying and
confirming all that said attorneys-in-fact and agents or their
substitute or substitutes may lawfully do or cause to be done by
virtue hereof.
Pursuant to the requirements of the Securities Exchange Act of
1934, this report has been signed below by the following persons on
behalf of the registrant and in the capacities and on the dates
indicated.
|
|
Laser Photonics Corporation
|
|
|
|
|
|
|
|
|
|
By:
|
/s/ Wayne Tupuola
|
|
|
|
|
|
|
|
|
Name: Wayne Tupuola
|
|
|
|
|
Title: Chief Executive Officer and Principal Financial
Officer
|
|
|
|
|
March 26, 2021
|
|
|
|
|
|
|
|
|
|
By:
|
/s/ Tatiana Nikitina
|
|
|
|
|
|
|
|
|
Name: Tatiana Nikitina
|
|
|
|
|
Title: Director
|
|
|
|
|
March 26, 2021
|
|
|
|
|
|
|
|
|
|
By:
|
/s/ Arnold Bykov
|
|
|
|
|
|
|
|
|
Name: Arnold Bykov
|
|
|
|
|
Title: Director
|
|
|
|
|
March 26, 2021
|
|
|
|
|
|
|
|
75
EXHIBIT INDEX
|
Exhibit
|
|
Description
|
||
|
|
Certificate
of Incorporation of the Registrant
|
|||
|
|
|
|
||
|
|
Bylaws
of the Registrant
|
|||
|
|
|
|
||
|
|
Specimen
Stock Certificate evidencing the shares of Common
Stock
|
|||
|
|
|
|
||
|
|
Laser
Photonics Corporation 2019 Stock Incentive Plan
|
|||
|
|
|
|
||
|
|
Sublease
Agreement dated December 1, 2019 between Laser Photonics
Corporation and ICT Investments, LLC
|
|||
|
|
|
|
||
|
|
Exclusive
License Agreement dated January 2, 2020 between Laser Photonics
Corporation and ICT Investments, LLC
|
|||
|
|
|
|
||
|
|
Promissory
Note dated January 30, 2020 issued by Laser Photonics Corporation
to ICT Investments, LLC
|
|||
|
|
|
|
||
|
|
Code of
Ethics
|
|||
|
|
|
|
||
|
|
Certification
of Chief Executive Officer pursuant to Rule 13a-14(a) or 15d-14 of
the Securities Exchange Act of 1934
|
|||
|
|
|
|
||
|
|
Certification
of Chief Financial Officer pursuant to Rule 13a-14(a) or 15d-14 of
the Securities Exchange Act of 1934
|
|||
|
|
|
|
||
|
|
Section
1350 Certification of Chief Executive Officer and Chief Financial
Officer
|
|||
|
|
|
|
||
|
101.INS
|
|
Instance Document
|
||
|
101.SCH
|
|
XBRL Taxonomy Extension Schema Document
|
||
|
101.CAL
|
|
XBRL Taxonomy Extension Calculation Linkbase Document
|
||
|
101.DEF
|
|
XBRL Taxonomy Extension Definition Linkbase Document
|
||
|
101.LAB
|
|
XBRL Taxonomy Extension Label Linkbase Document
|
||
|
101.PRE
|
|
XBRL Taxonomy Extension Presentation Linkbase Document
|
||
*
Indicates management contract or compensatory plan
+
Incorporated by reference to the
Company's Form 10 filed with the Securities and Exchange Commission
on April 30, 2020
76
TABLE OF CONTENTS
Part IItem 1. BusinessItem 1A. Risk FactorsItem 1B. Unresolved Staff CommentsItem 2. PropertiesItem 3. Legal ProceedingsItem 4. Mine Safety DisclosuresPart IIItem 5. Market For Registrant's Common Equity, Related Stockholder Matters and Issuer Purchases Of Equity SecuritiesItem 6. Selected Financial DataItem 7. Management's Discussion and Analysis Of Financial Condition and Results Of OperationsItem 7A. Quantitative and Qualitative Disclosures About Market RiskItem 8. Financial Statements and Supplementary DataNote 1 Organization and Description Of BusinessNote 2 Summary Of Significant Accounting PoliciesNote 3 Related Party TransactionsNote 4 Stockholders Equity/deficitNote 5 Commitments and ContingenciesNote 6 AdvancesNote 7 Subsequent EventsNote 8 - Selected Quarterly Financial Data (unaudited)Item 9. Changes in and Disagreements with Accountants on Accounting and Financial DisclosureItem 9A. Controls and ProceduresItem 9B. Other InformationPart IIIItem 10. Directors, Executive Officers and Corporate GovernanceItem 11. Executive CompensationItem 12. Security Ownership Of Certain Beneficial Owners and Management and Related Stockholder MattersItem 13. Certain Relationships and Related Transactions, and Director IndependenceItem 14. Principal Accounting Fees and ServicesPart IVItem 15. Exhibits and Financial Statements Schedules