UNITED STATES
SECURITIES AND EXCHANGE COMMISSION
Washington, D.C. 20549
________________________________________________________
FORM 10-K
________________________________________________________
(Mark One)
x
ANNUAL
REPORT PURSUANT TO SECTION 13 OR 15 (d) OF THE SECURITIES EXCHANGE ACT OF 1934
For the
fiscal year ended
December 31, 2018
OR
¨
TRANSITION REPORT PURSUANT TO SECTION 13 OR 15(d) OF THE SECURITIES EXCHANGE ACT OF 1934
For the transition period from
to
Commission File Number 001-38462
________________________________________________________
NLIGHT, INC.
(Exact name of Registrant as specified in its charter)
________________________________________________________
|
Delaware
|
91-2066376
|
|
|
(State or other jurisdiction of
incorporation or organization)
|
(I.R.S. Employer
Identification Number)
|
|
|
5408 NE 88th Street, Building E
Vancouver, Washington 98665
|
||
|
(Address of principal executive office, including zip code)
|
||
|
(360) 566-4460
|
||
|
(Registrant’s telephone number, including area code)
|
||
|
Title of Each Class
|
Name of Exchange on Which Registered
|
|
|
Common Stock, $0.0001 par value
per share
|
The NASDAQ Stock Market LLC
(The NASDAQ Global Select Market)
|
|
|
Securities registered pursuant to Section 12(g) of the Act:
|
||
|
None
|
||
Indicate by check mark if the registrant is a well-known seasoned issuer, as defined in Rule 405 of the Securities Act. Yes
¨
No
x
Indicate by check mark if the registrant is not required to file reports pursuant to Section 13 or Section 15(d) of the Act. Yes
¨
No
x
Indicate by check mark whether the Registrant (1) has filed all reports required to be filed by Section 13 or 15(d) of the Securities Exchange Act of 1934 during the preceding 12 months (or for such shorter period that the Registrant was required to file such reports), and (2) has been subject to such filing requirements for the past 90 days. Yes
x
No
¨
Indicate by check mark whether the registrant has submitted electronically every Interactive Data File required to be submitted pursuant to Rule 405 of Regulation S-T (§232.405 of this chapter) during the preceding 12 months (or for such shorter period that the registrant was required to submit such files). Yes
x
No
¨
Indicate by check mark if disclosure of delinquent filers pursuant to Item 405 of Regulation S-K is not contained herein, and will not be contained, to the best of the registrant’s knowledge, in definitive proxy or information statements incorporated by reference in Part III of this Form 10-K or any amendment to this Form 10-K.
x
Indicate by check mark whether the registrant is a large accelerated filer, an accelerated filer, a non-accelerated filer, a smaller reporting company or an emerging growth company. See definition of “large accelerated filer,” “accelerated filer,” “smaller reporting company” and “emerging growth company” in Rule 12b-2 of the Exchange Act.
|
Large Accelerated Filer
|
o
|
Accelerated Filer
|
o
|
Non-Accelerated Filer
|
x
|
Smaller Reporting Company
|
o
|
|
Emerging Growth Company
|
x
|
||||||
If an emerging growth company, indicate by check mark if the registrant has elected not to use the extended transition period for complying with any new or revised financial accounting standards provided pursuant to Section 13(a) of the Exchange Act.
¨
Indicate by check mark whether the registrant is a shell company (as defined in Rule 12b-2 of the Exchange Act). Yes
¨
No
x
The aggregate market value of the voting and non-voting stock held by non-affiliates of the Registrant, based on the closing sale price of the Registrant’s common stock on the last business day of its most recently completed second fiscal quarter (June 30,
2018
), as reported on The NASDAQ Global Select Market, was approximately
$577.3 million
. Shares of common stock held by each executive officer and director and by each other person who may be deemed to be an affiliate of the Registrant, have been excluded from this computation. The determination of affiliate status for this purpose is not necessarily a conclusive determination for other purposes.
As of
March 8, 2019
, the Registrant had
36,748,860
shares of common stock outstanding.
DOCUMENTS INCORPORATED BY REFERENCE
Portions of the registrant's definitive Proxy Statement for the 2019 Annual Meeting of Stockholders are incorporated herein by reference in Part III of this Annual Report on Form 10-K to the extent stated herein. Such Proxy Statement will be filed with the Securities and Exchange Commission within 120 days of the registrant's fiscal year ended
December 31, 2018
.
|
TABLE OF CONTENTS
|
|
|
Page
|
|
3
SPECIAL NOTE REGARDING FORWARD-LOOKING STATEMENTS AND INDUSTRY DATA
This report, including the sections entitled “Business,” “Risk Factors,” and “Management’s Discussion and Analysis of Financial Condition and Results of Operations” and certain information incorporated by reference into this report contain forward-looking statements within the meaning of Section 27A of the Securities Act of 1933, as amended, and Section 21E of the Securities Exchange Act of 1934, as amended. In some cases, you can identify forward-looking statements by the following words: "ability," "anticipate," "attempt," "believe," "can be," "continue," "contemplate," "could," "depend," "enable," "estimate," "expect," "extend," "grow," "if," "intend," "likely," "may," "objective," "ongoing," "plan," "possible," "potential," "predict," "project," "propose," "rely," "should," "target," "will," "would" or the negative of these terms or other comparable terminology, although not all forward-looking statements contain these words.
Forward-looking statements in this report include, but are not limited to, statements about:
|
•
|
the size of our market opportunity;
|
|
•
|
our ability to compete effectively against other providers of similar products and services, as well as competing technologies;
|
|
•
|
applications and processes that will use lasers, including the suitability of our products;
|
|
•
|
our ability to develop new technology, designs and applications for our lasers;
|
|
•
|
the reduction in cost per brilliant watt and increase in power of semiconductor lasers going forward; the implementation of our business model and strategic plans, including estimates regarding future sales, revenues, expenses, capital requirements and stock performance;
|
|
•
|
our future financial performance;
|
|
•
|
fluctuations in our quarterly results of operations and other operating measures, particularly as a result of seasonality;
|
|
•
|
the regulatory regime for our products and services, domestically and internationally;
|
|
•
|
the adoption of our products or lasers generally and the growth of the laser market broadly and within specific industries;
|
|
•
|
our utilization of vertical integration;
|
|
•
|
our ability to adequately protect our intellectual property rights;
|
|
•
|
our ability to maintain and grow our relationships with our customers, including our foreign customers;
|
|
•
|
the effect on our business of litigation to which we are or may become a party;
|
|
•
|
our ability to maintain an effective system of internal controls necessary to accurately report our financial results and prevent fraud;
|
|
•
|
future macroeconomic conditions;
|
|
•
|
the sufficiency of our existing liquidity sources to meet our cash needs;
|
|
•
|
and our ability to sustain and manage growth in our business.
|
You should refer to the "Risk Factors" section of this report for a discussion of other important factors that may cause our actual results to differ materially from those expressed or implied by our forward-looking statements. As a result of these factors, we cannot assure you that the forward-looking statements in this report will prove to be accurate. In addition, statements that "we believe" and similar statements reflect our beliefs and opinions on the relevant subject. These statements are based upon information available to us as of the date of this report, which although we believe such information forms a reasonable basis for such statements, such information may be limited or incomplete, and our statements should not be read to indicate that we have conducted a thorough inquiry into, or review of, all potentially available relevant information. These statements are inherently uncertain and investors are cautioned not to unduly rely upon these statements. Furthermore, if our forward-looking statements prove to be inaccurate, the inaccuracy may be material. In light of the significant uncertainties in these forward-looking statements, you should not regard these statements as a representation or warranty by us or any other person that we will achieve our objectives and plans in any specified time frame, or at all. We undertake no obligation to publicly update any forward-looking statements, whether as a result of new information, future events or otherwise, except as required by law.
4
PART I
ITEM 1. BUSINESS
Overview
We are a leading provider of high-power semiconductor and fiber lasers. Our lasers are changing not only the way things are made but also the things that can be made. We design, develop and manufacture the critical elements of our lasers, and we believe our vertically integrated business model enables us to rapidly introduce innovative products, control our costs and protect our intellectual property. In 2018, we sold our products to over
350
customers worldwide in three primary markets: industrial, microfabrication, and aerospace and defense.
Our semiconductor lasers are the industry's most brilliant and serve as the core building block of all of our products. Our vertical integration enables us to incorporate our semiconductor lasers into our proprietary fiber lasers and also to sell our semiconductor lasers as standalone solutions. We offer differentiated high-power fiber lasers that provide our customers with significant advantages over legacy fiber lasers in the areas of programmability, serviceability and reliability. By engaging with our customers early in their system design cycle and utilizing our platform-based approach to product design, we are able to offer semiconductor and fiber laser solutions optimized to meet our customers' requirements.
Semiconductor and fiber lasers are displacing legacy lasers and non-laser energy sources across a wide range of applications in the industrial, microfabrication, and aerospace and defense markets. In the industrial market, high-power semiconductor and fiber lasers have enabled the creation of next-generation industrial systems to perform manufacturing processes such as cutting, welding and drilling, as well as advanced manufacturing techniques such as additive manufacturing. In the microfabrication market, many of the critical microscale features incorporated into products in the automotive, electronics, medical, semiconductor and other markets are made commercially viable by the precise power delivery of lasers. In the aerospace and defense market, high-power semiconductor and fiber lasers are currently used across a wide range of mission critical applications, such as defending aircraft against missiles, and are enabling next-generation defense systems.
The growth of the high-power fiber laser market has been driven by a significant reduction in cost per brilliant watt and a substantial increase in the power output of semiconductor lasers, at a rate that we believe is similar to Moore's Law for integrated circuits. Our global customers include Cincinnati Inc., DMG Mori, Han's Laser Technology Group Co. Ltd. and Suzhou Quick Laser Technology Co. in industrial, MKS Instruments and Samsung in microfabrication, and BAE and Raytheon in aerospace and defense.
We generated revenues of
$191.4 million
,
$138.6 million
and
$101.3 million
in
2018
,
2017
and
2016
, respectively. We had net income (loss) of
$13.9 million
,
$1.8 million
and
$(14.2) million
in
2018
,
2017
and
2016
, respectively. As of
December 31, 2018
, we had approximately
1,130
full-time employees worldwide. Our vertically integrated operations include a semiconductor laser manufacturing facility at our Vancouver, Washington headquarters, an optical fiber manufacturing facility in Lohja, Finland, and a laser packaging and assembly facilities in Vancouver, Washington, Hillsboro, Oregon and Shanghai, China. We were founded in 2000 and possess an intellectual property portfolio that included over
460
issued or pending patents as of
December 31, 2018
.
Industry Overview
Legacy Lasers
A laser converts electrical energy into optical energy, or light, that can be concentrated and shaped to create a powerful beam that can cut, manipulate, melt and vaporize materials. The two main parts of a laser are an energy source and a gain medium. Gas and crystal lasers, named for the materials used as the gain medium, were the initial types of lasers used in industrial applications. While gas and crystal lasers are an improvement over mechanical and other non-laser techniques for material processing, they have various deficiencies, which may include lower reliability, the need for costly cooling and more frequent maintenance, less desirable beam quality, energy inefficiency, and lack of programmability and serviceability.
5
Fiber Lasers
In a fiber laser, the gain medium is an optical fiber infused with rare earth elements, and the energy source is one or more semiconductor lasers. The term "semiconductor laser" can describe an individual semiconductor laser chip or a product that combines an array of such chips into a more powerful device, which is typically the approach used to build a fiber laser. Semiconductor lasers vary based upon the material used as the gain medium, the spectrum of light generated, the beam shape, the power yielded, the brilliance, as well as other characteristics. Substantial improvements in the power, brilliance, cost, reliability and efficiency of semiconductor lasers have been foundational to the improved performance and cost competitiveness of fiber lasers.
Power and brilliance are critical measures of laser performance. Both laser power and laser brilliance can vary dramatically. For example, a single semiconductor laser chip used in a handheld laser pointer generates a fraction of a watt of power, whereas high-power semiconductor laser chips used in a high-power fiber laser can generate as much as 20 watts of power per chip. The output power of a high-power fiber laser, using an array of high-power semiconductor lasers amplified via specialty fiber, can be thousands of watts, or kilowatts. Laser brilliance is a measure of how much power a laser generates over a given emission area and the rate of divergence of its beam. Therefore, two lasers emitting the same power but with different emission areas or beam divergences will have different levels of brilliance. Semiconductor laser brilliance is critical for scaling power in fiber lasers, as high-power fiber lasers require efficient aggregation of the output power of many semiconductor lasers into a single fiber.
Over the past few decades, the cost per brilliant watt produced by semiconductor lasers has fallen dramatically as a result of improved laser design and production techniques and increased production volumes. This has led to the rapid adoption of fiber lasers in a variety of markets. We believe a parallel can be drawn to the proliferation of integrated circuits as their processing power increased while the cost per transistor fell. This advancement is defined as Moore's Law, which is an observation that the number of transistors in an integrated circuit doubles approximately every two years.
Fiber lasers address many of the disadvantages of legacy gas and crystal lasers. Improvements in performance and cost of production over the last decade have fueled a dramatic expansion in the use of fiber lasers in a number of markets.
Advantages of fiber lasers over legacy gas and crystal lasers include:
|
•
|
Superior beam quality.
Fiber lasers can generate higher power, more precise and more stable output beams. This enables simpler and lower-cost beam delivery optics, higher performance for the laser process and better overall system reliability.
|
|
•
|
Superior flexibility.
The simplicity of the architecture of a fiber laser enables an end user to optimize the laser to the precise needs of a given application by adjusting beam power, frequency and shape.
|
|
•
|
Lower total cost of ownership.
Fiber lasers tend to be more durable, reliable, energy efficient, stable and tolerant of longer operating cycles than legacy lasers. Fiber lasers are generally less costly to operate and repair than legacy lasers, and require less regular maintenance. These characteristics can result in a lower total cost of fiber lasers relative to legacy lasers over their operating lifetimes.
|
|
•
|
Smaller size and easier operability.
Fiber lasers generally are smaller than legacy lasers and can be located remotely from the workpiece by virtue of a convenient beam delivery fiber, potentially simplifying the tool and facility requirements. Locating the laser system away from the workpiece alleviates factory floor congestion. Moreover, the flexibility and small size of the beam delivery fiber is more adaptable to the physical attributes of the surface being processed and can often reach areas of a surface that legacy systems cannot. Fiber lasers are also easier to operate, with fewer parts and a reduced need for physical adjustments by operators.
|
Our Advancements in High-Power Fiber Lasers
We believe our high-power fiber lasers offer significant advancements over legacy fiber lasers in terms of programmability, serviceability and reliability. These advantages are a function of our vertically integrated business model, proprietary semiconductor laser technology, unique high-power fiber laser architectures and advanced in-house manufacturing methods.
Programmability
We believe the programmability of our lasers is a distinctive feature that makes them well-suited for use with versatile, multi-function machine tools in a wide range of applications. The programmability of our lasers improves the materials processing speed and quality provided by the systems into which they are incorporated. Moreover, the programmability of our lasers enables our OEM customers to develop machine tools that can be utilized across multiple applications, thereby allowing end users to replace multiple tools inside a factory with a single, more flexible tool. Our Corona fiber lasers incorporate proprietary all-fiber technology that allows our customers to program the output beam spot size and shape, while retaining the full operating power of
6
the fiber laser, without the complexity, cost, or performance trade-offs that accompany other beam shaping methods. All our fiber lasers incorporate proprietary control hardware and software that provide end users with significant flexibility to optimize not only output power but also the optical waveform (temporal beam shape). These advantages allow our customers to program our laser via a simple interface that modifies different beam variables during its use in a production cycle to improve the throughput and quality of the processed parts.
Serviceability
Our fiber lasers are designed to be serviced quickly on site and by our customers. Most service activities can be completed without shipping the laser back to a repair depot and often without the need for our direct involvement. In contrast, end users operating machine tools built with legacy fiber lasers that require the machine tool manufacturer to coordinate the service activity with the laser provider can experience longer disruptions in their operations when the lasers need servicing. With legacy lasers and competing fiber lasers, a service activity necessitating the removal of the laser from the machine tool on the production floor and its transportation to a remote service depot for service and repair can lead to longer operational downtime. The architecture of our fiber lasers enables them to be serviced on site, generally in less than two hours, often eliminating the need for the end customers to have spare lasers in reserve. As a result, end users benefit from significantly higher production uptime, and our customers benefit by the ability to manage the end-user experience without having to rely upon a laser manufacturer representative for ongoing service.
Reliability
Our fiber lasers incorporate advanced components and proprietary designs that protect our lasers from operating conditions that can cause failures in legacy fiber lasers, thereby improving uptime and lowering total operating cost. Many manufacturing environments are hot, humid, dirty and crowded, characteristics that challenge older generations of fiber lasers which need external air conditioning to operate. For instance, even in extremely humid environments, our high-power fiber lasers do not require air conditioning, instead relying on a simple and inexpensive dry air purge to prevent condensation and inoperability. Historically, a failure mode for fiber lasers has been back reflection from reflective materials. Our fiber lasers incorporate proprietary back reflection suppression technology, improving their ability to process highly reflective materials used for next-generation automotive batteries, automotive parts, appliances and many other applications. Our fiber lasers are industry leaders in power stability. We consider the power stability of our fiber lasers to be a particularly important differentiator for advanced and emerging applications, such as additive manufacturing, and in the development of versatile multifunctional machine tools.
Our Market Opportunity
Industrial
The productivity, efficiency and versatility offered by high-power fiber lasers have been critical in making them a key part of the evolution of the industrial ecosystem. Material processing applications, the largest of which is cutting, and others such as welding, cladding, heat treating and additive manufacturing comprise the majority of the industrial laser market. High-power fiber lasers are rapidly replacing gas and other legacy lasers for cutting, due to their significantly faster speed, higher quality and lower cost when used across a wide range of metals. High-power fiber lasers also continue to take market share from non-laser cutting techniques, and are expanding into other applications such as cutting metal tubes and other three-dimensional parts.
The factors driving the utilization of high-power fiber lasers in metal welding applications, including increased speed, quality and cost, are similar to those that have fueled their adoption for metal cutting. Fiber laser welding can be done faster, with deeper penetration, less distortion and lower heat input than traditional methods like arc welding. These advantages have fueled adoption of high-power fiber lasers across the automotive industry where system productivity and versatility are critical. Other metal fabrication industries, such as aerospace, energy and light manufacturing, are also embracing the unique capabilities offered by high-power fiber lasers for welding applications as they seek improved production efficiencies and higher levels of industrial automation.
In addition to improving traditional manufacturing processes, fiber lasers are also enabling new applications such as metal additive manufacturing. High-power fiber lasers provide the precise power needed to fuse metal powders into intricate three-dimensional metal structures. Advancements in laser technology are also enabling manufacturers to produce ever-larger parts with more complex geometries at faster speeds and lower costs.
7
Microfabrication
Microfabrication refers to the process of creating three-dimensional microscale structures, typically by ablating, annealing, etching and drilling. Many of the microscale features incorporated into products in the automotive, electronics, medical, semiconductor and other markets are made commercially viable by the precise power delivery of lasers. Preferences for brighter, more vibrant displays in mobile phones, tablets and televisions, and the desire for thinner products with improved battery life and energy efficiency are placing greater importance on the need for components that are smaller, more robust and less expensive, which we believe will drive demand for lasers.
Aerospace and Defense
Lasers are used today in a variety of aerospace and defense applications, such as range finding, imaging and directed energy defense systems. Directed energy defense systems utilize concentrated electrical or optical energy rather than chemical or kinetic force as a means to incapacitate, damage, disable or destroy. Compared to conventional weapons, directed energy weapons using high-power fiber lasers offer ultra-precise targeting, low cost per use and a nearly unlimited magazine. Over the past decade, directed energy technologies have improved steadily, culminating in a series of successful demonstrations of significantly higher power, multi-kilowatt systems. Systems using high-power fiber lasers have shown the highest degree of operational viability.
Our Competitive Strengths
We believe the following strengths will allow us to maintain and extend our leadership position:
Innovative semiconductor laser technology.
We design and manufacture the industry's most brilliant semiconductor lasers. Our semiconductor lasers serve as the core building block of all of our solutions, and are incorporated into our fiber lasers. Our proprietary semiconductor laser architecture, from semiconductor laser chip through packaging, is designed to deliver high-performance, high-power and reliable solutions that can be optimized to end-user needs. We intend to continue to aggressively invest in the development of semiconductor laser technology to meet the evolving needs of our customers.
Differentiated high-power fiber laser technology.
Our high-power fiber lasers provide distinct advantages over other fiber lasers and legacy lasers. Our fiber lasers are programmable, serviceable and reliable. Our fiber lasers are programmable using a proprietary solution that allows our customers to program laser beam strength, size, shape, and real-time pulse timing to optimize the performance of their solution for specific applications. This programmability, along with the wide operating range of our lasers, enables our OEM customers to develop machine tools that can be utilized across multiple applications, thereby allowing end users to replace multiple tools inside a factory with a single, more flexible tool. We have designed our high-power fiber lasers to allow for expeditious and easy in-field serviceability. Intelligent sensors embedded in our fiber lasers provide our end users with real-time diagnostics and feedback. Our fiber lasers have been designed to operate dependably and stably in a wide range of harsh environments. Additionally, we have designed proprietary back reflection suppression technologies into our high-power fiber lasers, which allows for greater uptime.
Customizable high-power semiconductor and fiber laser solutions based on a scalable platform.
We offer a scalable platform that is enabled by our extensive library of proprietary semiconductor and fiber laser designs, packaging options and specialty optical fibers. While we sell standard products for many applications, we primarily target higher value, high-volume opportunities that require deep collaboration, solution customization and deep integration into our OEM customers' systems. As a result of our platform-based approach, we are able to quickly and simply configure solutions that are optimized to the particular requirements of our OEM customers. Our lasers are designed into systems with stringent specifications for quality, performance and reliability, and our lasers are often mission critical in these applications.
Vertically integrated business model.
We design, develop and manufacture the critical elements of our high-power semiconductor and fiber lasers, including semiconductor laser chips and optical fiber. Our control and execution of nearly all steps of the manufacturing process allow us to optimize product quality, protect our intellectual property, effectively manage costs and minimize queue time between each process step. We believe that being vertically integrated also enables us to sell at the level of integration our customers desire, at highly competitive price points and at attractive profit margins.
Strong relationships with our diverse customer base.
We partner with our customers in the early stages of their system design cycle and collaborate with them to develop high-power semiconductor and fiber laser solutions that meet their specific requirements. We believe our partnership-based approach creates a competitive advantage for us, as it has enabled us to create long-term relationships with our customers, many of which span over a decade. We sold our products to over
350
customers worldwide in
2018
and have shipped thousands of high-power fiber lasers. In addition, our U.S. based engineering team and
8
manufacturing facilities enable us to partner with U.S. aerospace and defense customers, as domestic operations are often critical in order to serve as a strategic supplier.
Proven engineering and executive team.
The universe of experienced engineers who can design and manufacture high-power semiconductor and fiber lasers is limited. We believe our team members include many of the world's foremost experts in the areas of semiconductor and fiber laser design and manufacturing, and have been involved in pioneering semiconductor laser design, including work at Bell Labs, Nortel Networks Corporation, SDL, Inc., Xerox PARC and other leading innovators prior to joining us. Complementing the depth of our technical staff is the breadth and experience of our senior management team. Members of our management team have honed their ability to lead technology-driven organizations in competitive industries through their previous experience at industry-leading companies such as Agilent Technologies, Inc., Avago Technologies, Coherent, Inc., JDS Uniphase Corporation, McKinsey & Company and Orbotech Ltd.
Our Strategy
Our objective is to be the leading provider of high-power semiconductor and fiber lasers to the industrial, microfabrication, and aerospace and defense markets and, in the future, to leverage our core competencies to expand into other markets with similar performance requirements. The key elements of our strategy are:
Increase sales.
We intend to leverage our leading position in high-power semiconductor and fiber lasers and our global footprint in key geographies to increase our sales. Continued displacement of legacy lasers and non-laser energy sources by high-power semiconductor and fiber lasers in a wide range of applications should enable us to increase sales from existing customers and to generate sales from new customers. We believe the quality and performance of our lasers and our innovative approach of tailoring our platform-based high-power semiconductor and fiber laser solutions to the specific needs of our customers will allow us to grow our market share.
Enable new applications.
Our innovations are making our semiconductor and fiber lasers more powerful, programmable, reliable and affordable, which is driving their adoption in existing applications as well as enabling new ones that were not previously commercially viable. For instance, the power, precision and programmability of our lasers are enabling a new class of additive manufacturing tools in the industrial market and are supporting commercialization of next-generation directed energy defense systems in the aerospace and defense market. We expect the continued improvement in the features, performance and total cost of ownership of our lasers will drive their adoption in an expanding array of applications and end markets.
Further reduce costs of our high-power semiconductor and fiber lasers.
We have a track record of reducing the cost of our high-power semiconductor and fiber lasers. We anticipate continuing to reduce the cost of our products by developing new semiconductor laser chips, semiconductor laser and fiber laser architectures, introducing new packaging technologies and increasing the use of automation in our manufacturing and packaging facilities.
Products
We design and manufacture a range of high-power semiconductor and fiber lasers. Our products are typically integrated into laser systems or manufacturing tools built by our customers.
Semiconductor Lasers
Our semiconductor lasers serve as the core building block of our products and are deeply integrated with our OEM customers' systems used in applications in the industrial, microfabrication, and aerospace and defense markets. We sell high-power semiconductor lasers with a broad range of power levels, wavelengths and output fiber sizes. Our semiconductor lasers offer the industry's highest brilliance, and we believe are among the industry's most reliable.
Fiber Lasers
We offer programmable, serviceable and reliable high-power fiber lasers primarily for use in industrial, microfabrication, and aerospace and defense applications. Our fiber lasers enable fast, high-quality and efficient processing of materials. The programmability and wide operating range of our fiber lasers makes them easy for our customers to use and expands their applicability. For example, in some cases, a single Corona fiber laser with the ability to program the size and shape of its output beam can take the place of several less-flexible lasers. We have also designed our fiber lasers to enable a tool integrator or end user to perform common field service activities on-site, which results in higher machine uptime, lower cost of ownership and an improved customer experience.
9
Summary of Key Products
The table below summarizes our products and associated applications and features.
|
Product Area
|
Product
Description
|
Representative
Applications
|
Representative Specifications
and Features
|
|
Semiconductors
Lasers
|
Semiconductor lasers and packages used for fiber laser pumping. solid-state laser pumping and direct material processing
|
Marking
Plastic welding
Medical
Electronics packaging
Display production
Aerospace and defense
|
Output power
(15W - 400W)
Wavelengths
(793 nm to 1550nm)
VBG wavelength stabilized
Fiber core sizes
(105um - 400 um)
|
|
Fiber Lasers
|
High-power fiber lasers typically integrated into OEM systems
|
Metal cutting
Metal welding
Additive manufacturing
Electronics packaging
Electric vehicle battery production
Directed energy
|
Scalable output power
(500W- 12kW)
All-fiber programmable beam shape and size
Advanced waveform generation
Modulation up to 100kHz
High reliability and stability
Minimal infrastructure requirements
Back reflection protection
Field serviceable by OEM
|
From time to time, we develop products to address specific applications for select customers that require custom integration of our semiconductor laser chip and advanced optical assemblies. By their nature, these are typically sole-source designs with long product cycles. We also sell active and passive specialty optical fiber to select customers.
Technology
We believe we have developed strong, defensible technologies essential to the design and manufacture of semiconductor laser chips, fiber-coupled semiconductor laser packages, optical fiber and fiber lasers.
The Importance of Laser Brilliance
Laser brilliance can be thought of as the measure of how efficiently photons are integrated to scale power in semiconductor lasers and fiber lasers. A brilliant laser is one that emits a high level of power relative to the surface area and rate of divergence of its beam, and by increasing the brilliance of a laser we are able to increase its power scaling capability efficiently and cost effectively. Increasing power by increasing brilliance is more challenging than simply increasing the emitting surface area of the laser due to high optical power densities. Our lasers can endure extraordinary optical power densities because of our proprietary passivation technique applied to the emitting facet of the laser chip, operating reliably for extended operating cycles and with long operating lifetimes.
10
Semiconductor Laser Chips
The core building block of our technology is a compound semiconductor laser chip manufactured from a gallium arsenide wafer. We have developed advanced metal-organic chemical vapor deposition processes that yield high-quality semiconductor material with low-defect density and high uniformity. We believe that our semiconductor laser chips offer industry-leading brilliance as a result of proprietary and trade-secret protected semiconductor laser chip design, laser cavity design and facet passivation.
Semiconductor Lasers
We patented our multiplexed single-chip architecture for high-power semiconductor laser packaging. Our experience with multiplexed single-chip architecture gives us a performance advantage in multiple critical categories, including power, brilliance, efficiency and reliability. Our extensive experience in optical alignment and package design enables us to overcome many complex thermal and beam stability challenges to produce highly reliable semiconductor lasers.
Optical Fiber
Our active optical fibers are used as the gain medium in which lasing or amplification of light occurs in our fiber lasers. Our active fibers consist of an inner core that is doped with rare-earth ions and an outer core of un-doped glass for guiding the power delivered from our semiconductor lasers.
We utilize a proprietary and patented process for making our fibers, which we call Direct Nanoparticle Deposition, or DND. We have been developing and improving our DND technology for more than a decade. Our DND process enables simultaneous, single-step deposition of all elements in the active fiber and provides high compositional uniformity and independent control of refractive-index and doping profiles. Our DND technology enables high doping concentration, which allows for higher power and efficiency and shorter fiber length.
Our passive optical fibers route and deliver the optical energy generated in our semiconductor lasers and fiber lasers. Our passive fibers are designed to match the optical guiding properties of our rare earth-doped fibers, enabling compatibility with and low-loss splicing of our active fiber within our fiber lasers.
Fiber Lasers
Our fiber lasers use an active fiber that is doped with a rare-earth element to amplify the light from multiple semiconductor laser chips into a much higher brilliance laser beam. The power available from our fiber lasers has increased significantly due to the increase in power of our semiconductor laser chips and advances in our multi-chip semiconductor laser architecture, our DND active fibers and our proprietary fiber laser architectures. We scale power by both combining the outputs of multiple fiber lasers and by increasing the output power of our individual fiber laser.
Our fiber lasers offer many features, including all-fiber programmable beam sizes and shapes, programmable waveforms, high-speed waveform modulation capabilities, hardware back-reflection suppression, operability in harsh environments, quick and easy serviceability and industry-leading power stability. The resulting performance and quality provide significant advantages over alternative laser and non-laser solutions for existing applications, and support the commercial feasibility of an increasing number of new applications. We intend to continue to aggressively advance our fiber laser, semiconductor laser and active fiber technologies to further improve our performance, programmability, serviceability and reliability advantages.
Research and Development
Our research and development team is comprised of experts in semiconductor physics, chemistry, material science, electrical engineering, optical engineering, and mechanical engineering. Our research and development activities include innovation of existing products that enhance performance at reduced cost, and the design of new products that address select market opportunities. While we seek to improve our products on all operating characteristics, we believe we lead the market in terms of semiconductor laser chip brilliance. We work closely with customers to develop products to meet customer application and performance needs, making our research and development efforts more efficient. We also benefit from our vertically integrated business model, as we are able to conduct design cycles more rapidly through control of the full production process.
We intend to continue our commitment to research and development and to introduce new products, solutions and complementary products that would allow us to maintain and strengthen our competitive position.
11
Intellectual Property
Our success depends in part upon our ability to protect our intellectual property. To accomplish this, we rely on a combination of intellectual property rights, including patents, copyrights, trademarks and trade secrets, as well as customary contractual protections with our customers, suppliers, employees and consultants that contribute to our material intellectual property.
As of
December 31, 2018
, we have
106
issued U.S. patents,
121
pending U.S. patents,
114
issued foreign patents,
60
pending foreign patents,
52
pending Patent Cooperation Treaty (PCT) patent applications, and
14
pending European Patent Office (EPO) patent applications covering elements of semiconductor and fiber laser manufacturing and design, optical, fiber and circuit design and waveguide design and fabrication. Our currently issued patents are set to expire from
2021
to
2037
.
Sales and Marketing
We market and sell our products to global OEMs primarily through our direct sales force located in the United States, China, South Korea, Germany and Finland. To supplement our direct sales team, we have contracts in place with several independent sales representatives and distributors in Asia and Europe. We selected these independent representatives and distributors based on their ability to provide effective field sales, marketing communications and technical support for select products and markets in target geographies. Our sales and marketing efforts are conducted through an integrated process that involves our direct sales force, Field Applications Engineers, or FAEs, customer service representatives and our senior management team.
Our FAEs work closely with our sales and engineering teams to provide product development support to our OEM customers. Through close collaboration, our FAEs develop deep relationships with our OEM customers, providing us with unique insight into their product roadmaps and allowing us to identify business opportunities at an early stage. Our integrated sales and marketing strategy enables us to be highly responsive and successful in navigating each customer's unique and oftentimes complex design qualification process.
We maintain customer support and field service staff in our major markets in the United States, Europe, China, South Korea, and India. We work closely with customers to service equipment and train customers to use and repair our products and explore additional applications for our technologies. We plan to expand our support and field service footprint, particularly in locations where business volume requires local service capabilities.
We sell to and support over
350
customers worldwide. A few customers drive a significant portion of our revenues. In the aggregate, our top
ten
customers accounted for approximately
56%
,
61%
and
60%
of our revenues in
2018
,
2017
and
2016
, respectively. Suzhou Quick Laser Technology Co., Ltd accounted for
13%
,
14%
and
11%
of our revenues for the years
2018
,
2017
and
2016
, respectively. In addition, Raytheon Company accounted for
10%
of our revenues in
2016
. No other customer accounted for
10%
or more of our revenues in
2018
,
2017
or
2016
.
Competition
The industries in which we operate have significant price and technological competition. We compete not only with companies providing semiconductor and fiber lasers, but with companies offering conventional laser or non-laser solutions for the applications we target. Some of our competitors are larger and have substantially greater financial, research and development, managerial, sales, service and marketing resources and larger installed customer bases than we do.
We compete with companies that offer fiber lasers and other lasers such as BWT Beijing Ltd., Coherent, Inc., II-VI Incorporated, IPG Photonics Corporation, Lumentum Holdings Inc., Maxphotonics Co., Ltd., Raycus Fiber Laser Technologies Co. Ltd. and Trumpf GmbH + Co. KG. We also compete with widely used non-laser production methods, such as plasma cutting, water-jet cutting and resistance welding.
Manufacturing, Sources of Supply and Raw Materials
We manufacture, package and test the critical elements of our high-power semiconductor and fiber lasers, including semiconductor laser chips and optical fiber in-house. Our vertically integrated business model enables us to control and protect our proprietary technologies and process knowledge, and ensures our supply of critical components. Controlling and executing nearly all steps of the manufacturing process provides us several advantages, including:
|
•
|
protection of our intellectual property;
|
|
•
|
ability to maintain high product quality;
|
|
•
|
accelerated production cycles, improving our delivery times and responsiveness to customer requests;
|
12
|
•
|
ability to rapidly integrate improvements into our manufacturing process; and
|
|
•
|
efficient management of production costs.
|
We outsource components and materials when we feel that a specific component, by itself, does not provide a sufficient competitive advantage to warrant investment in the capital and human resources necessary for its manufacture. We work with our suppliers in these situations to ensure consistent quality and delivery performance. In many cases, components are custom manufactured for us based on our proprietary specifications.
We manufacture our products in facilities in Vancouver, Washington, Hillsboro, Oregon, Lohja, Finland and Shanghai, China. We manufacture certain electrical-optical components in our Vancouver, Washington, Shanghai, China and Hillsboro, Oregon facilities. We maintain our fiber operations and manufacture fiber in Finland, where we are fully vertically integrated.
We purchase raw materials used to manufacture our products and other components, such as semiconductor wafer substrates, fiber laser chip packages, optics and other materials, from single or limited-source suppliers. We typically purchase our materials through purchase orders or agreed-upon terms and conditions and we do not have guaranteed supply arrangements with many of these suppliers. To mitigate raw material supply risks, we take a variety of actions such as second source qualification, accumulation of safety stock and vendor surveillance.
We believe our existing manufacturing facilities are adequate to meet current anticipated demand. If additional capacity is needed, we believe that such capacity will be available on commercially reasonable terms.
Backlog
Backlog consists of purchase orders for products that we expect to ship within the next twelve months. We had backlog of
$38.0 million
and
$44.6 million
as of
December 31, 2018
and
December 31, 2017
, respectively. Our backlog is not necessarily indicative of revenues for any specific future period due to possible order cancellations or deferrals, and shipping or acceptance delays.
Quality Assurance
Our products are mission critical to our customers, and the superior performance and reliability of our lasers is crucial to our competitive strategy. To ensure our products perform to the high standards that we and our customers demand, we have established rigorous quality assurance protocols that are compliant with state-of-the-art industry standards. Our Vancouver, Washington, Hillsboro, Oregon, Lohja, Finland, and Shanghai, China facilities are ISO 9001:2015 registered. Our team has the expertise in quality control, manufacturing and process engineering necessary to produce highly reliable products that consistently meet customer expectations.
Regulation
We are subject to significant regulation by local, state, federal and international laws in all jurisdictions in which we operate. Compliance to these requirements can be costly and time consuming. We believe that our operations, products, services and actions substantially comply with applicable regulations in all jurisdictions. However, the risk of non-compliance cannot be eliminated and therefore there is no assurance that future costs related to these regulations will not be incurred. There is also the possibility that regulations will be retroactively applied, interpreted or applied differently to our operations, products, services and actions which will require significant time and resources.
Lasers sold in the United States are classified as Laser Products under the applicable rules and regulations of the Center for Devices and Radiological Health, or CDRH, of the U.S. Food and Drug Administration. CDRH regulations require a self-certification procedure pursuant to which a manufacturer must submit a filing to the CDRH with respect to each product incorporating a laser device, make periodic reports of sales and purchases and comply with product labeling standards, product safety and design features and informational requirements. Outside of the United States, most countries reference the International IEC60825-1 standard in their regulations, and our products are classified as Class 4. Our products are registered with the CDRH, but it is the responsibility of our customers to certify their product to CDRH and IEC60825 requirements.
Environmental
Our products contain hazardous substances that are subject to various federal, state, local and international laws governing environmental health and safety, including those relating to the purchase, transportation, storage, use, disposal, land-usage and human exposure. We believe that our operations are in compliance in all material respects with all applicable environmental laws
13
and regulations, including reporting requirements. In addition, we have put in place a wide range of safety training and internal controls regarding the handling of such hazardous substances.
Occupational Health and Safety
All of our operations are also subject to regulation by local, state, federal and international worker health and safety laws in all jurisdictions in which we operate. For instance, in the United States, we are required to comply with the Occupational Safety and Health Administration regulations and the applicable, more stringent Oregon and Washington requirements. Typical safety hazards are in the areas of laser, electrical and hazardous materials, whereas health hazards tend to be related to hazardous materials and ergonomics. We have designed controls and engage in continual improvement programs in order to better address these risks.
Export
Certain products of ours are subject to the Export Administration Regulations, administered by the Department of Commerce, Bureau of Industry Security, which require that we obtain an export license before we can export products or technology to specified countries. Additionally, some of our products are subject to International Traffic in Arms Regulations, a United States regulatory regime to restrict and control the export of defense and military related technologies to safeguard U.S. national security and further U.S. foreign policy objectives. Other products of ours are controlled by similar laws in other jurisdictions. We maintain an export compliance program staffed by dedicated personnel under which we screen export transactions against current lists of restricted exports, destinations and end users with the objective of carefully managing export-related decisions and transactions and shipping logistics and ensuring compliance with these rules. We believe we have obtained all export licenses required for our shipments subject to these regulations.
Employees
As of
December 31, 2018
we had a total of
1,130
full-time employees worldwide. Of our total full-time employees at our facilities, approximately
570
were in the United States,
500
were in China and
60
were in the rest of the world. In Finland, certain employees belong to labor unions for their specialty. There are no labor unions to which our employees belong in any other location. We have not experienced any work stoppages at any of our facilities. We consider our relationship with our employees to be good.
Corporate Information
We were incorporated under the name nLight Corporation in Washington in June 2000. We reincorporated in Delaware under the name nLight Photonics Corporation in August 2000 and changed our name to nLIGHT, Inc. in January 2016. Our principal executive office is located at 5408 Northeast 88th Street, Building E, Vancouver, Washington 98665. Our telephone number is (360) 566-4460. Our website address is www.nlight.net.
Where You Can Find Additional Information
We make available free of charge through our investor relations website, http://investors.nlight.net/IR, our annual reports, quarterly reports, current reports, proxy statements and all amendments to those reports as soon as reasonably practicable after such material is electronically filed or furnished with the SEC. In addition, the SEC maintains an Internet site that contains reports, proxy and information statements, and other information regarding reports that we file or furnish electronically with them at www.sec.gov. The information contained on the websites referenced in this Form 10-K is not incorporated by reference into this filing. Further, our references to website URLs are intended to be inactive textual references only.
ITEM 1A. RISK FACTORS
You should carefully consider the following risk factors, in addition to the other information contained in this report, including the section captioned “Management’s Discussion and Analysis of Financial Condition and Results of Operations” and our consolidated financial statements and related notes. This report also contains forward-looking statements that involve risks and uncertainties. Our actual results could differ materially from those anticipated in the forward-looking statements as a result of factors that are described below and elsewhere in this report.
14
Risks Related to Our Business and Industry
Our revenue growth rate in recent periods may not be indicative of our future performance.
In recent periods, we have experienced substantial levels of revenue growth. However, our historical revenue growth rate may not be indicative of future growth, and we may not achieve similar revenue growth rates in future periods. You should not rely on our revenues for any prior quarterly or annual periods as an indication of our future revenues or revenue growth. Our results of operations may vary as a result of a number of factors, including our ability to execute on our business strategy and expand our manufacturing capacity, the general economic conditions and the legal and regulatory environment in the United States, China and globally, as well as other factors that are outside of our control.
Downturns in the markets we serve could materially adversely affect our revenues and profitability.
Our results of operations may vary based on the impact of changes in the industries we serve or in the global economy. A large portion of our revenue growth of our business substantially depends on demand for our products in the industrial and microfabrication markets. For our products sold to the industrial market, we believe demand is largely based on general economic conditions, primarily in China and North America. Adverse changes in the global economy have occurred and may occur in the future as a result of declining or flat global or regional economic conditions, fluctuations in currency and commodity prices, trade restrictions or impositions of new tariffs, wavering confidence, unemployment, declines in stock markets, contraction of credit availability or other factors affecting economic conditions generally. We cannot predict the timing, strength or duration of any economic slowdown or recovery, whether global, regional or within specific markets.
For the microfabrication market, a portion of our revenues depends in part on the demand for our products from semiconductor equipment companies. The semiconductor equipment market has historically been characterized by sudden and severe cyclical variations in product supply and demand, which have often severely affected the demand for manufacturing equipment, including laser-based tools and systems. The timing, severity and duration of these market cycles are difficult to predict, which limits our ability to predict our business prospects and financial results in this market and we may not be able to respond effectively to these cycles.
During industry downturns in the past, our revenues from this market declined suddenly and significantly, and this is likely to occur again in the event of industry downturns in the future.
We have a history of losses, and as our operating costs increase we may not be able to generate sufficient revenues to achieve or maintain profitability in the future.
Although we have been profitable in the years ended December 31, 2017 and 2018, we have incurred net losses each year since our inception in 2000 through 2016, and only first became profitable in 2017. We had net income (loss) of
$13.9 million
,
$1.8 million
and
$(14.2) million
for the
years ended December 31, 2018
,
2017
and
2016
, respectively. We had an accumulated deficit of
$104.7 million
as of
December 31, 2018
.
We expect our operating costs to continue to increase in future periods as we expend substantial financial and other resources on, among other things, business and headcount expansion in operations, sales and marketing, research and development, and administration as a public company. These expenditures may not result in additional revenues or the growth of our business. If we fail to continue to grow revenues or to sustain profitability while our operating costs increase, our business, financial condition, results of operations and growth prospects will be materially adversely affected.
We have high levels of fixed costs and inventory levels that may materially adversely affect our gross profits and results of operations in the event that demand for our products declines or we maintain excess inventory levels.
We conduct our own manufacturing operations and have a high fixed cost base, including significant costs for the employees in our manufacturing operations. We may not be able to adjust our production levels or fixed costs quickly enough or sufficiently to adapt to rapidly changing market conditions. Gross profit, in absolute dollars and as a percentage of revenues, is impacted by our volumes, product sales mix, the corresponding absorption of fixed manufacturing overhead expenses, production costs and manufacturing yields. In addition, because we design and manufacture our key components, insufficient demand for our products will subject us to the risks of high inventory carrying costs and increased inventory obsolescence. If our capacity and production levels are not properly sized in relation to expected demand, we may need to record write-downs for excess or obsolete inventory. For example, we typically increase our inventory levels in the period leading up to Chinese New Year, which occurs during our first fiscal quarter, in anticipation of increased sales to our Chinese customers after completion of the holiday. If these anticipated sales do not occur, we may need to record write-downs for excess inventory.
15
The markets for our products are highly competitive. If we fail to compete successfully, our business, financial condition, results of operations and growth prospects will be materially adversely affected.
The industries in which we operate have significant price and technological competition. We compete not only with companies providing semiconductor and fiber lasers, but with companies offering conventional laser or non-laser solutions for the applications we target. Some of our competitors are larger and have substantially greater manufacturing, financial and research and development resources and larger installed customer bases than we do. Some of these competitors may receive substantial government subsidies allowing them to compete more aggressively. Certain of these competitors also have higher sales volume than we do, which can enable such competitors to lower the prices of their products. To compete, we may be forced to lower our prices, which could negatively impact our revenues and gross margins. For example, during the second half of 2018 certain of our competitors have substantially reduced the price of their fiber lasers sold in the China market. In some instances, we have reduced the price of our fiber lasers sold in China. It is unclear whether our competitors' price reductions will continue for the foreseeable future; however, the recent decline in the selling price of certain of our current fiber laser product offerings could negatively affect our near-term results of operations. Consolidation in our industry could intensify the competitive pressures that we face. Our competitors worldwide include BWT Beijing Ltd., Coherent, Inc., II-VI Incorporated, IPG Photonics Corporation, Lumentum Holdings Inc., Maxphotonics Co., Ltd., Raycus Fiber Laser Technologies Co. Ltd. and Trumpf GmbH + Co. KG.
We also compete with widely used non-laser production methods, such as plasma cutting, water-jet cutting and resistance welding. We believe that competition will be particularly intense from makers of CO2, YAG and disc lasers, as makers of these laser solutions may lower their prices in order to maintain market share and have committed significant research and development resources to pursue opportunities related to these technologies. If manufacturers of these non-laser and legacy laser solutions offer significantly lower prices than we do for our products, customers may choose to purchase their products instead of ours, despite any technical or performance advantage our products may offer.
Our OEM customers' internal production of laser technologies presents additional competitive pressure. To the extent our OEM customers move towards using such in-house technologies, we may need to lower our prices to remain competitive, otherwise our market share and revenues may be materially adversely affected.
To be competitive, we believe that we will be required to continue to invest significantly in research and development and manufacturing facilities. We may not have sufficient resources to continue to make these investments and we may not be able to make the technological advances or price adjustments necessary to compete successfully. Any failure to compete successfully will materially adversely affect our business, financial condition, results of operations and growth prospects.
Our inability to manage risks associated with our international customers and operations could materially adversely affect our business.
Approximately
63%
of our revenues were to customers outside of North America for the year ended
December 31, 2018
. We anticipate that foreign revenues, particularly revenues from Asia, will continue to account for a significant portion of our revenues in the foreseeable future. Our products are sold in over
30
countries. Our principal markets outside of North America include China, Japan, South Korea, India, and other Asian countries, Germany and other European countries. Our primary offices outside of the United States are in Lohja, Finland, Shanghai, China and Seoul, South Korea. We have substantial tangible assets outside of the United States, particularly in China and Finland.
Our foreign operations and revenues are subject to a number of risks, including the impact of recessions and other economic conditions in economies outside the United States, unexpected changes in regulatory requirements, certification requirements, environmental regulations, reduced protection for intellectual property rights in some countries, potentially adverse tax consequences, political and economic instability, import/export regulations, tariffs and trade barriers, compliance with applicable United States and foreign anti-corruption laws, cultural and management differences, reliance in some jurisdictions on third-party revenues from channel partners, preference for locally produced products and shipping, other logistics complications and longer accounts receivable collection periods.
Our business could also be impacted by international conflicts, terrorist and military activity, civil unrest and pandemic illness which could cause a slowdown in customer orders, cause customer order cancellations or negatively impact availability of supplies or limit our ability to timely service our installed base of products. Political, economic and monetary instability and changes in governmental regulations or policies, including trade tariffs and protectionism, could materially adversely affect both our ability to effectively operate our foreign offices and the ability of our foreign suppliers to supply us with required materials or services. Any interruption or delay in the supply of our required components, products, materials or services, or our inability to obtain these components, materials, products or services from alternate sources at acceptable prices and within a reasonable amount of time, could impair our ability to meet scheduled product deliveries to our customers and could cause customers to cancel orders.
16
Our failure to manage the foregoing risks associated with our operations in Finland, China and South Korea and our other existing and potential future international business operations could materially adversely affect our business, financial condition, results of operations and growth prospects.
We have substantial sales and operations in China, which exposes us to risks inherent in doing business there.
Our business operations in China and our sales to Chinese customers are critical to our success. As of
December 31, 2018
, we had approximately
500
employees at our Shanghai facility where we have high-volume manufacturing, fiber laser assembly and sales operations. Moreover, for the year ended
December 31, 2018
, approximately
37%
of our revenues were derived from China. As a result, downturns in the Chinese economy could materially adversely affect our results of operations. The Chinese economy differs from the economies of other developed countries in many respects, including the level of government involvement, level of development, growth rate and control of foreign exchange and allocation of resources. The Chinese economy has been transitioning from a planned economy to a more market-oriented economy. Despite reforms, the government continues to exercise significant control over China's economic growth by way of the allocation of resources, control over foreign currency-denominated obligations and monetary policy and provision of preferential treatment to particular industries or companies. We cannot predict the future economic policies of the Chinese government or their effect on the regional or global economy and we cannot predict other governments' economic policies toward China. For example, the United States and China have imposed a number of tariffs and other restrictions on items imported or exported between the United States and China, and have proposed to impose a number of additional tariffs. These or other events may lead to a significant reduction in demand for our products, which could materially adversely affect our results of operations.
The political, legal and regulatory climate in China, both nationally and regionally, is fluid and unpredictable, and operating in China exposes us to political and legal risks. Our ability to operate in China may be materially adversely affected by changes in Chinese laws and regulations such as those related to, among other things, taxation, import and export tariffs, environmental regulations, land use rights, intellectual property, currency controls, network security, employee benefits and overtime policies and other matters. Our operations in China are subject to numerous laws, regulations, rules and specifications relating to human health and safety and the environment. Applicable laws, rules and regulations often lack clarity and it is difficult to predict how any of these laws, rules and regulations will be enforced. If we or our employees or agents violate, or are alleged to have violated, any of these laws, rules and regulations, we or our employees could be subject to civil or criminal penalties, damages or fines, or our employees or agents could be detained, imprisoned or prevented from entering China, any of which could materially adversely affect our results of operations.
Potential tariffs or a global trade war could increase the cost of our products, which could adversely impact the competitiveness of our products and our financial results.
The United States Government has recently imposed new or higher tariffs on specified products imported from China to penalize China for what it characterizes as unfair trade practices and China has responded by imposing new or higher tariffs on specified products imported from the United States. On September 17, 2018, the Office of the United States Trade Representative finalized List 3 under Section 301 of the Trade Act of 1974 resulting in the imposition of an additional 10% tariff on specified products from China. In response, China has imposed additional tariffs on a number of U.S. goods. Based on our analysis of the tariff changes, we expect that the new tariffs will have a direct impact on our operations and financial results, as we maintain a significant portion of our operations, sales, and manufacturing in China. While there is uncertainty as to the duration of the tariffs or potential future increases, and we are actively taking remedial actions to minimize the financial impact, the additional tariffs may materially increase the cost of our raw materials and finished goods, and may negatively impact our margins as we may not be able to pass on the additional cost through increasing the prices of our products. Proposed tariffs may cause the depreciation of the RMB currency and a contraction of certain industries that will likely be affected by the proposed tariffs, including the industrial fiber laser market. As such, there may be potential decrease in the spending powers of our Chinese customers which may lead to fewer business opportunities and our operation may be negatively impacted. In addition, future actions or escalations by either the United States or China that affect trade relations may cause global economic uncertainty and potentially have a negative impact on our business and we cannot provide any assurances as to whether such actions will occur or the form that they may take.
Our manufacturing capacity and operations may not be appropriate for future levels of demand and may materially adversely affect our gross margins.
When market demand increases, we must be able to rapidly and effectively increase our manufacturing capacity to meet increases in customer demand, and if we fail to do so we may lose business to our competitors and our relationships with our customers may be harmed. To maintain our competitive position and to meet anticipated demand for our products, we have invested significantly in the expansion and automation of our manufacturing and operations throughout the world and may continue to do so in the future. If the demand for our products does not increase or if our revenues decrease from current levels, we may have
17
significant excess manufacturing capacity and under-absorption of our fixed costs, which could in turn materially adversely affect our gross margins and profitability.
In connection with any expansion, we may incur cost overruns, construction delays, labor difficulties or regulatory issues which could cause our capital expenditures to be higher than what we currently anticipate, possibly by a material amount, which would in turn adversely impact our results of operations. Expansion activities can also cause disruptions to existing manufacturing capabilities. Moreover, we may experience higher costs due to yield loss, production inefficiencies and equipment problems until any operational issues associated with the addition of new equipment or opening of new manufacturing facilities are resolved.
We rely on a small number of customers for a significant portion of our revenues, and if we lose any of these customers or they significantly curtail their purchases of our products, our results of operations could be materially adversely affected.
We rely on a few customers for a significant portion of our revenues. In the aggregate, our top
ten
customers accounted for approximately
56%
,
61%
and
60%
of our revenues during the
years ended December 31, 2018
,
2017
and
2016
, respectively. Suzhou Quick Laser Technology Co., Ltd accounted for
13%
,
14%
and
11%
of our revenues for the
years ended December 31, 2018
,
2017
and
2016
, respectively. In addition, Raytheon Company accounted for
10%
of our revenues in
2016
. We generally do not enter into long-term purchase agreements with our customers obligating them to purchase our products. Our business is characterized by short-term purchase orders issued by our customers, which are likely to be favorable to those customers. If any of our principal customers discontinues its relationship with us, develops its own products instead of using ours, replaces us as a vendor for certain products or suffers downturns in its business resulting in a cancellation of orders or an inability to place new orders, then our business, financial condition, results of operations and growth prospects could be materially adversely affected.
If we are unable to protect our proprietary technology and intellectual property rights, our competitive position could be harmed and our results of operations could be materially adversely affected.
Our success depends in part upon our ability to obtain, maintain and enforce patents, trade secrets, trademarks and other intellectual property rights and to operate without infringing on or otherwise violating the proprietary rights of others or having third parties infringe, misappropriate or circumvent the rights we own or license. We rely on a variety of intellectual property rights, including patents, copyrights, trademarks, trade secrets, technical know-how and other unpatented proprietary information to protect our products, product development and manufacturing activities from unauthorized copying by third parties.
Our patents do not cover all of our technologies, systems, products and product components and our competitors or others may design around our patented technologies. Some of our know-how or technology is not patented or patentable and may constitute trade secrets. To protect our trade secrets, we have a policy of requiring our employees, consultants, advisors and other collaborators who contribute to our material intellectual property to enter into confidentiality agreements. We also rely on customary contractual protections with our suppliers and customers, and we implement security measures intended to protect our trade secrets, know-how or other proprietary information. However, we cannot guarantee we have entered into appropriate agreements with all parties that have had access to our trade secrets, know-how or other proprietary information. We also cannot assure you that those agreements will provide meaningful protection for our trade secrets, know-how or other proprietary information in the event of any unauthorized use or disclosure. Our trade secrets, know-how or other proprietary information could be obtained by third parties as a result of breaches of our physical or electronic security systems or our suppliers, employees or consultants could assert rights to our intellectual property.
We have significant international operations and we are subject to foreign laws which differ in many respects from U.S. laws. Effective intellectual property protection may be unavailable or more limited in foreign jurisdictions in which we operate, such as China, relative to those protections available in the United States. Although we typically enter into confidentiality agreements with our employees who contribute to our material intellectual property to protect our proprietary information, our ability to enforce such agreements in foreign jurisdictions is uncertain. In the past, certain of our employees have been hired by our competitors. These former employees are contractually prohibited from misappropriating our confidential information, including trade secrets; however, we cannot be certain that such contractual obligations will be honored. While we monitor our competitors' activities for evidence of infringement of our proprietary rights, we cannot be certain that such infringement will be detected. If we pursue litigation to assert our intellectual property rights, an adverse decision in any legal action could limit our ability to assert our intellectual property rights, limit the value of our technology or otherwise materially adversely affect our business, financial condition or results of operations.
Monitoring unauthorized use of our intellectual property is difficult and costly. Unauthorized use of our intellectual property may have already occurred or may occur in the future. The steps that we take to acquire ownership of our employees' inventions and trade secrets in foreign countries may not have been effective under all such local laws, which could expose us to potential claims or the inability to protect intellectual property developed by our employees. Furthermore, any changes in, or unexpected interpretations of, the trade secret and other intellectual property laws in any country in which we operate may materially adversely affect our ability to enforce our trade secret and intellectual property positions. Our failure to identify unauthorized use
18
or otherwise adequately protect our intellectual property could jeopardize our competitive advantage and materially adversely affect our business. Moreover, any litigation in connection with unauthorized use of our intellectual property could be time consuming, and we could be forced to incur significant costs and divert our attention and the efforts of our employees, which could, in turn, result in lower revenues and higher expenses, and we may not be successful in enforcing our intellectual property rights.
Intellectual property claims could result in costly litigation and harm our business.
There has been significant litigation involving intellectual property rights in many technology-based industries, including our own. We continue to face risks and uncertainties in connection with any patent litigation, including the risk that patents issued to others may harm our ability to do business; that there could be existing patents of which we are unaware that could be pertinent to our business; and that it is not possible for us to know whether there are patent applications pending that our products might infringe upon, since patent applications often are not disclosed until a patent is issued or published. Moreover, the frequency with which new patents are granted and the diversity of jurisdictions in which they are granted make it impractical and expensive for us to monitor all patents that may be relevant to our business.
From time to time, we have been notified of allegations and claims that we may be infringing patents or otherwise violating intellectual property rights owned by third parties. In the future, we may be a party to litigation as a result of an alleged infringement, misappropriation, or other violation of others' intellectual property, whether through direct claims or by way of indemnification claims of our customers or suppliers. If any pending or future intellectual property-related litigation proceedings result in an adverse outcome then we could be required to:
|
•
|
cease the manufacture, use or sale of the infringing products, processes or technology;
|
|
•
|
pay substantial damages for infringement;
|
|
•
|
expend significant resources to develop non-infringing products, processes or technology;
|
|
•
|
license technology from the party claiming infringement, which license may not be available on commercially reasonable terms, or at all;
|
|
•
|
cross-license our technology to a competitor to resolve an infringement claim, which could weaken our ability to compete with that competitor; or
|
|
•
|
pay substantial damages to our direct or indirect customers to cause our end users to discontinue their use of, or replace, infringing products with non-infringing products.
|
In addition, intellectual property lawsuits can be brought by third parties against our customers and end-users that incorporate our products into their systems or processes. Because we generally indemnify customers against third-party infringement claims relating to our products, we may incur liabilities in connection with lawsuits against our customers. Any such lawsuits, whether or not they have merit, could be time-consuming to defend, damage our reputation and result in substantial and unanticipated costs.
Having to defend any such lawsuits, and any adverse consequences that might arise, could materially adversely affect our business, financial condition, results of operations and growth prospects.
If we are unable to develop new products, applications and end markets for our high-performance lasers and increase our market share in existing applications, our business, financial condition, results of operations and growth prospects will be materially adversely affected.
Any future success will depend in part on our ability to continue to generate sales of semiconductor lasers and fiber lasers in applications where legacy lasers have been used, or in new and developing markets and applications for lasers where they have not been used previously. As semiconductor and fiber lasers reach higher levels of penetration in core materials processing applications, the development of new applications, end markets and products outside our core applications becomes more important to our growth.
Our current and potential customers may have substantial investment in, and know-how related to, their existing laser and non-laser technologies. They may perceive risks relating to the reliability, quality, usefulness and profitability of integrating semiconductor lasers or fiber lasers in their systems when compared to other laser or non-laser technologies available in the market or that they manufacture themselves. Although we believe that semiconductor lasers and fiber lasers generally exhibit superior performance compared to other lasers or tools, customers may be reluctant to change from incumbent suppliers or cease using their own solutions, or we may miss the design and procurement cycles of our customers. Many of our target markets, such as industrial and aerospace and defense, have historically been slow to adopt new technologies. These markets often require long testing and qualification periods or lengthy government approval processes before adopting new technologies.
19
Introduction of new products and product enhancements will require that we effectively transfer production processes from research and development to manufacturing and coordinate our efforts with those of our suppliers to achieve increased production volume rapidly. If we are unable to implement our strategy to develop new applications and end markets for our products or develop new products, our business, financial condition, results of operations and growth prospects could be materially adversely affected. In addition, any newly developed or enhanced products may not achieve market acceptance or may be rendered obsolete or less competitive by the introduction of new products by other companies.
Fluctuations in our quarterly results of operations may increase the volatility of our stock price and may be difficult to predict.
We have experienced, and expect to continue to experience, fluctuations in our quarterly results of operations. We believe that fluctuations in quarterly results may cause the market price of our common stock to increase or decrease, perhaps substantially. In addition, we experience seasonality in our results of operations typically impacted by lower demand from our Chinese customers during Chinese New Year. Factors which have had or may in the future have an influence on our results of operations in a particular quarter include:
|
•
|
the increase, decrease, cancellation or rescheduling of significant customer orders;
|
|
•
|
declines in selling prices for our products;
|
|
•
|
delays in our product-shipment timing, customer or end-user sales or deployment cycles, or work performed under development contracts;
|
|
•
|
seasonality attributable to different purchasing patterns and levels of activity throughout the year in the areas where we operate;
|
|
•
|
the timing of revenue recognition based on the installation or acceptance of certain products shipped to our customers;
|
|
•
|
timing variability in product introductions, enhancements, services and technologies by us and our competitors and market acceptance of these new or enhanced products, services and technologies;
|
|
•
|
our ability to obtain export licenses for our products on a timely basis or at all;
|
|
•
|
changes in tariffs imposed by U.S. and foreign governments;
|
|
•
|
the rate at which our present and future customers and end users adopt our technologies;
|
|
•
|
the gain or loss of a key customer;
|
|
•
|
product or customer mix;
|
|
•
|
competitive pricing pressures and new market entrants;
|
|
•
|
our ability to design, manufacture and introduce new products on a cost-effective and timely basis;
|
|
•
|
our ability to manage our inventory levels and any write-downs for excess or obsolete inventory;
|
|
•
|
our ability to collect outstanding accounts receivable balances;
|
|
•
|
changes in the amount and timing of our operating costs, including those related to the expansion of our business, operations and infrastructure;
|
|
•
|
impairment of values for goodwill, intangibles and other long-lived assets;
|
|
•
|
different capital expenditure and budget cycles for our customers, which affect the timing of their spending;
|
|
•
|
foreign currency fluctuations; and
|
|
•
|
changes in jurisdictional income mix and tax rules and regulations in countries where we operate;
|
|
•
|
economic and market conditions in a particular geography or country;
|
A substantial portion of our operating expenses are fixed for the short-term, and as a result, fluctuations in revenues or unanticipated expenses can have a material and immediate impact on our profitability. In addition, we often recognize a substantial portion of our revenues in the last month of each fiscal quarter. Our expenses for any given quarter are typically based on expected revenues, and if revenues are below expectations in any given quarter, the adverse impact of the shortfall on our results of operations may be magnified by our inability to adjust spending quickly enough to compensate for the shortfall. We also base our manufacturing on our forecasted product mix for the quarter. If the actual product mix varies significantly from our forecast, we may not be able to fill some orders during that quarter, which would result in delays in the shipment of our products. Accordingly, variations in timing of sales, particularly for our higher priced, higher margin products, can cause significant fluctuations in quarterly results of operations.
Due to these and other factors, particularly varying product mix from quarter to quarter, we believe that quarter-to-quarter and year-to-year comparisons of our historical results of operations may not be meaningful. You should not rely on our results for any quarter or year as an indication of our future performance. Our results of operations in future quarters and years may be below public market analysts' or investors' expectations, which would likely cause the price of our stock to fall, perhaps significantly. In addition, over the past several years, U.S. and global equity markets have experienced significant price and volume fluctuations that have affected the stock prices of many technology companies both in and outside our industry. There has not always been a direct correlation between this volatility and the performance of particular companies subject to these stock price fluctuations. These factors, as well as general economic and political conditions or investors' concerns regarding the credibility of corporate financial statements, may materially adversely affect the market price of our stock in the future.
20
Products in the laser industry are experiencing declining average selling prices, and any future success depends in part on our ability to increase our volumes and decrease our costs to offset potential declines in the average selling prices of our products.
Products in the laser industries generally, and our products specifically, are experiencing and may in the future continue to experience a significant decline in average selling prices, or ASPs, on maturing products as a result of increased competition and price pressures from customers. As competing products become more widely available, the ASPs of our products may decrease. Due to the fixed cost of production, the average cost per unit of our products typically declines as our production volumes rise. For this reason, we may decide to offer products at ASPs that result in low initial gross margins to us with an intention to drive sales and production volumes higher, in turn lowering our average cost per unit. Because of these factors, we have experienced and we may continue to experience fluctuations in our results of operations on a quarterly or annual basis. If the ASPs of our products decline and we are unable to increase our unit volumes, introduce new or enhanced products with higher ASPs or reduce manufacturing costs to offset anticipated decreases in the prices of our existing products, our gross margins could decline, which in turn could materially adversely affect our business, financial condition, results of operations and growth prospects.
We participate in markets that are subject to rapid technological change and require significant research and development expenses to develop and maintain products that are able to achieve market acceptance.
The markets for our products are characterized by rapid technological change, frequent product introductions, substantial capital investment, volatility of product supply and demand, changing customer requirements and evolving industry standards. Our future performance will depend in part on the successful development, introduction and market acceptance of new and enhanced products that address these changes as well as current and potential customer requirements. We expect that new technologies will emerge as competition and our customers' need for higher and more cost-effective tools increase. The introduction of new and enhanced products may cause our customers to defer or cancel orders for existing products. To the extent customers defer or cancel orders for existing products due to a slowdown in demand or in the expectation of a new product release, or if there is any delay in development or introduction of our new products or enhancements of our products, our business, financial condition, results of operations and growth prospects would be materially adversely affected. We also may not be able to develop the underlying core technologies necessary to create new products and enhancements, or to license these technologies from third parties. Product development delays may result from numerous factors, including:
|
•
|
changing product specifications and customer requirements;
|
|
•
|
unanticipated engineering complexities;
|
|
•
|
expense reduction measures we have implemented, and others we may implement, to conserve our cash and attempt to sustain profitability;
|
|
•
|
difficulties in hiring and retaining necessary technical personnel;
|
|
•
|
difficulties in reallocating engineering resources and overcoming resource limitations; and
|
|
•
|
changing market or competitive product requirements.
|
The development of new, technologically advanced products is a complex and uncertain process that requires the accurate prediction of technological and market trends, as well as the investment of significant research and development expenses. Further, we typically invest substantial resources in advance of material sales of our products to our customers. Our research and development costs were
$21.1 million
for the year ended
December 31, 2018
. We cannot assure you that our expenditures for research and development will result in the introduction of new products or, if such products are introduced, that those products will achieve sufficient market acceptance or generate revenues to offset the costs of development. Ramping of production capacity also entails risks of delays which can limit our ability to realize the full benefit of the new product introduction. We cannot assure you that we will be able to identify, develop, manufacture, market or support new or enhanced products successfully, if at all, or on a timely basis. Further, we cannot assure you that our new products will gain market acceptance or that we will be able to respond effectively to product announcements by competitors, technological changes or emerging industry standards. Many of these factors are beyond our control. Any failure to respond to technological change would materially adversely affect our business, financial condition, results of operations and growth prospects.
Additionally, our product offerings may become obsolete given the frequent introduction of alternative technologies. In the event either our customers or our products fail to gain and maintain market acceptance, it would likely materially adversely affect our business, financial condition, results of operations and growth prospects.
Reliance on customers in the aerospace and defense industry for a significant portion of our revenues could materially adversely affect our business, financial condition, results of operations and growth prospects.
For the year ended
December 31, 2018
, we derived approximately
18%
of our revenues from customers in the aerospace and defense industry. From time to time, we have experienced declining aerospace and defense-related revenues. The aerospace and defense market is largely dependent upon government budgets, in particular defense budgets, which are driven by numerous factors, including geopolitical events, macroeconomic conditions and the ability of the U.S. government to enact relevant legislation.
21
As a result, our future revenues are subject in part to the uncertainties of governmental budgeting and appropriations and national defense policies and priorities, constraints of the budgetary process and timing and potential changes to these policies and priorities. Future spending levels are subject to a wide range of outcomes, depending on Congressional action, all of which are beyond our control. Moreover, no assurance can be given that an increase in defense spending will be allocated to programs that would benefit our business.
Many of our customers in the defense industry are subcontractors that must negotiate our proposals with the U.S. government. Our continuing relationship and the ability of these customers to pay for our products is dependent on the U.S. government's decision to accept or reject our customers' terms, which can be delayed for a substantial period of time and is largely outside of our control. Such delays could result in decreased revenues and could materially adversely harm our results of operations in any given period.
Our agreements with the U.S. government and suppliers to the U.S. government subject us to unique risks.
We must comply with and are affected by laws and regulations relating to the award, administration and performance of U.S. government contracts. The U.S. government contracting party may require us to increase production of certain solutions sold to the U.S. government due to changes in U.S. national security strategy and/or priorities or other reasons, in which case we may be required to decrease production of other products or sales to other customers to meet the requirements of the U.S. government. In addition, the U.S. government routinely retains rights to intellectual property developed in connection with a government contract. The U.S. government could exercise these rights in certain circumstances in the future, which could have the effect of decreasing the benefit we are able to realize commercially from such intellectual property.
U.S. government agencies, including the Defense Contract Audit Agency, the Defense Contract Management Agency and various agency Inspectors General, routinely audit and investigate government contractors. These agencies review a contractor's performance under its contracts, its cost structure, its business systems and compliance with applicable laws, regulations and standards. The U.S. government has the ability to decrease or withhold certain payments when it deems systems subject to its review to be inadequate. Additionally, any costs found to be misclassified may be subject to repayment. We have unaudited and unsettled incurred cost claims related to past years, which places risk on our ability to issue final billings on contracts for which authorized and appropriated funds may be expiring.
If an audit or investigation uncovers improper or illegal activities, we may be subject to civil or criminal penalties and administrative sanctions, including reductions of the value of contracts, contract modifications or terminations, forfeiture of profits, suspension of payments, penalties, fines and suspension, or prohibition from doing business with the U.S. government. In addition, we could suffer serious reputational harm if allegations of impropriety were made against us. Similar government oversight exists in most other countries where we conduct business. Any such imposition of penalties, or the loss of such government contracts, could materially adversely affect our business, financial condition, results of operations and growth prospects.
We are exposed to foreign currency risk, which may materially adversely affect our revenues, cost of revenues and operating margins and could result in exchange losses.
We conduct our business and incur costs in the local currency of most countries in which we operate. For the year ended
December 31, 2018
, our revenues outside North America represented approximately
63%
of our revenues. We incur currency transaction risk whenever one or more of our operating subsidiaries enter into a transaction using currencies different than their functional currency. Changes in exchange rates can also affect our results of operations when the value of revenues and expenses of foreign subsidiaries are translated to U.S. dollars. We do not actively hedge our foreign currency exposure and we cannot accurately predict the impact of future exchange rate fluctuations on our results of operations. Further, given the volatility of exchange rates, we may not be able to effectively manage our currency risks, and any volatility in currency exchange rates may increase the price of our products in local currency to our foreign customers or increase the manufacturing cost of our products, which could decrease demand for our products in such markets. Any of the foregoing could materially adversely affect our business, financial condition, results of operations and growth prospects.
The long sales cycles for our products may cause us to incur significant expenses without offsetting revenues.
Our products represent a large investment for our customers and they typically expend significant effort in evaluating, testing and qualifying our products before making a decision to purchase them, resulting in a lengthy initial sales cycle. While our customers are evaluating our products and before they place an order with us, we may incur substantial sales and marketing and research and development expenses to customize our products to the customers’ needs. We may also expend significant management efforts, increase manufacturing capacity and order long lead-time components or materials prior to receiving an order. Even after this evaluation process, a potential customer may not purchase our products. As a result, these long sales cycles may cause us to incur significant expenses without receiving revenues to offset such expenses soon thereafter or at all. This, in turn, can materially adversely affect our business, financial condition, our results of operations and growth prospects.
22
Because we lack long-term purchase commitments from our customers, our revenues can be difficult to predict, which could lead to excess or obsolete inventory and materially adversely affect our results of operations.
We generally do not enter into long-term agreements with our customers obligating them to purchase our products. Our business is characterized by short-term purchase orders and shipment schedules and, in some cases, orders may be canceled or delayed without penalty. As a result, it is difficult to forecast our revenues and to determine the appropriate levels of inventory required to meet future demand. This could lead to increased inventory levels and increased carrying costs and risk of excess or obsolete inventory due to unanticipated reductions in purchases by our customers. Write-downs have been recorded as a result of changes in demand or uncertainties related to the recoverability of the value of inventories due to technological and product changes. If we are unable to accurately forecast the demand for our products, fail to accurately forecast the timing of such demand, or are unable to consistently negotiate acceptable purchase order terms with customers, we could incur significant expenses, and our business, financial condition, results of operations and growth prospects may be materially adversely affected.
If we fail to effectively manage our growth or, alternatively, our spending during downturns, our business could be disrupted, which could materially adversely affect our results of operations.
Growth in revenues, combined with the challenges of managing geographically dispersed operations, can place a significant strain on our management systems and resources, and our anticipated growth in future operations could continue to place such a strain. The failure to effectively manage our growth could disrupt our business and materially adversely affect our results of operations. Our ability to successfully offer our products and implement our business plan in evolving markets requires an effective planning and management process. Even if executed successfully, our expansion may not deliver the anticipated increase in revenues and other benefits to compensate for the expenses incurred. This could materially adversely affect our business, financial condition, results of operations and growth prospects. In economic downturns, we must effectively manage our spending and operations to ensure that our competitive position during the downturn, as well as our future opportunities when the economy improves, remains intact. The failure to effectively manage our spending and operations could disrupt our business and materially adversely affect our results of operations.
Our estimates of market opportunity and forecasts of market growth may prove to be inaccurate, and even if the market in which we compete achieves the forecasted growth, our business could fail to grow at similar rates, if at all.
Our market opportunity estimates and growth forecasts are subject to significant uncertainty and are based on assumptions and estimates that may not prove to be accurate. Similarly, our estimates regarding the continued reduction in cost per brilliant watt and increase in power output of semiconductor lasers is based on assumptions and prior experience, and may not continue at the same rate, which could materially adversely affect the growth of high-power fiber lasers generally, and our growth specifically. Even if the markets in which we compete meet our size estimates and growth forecasts, and even if semiconductor lasers continue to become less expensive and more powerful, our business could fail to grow for a variety of reasons, which would adversely affect our results of operations.
We depend upon internal production and on outside single or limited-source suppliers for many of our key components and raw materials, including cutting-edge optics and materials. Any interruption in the supply of these key components and raw materials could materially adversely affect our business, financial condition, results of operations and growth prospects.
We rely exclusively on our own production capabilities to manufacture certain of our key components, such as semiconductor lasers, specialty optical fibers and optical components. Certain of our components, such as our semiconductor lasers, which are manufactured at our Vancouver, Washington facility, and our active fibers, which are manufactured at our Lohja, Finland facility, rely on processes and equipment that cannot be easily moved or replaced. If our manufacturing activities were obstructed or hampered significantly at these, or our other facilities, it could take a considerable length of time, at an increased cost, for us to resume manufacturing, which could materially harm our business and results of operations.
Also, we purchase certain raw materials and components, which are key elements to manufacture our products, from single- or limited-source suppliers. We generally do not have guaranteed supply arrangements with our suppliers. Some of our suppliers are relatively small private companies that may discontinue their operations at any time and may be particularly susceptible to prevailing economic conditions. Some of our suppliers are also our competitors. Our key suppliers may not have the ability to increase their production in line with our customers' demands. This can become acute during times of high growth in our customers' businesses. As a result, we experienced, and may in the future experience, longer lead times or delays in fulfillment of our orders. Furthermore, other than our current suppliers, there may be a limited number of entities from which we could obtain these supplies. We do not anticipate that we would be able to purchase these materials that we require in a short period of time or at the same cost from other sources in commercial quantities or that have our required performance specifications. In addition, if quality issues arise with these outsourced materials and go undetected by us, the use of such defective materials in our products could compromise their quality and harm our reputation.
23
For certain long lead-time supplies or in order to lock in pricing, we may be obligated to place purchase orders which are not cancelable or otherwise assume liability for a large amount of the ordered supplies, which limits our ability to adjust down our inventory liability in the event of market downturns or other customer cancellations or rescheduling of their purchase orders for our products. Some of our products require designs and specifications which are at the cutting-edge of available technologies. Our and our customers' designs and specifications frequently change to meet rapidly evolving market demands. Accordingly, certain of our products require components and supplies which may be technologically difficult and unpredictable to manufacture. By their very nature, these types of components may only be available by a single supplier. These characteristics place further pressure on the timely delivery of such components. Any interruption or delay in the supply of any of these components or materials, or the inability to obtain these components and materials from alternate sources at acceptable prices and within a reasonable amount of time, could materially adversely affect our ability to meet customer orders. If our suppliers face financial or other difficulties, do not maintain sufficient inventory on hand or if there are significant changes in demand for the components and materials we obtain from them, they could limit the availability of these components and materials to us. Any of the foregoing could materially adversely affect our business, financial condition, results of operations and growth prospects.
We depend on our OEM customers and system integrators to incorporate our products into their systems.
Our revenues depend in part on our ability to maintain existing and secure new OEM customers. Our revenues also depend in part upon the ability of our current and potential OEM customers and system integrators to incorporate our products into their systems, and to sell such systems successfully. The commercial success of these systems depends to a substantial degree on the efforts of these OEM customers and system integrators to develop and market products that incorporate our technologies. Relationships and experience with traditional laser makers, limited marketing resources, reluctance to invest in research and development and other factors affecting these OEM customers and third-party system integrators could have a substantial impact upon demand for our products, and in turn upon our revenues and financial results. If OEM customers or integrators are not able to adapt existing tools or develop new systems to take advantage of the features and benefits of lasers, or if they perceive us to be an actual or potential competitor, then the opportunities to expand our revenues and increase our margins may be severely limited or delayed. In addition, some of our OEM customers are developing their own laser sources. If they are successful, this may reduce our revenues from these customers.
Failure to effectively maintain and expand our field service and support organization could materially adversely affect our business, financial condition, results of operations and growth prospects.
It is important for us to provide rapid, responsive service directly to our customers throughout the world and to maintain and expand our own personnel resources to provide these services. Any actual or perceived lack of adequate field service in the locations where we sell or try to sell our products may negatively impact our sales efforts and, consequently, our revenues. This requires us to recruit and train additional qualified field service and support personnel as well as maintain effective and highly trained organizations that can provide service to our customers in various countries. We may not be able to attract and train additional qualified personnel to expand our direct support operations successfully, in a cost-effective manner or at all. We also may not be able to find and engage additional qualified third-party resources to supplement and enhance our direct support operations. Further, we may incur significantly higher costs in providing these field and support services if competition for or unavailability of these services is limited. Failure to implement and manage our support operation effectively could materially adversely affect our relationships with our customers, as well as our business, financial condition, results of operations and growth prospects.
Our products could contain defects, which may reduce sales of those products, harm market acceptance of our high-performance laser products or result in claims against us.
The manufacture of our high-performance lasers involves highly complex and precise processes. Despite testing by us and our customers, errors have been found in our products and may be found in the future. In addition, some of our products are combined with products from other vendors, which may contain defects. As a result, should problems occur, it may be difficult to identify the source of the problem. Our products are typically sold with warranty provisions that require us to remedy deficiencies in quality or performance over a specified period of time at no cost to our customers. Reserves for estimated warranty claims are recorded during the period of sale. The determination of such reserves requires us to make estimates of failure rates and expected costs to repair or replace the products under warranty. We typically establish warranty reserves based on historical warranty costs for each product line. If actual return rates and/or repair and replacement costs differ significantly from our estimates, adjustments to cost of revenues may be required in future periods, which could materially adversely affect our results of operations. These defects may cause us to incur significant warranty, support and repair costs, incur additional costs related to a recall, divert the attention of our engineering personnel from our product development efforts and harm our relationships with our customers. These problems could result in, among other things, loss of revenues or a delay in revenue recognition, loss of market share, harm to our reputation or a delay or loss of market acceptance of our laser products. Defects, integration issues or other performance problems in our products could also result in personal injury or financial or other damages to our customers, which in turn could damage
24
market acceptance of our products. Our customers could also seek damages from us for their losses. A product liability claim brought against us, even if unsuccessful, could be time-consuming and costly to defend, and could harm our reputation. We cannot assure investors that our product liability insurance would adequately protect our assets from the financial impact of defending a product liability claim. Any product liability claim brought against us, with or without merit, could increase our product liability insurance rates or prevent us from securing insurance coverage in the future.
We may experience lower than expected manufacturing yields, which would adversely affect our gross margins.
The manufacture of semiconductor lasers and their packaging is a highly complex process. Manufacturers often encounter difficulties in achieving acceptable product yields from laser and packaging operations. We have from time to time experienced lower than anticipated manufacturing yields for our lasers. If we do not achieve planned yields, our product costs could increase, resulting in lower gross margins, and key component availability would decrease, which could result in delays in fulfilling customer orders or rolling out new product lines.
A breach of our information technology and security systems could materially adversely affect our business.
We use information technology and security systems to maintain our facility's physical security and to protect our proprietary and confidential information, including that of our customers, suppliers and employees. Accidental or willful security breaches or other unauthorized access to our facilities or information systems, or viruses, loggers, or other malfeasant code in our data or software, could compromise this information. The consequences of such loss and possible misuse of our proprietary and confidential information could include, among other things, unfavorable publicity, damage to our reputation, difficulty marketing our products, customer allegations of breach-of-contract, litigation by affected parties and possible financial liabilities for damages, any of which could materially adversely affect our business, financial condition, reputation and relationships with customers and partners. We also rely on a number of third-party "cloud-based" providers of corporate infrastructure services relating to, among other things, human resources, electronic communication services and some financial functions, and we are therefore dependent on the security systems of these providers. Any security breaches or other unauthorized access to our service-providers' systems or viruses, loggers or other malfeasant code in their data or software could expose us to information loss and misappropriation of confidential information. Because the techniques used to obtain unauthorized access to or sabotage security systems change frequently and are often not recognized until after an attack, we may be unable to anticipate the techniques or implement adequate preventative measures, thereby exposing us to material adverse effects on our business, financial condition, results of operations and growth prospects.
Our business could be materially adversely affected if one or more members of our executive management team or key personnel departed.
Any future success is substantially dependent on the continued contributions of our executive officers, including Scott Keeney, our chairman of the board, president and chief executive officer. We are also dependent on key technologists, and other key engineering, sales, marketing, manufacturing and support personnel, any of whom may leave, which could harm our business and reputation in the market. Our business requires engineering staff with experience in several disciplines, including semiconductor physics, chemistry, material science, electrical engineering, optical engineering, and mechanical engineering. We will need to continue to recruit and retain highly skilled engineers for certain functions.
Any future success also depends in part on our ability to identify, attract, hire, train, retain and motivate highly skilled research and development, managerial, operations, sales, marketing and customer service personnel. We are continually recruiting such personnel. However, competition for such personnel can be strong and we can provide no assurance that we will be successful in attracting or retaining such personnel now or in the future. In addition, particularly in the high-technology industry, the value of stock options, restricted stock units, grants or other share-based compensation is an important element in the retention of employees. Declines in the value of our common stock could materially adversely affect our ability to retain employees and we may have to take additional steps to make the equity component of our compensation packages more appealing to attract and retain employees. These steps could result in dilution to stockholders.
If we fail to attract, integrate and retain the necessary personnel, our ability to extend and maintain our scientific expertise and grow our business could suffer significantly. The loss of any key employee, the failure of any key employee to adequately perform in his or her current position, our inability to attract, train and retain skilled employees as needed or the inability of our key employees to expand, train and manage our employee base as needed, could materially adversely affect our business, financial condition, results of operations and growth prospects.
25
We are subject to regulatory compliance requirements, including Section 404 of the Sarbanes-Oxley Act of 2002. If we fail to maintain an effective system of internal controls then we may not be able to accurately report our consolidated financial results or prevent fraud.
We are subject to the SEC's rules implementing Sections 302 and 404 of the Sarbanes-Oxley Act, which require management to certify financial and other information in our quarterly and annual reports and provide, beginning with our second annual report on Form 10-K, an annual management report on the effectiveness of internal controls over financial reporting. However, our independent registered public accounting firm will not be required to report on the effectiveness of our internal control over financial reporting pursuant to Section 404 of the Sarbanes-Oxley Act until the later of the year following our first annual report to be filed with the SEC, or the date we are no longer an "emerging growth company" as defined in the JOBS Act if we take advantage of the exemptions contained in the JOBS Act. Effective internal controls are necessary for us to provide reliable financial reports and prevent fraud. Section 404 compliance will divert resources and take significant time and effort to complete, and our compliance costs will correspondingly increase. We may be unable to successfully complete the procedures and certification and attestation requirements of Section 404 in a timely manner. In addition, the Sarbanes-Oxley Act requirements may be modified, supplemented or amended from time to time. Implementing the changes may take significant time and may require additional employee compliance training. We or our independent registered public accounting firm may discover internal controls that need improvement. A discovery of a material weakness, even if quickly remedied, could reduce the market’s confidence in our financial statements and harm our stock price. Any inability to provide reliable financial reports or prevent fraud could harm our business. We cannot assure you that we will be able to fully comply with the requirements of the Sarbanes-Oxley Act or that management or our independent registered public accounting firm will conclude that our internal controls are effective in future periods. Irrespective of compliance with Section 404, any failure of our internal controls could have a material adverse effect on our stated operating results and harm our reputation.
In addition, we are subject to the reporting requirements of the Exchange Act, the listing requirements of The Nasdaq Stock Market, and other applicable securities rules and regulations. As a consequence, and particularly after we cease to be an "emerging growth company," we expect to incur greater legal, accounting and other expenses than we incurred as a private company, including costs associated with public company reporting requirements. We also anticipate that we will incur costs associated with relatively recently adopted corporate governance requirements, including requirements of the SEC and The Nasdaq Stock Market. We expect these rules and regulations to increase our legal and financial compliance costs and to make some activities more time-consuming and costly. We also expect that these rules and regulations may make it more difficult and more expensive for us to obtain director and officer liability insurance and we may be required to accept reduced policy limits and coverage or incur substantially higher costs to obtain the same or similar coverage. As a result, it may be more difficult for us to attract and retain qualified individuals to serve on our Board of Directors or as executive officers. We are currently evaluating and monitoring developments with respect to these rules, and we cannot predict or estimate the amount of additional costs we may incur or the timing of such costs.
Our operations are conducted in a limited number of locations. Any disruption at our facilities could delay revenues or increase our expenses.
An earthquake, fire, flood or other natural or manmade disaster could disable our facilities, disrupt operations or cause catastrophic losses. Our major manufacturing facilities are located in Vancouver, Washington; Hillsboro, Oregon; Shanghai, China; and Lohja, Finland. Some of our facilities, such as our headquarters and key manufacturing and development facilities in Vancouver, Washington, are located in areas with a known history of seismic and volcanic activity. We also have facilities in areas with a known history of flooding, such as our location in Shanghai, China, and there is a risk of flooding and snowstorms at our location in Lohja, Finland. A loss at any of these or other of our or our suppliers' facilities could disrupt operations, delay production and shipments, reduce revenues and generate potentially significant expenses to repair or replace damaged facilities. The insurance we maintain against earthquakes, floods and other natural or manmade disasters may not be adequate to cover our losses in any particular case.
We are subject to governmental export and import controls that could subject us to liability or impair our ability to compete in international markets.
The U.S. and various foreign governments have imposed controls, export license requirements and restrictions on the import or export of certain products, technologies and software. We must export our products in compliance with U.S. export controls, including the Commerce Department's Export Administration Regulations, the State Department's International Traffic in Arms Regulations, or ITAR, and various economic and trade sanctions established by the Treasury Department's Office of Foreign Assets Controls. We may not always be successful in obtaining necessary export licenses, and our failure to obtain required import or export approval for our products or limitations on our ability to export or sell our products imposed by these laws may
26
harm our international and domestic revenues. Noncompliance with these laws could have negative consequences, including government investigations, penalties and reputational harm.
In addition, compliance with the directives of the Directorate of Defense Trade Controls, or DDTC, may result in substantial expenses and diversion of management attention. Any failure to adequately address the directives of DDTC could result in civil fines or suspension or loss of our export privileges, any of which could materially adversely affect our business, financial condition, results of operations and growth prospects.
Changes in our products or changes in export, import and economic sanctions laws and regulations may delay our introduction of new products in international markets, prevent our customers from deploying our products internationally or, in some cases, prevent the export or import of our products to or from certain countries altogether. The U.S. Government has imposed significant tariffs on a variety of items imported from China and has proposed tariffs on additional items. For example, the U.S. recently imposed tariffs on lasers which include our semiconductor lasers which are assembled in China. China has responded by proposing tariffs on the import of items from the United States. Such tariffs have not had a material impact on our results of operations to date. However, it is possible that additional sanctions or restrictions may be imposed by the United States on items imported into the United States from China and any such measures could further adversely affect our ability to sell our products to existing or potential customers and harm our ability to compete internationally and grow our business. Any change in export or import regulations or legislation, shift or change in enforcement, or change in the countries, persons or technologies targeted by these regulations, could result in decreased use of our products by, or in our decreased ability to export or sell our products to, existing or potential customers with international operations. In such event, our business, financial condition, results of operations and growth prospects could be materially adversely affected.
We are subject to anti-corruption, anti-bribery, anti-money laundering and similar laws, and non-compliance with such laws can subject us to criminal penalties or significant fines and harm our business and reputation.
We are subject to anti-corruption and anti-bribery and similar laws, such as the U.S. Foreign Corrupt Practices Act of 1977, as amended, or the FCPA, the U.S. domestic bribery statute contained in 18 U.S.C. § 201, the U.S. Travel Act, the USA PATRIOT Act, the U.K. Bribery Act 2010, the Proceeds of Crime Act 2002 and possibly other anti-corruption, anti-bribery and anti-money laundering laws in countries in which we conduct activities. Anti-corruption and anti-bribery laws have been enforced aggressively in recent years and are interpreted broadly and prohibit companies and their employees and agents from promising, authorizing, making, offering, soliciting or accepting improper payments or other benefits to or from government officials and others in the public and private sectors. We can be held liable for the corrupt or other illegal activities of our employees, representatives, contractors, business partners and agents, even if we do not explicitly authorize or have actual knowledge of such activities. China also strictly prohibits bribery of government officials and commercial bribery. Our operations in China create the risk of unauthorized payments or offers of payments by our employees, consultants, sales agents or distributors, even though they may not always be subject to our control.
While we have policies and procedures in this area, we cannot guarantee that improprieties committed by our employees or third parties will not occur. Noncompliance with these laws could subject us to investigations, sanctions, settlements, prosecution, other enforcement actions, disgorgement of profits, significant fines, damages, other civil and criminal penalties or injunctions, suspension or debarment from contracting with certain persons, the loss of export privileges, whistleblower complaints, reputational harm, adverse media coverage and other collateral consequences. If any subpoenas or investigations are launched, or governmental or other sanctions are imposed, or if we do not prevail in any possible civil or criminal litigation, our business, financial condition, results of operations and growth prospects could be materially adversely affected. In addition, responding to any action will likely result in a materially significant diversion of management's attention and resources and significant defense and compliance costs and other professional fees. In certain cases, enforcement authorities may even require us to appoint an independent compliance monitor, which can result in added costs and administrative burdens. Any investigations, actions or sanctions or other previously mentioned harm could materially adversely affect our business, financial condition, results of operations and growth prospects.
Changes in U.S. or foreign tax law may materially adversely affect our business, financial condition, results of operations and growth prospects.
The Tax Cuts and Jobs Act, or 2017 Tax Act, was recently enacted into law, bringing about extensive changes to the U.S. corporate tax system. The 2017 Tax Act includes changes that reduce U.S. corporate tax rates, change how U.S. multinational corporations, like us, are taxed on international earnings, repeal domestic manufacturing deduction, accelerate tax revenue recognition, allow capitalization of research and development expenditures, place additional limitations on executive compensation and limitations on the deductibility of interest. We continue to examine the impact the 2017 Tax Act may have on our business. Due to the large and expanding scale of our international business activities, any changes in the U.S. or foreign taxation of such activities may increase our worldwide effective tax rate and the amount of taxes we pay and seriously harm our business.
27
Additionally, under the applicable laws and regulations in China, arrangements and transactions among related parties may be subject to audit or challenge by the Chinese tax authorities. We would be subject to adverse tax consequences if the Chinese tax authorities were to determine that the transactions with or between our subsidiaries were not executed on an arm's-length basis, and as a result the Chinese tax authorities could require that our Chinese subsidiaries adjust their taxable income upward for Chinese tax purposes. Such an adjustment could materially adversely affect us by increasing our tax expenses.
We regularly assess the likelihood of favorable or unfavorable outcomes resulting from these examinations to determine the adequacy of our provision for income taxes. Although we believe our tax estimates are reasonable, there can be no assurance that any final determination will not be materially different than the treatment reflected in our historical income tax provisions and accruals, which could materially adversely affect our business, financial condition, results of operations and growth prospects.
We could be subject to additional income tax liabilities.
We are subject to income taxes in the United States and certain other foreign jurisdictions. Judgment is required in evaluating our worldwide provision for income taxes. During the ordinary course of business, there are many transactions for which the ultimate tax determination is uncertain. For example, our effective tax rates could be adversely affected by earnings being lower than anticipated in countries where we have lower statutory rates and higher than anticipated in countries where we have higher statutory rates, by changes in foreign currency exchange rates, by changes in the valuation of our deferred tax assets and liabilities, or by changes in the relevant tax, accounting and other laws, regulations, principles and interpretations. We are subject to audit in various jurisdictions, and such jurisdictions may assess additional income tax against us. Although we believe our tax estimates are reasonable, the final determination of tax audits and any related litigation could be materially different from our historical income tax provisions and accruals. The results of an audit or litigation could have a material adverse effect on our operating results or cash flows in the period or periods for which that determination is made.
Our international operations subject us to potential adverse tax consequences.
We generally conduct our international operations through wholly-owned subsidiaries and report our taxable income in various jurisdictions worldwide based upon our business operations in those jurisdictions. Our intercompany relationships are subject to complex transfer pricing regulations administered by taxing authorities in various jurisdictions. The relevant taxing authorities may disagree with our determinations as to the income and expenses attributable to specific jurisdictions. If such a disagreement were to occur, and our position was not sustained, we could be required to pay additional taxes, interest and penalties, which could result in one-time tax charges, higher effective tax rates, reduced cash flows and lower overall profitability of our operations. We believe that our financial statements reflect adequate reserves to cover such a contingency, but there can be no assurances in that regard.
Our reported financial results may be materially adversely affected by changes in accounting principles generally accepted in the United States.
Generally accepted accounting principles in the United States, or GAAP, are subject to interpretation by the Financial Accounting Standards Board, or FASB, the SEC, and various bodies formed to promulgate and interpret appropriate accounting principles. A change in these principles or interpretations could have a significant effect on our reported financial results, and could affect the reporting of transactions completed before the announcement of a change.
In particular, in February 2016 the FASB issued ASU No. 2016‑02,
Leases (Topic 842).
ASU 2016‑02 requires a lessee to recognize a right of use asset and a lease liability for virtually all leases, other than leases that meet the definition of short‑term. The standard is effective for annual reporting periods beginning after December 15, 2019. We expect to implement the provisions of ASU 2016‑02 as of January 1, 2020. We are currently evaluating the impact of this ASU and cannot reasonably estimate the quantitative impact on the financial statements.
We are subject to various environmental laws and regulations that could impose substantial costs upon us and may materially adversely affect our business, financial condition, results of operations and growth prospects.
We are subject to a variety of federal, state, local and foreign environmental regulations relating to the use, storage, discharge and disposal of hazardous chemicals used during our manufacturing process or requiring design changes or recycling of products we manufacture. We could incur costs, fines and civil or criminal sanctions, third-party property damage or personal injury claims, or could be required to incur substantial investigation or remediation costs, if we were to violate or become liable under environmental laws. Liability under environmental laws can be joint and several and without regard to comparative fault. Compliance with current or future environmental laws and regulations could restrict our ability to expand our facilities or require us to acquire additional expensive equipment, modify our manufacturing processes or incur other significant expenses in order to remain in compliance with such laws and regulations. At this time, we do not believe the costs to maintain compliance with current environmental laws to be material. If such costs were to become material in the future, whether due to unanticipated changes in
28
environmental laws or their interpretations, unanticipated changes in our operations or other unanticipated changes, we may be required to dedicate additional staff or financial resources in order to maintain compliance. There can be no assurance that violations of environmental laws or regulations will not occur in the future as a result of the lack of, or failure to obtain, permits, human error, accident, equipment failure or other causes.
Results of future litigation could materially adversely affect our business, financial condition, results of operations and growth prospects.
From time to time, we have been subject to litigation. The outcome of any litigation, regardless of its merits, is inherently uncertain. Future litigation could result in significant damages payable by us, and could harm our reputation. Even if we are successful in our defense, such litigation could still result in a diversion of management's attention and our resources and we may be required to incur significant expenses defending against these claims. We cannot predict our future commitments with respect to any matters encountered in the future, or their eventual outcome. Where we can make a reasonable estimate of the liability relating to pending litigation and determine that it is probable, we record a related liability. As additional information becomes available, we assess the potential liability and revise estimates as appropriate. However, because of uncertainties relating to litigation, the amount of our estimates could be wrong. Any adverse determination related to litigation could require us to change our technology or our business practices, pay monetary damages or fines, or enter into royalty or licensing arrangements, which could materially adversely affect our cash flows, harm our reputation, or otherwise materially adversely affect our business, financial condition, results of operations and growth prospects.
The outcome of any government inquiries and investigations involving our business is unpredictable and an adverse decision in any such matter could materially adversely affect our business, financial condition, results of operations and growth prospects.
We have been involved in certain disputes and have also received requests for information from government authorities. For example, we entered into a civil settlement agreement with the U.S. Department of Justice in March 2015 concerning a matter related to our eligibility for certain contracts awarded to us under the Small Business Innovation Research, or SBIR, Program. We have also received information requests from the Criminal Division of the U.S. Attorney's Office related to our SBIR eligibility and the Criminal Division has interviewed certain of our current and past employees. We have responded to the U.S. Attorney's requests with a production of documents. Although we have not received further inquiries from the Criminal Division since 2015, the Criminal Division has contacted certain of our former employees as recently as June 2017 and the inquiry may be ongoing, and we do not know when it will conclude or whether the Criminal Division will pursue claims against us or our employees. If the Criminal Division or a federal court determines that we or our employees are criminally liable, our business, financial condition, results of operations and growth prospects could be materially adversely affected.
Acquisitions could result in operating difficulties and may materially adversely affect our business, financial condition, results of operations and growth prospects.
We have evaluated, and expect to continue evaluating, potential strategic transactions, and we may pursue one or more transactions, including acquisitions. We have limited experience executing acquisitions. Integrating an acquired company, business or technology may create unforeseen operating difficulties and expenditures. If we fail to successfully integrate our acquisitions, or the people or technologies associated with those acquisitions, into our company, the results of operations of the combined company could be adversely affected. Any integration process will require significant time and resources, require significant attention from management, and disrupt the ordinary functioning of our business, and we may not be able to manage the process successfully, which could adversely affect our business, results of operations, and financial condition.
We may have to pay cash, incur debt, or issue equity securities to pay for any such acquisition, each of which could affect our financial condition or the value of our capital stock. The sale of equity to finance any such acquisitions could result in dilution to our stockholders. If we incur more debt, it would result in increased fixed obligations and could also subject us to covenants or other restrictions that would impede our ability to flexibly operate our business.
Our debt obligations contain restrictions that impact our business and expose us to risks that could materially adversely affect our liquidity and financial condition.
In September 2018, we entered into an amended and restated loan facility, or loan facility, with Pacific Western Bank, as lender. This loan facility imposes certain covenants and restrictions on our business and our ability to obtain additional financing. As of
December 31, 2018
, we had
no
outstanding principal amount under the revolving loan facility.
Among other things, our loan facility requires the lender's consent to:
|
•
|
merge or consolidate;
|
|
•
|
sell or transfer assets outside the ordinary course of business;
|
29
|
•
|
make certain types of investments and capital expenditures;
|
|
•
|
incur additional indebtedness or guarantee indebtedness of others;
|
|
•
|
pay dividends, redeem or repurchase our capital stock;
|
|
•
|
enter into transactions with affiliates outside the ordinary course of business; and
|
|
•
|
create liens on our assets.
|
Our loan facility also contains affirmative covenants, including a maximum capital expenditures covenant, determined in relation to our Adjusted EBITDA for the quarter, in the event our total cash reserves fall below a certain threshold. The facility contains events of default, including, among others, non-payment defaults, inaccuracy of representations and warranties, covenant defaults, cross-defaults to other indebtedness, judgment defaults, bankruptcy and insolvency defaults and a change of control default.
If we experience a decline in cash flow due to any of the factors described in this "Risk Factors" section or otherwise, we could have difficulty paying interest due and principal amounts outstanding in the future, and meeting the financial covenants set forth in our loan facility. If we are unable to generate sufficient cash flow or otherwise obtain the funds necessary to make required payments under our loan facility, or if we fail to comply with the requirements of our indebtedness, we could default under our loan facility. Any default that is not cured or waived could result in the acceleration of the obligations under the loan facility, an increase in the applicable interest rate under the loan facility, and would permit our lender to exercise remedies with respect to all of the collateral that is securing the loan facility, which includes substantially all of our assets. Any such default could materially adversely affect our liquidity and financial condition.
Even if we comply with all of the applicable covenants, the restrictions on the conduct of our business could materially adversely affect our business by, among other things, limiting our ability to take advantage of financings, mergers, acquisitions and other corporate opportunities that may be beneficial to the business. Even if the loan facility were terminated, additional debt we could incur in the future may subject us to similar or additional covenants, which could place restrictions on the operation of our business.
Our ability to use net operating losses to offset future taxable income may be limited.
As of
December 31, 2018
, we had U.S. federal and state net operating loss carryforwards, or NOLs, of
$74.4 million
and
$11.6 million
, respectively and federal and state research development credit carryforwards of
$5.3 million
and
$22 thousand
, respectively, which we may use to reduce future taxable income or offset income taxes due. The NOLs and credit carryforwards start expiring in
2023
and
2019
, respectively. Insufficient future taxable income will adversely affect our ability to deploy these NOLs and credit carryforwards. In addition, under Section 382 of the U.S. Internal Revenue Code, or the Code, a corporation that experiences a more than 50% ownership change over a three-year testing period is limited in its ability to use its pre-change NOLs and other tax assets to offset future taxable income or income taxes due. Our existing NOLs and credit carryforwards are subject to limitations arising from previous ownership changes. Our ability to use our NOLs and credit carryforwards could be further limited by Section 382 of the Code if we undergo an ownership change. Future changes in our stock ownership, the causes of which may be outside our control, could result in an ownership change under Section 382 of the Code. Our NOLs may also be impaired under state law. As a result of these limitations, we may not be able to utilize a material portion of, or possibly any of, the NOLs and credit carryforwards, which could materially adversely affect our cash flows.
Risks Related to Ownership of Our Common Stock
The market price of our common stock may be volatile, and the value of your investment could decline significantly
.
Technology stocks have historically experienced high levels of volatility. The trading price of our common has been and is likely to continue to be volatile. Factors that could cause fluctuations in the trading price of our common stock include the following:
|
•
|
price and volume fluctuations in the overall stock market from time to time;
|
|
•
|
changes in operating performance, stock market valuations and volatility in the market prices of other technology companies generally, or those in our industry in particular;
|
|
•
|
actual or anticipated quarterly variations in our results of operations or those of our competitors;
|
|
•
|
actual or anticipated changes in our growth rate relative to our competitors;
|
|
•
|
announcements by us or our competitors of acquisitions, new products, significant contracts, commercial relationships or capital commitments;
|
|
•
|
manufacturing or supply interruptions;
|
|
•
|
developments with respect to intellectual property rights;
|
|
•
|
our ability to develop and market new and enhanced products on a timely basis;
|
|
•
|
commencement of, or our involvement in, litigation;
|
|
•
|
major changes in our Board of Directors or management;
|
30
|
•
|
changes in governmental regulations or in the status of our regulatory approvals;
|
|
•
|
the trading volume of our stock;
|
|
•
|
any future sales of our common stock or other securities;
|
|
•
|
failure of financial analysts to maintain coverage of us, changes in financial estimates by any analysts who follow our company or our failure to meet these estimates or the expectations of investors;
|
|
•
|
fluctuations in the values of companies perceived by investors to be comparable to us;
|
|
•
|
the financial projections we may provide to the public, any changes in these projections or our failure to meet these projections; and
|
|
•
|
general economic conditions and slow or negative growth of related markets.
|
The stock market in general, and market prices for the securities of technology companies like ours in particular, have from time to time experienced volatility that often has been unrelated to the operating performance of the underlying companies. These broad market and industry fluctuations may adversely affect the market price of our common stock, regardless of our operating performance. In several recent situations when the market price of a stock has been volatile, holders of that stock have instituted securities class action litigation against the company that issued the stock. If any of our stockholders were to bring a lawsuit against us, the defense and disposition of the lawsuit could be costly and divert the time and attention of our management and materially adversely affect our results of operations.
If securities or industry analysts do not publish research reports about our business, or if they issue an adverse opinion about our business, our stock price and trading volume could decline.
The trading market for our common stock will be influenced by the research and reports that industry or securities analysts publish about us or our business. We do not have any control over these analysts. If one or more of the analysts who cover us issues an adverse opinion about our company, our stock price would likely decline. If one or more of these analysts ceases research coverage of us or fails to regularly publish reports on us, we could lose visibility in the financial markets, which in turn could cause our stock price or trading volume to decline.
Future sales of our common stock could cause our stock price to fall.
Our stock price could decline as a result of sales of a large number of shares of our common stock or the perception that these sales could occur. These sales, or the possibility that these sales may occur, also might make it more difficult for us to sell equity securities in the future at a time and at a price that we deem appropriate.
The holders of
8.9 million
shares, or approximately
24.2%
of our common stock, have rights, subject to some conditions, to require us to file registration statements covering the sale of their shares or to include their shares in registration statements that we may file for ourselves or other stockholders, based on our shares outstanding as of
December 31, 2018
.
In the future, we may issue additional shares of common stock or other equity or debt securities convertible into common stock in connection with a financing, acquisition, commercial relationship, litigation settlement, employee arrangements or otherwise. Any such issuance could result in substantial dilution to our existing stockholders and could cause our stock price to decline.
Our principal stockholders and management own a significant percentage of our stock and will be able to exercise significant influence over matters subject to stockholder approval.
Our executive officers, directors and current beneficial owners of 5% or more of our common stock beneficially own a significant percentage of our outstanding common stock. As a result, our executive officers, directors and principal stockholders, if acting together, may be able to significantly influence, in their capacity as stockholders, matters requiring approval by our stockholders, including the election of directors and the approval of mergers, acquisitions or other extraordinary transactions. The interests of this group of stockholders may not coincide with the interests of other stockholders.
We are an "emerging growth company," and any decision on our part to comply only with certain reduced reporting and disclosure requirements applicable to emerging growth companies could make our common stock less attractive to investors.
We are an "emerging growth company," as defined in the Jumpstart Our Business Startups, or JOBS, Act enacted in April 2012, and, for as long as we continue to be an "emerging growth company," we may choose to take advantage of exemptions from various reporting requirements applicable to other public companies but not to "emerging growth companies," including, but not limited to, not being required to have our independent registered public accounting firm audit our internal control over financial reporting under Section 404 of the Sarbanes-Oxley Act of 2002, or Section 404, reduced disclosure obligations regarding executive compensation in our periodic reports and proxy statements, and exemptions from the requirements of holding a nonbinding advisory vote on executive compensation and stockholder approval of any golden parachute payments not previously approved. We could
31
be an "emerging growth company" for up to five years following the first sale of our common stock pursuant to an effective registration statement under the Securities Act, although, if we have more than $1.07 billion in annual revenues, if the market value of our common stock that is held by non-affiliates exceeds $700 million as of June 30 of any year, or we issue more than $1.0 billion of non-convertible debt over a three-year period before the end of that five-year period, we would cease to be an "emerging growth company" as of the following December 31. If some investors find our common stock less attractive as a result of any choices to reduce future disclosure, there may be a less active trading market for our common stock and our stock price may be more volatile.
As an "emerging growth company," the JOBS Act allows us to delay adoption of new or revised accounting pronouncements applicable to public companies until such pronouncements are made applicable to private companies. We have elected to use this extended transition period under the JOBS Act. As a result, our financial statements may not be comparable to the financial statements of issuers who are required to comply with the effective dates for new or revised accounting standards that are applicable to public companies, which may make our common stock less attractive to investors.
Delaware and Washington law and provisions in our amended and restated certificate of incorporation and amended and restated bylaws could make a merger, tender offer or proxy contest difficult, thereby depressing the trading price of our common stock
.
Anti-takeover provisions in our charter documents and under Delaware and Washington law could make an acquisition of us difficult, limit attempts by our stockholders to replace or remove our current management or Board of Directors and adversely affect our stock price.
Provisions of our amended and restated certificate of incorporation and amended and restated bylaws may delay or discourage transactions involving an actual or potential change in our control or change in our management, including transactions in which stockholders might otherwise receive a premium for their shares, or transactions that our stockholders might otherwise deem to be in their best interests. Therefore, these provisions could adversely affect the price of our stock. Among other things, our amended and restated certificate of incorporation and amended and restated bylaws:
|
•
|
permit the Board of Directors to issue up to 5 million shares of preferred stock, with any rights, preferences and privileges as they may designate;
|
|
•
|
provide that the authorized number of directors may be changed only by resolution of the Board of Directors;
|
|
•
|
provide that all vacancies on our Board of Directors may only be filled by our Board of Directors and not by stockholders;
|
|
•
|
divide the Board of Directors into three classes;
|
|
•
|
provide that a director may only be removed from the Board of Directors by the stockholders for cause;
|
|
•
|
require that any action to be taken by our stockholders must be effected at a duly called annual or special meeting of stockholders and may not be taken by written consent;
|
|
•
|
provide that stockholders seeking to present proposals before a meeting of stockholders or to nominate candidates for election as directors at a meeting of stockholders must provide notice in writing in a timely manner and meet specific requirements as to the form and content of a stockholder's notice;
|
|
•
|
prevent cumulative voting rights (therefore allowing the holders of a plurality of the shares of common stock entitled to vote in any election of directors to elect all of the directors standing for election, if they should so choose);
|
|
•
|
provide that special meetings of our stockholders may be called only by the chairman of the board, our chief executive officer (or president, in the absence of a chief executive officer) or by the Board of Directors; and
|
|
•
|
provide that stockholders will be permitted to amend our amended and restated certificate of incorporation and amended and restated bylaws only upon receiving at least two-thirds of the total votes entitled to be cast by holders of all outstanding shares then entitled to vote generally in the election of directors, voting together as a single class.
|
In addition, because we are incorporated in Delaware, we are governed by the provisions of Section 203 of the Delaware General Corporation Law, which generally prohibits a Delaware corporation from engaging in any of a broad range of business combinations with any "interested" stockholder for a period of three years following the date on which the stockholder became an "interested" stockholder. Likewise, because our principal executive offices are located in Washington, the anti-takeover provisions of the Washington Business Corporation Act may apply to us under certain circumstances now or in the future. These provisions prohibit a "target corporation" from engaging in any of a broad range of business combinations with any stockholder constituting an "acquiring person" for a period of five years following the date on which the stockholder became an "acquiring person."
Our amended and restated bylaws provide that, unless we consent in writing to the selection of an alternative forum, the sole and exclusive forum for (i) any derivative action or proceeding brought on our behalf, (ii) any action asserting a claim of breach of a fiduciary duty owed by any of our directors, officers, or other employees to us or our stockholders, (iii) any action arising pursuant to any provision of the Delaware General Corporation Law, or our amended and restated certificate of incorporation
32
or our amended and restated bylaws or (iv) any other action asserting a claim that is governed by the internal affairs doctrine shall be a state or federal court located within the State of Delaware, in all cases subject to the court having jurisdiction over indispensable parties named as defendants.
Our amended and restated bylaws also provide that the federal district courts of the United States of America will be the exclusive forum for resolving any complaint asserting a cause of action arising under the Securities Act. On December 19, 2018, the Delaware Court of Chancery issued a decision in Matthew Sciabacucchi v. Matthew B. Salzberg et al., C.A. No. 2017-0931-JTL (Del. Ch.), finding that such provisions such as the federal forum provision are not valid under Delaware law. In light of this decision of the Delaware Court of Chancery, we do not intend to enforce the federal forum provision in our amended and restated bylaws unless and until such time there is a final determination by the Delaware Supreme Court regarding the validity of such provisions. To the extent the Delaware Supreme Court makes a final determination that provisions such as the Federal Forum Provision are not valid as a matter of Delaware law, our Board of Directors intends to amend our Bylaws to remove the federal forum provision.
Any person or entity purchasing or otherwise acquiring any interest in any of our securities shall be deemed to have notice of and consented to this provision. These exclusive-forum provisions may limit a stockholder's ability to bring a claim in a judicial forum of its choosing for disputes with us or our directors, officers, or other employees, which may discourage lawsuits against us and our directors, officers, and other employees. If a court were to find either exclusive-forum provision in our amended and restated bylaws to be inapplicable or unenforceable in an action, we may incur additional costs associated with resolving the dispute in other jurisdictions, which could harm our results of operations.
ITEM 1B. UNRESOLVED STAFF COMMENTS
None.
ITEM 2. PROPERTIES
Our facilities are leased and include the following:
|
Location
|
Lease Expiration
|
Approximate Size
(sq. ft.)
|
Primary Functions
|
|
Vancouver, Washington
|
March 31, 2022 ‑
July 31, 2025
|
122,400
|
Corporate headquarters; general corporate activities, product development, sales and support, chip fabrication and packaging and fiber laser operations
|
|
Hillsboro, Oregon
|
January 31, 2023
|
30,200
|
Aerospace and defense packaging
|
|
Lohja, Finland
|
April 1, 2022
|
31,800
|
Optical fiber development and manufacturing
|
|
Shanghai, China
|
April 16, 2019 ‑
January 31, 2021
|
82,800
|
Product development, China sales, service and high-volume manufacturing, fiber laser operations
|
|
Seoul, South Korea
|
September 30, 2020 -December 31, 2020
|
2,120
|
South Korea sales; installation, training and service
|
ITEM 3. LEGAL PROCEEDINGS
In December 2013, we submitted a disclosure letter to the Office of the Inspector General of the Department of Defense advising that we might not have been eligible for certain contracts we were awarded under the Small Business Innovation Research, or SBIR, Program, notwithstanding our prior representations that we were eligible. The matter was referred to the Small Business Administration and the U.S. Department of Justice for investigation of potential violations of the civil False Claims Act. In March 2015, a civil settlement agreement related to the SBIR matter was signed, in which we agreed to pay
$420,000
and received a release of any civil liabilities with respect to the SBIR matter. This settlement has been paid in full.
In October 2014, we received a request for information related to the SBIR matter from the U.S. Attorney's Office, Criminal Division. We provided documentation and an explanation of why a criminal investigation was unwarranted. In March 2015, we received an additional request, to which we also responded. The Criminal Division has contacted certain of our former employees as recently as June 2017. Although we are unable to predict the final outcome of this matter, in the event that the Criminal Division brings any claims, we intend to vigorously defend ourselves.
33
In addition, we may, from time to time, be party to litigation and subject to claims incident to the ordinary course of business. As our growth continues, we may become party to an increasing number of litigation matters and claims. The outcome of litigation and claims cannot be predicted with certainty, and the resolution of these matters could materially adversely affect our business, financial condition, results of operations and growth prospects.
ITEM 4. MINE SAFETY DISCLOSURES
Not Applicable.
PART II
ITEM 5. MARKET FOR REGISTRANT'S COMMON EQUITY, RELATED STOCKHOLDER MATTERS AND ISSUER PURCHASES OF EQUITY SECURITIES
Market Information
Our common stock has traded on The Nasdaq Global Select Market under the symbol “LASR” since April 26, 2018.
Holders of Record
As of
March 8, 2019
, there were
202
holders of record of our common stock. The actual number of stockholders is greater than this number of record holders and includes stockholders who are beneficial owners but whose shares are held in street name by brokers and other nominees. This number of holders of record also does not include stockholders whose shares may be held in trust by other entities.
Stock Performance Graph
The information included under the heading “Stock Performance Graph” is “furnished” and not “filed” for purposes of Section 18 of the Securities Exchange Act of 1934, as amended, or the Exchange Act, or otherwise subject to the liabilities of that section, nor shall it be deemed to be “soliciting material” subject to Regulation 14A or incorporated by reference in any filing under the Securities Act or the Exchange Act. The following graph compares our cumulative total stockholder return on nLIGHT's common stock with the NASDAQ Composite Index, the Russell 2000 Index and the S&P Electronic Equipment & Instruments Index.
The graph covers the period from April 26, 2018, using the closing price for the first day of trading immediately following the effectiveness of our initial public offering per SEC regulations, through
December 31, 2018
. This graph assumes that the value of the investment in nLIGHT's common stock and each index (including reinvestment of dividends) was $100 on April 26, 2018.
34
COMPARISON OF 9 MONTH CUMULATIVE TOTAL RETURN*
Among nLIGHT, Inc., the NASDAQ Composite Index,
the Russell 2000 Index and the S&P Electronic Equipment & Instruments Index
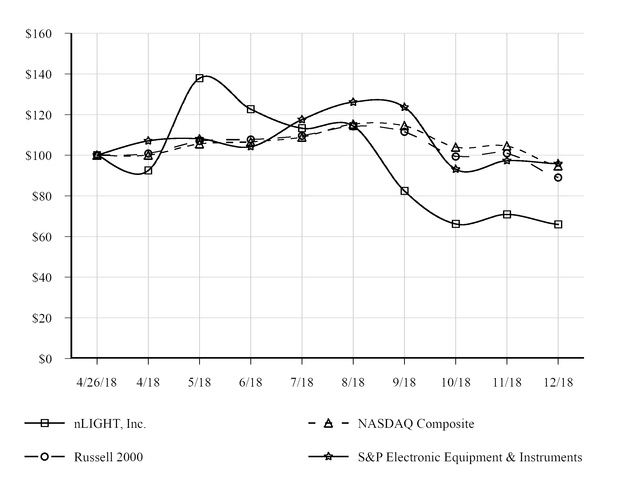
*$100 invested on April 26, 2018 in stock or March 31, 2018 in index, including reinvestment of dividends.
Fiscal year ending December 31.
Copyright© 2019 Standard & Poor's, a division of S&P Global. All rights reserved.
Copyright© 2019 Russell Investment Group. All rights reserved.
The stock price performance shown on the graph above is not necessarily indicative of future price performance. Information used in the graph was obtained from the Nasdaq Stock Market, a source believed to be reliable, but we are not responsible for any errors or omissions in such information.
Use of Proceeds from Public Offerings of Common Stock
On April 30, 2018, we closed our initial public offering, or IPO, in which we sold
6.9 million
shares of common stock at a price to the public of
$16.00
per share, including shares sold in connection with the exercise in full of the underwriters’ option to purchase additional shares. The offer and sale of all of the shares in the IPO were registered under the Securities Act pursuant to a registration statement on Form S-1 (File No. 333-224055), which was declared effective by the SEC on
April 25, 2018
. We raised approximately
$100.9 million
in net proceeds after deducting underwriting discounts and commissions of
$7.7 million
and estimated offering expenses of
$2.4 million
. No payments were made by us to directors, officers or persons owning 10% or more of our capital stock or to their associates, or to our affiliates, other than payments in the ordinary course of business to officers for salaries. There has been no material change in the planned use of proceeds from our IPO as described in the Prospectus dated April 25, 2018, filed with the SEC pursuant to Rule 424(b) under the Securities Act of 1933. We invested the funds received in accordance with our board approved investment policy, which provides for investments in short-term, investment grade, interest-
35
bearing securities, such as direct or guaranteed obligations of the U.S. government. The lead book-running managers of our IPO were Stifel, Nicolaus & Company, Incorporated and Raymond James & Associates, Inc.
Recent Sales of Unregistered Securities
On November 5, 2018 we issued
145 thousand
shares of common stock to an accredited investor pursuant to the net exercise of warrants to purchase common stock.
This transaction was exempt from registration under the Securities Act in reliance upon Section 3(a)(9) under the Securities Act as an exchange with an existing security holder where no commission or other remuneration is paid or given for soliciting such exchange.
ITEM 6. SELECTED CONSOLIDATED FINANCIAL DATA
The following selected consolidated financial data should be read in conjunction with, and is qualified by reference to, our consolidated financial statements and related notes and Item 7, "Management's Discussion and Analysis of Financial Condition and Results of Operations" included elsewhere in this report. The data as of
December 31, 2018
,
2017
and
2016
is derived from our audited consolidated financial statements and related notes included elsewhere in this report. Our historical results are not necessarily indicative of the results for any future period.
|
Year Ended December 31,
|
|||||||||||
|
2018
|
2017
|
2016
|
|||||||||
|
Consolidated Statement of Operations Data:
|
(in thousands except per share data)
|
||||||||||
|
Revenues
|
$
|
191,359
|
|
$
|
138,580
|
|
$
|
101,325
|
|
||
|
Cost of revenues
(1)
|
124,398
|
|
94,306
|
|
78,159
|
|
|||||
|
Gross profit
|
66,961
|
|
44,274
|
|
23,166
|
|
|||||
|
Operating expenses:
|
|||||||||||
|
Research and development
(1)
|
21,054
|
|
15,123
|
|
15,239
|
|
|||||
|
Sales, general, and administrative
(1)
|
28,844
|
|
19,353
|
|
17,265
|
|
|||||
|
Total operating expenses
|
49,898
|
|
34,476
|
|
32,504
|
|
|||||
|
Income (loss) from operations
|
17,063
|
|
9,798
|
|
(9,338
|
)
|
|||||
|
Other income (expense):
|
|||||||||||
|
Interest income (expense), net
|
728
|
|
(1,269
|
)
|
(2,229
|
)
|
|||||
|
Other expense
|
(253
|
)
|
(1,834
|
)
|
(753
|
)
|
|||||
|
Income (loss) before income taxes
|
17,538
|
|
6,695
|
|
(12,320
|
)
|
|||||
|
Income tax expense
|
3,600
|
|
4,858
|
|
1,882
|
|
|||||
|
Net income (loss)
|
$
|
13,938
|
|
$
|
1,837
|
|
$
|
(14,202
|
)
|
||
|
Less: Income allocated to preferred stockholders
|
(4,415
|
)
|
$
|
(1,837
|
)
|
—
|
|
||||
|
Net income (loss) attributable to common stockholders
|
$
|
9,523
|
|
$
|
—
|
|
$
|
(14,202
|
)
|
||
|
Net income (loss) per share, basic
(2)
|
$0.38
|
$0.00
|
$
|
(5.68
|
)
|
||||||
|
Net income (loss) per share, diluted
(2)
|
$0.32
|
$0.00
|
$
|
(5.68
|
)
|
||||||
|
Weighted average shares outstanding:
|
|||||||||||
|
Shares used in basic per share calculations
|
24,862
|
|
2,735
|
|
2,500
|
|
|||||
|
Shares used in diluted per share calculations
|
29,959
|
|
2,735
|
|
2,500
|
|
|||||
|
Select non-GAAP financial information (unaudited):
|
|||||||||||
|
Adjusted EBITDA
(3)
|
30,156
|
|
18,089
|
|
(931
|
)
|
|||||
36
(1)
Includes stock-based compensation expense as follows:
|
Year Ended December 31,
|
|||||||||||
|
2018
|
2017
|
2016
|
|||||||||
|
Cost of revenues
|
$
|
456
|
|
$
|
46
|
|
$
|
30
|
|
||
|
Research and development
|
1,293
|
|
66
|
|
57
|
|
|||||
|
Sales, general and administrative
|
3,056
|
|
257
|
|
221
|
|
|||||
|
$
|
4,805
|
|
$
|
369
|
|
$
|
308
|
|
|||
(2)
See Note 16 to our consolidated financial statements in Item 8 this report for a reconciliation between net income (loss) and net income (loss) per share.
(3)
See "Management's Discussion and Analysis of Financial Condition and Results of Operations - Non-GAAP Financial Information" for a reconciliation of Adjusted EBITDA to net income (loss), the most directly comparable GAAP measure.
|
Year Ended December 31,
|
|||||||||||
|
2018
|
2017
|
2016
|
|||||||||
|
Select Consolidated Balance Sheet Data:
|
(in thousands)
|
||||||||||
|
Cash and cash equivalents
|
$
|
149,478
|
|
$
|
36,687
|
|
$
|
13,500
|
|
||
|
Working capital
|
195,034
|
|
55,689
|
|
26,889
|
|
|||||
|
Total assets
|
250,130
|
|
110,148
|
|
71,059
|
|
|||||
|
Total debt, including current portion
(1)
|
109
|
|
17,471
|
|
19,667
|
|
|||||
|
Accumulated deficit
|
(104,731
|
)
|
(118,669
|
)
|
(120,506
|
)
|
|||||
|
Total stockholders' equity
|
217,783
|
|
61,283
|
|
29,691
|
|
|||||
(1) Net of debt issuance costs of
$42 thousand
,
$0
and
$571 thousand
as of
December 31, 2018
,
2017
and
2016
, respectively.
37
ITEM 7. MANAGEMENT’S DISCUSSION AND ANALYSIS OF FINANCIAL CONDITION AND RESULTS OF OPERATIONS
You should read the following discussion and analysis together with our consolidated financial statements and the related notes to those statements included elsewhere in this report. In addition to historical consolidated financial information, this discussion contains forward-looking statements that involve risks and uncertainties. As a result of many factors, such as those set forth under "Risk Factors" and elsewhere in this report, our actual results may differ materially from those anticipated in these forward-looking statements.
Overview
We are a leading provider of high‑power semiconductor and fiber lasers. Our lasers are changing not only the way things are made but also the things that can be made. We design, develop and manufacture the critical elements of our lasers, and we believe our vertically integrated business model enables us to rapidly introduce innovative products, control our costs and protect our intellectual property. We function through a single operating segment and, in
2018
, sold our products to over
350
customers worldwide in three primary markets: industrial, microfabrication, and aerospace and defense.
We maintain our corporate headquarters in Vancouver, Washington. Our Vancouver facility includes semiconductor laser fabrication and packaging, fiber laser operations, corporate offices, sales and marketing, customer support, research and development, finance, accounting and administrative functions. Our Hillsboro, Oregon facility is primarily dedicated to high‑precision packaging and activities for our aerospace and defense customers. We produce optical fiber products and perform research and development at our Lohja, Finland facility. We operate high‑volume manufacturing, sales and service for our Chinese customers from our Shanghai, China facility.
Due to our vertically integrated business model, we maintain a relatively high fixed manufacturing overhead. Our gross margin is therefore significantly affected by our sales volume, product mix, utilization of capacity and absorption of fixed manufacturing overhead expenses. We expect to continue to reduce the cost of our products by developing new semiconductor laser and fiber laser architectures, introducing new packaging technologies and increasing the use of automation in our manufacturing and packaging facilities.
We sell our products throughout the world primarily through our direct sales organization and also through our network of distributors and sales representatives. We have established, and expect to continue to broaden and deepen, relationships with our customers. We sell our products to customers that build their own systems which either incorporate our products or use our products as an energy or light source. Our sales cycle varies substantially, ranging from a period of a few weeks to as long as one year or more, but is typically several months.
We sell our products worldwide. Based on customer location, we generated approximately
37%
,
34%
and
36%
of our revenues from North America, approximately
37%
,
40%
and
38%
of our revenues from China, and approximately
26%
of our revenues from the rest of the world during each of the
years ended December 31, 2018
,
2017
and
2016
. China is the largest geographic market for lasers globally. We established our operations in China in 2004 and believe our sales, marketing and production operations in China will continue to enable us to increase revenues from new and existing customers. We believe that our innovative approach of tailoring our platform‑based high‑power semiconductor and fiber laser solutions to the specific needs of our customers will allow us to grow our market share with existing customers and attract new customers worldwide.
We had revenues of
$191.4 million
,
$138.6 million
and
$101.3 million
, net income (loss) of
$13.9 million
,
$1.8 million
and
$(14.2) million
, and an Adjusted EBITDA of
$30.2 million
,
$18.1 million
and
$(0.9) million
during the
years ended December 31, 2018
,
2017
and
2016
, respectively. Adjusted EBITDA is a non-GAAP financial measure. For a reconciliation of Adjusted EBITDA to net income, the most comparable GAAP measure, see “Non‑GAAP Financial Information” in the Results of Operations discussion following this overview.
We primarily sell to three end markets: industrial, microfabrication, and aerospace and defense. During the year ended
December 31, 2018
, approximately
$82.8 million
,
$74.1 million
and
$34.5 million
of revenues were derived from the industrial, microfabrication, and aerospace and defense markets, respectively. During the year ended
December 31, 2017
, approximately
$56.6 million
,
$60.9 million
and
$21.1 million
of revenues were derived from the industrial, microfabrication, and aerospace and defense markets, respectively. During the year ended
December 31, 2016
, approximately
$34.7 million
,
$47.6 million
and
$19.0 million
of revenues were derived from the industrial, microfabrication, and aerospace and defense markets, respectively.
38
Factors Affecting Our Performance
Demand for our Semiconductor and Fiber Laser Solutions
In order to continue to grow our revenues, we must continue to achieve design wins for our semiconductor and fiber lasers. We consider a design win to occur when a customer notifies us that it has selected one of our products to be incorporated into a product or system under development by such customer. For the foreseeable future, our operations will continue to depend upon capital expenditures by customers in the industrial and microfabrication markets, which, in turn, depend upon the demand for these customers’ products or services. In addition, in the aerospace and defense market, our business depends in large part on continued investment in laser technology by the U.S. government and its allies.
Technology and New Product Development
We invest heavily in the development of our semiconductor and fiber laser technologies to provide solutions to our current and future customers. We anticipate that we will continue to invest in research and development to achieve our technology and product roadmap. Our product development is targeted to specific sectors of the market where we believe the power and performance requirements of our products can provide the most benefit. We believe our close coordination with our customers regarding their future product requirements enhances the efficiency of our research and development expenditures.
Manufacturing Costs and Gross Margins
Our gross profit, in absolute dollars and as a percentage of revenues, is impacted by our product sales mix, sales volumes, changes in average selling prices, or ASPs, production volumes, the corresponding absorption of manufacturing overhead expenses, production costs and manufacturing yields. Our product sales mix can affect gross profits due to variations in profitability related to product configurations and cost profiles, customer volume pricing, availability of competitive products in various markets, and new product introductions, among other factors. Capacity utilization affects our gross margin because we have a high fixed cost base due to our vertically integrated business model. Increases in sales and production volumes drive favorable absorption of fixed costs, improved manufacturing efficiencies and lower production costs. Gross margins may fluctuate from period to period depending on product mix and the level of capacity utilization. Our gross margins have been improving. Gross margin for the years ended
December 31, 2018
,
2017
and
2016
was
35.0%
,
31.9%
and
22.9%
, respectively. During the second half of 2018, certain of our competitors have substantially reduced the price of their fiber lasers sold in the China market. In some instances, we have reduced the price of our fiber lasers sold in China, and may continue to do so as our competitors, and the industry generally, reduce the selling prices of fiber lasers. We believe that introducing new and higher value products, increasing the sales of our existing products, expanding into new applications and reducing our manufacturing costs will enable us to address recent declines in the ASPs of certain of our fiber lasers and continue to grow our revenues and gross margin.
Investment in Infrastructure
We have made, and intend to continue to make, substantial investments in infrastructure that will impact our cost of revenues, operating expenses and capital expenditures. We intend to continue investing to support growth at our existing facilities in order to meet the demands of our customer base. In addition, we intend to expand existing and establish new facilities in the future to accommodate our growth at various locations around the world. We expect to incur substantial costs in connection with such expansion efforts, including leasehold improvements and equipment costs.
Seasonality
Our quarterly revenues can fluctuate with general economic trends, holidays in foreign countries such as Chinese New Year in the first quarter of our fiscal year, the timing of capital expenditures by our customers, and general economic trends. In addition, as is typical in our industry, we tend to recognize a larger percentage of our quarterly revenues in the last month of the quarter, which may impact our working capital trends.
Components of Results of Operations
We are organized as, and operate in, one segment: the design, development, manufacture and sale of high-power semiconductor and fiber lasers. The following discussion sets forth certain components of our statements of results of operations as well as significant factors that impact those items.
Revenues
Sales of our products generally are recognized upon shipment or delivery, provided that the sales price is determinable, no performance obligation remains and collection is reasonably assured. Our sales typically are made on a purchase order or similar basis rather than through long-term purchase contracts.
39
Erosion of ASPs of established products is typical in our industry, and the ASPs of our products generally decrease as our products mature. We may also negotiate discounted selling prices from time to time with certain customers that purchase higher volumes, or to penetrate new markets or applications. We expect revenues to continue to increase as we grow our volumes and continue to introduce new and higher value products.
Cost of Revenues and Gross Margin
Our cost of revenues consists primarily of the cost of raw materials and components, direct labor expenses and manufacturing overhead. Cost of revenues includes compensation and other costs related to our manufacturing and service operations, facilities and equipment costs, shipping costs, cost of duties and tariffs, write-downs for inventory obsolescence and provisions for warranty obligations. Inventories are written down and charged to cost of revenues when identified as excess or obsolete. Given the fixed nature of our facilities and equipment costs, we expect gross margin to increase as revenues and volumes increase; however, gross margins may fluctuate from period to period depending on product mix and the level of capacity utilization.
Operating Expenses
Research and Development
Our research and development expense consists primarily of compensation, development expenses related to the design of our products and certain components, allocated facilities costs and the cost of materials and components to build prototype devices for testing. Costs related to product development are recorded as research and development expense in the period in which they are incurred. We expect that research and development expense will increase in absolute dollars as we invest in developing new products and technologies. However, we expect research and development expense to decrease modestly as a percentage of revenues over the longer term as revenues grow, although research and development expense may fluctuate as a percentage of revenues from period to period due to the timing and extent of these expenses.
Sales, General and Administrative
Our sales and marketing expense consists primarily of costs related to compensation, trade shows, travel, allocated facilities costs, amortization of assets used for demonstration purposes, commissions and other sales and marketing expenses, including charges and benefits related to the change in allowance for doubtful accounts.
Our general and administrative expense consists primarily of compensation and associated costs for executive management, finance, legal and other administrative personnel, outside legal and professional fees, allocated facilities costs and other general corporate expenses. Also included in general and administrative expense for the year ended
December 31, 2018
are costs associated with preparing for our initial public offering.
We expect sales, general and administrative expense will continue to increase in absolute dollars as we continue to grow and incur the costs of compliance associated with being a publicly-traded company, including legal, audit, compliance and consulting fees. Although sales, general and administrative expense may fluctuate as a percentage of revenues from period to period due to the timing and extent of these expenses, over the long term, we expect sales, general and administrative expense to decrease modestly as a percentage of revenues as we scale with the growth of our business.
Interest Income (Expense), Net
Interest income (expense), net, primarily consists of interest income on our deposit accounts, net of interest expense on outstanding debt under our credit facilities and any other indebtedness we may incur.
Other Expense
Other expense primarily relates to realized and unrealized gains and losses related to our foreign currency transactions and balances and other non-operating gains and losses.
Income Tax Expense
We record income tax expense for taxes in our foreign jurisdictions including China and Finland. We also record tax expense for uncertain tax positions taken and associated penalties and taxes. For further information, refer to Note 12,
Income Taxes
, in Item 8 of this report.
We consider all available evidence, both positive and negative, in assessing the extent to which a valuation allowance should be applied against our deferred tax assets. While earnings through
2018
in the U.S resulted in the utilization of a portion of our accumulated net operating loss carry-forwards, due to the uncertainly with respect to their ultimate realizability, we continue to maintain a full valuation allowance as of
December 31, 2018
.
40
Given our current earnings levels and anticipated future earnings, we believe that there is a reasonable possibility that we will continue to utilize these tax assets, and within the next 12 months, sufficient positive evidence may become available to allow us to reach a conclusion that a significant portion of the valuation allowance will no longer be needed. A release of the valuation allowance would result in the recognition of certain deferred tax assets and a decrease to income tax expense for the period the release is recorded.
Results of Operations
The following table sets forth our results of operations for the periods presented:
|
Year Ended December 31,
|
||||||||||||||
|
2018
|
2017
|
2016
|
||||||||||||
|
(in thousands)
|
||||||||||||||
|
Revenues
|
$
|
191,359
|
|
$
|
138,580
|
|
$
|
101,325
|
|
|||||
|
Cost of revenues
|
124,398
|
|
94,306
|
|
78,159
|
|
||||||||
|
Gross profit
|
66,961
|
|
44,274
|
|
23,166
|
|
||||||||
|
Operating expenses:
|
||||||||||||||
|
Research and development
|
21,054
|
|
15,123
|
|
15,239
|
|
||||||||
|
Sales, general and administrative
|
28,844
|
|
19,353
|
|
17,265
|
|
||||||||
|
Total operating expenses
|
49,898
|
|
34,476
|
|
32,504
|
|
||||||||
|
Income (loss) from operations
|
17,063
|
|
9,798
|
|
(9,338
|
)
|
||||||||
|
Other income (expense):
|
||||||||||||||
|
Interest expense, net
|
728
|
|
(1,269
|
)
|
(2,229
|
)
|
||||||||
|
Other expense
|
(253
|
)
|
(1,834
|
)
|
(753
|
)
|
||||||||
|
Income (loss) before income taxes
|
17,538
|
|
6,695
|
|
(12,320
|
)
|
||||||||
|
Income tax expense
|
3,600
|
|
4,858
|
|
1,882
|
|
||||||||
|
Net income (loss)
|
$
|
13,938
|
|
$
|
1,837
|
|
$
|
(14,202
|
)
|
|||||
The following table sets forth selected consolidated of operations data for the periods presented, indicated as a percentage of revenues:
|
Year Ended December 31,
|
|||||||||||
|
2018
|
2017
|
2016
|
|||||||||
|
(as a percentage of revenues)
|
|||||||||||
|
Revenues
|
100.0
|
|
100.0
|
|
100.0
|
|
|||||
|
Cost of revenues
|
65.0
|
|
68.1
|
|
77.1
|
|
|||||
|
Gross profit
|
35.0
|
|
31.9
|
|
22.9
|
|
|||||
|
Operating expenses:
|
|||||||||||
|
Research and development
|
11.0
|
|
10.9
|
|
15.0
|
|
|||||
|
Sales, general and administrative
|
15.1
|
|
14.0
|
|
17.0
|
|
|||||
|
Total operating expenses
|
26.1
|
|
24.9
|
|
32.1
|
|
|||||
|
Income (loss) from operations
|
8.9
|
|
7.1
|
|
(9.2
|
)
|
|||||
|
Other income (expense):
|
|||||||||||
|
Interest expense, net
|
0.4
|
|
(0.9
|
)
|
(2.2
|
)
|
|||||
|
Other expense
|
(0.1
|
)
|
(1.3
|
)
|
(0.7
|
)
|
|||||
|
Income (loss) before income taxes
|
9.2
|
|
4.8
|
|
(12.2
|
)
|
|||||
|
Income tax expense
|
1.9
|
|
3.5
|
|
1.9
|
|
|||||
|
Net income (loss)
|
7.3
|
|
1.3
|
|
(14.0
|
)
|
|||||
41
Comparison of Years Ended December 31,
2018
and
2017
Revenues
|
Year Ended December 31,
|
Change
|
|||||||||||||
|
2018
|
2017
|
Amount
|
%
|
|||||||||||
|
(in thousands, except percentages)
|
||||||||||||||
|
Revenues
|
$
|
191,359
|
|
$
|
138,580
|
|
$
|
52,779
|
|
38.1
|
%
|
|||
Revenues for the year ended
December 31, 2018
increased
$52.8 million
, or
38.1%
compared to the same period in
2017
. The increase was driven by growth in each of our three key end markets and across all regions.
Revenues from the industrial end market
increased
$26.2 million
, or approximately
46%
from the same period in
2017
. The increase was driven by the higher sales of our fiber lasers across all regions, as well as higher sales of optical fiber products to our industrial customers. Revenues from the microfabrication end market grew
$13.2 million
, or
22%
, compared to the same period in
2017
. The increase was driven by sales growth to customers for consumer electronics and semiconductor applications, primarily in North America and Asia. Revenues from the aerospace and defense end market
increased
$13.4 million
, or
64%
compared to the same period in
2017
. This increase was primarily driven by higher semiconductor laser sales to new and existing customers for defense applications, as well as new government contracts secured in the second half of 2017.
Cost of Revenues and Gross Margin
|
Year Ended December 31,
|
Change
|
|||||||||||||
|
2018
|
2017
|
Amount
|
%
|
|||||||||||
|
(in thousands, except percentages)
|
||||||||||||||
|
Cost of revenues
|
$
|
124,398
|
|
$
|
94,306
|
|
$
|
30,092
|
|
31.9
|
%
|
|||
|
Gross profit
|
$
|
66,961
|
|
$
|
44,274
|
|
$
|
22,687
|
|
51.2
|
%
|
|||
|
Gross margin as % of revenue
|
35.0
|
%
|
31.9
|
%
|
—
|
|
3.1
|
%
|
||||||
Cost of revenues for the year ended
December 31, 2018
increased
$30.1 million
, or
31.9%
, on higher volumes compared to the same period in
2017
. Gross profit increased
$22.7 million
, or
51.2%
for the
years ended December 31, 2018
, compared to the same period in
2017
. This was driven by higher sales volumes combined with improvements in product costs.
Gross margin for the year ended
December 31, 2018
increased
from
31.9%
to
35.0%
compared to the same period in
2017
. The improvement in gross margin was driven by lower manufacturing overhead as a percentage of revenues due to higher production volumes, coupled with cost reductions realized in our laser production. The increase was offset by continued ASP erosion in industrial end market, primarily in China, and a decrease in overhead capitalized in inventory at the end of 2018.
Operating Expenses
Research and Development
|
Year Ended December 31,
|
Change
|
|||||||||||||
|
2018
|
2017
|
Amount
|
%
|
|||||||||||
|
(in thousands, except percentages)
|
||||||||||||||
|
Research and development
|
$
|
21,054
|
|
$
|
15,123
|
|
$
|
5,931
|
|
39.2
|
%
|
|||
Research and development expense for the year ended
December 31, 2018
increased
$5.9 million
, or
39.2%
, compared to the same period in
2017
. The
increase
was primarily related to higher compensation costs on increased headcount, including
$1.2 million
in additional stock-based compensation, and higher material spend of
$1.7 million
, as we continue to develop new and improve existing products.
42
Sales, General and Administrative
|
Year Ended December 31,
|
Change
|
|||||||||||||
|
2018
|
2017
|
Amount
|
%
|
|||||||||||
|
(in thousands, except percentages)
|
||||||||||||||
|
Sales, general, and administrative
|
$
|
28,844
|
|
$
|
19,353
|
|
$
|
9,491
|
|
49.0
|
%
|
|||
Sales, general and administrative expense for the year ended
December 31, 2018
increased
$9.5 million
, or
49.0%
, compared to the same period in
2017
. The
increase
was primarily driven by higher compensation costs on increased headcount within our sales, general, and administrative functions, including higher stock-based compensation of
$2.8 million
due to the new grants issued 2018. We also incurred higher professional services of
$1.0 million
as a result of our initial public offering, which we completed in April 2018. In addition, sales expenses increased due to a
$1.0 million
recovery of a previously reserved receivable that occurred in the third quarter of 2017. Other increases were related to higher insurance and other expenses of being a public company, and travel and marketing costs.
Interest Income (Expense), net
|
Year Ended December 31,
|
Change
|
||||||||||||
|
2018
|
2017
|
Amount
|
%
|
||||||||||
|
(in thousands, except percentages)
|
|||||||||||||
|
Interest income (expense), net
|
$
|
728
|
|
$
|
(1,269
|
)
|
$
|
1,997
|
|
NM
|
|||
Interest income, net, for the year ended
December 31, 2018
increased
$2.0 million
, compared to the net expense during the same period in
2017
. The
increase
was primarily related to interest income of approximately
$1.5 million
generated on the cash received in connection with our initial and follow-on public offerings. Also contributing was the restructuring and substantial pay down of our debt facilities, which included the extinguishment of our debt with Multiplier Growth Partners SPV I, LP in July 2017, and refinancing our facility with Pacific Western Bank in September 2018.
Other Expense
|
Year Ended December 31,
|
Change
|
|||||||||||||
|
2018
|
2017
|
Amount
|
%
|
|||||||||||
|
(in thousands, except percentages)
|
||||||||||||||
|
Other expense
|
$
|
(253
|
)
|
$
|
(1,834
|
)
|
$
|
1,581
|
|
(86.2
|
)%
|
|||
The decrease in other expense for the year ended
December 31, 2018
compared to the same period in
2017
is primarily attributable to a non-recurring
$0.9 million
loss on debt extinguishment related to pay off of our loan facility with Multiplier Growth Partners SPV I, LP in the prior year.
Income Tax Expense
|
Year Ended December 31,
|
Change
|
|||||||||||||
|
2018
|
2017
|
Amount
|
%
|
|||||||||||
|
(in thousands, except percentages)
|
||||||||||||||
|
Income tax expense
|
$
|
3,600
|
|
$
|
4,858
|
|
$
|
(1,258
|
)
|
(25.9
|
)%
|
|||
Income tax expense for the year ended
December 31, 2018
decreased
$1.3 million
, or
25.9%
compared to
2017
. There is a limited tax expense associated with our operations in the U.S. as we maintain a full valuation allowance against our U.S. deferred tax assets. The
$1.3 million
decrease in tax expense was driven by the change in the jurisdictional mix of earnings, which reflects a
$20.0 million
increase in income from our U.S. operations compared to a
$9.1 million
decrease in foreign earnings. The worldwide effective tax rate for the year ended
December 31, 2018
was
20.5%
compared to
72.6%
in
2017
; the decrease in effective tax rate is driven by the increase in U.S. earnings.
43
Comparison of Years Ended December 31,
2017
and
2016
Revenues
|
Year Ended December 31,
|
Change
|
|||||||||||||
|
2017
|
2016
|
Amount
|
%
|
|||||||||||
|
(in thousands, except percentages)
|
||||||||||||||
|
Revenues
|
$
|
138,580
|
|
$
|
101,325
|
|
$
|
37,255
|
|
36.8
|
%
|
|||
Revenues for
2017
increased
$37.3 million
, or
36.8%
compared to
2016
, primarily driven by higher revenues from each of our three key end markets. Revenues from the industrial end market increased
$21.9 million
due to significantly higher sales volumes of fiber lasers to new and existing customers, primarily in China, North America and South Korea. Approximately half of the increase in industrial fiber laser volumes was related to our introduction of new products as we continued to fill out our product portfolio and introduce higher power levels. The remaining increase was attributable to customer adoption of our existing products due to growth in cutting and other industrial applications. Revenue growth from the microfabrication end market was attributable to higher laser sales to customers in North America, Europe and Japan, primarily driven by continued growth in the microelectronics market, particularly for consumer electronics applications. Revenues from the aerospace and defense end market grew
$2.1 million
due to higher sales volumes of semiconductor lasers to a large aerospace and defense customer in North America.
Cost of Revenues and Gross Margin
|
Year Ended December 31,
|
Change
|
|||||||||||||
|
2017
|
2016
|
Amount
|
%
|
|||||||||||
|
(in thousands, except percentages)
|
||||||||||||||
|
Cost of revenues
|
$
|
94,306
|
|
$
|
78,159
|
|
$
|
16,147
|
|
20.7
|
%
|
|||
|
Gross profit
|
$
|
44,274
|
|
$
|
23,166
|
|
$
|
21,108
|
|
91.1
|
%
|
|||
|
Gross margin as % of revenue
|
31.9
|
%
|
22.9
|
%
|
—
|
|
9.0
|
%
|
||||||
Cost of revenues for
2017
increased
$16.1 million
, or
20.7%
, primarily due to higher volumes compared to
2016
. Gross profit increased
$21.1 million
, or
91.1%
compared to
2016
due to the increase in sales volumes combined with lower product costs and increased absorption of fixed costs.
Gross margin increased to
31.9%
in
2017
from
22.9%
in
2016
. The improvement in gross margin was primarily driven by manufacturing efficiencies realized in our laser production, as well as cost reductions for raw materials, a reduction in manufacturing overhead as a percentage of revenues due to higher production volumes, and an increase in overhead capitalized in inventory due to higher inventory levels at the end of the 2017.
Operating Expenses
Research and Development
|
Year Ended December 31,
|
Change
|
|||||||||||||
|
2017
|
2016
|
Amount
|
%
|
|||||||||||
|
(in thousands, except percentages)
|
||||||||||||||
|
Research and development
|
$
|
15,123
|
|
$
|
15,239
|
|
$
|
(116
|
)
|
(0.8
|
)%
|
|||
Research and development expense for
2017
decreased
$0.1 million
, or
0.8%
, compared to
2016
. The decrease was related to lower depreciation and amortization primarily due to technology acquired in our acquisition of Arbor Photonics, Inc. being fully amortized in 2016, and lower usage of development materials due to product development cycles. These decreases were partially offset by higher compensation costs as we continued to increase headcount to support future development initiatives.
44
Sales, General and Administrative
|
Year Ended December 31,
|
Change
|
|||||||||||||
|
2017
|
2016
|
Amount
|
%
|
|||||||||||
|
(in thousands, except percentages)
|
||||||||||||||
|
Sales, general, and administrative
|
$
|
19,353
|
|
$
|
17,265
|
|
$
|
2,088
|
|
12.1
|
%
|
|||
Sales, general and administrative expense for
2017
increased
$2.1 million
, or
12.1%
, compared to
2016
. The increase was primarily due a to
$1.1 million
increase in expenses for audit, legal and other professional services largely attributable to preparation for our initial public offering. Other increases in sales, general and administrative expense were related to higher compensation costs, driven by growing headcount within our sales, general and administrative functions. We also incurred higher depreciation and amortization primarily due to an increase in demonstration equipment driven by the introduction of new products and expansion to new customers. These increases were partially offset by a
$1.0 million
reduction in sales expense as a result of the recovery of a previously reserved receivable from a Chinese customer.
Interest Expense, net
|
Year Ended December 31,
|
Change
|
|||||||||||||
|
2017
|
2016
|
Amount
|
%
|
|||||||||||
|
(in thousands, except percentages)
|
||||||||||||||
|
Interest expense, net
|
$
|
(1,269
|
)
|
$
|
(2,229
|
)
|
$
|
960
|
|
(43.1
|
)%
|
|||
Interest expense, net, for
2017
decreased
$1.0 million
, or
43.1%
, compared to
2016
. The decrease was primarily due to lower balances of debt outstanding coupled with restructuring of our debt facilities, which included the extinguishment of debt with Multiplier Growth Partners SPV I, LP in July 2017 as it carried a higher interest rate than our new loan facility with Pacific Western Bank. We also recorded
$0.2 million
of interest income on recovery of a past due receivable from a Chinese customer and $0.1 million of interest income on higher cash deposit balances as a result of additional equity financing completed in 2017.
Other Expense
|
Year Ended December 31,
|
Change
|
|||||||||||||
|
2017
|
2016
|
Amount
|
%
|
|||||||||||
|
(in thousands, except percentages)
|
||||||||||||||
|
Other expense
|
$
|
(1,834
|
)
|
$
|
(753
|
)
|
$
|
(1,081
|
)
|
143.6
|
%
|
|||
The increase in other expense for
2017
compared to
2016
was primarily attributable to a
$0.9 million
loss on debt extinguishment related to paying off our loan facility with Multiplier Growth Partners SPV I, LP. Other changes included a decrease of
$0.3 million
in subsidy income in China, offset by lower net unrealized and realized foreign exchange losses due to more favorable foreign exchange rate fluctuations during the year.
Income Tax Expense
|
Year Ended December 31,
|
Change
|
|||||||||||||
|
2017
|
2016
|
Amount
|
%
|
|||||||||||
|
(in thousands, except percentages)
|
||||||||||||||
|
Income tax expense
|
$
|
4,858
|
|
$
|
1,882
|
|
$
|
2,976
|
|
158.1
|
%
|
|||
Income tax expense for
2017
increased
$3.0 million
, or
158.1%
, compared to
2016
. There is limited tax expense associated with our operations in the United States as we maintain a full valuation allowance against our U.S. deferred tax assets. Our tax expense is impacted by the geographic location of our pre‑tax book income and is primarily related to operations in China and Finland. The
$3.0 million
increase in tax expense from
$1.9 million
in 2016 to
$4.9 million
in 2017 is primarily related to a
$9.1 million
increase in pre‑tax foreign earnings, as well as the mix of income between China and Finland. Our effective foreign tax rate is approximately
31%
, consisting of a
35%
effective tax rate on Chinese earnings and a
20%
effective tax rate on Finnish earnings. The Chinese effective tax rate consists of the
25%
statutory rate and dividend withholding tax that is being accrued due to our intention to repatriate the earnings in the future. Finland has a
20%
statutory rate.
45
Non‑GAAP Financial Information
We monitor Adjusted EBITDA, a non-GAAP financial metric, to help us evaluate our business, measure our performance, identify trends affecting our business, formulate business plans and make strategic decisions. In addition to our results determined in accordance with GAAP, we believe Adjusted EBITDA is useful in evaluating our operating performance.
We define Adjusted EBITDA as net income adjusted for income tax expense, other non‑operating expense or income, net interest expense or income, depreciation and amortization, stock‑based compensation and other special items as determined by management. We believe that Adjusted EBITDA is a meaningful measure of performance as it is commonly utilized by us and the investment community to analyze operating performance in our industry.
The following table sets forth Adjusted EBITDA and a reconciliation from net income, the most comparable GAAP measure, for the periods presented.
|
Year Ended December 31,
|
||||||||||||
|
2018
|
2017
|
2016
|
||||||||||
|
(in thousands)
|
||||||||||||
|
Net income (loss)
|
$
|
13,938
|
|
$
|
1,837
|
|
$
|
(14,202
|
)
|
|||
|
Income tax expense
|
3,600
|
|
4,858
|
|
1,882
|
|
||||||
|
Other expense
|
253
|
|
1,834
|
|
753
|
|
||||||
|
Interest (income) expense, net
|
(728
|
)
|
1,269
|
|
2,229
|
|
||||||
|
Depreciation and amortization
|
8,288
|
|
7,922
|
|
8,099
|
|
||||||
|
Stock-based compensation
|
4,805
|
|
369
|
|
308
|
|
||||||
|
Adjusted EBITDA
|
$
|
30,156
|
|
$
|
18,089
|
|
$
|
(931
|
)
|
|||
Adjusted EBITDA as a non-GAAP financial measure reflects an additional way of viewing aspects of our business that, when viewed with our GAAP results and the accompanying reconciliation to the corresponding GAAP financial measure included in the table above, may provide a more complete understanding of factors and trends affecting our business. This non-GAAP financial measure should not be relied upon to the exclusion of GAAP financial measures. We believe that the non‑GAAP measure disclosed herein is only useful as an additional tool to help management and investors make informed decisions about our financial and operating performance. By definition, non‑GAAP measures do not give a full understanding of our performance. To be useful, they must be used in conjunction with the comparable GAAP measures. In addition, non‑GAAP financial measures are not standardized. It may not be possible to compare our financial measures with other companies’ non‑GAAP financial measures having the same or similar names. We strongly encourage investors to review our consolidated financial statements and the notes thereto in their entirety and not to rely on any single financial measure.
Liquidity and Capital Resources
We had cash and cash equivalents of
$149.5 million
,
$36.7 million
and
$13.5 million
as of
December 31, 2018
,
2017
and
2016
, respectively. On
April 30, 2018
and
September 11, 2018
, upon the closing of our initial and follow-on public offerings, we received net proceeds of
$138.3 million
after deducting underwriting discounts and commissions and other offering costs.
Our principal uses of liquidity are to fund our working capital needs, purchase new capital equipment, and service our debt obligations. To date, our principal sources of liquidity have been the net proceeds we received through sales of equity securities, borrowings under our debt facilities and payments received from customers for our products.
We believe our existing sources of liquidity will be sufficient to meet our working capital and capital expenditure needs for at least the next 12 months. However, we may need to raise additional capital to expand the commercialization of our products, fund our operations and further our research and development activities. Our future capital requirements may vary materially from period to period and will depend on many factors, including the timing and extent of spending on research and development efforts, the expansion of sales and marketing activities, the continuing market acceptance of our products and ongoing investments to support the growth of our business. We may in the future enter into arrangements to acquire or invest in complementary businesses, services, technologies and intellectual property rights. From time to time, we may explore additional financing sources which could include equity, equity‑linked and debt financing arrangements.
46
The following table summarizes our cash flows for the periods presented:
|
Year Ended December 31,
|
|||||||||||
|
2018
|
2017
|
2016
|
|||||||||
|
(in thousands)
|
|||||||||||
|
Net cash provided by operating activities
|
$
|
3,335
|
|
$
|
3,411
|
|
$
|
5,959
|
|
||
|
Net cash used in investing activities
|
(11,679
|
)
|
(5,477
|
)
|
(4,027
|
)
|
|||||
|
Net cash provided by financing activities
|
121,301
|
|
24,419
|
|
3,641
|
|
|||||
|
Effect of exchange rate changes on cash
|
(166
|
)
|
834
|
|
1,072
|
|
|||||
|
Net increase in cash
|
$
|
112,791
|
|
$
|
23,187
|
|
$
|
6,645
|
|
||
Net Cash Provided by Operating Activities
During the year ended
December 31, 2018
, net cash
provided by
operating activities was
$3.3 million
which was primarily driven by
$13.9 million
of net income reported in the current period, non‑cash adjustments of
$11.8 million
related to depreciation, stock-based compensation, and other items as well as a
$2.2 million
increase in liabilities largely driven by timing of vendor payments, other accrued expenses and income taxes payable. These positive adjustments were partially offset by an
$13.7 million
increase in accounts receivable, due to the large portion of fourth quarter revenue recognized in the last month of the quarter, and
$6.1 million
increase in inventory, in support of higher revenue and production levels,
$2.5 million
increase in other current assets driven by increases in duty drawback and value-added taxes receivables, prepaid insurance, and other prepaid expenses, and a
$2.3 million
increase in other assets.
During the year ended
December 31, 2017
, net cash
provided by
operating activities was
$3.4 million
which was driven by a
$1.8 million
of net income reported in the period, non-cash adjustments of
$9.0 million
related to depreciation, deferred taxes, debt extinguishment, and other items. These positive adjustments were offset by a
$9.9 million
increase in inventory and
$3.5 million
increase in accounts receivable, which grew to support higher revenue levels. Those uses of cash were offset by
$5.7 million
increase in accounts payable and other accrued expenses, driven by increasing volume of material purchases, year-end payroll and bonus accruals, and timing of payments to vendors.
During the year ended
December 31, 2016
, net cash provided by operating activities was $6.0 million which was driven by a $9.0 million reduction in inventory related to inventory management programs put in place in 2016 to optimize inventory levels relative to revenues and non‑cash adjustments of $9.0 million related to depreciation and other items as well as a $3.0 million increase in cash related to fluctuations in the balance of accrued liabilities. These positive adjustments were partially offset by net loss of $14.2 million and $3.1 million related to an increase in the balance of other assets.
Net Cash Used in Investing Activities
During the year ended
December 31, 2018
, net cash
used in
investing activities was
$11.7 million
which was primarily due to capital expenditures during the period related to investments in manufacturing equipment and facilities in the U.S and China, as well as investments in our patent portfolio.
During the year ended
December 31, 2017
, net cash
used in
investing activities was
$5.5 million
which was primarily due to capital expenditures during the year related to further expanding our manufacturing capacity in our Shanghai facility, purchases of new manufacturing and lab equipment, and investment in our IT infrastructure.
During the year ended
December 31, 2016
, net cash used in investing activities was $4.0 million, which was due to $4.0 million of capital expenditures primarily related to expanding manufacturing capacity in our Shanghai facility.
Net Cash Provided by Financing Activities
During the year ended
December 31, 2018
, net cash
provided by
financing activities was
$121.3 million
which was driven by
$100.2 million
and
$37.9 million
in net proceeds related to our initial and follow-on public offerings less payment of offering expenses, respectively. These net proceeds were offset by net principal debt payments of
$17.4 million
.
During the year ended
December 31, 2017
, net cash
provided by
financing activities was
$24.4 million
which was due to
$27.5 million
of proceeds related to issuance of convertible preferred stock partially offset by
$2.8 million
in debt and capital lease payments.
47
During the year ended
December 31, 2016
, net cash provided by financing activities was $3.6 million which was due to proceeds from the issuance of convertible preferred stock of
$12.0 million
partially offset by principal payments on loans of
$8.3 million
.
Credit Facilities
Pacific Western Bank Loan Facility
In March 2014, we entered into a Loan and Security Agreement with Pacific Western Bank (successor in interest to Square 1 Bank), as lender. The loan facility initially provided for up to
$15.0 million
in aggregate commitments, comprised of a
$7.5 million
term loan and a revolving loan facility subject to a borrowing base of eligible accounts receivable and inventory. In August 2014, the revolving loan facility was increased to
$20.0 million
, with adjustments to the borrowing base. We amended and restated the loan facility in March 2018. The amended and restated loan facility provided for
$25.0 million
in aggregate commitments, including a term loan of
$15.0 million
and a revolving loan facility equal to the lesser of (i)
$25.0 million
minus the unpaid principal amount of the term loan and the amount of any reserves for ancillary banking services, or (ii) a borrowing base equal to 85% of eligible accounts receivable plus the lesser of $5.5 million or 35% of eligible inventory.
We most recently amended and restated this loan facility in September 2018. The second amended and restated loan and security agreement provides a
$40 million
revolving credit facility. Our obligations under the loan facility are secured by substantially all of our assets.
We initially borrowed
$16.1 million
under this line of credit to refinance the existing outstanding balance of the term and revolving loans under the prior agreement. These borrowings were repaid, and the outstanding balance under the amended and restated loan facility was
zero
as of
December 31, 2018
.
Borrowings under the revolving credit facility bear interest at a per annum rate, depending on certain liquidity thresholds, ranging from adjusted LIBOR plus
1.35%
to
2.25%
, or prime rate minus
1.40%
to
0.50%
. Prior to the amendment and restatement of our loan facility in September 2018, the term and revolving loans bore interest at a rate equal to the bank’s prime rate plus
0.50%
per annum, subject to a floor of
5.00%
per annum. Our line of credit also bears an unused credit fee at a per annum rate of
0.20%
. Interest is due and payable monthly in arrears.
Any outstanding principal and interest on the revolving loan is due and payable on
September 24, 2021
. We may prepay loans under the loan facility in whole or in part at any time without premium or penalty.
The loan agreement contains customary representations and warranties, events of default and affirmative and negative covenants, including, among other things, covenants that limit or restrict our ability to incur indebtedness, grant liens, merge or consolidate, dispose of assets, make investments, make acquisitions, enter into certain transactions with affiliates, engage in any new line of business, pay dividends or make distributions, or repurchase common shares. We are also required to comply with a minimum cash and cash equivalents threshold of
$50.0 million
. In the event cash and cash equivalents balance is less than
$50.0 million
, we have to comply with a minimum capital expenditures covenant determined in relation to our adjusted EBITDA for the quarter.
The facility also contains events of default that include, among others, non‑payment defaults, inaccuracy of representations and warranties, covenant defaults, cross‑defaults to other indebtedness and material obligations, judgment defaults, bankruptcy and insolvency defaults and a change of control default. Any default that is not cured or waived could result in the acceleration of the obligations under the loan facility, an increase in the applicable interest rate under the loan facility to a per annum rate equal to 5.00% above the applicable interest rate and would permit our lender to exercise remedies with respect to all of the collateral that is securing the loan facility.
As of
December 31, 2018
and
December 31, 2017
, we were in compliance with the covenants under our loan facilities.
Multiplier Loan Facility
In July 2015, we entered into a loan facility with Multiplier Growth Partners SPV I, LP, or Multiplier, as lender, and our subsidiary, Arbor Photonics, LLC, as co-borrower. The loan facility provided for a $15.0 million term loan available in two tranches and was subordinated to the loan facility with Pacific Western Bank. We borrowed $12.5 million in aggregate principal amount under the loan facility. The term loan bore interest at a rate equal to 11.00% per annum. On July 17, 2017, we repaid the term loan in full and terminated the loan facility. In connection with our prepayment and termination of the loan facility, we were required to pay a prepayment premium equal to 3.00% of the principal amount. The transaction qualified as a debt extinguishment and a loss of
$0.9 million
was recorded in other expense in the third quarter of 2017 as a result.
48
Contractual Obligations
The following table sets forth a summary of our contractual obligations as of
December 31, 2018
:
|
Payments Due by Period
|
|||||||||||||||||||
|
Less
Than
1 Year
|
1-3
Years
|
3-5
Years
|
More
Than
5 Years
|
Total
|
|||||||||||||||
|
(in thousands)
|
|||||||||||||||||||
|
Operating lease obligations
|
$
|
2,774
|
|
$
|
4,456
|
|
$
|
2,316
|
|
$
|
956
|
|
$
|
10,502
|
|
||||
|
Long term debt obligations, including current portion
|
36
|
|
5
|
|
—
|
|
—
|
|
41
|
|
|||||||||
|
Estimated interest payments
|
82
|
|
141
|
|
—
|
|
—
|
|
223
|
|
|||||||||
|
Capital lease obligations
|
70
|
|
40
|
|
—
|
|
—
|
|
110
|
|
|||||||||
|
Royalty obligations
|
102
|
|
322
|
|
340
|
|
255
|
|
1,019
|
|
|||||||||
|
Purchase commitments
|
12,657
|
|
—
|
|
—
|
|
—
|
|
12,657
|
|
|||||||||
|
Total
|
$
|
15,721
|
|
$
|
4,964
|
|
$
|
2,656
|
|
$
|
1,211
|
|
$
|
24,552
|
|
||||
We also have uncertain tax positions of
$5.9 million
as of
December 31, 2018
. However, as we are unable to reliably estimate the period of potential cash settlement, we have not included these amounts in the table of contractual obligations.
There have been no material changes to the contractual obligations since
December 31, 2018
.
Critical Accounting Policies and Significant Estimates
Our consolidated financial statements are prepared in accordance with generally accepted accounting principles in the United States and include our accounts and the accounts of our wholly owned subsidiaries. All intercompany transactions and balances have been eliminated in consolidation. The preparation of these financial statements requires our management to make estimates and assumptions that affect the reported amounts of assets, liabilities, revenues, costs and expenses and related disclosures. Our estimates are based on our historical experience and on various other factors that we believe are reasonable under the circumstances, the results of which form the basis for making judgments about the carrying value of assets and liabilities that are not readily apparent from other sources. Actual results may differ from these judgments and estimates under different assumptions or conditions and any such differences may be material. We believe that our significant accounting policies, which are discussed in the footnotes to our consolidated financial statements, and the accounting policies discussed below, involve a greater degree of complexity, involving management's judgments and estimates. Accordingly, these are the policies we believe are critical to understanding our financial condition and historical and future results of operations:
|
•
|
revenue recognition;
|
|
•
|
inventory; and
|
|
•
|
income taxes
|
Revenue Recognition
Our revenues are generated from the sale of semiconductor lasers, fiber lasers and other related products. Revenues are recognized when all of the following criteria are met:
|
•
|
we enter into a legally binding arrangement with a customer;
|
|
•
|
we deliver the product or provide the service. Revenues are recognized when legal title has passed to the customer upon shipment or delivery, depending on the shipment term. Title and risk of loss generally pass to the customer at the time of delivery according to the shipping terms. All costs incurred by us for shipping and handling are classified as cost of revenues; any amounts billed to a customer related to shipping and handling are classified as an offset to cost of revenues;
|
|
•
|
we determine the fee is fixed or determinable based on the payment terms associated with the transaction and free of contingencies or significant uncertainties; and
|
|
•
|
collectability is reasonably assured. We assess collectability based on credit analysis and payment history. We require cash collateral in the normal course of business if customers do not meet our criteria established for offering credit. We also maintain certain levels of credit insurance for small portion of our customers. Our typical credit term is net 30 days.
|
49
In limited circumstances when customer‑specified acceptance criteria exist, revenues are deferred until customer acceptance if we cannot demonstrate that the product meets the specifications prior to shipment. If installation is included with the sale of a product, installation revenues are deferred until installation is complete. For arrangements with multiple elements, revenues are allocated across the separately identified deliverables and may be recognized or deferred.
Inventory
Inventory is stated at the lower of cost or net realizable value. Inventory includes raw materials and components that may be specialized in nature and subject to obsolescence. We record write‑downs for excess or obsolete inventory items. The write‑downs are based upon a review of inventory materials on hand, which we compare with historical usage and age of the underlying inventory. We determine the valuation of excess and obsolete inventory by considering historical usage, inventory aging and other qualitative factors such as future demand and selling prices.
Income Taxes
The determination of our tax provision is highly dependent upon the geographic composition of worldwide earnings and tax regulations governing each region and is subject to judgments and estimates.
The calculation of tax liabilities involves significant judgment in estimating the impact of uncertainties in the application of complex tax laws. Resolution of these uncertainties in a manner inconsistent with our expectations could have a material impact on our business, results of operations and financial position. We believe we have adequately reserved for our uncertain tax positions; however, no assurance can be given that the final tax outcome of these matters will not be different than what we expect. We adjust these reserves in light of changing facts and circumstances, such as the closing of a tax audit or the refinement of an estimate. To the extent that the final tax outcome for these matters is different than the amounts recorded, such differences will impact the provision for income taxes in the period in which such determination is made. We provide a valuation allowance for deferred tax assets when we do not consider realization of such assets to be more likely than not. Due to uncertainty with respect to ultimate realizability of U.S. deferred tax assets driven by our historical U.S. entity net operating losses this decade with the exception of fiscal 2018, we have recorded a valuation allowance against the U.S. deferred tax assets as of
December 31, 2018
.
We file income tax returns in the U.S. federal jurisdiction, various states and various foreign jurisdictions, including China and Finland. At
December 31, 2018
, our tax years
2015
through
2018
,
2014
through
2018
, and
2008
through
2018
, remain open for examination in the federal, state and foreign jurisdictions, respectively. However, to the extent allowed by law, the taxing authorities may have the right to examine prior periods where net operating losses and credits were generated and carried forward, and make adjustments up to the net operating loss and credit carryforward amounts. We are not currently under federal, state, or foreign examination by any tax authority.
In December 2017, the Tax Cuts and Jobs Act (the “2017 Tax Act”) introduced significant changes to U.S. income tax law. Effective 2017, the 2017 Tax Act included a one-time transition tax on certain foreign earnings and the acceleration of depreciation for certain assets placed into service after September 27, 2017. Effective 2018, the 2017 Tax Act reduced the U.S. statutory tax rate from
34%
to
21%
, and created new taxes on certain foreign-sourced earnings, repealed the domestic manufacturing deduction, and placed additional limitations on executive compensation and limitations on the deductibility of interest.
Our 2017 financial results reflected the income tax effects of the 2017 Tax Act for which the accounting under ASC Topic 740 was complete and provisional amounts for those specific income tax effects of the 2017 Tax Act for which the accounting under ASC Topic 740 was incomplete but a reasonable estimate could be determined. The accounting for the income tax effects of the 2017 Tax Act is considered complete at
December 31, 2018
, with no material changes from 2017.
Off-Balance Sheet Arrangements
Since inception, we have not had any relationships with unconsolidated entities or financial partnerships, such as entities often referred to as structured finance or special purpose entities, which would have been established for the purpose of facilitating off-balance sheet arrangements or for another contractually narrow or limited purpose.
Inflation
We do not believe that inflation has had a material effect on our business, financial condition or results of operations. If our costs were to become subject to significant inflationary pressures, we may not be able to fully offset such higher costs through price increases. Our inability or failure to do so could materially adversely affect our business, financial condition and results of operations.
50
Recent Accounting Pronouncements
See Note 2,
Summary of Significant Accounting Policies
, in Item 8 of this report.
ITEM 7A. QUANTITATIVE AND QUALITATIVE DISCLOSURES ABOUT MARKET RISK
Interest Rate Risk
We had cash and cash equivalents of
$149.5 million
as of
December 31, 2018
. The goals of our investment policy are liquidity and capital preservation. We do not enter into investments for trading or speculative purposes. We believe that we do not have any material exposure to changes in the fair value of our cash equivalents as a result of changes in interest rates due to the short‑term nature of these assets.
We are subject to interest rate risk in connection with the borrowings under our loan facility. We have a
$40.0 million
revolving credit facility. As of
December 31, 2018
, we had
no
outstanding principal amount under the revolving loan facility. Borrowings under the Revolving Credit Facility bear interest at a per annum rate, depending on certain liquidity thresholds, ranging from adjusted LIBOR plus
1.35%
to
2.25%
, or prime rate minus
1.40%
to
0.50%
.
Foreign Currency Risk
Due to our international operations, a significant portion of our revenues, cost of revenues and operating expenses are denominated in currencies other than the USD, principally the Chinese RMB and the Euro. As a result, our international operations give rise to transactional market risk associated with exchange rate movements of the USD, the Chinese RMB and the Euro. We attempt to minimize these exposures by partially or fully offsetting foreign currency denominated assets and liabilities at our subsidiaries that operate in different functional currencies. The effectiveness of this strategy can be limited by the volume of underlying transactions at various subsidiaries and by our ability to accelerate or delay intercompany cash settlements. As a result, we are unable to completely offset the foreign currency denominated assets and liabilities.
At
December 31, 2018
, our foreign currency exposure was related to our net investment in our foreign subsidiaries. The potential loss in fair value resulting from a hypothetical 10% adverse change in foreign exchange rates would be approximately
$2.3 million
. Foreign exchange rate gains or losses on foreign investments as of
December 31, 2018
are reflected as a cumulative translation adjustment, net of tax, and do not affect our results of operations.
51
ITEM 8. FINANCIAL STATEMENTS AND SUPPLEMENTARY DATA
nLIGHT, INC.
Index to Consolidated Financial Statements
|
Page
|
|
|
Report of Independent Registered Public Accounting Firm
|
|
|
Consolidated Balance Sheets
|
|
|
Consolidated Statements of Operations
|
|
|
Consolidated Statements of Comprehensive Income (loss)
|
|
|
Consolidated Statements of Stockholders' Equity
|
|
|
Consolidated Statements of Cash Flows
|
|
|
Notes to Consolidated Financial Statements
|
|
52
Report of Independent Registered Public Accounting Firm
To the Stockholders and Board of Directors
nLIGHT, Inc.:
Opinion on the Consolidated Financial Statements
We have audited the accompanying consolidated balance sheets of nLIGHT, Inc. and subsidiaries (the Company) as of
December 31, 2018
and
2017
, the related consolidated statements of operations, comprehensive income (loss), stockholders' equity, and cash flows for each of the years in the three-year period ended December 31, 2018 and the related notes (collectively, the consolidated financial statements). In our opinion, the consolidated financial statements present fairly, in all material respects, the financial position of the Company as of
December 31, 2018
and
2017
, and the results of its operations and its cash flows for each of the years in the three-year period ended
December 31, 2018
, in conformity with U.S. generally accepted accounting principles.
Basis for Opinion
These consolidated financial statements are the responsibility of the Company's management. Our responsibility is to express an opinion on these consolidated financial statements based on our audits. We are a public accounting firm registered with the Public Company Accounting Oversight Board (United States) (PCAOB) and are required to be independent with respect to the Company in accordance with the U.S. federal securities laws and the applicable rules and regulations of the Securities and Exchange Commission and the PCAOB.
We conducted our audits in accordance with the standards of the PCAOB. Those standards require that we plan and perform the audit to obtain reasonable assurance about whether the consolidated financial statements are free of material misstatement, whether due to error or fraud. Our audits included performing procedures to assess the risks of material misstatement of the consolidated financial statements, whether due to error or fraud, and performing procedures that respond to those risks. Such procedures included examining, on a test basis, evidence regarding the amounts and disclosures in the consolidated financial statements. Our audits also included evaluating the accounting principles used and significant estimates made by management, as well as evaluating the overall presentation of the consolidated financial statements. We believe that our audits provide a reasonable basis for our opinion.
|
|
/s/ KPMG LLP
|
|
We have served as the Company's auditor since 2003.
Portland, Oregon
March 15, 2019
53
nLIGHT, Inc.
Consolidated Balance Sheets
(In thousands)
|
December 31,
|
December 31,
|
||||||
|
2018
|
2017
|
||||||
|
Assets
|
|||||||
|
Current assets:
|
|||||||
|
Cash and cash equivalents
|
$
|
149,478
|
|
$
|
36,687
|
|
|
|
Accounts receivable, net of allowances of $303 and $438
|
26,528
|
|
13,353
|
|
|||
|
Inventory
|
35,329
|
|
29,570
|
|
|||
|
Prepaid expenses and other current assets
|
7,286
|
|
4,973
|
|
|||
|
Total current assets
|
218,621
|
|
84,583
|
|
|||
|
Property and equipment, net
|
21,462
|
|
17,968
|
|
|||
|
Intangible assets, net
|
2,686
|
|
1,836
|
|
|||
|
Goodwill
|
1,387
|
|
1,387
|
|
|||
|
Other assets
|
5,974
|
|
4,374
|
|
|||
|
Total assets
|
$
|
250,130
|
|
$
|
110,148
|
|
|
|
Liabilities and Stockholders’ Equity
|
|||||||
|
Current liabilities:
|
|||||||
|
Accounts payable
|
$
|
12,068
|
|
$
|
12,920
|
|
|
|
Accrued liabilities
|
10,708
|
|
12,650
|
|
|||
|
Customer advances
|
493
|
|
575
|
|
|||
|
Deferred revenue
|
227
|
|
386
|
|
|||
|
Current portion of long-term debt
|
91
|
|
2,363
|
|
|||
|
Total current liabilities
|
23,587
|
|
28,894
|
|
|||
|
Non-current income taxes payable
|
6,472
|
|
3,930
|
|
|||
|
Long-term debt
|
18
|
|
15,108
|
|
|||
|
Other long-term liabilities
|
2,270
|
|
933
|
|
|||
|
Total liabilities
|
32,347
|
|
48,865
|
|
|||
|
Stockholders' equity:
|
|||||||
|
Convertible preferred stock - $0.0001 par value; zero and 129,478 shares authorized, zero and 24,642 shares issued and outstanding at December 31, 2018 and December 31, 2017. Liquidation preference of zero and $148,454 at December 31, 2018 and December 31, 2017.
|
—
|
|
12
|
|
|||
|
Preferred stock - $0.0001 par value; 5,000 and zero shares authorized, zero shares issued and outstanding at December 31, 2018 and December 31, 2017.
|
—
|
|
—
|
|
|||
|
Common stock - $0.0001 par value; 190,000 shares authorized, 36,705 shares issued and outstanding at December 31, 2018 and 190,000 shares authorized, 2,979 shares issued and outstanding at December 31, 2017.
|
15
|
|
2
|
|
|||
|
Additional paid-in capital
|
324,656
|
|
180,657
|
|
|||
|
Accumulated other comprehensive loss
|
(2,157
|
)
|
(719
|
)
|
|||
|
Accumulated deficit
|
(104,731
|
)
|
(118,669
|
)
|
|||
|
Total stockholders’ equity
|
217,783
|
|
61,283
|
|
|||
|
Total liabilities and stockholders’ equity
|
$
|
250,130
|
|
$
|
110,148
|
|
|
See accompanying notes to consolidated financial statements.
54
nLIGHT, Inc.
Consolidated Statements of Operations
(In thousands, except per share data)
|
Year Ended December 31,
|
|||||||||||
|
2018
|
2017
|
2016
|
|||||||||
|
Revenues
|
$
|
191,359
|
|
$
|
138,580
|
|
$
|
101,325
|
|
||
|
Cost of revenues
|
124,398
|
|
94,306
|
|
78,159
|
|
|||||
|
Gross profit
|
66,961
|
|
44,274
|
|
23,166
|
|
|||||
|
Operating expenses:
|
|||||||||||
|
Research and development
|
21,054
|
|
15,123
|
|
15,239
|
|
|||||
|
Sales, general, and administrative
|
28,844
|
|
19,353
|
|
17,265
|
|
|||||
|
Total operating expenses
|
49,898
|
|
34,476
|
|
32,504
|
|
|||||
|
Income (loss) from operations
|
17,063
|
|
9,798
|
|
(9,338
|
)
|
|||||
|
Other income (expense):
|
|||||||||||
|
Interest income (expense), net
|
728
|
|
(1,269
|
)
|
(2,229
|
)
|
|||||
|
Other expense
|
(253
|
)
|
(1,834
|
)
|
(753
|
)
|
|||||
|
Income (loss) before income taxes
|
17,538
|
|
6,695
|
|
(12,320
|
)
|
|||||
|
Income tax expense
|
3,600
|
|
4,858
|
|
1,882
|
|
|||||
|
Net income (loss)
|
$
|
13,938
|
|
$
|
1,837
|
|
$
|
(14,202
|
)
|
||
|
Less: Income allocated to participating securities
|
$
|
(4,415
|
)
|
$
|
(1,837
|
)
|
$
|
—
|
|
||
|
Net income (loss) attributable to common stockholders
|
$
|
9,523
|
|
$
|
—
|
|
$
|
(14,202
|
)
|
||
|
Net income (loss) per share, basic
|
$
|
0.38
|
|
$0.00
|
$
|
(5.68
|
)
|
||||
|
Net income (loss) per share, diluted
|
$
|
0.32
|
|
$0.00
|
$
|
(5.68
|
)
|
||||
|
Shares used in per share calculations:
|
|||||||||||
|
Basic
|
24,862
|
|
2,735
|
|
2,500
|
|
|||||
|
Diluted
|
29,959
|
|
2,735
|
|
2,500
|
|
|||||
See accompanying notes to consolidated financial statements.
55
nLIGHT, Inc.
Consolidated Statements of Comprehensive Income (Loss)
(In thousands)
|
Year Ended December 31,
|
|||||||||||
|
2018
|
2017
|
2016
|
|||||||||
|
Net income (loss)
|
$
|
13,938
|
|
$
|
1,837
|
|
$
|
(14,202
|
)
|
||
|
Other comprehensive income (loss):
|
|||||||||||
|
Foreign currency translation adjustments, net of tax
|
(1,438
|
)
|
2,290
|
|
(627
|
)
|
|||||
|
Comprehensive income (loss)
|
$
|
12,500
|
|
$
|
4,127
|
|
$
|
(14,829
|
)
|
||
See accompanying notes to consolidated financial statements.
56
nLIGHT, Inc.
Consolidated Statements of Stockholders' Equity
(In thousands)
|
Convertible preferred stock
|
Preferred stock
|
Common stock
|
Additional paid-in capital
|
Accumulated other comprehensive loss
|
Accumulated deficit
|
Total stockholders' equity
|
|||||||||||||
|
Shares
|
Amount
|
Shares
|
Amount
|
Shares
|
Amount
|
||||||||||||||
|
Balance, December 31, 2015
|
17,505
|
$9
|
—
|
$—
|
2,470
|
$1
|
$140,763
|
$(2,382)
|
$(106,304)
|
$32,087
|
|||||||||
|
Net loss
|
—
|
—
|
—
|
—
|
—
|
—
|
—
|
—
|
(14,202)
|
(14,202)
|
|||||||||
|
Net proceeds from issuance of Series F convertible preferred stock
|
2,332
|
1
|
—
|
—
|
—
|
—
|
11,963
|
—
|
—
|
11,964
|
|||||||||
|
Exercise of stock options and purchase of treasury stock
|
—
|
—
|
—
|
—
|
69
|
—
|
52
|
—
|
—
|
52
|
|||||||||
|
Stock-based compensation
|
—
|
—
|
—
|
—
|
—
|
—
|
308
|
—
|
—
|
308
|
|||||||||
|
Stock options issued in exchange for liability settlement
|
—
|
—
|
—
|
—
|
—
|
—
|
153
|
—
|
—
|
153
|
|||||||||
|
Other financing costs
|
—
|
—
|
—
|
—
|
—
|
—
|
(44)
|
—
|
—
|
(44)
|
|||||||||
|
Cumulative translation adjustment
|
—
|
—
|
—
|
—
|
—
|
—
|
—
|
(627)
|
—
|
(627)
|
|||||||||
|
Balance, December 31, 2016
|
19,837
|
$10
|
—
|
$—
|
2,539
|
$1
|
$153,195
|
$(3,009)
|
$(120,506)
|
$29,691
|
|||||||||
|
Net income
|
—
|
—
|
—
|
—
|
—
|
—
|
—
|
—
|
1,837
|
1,837
|
|||||||||
|
Net proceeds from issuance of Series G convertible preferred stock
|
4,805
|
2
|
—
|
—
|
—
|
—
|
27,479
|
—
|
—
|
27,481
|
|||||||||
|
Exercise of stock options
|
—
|
—
|
—
|
—
|
440
|
1
|
335
|
—
|
—
|
336
|
|||||||||
|
Other deferred offering costs
|
—
|
—
|
—
|
—
|
—
|
—
|
(721)
|
—
|
—
|
(721)
|
|||||||||
|
Stock-based compensation
|
—
|
—
|
—
|
—
|
—
|
—
|
369
|
—
|
—
|
369
|
|||||||||
|
Cumulative translation adjustment, net of tax
|
—
|
—
|
—
|
—
|
—
|
—
|
—
|
2,290
|
—
|
2,290
|
|||||||||
|
Balance, December 31, 2017
|
24,642
|
$12
|
—
|
$—
|
2,979
|
$2
|
$180,657
|
$(719)
|
$(118,669)
|
$61,283
|
|||||||||
|
Net income
|
—
|
—
|
—
|
—
|
—
|
—
|
—
|
—
|
13,938
|
13,938
|
|||||||||
|
Net proceeds from initial public offering
|
—
|
—
|
—
|
—
|
6,900
|
1
|
100,947
|
—
|
—
|
100,948
|
|||||||||
|
Net proceeds from follow-on offering
|
—
|
—
|
—
|
—
|
1,520
|
—
|
37,885
|
—
|
—
|
37,885
|
|||||||||
|
Exercise of stock options
|
—
|
—
|
—
|
—
|
387
|
—
|
362
|
—
|
—
|
362
|
|||||||||
|
Issuance and conversion of restricted stock awards and units
|
—
|
—
|
—
|
—
|
117
|
—
|
—
|
—
|
—
|
—
|
|||||||||
|
Conversion of convertible preferred stock to common stock
|
(24,642)
|
(12)
|
—
|
—
|
24,642
|
12
|
—
|
—
|
—
|
—
|
|||||||||
|
Exercise of warrants
|
—
|
—
|
—
|
—
|
160
|
—
|
—
|
—
|
—
|
—
|
|||||||||
|
Stock-based compensation
|
—
|
—
|
—
|
—
|
—
|
—
|
4,805
|
—
|
—
|
4,805
|
|||||||||
|
Cumulative translation adjustment
|
—
|
—
|
—
|
—
|
—
|
—
|
—
|
(1,438)
|
—
|
(1,438)
|
|||||||||
|
Balance, December 31, 2018
|
—
|
$—
|
—
|
$—
|
36,705
|
$15
|
$324,656
|
$(2,157)
|
$(104,731)
|
$217,783
|
|||||||||
See accompanying notes to consolidated financial statements.
57
nLIGHT, Inc.
Consolidated Statements of Cash Flows
(In thousands)
|
Year Ended December 31,
|
|||||||||||
|
2018
|
2017
|
2016
|
|||||||||
|
Cash flows from operating activities:
|
|||||||||||
|
Net income (loss)
|
$
|
13,938
|
|
$
|
1,837
|
|
$
|
(14,202
|
)
|
||
|
Adjustments to reconcile net income (loss) to net cash provided by operating activities:
|
|||||||||||
|
Depreciation and amortization
|
8,288
|
|
7,922
|
|
8,099
|
|
|||||
|
Provision for losses on accounts receivable
|
22
|
|
232
|
|
340
|
|
|||||
|
Stock-based compensation
|
4,805
|
|
369
|
|
308
|
|
|||||
|
Deferred income taxes
|
(1,307
|
)
|
(424
|
)
|
226
|
|
|||||
|
(Gain)/loss on disposal of property and equipment
|
12
|
|
9
|
|
(9
|
)
|
|||||
|
Loss on debt extinguishment
|
12
|
|
911
|
|
—
|
|
|||||
|
Changes in operating assets and liabilities:
|
|||||||||||
|
Accounts receivable
|
(13,734
|
)
|
(3,523
|
)
|
569
|
|
|||||
|
Inventory
|
(6,145
|
)
|
(9,875
|
)
|
8,975
|
|
|||||
|
Prepaid expenses and other current assets
|
(2,483
|
)
|
(639
|
)
|
933
|
|
|||||
|
Other assets
|
(2,262
|
)
|
(1,148
|
)
|
(3,069
|
)
|
|||||
|
Accounts payable
|
172
|
|
2,491
|
|
601
|
|
|||||
|
Accrued and other long-term liabilities
|
(310
|
)
|
3,160
|
|
3,038
|
|
|||||
|
Customer advances
|
(56
|
)
|
358
|
|
(223
|
)
|
|||||
|
Deferred revenue
|
(159
|
)
|
373
|
|
(243
|
)
|
|||||
|
Non-current income taxes payable
|
2,542
|
|
1,358
|
|
616
|
|
|||||
|
Net cash provided by operating activities
|
3,335
|
|
3,411
|
|
5,959
|
|
|||||
|
Cash flows from investing activities:
|
|||||||||||
|
Purchases of property, equipment and intangibles
|
(11,714
|
)
|
(5,483
|
)
|
(4,063
|
)
|
|||||
|
Proceeds from sale of property and equipment
|
35
|
|
6
|
|
36
|
|
|||||
|
Net cash used in investing activities
|
(11,679
|
)
|
(5,477
|
)
|
(4,027
|
)
|
|||||
|
Cash flows from financing activities:
|
|||||||||||
|
Principal payments on debt and capital leases
|
(33,417
|
)
|
(15,318
|
)
|
(8,331
|
)
|
|||||
|
Net proceeds from debt financing
|
16,053
|
|
12,499
|
|
—
|
|
|||||
|
Cash paid on debt extinguishment
|
—
|
|
(388
|
)
|
—
|
|
|||||
|
Proceeds from public offerings, net of offering costs
|
138,303
|
|
—
|
|
—
|
|
|||||
|
Net proceeds from issuance of convertible preferred stock
|
—
|
|
27,481
|
|
11,964
|
|
|||||
|
Payments of other financing costs
|
—
|
|
(191
|
)
|
(44
|
)
|
|||||
|
Proceeds from stock option exercises
|
362
|
|
336
|
|
52
|
|
|||||
|
Net cash provided by financing activities
|
121,301
|
|
24,419
|
|
3,641
|
|
|||||
|
Effect of exchange rate changes on cash
|
(166
|
)
|
834
|
|
1,072
|
|
|||||
|
Net increase in cash and cash equivalents
|
112,791
|
|
23,187
|
|
6,645
|
|
|||||
|
Cash and cash equivalents, beginning of period
|
36,687
|
|
13,500
|
|
6,855
|
|
|||||
|
Cash and cash equivalents, end of period
|
$
|
149,478
|
|
$
|
36,687
|
|
$
|
13,500
|
|
||
|
Supplemental disclosures:
|
|||||||||||
|
Cash paid for interest
|
$
|
941
|
|
$
|
1,437
|
|
$
|
2,060
|
|
||
|
Cash paid for income taxes
|
3,665
|
|
3,493
|
|
1,271
|
|
|||||
|
Accrued purchases of property, equipment and intangibles
|
577
|
|
969
|
|
—
|
|
|||||
|
Accrued deferred offering costs
|
—
|
|
530
|
|
—
|
|
|||||
See accompanying notes to consolidated financial statements.
58
nLIGHT, Inc.
Notes to Consolidated Financial Statements
|
(1)
|
Organization and Operations of the Company
|
nLIGHT, Inc. (the "Company") is a leading provider of high-power semiconductor and fiber lasers used in a variety of end applications in the industrial, microfabrication, and aerospace and defense markets. The Company, a Delaware corporation, is headquartered in Vancouver, Washington and is vertically integrated with manufacturing in Vancouver, Washington; Hillsboro, Oregon; Shanghai, China; and Lohja, Finland.
(2) Summary of Significant Accounting Policies
|
(a)
|
Principles of Consolidation
|
The accompanying consolidated financial statements include the accounts of nLIGHT, Inc. and its wholly owned subsidiaries. The wholly owned subsidiaries are Arbor Photonics, LLC, nLIGHT Cayman Ltd., nLIGHT Laser Technology (Shanghai) Co. Ltd, nLIGHT Oy (Finland), and nLIGHT Korea Inc. All intercompany balances have been eliminated.
|
(b)
|
Use of Estimates
|
The preparation of consolidated financial statements in conformity with accounting principles generally accepted in the United States of America requires management to make estimates and assumptions that affect the reported amounts of assets and liabilities at the date of the consolidated financial statements and the reported amounts of revenues and expenses during the reporting period. On an ongoing basis, the Company evaluates its estimates, including those related to inventory valuation, allowances for doubtful accounts, warranty, sales return reserves and the recoverability of long-lived assets. Management of the Company bases its estimates on historical experience and on various other assumptions. Actual results could differ from those estimates.
|
(c)
|
Reverse Stock Split
|
On April 12, 2018, the Company’s Board of Directors approved a one-for-five reverse stock split of its issued and outstanding shares of common and convertible preferred stock. The reverse stock split became effective on April 13, 2018. The par value of the Company's common stock and the par value of the Company's convertible preferred stock were not adjusted as a result of the reverse stock split. Accordingly, all share and per share amounts for all periods presented in the accompanying financial statements and notes thereto have been retroactively adjusted, where applicable, to reflect this reverse stock split.
|
(d)
|
Public Offerings
|
On April 30, 2018, the Company closed its IPO of
6.9 million
shares of common stock at an initial price to the public of
$16.00
per share, including
0.9 million
shares of common stock pursuant to the exercise in full of the underwriters' option to purchase additional shares, resulting in aggregate net proceeds to the Company of
$100.9 million
after deducting underwriting discounts and commissions and offering costs. Immediately prior to the closing of the IPO on April 30, 2018, all of the outstanding shares of convertible preferred stock converted into
24.6 million
shares of common stock.
On September 11, 2018, the Company closed its follow-on public offering in which it issued and sold approximately
1.5 million
shares of common stock at a public offering price of
$26.50
per share, resulting in aggregate estimated net proceeds to the Company of
$37.9 million
after deducting underwriting discounts and commissions and offering costs. Further, an additional
3.7 million
shares of the Company’s common stock were sold by certain selling stockholders in the offering at the public offering price of
$26.50
per share. The Company did not receive any proceeds from the sale of shares by the selling stockholders in the offering.
|
(e)
|
Revenue Recognition
|
Revenues are recognized when there is persuasive evidence of an arrangement, product delivery has occurred, the sales price is fixed or determinable, and collectability is reasonably assured. Title and risk of loss generally pass to the customer at the time of delivery of the product as indicated by the shipping terms. Revenues are recognized upon such delivery. In limited circumstances when customer‑specified acceptance criteria exist, revenue is deferred until customer acceptance if the Company cannot demonstrate the product meets the specifications prior to shipment. Taxes collected on behalf of a governmental entities are excluded from revenues.
59
The recognition of revenues on arrangements with multiple elements is consistent with guidance provided by FASB ASC Subtopic 605‑25,
Revenue Recognition-Multiple‑Element Arrangements
. For arrangements with multiple elements, revenues are allocated across the separately identified deliverables and may be recognized or deferred. When vendor‑specific objective evidence does not exist for undelivered elements, revenues are allocated to the elements based on third‑party evidence, if available, or management’s best estimate of fair value.
The Company also has a limited number of design and development contracts, principally with governmental customers, which are accounted for in accordance with the provisions of FASB ASC Subtopic 605‑35,
Revenue Recognition-Construction‑Type and Production‑Type Contracts
, using the percentage‑of‑completion method.
|
(f)
|
Cash and Cash Equivalents
|
The Company considers all highly liquid investments with a maturity of three months or less when acquired to be cash equivalents. Cash equivalents included
$123.4 million
and
$126 thousand
of highly liquid investments at
December 31, 2018
and
2017
, respectively. Cash equivalents are carried at cost, which approximates market.
|
(g)
|
Accounts Receivable
|
Trade accounts receivable are recorded at the invoiced amount and do not bear interest. The allowance for doubtful accounts is the Company’s best estimate of the amount of probable credit losses in the Company’s existing accounts receivable. The Company determines the allowance based on historical write‑off experience and knowledge of any applicable circumstances.
Activity related to the allowance for doubtful accounts was as follows:
|
(in thousands)
|
2018
|
2017
|
|||||
|
Allowance for doubtful accounts, beginning
|
$
|
438
|
|
$
|
1,608
|
|
|
|
Provision for losses on accounts receivable
|
22
|
|
232
|
|
|||
|
Write-offs and recoveries
|
(157
|
)
|
(1,402
|
)
|
|||
|
Allowance for doubtful accounts, ending
|
$
|
303
|
|
$
|
438
|
|
|
Included in the write-offs and recoveries for 2017 is a
$1.0 million
recovery related to a receivable fully reserved in 2015. The amount noted above was recovered in July 2017 after extensive litigation with the customer and was recognized as a reduction in bad debt expense within the sales, general, and administrative caption on the consolidated statement of operations. The Company also received
$175 thousand
in interest income as a result of this litigation which the Company recognized within the interest income (expense), net caption in the consolidated statements of operations.
|
(h)
|
Risks and Uncertainties including Business and Credit Concentrations
|
Financial instruments that potentially expose the Company to concentrations of credit risk consist principally of accounts receivable.
10
customers represented
67%
and
67%
of accounts receivable at
December 31, 2018
and
2017
, respectively.
Six
of the
10
customers were included in both periods presented.
The Company generates a significant portion of its revenues from a relatively small number of customers.
One
customer accounted for
13%
and
14%
of revenues during the years ended
December 31, 2018
and
2017
, respectively. The same customer as well as an additional customer accounted for
11%
and
10%
, respectively, of revenues during the year ended
December 31, 2016
.
Included in the consolidated balance sheets are the net assets of the Company’s foreign manufacturing operations located primarily in China which totaled approximately
$7.6 million
and
$13.3 million
at
December 31, 2018
and
2017
, respectively.
The market for the Company’s products is rapidly changing and evolving. The Company believes its future success will depend, in part, on its ability to increase sales of its existing products, penetrate new vertical markets, and to remain competitive in the marketplace. An inability of the Company to manage growth and generate increased demand for its products could have a material adverse impact on the Company’s financial position, results of operations and liquidity. It is the Company’s belief that existing cash resources will be sufficient to support operations and meet its debt service requirements for at least the next twelve months from the date on which the consolidated financial statements were available for issuance.
60
|
(i)
|
Property and Equipment
|
Property and equipment are stated at cost. Improvements and replacements are capitalized. Repair and maintenance costs are expensed as incurred. Depreciation is computed using the straight‑line method over the estimated useful life of each asset, generally
two
to
12 years
.
|
(j)
|
Income Taxes
|
The Company accounts for income taxes using the asset and liability approach under which deferred income taxes are provided based upon enacted tax laws and rates applicable to the periods in which taxes become payable.
The Company recognizes the effect of income tax positions only if those positions are more likely than not of being sustained. Recognized income tax positions are measured at the largest amount that is greater than 50% likely to be realized. Changes in recognition or measurement are reflected in the period in which the change in judgment occurs.
|
(k)
|
Stock‑Based Compensation
|
Stock‑based compensation is recognized at the grant date fair value and is recognized as expense over the requisite service period. The Company recognizes stock-based compensation for all time-based awards on a straight-line basis. Expense for performance-based awards is recognized over the requisite service period based on the probability of achievement of the performance criteria. The Company's time-based awards consist of stock options, restricted stock units, and restricted stock awards. Performance-based awards consist of restricted stock units and restricted stock awards.
Total stock-based compensation expense by financial statement caption was as follows:
|
Year Ended December 31,
|
|||||||||||
|
2018
|
2017
|
2016
|
|||||||||
|
Cost of revenues
|
$
|
456
|
|
$
|
46
|
|
$
|
30
|
|
||
|
Research and development
|
1,293
|
|
66
|
|
57
|
|
|||||
|
Sales, general and administrative
|
3,056
|
|
257
|
|
221
|
|
|||||
|
$
|
4,805
|
|
$
|
369
|
|
$
|
308
|
|
|||
Prior to the closing of the Company's initial public offering, the Company granted stock options at exercise prices believed to be equal to the fair value of the common stock underlying such options as determined by the board of directors, with input from management, on the date of grant. Because such grants occurred prior to the public trading of the Company's common stock, the board of directors exercised significant judgment in determining the fair market value of the Company's common stock. The valuations were consistent with the guidance and methods outlined in the AICPA Practice Aid,
Valuation of Privately-Held-Company Equity Securities Issued as Compensation
, or AICPA Practice Aid, for all option grant dates. After the closing of the initial public offering, the Company has not granted any stock options. For issuances of restricted stock units and awards the Company uses the market value of the Company's common stock at the date of grant.
For determining the fair value of stock options granted, the Company used the Black‑Scholes option pricing model with the following assumptions:
|
2018
|
2017
|
2016
|
|||
|
Expected volatility
|
39.2 - 40.2%
|
30.2 - 40.1%
|
34.1- 40.9%
|
||
|
Expected option term
|
6.3 - 6.5 years
|
6.2 - 6.5 years
|
5.6 - 6.6 years
|
||
|
Risk-free interest rate
|
2.6 - 2.9%
|
1.9 - 2.2%
|
1.2 - 1.6%
|
||
|
Expected dividend yield
|
None
|
None
|
None
|
||
The fair value of options granted in
2018
was determined to be approximately
$1.5 million
.
61
Included in the option pricing model is the fair value of the underlying common stock at the time of grant. Determining the fair value of the Company’s common stock requires complex and subjective judgments and estimates. There is inherent uncertainty in making these judgments and estimates. The absence of an active market for the Company’s common stock required the board of directors to estimate the fair value of the common stock for purposes of setting the exercise price of the options and estimating the fair value of the common stock at each meeting at which options were granted based on a number of objective and subjective factors, including valuations of comparable companies, operating and financial performance, lack of liquidity of the common stock and general and industry‑specific economic outlook, among other factors.
Since 2012 and prior to completing its initial public offering, the Company has obtained valuations prepared by an independent third‑party valuation firm to assist in determining the fair market value of its common stock. The board of directors and management of the Company considered these valuation reports when determining the fair market value of the Company’s common stock and related option exercise price on the dates such awards were granted. The valuations determined as of the dates below are as follows:
|
Fair Market Value
|
|
|
November 13, 2014
|
$0.75
|
|
January 1, 2016
|
$1.10
|
|
May 1, 2017
|
$1.45
|
|
September 1, 2017
|
$6.65
|
|
February 6, 2018
|
$9.70
|
|
March 27, 2018
|
$10.00
|
The average expected option term for awards granted reflects the application of the simplified method. The simplified method is based on the vesting period and the contractual term for each grant. The midpoint between the vesting date and the expiration date is used as the expected term under this method.
The Company uses the historical stock price volatility for comparable publicly‑traded competitors as the basis for its expected volatility assumption. The Company has assessed that the calculated volatility is representative of expected future stock price trends.
The risk‑free interest rate assumption is based upon observed U.S. Treasury rates consistent with the expected term of the award. The dividend yield assumption is based on the Company’s history of no dividend payouts and an expectation that no dividends will be paid in the foreseeable future.
The Company accounts for stock options issued to non‑employees in accordance with the provisions of FASB ASC Topic 718 and FASB ASC Subtopic 505‑50, Equity Based Payments to Non‑Employees. Under FASB ASC Topic 718 and FASB ASC Subtopic 505‑50, the Company uses the Black‑Scholes option pricing model to measure the fair value of stock options granted to non‑employees on the measurement date.
|
(l)
|
Research and Development Costs
|
Research and development is defined as activities aimed at developing or significantly improving a product or a process or technique whether the product or process is intended for sale or use. A process also may be used internally as a part of a manufacturing activity. Research and development costs are expensed as incurred.
|
(m)
|
Impairment of Long‑Lived Assets
|
Long‑lived assets, such as property and equipment, and intangibles subject to amortization, are reviewed for impairment whenever events or changes in circumstances indicate that the carrying amount of an asset may not be recoverable. Recoverability of assets to be held and used is measured by a comparison of the carrying amount of an asset to estimated undiscounted future cash flows expected to be generated by the asset. If the carrying amount of an asset exceeds its estimated future cash flows, an impairment charge is recognized for the amount by which the carrying amount of the asset exceeds the fair value of the asset. There was no impairment of long‑lived assets recorded for the years ended
December 31, 2018
,
2017
and
2016
.
62
|
(n)
|
Commitments and Contingencies
|
Liabilities for loss contingencies are recorded when it is probable that a liability has been incurred and the amount of the loss can be reasonably estimated.
In July 2017, the Company received notification of a claim related to a quality dispute with a vendor alleging that the Company owed payment for future non-cancelable order quantities. A liability of
$196 thousand
related to this matter was recorded within the accrued liabilities on the consolidated balance sheet as of
December 31, 2017
. This amount remains outstanding as of
December 31, 2018
.
In December 2013, the Company submitted a disclosure letter to the Office of the Inspector General of the Department of Defense advising that it might not have been eligible for certain contracts it was awarded under the Small Business Innovation Research ("SBIR") Program, notwithstanding its prior representations that the Company was eligible. The matter was referred to the Small Business Administration and the U.S. Department of Justice ("DOJ") for investigation of potential violations of the False Claims Act. In March 2015, a civil settlement agreement related to the SBIR matter was signed. A liability of
$420 thousand
was recorded at December 31, 2014 and subsequently paid in full in 2017.
In October 2014, the Company received a request for information related to the SBIR matter from the U.S. Attorney’s Office, Criminal Division. The Company provided documentation and an explanation of why a criminal investigation was unwarranted. In March 2015, the Company received an additional request, to which it also responded. Although the Company is unable to predict the final outcome of this matter, it intends to vigorously defend against any future claims.
The Company becomes involved in various legal proceedings and claims incidental to normal business activities. As of
December 31, 2018
, the Company believes these matters will not have a material adverse effect on the consolidated financial statements.
|
(o)
|
Goodwill and Intangible Assets
|
Goodwill and intangible assets with indefinite lives are not amortized; rather, they are tested for impairment on at least an annual basis. Intangible assets with finite lives are amortized over their useful lives. External costs incurred to file new patent applications, and extend the term of or defend the existing patents are capitalized and amortized over the estimated useful life.
|
(p)
|
Translation of Foreign Currencies
|
The Company’s international subsidiaries use their local currency as their functional currency. The financial statements of the international subsidiaries are translated to their U.S. dollar equivalents at end‑of‑period currency exchange rates for assets and liabilities and at average currency exchange rates for revenues and expenses. Translation adjustments are recorded as a component of accumulated other comprehensive loss within stockholders’ equity. Realized and unrealized foreign currency gains or losses, net are recorded in other expense within the consolidated statement of operations. Realized and unrealized foreign currency losses were
$0.7 million
and
$124 thousand
, respectively, for the year ended
December 31, 2018
. Realized and unrealized foreign currency losses were
$0.9 million
and
$36 thousand
, respectively, for the year ended
December 31, 2017
. Realized and unrealized foreign currency losses were
$1.0 million
and
$53 thousand
, respectively, in the year ended
December 31, 2016
.
|
(q)
|
Fair Value of Financial Instruments
|
The carrying amounts of certain of the Company’s financial instruments, including cash equivalents, accounts receivable and accounts payable, are shown at cost which approximates fair value due to the short term nature of these instruments. The fair value of the Company’s term and revolving loans with Pacific Western Bank, also described in Note 11, approximates the carrying value due to the variable market rate used to calculate interest payments.
The Company does not have any other significant financial assets or liabilities that are measured at fair value.
Fair value is defined as the exchange price that would be received for an asset or paid to transfer a liability (an exit price) in the principal or most advantageous market for the asset or liability in an orderly transaction between market participants on the measurement date. Valuation techniques used to measure fair value must maximize the use of observable inputs and minimize the use of unobservable inputs. The standard describes a fair value hierarchy based on three levels of inputs, of which the first two are considered observable and the last unobservable, that may be used to measure fair value which are the following:
|
•
|
Level 1 Inputs: Observable inputs, such as quoted prices (unadjusted) in active markets for identical assets or liabilities at the measurement date.
|
63
|
•
|
Level 2 Inputs: Observable inputs, other than Level 1 prices, such as quoted prices in active markets for similar assets and liabilities, quoted prices in markets that are not active, or other inputs that are observable or can be corroborated by observable market data for substantially the full term of the assets or liabilities.
|
|
•
|
Level 3 Inputs: Unobservable inputs that are supported by little or no market activity and that are significant to the fair value of the assets or liabilities.
|
The Company’s financial instruments that are carried at fair value consist of Level 1 assets which include highly liquid investments and bank drafts classified as cash equivalents. The Company's fair value hierarchy for its cash equivalents was as follows:
|
December 31, 2018
|
||||||||||||
|
Level 1
|
Level 2
|
Level 3
|
Total
|
|||||||||
|
Money market securities
|
$
|
123,121
|
|
$
|
—
|
|
$
|
—
|
|
$
|
123,121
|
|
|
Commercial paper
|
299
|
|
—
|
|
—
|
|
299
|
|
||||
|
Total
|
$
|
123,420
|
|
$
|
—
|
|
$
|
—
|
|
$
|
123,420
|
|
|
December 31, 2017
|
||||||||||||
|
Level 1
|
Level 2
|
Level 3
|
Total
|
|||||||||
|
Commercial paper
|
$
|
126
|
|
$
|
—
|
|
$
|
—
|
|
$
|
126
|
|
|
Total
|
$
|
126
|
|
$
|
—
|
|
$
|
—
|
|
$
|
126
|
|
|
(r)
|
Recently Issued Accounting Standards
|
Newly-Adopted Standards
The Financial Accounting Standards Board ("FASB") issued ASU 2016-09
, Compensation - Stock Compensation (Topic 718) - Improvements to Employee Share-Based Payment Accounting
, in March 2016. ASU 2016-09 simplifies several aspects of the accounting for share-based payment transactions, including the income tax consequences, classification of awards as either equity or liabilities, and classification on the statement of cash flows. ASU 2016-09 is effective for public companies' annual periods, including interim periods within those fiscal years, beginning after December 15, 2016. The method of application (i.e., retrospective, modified retrospective or prospective) depends on the transaction area that is being amended. The adoption of ASU 2016-09 effective as of the first quarter 2018 did not have a material effect on the financial position, results of operations or cash flows.
The FASB issued ASU 2016-16,
Income Taxes (Topic 740) - Intra-Entity Transfers of Assets Other Than Inventory,
in October 2016. Current GAAP prohibits the recognition of current and deferred income taxes for an intra-entity asset transfer until the asset is sold to an outside party. The amendments in ASU 2016-16 eliminate the exception for an intra-entity transfer of an asset other than inventory, and allows recognition of the income tax consequences when the transfer occurs. ASU 2016-16 is effective for public companies' fiscal years, including interim periods within those fiscal years, beginning after December 15, 2017, applied on a modified retrospective basis through a cumulative-effect adjustment directly to retained earnings. The adoption of ASU 2016-16 effective as of second quarter 2018 had no material effect on the financial position, results of operations or cash flows.
The FASB issued ASU 2017-09,
Compensation - Stock Compensation (Topic 718) - Scope in Modification Accounting
, in May 2017. ASU 2017-09 provides clarity and reduces diversity in practice and cost and complexity when applying the guidance in Topic 718 to a change to the terms or conditions of a share-based payment award. An entity should account for the effects of a modification unless all of certain criteria are met. Those criteria relate to fair value, vesting conditions and classification of the modified award. If all three conditions are the same for the modified award as for the original award, then the entity should not account for the effects of the modification. ASU 2017-09 is effective for all entities for annual periods, including interim periods within those annual periods, beginning after December 15, 2017. The adoption of ASU 2017-09 as of January 1, 2018 had no
material effect on the financial position, results of operations or cash flows.
Issued Not Yet Adopted Standards
64
The FASB issued ASU No. 2014‑09,
Revenue from Contracts with Customers
, in May 2014. ASU 2014‑09 requires an entity to recognize revenue to depict the transfer of promised goods or services to customers in an amount that reflects the consideration to which the entity expects to be entitled in exchange for those goods or services. The guidance also requires expanded disclosures relating to the nature, amount, timing, and uncertainty of revenue and cash flows arising from contracts with customers. Additionally, qualitative and quantitative disclosures are required about customer contracts, significant judgments and changes in judgments, and assets recognized from the costs to obtain or fulfill a contract. The standard permits the use of either the retrospective or modified retrospective transition methods. This guidance replaces most of the existing revenue recognition guidance in U.S. GAAP when it becomes effective, which is on January 1, 2019. In April 2016, the FASB issued ASU No. 2016‑10,
Revenue from Contracts with Customers (Topic 606): Identifying Performance Obligations and Licensing
(“ASU 2016‑10”), which was issued to clarify ASC Topic 606,
Revenue from Contracts with Customers
, related to (i) identifying performance obligations; and (ii) the licensing implementation guidance. The effective date and transition of ASU 2016-10 is the same as the effective date and transition of ASU 2014‑09,
Revenue from Contracts with Customers (Topic 606)
, which is on January 1, 2019.
The Company is adopting Topic 606 using the modified retrospective method and has identified and analyzed principal revenue streams by end market. The Company is substantially complete with the review of significant contracts and evaluation of the potential changes to our business processes, controls, and disclosures resulting from adoption of the new standard. The Company expects to finalize documentation of these assessments during the first quarter of 2019. Based on the analysis, the Company has determined there is not a material adjustment to be recorded to opening retained earnings on January 1, 2019. Further, the Company has identified potential accounting and financial reporting impacts to the business processes, controls, systems and disclosures as a result of the new standard, and is preparing for those changes. In addition, while the Company does not expect the adoption of ASU 2014-09, as amended, to have a material effect on the financial position, results of operations or cash flows, the Company does anticipate additional disclosure requirements upon adoption of the new standard.
The FASB issued ASU No. 2016‑02,
Leases (Topic 842)
, in February 2016. ASU 2016‑02 requires a lessee to recognize a right of use asset and a lease liability for virtually all leases, other than leases that meet the definition of short‑term. The standard is effective for annual reporting periods beginning after December 15, 2019. The Company expects to implement the provisions of ASU 2016‑02 as of January 1, 2020. The Company is currently evaluating the impact of this ASU and cannot reasonably estimate the quantitative impact on the financial statements at this time.
(3) Prepaid Expenses and Other Current Assets
The components of prepaid expenses and other current assets are as follows:
|
December 31,
|
December 31,
|
||||||
|
(in thousands)
|
2018
|
2017
|
|||||
|
Prepaid expenses
|
$
|
1,654
|
|
$
|
1,248
|
|
|
|
Value-added tax receivable, net
|
1,489
|
|
1,291
|
|
|||
|
Vendor prepayments
|
1,263
|
|
1,391
|
|
|||
|
Prepaid tax and duties
|
2,777
|
|
946
|
|
|||
|
Other
|
103
|
|
97
|
|
|||
|
$
|
7,286
|
|
$
|
4,973
|
|
||
(4) Inventory
Inventory is stated at the lower of cost (average cost) or net realizable value. The Company periodically reviews the quantities and carrying values of its inventory to assess recoverability. The costs associated with write‑downs for excess quantities, technological obsolescence, or component rejections are charged to cost of revenues as incurred and result in a new cost basis for that item in inventory. The components of inventory are as follows:
65
|
December 31,
|
December 31,
|
||||||
|
(in thousands)
|
2018
|
2017
|
|||||
|
Raw materials
|
$
|
14,174
|
|
$
|
11,326
|
|
|
|
Work in process and semi-finished goods
|
12,807
|
|
6,039
|
|
|||
|
Finished goods
|
8,348
|
|
12,205
|
|
|||
|
$
|
35,329
|
|
$
|
29,570
|
|
||
(5) Property and Equipment
Property and equipment consist of the following:
|
December 31,
|
December 31,
|
||||||||
|
(in thousands)
|
Useful life (years)
|
2018
|
2017
|
||||||
|
Computer hardware and software
|
3-5
|
$
|
4,143
|
|
$
|
3,732
|
|
||
|
Manufacturing and lab equipment
|
2-7
|
50,797
|
|
43,432
|
|
||||
|
Office equipment and furniture
|
5-7
|
1,127
|
|
1,053
|
|
||||
|
Leasehold improvements
|
2-12
|
19,207
|
|
18,580
|
|
||||
|
75,274
|
|
66,797
|
|
||||||
|
Accumulated depreciation
|
(53,812
|
)
|
(48,829
|
)
|
|||||
|
$
|
21,462
|
|
$
|
17,968
|
|
||||
Depreciation expense for the
years ended December 31, 2018
,
2017
and
2016
was
$5.9 million
,
$5.3 million
and
$5.4 million
, respectively.
(6) Intangible Assets and Goodwill
|
(a)
|
Intangibles
|
The Company capitalizes external costs incurred to file new patent applications and to extend the term of or defend existing patents. The details of the patents are as follows:
|
December 31, 2018
|
|||||||||||||
|
(in thousands)
|
Average amortization period
|
Gross carrying amount
|
Accumulated amortization
|
Net value
|
|||||||||
|
Patents
|
5
|
$
|
4,735
|
|
$
|
(2,049
|
)
|
$
|
2,686
|
|
|||
|
December 31, 2017
|
|||||||||||||
|
(in thousands)
|
Average amortization period
|
Gross carrying amount
|
Accumulated amortization
|
Net value
|
|||||||||
|
Patents
|
5
|
$
|
3,310
|
|
$
|
(1,474
|
)
|
$
|
1,836
|
|
|||
Amortization expense for intangible assets was
$592 thousand
,
$472 thousand
and
$779 thousand
for the
years ended December 31, 2018
,
2017
and
2016
, respectively. Estimated amortization expense for the next five years is as follows:
66
|
(in thousands)
|
|||
|
2019
|
$
|
769
|
|
|
2020
|
697
|
|
|
|
2021
|
570
|
|
|
|
2022
|
424
|
|
|
|
2023
|
226
|
|
|
|
$
|
2,686
|
|
|
|
(b)
|
Goodwill
|
The Company’s goodwill originated with the acquisition of Arbor Photonics, Inc. in December 2012.
The Company reviews its goodwill for impairment annually, or more frequently if events or circumstances indicate that the carrying value of a reporting unit exceeds its fair value. The Company completed its annual review of goodwill as of
December 31, 2018
and determined that no impairment of its recorded goodwill was necessary.
There were no changes in the carrying amount of goodwill during the
years ended December 31, 2018
,
2017
and 2016.
(7) Other Assets
Other assets consisted of the following:
|
December 31,
|
December 31,
|
||||||
|
(in thousands)
|
2018
|
2017
|
|||||
|
Demonstration assets, net
|
$
|
1,982
|
|
$
|
2,224
|
|
|
|
Deferred tax assets, net
|
3,114
|
|
1,807
|
|
|||
|
Other
|
878
|
|
343
|
|
|||
|
$
|
5,974
|
|
$
|
4,374
|
|
||
Demonstration (demo) assets are equipment that is used for demonstration and other purposes with existing and prospective customers. Demo assets are recorded at cost and amortized over an estimated useful life of approximately
two
years. Amortization expense for demo assets totaled
$1.8 million
,
$2.1 million
and
$1.8 million
for the years ended
December 31, 2018
,
2017
and
2016
, respectively.
(8) Accrued Liabilities
Accrued liabilities consist of the following:
|
December 31,
|
December 31,
|
||||||
|
(in thousands)
|
2018
|
2017
|
|||||
|
Accrued payroll and benefits
|
$
|
6,474
|
|
$
|
6,201
|
|
|
|
Product warranty, current
|
2,669
|
|
3,589
|
|
|||
|
Income tax payable
|
258
|
|
931
|
|
|||
|
Other accrued expenses
|
1,307
|
|
1,929
|
|
|||
|
$
|
10,708
|
|
$
|
12,650
|
|
||
(9) Product Warranties
The Company's products are sold with warranty provisions that require the Company to remedy deficiencies in quality or performance over a specified period of time, generally
four
to
36 months
, and occasionally up to
63
months for new products, at no cost to its customers. Net warranty charges incurred include labor charges and costs of replacement parts for repairs under warranty. A provision for the estimated future costs of warranty is based upon historical cost and product performance experience,
67
and is recorded when revenues are recognized. The warranty accrual is recorded within the accrued liabilities and other long-term liabilities captions, based on the performance period.
The following is a reconciliation of the changes in the aggregate product warranty accrual during the
years ended December 31, 2018
and
2017
:
|
Year Ended December 31,
|
|||||||
|
(in thousands)
|
2018
|
2017
|
|||||
|
Product warranty accrual, beginning
|
$
|
4,186
|
|
$
|
2,677
|
|
|
|
Warranty charges incurred, net
|
(3,152
|
)
|
(2,278
|
)
|
|||
|
Provision for warranty charges
|
3,521
|
|
3,787
|
|
|||
|
Product warranty accrual, ending
|
$
|
4,555
|
|
$
|
4,186
|
|
|
(10) Commitments
The Company leases its facilities in Vancouver, Washington; Hillsboro, Oregon; China, Finland, and South Korea as well as certain equipment under operating leases that expire at various dates through 2025. The Company had deposits of
$398 thousand
and
$301 thousand
as of
December 31, 2018
and
2017
, respectively, relating primarily to rent deposits on the China and Vancouver, Washington facility leases. Rent expense, before sublease income, totaled
$3.2 million
,
$2.7 million
and
$2.5 million
for the years ended
December 31, 2018
,
2017
and
2016
, respectively. Sublease income totaled
$99 thousand
,
$86 thousand
and
$50 thousand
for the years ended
December 31, 2018
,
2017
and
2016
, respectively.
The minimum future rent payments under noncancelable operating leases as of
December 31, 2018
are as follows:
|
(in thousands)
|
|||
|
2019
|
$
|
2,774
|
|
|
2020
|
2,392
|
|
|
|
2021
|
2,064
|
|
|
|
2022
|
1,482
|
|
|
|
2023
|
834
|
|
|
|
Thereafter
|
956
|
|
|
|
Total
|
$
|
10,502
|
|
Minimum rent payments under operating leases are recognized on a straight‑line basis over the term of the lease, including any periods of free rent. Deferred rent liability associated with operating leases was
$290 thousand
and
$254 thousand
as of
December 31, 2018
and
2017
, respectively.
(11) Long‑Term Debt
In March 2018, the Company entered into an Amended and Restated Loan and Security Agreement with Pacific Western Bank (successor in interest to Square 1 Bank). The agreement amended and restated in its entirety the Company's previous Loan and Security Agreement with Pacific Western Bank, dated March 13, 2014. The loan facility provided for up to
$25.0 million
in aggregate commitments, including a term loan of up to
$15.0 million
and a revolving loan facility equal to the lesser of (i)
$25.0 million
minus the unpaid principal amount of the term loan and the amount of any reserves for ancillary banking services, or (ii) a borrowing base equal to
85%
of eligible accounts receivable plus the lesser of
$5.5 million
or
35%
of eligible inventory. The principal amount of the term loan was to be repaid in thirty-six equal monthly installments beginning on July 14, 2018 with all outstanding principal and interest on the revolving loan due and payable on July 14, 2019.
In September 2018, the Company entered into the Second Amended and Restated Loan and Security Agreement with Pacific Western Bank (successor in interest to Square 1 Bank). The agreement amends and restates in its entirety the Company’s Amended and Restated Loan and Security Agreement entered in March 2018. As amended and restated, the loan agreement’s revolving credit facility provides for up to
$40.0 million
in aggregate commitments and was used to repay in full the term loan and revolving borrowings outstanding under the prior agreement. The Company may draw upon the credit facility until September 2021. The revolving loan bears interest at a per annum rate, depending on certain liquidity thresholds, ranging from adjusted
68
LIBOR plus
1.35%
to
2.25%
, or prime rate minus
1.40%
to
0.50%
. The line of credit also bears an unused credit fee at a per annum rate of
0.20%
. Interest is due and payable monthly in arrears.
The Company’s loan with Pacific Western Bank is secured by liens, subject to certain exceptions, on substantially all of the Company’s existing and future assets, including but not limited to accounts receivable, inventory, property and equipment, and intellectual property.
Pursuant to the terms of the amended and restated loan agreement, the Company will be subject to certain financial covenants in the event it fails to meet certain specified liquidity thresholds. Prior to September 2018, the Company was subject to minimum revenue and maximum capital expenditure covenants. The Company was in compliance with all of its financial covenants as of
December 31, 2018
and
December 31, 2017
.
The term loan balance was
zero
and
$13.5 million
at
December 31, 2018
and
December 31, 2017
, respectively. The revolving loan balance was
zero
and
$3.7 million
at
December 31, 2018
and
December 31, 2017
, respectively.
In 2015, the Company entered into a Loan and Security Agreement with Multiplier Growth Partners SPV I, LP, or Multiplier, agreeing to a term loan with a principal amount of up to
$15.0 million
, an interest rate of
11%
per annum, and a maturity date of July 16, 2020. The initial borrowing consisted of
$12.5 million
in principal including
$150 thousand
in fees. In conjunction with the term loan, the Company granted a stock warrant to Multiplier, see Note 13 for details. In July 2017, and concurrent with the increase in the borrowing base of the Company’s loan facility with Pacific Western Bank noted above, the Company extinguished all debt outstanding with Multiplier. The transaction qualified as a debt extinguishment under FASB ASC Subtopic 470‑50,
Debt
, and a loss of
$911 thousand
, associated with an early prepayment penalty of
$375 thousand
, write‑down of debt issuance costs of
$523 thousand
, and other miscellaneous costs of
$13 thousand
, was recorded in other expense during the year ended
December 31, 2017
.
Long‑term debt consists of the following:
|
December 31,
|
December 31,
|
||||||
|
(in thousands)
|
2018
|
2017
|
|||||
|
Pacific Western Bank, Term and Revolving Loans
|
$
|
—
|
|
$
|
17,200
|
|
|
|
2014 Finland equipment loans, Danske Bank
|
41
|
|
80
|
|
|||
|
Capital leases, various
|
110
|
|
191
|
|
|||
|
Total debt
|
151
|
|
17,471
|
|
|||
|
Less: debt issuance costs
|
(42
|
)
|
—
|
|
|||
|
Total long-term debt
|
109
|
|
17,471
|
|
|||
|
Less: current portion of long-term debt
|
(91
|
)
|
(2,363
|
)
|
|||
|
Non-current portion of long-term debt
|
$
|
18
|
|
$
|
15,108
|
|
|
Amortization of debt issuance costs was
$9 thousand
,
$96 thousand
and
$194 thousand
for the years ended
December 31, 2018
,
2017
and
2016
, respectively.
The Company has minimum payment schedules that call for future principal payments summarized as follows:
|
(in thousands)
|
|||
|
2019
|
$
|
106
|
|
|
2020
|
45
|
|
|
|
$
|
151
|
|
|
(12) Income Taxes
Income (loss) before income tax expense was as follows:
69
|
(in thousands)
|
Year Ended December 31,
|
||||||||||
|
2018
|
2017
|
2016
|
|||||||||
|
Domestic
|
$
|
10,901
|
|
$
|
(9,064
|
)
|
$
|
(19,006
|
)
|
||
|
Foreign
|
$
|
6,637
|
|
$
|
15,759
|
|
$
|
6,686
|
|
||
|
Income (loss) before income tax
|
$
|
17,538
|
|
$
|
6,695
|
|
$
|
(12,320
|
)
|
||
Income tax provision was as follows:
|
Year Ended December 31,
|
|||||||||||
|
(in thousands)
|
2018
|
2017
|
2016
|
||||||||
|
Current tax expense:
|
|||||||||||
|
Federal
|
$
|
—
|
|
$
|
—
|
|
$
|
—
|
|
||
|
State
|
9
|
|
—
|
|
8
|
|
|||||
|
Foreign
|
5,032
|
|
5,200
|
|
1,632
|
|
|||||
|
Current tax expense
|
5,041
|
|
5,200
|
|
1,640
|
|
|||||
|
Deferred tax expense
|
|||||||||||
|
Federal
|
—
|
|
—
|
|
—
|
|
|||||
|
State
|
—
|
|
—
|
|
—
|
|
|||||
|
Foreign
|
(1,441
|
)
|
(342
|
)
|
242
|
|
|||||
|
Deferred tax expense
|
(1,441
|
)
|
(342
|
)
|
242
|
|
|||||
|
Income tax expense
|
$
|
3,600
|
|
$
|
4,858
|
|
$
|
1,882
|
|
||
The income tax provision differs from the amount computed by applying the statutory federal income tax rate to the loss before income tax as a result of the following differences:
|
Year Ended December 31,
|
|||||||||||
|
(in thousands)
|
2018
|
2017
|
2016
|
||||||||
|
Tax computed at federal statutory rate
|
$
|
3,683
|
|
$
|
2,276
|
|
$
|
(4,189
|
)
|
||
|
State tax, net of federal tax benefit
|
27
|
|
(102
|
)
|
(125
|
)
|
|||||
|
Permanent items
|
545
|
|
1,078
|
|
662
|
|
|||||
|
Foreign dividends and unremitted earnings
|
159
|
|
796
|
|
586
|
|
|||||
|
Foreign rate differential
|
(347
|
)
|
(1,897
|
)
|
(991
|
)
|
|||||
|
Rate change due to tax reform
|
2,819
|
|
17,176
|
|
—
|
|
|||||
|
Federal credits
|
(619
|
)
|
(302
|
)
|
(363
|
)
|
|||||
|
Tax contingencies, net of reversals
|
2,140
|
|
592
|
|
663
|
|
|||||
|
Other
|
(1,537
|
)
|
109
|
|
302
|
|
|||||
|
Valuation allowance
|
(3,270
|
)
|
(14,868
|
)
|
5,337
|
|
|||||
|
Income tax expense
|
$
|
3,600
|
|
$
|
4,858
|
|
$
|
1,882
|
|
||
The income tax expense recorded primarily relates to operations in China and Finland, which have income tax rates of
25%
and
20%
, respectively.
70
The tax effects of temporary differences that give rise to significant portions of the deferred tax assets and deferred tax liabilities are as follows:
|
Year Ended December 31,
|
|||||||||||
|
(in thousands)
|
2018
|
2017
|
2016
|
||||||||
|
Deferred tax assets:
|
|||||||||||
|
Net operating loss carryforwards
|
$
|
16,407
|
|
$
|
21,626
|
|
$
|
35,803
|
|
||
|
Research and alternative minimum tax credits
|
4,501
|
|
3,635
|
|
3,373
|
|
|||||
|
Accrued expenses and other
|
2,806
|
|
1,891
|
|
2,466
|
|
|||||
|
Inventory
|
4,248
|
|
2,280
|
|
2,155
|
|
|||||
|
Property and equipment
|
1,334
|
|
1,644
|
|
2,351
|
|
|||||
|
Total gross deferred tax assets
|
29,296
|
|
31,076
|
|
46,148
|
|
|||||
|
Less valuation allowance
|
(25,603
|
)
|
(28,873
|
)
|
(43,741
|
)
|
|||||
|
Total deferred tax assets
|
3,693
|
|
2,203
|
|
2,407
|
|
|||||
|
Deferred tax liabilities
|
|||||||||||
|
Intangible assets
|
(579
|
)
|
(396
|
)
|
(503
|
)
|
|||||
|
Unremitted foreign earnings
|
—
|
|
—
|
|
(521
|
)
|
|||||
|
Total deferred tax liabilities
|
(579
|
)
|
(396
|
)
|
(1,024
|
)
|
|||||
|
Net deferred tax assets
|
$
|
3,114
|
|
$
|
1,807
|
|
$
|
1,383
|
|
||
Net deferred tax assets of
$3.1 million
,
$1.8 million
, and
$1.4 million
as of
December 31, 2018
,
2017
and
2016
, respectively, are included in other assets within the consolidated balance sheet.
In evaluating its valuation allowance, the Company considers all available positive and negative evidence, including scheduled reversals of deferred tax liabilities, projected future taxable income, tax planning strategies, and recent financial performance. Due to uncertainty with respect to ultimate realizability of deferred tax assets, the Company has provided a valuation allowance against the U.S. deferred tax assets. The net change in the total valuation allowance during the years ended
December 31, 2018
,
2017
and
2016
were decreases of
$3.3 million
and
$14.9 million
and an increase of
$5.3 million
, respectively.
At
December 31, 2018
, the Company has U.S. and state net operating loss carryforwards of
$74.4 million
and
$11.6 million
, respectively. These net operating losses will expire between
2023
and
2037
if not used by the Company to reduce income taxes payable in future periods. The Company has U.S. and state research and development credits of
$5.3 million
and
$22 thousand
, respectively. These credits will begin to expire between
2019
and
2038
if not used by the Company to reduce income taxes payable in future periods.
Utilization of net operating loss carryforwards, credit carryforwards and certain deductions have been subject to annual limitations due to ownership change limitations provided by the Internal Revenue Code of 1986, as amended, and similar state provisions. Under Sections 382 and 383 of the Internal Revenue Code of 1986, as amended, substantial changes in the Company's ownership have required the Company to limit the amount of net operating loss and research and development credit carryforwards that were previously available to offset future taxable income. The Company has had three "change in ownership" events that limit the utilization of net operating loss carryforwards. The "change in ownership" events occurred twice in August of
2000
and in January of
2001
, and resulted in net operating loss carryforward limitations of
$17 thousand
,
$52 thousand
, and
$459 thousand
for net operating losses generated prior to the change. Additional limitations on the use of these tax attributes could occur in the event of possible disputes arising in examination from various taxing authorities.
71
The following table presents a reconciliation of the changes in the unrecognized tax benefit:
|
(in thousands)
|
|||
|
Balance at December 31, 2015
|
$
|
1,528
|
|
|
Additions based on tax positions related to the current year
|
570
|
|
|
|
Additions for tax positions of prior years
|
3
|
|
|
|
Other
|
(51
|
)
|
|
|
Balance at December 31, 2016
|
$
|
2,050
|
|
|
Additions based on tax positions related to the current year
|
365
|
|
|
|
Additions for tax positions of prior years
|
99
|
|
|
|
Other
|
3
|
|
|
|
Balance at December 31, 2017
|
$
|
2,517
|
|
|
Additions based on tax positions related to the current year
|
3,398
|
|
|
|
Additions for tax positions of prior years
|
92
|
|
|
|
Reductions for tax positions of prior years
|
(49
|
)
|
|
|
Reductions as a result of a lapse of applicable statute of limitations
|
(5
|
)
|
|
|
Other
|
(66
|
)
|
|
|
Balance at December 31, 2018
|
$
|
5,887
|
|
At
December 31, 2018
, the Company has recognized
$3.5 million
unrecognized tax benefits (excluding interest and penalties) in non-current income taxes payable and
$2.4 million
of unrecognized tax benefits in noncurrent deferred tax assets on the accompanying consolidated balance sheet.
$5.9 million
of the Company's unrecognized tax benefits, if recognized, would impact the effective tax rate. At December 31,
2017
, the Company has recorded
$1.5 million
of unrecognized tax benefits in non-current income taxes payable and
$1.0 million
of unrecognized tax benefits recognized as an offset to noncurrent deferred tax assets on the accompanying consolidated balance sheet. The Company does not expect a significant decrease to the total amount of unrecognized tax benefits within the next twelve months.
The Company recognizes interest and penalties related to unrecognized tax benefits as a component of income tax expense. The Company has recognized penalties and interest during the years ended
December 31, 2018
,
2017
and
2016
, of
$0.4 million
,
$0.4 million
, and
$0.1 million
, respectively. At
December 31, 2018
and
2017
interest and penalties associated with unrecognized tax benefits were
$1.3 million
and
$0.9 million
, respectively.
At
December 31, 2018
, the Company's tax years
2015
through
2018
,
2014
through
2018
, and
2008
through
2018
, remain open for examination in the federal, state and foreign jurisdictions, respectively. However, to the extent allowed by law, the taxing authorities may have the right to examine prior periods where net operating losses and credits were generated and carried forward, and to make adjustments up to the net operating loss and credit carryforward amounts. The Company is not currently under federal, state, or foreign examination.
2017 Tax Act
In December 2017, the Tax Cuts and Jobs Act (the “2017 Tax Act”) introduced significant changes to U.S. income tax law. Effective 2017, the 2017 Tax Act included a one-time transition tax on certain foreign earnings and the acceleration of depreciation for certain assets placed into service after September 27, 2017. Effective 2018, the 2017 Tax Act reduced the U.S. statutory tax rate from
34%
to
21%
, and created new taxes on certain foreign-sourced earnings, repealed the domestic manufacturing deduction, and placed additional limitations on executive compensation and limitations on the deductibility of interest.
The Company recognized the income tax effects of the 2017 Tax Act in its 2017 financial statements in accordance with Staff Accounting Bulletin No. 118, which provides SEC staff guidance for the application of ASC Topic 740, Income Taxes, in the reporting period in which the 2017 Tax Act was signed into law. As such, the Company's 2017 financial results reflected the income tax effects of the 2017 Tax Act for which the accounting under ASC Topic 740 was complete and provisional amounts for those specific income tax effects of the 2017 Tax Act for which the accounting under ASC Topic 740 was incomplete but a reasonable estimate could be determined. The accounting for the income tax effects of the 2017 Tax Act is considered complete at
December 31, 2018
, with no material changes to the amounts recorded in 2017.
72
The changes to existing U.S. tax laws as a result of the 2017 Tax Act, which have the most significant impact on the Company's federal income taxes are as follows:
Reduction of the U.S. Corporate Income Tax Rate
The Company measures deferred tax assets and liabilities using enacted tax rates that will apply in the years in which the temporary differences are expected to be recovered or paid. Accordingly, the Company's deferred tax assets and liabilities were remeasured to reflect the reduction in the U.S. corporate income tax rate from
34%
to
21%
, resulting in a
$16.1 million
increase in income tax expense for the year ended December 31, 2017 and a corresponding decrease in net deferred tax assets as of December 31, 2017. These adjustments were fully offset with a corresponding adjustment to the valuation allowance.
Transition Tax on Foreign Earnings
The Company recognized a provisional income tax expense of
$1.1 million
for the year ended December 31, 2017 related to the one-time transition tax on certain foreign earnings. This resulted in a corresponding decrease in deferred tax assets due to the utilization of net operating loss carryforwards. This amount was finalized as of
December 31, 2018
without material adjustment from the provisional amount.
(13) Stockholders’ Equity
|
(a)
|
Authorized Shares
|
As of
December 31, 2018
and
2017
, the Company was authorized to issue a total of
195.0 million
and
319.5 million
shares respectively, with a par value of
$0.0001
per share. The authorized shares as of
December 31, 2018
consisted of
190.0 million
of common stock and
5.0 million
of preferred stock. The authorized shares as of
December 31, 2017
consisted of
190.0 million
shares of common stock and
129.5 million
shares of convertible preferred stock (consisting of
22.9 million
Series C,
28.3 million
Series D,
11.8 million
Series E,
37.3 million
Series F, and
29.2 million
Series G shares).
|
(b)
|
Common Stock
|
At
December 31, 2018
and
December 31, 2017
the Company had
36.7 million
and
3.0 million
shares of common stock issued and outstanding, respectively.
|
(c)
|
Series A and Series B Convertible Preferred Stock
|
In August and November 2000, the Company sold a total of
1.8 million
shares of Series A convertible preferred stock at
$5.15
per share to investors. In January 2001, the Company sold an additional
40 thousand
shares of Series A convertible preferred stock for the same price. In January 2001, the Company sold
3.3 million
shares of its Series B convertible preferred stock for
$13.30
per share to investors. Series A and Series B shares were converted to Series C convertible preferred stock and common stock in 2004.
|
(d)
|
Series C, Series D, Series E, Series F and Series G Convertible Preferred Stock
|
In January, March, and October 2004, the Company sold a total of
1.6 million
shares of Series C convertible preferred stock at
$8.490
per share to investors for a net consideration of
$13.1 million
(net of offering costs of
$129 thousand
).
Holders of Series A and Series B convertible preferred stock were provided an opportunity to participate in the Series C financing. Those investors that elected to participate in the Series C financing exchanged their Series A convertible preferred stock and Series B convertible preferred stock for a total of
3.0 million
shares of Series C convertible preferred stock. All remaining shares of Series A and Series B convertible preferred stock were converted to common stock on a one‑for‑one basis.
At
December 31, 2017
, there were
4.6 million
shares of Series C issued and outstanding.
In March and May 2007, the Company sold a total of
3.3 million
shares of Series D convertible preferred stock at
$4.590
per share to investors for a net consideration of
$15.2 million
(net of offering costs of
$14 thousand
).
In January and June 2009, the Company sold a total of
2.3 million
shares of Series D convertible preferred stock at
$4.590
per share to investors for a net consideration of
$10.7 million
(net of offering costs of
$55 thousand
).
73
At
December 31, 2017
, there were
5.7 million
shares of Series D issued and outstanding.
In February and July 2011, the Company sold a total of
2.3 million
shares of Series E convertible preferred stock at
$7.4695
per share to investors for a net consideration of
$17.4 million
(net of offering costs of
$135 thousand
).
At
December 31, 2017
, there were
2.3 million
shares of Series E issued and outstanding.
In November 2014, the Company sold a total of
1.0 million
shares of Series F convertible preferred stock at
$5.145
per share to investors for a net consideration of
$4.9 million
(net of offering costs of
$127 thousand
).
In January and April 2015, the Company sold a total of
4.0 million
shares of Series F convertible preferred stock at
$5.145
per share to investors for a net consideration of
$20.3 million
(net of offering costs of
$71 thousand
).
In January and February 2016, the Company sold a total of
2.3 million
shares of Series F convertible preferred stock at
$5.145
per share to investors for a net consideration of
$12.0 million
(net of offering costs of
$36 thousand
).
At
December 31, 2017
, there were
7.3 million
shares of Series F issued and outstanding.
In April and May 2017, the Company sold a total of
4.8 million
shares of Series G convertible preferred stock at
$5.9885
per share to investors for a gross consideration of
$28.8 million
. Total offering costs incurred in connection with the financing were
$1.3 million
, of which
$45 thousand
was incurred in 2016.
At
December 31, 2017
, there were
4.8 million
of Series G issued and outstanding.
The rights and privileges of the Series C, Series D, Series E, F, and G convertible preferred stock are as follows:
Dividends
The holders of shares of Series F and Series G convertible preferred stock are entitled to receive dividends out of any assets legally available in preference to any declaration or payment of any dividend on the Series C, Series D, or Series E convertible preferred stock or common stock. The dividend rate for the Series F and Series G convertible preferred stock is equal to
$0.206
and
$0.240
per annum (as adjusted for any stock splits, stock dividends or distributions, recapitalizations, and similar events) on each outstanding share of Series G and Series F convertible preferred stock, respectively. The holders of Series C convertible preferred stock, Series D convertible preferred stock and Series E convertible preferred stock are entitled to receive dividends payable out of any assets legally available in preference to any declaration or payment of any dividend (payable other than in common stock or other securities and rights convertible into or entitling the holder thereof to receive, directly or indirectly, additional shares of common stock) on the common stock, at the rate of
$0.340
, in the case of the Series C convertible preferred stock,
$0.184
in the case of the Series D convertible preferred stock, and
$0.300
in the case of the Series E convertible preferred stock, per share per annum (as adjusted for any stock splits, stock dividends or distributions, recapitalizations, and similar events) on the convertible preferred stock, payable annually. Such dividends are payable only if declared by the board of directors, and are not cumulative. As of December 31, 2017 no dividends have been declared.
Liquidation Preference
In the event of liquidation the holders of Series F and Series G convertible preferred stock will be entitled to receive, in preference to the holders of Series C, D, and E convertible preferred stock and the holders of common stock, a per share amount equal to
$5.145
and
$5.9885
, respectively, plus any declared but unpaid dividends. Upon the completion of distribution to holders of Series G and Series F convertible preferred stock, the holders of Series C, D, and E convertible preferred stock will be entitled to receive, in preference to the holders of common stock, a per share amount equal to
$8.490
,
$4.590
, and
$7.4695
, respectively, plus any declared but unpaid dividends. After payment of the Liquidation Preference to the holders of Series C, D, and E convertible preferred stock, any remaining assets of the Company legally available for distribution to stockholders will be distributed among the holders of common stock on a pro rata basis. As of December 31, 2017 the aggregate liquidation preference to the convertible preferred stockholders was as follows:
74
|
(in thousands)
|
|||
|
Series C
|
$
|
38,820
|
|
|
Series D
|
25,980
|
|
|
|
Series E
|
17,537
|
|
|
|
Series F
|
37,334
|
|
|
|
Series G
|
28,783
|
|
|
|
$
|
148,454
|
|
|
Conversion
Each share of Series C, D, E, F and G convertible preferred stock is convertible, at the option of the holder, at any time into shares of the Company’s common stock. Each share of Series C, D, E, F and G convertible preferred stock is initially convertible into one share of the Company’s common stock. Shares of Series C, D, E, F and G convertible preferred stock automatically convert to shares of common stock upon the earlier of an initial public offering of the Company’s equity securities of not less than
$7.185
per share and gross aggregate cash proceeds of
$50 million
or the written consent of the holders of a majority of the then-outstanding shares of convertible preferred stock, voting together as a single class on an as‑converted basis, and the holders of a majority of the then-outstanding shares of Series G convertible preferred stock, voting together as a separate class.
Immediately prior to the closing of the IPO on April 30, 2018 all shares of the outstanding convertible preferred stock automatically converted into an aggregate of
24.6 million
shares of common stock. There were
no
outstanding shares of convertible preferred stock as of
December 31, 2018
.
Voting Rights
The holders of each share of Series C, D, E, F and G convertible preferred stock are entitled to a number of votes equal to the number of shares of common stock into which such shares could be converted. In addition, the consent of the holders of a majority of the convertible preferred stock, voting as a separate class, is required for certain corporate actions. The holders of Series E, F and G convertible preferred stock have additional voting rights, which require the consent of the holders of a majority of the then-outstanding shares of Series E,F or G convertible preferred stock, each voting as a separate class, to consent to certain corporate actions as the case may be.
Warrants
In conjunction with the Loan and Security Agreement with Pacific Western Bank, the Company granted
20 thousand
warrants to purchase Series E convertible preferred stock at an exercise price of
$7.47
per share in 2014. The fair value of the warrants was recorded as a debt discount and was not material to the consolidated financial statements. The warrants were exercised and converted to
15 thousand
common shares in May 2018.
In conjunction with the Loan and Security Agreement with Multiplier, the Company granted
194 thousand
warrants to purchase Series F convertible preferred stock at an exercise price of
$5.15
per share in 2015. The warrants were measured at fair value using the Black‑Scholes option pricing model, with assumptions of expected term of
five
years, volatility of
39.0%
, and risk free rate of
1.7%
. The relative fair value of the warrants of
$360 thousand
was accounted for as debt discount, and was initially included in debt issuance costs before being written off in the current year as a result of the debt extinguishment described in Note 11. The warrants were exercised and converted to
145 thousand
common shares in November 2018.
(e) Preferred Stock
In April 2018, the Company's Board of Directors approved an increase to the amount of authorized preferred stock to become effective on the closing of the Company's IPO. As of
December 31, 2018
there were
5.0 million
shares of preferred stock, par value
$0.0001
, authorized and
no
shares of preferred stock issued and outstanding.
|
(f)
|
2001 and 2018 Stock Plans
|
The Company maintains
two
stock-based compensation plans: the 2018 Equity Incentive Plan (the "2018 Plan"), and the 2001 Stock Option Plan (the "2001 Plan"). The Board of Directors adopted, and stockholders approved, the 2018 Plan in April 2018. The 2018 Plan became effective on April 24, 2018, and serves as the successor to the 2001 Plan. There are
no
shares reserved
75
for future awards under the 2001 Plan. Outstanding awards under the 2001 Plan continue to be subject to the terms and conditions of the 2001 Plan.
In April 2018, the Company adopted the 2018 Plan with a reserve of
3.4 million
shares of common stock for issuance, plus, shares subject to awards under the 2001 Plan that expire or terminate, and shares previously issued pursuant to the 2001 Plan that are forfeited (provided that the maximum number of shares that may be added to the 2018 Plan from the 2001 plan is
5.6 million
shares). The number of shares reserved for issuance under the 2018 Plan will increase automatically on the first day of each calendar year by a number of shares of common stock equal to the lesser of (i)
3.4 million
shares of common stock, (ii)
5%
of the total outstanding shares of the Company's common stock as of the immediately preceding December 31 or (iii) a number of shares determined by the Board of Directors.
As of
December 31, 2018
and
December 31, 2017
the Company had reserved
9.0 million
shares of common stock for issuance under the
two
plans to employees, directors, and consultants of the Company. Of these shares, a total of
2.9 million
and
1.7 million
shares, respectively were available for issuance as of
December 31, 2018
and
December 31, 2017
.
The following table summarizes the Company’s stock option activity during the
year
ended
December 31, 2018
:
|
(in thousands, except weighted average grant price)
|
Number of shares
|
Weighted average exercise price
|
Weighted average remaining contractual term (years)
|
Aggregate intrinsic value
|
||||
|
Outstanding, December 31, 2017
|
5,369
|
|
$1.09
|
7.4
|
$29,863
|
|||
|
Options granted
|
357
|
|
$9.71
|
|||||
|
Options exercised
|
(387
|
)
|
$0.94
|
|||||
|
Options canceled
|
(168
|
)
|
$4.31
|
|||||
|
Outstanding, December 31, 2018
|
5,171
|
|
$1.60
|
7.2
|
$83,700
|
|||
|
Options exercisable at December 31, 2018
|
3,027
|
|
$0.92
|
6.6
|
$51,041
|
|||
|
Options vested as of December 31, 2018 and expected to vest after December 31, 2018
|
5,171
|
|
$1.60
|
7.2
|
$83,700
|
|||
Total intrinsic value of options exercised for the
years ended December 31, 2018
and
2017
was
$6.7 million
and
$751 thousand
, respectively. The Company received proceeds of
$362 thousand
and
$336 thousand
from the exercise of options for the
years ended December 31, 2018
and
2017
, respectively.
The Company has granted time-based options, time-based restricted stock unit awards, performance-based restricted stock unit awards, time-based restricted stock awards, and performance-based restricted stock awards.
Restricted stock award activity during the year ended
December 31, 2018
was as follows:
|
(in thousands, except weighted average grant price)
|
Number of restricted stock awards
|
Weighted average grant date fair value
|
||
|
Outstanding, December 31, 2017
|
—
|
|
$0.00
|
|
|
Awards granted
|
115
|
|
$37.15
|
|
|
Awards vested
|
—
|
|
$0.00
|
|
|
Awards canceled
|
—
|
|
$0.00
|
|
|
Outstanding, December 31, 2018
|
115
|
|
$37.15
|
|
76
Restricted stock unit activity during the year ended
December 31, 2018
was as follows:
|
(in thousands, except weighted average grant price)
|
Number of restricted stock units
|
Weighted average grant date fair value
|
||
|
Outstanding, December 31, 2017
|
—
|
|
$0.00
|
|
|
Units granted
|
563
|
|
$30.26
|
|
|
Units vested
|
(2
|
)
|
$32.50
|
|
|
Units canceled
|
(4
|
)
|
$23.73
|
|
|
Outstanding, December 31, 2018
|
557
|
|
$30.31
|
|
Of the
672 thousand
non-vested restricted stock awards and restricted stock units outstanding under the 2018 Plan as of
December 31, 2018
,
206 thousand
awards represent the expected number of awards whereby vesting is contingent on meeting certain performance conditions. The stock-based compensation expense for those awards in the year ended
December 31, 2018
was estimated by the Company at
100%
achievement.
Total compensation cost related to nonvested options, restricted stock units and restricted stock awards not yet recognized is
$19.4 million
, which will be recognized over the next five years as follows:
|
(in thousands)
|
|||
|
2019
|
$
|
6,925
|
|
|
2020
|
6,123
|
|
|
|
2021
|
4,500
|
|
|
|
2022
|
1,817
|
|
|
|
2023
|
8
|
|
|
|
$
|
19,373
|
|
|
(g)
2018 Employee Stock Purchase Plan
During the year ended December 31, 2018, the Company's Board of Directors approved the terms of the 2018 Employee Stock Purchase Plan (the "2018 ESPP"). The 2018 ESPP became effective on April 24, 2018. Subject to any limitations therein, the 2018 ESPP allows eligible employees to contribute up to
10%
of their earnings for the purchase of common stock at a discounted price per share. The 2018 ESPP provides for separate
six
-month offering periods commencing on the first trading day on or after May 15 and November 15 of each calendar year. The initial offering period will occur from November 15, 2018 through May 14, 2019.
A total of
0.9 million
shares of common stock are available for sale under the 2018 ESPP. The number of shares of common stock that are available for sale under the ESPP also includes an annual increase on the first day of each fiscal year following the fiscal year in which the first offering period enrollment date occurs, equal to the least of:
0.9 million
shares;
2%
of the outstanding shares of common stock as of the last day of the immediately preceding fiscal year; or such other amount as the Board of Directors may determine. As of
December 31, 2018
, no shares of the Company's common stock have been purchased under the 2018 ESPP.
(14) 401(k) Plan
The Company has a 401(k) Profit Sharing Plan and Trust (the Plan). Participation in the Plan is voluntary and is available to all employees. Employees are eligible to participate in the Plan on the first day of the month after their first day of employment. Participants may elect to contribute part of their annual salary to the Plan up to the statutorily prescribed limit. The Company may make discretionary matching or qualified nonelective contributions to the Plan. The Company maintains a match of
40%
of each dollar up to the first
5%
of compensation that is contributed to the Plan. The match for the
years ended December 31, 2018
,
2017
and
2016
was
$606 thousand
,
$462 thousand
and
$376 thousand
, respectively, and is recorded within the cost of revenues and operating expenses in the consolidated statements of operations.
77
(15) Segment and Geographic Information
The Company operates in
one
segment which involves the design, development, production and distribution of fiber lasers, semiconductor lasers, and other related products. The Company's chief operating decision‑maker (CODM) is the chief executive officer. The CODM regularly reviews financial information presented on a total company basis, accompanied by information about revenue and direct costs by product family for purposes of monitoring the product mix impact on total gross margin. Throughout the year, the CODM allocates capital resources on a project‑by‑project basis across the Company’s entire asset base to maximize profitability regardless of the legal entity, product or end market basis.
The Company markets and sells its products throughout the world through both direct sales and distribution channels. The geographic sources of the Company’s revenues based on the customer's location are as follows:
|
Year Ended December 31,
|
|||||||||||
|
(in thousands)
|
2018
|
2017
|
2016
|
||||||||
|
China
|
$
|
70,196
|
|
$
|
55,344
|
|
$
|
38,309
|
|
||
|
North America
|
70,694
|
|
46,489
|
|
36,200
|
|
|||||
|
Rest of World
|
50,469
|
|
36,747
|
|
26,816
|
|
|||||
|
$
|
191,359
|
|
$
|
138,580
|
|
$
|
101,325
|
|
|||
The geographic locations of the Company’s long‑lived assets, net, based on location of the assets, are as follows:
|
December 31,
|
December 31,
|
||||||
|
(in thousands)
|
2018
|
2017
|
|||||
|
United States
|
$
|
18,308
|
|
$
|
13,991
|
|
|
|
China
|
8,187
|
|
8,433
|
|
|||
|
Rest of World
|
1,022
|
|
991
|
|
|||
|
$
|
27,517
|
|
$
|
23,415
|
|
||
(16) Net Income (Loss) per Share
Net income (loss) per share is presented in conformity with the two‑class method required for multiple classes of common stock and participating securities.
The participating securities include convertible preferred stock as the holders of these securities are entitled to receive a noncumulative dividend in preference to the common stockholders in the event that a dividend is declared on common stock. The holders of convertible preferred stock do not have a contractual obligation to share in the losses. As such, net loss for the year ended December 31, 2016 was not allocated to the participating securities. The convertible preferred stock converted to common stock on April 30, 2018 upon the closing of the Company's initial public offering. As such, for the year ended
December 31, 2018
only income earned prior to April 30, 2018 has been allocated to these participating securities.
Basic income per share is computed using the weighted average number of common shares outstanding during the period, and excludes any dilutive effects of common stock equivalent shares such as stock options, restricted stock, warrants, and convertible preferred stock. Diluted income per share is computed using the weighted average number of common shares outstanding and potentially dilutive common stock options, restricted stock, warrants, and convertible preferred stock.
78
The following table sets forth the calculation of basic and diluted net income (loss) per share attributable to common stockholders during the periods presented:
|
Year Ended December 31,
|
|||||||||||
|
(in thousands, except per share data)
|
2018
|
2017
|
2016
|
||||||||
|
Numerator:
|
|||||||||||
|
Net income (loss)
|
$
|
13,938
|
|
$
|
1,837
|
|
$
|
(14,202
|
)
|
||
|
Participating securities:
|
|||||||||||
|
Income allocated to participating securities
|
(4,415
|
)
|
(1,837
|
)
|
—
|
|
|||||
|
Net income (loss) attributable to common stockholders
|
9,523
|
|
—
|
|
(14,202
|
)
|
|||||
|
Denominator:
|
|||||||||||
|
Weighted-average shares, basic
|
24,862
|
|
2,735
|
|
2,500
|
|
|||||
|
Dilutive effect of restricted stock units and awards
|
11
|
|
—
|
|
—
|
|
|||||
|
Dilutive effect of common stock options
|
5,086
|
|
—
|
|
—
|
|
|||||
|
Weighted-average common shares outstanding, diluted
|
29,959
|
|
2,735
|
|
2,500
|
|
|||||
|
Net income (loss) per share attributable to common stockholders:
|
|||||||||||
|
Basic
|
$
|
0.38
|
|
$0.00
|
$
|
(5.68
|
)
|
||||
|
Diluted
|
$
|
0.32
|
|
$0.00
|
$
|
(5.68
|
)
|
||||
The following potentially dilutive shares of convertible preferred stock, preferred stock warrants, restricted stock awards and units, and stock options were not included in the calculation of diluted shares above as the effect would have been anti‑dilutive:
|
Year Ended December 31,
|
||||||||
|
(in thousands)
|
2018
|
2017
|
2016
|
|||||
|
Convertible preferred stock
|
—
|
|
23,095
|
|
19,774
|
|
||
|
Preferred stock warrants
|
—
|
|
214
|
|
214
|
|
||
|
Restricted stock units and awards
|
622
|
|
—
|
|
—
|
|
||
|
Common stock options
|
—
|
|
5,369
|
|
4,602
|
|
||
|
Total
|
622
|
|
28,678
|
|
24,590
|
|
||
(17) Quarterly Results of Operations (unaudited)
The following table summarizes unaudited quarterly financial data for
2018
and
2017
(in thousands, except per share data):
|
Year Ended December 31, 2018
|
|||||||||||||||||||
|
Q4
|
Q3
|
Q2
|
Q1
|
Full Year
|
|||||||||||||||
|
Revenues
|
$
|
46,162
|
|
$
|
51,025
|
|
$
|
51,705
|
|
$
|
42,467
|
|
$
|
191,359
|
|
||||
|
Gross profit
|
16,506
|
|
18,047
|
|
17,679
|
|
14,729
|
|
66,961
|
|
|||||||||
|
Net income attributable to common stockholders
|
2,360
|
|
4,009
|
|
3,154
|
|
—
|
|
9,523
|
|
|||||||||
|
Net income per share, basic
|
$
|
0.06
|
|
$
|
0.11
|
|
$
|
0.13
|
|
$
|
0.00
|
|
$
|
0.38
|
|
||||
|
Net income per share, diluted
|
$
|
0.06
|
|
$
|
0.10
|
|
$
|
0.11
|
|
$
|
0.00
|
|
$
|
0.32
|
|
||||
79
|
Year Ended December 31, 2017
|
|||||||||||||||||||
|
Q4
|
Q3
|
Q2
|
Q1
|
Full Year
|
|||||||||||||||
|
Revenues
|
$
|
37,482
|
|
$
|
36,547
|
|
$
|
34,664
|
|
$
|
29,887
|
|
$
|
138,580
|
|
||||
|
Gross profit
|
12,282
|
|
12,345
|
|
10,680
|
|
8,967
|
|
44,274
|
|
|||||||||
|
Net income (loss) attributable to common stockholders
|
—
|
|
—
|
|
(287
|
)
|
(1,213
|
)
|
—
|
|
|||||||||
|
Net income (loss) per share, basic
|
$
|
—
|
|
$
|
—
|
|
$
|
(0.11
|
)
|
$
|
(0.47
|
)
|
$0.00
|
||||||
|
Net income (loss) per share, diluted
|
$
|
—
|
|
$
|
—
|
|
$
|
(0.11
|
)
|
$
|
(0.47
|
)
|
$0.00
|
||||||
ITEM 9. CHANGES IN AND DISAGREEMENTS WITH ACCOUNTANTS ON ACCOUNTING AND FINANCIAL DISCLOSURE
None.
ITEM 9A. CONTROLS AND PROCEDURES
Evaluation of Disclosure Controls and Procedures
Our management, with the participation of our chief executive officer and our chief financial officer, have evaluated our disclosure controls and procedures (as defined in Rules 13a-15(e) and 15d-15(e) under the Exchange Act) as of the end of the period covered by this report. Based on that evaluation, our chief executive officer and our chief financial officer have concluded that, as of such date, our disclosure controls and procedures were, in design and operation, effective.
Management's Report on Internal Control Over Financial Reporting
This annual report on Form 10-K does not include a report of management’s assessment regarding internal control over financial reporting or an attestation report of our independent registered public accounting firm due to a transition period established by the rules of the SEC for newly public companies.
Changes in Internal Control over Financial Reporting
Our chief executive officer and chief financial officer did not identify any changes in our internal control over financial reporting in connection with the evaluation required by Rule 13a-15(d) and 15d-15(d) of the Exchange Act during the quarter ended
December 31, 2018
that have materially affected, or are reasonably likely to materially affect, our internal control over financial reporting.
Inherent Limitation on the Effectiveness of Internal Control
The effectiveness of any system of internal control over financial reporting, including ours, is subject to inherent limitations, including the exercise of judgment in designing, implementing, operating, and evaluating the controls and procedures, and the inability to eliminate misconduct completely. Accordingly, in designing and evaluating the disclosure controls and procedures, management recognizes that any system of internal control over financial reporting, including ours, no matter how well designed and operated, can only provide reasonable, not absolute assurance of achieving the desired control objectives. In addition, the design of disclosure controls and procedures must reflect the fact that there are resource constraints and that management is required to apply its judgment in evaluating the benefits of possible controls and procedures relative to their costs. Moreover, projections of any evaluation of effectiveness to future periods are subject to the risk that controls may become inadequate because of changes in conditions, or that the degree of compliance with the policies or procedures may deteriorate. We intend to continue to monitor and upgrade our internal controls as necessary or appropriate for our business, but cannot assure you that such improvements will be sufficient to provide us with effective internal control over financial reporting.
ITEM 9B. OTHER INFORMATION
None.
80
PART III
ITEM 10. DIRECTORS, EXECUTIVE OFFICERS AND CORPORATE GOVERNANCE
The information required by this item is incorporated by reference to the Company’s definitive proxy statement relating to the 2019 annual meeting of stockholders. The definitive proxy statement will be filed with the SEC within 120 days after
December 31, 2018
.
We have adopted a Code of Ethics that applies to our chief executive officer, chief financial officer, principal accounting officer and controller and persons performing similar functions. The Code of Ethics is posted on our website at http://investors.nlight.net/IR/corporate-governance. We intend to satisfy the disclosure requirements under Item 5.05 of Form 8-K regarding an amendment to, or waiver from, a provision of the Code of Ethics by posting such information on our website at the address specified above.
ITEM 11. EXECUTIVE COMPENSATION
The information required by this item is incorporated by reference to the Company’s definitive proxy statement relating to the 2019 annual meeting of stockholders. The definitive proxy statement will be filed with the SEC within 120 days after
December 31, 2018
.
ITEM 12. SECURITY OWNERSHIP OF CERTAIN BENEFICIAL OWNERS AND MANAGEMENT AND RELATED STOCKHOLDER MATTERS
The information required by this item is incorporated by reference to the Company’s definitive proxy statement relating to the 2019 annual meeting of stockholders. The definitive proxy statement will be filed with the SEC within 120 days after
December 31, 2018
.
ITEM 13. CERTAIN RELATIONSHIPS AND RELATED TRANSACTIONS, AND DIRECTOR INDEPENDENCE
The information required by this item is incorporated by reference to the Company’s definitive proxy statement relating to the 2019 annual meeting of stockholders. The definitive proxy statement will be filed with the SEC within 120 days after
December 31, 2018
.
ITEM 14. PRINCIPAL ACCOUNTING FEES AND SERVICES
The information required by this item is incorporated by reference to the Company’s definitive proxy statement relating to the 2019 annual meeting of stockholders. The definitive proxy statement will be filed with the SEC within 120 days after
December 31, 2018
.
81
PART IV
ITEM 15. EXHIBITS
(a)(1)
Financial Statements
We have filed the financial statements listed in the Index to Consolidated Financial Statements as a part of this report.
(a)(2)
Financial Statement Schedules
Schedules not listed above have been omitted because they are not required, not applicable, or the required information is otherwise included.
(a)(3)
Exhibits
The exhibits listed below are filed as part of this Annual Report on Form 10-K or are incorporated herein by reference, in each case as indicated below.
|
Exhibit
Number
|
Incorporated by Reference
|
Filed
Herewith
|
||||
|
Description
|
Form
|
File No.
|
Exhibit
|
Filing Date
|
||
|
3.1
|
10-Q
|
001-38462
|
3.1
|
May 25, 2018
|
||
|
3.2
|
10-Q
|
001-38462
|
3.2
|
May 25, 2018
|
||
|
4.1
|
S-1/A
|
333-224055
|
4.1
|
April 16, 2018
|
||
|
4.2
|
S-1
|
333-224055
|
4.2
|
March 30, 2018
|
||
|
10.1
|
S-1/A
|
333-224055
|
10.1
|
April 16, 2018
|
||
|
10.2+
|
S-1
|
333-224055
|
10.2
|
March 30, 2018
|
||
|
10.3+
|
S-1/A
|
333-224055
|
10.3
|
April 16, 2018
|
||
|
10.4+
|
S-1/A
|
333-224055
|
10.4
|
April 16, 2018
|
||
|
10.5+
|
8-K
|
001-38462
|
10.1
|
June 4, 2018
|
||
|
10.6+
|
8-K
|
001-38462
|
10.2
|
June 4, 2018
|
||
|
10.7+
|
8-K
|
001-38462
|
10.3
|
June 4, 2018
|
||
|
10.8+
|
S-1
|
333-224055
|
10.5
|
March 30, 2018
|
||
|
10.9+
|
S-1
|
333-224055
|
10.6
|
March 30, 2018
|
||
|
10.10+
|
S-1
|
333-224055
|
10.7
|
March 30, 2018
|
||
|
10.11+
|
S-1
|
333-224055
|
10.8
|
March 30, 2018
|
||
|
10.12
|
S-1
|
333-224055
|
10.10
|
March 30, 2018
|
||
|
10.13
|
10-Q
|
001-38462
|
10.1
|
August 10, 2018
|
||
|
10.14
|
8-K
|
001-38462
|
10.1
|
September 27, 2018
|
||
|
10.15
|
S-1
|
333-224055
|
10.11
|
March 30, 2018
|
||
82
|
Exhibit
Number
|
Incorporated by Reference
|
Filed
Herewith
|
||||
|
Description
|
Form
|
File No.
|
Exhibit
|
Filing Date
|
||
|
10.16
|
S-1
|
333-224055
|
10.12
|
March 30, 2018
|
||
|
10.17
|
8-K
|
001-38462
|
10.1
|
May 11, 2018
|
||
|
10.18
|
S-1
|
333-224055
|
10.13
|
March 30, 2018
|
||
|
10.19
|
S-1
|
333-224055
|
10.14
|
March 30, 2018
|
||
|
21.1
|
S-1
|
333-224055
|
21.1
|
March 30, 2018
|
||
|
23.1
|
X
|
|||||
|
31.1
|
X
|
|||||
|
31.2
|
X
|
|||||
|
32.1*
|
X
|
|||||
|
101.INS
|
XBRL Instance Document.
|
X
|
||||
|
101.SCH
|
XBRL Taxonomy Extension Schema Document
|
X
|
||||
|
101.CAL
|
XBRL Taxonomy Extension Calculation Linkbase Document.
|
X
|
||||
|
101.DEF
|
XBRL Taxonomy Extension Definition Linkbase Document
|
X
|
||||
|
101.LAB
|
XBRL Taxonomy Extension Label Linkbase Document
|
X
|
||||
|
101.PRE
|
XBRL Taxonomy Extension Presentation Linkbase Document
|
X
|
||||
|
+
|
Indicates a management contract or compensatory plan or arrangement.
|
|
*
|
The certifications furnished in Exhibit 32.1 hereto are deemed to accompany this Annual Report on Form 10-K and will not be deemed "filed" for purposes of Section 18 of the Securities Exchange Act of 1934, as amended, except to the extent that the registrant specifically incorporates it by reference.
|
ITEM 16. FORM 10-K SUMMARY
None.
83
SIGNATURES
Pursuant to the requirements of the Securities Exchange Act of 1934, the registrant has duly caused this report to be signed on its behalf by the undersigned, thereunto duly authorized.
|
NLIGHT, INC.
|
||
|
Date: March 15, 2019
|
By:
|
/s/ SCOTT KEENEY
|
|
Scott Keeney
|
||
|
President and Chief Executive Officer
(Principal Executive Officer) |
||
|
Date: March 15, 2019
|
By:
|
/s/ RAN BAREKET
|
|
Ran Bareket
|
||
|
Chief Financial Officer
(Principal Accounting and Financial Officer) |
||
POWER OF ATTORNEY
KNOW ALL PERSONS BY THESE PRESENTS, that each person whose signature appears below constitutes and appoints Scott Keeney and Ran Bareket, and each of them, with full power of substitution and resubstitution and full power to act without the other, as his or her true and lawful attorney-in-fact and agent to act in his or her name, place and stead and to execute in the name and on behalf of each person, individually and in each capacity stated below, and to file, any and all documents in connection therewith, with the Securities and Exchange Commission, granting unto said attorneys-in-fact and agents, and each of them, full power and authority to do and perform each and every act and thing, ratifying and confirming all that said attorneys-in-fact and agents or any of them or their and his or her substitute or substitutes, may lawfully do or cause to be done by virtue thereof.
Pursuant to the requirements of the Securities Act of 1934, this Annual Report on Form 10-K has been signed by the following persons on behalf of the registrant and in the capacities and on the dates indicated:
84
|
Signature
|
Title
|
Date
|
|
/s/ SCOTT KEENEY
|
President, Chief Executive Officer and Director (Principal Executive Officer)
|
|
|
Scott Keeney
|
March 15, 2019
|
|
|
/s/ RAN BAREKET
|
Chief Financial Officer (Principal Accounting and Financial Officer)
|
|
|
Ran Bareket
|
March 15, 2019
|
|
|
/s/ BANDEL CARANO
|
Director
|
|
|
Bandel Carano
|
March 15, 2019
|
|
|
/s/ DOUGLAS CARLISLE
|
Director
|
|
|
Douglas Carlisle
|
March 15, 2019
|
|
|
/s/ BILL GOSSMAN
|
Director
|
|
|
Bill Gossman
|
March 15, 2019
|
|
|
/s/ RAYMOND LINK
|
Director
|
|
|
Raymond Link
|
March 15, 2019
|
|
|
/s/ GARY LOCKE
|
Director
|
|
|
Gary Locke
|
March 15, 2019
|
|
|
/s/ GEOFFREY MOORE
|
Director
|
|
|
Geoffrey Moore
|
March 15, 2019
|
|
|
/s/ DAVID OSBORNE
|
Director
|
|
|
David Osborne
|
March 15, 2019
|
|
85
TABLE OF CONTENTS
Part IItem 1. BusinessItem 1A. Risk FactorsItem 1B. Unresolved Staff CommentsItem 2. PropertiesItem 3. Legal ProceedingsItem 4. Mine Safety DisclosuresPart IIItem 5. Market For Registrant's Common Equity, Related Stockholder Matters and Issuer Purchases Of Equity SecuritiesItem 6. Selected Consolidated Financial DataItem 7. Management S Discussion and Analysis Of Financial Condition and Results Of OperationsItem 7A. Quantitative and Qualitative Disclosures About Market RiskItem 8. Financial Statements and Supplementary DataItem 9. Changes in and Disagreements with Accountants on Accounting and Financial DisclosureItem 9A. Controls and ProceduresItem 9B. Other InformationPart IIIItem 10. Directors, Executive Officers and Corporate GovernanceItem 11. Executive CompensationItem 12. Security Ownership Of Certain Beneficial Owners and Management and Related Stockholder MattersItem 13. Certain Relationships and Related Transactions, and Director IndependenceItem 14. Principal Accounting Fees and ServicesPart IVItem 15. ExhibitsItem 16. Form 10-k Summary