LAUREATE EDUCATION, INC.
UNITED STATES
SECURITIES AND EXCHANGE COMMISSION
Washington, D.C. 20549
FORM 10-Q
x
Quarterly Report pursuant to Section 13 or 15(d) of the Securities Exchange Act of 1934
For the quarterly period ended
September 30, 2018
OR
o
Transition Report pursuant to Section 13 or 15(d) of the Securities Exchange Act of 1934
For the transition period from __________ to __________.
Commission File Number: 001-38002

Laureate Education, Inc.
(Exact name of registrant as specified in its charter)
|
Delaware
|
52-1492296
|
|
|
(State or other jurisdiction of
|
(I.R.S. Employer
|
|
|
incorporation or organization)
|
Identification No.)
|
|
|
650 S. Exeter Street, Baltimore, Maryland
|
21202
|
|
|
(Address of principal executive offices)
|
(Zip Code)
|
|
Registrant’s telephone number, including area code: (410) 843-6100
Indicate by check mark whether the registrant (1) has filed all reports required to be filed by Section 13 or 15(d) of the Securities Exchange Act of 1934 during the preceding 12 months (or for such shorter period that the registrant was required to file such reports), and (2) has been subject to such filing requirements for the past 90 days. Yes
x
No
o
Indicate by check mark whether the registrant has submitted electronically and posted on its corporate Web site, if any, every Interactive Data File required to be submitted and posted pursuant to Rule 405 of Regulation S-T (§232.405 of this chapter) during the preceding 12 months (or for such shorter period that the registrant was required to submit and post such files).
Yes
x
No
o
Indicate by check mark whether the registrant is a large accelerated filer, an accelerated filer, a non-accelerated filer, smaller reporting company, or an emerging growth company. See the definitions of "large accelerated filer," "accelerated filer," "smaller reporting company," and "emerging growth company" in Rule 12b-2 of the Exchange Act.
Large accelerated filer
o
Accelerated filer
o
Non-accelerated filer
x
(Do not check if a smaller reporting company)
Smaller reporting company
o
Emerging Growth Company
o
If an emerging growth company, indicate by check mark if the registrant has elected not to use the extended transition period for complying with any new or revised financial accounting standards provided pursuant to Section 13(a) of the Exchange Act.
o
Indicate by check mark whether the registrant is a shell company (as defined in Rule 12b-2 of the Exchange Act). Yes
o
No
x
Indicate the number of shares outstanding of each of the issuer's classes of common stock, as of the latest practicable date.
|
Class
|
Outstanding at September 30, 2018
|
|
|
Class A common stock, par value $0.004 per share
|
91,654,217 shares
|
|
|
Class B common stock, par value $0.004 per share
|
132,386,666 shares
|
|
|
INDEX
|
|||
|
PART I. - FINANCIAL INFORMATION
|
Page No.
|
||
|
Item 1.
|
Financial Statements (Unaudited)
|
||
|
Consolidated Statements of Operations - Three months ended September 30, 2018 and
September 30, 2017
|
|||
|
Consolidated Statements of Operations - Nine months ended September 30, 2018 and
September 30, 2017
|
|||
|
Consolidated Statements of Comprehensive Income - Three months ended September 30, 2018
and September 30, 2017 |
|||
|
Consolidated Statements of Comprehensive Income - Nine months ended September 30, 2018
and September 30, 2017 |
|||
|
Consolidated Balance Sheets - September 30, 2018 and December 31, 2017
|
|||
|
Consolidated Statements of Cash Flows - Nine months ended September 30, 2018 and
September 30, 2017
|
|||
|
Notes to Consolidated Financial Statements
|
|||
|
Item 2.
|
Management's Discussion and Analysis of Financial Condition and Results of Operations
|
||
|
Item 3.
|
Quantitative and Qualitative Disclosures About Market Risk
|
||
|
Item 4.
|
Controls and Procedures
|
||
|
PART II. - OTHER INFORMATION
|
|||
|
Item 1.
|
Legal Proceedings
|
||
|
Item 1A.
|
Risk Factors
|
||
|
Item 6.
|
Exhibits
|
||
|
SIGNATURES
|
|||
1
LAUREATE EDUCATION, INC. AND SUBSIDIARIES
IN THOUSANDS, except per share amounts
|
For the three months ended September 30,
|
2018
|
|
2017
|
||||
|
(Unaudited)
|
(Unaudited)
|
||||||
|
Revenues
|
$
|
787,102
|
|
$
|
818,601
|
|
|
|
Costs and expenses:
|
|||||||
|
Direct costs
|
677,816
|
|
728,743
|
|
|||
|
General and administrative expenses
|
73,680
|
|
64,999
|
|
|||
|
Loss on impairment of assets
|
10,030
|
|
—
|
|
|||
|
Operating income
|
25,576
|
|
24,859
|
|
|||
|
Interest income
|
3,502
|
|
3,677
|
|
|||
|
Interest expense
|
(58,319
|
)
|
(69,103
|
)
|
|||
|
Loss on derivatives
|
(144
|
)
|
(19,930
|
)
|
|||
|
Other income (expense), net
|
8,312
|
|
(778
|
)
|
|||
|
Foreign currency exchange (loss) gain, net
|
(26,492
|
)
|
6,624
|
|
|||
|
Loss from continuing operations before income taxes
|
(47,565
|
)
|
(54,651
|
)
|
|||
|
Income tax benefit (expense)
|
3,773
|
|
(12,530
|
)
|
|||
|
Loss from continuing operations
|
(43,792
|
)
|
(67,181
|
)
|
|||
|
Loss from discontinued operations, net of tax benefit (expense) of $2,905 and $(1,329), respectively
|
(34,466
|
)
|
|
(36,309
|
)
|
||
|
Loss on sales of discontinued operations, net of tax expense of $2,694 and $0
|
(18,426
|
)
|
|
—
|
|
||
|
Net loss
|
(96,684
|
)
|
(103,490
|
)
|
|||
|
Net loss attributable to noncontrolling interests
|
1,895
|
|
5,531
|
|
|||
|
Net loss attributable to Laureate Education, Inc.
|
$
|
(94,789
|
)
|
$
|
(97,959
|
)
|
|
|
Accretion of Series A convertible redeemable preferred stock and other redeemable noncontrolling interests and equity
|
324
|
|
(84,060
|
)
|
|||
|
Net loss available to common stockholders
|
$
|
(94,465
|
)
|
$
|
(182,019
|
)
|
|
|
Basic and diluted loss per share:
|
|||||||
|
Loss from continuing operations
|
$
|
(0.18
|
)
|
$
|
(0.82
|
)
|
|
|
Loss from discontinued operations
|
(0.24
|
)
|
(0.20
|
)
|
|||
|
Basic and diluted loss per share
|
$
|
(0.42
|
)
|
$
|
(1.02
|
)
|
|
The accompanying notes are an integral part of these consolidated financial statements.
2
LAUREATE EDUCATION, INC. AND SUBSIDIARIES
Consolidated Statements of Operations
IN THOUSANDS, except per share amounts
|
For the nine months ended September 30,
|
2018
|
2017
|
|||||
|
(Unaudited)
|
(Unaudited)
|
||||||
|
Revenues
|
$
|
2,436,514
|
|
$
|
2,434,687
|
|
|
|
Costs and expenses:
|
|||||||
|
Direct costs
|
2,081,125
|
|
2,110,901
|
|
|||
|
General and administrative expenses
|
194,184
|
|
221,909
|
|
|||
|
Loss on impairment of assets
|
10,030
|
|
—
|
|
|||
|
Operating income
|
151,175
|
|
101,877
|
|
|||
|
Interest income
|
9,358
|
|
9,702
|
|
|||
|
Interest expense
|
(181,764
|
)
|
(256,677
|
)
|
|||
|
Loss on debt extinguishment
|
(7,481
|
)
|
(8,425
|
)
|
|||
|
Gain on derivatives
|
92,112
|
|
19,187
|
|
|||
|
Other income (expense), net
|
10,815
|
|
(568
|
)
|
|||
|
Foreign currency exchange loss, net
|
(43,942
|
)
|
(2,221
|
)
|
|||
|
Income (loss) from continuing operations before income taxes and equity in net income of affiliates
|
30,273
|
|
(137,125
|
)
|
|||
|
Income tax expense
|
(65,822
|
)
|
(13,668
|
)
|
|||
|
Equity in net income of affiliates, net of tax
|
—
|
|
1
|
|
|||
|
Loss from continuing operations
|
(35,549
|
)
|
(150,792
|
)
|
|||
|
Income from discontinued operations, net of tax expense of $39,712 and $15,125, respectively
|
22,459
|
|
44,047
|
|
|||
|
Gain on sales of discontinued operations, net, including tax benefit of $18,097 and $0, respectively
|
311,904
|
|
—
|
|
|||
|
Net income (loss)
|
298,814
|
|
(106,745
|
)
|
|||
|
Net (income) loss attributable to noncontrolling interests
|
(315
|
)
|
2,365
|
|
|||
|
Net income (loss) attributable to Laureate Education, Inc.
|
$
|
298,499
|
|
$
|
(104,380
|
)
|
|
|
Accretion of Series A convertible redeemable preferred stock and other redeemable noncontrolling interests and equity
|
(61,403
|
)
|
(192,141
|
)
|
|||
|
Gain upon conversion of Series A convertible redeemable preferred stock
|
74,110
|
|
—
|
|
|||
|
Net income (loss) available to common stockholders
|
$
|
311,206
|
|
$
|
(296,521
|
)
|
|
|
Basic earnings (loss) per share:
|
|||||||
|
Income (loss) from continuing operations
|
$
|
(0.10
|
)
|
$
|
(2.03
|
)
|
|
|
Income from discontinued operations
|
1.59
|
|
0.26
|
|
|||
|
Basic earnings (loss) per share
|
$
|
1.49
|
|
$
|
(1.77
|
)
|
|
|
Diluted earnings (loss) per share:
|
|||||||
|
Loss from continuing operations
|
$
|
(0.16
|
)
|
$
|
(2.03
|
)
|
|
|
Income from discontinued operations
|
1.59
|
|
0.26
|
|
|||
|
Diluted earnings (loss) per share
|
$
|
1.43
|
|
$
|
(1.77
|
)
|
|
The accompanying notes are an integral part of these consolidated financial statements.
3
LAUREATE EDUCATION, INC. AND SUBSIDIARIES
Consolidated Statements of Comprehensive Income
IN THOUSANDS
|
For the three months ended September 30,
|
2018
|
2017
|
|||||
|
(Unaudited)
|
(Unaudited)
|
||||||
|
Net loss
|
$
|
(96,684
|
)
|
$
|
(103,490
|
)
|
|
|
Other comprehensive (loss) income:
|
|||||||
|
Foreign currency translation adjustment, net of tax of $0 for both periods
|
(52,750
|
)
|
64,742
|
|
|||
|
Unrealized (loss) gain on derivative instruments, net of tax of $0 for both periods
|
(560
|
)
|
525
|
|
|||
|
Total other comprehensive (loss) income
|
(53,310
|
)
|
65,267
|
|
|||
|
Comprehensive loss
|
(149,994
|
)
|
(38,223
|
)
|
|||
|
Net comprehensive loss attributable to noncontrolling interests
|
1,683
|
|
4,065
|
|
|||
|
Comprehensive loss attributable to Laureate Education, Inc.
|
$
|
(148,311
|
)
|
$
|
(34,158
|
)
|
|
The accompanying notes are an integral part of these consolidated financial statements.
4
LAUREATE EDUCATION, INC. AND SUBSIDIARIES
Consolidated Statements of Comprehensive Income
IN THOUSANDS
|
For the nine months ended September 30,
|
2018
|
2017
|
|||||
|
(Unaudited)
|
(Unaudited)
|
||||||
|
Net income (loss)
|
$
|
298,814
|
|
$
|
(106,745
|
)
|
|
|
Other comprehensive (loss) income:
|
|||||||
|
Foreign currency translation adjustment, net of tax of $0 for both periods
|
(166,052
|
)
|
196,593
|
|
|||
|
Unrealized gain on derivative instruments, net of tax of $0 for both periods
|
11,776
|
|
6,625
|
|
|||
|
Minimum pension liability adjustment, net of tax of $0
|
376
|
|
—
|
|
|||
|
Total other comprehensive (loss) income
|
(153,900
|
)
|
203,218
|
|
|||
|
Comprehensive income
|
144,914
|
|
96,473
|
|
|||
|
Net comprehensive (income) loss attributable to noncontrolling interests
|
(719
|
)
|
10
|
|
|||
|
Comprehensive income attributable to Laureate Education, Inc.
|
$
|
144,195
|
|
$
|
96,483
|
|
|
The accompanying notes are an integral part of these consolidated financial statements.
5
LAUREATE EDUCATION, INC. AND SUBSIDIARIES
IN THOUSANDS, except per share amounts
|
September 30, 2018
|
December 31, 2017
|
||||||
|
Assets
|
(Unaudited)
|
(Unaudited)
|
|||||
|
Current assets:
|
|||||||
|
Cash and cash equivalents (includes VIE amounts of $146,927 and $100,971, see Note 2)
|
$
|
392,348
|
|
$
|
320,567
|
|
|
|
Restricted cash
|
196,790
|
|
212,215
|
|
|||
|
Receivables:
|
|||||||
|
Accounts and notes receivable
|
571,240
|
|
474,456
|
|
|||
|
Other receivables
|
17,500
|
|
15,175
|
|
|||
|
Allowance for doubtful accounts
|
(164,101
|
)
|
(178,566
|
)
|
|||
|
Receivables, net
|
424,639
|
|
311,065
|
|
|||
|
Income tax receivable
|
16,454
|
|
38,231
|
|
|||
|
Prepaid expenses and other current assets
|
77,554
|
|
81,948
|
|
|||
|
Current assets held for sale
|
346,702
|
|
324,668
|
|
|||
|
Total current assets (includes VIE amounts of $642,133 and $407,315, see Note 2)
|
1,454,487
|
|
1,288,694
|
|
|||
|
Notes receivable, net
|
12,171
|
|
3,528
|
|
|||
|
Property and equipment:
|
|||||||
|
Land
|
229,455
|
|
243,179
|
|
|||
|
Buildings
|
642,040
|
|
669,973
|
|
|||
|
Furniture, equipment and software
|
961,712
|
|
977,382
|
|
|||
|
Leasehold improvements
|
359,466
|
|
366,735
|
|
|||
|
Construction in-progress
|
45,792
|
|
62,474
|
|
|||
|
Accumulated depreciation and amortization
|
(980,778
|
)
|
(939,326
|
)
|
|||
|
Property and equipment, net
|
1,257,687
|
|
1,380,417
|
|
|||
|
Land use rights, net
|
1,631
|
|
1,572
|
|
|||
|
Goodwill
|
1,709,586
|
|
1,828,365
|
|
|||
|
Other intangible assets:
|
|||||||
|
Tradenames
|
1,130,186
|
|
1,167,302
|
|
|||
|
Other intangible assets, net
|
25,455
|
|
35,779
|
|
|||
|
Deferred costs, net
|
65,896
|
|
60,931
|
|
|||
|
Deferred income taxes
|
150,530
|
|
152,398
|
|
|||
|
Derivative instruments
|
682
|
|
48,186
|
|
|||
|
Other assets
|
174,881
|
|
199,441
|
|
|||
|
Long-term assets held for sale
|
1,007,344
|
|
1,224,672
|
|
|||
|
Total assets (includes VIE amounts of $1,334,870 and $1,419,579, see Note 2)
|
$
|
6,990,536
|
|
$
|
7,391,285
|
|
|
The accompanying notes are an integral part of these consolidated financial statements.
6
LAUREATE EDUCATION, INC. AND SUBSIDIARIES
Consolidated Balance Sheets (continued)
IN THOUSANDS, except per share amounts
|
September 30, 2018
|
December 31, 2017
|
||||||
|
Liabilities and stockholders' equity
|
(Unaudited)
|
(Unaudited)
|
|||||
|
Current liabilities:
|
|||||||
|
Accounts payable
|
$
|
51,395
|
|
$
|
70,137
|
|
|
|
Accrued expenses
|
269,255
|
|
239,620
|
|
|||
|
Accrued compensation and benefits
|
173,718
|
|
215,760
|
|
|||
|
Deferred revenue and student deposits
|
465,290
|
|
184,116
|
|
|||
|
Current portion of long-term debt
|
104,502
|
|
121,870
|
|
|||
|
Current portion of due to shareholders of acquired companies
|
23,065
|
|
34,745
|
|
|||
|
Income taxes payable
|
13,713
|
|
20,553
|
|
|||
|
Derivative instruments
|
35
|
|
4,458
|
|
|||
|
Other current liabilities
|
42,063
|
|
31,761
|
|
|||
|
Current liabilities held for sale
|
394,229
|
|
451,569
|
|
|||
|
Total current liabilities (includes VIE amounts of $314,860 and $341,147, see Note 2)
|
1,537,265
|
|
1,374,589
|
|
|||
|
Long-term debt, less current portion
|
2,505,498
|
|
2,973,396
|
|
|||
|
Due to shareholders of acquired companies, less current portion
|
20,045
|
|
37,040
|
|
|||
|
Deferred compensation
|
13,383
|
|
14,470
|
|
|||
|
Income taxes payable
|
73,275
|
|
106,062
|
|
|||
|
Deferred income taxes
|
257,083
|
|
247,371
|
|
|||
|
Derivative instruments
|
7,258
|
|
9,390
|
|
|||
|
Other long-term liabilities
|
239,053
|
|
221,941
|
|
|||
|
Long-term liabilities held for sale
|
353,338
|
|
405,747
|
|
|||
|
Total liabilities (includes VIE amounts of $382,380 and $449,561, see Note 2)
|
5,006,198
|
|
5,390,006
|
|
|||
|
Series A convertible redeemable preferred stock, par value $0.001 per share – 111 shares authorized, no shares issued and outstanding as of September 30, 2018 and 512 shares authorized, 401 shares issued and outstanding as of December 31, 2017
|
—
|
|
|
400,276
|
|
||
|
Redeemable noncontrolling interests and equity
|
12,671
|
|
13,721
|
|
|||
|
Stockholders' equity:
|
|||||||
|
Preferred stock, par value $0.001 per share – 49,889 and 49,488 shares authorized as of September 30, 2018 and December 31, 2017, respectively, no shares issued and outstanding as of September 30, 2018 and December 31, 2017
|
—
|
|
—
|
|
|||
|
Class A common stock, par value $0.004 per share – 700,000 shares authorized, 91,654 shares issued and outstanding as of September 30, 2018 and 55,052 shares issued and outstanding as of December 31, 2017
|
366
|
|
220
|
|
|||
|
Class B common stock, par value $0.004 per share – 175,000 shares authorized, 132,387 shares issued and outstanding as of September 30, 2018 and 132,443 shares issued and outstanding as of December 31, 2017
|
530
|
|
530
|
|
|||
|
Additional paid-in capital
|
3,705,707
|
|
3,446,206
|
|
|||
|
Accumulated deficit
|
(643,407
|
)
|
(946,236
|
)
|
|||
|
Accumulated other comprehensive loss
|
(1,079,860
|
)
|
(925,556
|
)
|
|||
|
Total Laureate Education, Inc. stockholders' equity
|
1,983,336
|
|
1,575,164
|
|
|||
|
Noncontrolling interests
|
(11,669
|
)
|
12,118
|
|
|||
|
Total stockholders' equity
|
1,971,667
|
|
1,587,282
|
|
|||
|
Total liabilities and stockholders' equity
|
$
|
6,990,536
|
|
$
|
7,391,285
|
|
|
The accompanying notes are an integral part of these consolidated financial statements.
7
LAUREATE EDUCATION, INC. AND SUBSIDIARIES
IN THOUSANDS
|
For the nine months ended September 30,
|
2018
|
2017
|
|||||
|
Cash flows from operating activities
|
(Unaudited)
|
(Unaudited)
|
|||||
|
Net income (loss)
|
$
|
298,814
|
|
$
|
(106,745
|
)
|
|
|
Adjustments to reconcile net income (loss) to net cash provided by operating activities:
|
|||||||
|
Depreciation and amortization
|
189,961
|
|
199,394
|
|
|||
|
Loss on impairment of assets
|
10,030
|
|
—
|
|
|||
|
(Gain) loss on sales of subsidiaries and disposal of property and equipment, net
|
(292,999
|
)
|
3,050
|
|
|||
|
Gain on derivative instruments
|
(92,749
|
)
|
(19,621
|
)
|
|||
|
Proceeds from settlement of derivative contracts
|
14,117
|
|
—
|
|
|||
|
Loss on debt extinguishment
|
7,481
|
|
8,425
|
|
|||
|
Non-cash interest expense
|
14,651
|
|
29,809
|
|
|||
|
Interest paid on deferred purchase price for acquisitions
|
—
|
|
(39,419
|
)
|
|||
|
Non-cash share-based compensation expense
|
10,492
|
|
43,969
|
|
|||
|
Bad debt expense
|
83,029
|
|
88,677
|
|
|||
|
Deferred income taxes
|
(389
|
)
|
(21,787
|
)
|
|||
|
Unrealized foreign currency exchange loss
|
53,731
|
|
4,852
|
|
|||
|
Non-cash (gain) loss from non-income tax contingencies
|
(843
|
)
|
4,032
|
|
|||
|
Other, net
|
(11,607
|
)
|
1,637
|
|
|||
|
Changes in operating assets and liabilities:
|
|||||||
|
Receivables
|
(288,747
|
)
|
(344,661
|
)
|
|||
|
Prepaid expenses and other assets
|
(50,919
|
)
|
(69,843
|
)
|
|||
|
Accounts payable and accrued expenses
|
(6,263
|
)
|
14,624
|
|
|||
|
Income tax receivable/payable, net
|
(10,084
|
)
|
(19,815
|
)
|
|||
|
Deferred revenue and other liabilities
|
428,664
|
|
435,173
|
|
|||
|
Net cash provided by operating activities
|
356,370
|
|
211,751
|
|
|||
|
Cash flows from investing activities
|
|||||||
|
Purchase of property and equipment
|
(150,458
|
)
|
(134,629
|
)
|
|||
|
Expenditures for deferred costs
|
(13,182
|
)
|
(12,712
|
)
|
|||
|
Receipts from sales of discontinued operations and property and equipment, net of cash sold
|
375,792
|
|
1,180
|
|
|||
|
Settlement of derivatives related to sale of discontinued operations
|
(9,960
|
)
|
—
|
|
|||
|
Proceeds from corporate-owned life insurance and property insurance recoveries
|
24,641
|
|
370
|
|
|||
|
Business acquisitions, net of cash acquired
|
—
|
|
(835
|
)
|
|||
|
Payments (to) from related parties and investments in affiliates
|
(8
|
)
|
349
|
|
|||
|
Net cash provided by (used in) investing activities
|
226,825
|
|
(146,277
|
)
|
|||
|
Cash flows from financing activities
|
|||||||
|
Proceeds from issuance of long-term debt, net of original issue discount
|
383,594
|
|
2,349,673
|
|
|||
|
Payments on long-term debt
|
(838,542
|
)
|
(2,695,511
|
)
|
|||
|
Payments of deferred purchase price for acquisitions
|
(17,588
|
)
|
(93,813
|
)
|
|||
|
Payments to purchase noncontrolling interests
|
(127
|
)
|
—
|
|
|||
|
Proceeds from issuance of convertible redeemable preferred stock, net of issuance costs
|
—
|
|
55,290
|
|
|||
|
Payment of dividends on Series A Preferred Stock
|
(11,103
|
)
|
(5,252
|
)
|
|||
|
Proceeds from initial public offering, net of issuance costs
|
—
|
|
456,359
|
|
|||
|
Withholding of shares to satisfy tax withholding for vested stock awards
|
(1,744
|
)
|
(1,725
|
)
|
|||
|
Payments of debt issuance costs and redemption and call premiums for debt modification
|
(490
|
)
|
(76,523
|
)
|
|||
|
Noncontrolling interest holder's loan to subsidiaries
|
—
|
|
943
|
|
|||
|
Distributions to noncontrolling interest holders
|
(912
|
)
|
(847
|
)
|
|||
|
Net cash used in financing activities
|
(486,912
|
)
|
(11,406
|
)
|
|||
|
Effects of exchange rate changes on Cash and cash equivalents and Restricted cash
|
(4,535
|
)
|
25,965
|
|
|||
|
Change in cash included in current assets held for sale
|
(35,392
|
)
|
(68,100
|
)
|
|||
|
Net change in Cash and cash equivalents and Restricted cash
|
56,356
|
|
11,933
|
|
|||
|
Cash and cash equivalents and Restricted cash at beginning of period
|
532,782
|
|
474,337
|
|
|||
|
Cash and cash equivalents and Restricted cash at end of period
|
$
|
589,138
|
|
$
|
486,270
|
|
|
The accompanying notes are an integral part of these consolidated financial statements.
8
Laureate Education, Inc. and Subsidiaries
Notes to Consolidated Financial Statements
(Dollars and shares in thousands)
Note
1
.
Description of Business
Laureate Education, Inc. and subsidiaries (hereinafter Laureate, we, us, our, or the Company) provide higher education programs and services to students through an international network of licensed universities and higher education institutions (institutions). Laureate's programs are provided through institutions that are campus-based and internet-based, or through electronically distributed educational programs (online). On October 1, 2015, we redomiciled in Delaware as a public benefit corporation as a demonstration of our long-term commitment to our mission to benefit our students and society.
The Company's shares are listed on the Nasdaq Global Select Market under the symbol ‘‘LAUR’’. In its initial public offering (IPO) on
February 6, 2017
, the Company sold
35,000
shares of its Class A common stock in the IPO at a price of
$14.00
per share, resulting in net proceeds to the Company during the first quarter of 2017, after deducting underwriting discounts and commissions and offering expenses payable by us, of
$456,359
.
On
August 9, 2018
, the Company announced that it plans to divest additional subsidiaries located in Europe, Asia and Central America, which are included in the Rest of World (formerly called EMEAA), Andean (formerly called Andean & Iberian), and Central America & U.S. Campuses segments. Previously, the Company had announced the divestiture of certain subsidiaries in the Rest of World and Central America & U.S. Campuses segments.
After completing all of these announced divestitures, the Company’s remaining principal markets will be Brazil, Chile, Mexico and Peru, along with the Online & Partnerships segment and the institutions in Australia and New Zealand. This represents a strategic shift that will have a major effect on the Company's operations and financial results. Accordingly, all of the divestitures that are part of this strategic shift, including the divestitures announced on
August 9, 2018
and those announced previously, are now
accounted for as discontinued operations for all periods presented in accordance with Accounting Standards Codification (ASC) 205-20, ‘‘Discontinued Operations’’ (ASC 205). See Note
4
,
Discontinued Operations and Assets Held for Sale
, for more information. Unless indicated otherwise, the information in the footnotes to the Consolidated Financial Statements relates to continuing operations.
The accompanying unaudited Consolidated Financial Statements have been prepared in accordance with accounting principles generally accepted in the United States (GAAP) for interim financial information and with the instructions to Form 10-Q. Accordingly, they do not include all of the information and footnotes required by GAAP for complete financial statements. In our opinion, these financial statements include all adjustments considered necessary to present a fair statement of our consolidated results of operations, financial position and cash flows. Operating results for any interim period are not necessarily indicative of the results that may be expected for the full year. These unaudited Consolidated Financial Statements should be read in conjunction with Laureate's audited Consolidated Financial Statements included in our
Annual Report on Form 10-K for the fiscal year ended December 31, 2017 (the 2017 Form 10-K)
.
9
Note
2
.
Significant Accounting Policies
The Variable Interest Entity (VIE) Arrangements
Laureate consolidates in its financial statements certain internationally based educational organizations that do not have shares or other equity ownership interests. Although these educational organizations may be considered not-for-profit entities in their home countries and they are operated in compliance with their respective not-for-profit legal regimes, we believe they do not meet the definition of a not-for-profit entity under GAAP, and therefore we treat them as "for-profit" entities for accounting purposes. These entities generally cannot declare dividends or distribute their net assets to the entities that control them.
Under ASC 810-10, ‘‘Consolidation,’’ we have determined that these institutions are VIEs and that Laureate is the primary beneficiary of these VIEs because we have, as further described herein: (1) the power to direct the activities of the VIEs that most significantly affect their educational and economic performance and (2) the right to receive economic benefits from contractual and other arrangements with the VIEs that could potentially be significant to the VIEs. We account for the acquisition of the right to control a VIE in accordance with ASC 805, "Business Combinations."
The VIEs in Brazil and Mexico comprise several not-for-profit foundations that have insignificant revenues and operating expenses. Selected Consolidated Statements of Operations information for VIEs that are included in continuing operations was as follows, net of the charges related to the above-described contractual arrangements:
|
For the three months ended September 30,
|
For the nine months ended September 30,
|
||||||||||||||
|
2018
|
2017
|
2018
|
2017
|
||||||||||||
|
Selected Statements of Operations information:
|
|||||||||||||||
|
Revenues, by segment:
|
|||||||||||||||
|
Brazil
|
$
|
—
|
|
$
|
11
|
|
$
|
—
|
|
$
|
57
|
|
|||
|
Mexico
|
4
|
|
—
|
|
89
|
|
—
|
|
|||||||
|
Andean
|
119,884
|
|
114,494
|
|
325,423
|
|
300,385
|
|
|||||||
|
Revenues
|
119,888
|
|
114,505
|
|
325,512
|
|
300,442
|
|
|||||||
|
Depreciation and amortization
|
6,163
|
|
6,626
|
|
19,398
|
|
20,397
|
|
|||||||
|
Operating income (loss), by segment:
|
|||||||||||||||
|
Brazil
|
(16
|
)
|
(23
|
)
|
(56
|
)
|
(30
|
)
|
|||||||
|
Mexico
|
(121
|
)
|
(163
|
)
|
(349
|
)
|
(516
|
)
|
|||||||
|
Andean
|
12,954
|
|
6,613
|
|
7,714
|
|
(3,545
|
)
|
|||||||
|
Operating income (loss)
|
12,817
|
|
6,427
|
|
7,309
|
|
(4,091
|
)
|
|||||||
|
Net income
|
18,812
|
|
10,928
|
|
22,860
|
|
8,308
|
|
|||||||
|
Net income attributable to Laureate Education, Inc.
|
18,812
|
|
10,928
|
|
22,860
|
|
8,308
|
|
|||||||
10
The following table reconciles the Net income (loss) attributable to Laureate Education, Inc. as presented in the table above, to the amounts in our Consolidated Statements of Operations:
|
For the three months ended September 30,
|
For the nine months ended September 30,
|
||||||||||||||
|
2018
|
2017
|
2018
|
2017
|
||||||||||||
|
Net (loss) income attributable to Laureate Education, Inc.:
|
|||||||||||||||
|
Variable interest entities
|
$
|
18,812
|
|
$
|
10,928
|
|
$
|
22,860
|
|
$
|
8,308
|
|
|||
|
Other operations
|
21,564
|
|
40,366
|
|
241,920
|
|
278,804
|
|
|||||||
|
Corporate and eliminations
|
(135,165
|
)
|
(149,253
|
)
|
33,719
|
|
(391,492
|
)
|
|||||||
|
Net (loss) income attributable to Laureate Education, Inc.
|
$
|
(94,789
|
)
|
$
|
(97,959
|
)
|
$
|
298,499
|
|
$
|
(104,380
|
)
|
|||
The following table presents selected assets and liabilities of the consolidated VIEs. Except for Goodwill, the assets in the table below include the assets that can be used only to settle the obligations for the VIEs. The liabilities in the table are liabilities for which the creditors of the VIEs do not have recourse to the general credit of Laureate.
Selected Consolidated Balance Sheet amounts for these VIEs were as follows:
|
September 30, 2018
|
December 31, 2017
|
||||||||||||||
|
VIE
|
Consolidated
|
VIE
|
Consolidated
|
||||||||||||
|
Balance Sheets data:
|
|||||||||||||||
|
Cash and cash equivalents
|
$
|
146,927
|
|
$
|
392,348
|
|
$
|
100,971
|
|
$
|
320,567
|
|
|||
|
Current assets held for sale
|
170,886
|
|
346,702
|
|
170,229
|
|
324,668
|
|
|||||||
|
Other current assets
|
324,320
|
|
715,437
|
|
136,115
|
|
643,459
|
|
|||||||
|
Total current assets
|
642,133
|
|
1,454,487
|
|
407,315
|
|
1,288,694
|
|
|||||||
|
Goodwill
|
174,600
|
|
1,709,586
|
|
183,812
|
|
1,828,365
|
|
|||||||
|
Tradenames
|
69,107
|
|
1,130,186
|
|
74,484
|
|
1,167,302
|
|
|||||||
|
Other intangible assets, net
|
—
|
|
25,455
|
|
—
|
|
35,779
|
|
|||||||
|
Long-term assets held for sale
|
151,310
|
|
1,007,344
|
|
369,375
|
|
1,224,672
|
|
|||||||
|
Other long-term assets
|
297,720
|
|
1,663,478
|
|
384,593
|
|
1,846,473
|
|
|||||||
|
Total assets
|
1,334,870
|
|
6,990,536
|
|
1,419,579
|
|
7,391,285
|
|
|||||||
|
Current liabilities held for sale
|
114,569
|
|
394,229
|
|
183,166
|
|
451,569
|
|
|||||||
|
Other current liabilities
|
200,291
|
|
1,143,036
|
|
157,981
|
|
923,020
|
|
|||||||
|
Long-term liabilities held for sale
|
38,696
|
|
353,338
|
|
84,760
|
|
405,747
|
|
|||||||
|
Long-term debt and other long-term liabilities
|
28,824
|
|
3,115,595
|
|
23,654
|
|
3,609,670
|
|
|||||||
|
Total liabilities
|
382,380
|
|
5,006,198
|
|
449,561
|
|
5,390,006
|
|
|||||||
|
Total stockholders' equity
|
952,490
|
|
1,971,667
|
|
970,018
|
|
1,587,282
|
|
|||||||
|
Total stockholders' equity attributable to Laureate Education, Inc.
|
952,317
|
|
1,983,336
|
|
948,966
|
|
1,575,164
|
|
|||||||
On January 24, 2018, a new Higher Education Law (the New Law) was passed by the Chilean Congress. On March 27, 2018, the Constitutional Court declared unconstitutional Article 63 of the New Law, which would have prohibited for-profit organizations such as Laureate from controlling the boards of universities in Chile. The Constitutional Court released its opinion on April 26, 2018, and signature and enactment of the New Law occurred in May 2018. Among other things left intact by the Constitutional Court, the New Law prohibits conflicts of interests and related party transactions with certain exceptions, including the provision of services that are educational in nature or essential for the university's purposes. The New Law provides for a transition period. The incoming Chilean presidential administration, which took office on March 11, 2018, has the responsibility to implement the new legislative mandates and compliance processes.
The Company is reviewing the impact the New Law will have on its Chilean operations, including the extent to which it will affect existing contractual relationships that the Company maintains with the Chilean non-profit universities. As the New Law no longer
11
contains provisions that prohibit Laureate from controlling the boards of the Chilean non-profit universities, but still requires the promulgation of new regulations and procedures that will be applicable to any commercial relationship that the Company has with the Chilean non-profit universities, the Company has determined that it will continue to consolidate the three Chilean non-profit universities, which are accounted for as variable interest entities, and its Chilean real estate subsidiary.
While we believe that all of our institutions in Chile are operating in full compliance with Chilean law, we cannot predict the extent or outcome of any educational reforms that may be implemented in Chile. The Company does not believe the New Law will change its relationship with its two tech/voc institutions in Chile that are for-profit entities. However, it is possible that the Chilean government will adopt additional laws that affect for-profit tech/voc institutions and their relationships with their owners. Depending upon how these reforms are defined and implemented, there could be a material adverse effect on our financial condition and results of operations.
Allowance for Doubtful Accounts
Receivables are deemed to be uncollectible when they have been outstanding for
two years
, or earlier when collection efforts have ceased, at which time they are written off. Prior to that, Laureate records an allowance for doubtful accounts to reduce our receivables to their net realizable value. Our allowance estimation methodology is based on the age of the receivables, the status of past-due amounts, historical collection trends, current economic conditions and student enrollment status. In the event that current collection trends differ from historical trends, an adjustment is made to the allowance account and bad debt expense.
The reconciliations of the beginning and ending balances of the
Allowance for doubtful accounts
were as follows:
|
For the nine months ended September 30,
|
2018
|
2017
|
|||||
|
Balance at beginning of period
|
$
|
182,965
|
|
$
|
169,014
|
|
|
|
Additions: charges to bad debt expense
|
74,969
|
|
79,408
|
|
|||
|
Deductions
(a)
|
(90,494
|
)
|
(68,155
|
)
|
|||
|
Balance at end of period
|
$
|
167,440
|
|
$
|
180,267
|
|
|
(a)
Deductions includes accounts receivable written off against the allowance (net of recoveries), reclassifications, and foreign
currency translation. The beginning and ending balances of the
Allowance for doubtful accounts
include the current
portion, as shown on the face of Consolidated Balance Sheets, in addition to the noncurrent portion that is included in
Notes receivable, net
on the Consolidated Balance Sheets.
Impairment of Long-lived Assets
Effective September 30, 2018, the University of Liverpool (Liverpool), an institution in our Online & Partnerships segment, elected not to renew its institutional partnership agreement and therefore the existing agreement will terminate in April 2021. Accordingly, Liverpool will stop enrolling new students and will begin a teach-out process that is expected to be completed in April 2021. As a result, during the third quarter of 2018, we recorded an impairment charge of
$10,030
related to fixed assets of this entity that are no longer recoverable based on expected future cash flows. Because Liverpool does not meet the criteria to be classified as held-for-sale or a discontinued operation, its results are reported within continuing operations for all periods presented.
12
Recently Adopted Accounting Standards
Accounting Standards Update (ASU) No. 2014-09, (ASU 2014-09), Revenue from Contracts with Customers (Topic 606)
On May 28, 2014, the Financial Accounting Standards Board (FASB) issued ASU 2014-09, which, along with amendments issued in 2015 and 2016, supersedes the revenue recognition requirements in ASC 605,
‘‘Revenue Recognition’’
and most industry-specific guidance. The core principle of ASU 2014-09 is that a company will recognize revenue when it transfers promised goods or services to customers in an amount that reflects the consideration to which the company expects to be entitled in exchange for those goods or services. We adopted Topic 606 as of January 1, 2018 using the modified retrospective transition method and elected to apply the standard only to contracts that were not completed as of that date. We recorded a net increase to opening retained earnings of approximately
$1,400
as of January 1, 2018 due to the cumulative impact of adopting Topic 606, with the impact primarily related to the deferral of costs to obtain a contract which were previously expensed as incurred. The impact to revenues as a result of applying Topic 606 was an increase of
$2,577
for the
nine months ended September 30, 2018
.
In accordance with the requirements under Topic 606, the impact of adoption on our Consolidated Statement of Operations and Consolidated Balance Sheet was as follows:
|
|
For the nine months ended September 30, 2018
|
||||||||
|
|
As Reported
|
Balances Without Adoption of ASC 606
|
Effect of Change Higher/(Lower)
|
||||||
|
Statement of Operations data:
|
|
|
|
||||||
|
Revenues
|
$
|
2,436,514
|
|
$
|
2,433,937
|
|
$
|
2,577
|
|
|
Costs and Expenses:
|
|
|
|
||||||
|
Direct costs
|
2,081,125
|
|
2,084,654
|
|
(3,529
|
)
|
|||
|
Income tax expense
|
(65,822
|
)
|
(65,786
|
)
|
(36
|
)
|
|||
|
Net income
|
298,814
|
|
292,743
|
|
6,071
|
|
|||
|
|
As of September 30, 2018
|
||||||||
|
|
As Reported
|
Balances Without Adoption of ASC 606
|
Effect of Change Higher/(Lower)
|
||||||
|
Balance Sheet data:
|
|||||||||
|
Assets:
|
|||||||||
|
Deferred costs, net
|
$
|
65,896
|
|
$
|
60,949
|
|
$
|
4,947
|
|
|
Liabilities:
|
|||||||||
|
Deferred revenue and student deposits
|
465,290
|
|
467,867
|
|
(2,577
|
)
|
|||
|
Deferred income taxes
|
257,083
|
|
257,047
|
|
36
|
|
|||
|
Equity:
|
|||||||||
|
Accumulated deficit
|
(643,407
|
)
|
(650,895
|
)
|
7,488
|
|
|||
13
ASU No. 2016-15 (ASU 2016-15), Statement of Cash Flows (Topic 230): Classification of Certain Cash Receipts and Cash Payments
In August 2016, the FASB issued ASU 2016-15 in order to address the
diversity in practice in how certain cash receipts and cash payments are presented and classified in the statement of cash flows under Topic 230, Statement of Cash Flows, and other Topics. This standard addresses the following eight specific cash flow issues: debt prepayment or debt extinguishment costs; settlement of zero-coupon debt instruments or other debt instruments with coupon interest rates that are insignificant in relation to the effective interest rate of the borrowing; contingent consideration payments made after a business combination; proceeds from the settlement of insurance claims; proceeds from the settlement of corporate-owned life insurance policies (COLIs) (including bank-owned life insurance policies (BOLIs)); distributions received from equity method investees; beneficial interests in securitization transactions; and separately identifiable cash flows and application of the predominance principle. The amendments in this update apply to all entities, including both business entities and not-for-profit entities that are required to present a statement of cash flows under Topic 230. The Company adopted this standard beginning January 1, 2018. Because this standard requires retrospective application, for the
nine months ended September 30, 2017
we have reclassified from operating activities to financing activities approximately
$65,000
of redemption and call premiums that were paid in connection with a debt modification that was completed during the second quarter of 2017.
ASU No. 2016-16 (ASU 2016-16), Income Taxes (Topic 740): Intra-Entity Transfers of Assets Other Than Inventory
In October 2016, the FASB issued ASU 2016-16 in order to improve the accounting for income tax consequences for intra-entity transfers of assets other than inventory. Prior to adopting this ASU, the recognition of current and deferred income taxes for an intra-entity transfer was prohibited until the asset was sold to a third party. The amendments in this ASU state that an entity should recognize income tax consequences of an intra-entity transfer when the transfer occurs. This aligns the recognition of income tax consequences for intra-entity transfers of assets with International Financing Reporting Standards (IFRS). Laureate adopted ASU 2016-16 effective January 1, 2018 and recorded a cumulative-effect adjustment to retained earnings of approximately
$2,900
.
ASU No. 2016-18 (ASU 2016-18), Statement of Cash Flows (Topic 230): Restricted Cash
In November 2016, the FASB issued ASU 2016-18 in order to address the diversity that exists in the classification and presentation of changes in restricted cash on the statement of cash flows under Topic 230, Statement of Cash Flows. The amendments in this ASU require that a statement of cash flows explain the change during the period in the total of cash, cash equivalents, and amounts generally described as restricted cash or restricted cash equivalents. Therefore, amounts generally described as restricted cash and restricted cash equivalents should be included with cash and cash equivalents when reconciling the beginning-of-period and end-of-period total amounts shown on the statement of cash flows. The amendments in this ASU apply to all entities that have restricted cash or restricted cash equivalents and are required to present a statement of cash flows under Topic 230. This ASU was adopted by Laureate beginning January 1, 2018 and resulted in a change in presentation within the Consolidated Statements of Cash Flows. As required, Laureate retrospectively applied the guidance to the prior period presented, which resulted in an increase of
$1,743
in operating cash flows and an increase of
$3,921
in investing cash flows on the Consolidated Statement of Cash Flows for the
nine months ended September 30, 2017
. As required by the ASU, we have provided a reconciliation from cash and cash equivalents as presented on our Consolidated Balance Sheets to cash, cash equivalents, and restricted cash as reported on our Consolidated Statements of Cash Flows. See Note
20
,
Supplemental Cash Flow Information
, for this reconciliation, as well as a discussion of the nature of our restricted cash balances.
ASU No. 2017-07 (ASU 2017-07), Compensation - Retirement Benefits (Topic 715)
In March 2017, the FASB issued ASU 2017-07 in order to improve the presentation of net periodic pension cost and net periodic post retirement benefit cost. Prior to adoption of this ASU, these costs comprised several components that reflected different aspects of an employer's financial arrangements as well as the cost of benefits provided to employees, and were aggregated for reporting purposes. Under the amendments in this ASU, the service cost component of net periodic benefit cost is disaggregated and reported in the same line item(s) as other compensation costs arising from services rendered during the period, and the remaining components are presented on the income statement separately from the service cost component and outside a subtotal of income from operations, if presented. Laureate adopted ASU 2017-07 on January 1, 2018. Because the effect of ASU 2017-07 on prior periods presented was insignificant, we did not revise the Consolidated Statement of Operations for the
nine months ended September 30, 2017
. For the
nine months ended September 30, 2018
, the impact on our Consolidated Statement of Operations was immaterial to the Company.
14
Recently Issued Accounting Standards Not Yet Adopted
ASU No. 2016-02 (ASU 2016-02), Leases (Topic 842)
On February 25, 2016, the FASB issued ASU 2016-02. Lessees will need to recognize on their balance sheet a right-of-use asset and a lease liability for virtually all of their leases (other than leases that meet the definition of a short-term lease). The liability will be equal to the present value of the lease payments. The asset will be based on the liability, subject to adjustment, such as for initial direct costs and uneven rent payments. For income statement purposes, the FASB retained a dual model, requiring leases to be classified as either operating or finance. Operating leases will result in straight-line expense (similar to current operating leases) while finance leases will result in a front-loaded expense pattern (similar to current capital leases). Classification will be based on criteria that are largely similar to those applied in current lease accounting, but without explicit bright lines. The standard is effective for Laureate beginning January 1, 2019. During the third quarter of 2018, the FASB issued ASU 2018-11, ‘‘Leases (Topic 842): Targeted improvements,’’ which provides companies with an additional, optional transition method to adopt the new lease requirements by allowing entities to apply the requirements by recognizing a cumulative-effect adjustment to the opening balance of retained earnings in the period of adoption. As a result, a company's reporting for the comparative periods presented in the financial statements in which the company adopts the new lease requirements would continue to be in accordance with current GAAP (ASC Topic 840). A company electing this optional transition method must provide the required Topic 840 disclosures for all periods that continue to be in accordance with Topic 840. The amendments do not change the existing disclosure requirements in Topic 840 and do not create any interim disclosure requirements that companies previously were not required to provide. We plan to elect this optional transition method. We have completed our diagnostic assessment and have established a cross-functional implementation team which is in the process of identifying changes to our accounting policies, business processes, systems and internal controls in preparation for the implementation. We anticipate that ASU 2016-02 will have a material impact on our Consolidated Balance Sheets, as we will record significant asset and liability balances in connection with our leased properties. We are still evaluating the impact to our Consolidated Statements of Operations and Cash Flows.
Note
3
.
Revenue
Revenue Recognition
Laureate's revenues primarily consist of tuition and educational service revenues. We also generate other revenues from student fees, dormitory/residency fees and other education-related activities. These other revenues are less material to our overall financial results and have a tendency to trend with tuition revenues. Revenues are recognized when control of the promised goods or services is transferred to our customers, in an amount that reflects the consideration we expect to be entitled to in exchange for those goods or services. These revenues are recognized net of scholarships and other discounts, refunds, waivers and the fair value of any guarantees made by Laureate related to student financing programs. Laureate's institutions have various billing and academic cycles.
We determine revenue recognition through the five-step model prescribed by Topic 606 as follows:
•
Identification of the contract, or contracts, with a customer;
•
Identification of the performance obligations in the contract;
•
Determination of the transaction price;
•
Allocation of the transaction price to the performance obligations in the contract; and
•
Recognition of revenue when, or as, we satisfy a performance obligation.
We assess collectibility on a portfolio basis prior to recording revenue. Generally, students cannot re-enroll for the next academic session without satisfactory resolution of any past-due amounts. If a student withdraws from an institution, Laureate's obligation to issue a refund depends on the refund policy at that institution and the timing of the student's withdrawal. Generally, our refund obligations are reduced over the course of the academic term. We record refunds as a reduction of deferred revenue as applicable.
As discussed in Note
1
,
Description of Business
, during the quarter ended September 30, 2018,
a number of our subsidiaries met the requirements to be classified as discontinued operations, including the entire
Central America & U.S. Campuses segment
. As a result, the operations of the
Central America & U.S. Campuses segment
have been excluded from the segment information for all periods presented. In addition, the portions of the Andean and Rest of World reportable segments that are included in discontinued operations have also been excluded from the segment information for all periods presented.
15
The following table shows the components of Revenues by reportable segment and as a percentage of total net revenue for the three months ended
September 30, 2018
:
|
|
Brazil
|
Mexico
|
Andean
|
Rest of World
|
Online & Partnerships
|
Corporate
(1)
|
Total
|
||||||||||||||||
|
Tuition and educational services
|
$
|
196,670
|
|
$
|
158,602
|
|
$
|
312,274
|
|
$
|
57,768
|
|
$
|
180,063
|
|
$
|
—
|
|
$
|
905,377
|
|
115
|
%
|
|
Other
|
2,272
|
|
23,676
|
|
22,594
|
|
3,112
|
|
13,767
|
|
(3,694
|
)
|
61,727
|
|
8
|
%
|
|||||||
|
Gross revenue
|
198,942
|
|
182,278
|
|
334,868
|
|
60,880
|
|
193,830
|
|
(3,694
|
)
|
967,104
|
|
123
|
%
|
|||||||
|
Less: Discounts / waivers / scholarships
|
(77,853
|
)
|
(33,953
|
)
|
(35,255
|
)
|
(4,332
|
)
|
(28,609
|
)
|
—
|
|
(180,002
|
)
|
(23
|
)%
|
|||||||
|
Total
|
$
|
121,089
|
|
$
|
148,325
|
|
$
|
299,613
|
|
$
|
56,548
|
|
$
|
165,221
|
|
$
|
(3,694
|
)
|
$
|
787,102
|
|
100
|
%
|
(1)
Includes the elimination of intersegment revenues.
The following table shows the components of Revenues by reportable segment and as a percentage of total net revenue for the
nine months ended September 30, 2018
:
|
|
Brazil
|
Mexico
|
Andean
|
Rest of World
|
Online & Partnerships
|
Corporate
(1)
|
Total
|
||||||||||||||||
|
Tuition and educational services
|
$
|
741,945
|
|
$
|
499,876
|
|
$
|
889,290
|
|
$
|
174,192
|
|
$
|
541,681
|
|
$
|
—
|
|
$
|
2,846,984
|
|
117
|
%
|
|
Other
|
7,974
|
|
68,905
|
|
59,523
|
|
8,350
|
|
40,500
|
|
(9,418
|
)
|
175,834
|
|
7
|
%
|
|||||||
|
Gross revenue
|
749,919
|
|
568,781
|
|
948,813
|
|
182,542
|
|
582,181
|
|
(9,418
|
)
|
3,022,818
|
|
124
|
%
|
|||||||
|
Less: Discounts / waivers / scholarships
|
(280,439
|
)
|
(104,913
|
)
|
(104,600
|
)
|
(12,378
|
)
|
(83,974
|
)
|
—
|
|
(586,304
|
)
|
(24
|
)%
|
|||||||
|
Total
|
$
|
469,480
|
|
$
|
463,868
|
|
$
|
844,213
|
|
$
|
170,164
|
|
$
|
498,207
|
|
$
|
(9,418
|
)
|
$
|
2,436,514
|
|
100
|
%
|
(1)
Includes the elimination of intersegment revenues.
Performance Obligations
A performance obligation is a promise in a contract to transfer a distinct good or service to the customer and is the unit of accounting in ASC Topic 606. A contract’s transaction price is allocated to each performance obligation identified in the arrangement based on the relative standalone selling price of each distinct good or service in the contract and recognized as revenue when, or as, the performance obligation is satisfied. The primary method used to estimate standalone selling price is the adjusted market assessment approach, under which we evaluate the market and estimate the price that a customer would be willing to pay for the goods and services we provide.
Our performance obligations are primarily satisfied over time during the course of an academic semester or academic year. Laureate's transaction price is determined based on gross price, net of scholarships and other discounts, refunds, waivers and the fair value of any guarantees made by Laureate related to student financing programs.
The majority of our revenue is derived from tuition and educational services agreements with students, and thus, is recognized over time on a weekly straight-line basis over each academic session.
We view the knowledge gained by the student as the benefit which the student receives during the academic sessions. We use the output method to recognize tuition and educational services revenue as this method faithfully depicts our performance toward complete satisfaction of the performance obligation. Dormitory/residency revenues, which are included in the Other line item in the table above, are recognized over time throughout the occupancy period using the output method based on the proportional period of time elapsed which faithfully depicts our performance toward complete satisfaction of the performance obligation.
We have elected the optional exemption to not disclose amounts where the performance obligation is part of a contract that has an original expected duration of one year or less. We expect to recognize substantially all revenue on these remaining performance obligations over the next
12 months
.
16
Contract Balances
The timing of billings, cash collections and revenue recognition results in accounts receivable (contract assets) and deferred revenue and student deposits (contract liabilities) on the Consolidated Balance Sheets. We have various billing and academic cycles and recognize student receivables when an academic session begins, although students generally enroll in courses prior to the start of the academic session. Receivables are recognized only to the extent that it is probable that we will collect substantially all of the consideration to which we are entitled in exchange for the goods and services that will be transferred to the student. We receive advance payments or deposits from our students before revenue is recognized, which are recorded as contract liabilities in deferred revenue and student deposits. Payment terms vary by university with some universities requiring payment in advance of the academic session and other universities allowing students to pay in installments over the term of the academic session.
All of our contract assets are considered accounts receivable and are included within the
Accounts and notes receivable
balance in the accompanying Consolidated Balance Sheets. Total accounts receivable from our contracts with students were
$571,240
and
$474,456
as of
September 30, 2018
and December 31, 2017, respectively. The increase in the contract assets balance at
September 30, 2018
compared to December 31, 2017 is primarily driven by our enrollment cycles. The first and third calendar quarters generally coincide with the primary and secondary intakes for some of our larger institutions. All contract asset amounts are classified as current.
Contract liabilities in the amount of
$465,290
and
$184,116
were included within the
Deferred revenue and student deposits
balance in the current liabilities section of the accompanying Consolidated Balance Sheets as of
September 30, 2018
and December 31, 2017, respectively. The increase in the contract liability balance during the period ended
September 30, 2018
is the result of semester billings and cash payments received in advance of satisfying performance obligations, offset by revenue recognized during that period. Revenue recognized for the
nine months ended September 30, 2018
that was included in the contract liability balance at the beginning of the year was approximately
$166,000
.
Costs to Obtain a Contract
Certain commissions and bonuses earned by third party agents and our employees are considered incremental and recoverable costs of obtaining a contract with a customer. These costs are deferred and then amortized over the period of benefit which ranges from
two
to
four
years. We determined the expected period of benefit, by university, as the expected student enrollment period. As of
September 30, 2018
and December 31, 2017, the asset balances were approximately
$8,300
and
$0
, respectively, and the accumulated amortization balances were approximately
$3,400
and
$0
, respectively, both of which are included in
Deferred costs, net
, in the accompanying Consolidated Balance Sheets. The associated operating cost of approximately
$3,400
was recorded in
Direct costs
in the accompanying Consolidated Statement of Operations for the
nine months ended September 30, 2018
. We also pay certain commissions and bonuses where the period of benefit is
one year or less
. We have elected the practical expedient available in ASC 340-40 whereby any incremental costs of obtaining a contract are recognized as an expense when incurred if the amortization period of the asset that would have been recognized is
one year or less
.
Practical Expedients and Optional Exemptions
We elected to adopt this standard using the modified retrospective approach with the cumulative effect of adoption recognized at the initial date of application. We have elected to apply the standard only to contracts that are not completed at the initial date of application.
As noted above, we recognize the incremental costs of obtaining a contract with a student as an expense when incurred in instances where the amortization period of the asset that we would have recognized is
one year or less
.
We have made an accounting policy election to exclude from the measurement of the transaction price all taxes assessed by governmental authorities that are both imposed on and concurrent with specific revenue-producing transactions and collected by the entity from our customers (e.g., sales, use, value added and excise taxes).
17
Note
4
.
Discontinued Operations and Assets Held for Sale
As discussed in Note
1
,
Description of Business
, on August 9, 2018, the Company announced that it plans to focus on its principal
markets and will divest of its other markets
. The principal markets that will remain
(the Continuing Operations)
include
Brazil, Chile, Mexico, and Peru, along with the Online & Partnerships segment and the institutions in Australia and New Zealand. The markets to be divested (
the Discontinued Operations)
include the institutions in Portugal and Spain, which are part of the Andean segment, all remaining institutions in the Central America & U.S. Campuses segment, and all remaining institutions in the Rest of World segment, except for Australia, New Zealand and the managed institutions in the Kingdom of Saudi Arabia and China. Included in the Discontinued Operations are
seven
VIE institutions.
The divestitures are expected to create a more focused and simplified business model and generate proceeds that will be used for further repayment of long-term debt.
The timing and ability to complete any of these transactions is uncertain and will be subject to market and other conditions, which may include regulatory approvals and consents of third parties.
As described in Note
5
,
Dispositions
, several sale transactions have already closed during 2018.
Summarized operating results and cash flows of the Discontinued Operations are presented in the following tables:
|
For the nine months ended September 30,
|
2018
|
2017
|
|||||
|
Revenues
|
$
|
635,223
|
|
$
|
682,079
|
|
|
|
Depreciation and amortization
|
26,632
|
|
46,885
|
|
|||
|
Share-based compensation expense
|
920
|
|
1,755
|
|
|||
|
Other direct costs
|
526,706
|
|
560,028
|
|
|||
|
Operating income
|
80,965
|
|
73,411
|
|
|||
|
Other non-operating expense
|
(18,794
|
)
|
(14,239
|
)
|
|||
|
Pretax income of discontinued operations
|
62,171
|
|
59,172
|
|
|||
|
Income tax expense
|
(39,712
|
)
|
(15,125
|
)
|
|||
|
Income from discontinued operations, net of tax
|
$
|
22,459
|
|
$
|
44,047
|
|
|
|
Operating cash flows of discontinued operations
|
$
|
148,251
|
|
$
|
153,707
|
|
|
|
Investing cash flows of discontinued operations
|
$
|
(38,876
|
)
|
$
|
(25,056
|
)
|
|
|
Financing cash flows of discontinued operations
|
$
|
(15,284
|
)
|
$
|
(34,909
|
)
|
|
|
For the three months ended September 30,
|
2018
|
2017
|
|||||
|
Revenues
|
$
|
151,430
|
|
$
|
164,793
|
|
|
|
Depreciation and amortization
|
6,321
|
|
15,994
|
|
|||
|
Share-based compensation expense
|
173
|
|
679
|
|
|||
|
Other direct costs
|
176,686
|
|
178,675
|
|
|||
|
Operating loss
|
(31,750
|
)
|
(30,555
|
)
|
|||
|
Other non-operating expense
|
(5,621
|
)
|
(4,425
|
)
|
|||
|
Pretax loss of discontinued operations
|
(37,371
|
)
|
(34,980
|
)
|
|||
|
Income tax benefit (expense)
|
2,905
|
|
(1,329
|
)
|
|||
|
Loss from discontinued operations, net of tax
|
$
|
(34,466
|
)
|
$
|
(36,309
|
)
|
|
18
The assets and liabilities of the Discontinued Operations, which are subject to finalization, have been classified as held for sale as of
September 30, 2018
and
December 31, 2017
, in accordance with ASC 205. The assets and liabilities are recorded at the lower of their carrying values or their estimated 'fair values less costs to sell.' In addition to the Discontinued Operations, UniNorte, an institution in the Brazil segment, has also been classified as held for sale as of
September 30, 2018
. UniNorte is included in Continuing Operations as it is not part of the strategic shift described above. The carrying amounts of the major classes of assets and liabilities that were classified as held for sale are presented in the following tables:
|
September 30, 2018
|
December 31, 2017
|
||||||
|
Assets of Discontinued Operations
|
|||||||
|
Cash and cash equivalents
|
$
|
209,148
|
|
$
|
197,898
|
|
|
|
Receivables, net
|
85,298
|
|
83,045
|
|
|||
|
Property and equipment, net
|
637,639
|
|
830,408
|
|
|||
|
Goodwill
|
131,958
|
|
159,042
|
|
|||
|
Tradenames
|
126,292
|
|
156,746
|
|
|||
|
Other assets
|
97,829
|
|
122,201
|
|
|||
|
Subtotal: assets of Discontinued Operations
|
$
|
1,288,164
|
|
$
|
1,549,340
|
|
|
|
Other assets classified as held for sale: UniNorte Brazil
|
|
|
|||||
|
Receivables, net
|
$
|
8,311
|
|
$
|
—
|
|
|
|
Property and equipment, net
|
15,254
|
|
—
|
|
|||
|
Goodwill
|
21,665
|
|
—
|
|
|||
|
Tradenames
|
7,664
|
|
—
|
|
|||
|
Other assets
|
12,988
|
|
—
|
|
|||
|
Subtotal: other assets classified as held for sale
|
$
|
65,882
|
|
$
|
—
|
|
|
|
Total assets held for sale
|
$
|
1,354,046
|
|
$
|
1,549,340
|
|
|
|
September 30, 2018
|
December 31, 2017
|
||||||
|
Liabilities of Discontinued Operations
|
|||||||
|
Deferred revenue and student deposits
|
$
|
211,086
|
|
$
|
223,163
|
|
|
|
Long-term debt, including current portion
|
275,024
|
|
319,473
|
|
|||
|
Other liabilities
|
243,223
|
|
314,680
|
|
|||
|
Subtotal: liabilities of Discontinued Operations
|
$
|
729,333
|
|
$
|
857,316
|
|
|
|
Other liabilities classified as held for sale: UniNorte Brazil
|
|
|
|||||
|
Deferred revenue and student deposits
|
$
|
1,598
|
|
$
|
—
|
|
|
|
Long-term debt, including current portion
|
4,973
|
|
—
|
|
|||
|
Other liabilities
|
11,663
|
|
—
|
|
|||
|
Subtotal: other liabilities classified as held for sale
|
$
|
18,234
|
|
$
|
—
|
|
|
|
Total liabilities held for sale
|
$
|
747,567
|
|
$
|
857,316
|
|
|
Sale Agreements Signed in 2018 and Pending Closure
University of St. Augustine for Health Sciences, LLC (St. Augustine)
On
April 24, 2018
, the Company and Exeter Street Holdings, LLC (the St. Augustine Seller) and St. Augustine, both of which are wholly owned subsidiaries of the Company, entered into a Membership Interest Purchase Agreement (the St. Augustine Purchase Agreement) with University of St. Augustine Acquisition Corp. (the St. Augustine Purchaser), an affiliate of Altas Partners LP. Pursuant to the St. Augustine Purchase Agreement, the St. Augustine Purchaser will purchase from the St. Augustine Seller all of
19
the issued and outstanding membership interests of St. Augustine. As of
September 30, 2018
, St. Augustine is included in the Discontinued Operations and has been classified as held for sale on our Consolidated Balance Sheet. The transaction value under the St. Augustine Purchase Agreement is
$400,000
, subject to customary closing adjustments, and the parties expect that the transaction will close in late 2018, subject to required regulatory approvals, including approvals by the U.S. Department of Education and the WASC Senior College and University Commission, and customary closing conditions.
Monash South Africa
On September 7, 2018, LEI AMEA Investments BV (the Monash Seller), a wholly owned subsidiary of the Company, The Independent Institute of Education Proprietary Limited (the Monash Purchaser), Advtech Limited (the Monash Purchaser Guarantor), Monash South Africa Limited (our majority-owned institution) and Monash University (a noncontrolling interest holder) entered into agreements whereby the Monash Purchaser will acquire the Company's operations in South Africa, including real estate and our institution in South Africa. The total transaction value is approximately
343,000
South African Rand (approximately
$23,900
at
September 30, 2018
), subject to working capital and other adjustments, and closing is expected to occur in late 2018 or early 2019, subject to regulatory approvals and customary closing conditions.
Note
5
.
Dispositions
Sale of Cyprus and Italy Operations
As previously disclosed in our 2017 Form 10-K, on
January 11, 2018
, we completed the sale of European University-Cyprus Ltd (EUC) and Laureate Italy S.r.L. (Laureate Italy). Upon closing, we received gross proceeds of approximately
232,000
Euros (EUR) (approximately US
$275,500
, or approximately US
$244,300
net of cash sold and net of the approximately
$4,100
working capital settlement between the Company and the buyer that was completed during the second quarter of 2018), and recognized a total gain on sale for the
nine months ended September 30, 2018
of approximately
$218,000
, which is included in Gain on sales of discontinued operations, net of tax, on the Consolidated Statements of Operations. The Company used the proceeds from this transaction, along with borrowings on our revolving credit facility that were subsequently repaid with the China sale proceeds discussed below, to repay
$350,000
of principal balance on our syndicated term loan that matures in April 2024 (the 2024 Term Loan), as discussed in Note
9
,
Debt
.
Sale of China Operations
As previously disclosed in our 2017 Form 10-K, on
January 25, 2018
, we completed the sale of LEI Lie Ying Limited (LEILY). At closing, the Company received initial gross proceeds totaling approximately
$128,800
(approximately
$110,800
net of cash sold), net of banker transaction fees and certain taxes and duties totaling approximately
$16,000
.
Six months
after the closing date, the buyer was required to pay to the Company the Hong Kong Dollar (HKD) equivalent of Chinese Renminbi (RMB)
120,000
(the First Holdback Payment).
On July 27, 2018, the Company received the First Holdback Payment from the buyer, net of withholding taxes and agreed-upon legal fees, for a net payment of HKD
142,221
or
$18,117
at the date of receipt, prior to banker transaction fees.
Twelve months
after the closing date, the buyer is required to pay to the Company the HKD equivalent of RMB
60,000
(the Second Holdback Payment, approximately US
$9,000
at
September 30, 2018
). Both the First Holdback Payment and the Second Holdback Payment are subject to deduction of any indemnifiable losses payable by the Company to the buyer pursuant to the sale purchase agreement. The remainder of the transaction value was paid into an escrow account and will be distributed to the Company pursuant to the terms and conditions of the escrow agreement.
As of
September 30, 2018
, the Company has recorded a receivable for the Second Holdback Payment, as well as a receivable of approximately
$25,900
for the portion of the escrowed amount that the Company expects to receive. In addition, the Company has recorded a liability of approximately
$15,000
related to loss contingencies for which we have indemnified the buyer. The Company recognized a gain on the sale of LEILY for the
nine months ended September 30, 2018
of approximately
$99,500
, including tax effect, which is included in Gain on sales of discontinued operations, net of tax, on the Consolidated Statements of Operations.
Sale of German Operations
On April 12, 2018, LEI European Investments B.V., a Netherlands private limited liability company (LEI BV), and Laureate International B.V., a Netherlands private limited liability company (Laureate International), both of which are indirect, wholly owned subsidiaries of Laureate Education, Inc., executed and closed a Sale and Purchase Agreement (the Laureate Germany SPA) with Global University Systems Germany B.V., a Netherlands private limited liability company (Global University Systems). Pursuant to the Laureate Germany SPA, Global University Systems purchased from LEI BV all of the issued and outstanding
20
shares of capital stock of Laureate Germany Holding GmbH and its consolidated institutions, including the University of Applied Sciences Europe and Laureate Academies GmbH (collectively, Laureate Germany), and Laureate International guaranteed the obligations of LEI BV under the Laureate Germany SPA. Upon completion of the sale, LEI BV received gross proceeds of EUR
1,000
(approximately US
$1,200
at the date of receipt). At the date of sale, Laureate Germany had approximately
$12,900
of cash and restricted cash on its balance sheet. In connection with this transaction, the Company contributed capital to Laureate Germany of approximately
$3,600
, and expects to pay estimated real estate transfer taxes of approximately
$400
. The Company recognized a loss on the sale of Laureate Germany for the
nine months ended September 30, 2018
of approximately
$5,500
, which is included in Gain on sales of discontinued operations, net of tax, on the Consolidated Statements of Operations.
Sale of Moroccan Operations
As previously reported in our 2017 Form 10-K, on November 29, 2017, Laureate Middle East Holdings B.V., a Netherlands private limited liability company and an indirect, wholly owned subsidiary of the Company (LMEH), and La Société Maroc Emirats Arabes Unis de Développement, a Morocco company (SOMED and, together with LMEH, the Sellers), Laureate I B.V., a Netherlands private limited liability company and an indirect, wholly owned subsidiary of the Company (the Guarantor), and UPM Pédagogique, a Morocco company (the Purchaser), entered into a Share Purchase Agreement (the Laureate Somed SPA), pursuant to which the Purchaser agreed to purchase from the Sellers all of the issued and outstanding capital shares of Laureate Somed Holding, a Morocco company (Laureate Somed), for a total transaction value of
500,000
Moroccan Dirhams, and the Guarantor agreed to guarantee certain obligations of LMEH under the Laureate Somed SPA. The transaction closed on
April 13, 2018
, and LMEH received net proceeds of
300,000
Moroccan Dirhams (approximately US
$32,500
at the date of sale, or approximately
$31,100
net of cash sold).
The proceeds were used for general debt repayment across the Company rather than repayment of a specific tranche.
Prior to the consummation of the sale, LMEH owned approximately
60%
of the capital shares of Laureate Somed, while SOMED owned the remaining approximately
40%
of the capital shares of Laureate Somed. Laureate Somed is the operator of Université Internationale de Casablanca, a comprehensive campus-based university in Casablanca, Morocco. The Company recognized a gain on the sale of Laureate Somed of approximately
$17,400
for the
nine months ended September 30, 2018
, which is included in Gain on sales of discontinued operations, net of tax, on the Consolidated Statements of Operations.
Sale of Kendall College, LLC
As previously disclosed in our 2017 Form 10-K, on January 15, 2018, Kendall College, LLC (Kendall), an Illinois limited liability company and indirect wholly owned subsidiary of Laureate, The Dining Room at Kendall NFP, an Illinois not for profit corporation, National Louis University, an Illinois not for profit corporation (NLU), and Laureate, solely as guarantor of certain of Kendall’s obligations thereunder, entered into an asset purchase agreement. On
August 6, 2018
, we closed the transaction and Kendall transferred to NLU certain assets, including all of Kendall's education programs, subject to certain conditions, in exchange for consideration of one dollar. Closing of the transaction was subject to prior receipt of regulatory consents, including those of the U.S. Department of Education and the Higher Learning Commission.
As part of the agreement, at closing Laureate paid to NLU
$14,000
to support NLU’s construction of facilities for the acquired culinary program on NLU’s campus, subject to possible partial recoupment under specified conditions during the
10
-year post-closing period. In addition, at closing Laureate paid approximately
$2,100
to NLU for a working capital adjustment and other items provided for under the agreement. This payment was included in the loss on sale, which totaled approximately
$17,000
, including tax effect, and is included in gain/loss on sales of discontinued operations, net of tax, on the Consolidated Statements of Operations.
Also, at the closing date of the sale, the cease-use criteria were met for a leased building that was not part of the sale transaction and that has a lease term ending in July 2028. Accordingly, during the third quarter of 2018, the Company recorded a liability of approximately
$24,000
for the present value of the remaining lease costs, less estimated sublease income, which was charged to loss from discontinued operations, net of tax, on the Consolidated Statements of Operations.
21
Note
6
.
Due to Shareholders of Acquired Companies
The amounts due to shareholders of acquired companies generally arise in connection with Laureate’s acquisition of a majority or all of the ownership interest of these companies. Promissory notes payable to the sellers of acquired companies, referred to as “seller notes,” are commonly used as a means of payment for business acquisitions. Seller note payments are classified as
Payments of deferred purchase price for acquisitions
within financing activities in our Consolidated Statements of Cash Flows. The amounts due to shareholders of acquired companies, currencies, and interest rates applied were as follows:
|
September 30, 2018
|
December 31, 2017
|
Nominal Currency
|
Interest
Rate % |
|||||
|
Universidade Anhembi Morumbi (UAM Brazil)
|
$
|
28,577
|
|
$
|
45,206
|
|
BRL
|
CDI + 2%
|
|
University of St. Augustine for Health Sciences, LLC
(St. Augustine) |
11,550
|
|
11,550
|
|
USD
|
7%
|
||
|
Faculdade Porto-Alegrense (FAPA)
|
1,806
|
|
3,084
|
|
BRL
|
IGP-M
|
||
|
IADE Group
|
1,177
|
|
2,374
|
|
EUR
|
3%
|
||
|
Monash South Africa (MSA)
|
—
|
|
9,571
|
|
AUD
|
n/a
|
||
|
Total due to shareholders of acquired companies
|
43,110
|
|
71,785
|
|
||||
|
Less: Current portion of due to shareholders of acquired companies
|
23,065
|
|
34,745
|
|
||||
|
Due to shareholders of acquired companies, less current portion
|
$
|
20,045
|
|
$
|
37,040
|
|
||
|
BRL: Brazilian Real
|
CDI: Certificados de Depósitos Interbancários (Brazil)
|
|
|
USD: United States Dollar
|
IGP-M: General Index of Market Prices (Brazil)
|
|
|
EUR: European Euro
|
||
|
AUD: Australian Dollar
|
||
MSA
During the second quarter of 2018, the conditions required for resolution of the MSA earnout were completed and the seller note liability, which was recorded on a corporate entity, was reversed as the criteria for payment was not met.
Note
7
.
Business and Geographic Segment Information
Laureate’s educational services are offered through
six
operating segments: Brazil, Mexico, Andean, Central America & U.S. Campuses, Rest of World and Online & Partnerships. Laureate determines its operating segments based on information utilized by the chief operating decision maker to allocate resources and assess performance.
Our campus-based segments generate revenues by providing an education that emphasizes professional-oriented fields of study with undergraduate and graduate degrees in a wide range of disciplines. Our educational offerings are increasingly utilizing online and hybrid (a combination of online and in-classroom) courses and programs to deliver their curriculum. Many of our largest campus-based operations are in developing markets which are experiencing a growing demand for higher education based on favorable demographics and increasing secondary completion rates, driving increases in participation rates and resulting in continued growth in the number of higher education students. Traditional higher education students (defined as 18-24 year olds) have historically been served by public universities, which have limited capacity and are often underfunded, resulting in an inability to meet the growing student demand and employer requirements. This supply and demand imbalance has created a market opportunity for private sector participants. Most students finance their own education. However, there are some government-sponsored student financing programs which are discussed below. These campus-based segments include Brazil, Mexico, Andean, Central America & U.S. Campuses and Rest of World. Specifics related to each of these campus-based segments and our Online & Partnerships segment are discussed below:
In Brazil, approximately 75% of post-secondary students are enrolled in private higher education institutions. While the federal government defines the national curricular guidelines, institutions are licensed to operate by city. Laureate owns 13 institutions in eight states throughout Brazil, with a particularly strong presence in the competitive São Paulo market. Many students finance their own education while others rely on the government-sponsored programs such as Prouni and FIES.
Public universities in Mexico enroll approximately two thirds of students attending post-secondary education. However, many public institutions are faced with capacity constraints or the quality of the education is considered low. Laureate owns two institutions
22
and is present throughout the country with a footprint of over 40 campuses. Each institution in Mexico has a national license. Students in our Mexican institutions typically finance their own education.
The Andean segment includes institutions in Chile, Peru, Portugal and Spain. In Chile, private universities enroll approximately 80% of post-secondary students. In Peru, the public sector plays a significant role, but private universities are increasingly providing the capacity to meet growing demand. In Spain and Portugal, the high demand for post-secondary education places capacity constraints on the public sector, pushing students to turn to the private sector for high-quality education. Chile has government-sponsored student financing programs, while in the other countries students generally finance their own education. The
institutions in Portugal and Spain are included in Discontinued Operations
.
The Central America & U.S. Campuses segment includes institutions in Costa Rica, Honduras, Panama and the United States. Students in Central America typically finance their own education while students in the United States finance their education in a variety of ways, including U.S. Department of Education (DOE) Title IV programs. The entire
Central America & U.S. Campuses segment is included in Discontinued Operations
.
The Rest of World segment includes an institution in the European country of Turkey, as well as locations in the Middle East, Africa and Asia Pacific consisting of campus-based institutions with operations in Australia, India, Malaysia, New Zealand, South Africa and Thailand. Additionally, the Rest of World segment manages
eight
licensed institutions in the Kingdom of Saudi Arabia and manages
one
additional institution in China through a joint venture arrangement.
T
he institutions in the Rest of World segment are included in Discontinued Operations, except for Australia, New Zealand and the managed institutions in the Kingdom of Saudi Arabia and China.
The Online & Partnerships segment includes fully online institutions operating globally that offer professionally oriented degree programs in the United States through Walden University (Walden), a U.S.-based accredited institution, and through the University of Liverpool and the University of Roehampton in the United Kingdom. These online institutions primarily serve working adults with undergraduate and graduate degree program offerings. Students in the United States finance their education in a variety of ways, including Title IV programs.
As discussed in Note
1
,
Description of Business
and Note
4
,
Discontinued Operations and Assets Held for Sale
, during the
quarter ended September 30, 2018
,
a number of our subsidiaries met the requirements to be classified as discontinued operations, including the entire
Central America & U.S. Campuses segment
. As a result, the operations of the
Central America & U.S. Campuses segment
have been excluded from the segment information for all periods presented. In addition, the portions of the Andean and Rest of World reportable segments that are included in discontinued operations have also been excluded from the segment information for all periods presented.
Intersegment transactions are accounted for in a similar manner as third-party transactions and are eliminated in consolidation. The Corporate amounts presented in the following tables includes corporate charges that were not allocated to our reportable segments and adjustments to eliminate intersegment items.
We evaluate segment performance based on Adjusted EBITDA, which is a non-GAAP performance measure defined as Income (loss) from continuing operations before income taxes and equity in net income of affiliates, adding back the following items:
Gain (loss) on sales of subsidiaries, net
,
Foreign currency exchange loss, net
,
Other income (expense), net
,
Gain on derivatives
,
Loss on debt extinguishment
,
Interest expense
,
Interest income
, Depreciation and amortization expense, Loss on impairment of assets, Share-based compensation expense and expenses related to our Excellence-in-Process (EiP) initiative. EiP is an enterprise-wide initiative to optimize and standardize Laureate’s processes, creating vertical integration of procurement, information technology, finance, accounting and human resources. It includes the establishment of regional shared services organizations (SSOs) around the world, as well as improvements to the Company's system of internal controls over financial reporting. We have expanded the EiP initiative into other back- and mid-office areas, as well as certain student-facing activities. EiP also includes certain non-recurring costs incurred in connection with the planned dispositions described in Note
4
,
Discontinued Operations and Assets Held for Sale
, and the completed dispositions described in Note
5
,
Dispositions
.
When we review Adjusted EBITDA on a segment basis, we exclude intercompany revenues and expenses, related to network fees and royalties between our segments, which eliminate in consolidation. We use total assets as the measure of assets for reportable segments.
23
The following tables provide financial information for our reportable segments, including a reconciliation of Adjusted EBITDA to Income from continuing operations before income taxes, as reported in the Consolidated Statements of Operations:
|
For the three months ended
|
For the nine months ended
|
||||||||||||||
|
September 30,
|
September 30,
|
||||||||||||||
|
2018
|
2017
|
2018
|
2017
|
||||||||||||
|
Revenues
|
|||||||||||||||
|
Brazil
|
$
|
121,089
|
|
$
|
170,497
|
|
$
|
469,480
|
|
$
|
547,971
|
|
|||
|
Mexico
|
148,325
|
|
141,175
|
|
463,868
|
|
451,993
|
|
|||||||
|
Andean
|
299,613
|
|
295,160
|
|
844,213
|
|
779,135
|
|
|||||||
|
Rest of World
|
56,548
|
|
49,045
|
|
170,164
|
|
149,156
|
|
|||||||
|
Online & Partnerships
|
165,221
|
|
168,375
|
|
498,207
|
|
520,982
|
|
|||||||
|
Corporate
|
(3,694
|
)
|
(5,651
|
)
|
(9,418
|
)
|
(14,550
|
)
|
|||||||
|
Revenues
|
$
|
787,102
|
|
$
|
818,601
|
|
$
|
2,436,514
|
|
|
$
|
2,434,687
|
|
||
|
Adjusted EBITDA of reportable segments
|
|||||||||||||||
|
Brazil
|
$
|
682
|
|
$
|
9,138
|
|
$
|
52,600
|
|
$
|
61,289
|
|
|||
|
Mexico
|
23,715
|
|
6,465
|
|
81,965
|
|
78,590
|
|
|||||||
|
Andean
|
90,610
|
|
90,594
|
|
235,376
|
|
208,469
|
|
|||||||
|
Rest of World
|
5,277
|
|
(411
|
)
|
15,870
|
|
10,062
|
|
|||||||
|
Online & Partnerships
|
45,725
|
|
42,883
|
|
136,126
|
|
145,753
|
|
|||||||
|
Total Adjusted EBITDA of reportable segments
|
166,009
|
|
148,669
|
|
521,937
|
|
504,163
|
|
|||||||
|
Reconciling items:
|
|||||||||||||||
|
Corporate
|
(45,544
|
)
|
(48,731
|
)
|
(127,539
|
)
|
(152,676
|
)
|
|||||||
|
Depreciation and amortization expense
|
(53,475
|
)
|
(51,936
|
)
|
(163,329
|
)
|
(152,509
|
)
|
|||||||
|
Loss on impairment of assets
|
(10,030
|
)
|
—
|
|
(10,030
|
)
|
—
|
|
|||||||
|
Share-based compensation expense
|
(6,388
|
)
|
(7,953
|
)
|
(9,572
|
)
|
(42,214
|
)
|
|||||||
|
EiP expenses
|
(24,996
|
)
|
(15,190
|
)
|
(60,292
|
)
|
(54,887
|
)
|
|||||||
|
Operating income
|
25,576
|
|
24,859
|
|
151,175
|
|
101,877
|
|
|||||||
|
Interest income
|
3,502
|
|
3,677
|
|
9,358
|
|
9,702
|
|
|||||||
|
Interest expense
|
(58,319
|
)
|
(69,103
|
)
|
(181,764
|
)
|
(256,677
|
)
|
|||||||
|
Loss on debt extinguishment
|
—
|
|
—
|
|
(7,481
|
)
|
(8,425
|
)
|
|||||||
|
(Loss) gain on derivatives
|
(144
|
)
|
(19,930
|
)
|
92,112
|
|
19,187
|
|
|||||||
|
Other income (expense), net
|
8,312
|
|
(778
|
)
|
10,815
|
|
(568
|
)
|
|||||||
|
Foreign currency exchange (loss) gain, net
|
(26,492
|
)
|
6,624
|
|
(43,942
|
)
|
(2,221
|
)
|
|||||||
|
(Loss) income from continuing operations before income taxes and equity in net income of affiliates
|
$
|
(47,565
|
)
|
$
|
(54,651
|
)
|
$
|
30,273
|
|
$
|
(137,125
|
)
|
|||
|
September 30, 2018
|
December 31, 2017
|
||||||
|
Assets
|
|||||||
|
Brazil
|
$
|
989,206
|
|
$
|
1,256,364
|
|
|
|
Mexico
|
1,024,731
|
|
969,400
|
|
|||
|
Andean
|
1,737,234
|
|
1,714,819
|
|
|||
|
Rest of World
|
230,780
|
|
225,429
|
|
|||
|
Online & Partnerships
|
1,244,418
|
|
1,294,147
|
|
|||
|
Corporate and Discontinued Operations
|
1,764,167
|
|
1,931,126
|
|
|||
|
Total assets
|
$
|
6,990,536
|
|
$
|
7,391,285
|
|
|
24
Note
8
.
Goodwill
The change in the net carrying amount of Goodwill from
December 31, 2017
through
September 30, 2018
was composed of the following items:
|
|
Brazil
|
Mexico
|
Andean
|
Rest of World
|
Online & Partnerships
|
Total
|
||||||||||||
|
Balance at December 31, 2017
|
$
|
493,373
|
|
$
|
503,373
|
|
$
|
272,181
|
|
$
|
98,698
|
|
$
|
460,740
|
|
$
|
1,828,365
|
|
|
Acquisitions
|
—
|
|
—
|
|
—
|
|
—
|
|
—
|
|
—
|
|
||||||
|
Dispositions
|
—
|
|
—
|
|
—
|
|
—
|
|
—
|
|
—
|
|
||||||
|
Reclassification to Long-term assets held for sale
|
(21,664
|
)
|
—
|
|
—
|
|
—
|
|
—
|
|
(21,664
|
)
|
||||||
|
Impairments
|
—
|
|
—
|
|
—
|
|
—
|
|
—
|
|
—
|
|
||||||
|
Currency translation adjustments
|
(96,754
|
)
|
20,955
|
|
(15,777
|
)
|
(5,539
|
)
|
—
|
|
(97,115
|
)
|
||||||
|
Adjustments to prior acquisitions
|
—
|
|
—
|
|
—
|
|
—
|
|
—
|
|
—
|
|
||||||
|
Balance at September 30, 2018
|
$
|
374,955
|
|
$
|
524,328
|
|
$
|
256,404
|
|
$
|
93,159
|
|
$
|
460,740
|
|
$
|
1,709,586
|
|
Note
9
.
Debt
Outstanding long-term debt was as follows:
|
September 30, 2018
|
December 31, 2017
|
||||||
|
Senior long-term debt:
|
|||||||
|
Senior Secured Credit Facility (stated maturity dates April 2022 and April 2024), net of discount
|
$
|
1,227,730
|
|
$
|
1,625,344
|
|
|
|
Senior Notes (stated maturity dates May 2025)
|
800,000
|
|
800,000
|
|
|||
|
Total senior long-term debt
|
2,027,730
|
|
2,425,344
|
|
|||
|
Other debt:
|
|||||||
|
Lines of credit
|
52,226
|
|
42,195
|
|
|||
|
Notes payable and other debt
|
512,537
|
|
593,268
|
|
|||
|
Total senior and other debt
|
2,592,493
|
|
3,060,807
|
|
|||
|
Capital lease obligations and sale-leaseback financings
|
108,691
|
|
139,758
|
|
|||
|
Total long-term debt
|
2,701,184
|
|
3,200,565
|
|
|||
|
Less: total unamortized deferred financing costs
|
91,184
|
|
105,299
|
|
|||
|
Less: current portion of long-term debt
|
104,502
|
|
121,870
|
|
|||
|
Long-term debt, less current portion
|
$
|
2,505,498
|
|
$
|
2,973,396
|
|
|
Estimated Fair Value of Debt
The estimated fair value of our debt was determined using observable market prices, as the majority of our securities, including the Senior Secured Credit Facility and the Senior Notes due 2025, are traded in a brokered market. The fair value of our remaining debt instruments approximates carrying value based on their terms. As of
September 30, 2018
and
December 31, 2017
, our long-term debt was classified as Level 2 within the fair value hierarchy, based on the frequency and volume of trading in the brokered market. The estimated fair value of our debt was as follows:
|
September 30, 2018
|
December 31, 2017
|
||||||||||||||
|
Carrying amount
|
Estimated fair value
|
Carrying amount
|
Estimated fair value
|
||||||||||||
|
Total senior and other debt
|
$
|
2,592,493
|
|
$
|
2,654,632
|
|
$
|
3,060,807
|
|
$
|
3,117,437
|
|
|||
Amendment to Senior Secured Credit Facility - 2024 Term Loan
On
February 1, 2018
, we amended our Senior Secured Credit Facility to reduce the interest rate on our 2024 Term Loan. In connection with this transaction, we also prepaid
$350,000
of the principal balance of the 2024 Term Loan in addition to
$1,239
25
of accrued interest using the proceeds from the sale of our Cyprus and Italy operations, along with borrowings on our revolving credit facility that were subsequently repaid with the China sale proceeds. As a result of the
$350,000
prepayment, there will be no further quarterly principal payments required and the remaining balance will be due at maturity.
Pursuant to this amendment, the interest rate margins applicable to the 2024 Term Loan were amended to
3.50%
for LIBOR term loans and
2.50%
for ABR term loans and such interest rate margins will no longer be based upon the Company’s consolidated total debt to consolidated EBITDA ratio. The amendment effectively reduces the current interest rate margins applicable to the outstanding term loans, which prior to the amendment was based on the Company’s consolidated total debt to consolidated EBITDA ratio, by 100 basis points, from
4.50%
to
3.50%
for LIBOR term loans, and
3.50%
to
2.50%
for ABR term loans. The amended credit agreement also provided for a prepayment premium with respect to the outstanding term loans. The prepayment premium equaled
one percent
(
1%
) of the amount of any term loans that were subject to certain repricing transactions occurring on or prior to August 1, 2018, of which there were none.
Certain Covenants
As of
September 30, 2018
, our senior long-term debt contained certain negative covenants including, among others: (1) limitations on additional indebtedness; (2) limitations on dividends; (3) limitations on asset sales, including the sale of ownership interests in subsidiaries and sale-leaseback transactions; and (4) limitations on liens, guarantees, loans or investments. The
Second Amended and Restated Credit Agreement
provides, solely with respect to the Revolving Credit Facility, that the Company shall not permit its Consolidated Senior Secured Debt to Consolidated EBITDA ratio, as defined in the Second Amended and Restated Credit Agreement, to exceed
3.50x as of the last day of each quarter ending June 30, 2018 and thereafter.
However, the agreement also provides that if (i) the Company’s Consolidated Total Debt to Consolidated EBITDA ratio, as defined in the Second Amended and Restated Credit Agreement, is not greater than
4.75
x as of such date and (ii) less than
25%
of the Revolving Credit Facility is utilized as of that date, then such financial covenant shall not apply.
As of
September 30, 2018
, these conditions were satisfied and, therefore, we were not subject to the leverage ratio covenant.
In addition, notes payable at some of our locations contain financial maintenance covenants.
26
Note
10
.
Commitments and Contingencies
Noncontrolling Interest Holder Put Arrangements
The following section provides a summary table and description of the various noncontrolling interest holder put arrangements, which relate to Discontinued Operations, that Laureate had outstanding as of
September 30, 2018
. Laureate has elected to accrete changes in the arrangements’ redemption values over the period from the date of issuance to the earliest redemption date. The redeemable noncontrolling interests are recorded at the greater of the accreted redemption value or the traditional noncontrolling interest. Until the first exercise date, the put instruments’ reported values may be lower than the final amounts that will be required to settle the minority put arrangements. As of
September 30, 2018
, the carrying value of all noncontrolling interest holder put arrangements was
$10,958
.
If the minority put arrangements were all exercised at
September 30, 2018
, Laureate would be obligated to pay the noncontrolling interest holders an estimated amount of
$10,958
, as summarized in the following table:
|
Nominal Currency
|
First Exercisable Date
|
Estimated Value as of September 30, 2018 redeemable within 12-months:
|
Reported
Value |
||||||
|
Noncontrolling interest holder put arrangements
|
|||||||||
|
INTI Education Holdings Sdn Bhd (Inti Holdings) - 10.10%
|
MYR
|
Current
|
$
|
9,016
|
|
$
|
9,016
|
|
|
|
Pearl Retail Solutions Private Limited (Pearl) - 10%
|
INR
|
Current
|
1,880
|
|
1,880
|
|
|||
|
Stamford International University (STIU) - Puttable preferred stock of TEDCO
|
THB
|
Current
|
62
|
|
62
|
|
|||
|
Total noncontrolling interest holder put arrangements
|
10,958
|
|
10,958
|
|
|||||
|
Puttable common stock - not currently redeemable
|
USD
|
*
|
—
|
|
1,713
|
|
|||
|
Total redeemable noncontrolling interests and equity
|
$
|
10,958
|
|
$
|
12,671
|
|
|||
* Contingently redeemable
MYR: Malaysian Ringgit
INR: Indian Rupee
THB: Thai Baht
Laureate’s noncontrolling interest put arrangements are specified in agreements with each noncontrolling interest holder. The terms of these agreements determine the measurement of the redemption value of the put options based on a non-GAAP measure of earnings before interest, taxes, depreciation and amortization (EBITDA, or recurring EBITDA), the definition of which varies for each particular contract.
Commitments and contingencies are generally denominated in foreign currencies.
Series A Convertible Redeemable Preferred Stock
As disclosed in our 2017 Form 10-K, in December 2016 and January 2017, the Company issued an aggregate of
400
shares of convertible redeemable preferred stock (the Series A Preferred Stock) for total gross proceeds of
$400,000
. The Series A Preferred Stock included a Beneficial Conversion Feature (BCF) that was contingent on a qualified IPO (as defined in the Certificate of Designations governing the terms of the Series A Preferred Stock), which was consummated on February 6, 2017. Accordingly, during the first quarter of 2017, the Company recorded the BCF at its estimated fair value as a reduction of the carrying value of the Series A Preferred Stock and an increase to
Additional paid-in capital
. The accretion of this BCF reduced net income available to common stockholders in the calculation of earnings per share, as shown in Note
16
,
Earnings (Loss) Per Share
. The total BCF of
$265,368
was accreted using a constant yield approach over a
one
-year period. For the
nine months ended September 30, 2018
and
2017
, we recorded total accretion on the Series A Preferred Stock of
$61,974
and
$185,149
, respectively, and paid cash dividends on the Series A Preferred Stock of
$11,103
and
$5,175
, respectively. As of
December 31, 2017
, the Series A Preferred Stock had a carrying value of
$400,276
.
On
April 23, 2018
all of the issued and outstanding shares of the Series A Preferred Stock were converted into
36,143
shares of the Company’s Class A common stock, par value
$0.004
per share. This conversion was treated as a redemption for accounting purposes and resulted in an increase in
Additional paid-in capital
upon reclassification of the carrying value of the Series A Preferred
27
Stock. See Note
13
,
Stockholders' Equity
, for further detail. A portion of the fair value of the shares of Class A common stock issued to redeem the Series A Preferred Stock was allocated to the BCF contained in the Series A Preferred Stock. The difference between the remaining fair value of the shares of Class A common stock issued, the carrying value of the Series A Preferred Stock and fair value of the embedded derivatives resulted in a gain of
$74,110
, which was recorded as
Additional paid-in capital
but included in income available to common stockholders in the calculation of earnings per share.
Other Loss Contingencies
Laureate is subject to legal actions arising in the ordinary course of its business. In management's opinion, we have adequate legal defenses, insurance coverage and/or accrued liabilities with respect to the eventuality of such actions. We do not believe that any settlement would have a material impact on our Consolidated Financial Statements. Refer to Note
18
,
Legal and Regulatory Matters
, for a discussion of certain matters.
Contingent Liabilities for Taxes
As of
September 30, 2018
and
December 31, 2017
, Laureate has recorded cumulative liabilities totaling
$64,997
and
$77,258
, respectively, for taxes other-than-income tax, principally payroll-tax-related uncertainties recorded at the time of an acquisition, of which
$5,072
and
$7,240
, respectively, was classified as held for sale. The changes in this recorded liability are related to acquisitions, interest and penalty accruals, changes in tax laws, expirations of statutes of limitations, settlements and changes in foreign currency exchange rates. The terms of the statutes of limitations on these contingencies vary but can be up to
10 years
. These liabilities were included in current and long-term liabilities on the Consolidated Balance Sheets. Changes in the recorded values of non-income tax contingencies impact operating income and interest expense, while changes in the related indemnification assets impact only operating income. The total increase to operating income for adjustments to non-income tax contingencies and indemnification assets was
$857
and
$4,905
, respectively, for the
nine months ended September 30, 2018
and
2017
.
In addition, as of
September 30, 2018
and
December 31, 2017
, Laureate has recorded cumulative liabilities for income tax contingencies of
$68,404
and
$103,189
, respectively, of which
$8,680
and
$9,300
, respectively, were classified as held for sale. As of
September 30, 2018
and
December 31, 2017
, indemnification assets primarily related to acquisition contingencies were
$95,956
and
$98,493
, respectively, of which
$600
and
$935
, respectively, were classified as held for sale. These indemnification assets primarily cover contingencies for income taxes and taxes other-than-income taxes. In addition, we have identified certain contingencies, primarily tax-related, that we have assessed as being reasonably possible of loss, but not probable of loss, and could have an adverse effect on the Company’s results of operations if the outcomes are unfavorable. In most cases, Laureate has received indemnifications from the former owners and/or noncontrolling interest holders of the acquired businesses for contingencies, and therefore, we do not believe we will sustain an economic loss even if we are required to pay these additional amounts. In cases where we are not indemnified, the unrecorded contingencies are not individually material and are primarily in Brazil. In the aggregate, we estimate that the reasonably possible loss for these unrecorded contingencies in Brazil could be up to approximately
$39,000
if the outcomes were unfavorable in all cases.
Other Loss Contingencies
Laureate has accrued liabilities for certain civil actions against our institutions, a portion of which existed prior to our acquisition of these entities. Laureate intends to vigorously defend against these matters. As of
September 30, 2018
and
December 31, 2017
, approximately
$35,000
and
$18,000
,
respectively, of
loss contingencies were included in
Other long-term liabilities
and
Other current liabilities
on the Consolidated Balance Sheets. In addition, as of
September 30, 2018
and
December 31, 2017
,
$18,000
and
$4,000
, respectively, of loss contingencies for Discontinued Operations were classified as liabilities held for sale. The increase is primarily due to loss contingencies recorded as a result of the sale of LEILY in China, as discussed in Note
5
,
Dispositions
, as well as loss contingencies in the Brazil segment for which we are indemnified by the former owner and have recorded a corresponding indemnification asset.
Material Guarantees – Student Financing
Chile
The accredited Chilean institutions in the Laureate network also participate in a government-sponsored student financing program known as Crédito con Aval del Estado (the CAE Program).
The CAE Program was formally implemented by the Chilean government in 2006 to promote higher education in Chile for lower socio-economic level students in good academic standing. The CAE Program involves tuition financing and guarantees that are provided by our institutions and the government.
As part of the CAE Program, these institutions provide guarantees which result in contingent liabilities to third-party financing institutions, beginning
28
at 90% of the tuition loans made directly to qualified students enrolled through the CAE Program and declining to 60% over time. The guarantees by these institutions are in effect during the period in which the student is enrolled
, and the guarantees are assumed entirely by the government upon the student’s graduation. When a student leaves one of Laureate's institutions and enrolls in another CAE-qualified institution, the Laureate institution will remain guarantor of the tuition loans that have been granted up to the date of transfer, and until the student's graduation from a CAE-qualified institution.
The maximum potential amount of payments our institutions could be required to make under the CAE Program was approximately
$511,000
and
$527,000
at
September 30, 2018
and
December 31, 2017
, respectively.
This maximum potential amount assumes that all students in the CAE Program do not graduate, so that our guarantee would not be assigned to the government, and that all students default on the full amount of the CAE-qualified loan balances.
As of
September 30, 2018
and
December 31, 2017
,
we recorded
$33,884
and
$27,073
, respectively,
as estimated long-term guarantee liabilities for these obligations.
Material Guarantees – Other
In conjunction with the purchase of UNP Brazil, Laureate pledged all of the acquired shares as a guarantee of our payments of rents as they become due. In the event that we default on any payment, the pledge agreement provides for a forfeiture of the relevant pledged shares. In the event of forfeiture, Laureate may be required to transfer the books and management of UNP to the former owners.
Laureate
acquired the remaining 49% ownership interest in UAM Brazil in April 2013. As part of the agreement to purchase the 49% ownership interest, Laureate pledged 49% of its total shares in UAM Brazil as a guarantee of our payment obligations under the purchase agreement. In the event that we default on any payment, the agreement provides for a forfeiture of the pledged shares.
In connection with the purchase of FMU on September 12, 2014,
Laureate pledged 75% of the acquired shares to third-party lenders as a guarantee of our payment obligations under the loans that financed a portion of the purchase price.
Laureate
pledged the remaining 25% of the acquired shares to the sellers as a guarantee of our payment obligations under the purchase agreement for the seller notes
. In the event that we default on any payment of the loans or seller notes, the purchase agreement provides for a forfeiture of the relevant pledged shares. After the payment of the seller notes in September 2017, the shares pledged to the sellers were pledged to the third-party lenders until full payment of the loans, which mature in April 2021.
In connection with a loan agreement entered into by a Laureate subsidiary in Peru, all of the shares of UPN Peru, one of our universities, were pledged to the third-party lender as a guarantee of the payment obligations under the loan.
Standby Letters of Credit, Surety Bonds and Other Commitments
As of
September 30, 2018
and
December 31, 2017
, Laureate's outstanding letters of credit (LOCs) and surety bonds primarily consisted of the items discussed below.
As of both
September 30, 2018
and
December 31, 2017
, we had approximately
$137,000
posted as LOCs in favor of the DOE. These LOCs were required to allow Walden, Kendall, NewSchool and St. Augustine to continue participating in the DOE Title IV program and are recorded on Walden and a corporate entity. These LOCs are fully collateralized with cash equivalents and certificates of deposit, which are classified as
Restricted cash
on our
September 30, 2018
and
December 31, 2017
Consolidated Balance Sheets.
As of
December 31, 2017
, we had
$39,505
posted as cash collateral for LOCs related to the Spain Tax Audits. As discussed in Note
15
,
Income Taxes
, the cash collateral for these LOCs was released during the first quarter of 2018 and used for payments to the Spanish taxing authorities in order to stop additional interest from accruing while the appeals process continues. The cash collateral for these LOCs was recorded in Continuing Operations and was classified as
Restricted cash
on our
December 31, 2017
Consolidated Balance Sheet.
As part of our normal operations, our insurers issue surety bonds on our behalf, as required by various state education authorities in the United States. We are obligated to reimburse our insurers for any payments made by the insurers under the surety bonds. As of
September 30, 2018
and
December 31, 2017
, the total face amount of these surety bonds was
$22,410
and $
13,980
, respectively. These bonds are fully collateralized with cash, which was classified as
Restricted cash
on our
September 30, 2018
and
December 31, 2017
Consolidated Balance Sheets.
In November 2016, in order to continue participating in Prouni, a federal program that offers tax benefits designed to increase higher education participation rates in Brazil, UAM Brazil posted a guarantee in the amount of
$15,300
. In connection with the issuance of the guarantee, UAM Brazil obtained a non-collateralized surety bond from a third party in order to secure the guarantee.
29
The cost of the surety bond was
$1,400
, of which half was reimbursed by the former owner of UAM Brazil, and is being amortized over the
five
-year term. The Company believes that this matter will not have a material impact on our Consolidated Financial Statements.
Note
11
.
Financing Receivables
Laureate’s financing receivables consist primarily of trade receivables related to student tuition financing programs with an initial term in excess of one year. We have offered long-term financing through the execution of note receivable agreements with students at some of our institutions. Our disclosures include financing receivables that are classified in our Consolidated Balance Sheets as both current and long-term, reported in accordance with ASC 310, “Receivables.”
Laureate’s financing receivables balances were as follows:
|
September 30, 2018
|
December 31, 2017
|
||||||
|
Financing receivables
|
$
|
31,506
|
|
$
|
20,380
|
|
|
|
Allowance for doubtful accounts
|
(5,876
|
)
|
(6,472
|
)
|
|||
|
Financing receivables, net of allowances
|
$
|
25,630
|
|
$
|
13,908
|
|
|
We do not purchase financing receivables in the ordinary course of our business. We may sell certain receivables that are significantly past due. No material amounts of financing receivables were sold during the periods reported herein.
Delinquency is the primary indicator of credit quality for our financing receivables. Receivable balances are considered delinquent when contractual payments on the loan become past due. Delinquent financing receivables are placed on non-accrual status for interest income. The accrual of interest is resumed when the financing receivable becomes contractually current and when collection of all remaining amounts due is reasonably assured. We record an Allowance for doubtful accounts to reduce our financing receivables to their net realizable value. The Allowance for doubtful accounts is based on the age of the receivables, the status of past-due amounts, historical collection trends, current economic conditions, and student enrollment status. Each of our institutions evaluates its balances for potential impairment. We consider impaired loans to be those that are past due one year or greater, and those that are modified as a troubled debt restructuring (TDR). The aging of financing receivables grouped by country portfolio was as follows:
|
Chile
|
Other
|
Total
|
|||||||||
|
As of September 30, 2018
|
|||||||||||
|
Amounts past due less than one year
|
$
|
11,327
|
|
$
|
305
|
|
$
|
11,632
|
|
||
|
Amounts past due one year or greater
|
3,484
|
|
192
|
|
3,676
|
|
|||||
|
Total past due (on non-accrual status)
|
14,811
|
|
497
|
|
15,308
|
|
|||||
|
Not past due
|
15,333
|
|
865
|
|
16,198
|
|
|||||
|
Total financing receivables
|
$
|
30,144
|
|
$
|
1,362
|
|
$
|
31,506
|
|
||
|
As of December 31, 2017
|
|||||||||||
|
Amounts past due less than one year
|
$
|
6,800
|
|
$
|
921
|
|
$
|
7,721
|
|
||
|
Amounts past due one year or greater
|
3,551
|
|
201
|
|
3,752
|
|
|||||
|
Total past due (on non-accrual status)
|
10,351
|
|
1,122
|
|
11,473
|
|
|||||
|
Not past due
|
8,494
|
|
413
|
|
8,907
|
|
|||||
|
Total financing receivables
|
$
|
18,845
|
|
$
|
1,535
|
|
$
|
20,380
|
|
||
30
The following is a rollforward of the Allowance for doubtful accounts related to financing receivables for the
nine months ended September 30, 2018
and
2017
, grouped by country portfolio:
|
Chile
|
Other
|
Total
|
|||||||||
|
Balance at December 31, 2017
|
$
|
(6,107
|
)
|
$
|
(365
|
)
|
$
|
(6,472
|
)
|
||
|
Charge-offs
|
1,338
|
|
37
|
|
1,375
|
|
|||||
|
Recoveries
|
—
|
|
—
|
|
—
|
|
|||||
|
Reclassifications
|
—
|
|
—
|
|
—
|
|
|||||
|
Provision
|
(1,233
|
)
|
18
|
|
(1,215
|
)
|
|||||
|
Currency adjustments
|
434
|
|
2
|
|
436
|
|
|||||
|
Balance at September 30, 2018
|
$
|
(5,568
|
)
|
$
|
(308
|
)
|
$
|
(5,876
|
)
|
||
|
Balance at December 31, 2016
|
$
|
(6,209
|
)
|
$
|
(877
|
)
|
$
|
(7,086
|
)
|
||
|
Charge-offs
|
2,798
|
|
330
|
|
3,128
|
|
|||||
|
Recoveries
|
—
|
|
—
|
|
—
|
|
|||||
|
Reclassifications
|
—
|
|
—
|
|
—
|
|
|||||
|
Provision
|
(2,089
|
)
|
225
|
|
(1,864
|
)
|
|||||
|
Currency adjustments
|
(360
|
)
|
(47
|
)
|
(407
|
)
|
|||||
|
Balance at September 30, 2017
|
$
|
(5,860
|
)
|
$
|
(369
|
)
|
$
|
(6,229
|
)
|
||
Restructured Receivables
A TDR is a financing receivable in which the borrower is experiencing financial difficulty and Laureate has granted an economic concession to the student debtor that we would not otherwise consider. When we modify financing receivables in a TDR, Laureate typically offers the student debtor an extension of the loan maturity and/or a reduction in the accrued interest balance. In certain situations, we may offer to restructure a financing receivable in a manner that ultimately results in the forgiveness of contractually specified principal balances. Our only TDRs are in Chile.
The number of financing receivable accounts and the pre- and post-modification account balances modified under the terms of a TDR during the
nine months ended September 30, 2018
and
2017
were as follows:
|
Number of Financing Receivable Accounts
|
Pre-Modification Balance Outstanding
|
Post-Modification Balance Outstanding
|
||||||||
|
2018
|
435
|
|
$
|
1,345
|
|
$
|
1,262
|
|
||
|
2017
|
355
|
|
$
|
1,838
|
|
$
|
1,655
|
|
||
The preceding table represents accounts modified under the terms of a TDR during the
nine months ended September 30, 2018
, whereas the following table represents accounts modified as a TDR between January 1,
2017
and
September 30, 2018
that subsequently defaulted during the
nine months ended September 30, 2018
:
|
Number of Financing Receivable Accounts
|
Balance at Default
|
|||||
|
Total
|
128
|
|
$
|
455
|
|
|
The following table represents accounts modified as a TDR between January 1,
2016
and
September 30, 2017
that subsequently defaulted during the
nine months ended September 30, 2017
:
|
Number of Financing Receivable Accounts
|
Balance at Default
|
|||||
|
Total
|
156
|
|
$
|
721
|
|
|
31
Note
12
.
Share-based Compensation
Share-based compensation expense was as follows:
|
For the three months ended September 30,
|
For the nine months ended September 30,
|
||||||||||||||
|
2018
|
2017
|
2018
|
2017
|
||||||||||||
|
Continuing operations
|
|||||||||||||||
|
Stock options, net of estimated forfeitures
|
$
|
1,932
|
|
$
|
4,315
|
|
$
|
(3,333
|
)
|
$
|
32,142
|
|
|||
|
Restricted stock awards
|
4,456
|
|
3,638
|
|
12,905
|
|
10,072
|
|
|||||||
|
Total continuing operations
|
$
|
6,388
|
|
$
|
7,953
|
|
$
|
9,572
|
|
$
|
42,214
|
|
|||
|
Discontinued operations
|
|||||||||||||||
|
Share-based compensation expense for discontinued operations
|
173
|
|
679
|
|
920
|
|
1,755
|
|
|||||||
|
Total continuing and discontinued operations
|
$
|
6,561
|
|
$
|
8,632
|
|
$
|
10,492
|
|
$
|
43,969
|
|
|||
The negative stock options expense for the nine months ended September 30, 2018 relates to the correction of an immaterial error recorded in the prior year.
Note
13
.
Stockholders' Equity
The components of net changes in stockholders' equity for the nine months ended
September 30, 2018
were as follows:
|
|
Laureate Education, Inc. Stockholders
|
|
|
||||||||||||||||||||||
|
|
Class A
Common Stock |
Class B
Common Stock |
Additional paid-in capital
|
(Accumulated deficit) retained earnings
|
Accumulated other comprehensive (loss) income
|
Non-controlling interests
|
Total stockholders' equity
|
||||||||||||||||||
|
|
Shares
|
Amount
|
Shares
|
Amount
|
|||||||||||||||||||||
|
Balance at December 31, 2017
|
55,052
|
|
$
|
220
|
|
132,443
|
|
$
|
530
|
|
$
|
3,446,206
|
|
$
|
(946,236
|
)
|
$
|
(925,556
|
)
|
$
|
12,118
|
|
$
|
1,587,282
|
|
|
Adoption of accounting standards
|
—
|
|
—
|
|
—
|
|
—
|
|
—
|
|
4,330
|
|
—
|
|
—
|
|
4,330
|
|
|||||||
|
Balance at January 1, 2018
|
55,052
|
|
220
|
|
132,443
|
|
530
|
|
3,446,206
|
|
(941,906
|
)
|
(925,556
|
)
|
12,118
|
|
1,591,612
|
|
|||||||
|
Non-cash stock compensation
|
—
|
|
—
|
|
—
|
|
—
|
|
10,492
|
|
—
|
|
—
|
|
—
|
|
10,492
|
|
|||||||
|
Conversion of Class B shares to Class A shares
|
115
|
|
—
|
|
(115
|
)
|
—
|
|
—
|
|
—
|
|
—
|
|
—
|
|
—
|
|
|||||||
|
Vesting of restricted stock, net of shares withheld to satisfy tax withholding
|
344
|
|
2
|
|
59
|
|
—
|
|
(1,746
|
)
|
—
|
|
—
|
|
—
|
|
(1,744
|
)
|
|||||||
|
Distributions to noncontrolling interest holders
|
—
|
|
—
|
|
—
|
|
—
|
|
—
|
|
—
|
|
—
|
|
(892
|
)
|
(892
|
)
|
|||||||
|
Change in noncontrolling interests
|
—
|
|
—
|
|
—
|
|
—
|
|
(468
|
)
|
—
|
|
—
|
|
(23,305
|
)
|
(23,773
|
)
|
|||||||
|
Accretion of redeemable noncontrolling interests and equity
|
—
|
|
—
|
|
—
|
|
—
|
|
1,130
|
|
—
|
|
—
|
|
—
|
|
1,130
|
|
|||||||
|
Accretion of Series A Preferred Stock
|
—
|
|
—
|
|
—
|
|
—
|
|
(61,974
|
)
|
—
|
|
—
|
|
—
|
|
(61,974
|
)
|
|||||||
|
Gain upon conversion of Series A Preferred Stock
|
—
|
|
—
|
|
—
|
|
—
|
|
74,110
|
|
—
|
|
—
|
|
—
|
|
74,110
|
|
|||||||
|
Reclassification of Series A Preferred Stock upon conversion
|
36,143
|
|
144
|
|
—
|
|
—
|
|
237,957
|
|
—
|
|
—
|
|
—
|
|
238,101
|
|
|||||||
|
Reclassification of redeemable noncontrolling interests and equity
|
—
|
|
—
|
|
—
|
|
—
|
|
—
|
|
—
|
|
—
|
|
(309
|
)
|
(309
|
)
|
|||||||
|
Net income
|
—
|
|
—
|
|
—
|
|
—
|
|
—
|
|
298,499
|
|
—
|
|
315
|
|
298,814
|
|
|||||||
|
Foreign currency translation adjustment, net of tax of $0
|
—
|
|
—
|
|
—
|
|
—
|
|
—
|
|
—
|
|
(166,456
|
)
|
404
|
|
(166,052
|
)
|
|||||||
|
Unrealized gain on derivatives, net of tax of $0
|
—
|
|
—
|
|
—
|
|
—
|
|
—
|
|
—
|
|
11,776
|
|
—
|
|
11,776
|
|
|||||||
|
Minimum pension liability adjustment, net of tax of $0
|
—
|
|
—
|
|
—
|
|
—
|
|
—
|
|
—
|
|
376
|
|
—
|
|
376
|
|
|||||||
|
Balance at September 30, 2018
|
91,654
|
|
$
|
366
|
|
132,387
|
|
$
|
530
|
|
$
|
3,705,707
|
|
$
|
(643,407
|
)
|
$
|
(1,079,860
|
)
|
$
|
(11,669
|
)
|
$
|
1,971,667
|
|
As described in Note
2
,
Significant Accounting Policies
, the change in opening retained earnings from the adoption of accounting standards comprises an increase of approximately
$1,400
from the cumulative impact of adopting Topic 606 and an increase of approximately
$2,900
from the cumulative impact of adopting ASU 2016-16.
32
Accumulated Other Comprehensive Income (Loss)
Accumulated other comprehensive income (AOCI) in our Consolidated Balance Sheets includes the accumulated translation adjustments arising from translation of foreign subsidiaries' financial statements, the unrealized gains on derivatives designated as cash flow hedges, and the accumulated net gains or losses that are not recognized as components of net periodic benefit cost for our minimum pension liability. The components of these balances were as follows:
|
September 30, 2018
|
December 31, 2017
|
||||||||||||||||||
|
Laureate Education, Inc.
|
Noncontrolling Interests
|
Total
|
Laureate Education, Inc.
|
Noncontrolling Interests
|
Total
|
||||||||||||||
|
Foreign currency translation loss
|
$
|
(1,093,677
|
)
|
$
|
371
|
|
$
|
(1,093,306
|
)
|
$
|
(927,221
|
)
|
$
|
(33
|
)
|
$
|
(927,254
|
)
|
|
|
Unrealized gain on derivatives
|
16,433
|
|
—
|
|
16,433
|
|
4,657
|
|
—
|
|
4,657
|
|
|||||||
|
Minimum pension liability adjustment
|
(2,616
|
)
|
—
|
|
(2,616
|
)
|
(2,992
|
)
|
—
|
|
(2,992
|
)
|
|||||||
|
Accumulated other comprehensive loss
|
$
|
(1,079,860
|
)
|
$
|
371
|
|
$
|
(1,079,489
|
)
|
$
|
(925,556
|
)
|
$
|
(33
|
)
|
$
|
(925,589
|
)
|
|
Note
14
.
Derivative Instruments
In the normal course of business, our operations are exposed to fluctuations in foreign currency values and interest rate changes. We may seek to control a portion of these risks through a risk management program that includes the use of derivative instruments.
The interest and principal payments for Laureate’s senior long-term debt arrangements are to be paid primarily in USD. Our ability to make debt payments is subject to fluctuations in the value of the USD against foreign currencies, since a majority of our operating cash used to make these payments is generated by subsidiaries with functional currencies other than USD. As part of our overall risk management policies, Laureate has at times entered into foreign currency swap contracts and floating-to-fixed interest rate swap contracts. In addition, we occasionally enter into foreign exchange forward contracts to reduce the impact of other non-functional currency-denominated receivables and payables.
We do not enter into speculative or leveraged transactions, nor do we hold or issue derivatives for trading purposes. We generally intend to hold our derivatives until maturity.
Laureate reports all derivatives at fair value. These contracts are recognized as either assets or liabilities, depending upon the derivative’s fair value. Gains or losses associated with the change in the fair value of these swaps are recognized in our Consolidated Statements of Operations on a current basis over the term of the contracts, unless designated and effective as a hedge. For swaps that are designated and effective as cash flow hedges, gains or losses associated with the change in fair value of the swaps are recognized in our Consolidated Balance Sheets as a component of AOCI and amortized into earnings as a component of Interest expense over the term of the related hedged items. Upon early termination of an effective interest rate swap designated as a cash flow hedge, unrealized gains or losses are deferred in our Consolidated Balance Sheets as a component of AOCI and are amortized as an adjustment to Interest expense over the period during which the hedged forecasted transaction affects earnings. For derivatives that are both designated and effective as net investment hedges, gains or losses associated with the change in fair value of the derivatives are recognized on our Consolidated Balance Sheets as a component of AOCI.
33
The reported fair values of our derivatives, which are classified in Derivative instruments on our Consolidated Balance Sheets, were as follows:
|
September 30, 2018
|
December 31, 2017
|
||||||
|
Derivatives designated as hedging instruments:
|
|||||||
|
Long-term assets:
|
|||||||
|
Interest rate swaps
|
$
|
—
|
|
$
|
6,046
|
|
|
|
Net investment cross currency swaps
|
682
|
|
—
|
|
|||
|
Long-term liabilities:
|
|||||||
|
Net investment cross currency swaps
|
—
|
|
1,451
|
|
|||
|
Derivatives not designated as hedging instruments:
|
|||||||
|
Long-term assets:
|
|||||||
|
Contingent redemption features - Series A Preferred Stock
|
—
|
|
42,140
|
|
|||
|
Current liabilities:
|
|||||||
|
Interest rate swaps
|
35
|
|
179
|
|
|||
|
Cross currency and interest rate swaps
|
—
|
|
4,279
|
|
|||
|
Long-term liabilities:
|
|||||||
|
Cross currency and interest rate swaps
|
7,258
|
|
7,939
|
|
|||
|
Total derivative instrument assets
|
$
|
682
|
|
$
|
48,186
|
|
|
|
Total derivative instrument liabilities
|
$
|
7,293
|
|
$
|
13,848
|
|
|
Derivatives Designated as Hedging Instruments
Cash Flow Hedge -
2024 Term Loan Interest Rate Swaps
In May 2017, Laureate entered into, and designated as cash flow hedges,
four
pay-fixed, receive-floating amortizing interest rate swaps with notional amounts of
$100,000
,
$100,000
,
$200,000
and
$300,000
, respectively. These notional amounts match the corresponding principal of the 2024 Term Loan borrowings of which these swaps are effectively hedging the interest payments. As such, the notional values amortize annually based on the terms of the agreements to match the principal borrowings as they are repaid. These swaps effectively fix the floating interest rate on the term loan to reduce exposure to variability in cash flows attributable to changes in the USD-LIBOR-BBA swap rate. All
four
swaps had an effective date of May 31, 2017 and would have matured on May 31, 2022; however, on August 21, 2018 Laureate fully settled these swaps. The cash received at settlement from the swap counterparties was
$14,117
. The decrease of
$1,172
from the derivative asset's recorded fair value at June 30, 2018 and the fair value at settlement was also deferred into AOCI and will be ratably reclassified into income through Interest expense over the remaining maturity period of the 2024 Term Loans. Prior to settlement of the swaps, they were determined to be
100%
effective; therefore, the amount of gain or loss recognized in income on the ineffective portion was
$0
. During the next 12 months, approximately
$5,209
is expected to be reclassified from AOCI into income. The unamortized balance at September 30, 2018 is
$13,352
. As of
December 31, 2017
, these swaps had an estimated fair value of
$6,046
which was recorded in
Derivative instruments
as a long-term asset.
34
Net Investment Hedge - Cross Currency Swaps
In December 2017, Laureate entered into
two
EUR-USD cross currency swaps (net investment hedges) to hedge the foreign currency exchange volatility on operations of our Euro functional currency subsidiaries and better match our cash flows with the currencies in which our debt obligations are denominated. Both swaps have an effective date of December 22, 2017 and a maturity date of November 2, 2020, and were designated at inception as effective net investment hedges. At maturity on the first swap Laureate will deliver the notional amount of EUR
50,000
and receive USD
$59,210
at an implied exchange rate of
1.1842
. At maturity on the second swap Laureate will deliver the notional amount of EUR
50,000
and receive USD
$59,360
at an implied exchange rate of
1.1872
. Semiannually until maturity, Laureate is obligated to pay
5.63%
and receive
8.25%
on EUR
50,000
and USD
$59,210
, respectively, on the first swap and pay
5.6675%
and receive
8.25%
on EUR
50,000
and USD
$59,360
, respectively, on the second swap. The swaps are determined to be
100%
effective; therefore, the amount of gain or loss recognized in income on the ineffective portion of derivative instruments designated as hedging instruments was
$0
. As of
September 30, 2018
and
December 31, 2017
, these swaps had an estimated fair value of
$682
and
$1,451
, respectively, which was recorded in Derivative Instruments as a long-term asset at
September 30, 2018
and a long-term liability at
December 31, 2017
.
The table below shows the total recorded unrealized (loss) gain in Comprehensive income for the derivatives designated as hedging instruments. The impact of these derivative instruments on Comprehensive income, Interest expense and AOCI were as follows:
For the three months ended September 30:
|
(Loss) Gain Recognized in Comprehensive Income (Effective Portion)
|
Income Statement Location
|
Gain (Loss) Reclassified
from AOCI to Income (Effective Portion) |
|||||||||||||||
|
2018
|
2017
|
2018
|
2017
|
||||||||||||||
|
Interest rate swaps
|
$
|
(1,938
|
)
|
$
|
525
|
|
Interest expense
|
$
|
950
|
|
$
|
(972
|
)
|
||||
|
Net investment cross currency swaps
|
1,378
|
|
—
|
|
N/A
|
—
|
|
—
|
|
||||||||
|
Total
|
$
|
(560
|
)
|
$
|
525
|
|
|
$
|
950
|
|
$
|
(972
|
)
|
||||
For the nine months ended September 30:
|
Gain Recognized in Comprehensive Income
(Effective Portion) |
Income Statement Location
|
Gain (Loss) Reclassified
from AOCI to Income (Effective Portion) |
|||||||||||||||
|
2018
|
2017
|
2018
|
2017
|
||||||||||||||
|
Interest rate swaps
|
$
|
7,307
|
|
$
|
6,625
|
|
Interest expense
|
$
|
912
|
|
$
|
(6,705
|
)
|
||||
|
Net investment cross currency swaps
|
4,469
|
|
—
|
|
N/A
|
—
|
|
—
|
|
||||||||
|
Total
|
$
|
11,776
|
|
$
|
6,625
|
|
$
|
912
|
|
$
|
(6,705
|
)
|
|||||
Derivatives Not Designated as Hedging Instruments
Derivatives related to Series A Preferred Stock Offering
The Company identified several embedded derivatives associated with the issuance of the Series A Preferred Stock as discussed in Note
10
,
Commitments and Contingencies
. The embedded derivatives were related to certain contingent redemption features of the Series A Preferred Stock. As of
December 31, 2017
, the total estimated fair value of these derivatives was
$42,140
, which was recorded in
Derivative instruments
as a long-term asset on the Consolidated Balance Sheet. These derivatives were not designated as hedges for accounting purposes thus the changes in estimated fair value were recognized as a component of earnings. As discussed in Note
10
,
Commitments and Contingencies
, the Series A Preferred Stock was converted into Class A common stock on
April 23, 2018
. The estimated fair value of these derivatives at the conversion date was approximately
$140,300
; accordingly, the derivative assets were recorded at their estimated fair values through a corresponding gain on derivatives, a component of non-operating income. The increase in the fair value of the derivatives can be attributed to the use of the Monte Carlo Simulation Method to value the derivatives prior to the
April 23, 2018
conversion date, when the probability of conversion increased to
100%
and the valuation inputs became definitive. In connection with the conversion of the Series A Preferred Stock into Class A common stock, the carrying value of the derivative assets was reclassified into equity in April 2018.
35
THINK Interest Rate Swaps
Laureate acquired THINK on December 20, 2013, and financed a portion of the purchase price by borrowing AUD
45,000
(US
$32,724
at
September 30, 2018
) under a syndicated facility agreement in the form of
two
term loans of AUD
22,500
each. The terms of the syndicated facility agreement required THINK to enter into an interest rate swap within
45
days from the agreement's December 20, 2013 effective date, in order to convert at least
50%
of the AUD
45,000
of term loan debt from a variable interest rate based on the BBSY bid rate, an Australia bank rate, to a fixed interest rate. Accordingly, on January 31, 2014, THINK executed an interest rate swap agreement with an original notional amount of AUD
22,500
to satisfy this requirement and converted AUD
22,500
(US
$16,362
at
September 30, 2018
) of the variable rate component of the term loan debt to a fixed interest rate of
3.86%
. The notional amount of the swap decreases quarterly based on the terms of the agreement, and the swap matures on December 20, 2018. This interest rate swap was not designated as a hedge for accounting purposes, and had an estimated fair value of
$35
and
$179
at
September 30, 2018
and
December 31, 2017
, respectively, which was recorded in Derivative instruments as a current liability.
EUR to USD Foreign Currency Swaps
In December 2017, the Company entered into a total of
six
EUR to USD forward exchange swap agreements in connection with the sale of EUC and Laureate Italy, as discussed in Note
5
,
Dispositions
. The purpose of the swaps was to mitigate the risk of foreign currency exposure on the sale proceeds. The swaps had an aggregate notional amount of EUR
200,000
and matured on January 16, 2018, resulting in a total realized loss on derivatives of
$9,960
. The swaps were not designated as hedges for accounting purposes.
CLP to Unidad de Fomento (UF) Cross Currency and Interest Rate Swaps
The cross currency and interest rate swap agreements are intended to provide a better correlation between our debt obligations and operating currencies. In 2010, one of our subsidiaries in Chile entered into
four
cross currency and interest rate swap agreements.
One
of the swaps matures on December 1, 2024, and the remaining
three
mature on July 1, 2025 (the CLP to UF cross currency and interest rate swaps). The UF is a Chilean inflation-adjusted unit of account. The
four
swaps have an aggregate notional amount of approximately
$31,000
, and convert CLP-denominated, floating-rate debt to fixed-rate UF-denominated debt. The CLP to UF cross currency and interest rate swaps were not designated as hedges for accounting purposes. As of
September 30, 2018
and
December 31, 2017
, these swaps had an estimated fair value of
$7,258
and
$7,939
, respectively, which was recorded in
Derivative instruments
as a long-term liability.
Components of the reported (Loss) gain on derivatives not designated as hedging instruments in the Consolidated Statements of Operations were as follows:
|
For the three months ended September 30,
|
For the nine months ended September 30,
|
||||||||||||||
|
|
2018
|
2017
|
2018
|
2017
|
|||||||||||
|
Unrealized Gain (Loss)
|
|||||||||||||||
|
Contingent redemption features - Series A Preferred Stock
|
$
|
—
|
|
$
|
(19,974
|
)
|
$
|
(42,140
|
)
|
$
|
19,468
|
|
|||
|
Cross currency and interest rate swaps
|
33
|
|
151
|
|
4,391
|
|
24
|
|
|||||||
|
Interest rate swaps
|
36
|
|
58
|
|
138
|
|
129
|
|
|||||||
|
69
|
|
(19,765
|
)
|
(37,611
|
)
|
19,621
|
|
||||||||
|
Realized (Loss) Gain
|
|||||||||||||||
|
Contingent redemption features - Series A Preferred Stock
|
—
|
|
—
|
|
140,320
|
|
—
|
|
|||||||
|
Cross currency and interest rate swaps
|
(213
|
)
|
(165
|
)
|
(10,597
|
)
|
(434
|
)
|
|||||||
|
(213
|
)
|
(165
|
)
|
129,723
|
|
(434
|
)
|
||||||||
|
Total (Loss) Gain
|
|||||||||||||||
|
Contingent redemption features - Series A Preferred Stock
|
—
|
|
(19,974
|
)
|
98,180
|
|
19,468
|
|
|||||||
|
Cross currency and interest rate swaps
|
(180
|
)
|
(14
|
)
|
(6,206
|
)
|
(410
|
)
|
|||||||
|
Interest rate swaps
|
36
|
|
58
|
|
138
|
|
129
|
|
|||||||
|
(Loss) Gain on derivatives, net
|
$
|
(144
|
)
|
$
|
(19,930
|
)
|
$
|
92,112
|
|
$
|
19,187
|
|
|||
36
Credit Risk and Credit-Risk-Related Contingent Features
Laureate’s derivatives expose us to credit risk to the extent that the counterparty may possibly fail to perform its contractual obligation. The amount of our credit risk exposure is equal to the fair value of the derivative when any of the derivatives are in a net gain position. As of
September 30, 2018
and
December 31, 2017
, the estimated fair values of derivatives in a gain position were
$682
and
$48,186
, respectively; however, the
December 31, 2017
carrying value relates primarily to the redemption rights of the holders of the Series A Preferred Stock, which did not expose us to credit risk. Our counterparty credit risk is currently limited to the net investment hedges, with an aggregate fair value in a gain position of
$682
as of
September 30, 2018
.
Laureate has limited its credit risk by only entering into derivative transactions with highly rated major financial institutions. We have not entered into collateral agreements with our derivatives' counterparties. At
September 30, 2018
,
one
institution was rated Aa3,
one
institution was rated A1,
one
institution was rated A2 and
one
institution was rated A3 by the global rating agency of Moody's Investors Service. These financial institutions accounted for all of Laureate's derivative credit risk exposure.
Laureate's agreements with its derivative counterparties contain a provision under which we could be declared in default on our derivative obligations if repayment of the underlying indebtedness is accelerated by the lender due to a default on the indebtedness. As of
September 30, 2018
and
December 31, 2017
, we had not breached any default provisions and had not posted any collateral related to these agreements. If we had breached any of these provisions, we could have been required to settle the obligations under the derivative agreements for an amount that we believe would approximate their estimated fair value of
$7,293
as of
September 30, 2018
and
$13,848
as of
December 31, 2017
.
Note
15
.
Income Taxes
Laureate uses the liability method to account for income taxes. Deferred income taxes reflect the net tax effects of temporary differences between the carrying amount of assets and liabilities for financial reporting purposes and the amounts used for income tax purposes. For interim purposes, we also apply ASC 740-270, "Income Taxes - Interim Reporting."
Laureate's income tax provisions for all periods consist of federal, state and foreign income taxes. The tax provisions for the
nine months ended September 30, 2018
and
2017
were based on estimated full-year effective tax rates, after giving effect to significant items related specifically to the interim periods, including the mix of income for the period between higher-taxed and lower-taxed jurisdictions. Laureate has operations in multiple countries at various statutory tax rates or which are tax-exempt entities, and other operations that are loss-making entities for which it is not more likely than not that a tax benefit will be realized on the loss.
The Tax Cuts & Jobs Act (TCJA)
TCJA was enacted in December 2017. Among other things, the TCJA reduces the U.S. federal corporate tax rate from 35% to 21% beginning in 2018, requires companies to pay a one-time transition tax on previously unremitted earnings of non-U.S. subsidiaries that were previously tax deferred and creates new taxes on certain foreign-sourced earnings. The SEC staff issued Staff Accounting Bulletin (SAB) 118, which provides guidance on accounting for enactment effects of the TCJA. SAB 118 provides a measurement period of up to one year from the TCJA’s enactment date for companies to complete their accounting under ASC 740. In accordance with SAB 118, to the extent that a company’s accounting for certain income tax effects of the TCJA is incomplete but it is able to determine a reasonable estimate, it must record a provisional estimate in its financial statements. If a company cannot determine a provisional estimate to be included in its financial statements, it should continue to apply ASC 740 on the basis of the provisions of the tax laws that were in effect immediately before the enactment of the TCJA.
Transition Tax
The transition tax is a tax on previously untaxed accumulated and current earnings and profits (E&P) of certain of the Company’s non-U.S. subsidiaries. To determine the amount of the transition tax, Laureate must determine, in addition to other factors, the amount of post-1986 E&P of the relevant subsidiaries, as well as the amount of non-U.S. income taxes paid on such earnings. Further, the transition tax is based in part on the amount of those earnings held in cash and other specified assets. Laureate was able to make a reasonable estimate of the transition tax and recorded a provisional obligation resulting in additional tax expense of
$149,800
in the fourth quarter of 2017. However, Laureate was able to offset this liability with 2017 losses and, under alternative minimum tax, up to
90%
of the remaining liability, with existing net operating losses, resulting in a net liability of
$3,200
. Additionally, the TCJA repeals the corporate alternative minimum tax prospectively. Thus, Laureate recorded a deferred tax asset for an amount equal to the payable under the alternative minimum tax, resulting in no net income tax expense related to the transition tax. The Company is continuing to gather additional information and will consider additional technical guidance to more precisely compute and account for the amount of the transition tax. This amount may change when Laureate finalizes the calculation
37
of post-1986 foreign E&P previously deferred from U.S. federal taxation and finalizes the amounts held in cash or other specified assets.
Remeasurement of Deferred Tax Assets/Liabilities
Laureate remeasured certain deferred tax assets and liabilities based on the rates at which they are expected to reverse, which is generally 21% under the TCJA and recorded a tax benefit in the amount of
$66,900
. Additionally, Laureate recorded a tax benefit related to the valuation allowance release, net of rate adjustment, on the deferred tax assets other than NOLs that, when realized, will become indefinite-lived NOLs in the amount of
$70,700
. During the nine months ended
September 30, 2018
, the company recorded an additional benefit of
$400
related to release of valuation allowance for state conformity. Laureate is still analyzing certain aspects of the TCJA, including state conformity, considering additional technical guidance, and refining its calculations, which could potentially affect the measurement of these balances or potentially give rise to new deferred tax amounts.
Permanent Reinvestment
Laureate also is considering other impacts of the 2017 enactment of the TCJA including, but not limited to, effects on the Company’s indefinite-reinvestment assertion. Laureate previously has not provided deferred taxes on unremitted earnings attributable to international companies that have been considered to be reinvested indefinitely. Laureate is still analyzing the full effects of the TCJA, which may cause some reassessment of previous indefinite-reinvestment assertions with respect to certain jurisdictions.
Global Low-Taxed Income (GILTI)
Laureate is considering the potential impacts of the GILTI provision within the TCJA on deferred tax assets/liabilities. During the third quarter of 2018, the Company estimated the GILTI provision based on guidance and data available at that time. Currently, Laureate has not yet elected a policy as to whether it will recognize deferred taxes for basis differences expected to reverse as GILTI or whether Laureate will account for GILTI as period costs if and when incurred. Laureate is not aware of other elements of the TCJA for which the Company was not yet able to make reasonable estimates of the enactment impact and for which it would continue accounting for them in accordance with ASC 740 on the basis of the tax laws in effect before the TCJA.
ICE Audit
As previously disclosed in our 2017 Form 10-K, during 2010 and 2013, Laureate was notified by the Spain Tax Authorities (STA) that
two
tax audits of our Spanish subsidiaries were being initiated for 2006 through 2007, and for 2008 through 2010, respectively. On June 29, 2012, the STA issued a final assessment to Iniciativas Culturales de España, S.L. (ICE), our Spanish holding company, for EUR
11,051
(
$13,000
at
September 30, 2018
), including interest, for the 2006 through 2007 period. Laureate has appealed this final assessment related to the 2006 through 2007 period and issued a cash-collateralized letter of credit in July 2012, in order to continue the appeal process. In October 2015, the STA issued a final assessment to ICE for the 2008 through 2010 period for approximately EUR
17,187
(approximately US
$20,200
at
September 30, 2018
), including interest, for those three years. In order to continue the appeals process, we issued cash-collateralized letters of credit for the 2008 to 2010 period assessment amount, plus interest and surcharges. As of December 31, 2017, we had issued total cash-collateralized letters of credit for the ICE tax audit matters of EUR
33,282
(US
$39,505
at December 31, 2017), as also described in Note
10
,
Commitments and Contingencies
.
During the quarter ended June 30, 2015, the Company reassessed its position regarding the ICE tax audit matters as a result of recent adverse decisions from the Spanish Supreme Court and the Spanish National Court on cases for taxpayers with similar facts and determined that it could no longer support a more-likely-than-not position. As a result, during 2015, the Company recorded a provision totaling EUR
37,610
(approximately US
$42,100
). The Company plans to continue the appeals process for the periods already audited and assessed. During the second quarter of 2016, we were notified by the STA that tax audits of the Spanish subsidiaries were also being initiated for 2011 and 2012, and in July 2017 the tax audit was extended to include 2013. In October of 2018, the STA issued a final assessment to ICE for the 2011 through 2013 period totaling EUR
4,066
(approximately US
$4,800
at
September 30, 2018
), including interest. Also, during the second quarter of 2016, the Regional Administrative Court issued a decision against the Company on its appeal. The Company has further appealed at the Highest Administrative Court level, which appeal was rejected on January 23, 2018. The Company has appealed both decisions to the National Court. In the first quarter of 2018, the Company made payments to the STA totaling approximately EUR
29,600
(approximately US
$34,800
at
September 30, 2018
) in order to reduce the amount of future interest that could be incurred as the appeals process continues. The payments were made using the restricted cash that had collateralized the letters of credit discussed above and reduced the liability that had been recorded for this income tax contingency.
38
Note
16
.
Earnings (Loss) Per Share
On January 31, 2017 our common stock was reclassified into shares of Class B common stock and, on
February 6, 2017
, we completed our IPO of Class A common stock. Other than voting rights, the Class B common stock has the same rights as the Class A common stock and therefore both are treated as the same class of stock for purposes of the earnings per share calculation. Laureate computes basic earnings per share (EPS) by dividing income available to common shareholders by the weighted average number of common shares outstanding for the reporting period. Diluted EPS reflects the potential dilution that would occur if share-based compensation awards, contingently issuable shares, or convertible securities were exercised or converted into common stock. To calculate the diluted EPS, the basic weighted average number of shares is increased by the dilutive effect of stock options, restricted stock, restricted stock units, and contingently issuable shares determined using the treasury stock method, and convertible securities using the if-converted method.
The following tables summarize the computations of basic and diluted earnings per share:
|
For the three months ended September 30,
|
2018
|
2017
|
|||||
|
Numerator used in basic and diluted earnings (loss) per common share for continuing operations:
|
|||||||
|
Loss from continuing operations
|
$
|
(43,792
|
)
|
$
|
(67,181
|
)
|
|
|
Net loss attributable to noncontrolling interests
|
2,037
|
|
3,943
|
|
|||
|
Loss from continuing operations attributable to Laureate Education, Inc.
|
(41,755
|
)
|
(63,238
|
)
|
|||
|
Accretion of redemption value of redeemable noncontrolling interests and equity
|
324
|
|
(105
|
)
|
|||
|
Accretion of Series A Preferred Stock
|
—
|
|
(83,955
|
)
|
|||
|
Subtotal: accretion of Series A Preferred Stock and other redeemable noncontrolling interests and equity
|
324
|
|
(84,060
|
)
|
|||
|
Net loss from continuing operations available to common stockholders for basic and diluted earnings per share
|
$
|
(41,431
|
)
|
$
|
(147,298
|
)
|
|
|
Numerator used in basic and diluted earnings (loss) per common share for discontinued operations:
|
|
|
|
||||
|
Loss from discontinued operations, net of tax
|
$
|
(34,466
|
)
|
$
|
(36,309
|
)
|
|
|
Loss on sales of discontinued operations, net of tax
|
(18,426
|
)
|
—
|
|
|||
|
(Income) loss attributable to noncontrolling interests
|
(142
|
)
|
1,588
|
|
|||
|
Net loss from discontinued operations for basic and diluted earnings per share
|
$
|
(53,034
|
)
|
|
$
|
(34,721
|
)
|
|
Denominator used in basic and diluted earnings (loss) per common share:
|
|||||||
|
Basic and diluted weighted average shares outstanding
|
224,037
|
|
178,871
|
|
|||
|
Basic and diluted loss per share:
|
|||||||
|
Loss from continuing operations
|
$
|
(0.18
|
)
|
$
|
(0.82
|
)
|
|
|
Loss from discontinued operations
|
(0.24
|
)
|
(0.20
|
)
|
|||
|
Basic and diluted loss per share
|
$
|
(0.42
|
)
|
$
|
(1.02
|
)
|
|
39
|
For the nine months ended September 30,
|
2018
|
2017
|
|||||
|
Numerator used in basic and diluted earnings (loss) per common share for continuing operations:
|
|||||||
|
Loss from continuing operations
|
$
|
(35,549
|
)
|
$
|
(150,792
|
)
|
|
|
Net loss attributable to noncontrolling interests
|
892
|
|
2,652
|
|
|||
|
Loss from continuing operations attributable to Laureate Education, Inc.
|
(34,657
|
)
|
(148,140
|
)
|
|||
|
Accretion of redemption value of redeemable noncontrolling interests and equity
|
1,130
|
|
(635
|
)
|
|||
|
Adjusted for: accretion related to noncontrolling interests and equity redeemable at fair value
|
(559
|
)
|
(6,357
|
)
|
|||
|
Accretion of Series A Preferred Stock
|
(61,974
|
)
|
(185,149
|
)
|
|||
|
Gain upon conversion of Series A Preferred Stock
|
74,110
|
|
—
|
|
|||
|
Subtotal: accretion of Series A Preferred Stock, net and other redeemable noncontrolling interests and equity
|
12,707
|
|
(192,141
|
)
|
|||
|
Net income (loss) available to common stockholders for basic earnings per share
|
(21,950
|
)
|
(340,281
|
)
|
|||
|
Adjusted for: accretion of Series A Preferred Stock
|
61,974
|
|
—
|
|
|||
|
Adjusted for: gain upon conversion of Series A Preferred Stock
|
(74,110
|
)
|
—
|
|
|||
|
Net loss from continuing operations available to common stockholders for diluted earnings per share
|
$
|
(34,086
|
)
|
$
|
(340,281
|
)
|
|
|
Numerator used in basic and diluted earnings (loss) per common share for discontinued operations:
|
|||||||
|
(Loss) income from discontinued operations, net of tax
|
$
|
22,459
|
|
$
|
44,047
|
|
|
|
Gain on sale of discontinued operations, net of tax
|
311,904
|
|
—
|
|
|||
|
Income attributable to noncontrolling interests
|
(1,207
|
)
|
(287
|
)
|
|||
|
Net income from discontinued operations for basic and diluted earnings per share
|
$
|
333,156
|
|
$
|
43,760
|
|
|
|
Denominator used in basic and diluted earnings (loss) per common share:
|
|||||||
|
Basic and diluted weighted average shares outstanding
|
209,129
|
|
167,261
|
|
|||
|
Basic earnings (loss) per share:
|
|||||||
|
Income (loss) from continuing operations
|
$
|
(0.10
|
)
|
$
|
(2.03
|
)
|
|
|
Income from discontinued operations
|
1.59
|
|
0.26
|
|
|||
|
Basic earnings (loss) per share
|
$
|
1.49
|
|
$
|
(1.77
|
)
|
|
|
Diluted earnings (loss) per share:
|
|||||||
|
Loss from continuing operations
|
$
|
(0.16
|
)
|
$
|
(2.03
|
)
|
|
|
Income from discontinued operations
|
1.59
|
|
0.26
|
|
|||
|
Diluted earnings (loss) per share
|
$
|
1.43
|
|
$
|
(1.77
|
)
|
|
40
The shares of Class A common stock that were issuable upon completion of the conversion of the Series A Preferred Stock were not included in the calculation of diluted EPS, as the effect would have been antidilutive. In the calculation of diluted EPS for 2018, the conversion of the Series A Preferred Stock, which occurred on April 23, 2018, was assumed to have occurred as of the beginning of the period; accordingly, the effects of the accretion and the gain upon conversion of the Series A Preferred Stock were removed from net income available to common stockholders for diluted earnings per share. The following table summarizes the number of stock options, shares of restricted stock and restricted stock units (RSUs) that were excluded from the diluted EPS calculations because the effect would have been antidilutive:
|
For the three months ended September 30,
|
For the nine months ended September 30,
|
||||||||||
|
2018
|
2017
|
2018
|
2017
|
||||||||
|
Stock options
|
9,328
|
|
13,443
|
|
9,628
|
|
12,957
|
|
|||
|
Restricted stock and RSUs
|
931
|
|
843
|
|
1,034
|
|
730
|
|
|||
Note
17
.
Related Party Transactions
Corporate
Transactions between Laureate and Affiliates of Wengen Alberta, Limited Partnership (Wengen)
As part of the issuance and sale of shares of the Company’s Series A Preferred Stock in December 2016, KKR and Snow Phipps, affiliates of Wengen, our controlling stockholder, purchased from the Company
60
and
15
shares of Series A Preferred Stock, respectively. During the
nine months ended September 30, 2018
, the Company paid cash dividends on the Series A Preferred Stock totaling
$11,103
, of which
$1,822
was paid to KKR and Snow Phipps. As discussed in Note
10
,
Commitments and Contingencies
, all shares of Series A Preferred Stock were converted to Class A common stock on
April 23, 2018
.
Note
18
.
Legal and Regulatory Matters
Laureate is subject to legal proceedings arising in the ordinary course of business. In management's opinion, we have adequate legal defenses, insurance coverage, and/or accrued liabilities with respect to the eventuality of these actions. Management believes that any settlement would not have a material impact on Laureate's financial position, results of operations, or cash flows. For further description, see our 2017 Form 10-K and our Quarterly Reports on Form 10-Q for the quarters ended March 31, 2018 and June 30, 2018.
Update on Turkey Regulatory Matters
The Company previously disclosed in its 2017 Form 10-K that, on April 18, 2017, Istanbul Bilgi University (Bilgi) received from the Turkish Higher Education Council (the YÖK) the results of its 2015-2016 annual audit (the 2015-2016 Annual Audit) and that the Company was appealing the result of that audit. The YÖK also conducted a supplemental audit of the 2015-2016 academic year (the 2015-2016 Supplemental Audit) and the annual audit of the 2016-2017 academic year (the 2016-2017 Annual Audit). On April 6, 2018, Bilgi received the results of the 2015-2016 Supplemental Audit and the 2016-2017 Annual Audit by resolutions of the YÖK which, among other things, approved a portion of the payments previously made by Bilgi to a subsidiary of the Company for management, operational and student services and intellectual property and disallowed and required reimbursement of a portion of such payments. In order to comply with the resolutions of the YÖK and avoid sanctions, Bilgi has complied with those resolutions and the Company has reimbursed to Bilgi the disallowed payments; however, it has appealed the YÖK’s decision on the 2015-2016 Annual Audit in the Turkish court system, as well as the YÖK’s decisions pursuant to the 2015-2016 Supplemental Audit and the 2016-2017 Annual Audit. The YÖK is currently conducting its 2017-2018 annual audit (the 2017-2018 Annual Audit) of Bilgi. As part of the 2017-2018 Annual Audit, Bilgi has received inquiries from the YÖK requesting clarifications regarding certain academic and financial matters. Bilgi is preparing responses to the YÖK.
In May 2018, an amendment to Turkey's higher education law was passed
, which could affect certain transactions of Turkish universities that are deemed to be related party transactions. In order for it to be implemented, the amendment requires the Turkish government to issue final directives, which have not yet been issued. These directives are expected to be of significant importance in determining whether the amendment will have an impact on our operations. Once the final directives are received, the Company will evaluate whether this amendment to the higher education law has an effect on our operations, including the existing contractual relationships that the Company maintains with Bilgi, our institution in Turkey. At this time, we cannot predict the impact, if any,
41
of this amendment to our business, financial condition, results of operations or cash flows.
Bilgi is one of the subsidiaries that the Company plans to divest; accordingly, it is included in Discontinued Operations for all periods presented.
Note
19
.
Fair Value Measurement
Fair value is defined as the price that would be received to sell an asset or paid to settle a liability in an orderly transaction between market participants at the measurement date. Accounting standards utilize a fair value hierarchy that prioritizes the inputs to valuation techniques used to measure fair value into three levels, which are described below:
|
•
|
Level 1 – Quoted prices (unadjusted) for identical assets or liabilities in active markets;
|
|
•
|
Level 2 – Observable inputs other than quoted prices that are either directly or indirectly observable for the asset or liability;
|
|
•
|
Level 3 – Unobservable inputs that are supported by little or no market activity.
|
These levels are not necessarily an indication of the risk of liquidity associated with the financial assets or liabilities disclosed. Assets and liabilities are classified in their entirety based on the lowest level of input that is significant to the fair value measurement, as required under ASC 820-10, "Fair Value Measurement."
Derivative instruments
Laureate uses derivative instruments as economic hedges for bank debt, foreign exchange fluctuations and interest rate risk. Their values are derived using valuation models commonly used for derivatives. These valuation models require a variety of inputs, including contractual terms, market prices, forward-price yield curves, notional quantities, measures of volatility and correlations of such inputs. Our valuation models also reflect measurements for credit risk. Laureate concluded that the fair values of our derivatives are based on unobservable inputs, or Level 3 assumptions. The significant unobservable input used in the fair value measurement of the Company's derivative instruments is our own credit risk. Holding other inputs constant, a significant increase (decrease) in our own credit risk would result in a significantly lower (higher) fair value measurement for the Company's derivative instruments.
Laureate’s financial assets and liabilities that are measured at fair value on a recurring basis as of
September 30, 2018
were as follows:
|
Total
|
Level 1
|
Level 2
|
Level 3
|
||||||||||||
|
Assets
|
|||||||||||||||
|
Derivative instruments
|
$
|
682
|
|
$
|
—
|
|
$
|
—
|
|
$
|
682
|
|
|||
|
Liabilities
|
|||||||||||||||
|
Derivative instruments
|
$
|
7,293
|
|
$
|
—
|
|
$
|
—
|
|
$
|
7,293
|
|
|||
Laureate’s financial assets and liabilities that are measured at fair value on a recurring basis as of
December 31, 2017
were as follows:
|
Total
|
Level 1
|
Level 2
|
Level 3
|
||||||||||||
|
Assets
|
|||||||||||||||
|
Derivative instruments
|
$
|
48,186
|
|
$
|
—
|
|
$
|
—
|
|
$
|
48,186
|
|
|||
|
Liabilities
|
|||||||||||||||
|
Derivative instruments
|
$
|
13,848
|
|
$
|
—
|
|
$
|
—
|
|
$
|
13,848
|
|
|||
42
The changes in our Level 3 Derivative instruments measured at fair value on a recurring basis for the
nine months ended September 30, 2018
were as follows:
|
Balance at December 31, 2017
|
$
|
34,338
|
|
|
(Loss) Gain included in earnings:
|
|||
|
Unrealized losses, net
|
(37,611
|
)
|
|
|
Realized gains, net
|
129,723
|
|
|
|
Included in other comprehensive income
|
11,776
|
|
|
|
Settlements
|
(3,520
|
)
|
|
|
Reclassification upon conversion of Series A Preferred Stock
|
(140,320
|
)
|
|
|
Currency translation adjustment and other
|
(997
|
)
|
|
|
Balance at September 30, 2018
|
$
|
(6,611
|
)
|
|
Unrealized loss, net, relating to derivatives held at September 30, 2018
|
$
|
(37,611
|
)
|
The following table presents quantitative information regarding the significant unobservable inputs utilized in the fair value measurements of the Company's assets/(liabilities) classified as Level 3 as of
September 30, 2018
:
|
Fair Value at September 30, 2018
|
Valuation Technique
|
Unobservable Input
|
Range/Input Value
|
|||||||
|
Derivative instruments - cross currency and interest rate swaps
|
$
|
(6,611
|
)
|
Discounted Cash Flow
|
Credit Risk
|
3.39
|
%
|
|||
Note
20
.
Supplemental Cash Flow Information
Reconciliation of Cash and cash equivalents and Restricted cash
The following table provides a reconciliation of cash, cash equivalents and restricted cash reported within the Consolidated Balance Sheets, as well as the
September 30, 2017
balance. The
September 30, 2018
and
September 30, 2017
balances sum to the amounts shown in the Consolidated Statements of Cash Flows for the
nine months ended September 30, 2018
and
2017
:
|
|
September 30, 2018
|
September 30, 2017
|
December 31, 2017
|
|||||||
|
Cash and cash equivalents
|
$
|
392,348
|
|
$
|
299,010
|
|
$
|
320,567
|
|
|
|
Restricted cash
|
196,790
|
|
187,260
|
|
212,215
|
|
||||
|
Total Cash and cash equivalents and Restricted cash shown in the Consolidated Statements of Cash Flows
|
$
|
589,138
|
|
$
|
486,270
|
|
$
|
532,782
|
|
|
Restricted cash includes cash equivalents held to collateralize standby letters of credit in favor of the DOE. In addition, Laureate may at times have restricted cash in escrow pending potential acquisition transactions, hold a United States deposit for a letter of credit in lieu of a surety bond, or otherwise have cash that is not immediately available for use in current operations. See also Note
10
,
Commitments and Contingencies
.
Note
21
.
Subsequent Events
Peru Acquisition
On October 5, 2018, Laureate Education Peru, SRL, an indirect wholly owned subsidiary of the Company, signed a sale purchase agreement to acquire all of the capital stock of Instituto de Educación Superior Tecnológico Privado Red Avansys SAC (Avansys), an institution in Peru, for a purchase price of
60,150
Peruvian Nuevo Sols, plus closing costs (approximately
$18,500
at
September 30, 2018
).
The sale closed on November 5, 2018
.
43
Forward-Looking Statements
This Quarterly Report on Form 10-Q contains ‘‘forward-looking statements’’ within the meaning of the federal securities laws, which involve risks and uncertainties. You can identify forward-looking statements because they contain words such as ‘‘believes,’’ ‘‘expects,’’ ‘‘may,’’ ‘‘will,’’ ‘‘should,’’ ‘‘seeks,’’ ‘‘approximately,’’ ‘‘intends,’’ ‘‘plans,’’ ‘‘estimates’’ or ‘‘anticipates’’ or similar expressions that concern our strategy, plans or intentions. All statements we make relating to estimated and projected earnings, costs, expenditures, cash flows, growth rates, financial results
and all statements we make relating to our planned divestitures, the expected proceeds generated therefrom and the expected reduction in revenue resulting therefrom,
are forward-looking statements. In addition, we, through our senior management, from time to time make forward-looking public statements concerning our expected future operations and performance and other developments. All of these forward-looking statements are subject to risks and uncertainties that may change at any time, and, therefore, our actual results may differ materially from those we expected. We derive most of our forward-looking statements from our operating budgets and forecasts, which are based upon many detailed assumptions. While we believe that our assumptions are reasonable, we caution that it is very difficult to predict the impact of known factors, and, of course, it is impossible for us to anticipate all factors that could affect our actual results. Important factors that could cause actual results to differ materially from our expectations, including, without limitation, in conjunction with the forward-looking statements included in this Form 10-Q, are disclosed in ‘‘Item 1—Business, Item 1A—Risk Factors’’ of our 2017 Form 10-K, as updated in Part II, Item 1A of our Quarterly Report on Form 10-Q for the quarter ended March 31, 2018 and in Part II, Item 1A of this Quarterly Report on Form 10-Q. Some of the factors that we believe could affect our results include:
|
•
|
the risks associated with conducting our global operations, including complex business, foreign currency, political, legal, regulatory, tax and economic risks;
|
|
•
|
our ability to effectively manage the growth of our business, implement a common operating model and platform, and increase our operating leverage;
|
|
•
|
the development and expansion of our global education network and programs and the effect of new technology applications in the educational services industry;
|
|
•
|
our ability to successfully complete planned divestitures and make strategic acquisitions, and to successfully integrate and operate acquired businesses;
|
|
•
|
the effect of existing international and U.S. laws and regulations governing our business or changes to those laws and regulations or in their application to our business;
|
|
•
|
changes in the political, economic and business climate in the international or the U.S. markets where we operate;
|
|
•
|
risks of downturns in general economic conditions and in the educational services and education technology industries, that could, among other things, impair our goodwill and intangible assets;
|
|
•
|
possible increased competition from other educational service providers;
|
|
•
|
market acceptance of new service offerings by us or our competitors and our ability to predict and respond to changes in the markets for our educational services;
|
|
•
|
the effect on our business and results of operations from fluctuations in the value of foreign currencies;
|
|
•
|
our ability to attract and retain key personnel;
|
|
•
|
the fluctuations in revenues due to seasonality;
|
|
•
|
our ability to generate anticipated savings from our
Excellence in Process
(‘‘EiP’’) program, our shared services organizations (‘‘SSOs’’) and reductions in overhead costs after our planned divestitures;
|
|
•
|
our ability to maintain proper and effective internal controls or remediate any of our current material weaknesses necessary to produce accurate financial statements on a timely basis;
|
|
•
|
our focus on a specific public benefit purpose and producing a positive effect for society may negatively influence our financial performance;
|
|
•
|
the future trading prices of our Class A common stock and the impact of any securities analysts’ reports on these prices; and
|
|
•
|
our ability to maintain and, subsequently, increase tuition rates and student enrollments in our institutions.
|
We caution you that the foregoing list of important factors may not contain all of the material factors that are important to you. In addition, in light of these risks and uncertainties, the matters referred to in the forward-looking statements contained in this Quarterly Report on Form 10-Q may not in fact occur. We undertake no obligation to publicly update or revise any forward-looking statement as a result of new information, future events or otherwise, except as otherwise required by law.
44
Introduction
This Management’s Discussion and Analysis of Financial Condition and Results of Operations (the ‘‘MD&A’’) is provided to assist readers of the financial statements in understanding the results of operations, financial condition and cash flows of Laureate Education, Inc. This MD&A should be read in conjunction with the consolidated financial statements and related notes included elsewhere in this Quarterly Report on Form 10-Q. The consolidated financial statements included elsewhere in this Quarterly Report on Form 10-Q are presented in U.S. dollars (USD) rounded to the nearest thousand, with the amounts in MD&A rounded to the nearest tenth of a million. Therefore, discrepancies in the tables between totals and the sums of the amounts listed may occur due to such rounding. Our MD&A is presented in the following sections:
|
•
|
Overview;
|
|
•
|
Results of Operations;
|
|
•
|
Liquidity and Capital Resources;
|
|
•
|
Critical Accounting Policies and Estimates; and
|
|
•
|
Recently Issued Accounting Standards.
|
Overview
Our Business
We are an international network of degree-granting higher education institutions with approximately
879,100
students enrolled at our
38
institutions in
10
countries on more than 150 campuses included in our continuing operations as of
September 30, 2018
, which we collectively refer to as the
Laureate International Universities
network. We believe the global higher education market presents an attractive long-term opportunity, primarily because of the large and growing imbalance between the supply and demand for quality higher education around the world. Advanced education opportunities drive higher earnings potential, and we believe the projected growth in the middle-class population worldwide and limited government resources dedicated to higher education create substantial opportunities for high-quality private institutions to meet this growing and unmet demand. Our outcomes-driven strategy is focused on enabling students to prosper and thrive in the dynamic and evolving knowledge economy.
As of
September 30, 2018
, our international network of
38
institutions comprised
29
institutions we owned or controlled, and an addition
al
9
institutions that we managed or with which we had other relationships. We have six operating segments as described below.
We group our institutions by geography in: 1
) Brazil; 2) Mexico; 3) Andean (formerly Andean & Iberian); 4) Central America & U.S. Campuses; and 5) Rest of World (formerly EMEAA) for reporting purposes.
Our sixth segment, Online & Partnerships, includes fully online institutions that operate globally.
Discontinued Operations
As discussed in Note
4
,
Discontinued Operations and Assets Held for Sale
, of our consolidated financial statements included elsewhere in this Quarterly Report on Form 10-Q, during the
quarter ended September 30, 2018
, the Company announced that it plans to focus on its principal
markets and will divest of its other markets
. The principal markets that will remain
(the Continuing Operations)
include
Brazil, Chile, Mexico and Peru, along with the Online & Partnerships segment and the institutions in Australia and New Zealand. The markets to be divested (
the Discontinued Operations)
include the institutions in Portugal and Spain, which are part of the Andean segment, all remaining institutions in the Central America & U.S. Campuses segment, and all remaining institutions in the Rest of World segment except for Australia, New Zealand and the managed institutions in the Kingdom of Saudi Arabia and China. The divestitures represent a strategic shift that will have a major effect on the Company's operations and financial results. Accordingly, in accordance with Accounting Standard Codification (ASC) 205-20,
‘‘Discontinued Operations,’’
the results of the divestitures that are part of the strategic shift are presented as discontinued operations in our consolidated financial statements included elsewhere in this Quarterly Report on Form 10-Q for all periods. Because our entire Central America & U.S. Campuses operating segment is included in Discontinued Operations, it no longer meets the criteria for a reportable segment under ASC 280, "Segment Reporting."
In addition, the portions of the Andean and Rest of World reportable segments that are included in Discontinued Operations have also been excluded from the segment information for all periods presented. Unless indicated otherwise, the information in the MD&A relates to continuing operations.
45
Our Segments
Our campus-based segments generate revenues by providing an education that emphasizes professional-oriented fields of study with undergraduate and graduate degrees in a wide range of disciplines. Our educational offerings are increasingly utilizing online and hybrid (a combination of online and in-classroom) courses and programs to deliver their curriculum. Many of our largest campus-based operations are in developing markets which are experiencing a growing demand for higher education based on favorable demographics and increasing secondary completion rates, driving increases in participation rates and resulting in continued growth in the number of higher education students. Traditional higher education students (defined as 18-24 year olds) have historically been served by public universities, which have limited capacity and are often underfunded, resulting in an inability to meet the growing student demand and employer requirements. This supply and demand imbalance has created a market opportunity for private sector participants. Most students finance their own education. However, there are some government-sponsored student financing programs which are discussed below. These campus-based segments include Brazil, Mexico, Andean, Central America & U.S. Campuses and Rest of World. Specifics related to each of these campus-based segments and our Online & Partnerships segment are discussed below:
|
•
|
In Brazil, approximately 75% of post-secondary students are enrolled in private higher education institutions. While the federal government defines the national curricular guidelines, institutions are licensed to operate by city. Laureate owns 13 institutions in eight states throughout Brazil, with a particularly strong presence in the competitive São Paulo market. Many students finance their own education while others rely on the government-sponsored programs such as Prouni and FIES.
|
|
•
|
Public universities in Mexico enroll approximately two thirds of students attending post-secondary education. However, many public institutions are faced with capacity constraints or the quality of the education is considered low. Laureate owns two institutions and is present throughout the country with a footprint of over 40 campuses. Each institution in Mexico has a national license. Students in our Mexican institutions typically finance their own education.
|
|
•
|
The Andean segment includes institutions in Chile, Peru, Portugal and Spain. In Chile, private universities enroll approximately 80% of post-secondary students. In Peru, the public sector plays a significant role, but private universities are increasingly providing the capacity to meet growing demand. In Spain and Portugal, the high demand for post-secondary education places capacity constraints on the public sector, pushing students to turn to the private sector for high-quality education. Chile has government-sponsored student financing programs, while in the other countries students generally finance their own education. The
institutions in Portugal and Spain are included in Discontinued Operations
.
|
|
•
|
The Central America & U.S. Campuses segment includes institutions in Costa Rica, Honduras, Panama and the United States. Students in Central America typically finance their own education while students in the United States finance their education in a variety of ways, including U.S. Department of Education (DOE) Title IV programs. The entire
Central America & U.S. Campuses segment is included in Discontinued Operations
.
|
|
•
|
The Rest of World segment includes an institution in the European country of Turkey, as well as locations in the Middle East, Africa and Asia Pacific consisting of campus-based institutions with operations in Australia, India, Malaysia, New Zealand, South Africa and Thailand. Additionally, the Rest of World segment manages
eight
licensed institutions in the Kingdom of Saudi Arabia and manages
one
additional institution in China through a joint venture arrangement.
T
he institutions in the Rest of World segment are included in Discontinued Operations, except for Australia, New Zealand and the managed institutions in the Kingdom of Saudi Arabia and China.
|
|
•
|
The Online & Partnerships segment includes fully online institutions operating globally that offer professionally oriented degree programs in the United States through Walden University (Walden), a U.S.-based accredited institution, and through the University of Liverpool and the University of Roehampton in the United Kingdom. These online institutions primarily serve working adults with undergraduate and graduate degree program offerings. Students in the United States finance their education in a variety of ways, including Title IV programs.
|
Corporate is a non-operating business unit whose purpose is to support operations. Its departments are responsible for establishing operational policies and internal control standards; implementing strategic initiatives; and monitoring compliance with policies and controls throughout our operations. Our Corporate segment is an internal source of capital and provides financial, human resource, information technology, insurance, legal and tax compliance services. The Corporate segment also contains the eliminations of intersegment revenues and expenses.
46
The following information for our reportable segments in continuing operations is presented as of
September 30, 2018
:
|
Countries
|
Institutions
|
Enrollment
|
2018 YTD Revenues ($ in millions)
(1)
|
% Contribution to 2018 YTD Revenues
|
|||||||
|
Brazil
|
1
|
|
13
|
|
273,000
|
|
$
|
469.5
|
|
19
|
%
|
|
Mexico
|
1
|
|
2
|
|
210,200
|
|
463.9
|
|
19
|
%
|
|
|
Andean
|
2
|
|
8
|
|
314,800
|
|
844.2
|
|
35
|
%
|
|
|
Rest of World
(2)
|
4
|
|
12
|
|
19,100
|
|
170.2
|
|
7
|
%
|
|
|
Online & Partnerships
(3) (4)
|
2
|
|
3
|
|
62,000
|
|
498.2
|
|
20
|
%
|
|
|
Total
(1)
|
10
|
|
38
|
|
879,100
|
|
$
|
2,436.5
|
|
100
|
%
|
(1)
The elimination of intersegment revenues and amounts related to Corporate, which total
$9.4 million
, is not separately presented.
(2)
Includes
eight
licensed institutions in the Kingdom of Saudi Arabia that are managed under a contract that expires in 2019.
(3)
In December 2017, we stopped accepting new enrollments at the University of Roehampton, an institution in our Online & Partnerships segment.
(4)
We will no longer accept new enrollments at the University of Liverpool, an institution in our Online & Partnerships segment.
Challenges
Our international operations are subject to complex business, economic, legal, regulatory, political, tax and foreign currency risks, which may be difficult to adequately address. The majority of our operations are outside the United States. As a result, we face risks that are inherent in international operations, including: fluctuations in exchange rates, possible currency devaluations, inflation and hyper-inflation; price controls and foreign currency exchange restrictions; potential economic and political instability in the countries in which we operate; expropriation of assets by local governments; key political elections and changes in government policies; multiple and possibly overlapping and conflicting tax laws; and compliance with a wide variety of foreign laws. There are also risks associated with our announcement of the divestiture of certain operations. See ‘‘Risk Factors-Risks Relating to Our Business-Our divestiture activities and the planned strategic shift in our business may disrupt our ongoing business, involve increased expenses and present risks not contemplated at the time of the transactions,” in Part II, Item 1A of this Quarterly Report on Form 10-Q. We plan to grow our continuing operations organically by: 1) adding new programs and course offerings; 2) expanding target student demographics; and 3) increasing capacity at existing and new campus locations. Our success in growing our business will depend on the ability to anticipate and effectively manage these and other risks related to operating in various countries.
Regulatory Environment and Other Matters
Our business is subject to regulation by various agencies based on the requirements of local jurisdictions. These agencies continue to review and update regulations as they deem necessary. We cannot predict the form of the rules that ultimately may be adopted in the future or what effects they might have on our business, financial condition, results of operations and cash flows. We will continue to develop and implement necessary changes that enable us to comply with such regulations. See ‘‘Risk Factors—Risks Relating to Our Business—Our institutions are subject to uncertain and varying laws and regulations, and any changes to these laws or regulations or their application to us may materially adversely affect our business, financial condition and results of operations, Risk Factors—Risks Relating to Our Business—Political and regulatory developments in Turkey may materially adversely affect us, Risk Factors—Risks Relating to Our Business—Political and regulatory developments in Chile have materially adversely affected us and may continue to affect us, Risk Factors—Risks Relating to Our Business—Our ability to control our institutions may be materially adversely affected by changes in laws affecting higher education in certain countries in which we operate, Risk Factors-Risks Relating to Our Highly Regulated Industry in the United States,’’ and ‘‘Item 1—Business—Industry Regulation,’’ in our 2017 Form 10-K.
Chilean Regulatory Updates
On January 24, 2018, a new Higher Education Law (the New Law) was passed by the Chilean Congress. On March 27, 2018, the Constitutional Court declared unconstitutional Article 63 of the New Law, which would have prohibited for-profit organizations such as Laureate from controlling the boards of universities in Chile. The Constitutional Court released its opinion on April 26, 2018, and signature and enactment of the New Law occurred in May 2018. Among other things left intact by the Constitutional Court, the New Law prohibits conflicts of interests and related party transactions with certain exceptions, including the provision of services that are educational in nature or essential for the university's purposes. The New Law provides for a transition period. The incoming Chilean presidential administration, which took office on March 11, 2018, has the responsibility to implement the new legislative mandates and compliance processes.
47
The Company is reviewing the impact the New Law will have on its Chilean operations, including the extent to which it will affect existing contractual relationships that the Company maintains with the Chilean non-profit universities. As the New Law no longer contains provisions that prohibit Laureate from controlling the boards of the Chilean non-profit universities, but still requires the promulgation of new regulations and procedures that will be applicable to any commercial relationship that the Company has with the Chilean non-profit universities, the Company has determined that it will continue to consolidate the three Chilean non-profit universities, which are accounted for as variable interest entities, and its Chilean real estate subsidiary.
While we believe that all of our institutions in Chile are operating in full compliance with Chilean law, we cannot predict the extent or outcome of any educational reforms that may be implemented in Chile. The Company does not believe the New Law will change its relationship with its two tech/voc institutions in Chile that are for-profit entities. However, it is possible that the Chilean government will adopt additional laws that affect for-profit tech/voc institutions and their relationships with their owners. Depending upon how these reforms are defined and implemented, there could be a material adverse effect on our financial condition and results of operations.
In October 2018, the Ministry of Education notified UNAB Chile, UDLA Chile and UVM Chile, universities that are part of the
Laureate International Universities
network, that it had issued a final resolution to each of the institutions thereby marking the end of previously disclosed administrative processes into possible violations of the not-for-profit status of those institutions. The resolutions found no violations of law and mandated that each of the institutions, UNAB Chile, UVM Chile, UDLA Chile, review, and conform if necessary, its related party contractual relationships in view of the New Law that will come into force in May 2019. The Company continues to analyze the New Law and will review and comply with any implementing regulations once they are promulgated.
Turkey Regulatory Updates
In May 2018, an amendment to Turkey's higher education law was passed
, which could affect certain transactions of Turkish universities that are deemed to be related party transactions. In order for it to be implemented, the amendment requires the Turkish government to issue final directives, which have not yet been issued. These directives are expected to be of significant importance in determining whether the amendment will have an impact on our operations. Once the final directives are received, the Company will evaluate whether this amendment to the higher education law has an effect on our operations, including the existing contractual relationships that the Company maintains with Bilgi, our institution in Turkey. At this time, we cannot predict the impact, if any, of this amendment to our business, financial condition, results of operations or cash flows.
See ‘‘Risk Factors—Risks Relating to Our Business—Our right to receive economic benefits from certain of the institutions that are organized as not-for-profit or non-stock entities, and that we account for as variable interest entities, may be limited,’’ in our 2017 Form 10-K.
Evaluation of Strategic Alternatives for Walden University
We are continuing to pursue our previously announced strategy of simplifying and focusing our business, including our announced plan to divest our campus-based assets in the U.S., Europe, Asia and Central America, and the creation of two scaled enterprises - one campus-based business primarily focused on emerging markets in Latin America, and one fully online plat
form in the U.S. We are currently evaluating the strategic fit of having these two scaled, but different, business units together in one organization. Accordingly, we are considering various strategic options for Walden University (Walden) with the goal of continuing to provide the best possible experience for Walden students, as well as ensuring the best position for Walden, for us and for our key stakeholders. To that end, we have had exploratory discussions with third parties regarding possible alternative transactions involving Walden. We are very proud of the quality and strength of Walden and we are very committed to maintaining that quality. Our conclusion following these discussions may be to decide to retain Walden within Laureate. At this time there is no assurance that we will engage in any transaction, or of the timing of any transaction, or that any proposed transaction, if it were to be announced, would be successfully consummated. Because Walden does not meet the criteria to be classified as held for sale or a discontinued operation, its results are reported within continuing operations for all periods presented.
Key Business Metrics
Enrollment
Enrollment is our lead revenue indicator and represents our most important non-financial metric. We define ‘‘enrollment’’ as the number of students registered in a course on the last day of the enrollment reporting period. New enrollments provide an indication of future revenue trends. Total enrollment is a function of continuing student enrollments, new student enrollments and enrollments from acquisitions, offset by graduations, attrition and enrollment decreases due to dispositions. Attrition is defined as a student
48
leaving the institution before completion of the program. To minimize attrition, we have implemented programs that involve assisting students in remedial education, mentoring, counseling and student financing.
Each of our institutions has an enrollment cycle that varies by geographic region and academic program. During each academic year, each institution has a "Primary Intake" period in which the majority of the enrollment occurs. Most institutions also have one or more smaller "Secondary Intake" periods. The first calendar quarter generally coincides with the Primary Intakes for our institutions in Brazil, the Andean Region, Australia, New Zealand and the Kingdom of Saudi Arabia. The third calendar quarter generally coincides with the Primary Intakes for our institutions in Mexico and the Online & Partnerships segment.
The following chart shows our enrollment cycles at our continuing operations. Shaded areas in the chart represent periods when classes are generally in session and revenues are recognized. Areas that are not shaded represent summer breaks during which revenues are not typically recognized. The large circles indicate the Primary Intake start dates of our institutions, and the small circles represent Secondary Intake start dates.
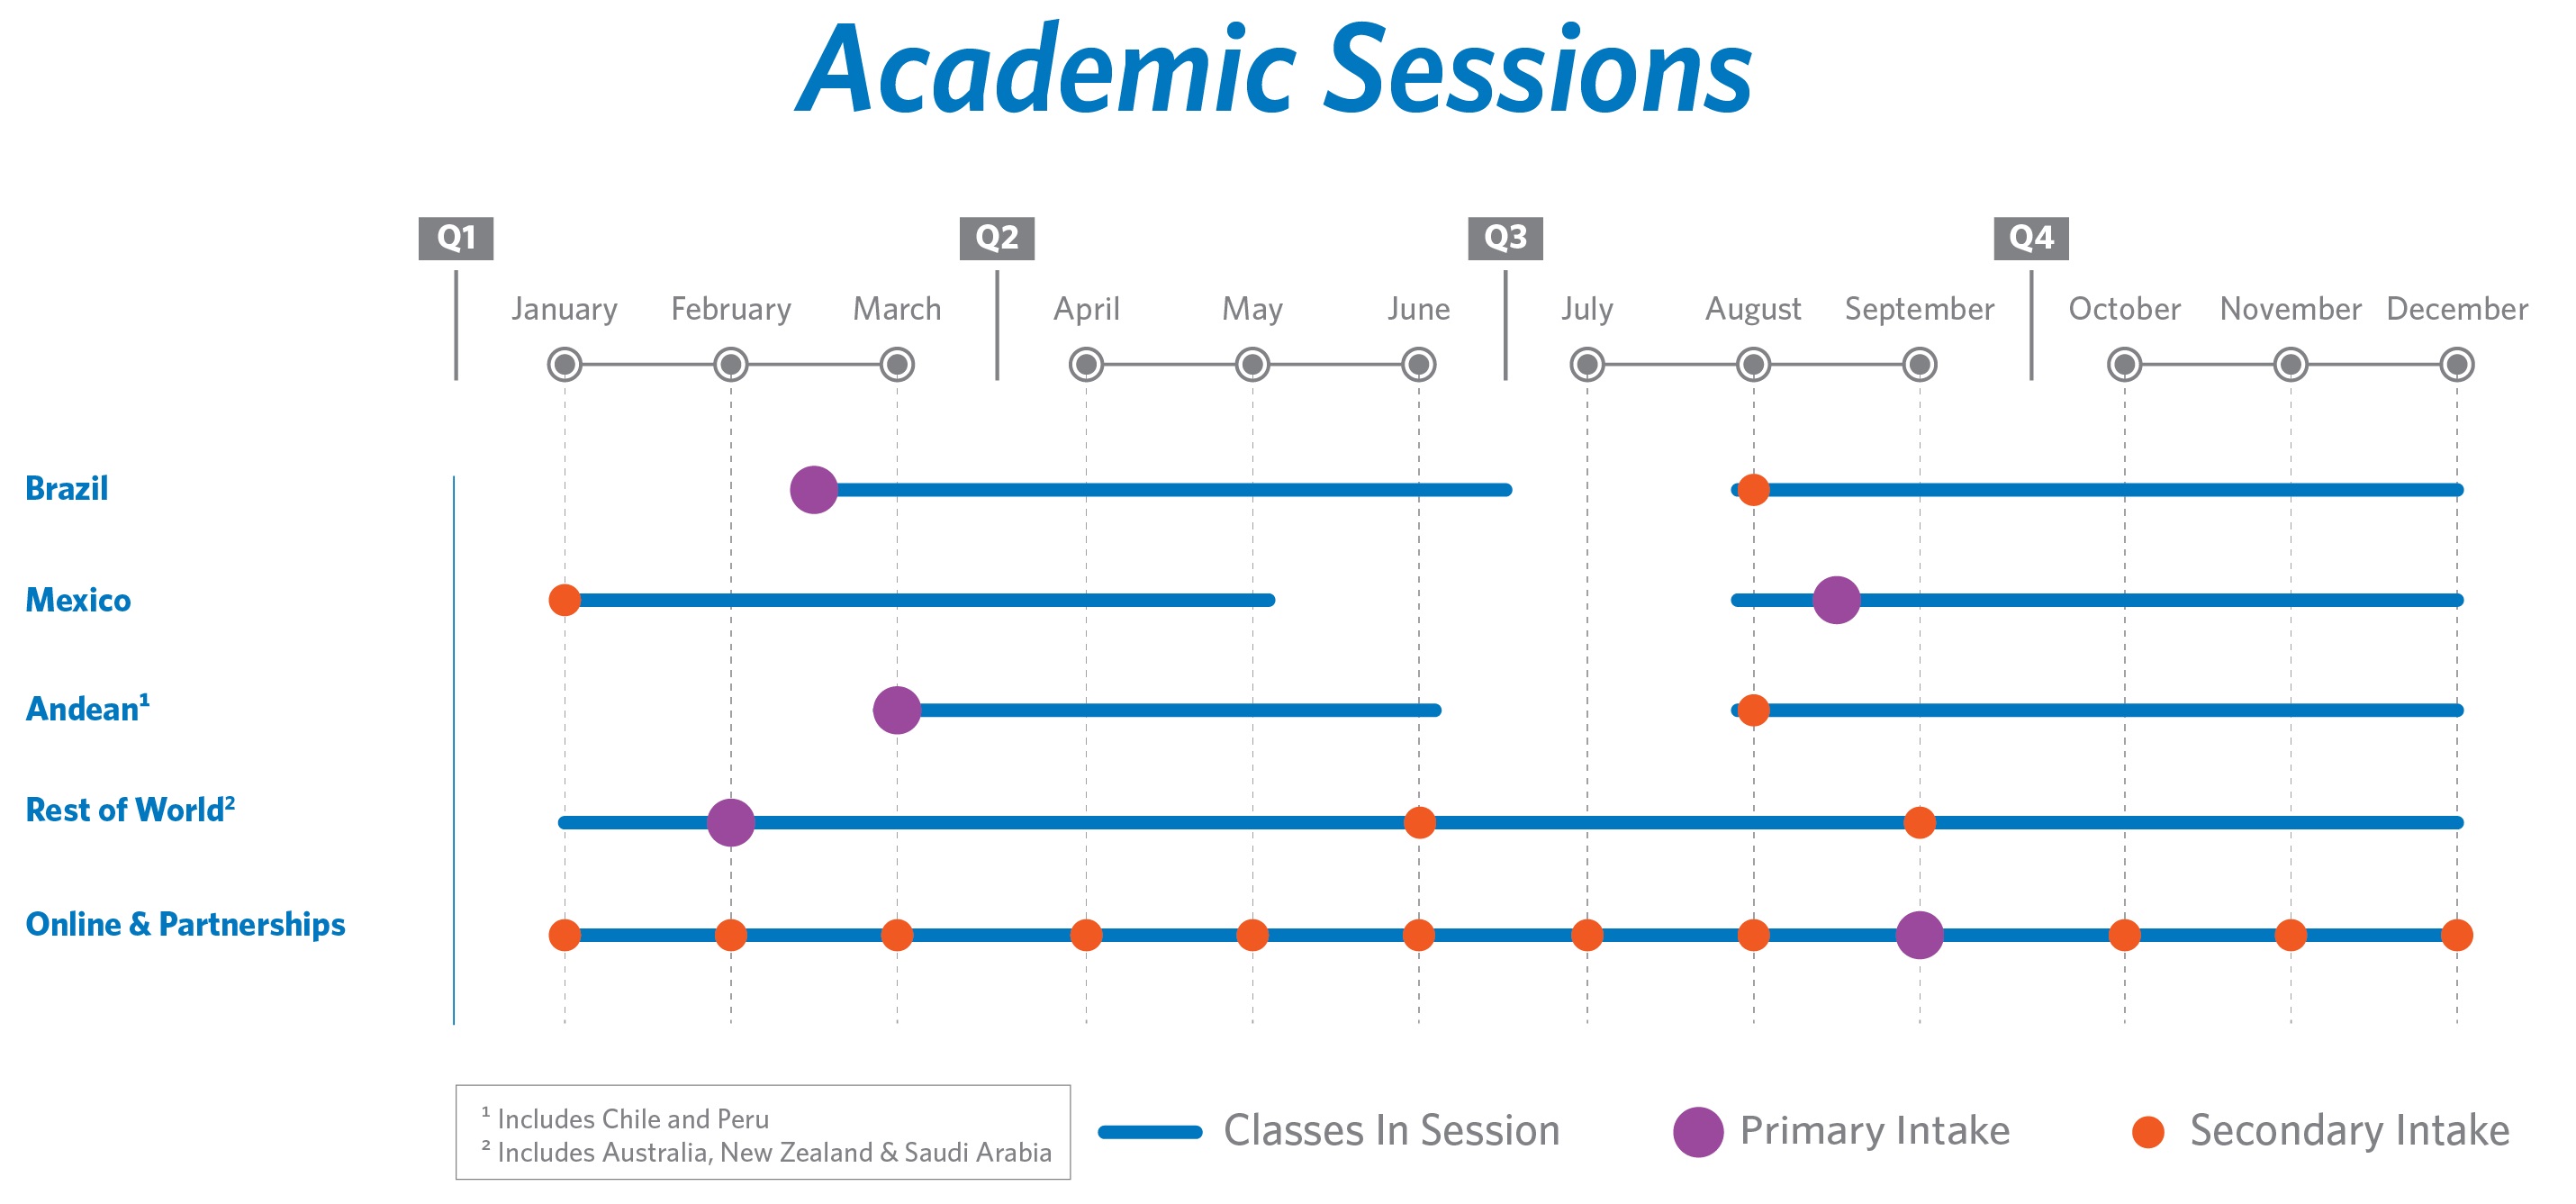
Pricing
We continually monitor market conditions and carefully adjust our tuition rates to meet local demand levels. We proactively seek the best price and content combinations to ensure that we remain competitive in all the markets in which we operate.
Principal Components of Income Statement
Revenues
The majority of our revenue is derived from tuition and educational services agreements with students, and thus, is recognized over time on a weekly straight-line basis over each academic session.
The amount of tuition generated in a given period depends on the price per credit hour and the total credit hours or price per program taken by the enrolled student population. Deferred revenue and student deposits on our consolidated balance sheets consist of tuition paid prior to the start of academic sessions and unearned tuition amounts recorded as accounts receivable after an academic session begins. The price per credit hour varies by program, by market and by degree level. Additionally, varying levels of discounts and scholarships are offered depending on market-specific dynamics and individual achievements of our students. Revenues are recognized net of scholarships, other discounts, refunds, waivers and the fair value of any guarantees made by Laureate related to student financing programs. In addition to tuition revenues, we generate other revenues from student fees, dormitory/residency fees, and other education-related activities. These other revenues are less material to our overall financial results and have a tendency to trend with tuition revenues. The main drivers of changes in revenues between periods are student enrollment and price.
Direct Costs
Our direct costs include labor and operating costs associated with the delivery of services to our students, including the cost of wages, payroll taxes, and benefits for institution employees, depreciation and amortization, rent, utilities, bad debt expenses and
49
marketing and promotional costs to grow future enrollments. In general, a significant portion of our direct costs tend to be variable in nature and trend with enrollment, and management continues to monitor and improve the efficiency of instructional delivery. Conversely, as campuses expand, direct costs may grow faster than enrollment growth as infrastructure investments are made in anticipation of future enrollment growth.
General and Administrative Expenses
Our general and administrative expenses primarily consist of costs associated with corporate departments, including executive management, finance, legal, business development and other departments that do not provide direct operational services.
Factors Affecting Comparability
Acquisitions
Our past experiences provide us with the expertise to further our mission of providing high-quality, accessible and affordable higher education to students by expanding into new markets, primarily through acquisitions. Acquisitions affect the comparability of our financial statements from period to period. Acquisitions completed during one period impact comparability to a prior period in which we did not own the acquired entity. Therefore, changes related to such entities are considered "incremental impact of acquisitions" for the first 12 months of our ownership. We have made no acquisitions in 2018 through the third quarter and made only one small acquisition in 2017 that had essentially no impact on the comparability of the periods presented.
Dispositions
Certain strategic initiatives include the sale of institutions such as those described in Note
4
,
Discontinued Operations and Assets Held for Sale
and Note
5
,
Dispositions
, of our consolidated financial statements included elsewhere in this Quarterly Report on Form 10-Q. Such dispositions affect the comparability of our financial statements from period to period. Dispositions completed during one period impact comparability to a prior period in which we owned the divested entity. Therefore, changes related to such entities are considered "incremental impact of dispositions" for the first 12 months subsequent to the disposition.
Foreign Exchange
The majority of our institutions are located outside the United States. These institutions enter into transactions in currencies other than USD and keep their local financial records in a functional currency other than the USD. We monitor the impact of foreign currency movements and the correlation between the local currency and the USD. Our revenues and expenses are generally denominated in local currency. The USD is our reporting currency and our subsidiaries operate in various other functional currencies, including: Australian Dollar, Brazilian Real, Chilean Peso, Euro, Mexican Peso, New Zealand Dollar, Peruvian Nuevo Sol, Polish Złoty, and Saudi Riyal. The principal foreign exchange exposure is the risk related to the translation of revenues and expenses incurred in each country from the local currency into USD. In order to provide a framework for assessing how our business performed excluding the effects of foreign currency fluctuations, we present
organic constant currency in our segment results, which is calculated using the change from prior-year average foreign exchange rates to current-year average foreign exchange rates, as applied to local-currency operating results for the current year.
Seasonality
Most of the institutions in our network have a summer break during which classes are generally not in session and minimal revenues are recognized. In addition to the timing of summer breaks, holidays such as Easter also have an impact on our academic calendar. Operating expenses, however, do not fully correlate to the enrollment and revenue cycles, as the institutions continue to incur expenses during summer breaks. Given the geographic diversity of our institutions and differences in timing of summer breaks, our second and fourth quarters are stronger revenue quarters as the majority of our institutions are in session for most of these respective quarters. Our first and third fiscal quarters are weaker revenue quarters because the majority of our institutions have summer breaks for some portion of one of these two quarters. Due to this seasonality, revenues and profits in any one quarter are not necessarily indicative of results in subsequent
quarters and may not be correlated to new enrollment in any one quarter.
50
Income Tax Expense
Our consolidated income tax provision is derived based on the combined impact of federal, state and foreign income taxes. Laureate has operations in multiple countries, several of which have statutory tax rates lower than the United States. Also, discrete items can arise in the course of our operations that can further impact the Company's effective tax rate for the period. Our tax rate fluctuates from period to period due to changes in the mix of earnings between our tax-paying entities, our tax-exempt entities and our loss-making entities for which it is not more likely than not that a tax benefit will be realized on the loss.
Results from the Discontinued Operations
The results of operations at our discontinued subsidiaries for the periods ended
September 30, 2018
and
2017
were as follows:
|
For the three months ended
|
For the nine months ended
|
||||||||||||||
|
September 30,
|
September 30,
|
||||||||||||||
|
(in millions)
|
2018
|
2017
|
2018
|
2017
|
|||||||||||
|
Revenues
|
$
|
151.4
|
|
$
|
164.8
|
|
$
|
635.2
|
|
$
|
682.1
|
|
|||
|
Depreciation and amortization
|
6.3
|
|
16.0
|
|
26.6
|
|
46.9
|
|
|||||||
|
Share-based compensation expense
|
0.2
|
|
0.7
|
|
0.9
|
|
1.8
|
|
|||||||
|
Other direct costs
|
176.7
|
|
178.7
|
|
526.7
|
|
560.0
|
|
|||||||
|
Operating (loss) income
|
(31.8
|
)
|
(30.6
|
)
|
81.0
|
|
73.4
|
|
|||||||
|
Other non-operating expense
|
(5.6
|
)
|
(4.4
|
)
|
(18.8
|
)
|
(14.2
|
)
|
|||||||
|
Pretax (loss) income of discontinued operations
|
(37.4
|
)
|
(35.0
|
)
|
62.2
|
|
59.2
|
|
|||||||
|
Income tax benefit (expense)
|
2.9
|
|
(1.3
|
)
|
(39.7
|
)
|
(15.1
|
)
|
|||||||
|
(Loss) income from discontinued operations, net of tax
|
(34.5
|
)
|
(36.3
|
)
|
22.5
|
|
44.0
|
|
|||||||
|
(Loss) gain on sales of discontinued operations, net of tax
|
(18.4
|
)
|
—
|
|
311.9
|
|
—
|
|
|||||||
|
Net (loss) income from discontinued operations
|
(52.9
|
)
|
(36.3
|
)
|
334.4
|
|
44.0
|
|
|||||||
Enrollment at our discontinued subsidiaries as of
September 30, 2018
and
2017
was as follows:
|
September 30, 2018
|
September 30, 2017
|
||||
|
Enrollment
|
160,800
|
|
203,500
|
|
|
Results of Operations
The following discussion of the results of our operations is organized as follows:
|
•
|
Summary Comparison of Consolidated Results;
|
|
•
|
Non-GAAP Financial Measure; and
|
|
•
|
Segment Results.
|
Summary Comparison of Consolidated Results
Discussion of Significant Items Affecting the Consolidated Results for the
Nine Months Ended September 30, 2018
and
2017
Nine Months Ended September 30, 2018
On
January 11, 2018
, we sold the operations of European University-Cyprus Ltd (EUC) and Laureate Italy S.r.L. (Laureate Italy), which resulted in a gain on sale of approximately
$218.0 million
. This gain is included in gain on sales of discontinued operations in the year-to-date table below.
On
January 25, 2018
, we sold the operations of LEI Lie Ying Limited (LEILY), which resulted in a gain on sale of approximately
$99.5 million
. This gain is included in gain on sales of discontinued operations in the year-to-date table below.
On
February 1, 2018
, we amended our Senior Secured Credit Facility to reduce the interest rate on our 2024 Term Loan. In connection with this transaction, we also repaid
$350.0 million
of the principal balance of the 2024 Term Loan. As a result of this
51
transaction, the Company recorded a
$7.5 million
loss on debt extinguishment related to the pro-rata write-off of the term loan's remaining deferred financing costs. This loss is included in other non-operating income in the year-to-date table below.
On April 12, 2018, we sold the operations of Laureate Germany, which resulted in a loss on sale of approximately
$5.5 million
. This loss is included in gain on sales of discontinued operations in the year-to-date table below.
On
April 13, 2018
, we sold the operations of Laureate Somed. Laureate Somed is the operator of Université Internationale de Casablanca, a comprehensive campus-based university in Casablanca, Morocco and recognized a gain on the sale of Laureate Somed of approximately
$17.4 million
. This gain is included in gain on sales of discontinued operations in the year-to-date table below.
On August 6, 2018, we sold the operations of Kendall College, LLC (Kendall), which resulted in a loss on sale of approximately
$17.0 million
. This loss is included in (loss) gain on sales of discontinued operations in the tables below.
Impairment
Effective September 30, 2018, the University of Liverpool (Liverpool), an institution in our Online & Partnerships segment, began a teach-out process that is expected to be completed in April 2021. As a result, during the third quarter of 2018, we recorded an impairment charge of
$10.0 million
related to fixed assets of this entity that are no longer recoverable based on expected future cash flows.
Nine Months Ended September 30, 2017
During the second quarter of 2017, the Company completed refinancing transactions that resulted in repayment of the previous senior credit facility and the redemption of the 9.250% Senior Notes due 2019 (the Senior Notes due 2019) (other than $250.0 million in aggregate principal amount of the Senior Notes due 2019 that the Company exchanged on April 21, 2017 for substantially identical but non-redeemable notes issued under a new indenture (the Exchanged Notes)). As a result of the refinancing transactions, during the nine months ended September 30, 2017, we recorded approximately $22.8 million in General and administrative expenses related to new third-party costs, as well as a Loss on debt extinguishment of $6.9 million.
Comparison of Consolidated Results for the
Three Months Ended September 30, 2018
and
2017
|
% Change
|
||||||||||
|
Better/(Worse)
|
||||||||||
|
(in millions)
|
2018
|
2017
|
2018 vs. 2017
|
|||||||
|
Revenues
|
$
|
787.1
|
|
$
|
818.6
|
|
(4
|
)%
|
||
|
Direct costs
|
677.8
|
|
728.7
|
|
7
|
%
|
||||
|
General and administrative expenses
|
73.7
|
|
65.0
|
|
(13
|
)%
|
||||
|
Loss on impairment of assets
|
10.0
|
|
—
|
|
nm
|
|
||||
|
Operating income
|
25.6
|
|
24.9
|
|
3
|
%
|
||||
|
Interest expense, net of interest income
|
(54.8
|
)
|
(65.4
|
)
|
16
|
%
|
||||
|
Other non-operating expense
|
(18.3
|
)
|
(14.1
|
)
|
(30
|
)%
|
||||
|
Loss from continuing operations before income taxes
|
(47.6
|
)
|
(54.7
|
)
|
13
|
%
|
||||
|
Income tax benefit (expense)
|
3.8
|
|
(12.5
|
)
|
130
|
%
|
||||
|
Loss from continuing operations
|
(43.8
|
)
|
(67.2
|
)
|
35
|
%
|
||||
|
Loss from discontinued operations, net of tax
|
(34.5
|
)
|
(36.3
|
)
|
5
|
%
|
||||
|
Loss on sales of discontinued operations, net of tax
|
(18.4
|
)
|
—
|
|
nm
|
|
||||
|
Net loss
|
(96.7
|
)
|
(103.5
|
)
|
7
|
%
|
||||
|
Net loss attributable to noncontrolling interests
|
1.9
|
|
5.5
|
|
65
|
%
|
||||
|
Net loss attributable to Laureate Education, Inc.
|
$
|
(94.8
|
)
|
$
|
(98.0
|
)
|
3
|
%
|
||
nm - percentage changes not meaningful
For further details on certain discrete items discussed below, see "Discussion of Significant Items Affecting the Consolidated Results."
52
Comparison of Consolidated Results for the
Three Months Ended September 30, 2018
to the
Three Months Ended September 30, 2017
Revenues
decreased
by
$31.5 million
to
$787.1 million
for the three months ended
September 30, 2018
(the 2018 fiscal quarter) from
$818.6 million
for the three months ended
September 30, 2017
(the 2017 fiscal quarter). The effect of a net change in foreign currency exchange rates
decreased
revenues by
$54.6 million
compared to the
2017
fiscal quarter, mainly due to weakening of the Brazilian Real compared to the 2017 fiscal quarter. This decrease in revenues was partially offset by the effects of higher average total organic enrollment at a majority of our institutions, which
increased
revenues by
$1.6 million
compared to the
2017
fiscal quarter; and the effect of changes in tuition rates and enrollments in programs at varying price points ("product mix"), pricing and timing, which
increased
revenues by
$19.5 million
. The product mix, pricing and timing includes a negative effect of approximately
$11.9 million
of revenue that was recognized during the 2017 fiscal quarter that had been deferred from the first and second quarters of 2017 at our three Peruvian institutions as a result of a period of heavy rains and floods that occurred during the first quarter of 2017; and
a positive impact of approximately $11.7 million of revenue that was deferred at our Mexico institutions from the third quarter of 2017 to the fourth quarter of 2017 due to class disruptions resulting from the September 2017 Mexico City earthquake
. Other Corporate and Eliminations changes accounted for an
increase
in revenues of
$2.0 million
.
Direct costs and general and administrative expenses combined
decreased
by
$42.2 million
to
$751.5 million
for the
2018
fiscal quarter from
$793.7 million
for the
2017
fiscal quarter. This decrease was due to the effect of a net change in foreign currency exchange rates, which
decreased
costs by
$49.5 million
for the
2018
fiscal quarter compared to the
2017
fiscal quarter; changes in acquisition-related contingent liabilities for taxes other-than-income tax, net of changes in recorded indemnification assets, which resulted in a year-over-year
decrease
in direct costs of
$1.5 million
; and other Corporate and Eliminations expenses, which accounted for a
decrease
in costs of
$1.2 million
. Offsetting these direct costs decreases were overall higher organic enrollments and expanded operations, which
increased
costs by
$10.0 million
for the
2018
fiscal quarter compared to the
2017
fiscal quarter.
Operating income
increased
by
$0.7 million
to
$25.6 million
for the
2018
fiscal quarter from
$24.9 million
for the
2017
fiscal quarter. The increase in operating income was a result of decreased operating loss in our Mexico and Rest of World segments, partially offset by the Liverpool impairment loss of
$10.0 million
, combined with increased operating expenses at Corporate and increased operating loss in our Brazil segment.
Interest expense, net of interest income
decreased
by
$10.6 million
to
$54.8 million
for the
2018
fiscal quarter from
$65.4 million
for the
2017
fiscal quarter. The decrease in interest expense was primarily attributable to lower average debt balances and lower interest rates during the 2018 fiscal quarter resulting from reductions in debt principal balances and interest rates due to the 2017 debt refinancing transactions and the 2018 repricing transaction.
Other non-operating expense
increased
by
$4.2 million
to
$18.3 million
for the
2018
fiscal quarter from
$14.1 million
for the
2017
fiscal quarter. This increase was primarily attributable to a loss on foreign currency exchange in the
2018
fiscal quarter compared to a gain in the
2017
fiscal quarter for a change of
$33.1 million
. This increase was partially offset by a decrease in loss on derivative instruments of
$19.8 million
; and other non-operating income in the
2018
fiscal quarter compared to an expense in the
2017
fiscal quarter for
an increase
of
$9.1 million
, primarily related to proceeds from corporate-owned life insurance.
Income tax benefit (expense)
changed by
$16.3 million
to a benefit of
$3.8 million
for the
2018
fiscal quarter from an expense of
$12.5 million
for the
2017
fiscal quarter, primarily due to changes in the mix of pre-tax book income attributable to taxable and non-taxable entities in various taxing jurisdictions.
Loss from discontinued operations, net of tax
decreased
by
$1.8 million
$34.5 million
for the
2018
fiscal quarter from
$36.3 million
for the
2017
fiscal quarter.
Loss on sales of discontinued operations, net of tax
for the 2018 fiscal quarter was
$18.4 million
, which amount was primarily related to the sale of Kendall.
53
Comparison of Consolidated Results for the
Nine Months Ended September 30, 2018
and
2017
|
% Change
|
||||||||||
|
Better/(Worse)
|
||||||||||
|
(in millions)
|
2018
|
2017
|
2018 vs. 2017
|
|||||||
|
Revenues
|
$
|
2,436.5
|
|
$
|
2,434.7
|
|
—
|
%
|
||
|
Direct costs
|
2,081.1
|
|
2,110.9
|
|
1
|
%
|
||||
|
General and administrative expenses
|
194.2
|
|
221.9
|
|
12
|
%
|
||||
|
Loss on impairment of assets
|
10.0
|
|
—
|
|
nm
|
|
||||
|
Operating income
|
151.2
|
|
101.9
|
|
48
|
%
|
||||
|
Interest expense, net of interest income
|
(172.4
|
)
|
(247.0
|
)
|
30
|
%
|
||||
|
Other non-operating income
|
51.5
|
|
8.0
|
|
nm
|
|
||||
|
Income (loss) from continuing operations before income taxes and equity in net income of affiliates
|
30.3
|
|
(137.1
|
)
|
122
|
%
|
||||
|
Income tax expense
|
(65.8
|
)
|
(13.7
|
)
|
nm
|
|
||||
|
Equity in net income of affiliates, net of tax
|
—
|
|
—
|
|
nm
|
|
||||
|
Loss from continuing operations
|
(35.5
|
)
|
(150.8
|
)
|
76
|
%
|
||||
|
Income from discontinued operations, net of tax
|
22.5
|
|
44.0
|
|
(49
|
)%
|
||||
|
Gain on sales of discontinued operations, net of tax
|
311.9
|
|
—
|
|
nm
|
|
||||
|
Net income (loss)
|
298.8
|
|
(106.7
|
)
|
nm
|
|
||||
|
Net (income) loss attributable to noncontrolling interests
|
(0.3
|
)
|
2.4
|
|
113
|
%
|
||||
|
Net income (loss) attributable to Laureate Education, Inc.
|
$
|
298.5
|
|
$
|
(104.4
|
)
|
nm
|
|
||
nm - percentage changes not meaningful
For further details on certain discrete items discussed below, see "Discussion of Significant Items Affecting the Consolidated Results."
Comparison of Consolidated Results for the
Nine Months Ended September 30, 2018
to the
Nine Months Ended September 30, 2017
Revenues
increased
by
$1.8 million
to
$2,436.5 million
for the
nine months ended September 30, 2018
(the 2018 fiscal period) from
$2,434.7 million
for the
nine months ended September 30, 2017
(the 2017 fiscal period). This increase in revenues primarily resulted from the effect of higher average total organic enrollment at a majority of our institutions, which
increased
revenues by
$22.1 million
; and the effect of product mix, pricing and timing, which
increased
revenues by
$29.4 million
. The revenues increase from product mix, pricing and timing includes
a positive impact of approximately $11.7 million of revenue that was deferred at our Mexico institutions from the third quarter of 2017 to the fourth quarter of 2017 due to class disruptions resulting from the September 2017 Mexico City earthquake
. Other Corporate and Eliminations changes accounted for an
increase
in revenues of
$5.2 million
. These increases in revenues were partially offset by a net change in foreign currency exchange rates, which
decreased
revenues by
$54.9 million
compared to the
2017
fiscal period.
Direct costs and general and administrative expenses combined
decreased
by
$57.5 million
to
$2,275.3 million
for the
2018
fiscal period from
$2,332.8 million
for the
2017
fiscal period. This decrease in direct costs primarily resulted from the effect of a net change in foreign currency exchange rates, which decreased costs by
$43.3 million
; reduced share-based compensation expense, which decreased direct costs by
$32.6 million
for the
2018
fiscal period compared to the 2017 fiscal period; changes in acquisition-related contingent liabilities for taxes other-than-income tax, net of changes in recorded indemnification assets, which resulted in a year-over-year decrease in direct costs of
$4.9 million
; and other Corporate and Eliminations expenses, which accounted for a decrease in costs of
$20.0 million
in the
2018
fiscal period, primarily a result of an expense in the 2017 fiscal period of $22.8 million related to the portion of the refinancing transactions that was deemed to be a debt modification. Offsetting these direct costs decreases were overall higher organic enrollments and expanded operations, including EiP implementation expense, which increased costs by
$43.3 million
for the
2018
fiscal period compared to the
2017
fiscal period.
Operating income
increased
by
$49.3 million
to
$151.2 million
for the
2018
fiscal period from
$101.9 million
for the
2017
fiscal period. The increase in operating income primarily resulted from increased operating income in our Andean segment; operating income for the 2018 fiscal period in our Mexico segment compared to a loss in the 2017 fiscal period, which primarily resulted
54
from the deferral of revenues due to the September 2017 Mexico City earthquake; decreased operating expenses at Corporate, primarily related to share-based compensation and debt modification. These increases were partially offset by the Liverpool impairment loss of
$10.0 million
during the
2018
fiscal period, combined with decreased operating income at our Brazil segment.
Interest expense, net of interest income
decreased
by
$74.6 million
to
$172.4 million
for the
2018
fiscal period from
$247.0 million
for the
2017
fiscal period. The decrease in interest expense was primarily attributable to lower average debt balances and lower interest rates during the 2018 fiscal period resulting from reductions in debt principal balances and interest rates due to the 2017 debt refinancing transactions and the 2018 repricing transaction.
Other non-operating income
increased
by
$43.5 million
to
$51.5 million
for the
2018
fiscal period from
$8.0 million
for the
2017
fiscal period. This increase was primarily attributable to an increase in the
gain
on derivative instruments of
$72.9 million
in the
2018
fiscal period, primarily related to the Series A Preferred Stock embedded derivatives;
an increase
of
$11.4 million
in other non-operating income in the
2018
fiscal period compared to the
2017
fiscal period, primarily related to proceeds from corporate-owned life insurance; and a decrease in loss on debt extinguishment of
$0.9 million
compared to the 2017 fiscal period. These increases were partially offset by an increase in loss on foreign currency exchange of
$41.7 million
in the
2018
fiscal period compared to the
2017
fiscal period.
Income tax expense
increased
by
$52.1 million
to
$65.8 million
for the
2018
fiscal period from
$13.7 million
for the
2017
fiscal period. This increase in income tax expense was primarily due to a benefit recorded in the 2017 fiscal period of approximately $30 million related to intercompany loans that were converted from temporary to permanent and the impact of the mix of earnings between income and loss companies.
Income from discontinued operations, net of tax
decreased
by
$21.5 million
to
$22.5 million
for the
2018
fiscal period from
$44.0 million
for the
2017
fiscal period. This decrease was primarily due to higher income tax expense of approximately $25 million that was recorded on the Discontinued Operations during the 2018 fiscal period, attributable to changes in the mix of pretax book income from taxable and nontaxable entities in various taxing jurisdictions.
Gain on sales of discontinued operations, net of tax
for the
2018
fiscal period was
$311.9 million
related to the sales of our Cyprus, Italy, China, Germany, Morocco and Kendall College subsidiaries in the
2018
fiscal period.
Non-GAAP Financial Measure
We define Adjusted EBITDA as income (loss) from continuing operations,
before
equity in net (income) loss of affiliates, net of tax, income tax expense (benefit), loss (gain) on sale of subsidiaries, net, foreign currency exchange (gain) loss, net, other (income) expense, net, loss (gain) on derivatives, loss on debt extinguishment, interest expense and interest income,
plus
depreciation and amortization, share-based compensation expense, loss on impairment of assets and expenses related to implementation of our EiP initiative. When we review Adjusted EBITDA on a segment basis, we exclude inter-segment revenues and expenses that eliminate in consolidation. Adjusted EBITDA is used in addition to and in conjunction with results presented in accordance with GAAP and should not be relied upon to the exclusion of GAAP financial measures.
Adjusted EBITDA is a key measure used by our management and board of directors to understand and evaluate our core operating performance and trends, to prepare and approve our annual budget and to develop short- and long-term operational plans. In particular, the exclusion of certain expenses in calculating Adjusted EBITDA can provide a useful measure for period-to-period comparisons of our core business. Additionally, Adjusted EBITDA is a key financial measure used by the compensation committee of our board of directors and our Chief Executive Officer in connection with the payment of incentive compensation to our executive officers and other members of our management team. Accordingly, we believe that Adjusted EBITDA provides useful information to investors and others in understanding and evaluating our operating results in the same manner as our management and board of directors.
55
The following table presents Adjusted EBITDA and reconciles
loss
from continuing operations to Adjusted EBITDA for the three months ended
September 30, 2018
and
2017
:
|
% Change
|
||||||||||
|
Better/(Worse)
|
||||||||||
|
(in millions)
|
2018
|
2017
|
2018 vs. 2017
|
|||||||
|
Loss from continuing operations
|
$
|
(43.8
|
)
|
$
|
(67.2
|
)
|
35
|
%
|
||
|
Plus:
|
||||||||||
|
Income tax (benefit) expense
|
(3.8
|
)
|
12.5
|
|
130
|
%
|
||||
|
Loss from continuing operations before income taxes
|
(47.6
|
)
|
(54.7
|
)
|
13
|
%
|
||||
|
Plus:
|
||||||||||
|
Foreign currency exchange loss (gain), net
|
26.5
|
|
(6.6
|
)
|
nm
|
|
||||
|
Other (income) expense, net
|
(8.3
|
)
|
0.8
|
|
nm
|
|
||||
|
Loss on derivatives
|
0.1
|
|
19.9
|
|
99
|
%
|
||||
|
Interest expense
|
58.3
|
|
69.1
|
|
16
|
%
|
||||
|
Interest income
|
(3.5
|
)
|
(3.7
|
)
|
(5
|
)%
|
||||
|
Operating income
|
25.6
|
|
24.9
|
|
3
|
%
|
||||
|
Plus:
|
||||||||||
|
Depreciation and amortization
|
53.5
|
|
51.9
|
|
(3
|
)%
|
||||
|
EBITDA
|
79.1
|
|
76.8
|
|
3
|
%
|
||||
|
Plus:
|
||||||||||
|
Share-based compensation expense
(a)
|
6.4
|
|
8.0
|
|
20
|
%
|
||||
|
Loss on impairment of assets
(b)
|
10.0
|
|
—
|
|
nm
|
|
||||
|
EiP implementation expenses
(c)
|
25.0
|
|
15.2
|
|
(64
|
)%
|
||||
|
Adjusted EBITDA
|
$
|
120.5
|
|
$
|
99.9
|
|
21
|
%
|
||
nm - percentage changes not meaningful
(a)
Represents non-cash, share-based compensation expense pursuant to the provisions of ASC 718.
(b)
Represents non-cash charges related to impairments of long-lived assets. For further details on certain impairment items see "Discussion of Significant Items Affecting the Consolidated Results for the
Nine Months Ended September 30, 2018
and
2017
- Impairments."
(c)
EiP implementation expenses are related to our enterprise-wide initiative to optimize and standardize our processes, creating vertical integration of procurement, information technology, finance, accounting and human resources. The first wave of EiP began in 2014 and was substantially completed in 2017, and includes the establishment of regional SSOs around the world, as well as improvements to our system of internal controls over financial reporting. Given the success of the first wave of EiP, we have expanded the initiative into other back- and mid-office areas, as well as certain student-facing activities, in order to generate additional efficiencies and create a more efficient organizational structure.
Comparison of Depreciation and Amortization, Share-based Compensation and EiP Implementation Expenses for the
Three Months Ended September 30, 2018
and
2017
Depreciation and amortization
increased
by
$1.6 million
to
$53.5 million
for the
2018
fiscal quarter from
$51.9 million
for the
2017
fiscal quarter. Depreciation and amortization expense increased by
$4.9 million
, partially offset by the effects of foreign currency exchange, which decreased depreciation and amortization expense by
$3.3 million
for the
2018
fiscal quarter compared to the
2017
fiscal quarter.
Share-based compensation expense
decreased
by
$1.6 million
to
$6.4 million
for the
2018
fiscal quarter from
$8.0 million
for the
2017
fiscal quarter.
EiP implementation expenses
increased
by
$9.8 million
to
$25.0 million
for the
2018
fiscal quarter from
$15.2 million
for the
2017
fiscal quarter. The EiP expenses are related to an enterprise-wide initiative to optimize and standardize our processes, creating vertical integration of procurement, information technology, financing, accounting and human resources. EiP also includes the establishment of regional SSOs around the world, as well as improvements to our system of internal controls over financial
56
reporting. The year-over-year increase in EiP expense relates primarily to compliance monitoring of information technology general controls and costs incurred in connection with the dispositions.
The following table presents Adjusted EBITDA and reconciles
loss
from continuing operations to Adjusted EBITDA for the
nine months ended September 30, 2018
and
2017
:
|
% Change
|
||||||||||
|
Better/(Worse)
|
||||||||||
|
(in millions)
|
2018
|
2017
|
2018 vs. 2017
|
|||||||
|
Loss from continuing operations
|
$
|
(35.5
|
)
|
$
|
(150.8
|
)
|
76
|
%
|
||
|
Plus:
|
||||||||||
|
Equity in net income of affiliates, net of tax
|
—
|
|
—
|
|
nm
|
|
||||
|
Income tax expense
|
65.8
|
|
13.7
|
|
nm
|
|
||||
|
Income (loss) from continuing operations before income taxes and equity in net income of affiliates
|
30.3
|
|
(137.1
|
)
|
122
|
%
|
||||
|
Plus:
|
||||||||||
|
Foreign currency exchange loss, net
|
43.9
|
|
2.2
|
|
nm
|
|
||||
|
Other (income) expense, net
|
(10.8
|
)
|
0.6
|
|
nm
|
|
||||
|
Gain on derivatives
|
(92.1
|
)
|
(19.2
|
)
|
nm
|
|
||||
|
Loss on debt extinguishment
|
7.5
|
|
8.4
|
|
11
|
%
|
||||
|
Interest expense
|
181.8
|
|
256.7
|
|
29
|
%
|
||||
|
Interest income
|
(9.4
|
)
|
(9.7
|
)
|
(3
|
)%
|
||||
|
Operating income
|
151.2
|
|
101.9
|
|
48
|
%
|
||||
|
Plus:
|
||||||||||
|
Depreciation and amortization
|
163.3
|
|
152.5
|
|
(7
|
)%
|
||||
|
EBITDA
|
314.5
|
|
254.4
|
|
24
|
%
|
||||
|
Plus:
|
||||||||||
|
Share-based compensation expense
(a)
|
9.6
|
|
42.2
|
|
77
|
%
|
||||
|
Loss on impairment of assets
(b)
|
10.0
|
|
—
|
|
nm
|
|
||||
|
EiP implementation expenses
(c)
|
60.3
|
|
54.9
|
|
(10
|
)%
|
||||
|
Adjusted EBITDA
|
$
|
394.4
|
|
$
|
351.5
|
|
12
|
%
|
||
nm - percentage changes not meaningful
(a)
Represents non-cash, share-based compensation expense pursuant to the provisions of ASC 718.
(b)
Represents non-cash charges related to impairments of long-lived assets. For further details on certain impairment items see "Discussion of Significant Items Affecting the Consolidated Results for the
Nine Months Ended September 30, 2018
and
2017
- Impairments."
(c)
EiP implementation expenses are related to our enterprise-wide initiative to optimize and standardize our processes, creating vertical integration of procurement, information technology, finance, accounting and human resources. The first wave of EiP began in 2014 and was substantially completed in 2017, and includes the establishment of regional SSOs around the world, as well as improvements to our system of internal controls over financial reporting. Given the success of the first wave of EiP, we have expanded the initiative into other back- and mid-office areas, as well as certain student-facing activities, in order to generate additional efficiencies and create a more efficient organizational structure.
Comparison of Depreciation and Amortization, Share-based Compensation and EiP Implementation Expenses for the
Nine Months Ended September 30, 2018
and
2017
Depreciation and amortization
increased
by
$10.8 million
to
$163.3 million
for the
2018
fiscal period from
$152.5 million
for the
2017
fiscal period. Depreciation and amortization expense increased by
$13.1 million
, partially offset by the effects of foreign currency exchange, which decreased depreciation and amortization expense by
$2.3 million
for the
2018
fiscal period compared to the
2017
fiscal period.
57
Share-based compensation expense
decreased
by
$32.6 million
to
$9.6 million
for the
2018
fiscal period from
$42.2 million
for the
2017
fiscal period. This decrease is mostly attributable to stock options that were granted to the Company’s then-CEO in the
2017
fiscal period under the Executive Profits Interests (EPI) agreement. The EPI options vested upon consummation of the IPO on
February 6, 2017
, resulting in additional share-based compensation expense of $14.6 million during the
2017
fiscal period. In addition, the Company recorded a stock modification charge of approximately $5.1 million during
2017
fiscal period related to a repricing of stock option awards. Also, the Company recorded a correction of an immaterial error in the first quarter of 2018, which reduced share-based compensation expense for the
2018
fiscal period.
EiP implementation expenses
increased
by
$5.4 million
to
$60.3 million
for the
2018
fiscal period from
$54.9 million
for the
2017
fiscal period. The EiP expenses are related to an enterprise-wide initiative to optimize and standardize our processes, creating vertical integration of procurement, information technology, financing, accounting and human resources. EiP also includes the establishment of regional SSOs around the world, as well as improvements to our system of internal controls over financial reporting. The year-over-year increase in EiP expenses relates primarily to compliance monitoring of information technology general controls and costs incurred in connection with the dispositions during the
2018
fiscal period, partially offset by the effect of severance costs that were recognized in the
2017
fiscal period.
Segment Results
We have six operating segments: Brazil, Mexico, Andean, Central America & U.S. Campuses, Rest of World, and Online & Partnerships. As discussed in ‘‘Overview,’’ the entire Central America & U.S. Campuses segment is included in Discontinued Operations and therefore is excluded from segment results. For purposes of the following comparison of results discussion, "
segment direct costs
" represent direct costs by segment as they are included in Adjusted EBITDA, such that depreciation and amortization expense, loss on impairment of assets, share-based compensation expense and our EiP implementation expenses have been excluded. For a further description of our segments, see ‘‘Overview.’’
The following tables, derived from our consolidated financial statements included elsewhere in this Quarterly Report on Form 10-Q, presents selected financial information of our segments:
|
(in millions)
|
% Change
|
|||||||||
|
Better/(Worse)
|
||||||||||
|
For the three months ended September 30,
|
2018
|
2017
|
2018 vs. 2017
|
|||||||
|
Revenues:
|
||||||||||
|
Brazil
|
$
|
121.1
|
|
$
|
170.5
|
|
(29
|
)%
|
||
|
Mexico
|
148.3
|
|
141.2
|
|
5
|
%
|
||||
|
Andean
|
299.6
|
|
295.2
|
|
1
|
%
|
||||
|
Rest of World
|
56.5
|
|
49.0
|
|
15
|
%
|
||||
|
Online & Partnerships
|
165.2
|
|
168.4
|
|
(2
|
)%
|
||||
|
Corporate
|
(3.7
|
)
|
(5.7
|
)
|
35
|
%
|
||||
|
Consolidated Total Revenues
|
$
|
787.1
|
|
$
|
818.6
|
|
(4
|
)%
|
||
|
Adjusted EBITDA:
|
||||||||||
|
Brazil
|
$
|
0.7
|
|
$
|
9.1
|
|
(92
|
)%
|
||
|
Mexico
|
23.7
|
|
6.5
|
|
nm
|
|
||||
|
Andean
|
90.6
|
|
90.6
|
|
—
|
%
|
||||
|
Rest of World
|
5.3
|
|
(0.4
|
)
|
nm
|
|
||||
|
Online & Partnerships
|
45.7
|
|
42.9
|
|
7
|
%
|
||||
|
Corporate
|
(45.5
|
)
|
(48.7
|
)
|
7
|
%
|
||||
|
Consolidated Total Adjusted EBITDA
|
$
|
120.5
|
|
$
|
99.9
|
|
21
|
%
|
||
58
|
(in millions)
|
% Change
|
|||||||||
|
Better/(Worse)
|
||||||||||
|
For the nine months ended September 30,
|
2018
|
2017
|
2018 vs. 2017
|
|||||||
|
Revenues:
|
||||||||||
|
Brazil
|
$
|
469.5
|
|
$
|
548.0
|
|
(14
|
)%
|
||
|
Mexico
|
463.9
|
|
452.0
|
|
3
|
%
|
||||
|
Andean
|
844.2
|
|
779.1
|
|
8
|
%
|
||||
|
Rest of World
|
170.2
|
|
149.2
|
|
14
|
%
|
||||
|
Online & Partnerships
|
498.2
|
|
521.0
|
|
(4
|
)%
|
||||
|
Corporate
|
(9.4
|
)
|
(14.6
|
)
|
36
|
%
|
||||
|
Consolidated Total Revenues
|
$
|
2,436.5
|
|
$
|
2,434.7
|
|
—
|
%
|
||
|
Adjusted EBITDA:
|
||||||||||
|
Brazil
|
$
|
52.6
|
|
$
|
61.3
|
|
(14
|
)%
|
||
|
Mexico
|
82.0
|
|
78.6
|
|
4
|
%
|
||||
|
Andean
|
235.4
|
|
208.5
|
|
13
|
%
|
||||
|
Rest of World
|
15.9
|
|
10.1
|
|
57
|
%
|
||||
|
Online & Partnerships
|
136.1
|
|
145.8
|
|
(7
|
)%
|
||||
|
Corporate
|
(127.5
|
)
|
(152.7
|
)
|
17
|
%
|
||||
|
Consolidated Total Adjusted EBITDA
|
$
|
394.4
|
|
$
|
351.5
|
|
12
|
%
|
||
Brazil
Financial Overview
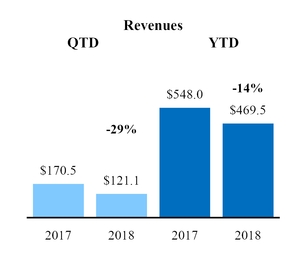
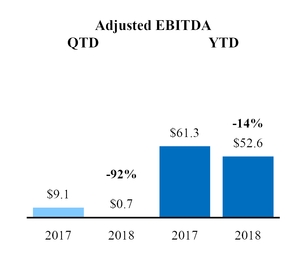
59
Comparison of Brazil Results for the
Three Months Ended September 30, 2018
to the
Three Months Ended September 30, 2017
|
(in millions)
|
Revenues
|
Direct Costs
|
Adjusted EBITDA
|
||||||||
|
September 30, 2017
|
$
|
170.5
|
|
$
|
161.4
|
|
$
|
9.1
|
|
||
|
Organic enrollment
(1)
|
0.7
|
|
|||||||||
|
Product mix, pricing and timing
(1)
|
(17.0
|
)
|
|||||||||
|
Organic constant currency
|
(16.3
|
)
|
(9.5
|
)
|
(6.8
|
)
|
|||||
|
Foreign exchange
|
(33.1
|
)
|
(29.9
|
)
|
(3.2
|
)
|
|||||
|
Acquisitions
|
—
|
|
—
|
|
—
|
|
|||||
|
Dispositions
|
—
|
|
—
|
|
—
|
|
|||||
|
Other
(2)
|
—
|
|
(1.6
|
)
|
1.6
|
|
|||||
|
September 30, 2018
|
$
|
121.1
|
|
$
|
120.4
|
|
$
|
0.7
|
|
||
(1)
Organic enrollment and Product mix, pricing and timing are not separable for the calculation of direct costs and therefore are combined and defined as Organic constant currency for the calculation of Adjusted EBITDA.
(2)
Other is composed of acquisition-related contingent liabilities for taxes other-than-income tax, net of changes in recorded indemnification assets.
Revenues
decreased
by
$49.4 million
, a
29%
decrease
from the
2017
fiscal quarter.
|
•
|
The decrease in revenues during the
2018
fiscal quarter was primarily due to weakening of the Brazilian Real relative to the USD compared to the 2017 fiscal quarter. For the 2018 fiscal quarter, organic enrollment was essentially flat compared to the 2017 fiscal quarter.
|
|
•
|
Revenues represented
15%
of our consolidated total revenues for the
2018
fiscal quarter compared to
21%
for the
2017
fiscal quarter.
|
Adjusted EBITDA
decreased
by
$8.4 million
, a
92%
decrease
from the
2017
fiscal quarter.
Comparison of Brazil Results for the
Nine Months Ended September 30, 2018
to the
Nine Months Ended September 30, 2017
|
(in millions)
|
Revenues
|
Direct Costs
|
Adjusted EBITDA
|
||||||||
|
September 30, 2017
|
$
|
548.0
|
|
$
|
486.7
|
|
$
|
61.3
|
|
||
|
Organic enrollment
(1)
|
14.7
|
|
|||||||||
|
Product mix, pricing and timing
(1)
|
(29.0
|
)
|
|||||||||
|
Organic constant currency
|
(14.3
|
)
|
(13.4
|
)
|
(0.9
|
)
|
|||||
|
Foreign exchange
|
(64.2
|
)
|
(51.1
|
)
|
(13.1
|
)
|
|||||
|
Acquisitions
|
—
|
|
—
|
|
—
|
|
|||||
|
Dispositions
|
—
|
|
—
|
|
—
|
|
|||||
|
Other
(2)
|
—
|
|
(5.3
|
)
|
5.3
|
|
|||||
|
September 30, 2018
|
$
|
469.5
|
|
$
|
416.9
|
|
$
|
52.6
|
|
||
(1)
Organic enrollment and Product mix, pricing and timing are not separable for the calculation of direct costs and therefore are combined and defined as Organic constant currency for the calculation of Adjusted EBITDA.
(2)
Other is composed of acquisition-related contingent liabilities for taxes other-than-income tax, net of changes in recorded indemnification assets.
Revenues
decreased
by
$78.5 million
, a
14%
decrease
from the
2017
fiscal period.
|
•
|
For the
2018
fiscal period, revenues decreased due to weakening of the Brazilian Real relative to the USD, combined with higher scholarship discounts. These decreases were partially offset by an increase in organic enrollment of
3%
, which
increased
revenues by
$14.7 million
.
|
|
•
|
Revenues represented
19%
of our consolidated total revenues for the
2018
fiscal period compared to
22%
for the
2017
fiscal period.
|
60
Adjusted EBITDA
decreased
by
$8.7 million
, a
14%
decrease
from the
2017
fiscal period.
Mexico
Financial Overview
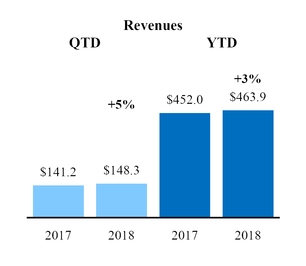

*Percentage change considered not meaningful and, therefore, not shown
Comparison of Mexico Results for the
Three Months Ended September 30, 2018
to the
Three Months Ended September 30, 2017
|
(in millions)
|
Revenues
|
Direct Costs
|
Adjusted EBITDA
|
||||||||
|
September 30, 2017
|
$
|
141.2
|
|
$
|
134.7
|
|
$
|
6.5
|
|
||
|
Organic enrollment
(1)
|
(4.4
|
)
|
|||||||||
|
Product mix, pricing and timing
(1)
|
21.4
|
|
|||||||||
|
Organic constant currency
|
17.0
|
|
(2.0
|
)
|
19.0
|
|
|||||
|
Foreign exchange
|
(9.9
|
)
|
(8.2
|
)
|
(1.7
|
)
|
|||||
|
Acquisitions
|
—
|
|
—
|
|
—
|
|
|||||
|
Dispositions
|
—
|
|
—
|
|
—
|
|
|||||
|
Other
(2)
|
—
|
|
0.1
|
|
(0.1
|
)
|
|||||
|
September 30, 2018
|
$
|
148.3
|
|
$
|
124.6
|
|
$
|
23.7
|
|
||
(1)
Organic enrollment and Product mix, pricing and timing are not separable for the calculation of direct costs and therefore are combined and defined as Organic constant currency for the calculation of Adjusted EBITDA.
(2)
Other is composed of acquisition-related contingent liabilities for taxes other-than-income tax, net of changes in recorded indemnification assets.
Revenues
increased
by
$7.1 million
, a
5%
increase
from the
2017
fiscal quarter.
|
•
|
Organic enrollment
decreased
during the fiscal quarter by
2%
, decreasing revenues by
$4.4 million
.
|
|
•
|
The product mix, pricing and timing includes
a positive impact of approximately $11.7 million of revenue that was deferred at our Mexico institutions from the third quarter of 2017 to the fourth quarter of 2017 due to class disruptions resulting from the September 2017 Mexico City earthquake
.
|
|
•
|
Revenues represented
19%
of our consolidated total revenues for the
2018
fiscal quarter compared to
17%
for the
2017
fiscal quarter.
|
Adjusted EBITDA
increased
by
$17.2 million
from the
2017
fiscal quarter, primarily due to increases in revenues from product mix, pricing and timing.
61
Comparison of Mexico Results for the
Nine Months Ended September 30, 2018
to the
Nine Months Ended September 30, 2017
|
(in millions)
|
Revenues
|
Direct Costs
|
Adjusted EBITDA
|
||||||||
|
September 30, 2017
|
$
|
452.0
|
|
$
|
373.4
|
|
$
|
78.6
|
|
||
|
Organic enrollment
(1)
|
(10.2
|
)
|
|||||||||
|
Product mix, pricing and timing
(1)
|
26.0
|
|
|||||||||
|
Organic constant currency
|
15.8
|
|
11.6
|
|
4.2
|
|
|||||
|
Foreign exchange
|
(3.9
|
)
|
(3.5
|
)
|
(0.4
|
)
|
|||||
|
Acquisitions
|
—
|
|
—
|
|
—
|
|
|||||
|
Dispositions
|
—
|
|
—
|
|
—
|
|
|||||
|
Other
(2)
|
—
|
|
0.4
|
|
(0.4
|
)
|
|||||
|
September 30, 2018
|
$
|
463.9
|
|
$
|
381.9
|
|
$
|
82.0
|
|
||
(1)
Organic enrollment and Product mix, pricing and timing are not separable for the calculation of direct costs and therefore are combined and defined as Organic constant currency for the calculation of Adjusted EBITDA.
(2)
Other is composed of acquisition-related contingent liabilities for taxes other-than-income tax, net of changes in recorded indemnification assets.
Revenues
increased
by
$11.9 million
, a
3%
increase
from the
2017
fiscal period.
|
•
|
Increases in revenues during the
2018
fiscal period were partially offset by a decrease in organic enrollment of
2%
, which
decreased
revenues by
$10.2 million
.
|
|
•
|
The product mix, pricing and timing includes
a positive impact of approximately $11.7 million of revenue that was deferred at our Mexico institutions from the third quarter of 2017 to the fourth quarter of 2017 due to class disruptions resulting from the September 2017 Mexico City earthquake
.
|
|
•
|
Revenues represented
19%
of our consolidated total revenues for both the
2018
and the
2017
fiscal periods.
|
Adjusted EBITDA
increased
by
$3.4 million
, a
4%
increase
from the
2017
fiscal period.
Andean
Financial Overview
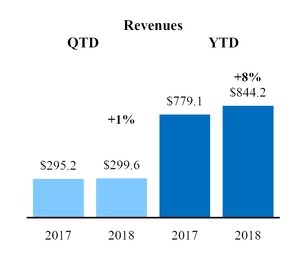
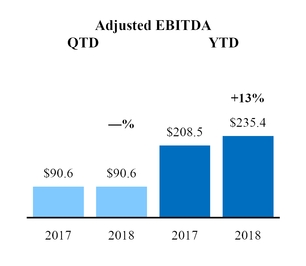
62
Comparison of Andean Results for the
Three Months Ended September 30, 2018
to the
Three Months Ended September 30, 2017
|
(in millions)
|
Revenues
|
Direct Costs
|
Adjusted EBITDA
|
||||||||
|
September 30, 2017
|
$
|
295.2
|
|
$
|
204.6
|
|
$
|
90.6
|
|
||
|
Organic enrollment
(1)
|
5.8
|
|
|||||||||
|
Product mix, pricing and timing
(1)
|
6.7
|
|
|||||||||
|
Organic constant currency
|
12.5
|
|
9.4
|
|
3.1
|
|
|||||
|
Foreign exchange
|
(8.1
|
)
|
(5.0
|
)
|
(3.1
|
)
|
|||||
|
Acquisitions
|
—
|
|
—
|
|
—
|
|
|||||
|
Dispositions
|
—
|
|
—
|
|
—
|
|
|||||
|
Other
|
—
|
|
—
|
|
—
|
|
|||||
|
September 30, 2018
|
$
|
299.6
|
|
$
|
209.0
|
|
$
|
90.6
|
|
||
(1)
Organic enrollment and Product mix, pricing and timing are not separable for the calculation of direct costs and therefore are combined and defined as Organic constant currency for the calculation of Adjusted EBITDA.
Revenues
increased
by
$4.4 million
, a
1%
increase
from the
2017
fiscal quarter.
|
•
|
Organic enrollment
increased
during the
2018
fiscal quarter by
2%
, increasing revenues by
$5.8 million
.
|
|
•
|
The revenues increase from the product mix, pricing and timing is net of a negative effect of approximately
$11.9 million
related to revenue recognized during the 2017 fiscal quarter that had been deferred from the first and second quarters of 2017 at our three Peruvian institutions as a result of a period of heavy rains and floods that occurred during the first quarter of 2017.
|
|
•
|
Revenue represented
38%
of our consolidated total revenues for the
2018
fiscal quarter compared to
36%
for the
2017
fiscal quarter.
|
Adjusted EBITDA for the
2018
fiscal quarter remained flat compared to the
2017
fiscal quarter.
|
•
|
Foreign exchange affected the results for the
2018
fiscal quarter, primarily due to the weakening of the Chilean Peso and the Peruvian Nuevo Sol relative to the USD.
|
Comparison of Andean Results for the
Nine Months Ended September 30, 2018
to the
Nine Months Ended September 30, 2017
|
(in millions)
|
Revenues
|
Direct Costs
|
Adjusted EBITDA
|
||||||||
|
September 30, 2017
|
$
|
779.1
|
|
$
|
570.6
|
|
$
|
208.5
|
|
||
|
Organic enrollment
(1)
|
24.3
|
|
|||||||||
|
Product mix, pricing and timing
(1)
|
25.5
|
|
|||||||||
|
Organic constant currency
|
49.8
|
|
23.2
|
|
26.6
|
|
|||||
|
Foreign exchange
|
15.3
|
|
15.0
|
|
0.3
|
|
|||||
|
Acquisitions
|
—
|
|
—
|
|
—
|
|
|||||
|
Dispositions
|
—
|
|
—
|
|
—
|
|
|||||
|
Other
|
—
|
|
—
|
|
—
|
|
|||||
|
September 30, 2018
|
$
|
844.2
|
|
$
|
608.8
|
|
$
|
235.4
|
|
||
(1)
Organic enrollment and Product mix, pricing and timing are not separable for the calculation of direct costs and therefore are combined and defined as Organic constant currency for the calculation of Adjusted EBITDA.
Revenues
increased
by
$65.1 million
, an
8%
increase
from the
2017
fiscal period.
|
•
|
Organic enrollment
increased
during the
2018
fiscal period by
3%
, increasing revenues by
$24.3 million
.
|
|
•
|
Revenue represented
35%
of our consolidated total revenues for the
2018
fiscal period compared to
32%
for the
2017
fiscal period.
|
63
Adjusted EBITDA
increased
by
$26.9 million
, a
13%
increase
from the
2017
fiscal period.
|
•
|
Foreign exchange affected the results for the
2018
fiscal period due to strengthening of the Chilean Peso, partially offset by the weakening Peruvian Nuevo Sol relative to the USD.
|
Rest of World
Financial Overview

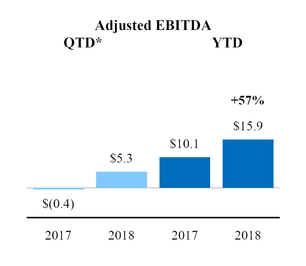
*Percentage change considered not meaningful and, therefore, not shown
Comparison of Rest of World Results for the
Three Months Ended September 30, 2018
to the
Three Months Ended September 30, 2017
|
(in millions)
|
Revenues
|
Direct Costs
|
Adjusted EBITDA
|
||||||||
|
September 30, 2017
|
$
|
49.0
|
|
$
|
49.4
|
|
$
|
(0.4
|
)
|
||
|
Organic enrollment
(1)
|
7.6
|
|
|||||||||
|
Product mix, pricing and timing
(1)
|
3.4
|
|
|||||||||
|
Organic constant currency
|
11.0
|
|
4.9
|
|
6.1
|
|
|||||
|
Foreign exchange
|
(3.5
|
)
|
(3.1
|
)
|
(0.4
|
)
|
|||||
|
Acquisitions
|
—
|
|
—
|
|
—
|
|
|||||
|
Dispositions
|
—
|
|
—
|
|
—
|
|
|||||
|
Other
|
—
|
|
—
|
|
—
|
|
|||||
|
September 30, 2018
|
$
|
56.5
|
|
$
|
51.2
|
|
$
|
5.3
|
|
||
Revenues
increased
by
$7.5 million
, a
15%
increase
from the
2017
fiscal quarter.
|
•
|
Organic enrollment
increased
during the
2018
fiscal quarter by
16%
, increasing revenues by
$7.6 million
.
|
|
•
|
Revenues represented
7%
of our consolidated total revenues for the
2018
fiscal quarter compared to
6%
for the
2017
fiscal quarter.
|
Adjusted EBITDA
increased
by
$5.7 million
from the
2017
fiscal quarter.
|
•
|
Foreign exchange affected the results for the
2018
fiscal quarter, primarily due to the weakening of the Australian Dollar relative to the USD.
|
64
Comparison of Rest of World Results for the
Nine Months Ended September 30, 2018
to the
Nine Months Ended September 30, 2017
|
(in millions)
|
Revenues
|
Direct Costs
|
Adjusted EBITDA
|
||||||||
|
September 30, 2017
|
$
|
149.2
|
|
$
|
139.1
|
|
$
|
10.1
|
|
||
|
Organic enrollment
(1)
|
21.7
|
|
|||||||||
|
Product mix, pricing and timing
(1)
|
1.4
|
|
|||||||||
|
Organic constant currency
|
23.1
|
|
16.6
|
|
6.5
|
|
|||||
|
Foreign exchange
|
(2.1
|
)
|
(1.4
|
)
|
(0.7
|
)
|
|||||
|
Acquisitions
|
—
|
|
—
|
|
—
|
|
|||||
|
Dispositions
|
—
|
|
—
|
|
—
|
|
|||||
|
Other
|
—
|
|
—
|
|
—
|
|
|||||
|
September 30, 2018
|
$
|
170.2
|
|
$
|
154.3
|
|
$
|
15.9
|
|
||
Revenues
increased
by
$21.0 million
, a
14%
increase
from the
2017
fiscal period.
|
•
|
Organic enrollment
increased
during the
2018
fiscal period by
15%
, increasing revenues by
$21.7 million
.
|
|
•
|
Revenues represented
7%
of our consolidated total revenues for the
2018
fiscal period compared to
6%
for the
2017
fiscal period.
|
Adjusted EBITDA
increased
by
$5.8 million
, a
57%
increase
from the
2017
fiscal period.
|
•
|
Foreign exchange affected the results for the
2018
fiscal period primarily due to the weakening of the Australian Dollar relative to the USD.
|
Online & Partnerships
Financial Overview

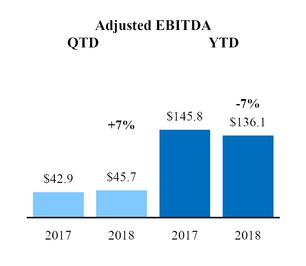
65
Comparison of Online & Partnerships Results for the
Three Months Ended September 30, 2018
to the
Three Months Ended September 30, 2017
|
(in millions)
|
Revenues
|
Direct Costs
|
Adjusted EBITDA
|
||||||||
|
September 30, 2017
|
$
|
168.4
|
|
$
|
125.5
|
|
$
|
42.9
|
|
||
|
Organic enrollment
(1)
|
(8.1
|
)
|
|||||||||
|
Product mix, pricing and timing
(1)
|
4.9
|
|
|||||||||
|
Organic constant currency
|
(3.2
|
)
|
(6.0
|
)
|
2.8
|
|
|||||
|
Foreign exchange
|
—
|
|
—
|
|
—
|
|
|||||
|
Acquisitions
|
—
|
|
—
|
|
—
|
|
|||||
|
Dispositions
|
—
|
|
—
|
|
—
|
|
|||||
|
Other
|
—
|
|
—
|
|
—
|
|
|||||
|
September 30, 2018
|
$
|
165.2
|
|
$
|
119.5
|
|
$
|
45.7
|
|
||
(1)
Organic enrollment and Product mix, pricing and timing are not separable for the calculation of direct costs and therefore are combined and defined as Organic constant currency for the calculation of Adjusted EBITDA.
Revenues
decreased
by
$3.2 million
, a
2%
decrease
from the
2017
fiscal quarter.
|
•
|
Organic enrollment
decreased
during the
2018
fiscal quarter by
6%
, decreasing revenues by
$8.1 million
.
|
|
•
|
Revenues represented
21%
of our consolidated total revenues for the
2018
fiscal quarter compared to
20%
for the
2017
fiscal quarter.
|
Adjusted EBITDA
increased
by
$2.8 million
, a
7%
increase
compared to the
2017
fiscal quarter.
Comparison of Online & Partnerships Results for the
Nine Months Ended September 30, 2018
to the
Nine Months Ended September 30, 2017
|
(in millions)
|
Revenues
|
Direct Costs
|
Adjusted EBITDA
|
||||||||
|
September 30, 2017
|
$
|
521.0
|
|
$
|
375.2
|
|
$
|
145.8
|
|
||
|
Organic enrollment
(1)
|
(28.4
|
)
|
|||||||||
|
Product mix, pricing and timing
(1)
|
5.6
|
|
|||||||||
|
Organic constant currency
|
(22.8
|
)
|
(13.1
|
)
|
(9.7
|
)
|
|||||
|
Foreign exchange
|
—
|
|
—
|
|
—
|
|
|||||
|
Acquisitions
|
—
|
|
—
|
|
—
|
|
|||||
|
Dispositions
|
—
|
|
—
|
|
—
|
|
|||||
|
Other
|
—
|
|
—
|
|
—
|
|
|||||
|
September 30, 2018
|
$
|
498.2
|
|
$
|
362.1
|
|
$
|
136.1
|
|
||
(1)
Organic enrollment and Product mix, pricing and timing are not separable for the calculation of direct costs and therefore are combined and defined as Organic constant currency for the calculation of Adjusted EBITDA.
Revenues
decreased
by
$22.8 million
, a
4%
decrease
from the
2017
fiscal period.
|
•
|
Organic enrollment
decreased
during the
2018
fiscal period by
7%
, decreasing revenues by
$28.4 million
.
|
|
•
|
Revenues represented
20%
of our consolidated total revenues for the
2018
fiscal period compared to
21%
for the
2017
fiscal period.
|
Adjusted EBITDA
decreased
by
$9.7 million
, a
7%
decrease
compared to the
2017
fiscal period.
Corporate
Corporate revenues
represent amounts from our consolidated joint venture with the University of Liverpool, as well as centralized IT costs charged to various segments, offset by the elimination of intersegment revenues. The
2017
fiscal period also included revenues from contractual arrangements with UDLA Ecuador, an institution in Ecuador that was formerly consolidated into Laureate prior to 2013.
66
Operating results for Corporate for the three months ended
September 30, 2018
and
2017
:
|
% Change
|
||||||||||
|
Better/(Worse)
|
||||||||||
|
(in millions)
|
2018
|
2017
|
2018 vs. 2017
|
|||||||
|
Revenues
|
$
|
(3.7
|
)
|
$
|
(5.7
|
)
|
35
|
%
|
||
|
Expenses
|
41.8
|
|
43.0
|
|
3
|
%
|
||||
|
Adjusted EBITDA
|
$
|
(45.5
|
)
|
$
|
(48.7
|
)
|
7
|
%
|
||
Comparison of Corporate Results for the
Three Months Ended September 30, 2018
to the
Three Months Ended September 30, 2017
Adjusted EBITDA
increased
by
$3.2 million
, a
7%
increase
from the
2017
fiscal quarter.
|
•
|
Labor costs and other professional fees decreased by
$6.0 million
for the
2018
fiscal quarter compared to the
2017
fiscal quarter.
|
|
•
|
The 2017 fiscal quarter included revenue from contractual arrangements with UDLA Ecuador of
$1.5 million
.
|
|
•
|
Other items accounted for
a decrease
in Adjusted EBITDA of
$1.3 million
.
|
Operating results for Corporate for the
nine months ended September 30, 2018
and
2017
:
|
% Change
|
||||||||||
|
Better/(Worse)
|
||||||||||
|
(in millions)
|
2018
|
2017
|
2018 vs. 2017
|
|||||||
|
Revenues
|
$
|
(9.4
|
)
|
$
|
(14.6
|
)
|
36
|
%
|
||
|
Expenses
|
118.1
|
|
138.1
|
|
14
|
%
|
||||
|
Adjusted EBITDA
|
$
|
(127.5
|
)
|
$
|
(152.7
|
)
|
17
|
%
|
||
Comparison of Corporate Results for the
Nine Months Ended September 30, 2018
to the
Nine Months Ended September 30, 2017
Adjusted EBITDA
increased
by
$25.2 million
, a
17%
increase
from the
2017
fiscal period.
|
•
|
The 2017 fiscal period included an expense of
$22.8 million
related to the portion of the April 2017 refinancing transactions that was deemed to be a debt modification.
|
|
•
|
The 2017 fiscal period included an expense of
$4.5 million
related to a transaction with a former business partner.
|
|
•
|
Labor costs and other professional fees increased expenses by
$2.8 million
for the
2018
fiscal period compared to the
2017
fiscal period.
|
|
•
|
The 2017 fiscal quarter included revenue from contractual arrangements with UDLA Ecuador of
$4.6 million
.
|
|
•
|
Other items accounted for
an increase
in Adjusted EBITDA of
$5.3 million
, which primarily includes a positive impact from the resolution of an earnout liability related to the 2014 acquisition of Monash South Africa.
|
Liquidity and Capital Resources
Liquidity Sources
We anticipate that cash flow from operations and available cash will be sufficient to meet our current operating requirements for at least the next 12 months from the date of issuance of this report.
Our primary source of cash is revenue from tuition charged to students in connection with our various education program offerings. The majority of our students finance the cost of their own education and/or seek third-party financing programs. We anticipate generating sufficient cash flow from operations in the majority of countries where we operate to satisfy the working capital and financing needs of our organic growth plans for each country. If our educational institutions within one country were unable to
67
maintain sufficient liquidity, we would consider using internal cash resources or reasonable short-term working capital facilities to accommodate any short- to medium-term shortfalls.
As of
September 30, 2018
, our secondary source of liquidity was cash and cash equivalents of
$392.3 million
, which does not include
$209.6 million
of cash recorded at subsidiaries that are classified as held for sale at
September 30, 2018
. Our cash accounts are maintained with high-quality financial institutions with no significant concentration in any one institution.
Sale Transactions
On
January 11, 2018
, we completed the sale of European University-Cyprus Ltd (EUC) and Laureate Italy S.r.L. (Laureate Italy). Upon closing, we received gross proceeds of approximately
232.0 million
Euros (EUR) (approximately US
$275.5 million
, or approximately
$244.3 million
net of cash sold and net of the
$4.1 million
working capital settlement between the Company and the buyer that was completed during the second quarter of 2018). The Company used the proceeds from this transaction, along with borrowings on our revolving credit facility that were subsequently repaid with the China sale proceeds discussed below, to repay
$350.0 million
of principal balance on our syndicated term loan that matures in April 2024 (the 2024 Term Loan).
On
January 25, 2018
, we completed the sale of LEI Lie Ying Limited (LEILY).
At closing, the Company received initial proceeds totaling approximately
$128.8 million
(approximately
$110.8 million
net of cash sold), net of banker transaction fees and certain taxes and duties totaling approximately
$16.0 million
. Six months after the closing date, the buyer was required to pay to the Company the Hong Kong Dollar (HKD) equivalent of RMB
120.0 million
(the First Holdback Payment).
On July 27, 2018, the Company received the First Holdback Payment from the buyer, net of withholding taxes and agreed-upon legal fees, for a net payment of HKD
142.2 million
(
$18.1 million
at the date of receipt), prior to banker transaction fees. Twelve months after the closing date, the buyer is required to pay to the Company the HKD equivalent of RMB
60.0 million
(the Second Holdback Payment, approximately US
$9 million
at
September 30, 2018
). Both the First Holdback Payment and the Second Holdback Payment are subject to deduction of any indemnifiable losses payable by the Company to the buyer pursuant to the sale purchase agreement. The remainder of the transaction value was paid into an escrow account and will be distributed to the Company pursuant to the terms and conditions of the escrow agreement.
On April 12, 2018, we completed the sale of Laureate Germany and received gross proceeds of EUR
1.0 million
(approximately US
$1.2 million
at the date of receipt). At the date of sale, Laureate Germany had approximately
$12.9 million
of cash and restricted cash on its balance sheet. In connection with this transaction, the Company contributed capital to Laureate Germany of approximately
$3.6 million
, and expects to pay estimated real estate transfer taxes of approximately
$0.4 million
.
On April 13, 2018, we completed the sale of Laureate Somed Holding in Morocco and received net proceeds of
300.0 million
Moroccan Dirhams (approximately US
$32.5 million
at the date of sale, or approximately
$31.1 million
net of cash sold).
The proceeds were used for general debt repayment across the Company rather than repayment of a specific tranche.
On
August 6, 2018
, we completed the sale of certain assets of Kendall College, LLC (Kendall), including Kendall's education programs, in exchange for consideration of one dollar. As part of the agreement, at closing Laureate paid
$14.0 million
to National Louis University (NLU), to support NLU's construction of facilities for the acquired culinary program on NLU's campus. In addition, Laureate paid approximately
$2.1 million
to NLU at closing for a working capital adjustment and other items provided for under the agreement. Also, at the closing date of the sale, the cease-use criteria were met for a leased building that was not part of the sale transaction and that has a lease term ending in July 2028. Accordingly, during the third quarter, the Company recorded a liability of approximately
$24.0 million
for the present value of the remaining lease costs, less estimated sublease income.
Liquidity Restrictions
Our liquidity is affected by restricted cash balances, which totaled
$196.8 million
and
$212.2 million
as of
September 30, 2018
and
December 31, 2017
, respectively.
Indefinite Reinvestment of Foreign Earnings
We earn a significant portion of our income from subsidiaries located in countries outside the United States. As part of our business strategies, we have determined that all earnings from our foreign operations will be deemed indefinitely reinvested outside of the United States. As of
September 30, 2018
,
$326.1 million
of our total
$392.3 million
of cash and cash equivalents were held by foreign subsidiaries, including
$146.9 million
held by VIEs. These amounts above do not include
$209.6 million
of cash recorded at subsidiaries that are classified as held for sale at
September 30, 2018
, of which
$196.6 million
was held by foreign subsidiaries. As of December 31, 2017,
$312.2 million
of our total
$320.6 million
of cash and cash equivalents were held by foreign subsidiaries,
68
including
$101.0 million
held by VIEs. These amounts above do not include
$197.9 million
of cash recorded at subsidiaries that are classified as held for sale at December 31, 2017, of which
$181.5 million
was held by foreign subsidiaries. The VIEs' cash and cash equivalents balances are generally required to be used only for the operations of these VIEs.
Liquidity Requirements
Our short-term liquidity requirements include: funding for debt service (including capital leases); operating lease obligations; payments due to shareholders of acquired companies; working capital; operating expenses; payments of third-party obligations; capital expenditures; and business development activities.
Long-term liquidity requirements include: payments on long-term debt (including capital leases); operating lease obligations; payments of long-term amounts due to shareholders of acquired companies; payments of deferred compensation; settlements of derivatives; and payments of third-party obligations.
Debt
On February 1, 2018, we completed an amendment of our Senior Secured Credit Facility that effectively reduces the current interest rate margins applicable to the 2024 Term Loan by 100 basis points. In connection with this amendment, we repaid
$350.0 million
of the principal balance of the 2024 Term Loan using the proceeds from the sale of our Cyprus and Italy operations, along with borrowings on our revolving credit facility that were subsequently repaid with the China sale proceeds. As a result of the
$350.0 million
repayment, there will be no further quarterly principal payments required and the remaining balance will be due at maturity.
As of
September 30, 2018
, senior long-term borrowings totaled
$2,027.7 million
and consisted of
$1,227.7 million
under the Senior Secured Credit Facility that matures in April 2022 and April 2024 and
$800.0 million
in Senior Notes due 2025 that mature in May 2025.
As of
September 30, 2018
, other debt balances totaled
$564.8 million
and our capital lease obligations and sale-leaseback financings were
$108.7 million
. Other debt includes lines of credit and short-term borrowing arrangements of subsidiaries, mortgages payable and notes payable.
Approximately
$280.0 million
of long-term debt, including the current portion, is included in the
held-for-sale liabilities recorded on the consolidated balance sheet as of
September 30, 2018
. For further description of the held-for-sale amounts see Note
4
,
Discontinued Operations and Assets Held for Sale
, in our consolidated financial statements included elsewhere in this Quarterly Report on Form 10-Q.
Senior Secured Credit Facility
As of
September 30, 2018
, the outstanding balance under our Senior Secured Credit Facility was
$1,227.7 million
, which consisted of an outstanding balance of
zero
under our $385.0 million senior secured revolving credit facility and an aggregate outstanding balance of
$1,227.7 million
, net of a debt discount, under the term loans. As of December 31,
2017
, the outstanding balance under our previous senior credit facility was
$1,625.3 million
, which consisted of $52.0 million outstanding under our $385.0 million senior secured revolving credit facility and an aggregate outstanding balance of $1,573.3 million, net of a debt discount, under the term loans.
Senior Notes
As of both
September 30, 2018
and
December 31, 2017
, the outstanding balance under our Senior Notes due 2025 was
$800.0 million
.
Covenants
Under our
Second Amended and Restated Credit Agreement
we are subject to a Consolidated Senior Secured Debt to Consolidated EBITDA financial maintenance covenant, as defined in the
Second Amended and Restated Credit Agreement
, unless certain conditions are satisfied.
As of
September 30, 2018
, these conditions were satisfied and, therefore, we were not subject to the leverage ratio covenant.
The maximum ratio, as defined, is
3.50x as of the last day of each quarter ending June 30, 2018 and thereafter.
In addition, notes payable at some of our locations contain financial maintenance covenants.
69
Leases
We conduct a significant portion of our operations from leased facilities. These facilities include our corporate headquarters, other office locations, and many of our higher education facilities.
Due to Shareholders of Acquired Companies
One method of payment for acquisitions is the use of promissory notes payable to the sellers of acquired companies. As of
September 30, 2018
and
December 31, 2017
, we recorded
$43.1 million
and
$71.8 million
, respectively, for these liabilities. See also Note
6
,
Due to Shareholders of Acquired Companies
, in our consolidated financial statements included elsewhere in this Form 10-Q.
Capital Expenditures
Capital expenditures consist of purchases of property and equipment, purchases of land use rights and expenditures for deferred costs. Our capital expenditure program is a component of our liquidity and capital management strategy. This program includes discretionary spending, which we can adjust in response to economic and other changes in our business environment, to grow our network through the following: (1) capacity expansion at institutions to support enrollment growth; (2) new campuses for institutions entering new geographic markets; (3) information technology to increase efficiency and controls; and (4) online content development. Our non-discretionary spending includes the maintenance of existing facilities. We typically fund our capital expenditures through cash flow from operations and external financing. In the event that we are unable to obtain the necessary funding for capital expenditures, our long-term growth strategy could be significantly affected. We believe that our internal sources of cash and our ability to obtain additional third-party financing, subject to market conditions, will be sufficient to fund our investing activities.
Our total capital expenditures for our continuing and discontinued operations, excluding receipts from the sale of subsidiaries and property equipment, were
$163.6 million
and
$147.3 million
during the
nine months ended September 30, 2018
, and
2017
, respectively. The
11%
increase in capital expenditures for the
2018
fiscal period compared to the
2017
fiscal period was driven by the ongoing construction of a replacement campus in Costa Rica, combined with growth initiatives in Peru. These increases were partially offset by lower capital expenditures in Mexico and online initiatives.
Derivatives
In the normal course of business, our operations are exposed to fluctuations in foreign currency values and interest rate changes. We mitigate a portion of these risks through a risk-management program that includes the use of derivatives. For further information on our derivatives, see Note
14
,
Derivative Instruments
, in our consolidated financial statements included elsewhere in this Quarterly Report on Form 10-Q.
Redeemable Noncontrolling Interests and Equity
In connection with certain acquisitions, we have entered into put/call arrangements with certain minority shareholders, and we may be required or elect to purchase additional ownership interests in the associated entities within a specified timeframe. Certain of our call rights contain minimum payment provisions. If we exercise such call rights, the consideration required could be higher than the estimated put values. Upon exercise of these puts or calls, our ownership interests in these subsidiaries would increase.
Laureate Education, Inc. Deferred Compensation Plan
Laureate maintains a deferred compensation plan to provide certain executive employees and members of our Board of Directors with the opportunity to defer their salaries, bonuses, and Board of Directors' retainers and fees in order to accumulate funds for retirement on a pre-tax basis. Participants are 100% vested in their respective deferrals and the earnings thereon. Laureate does not make contributions to the plan or guarantee returns on the investments. Although plan investments and participant deferrals are kept in a separate trust account, the assets remain Laureate’s property and are subject to claims of general creditors.
As of
September 30, 2018
and
December 31, 2017
, total plan assets included in our Consolidated Balance Sheets were
$5.1 million
and
$11.6 million
, respectively. As of
September 30, 2018
and
December 31, 2017
, the plan liabilities reported in our Consolidated Balance Sheets were
$7.7 million
and
$18.7 million
, respectively. As of
September 30, 2018
and
December 31, 2017
,
$1.5 million
and
$11.9 million
, respectively, of the total plan liability was classified as a current liability; the remainder was noncurrent and recorded in
Other long-term liabilities
. During the
nine months ended September 30, 2018
, the Company paid
$12.1 million
of plan distributions with operating cash, rather than using the plan assets in the trust. During the third quarter of 2018, the Company
70
received a partial reimbursement from the trust of $6.8 million, following the conversion of the plan's assets, which consisted of the cash surrender value of life insurance policies, into restricted cash. An estimated
$1.5 million
of additional plan distributions will be required in the twelve-month period following
September 30, 2018
. The plan distributions relate to participants who retire and are required to receive distributions of their plan balances.
Peru Acquisition
On October 5, 2018, Laureate Education Peru, SRL, an indirect wholly owned subsidiary of the Company, signed a sale purchase agreement to acquire all of the capital stock of Instituto de Educación Superior Tecnológico Privado Red Avansys SAC (Avansys), an institution in Peru, for a purchase price of
approximately
$18.5 million
.
The sale closed on November 5, 2018
and the purchase price was funded with cash of approximately $8 million in addition to a bridge loan of approximately $10.5 million that carries an interest rate of 8.15% and matures in April 2019. The Company intends to refinance the bridge loan into a long-term mortgage note payable.
Cash Flows
In the consolidated statements of cash flows, the changes in operating assets and liabilities are presented excluding the effects of exchange rate changes, acquisitions, and reclassifications, as these effects do not represent operating cash flows. Accordingly, the amounts in the consolidated statements of cash flows do not agree with the changes of the operating assets and liabilities as presented in the consolidated balance sheets. The effects of exchange rate changes on cash are presented separately in the consolidated statements of cash flows.
The following table summarizes our cash flows from operating, investing, and financing activities for each of the
nine months ended September 30, 2018
and
2017
:
|
(in millions)
|
2018
|
2017
|
|||||
|
Cash provided by (used in):
|
|||||||
|
Operating activities
|
$
|
356.4
|
|
$
|
211.8
|
|
|
|
Investing activities
|
226.8
|
|
(146.3
|
)
|
|||
|
Financing activities
|
(486.9
|
)
|
(11.4
|
)
|
|||
|
Effects of exchange rates changes on cash
|
(4.5
|
)
|
26.0
|
|
|||
|
Change in cash included in current assets held for sale
|
(35.4
|
)
|
(68.1
|
)
|
|||
|
Net change in cash and cash equivalents and restricted cash
|
$
|
56.4
|
|
$
|
11.9
|
|
|
Comparison of Cash Flows
for the Nine Months Ended September 30, 2018 to the Nine Months Ended September 30, 2017
Operating activities
Cash provided by operating activities increased by
$144.6 million
to
$356.4 million
for the
2018
fiscal period, compared to
$211.8 million
for the
2017
fiscal period. This increase in operating cash was primary due to the following: (1) Cash paid for interest
decreased
by
$130.5 million
, from
$298.5 million
for the
2017
fiscal period to
$168.0 million
for the
2018
fiscal period, which is primarily attributable to lower average debt balances and lower interest rates during the 2018 fiscal period resulting from reductions in debt principal balances and interest rates following the April 2017 debt refinancing transactions, the note conversion in August 2017 and the February 2018 repricing transaction, as well as the timing of interest payments; (2) During the 2017 fiscal period, we fully repaid the FMU seller notes, the interest portion of which was classified in operating cash flows and included in the
$39.4 million
of interest paid on deferred purchase price for acquisitions; (3) During the 2017 fiscal period we made payments of
$22.8 million
for third-party general and administrative expenses paid in connection with the debt refinancing; and (4) Proceeds from settlement of derivative contracts increased operating cash by
$13.9 million
for the 2018 fiscal period compared to the 2017 fiscal period, primarily related to the cash of
$14.1 million
received upon settlement of interest rate swaps. Partially offsetting these operating cash increases was an
increase
in cash paid for taxes of
$17.6 million
, from
$88.0 million
for the
2017
fiscal period to
$105.6 million
for the
2018
fiscal period. The
increase
in cash paid for taxes includes the net effect of an approximately $20 million refund received by one of our Spanish subsidiaries during the first quarter of
2018
from an estimated tax payment made in 2016, and the approximately
$34.8 million
of payments made to the Spanish Tax Authorities during the
2018
fiscal period, as discussed in Note
15
,
Income Taxes
, of our consolidated financial statements included elsewhere in this Form 10-Q. Changes in operating assets and liabilities and other working capital, which included deferred compensation plan payments of approximately
$12.1 million
, accounted for the remaining change in operating cash of
$44.4 million
.
71
Investing activities
Cash flows from investing activities increased by
$373.1 million
to an investing cash inflow of
$226.8 million
for the
2018
fiscal period, from an investing cash usage of
$(146.3) million
for the
2017
fiscal period. This change is primarily attributable to the sales of the Cyprus, Italy, China, Germany, Morocco and Kendall institutions during 2018, which resulted in a
$374.6 million
year-over-year increase in receipts from the sales of these Discontinued Operations and property and equipment. In addition, during the
2018
fiscal period, the Company received proceeds from corporate-owned life insurance policies, resulting in a year-over-year increase of
$24.3 million
. The life insurance proceeds are classified as restricted cash as they are plan assets of deferred compensation plans. These increases in investing cash was partially offset by a year-over-year increase in capital expenditures of
$16.3 million
and a year-over-year increase in derivative settlements of
$10.0 million
related to the realized loss on the foreign exchange swap agreements associated with the sale of the Cyprus and Italy institutions. Other items accounted for the remaining change of
$0.5 million
.
Financing activities
Financing activities cash flows
decreased
by
$475.5 million
to a financing cash usage of
$(486.9) million
for the
2018
fiscal period, from a financing cash usage of
$(11.4) million
for the
2017
fiscal period. This decrease was primarily attributable to the
$456.4 million
of net proceeds from the IPO and net proceeds from the issuance of Series A Preferred Stock of
$55.3 million
in the 2017 fiscal period. Additionally, net payments of long-term debt during the
2018
fiscal period, which included the
$350.0 million
repayment of the 2024 Term Loan, were
$109.1 million
higher than in the
2017
fiscal period. The payment of dividends on Series A Preferred Stock increased by
$5.9 million
in the
2018
fiscal period since the Series A Preferred stock dividends were paid-in-kind for a portion of the
2017
fiscal period (no further dividend payments are required following the
April 23, 2018
conversion of the Series A Preferred Stock into Class A common stock). These financing cash decreases were partially offset by lower payments during the
2018
fiscal period of approximately
$76.0 million
in debt issuance costs and redemption and call premiums than in the
2017
fiscal period as a result of the debt refinancing that was completed during the second quarter of 2017, in addition to lower payments of deferred price for acquisitions during the
2018
fiscal period versus the
2017
fiscal period of
$76.2 million
, due primarily to the repayment of the FMU seller note in September 2017. Other items accounted for the remaining change of
$1.0 million
.
Critical Accounting Policies and Estimates
The preparation of the consolidated financial statements in conformity with GAAP requires our management to make estimates and assumptions that affect the reported amounts of assets, liabilities, revenues and expenses, and the related disclosure of contingent assets and liabilities. Actual results could differ from these estimates. Our significant accounting policies are discussed in Note
2
,
Significant Accounting Policies
, of the audited consolidated financial statements included in our 2017 Form 10-K. Our critical accounting policies require the most significant judgments and estimates about the effect of matters that are inherently uncertain. As a result, these accounting policies and estimates could materially affect our financial statements and are critical to the understanding of our results of operations and financial condition. For a complete discussion of our critical accounting policies, see the “Critical Accounting Policies and Estimates” section of the MD&A in our 2017 Form 10-K. During the
nine months ended September 30, 2018
, there were no significant changes to our critical accounting policies.
Recently Issued Accounting Standards
Refer to Note
2
,
Significant Accounting Policies
, in our consolidated financial statements included elsewhere in this Form 10-Q for recently issued accounting standards.
For information regarding our exposure to certain market risks, see Item 7A, Quantitative and Qualitative Disclosures About Market Risk, in our 2017 Form 10-K. There have been no significant changes in our market risk exposures since our December 31, 2017 fiscal year end.
Evaluation of Disclosure Controls and Procedures
Our management, with the participation of our Chief Executive Officer (CEO) and Chief Financial Officer (CFO), has evaluated the effectiveness of our disclosure controls and procedures (as defined in Rules 13a-15(e) and 15d-15(e) under the Securities Exchange Act of 1934 (the Exchange Act)), as of the end of the period covered by this Quarterly Report on Form 10-Q. The
72
purpose of disclosure controls and procedures is to ensure that information required to be disclosed in the reports we file or submit under the Exchange Act is recorded, processed, summarized and reported within the time periods specified in the SEC's rules and forms, and that such information is accumulated and communicated to management, including our CEO and CFO, to allow timely decisions regarding required disclosures. Based on that evaluation, our CEO and CFO have concluded that, as of the end of the period covered by this Quarterly Report on Form 10-Q, our disclosure controls and procedures were not effective due to the four material weaknesses, previously disclosed in Item 9A of our 2017 Form 10-K.
Remediation Update of Previously Identified Material Weaknesses
We have implemented processes and controls to enhance our internal control over financial reporting with respect to each of the four material weaknesses that were previously identified and disclosed in Item 9A of our 2017 Form 10-K.
Risk Assessment
As first disclosed in our Annual Report on Form 10-K for the fiscal year ended December 31, 2016 (the 2016 Form 10-K), we identified a material weakness in our risk assessment process, which we determined was not operating adequately to identify and address the risks to our business and to establish appropriate control objectives given the environment in which we operate and the decentralized structure used to manage our operating activities.
In order to remediate this material weakness, we have designed and implemented an improved enterprise wide risk management process that follows the COSO 2013 framework including identifying and mitigating risks to our business that could have an impact on our internal control over financial reporting. During 2017, a full review was performed on our processes and controls across locations in order to identify and address potential design gaps, to standardize the design of these processes and controls across locations, and to ensure location-specific processes and controls were designed to address location specific risks.
Our process also includes periodic updates of the enterprise risk universe through the consideration of current and historical risks, periodic input from Corporate, segment and local management as well as other stakeholders. Each time a new risk is identified, we evaluate if additional controls are required to mitigate risks to our internal control over financial reporting. Also, during 2017, we engaged a global professional services firm as an extension of the internal controls team, to assist with the standardization of controls and risks globally and perform independent testing of the entity-level and transactional-level controls including IT general and application controls. In the third quarter of 2018, we completed the design assessment of the entity-level and transactional-level controls including IT general and application controls and now are in the process of testing the operating effectiveness. Also, during the third quarter of 2018, we completed and implemented a formalized change management framework which is focused on identifying and addressing on a timely basis significant changes in the business that may have a controls implication.
Contract Legal Compliance
As first disclosed in our 2016 Form 10-K, we identified a material weakness in that we did not appropriately assess the risks relating to our contracting processes and did not have controls that were properly designed or operating effectively to detect and prevent fraud. Specifically, our controls over contracting processes were not designed or operating effectively to incorporate appropriate levels of due diligence, requisite management approvals, segregation of duties or ongoing monitoring.
During 2017, we designed and implemented a process to track and monitor contracts on a global basis. As part of our design, we have implemented an IT solution across all of our segments which has further enhanced the process as a central repository for contracts, ensured segregation of duties, and facilitated contract review and approval. We enhanced our controls to ensure adequate due diligence is performed and reviewed. In addition, the Company created a contract management office that has been staffed with employees located across our global footprint. The implementation of remediation activities has resulted in a contract management process that incorporates appropriate levels of due diligence, requisite management approvals, segregation of duties, ongoing monitoring. In the third quarter of 2018, we completed the design assessment of the contract legal compliance process and the implementation of controls to ensure contracts are appropriately executed and monitored and we are in the process of testing the operating effectiveness.
Information Technology General Controls
As first disclosed in our 2016 Form 10-K, we identified a material weakness in that we did not maintain effective controls over the operating effectiveness of information technology ("IT") general controls for information systems that are relevant to the preparation of our financial statements. Specifically we did not:
73
|
(i)
|
maintain program change management controls to ensure that IT program and data changes affecting financial IT applications and underlying accounting records are identified, tested, authorized and implemented appropriately;
|
|
(ii)
|
maintain user access controls to ensure appropriate segregation of duties and that access to financial applications and data is adequately restricted to appropriate personnel; and
|
|
(iii)
|
maintain computer operations controls to ensure that privileges are appropriately granted, and data backups are authorized and monitored.
|
In order to remediate this material weakness, we have implemented processes and controls as part of our plan to remediate the material weakness around IT general controls including: identifying a global list of in-scope systems, designing and implementing a global monitoring control over the performance of IT general controls, providing targeted training to our IT control owners to further assist in correcting control deficiencies and walking through and testing our IT general controls. Also, the Company has created an IT Compliance group within the Global IT department whose mission is to identify and monitor the general IT control environment. These resources are located across our global footprint. IT general controls have been implemented across our IT general control environment and we are in the process of testing the operating effectiveness. In the third quarter of 2018, we completed the design assessment of IT general and application controls.
Key Reports and Spreadsheets
As first disclosed in our Registration Statement on Form S-1 filed on October 2, 2015, we identified a material weakness in that we had inadequate controls over key reports and spreadsheets. Specifically, we did not design adequate controls to address the completeness and accuracy of key reports and key spreadsheets.
In order to remediate this material weakness, we have designed and implemented a process to ensure the completeness and accuracy of key reports and key spreadsheets used in our internal controls over financial reporting. During 2017, we completed the process of creating an inventory of these reports and spreadsheets across our significant locations and provided training to employees responsible for the relevant controls that involve these reports and spreadsheets. We have implemented a standardized process to identify and test the completeness and accuracy of the key reports and spreadsheets. During the third quarter of 2018, we performed base-line testing of the key reports and instituted change management controls, which will be tested on an ongoing basis. We also restricted access to all key spreadsheets to appropriate individuals to protect from inadvertent or unintentional changes to data.
Although we have implemented and tested the additional controls across each of the four material weaknesses as detailed in our remediation plan above, the controls have not been in place and operating for a sufficient period to evaluate whether the material weakness has been remediated.
Changes in Internal Controls over Financial Reporting
Except for the changes described above under “Remediation Update of Previously Identified Material Weaknesses,” there were no changes in our internal control over financial reporting during the fiscal quarter ended
September 30, 2018
that have materially affected, or are reasonably likely to materially affect our internal control over financial reporting.
74
Please refer to ‘‘Item 3. Legal Proceedings’’ in our Annual Report on Form 10-K for the year ended December 31, 2017 and our Quarterly Report on Form 10-Q for the quarter ended June 30, 2018, for information regarding material pending legal proceedings. Except as set forth therein and below, there have been no new material legal proceedings and no material developments in the legal proceedings previously disclosed.
On October 18, 2016, a former student filed suit against us and Walden University pro se in the United States District Court for the District of Maryland in the matter of
Eric D. Streeter v. Walden University, et. al. (Case No. 1CCB6-CV-3460)
, claiming that his progress in his program was delayed by Walden University and Laureate. The claims included unjust enrichment, breach of contract, violation of the Maryland Consumer Protection Act, violation of the Due Process Clause in the Fourteenth Amendment, libel, and violation of the False Claims Act. We filed a motion to dismiss on April 12, 2017, which was granted on December 5, 2017. On July 10, 2018, the U.S. Fourth Circuit Court of Appeals affirmed the judgment of the district court dismissing the suit. Streeter filed a petition for writ of certiorari to the U.S. Supreme Court on October 9, 2018.
In addition, several groups of current and former students filed separate law suits in the Seventh Judicial Circuit in and for St. Johns County, Florida against St. Augustine relating to matters arising before we acquired that institution in November 2013. The pending suits are
Hemingway et al. v. University of St. Augustine for Health Sciences, Inc.
filed on August 12, 2013 and
Johnson v. University of St. Augustine for Health Sciences, LLC
filed on June 16, 2016.
Miller v. University of St. Augustine for the Health Sciences, LLC,
filed on February 12, 2018, was resolved and dismissed on August 31, 2018. The allegations in the cases relate to a program that was launched in May 2011 and, at the time, offered a ‘‘Master of Orthopaedic Physician’s Assistant Program’’ degree. The plaintiffs in these matters allege that the university misrepresented their ability to practice as licensed Physician Assistants with a heightened specialty in orthopaedics. The plaintiffs are seeking relief including refund of tuition paid to St. Augustine, as well as loan debt incurred by the plaintiffs while attending St. Augustine, loss of future earnings, litigation costs and punitive damages. The
Hemingway
matter is scheduled for trial in November 2018. The
Johnson
matter is at a preliminary stage of discovery. We believe the claims in these cases are without merit and intend to defend vigorously against the allegations. With respect to the two pending St. Augustine cases, under the terms of the acquisition agreement for St. Augustine, we expect to be indemnified by the seller for substantially all of the liability with respect to any claims in these cases. We also have a right of set-off against the seller for such amounts.
In November 2017, Chin Zhingxian (a minority shareholder in the HIEU group) commenced civil proceedings in the Higher Court of Hunan Province in the People's Republic of China against LEI Lie Ying Limited and Steven Lin (a former Laureate employee) seeking return of a capital contribution of RMB 172 million and for loss of interest of RMB 28 million or the distribution of dividends in an equivalent amount. In connection with these proceedings, the court prohibited the transfer of shares in Hunan Lie Ying Industry Co Ltd held by LEI Lie Ying Limited equal to 10.6% of the shares in Hunan Lie Ying Industry Co Ltd. pending resolution of the matter on the merits. On November 5, 2018, the court entered judgment in favor of the current and former Laureate affiliates and dismissed this case.
In December 2017, Guangdong Nanbo Education Investment Co Ltd (a minority shareholder in the HIEU group) commenced civil proceedings in the Higher Court of Hunan Province in the People's Republic of China against LEI Lie Ying Limited (as majority shareholder) and Laureate Shanghai alleging the invalidity of service agreements entered into between HIEU and Laureate Shanghai and the infringement by LEI Lie Ying Limited of HIEU's interests, seeking the repayment of RMB 265 million fees paid under those agreements. In connection with these proceedings, the court prohibited the transfer of shares in Hunan Lie Ying Industry Co Ltd held by LEI Lie Ying Limited equal to 22.8% of the shares in Hunan Lie Ying Industry Co Ltd. pending resolution of the matter on the merits. On November 5, 2018, the court entered judgment in favor of the current and former Laureate affiliates and dismissed this case.
In June 2016, Li Shihong and Hunan Lieying Education Investment Management Co Ltd commenced civil proceedings in the Changsha Intermediary Court in the People's Republic of China against Zhang Jiangbo, Zhang Jianbo, Ch
e
n Zhingxian, Hunan New Lieying Science and Education Co Ltd and Hunan International Economics University, our former network institution in China ("HIEU"). Zhang Jiangbo, Zhang Jianbo and Ch
e
n Zhingxian were the minority shareholders in the HIEU group. The plaintiffs claim that the defendants are liable to pay an amount of RMB 170 million (approximately $25 million at
September 30, 2018
) based on a debt repayment document executed in 2014. The document was signed by the minority shareholders and Hunan New Lieying Science and Education Co Ltd and Zhang Jiangbo, allegedly on behalf of HIEU, in effect as a guarantor and a seal was affixed, allegedly being that of HIEU. The plaintiffs also claim interest and litigation expenses. HIEU has filed a defense and evidence in this matter contending that Zhang Jiangbo was not authorized to execute the document on behalf of HIEU, nor to affix
75
any HIEU seal, and contending further that in any event an education institution is not permitted to guarantee a loan for non-educational purposes. Zhang Jiangbo has admitted to the court that he lacked such authorization. The Changsha Intermediary Court issued a judgment on October 25, 2017 which dismissed this claim. The plaintiffs appealed to the Higher People's Court of Hainan Province on November 25, 2017 and the Court ordered on June 22, 2018 that the Changsha Intermediary Court rehear the case
.
Chen Zhengxian passed away on May 5, 2018, and she left all her legacy to her nephew Mr. Zheng Ziben who is a Hong Kong citizen. Changsha Intermediary Court further ordered on September 26, 2018 that the Higher People's Court of Hainan Province should be the trial court because the case involves a Hong Kong citizen and is now a foreign-related case.
Under the arrangements for the sale of our interest in HIEU, we have indemnified the purchaser against liabilities which arise from these claims subject to an aggregate cap on liability of RMB 400 million (approximately $58 million at
September 30, 2018
).
76
Except as set forth below, there have been no material changes in the Risk Factors included in Item 1A of our 2017 Form 10-K as updated in Part II, Item 1A of our Form 10-Q for the quarter ended March 31, 2018.
Our divestiture activities and the planned strategic shift in our business may disrupt our ongoing business, involve increased expenses and present risks not contemplated at the time of the transactions.
We are continuing to pursue our previously announced strategy of simplifying and focusing our business, including our announced plan to divest assets in Europe, Asia and Central America and create two scaled enterprises - one campus-based business primarily focused on emerging markets in Latin America, and one fully online platform in the U.S. These currently contemplated divestitures, along with past and any future divestitures, and the planned strategic shift in our business involve significant financial, operational and managerial risks and uncertainties, including:
|
•
|
inability to find potential buyers or otherwise complete transactions on favorable terms;
|
|
•
|
failure to effectively transfer liabilities, contracts, facilities and employees to buyers;
|
|
•
|
requirements that we indemnify buyers against certain liabilities and obligations;
|
|
•
|
the possibility that we will become subject to third-party claims arising out of a divestiture;
|
|
•
|
challenges in identifying and separating the intellectual property and data to be divested from the intellectual property and data that we wish to retain;
|
|
•
|
challenges in collecting the proceeds from any divestiture;
|
|
•
|
the possible need to restructure our capital and debt structure;
|
|
•
|
realization of our intended tax treatment of a divestiture;
|
|
•
|
inability to eliminate or reduce overhead and fixed costs associated with the divested assets or business and operate the retained business on a cost-effective and efficient basis;
|
|
•
|
disruption of our retained ongoing business and distraction of management; and
|
|
•
|
loss of key employees as a result of a contemplated or completed divestiture.
|
We may not be successful in overcoming the above risks and uncertainties or any other problems encountered in connection with a divestiture, which may adversely affect our operations and financial results. In addition, there is no assurance that our currently contemplated divestitures - or future divestitures - will be completed, will be completed within our contemplated timeframe, or will be completed on terms sufficient to allow us to achieve the anticipated benefits from the divestitures.
Risks Relating to Our Highly Regulated Industry in the United States
Congress may revise the laws governing Title IV programs or reduce funding for those and other student financial assistance programs, and the DOE may revise its regulations administering Title IV programs, any of which could reduce our enrollment and revenues and increase costs of operations.
The U.S. Higher Education Act (the “HEA”) is a federal law that governs Title IV programs. The U.S. Congress must authorize and appropriate funding for Title IV programs under the HEA and can change the laws governing Title IV programs at any time. The HEA was most recently reauthorized in August 2008. Congress is currently in the process of reauthorizing the HEA and has conducted hearings examining various issues including, but not limited to, the streamlining of Title IV financial aid programs and repayment systems, the role of consumer information in college choices by students and families, whether Title IV programs should include institutional risk sharing, and the role of accrediting agencies in ensuring institutional quality, among other items. On December 13, 2017, the Committee on Education and the Workforce of the U.S. House of Representatives approved legislation to reauthorize the HEA, titled the “Promoting Real Opportunity, Success, and Prosperity through Education Reform Act” (PROSPER Act). If enacted in its current form, this legislation would substantially amend the HEA to, among other things, make changes to Title IV programs and provisions governing institutional participation therein. We cannot predict the timing and
77
terms of any eventual HEA reauthorization, including any potential changes to institutional participation, student eligibility requirements or funding levels for particular Title IV programs, which terms may materially adversely affect our business, financial condition and results of operations.
Apart from Title IV programs, eligible veterans and military personnel may receive educational benefits for the pursuit of higher education. A reduction in federal funding levels for Title IV programs, or for programs providing educational benefits to veterans and military personnel, could reduce the ability of some students to finance their education. We cannot predict with certainty the future funding levels for Title IV programs, or for programs providing educational benefits to veterans and military personnel, or the nature of any future revisions to the law or regulations related to these programs. Because a significant percentage of the revenues of our U.S. Institutions is and is expected to be derived from Title IV programs, any action by the U.S. Congress that significantly reduces Title IV program funding or the ability of our U.S. students to participate in Title IV programs could have a material adverse effect on the enrollments, business, financial condition and results of operations of our postsecondary educational institutions in the United States (our U.S. Institutions). Congressional action also may require our U.S. Institutions to modify their practices in ways that could increase administrative costs and reduce profit margins, which could have a material adverse effect on our business, financial condition and results of operations.
In recent years, the U.S. Department of Education (“DOE”) has promulgated a substantial number of new regulations that impact our U.S. Institutions, including, but not limited to, state authorization, gainful employment, financial responsibility, borrower defenses to repayment, and the definition of a credit hour for the purpose of determining program eligibility for Title IV student financial aid. On October 30, 2014, the DOE published regulations to define “gainful employment” for the purposes of the Title IV program requirement that educational programs offered by proprietary institutions prepare students for gainful employment in recognized occupations, which became effective on July 1, 2015. On July 5, 2017, the DOE further announced that it would allow additional time, until July 1, 2018, for institutions to comply with certain disclosure requirements in the gainful employment regulations. On June 16, 2017, the DOE published a notice of intent to establish a negotiated rulemaking committee to develop proposed revisions to the gainful employment regulations. The DOE held negotiated rulemaking sessions on the gainful employment rule in December 2017, February 2018 and March 2018 and failed to meet consensus on the DOE’s proposed regulatory changes. On August 14, 2018, the DOE released a Notice of Proposed Rulemaking which would rescind its gainful employment regulations and related requirements. Comments were due September 13, 2018. The DOE has publicly indicated that it will not meet the master calendar deadline of November 1 to issue a new regulation to rescind the gainful employment requirements, and therefore it is not clear when any new such regulation will become effective. We cannot predict with any certainty the outcome of the DOE’s proposal to rescind the gainful employment regulations or the extent to which it ultimately proposes gainful employment regulations that differ from the current regulations.
On December 19, 2016, the DOE published final regulations regarding state authorization for programs offered through distance education and state authorization for foreign locations of institutions. Among other provisions, these final regulations require that an institution participating in the Title IV federal student aid programs and offering post‑secondary education through distance education be authorized by each state in which the institution enrolls students, if such authorization is required by the state. The DOE would recognize authorization through participation in a state authorization reciprocity agreement, if the agreement does not prevent a state from enforcing its own laws. The final regulations also require that foreign additional locations and branch campuses be authorized by the appropriate foreign government agency and, if at least 50% of a program can be completed at the location/branch, be approved by the institution’s accrediting agency and be reported to the state where the main campus is located. The final regulations would also require institutions to document the state process for resolving complaints from students enrolled in programs offered through distance education or correspondence courses and make certain public and individualized disclosures to enrolled and prospective students about their distance education programs. These final regulations are effective July 1, 2018.
The DOE may adopt regulations governing federal student loan debt forgiveness that could result in liability for amounts based on borrower defenses or affect the DOE’s assessment of our institutional capability.
Under the DOE’s current regulations, a William D. Ford Federal Direct Loan Program (the “Direct Loan Program”) borrower may assert as a defense to repayment any “act or omission of the school attended by the student that would give rise to a cause of action against the school under applicable State law.” On November 1, 2016, the DOE published a rule that, among other provisions, established new standards and processes for determining whether a Direct Loan Program borrower has a defense to repayment (“DTR”) on a loan due to acts or omissions by the institution at which the loan was used by the borrower for educational expenses (the “2016 DTR regulations”). The 2016 DTR regulations were to take effect on July 1, 2017. On June 15, 2017, the DOE announced an indefinite delay to its implementation of the 2016 DTR regulations, and on June 16, 2017 published a notice of intent to establish a negotiated rulemaking committee to develop proposed revisions to the rule.
Among other topics, the 2016 DTR regulations established permissible borrower defense claims for discharge, procedural rules under which claims would be adjudicated, time limits for borrowers’ claims, and guidelines for recoupment by the DOE of
78
discharged loan amounts from institutions of higher education. They also prohibited schools from using any pre‑dispute arbitration agreements, prohibited schools from prohibiting relief in the form of class actions by student borrowers, and invalidated clauses imposing requirements that students pursue an internal dispute resolution process before contacting authorities regarding concerns about an institution. For proprietary institutions, the 2016 DTR regulations described the threshold for loan repayment rates that would require specific disclosures to current and prospective students and the applicable loan repayment rate methodology. The 2016 DTR regulations also established important new financial responsibility and administrative capacity requirements for both not‑for‑profit and for‑profit institutions participating in the Title IV programs. Under the 2016 DTR regulations, certain events would automatically trigger a letter of credit, and the DOE retained discretion to impose a letter of credit upon the occurrence of other events.
The DOE held negotiated rulemaking sessions in November 2017, January 2018 and February 2018 regarding the 2016 DTR regulations. The DOE and negotiators failed to reach consensus on revised DTR regulations. On July 31, 2018, the DOE published in the Federal Register a proposed rule which would replace most substantive provisions of the 2016 DTR regulations. Following a 30-day public comment period, the DOE was expected to issue a final rule by November 1, 2018, taking effect July 1, 2019; however, the DOE indicated in a court filing that it would miss the November 1, 2018 deadline. Therefore, it is not clear when the 2018 version of the DTR regulations would be announced or when they will become effective.
On July 6, 2017, the attorneys general of 18 states and the District of Columbia filed suit against the DOE claiming that its delay of the 2016 DTR regulations violated applicable law, including the Administrative Procedure Act. Through a series of orders dated September 12 and 17, and October 12, 2018, the U.S. District Court for the District of Columbia held that procedural delays by the DOE in implementing the 2016 DTR regulations were improper and that the 2016 DTR regulations would be reinstated as of October 16, 2018.
The effectiveness and applicability of the 2016 DTR regulations to the period between July 1, 2017 (the original effective date) and October 16, 2018 is not entirely clear as the DOE has indicated that it will issue further guidance on the implementation in the near future. We cannot state with any certainty the impact that complying with the 2016 DTR regulations might have on our business. If we are required to repay the DOE for any successful DTR claims by students who attended our U.S. Institutions, or if we are required to obtain additional letters of credit or increase our current letter of credit, it could materially affect our business, financial conditions and results of operations.
If any of our U.S. Institutions do not meet specific financial responsibility standards established by the DOE, that institution may be required to post a letter of credit or accept other limitations to continue participating in Title IV programs, or that institution could lose its eligibility to participate in Title IV programs.
To participate in Title IV programs, our U.S. Institutions must satisfy specific measures of financial responsibility prescribed by the DOE, or post a letter of credit in favor of the DOE and possibly accept other conditions on its participation in Title IV programs. These financial responsibility tests are applied on an annual basis based on an institution’s audited financial statements, and may be applied at other times, such as if an institution undergoes a change in control. The DOE may also apply such measures of financial responsibility to an eligible institution’s operating company and ownership entities and, if such measures are not satisfied by the operating company or ownership entities, require the institution to post a letter of credit in favor of the DOE and possibly accept other conditions on its participation in Title IV programs. The operating restrictions that may be placed on an institution that does not meet the quantitative standards of financial responsibility include changes to the method of receiving Title IV program funds, which in some cases may result in a significant delay in the institution’s receipt of those funds. Limitations on, or termination of, our participation in Title IV programs as a result of our failure to demonstrate financial responsibility would limit our students’ access to Title IV program funds, which could significantly reduce enrollments and have a material adverse effect on our business, financial condition and results of operations.
As described in more detail under “Item 1-Business-Industry Regulation-U.S. Regulation” in our Annual Report on Form 10-K for the year ended December 31, 2017, the DOE annually assesses our U.S. Institutions’ financial responsibility through a composite score determination based on the Laureate consolidated audited financial statements and not at the individual institutional level. Based on Laureate’s composite score for its fiscal year ended December 31, 2016, the DOE determined that it, and consequently, Walden University, NewSchool of Architecture and Design, Kendall College and St. Augustine failed to meet the standards of financial responsibility. As a result, in a letter dated October 30, 2017, the Department required Laureate to increase its existing letter of credit to $136,887,941 (15% of the Title IV program funds that such schools received during the most recently completed fiscal year), continued the institutions on Heightened Cash Monitoring 1 and required Laureate to continue to comply with additional notification and reporting requirements, including submitting bi‑weekly cash flow statements for Laureate and monthly student rosters of the institutions. In a letter dated March 1, 2018, the DOE required Laureate to provide additional ongoing information about its current operations and future plans, including bi‑weekly updates on its cash balances and monthly cash flow statements and student rosters for its U.S. Institutions, beginning in April 2018.
79
In December 2015, the DOE sent us a letter requiring us to post a letter of credit in the amount of $14,967 for St. Augustine (25% of the total Title IV program refunds the institution made or should have made during the fiscal year ended December 31, 2014). This requirement was due to the fact that St. Augustine was found to have untimely processed refunds of Title IV program funds for withdrawn students for more than 5% of the students in its auditor’s sample for the 2014 fiscal year. We have obtained this letter of credit. Any obligation to post, maintain or increase a letter of credit could materially adversely affect our liquidity or increase our costs of regulatory compliance. The DOE has the discretion to increase our letter of credit requirements at any time. If we are unable to secure any required letter of credit, our U.S. Institutions would lose their eligibility to participate in Title IV programs, which could have a material adverse effect on our business, financial condition and results of operations.
On November 1, 2016, as part of its defense to repayment rulemaking, the DOE issued a rule to revise its general standards of financial responsibility to include various actions and events that would require institutions to provide the DOE with irrevocable letters of credit upon the occurrence of certain triggering events. On June 15, 2017, the DOE announced an indefinite delay to its implementation of the 2016 DTR regulations, which were to take effect on July 1, 2017. On July 6, 2017, the attorneys general of 18 states and the District of Columbia filed suit against the DOE claiming that its delay of the 2016 DTR regulations violated applicable law, including the Administrative Procedure Act. Through a series of orders dated September 12 and 17, and October 12, 2018, the U.S. District Court for the District of Columbia held that procedural delays by the DOE in implementing the 2016 DTR regulations were improper and that the 2016 DTR regulations would be reinstated as of October 16, 2018. The 2016 DTR regulations include various actions and events that would require institutions to provide the DOE with irrevocable letters of credit upon the occurrence of certain triggering events. For additional information regarding this rule and current rulemaking, see “Risk Factors-Risks Relating to Our Highly Regulated Industry in the United States-The DOE may adopt regulations governing federal student loan debt forgiveness that could result in liability for amounts based on borrower defenses or affect the DOE’s assessment of our institutional capability,” in our Form 10-K. If we are required to repay the DOE for any successful DTR claims by students who attended our U.S. Institutions, or we are required to obtain additional letters of credit or increase our current letter of credit, it could materially affect our business, financial conditions and results of operations.
We or certain of our educational programs at our U.S. Institutions may lose eligibility to participate in Title IV programs if any of our U.S. Institutions or certain of their educational programs cannot satisfy the DOE’s “gainful employment” requirements.
Under the HEA, proprietary schools generally are eligible to participate in Title IV programs in respect of educational programs that lead to “gainful employment in a recognized occupation.” Historically, the concept of “gainful employment” has not been defined in detail. On October 30, 2014, the DOE published regulations to define “gainful employment,” which became effective on July 1, 2015. The regulations define this concept using two ratios, one based on annual debt‑to‑annual earnings (“DTE”) and another based on annual debt‑to‑discretionary income (“DTI”) ratio. Under the regulations, an educational program with a DTE ratio at or below 8% or a DTI ratio at or below 20% is considered “passing.” An educational program with a DTE ratio greater than 8% but less than or equal to 12% or a DTI ratio greater than 20% but less than or equal to 30% is considered to be “in the zone.” An educational program with a DTE ratio greater than 12% and a DTI ratio greater than 30% is considered “failing.” An educational program will cease to be eligible for students to receive Title IV program funds if its DTE and DTI ratios are failing in two out of any three consecutive award years or if both of those rates are failing or in the zone for four consecutive award years. The regulations also require an institution to provide warnings to current and prospective students in programs which may lose Title IV eligibility at the end of an award or fiscal year. For more information see “Item 1-Business-Industry Regulation-U.S. Regulation-Regulation of Federal Student Financial Aid Programs-Gainful Employment” in our Annual Report on Form 10-K for the year ended December 31, 2017.
In January 2017, the DOE issued final DTE rates to institutions. Among the Classification of Instructional Programs reported within NewSchool of Architecture and Design, Kendall College and Walden University, the DOE has indicated that we had one that failed and five in the zone. This represents a total of one educational program that failed and ten in the zone. St. Augustine had no programs that failed or were in the zone. The percentage of students enrolled in the educational program that failed represents approximately 1% of the students currently enrolled in our U.S. Institutions. The percentage of students enrolled in the educational programs that were in the zone represents approximately 5%. We are currently examining and implementing options for each of these programs and their students. We are discontinuing the program that failed. For one of the programs in the zone, we conducted an alternate salary survey and are appealing the zone score to the DOE. Additionally, the regulations require an institution to certify to the DOE that its educational programs subject to the gainful employment requirements, which include all programs offered by our U.S. Institutions, meet the applicable requirements for graduates to be professionally or occupationally licensed or certified in the state in which the institution is located. The regulations also include requirements for the reporting of student and program data by institutions to the DOE and expand the disclosure requirements that have been in effect since July 1, 2011. On July 5, 2017, the DOE announced that it would allow additional time, until July 1, 2018, for institutions to comply with certain disclosure requirements in the gainful employment regulations.
On June 16, 2017 the DOE published a notice of intent to establish a negotiated rulemaking committee to develop proposed revisions to the gainful employment regulations. The DOE held negotiated rulemaking sessions on the gainful employment rule
80
in December 2017, February 2018 and March 2018 and failed to reach consensus. On August 14, 2018, the DOE issued a notice in the Federal Register, proposing to rescind the gainful employment regulations and related requirements. Comments were due September 13, 2018. We cannot predict with any certainty the outcome of the DOE’s proposal to rescind the gainful employment regulations or the extent to which it ultimately proposes gainful employment regulations that differ from the current regulations.
The failure of any program or programs offered by any of our U.S. Institutions to satisfy any gainful employment regulations could render that program or programs ineligible for Title IV program funds. Additionally, any gainful employment data released by the DOE about our U.S. Institutions or warnings provided under the regulations could influence current students not to continue their studies, discourage prospective students from enrolling in our programs or negatively impact our reputation. If a particular educational program ceased to become eligible for Title IV program funds, either because it fails to prepare students for gainful employment in a recognized occupation or due to other factors, we may choose to cease offering the program. It is possible that several programs offered by our schools may be adversely affected by the regulations due to lack of specialized program accreditation or certification or in the states in which such institutions are based. We also could be required to make changes to certain programs in the future in order to comply with the rule or to avoid the uncertainty associated with such compliance. Any of these factors could reduce enrollments, impact tuition prices, and have a material adverse effect on our U.S. Institutions’ business, financial condition and results of operations.
81
(a) Exhibits filed with this report or, where indicated, previously filed and incorporated by reference:
|
Exhibit
No.
|
Exhibit Description
|
Form
|
File Number
|
Exhibit
Number
|
Filing Date
|
|
2.1#
|
10-K
|
001-38002
|
2.7
|
03/20/2018
|
|
|
2.2#
|
8-K
|
001-38002
|
2.1
|
04/18/2018
|
|
|
2.3#
|
8-K
|
001-38002
|
2.1
|
08/07/2018
|
|
|
2.4#
|
10-Q
|
001-38002
|
2.4
|
08/09/2018
|
|
|
3.1
|
S‑1/A
|
333‑207243
|
3.1
|
01/31/2017
|
|
|
3.2
|
S‑1/A
|
333‑207243
|
3.2
|
01/31/2017
|
|
|
3.3
|
8-K
|
001-38002
|
3.1
|
07/20/2018
|
|
|
4.1
|
8-K
|
001-38002
|
4.1
|
04/27/2017
|
|
|
4.2
|
8-K
|
001-38002
|
4.1
|
04/27/2017
|
|
|
4.3
|
8-K
|
001-38002
|
4.3
|
04/27/2017
|
|
|
4.4
|
8-K
|
001-38002
|
4.3
|
04/27/2017
|
|
|
10.1†
|
S‑1/A
|
333‑207243
|
10.31
|
11/20/2015
|
|
|
10.2†
|
S‑1/A
|
333‑207243
|
10.32
|
11/20/2015
|
|
|
10.3†
|
S‑1/A
|
333‑207243
|
10.34
|
11/20/2015
|
|
|
10.4†
|
S‑1/A
|
333‑207243
|
10.35
|
11/20/2015
|
|
|
10.5†
|
S‑1/A
|
333‑207243
|
10.36
|
11/20/2015
|
|
|
10.6†
|
S‑1/A
|
333‑207243
|
10.38
|
12/23/2015
|
|
|
10.7†
|
S‑4/A
|
333‑208758
|
10.37
|
01/20/2016
|
|
|
10.8†
|
S‑1/A
|
333‑207243
|
10.39
|
11/20/2015
|
|
|
10.9†
|
S‑1/A
|
333‑207243
|
10.40
|
11/20/2015
|
|
|
10.10†
|
S‑1/A
|
333‑207243
|
10.41
|
11/20/2015
|
|
|
10.11†
|
S‑1/A
|
333‑207243
|
10.42
|
11/20/2015
|
|
|
10.12†
|
S‑1/A
|
333‑207243
|
10.43
|
11/20/2015
|
|
82
|
Exhibit
No.
|
Exhibit Description
|
Form
|
File Number
|
Exhibit
Number
|
Filing Date
|
|
10.13
|
S‑1/A
|
333‑207243
|
10.44
|
11/20/2015
|
|
|
10.14
|
S‑1/A
|
333‑207243
|
10.45
|
11/20/2015
|
|
|
10.15‡
|
S‑1/A
|
333‑207243
|
10.46
|
11/20/2015
|
|
|
10.16†
|
S‑1/A
|
333‑207243
|
10.47
|
11/20/2015
|
|
|
10.17†
|
S‑1/A
|
333‑207243
|
10.48
|
11/20/2015
|
|
|
10.18†
|
S‑1/A
|
333‑207243
|
10.49
|
11/20/2015
|
|
|
10.19†
|
S‑1/A
|
333‑207243
|
10.50
|
11/20/2015
|
|
|
10.20
|
S‑1/A
|
333‑207243
|
10.53
|
05/20/2016
|
|
|
10.21†
|
S‑1/A
|
333‑207243
|
10.54
|
05/20/2016
|
|
|
10.22†
|
S‑1/A
|
333‑207243
|
10.55
|
05/20/2016
|
|
|
10.23†
|
S‑1/A
|
333‑207243
|
10.56
|
05/20/2016
|
|
|
10.24†
|
S‑1/A
|
333‑207243
|
10.57
|
05/20/2016
|
|
|
10.25†
|
S‑1/A
|
333‑207243
|
10.58
|
05/20/2016
|
|
|
10.26†
|
S‑1/A
|
333‑207243
|
10.59
|
05/20/2016
|
|
|
10.27†
|
S‑1/A
|
333‑207243
|
10.60
|
05/20/2016
|
|
|
10.28
|
S‑1/A
|
333‑207243
|
10.63
|
12/15/2016
|
|
|
10.29
|
10-K
|
001-38002
|
10.29
|
03/20/2018
|
|
|
10.30
|
10-K
|
001-38002
|
10.30
|
03/20/2018
|
|
|
10.31†
|
S‑1/A
|
333‑207243
|
10.68
|
01/10/2017
|
|
|
10.32
|
S‑1/A
|
333‑207243
|
10.69
|
01/10/2017
|
|
|
10.33†
|
S‑1/A
|
333‑207243
|
10.70
|
01/10/2017
|
|
|
10.34†
|
S‑1/A
|
333‑207243
|
10.71
|
01/10/2017
|
|
|
10.35†
|
S‑1/A
|
333‑207243
|
10.72
|
01/10/2017
|
|
|
10.36†
|
S‑1/A
|
333‑207243
|
10.73
|
01/10/2017
|
|
83
|
Exhibit
No.
|
Exhibit Description
|
Form
|
File Number
|
Exhibit
Number
|
Filing Date
|
|
10.37
|
8‑K
|
001‑38002
|
10.1
|
02/06/2017
|
|
|
10.38
|
8‑K
|
001‑38002
|
10.2
|
02/06/2017
|
|
|
10.39†
|
10-K
|
001-38002
|
10.76
|
03/29/2017
|
|
|
10.40†
|
8-K
|
001-38002
|
10.3
|
02/06/2017
|
|
|
10.41†
|
8-K
|
001-38002
|
10.4
|
02/06/2017
|
|
|
10.42
|
8-K
|
001-38002
|
10.1
|
04/27/2017
|
|
|
10.43†
|
10-Q
|
001-38002
|
10.80
|
05/11/2017
|
|
|
10.44
|
10-Q
|
001-38002
|
10.81
|
05/11/2017
|
|
|
10.45
|
10-Q
|
001-38002
|
10.82
|
05/11/2017
|
|
|
10.46
|
10-Q
|
001-38002
|
10.83
|
05/11/2017
|
|
|
10.47
|
10-Q
|
001-38002
|
10.84
|
05/11/2017
|
|
|
10.48
|
10-Q
|
001-38002
|
10.85
|
05/11/2017
|
|
|
10.49
|
10-Q
|
001-38002
|
10.86
|
05/11/2017
|
|
|
10.50†
|
8-K
|
001-38002
|
10.1
|
06/20/2017
|
|
|
10.51†
|
10-Q
|
001-38002
|
10.51
|
08/08/2017
|
|
|
10.52†
|
10-Q
|
001-38002
|
10.52
|
08/08/2017
|
|
|
10.53†
|
10-Q
|
001-38002
|
10.53
|
08/08/2017
|
|
|
10.54†
|
10-Q
|
001-38002
|
10.54
|
08/08/2017
|
|
|
10.55†
|
10-Q
|
001-38002
|
10.55
|
08/08/2017
|
|
84
|
Exhibit
No.
|
Exhibit Description
|
Form
|
File Number
|
Exhibit
Number
|
Filing Date
|
|
10.56†
|
10-Q
|
001-38002
|
10.56
|
08/08/2017
|
|
|
10.57†
|
10-Q
|
001-38002
|
10.57
|
08/08/2017
|
|
|
10.58†
|
10-Q
|
001-38002
|
10.58
|
08/08/2017
|
|
|
10.59†
|
10-Q
|
001-38002
|
10.59
|
08/08/2017
|
|
|
10.61†
|
10-Q
|
001-38002
|
10.61
|
11/08/2017
|
|
|
10.62†
|
10-Q
|
001-38002
|
10.62
|
11/08/2017
|
|
|
10.63†
|
10-Q
|
001-38002
|
10.63
|
11/08/2017
|
|
|
10.64†
|
10-Q
|
001-38002
|
10.64
|
11/08/2017
|
|
|
10.65†
|
10-Q
|
001-38002
|
10.65
|
11/08/2017
|
|
|
10.66
|
8-K
|
001-38002
|
10.1
|
02/01/2018
|
|
|
10.67†
|
10-K
|
001-38002
|
10.67
|
03/20/2018
|
|
|
10.68†
|
10-K
|
001-38002
|
10.68
|
03/20/2018
|
|
|
10.69†
|
10-K
|
001-38002
|
10.69
|
03/20/2018
|
|
|
10.70†
|
10-K
|
001-38002
|
10.70
|
03/20/2018
|
|
|
10.71
|
10-Q
|
001-38002
|
10.71
|
05/09/2018
|
|
|
10.72†
|
10-Q
|
001-38002
|
10.72
|
08/09/2018
|
|
|
21.1*
|
|||||
|
31.1*
|
|||||
|
31.2*
|
|||||
|
32*
|
|||||
|
Ex. 101.INS*
|
XBRL Instance Document
|
||||
|
Ex. 101.SCH*
|
XBRL Taxonomy Extension Schema Document
|
||||
|
Ex. 101.CAL*
|
XBRL Taxonomy Extension Calculation Linkbase Document
|
||||
|
Ex. 101.LAB*
|
XBRL Taxonomy Extension Label Linkbase Document
|
||||
85
|
Exhibit
No.
|
Exhibit Description
|
Form
|
File Number
|
Exhibit
Number
|
Filing Date
|
|
Ex. 101.PRE*
|
XBRL Taxonomy Extension Presentation Linkbase Document
|
||||
|
Ex. 101.DEF*
|
XBRL Taxonomy Extension Definition Linkbase Document
|
||||
|
*
|
Filed herewith.
|
||||
|
#
|
Laureate Education, Inc. hereby undertakes to furnish supplementally a copy of any omitted schedule or exhibit to such agreement to the U.S. Securities and Exchange Commission upon request.
|
||||
|
†
|
Indicates a management contract or compensatory plan or arrangement.
|
||||
|
‡
|
Confidential treatment has been granted with respect to certain portions of this exhibit. Omitted portions have been filed separately with the U.S. Securities and Exchange Commission.
|
||||
86
SIGNATURES
Pursuant to the requirements of the Securities Exchange Act of 1934, the registrant has duly caused this report to be signed on its behalf by the undersigned, thereunto duly authorized, on
November 8, 2018
.
/s/ JEAN-JACQUES CHARHON
Jean-Jacques Charhon
Executive Vice President and Chief Financial Officer
/s/ TAL DARMON
Tal Darmon
Senior Vice President, Chief Accounting Officer
and Global Controller
87
88
TABLE OF CONTENTS
Part I - Financial InformationItem 1. Financial Statements (unaudited)Note 1. Description Of BusinessNote 2. Significant Accounting PoliciesNote 3. RevenueNote 4. Discontinued Operations and Assets Held For SaleNote 5. DispositionsNote 6. Due To Shareholders Of Acquired CompaniesNote 7. Business and Geographic Segment InformationNote 8. GoodwillNote 9. DebtNote 10. Commitments and ContingenciesNote 11. Financing ReceivablesNote 12. Share-based CompensationNote 13. Stockholders' EquityNote 14. Derivative InstrumentsNote 15. Income TaxesNote 16. Earnings (loss) Per ShareNote 17. Related Party TransactionsNote 18. Legal and Regulatory MattersNote 19. Fair Value MeasurementNote 20. Supplemental Cash Flow InformationNote 21. Subsequent EventsItem 2. Management S Discussion and Analysis Of Financial Condition and Results Of OperationsItem 3. Quantitative and Qualitative Disclosures About Market RiskItem 4. Controls and ProceduresPart II - Other InformationItem 1. Legal ProceedingsItem 1A. Risk FactorsItem 6. Exhibits