LAUREATE EDUCATION, INC.
UNITED STATES
SECURITIES AND EXCHANGE COMMISSION
Washington, D.C. 20549
FORM 10-Q
x
Quarterly Report pursuant to Section 13 or 15(d) of the Securities Exchange Act of 1934
For the quarterly period ended
March 31, 2019
OR
o
Transition Report pursuant to Section 13 or 15(d) of the Securities Exchange Act of 1934
For the transition period from __________ to __________.
Commission File Number: 001-38002

Laureate Education, Inc.
(Exact name of registrant as specified in its charter)
|
Delaware
|
52-1492296
|
|
|
(State or other jurisdiction of
|
(I.R.S. Employer
|
|
|
incorporation or organization)
|
Identification No.)
|
|
|
650 S. Exeter Street, Baltimore, Maryland
|
21202
|
|
|
(Address of principal executive offices)
|
(Zip Code)
|
|
Registrant’s telephone number, including area code: (410) 843-6100
Securities registered pursuant to Section 12(b) of the Securities Exchange Act of 1934:
|
Title of each class
|
Trading Symbol(s)
|
Name of each exchange on which registered
|
|
Class A common stock, par value $0.004 per share
|
LAUR
|
The NASDAQ Stock Market LLC
(Nasdaq Global Select Market)
|
Indicate by check mark whether the registrant (1) has filed all reports required to be filed by Section 13 or 15(d) of the Securities Exchange Act of 1934 during the preceding 12 months (or for such shorter period that the registrant was required to file such reports), and (2) has been subject to such filing requirements for the past 90 days. Yes
x
No
o
Indicate by check mark whether the registrant has submitted electronically every Interactive Data File required to be submitted pursuant to Rule 405 of Regulation S-T (§232.405 of this chapter) during the preceding 12 months (or for such shorter period that the registrant was required to submit such files). Yes
x
No
o
Indicate by check mark whether the registrant is a large accelerated filer, an accelerated filer, a non-accelerated filer, smaller reporting company, or an emerging growth company. See the definitions of "large accelerated filer," "accelerated filer," "smaller reporting company," and "emerging growth company" in Rule 12b-2 of the Exchange Act.
Large accelerated filer
x
Accelerated filer
o
Non-accelerated filer
o
(Do not check if a smaller reporting company)
Smaller reporting company
o
Emerging Growth Company
o
If an emerging growth company, indicate by check mark if the registrant has elected not to use the extended transition period for complying with any new or revised financial accounting standards provided pursuant to Section 13(a) of the Exchange Act.
o
Indicate by check mark whether the registrant is a shell company (as defined in Rule 12b-2 of the Exchange Act). Yes
o
No
x
Indicate the number of shares outstanding of each of the issuer's classes of common stock, as of the latest practicable date.
|
Class
|
Outstanding at March 31, 2019
|
|
|
Class A common stock, par value $0.004 per share
|
107,782,733 shares
|
|
|
Class B common stock, par value $0.004 per share
|
116,857,483 shares
|
|
|
INDEX
|
|||
|
PART I. - FINANCIAL INFORMATION
|
Page No.
|
||
|
Item 1.
|
Financial Statements (Unaudited)
|
||
|
Consolidated Statements of Operations - Three months ended March 31, 2019 and March 31, 2018
|
|||
|
Consolidated Statements of Comprehensive Income - Three months ended March 31, 2019
and March 31, 2018 |
|||
|
Consolidated Balance Sheets - March 31, 2019 and December 31, 2018
|
|||
|
Consolidated Statements of Cash Flows - Three months ended March 31, 2019 and March 31, 2018
|
|||
|
Notes to Consolidated Financial Statements
|
|||
|
Item 2.
|
Management's Discussion and Analysis of Financial Condition and Results of Operations
|
||
|
Item 3.
|
Quantitative and Qualitative Disclosures About Market Risk
|
||
|
Item 4.
|
Controls and Procedures
|
||
|
PART II. - OTHER INFORMATION
|
|||
|
Item 1.
|
Legal Proceedings
|
||
|
Item 1A.
|
Risk Factors
|
||
|
Item 6.
|
Exhibits
|
||
|
SIGNATURES
|
|||
1
PART I - FINANCIAL INFORMATION
Item 1. Financial Statements (Unaudited)
LAUREATE EDUCATION, INC. AND SUBSIDIARIES
Consolidated Statements of Operations
IN THOUSANDS, except per share amounts
|
For the three months ended March 31,
|
2019
|
2018
|
|||||
|
(Unaudited)
|
(Unaudited)
|
||||||
|
Revenues
|
$
|
621,796
|
|
$
|
632,216
|
|
|
|
Costs and expenses:
|
|||||||
|
Direct costs
|
652,414
|
|
677,535
|
|
|||
|
General and administrative expenses
|
53,911
|
|
47,302
|
|
|||
|
Operating loss
|
(84,529
|
)
|
(92,621
|
)
|
|||
|
Interest income
|
3,553
|
|
3,268
|
|
|||
|
Interest expense
|
(54,655
|
)
|
(63,335
|
)
|
|||
|
Loss on debt extinguishment
|
(10,622
|
)
|
(7,481
|
)
|
|||
|
Gain (loss) on derivatives
|
5,183
|
|
(19,340
|
)
|
|||
|
Other income, net
|
359
|
|
2,597
|
|
|||
|
Foreign currency exchange loss, net
|
(4,659
|
)
|
(11,782
|
)
|
|||
|
Loss from continuing operations before income taxes
|
(145,370
|
)
|
(188,694
|
)
|
|||
|
Income tax benefit
|
35,056
|
|
23,059
|
|
|||
|
Loss from continuing operations
|
(110,314
|
)
|
(165,635
|
)
|
|||
|
Income from discontinued operations, including tax expense of ($9,350) and ($46,382), respectively
|
56,574
|
|
18,853
|
|
|||
|
Gain on sales of discontinued operations, net, including tax benefit of $287 and $20,792, respectively
|
248,005
|
|
318,327
|
|
|||
|
Net income
|
194,265
|
|
171,545
|
|
|||
|
Net income attributable to noncontrolling interests
|
(3,022
|
)
|
(2,666
|
)
|
|||
|
Net income attributable to Laureate Education, Inc.
|
$
|
191,243
|
|
$
|
168,879
|
|
|
|
Accretion of other redeemable noncontrolling interests and equity and Series A convertible redeemable preferred stock
|
263
|
|
(57,403
|
)
|
|||
|
Net income available to common stockholders
|
$
|
191,506
|
|
$
|
111,476
|
|
|
|
Basic and diluted earnings (loss) per share:
|
|||||||
|
Loss from continuing operations
|
$
|
(0.50
|
)
|
$
|
(1.20
|
)
|
|
|
Income from discontinued operations
|
1.35
|
|
1.79
|
|
|||
|
Basic and diluted earnings per share
|
$
|
0.85
|
|
$
|
0.59
|
|
|
The accompanying notes are an integral part of these consolidated financial statements.
2
LAUREATE EDUCATION, INC. AND SUBSIDIARIES
Consolidated Statements of Comprehensive Income
IN THOUSANDS
|
For the three months ended March 31,
|
2019
|
2018
|
|||||
|
(Unaudited)
|
(Unaudited)
|
||||||
|
Net income
|
$
|
194,265
|
|
$
|
171,545
|
|
|
|
Other comprehensive income:
|
|||||||
|
Foreign currency translation adjustment, net of tax of $0 for both periods
|
49,551
|
|
83,369
|
|
|||
|
Unrealized gain on derivative instruments, net of tax of $0 for both periods
|
2,609
|
|
2,210
|
|
|||
|
Minimum pension liability adjustment, net of tax of $0
|
—
|
|
376
|
|
|||
|
Total other comprehensive income
|
52,160
|
|
85,955
|
|
|||
|
Comprehensive income
|
246,425
|
|
257,500
|
|
|||
|
Net comprehensive income attributable to noncontrolling interests
|
(3,052
|
)
|
(2,387
|
)
|
|||
|
Comprehensive income attributable to Laureate Education, Inc.
|
$
|
243,373
|
|
$
|
255,113
|
|
|
The accompanying notes are an integral part of these consolidated financial statements.
3
LAUREATE EDUCATION, INC. AND SUBSIDIARIES
Consolidated Balance Sheets
IN THOUSANDS, except per share amounts
|
March 31, 2019
|
December 31, 2018
|
||||||
|
Assets
|
(Unaudited)
|
||||||
|
Current assets:
|
|||||||
|
Cash and cash equivalents (includes VIE amounts of $75,019 and $158,387, see Note 2)
|
$
|
278,782
|
|
$
|
388,490
|
|
|
|
Restricted cash
|
203,633
|
|
201,300
|
|
|||
|
Receivables:
|
|||||||
|
Accounts and notes receivable
|
606,235
|
|
399,322
|
|
|||
|
Other receivables
|
13,429
|
|
11,596
|
|
|||
|
Allowance for doubtful accounts
|
(165,011
|
)
|
(161,649
|
)
|
|||
|
Receivables, net
|
454,653
|
|
249,269
|
|
|||
|
Income tax receivable
|
82,269
|
|
18,515
|
|
|||
|
Prepaid expenses and other current assets
|
72,474
|
|
53,187
|
|
|||
|
Current assets held for sale
|
308,650
|
|
306,372
|
|
|||
|
Total current assets (includes VIE amounts of $590,857 and $483,613, see Note 2)
|
1,400,461
|
|
1,217,133
|
|
|||
|
Notes receivable, net
|
7,159
|
|
2,397
|
|
|||
|
Property and equipment:
|
|||||||
|
Land
|
239,536
|
|
234,826
|
|
|||
|
Buildings
|
651,359
|
|
645,177
|
|
|||
|
Furniture, equipment and software
|
995,564
|
|
968,468
|
|
|||
|
Leasehold improvements
|
330,749
|
|
356,824
|
|
|||
|
Construction in-progress
|
38,500
|
|
60,919
|
|
|||
|
Accumulated depreciation and amortization
|
(1,018,103
|
)
|
(987,279
|
)
|
|||
|
Property and equipment, net
|
1,237,605
|
|
1,278,935
|
|
|||
|
Operating lease right-of-use assets, net
|
952,890
|
|
—
|
|
|||
|
Land use rights, net
|
1,592
|
|
1,552
|
|
|||
|
Goodwill
|
1,738,228
|
|
1,707,089
|
|
|||
|
Other intangible assets:
|
|||||||
|
Tradenames
|
1,134,342
|
|
1,126,244
|
|
|||
|
Other intangible assets, net
|
2,476
|
|
25,429
|
|
|||
|
Deferred costs, net
|
68,049
|
|
66,835
|
|
|||
|
Deferred income taxes
|
145,455
|
|
136,487
|
|
|||
|
Derivative instruments
|
6,197
|
|
3,259
|
|
|||
|
Other assets
|
177,855
|
|
172,817
|
|
|||
|
Long-term assets held for sale
|
961,212
|
|
1,031,459
|
|
|||
|
Total assets (includes VIE amounts of $1,360,948 and $1,196,813, see Note 2)
|
$
|
7,833,521
|
|
$
|
6,769,636
|
|
|
The accompanying notes are an integral part of these consolidated financial statements.
4
LAUREATE EDUCATION, INC. AND SUBSIDIARIES
Consolidated Balance Sheets (continued)
IN THOUSANDS, except per share amounts
|
March 31, 2019
|
December 31, 2018
|
||||||
|
Liabilities and stockholders' equity
|
(Unaudited)
|
||||||
|
Current liabilities:
|
|||||||
|
Accounts payable
|
$
|
70,629
|
|
$
|
67,303
|
|
|
|
Accrued expenses
|
241,368
|
|
227,583
|
|
|||
|
Accrued compensation and benefits
|
143,194
|
|
196,355
|
|
|||
|
Deferred revenue and student deposits
|
556,384
|
|
193,226
|
|
|||
|
Current portion of operating leases
|
97,517
|
|
—
|
|
|||
|
Current portion of long-term debt and finance leases
|
105,264
|
|
101,866
|
|
|||
|
Current portion of due to shareholders of acquired companies
|
25,251
|
|
23,820
|
|
|||
|
Income taxes payable
|
22,288
|
|
20,901
|
|
|||
|
Derivative instruments
|
1,223
|
|
4,021
|
|
|||
|
Other current liabilities
|
23,033
|
|
46,621
|
|
|||
|
Current liabilities held for sale
|
315,521
|
|
308,391
|
|
|||
|
Total current liabilities (includes VIE amounts of $358,368 and $207,977, see Note 2)
|
1,601,672
|
|
1,190,087
|
|
|||
|
Long-term operating leases, less current portion
|
871,588
|
|
—
|
|
|||
|
Long-term debt and finance leases, less current portion
|
2,136,328
|
|
2,593,585
|
|
|||
|
Due to shareholders of acquired companies, less current portion
|
21,044
|
|
21,571
|
|
|||
|
Deferred compensation
|
12,918
|
|
12,778
|
|
|||
|
Income taxes payable
|
89,706
|
|
93,460
|
|
|||
|
Deferred income taxes
|
217,886
|
|
217,558
|
|
|||
|
Derivative instruments
|
—
|
|
6,656
|
|
|||
|
Other long-term liabilities
|
166,385
|
|
214,306
|
|
|||
|
Long-term liabilities held for sale
|
374,179
|
|
354,293
|
|
|||
|
Total liabilities (includes VIE amounts of $521,229 and $274,744, see Note 2)
|
5,491,706
|
|
4,704,294
|
|
|||
|
Redeemable noncontrolling interests and equity
|
13,909
|
|
14,396
|
|
|||
|
Stockholders' equity:
|
|||||||
|
Preferred stock, par value $0.001 per share – 49,889 shares authorized as of March 31, 2019 and December 31, 2018, respectively, no shares issued and outstanding as of March 31, 2019 and December 31, 2018
|
—
|
|
—
|
|
|||
|
Class A common stock, par value $0.004 per share – 700,000 shares authorized, 107,783 shares issued and outstanding as of March 31, 2019 and 107,450 shares issued and outstanding as of December 31, 2018
|
431
|
|
430
|
|
|||
|
Class B common stock, par value $0.004 per share – 175,000 shares authorized, 116,857 shares issued and outstanding as of March 31, 2019 and 116,865 shares issued and outstanding as of December 31, 2018
|
467
|
|
467
|
|
|||
|
Additional paid-in capital
|
3,705,787
|
|
3,703,796
|
|
|||
|
Accumulated deficit
|
(310,732
|
)
|
(530,919
|
)
|
|||
|
Accumulated other comprehensive loss
|
(1,060,565
|
)
|
(1,112,695
|
)
|
|||
|
Total Laureate Education, Inc. stockholders' equity
|
2,335,388
|
|
2,061,079
|
|
|||
|
Noncontrolling interests
|
(7,482
|
)
|
(10,133
|
)
|
|||
|
Total stockholders' equity
|
2,327,906
|
|
2,050,946
|
|
|||
|
Total liabilities and stockholders' equity
|
$
|
7,833,521
|
|
$
|
6,769,636
|
|
|
The accompanying notes are an integral part of these consolidated financial statements.
5
LAUREATE EDUCATION, INC. AND SUBSIDIARIES
Consolidated Statements of Cash Flows
IN THOUSANDS
|
For the three months ended March 31,
|
2019
|
2018
|
|||||
|
Cash flows from operating activities
|
(Unaudited)
|
(Unaudited)
|
|||||
|
Net income
|
$
|
194,265
|
|
$
|
171,545
|
|
|
|
Adjustments to reconcile net income to net cash provided by (uesd in) operating activities:
|
|||||||
|
Depreciation and amortization
|
47,644
|
|
67,762
|
|
|||
|
Amortization of operating lease right-of-use assets
|
33,374
|
|
—
|
|
|||
|
Gain on sales of subsidiaries and disposal of property and equipment, net
|
(246,803
|
)
|
(297,479
|
)
|
|||
|
(Gain) loss on derivative instruments
|
(5,343
|
)
|
19,132
|
|
|||
|
Payments for settlement of derivative contracts
|
(8,233
|
)
|
—
|
|
|||
|
Loss on debt extinguishment
|
10,622
|
|
7,481
|
|
|||
|
Non-cash interest expense
|
5,076
|
|
4,645
|
|
|||
|
Non-cash share-based compensation expense
|
3,149
|
|
(3,756
|
)
|
|||
|
Bad debt expense
|
23,650
|
|
22,153
|
|
|||
|
Deferred income taxes
|
8,835
|
|
(26,560
|
)
|
|||
|
Unrealized foreign currency exchange loss
|
5,458
|
|
1,082
|
|
|||
|
Non-cash loss from non-income tax contingencies
|
4,561
|
|
2,121
|
|
|||
|
Other, net
|
1,537
|
|
(315
|
)
|
|||
|
Changes in operating assets and liabilities:
|
|||||||
|
Receivables
|
(264,944
|
)
|
(268,434
|
)
|
|||
|
Prepaid expenses and other assets
|
(62,433
|
)
|
(20,158
|
)
|
|||
|
Accounts payable and accrued expenses
|
(47,929
|
)
|
(61,087
|
)
|
|||
|
Income tax receivable/payable, net
|
(45,012
|
)
|
(14,810
|
)
|
|||
|
Deferred revenue and other liabilities
|
387,500
|
|
389,602
|
|
|||
|
Net cash provided by (used in) operating activities
|
44,974
|
|
(7,076
|
)
|
|||
|
Cash flows from investing activities
|
|||||||
|
Purchase of property and equipment
|
(32,319
|
)
|
(44,245
|
)
|
|||
|
Expenditures for deferred costs
|
(3,488
|
)
|
(3,365
|
)
|
|||
|
Receipts from sales of discontinued operations and property and equipment, net of cash sold
|
330,998
|
|
359,510
|
|
|||
|
Settlement of derivatives related to sale of discontinued operations
|
—
|
|
(9,960
|
)
|
|||
|
Business acquisitions, net of cash acquired
|
(1,194
|
)
|
—
|
|
|||
|
Payments from related parties
|
87
|
|
750
|
|
|||
|
Net cash provided by investing activities
|
294,084
|
|
302,690
|
|
|||
|
Cash flows from financing activities
|
|||||||
|
Proceeds from issuance of long-term debt, net of original issue discount
|
90,630
|
|
188,563
|
|
|||
|
Payments on long-term debt
|
(532,592
|
)
|
(541,812
|
)
|
|||
|
Payments of deferred purchase price for acquisitions
|
(369
|
)
|
(5,534
|
)
|
|||
|
Payments to purchase noncontrolling interests
|
—
|
|
(127
|
)
|
|||
|
Payment of dividends on Series A Preferred Stock
|
—
|
|
(9,719
|
)
|
|||
|
Withholding of shares to satisfy tax withholding for vested stock awards
|
(1,420
|
)
|
(803
|
)
|
|||
|
Payments of debt issuance costs and redemption premiums
|
(5,226
|
)
|
(148
|
)
|
|||
|
(Distributions to) contributions from noncontrolling interest holders
|
(625
|
)
|
581
|
|
|||
|
Net cash used in financing activities
|
(449,602
|
)
|
(368,999
|
)
|
|||
|
Effects of exchange rate changes on Cash and cash equivalents and Restricted cash
|
2,045
|
|
22,150
|
|
|||
|
Change in cash included in current assets held for sale
|
1,124
|
|
(100
|
)
|
|||
|
Net change in Cash and cash equivalents and Restricted cash
|
(107,375
|
)
|
(51,335
|
)
|
|||
|
Cash and cash equivalents and Restricted cash at beginning of period
|
589,790
|
|
532,782
|
|
|||
|
Cash and cash equivalents and Restricted cash at end of period
|
$
|
482,415
|
|
$
|
481,447
|
|
|
The accompanying notes are an integral part of these consolidated financial statements.
6
Laureate Education, Inc. and Subsidiaries
Notes to Consolidated Financial Statements
(Dollars and shares in thousands)
Note
1
.
Description of Business
Laureate Education, Inc. and subsidiaries (hereinafter Laureate, we, us, our, or the Company) provide higher education programs and services to students through an international network of licensed universities and higher education institutions (institutions). Laureate's programs are provided through institutions that are campus-based and internet-based, or through electronically distributed educational programs (online). On October 1, 2015, we redomiciled in Delaware as a public benefit corporation as a demonstration of our long-term commitment to our mission to benefit our students and society. The Company completed its initial public offering (IPO) on
February 6, 2017
and its shares are listed on the Nasdaq Global Select Market under the symbol ‘‘LAUR.’’
Discontinued Operations
On
August 9, 2018
, the Company announced the divestiture of additional subsidiaries located in Europe, Asia and Central America, which are included in the Rest of World (formerly called EMEAA), Andean (formerly called Andean & Iberian), and Central America & U.S. Campuses segments. Previously, the Company had announced the divestiture of certain subsidiaries in the Rest of World and Central America & U.S. Campuses segments. After completing all of these announced divestitures, the Company’s remaining principal markets will be Brazil, Chile, Mexico and Peru, along with the Online & Partnerships segment and the institutions in Australia and New Zealand. This represents a strategic shift that will have a major effect on the Company's operations and financial results. Accordingly, all of the divestitures that are part of this strategic shift, including the divestitures announced on
August 9, 2018
and those announced previously, are now accounted for as discontinued operations for all periods presented in accordance with Accounting Standards Codification (ASC) 205-20, ‘‘Discontinued Operations’’ (ASC 205). See Note
4
,
Discontinued Operations and Assets Held for Sale
, for more information. Unless indicated otherwise, the information in the footnotes to the Consolidated Financial Statements relates to continuing operations.
The accompanying unaudited Consolidated Financial Statements have been prepared in accordance with accounting principles generally accepted in the United States (GAAP) for interim financial information and with the instructions to Form 10-Q. Accordingly, they do not include all of the information and footnotes required by GAAP for complete financial statements. In our opinion, these financial statements include all adjustments considered necessary to present a fair statement of our consolidated results of operations, financial position and cash flows. Operating results for any interim period are not necessarily indicative of the results that may be expected for the full year. These unaudited Consolidated Financial Statements should be read in conjunction with Laureate's audited Consolidated Financial Statements included in our
Annual Report on Form 10-K for the fiscal year ended December 31, 2018 (the 2018 Form 10-K)
.
7
Note
2
.
Significant Accounting Policies
The Variable Interest Entity (VIE) Arrangements
Laureate consolidates in its financial statements certain internationally based educational organizations that do not have shares or other equity ownership interests. Although these educational organizations may be considered not-for-profit entities in their home countries and they are operated in compliance with their respective not-for-profit legal regimes, we believe they do not meet the definition of a not-for-profit entity under GAAP, and therefore we treat them as "for-profit" entities for accounting purposes. These entities generally cannot declare dividends or distribute their net assets to the entities that control them.
Under ASC 810-10, ‘‘Consolidation,’’ we have determined that these institutions are VIEs and that Laureate is the primary beneficiary of these VIEs because we have, as further described herein: (1) the power to direct the activities of the VIEs that most significantly affect their educational and economic performance and (2) the right to receive economic benefits from contractual and other arrangements with the VIEs that could potentially be significant to the VIEs. We account for the acquisition of the right to control a VIE in accordance with ASC 805, ‘‘Business Combinations.’’
The VIEs in Brazil and Mexico comprise several not-for-profit foundations that have insignificant revenues and operating expenses. Selected Consolidated Statements of Operations information for VIEs that are included in continuing operations was as follows, net of the charges related to the above-described contractual arrangements:
|
For the three months ended March 31,
|
2019
|
2018
|
|||||
|
Selected Statements of Operations information:
|
|||||||
|
Revenues, by segment:
|
|||||||
|
Brazil
|
$
|
—
|
|
$
|
—
|
|
|
|
Mexico
|
—
|
|
—
|
|
|||
|
Andean
|
56,450
|
|
55,036
|
|
|||
|
Revenues
|
56,450
|
|
55,036
|
|
|||
|
Depreciation and amortization
|
6,096
|
|
6,744
|
|
|||
|
Operating loss, by segment:
|
|||||||
|
Brazil
|
(18
|
)
|
(18
|
)
|
|||
|
Mexico
|
(97
|
)
|
(157
|
)
|
|||
|
Andean
|
(27,220
|
)
|
(39,251
|
)
|
|||
|
Operating loss
|
(27,335
|
)
|
(39,426
|
)
|
|||
|
Net loss
|
(24,200
|
)
|
(34,994
|
)
|
|||
|
Net loss attributable to Laureate Education, Inc.
|
(24,200
|
)
|
(34,994
|
)
|
|||
8
The following table reconciles the Net (loss) income attributable to Laureate Education, Inc. as presented in the table above, to the amounts in our Consolidated Statements of Operations:
|
For the three months ended March 31,
|
2019
|
2018
|
|||||
|
Net (loss) income attributable to Laureate Education, Inc.:
|
|||||||
|
Variable interest entities
|
$
|
(24,200
|
)
|
$
|
(34,994
|
)
|
|
|
Other operations
|
(45,211
|
)
|
(18,268
|
)
|
|||
|
Corporate and eliminations
|
260,654
|
|
222,141
|
|
|||
|
Net income attributable to Laureate Education, Inc.
|
$
|
191,243
|
|
$
|
168,879
|
|
|
The following table presents selected assets and liabilities of the consolidated VIEs. Except for Goodwill, the assets in the table below include the assets that can be used only to settle the obligations for the VIEs. The liabilities in the table are liabilities for which the creditors of the VIEs do not have recourse to the general credit of Laureate.
Selected Consolidated Balance Sheet amounts for these VIEs were as follows:
|
March 31, 2019
|
December 31, 2018
|
||||||||||||||
|
VIE
|
Consolidated
|
VIE
|
Consolidated
|
||||||||||||
|
Balance Sheets data:
|
|||||||||||||||
|
Cash and cash equivalents
|
$
|
75,019
|
|
$
|
278,782
|
|
$
|
158,387
|
|
$
|
388,490
|
|
|||
|
Current assets held for sale
|
194,353
|
|
308,650
|
|
183,880
|
|
306,372
|
|
|||||||
|
Other current assets
|
321,485
|
|
813,029
|
|
141,346
|
|
522,271
|
|
|||||||
|
Total current assets
|
590,857
|
|
1,400,461
|
|
483,613
|
|
1,217,133
|
|
|||||||
|
Goodwill
|
172,675
|
|
1,738,228
|
|
168,473
|
|
1,707,089
|
|
|||||||
|
Tradenames
|
68,273
|
|
1,134,342
|
|
66,929
|
|
1,126,244
|
|
|||||||
|
Other intangible assets, net
|
—
|
|
2,476
|
|
—
|
|
25,429
|
|
|||||||
|
Operating lease right-of-use assets, net
|
76,149
|
|
952,890
|
|
—
|
|
—
|
|
|||||||
|
Long-term assets held for sale
|
170,787
|
|
961,212
|
|
165,087
|
|
1,031,459
|
|
|||||||
|
Other long-term assets
|
282,207
|
|
1,643,912
|
|
312,711
|
|
1,662,282
|
|
|||||||
|
Total assets
|
1,360,948
|
|
7,833,521
|
|
1,196,813
|
|
6,769,636
|
|
|||||||
|
Current liabilities held for sale
|
91,912
|
|
315,521
|
|
101,320
|
|
308,391
|
|
|||||||
|
Other current liabilities
|
266,456
|
|
1,286,151
|
|
106,657
|
|
881,696
|
|
|||||||
|
Long-term operating leases, less current portion
|
65,649
|
|
871,588
|
|
—
|
|
—
|
|
|||||||
|
Long-term liabilities held for sale
|
63,847
|
|
374,179
|
|
42,265
|
|
354,293
|
|
|||||||
|
Long-term debt and other long-term liabilities
|
33,365
|
|
2,644,267
|
|
24,502
|
|
3,159,914
|
|
|||||||
|
Total liabilities
|
521,229
|
|
5,491,706
|
|
274,744
|
|
4,704,294
|
|
|||||||
|
Total stockholders' equity
|
839,719
|
|
2,327,906
|
|
922,069
|
|
2,050,946
|
|
|||||||
|
Total stockholders' equity attributable to Laureate Education, Inc.
|
839,323
|
|
2,335,388
|
|
921,747
|
|
2,061,079
|
|
|||||||
On January 24, 2018, a new Higher Education Law (the New Law) was passed by the Chilean Congress. Among other things, the New Law prohibits conflicts of interests and related party transactions involving universities and their controlling parties, with certain exceptions. These exceptions include the provision of services that are educational in nature or essential for the university's purposes.
The New Law, which has an implementation date of May 29, 2019, established a Superintendency of Higher Education, with authority to regulate institutions of higher education and promulgate regulations and procedures implementing the New Law. We anticipate that the Superintendent of Higher Education will promulgate regulations or other guidance. In anticipation of the implementation of the New Law, we have modified and will continue to modify some of our relationships with the Chilean universities in our network and we will continue to evaluate the impact the New Law will have on our Chilean operations. We do not believe the New Law will change our relationship with our two tech/voc institutions in Chile that are for-profit entities.
9
Additionally, we will continue to evaluate our accounting treatment of the Chilean non-profit universities to determine whether we can continue to consolidate them. Our continuing evaluation of the impact of the New Law may result in changes to our expectations due to changes in our interpretations of the law, assumptions used, and additional guidance that may be issued.
Recently Adopted Accounting Standards
Accounting Standards Update (ASU) No. 2016-02 (ASU 2016-02), Leases (Topic 842)
On February 25, 2016, the Financial Accounting Standards Board (FASB) issued ASU 2016-02, which requires lessees to recognize on their balance sheet a right-of-use (ROU) asset and a lease liability for virtually all of their leases (other than leases that meet the definition of a short-term lease). The liability is equal to the present value of the lease payments. The asset is based on the liability, subject to adjustment, such as for initial direct costs and uneven rent payments. For income statement purposes, the FASB retained a dual model, requiring leases to be classified as either operating or finance. Operating leases result in straight-line expense (similar to operating leases prior to adoption of ASU 2016-02) while finance leases will result in a front-loaded expense pattern (similar to capital leases prior to adoption of ASU 2016-02).
Laureate adopted ASU 2016-02 as of January 1, 2019 under a modified retrospective method. The standard provided companies with an additional, optional transition method that allowed entities to prospectively apply the requirements by recognizing a cumulative-effect adjustment to the opening balance of retained earnings in the period of adoption. We elected this optional transition method. In accordance with Topic 842 we also elected the package of practical expedients, which permits us to not reassess (1) whether any expired or existing contracts are or contain leases, (2) the lease classification for any expired or existing leases, and (3) any initial direct costs for any existing leases as of the effective date. We did not elect the hindsight practical expedient, which permits entities to use hindsight in determining the lease term and assessing impairment. We elected the practical expedient to combine our lease and related nonlease components for our building leases.
Adopting ASU 2016-02 had a material impact on our Consolidated Balance Sheet as we recorded significant asset and liability balances in connection with our leased properties. The most significant impacts to our Consolidated Financial Statements of adopting this standard are as follows:
|
•
|
The recognition of ROU assets and lease liabilities for operating leases, which totaled
$952,890
and
$969,105
, respectively, as of
March 31, 2019
;
|
|
•
|
An increase in 2019 rent expense of approximately
$13,000
for continuing operations primarily related to build-to-suit arrangements where Laureate was deemed to be the owner of the construction. Upon adoption of this standard, these arrangements were classified on the balance sheet as operating leases and the related ROU asset is being amortized to rent expense rather than depreciation expense; and
|
|
•
|
A cumulative-effect adjustment to retained earnings upon adoption of
$28,944
, which is primarily attributable to the reclassification into retained earnings of deferred gain liabilities related to sale-leaseback transactions that were classified as operating leases upon adoption.
|
ASU No. 2017-12 (ASU 2017-12), Derivatives and Hedging (Topic 815): Targeted Improvements to Accounting for Hedging Activities
On August 28, 2017, the FASB issued ASU 2017-12, which contains significant amendments to the hedge accounting model. The new guidance is intended to simplify the application of hedge accounting and should allow for more hedging strategies to qualify for hedge accounting. ASU 2017-12 also amends the presentation and disclosure requirements and changes how companies assess effectiveness. Public business entities like Laureate will have until the end of the first quarter in which a hedge is designated to perform an initial assessment of a hedge’s effectiveness. After initial qualification, the new guidance permits a qualitative effectiveness assessment for certain hedges instead of a quantitative test, such as a regression analysis, if the company can reasonably support an expectation of high effectiveness throughout the term of the hedge. An initial quantitative test to establish that the hedge relationship is highly effective is still required. We adopted this ASU on January 1, 2019 and the impact was not material.
10
ASU No. 2018-15 (ASU 2018-15) Intangibles-Goodwill and Other-Internal-Use Software (Subtopic 350-40)
In August 2018, the FASB issued ASU 2018-15, which addresses the accounting for implementation costs associated with a hosted service. The standard provides amendments to align the requirements for capitalizing implementation costs incurred in a hosting arrangement that is a service contract with the requirements for capitalizing implementation costs incurred to develop or obtain internal-use software (and hosting arrangements that include an internal use software license). Laureate elected to early adopt ASU 2018-15 on January 1, 2019, and the impact on our Consolidated Financial Statements was not material.
Note
3
.
Revenue
Revenue Recognition
Laureate's revenues primarily consist of tuition and educational service revenues. We also generate other revenues from student fees, dormitory/residency fees and other education-related activities. These other revenues are less material to our overall financial results and have a tendency to trend with tuition revenues. Revenues are recognized when control of the promised goods or services is transferred to our customers, in an amount that reflects the consideration we expect to be entitled to in exchange for those goods or services. These revenues are recognized net of scholarships and other discounts, refunds, waivers and the fair value of any guarantees made by Laureate related to student financing programs. Laureate's institutions have various billing and academic cycles.
We determine revenue recognition through the five-step model prescribed by ASC Topic 606,
Revenue from Contracts with Customers
, as follows:
•
Identification of the contract, or contracts, with a customer;
•
Identification of the performance obligations in the contract;
•
Determination of the transaction price;
•
Allocation of the transaction price to the performance obligations in the contract; and
•
Recognition of revenue when, or as, we satisfy a performance obligation.
We assess collectibility on a portfolio basis prior to recording revenue. Generally, students cannot re-enroll for the next academic session without satisfactory resolution of any past-due amounts. If a student withdraws from an institution, Laureate's obligation to issue a refund depends on the refund policy at that institution and the timing of the student's withdrawal. Generally, our refund obligations are reduced over the course of the academic term. We record refunds as a reduction of deferred revenue as applicable.
11
The following table shows the components of Revenues by reportable segment and as a percentage of total net revenue for the three months ended
March 31, 2019
and
2018
:
|
Brazil
|
Mexico
|
Andean
|
Rest of World
|
Online & Partnerships
|
Corporate
(1)
|
Total
|
|||||||||||||||||
|
2019
|
|||||||||||||||||||||||
|
Tuition and educational services
|
$
|
201,254
|
|
$
|
164,802
|
|
$
|
137,403
|
|
$
|
54,080
|
|
$
|
181,050
|
|
$
|
—
|
|
$
|
738,589
|
|
118
|
%
|
|
Other
|
1,926
|
|
26,496
|
|
15,847
|
|
3,177
|
|
12,008
|
|
491
|
|
59,945
|
|
10
|
%
|
|||||||
|
Gross revenue
|
$
|
203,180
|
|
$
|
191,298
|
|
$
|
153,250
|
|
$
|
57,257
|
|
$
|
193,058
|
|
$
|
491
|
|
$
|
798,534
|
|
128
|
%
|
|
Less: Discounts / waivers / scholarships
|
(93,211
|
)
|
(34,834
|
)
|
(14,308
|
)
|
(3,101
|
)
|
(31,284
|
)
|
—
|
|
(176,738
|
)
|
(28
|
)%
|
|||||||
|
Total
|
$
|
109,969
|
|
$
|
156,464
|
|
$
|
138,942
|
|
$
|
54,156
|
|
$
|
161,774
|
|
$
|
491
|
|
$
|
621,796
|
|
100
|
%
|
|
2018
|
|||||||||||||||||||||||
|
Tuition and educational services
|
$
|
202,103
|
|
$
|
166,310
|
|
$
|
135,964
|
|
$
|
53,315
|
|
$
|
181,245
|
|
$
|
—
|
|
$
|
738,937
|
|
117
|
%
|
|
Other
|
2,859
|
|
25,279
|
|
15,542
|
|
2,189
|
|
14,182
|
|
(1,834
|
)
|
58,217
|
|
9
|
%
|
|||||||
|
Gross revenue
|
$
|
204,962
|
|
$
|
191,589
|
|
$
|
151,506
|
|
$
|
55,504
|
|
$
|
195,427
|
|
$
|
(1,834
|
)
|
$
|
797,154
|
|
126
|
%
|
|
Less: Discounts / waivers / scholarships
|
(82,170
|
)
|
(35,690
|
)
|
(16,452
|
)
|
(3,230
|
)
|
(27,396
|
)
|
—
|
|
(164,938
|
)
|
(26
|
)%
|
|||||||
|
Total
|
$
|
122,792
|
|
$
|
155,899
|
|
$
|
135,054
|
|
$
|
52,274
|
|
$
|
168,031
|
|
$
|
(1,834
|
)
|
$
|
632,216
|
|
100
|
%
|
(1)
Includes the elimination of intersegment revenues.
Contract Balances
The timing of billings, cash collections and revenue recognition results in accounts receivable (contract assets) and deferred revenue and student deposits (contract liabilities) on the Consolidated Balance Sheets. We have various billing and academic cycles and recognize student receivables when an academic session begins, although students generally enroll in courses prior to the start of the academic session. Receivables are recognized only to the extent that it is probable that we will collect substantially all of the consideration to which we are entitled in exchange for the goods and services that will be transferred to the student. We receive advance payments or deposits from our students before revenue is recognized, which are recorded as contract liabilities in deferred revenue and student deposits. Payment terms vary by university with some universities requiring payment in advance of the academic session and other universities allowing students to pay in installments over the term of the academic session.
All of our contract assets are considered accounts receivable and are included within the
Accounts and notes receivable
balance in the accompanying Consolidated Balance Sheets. Total accounts receivable from our contracts with students were
$606,235
and
$399,322
as of
March 31, 2019
and
December 31, 2018
, respectively. The increase in the contract assets balance at
March 31, 2019
compared to
December 31, 2018
is primarily driven by our enrollment cycles. The first and third calendar quarters generally coincide with the primary and secondary intakes for our larger institutions. All contract asset amounts are classified as current.
Contract liabilities in the amount of
$556,384
and
$193,226
were included within the
Deferred revenue and student deposits
balance in the current liabilities section of the accompanying Consolidated Balance Sheets as of
March 31, 2019
and
December 31, 2018
, respectively. The increase in the contract liability balance during the period ended
March 31, 2019
is the result of semester billings and cash payments received in advance of satisfying performance obligations, offset by revenue recognized during that period. Revenue recognized for the
three months ended March 31, 2019
that was included in the contract liability balance at the beginning of the year was approximately
$141,000
.
12
Note
4
.
Discontinued Operations and Assets Held for Sale
As discussed in Note
1
,
Description of Business
, on August 9, 2018, the Company announced that it plans to focus on its principal
markets and will divest certain of its other markets
. The principal markets that will remain
(the Continuing Operations)
include
Brazil, Chile, Mexico, and Peru, along with the Online & Partnerships segment and the institutions in Australia and New Zealand. The markets to be divested (
the Discontinued Operations)
include the institutions in Portugal and Spain, which are part of the Andean segment, all remaining institutions in the Central America & U.S. Campuses segment, and all remaining institutions in the Rest of World segment, except for Australia, New Zealand and the managed institutions in the Kingdom of Saudi Arabia and China.
The institutions in the Kingdom of Saudi Arabia
are managed under a contract that expires in August 2019
.
Included in the Discontinued Operations are
six
VIE institutions.
The divestitures are expected to create a more focused and simplified business model and generate proceeds that will be used for further repayment of long-term debt.
The timing and ability to complete any of these transactions is uncertain and will be subject to market and other conditions, which may include regulatory approvals and consents of third parties.
Summarized operating results and cash flows of the Discontinued Operations are presented in the following tables:
|
For the three months ended March 31,
|
2019
|
2018
|
|||||
|
Revenues
|
$
|
202,616
|
|
$
|
253,072
|
|
|
|
Depreciation and amortization
|
—
|
|
10,793
|
|
|||
|
Share-based compensation expense
|
162
|
|
321
|
|
|||
|
Other direct costs
|
139,648
|
|
176,799
|
|
|||
|
Operating income
|
62,806
|
|
65,159
|
|
|||
|
Other non-operating income
|
3,118
|
|
76
|
|
|||
|
Pretax income of discontinued operations
|
65,924
|
|
65,235
|
|
|||
|
Income tax expense
|
(9,350
|
)
|
(46,382
|
)
|
|||
|
Income from discontinued operations, net of tax
|
$
|
56,574
|
|
$
|
18,853
|
|
|
|
Operating cash flows of discontinued operations
|
$
|
16,124
|
|
$
|
20,682
|
|
|
|
Investing cash flows of discontinued operations
|
$
|
(7,410
|
)
|
$
|
(11,253
|
)
|
|
|
Financing cash flows of discontinued operations
|
$
|
(15,473
|
)
|
$
|
(5,421
|
)
|
|
The assets and liabilities of the Discontinued Operations, which are subject to finalization, have been classified as held for sale as of
March 31, 2019
and
December 31, 2018
, in accordance with ASC 205. The assets and liabilities are recorded at the lower of their carrying values or their estimated 'fair values less costs to sell.' In addition to the Discontinued Operations, UniNorte, an institution in the Brazil segment, has also been classified as held for sale as of
March 31, 2019
. UniNorte is included in Continuing Operations as it is not part of the strategic shift described above. As described in Note
21
,
Subsequent Events
, on
April 16, 2019
, the Company entered into an agreement to divest UniNorte, which it expects to
close during the second half of 2019
.
13
The carrying amounts of the major classes of assets and liabilities that were classified as held for sale are presented in the following tables:
|
March 31, 2019
|
December 31, 2018
|
||||||
|
Assets of Discontinued Operations
|
|||||||
|
Cash and cash equivalents
|
$
|
215,599
|
|
$
|
214,934
|
|
|
|
Receivables, net
|
55,295
|
|
38,588
|
|
|||
|
Property and equipment, net
|
558,226
|
|
667,527
|
|
|||
|
Goodwill
|
72,990
|
|
131,329
|
|
|||
|
Tradenames
|
94,235
|
|
124,932
|
|
|||
|
Operating lease right-of-use assets, net
|
122,913
|
|
—
|
|
|||
|
Other assets
|
82,235
|
|
99,566
|
|
|||
|
Subtotal: assets of Discontinued Operations
|
$
|
1,201,493
|
|
$
|
1,276,876
|
|
|
|
Other assets classified as held for sale: UniNorte Brazil
|
|
|
|||||
|
Receivables, net
|
$
|
7,435
|
|
$
|
6,983
|
|
|
|
Property and equipment, net
|
14,248
|
|
16,726
|
|
|||
|
Goodwill
|
15,243
|
|
15,165
|
|
|||
|
Tradenames
|
8,188
|
|
8,146
|
|
|||
|
Operating lease right-of-use assets, net
|
18,652
|
|
—
|
|
|||
|
Other assets
|
4,603
|
|
13,935
|
|
|||
|
Subtotal: other assets classified as held for sale
|
$
|
68,369
|
|
$
|
60,955
|
|
|
|
Total assets held for sale
|
$
|
1,269,862
|
|
$
|
1,337,831
|
|
|
|
March 31, 2019
|
December 31, 2018
|
||||||
|
Liabilities of Discontinued Operations
|
|||||||
|
Deferred revenue and student deposits
|
$
|
99,759
|
|
$
|
115,969
|
|
|
|
Operating leases, including current portion
|
132,720
|
|
—
|
|
|||
|
Long-term debt and finance leases, including current portion
|
183,365
|
|
278,074
|
|
|||
|
Other liabilities
|
248,810
|
|
253,397
|
|
|||
|
Subtotal: liabilities of Discontinued Operations
|
$
|
664,654
|
|
$
|
647,440
|
|
|
|
Other liabilities classified as held for sale: UniNorte Brazil
|
|
|
|||||
|
Deferred revenue and student deposits
|
$
|
2,553
|
|
$
|
469
|
|
|
|
Operating leases, including current portion
|
11,594
|
|
—
|
|
|||
|
Long-term debt and finance leases, including current portion
|
2,493
|
|
5,370
|
|
|||
|
Other liabilities
|
8,406
|
|
9,405
|
|
|||
|
Subtotal: other liabilities classified as held for sale
|
$
|
25,046
|
|
$
|
15,244
|
|
|
|
Total liabilities held for sale
|
$
|
689,700
|
|
$
|
662,684
|
|
|
Note
5
.
Dispositions
Sale of the University of St. Augustine for Health Sciences, LLC (St. Augustine)
As previously disclosed in our 2018 Form 10-K, the sale of St. Augustine was completed on
February 1, 2019
. The total transaction value under the sale agreement was
$400,000
. Upon completion of the sale, the Company received net proceeds of approximately
$346,400
, which included
$11,700
of customary closing adjustments, and was net of
$58,100
of debt assumed by the purchaser
14
and fees of
$7,200
. The proceeds net of cash sold were approximately
$301,500
, which the Company used to repay outstanding indebtedness under its U.S. term loan and revolving credit facility. The Company recognized a pre-tax gain on the sale of approximately
$223,500
, which is included in gain on sales of discontinued operations on the Consolidated Statements of Operations.
Sale of Thailand Operations
As previously disclosed in our 2018 Form 10-K, on February 12, 2019, the Company completed the sale of its interests in Thai Education Holdings Company Limited, a Thailand corporation (TEDCO), and Far East Stamford International Co. Ltd. (FES), a Thailand corporation. TEDCO was the owner of a controlling interest in FES, which was the license holder for Stamford International University, which had
three
campuses in Thailand. The total purchase price was approximately
$35,300
, and net proceeds were approximately
$27,900
, net of debt assumed by the buyer and other customary closing adjustments. Of the
$27,900
in net proceeds,
$23,700
, or
$20,300
net of cash sold, was received at closing. The balance of
$4,200
is payable upon satisfaction of certain post-closing requirements. The Company recognized a pre-tax gain on the sale of approximately
$10,800
, which is included in gain on sales of discontinued operations on the Consolidated Statements of Operations.
Additional Gain on Sale of China Operations
As previously disclosed in our 2018 Form 10-K, on
January 25, 2018
, the Company completed the sale of LEI Lie Ying Limited (LEILY). A portion of the purchase price was held back and subject to deduction of any indemnifiable losses payable to the buyer pursuant to the sale purchase agreement. On January 25, 2019, Laureate received HKD
71,463
(approximately US
$9,100
at date of receipt) for the second and final holdback payment, net of legal fees. Also, as of December 31, 2018, the Company had recorded a liability of approximately
$14,300
related to loss contingencies for which the Company had indemnified the buyer. During the first quarter of 2019, the legal matter that this loss contingency related to was settled, with no cost to the Company. Accordingly, during the
three months ended March 31, 2019
, the Company reversed the loss contingency and recognized additional gain on the sale of LEILY of approximately
$13,700
, which is included in gain on sales of discontinued operations on the Consolidated Statements of Operations. The remaining liability recorded relates to certain legal fees. Additionally, at the closing of the sale on
January 25, 2018
, a portion of the total transaction value was paid into an escrow account and will be distributed to the Company pursuant to the terms and conditions of the escrow agreement. As of both
March 31, 2019
and December 31, 2018, the Company has recorded a receivable of approximately
$25,900
for the portion of the escrowed amount that the Company expects to receive.
Note
6
.
Due to Shareholders of Acquired Companies
The amounts due to shareholders of acquired companies generally arise in connection with Laureate’s acquisition of a majority or all of the ownership interest of these companies. Promissory notes payable to the sellers of acquired companies, referred to as “seller notes,” are commonly used as a means of payment for business acquisitions. Seller note payments are classified as
Payments of deferred purchase price for acquisitions
within financing activities in our Consolidated Statements of Cash Flows. The amounts due to shareholders of acquired companies, currencies, and interest rates applied were as follows:
|
March 31, 2019
|
December 31, 2018
|
Nominal Currency
|
Interest
Rate % |
|||||
|
Universidade Anhembi Morumbi (UAM Brazil)
|
$
|
31,744
|
|
$
|
30,912
|
|
BRL
|
CDI + 2%
|
|
University of St. Augustine for Health Sciences, LLC
(St. Augustine) (1) |
11,395
|
|
11,395
|
|
USD
|
7%
|
||
|
Faculdade Porto-Alegrense (FAPA)
|
2,030
|
|
1,943
|
|
BRL
|
IGP-M
|
||
|
IADE Group
|
1,126
|
|
1,141
|
|
EUR
|
3%
|
||
|
Total due to shareholders of acquired companies
|
46,295
|
|
45,391
|
|
||||
|
Less: Current portion of due to shareholders of acquired companies
|
25,251
|
|
23,820
|
|
||||
|
Due to shareholders of acquired companies, less current portion
|
$
|
21,044
|
|
$
|
21,571
|
|
||
(1)
Although St. Augustine was sold and is included in Discontinued Operations, this promissory note is the legal obligation of a corporate entity, and therefore is included in Continuing Operations and remains outstanding following the sale of St. Augustine.
|
BRL: Brazilian Real
|
CDI: Certificados de Depósitos Interbancários (Brazil)
|
|
|
USD: United States Dollar
|
IGP-M: General Index of Market Prices (Brazil)
|
|
|
EUR: European Euro
|
||
15
Note
7
.
Business and Geographic Segment Information
Laureate’s educational services are offered through
six
operating segments: Brazil, Mexico, Andean, Central America & U.S. Campuses, Rest of World and Online & Partnerships. Laureate determines its operating segments based on information utilized by the chief operating decision maker to allocate resources and assess performance.
Our campus-based segments generate revenues by providing an education that emphasizes professional-oriented fields of study with undergraduate and graduate degrees in a wide range of disciplines. Our educational offerings are increasingly utilizing online and hybrid (a combination of online and in-classroom) courses and programs to deliver their curriculum. Many of our largest campus-based operations are in developing markets which are experiencing a growing demand for higher education based on favorable demographics and increasing secondary completion rates, driving increases in participation rates and resulting in continued growth in the number of higher education students. Traditional higher education students (defined as 18-24 year olds) have historically been served by public universities, which have limited capacity and are often underfunded, resulting in an inability to meet the growing student demand and employer requirements. This supply and demand imbalance has created a market opportunity for private sector participants. Most students finance their own education. However, there are some government-sponsored student financing programs which are discussed below. The campus-based segments include Brazil, Mexico, Andean, Central America & U.S. Campuses and Rest of World. Specifics related to each of these campus-based segments and our Online & Partnerships segment are discussed below
.
In Brazil, approximately 75% of post-secondary students are enrolled in private higher education institutions. While the federal government defines the national curricular guidelines, institutions are licensed to operate by city. Laureate owns 13 institutions in eight states throughout Brazil, with a particularly strong presence in the competitive São Paulo market. Many students finance their own education while others rely on the government-sponsored programs such as Prouni and FIES.
As described in Note
21
,
Subsequent Events
, on
April 16, 2019
, the Company entered into an agreement to divest UniNorte, a traditional higher education institution in Manaus, Brazil.
Public universities in Mexico enroll approximately two thirds of students attending post-secondary education. However, many public institutions are faced with capacity constraints or the quality of the education is considered low. Laureate owns two institutions and is present throughout the country with a footprint of over 40 campuses. Each institution in Mexico has a national license. Students in our Mexican institutions typically finance their own education.
The Andean segment includes institutions in Chile, Peru, Portugal and Spain. In Chile, private universities enroll approximately 80% of post-secondary students. In Peru, the public sector plays a significant role, but private universities are increasingly providing the capacity to meet growing demand. In Spain and Portugal, the high demand for post-secondary education places capacity constraints on the public sector, pushing students to turn to the private sector for high-quality education. Chile has government-sponsored student financing programs, while in the other countries students generally finance their own education. The institutions in Portugal and Spain are included in Discontinued Operations.
The Central America & U.S. Campuses segment includes institutions in Costa Rica, Honduras, Panama and the United States. Students in Central America typically finance their own education while students in the United States finance their education in a variety of ways, including U.S. Department of Education (DOE) Title IV programs. The entire Central America & U.S. Campuses segment is included in Discontinued Operations.
The Rest of World segment includes an institution in the European country of Turkey, as well as institutions in the Middle East, Africa and Asia Pacific consisting of campus-based institutions with operations in Australia, India, Malaysia, New Zealand and South Africa. Additionally, the Rest of World segment manages
eight
licensed institutions in the Kingdom of Saudi Arabia and manages
one
additional institution in China through a joint venture arrangement.
The institutions in the Rest of World segment are included in Discontinued Operations, except for Australia, New Zealand and the managed institutions in the Kingdom of Saudi Arabia and China.
The institutions in the Kingdom of Saudi Arabia
are managed under a contract that expires in August 2019
. Also, as described in Note
21
,
Subsequent Events
, on
April 8, 2019
, the Company completed the sale of its institution in South Africa.
The Online & Partnerships segment includes fully online institutions that offer professionally oriented degree programs in the United States through Walden University (Walden), a U.S.-based accredited institution, and through the University of Liverpool and the University of Roehampton in the United Kingdom. These online institutions primarily serve working adults with undergraduate and graduate degree program offerings. Students in the United States finance their education in a variety of ways, including Title IV programs.
We no longer accept new enrollments at the University of Liverpool and the University of Roehampton
.
16
As discussed in Note
1
,
Description of Business
, and Note
4
,
Discontinued Operations and Assets Held for Sale
, during the third quarter of 2018, a number of our subsidiaries met the requirements to be classified as discontinued operations, including the entire
Central America & U.S. Campuses segment
. As a result, the operations of the
Central America & U.S. Campuses segment
have been excluded from the segment information for all periods presented. In addition, the portions of the Andean and Rest of World reportable segments that are included in discontinued operations have also been excluded from the segment information for all periods presented.
Intersegment transactions are accounted for in a similar manner as third-party transactions and are eliminated in consolidation. The Corporate amounts presented in the following tables include corporate charges that were not allocated to our reportable segments and adjustments to eliminate intersegment items.
We evaluate segment performance based on Adjusted EBITDA, which is a non-GAAP performance measure defined as Income (loss) from continuing operations before income taxes and equity in net income of affiliates, adding back the following items:
Gain (loss) on sales of subsidiaries, net
,
Foreign currency exchange loss, net
,
Other income, net
,
Gain (loss) on derivatives
,
Loss on debt extinguishment
,
Interest expense
,
Interest income
, Depreciation and amortization expense, Loss on impairment of assets, Share-based compensation expense and expenses related to our Excellence-in-Process (EiP) initiative. EiP is an enterprise-wide initiative to optimize and standardize Laureate’s processes, creating vertical integration of procurement, information technology, finance, accounting and human resources. It includes the establishment of regional shared services organizations (SSOs) around the world, as well as improvements to the Company's system of internal controls over financial reporting. We have expanded the EiP initiative into other back- and mid-office areas, as well as certain student-facing activities. EiP also includes certain non-recurring costs incurred in connection with the planned dispositions described in Note
4
,
Discontinued Operations and Assets Held for Sale
, and the completed dispositions described in Note
5
,
Dispositions
.
When we review Adjusted EBITDA on a segment basis, we exclude intercompany revenues and expenses related to network fees and royalties between our segments, which eliminate in consolidation. We use total assets as the measure of assets for reportable segments.
17
The following tables provide financial information for our reportable segments, including a reconciliation of Adjusted EBITDA to Income from continuing operations before income taxes, as reported in the Consolidated Statements of Operations:
|
For the three months ended March 31,
|
2019
|
2018
|
|||||
|
Revenues
|
|||||||
|
Brazil
|
$
|
109,969
|
|
$
|
122,792
|
|
|
|
Mexico
|
156,464
|
|
155,899
|
|
|||
|
Andean
|
138,942
|
|
135,054
|
|
|||
|
Rest of World
|
54,156
|
|
52,274
|
|
|||
|
Online & Partnerships
|
161,774
|
|
168,031
|
|
|||
|
Corporate
|
491
|
|
(1,834
|
)
|
|||
|
Revenues
|
$
|
621,796
|
|
|
$
|
632,216
|
|
|
Adjusted EBITDA of reportable segments
|
|||||||
|
Brazil
|
$
|
(30,656
|
)
|
$
|
(26,016
|
)
|
|
|
Mexico
|
25,828
|
|
30,443
|
|
|||
|
Andean
|
(33,243
|
)
|
(39,431
|
)
|
|||
|
Rest of World
|
4,500
|
|
2,990
|
|
|||
|
Online & Partnerships
|
48,576
|
|
44,974
|
|
|||
|
Total Adjusted EBITDA of reportable segments
|
15,005
|
|
12,960
|
|
|||
|
Reconciling items:
|
|||||||
|
Corporate
|
(36,611
|
)
|
(42,627
|
)
|
|||
|
Depreciation and amortization expense
|
(47,644
|
)
|
(56,969
|
)
|
|||
|
Loss on impairment of assets
|
—
|
|
—
|
|
|||
|
Share-based compensation expense
|
(2,987
|
)
|
4,077
|
|
|||
|
EiP expenses
|
(12,292
|
)
|
(10,062
|
)
|
|||
|
Operating loss
|
(84,529
|
)
|
(92,621
|
)
|
|||
|
Interest income
|
3,553
|
|
3,268
|
|
|||
|
Interest expense
|
(54,655
|
)
|
(63,335
|
)
|
|||
|
Loss on debt extinguishment
|
(10,622
|
)
|
(7,481
|
)
|
|||
|
Gain (loss) on derivatives
|
5,183
|
|
(19,340
|
)
|
|||
|
Other income, net
|
359
|
|
2,597
|
|
|||
|
Foreign currency exchange loss, net
|
(4,659
|
)
|
(11,782
|
)
|
|||
|
Loss from continuing operations before income taxes
|
$
|
(145,370
|
)
|
$
|
(188,694
|
)
|
|
|
March 31, 2019
|
December 31, 2018
|
||||||
|
Assets
|
|||||||
|
Brazil
|
$
|
1,173,337
|
|
$
|
1,011,391
|
|
|
|
Mexico
|
1,305,525
|
|
971,309
|
|
|||
|
Andean
|
1,971,141
|
|
1,608,406
|
|
|||
|
Rest of World
|
249,863
|
|
231,421
|
|
|||
|
Online & Partnerships
|
1,260,983
|
|
1,308,854
|
|
|||
|
Corporate and Discontinued Operations
|
1,872,672
|
|
1,638,255
|
|
|||
|
Total assets
|
$
|
7,833,521
|
|
$
|
6,769,636
|
|
|
18
Note
8
.
Goodwill
The change in the net carrying amount of Goodwill from
December 31, 2018
through
March 31, 2019
was composed of the following items:
|
|
Brazil
|
Mexico
|
Andean
|
Rest of World
|
Online & Partnerships
|
Total
|
||||||||||||
|
Balance at December 31, 2018
|
$
|
406,452
|
|
$
|
498,219
|
|
$
|
254,259
|
|
$
|
87,419
|
|
$
|
460,740
|
|
$
|
1,707,089
|
|
|
Acquisitions
|
1,327
|
|
—
|
|
—
|
|
—
|
|
—
|
|
1,327
|
|
||||||
|
Dispositions
|
—
|
|
—
|
|
—
|
|
—
|
|
—
|
|
—
|
|
||||||
|
Impairments
|
—
|
|
—
|
|
—
|
|
—
|
|
—
|
|
—
|
|
||||||
|
Currency translation adjustments
|
2,066
|
|
22,213
|
|
4,781
|
|
752
|
|
—
|
|
29,812
|
|
||||||
|
Adjustments to prior acquisitions
|
—
|
|
—
|
|
—
|
|
—
|
|
—
|
|
—
|
|
||||||
|
Balance at March 31, 2019
|
$
|
409,845
|
|
$
|
520,432
|
|
$
|
259,040
|
|
$
|
88,171
|
|
$
|
460,740
|
|
$
|
1,738,228
|
|
In March 2019, the Company's indirect, wholly owned subsidiary, UAM Brazil, acquired a company in Brazil that, prior to the acquisition, was a vendor providing distance-learning and marketing services to the Company's Brazil operations. The total purchase price was BRL
5,000
(
$1,327
at the date of purchase), which was recorded as Goodwill given the immaterial nature of the acquisition. The acquiree is being merged into UAM Brazil.
Note
9
.
Debt
Outstanding long-term debt was as follows:
|
March 31, 2019
|
December 31, 2018
|
||||||
|
Senior long-term debt:
|
|||||||
|
Senior Secured Credit Facility (stated maturity dates April 2022 and April 2024), net of discount
|
$
|
921,127
|
|
$
|
1,321,629
|
|
|
|
Senior Notes (stated maturity date May 2025)
|
800,000
|
|
800,000
|
|
|||
|
Total senior long-term debt
|
1,721,127
|
|
2,121,629
|
|
|||
|
Other debt:
|
|||||||
|
Lines of credit
|
38,612
|
|
37,899
|
|
|||
|
Notes payable and other debt
|
494,882
|
|
504,522
|
|
|||
|
Total senior and other debt
|
2,254,621
|
|
2,664,050
|
|
|||
|
Finance lease obligations and sale-leaseback financings
|
69,434
|
|
119,642
|
|
|||
|
Total long-term debt and finance leases
|
2,324,055
|
|
2,783,692
|
|
|||
|
Less: total unamortized deferred financing costs
|
82,463
|
|
88,241
|
|
|||
|
Less: current portion of long-term debt and finance leases
|
105,264
|
|
101,866
|
|
|||
|
Long-term debt and finance leases, less current portion
|
$
|
2,136,328
|
|
$
|
2,593,585
|
|
|
Estimated Fair Value of Debt
The estimated fair value of our debt was determined using observable market prices, as the majority of our securities, including the Senior Secured Credit Facility and the Senior Notes due 2025, are traded in a brokered market. The fair value of our remaining debt instruments approximates carrying value based on their terms. As of
March 31, 2019
and
December 31, 2018
, our long-term debt was classified as Level 2 within the fair value hierarchy, based on the frequency and volume of trading in the brokered market. The estimated fair value of our debt was as follows:
|
March 31, 2019
|
December 31, 2018
|
||||||||||||||
|
Carrying amount
|
Estimated fair value
|
Carrying amount
|
Estimated fair value
|
||||||||||||
|
Total senior and other debt
|
$
|
2,254,621
|
|
$
|
2,323,394
|
|
$
|
2,664,050
|
|
$
|
2,677,024
|
|
|||
19
Loss on Debt Extinguishment
As discussed in Note
5
,
Dispositions
, the Company completed the sale of St. Augustine on
February 1, 2019
and used approximately
$340,000
of the total
$346,400
of net proceeds to repay a portion of the term loan that matures in April 2024 (the 2024 Term Loan) under its Senior Secured Credit Facility, with the remaining proceeds utilized to repay borrowings outstanding for the revolver under its Senior Secured Credit Facility. In addition, during the first quarter of 2019, the Company elected to repay approximately
$35,000
of the approximately
$51,700
principal balance outstanding for certain notes payable at a real estate subsidiary in Chile.
In connection with these debt repayments, the Company recorded a
Loss on debt extinguishment
of
$10,622
, primarily related to the write off of a pro-rata portion of the unamortized deferred financing costs associated with the repaid debt balances.
Certain Covenants
As of
March 31, 2019
, our senior long-term debt contained certain negative covenants including, among others: (1) limitations on additional indebtedness; (2) limitations on dividends; (3) limitations on asset sales, including the sale of ownership interests in subsidiaries and sale-leaseback transactions; and (4) limitations on liens, guarantees, loans or investments. The
Second Amended and Restated Credit Agreement
provides, solely with respect to the Revolving Credit Facility, that the Company shall not permit its Consolidated Senior Secured Debt to Consolidated EBITDA ratio, as defined in the Second Amended and Restated Credit Agreement, to exceed
3.50x
as of the last day of each quarter ending June 30, 2018 and thereafter. However, the agreement also provides that if (i) the Company’s Consolidated Total Debt to Consolidated EBITDA ratio, as defined in the Second Amended and Restated Credit Agreement, is not greater than
4.75
x as of such date and (ii) less than
25%
of the Revolving Credit Facility is utilized as of that date, then such financial covenant shall not apply.
As of
March 31, 2019
, these conditions were satisfied and, therefore, we were not subject to the leverage ratio covenant.
In addition, notes payable at some of our locations contain financial maintenance covenants.
Note
10
.
Leases
Laureate conducts a significant portion of its operations at leased facilities. These facilities include our corporate headquarters, other office locations, and many of Laureate's higher education facilities. Laureate analyzes each lease agreement to determine whether it should be classified as a finance lease or an operating lease. As a result of adopting ASC Topic 842, we recorded significant asset and liability balances associated with the operating leases that are now classified on the balance sheet, as described further below.
Operating Leases
Our operating lease agreements are primarily for real estate space and are included within operating lease ROU assets and operating lease liabilities on the Consolidated Balance Sheets. The terms of our operating leases vary and generally contain renewal options. Certain of these operating leases provide for increasing rent over the term of the lease. Laureate also leases certain equipment under noncancellable operating leases, which are typically for terms of
60 months
or less.
ROU assets represent our right to use an underlying asset for the lease term and lease liabilities represent our obligation to make lease payments arising from the lease. ROU assets and lease liabilities are recognized at the commencement date based on the present value of lease payments over the lease term. Our variable lease payments consist of non-lease services related to the lease. Variable lease payments are excluded from the ROU assets and lease liabilities and are recognized in the period in which the obligation for those payments is incurred. As most of our leases do not provide an implicit rate, we use our incremental borrowing rate based on the information available at the commencement date in determining the present value of lease payments. Many of our lessee agreements include options to extend the lease, which we do not include in our minimum lease terms unless they are reasonably certain to be exercised. Rental expense for lease payments related to operating leases is recognized on a straight-line basis over the lease term. On occasion, Laureate has entered into sublease agreements for certain leased office space; however, the sublease income from these agreements is immaterial.
20
Supplemental balance sheet information related to leases was as follows:
|
Leases
|
Classification
|
March 31, 2019
|
||
|
Assets:
|
||||
|
Operating
|
Operating lease right-of-use assets, net
|
$
|
952,890
|
|
|
Finance
|
Buildings, Furniture, equipment and software, net
|
21,541
|
|
|
|
Total leased assets
|
$
|
974,431
|
|
|
|
Liabilities:
|
||||
|
Current
|
||||
|
Operating
|
Current portion of operating leases
|
$
|
97,517
|
|
|
Finance
|
Current portion of long-term debt and finance leases
|
4,705
|
|
|
|
Non-current
|
||||
|
Operating
|
Long-term operating leases, less current portion
|
871,588
|
|
|
|
Finance
|
Long-term debt and finance leases, less current portion
|
20,763
|
|
|
|
Total lease liabilities
|
$
|
994,573
|
|
|
|
Lease Term and Discount Rate
|
March 31, 2019
|
|
|
Weighted average remaining lease terms
|
||
|
Operating leases
|
9.5 years
|
|
|
Finance leases
|
8.9 years
|
|
|
Weighted average discount rate
|
||
|
Operating leases
|
9.80
|
%
|
|
Finance leases
|
9.90
|
%
|
The components of lease cost were as follows:
|
Lease Cost
|
Classification
|
For the three months ended March 31, 2019
|
||
|
Operating lease cost
|
Direct costs
|
$
|
45,716
|
|
|
Finance lease cost
|
||||
|
Amortization of leased assets
|
Direct costs
|
1,146
|
|
|
|
Interest on leased assets
|
Interest expense
|
621
|
|
|
|
Short-term lease costs
|
Direct costs
|
677
|
|
|
|
Variable lease costs
|
Direct costs
|
3,848
|
|
|
|
Sublease income
|
Other income, net
|
(959
|
)
|
|
|
Total lease cost
|
$
|
51,049
|
|
|
21
As of
March 31, 2019
, maturities of lease liabilities were as follows:
|
Maturity of Lease Liability
|
Operating Leases
|
Finance Leases
|
||||
|
Year 1
|
$
|
180,166
|
|
$
|
5,783
|
|
|
Year 2
|
169,420
|
|
4,709
|
|
||
|
Year 3
|
159,952
|
|
4,155
|
|
||
|
Year 4
|
151,139
|
|
3,958
|
|
||
|
Year 5
|
140,294
|
|
3,147
|
|
||
|
Thereafter
|
651,535
|
|
14,138
|
|
||
|
Total lease payments
|
$
|
1,452,506
|
|
$
|
35,890
|
|
|
Less: interest and inflation
|
(483,401
|
)
|
(10,422
|
)
|
||
|
Present value of lease liabilities
|
$
|
969,105
|
|
$
|
25,468
|
|
Supplemental cash flow information related to leases was as follows:
|
Other Information
|
For the three months ended March 31, 2019
|
||
|
Cash paid for amounts included in the measurement of lease liabilities
|
|||
|
Operating cash flows from operating leases
|
$
|
47,367
|
|
|
Operating cash flows from finance leases
|
621
|
|
|
|
Financing cash flows from finance leases
|
984
|
|
|
|
Leased assets obtained for new finance lease liabilities
|
125
|
|
|
|
Leased assets obtained for new operating lease liabilities
|
149
|
|
|
As disclosed in our 2018 Form 10-K, future minimum lease payments at
December 31, 2018
, prior to the adoption of ASC Topic 842, by year and in the aggregate, under all noncancellable operating leases were as follows:
|
Lease Payments
|
|||
|
2019
|
$
|
151,795
|
|
|
2020
|
142,995
|
|
|
|
2021
|
135,426
|
|
|
|
2022
|
128,441
|
|
|
|
2023
|
119,955
|
|
|
|
Thereafter
|
482,220
|
|
|
|
Total
|
$
|
1,160,832
|
|
Note
11
.
Commitments and Contingencies
Noncontrolling Interest Holder Put Arrangements
The following section provides a summary table and description of the various noncontrolling interest holder put arrangements, all of which relate to Discontinued Operations, that Laureate had outstanding as of
March 31, 2019
. Laureate has elected to accrete changes in the arrangements’ redemption values over the period from the date of issuance to the earliest redemption date. The redeemable noncontrolling interests are recorded at the greater of the accreted redemption value or the traditional noncontrolling interest. Until the first exercise date, the put instruments’ reported values may be lower than the final amounts that will be required to settle the minority put arrangements. As of
March 31, 2019
, the carrying value of all noncontrolling interest holder put arrangements was
$12,195
.
22
If the minority put arrangements were all exercised at
March 31, 2019
, Laureate would be obligated to pay the noncontrolling interest holders an estimated amount of
$12,195
, as summarized in the following table:
|
Nominal Currency
|
First Exercisable Date
|
Estimated Value as of March 31, 2019 redeemable within 12-months:
|
Reported
Value |
||||||
|
Noncontrolling interest holder put arrangements
|
|||||||||
|
INTI Education Holdings Sdn Bhd (Inti Holdings) - 10.10%
|
MYR
|
Current
|
$
|
10,109
|
|
$
|
10,109
|
|
|
|
Pearl Retail Solutions Private Limited (Pearl) - 10%
|
INR
|
Current
|
2,086
|
|
2,086
|
|
|||
|
Total noncontrolling interest holder put arrangements
|
12,195
|
|
12,195
|
|
|||||
|
Puttable common stock - not currently redeemable
|
USD
|
*
|
—
|
|
1,714
|
|
|||
|
Total redeemable noncontrolling interests and equity
|
$
|
12,195
|
|
$
|
13,909
|
|
|||
* Contingently redeemable
MYR: Malaysian Ringgit
INR: Indian Rupee
Laureate’s noncontrolling interest put arrangements are specified in agreements with each noncontrolling interest holder. The terms of these agreements determine the measurement of the redemption value of the put options based on a non-GAAP measure of earnings before interest, taxes, depreciation and amortization (EBITDA, or recurring EBITDA), the definition of which varies for each particular contract.
Commitments and contingencies are generally denominated in foreign currencies.
Other Loss Contingencies
Laureate is subject to legal actions arising in the ordinary course of its business. In management's opinion, we have adequate legal defenses, insurance coverage and/or accrued liabilities with respect to the eventuality of such actions. We do not believe that any settlement would have a material impact on our Consolidated Financial Statements.
Contingent Liabilities for Taxes
As of
March 31, 2019
and
December 31, 2018
, Laureate has recorded cumulative liabilities totaling
$54,026
and
$52,880
, respectively, for taxes other-than-income tax, principally payroll-tax-related uncertainties recorded at the time of an acquisition, of which
$4,725
and
$4,999
, respectively, was classified as held for sale. The changes in this recorded liability are related to acquisitions, interest and penalty accruals, changes in tax laws, expirations of statutes of limitations, settlements and changes in foreign currency exchange rates. The terms of the statutes of limitations on these contingencies vary but can be up to
10 years
. These liabilities were included in current and long-term liabilities on the Consolidated Balance Sheets. Changes in the recorded values of non-income tax contingencies impact operating income and interest expense, while changes in the related indemnification assets impact only operating income. The total decrease to operating income for adjustments to non-income tax contingencies and indemnification assets was
$4,561
and
$2,121
, respectively, for the
three months ended March 31, 2019
and
2018
.
In addition, as of
March 31, 2019
and
December 31, 2018
, Laureate has recorded cumulative liabilities for income tax contingencies of
$62,322
and
$64,157
, respectively, of which
$12,182
and
$11,208
, respectively, were classified as held for sale. As of
March 31, 2019
and
December 31, 2018
, indemnification assets primarily related to acquisition contingencies were
$79,621
and
$82,061
, respectively, of which
$391
and
$476
, respectively, were classified as held for sale. These indemnification assets primarily cover contingencies for income taxes and taxes other-than-income taxes. We have also recorded a receivable of approximately
$19,500
from the former owner of one of our Brazil institutions which is guaranteed by future rental payments to the former owner.
In addition, we have identified certain contingencies, primarily tax-related, that we have assessed as being reasonably possible of loss, but not probable of loss, and could have an adverse effect on the Company’s results of operations if the outcomes are unfavorable. In most cases, Laureate has received indemnifications from the former owners and/or noncontrolling interest holders of the acquired businesses for contingencies, and therefore, we do not believe we will sustain an economic loss even if we are required to pay these additional amounts. In cases where we are not indemnified, the unrecorded contingencies are not individually material and are primarily in Brazil. In the aggregate, we estimate that the reasonably possible loss for these unrecorded contingencies in Brazil could be up to approximately
$42,000
if the outcomes were unfavorable in all cases.
23
Other Loss Contingencies
Laureate has accrued liabilities for certain civil actions against our institutions, a portion of which existed prior to our acquisition of these entities. Laureate intends to vigorously defend against these matters. As of
March 31, 2019
and
December 31, 2018
, approximately
$31,000
and
$29,000
,
respectively, of
loss contingencies were included in
Other long-term liabilities
and
Other current liabilities
on the Consolidated Balance Sheets. In addition, as of
March 31, 2019
and
December 31, 2018
,
$4,100
and
$18,000
, respectively, of loss contingencies for Discontinued Operations were classified as liabilities held for sale. The decrease is primarily related to the reversal of loss contingencies recorded in 2018 in connection with the sale of LEILY in China, as discussed in Note
5
,
Dispositions
. During the first quarter of 2019, loss contingencies were reversed following the settlement of a legal matter related to LEILY with no cost to the Company, resulting in additional gain on sale.
Material Guarantees – Student Financing
The accredited Chilean institutions in the Laureate network also participate in a government-sponsored student financing program known as Crédito con Aval del Estado (the CAE Program).
The CAE Program was formally implemented by the Chilean government in 2006 to promote higher education in Chile for lower socio-economic level students in good academic standing. The CAE Program involves tuition financing and guarantees that are provided by our institutions and the government.
As part of the CAE Program, these institutions provide guarantees which result in contingent liabilities to third-party financing institutions, beginning at 90% of the tuition loans made directly to qualified students enrolled through the CAE Program and declining to 60% over time. The guarantees by these institutions are in effect during the period in which the student is enrolled
, and the guarantees are assumed entirely by the government upon the student’s graduation. When a student leaves one of Laureate's institutions and enrolls in another CAE-qualified institution, the Laureate institution will remain guarantor of the tuition loans that have been granted up to the date of transfer, and until the student's graduation from a CAE-qualified institution.
The maximum potential amount of payments our institutions could be required to make under the CAE Program was approximately
$509,000
and
$499,000
at
March 31, 2019
and
December 31, 2018
, respectively.
This maximum potential amount assumes that all students in the CAE Program do not graduate, so that our guarantee would not be assigned to the government, and that all students default on the full amount of the CAE-qualified loan balances.
As of
March 31, 2019
and
December 31, 2018
,
we recorded
$37,417
and
$28,254
, respectively,
as estimated long-term guarantee liabilities for these obligations.
Material Guarantees – Other
In conjunction with the purchase of Universidade Potiguar in Brazil (UNP), Laureate pledged all of the acquired shares as a guarantee of our payments of rents as they become due. In the event that we default on any payment, the pledge agreement provides for a forfeiture of the relevant pledged shares. In the event of forfeiture, Laureate may be required to transfer the books and management of UNP to the former owners.
Laureate
acquired the remaining 49% ownership interest in UAM Brazil in April 2013. As part of the agreement to purchase the 49% ownership interest, Laureate pledged 49% of its total shares in UAM Brazil as a guarantee of our payment obligations under the purchase agreement. In the event that we default on any payment, the agreement provides for a forfeiture of the pledged shares.
In connection with the purchase of FMU Education Group on September 12, 2014,
Laureate pledged 75% of the acquired shares to third-party lenders as a guarantee of our payment obligations under the loans that financed a portion of the purchase price.
Laureate
pledged the remaining 25% of the acquired shares to the sellers as a guarantee of our payment obligations under the purchase agreement for the seller notes
. In the event that we default on any payment of the loans or seller notes, the purchase agreement provides for a forfeiture of the relevant pledged shares. After the payment of the seller notes in September 2017, the shares pledged to the sellers were pledged to the third-party lenders until full payment of the loans, which mature in April 2021.
In connection with a loan agreement entered into by a Laureate subsidiary in Peru, all of the shares of Universidad Privada del Norte, one of our universities, were pledged to the third-party lender as a guarantee of the payment obligations under the loan.
Standby Letters of Credit, Surety Bonds and Other Commitments
As of
March 31, 2019
and
December 31, 2018
, Laureate's outstanding letters of credit (LOCs) and surety bonds primarily consisted of the items discussed below.
As of both
March 31, 2019
and
December 31, 2018
, we had approximately
$139,000
posted as LOCs in favor of the DOE. These LOCs were required to allow Walden, NewSchool of Architecture and Design and St. Augustine to continue participating in the DOE Title IV program. These LOCs are recorded on Walden and a corporate entity and are fully collateralized with cash equivalents
24
and certificates of deposit, which are classified as
Restricted cash
on our
March 31, 2019
and
December 31, 2018
Consolidated Balance Sheets.
As of
March 31, 2019
and
December 31, 2018
, we had approximately
$5,700
posted as cash collateral for LOCs related to the Spanish tax audits, which was recorded in Continuing Operations and classified as
Restricted cash
on our
March 31, 2019
and
December 31, 2018
Consolidated Balance Sheets. The cash collateral is related to the final assessment issued by the Spanish Taxing Authority (STA) in October 2018 for the 2011 to 2013 tax audit period.
As part of our normal operations, our insurers issue surety bonds on our behalf, as required by various state education authorities in the United States. We are obligated to reimburse our insurers for any payments made by the insurers under the surety bonds. As of
March 31, 2019
and
December 31, 2018
, the total face amount of these surety bonds was
$22,235
and $
22,204
, respectively. These bonds are fully collateralized with cash, which was classified as
Restricted cash
on our
March 31, 2019
and
December 31, 2018
Consolidated Balance Sheets.
In November 2016, in order to continue participating in Prouni, a federal program that offers tax benefits designed to increase higher education participation rates in Brazil, UAM Brazil posted a guarantee in the amount of
$15,300
. In connection with the issuance of the guarantee, UAM Brazil obtained a non-collateralized surety bond from a third party in order to secure the guarantee. The cost of the surety bond was
$1,400
, of which half was reimbursed by the former owner of UAM Brazil, and is being amortized over the
five
-year term. The Company believes that this matter will not have a material impact on our Consolidated Financial Statements.
Note
12
.
Financing Receivables
Laureate’s financing receivables consist primarily of trade receivables related to student tuition financing programs with an initial term in excess of one year. We have offered long-term financing through the execution of note receivable agreements with students at some of our institutions. Our disclosures include financing receivables that are classified in our Consolidated Balance Sheets as both current and long-term, reported in accordance with ASC 310, “Receivables.”
Laureate’s financing receivables balances were as follows:
|
March 31, 2019
|
December 31, 2018
|
||||||
|
Financing receivables
|
$
|
25,816
|
|
$
|
16,531
|
|
|
|
Allowance for doubtful accounts
|
(6,477
|
)
|
(6,395
|
)
|
|||
|
Financing receivables, net of allowances
|
$
|
19,339
|
|
$
|
10,136
|
|
|
We do not purchase financing receivables in the ordinary course of our business. We may sell certain receivables that are significantly past due. No material amounts of financing receivables were sold during the periods reported herein.
25
Delinquency is the primary indicator of credit quality for our financing receivables. Receivable balances are considered delinquent when contractual payments on the loan become past due. Delinquent financing receivables are placed on non-accrual status for interest income. The accrual of interest is resumed when the financing receivable becomes contractually current and when collection of all remaining amounts due is reasonably assured. We record an Allowance for doubtful accounts to reduce our financing receivables to their net realizable value. The Allowance for doubtful accounts is based on the age of the receivables, the status of past-due amounts, historical collection trends, current economic conditions, and student enrollment status. Each of our institutions evaluates its balances for potential impairment. We consider impaired loans to be those that are past due one year or greater, and those that are modified as a troubled debt restructuring (TDR). The aging of financing receivables grouped by country portfolio was as follows:
|
Chile
|
Other
|
Total
|
|||||||||
|
As of March 31, 2019
|
|||||||||||
|
Amounts past due less than one year
|
$
|
10,728
|
|
$
|
433
|
|
$
|
11,161
|
|
||
|
Amounts past due one year or greater
|
3,006
|
|
153
|
|
3,159
|
|
|||||
|
Total past due (on non-accrual status)
|
13,734
|
|
586
|
|
14,320
|
|
|||||
|
Not past due
|
10,202
|
|
1,294
|
|
11,496
|
|
|||||
|
Total financing receivables
|
$
|
23,936
|
|
$
|
1,880
|
|
$
|
25,816
|
|
||
|
As of December 31, 2018
|
|||||||||||
|
Amounts past due less than one year
|
$
|
7,618
|
|
$
|
644
|
|
$
|
8,262
|
|
||
|
Amounts past due one year or greater
|
2,879
|
|
192
|
|
3,071
|
|
|||||
|
Total past due (on non-accrual status)
|
10,497
|
|
836
|
|
11,333
|
|
|||||
|
Not past due
|
4,980
|
|
218
|
|
5,198
|
|
|||||
|
Total financing receivables
|
$
|
15,477
|
|
$
|
1,054
|
|
$
|
16,531
|
|
||
The following is a rollforward of the Allowance for doubtful accounts related to financing receivables for the
three months ended March 31, 2019
and
2018
, grouped by country portfolio:
|
Chile
|
Other
|
Total
|
|||||||||
|
Balance at December 31, 2018
|
$
|
(6,108
|
)
|
$
|
(287
|
)
|
$
|
(6,395
|
)
|
||
|
Charge-offs
|
414
|
|
76
|
|
490
|
|
|||||
|
Recoveries
|
—
|
|
—
|
|
—
|
|
|||||
|
Reclassifications
|
—
|
|
—
|
|
—
|
|
|||||
|
Provision
|
(361
|
)
|
(72
|
)
|
(433
|
)
|
|||||
|
Currency adjustments
|
(124
|
)
|
(15
|
)
|
(139
|
)
|
|||||
|
Balance at March 31, 2019
|
$
|
(6,179
|
)
|
$
|
(298
|
)
|
$
|
(6,477
|
)
|
||
|
Balance at December 31, 2017
|
$
|
(6,107
|
)
|
$
|
(365
|
)
|
$
|
(6,472
|
)
|
||
|
Charge-offs
|
331
|
|
—
|
|
331
|
|
|||||
|
Recoveries
|
(1
|
)
|
—
|
|
(1
|
)
|
|||||
|
Reclassifications
|
—
|
|
—
|
|
—
|
|
|||||
|
Provision
|
(731
|
)
|
28
|
|
(703
|
)
|
|||||
|
Currency adjustments
|
(164
|
)
|
(9
|
)
|
(173
|
)
|
|||||
|
Balance at March 31, 2018
|
$
|
(6,672
|
)
|
$
|
(346
|
)
|
$
|
(7,018
|
)
|
||
Restructured Receivables
A TDR is a financing receivable in which the borrower is experiencing financial difficulty and Laureate has granted an economic concession to the student debtor that we would not otherwise consider. When we modify financing receivables in a TDR, Laureate typically offers the student debtor an extension of the loan maturity and/or a reduction in the accrued interest balance. In certain situations, we may offer to restructure a financing receivable in a manner that ultimately results in the forgiveness of contractually specified principal balances. Our only TDRs are in Chile.
26
The number of financing receivable accounts and the pre- and post-modification account balances modified under the terms of a TDR during the
three months ended March 31, 2019
and
2018
were as follows:
|
Number of Financing Receivable Accounts
|
Pre-Modification Balance Outstanding
|
Post-Modification Balance Outstanding
|
||||||||
|
2019
|
296
|
|
$
|
898
|
|
$
|
867
|
|
||
|
2018
|
409
|
|
$
|
1,372
|
|
$
|
1,262
|
|
||
The preceding table represents accounts modified under the terms of a TDR during the
three months ended March 31, 2019
, whereas the following table represents accounts modified as a TDR between January 1,
2018
and
March 31, 2019
that subsequently defaulted during the
three months ended March 31, 2019
:
|
Number of Financing Receivable Accounts
|
Balance at Default
|
|||||
|
Total
|
155
|
|
$
|
251
|
|
|
The following table represents accounts modified as a TDR between January 1,
2017
and
March 31, 2018
that subsequently defaulted during the
three months ended March 31, 2018
:
|
Number of Financing Receivable Accounts
|
Balance at Default
|
|||||
|
Total
|
138
|
|
$
|
339
|
|
|
Note
13
.
Share-based Compensation
Share-based compensation expense was as follows:
|
For the three months ended March 31,
|
2019
|
2018
|
|||||
|
Continuing operations
|
|||||||
|
Stock options, net of estimated forfeitures
|
$
|
823
|
|
$
|
(7,247
|
)
|
|
|
Restricted stock awards
|
2,164
|
|
3,170
|
|
|||
|
Total continuing operations
|
$
|
2,987
|
|
$
|
(4,077
|
)
|
|
|
Discontinued operations
|
|||||||
|
Share-based compensation expense for discontinued operations
|
162
|
|
321
|
|
|||
|
Total continuing and discontinued operations
|
$
|
3,149
|
|
$
|
(3,756
|
)
|
|
The negative stock options expense for the three months ended March 31, 2018 relates to the correction of an immaterial error.
27
Note
14
.
Stockholders' Equity
The components of net changes in stockholders' equity for the three months ended
March 31, 2019
were as follows:
|
|
Laureate Education, Inc. Stockholders
|
|
|
||||||||||||||||||||||
|
|
Class A
Common Stock |
Class B
Common Stock |
Additional paid-in capital
|
(Accumulated deficit) retained earnings
|
Accumulated other comprehensive (loss) income
|
Non-controlling interests
|
Total stockholders' equity
|
||||||||||||||||||
|
|
Shares
|
Amount
|
Shares
|
Amount
|
|||||||||||||||||||||
|
Balance at December 31, 2018
|
107,450
|
$
|
430
|
|
116,865
|
|
$
|
467
|
|
$
|
3,703,796
|
|
$
|
(530,919
|
)
|
$
|
(1,112,695
|
)
|
$
|
(10,133
|
)
|
$
|
2,050,946
|
|
|
|
Adoption of accounting standards
|
—
|
|
—
|
|
—
|
|
—
|
|
—
|
|
28,944
|
|
—
|
|
—
|
|
28,944
|
|
|||||||
|
Balance at January 1, 2019
|
107,450
|
|
430
|
|
116,865
|
|
467
|
|
3,703,796
|
|
(501,975
|
)
|
(1,112,695
|
)
|
(10,133
|
)
|
2,079,890
|
|
|||||||
|
Non-cash stock compensation
|
—
|
|
—
|
|
—
|
|
—
|
|
3,149
|
|
—
|
|
—
|
|
—
|
|
3,149
|
|
|||||||
|
Conversion of Class B shares to Class A shares
|
8
|
|
—
|
|
(8
|
)
|
—
|
|
—
|
|
—
|
|
—
|
|
—
|
|
—
|
|
|||||||
|
Vesting of restricted stock, net of shares withheld to satisfy tax withholding
|
325
|
|
1
|
|
—
|
|
—
|
|
(1,421
|
)
|
—
|
|
—
|
|
—
|
|
(1,420
|
)
|
|||||||
|
Distributions to noncontrolling interest holders
|
—
|
|
—
|
|
—
|
|
—
|
|
—
|
|
—
|
|
—
|
|
(625
|
)
|
(625
|
)
|
|||||||
|
Accretion of redeemable noncontrolling interests and equity
|
—
|
|
—
|
|
—
|
|
—
|
|
263
|
|
—
|
|
—
|
|
—
|
|
263
|
|
|||||||
|
Reclassification of redeemable noncontrolling interests and equity
|
—
|
|
—
|
|
—
|
|
—
|
|
—
|
|
—
|
|
—
|
|
224
|
|
224
|
|
|||||||
|
Net income
|
—
|
|
—
|
|
—
|
|
—
|
|
—
|
|
191,243
|
|
—
|
|
3,022
|
|
194,265
|
|
|||||||
|
Foreign currency translation adjustment, net of tax of $0
|
—
|
|
—
|
|
—
|
|
—
|
|
—
|
|
—
|
|
49,521
|
|
30
|
|
49,551
|
|
|||||||
|
Unrealized gain on derivatives, net of tax of $0
|
—
|
|
—
|
|
—
|
|
—
|
|
—
|
|
—
|
|
2,609
|
|
—
|
|
2,609
|
|
|||||||
|
Balance at March 31, 2019
|
107,783
|
|
$
|
431
|
|
116,857
|
|
$
|
467
|
|
$
|
3,705,787
|
|
$
|
(310,732
|
)
|
$
|
(1,060,565
|
)
|
$
|
(7,482
|
)
|
$
|
2,327,906
|
|
As described in Note
2
,
Significant Accounting Policies
, the change in beginning retained earnings resulting from the adoption of accounting standards represents the cumulative impact of adopting ASU 2016-02.
28
The components of net changes in stockholders' equity for the three months ended
March 31, 2018
were as follows:
|
Laureate Education, Inc. Stockholders
|
|||||||||||||||||||||||||
|
Class A
Common Stock
|
Class B
Common Stock
|
Additional paid-in capital
|
(Accumulated deficit) retained earnings
|
Accumulated other comprehensive (loss) income
|
Non-controlling interests
|
Total stockholders' equity
|
|||||||||||||||||||
|
Shares
|
Amount
|
Shares
|
Amount
|
||||||||||||||||||||||
|
Balance at December 31, 2017
|
55,052
|
|
$
|
220
|
|
132,443
|
|
$
|
530
|
|
$
|
3,446,206
|
|
$
|
(946,236
|
)
|
$
|
(925,556
|
)
|
$
|
12,118
|
|
$
|
1,587,282
|
|
|
Adoption of accounting standards
|
—
|
|
—
|
|
—
|
|
—
|
|
—
|
|
5,074
|
|
—
|
|
—
|
|
5,074
|
|
|||||||
|
Balance at January 1, 2018
|
55,052
|
|
220
|
|
132,443
|
|
530
|
|
3,446,206
|
|
(941,162
|
)
|
(925,556
|
)
|
12,118
|
|
1,592,356
|
|
|||||||
|
Non-cash stock compensation
|
—
|
|
—
|
|
—
|
|
—
|
|
(3,756
|
)
|
—
|
|
—
|
|
—
|
|
(3,756
|
)
|
|||||||
|
Conversion of Class B shares to Class A shares
|
59
|
|
—
|
|
(59
|
)
|
—
|
|
—
|
|
—
|
|
—
|
|
—
|
|
—
|
|
|||||||
|
Vesting of restricted stock, net of shares withheld to satisfy tax withholding
|
145
|
|
1
|
|
59
|
|
—
|
|
(804
|
)
|
—
|
|
—
|
|
—
|
|
(803
|
)
|
|||||||
|
Distributions from noncontrolling interest holders
|
—
|
|
—
|
|
—
|
|
—
|
|
—
|
|
—
|
|
—
|
|
581
|
|
581
|
|
|||||||
|
Change in noncontrolling interests
|
—
|
|
—
|
|
—
|
|
—
|
|
(468
|
)
|
—
|
|
—
|
|
(20,575
|
)
|
(21,043
|
)
|
|||||||
|
Accretion of redeemable noncontrolling interests and equity
|
—
|
|
—
|
|
—
|
|
—
|
|
(76
|
)
|
—
|
|
—
|
|
—
|
|
(76
|
)
|
|||||||
|
Accretion of Series A Convertible Redeemable Preferred Stock
|
—
|
|
—
|
|
—
|
|
—
|
|
(57,324
|
)
|
—
|
|
—
|
|
—
|
|
(57,324
|
)
|
|||||||
|
Reclassification of redeemable noncontrolling interests and equity
|
—
|
|
—
|
|
—
|
|
—
|
|
—
|
|
—
|
|
—
|
|
38
|
|
38
|
|
|||||||
|
Net income
|
—
|
|
—
|
|
—
|
|
—
|
|
—
|
|
168,879
|
|
—
|
|
2,666
|
|
171,545
|
|
|||||||
|
Foreign currency translation adjustment, net of tax of $0
|
—
|
|
—
|
|
—
|
|
—
|
|
—
|
|
—
|
|
83,648
|
|
(279
|
)
|
83,369
|
|
|||||||
|
Unrealized gain on derivatives, net of tax of $0
|
—
|
|
—
|
|
—
|
|
—
|
|
—
|
|
—
|
|
2,210
|
|
—
|
|
2,210
|
|
|||||||
|
Minimum pension liability adjustment, net of tax of $0
|
—
|
|
—
|
|
—
|
|
—
|
|
—
|
|
—
|
|
376
|
|
—
|
|
376
|
|
|||||||
|
Balance at March 31, 2018
|
55,256
|
|
$
|
221
|
|
132,443
|
|
$
|
530
|
|
$
|
3,383,778
|
|
$
|
(772,283
|
)
|
$
|
(839,322
|
)
|
$
|
(5,451
|
)
|
$
|
1,767,473
|
|
Accumulated Other Comprehensive Income (Loss)
Accumulated other comprehensive income (loss) (AOCI) in our Consolidated Balance Sheets includes the accumulated translation adjustments arising from translation of foreign subsidiaries' financial statements, the unrealized gains on derivatives designated as cash flow hedges, and the accumulated net gains or losses that are not recognized as components of net periodic benefit cost for our minimum pension liability. The components of these balances were as follows:
|
March 31, 2019
|
December 31, 2018
|
||||||||||||||||||
|
Laureate Education, Inc.
|
Noncontrolling Interests
|
Total
|
Laureate Education, Inc.
|
Noncontrolling Interests
|
Total
|
||||||||||||||
|
Foreign currency translation loss
|
$
|
(1,078,198
|
)
|
$
|
489
|
|
$
|
(1,077,709
|
)
|
$
|
(1,127,719
|
)
|
$
|
459
|
|
$
|
(1,127,260
|
)
|
|
|
Unrealized gain on derivatives
|
20,975
|
|
—
|
|
20,975
|
|
18,366
|
|
—
|
|
18,366
|
|
|||||||
|
Minimum pension liability adjustment
|
(3,342
|
)
|
—
|
|
(3,342
|
)
|
(3,342
|
)
|
—
|
|
(3,342
|
)
|
|||||||
|
Accumulated other comprehensive loss
|
$
|
(1,060,565
|
)
|
$
|
489
|
|
$
|
(1,060,076
|
)
|
$
|
(1,112,695
|
)
|
$
|
459
|
|
$
|
(1,112,236
|
)
|
|
Note
15
.
Derivative Instruments
In the normal course of business, our operations are exposed to fluctuations in foreign currency values and interest rate changes. We may seek to control a portion of these risks through a risk management program that includes the use of derivative instruments.
The interest and principal payments for Laureate’s senior long-term debt arrangements are to be paid primarily in USD. Our ability to make debt payments is subject to fluctuations in the value of the USD against foreign currencies, since a majority of our operating cash used to make these payments is generated by subsidiaries with functional currencies other than USD. As part of our overall
29
risk management policies, Laureate has at times entered into foreign currency swap contracts and floating-to-fixed interest rate swap contracts. In addition, we occasionally enter into foreign exchange forward contracts to reduce the impact of other non-functional currency-denominated receivables and payables. We do not enter into speculative or leveraged transactions, nor do we hold or issue derivatives for trading purposes.
Laureate reports all derivatives at fair value. These contracts are recognized as either assets or liabilities, depending upon the derivative’s fair value. Gains or losses associated with the change in the fair value of these swaps are recognized in our Consolidated Statements of Operations on a current basis over the term of the contracts, unless designated and effective as a hedge. For swaps that are designated and effective as cash flow hedges, gains or losses associated with the change in fair value of the swaps are recognized in our Consolidated Balance Sheets as a component of AOCI and amortized into earnings as a component of Interest expense over the term of the related hedged items. Upon early termination of an effective interest rate swap designated as a cash flow hedge, unrealized gains or losses are deferred in our Consolidated Balance Sheets as a component of AOCI and are amortized as an adjustment to Interest expense over the period during which the hedged forecasted transaction affects earnings. For derivatives that are both designated and effective as net investment hedges, gains or losses associated with the change in fair value of the derivatives are recognized on our Consolidated Balance Sheets as a component of AOCI.
The reported fair values of our derivatives, which are classified in Derivative instruments on our Consolidated Balance Sheets, were as follows:
|
March 31, 2019
|
December 31, 2018
|
||||||
|
Derivatives designated as hedging instruments:
|
|||||||
|
Long-term assets:
|
|||||||
|
Net investment cross currency swaps
|
6,197
|
|
3,259
|
|
|||
|
Derivatives not designated as hedging instruments:
|
|||||||
|
Current assets:
|
|||||||
|
Cross currency swaps
|
3,777
|
|
—
|
|
|||
|
Current liabilities:
|
|||||||
|
Cross currency swaps
|
1,223
|
|
4,021
|
|
|||
|
Long-term liabilities:
|
|||||||
|
Cross currency and interest rate swaps
|
—
|
|
6,656
|
|
|||
|
Total derivative instrument assets
|
$
|
9,974
|
|
$
|
3,259
|
|
|
|
Total derivative instrument liabilities
|
$
|
1,223
|
|
$
|
10,677
|
|
|
Derivatives Designated as Hedging Instruments
Cash Flow Hedge -
2024 Term Loan Interest Rate Swaps
In May 2017, Laureate entered into, and designated as cash flow hedges,
four
pay-fixed, receive-floating amortizing interest rate swaps with notional amounts of
$100,000
,
$100,000
,
$200,000
and
$300,000
, respectively. These notional amounts match the corresponding principal of the 2024 Term Loan borrowings of which these swaps are effectively hedging the interest payments. As such, the notional values amortize annually based on the terms of the agreements to match the principal borrowings as they are repaid. These swaps effectively fix the floating interest rate on the term loan to reduce exposure to variability in cash flows attributable to changes in the USD-LIBOR-BBA swap rate. All
four
swaps had an effective date of May 31, 2017 and would have matured on May 31, 2022; however, on August 21, 2018 Laureate fully settled these swaps. The cash received at settlement from the swap counterparties was
$14,117
. The decrease of
$1,172
from the derivative asset's recorded fair value at June 30, 2018 and the fair value at settlement was also deferred into AOCI and will be ratably reclassified into income through Interest expense over the remaining maturity period of the 2024 Term Loans. Prior to settlement of the swaps, they were determined to be
100%
effective; therefore, the amount of gain or loss recognized in income on the ineffective portion was
$0
. During the next 12 months, approximately
$4,600
is expected to be reclassified from AOCI into income. The unamortized balance at
March 31, 2019
was
$10,605
.
30
Net Investment Hedge - Cross Currency Swaps
In December 2017, Laureate entered into
two
EUR-USD cross currency swaps (net investment hedges) to hedge the foreign currency exchange volatility on operations of our Euro functional currency subsidiaries and better match our cash flows with the currencies in which our debt obligations are denominated. Both swaps have an effective date of December 22, 2017 and a maturity date of November 2, 2020, and were designated at inception as effective net investment hedges. In April 2019, the Company terminated both EUR-USD cross currency swaps for a net settlement received of
$7,679
, which will be included in our Consolidated Statement of Cash Flows for the six months ended June 30, 2019. The terms of the swaps specified that at maturity on the first swap, Laureate would deliver the notional amount of EUR
50,000
and receive USD
$59,210
at an implied exchange rate of
1.1842
and at maturity on the second swap, Laureate would deliver the notional amount of EUR
50,000
and receive USD
$59,360
at an implied exchange rate of
1.1872
. Semiannually until maturity, Laureate was obligated to pay
5.63%
and receive
8.25%
on EUR
50,000
and USD
$59,210
, respectively, on the first swap and pay
5.6675%
and receive
8.25%
on EUR
50,000
and USD
$59,360
, respectively, on the second swap. The swaps were determined to be
100%
effective; therefore, the amount of gain or loss recognized in income on the ineffective portion of derivative instruments designated as hedging instruments was
$0
. The accumulated gain recognized in AOCI will be deferred from earnings until the sale or liquidation of the hedged investee. As of
March 31, 2019
and
December 31, 2018
, these swaps had an estimated fair value of
$6,197
and
$3,259
, respectively, which was recorded in Derivative Instruments as a long-term asset.
The table below shows the total recorded unrealized (loss) gain in Comprehensive income for the derivatives designated as hedging instruments. The impact of these derivative instruments on Comprehensive income, Interest expense and AOCI for the
three months ended March 31, 2019
, and 2018 were as follows:
|
(Loss) Gain Recognized in Comprehensive Income
(Effective Portion) |
Income Statement Location
|
Gain (Loss) Reclassified
from AOCI to Income (Effective Portion) |
Total Consolidated Interest Expense
|
||||||||||||||||||||
|
2019
|
2018
|
2019
|
2018
|
2019
|
2018
|
||||||||||||||||||
|
Cash flow hedge
|
|||||||||||||||||||||||
|
Interest rate swaps
|
$
|
(1,212
|
)
|
$
|
6,688
|
|
Interest expense
|
$
|
1,212
|
|
$
|
(297
|
)
|
||||||||||
|
Net investment hedge
|
|||||||||||||||||||||||
|
Cross currency swaps
|
3,821
|
|
(4,478
|
)
|
N/A
|
—
|
|
—
|
|
||||||||||||||
|
Total
|
$
|
2,609
|
|
$
|
2,210
|
|
$
|
1,212
|
|
$
|
(297
|
)
|
$
|
(54,655
|
)
|
$
|
(63,335
|
)
|
|||||
Derivatives Not Designated as Hedging Instruments
Derivatives related to Series A Preferred Stock Offering
In December 2016 and January 2017, the Company issued shares of convertible redeemable preferred stock (the Series A Preferred Stock) and identified several embedded derivatives related to certain contingent redemption features of the Series A Preferred Stock. These derivatives were not designated as hedges for accounting purposes thus the changes in estimated fair value were recognized as a component of earnings. The Series A Preferred Stock was converted into Class A common stock on April 23, 2018. The estimated fair value of these derivatives at the conversion date was approximately
$140,300
; accordingly, the derivative assets were recorded at their estimated fair values through a corresponding gain on derivatives, a component of non-operating income. The increase in the fair value of the derivatives can be attributed to the use of the Monte Carlo Simulation Method to value the derivatives prior to the April 23, 2018 conversion date, when the probability of conversion increased to
100%
and the valuation inputs became definitive. In connection with the conversion of the Series A Preferred Stock into Class A common stock, the carrying value of the derivative assets was reclassified into equity in April 2018.
31
EUR to USD Foreign Currency Swaps - Spain and Portugal
As disclosed in the 2018 Form 10-K, in December 2018, Laureate entered into
two
EUR to USD swap agreements in connection with the signing of the sale agreement for the subsidiaries in Spain and Portugal. The purpose of the swaps is to mitigate the risk of foreign currency exposure on the sale proceeds. T
he first swap is deal contingent, with the settlement date occurring on the second business day following the completion of the sale. On the settlement date, Laureate will deliver the notional amount of EUR
275,000
and will receive an amount in USD equal to the notional amount multiplied by the contract rate of exchange at the settlement date. The contract rate of exchange has a possible range of
1.13355
-
1.1439
USD/1 EUR and the swap matures on May 15, 2019 but has certain provisions to allow for settlement beyond that date. As of
March 31, 2019
, this swap had an estimated fair value of
$3,777
, which was recorded as a current asset through a credit to unrealized gain on derivatives. The second swap was a put/call option with a maturity date of April 8, 2019, where Laureate could put the notional amount of EUR
275,000
and call the USD amount of
$310,750
at an exchange rate of
1.13
. Based on expected timing of the sale transaction, the swap was terminated on April 2, 2019, resulting in a payment to the counterparty of
$980
that included a deferred premium payment net of proceeds received. This payment will be included in our Consolidated Statement of Cash Flows for the six months ended June 30, 2019. As of
March 31, 2019
, this swap had an estimated fair value of
$1,223
, which was recorded as a current liability through a charge to unrealized loss on derivatives. As of December 31, 2018, these swaps had an aggregate estimated fair value of
$4,021
, which was recorded in Derivative instruments as a current liability through a charge to unrealized loss on derivatives. Neither of the swaps was designated as a hedge for accounting purposes.
To continue to mitigate the risk of foreign currency exposure on the expected sale proceeds for Spain and Portugal, in April 2019, Laureate entered into
seven
EUR to USD swap agreements with a combined notional amount of EUR
375,000
. On the maturity date of May 15, 2019, Laureate will pay the EUR notional amount and will receive a combined total of USD
$423,003
at a rate of exchange of
1.128007
. These swaps were not designated as hedges for accounting purposes.
EUR to USD Foreign Currency Swaps - Cyprus and Italy
As disclosed in the
2018
Form 10-K, in December
2017
, the Company entered into a total of
six
EUR to USD forward exchange swap agreements in connection with the sale of its institutions in Cyprus and Italy. The purpose of the swaps was to mitigate the risk of foreign currency exposure on the sale proceeds. The swaps had an aggregate notional amount of EUR
200,000
and matured on January 16, 2018, resulting in a total realized loss on derivatives of
$9,960
. The swaps were not designated as hedges for accounting purposes.
CLP to Unidad de Fomento (UF) Cross Currency and Interest Rate Swaps
The cross currency and interest rate swap agreements are intended to provide a better correlation between our debt obligations and operating currencies. In 2010, one of our subsidiaries in Chile entered into
four
cross currency and interest rate swap agreements with an aggregate notional amount of approximately
$31,000
, and convert CLP-denominated, floating-rate debt to fixed-rate UF-denominated debt. The UF is a Chilean inflation-adjusted unit of account.
One
of the swaps was scheduled to mature on December 1, 2024, and the remaining
three
were scheduled to mature on July 1, 2025 (the CLP to UF cross currency and interest rate swaps); however, during the first quarter 2019, the Company elected to settle all
four
swaps for a net cash payment of approximately USD
$8,200
. In addition, Chile also elected to repay a portion of the principal balance outstanding for certain notes payable, as discussed in Note
9
,
Debt
. This payment is included in
Payments for settlement of derivative contracts
on the Consolidated Statement of Cash Flows. The CLP to UF cross currency and interest rate swaps were not designated as hedges for accounting purposes. As of
December 31, 2018
, these swaps had an estimated fair value of
$6,656
which was recorded in
Derivative instruments
as a long-term liability.
32
Components of the reported Gain (loss) on derivatives not designated as hedging instruments in the Consolidated Statements of Operations were as follows:
|
For the three months ended March 31,
|
2019
|
2018
|
|||||
|
Unrealized Gain (Loss)
|
|||||||
|
Contingent redemption features - Series A Preferred Stock
|
$
|
—
|
|
$
|
(13,533
|
)
|
|
|
Cross currency and interest rate swaps
|
6,576
|
|
4,305
|
|
|||
|
Interest rate swaps
|
—
|
|
56
|
|
|||
|
6,576
|
|
(9,172
|
)
|
||||
|
Realized Loss
|
|||||||
|
Cross currency and interest rate swaps
|
(1,393
|
)
|
(10,168
|
)
|
|||
|
(1,393
|
)
|
(10,168
|
)
|
||||
|
Total Gain (Loss)
|
|||||||
|
Contingent redemption features - Series A Preferred Stock
|
—
|
|
(13,533
|
)
|
|||
|
Cross currency and interest rate swaps
|
5,183
|
|
(5,863
|
)
|
|||
|
Interest rate swaps
|
—
|
|
56
|
|
|||
|
Gain (loss) on derivatives, net
|
$
|
5,183
|
|
$
|
(19,340
|
)
|
|
Credit Risk and Credit-Risk-Related Contingent Features
Laureate’s derivatives expose us to credit risk to the extent that the counterparty may possibly fail to perform its contractual obligation. The amount of our credit risk exposure is equal to the fair value of the derivative when any of the derivatives are in a net gain position. As of
March 31, 2019
and
December 31, 2018
, the estimated fair values of derivatives in a gain position were
$9,974
and
$3,259
, respectively.
Laureate has limited its credit risk by only entering into derivative transactions with highly rated major financial institutions. We have not entered into collateral agreements with our derivatives' counterparties. At
March 31, 2019
,
one
institution was rated A1 and
one
institution was rated A2 by the global rating agency of Moody's Investors Service. These financial institutions accounted for all of Laureate's derivative credit risk exposure.
Laureate's agreements with its derivative counterparties contain a provision under which we could be declared in default on our derivative obligations if repayment of the underlying indebtedness is accelerated by the lender due to a default on the indebtedness. As of
March 31, 2019
and
December 31, 2018
, we had not breached any default provisions and had not posted any collateral related to these agreements. If we had breached any of these provisions, we could have been required to settle the obligations under the derivative agreements for an amount that we believe would approximate their estimated fair value of
$1,223
as of
March 31, 2019
and
$10,677
as of
December 31, 2018
.
Note
16
.
Income Taxes
Laureate uses the liability method to account for income taxes. Deferred income taxes reflect the net tax effects of temporary differences between the carrying amount of assets and liabilities for financial reporting purposes and the amounts used for income tax purposes. For interim purposes, we also apply ASC 740-270, "Income Taxes - Interim Reporting."
Laureate's income tax provisions for all periods consist of federal, state and foreign income taxes. The tax provisions for the
three months ended March 31, 2019
and
2018
were based on estimated full-year effective tax rates, after giving effect to significant items related specifically to the interim periods, including the mix of income for the period between higher-taxed and lower-taxed jurisdictions. Laureate has operations in multiple countries at various statutory tax rates or which are tax-exempt entities, and other operations that are loss-making entities for which it is not more likely than not that a tax benefit will be realized on the loss.
Laureate records interest and penalties related to uncertain tax positions as a component of Income tax expense. During the
three months ended March 31, 2019
, Laureate recognized interest and penalties related to income taxes of
$1,040
. Laureate had
$26,150
of accrued interest and penalties as of
March 31, 2019
. During the
three months ended March 31, 2019
, Laureate derecognized
$3,740
of previously accrued interest and penalties. Approximately
$23,820
of unrecognized tax benefits, if recognized, will affect the effective income tax rate. It is reasonably possible that Laureate’s unrecognized tax benefits may decrease within the next 12
33
months by up to approximately
$12,580
as a result of the lapse of statutes of limitations and as a result of the final settlement and resolution of outstanding tax matters in various jurisdictions.
Note
17
.
Earnings (Loss) Per Share
We have two classes of common stock, Class A common stock and Class B common stock. Other than voting rights, the Class B common stock has the same rights as the Class A common stock and therefore both are treated as the same class of stock for purposes of the earnings per share calculation. Laureate computes basic earnings per share (EPS) by dividing income available to common shareholders by the weighted average number of common shares outstanding for the reporting period. Diluted EPS reflects the potential dilution that would occur if share-based compensation awards, contingently issuable shares, or convertible securities were exercised or converted into common stock. To calculate the diluted EPS, the basic weighted average number of shares is increased by the dilutive effect of stock options, restricted stock, restricted stock units, and contingently issuable shares determined using the treasury stock method, and convertible securities using the if-converted method.
The following table summarize the computations of basic and diluted earnings per share:
|
For the three months ended March 31,
|
2019
|
2018
|
|||||
|
Numerator used in basic and diluted earnings (loss) per common share for continuing operations:
|
|||||||
|
Loss from continuing operations
|
$
|
(110,314
|
)
|
$
|
(165,635
|
)
|
|
|
Net income attributable to noncontrolling interests
|
(2,731
|
)
|
(1,692
|
)
|
|||
|
Loss from continuing operations attributable to Laureate Education, Inc.
|
(113,045
|
)
|
(167,327
|
)
|
|||
|
Accretion of redemption value of redeemable noncontrolling interests and equity
|
263
|
|
(76
|
)
|
|||
|
Adjusted for: accretion related to noncontrolling interests and equity redeemable at fair value
|
—
|
|
(3
|
)
|
|||
|
Accretion of Series A Preferred Stock
|
—
|
|
(57,324
|
)
|
|||
|
Subtotal: accretion of other redeemable noncontrolling interests and equity and Series A Preferred Stock, net
|
263
|
|
(57,403
|
)
|
|||
|
Net loss available to common stockholders for basic and diluted earnings per share
|
$
|
(112,782
|
)
|
$
|
(224,730
|
)
|
|
|
Numerator used in basic and diluted earnings per common share for discontinued operations:
|
|||||||
|
Income from discontinued operations, net of tax
|
$
|
56,574
|
|
$
|
18,853
|
|
|
|
Gain on sale of discontinued operations, net of tax
|
248,005
|
|
318,327
|
|
|||
|
Income attributable to noncontrolling interests
|
(291
|
)
|
(974
|
)
|
|||
|
Net income from discontinued operations for basic and diluted earnings per share
|
$
|
304,288
|
|
$
|
336,206
|
|
|
|
Denominator used in basic and diluted earnings (loss) per common share:
|
|||||||
|
Basic and diluted weighted average shares outstanding
|
224,655
|
|
187,765
|
|
|||
|
Basic and diluted earnings (loss) per share:
|
|||||||
|
Loss from continuing operations
|
$
|
(0.50
|
)
|
$
|
(1.20
|
)
|
|
|
Income from discontinued operations
|
1.35
|
|
1.79
|
|
|||
|
Basic and diluted earnings per share
|
$
|
0.85
|
|
$
|
0.59
|
|
|
34
For the three months ended March 31, 2018, the shares of Class A common stock that were issuable upon conversion of the Series A Preferred Stock, which occurred on April 23, 2018, were not included in the calculation of diluted EPS as the effect would have been antidilutive.
The following table summarizes the number of stock options, shares of restricted stock and restricted stock units (RSUs) that were excluded from the diluted EPS calculations because the effect would have been antidilutive:
|
For the three months ended March 31,
|
2019
|
2018
|
|||
|
Stock options
|
8,970
|
|
9,840
|
|
|
|
Restricted stock and RSUs
|
983
|
|
1,003
|
|
|
Note
18
.
Legal and Regulatory Matters
Laureate is subject to legal proceedings arising in the ordinary course of business. In management's opinion, we have adequate legal defenses, insurance coverage, and/or accrued liabilities with respect to the eventuality of these actions. Management believes that any settlement would not have a material impact on Laureate's financial position, results of operations, or cash flows. In addition, our institutions are subject to uncertain and varying laws and regulations, and any changes to these laws or regulations or their application to us may materially adversely affect our business, financial condition and results of operations. There have been no material changes to the laws and regulations affecting our higher education institutions that are described in our 2018 Form 10-K.
Note
19
.
Fair Value Measurement
Fair value is defined as the price that would be received to sell an asset or paid to settle a liability in an orderly transaction between market participants at the measurement date. Accounting standards utilize a fair value hierarchy that prioritizes the inputs to valuation techniques used to measure fair value into three levels, which are described below:
|
•
|
Level 1 – Quoted prices (unadjusted) for identical assets or liabilities in active markets;
|
|
•
|
Level 2 – Observable inputs other than quoted prices that are either directly or indirectly observable for the asset or liability;
|
|
•
|
Level 3 – Unobservable inputs that are supported by little or no market activity.
|
These levels are not necessarily an indication of the risk of liquidity associated with the financial assets or liabilities disclosed. Assets and liabilities are classified in their entirety based on the lowest level of input that is significant to the fair value measurement, as required under ASC 820-10, "Fair Value Measurement."
Derivative instruments
Laureate uses derivative instruments as economic hedges for bank debt, foreign exchange fluctuations and interest rate risk. Their values are derived using valuation models commonly used for derivatives. These valuation models require a variety of inputs, including contractual terms, market prices, forward-price yield curves, notional quantities, measures of volatility and correlations of such inputs. Our valuation models also reflect measurements for credit risk. Laureate concluded that the fair values of our derivatives are based on unobservable inputs, or Level 3 assumptions. The significant unobservable input used in the fair value measurement of the Company's derivative instruments is our own credit risk. Holding other inputs constant, a significant increase (decrease) in our own credit risk would result in a significantly lower (higher) fair value measurement for the Company's derivative instruments.
Laureate’s financial assets and liabilities that are measured at fair value on a recurring basis as of
March 31, 2019
were as follows:
|
Total
|
Level 1
|
Level 2
|
Level 3
|
||||||||||||
|
Assets
|
|||||||||||||||
|
Derivative instruments
|
$
|
9,974
|
|
$
|
—
|
|
$
|
—
|
|
$
|
9,974
|
|
|||
|
Liabilities
|
|||||||||||||||
|
Derivative instruments
|
$
|
1,223
|
|
$
|
—
|
|
$
|
—
|
|
$
|
1,223
|
|
|||
35
Laureate’s financial assets and liabilities that are measured at fair value on a recurring basis as of
December 31, 2018
were as follows:
|
Total
|
Level 1
|
Level 2
|
Level 3
|
||||||||||||
|
Assets
|
|||||||||||||||
|
Derivative instruments
|
$
|
3,259
|
|
$
|
—
|
|
$
|
—
|
|
$
|
3,259
|
|
|||
|
Liabilities
|
|||||||||||||||
|
Derivative instruments
|
$
|
10,677
|
|
$
|
—
|
|
$
|
—
|
|
$
|
10,677
|
|
|||
The changes in our Level 3 Derivative instruments measured at fair value on a recurring basis for the
three months ended March 31, 2019
were as follows:
|
Balance at December 31, 2018
|
$
|
(7,418
|
)
|
|
Gain (Loss) included in earnings:
|
|||
|
Unrealized gains, net
|
6,576
|
|
|
|
Realized losses, net
|
(1,393
|
)
|
|
|
Included in other comprehensive income
|
2,609
|
|
|
|
Settlements
|
8,233
|
|
|
|
Currency translation adjustment and other
|
144
|
|
|
|
Balance at March 31, 2019
|
$
|
8,751
|
|
The following table presents quantitative information regarding the significant unobservable inputs utilized in the fair value measurements of the Company's assets/(liabilities) classified as Level 3 as of
March 31, 2019
:
|
Fair Value at March 31, 2019
|
Valuation Technique
|
Unobservable Input
|
Range/Input Value
|
|||||
|
Derivative instruments - cross currency swaps
|
$
|
8,751
|
|
Discounted Cash Flow
|
Credit Risk
|
3.56
|
%
|
|
Note
20
.
Supplemental Cash Flow Information
Reconciliation of Cash and cash equivalents and Restricted cash
The following table provides a reconciliation of cash, cash equivalents and restricted cash reported within the Consolidated Balance Sheets, as well as the
March 31, 2018
balance. The
March 31, 2019
and
March 31, 2018
balances sum to the amounts shown in the Consolidated Statements of Cash Flows for the
three months ended March 31, 2019
and
2018
:
|
|
March 31, 2019
|
March 31, 2018
|
December 31, 2018
|
|||||||
|
Cash and cash equivalents
|
$
|
278,782
|
|
$
|
305,890
|
|
$
|
388,490
|
|
|
|
Restricted cash
|
203,633
|
|
175,557
|
|
201,300
|
|
||||
|
Total Cash and cash equivalents and Restricted cash shown in the Consolidated Statements of Cash Flows
|
$
|
482,415
|
|
$
|
481,447
|
|
$
|
589,790
|
|
|
Restricted cash includes cash equivalents held to collateralize standby letters of credit in favor of the DOE. In addition, Laureate may at times hold a United States deposit for a letter of credit in lieu of a surety bond, or otherwise have cash that is not immediately available for use in current operations. See also Note
11
,
Commitments and Contingencies
.
Note
21
.
Subsequent Events
Sale of Monash South Africa
On
April 8, 2019
, the Company completed the sale of its institution in South Africa, Monash South Africa, as well as the sale of
the real estate associated with that institution. The transactions consisted of: (i) the transfer by Monash South Africa Limited (MSA), an Australia limited company that is an indirect
75%
-owned subsidiary of the Company, to The Independent Institute of Education Limited (IIE), a South Africa limited company that is a subsidiary of ADvTECH Limited, of all of MSA’s assets and certain of its operational liabilities for a sale price of
15,000
South African Rand (ZAR) (subject to customary adjustments) (or
36
approximately
$1,100
at the closing date) and (ii) the sale by LEI AMEA Investments B.V., a Netherlands limited company that is an indirect wholly owned subsidiary of the Company, of all of the shares of Laureate South Africa Pty. Ltd. (LSA), a South Africa limited company, to IIE for a net sale price of approximately ZAR
99,000
(subject to customary adjustments) (or approximately
$7,000
at the closing date). In addition, IIE assumed debt of approximately
$20,200
. In the aggregate, the Company received approximately
$7,400
from the buyer, which it plans to use to reduce indebtedness.
Agreement to Sell Institution in Brazil
On
April 16, 2019
, Rede Internacional de Universidades Laureate Ltda., a limited business company organized under the laws of Brazil (the UniNorte Seller), which is an indirect wholly owned subsidiary of the Company, entered into a Quota Assignment and Transfer Agreement (the UniNorte Agreement) with Cenesup - Centro Nacional de Ensino Superior Ltda., a limited liability company organized under the laws of Brazil (the UniNorte Purchaser), which is an indirect wholly owned subsidiary of Ser Educacional S.A., a company organized under the laws of Brazil (Ser). Pursuant to the UniNorte Agreement, the UniNorte Purchaser will purchase from the UniNorte Seller
100%
of the quota capital of Sodecam - Sociedade de Desenvolvimento Cultural do Amazonas Ltda., a limited liability company organized under the laws of Brazil, which is the maintaining entity of Centro Universitário do Norte, a higher education institution located in the city of Manaus, Brazil (UniNorte). The Company and Ser are also parties to the Agreement as guarantors of certain obligations of their respective subsidiaries.
The transaction enterprise value under the UniNorte Agreement is
194,800
Brazilian Reais (BRL) (or approximately
$49,900
at the rate of exchange on the date of signing), which includes the assumption of net debt in the amount of approximately BRL
9,800
(or approximately
$2,500
at the rate of exchange on the date of signing), subject to customary closing adjustments, and the parties expect that the transaction will
close during the second half of 2019
, subject to customary closing conditions, including approval by the Brazilian competition authorities.
37
Item 2. Management’s Discussion and Analysis of Financial Condition and Results of Operations
Forward-Looking Statements
This Quarterly Report on Form 10-Q (this Form 10-Q) contains ‘‘forward-looking statements’’ within the meaning of the federal securities laws, which involve risks and uncertainties. You can identify forward-looking statements because they contain words such as "believes," "expects," "may," "will," "should," "seeks," "approximately," "intends," "plans," "estimates" or "anticipates" or similar expressions that concern our strategy, plans or intentions. All statements we make relating to estimated and projected earnings, costs, expenditures, cash flows, growth rates and financial results, and all statements we make relating to our planned divestitures, the expected proceeds generated therefrom and the expected reduction in revenue resulting therefrom, are forward-looking statements. In addition, we, through our senior management, from time to time make forward-looking public statements concerning our expected future operations and performance and other developments. All of these forward-looking statements are subject to risks and uncertainties that may change at any time, and, therefore, our actual results may differ materially from those we expected. We derive most of our forward-looking statements from our operating budgets and forecasts, which are based upon many detailed assumptions. While we believe that our assumptions are reasonable, we caution that it is very difficult to predict the impact of known factors, and, of course, it is impossible for us to anticipate all factors that could affect our actual results. Important factors that could cause actual results to differ materially from our expectations, including, without limitation, in conjunction with the forward-looking statements included in this Form 10-Q, are disclosed in ‘‘Item 1—Business,’’ and ‘‘Item 1A—Risk Factors’’ of our Annual Report on Form 10-K for the fiscal year ended December 31, 2018 (the 2018 Form 10-K). Some of the factors that we believe could affect our results include:
|
•
|
the risks associated with conducting our global operations, including complex business, foreign currency, political, legal, regulatory, tax and economic risks;
|
|
•
|
our ability to effectively manage the growth of our business, implement a common operating model and platform, and increase our operating leverage;
|
|
•
|
the development and expansion of our global education network and programs and the effect of new technology applications in the educational services industry;
|
|
•
|
our ability to successfully complete planned divestitures and make strategic acquisitions, and to successfully integrate and operate acquired businesses;
|
|
•
|
the effect of existing international and U.S. laws and regulations governing our business or changes to those laws and regulations or in their application to our business;
|
|
•
|
changes in the political, economic and business climate in the international or the U.S. markets where we operate;
|
|
•
|
risks of downturns in general economic conditions and in the educational services and education technology industries, that could, among other things, impair our goodwill and intangible assets;
|
|
•
|
possible increased competition from other educational service providers;
|
|
•
|
market acceptance of new service offerings by us or our competitors and our ability to predict and respond to changes in the markets for our educational services;
|
|
•
|
the effect on our business and results of operations from fluctuations in the value of foreign currencies;
|
|
•
|
our ability to attract and retain key personnel;
|
|
•
|
the fluctuations in revenues due to seasonality;
|
|
•
|
our ability to maintain proper and effective internal controls necessary to produce accurate financial statements on a timely basis;
|
|
•
|
our focus on a specific public benefit purpose and producing a positive effect for society may negatively influence our financial performance;
|
|
•
|
the future trading prices of our Class A common stock and the impact of any securities analysts’ reports on these prices; and
|
|
•
|
our ability to maintain and, subsequently, increase tuition rates and student enrollments in our institutions.
|
We caution you that the foregoing list of important factors may not contain all of the material factors that are important to you. In addition, in light of these risks and uncertainties, the matters referred to in the forward-looking statements contained in this Form 10-Q may not in fact occur. We undertake no obligation to publicly update or revise any forward-looking statement as a result of new information, future events or otherwise, except as otherwise required by law.
38
Introduction
This Management’s Discussion and Analysis of Financial Condition and Results of Operations (the MD&A) is provided to assist readers of the financial statements in understanding the results of operations, financial condition and cash flows of Laureate Education, Inc. This MD&A should be read in conjunction with the consolidated financial statements and related notes included elsewhere in this Quarterly Report on Form 10-Q. The consolidated financial statements included elsewhere in this Form 10-Q are presented in U.S. dollars (USD) rounded to the nearest thousand, with the amounts in MD&A rounded to the nearest tenth of a million. Therefore, discrepancies in the tables between totals and the sums of the amounts listed may occur due to such rounding. Our MD&A is presented in the following sections:
|
•
|
Overview;
|
|
•
|
Results of Operations;
|
|
•
|
Liquidity and Capital Resources;
|
|
•
|
Critical Accounting Policies and Estimates; and
|
|
•
|
Recently Issued Accounting Standards.
|
Overview
Our Business
We are the largest international network of degree-granting higher education institutions, primarily focused in Latin America, with
921,500
students enrolled at our
38
institutions in
10
countries on more than 150 campuses included in our continuing operations as of
March 31, 2019
, which we collectively refer to as the
Laureate International Universities
network. We believe the global higher education market presents an attractive long-term opportunity, primarily because of the large and growing imbalance between the supply and demand for quality higher education around the world. Advanced education opportunities drive higher earnings potential, and we believe the projected growth in the middle-class population worldwide and limited government resources dedicated to higher education create substantial opportunities for high-quality private institutions to meet this growing and unmet demand. Our outcomes-driven strategy is focused on enabling students to prosper and thrive in the dynamic and evolving knowledge economy.
As of
March 31, 2019
, our international network of
38
institutions comprised
29
institutions we owned or controlled, and an addition
al
nine
institutions that we managed or with which we had other relationships. We have six operating segments as described below.
We group our institutions by geography in: 1
) Brazil; 2) Mexico; 3) Andean; 4) Central America & U.S. Campuses; and 5) Rest of World for reporting purposes.
Our sixth segment, Online & Partnerships, includes fully online institutions that operate globally.
Discontinued Operations
In 2017, the Company announced the divestiture of certain subsidiaries in our Rest of World and Central America & U.S. Campuses segments. On August 9, 2018, the Company announced the divestiture of additional subsidiaries located in Europe, Asia and Central America. After completing all of the announced divestitures, the Company’s remaining principal markets will be Brazil, Chile, Mexico and Peru, along with the Online and Partnerships segment and the institutions in Australia and New Zealand. The markets being divested (the Discontinued Operations) include the institutions in Portugal and Spain, which are part of the Andean segment, all remaining institutions in the Central America & U.S. Campuses segment, and all remaining institutions in the Rest of World segment except for Australia, New Zealand and the managed institutions in the Kingdom of Saudi Arabia and China.
The institutions in the Kingdom of Saudi Arabia
are managed under a contract that expires in August 2019
. The divestitures represent a strategic shift that will have a major effect on the Company's operations and financial results.
Accordingly, in accordance with Accounting Standard Codification (ASC) 205-20, ‘‘Discontinued Operations,’’ the results of the divestitures that are part of the strategic shift are presented as discontinued operations in our consolidated financial statements included elsewhere in our Quarterly Report on Form 10-Q for all periods. Since our entire Central America & U.S. Campuses operating segment is included in Discontinued Operations, it no longer meets the criteria for a reportable segment under ASC 280, "Segment Reporting," and, therefore, it is excluded from the segments information for all periods presented. In addition, the portions of the Andean and Rest of World reportable segments that are included in Discontinued Operations have also been excluded from the segment information for all periods presented. Unless indicated otherwise, the information in the MD&A relates to continuing operations.
The Company has entered into sale agreements for a number of these entities and closing of sale transactions began in the first quarter of 2018. To date, we have completed the sales of subsidiaries in Cyprus, Italy, China, Germany, Morocco, Thailand and
39
South Africa, as well as Kendall College, LLC (Kendall), and the University of St. Augustine for Health Sciences, LLC (St. Augustine) in the United States. We have not yet completed the divestitures of our subsidiaries in Central America, Spain, Portugal, Turkey, India and Malaysia, as well as one small campus-based institution in the United States and UniNorte, an institution in the Brazil segment that is included in continuing operations as it is not part of the strategic shift. We have signed sale agreements for our subsidiaries in Spain, Portugal and Malaysia, as well as the Brazilian institution UniNorte, that are pending closure.
Our Segments
Our campus-based segments generate revenues by providing an education that emphasizes professional-oriented fields of study with undergraduate and graduate degrees in a wide range of disciplines. Our educational offerings are increasingly utilizing online and hybrid (a combination of online and in-classroom) courses and programs to deliver their curriculum. Many of our largest campus-based operations are in developing markets which are experiencing a growing demand for higher education based on favorable demographics and increasing secondary completion rates, driving increases in participation rates and resulting in continued growth in the number of higher education students. Traditional higher education students (defined as 18-24 year olds) have historically been served by public universities, which have limited capacity and are often underfunded, resulting in an inability to meet the growing student demand and employer requirements. This supply and demand imbalance has created a market opportunity for private sector participants. Most students finance their own education. However, there are some government-sponsored student financing programs which are discussed below. The campus-based segments include Brazil, Mexico, Andean, Central America & U.S. Campuses and Rest of World. Specifics related to each of these campus-based segments and our Online & Partnerships segment are discussed below
:
|
•
|
In Brazil, approximately 75% of post-secondary students are enrolled in private higher education institutions. While the federal government defines the national curricular guidelines, institutions are licensed to operate by city. Laureate owns 13 institutions in eight states throughout Brazil, with a particularly strong presence in the competitive São Paulo market. Many students finance their own education while others rely on the government-sponsored programs such as Prouni and FIES.
As described in Note
21
,
Subsequent Events
, of our consolidated financial statements included elsewhere in this Form 10-Q, on
April 16, 2019
, the Company entered into an agreement to divest UniNorte,
a traditional higher education institution in Manaus, Brazil.
|
|
•
|
Public universities in Mexico enroll approximately two thirds of students attending post-secondary education. However, many public institutions are faced with capacity constraints or the quality of the education is considered low. Laureate owns two institutions and is present throughout the country with a footprint of over 40 campuses. Each institution in Mexico has a national license. Students in our Mexican institutions typically finance their own education.
|
|
•
|
The Andean segment includes institutions in Chile, Peru, Portugal and Spain. In Chile, private universities enroll approximately 80% of post-secondary students. In Peru, the public sector plays a significant role, but private universities are increasingly providing the capacity to meet growing demand. In Spain and Portugal, the high demand for post-secondary education places capacity constraints on the public sector, pushing students to turn to the private sector for high-quality education. Chile has government-sponsored student financing programs, while in the other countries students generally finance their own education. The institutions in Portugal and Spain are included in Discontinued Operations.
|
|
•
|
The Central America & U.S. Campuses segment includes institutions in Costa Rica, Honduras, Panama and the United States. Students in Central America typically finance their own education while students in the United States finance their education in a variety of ways, including U.S. Department of Education (DOE) Title IV programs. The entire Central America & U.S. Campuses segment is included in Discontinued Operations.
|
|
•
|
The Rest of World segment includes an institution in the European country of Turkey, as well as institutions in the Middle East, Africa and Asia Pacific consisting of campus-based institutions with operations in Australia, India, Malaysia, New Zealand and South Africa. Additionally, the Rest of World segment manages
eight
licensed institutions in the Kingdom of Saudi Arabia and manages
one
additional institution in China through a joint venture arrangement.
The institutions in the Rest of World segment are included in Discontinued Operations, except for Australia, New Zealand and the managed institutions in the Kingdom of Saudi Arabia and China.
The institutions in the Kingdom of Saudi Arabia
are managed under a contract that expires in August 2019
. Also, as described in Note
21
,
Subsequent Events
, of our consolidated financial statements included elsewhere in this Form 10-Q, on
April 8, 2019
, the Company completed the sale of its institution in South Africa.
|
|
•
|
The Online & Partnerships segment includes fully online institutions that offer professionally oriented degree programs in the United States through Walden University (Walden), a U.S.-based accredited institution, and through the University of Liverpool and the University of Roehampton in the United Kingdom. These online institutions primarily serve working adults with undergraduate and graduate degree program offerings. Students in the United States finance their education in a variety
|
40
of ways, including Title IV programs.
We no longer accept new enrollments at the University of Liverpool and the University of Roehampton
Corporate is a non-operating business unit whose purpose is to support operations. Its departments are responsible for establishing operational policies and internal control standards, implementing strategic initiatives, and monitoring compliance with policies and controls throughout our operations. Our Corporate segment is an internal source of capital and provides financial, human resource, information technology, insurance, legal and tax compliance services. The Corporate segment also contains the eliminations of intersegment revenues and expenses.
The following information for our reportable segments in continuing operations is presented as of
March 31, 2019
:
|
Countries
|
Institutions
|
Enrollment
|
2019 YTD Revenues ($ in millions)
(1)
|
% Contribution to 2019 YTD Revenues
|
|||||||
|
Brazil
|
1
|
|
13
|
|
298,300
|
|
$
|
110.0
|
|
18
|
%
|
|
Mexico
|
1
|
|
2
|
|
195,800
|
|
156.5
|
|
25
|
%
|
|
|
Andean
|
2
|
|
8
|
|
345,900
|
|
138.9
|
|
22
|
%
|
|
|
Rest of World
(2)
|
4
|
|
12
|
|
20,800
|
|
54.2
|
|
9
|
%
|
|
|
Online & Partnerships
(3)
|
2
|
|
3
|
|
60,700
|
|
161.8
|
|
26
|
%
|
|
|
Total
(1)
|
10
|
|
38
|
|
921,500
|
|
$
|
621.8
|
|
100
|
%
|
(1)
The amounts related to Corporate, net of elimination of intersegment revenues, which total
$0.5 million
, are not separately presented.
(2)
Includes
eight
licensed institutions in the Kingdom of Saudi Arabia that
are managed under a contract that expires in August 2019
.
(3)
We no longer accept new enrollments at the University of Liverpool and the University of Roehampton
.
Challenges
Our international operations are subject to complex business, economic, legal, regulatory, political, tax and foreign currency risks, which may be difficult to adequately address. The majority of our operations are outside the United States. As a result, we face risks that are inherent in international operations, including: fluctuations in exchange rates, possible currency devaluations, inflation and hyper-inflation; price controls and foreign currency exchange restrictions; potential economic and political instability in the countries in which we operate; expropriation of assets by local governments; key political elections and changes in government policies; multiple and possibly overlapping and conflicting tax laws; and compliance with a wide variety of foreign laws. There are also risks associated with our decision to divest certain operations. See ‘‘Risk Factors—Risks Relating to Our Continuing Business—Our divestiture activities and the ongoing strategic shift in our business may disrupt our ongoing business, involve increased expenses and present risks not contemplated at the time of the transactions,” in our 2018 Form 10-K. We plan to grow our continuing operations organically by: 1) adding new programs and course offerings; 2) expanding target student demographics; and 3) increasing capacity at existing and new campus locations. Our success in growing our business will depend on the ability to anticipate and effectively manage these and other risks related to operating in various countries.
Regulatory Environment and Other Matters
Our business is subject to regulation by various agencies based on the requirements of local jurisdictions. These agencies continue to review and update regulations as they deem necessary. We cannot predict the form of the rules that ultimately may be adopted in the future or what effects they might have on our business, financial condition, results of operations and cash flows. We will continue to develop and implement necessary changes that enable us to comply with such regulations. See ‘‘Item 1A—Risk Factors—Risks Relating to Our Continuing Business—Our institutions are subject to uncertain and varying laws and regulations, and any changes to these laws or regulations or their application to us may materially adversely affect our business, financial condition and results of operations,” ‘‘Risk Factors—Risks Relating to Our Continuing Business—Political and regulatory developments in Chile may materially adversely affect us,” ‘‘Risk Factors-Risks Relating to Our Highly Regulated Industry in the United States,’’ and ‘‘Item 1—Business—Industry Regulation,’’ in our 2018 Form 10-K.
Chilean Regulatory Developments
On January 24, 2018, a new Higher Education Law (the New Law) was passed by the Chilean Congress. Among other things, the New Law prohibits conflicts of interests and related party transactions involving universities and their controlling parties, with
41
certain exceptions. These exceptions include the provision of services that are educational in nature or essential for the university's purposes.
The New Law, which has an implementation date of May 29, 2019, established a Superintendency of Higher Education, with authority to regulate institutions of higher education and promulgate regulations and procedures implementing the New Law. We anticipate that the Superintendent of Higher Education will promulgate regulations or other guidance. In anticipation of the implementation of the New Law, we have modified and will continue to modify some of our relationships with the Chilean universities in our network and we will continue to evaluate the impact the New Law will have on our Chilean operations. We do not believe the New Law will change our relationship with our two tech/voc institutions in Chile that are for-profit entities. Additionally, we will continue to evaluate our accounting treatment of the Chilean non-profit universities to determine whether we can continue to consolidate them. Our continuing evaluation of the impact of the New Law may result in changes to our expectations due to changes in our interpretations of the law, assumptions used, and additional guidance that may be issued.
Key Business Metrics
Enrollment
Enrollment is our lead revenue indicator and represents our most important non-financial metric. We define ‘‘enrollment’’ as the number of students registered in a course on the last day of the enrollment reporting period. New enrollments provide an indication of future revenue trends. Total enrollment is a function of continuing student enrollments, new student enrollments and enrollments from acquisitions, offset by graduations, attrition and enrollment decreases due to dispositions. Attrition is defined as a student leaving the institution before completion of the program. To minimize attrition, we have implemented programs that involve assisting students in remedial education, mentoring, counseling and student financing.
Each of our institutions has an enrollment cycle that varies by geographic region and academic program. During each academic year, each institution has a "Primary Intake" period in which the majority of the enrollment occurs. Most institutions also have one or more smaller "Secondary Intake" periods. The first calendar quarter generally coincides with the Primary Intakes for our institutions in the Brazil, Andean and Rest of World segments. The third calendar quarter generally coincides with the Primary Intakes for our institutions in the Mexico and Online & Partnerships segments.
The following chart shows our enrollment cycles at our continuing operations. Shaded areas in the chart represent periods when classes are generally in session and revenues are recognized. Areas that are not shaded represent summer breaks during which revenues are not typically recognized. The large circles indicate the Primary Intake start dates of our institutions, and the small circles represent Secondary Intake start dates.
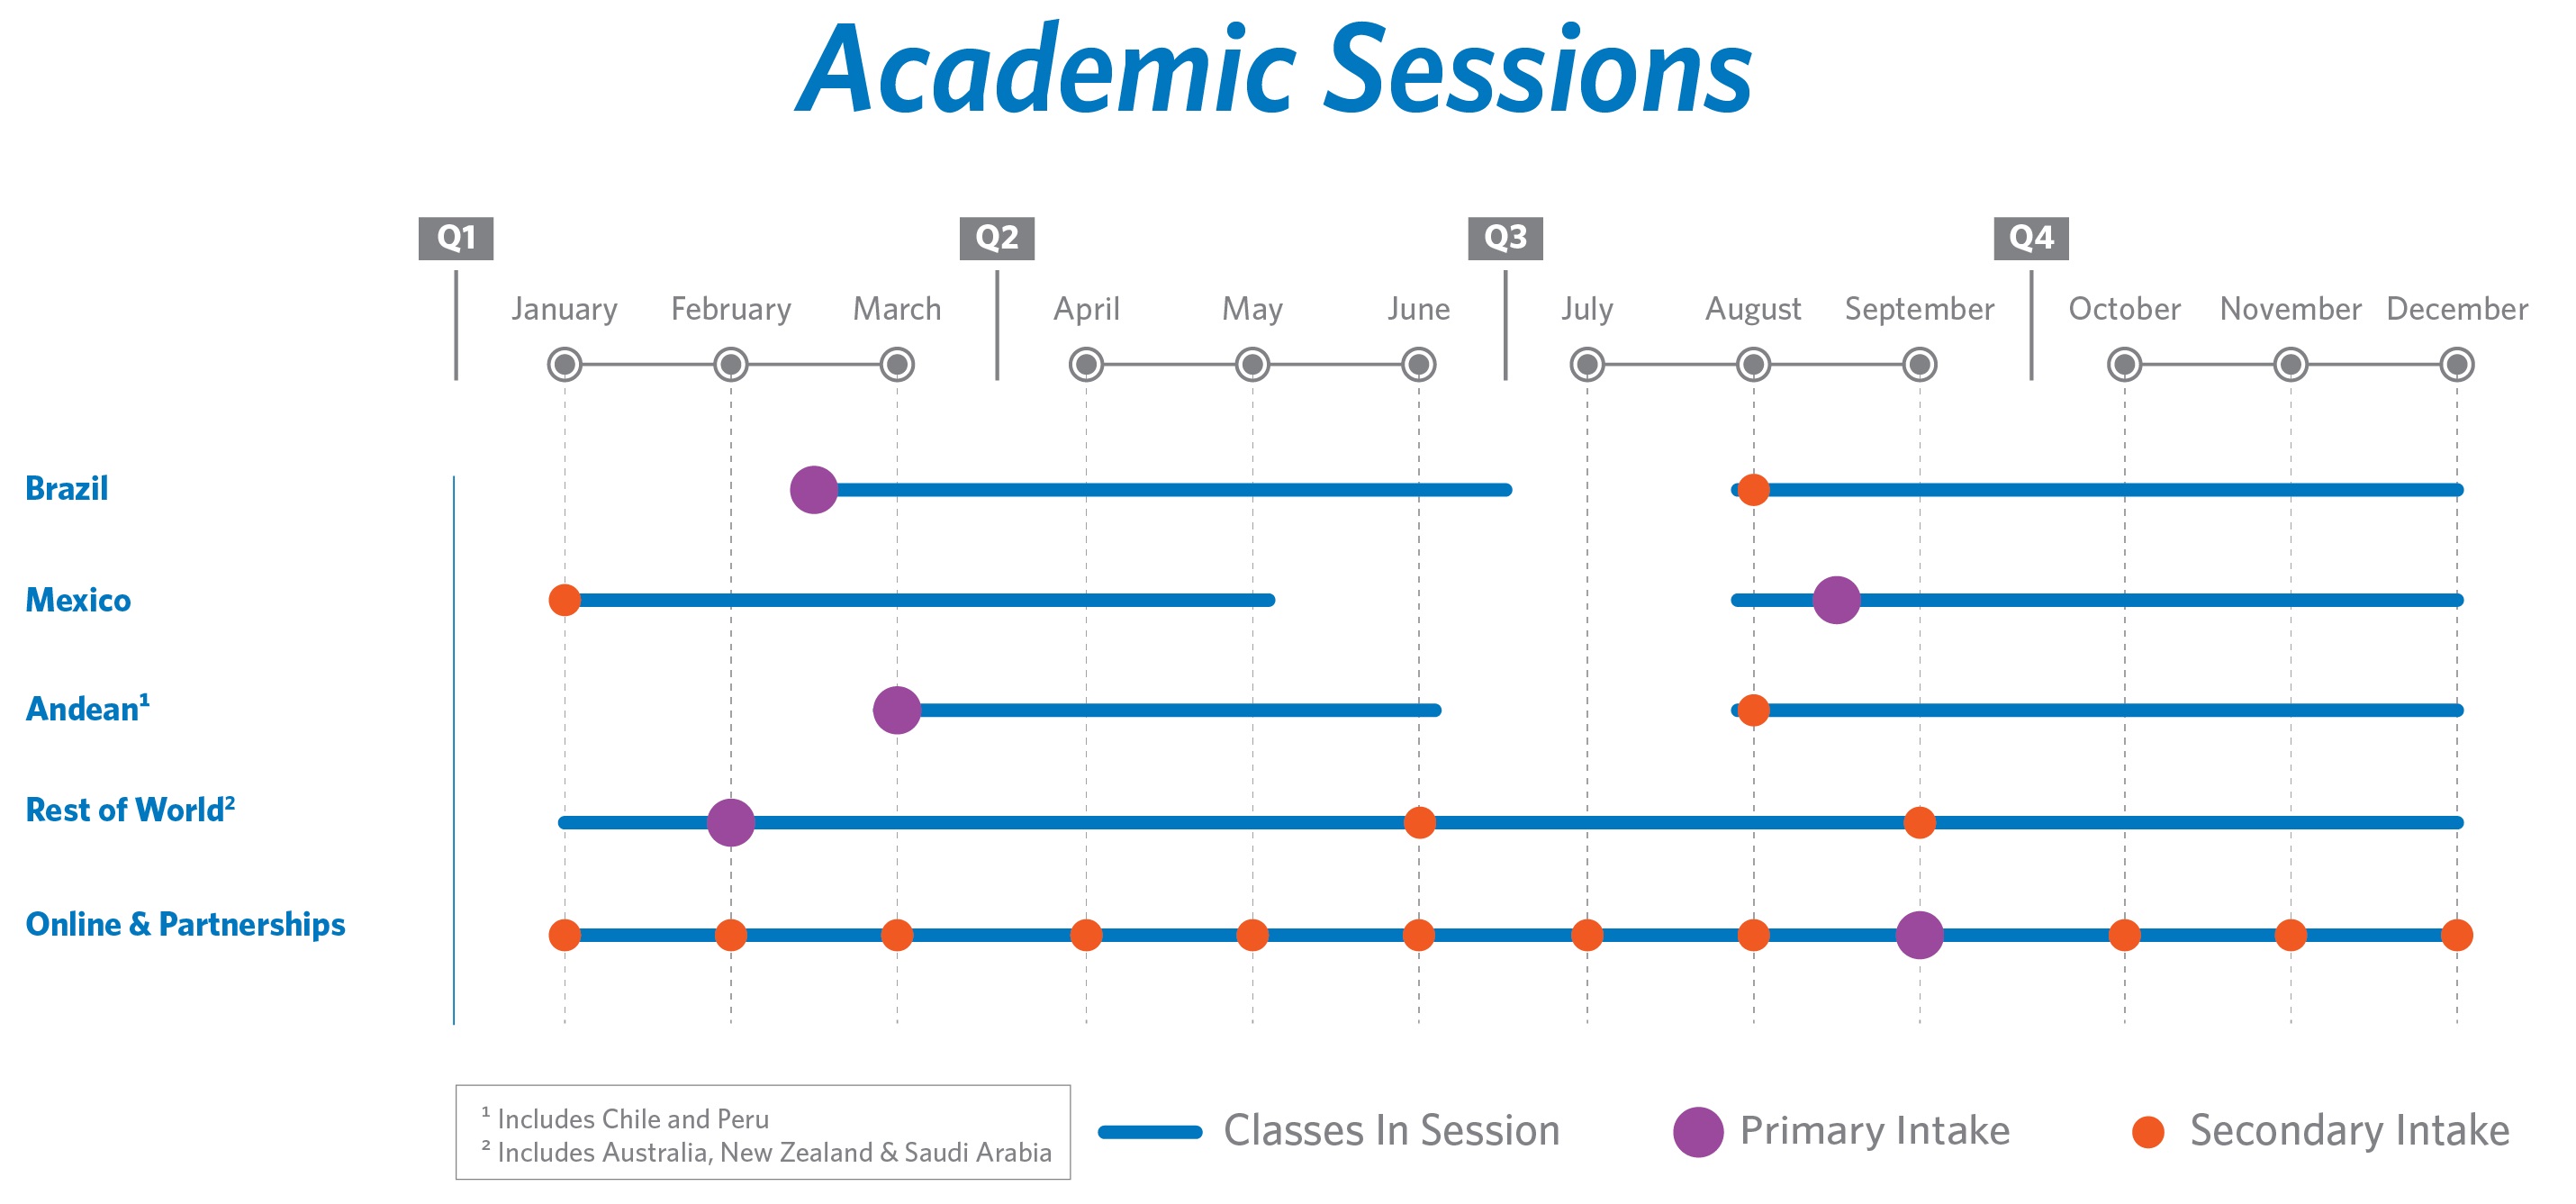
42
Pricing
We continually monitor market conditions and carefully adjust our tuition rates to meet local demand levels. We proactively seek the best price and content combinations to ensure that we remain competitive in all the markets in which we operate.
Principal Components of Income Statement
Revenues
The majority of our revenue is derived from tuition and educational services. The amount of tuition generated in a given period depends on the price per credit hour and the total credit hours or price per program taken by the enrolled student population. The price per credit hour varies by program, by market and by degree level. Additionally, varying levels of discounts and scholarships are offered depending on market-specific dynamics and individual achievements of our students. Revenues are recognized net of scholarships, other discounts, refunds, waivers and the fair value of any guarantees made by Laureate related to student financing programs. In addition to tuition revenues, we generate other revenues from student fees, dormitory/residency fees and other education-related activities. These other revenues are less material to our overall financial results and have a tendency to trend with tuition revenues. The main drivers of changes in revenues between periods are student enrollment and price.
Direct Costs
Our direct costs include labor and operating costs associated with the delivery of services to our students, including the cost of wages, payroll taxes and benefits, depreciation and amortization, rent, utilities, bad debt expenses and marketing and promotional costs to grow future enrollments. In general, a significant portion of our direct costs tend to be variable in nature and trend with enrollment, and management continues to monitor and improve the efficiency of instructional delivery. Conversely, as campuses expand, direct costs may grow faster than enrollment growth as infrastructure investments are made in anticipation of future enrollment growth.
General and Administrative Expenses
Our general and administrative expenses primarily consist of costs associated with corporate departments, including executive management, finance, legal, business development and other departments that do not provide direct operational services.
Factors Affecting Comparability
Acquisitions
Our past experiences provide us with the expertise to further our mission of providing high-quality, accessible and affordable higher education to students by expanding into new markets if opportunities arise, primarily through acquisitions. Acquisitions affect the comparability of our financial statements from period to period. Acquisitions completed during one period impact comparability to a prior period in which we did not own the acquired entity. Therefore, changes related to such entities are considered "incremental impact of acquisitions" for the first 12 months of our ownership. We have made only small acquisitions in 2019 and 2018 that had essentially no impact on the comparability of the periods presented.
Dispositions
Any dispositions of our continuing operations affect the comparability of our financial statements from period to period. Dispositions completed during one period impact comparability to a prior period in which we owned the divested entity. Therefore, changes related to such entities are considered "incremental impact of dispositions" for the first 12 months subsequent to the disposition. As discussed above, all of the divestitures that are part of the strategic shift announced in August 2018 are included in Discontinued Operations for all periods presented. Once its sale is completed, UniNorte, which is part of continuing operations, will be included in the incremental impact of dispositions.
Foreign Exchange
The majority of our institutions are located outside the United States. These institutions enter into transactions in currencies other than USD and keep their local financial records in a functional currency other than the USD. We monitor the impact of foreign currency movements and the correlation between the local currency and the USD. Our revenues and expenses are generally denominated in local currency. The USD is our reporting currency and our subsidiaries operate in various other functional currencies, including: Australian Dollar, Brazilian Real, Chilean Peso, Euro, Mexican Peso, New Zealand Dollar, Peruvian Nuevo Sol, Polish
43
Złoty, and Saudi Riyal. The principal foreign exchange exposure is the risk related to the translation of revenues and expenses incurred in each country from the local currency into USD. See ‘‘Item 1A—Risk Factors—Risks Relating to Our Continuing Business—Our reported revenues and earnings may be negatively affected by the strengthening of the U.S. dollar and currency exchange rates’’ in our 2018 Form 10-K. In order to provide a framework for assessing how our business performed excluding the effects of foreign currency fluctuations, we present
organic constant currency in our segment results, which is calculated using the change from prior-year average foreign exchange rates to current-year average foreign exchange rates, as applied to local-currency operating results for the current year.
Seasonality
Most of the institutions in our network have a summer break during which classes are generally not in session and minimal revenues are recognized. In addition to the timing of summer breaks, holidays such as Easter also have an impact on our academic calendar. Operating expenses, however, do not fully correlate to the enrollment and revenue cycles, as the institutions continue to incur expenses during summer breaks. Given the geographic diversity of our institutions and differences in timing of summer breaks, our second and fourth quarters are stronger revenue quarters as the majority of our institutions are in session for most of these respective quarters. Our first and third fiscal quarters are weaker revenue quarters because the majority of our institutions have summer breaks for some portion of one of these two quarters. Due to this seasonality, revenues and profits in any one quarter are not necessarily indicative of results in subsequent
quarters and may not be correlated to new enrollment in any one quarter.
Income Tax Expense
Our consolidated income tax provision is derived based on the combined impact of federal, state and foreign income taxes. Also, discrete items can arise in the course of our operations that can further impact the Company’s effective tax rate for the period. Our tax rate fluctuates from period to period due to changes in the mix of earnings between our tax-paying entities, our tax-exempt entities and our loss-making entities for which it is not more likely than not that a tax benefit will be realized on the loss.
Results from the Discontinued Operations
The results of operations at our discontinued subsidiaries for the quarters ended
March 31, 2019
and
2018
were as follows:
|
(in millions)
|
2019
|
2018
|
|||||
|
Revenues
|
$
|
202.6
|
|
$
|
253.1
|
|
|
|
Depreciation and amortization
|
—
|
|
10.8
|
|
|||
|
Share-based compensation expense
|
0.2
|
|
0.3
|
|
|||
|
Other direct costs
|
139.6
|
|
176.8
|
|
|||
|
Operating income
|
62.8
|
|
65.2
|
|
|||
|
Other non-operating income
|
3.1
|
|
0.1
|
|
|||
|
Pretax income of discontinued operations
|
65.9
|
|
65.2
|
|
|||
|
Income tax benefit (expense)
|
(9.4
|
)
|
(46.4
|
)
|
|||
|
Income from discontinued operations, net of tax
|
56.6
|
|
18.9
|
|
|||
|
Gain on sales of discontinued operations, net of tax
|
248.0
|
|
318.3
|
|
|||
|
Net income from discontinued operations
|
$
|
304.6
|
|
$
|
337.2
|
|
|
Enrollment at our discontinued operations as of
March 31, 2019
and
2018
was as follows:
|
March 31, 2019
|
March 31, 2018
|
||||
|
Enrollment
|
155,800
|
|
167,800
|
|
|
Sales Completed during the
Three Months Ended March 31, 2019
On February 1, 2019, we sold the operations of St. Augustine, which resulted in a pre-tax gain of approximately
$223.5 million
.
On February 12, 2019, we sold our operations in Thailand, which resulted in a pre-tax gain of approximately
$10.8 million
.
As previously disclosed in our 2018 Form 10-K, on
January 25, 2018
, we completed the sale of LEI Lie Ying Limited (LEILY).
44
During the first quarter of 2019, a legal matter, for which the Company had indemnified the buyer and recorded a contingent liability, was settled with no cost to the Company. Accordingly, the Company reversed the liability and recognized additional gain on the sale of LEILY of approximately
$13.7 million
.
Sales Completed during the
Three Months Ended March 31, 2018
On January 11, 2018, we sold the operations of European University-Cyprus Ltd (EUC) and Laureate Italy S.r.L. (Laureate Italy), which resulted in a gain on sale of approximately $218.0 million.
On
January 25, 2018
, we sold the operations of LEI Lie Ying Limited (LEILY), which resulted in an initial gain on sale of approximately $100.0 million, including tax benefit, during the first quarter of 2018.
Results of Operations
The following discussion of the results of our operations is organized as follows:
|
•
|
Summary Comparison of Consolidated Results;
|
|
•
|
Non-GAAP Financial Measure; and
|
|
•
|
Segment Results.
|
Summary Comparison of Consolidated Results
Discussion of Significant Items Affecting the Consolidated Results for the
Three Months Ended March 31, 2019
and
2018
Three Months Ended March 31, 2019
During the first quarter of 2019, we used approximately
$340.0 million
of the net proceeds from the sale of St. Augustine to repay a portion of our term loan that matures in April 2024 (the 2024 Term Loan). In addition, the Company elected to repay approximately
$35.0 million
of the approximately
$51.7 million
principal balance outstanding for certain notes payable at a real estate subsidiary in Chile. In connection with these debt repayments, the Company recorded a loss on debt extinguishment of
$10.6 million
, primarily related to the write off of a pro-rata portion of the unamortized deferred financing costs associated with the repaid debt balances.
Three Months Ended March 31, 2018
On February 1, 2018, we amended our Senior Secured Credit Facility to reduce the interest rate on our 2024 Term Loan. In connection with this transaction, we also repaid $350.0 million of the principal balance of the 2024 Term Loan. As a result of this transaction, the Company recorded a
$7.5 million
loss on debt extinguishment related to the pro-rata write-off of the term loan's remaining deferred financing costs. This loss is included in other non-operating income in the year-to-date table below.
45
Comparison of Consolidated Results for the
Three Months Ended March 31, 2019
and
2018
|
% Change
|
||||||||||
|
Better/(Worse)
|
||||||||||
|
(in millions)
|
2019
|
2018
|
2019 vs. 2018
|
|||||||
|
Revenues
|
$
|
621.8
|
|
$
|
632.2
|
|
(2
|
)%
|
||
|
Direct costs
|
652.4
|
|
677.5
|
|
4
|
%
|
||||
|
General and administrative expenses
|
53.9
|
|
47.3
|
|
(14
|
)%
|
||||
|
Operating loss
|
(84.5
|
)
|
(92.6
|
)
|
9
|
%
|
||||
|
Interest expense, net of interest income
|
(51.1
|
)
|
(60.1
|
)
|
15
|
%
|
||||
|
Other non-operating expense
|
(9.7
|
)
|
(36.0
|
)
|
73
|
%
|
||||
|
Loss from continuing operations before income taxes
|
(145.4
|
)
|
(188.7
|
)
|
23
|
%
|
||||
|
Income tax benefit
|
35.1
|
|
23.1
|
|
52
|
%
|
||||
|
Loss from continuing operations
|
(110.3
|
)
|
(165.6
|
)
|
33
|
%
|
||||
|
Income from discontinued operations, net of tax
|
56.6
|
|
18.9
|
|
199
|
%
|
||||
|
Gain on sales of discontinued operations, net of tax
|
248.0
|
|
318.3
|
|
(22
|
)%
|
||||
|
Net income
|
194.3
|
|
171.5
|
|
13
|
%
|
||||
|
Net income attributable to noncontrolling interests
|
(3.0
|
)
|
(2.7
|
)
|
11
|
%
|
||||
|
Net income attributable to Laureate Education, Inc.
|
$
|
191.2
|
|
$
|
168.9
|
|
13
|
%
|
||
nm - percentage changes not meaningful
For further details on certain discrete items discussed below, see "Discussion of Significant Items Affecting the Consolidated Results."
Comparison of Consolidated Results for the
Three Months Ended March 31, 2019
to the
Three Months Ended March 31, 2018
Revenues
decreased
by
$10.4 million
to
$621.8 million
for the
three months ended March 31, 2019
(the 2019 fiscal quarter) from
$632.2 million
for the
three months ended March 31, 2018
(the 2018 fiscal quarter). This decrease in revenues primarily resulted from the effect of a net change in foreign currency exchange rates, which
decreased
revenues by
$35.5 million
compared to the
2018
fiscal quarter. This decrease in revenues was partially offset by a higher average total organic enrollment at a majority of our institutions, which
increased
revenues by
$11.5 million
; the effect of changes in tuition rates and enrollments in programs at varying price points ("product mix"), pricing and timing, which
increased
revenues by
$11.3 million
; and other Corporate and Eliminations changes, which accounted for an
increase
in revenues of
$2.3 million
.
Direct costs and general and administrative expenses combined
decreased
by
$18.5 million
to
$706.3 million
for the
2019
fiscal quarter from
$724.8 million
for the
2018
fiscal quarter. This decrease in direct costs primarily resulted from the effect of a net change in foreign currency exchange rates, which decreased costs by
$45.5 million
, and other Corporate and Eliminations expenses, which accounted for a decrease in costs of
$3.7 million
in the
2019
fiscal quarter. Offsetting these direct costs decreases was the effect of overall higher organic enrollments, which increased costs by
$28.7 million
for the
2019
fiscal quarter compared to the
2018
fiscal quarter, in addition to changes in acquisition-related contingent liabilities for taxes other-than-income tax, net of changes in recorded indemnification assets, which resulted in a year-over-year increase in direct costs of
$2.0 million
.
Operating loss
decreased
by
$8.1 million
to
$(84.5) million
for the
2019
fiscal quarter from
$(92.6) million
for the
2018
fiscal quarter. This decrease in operating loss primarily resulted from increased operating income in our Online & Partnerships segment, combined with decreased operating loss in our Andean and Rest of World segments. These changes were partially offset by increased operating loss in our Brazil segment, combined with decreased operating income at our Mexico segment.
Interest expense, net of interest income
decreased
by
$9.0 million
to
$51.1 million
for the
2019
fiscal quarter from
$60.1 million
for the
2018
fiscal quarter. The decrease in interest expense was primarily attributable to lower average debt balances resulting from reductions in debt principal balances.
46
Other non-operating expense
decreased
by
$26.3 million
to
$9.7 million
for the
2019
fiscal quarter from
$36.0 million
for the
2018
fiscal quarter. This decrease was primarily attributable to a
gain
on derivative instruments in the 2019 fiscal quarter compared to a loss in the 2018 fiscal quarter for a change of
$24.5 million
, and a decrease in loss on foreign currency exchange of
$7.1 million
in the
2019
fiscal quarter compared to the
2018
fiscal quarter. These decreases were partially offset by an increase in loss on debt extinguishment of
$3.1 million
compared to the 2018 fiscal quarter, and
a decrease
of
$2.2 million
in other non-operating income in the
2019
fiscal quarter compared to the
2018
fiscal quarter.
Income tax benefit
increased by
$12.0 million
to
$35.1 million
for the
2019
fiscal quarter from
$23.1 million
for the
2018
fiscal quarter. This increase in income tax benefit was primarily due to the impact of the mix of earnings between income and loss companies.
Income from discontinued operations, net of tax
increased
by
$37.7 million
to
$56.6 million
for the
2019
fiscal quarter from
$18.9 million
for the
2018
fiscal quarter.
Gain on sales of discontinued operations, net of tax
decreased
by
$70.3 million
to
$248.0 million
for the
2019
fiscal quarter related to the sales of St. Augustine and our Thailand subsidiaries, compared to
$318.3 million
for the
2018
fiscal quarter related to the sales of our Cyprus, Italy and China subsidiaries.
Non-GAAP Financial Measure
We define Adjusted EBITDA as income (loss) from continuing operations,
before
equity in net (income) loss of affiliates, net of tax, income tax expense (benefit), loss (gain) on sale of subsidiaries, net, foreign currency exchange (gain) loss, net, other (income) expense, net, loss (gain) on derivatives, loss on debt extinguishment, interest expense and interest income,
plus
depreciation and amortization, share-based compensation expense, loss on impairment of assets and expenses related to implementation of our EiP initiative. When we review Adjusted EBITDA on a segment basis, we exclude inter-segment revenues and expenses that eliminate in consolidation. Adjusted EBITDA is used in addition to and in conjunction with results presented in accordance with GAAP and should not be relied upon to the exclusion of GAAP financial measures.
Adjusted EBITDA is a key measure used by our management and board of directors to understand and evaluate our core operating performance and trends, to prepare and approve our annual budget and to develop short- and long-term operational plans. In particular, the exclusion of certain expenses in calculating Adjusted EBITDA can provide a useful measure for period-to-period comparisons of our core business. Additionally, Adjusted EBITDA is a key financial measure used by the compensation committee of our board of directors and our Chief Executive Officer in connection with the payment of incentive compensation to our executive officers and other members of our management team. Accordingly, we believe that Adjusted EBITDA provides useful information to investors and others in understanding and evaluating our operating results in the same manner as our management and board of directors.
47
The following table presents Adjusted EBITDA and reconciles
loss
from continuing operations to Adjusted EBITDA for the
three months ended March 31, 2019
and
2018
:
|
% Change
|
||||||||||
|
Better/(Worse)
|
||||||||||
|
(in millions)
|
2019
|
2018
|
2019 vs. 2018
|
|||||||
|
Loss from continuing operations
|
$
|
(110.3
|
)
|
$
|
(165.6
|
)
|
33
|
%
|
||
|
Plus:
|
||||||||||
|
Income tax benefit
|
(35.1
|
)
|
(23.1
|
)
|
52
|
%
|
||||
|
Loss from continuing operations before income taxes
|
(145.4
|
)
|
(188.7
|
)
|
23
|
%
|
||||
|
Plus:
|
||||||||||
|
Foreign currency exchange loss, net
|
4.7
|
|
11.8
|
|
60
|
%
|
||||
|
Other income, net
|
(0.4
|
)
|
(2.6
|
)
|
(85
|
)%
|
||||
|
(Gain) loss on derivatives
|
(5.2
|
)
|
19.3
|
|
127
|
%
|
||||
|
Loss on debt extinguishment
|
10.6
|
|
7.5
|
|
(41
|
)%
|
||||
|
Interest expense
|
54.7
|
|
63.3
|
|
14
|
%
|
||||
|
Interest income
|
(3.6
|
)
|
(3.3
|
)
|
9
|
%
|
||||
|
Operating loss
|
(84.5
|
)
|
(92.6
|
)
|
9
|
%
|
||||
|
Plus:
|
||||||||||
|
Depreciation and amortization
|
47.6
|
|
57.0
|
|
16
|
%
|
||||
|
EBITDA
|
(36.9
|
)
|
(35.6
|
)
|
(4
|
)%
|
||||
|
Plus:
|
||||||||||
|
Share-based compensation expense
(a)
|
3.0
|
|
(4.1
|
)
|
(173
|
)%
|
||||
|
EiP implementation expenses
(b)
|
12.3
|
|
10.1
|
|
(22
|
)%
|
||||
|
Adjusted EBITDA
|
$
|
(21.6
|
)
|
$
|
(29.7
|
)
|
27
|
%
|
||
nm - percentage changes not meaningful
(a)
Represents non-cash, share-based compensation expense pursuant to the provisions of ASC 718, ‘‘Stock Compensation.’’
(b)
EiP implementation expenses are related to our enterprise-wide initiative to optimize and standardize our processes, creating vertical integration of procurement, information technology, finance, accounting and human resources. The first wave of EiP included the establishment of regional SSOs around the world, as well as improvements to our system of internal controls over financial reporting. Given the success of the first wave of EiP, we expanded the initiative into other back- and mid-office areas, as well as certain student-facing activities, in order to generate additional efficiencies and create a more efficient organizational structure. EiP also includes certain non-recurring costs incurred in connection with the planned and completed dispositions.
Comparison of Depreciation and Amortization, Share-based Compensation and EiP Implementation Expenses for the
Three Months Ended March 31, 2019
and
2018
Depreciation and amortization
decreased
by
$9.4 million
to
$47.6 million
for the
2019
fiscal quarter from
$57.0 million
for the
2018
fiscal quarter. The effects of foreign currency exchange decreased depreciation and amortization expense by
$3.0 million
for the
2019
fiscal quarter compared to the
2018
fiscal quarter. In addition, the cessation of depreciation expense at UniNorte following its classification as held-for-sale in the third quarter of 2018 decreased depreciation and amortization expense by
$1.0 million
for the
2019
fiscal quarter compared to the
2018
fiscal quarter. Other items decreased depreciation and amortization by
$5.4 million
.
Share-based compensation expense
increased
by
$7.1 million
to
$3.0 million
for the
2019
fiscal quarter from
$(4.1) million
for the
2018
fiscal quarter. This increase is mostly attributable to a correction of an immaterial error in the first quarter of 2018, which reduced share-based compensation expense for the
2018
fiscal quarter.
EiP implementation expenses
increased
by
$2.2 million
to
$12.3 million
for the
2019
fiscal quarter from
$10.1 million
for the
2018
fiscal quarter. The year-over-year increase in EiP expenses is primarily attributable to higher costs for severance and retention bonuses related to our divestiture activity.
48
Segment Results
We have five reportable segments: Brazil, Mexico, Andean, Rest of World, and Online & Partnerships. As discussed in "Overview," the entire Central America & U.S. Campuses segment is included in Discontinued Operations and therefore is excluded from segment results. For purposes of the following comparison of results discussion, "
segment direct costs
" represent direct costs by segment as they are included in Adjusted EBITDA, such that depreciation and amortization expense, loss on impairment of assets, share-based compensation expense and our EiP implementation expenses have been excluded. Organic enrollment is based on average total enrollment for the period. For a further description of our segments, see "Overview."
The following tables, derived from our consolidated financial statements included elsewhere in this Form 10-Q, presents selected financial information of our segments:
|
(in millions)
|
% Change
|
|||||||||
|
Better/(Worse)
|
||||||||||
|
For the three months ended March 31,
|
2019
|
2018
|
2019 vs. 2018
|
|||||||
|
Revenues:
|
||||||||||
|
Brazil
|
$
|
110.0
|
|
$
|
122.8
|
|
(10
|
)%
|
||
|
Mexico
|
156.5
|
|
155.9
|
|
—
|
%
|
||||
|
Andean
|
138.9
|
|
135.1
|
|
3
|
%
|
||||
|
Rest of World
|
54.2
|
|
52.3
|
|
4
|
%
|
||||
|
Online & Partnerships
|
161.8
|
|
168.0
|
|
(4
|
)%
|
||||
|
Corporate
|
0.5
|
|
(1.8
|
)
|
128
|
%
|
||||
|
Consolidated Total Revenues
|
$
|
621.8
|
|
$
|
632.2
|
|
(2
|
)%
|
||
|
Adjusted EBITDA:
|
||||||||||
|
Brazil
|
$
|
(30.7
|
)
|
$
|
(26.0
|
)
|
(18
|
)%
|
||
|
Mexico
|
25.8
|
|
30.4
|
|
(15
|
)%
|
||||
|
Andean
|
(33.2
|
)
|
(39.4
|
)
|
16
|
%
|
||||
|
Rest of World
|
4.5
|
|
3.0
|
|
50
|
%
|
||||
|
Online & Partnerships
|
48.6
|
|
45.0
|
|
8
|
%
|
||||
|
Corporate
|
(36.6
|
)
|
(42.6
|
)
|
14
|
%
|
||||
|
Consolidated Total Adjusted EBITDA
|
$
|
(21.6
|
)
|
$
|
(29.7
|
)
|
27
|
%
|
||
49
Brazil
Financial Overview
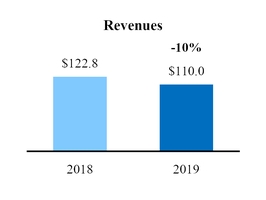
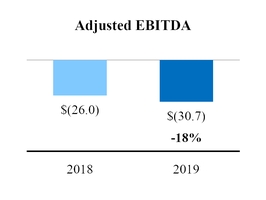
Comparison of Brazil Results for the
Three Months Ended March 31, 2019
to the
Three Months Ended March 31, 2018
|
(in millions)
|
Revenues
|
Direct Costs
|
Adjusted EBITDA
|
||||||||
|
March 31, 2018
|
$
|
122.8
|
|
$
|
148.8
|
|
$
|
(26.0
|
)
|
||
|
Organic enrollment
(1)
|
4.5
|
|
|||||||||
|
Product mix, pricing and timing
(1)
|
0.4
|
|
|||||||||
|
Organic constant currency
|
4.9
|
|
13.7
|
|
(8.8
|
)
|
|||||
|
Foreign exchange
|
(17.7
|
)
|
(22.5
|
)
|
4.8
|
|
|||||
|
Acquisitions
|
—
|
|
—
|
|
—
|
|
|||||
|
Dispositions
|
—
|
|
—
|
|
—
|
|
|||||
|
Other
(2)
|
—
|
|
0.7
|
|
(0.7
|
)
|
|||||
|
March 31, 2019
|
$
|
110.0
|
|
$
|
140.7
|
|
$
|
(30.7
|
)
|
||
(1)
Organic enrollment and Product mix, pricing and timing are not separable for the calculation of direct costs and therefore are combined and defined as Organic constant currency for the calculation of Adjusted EBITDA.
(2)
Other is composed of acquisition-related contingent liabilities for taxes other-than-income tax, net of changes in recorded indemnification assets.
Revenues
decreased
by
$12.8 million
, a
10%
decrease
from the
2018
fiscal quarter.
|
•
|
Organic enrollment
increased
during the 2019 fiscal quarter by
3%
, increasing revenues by
$4.5 million
. The increase in enrollments for the 2019 fiscal quarter is attributable to growth in distance learning, which has a lower average revenue per student than our campus-based programs.
|
|
•
|
Revenues represented
18%
of our consolidated total revenues for the
2019
fiscal quarter compared to
19%
for the
2018
fiscal quarter.
|
Adjusted EBITDA
decreased
by
$4.7 million
, an
18%
decrease
from the
2018
fiscal quarter, primarily due to an increase in discounts and scholarships as a percentage of revenue, as the number of students participating in the Brazilian government student loan program (FIES) continues to decline following their graduation.
50
Mexico
Financial Overview
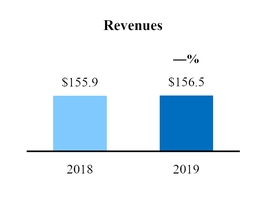
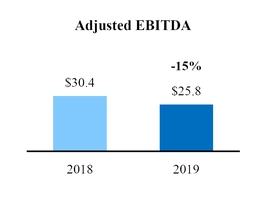
Comparison of Mexico Results for the
Three Months Ended March 31, 2019
to the
Three Months Ended March 31, 2018
|
(in millions)
|
Revenues
|
Direct Costs
|
Adjusted EBITDA
|
||||||||
|
March 31, 2018
|
$
|
155.9
|
|
$
|
125.5
|
|
$
|
30.4
|
|
||
|
Organic enrollment
(1)
|
(2.9
|
)
|
|||||||||
|
Product mix, pricing and timing
(1)
|
7.6
|
|
|||||||||
|
Organic constant currency
|
4.7
|
|
7.0
|
|
(2.3
|
)
|
|||||
|
Foreign exchange
|
(4.1
|
)
|
(3.1
|
)
|
(1.0
|
)
|
|||||
|
Acquisitions
|
—
|
|
—
|
|
—
|
|
|||||
|
Dispositions
|
—
|
|
—
|
|
—
|
|
|||||
|
Other
(2)
|
—
|
|
1.3
|
|
(1.3
|
)
|
|||||
|
March 31, 2019
|
$
|
156.5
|
|
$
|
130.7
|
|
$
|
25.8
|
|
||
(1)
Organic enrollment and Product mix, pricing and timing are not separable for the calculation of direct costs and therefore are combined and defined as Organic constant currency for the calculation of Adjusted EBITDA.
(2)
Other is composed of acquisition-related contingent liabilities for taxes other-than-income tax, net of changes in recorded indemnification assets.
Revenues
increased
by
$0.6 million
from the
2018
fiscal quarter.
|
•
|
Organic enrollment decreased by
1%
during the
2019
fiscal quarter, which
decreased
revenues by
$2.9 million
.
|
|
•
|
Revenues represented
25%
of our consolidated total revenues for both the
2019
and the
2018
fiscal quarters.
|
Adjusted EBITDA
decreased
by
$4.6 million
, a
15%
decrease
from the
2018
fiscal quarter.
51
Andean
Financial Overview
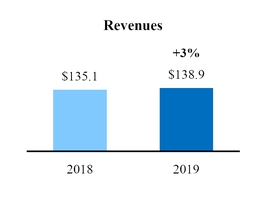
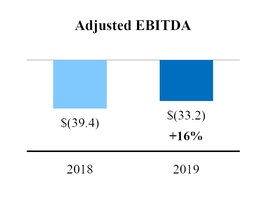
Comparison of Andean Results for the
Three Months Ended March 31, 2019
to the
Three Months Ended March 31, 2018
|
(in millions)
|
Revenues
|
Direct Costs
|
Adjusted EBITDA
|
||||||||
|
March 31, 2018
|
$
|
135.1
|
|
$
|
174.5
|
|
$
|
(39.4
|
)
|
||
|
Organic enrollment
(1)
|
7.1
|
|
|||||||||
|
Product mix, pricing and timing
(1)
|
7.1
|
|
|||||||||
|
Organic constant currency
|
14.2
|
|
10.8
|
|
3.4
|
|
|||||
|
Foreign exchange
|
(10.4
|
)
|
(13.2
|
)
|
2.8
|
|
|||||
|
Acquisitions
|
—
|
|
—
|
|
—
|
|
|||||
|
Dispositions
|
—
|
|
—
|
|
—
|
|
|||||
|
Other
|
—
|
|
—
|
|
—
|
|
|||||
|
March 31, 2019
|
$
|
138.9
|
|
$
|
172.1
|
|
$
|
(33.2
|
)
|
||
(1)
Organic enrollment and Product mix, pricing and timing are not separable for the calculation of direct costs and therefore are combined and defined as Organic constant currency for the calculation of Adjusted EBITDA.
Revenues
increased
by
$3.8 million
, a
3%
increase
from the
2018
fiscal quarter.
|
•
|
Organic enrollment
increased
during the
2019
fiscal quarter by
6%
, increasing revenues by
$7.1 million
.
|
|
•
|
Revenue represented
22%
of our consolidated total revenues for the
2019
fiscal quarter compared to
21%
for the
2018
fiscal quarter.
|
Adjusted EBITDA
increased
by
$6.2 million
, a
16%
increase
from the
2018
fiscal quarter.
|
•
|
Foreign exchange affected the results for the
2019
fiscal quarter due to weakening of the Chilean Peso and the Peruvian Nuevo Sol relative to the USD.
|
52
Rest of World
Financial Overview
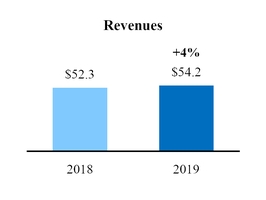
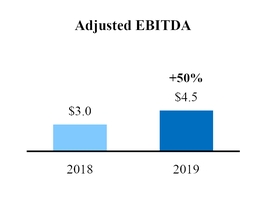
Comparison of Rest of World Results for the
Three Months Ended March 31, 2019
to the
Three Months Ended March 31, 2018
|
(in millions)
|
Revenues
|
Direct Costs
|
Adjusted EBITDA
|
||||||||
|
March 31, 2018
|
$
|
52.3
|
|
$
|
49.3
|
|
$
|
3.0
|
|
||
|
Organic enrollment
(1)
|
5.8
|
|
|||||||||
|
Product mix, pricing and timing
(1)
|
(0.6
|
)
|
|||||||||
|
Organic constant currency
|
5.2
|
|
4.1
|
|
1.1
|
|
|||||
|
Foreign exchange
|
(3.3
|
)
|
(3.7
|
)
|
0.4
|
|
|||||
|
Acquisitions
|
—
|
|
—
|
|
—
|
|
|||||
|
Dispositions
|
—
|
|
—
|
|
—
|
|
|||||
|
Other
|
—
|
|
—
|
|
—
|
|
|||||
|
March 31, 2019
|
$
|
54.2
|
|
$
|
49.7
|
|
$
|
4.5
|
|
||
Revenues
increased
by
$1.9 million
, a
4%
increase
from the
2018
fiscal quarter.
|
•
|
Organic enrollment
increased
during the
2019
fiscal quarter by
11%
, increasing revenues by
$5.8 million
.
|
|
•
|
Revenues represented
9%
of our consolidated total revenues for the
2019
fiscal quarter compared to
8%
for the
2018
fiscal quarter.
|
Adjusted EBITDA
increased
by
$1.5 million
, a
50%
increase
from the
2018
fiscal quarter.
|
•
|
Foreign exchange affected the results for the
2019
fiscal quarter, primarily due to the weakening of the Australian Dollar relative to the USD.
|
53
Online & Partnerships
Financial Overview
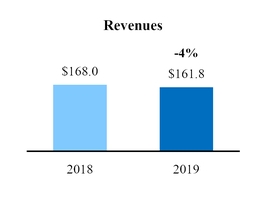
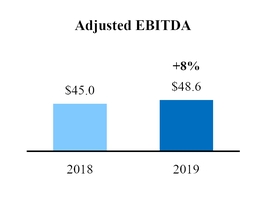
Comparison of Online & Partnerships Results for the
Three Months Ended March 31, 2019
to the
Three Months Ended March 31, 2018
|
(in millions)
|
Revenues
|
Direct Costs
|
Adjusted EBITDA
|
||||||||
|
March 31, 2018
|
$
|
168.0
|
|
$
|
123.0
|
|
$
|
45.0
|
|
||
|
Organic enrollment
(1)
|
(3.0
|
)
|
|||||||||
|
Product mix, pricing and timing
(1)
|
(3.2
|
)
|
|||||||||
|
Organic constant currency
|
(6.2
|
)
|
(9.8
|
)
|
3.6
|
|
|||||
|
Foreign exchange
|
—
|
|
—
|
|
—
|
|
|||||
|
Acquisitions
|
—
|
|
—
|
|
—
|
|
|||||
|
Dispositions
|
—
|
|
—
|
|
—
|
|
|||||
|
Other
|
—
|
|
—
|
|
—
|
|
|||||
|
March 31, 2019
|
$
|
161.8
|
|
$
|
113.2
|
|
$
|
48.6
|
|
||
(1)
Organic enrollment and Product mix, pricing and timing are not separable for the calculation of direct costs and therefore are combined and defined as Organic constant currency for the calculation of Adjusted EBITDA.
Revenues
decreased
by
$6.2 million
, a
4%
decrease
from the
2018
fiscal quarter.
|
•
|
Organic enrollment
decreased
during the
2019
fiscal quarter by
3%
, decreasing revenues by
$3.0 million
.
|
|
•
|
Revenues represented
26%
of our consolidated total revenues for the
2019
fiscal quarter compared to
27%
for the
2018
fiscal quarter.
|
Adjusted EBITDA
increased
by
$3.6 million
, an
8%
increase
compared to the
2018
fiscal quarter.
Corporate
Corporate revenues
represent amounts from our consolidated joint venture with the University of Liverpool, as well as centralized IT costs charged to various segments, offset by the elimination of intersegment revenues.
Operating results for Corporate for the
three months ended March 31, 2019
and
2018
:
|
% Change
|
||||||||||
|
Better/(Worse)
|
||||||||||
|
(in millions)
|
2019
|
2018
|
2019 vs. 2018
|
|||||||
|
Revenues
|
$
|
0.5
|
|
$
|
(1.8
|
)
|
128
|
%
|
||
|
Expenses
|
37.1
|
|
40.8
|
|
9
|
%
|
||||
|
Adjusted EBITDA
|
$
|
(36.6
|
)
|
$
|
(42.6
|
)
|
14
|
%
|
||
54
Comparison of Corporate Results for the
Three Months Ended March 31, 2019
to the
Three Months Ended March 31, 2018
Adjusted EBITDA
increased
by
$6.0 million
, a
14%
increase
from the
2018
fiscal quarter.
|
•
|
Labor costs and other professional fees decreased expenses by
$6.9 million
for the
2019
fiscal quarter compared to the
2018
fiscal quarter.
|
|
•
|
Other items accounted for
a decrease
in Adjusted EBITDA of
$0.9 million
.
|
Liquidity and Capital Resources
Liquidity Sources
We anticipate that cash flow from operations and available cash will be sufficient to meet our current operating requirements for at least the next 12 months from the date of issuance of this report.
Our primary source of cash is revenue from tuition charged to students in connection with our various education program offerings. The majority of our students finance the cost of their own education and/or seek third-party financing programs. We anticipate generating sufficient cash flow from operations in the majority of countries where we operate to satisfy the working capital and financing needs of our organic growth plans for each country. If our educational institutions within one country were unable to maintain sufficient liquidity, we would consider using internal cash resources or reasonable short-term working capital facilities to accommodate any short- to medium-term shortfalls.
As of
March 31, 2019
, our secondary source of liquidity was cash and cash equivalents of
$278.8 million
, which does not include
$215.8 million
of cash recorded at subsidiaries that are classified as held for sale at
March 31, 2019
. Our cash accounts are maintained with high-quality financial institutions with no significant concentration in any one institution.
Sale Transactions
On February 1, 2019, we completed the sale of St. Augustine and received net proceeds of approximately
$346.4 million
(approximately
$301.5 million
net of cash sold). The Company used
$340.0 million
of the net proceeds to repay a portion of the 2024 Term Loan, with the remaining proceeds utilized to repay borrowings outstanding under our revolving credit facility.
On February 12, 2019, we completed the sale of our Thailand operations. The total purchase price was approximately
$35.3 million
, resulting in net proceeds of approximately
$27.9 million
. Of the
$27.9 million
in net proceeds,
$23.7 million
(approximately
$20.3 million
net of cash sold) was received at closing; the balance of
$4.2 million
will be payable upon satisfaction of certain post-closing requirements.
On
April 8, 2019
, we completed the sale of our institution in South Africa, Monash South Africa, as well as the sale of the real estate associated with that institution. The Company received approximately
$7.4 million
from the buyer, which it plans to use to reduce indebtedness.
Liquidity Restrictions
Our liquidity is affected by restricted cash balances, which totaled
$203.6 million
and
$201.3 million
as of
March 31, 2019
and
December 31, 2018
, respectively.
Indefinite Reinvestment of Foreign Earnings
We earn a significant portion of our income from subsidiaries located in countries outside the United States. As part of our business strategies, we have determined that, except for one of our institutions in Peru, all earnings from our foreign continuing operations will be deemed indefinitely reinvested outside of the United States. As of
March 31, 2019
,
$247.0 million
of our total
$278.8 million
of cash and cash equivalents were held by foreign subsidiaries, including
$75.0 million
held by VIEs. These amounts above do not include
$215.8 million
of cash recorded at subsidiaries that are classified as held for sale at
March 31, 2019
, of which
$214.5 million
was held by foreign subsidiaries. As of December 31, 2018,
$327.9 million
of our total
$388.5 million
of cash and cash equivalents were held by foreign subsidiaries, including
$158.4 million
held by VIEs. These amounts above do not include
$216.4 million
of cash recorded at subsidiaries that are classified as held for sale at December 31, 2018, of which
$208.4 million
was held by foreign subsidiaries. The VIEs' cash and cash equivalents balances are generally required to be used only for the operations of these VIEs.
55
Liquidity Requirements
Our short-term liquidity requirements include: funding for debt service (including finance leases); operating lease obligations; payments due to shareholders of acquired companies; payments of deferred compensation; working capital; operating expenses; payments of third-party obligations; capital expenditures; and business development activities.
Long-term liquidity requirements include: payments on long-term debt (including finance leases); operating lease obligations; payments of long-term amounts due to shareholders of acquired companies; payments of deferred compensation; and payments of third-party obligations.
Debt
As of
March 31, 2019
, senior long-term borrowings totaled
$1,721.1 million
and consisted of
$921.1 million
under the Senior Secured Credit Facility that matures in April 2022 and April 2024 and
$800.0 million
in Senior Notes due 2025 that mature in May 2025.
As of
March 31, 2019
, other debt balances totaled
$533.5 million
and our finance lease obligations were
$69.4 million
. Other debt includes lines of credit and short-term borrowing arrangements of subsidiaries, mortgages payable and notes payable.
Approximately
$185.9 million
of long-term debt, including the current portion, is included in the
held-for-sale liabilities recorded on the consolidated balance sheet as of
March 31, 2019
. For further description of the held-for-sale amounts see Note
4
,
Discontinued Operations and Assets Held for Sale
, in our consolidated financial statements included elsewhere in this Form 10-Q.
Senior Secured Credit Facility
As of
March 31, 2019
, the outstanding balance under our Senior Secured Credit Facility was
$921.1 million
, which consisted of an outstanding balance of
$30.0 million
under our $385.0 million senior secured revolving credit facility and an aggregate outstanding balance of
$891.1 million
, net of a debt discount, under the term loans. As of December 31,
2018
, the outstanding balance under our Senior Secured Credit Facility was
$1,321.6 million
, which consisted of
$93.5 million
outstanding under our $385.0 million senior secured revolving credit facility and an aggregate outstanding balance of
$1,228.1 million
, net of a debt discount, under the term loans.
Senior Notes
As of both
March 31, 2019
and
December 31, 2018
, the outstanding balance under our Senior Notes due 2025 was
$800.0 million
.
Covenants
Under our
Second Amended and Restated Credit Agreement
we are subject to a Consolidated Senior Secured Debt to Consolidated EBITDA financial maintenance covenant, as defined in the
Second Amended and Restated Credit Agreement
, unless certain conditions are satisfied.
As of
March 31, 2019
, these conditions were satisfied and, therefore, we were not subject to the leverage ratio covenant.
The maximum ratio, as defined, is
3.50x
as of
March 31, 2019
and thereafter. In addition, notes payable at some of our locations contain financial maintenance covenants.
Leases
We conduct a significant portion of our operations from leased facilities. These facilities include our corporate headquarters, other office locations, and many of our higher education facilities. As discussed in Note
10
,
Leases
, in our consolidated financial statements included elsewhere in this Form 10-Q, we have significant liabilities recorded related to our leased facilities, which will require future cash payments.
Due to Shareholders of Acquired Companies
One method of payment for acquisitions is the use of promissory notes payable to the sellers of acquired companies. As of
March 31, 2019
and
December 31, 2018
, we recorded
$46.3 million
and
$45.4 million
, respectively, for these liabilities. See also Note
6
,
Due to Shareholders of Acquired Companies
, in our consolidated financial statements included elsewhere in this Form 10-Q.
56
Capital Expenditures
Capital expenditures consist of purchases of property and equipment and expenditures for deferred costs. Our capital expenditure program is a component of our liquidity and capital management strategy. This program includes discretionary spending, which we can adjust in response to economic and other changes in our business environment, to grow our network through the following: (1) capacity expansion at institutions to support enrollment growth; (2) new campuses for institutions in our existing markets; (3) information technology to increase efficiency and controls; and (4) online content development. Our non-discretionary spending includes the maintenance of existing facilities. We typically fund our capital expenditures through cash flow from operations and external financing. In the event that we are unable to obtain the necessary funding for capital expenditures, our long-term growth strategy could be significantly affected. We believe that our internal sources of cash and our ability to obtain additional third-party financing, subject to market conditions, will be sufficient to fund our investing activities.
Our total capital expenditures for our continuing and discontinued operations, excluding receipts from the sale of subsidiaries and property equipment, were
$35.8 million
and
$47.6 million
during the
three months ended March 31, 2019
, and
2018
, respectively. The
25%
decrease in capital expenditures for the
2019
fiscal quarter compared to the
2018
fiscal quarter was driven by lower
spending in Brazil, Peru and Costa Rica, due to significant capital expenditures made in prior periods to launch several new campuses in these geographies, as well as reduced equipment expenditures in Mexico and, to a lesser extent, reduced capital expenditures as a result of divestitures.
Derivatives
In the normal course of business, our operations are exposed to fluctuations in foreign currency values and interest rate changes. We mitigate a portion of these risks through a risk-management program that includes the use of derivatives. For further information on our derivatives, see Note
15
,
Derivative Instruments
, in our consolidated financial statements included elsewhere in this Form 10-Q.
Redeemable Noncontrolling Interests and Equity
In connection with certain acquisitions, we have entered into put/call arrangements with certain minority shareholders, and we may be required or elect to purchase additional ownership interests in the associated entities within a specified timeframe. Certain of our call rights contain minimum payment provisions. If we exercise such call rights, or negotiate purchase of additional ownership interests, the consideration required could be higher than the estimated put values.
Cash Flows
In the consolidated statements of cash flows, the changes in operating assets and liabilities are presented excluding the effects of exchange rate changes, acquisitions, and reclassifications, as these effects do not represent operating cash flows. Accordingly, the amounts in the consolidated statements of cash flows do not agree with the changes of the operating assets and liabilities as presented in the consolidated balance sheets. The effects of exchange rate changes on cash are presented separately in the consolidated statements of cash flows.
The following table summarizes our cash flows from operating, investing, and financing activities for each of the
three months ended March 31, 2019
and
2018
:
|
(in millions)
|
2019
|
2018
|
|||||
|
Cash provided by (used in):
|
|||||||
|
Operating activities
|
$
|
45.0
|
|
$
|
(7.1
|
)
|
|
|
Investing activities
|
294.1
|
|
302.7
|
|
|||
|
Financing activities
|
(449.6
|
)
|
(369.0
|
)
|
|||
|
Effects of exchange rates changes on cash
|
2.0
|
|
22.2
|
|
|||
|
Change in cash included in current assets held for sale
|
1.1
|
|
(0.1
|
)
|
|||
|
Net change in cash and cash equivalents and restricted cash
|
$
|
(107.4
|
)
|
$
|
(51.3
|
)
|
|
57
Comparison of Cash Flows
for the Three Months Ended March 31, 2019 to the Three Months Ended March 31, 2018
Operating activities
Cash flows from operating activities
increased
by
$52.1 million
to an operating cash inflow of
$45.0 million
for the
2019
fiscal quarter, from an operating cash usage of
$(7.1) million
for the
2018
fiscal quarter. This increase in operating cash was primarily due to a
decrease
in cash paid for taxes of
$13.3 million
, from
$32.0 million
for the
2018
fiscal quarter to
$18.7 million
for the
2019
fiscal quarter, as well as changes in operating assets and liabilities and other working capital, which accounted for an increase in operating cash of
$47.3 million
for the
2019
fiscal quarter compared to the
2018
fiscal quarter. These increases in operating cash flows were partially offset by a cash payment of
$8.2 million
during the 2019 fiscal quarter to settle cross currency and interest rate swaps in Chile, as discussed in Note
15
,
Derivative Instruments
, in our consolidated financial statements included elsewhere in this Quarterly Report on Form 10-Q. In addition, c
ash paid for interest
increased
slightly by
$0.3 million
, from
$47.4 million
for the
2018
fiscal quarter to
$47.7 million
for the
2019
fiscal quarter, due to timing of interest payments for the 2024 Term Loan.
Investing activities
Cash provided by investing activities
decreased
by
$8.6 million
to
$294.1 million
for the
2019
fiscal quarter from
$302.7 million
for the
2018
fiscal quarter. This decrease is primarily attributable to lower cash receipts from the sales of discontinued operations of
$28.5 million
, from
$359.5 million
during the 2018 fiscal quarter (for the sales of our operations in Cyprus, Italy, and China) to
$331.0 million
during the 2019 fiscal quarter (for the sales of St. Augustine and our Thailand operations). In addition, during the
2019
fiscal quarter, we paid
$1.2 million
for a small acquisition in Brazil. Partially offsetting these decreases in investing cash were decreased capital expenditures of
$11.8 million
and a decrease in cash paid for derivative settlements of
$10.0 million
, which related to the foreign exchange swap agreements associated with the sale of the Cyprus and Italy institutions during the 2018 fiscal quarter. Other items accounted for the remaining change of
$0.7 million
.
Financing activities
Financing activities cash flows
decreased
by
$80.6 million
to a financing cash usage of
$(449.6) million
for the
2019
fiscal quarter, from a financing cash usage of
$(369.0) million
for the
2018
fiscal quarter. This decrease was primarily attributable to higher net payments of long-term debt during the
2019
fiscal quarter as compared to the
2018
fiscal quarter, which increased by
$88.7 million
, as well as higher payments for debt issuance costs and redemption and call premiums during the
2019
fiscal quarter than in the
2018
fiscal quarter of
$5.1 million
, which was mostly related to debt repayment in Chile. These decreases in financing cash were partially offset by a
$9.7 million
reduction in dividend payments for the Series A Preferred Stock (no further dividend payments were required following the April 23, 2018 conversion of the Series A Preferred Stock into Class A common stock). In addition, payments of deferred price for acquisitions were lower during the
2019
fiscal quarter versus the
2018
fiscal quarter by
$5.2 million
. Other items accounted for the remaining change of
$1.7 million
.
Critical Accounting Policies and Estimates
The preparation of the consolidated financial statements in conformity with GAAP requires our management to make estimates and assumptions that affect the reported amounts of assets, liabilities, revenues and expenses, and the related disclosure of contingent assets and liabilities. Actual results could differ from these estimates. Our significant accounting policies are discussed in Note
2
,
Significant Accounting Policies
, of the audited consolidated financial statements included in our 2018 Form 10-K. Our critical accounting policies require the most significant judgments and estimates about the effect of matters that are inherently uncertain. As a result, these accounting policies and estimates could materially affect our financial statements and are critical to the understanding of our results of operations and financial condition. For a complete discussion of our critical accounting policies, see the “Critical Accounting Policies and Estimates” section of the MD&A in our 2018 Form 10-K. During the
three months ended March 31, 2019
, there were no significant changes to our critical accounting policies.
Recently Issued Accounting Standards
Refer to Note
2
,
Significant Accounting Policies
, in our consolidated financial statements included elsewhere in this Form 10-Q for recently issued accounting standards.
Item 3. Quantitative and Qualitative Disclosures About Market Risk
For information regarding our exposure to certain market risks, see Item 7A, Quantitative and Qualitative Disclosures About Market Risk, in our 2018 Form 10-K. There have been no significant changes in our market risk exposures since our December 31, 2018 fiscal year end.
58
Item 4. Controls and Procedures
Evaluation of Disclosure Controls and Procedures
Our management, with the participation of our Chief Executive Officer (CEO) and Chief Financial Officer (CFO), has evaluated the effectiveness of our disclosure controls and procedures (as defined in Rules 13a-15(e) and 15d-15(e) under the Securities Exchange Act of 1934 (the Exchange Act)), as of the end of the period covered by this Quarterly Report on Form 10-Q. The purpose of disclosure controls and procedures is to ensure that information required to be disclosed in the reports we file or submit under the Exchange Act is recorded, processed, summarized and reported within the time periods specified in the SEC's rules and forms, and that such information is accumulated and communicated to management, including our CEO and CFO, to allow timely decisions regarding required disclosures. Based on that evaluation, our CEO and CFO have concluded that, as of the end of the period covered by this Quarterly Report on Form 10-Q, our disclosure controls and procedures were effective.
Changes in Internal Controls over Financial Reporting
There were no changes in our internal control over financial reporting during the fiscal quarter ended
March 31, 2019
that have materially affected, or are reasonably likely to materially affect, our internal control over financial reporting. We implemented internal controls to ensure that we properly assessed the impact on our financial statements of adopting and prospectively accounting for the new lease standard. There were no significant changes to our internal control over financial reporting due to the adoption of the new standard.
59
PART II - OTHER INFORMATION
Item 1. Legal Proceedings
Please refer to ‘‘Item 3. Legal Proceedings’’ in our 2018 Form 10-K for information regarding material pending legal proceedings. Except as set forth below, there have been no new material legal proceedings and no material developments in the legal proceedings previously disclosed.
In June 2016, Li Shihong and Hunan Lieying Education Investment Management Co Ltd commenced civil proceedings in the Changsha Intermediary Court in the People's Republic of China against Zhang Jiangbo, Zhang Jianbo, Chen Zhengxian, Hunan New Lieying Science and Education Co Ltd and Hunan International Economics University, our former network institution in China (HIEU). This case was settled during the first quarter of 2019, without cost to us.
In November 2017, Chen Zhengxian (a minority shareholder in the HIEU group) commenced civil proceedings in the Higher Court of Hunan Province in the People's Republic of China against LEI Lie Ying Limited and Steven Lin (a former Laureate employee) seeking return of a capital contribution of RMB 172 million and for loss of interest of RMB 28 million or the distribution of dividends in an equivalent amount. On November 5, 2018, the court entered judgment in favor of the current and former Laureate affiliates and dismissed this case. Chen Zhengxian's heir, Mr. Zheng Ziban, appealed to the Supreme People's Court, which has accepted the appeal.
In December 2017, Guangdong Nanbo Education Investment Co Ltd (a minority shareholder in the HIEU group) commenced civil proceedings in the Higher Court of Hunan Province in the People's Republic of China against LEI Lie Ying Limited (as majority shareholder) and Laureate Shanghai alleging the invalidity of service agreements entered into between HIEU and Laureate Shanghai and the infringement by LEI Lie Ying Limited of HIEU's interests, seeking the repayment of RMB 265 million fees paid under those agreements. On November 5, 2018, the court entered judgment in favor of the current and former Laureate affiliates and dismissed this case. Guangdong Nanbo Education Investment Co Ltd appealed to the Supreme People's Court, which has accepted the appeal.
Under the arrangements for the sale of our interest in HIEU, we have indemnified the purchaser against liabilities which arise from these claims subject to an aggregate cap on liability of RMB 400 million (approximately $60 million at
March 31, 2019
).
60
Item 1A. Risk Factors
There have been no material changes in the Risk Factors included in Item 1A of our 2018 Form 10-K.
61
Item 6. Exhibits
(a) Exhibits filed with this report or, where indicated, previously filed and incorporated by reference:
|
Exhibit
No.
|
Exhibit Description
|
Form
|
File Number
|
Exhibit
Number
|
Filing Date
|
|
2.1#
|
10-K
|
001-38002
|
2.7
|
03/20/2018
|
|
|
2.2#
|
8-K
|
001-38002
|
2.1
|
04/18/2018
|
|
|
2.3#
|
8-K
|
001-38002
|
2.1
|
08/07/2018
|
|
|
2.4#
|
10-Q
|
001-38002
|
2.4
|
08/09/2018
|
|
|
2.5#
|
10-K
|
001-38002
|
2.5
|
02/28/2019
|
|
|
3.1
|
S‑1/A
|
333‑207243
|
3.1
|
01/31/2017
|
|
|
3.2
|
S‑1/A
|
333‑207243
|
3.2
|
01/31/2017
|
|
|
3.3
|
8-K
|
001-38002
|
3.1
|
07/20/2018
|
|
|
4.1
|
8-K
|
001-38002
|
4.1
|
04/27/2017
|
|
|
4.2
|
8-K
|
001-38002
|
4.1
|
04/27/2017
|
|
|
4.3
|
8-K
|
001-38002
|
4.3
|
04/27/2017
|
|
|
4.4
|
8-K
|
001-38002
|
4.3
|
04/27/2017
|
|
|
10.1†
|
S‑1/A
|
333‑207243
|
10.31
|
11/20/2015
|
|
|
10.2†
|
S‑1/A
|
333‑207243
|
10.32
|
11/20/2015
|
|
|
10.3†
|
S‑1/A
|
333‑207243
|
10.34
|
11/20/2015
|
|
|
10.4†
|
S‑1/A
|
333‑207243
|
10.35
|
11/20/2015
|
|
|
10.5†
|
S‑1/A
|
333‑207243
|
10.36
|
11/20/2015
|
|
|
10.6†
|
S‑1/A
|
333‑207243
|
10.40
|
11/20/2015
|
|
|
10.7†
|
S‑1/A
|
333‑207243
|
10.41
|
11/20/2015
|
|
|
10.8†
|
S‑1/A
|
333‑207243
|
10.42
|
11/20/2015
|
|
|
10.9†
|
S‑1/A
|
333‑207243
|
10.43
|
11/20/2015
|
|
62
|
Exhibit
No.
|
Exhibit Description
|
Form
|
File Number
|
Exhibit
Number
|
Filing Date
|
|
10.10
|
S‑1/A
|
333‑207243
|
10.45
|
11/20/2015
|
|
|
10.11‡
|
S‑1/A
|
333‑207243
|
10.46
|
11/20/2015
|
|
|
10.12†
|
S‑1/A
|
333‑207243
|
10.47
|
11/20/2015
|
|
|
10.13†
|
S‑1/A
|
333‑207243
|
10.48
|
11/20/2015
|
|
|
10.14†
|
S‑1/A
|
333‑207243
|
10.49
|
11/20/2015
|
|
|
10.15†
|
S‑1/A
|
333‑207243
|
10.50
|
11/20/2015
|
|
|
10.16
|
S‑1/A
|
333‑207243
|
10.53
|
05/20/2016
|
|
|
10.17†
|
S‑1/A
|
333‑207243
|
10.54
|
05/20/2016
|
|
|
10.18†
|
S‑1/A
|
333‑207243
|
10.55
|
05/20/2016
|
|
|
10.19†
|
S‑1/A
|
333‑207243
|
10.56
|
05/20/2016
|
|
|
10.20†
|
S‑1/A
|
333‑207243
|
10.57
|
05/20/2016
|
|
|
10.21†
|
S‑1/A
|
333‑207243
|
10.58
|
05/20/2016
|
|
|
10.22†
|
S‑1/A
|
333‑207243
|
10.59
|
05/20/2016
|
|
|
10.23†
|
S‑1/A
|
333‑207243
|
10.60
|
05/20/2016
|
|
|
10.24
|
S‑1/A
|
333‑207243
|
10.63
|
12/15/2016
|
|
|
10.25
|
10-K
|
001-38002
|
10.29
|
03/20/2018
|
|
|
10.26
|
10-K
|
001-38002
|
10.30
|
03/20/2018
|
|
|
10.27
|
S‑1/A
|
333‑207243
|
10.69
|
01/10/2017
|
|
|
10.28†
|
S‑1/A
|
333‑207243
|
10.70
|
01/10/2017
|
|
|
10.29†
|
S‑1/A
|
333‑207243
|
10.71
|
01/10/2017
|
|
|
10.30†
|
S‑1/A
|
333‑207243
|
10.72
|
01/10/2017
|
|
|
10.31†
|
S‑1/A
|
333‑207243
|
10.73
|
01/10/2017
|
|
|
10.32
|
8‑K
|
001‑38002
|
10.1
|
02/06/2017
|
|
63
|
Exhibit
No.
|
Exhibit Description
|
Form
|
File Number
|
Exhibit
Number
|
Filing Date
|
|
10.33
|
8‑K
|
001‑38002
|
10.2
|
02/06/2017
|
|
|
10.34†
|
10-K
|
001-38002
|
10.76
|
03/29/2017
|
|
|
10.35
|
8-K
|
001-38002
|
10.1
|
04/27/2017
|
|
|
10.36
|
10-Q
|
001-38002
|
10.81
|
05/11/2017
|
|
|
10.37
|
10-Q
|
001-38002
|
10.82
|
05/11/2017
|
|
|
10.38
|
10-Q
|
001-38002
|
10.83
|
05/11/2017
|
|
|
10.39
|
10-Q
|
001-38002
|
10.84
|
05/11/2017
|
|
|
10.40
|
10-Q
|
001-38002
|
10.85
|
05/11/2017
|
|
|
10.41
|
10-Q
|
001-38002
|
10.86
|
05/11/2017
|
|
|
10.42†
|
8-K
|
001-38002
|
10.1
|
06/20/2017
|
|
|
10.43†
|
10-Q
|
001-38002
|
10.51
|
08/08/2017
|
|
|
10.44†
|
10-Q
|
001-38002
|
10.52
|
08/08/2017
|
|
|
10.45†
|
10-Q
|
001-38002
|
10.53
|
08/08/2017
|
|
|
10.46†
|
10-Q
|
001-38002
|
10.54
|
08/08/2017
|
|
|
10.47†
|
10-Q
|
001-38002
|
10.55
|
08/08/2017
|
|
|
10.48†
|
10-Q
|
001-38002
|
10.56
|
08/08/2017
|
|
|
10.49†
|
10-Q
|
001-38002
|
10.57
|
08/08/2017
|
|
64
|
Exhibit
No.
|
Exhibit Description
|
Form
|
File Number
|
Exhibit
Number
|
Filing Date
|
|
10.50†
|
10-Q
|
001-38002
|
10.58
|
08/08/2017
|
|
|
10.51†
|
10-Q
|
001-38002
|
10.59
|
08/08/2017
|
|
|
10.52†
|
10-Q
|
001-38002
|
10.61
|
11/08/2017
|
|
|
10.53†
|
10-Q
|
001-38002
|
10.64
|
11/08/2017
|
|
|
10.54†
|
10-Q
|
001-38002
|
10.65
|
11/08/2017
|
|
|
10.55
|
8-K
|
001-38002
|
10.1
|
02/01/2018
|
|
|
10.56†
|
10-K
|
001-38002
|
10.67
|
03/20/2018
|
|
|
10.57†
|
10-K
|
001-38002
|
10.68
|
03/20/2018
|
|
|
10.58
|
10-Q
|
001-38002
|
10.71
|
05/09/2018
|
|
|
10.59†
|
10-Q
|
001-38002
|
10.72
|
08/09/2018
|
|
|
10.60†
|
10-K
|
001-38002
|
10.73
|
02/28/2019
|
|
|
10.61†
|
10-K
|
001-38002
|
10.74
|
02/28/2019
|
|
|
21.1*
|
|||||
|
31.1*
|
|||||
|
31.2*
|
|||||
|
32*
|
|||||
65
|
Exhibit
No.
|
Exhibit Description
|
Form
|
File Number
|
Exhibit
Number
|
Filing Date
|
|
Ex. 101.INS*
|
XBRL Instance Document
|
||||
|
Ex. 101.SCH*
|
XBRL Taxonomy Extension Schema Document
|
||||
|
Ex. 101.CAL*
|
XBRL Taxonomy Extension Calculation Linkbase Document
|
||||
|
Ex. 101.LAB*
|
XBRL Taxonomy Extension Label Linkbase Document
|
||||
|
Ex. 101.PRE*
|
XBRL Taxonomy Extension Presentation Linkbase Document
|
||||
|
Ex. 101.DEF*
|
XBRL Taxonomy Extension Definition Linkbase Document
|
||||
|
*
|
Filed herewith.
|
||||
|
#
|
Laureate Education, Inc. hereby undertakes to furnish supplementally a copy of any omitted schedule or exhibit to such agreement to the U.S. Securities and Exchange Commission upon request.
|
||||
|
†
|
Indicates a management contract or compensatory plan or arrangement.
|
||||
|
‡
|
Confidential treatment has been granted with respect to certain portions of this exhibit. Omitted portions have been filed separately with the U.S. Securities and Exchange Commission.
|
||||
66
SIGNATURES
Pursuant to the requirements of the Securities Exchange Act of 1934, the registrant has duly caused this report to be signed on its behalf by the undersigned, thereunto duly authorized, on
May 9, 2019
.
/s/ JEAN-JACQUES CHARHON
Jean-Jacques Charhon
Executive Vice President and Chief Financial Officer
/s/ TAL DARMON
Tal Darmon
Senior Vice President, Chief Accounting Officer
and Global Controller
67
68
TABLE OF CONTENTS
Part I - Financial InformationItem 1. Financial Statements (unaudited)Note 1. Description Of BusinessNote 2. Significant Accounting PoliciesNote 3. RevenueNote 4. Discontinued Operations and Assets Held For SaleNote 5. DispositionsNote 6. Due To Shareholders Of Acquired CompaniesNote 7. Business and Geographic Segment InformationNote 8. GoodwillNote 9. DebtNote 10. LeasesNote 11. Commitments and ContingenciesNote 12. Financing ReceivablesNote 13. Share-based CompensationNote 14. Stockholders' EquityNote 15. Derivative InstrumentsNote 16. Income TaxesNote 17. Earnings (loss) Per ShareNote 18. Legal and Regulatory MattersNote 19. Fair Value MeasurementNote 20. Supplemental Cash Flow InformationNote 21. Subsequent EventsItem 2. Management S Discussion and Analysis Of Financial Condition and Results Of OperationsItem 3. Quantitative and Qualitative Disclosures About Market RiskItem 4. Controls and ProceduresPart II - Other InformationItem 1. Legal ProceedingsItem 1A. Risk FactorsItem 6. Exhibits